Embed Size (px)
Citation preview

2008 Annual Report

Utility & Power PlantsCommercial New HomesResidential Retrofi t
A Quarter Century of Innovation
SunPower Corporation manufactures the planet’s most powerful solar and the
highest-energy delivery systems. With headquarters in San Jose, California and
Geneva, Switzerland, we serve utility-scale and large commercial clients with
design, construction, and installation services, and homeowners through our
global residential dealer network. SunPower’s innovative products include the
highest-effi ciency solar panels, our patented SunPower® Tracker and the market-
leading SunTile® for new homes.
2008 Annual Report

Dear Stockholders:
SunPower had another historic year in 2008, as we doubled revenue from 2007. But more importantly, wemade significant progress on our strategies to build our brand by leveraging our channel ownership to deliver thehighest-performance solar technologies on the planet. And we did so while dramatically reducing the costs ofenergy delivered and investing in our people. The industry saw dramatic changes during the year, with a sharptransition from a supply-constrained market during the first three quarters to a worldwide economic crisis that ledto a more demand-driven business environment in the fourth quarter. Our strategies were designed for markettransitions like this, and we believe we are in an excellent position to capitalize on this new market dynamic.
Brand
We are establishing the SunPower brand through a unique channel architecture that is customized for eachmarket segment, allowing us to dramatically improve the customer experience. Our brand is built on our market-driven approach, and a truly differentiated technology platform based on the planet’s most powerful solar cellsand highest-energy delivery solar power systems. In today’s economic and competitive environment, brand isbecoming an even more important differentiator and a significant competitive advantage.
We are capitalizing on this advantage to capture market share in our residential, commercial and utility andpower plant segments. For example, in the residential retrofit market, we have established a robust dealernetwork to which we offer additional services as well as our industry-leading solar systems. By offering thehighest-energy delivery from any roof, and the best looking panels, we have garnered the top market share inCalifornia, the largest residential market in the U.S. We built on this position in 2008 as we acceleratedexpansion of our dealer network for the residential retrofit and light commercial segment in Europe and Australiaby leveraging acquisitions completed in Italy and Australia. We have also added more than 350 dealers in theU.S., Germany, Spain, Italy, and Australia.
We leveraged our engineering, procurement and construction (EPC) capability, established by ourPowerLight acquisition in 2007, as well as our strong brand and superior technology to expand our reach inlarge-scale systems, with a major push into the utility and power plant segment. The combination of our superiorsystems technology and industry-leading cell efficiency enables us to drive up to 30 percent more energy thanconventional fixed-tilt systems, a key competitive advantage in today’s market. As a result, we saw significantgrowth in our systems business, and we now have completed more than 500 systems generating more than 400megawatts of peak power generation. We are the world leader in large-scale solar systems, and we are using thislead to develop technologies and products that are customized for large-scale systems.
Technology
Our success in developing SunPower’s brand through a unique channel strategy is based on ourdifferentiated technology, which is currently focused in three areas: high-efficiency solar cells, high-energycollection systems and high-visibility systems monitoring.
Since our IPO in November of 2005, we introduced a new solar cell technology into mass production. OurGen 2 solar cells offer a minimum sunlight-to-electricity conversion efficiency of 22 percent. Our next-generation solar cell technology will increase efficiency to more than 23 percent. We have completed pilotproduction runs of this technology, and plan to mass produce Gen 3 cells in Fab 3.
We have also been able to innovate in our solar cell manufacturing while expanding capacity. We areproducing the world’s thinnest crystalline solar cells with polysilicon utilization of less than 5.6 grams per watt.We are building new production lines to use thinner wafer technology, and converting most of our existing linesto thinner wafers. At the end of 2008, we operated a total of twelve production lines with more than 400megawatts of nameplate capacity.
We remain very positive on the long-term fundamentals of the solar energy industry and see increasedworldwide demand as many countries look for ways to reduce their carbon footprint and dependence on fossil

fuels for their energy needs. As a result, in 2008, we started construction on Fab 3, our third manufacturingfacility. Located in Malaysia with financial support coming from the Malaysian government, when complete,Fab 3 will have a production capacity of 1,000 megawatts at significantly reduced capital expense per watt ascompared to Fab 2.
Our technology focus extends beyond improving the efficiency of our cells to improving the efficiency ofour solar collection systems. For example, our SunPower® T20 Tracker, a ground-mounted system, produces upto 30 percent more energy from each solar panel than conventional fixed-tilt systems by tracking the sun as itmoves across the sky. At the end of 2008, we had deployed more than 100 ground-mounted tracking systems,generating more than 250 megawatts of peak power for our customers around the world. The combination of oursuperior cell efficiency and proprietary energy collection systems technology enables us to produce, manufactureand market the highest-performance solar energy systems in the world today.
We have also invested in high-visibility monitoring for our customers to track the performance of theirsystems. In 2008, we introduced new monitoring systems for both residential and commercial customers. OurSunPower solar operating center is the most extensive and advanced in the world, monitoring more than 400megawatts of large-scale solar systems, with data sets spanning more than a decade, to support our servicecontracts with our customers and validate our performance prediction tools.
Cost
Our technology advantages tie directly to our ability to offer a competitive, levelized cost of energy – that isthe cost of energy from a solar system as paid by our customers over the system’s lifetime. Our leadership indeveloping large ground-mounted solar systems gave us the experience and credibility to enter the U.S. utilitymarket. The combination of our tracking technology and industry-leading solar cell technology offer utilities avery competitive, levelized cost of energy.
In a groundbreaking announcement for the solar industry, we were selected by Pacific Gas and ElectricCompany to supply the California utility with energy from a 250-megawatt solar power plant. This project willbe the first, true utility-scale photovoltaic (PV) power plant in the world, delivering an average of 550,000megawatt-hours of clean electricity annually. The project is contracted to begin power delivery in 2010 and befully operational in 2012. Additionally, Florida Power & Light Company (FPL) selected SunPower to provide 35megawatts of solar power to them by the end of 2010. The first power plant for FPL will be a 25 megawattproject in DeSoto County, Florida. When operational in 2009, it will be the largest solar PV power plant in thecountry, eclipsing our 14-megawatt power plant at Nellis Air Force Base that was completed in 2007. These winsdemonstrate that utilities are expanding their resource portfolios to include PV power plants.
Given our success in the utility space, we made a strategic decision in 2008 to invest in this segment forfuture growth. We have built the core of our utility team and will continue to invest resources to maximize ouropportunities in this area. Our work to date is proving fruitful, and our utility and power plant sales pipeline nowexceeds 1,000 megawatts. With a favorable public policy backdrop through the eight-year extension of the U.S.federal Investment Tax Credit (ITC), and more than half of U.S. states implementing renewable energy portfoliostandards, we are in a strong position to capitalize on the growth in this segment.
In 2008, our manufacturing and supply chain scale efficiencies, combined with our continued improvementsin silicon efficiency, position us to achieve our 50 percent cost reduction goal by 2012 relative to installed systemcosts in 2006. Deliveries under our silicon contracts lowered the average silicon cost in our portfolio for the firsttime in company history. We also successfully transitioned the majority of our manufacturing lines to thinner,145 micron wafers, maximizing our energy delivery per gram of silicon. When combined with the increase inhigher-efficiency cell production, we improved our silicon utilization by 14 percent year-over-year to 5.6 grams/watt in the fourth quarter. These factors give us confidence that we will meet our cost reduction targets asexpected.

People
Turning now to our final strategic focus – our people. For SunPower, 2008 was a year of growth as we addedrapidly to the SunPower family to support our revenue growth and manufacturing ramp. We have built a team thatwe believe will take the company to the next level. For example, given our focus on the utility segment, our recentexecutive level additions include Dennis Arriola and Jean Wilson. Dennis, our CFO, was most recently the CFO ofSan Diego Gas & Electric Company and Southern California Gas Co. Jean Wilson, formally senior vice president atPPM Energy (now Iberdrola), leads our North American utility and power plant group. Additionally, we appointedThomas R. McDaniel, who served 37 years at Edison International, to our Board of Directors.
We are also excited that we made the commitment to create the SunPower Foundation. Our employeesrequested that we complement our business success by helping educate people around the world about thepotential for solar power. With the SunPower Foundation, we are now able to do that.
In summary, 2008 was a strong year for SunPower as we posted record financial results, ramped ourmanufacturing capabilities, expanded our global footprint through our dealer network and established ourselvesas a leader in the utility power plant business. The policy environment turned more favorable in the U.S., ourhome market, as the world turns to addressing climate change through the next decade.
We see 2009 as a key transition year for SunPower and the industry, as supply and demand become morebalanced in the face of global economic recession and worldwide credit crisis. We recognize that our mix ofmarkets and segments will shift while credit conditions are tight, but we are better situated than any other solarcompany to respond flexibly to that need. We have been structuring our company to thrive in difficult marketconditions and we have taken appropriate actions to moderate expense growth, while continuing to invest in keyareas for long-term differentiation. We fundamentally believe that we are at the beginning of a long-termtransition to renewable energy sources, and we have designed your company to be the leader in this transition.
Thomas H. WernerChief Executive Officer

(This page intentionally left blank)

UNITED STATES SECURITIES AND EXCHANGE COMMISSIONWashington, D.C. 20549
_____________________
FORM 10-K_____________________
ANNUAL REPORT PURSUANT TO SECTION 13 OR 15(d) OF THE SECURITIES EXCHANGE ACT OF 1934
For the fiscal year ended December 28, 2008OR
TRANSITION REPORT PURSUANT TO SECTION 13 OR 15(d) OF THE SECURITIES EXCHANGE ACT OF 1934
For the transition period from ______________ to ______________Commission file number 001-34166
SunPower Corporation(Exact name of registrant as specified in its charter)
Delaware 94-3008969(State or other jurisdiction of (I.R.S. Employer incorporation or organization) Identification No.)
3939 North First Street, San Jose, California 95134(Address of principal executive offices and zip code)
(408) 240-5500
Securities registered pursuant to Section 12(b) of the Act:Title of each class Name of each exchange on which registered
Class A Common Stock. $0.001 par value Nasdaq Global Select MarketClass B Common Stock. $0.001 par value Nasdaq Global Select Market
Securities registered pursuant to Section 12(g) of the Act:None
(Title of Class)_____________________
Indicate by check mark if the registrant is a well-known seasoned issuer, as defined in Rule 405 of the Securities Act. Yes No
Indicate by check mark if the registrant is not required to file reports pursuant to Section 13 of Section 15(d) of the Act. Yes No
Indicate by check mark whether the registrant (1) has filed all reports required to be filed by Section 13 or 15(d) of the Securities Exchange Act of 1934 during the preceding 12 months (or for such shorter period that the registrant was required to file such reports), and (2) has been subject to such filing requirements for the past 90 days. Yes No
Indicate by check mark if disclosure of delinquent filers pursuant to Item 405 of Regulation S-K is not contained herein, and will not be conPart III of this Form 10-K or any amendment to this Form 10-K.
Indicate by check mark whether the registrant is a large accelerated filer, an accelerated filer, a non-accelerated filer, or a
Rule 12b-2 of the Exchange Act. (Check one): Large Accelerated Filer Accelerated Filer Non-accelerated filer
(Do not check if a smaller reporting company) Smaller reporting
company Indicate by check mark whether the registrant is a shell company (as defined in Rule 12b-2 of the Act). Yes No The aggregate market value of the voting stock held by non-affiliates of the registrant on June 29, 2008 was $2.6 billion. Such
aggregate market value was computed by reference to the closing price of the common stock as reported on the Nasdaq Global Marketon June 27, 2008. For purposes of determining this amount only, the registrant has defined affiliates as including the executive officers and directors of registrant on June 27, 2008.
s class A common stock as of February 13, 2009 was 43,971,526.
DOCUMENTS INCORPORATED BY REFERENCE
reference in Items 10, 11, 12, 13 and 14 of Part III of this Annual Report on Form 10-K.

(This page intentionally left blank)

i
TABLE OF CONTENTS
Page
PART I
Item 1: Business 1
Item 1A: Risk Factors 13
Item 1B: Unresolved Staff Comments 32
Item 2: Properties 32
Item 3: Legal Proceedings 33
Item 4: Submission of Matters to a Vote of Security Holders 33
PART II
Item 5: Market for Registrant’s Common Equity, Related Stockholder Matters and Issuer Purchases of Equity Securities 33
Item 6: Selected Consolidated Financial Data 36
Item 7: Management’s Discussion and Analysis of Financial Condition and Results of Operations 38
Item 7A: Quantitative and Qualitative Disclosures About Market Risk 61
Item 8: Financial Statements and Supplementary Data 64
Item 9: Changes in and Disagreements with Accountants on Accounting and Financial Disclosures 119
Item 9A: Controls and Procedures 119
Item 9B: Other Information 120
PART III
Item 10: Directors, Executive Officers and Corporate Governance 121
Item 11: Executive Compensation 122
Item 12: Security Ownership of Certain Beneficial Owners and Management and Related Stockholder Matters 122
Item 13: Certain Relationships and Related Transactions, and Director Independence 122
Item 14: Principal Accountant Fees and Services 122
PART IV
Item 15: Exhibits and Financial Statement Schedules 122

(This page intentionally left blank)

1
PART I
Trademarks
The following terms are our trademarks and may be used in this report: SunPower®, PowerGuard®, SunTile®, PowerTracker®, and PowerLight®. All other trademarks appearing in this report are the property of their holders.
Cautionary Statement Regarding Forward-Looking Statements
This Annual Report on Form 10-K contains forward-looking statements within the meaning of the Private Securities Litigation Reform Act of 1995, Section 27A of the Securities Act of 1933 and Section 21E of the Securities Exchange Act of 1934. Forward-looking statements are statements that do not represent historical facts. We use words
-looking statements. Forward-looking statements in this Annual Report on Form 10-K include, but are not limited to, our plans and expectations regarding our ability to obtain financing, future financial results, operating results, business strategies, projected costs, products, competitive
ans and objectives for future operations, and industry trends. These forward-looking statements are based on information available to us as of the date of this Annual Report on Form 10-K and current expectations, forecasts and assumptions and involve a number of risks and uncertainties that could cause actual results to differ materially from those anticipated by these forward-looking statements. Such risks and uncertainties include a
the Securities and Exchange Commission for additional information on risks and uncertainties that could cause actual results to differ. These forward-looking statements should not be relied upon as representing our views as of any subsequent date, and we are under no obligation to, and expressly disclaim any responsibility to, update or alter our forward-looking statements, whether as a result of new information, future events or otherwise.
The following information should be read in conjunction with the Consolidated Financial Statements and the accompanying Notes to Consolidated Financial Statements included in this Annual Report on Form 10-K. Our fiscal year ends on the Sunday closest to the end of the applicable calendar year. All references to fiscal periods apply to our fiscal quarters or year which ends on the Sunday closest to the calendar month end.
PART I
ITEM 1: BUSINESS
We are a vertically integrated solar products and services company that designs, manufactures and markets high-performance solar electric power technologies. Our solar cells and solar panels are manufactured using proprietary processes, and our technologies are based on more than 15 years of research and development. Of all the solar cells available for the mass market, we believe our solar cells have the highest conversion efficiency, a measurement of the amount of sunlight converted by the solar cell into electricity. Our solar power products are sold through our components business segment, or Components Segment. In January 2007, we acquired PowerLight Corporation, or PowerLight, now known as SunPower Corporation, Systems, or SP Systems, which developed, engineered, manufactured and delivered large-scale solar power systems. These activities are now performed by our systems business segment, or our Systems Segment. Our solar power systems, which generate electricity, integrate solar cells and panels manufactured by us as well as other suppliers. For more information about financial condition and results of operations of each segment, please see andFinan
Business Segments Overview
Components Segment: Our Components Segment sells solar power products, including solar cells, solar panels and inverters, which convert sunlight to electricity compatible with the utility network. We believe our solar cells provide the following benefits compared with conventional solar cells:
superior performance, including the ability to generate up to 50% more power per unit area;

2
superior aesthetics, with our uniformly black surface design that eliminates highly visible reflective grid lines and metal interconnect ribbons; and
more efficient use of silicon, a key raw material used in the manufacture of solar cells.
We sell our solar components products to installers and resellers, including our global dealer network, for use in residential and commercial applications where the high efficiency and superior aesthetics of our solar power products provide compelling customer benefits. We also sell products for use in multi-megawatt solar power plant applications. In many situations, we offer a materially lower area-related cost structure for our customers because our solar panels require a substantially smaller roof or land area than conventional solar technology and half or less of the roof or land area of commercial solar thin film technologies. We sell our products primarily in North America, Europe and Asia, principally in regions where public policy has accelerated solar power adoption. In fiscal 2008, 2007 and 2006, components revenue represented approximately 43%, 40% and 100%, respectively, of total revenue.
As discussed more fully below, we manufacture our solar cells at our two facilities in the Philippines, and are developing a third solar cell manufacturing facility in Malaysia. Almost all of our solar cells are then combined into solar panels at our solar panel assembly facility located in the Philippines. Our solar panels are also manufactured for us by a third-party subcontractor in China.
Systems Segment: Our Systems Segment generally sells solar power systems directly to system owners and developers. When we sell a solar power system, it may include services such as development, engineering, procurement of permits and equipment, construction management, access to financing, monitoring and maintenance. We believe our
superior performance delivered by maximizing energy delivery and financial return through systems technology design;
superior systems design to meet customer needs and reduce cost, including non-penetrating, fast roof installation technologies; and
superior channel breadth and delivery capability including turnkey systems.
Our Systems Segment is comprised primarily of the PowerLight (now known as SP Systems) business we acquired in January 2007. Our customers include commercial and governmental entities, investors, utilities, production home builders and home owners. We work with development, construction, system integration and financing companies to deliver our solar power systems to customers. Our solar power systems are designed to generate electricity over a system life typically exceeding 25 years and are principally designed to be used in large-scale applications with system ratings of typically more than 500 kilowatts. Worldwide, more than 500 SunPower solar power systems have been constructed or are under contract, rated in the aggregate at more than 400 megawatts of peak capacity. In fiscal 2008 and 2007, systems revenue represented approximately 57% and 60%, respectively, of total revenue.
We have solar power system projects completed or in the process of being completed in various countries including Germany, Italy, Portugal, South Korea, Spain and the United States. We sell distributed rooftop and ground-mounted solar power systems as well as central-station power plants. In the United States, distributed solar power systems are typically rated at more than 500 kilowatts of capacity to provide a supplemental, distributed source of
agreement with a financing company which buys the system from us. In Europe and South Korea, our products and systems are typically purchased by a financing company and operated as a central-station solar power plant. These power plants are rated with capacities of approximately one to twenty megawatts, and generate electricity for sale under tariff to private and public utilities. In 2008, we began serving the utility market in the United States, as regulated utilities began seeking cost-effective renewable energy to meet governmental renewable portfolio standard requirements. Examples include an agreement with Florida Power & Light Company, or FPL, to design and build two solar photovoltaic power plants totaling 35 megawatts in Florida, and another with Pacific Gas and Electric Company, or PG&E, to design and build a 250 megawatt solar power plant in California.

3
We manufacture certain of our solar power system products at our manufacturing facilities in Richmond, California and at other facilities located close to our customers. Some of our solar power system products are also manufactured for us by third-party suppliers.
Our Products and Services
Products Sold Through Our Components Segment
Our solar power products include solar cells and solar panels manufactured using proprietary processes, and our technologies are based on more than 15 years of research and development. We also sell a line of SunPower branded inverters manufactured by third-parties.
Solar Cells
Solar cells are semiconductor devices that directly convert sunlight into direct current electricity. Our A-300 solar cell is a silicon solar cell with a specified power value of 3.1 watts and a conversion efficiency averaging between 20% and 21.5%. Our A-330 solar cell delivers 3.3 watts with a conversion efficiency of up to 22.7%. The A-330 solar cell started shipping in 2007. Our solar cells are designed without highly reflective metal contact grids or current collection ribbons on the front of the solar cells. This feature enables our solar cells to be assembled into solar panels that exhibit a more uniform appearance than conventional solar panels.
Solar Panels
Solar panels are solar cells electrically connected together and encapsulated in a weatherproof package. We believe solar panels made with our solar cells are the highest efficiency solar panels available for the mass market. Because our solar cells are more efficient relative to conventional solar cells, when our solar cells are assembled into panels, the assembly cost per watt is less because more power can be incorporated into a given size package. Higher solar panel efficiency allows installers to mount a solar power system with more power within a given roof or site area and can reduce per watt installation costs.
Products Sold Through Our Systems Segment
Our solar electric power system technology integrates solar cells and solar panels to convert sunlight to electricity. Our systems are principally designed to be used in large-scale utility, commercial, public sector and production home applications.
PowerGuard® Roof System
Our PowerGuard® Roof System is a roof-mounted solar panel mounting system that delivers reliable, clean electricity while insulating and protecting the roof. PowerGuard® is a proprietary, pre-engineered solar power roofing tile system. Each PowerGuard® tile consists of a solar laminate, lightweight cement substrate and styrofoam base. Designed for quick and easy installation, PowerGuard® tiles fit together with interlocking tongue-and-groove side surfaces. In addition to generating electricity, PowerGuard® roof systems also insulate and protect the roof membrane from ultraviolet rays and thermal degradation. This saves both heating and cooling energy expenses and extends the roof life. The PowerGuard® roof system has been tested and certified by Underwriters Laboratories Inc., or UL, and has received a UL Class B fire rating which we believe facilitates obtaining building permits and inspector approvals.
Our PowerGuard® scomparison, conventional solar power systems typically penetrate the roof. Systems that require drilling many holes into rooftops to install and secure solar panels may compromise the integrity of the roof and reduce its life span. To avoid drilling holes, certain other conventional systems add weight for stability against wind and weather, which may exceed
PowerGuard® tiles typically weigh approximately four pounds per square foot, which is supported by most commercial rooftops. Our technology integrates this lightweight construction with a patented pressure equalizing design that has been tested to withstand winds of up to 140 miles per hour. PowerGuard® roof systems have been installed in a

4
broad range of climates, including California, Illinois, Hawaii, Massachusetts, Nevada, New Jersey, New York, Canada and Switzerland and on a wide variety of building types, from rural single story warehouses to urban high rise structures.
SunPower® T-10 Commercial Solar Roof Tiles
SunPower® T-10 commercial solar roof tiles are pre-engineered solar panels that tilt at a 10-degree angle. Depending on geographical location and local climate conditions, this can allow for the generation of up to 10% more annual energy output than traditional flat roof-mounted systems. These non-penetrating panels interlock for secure, rapid installation on rooftops without compromising the structural integrity of the roof.
Similar to our PowerGuard® product, the SunPower® T-10 commercial roof tile is lightweight, weighing less than four pounds per square foot, and is installed without penetrating the roof surface. Sloped side and rear wind deflectors improve wind performance, allowing T-10 arrays to withstand winds up to 120 miles per hour.
Whereas PowerGuard® performance is optimized in constrained rooftop environments where it contributes to maximum power density, commercial roof tile performance is optimized for larger roofs with less space constraints as well as underutilized tracks of land, such as ground reservoirs.
SunTile® Roof Integrated System for Residential Market
Our SunTile® product is a highly efficient solar power shingle roofing system utilizing our A-300 solar cell technology that is designed to integrate with conventional residential roofing materials. SunTile® solar shingles are designed to replace multiple types of roof panels, including the most common coand composition shingles. We believe that SunTile® is less visible on a roof than conventional solar technology because the solar panel is integrated directly into the roofing material instead of mounted onto the roof. SunTile® has a UL-listed Class A fire rating, which is the highest level of fire rating provided by UL. SunTile® is designed to be incorporated by production home builders into the construction of their new homes.
Ground Mounted SunPower® Tracker Systems
We offer several types of ground-mounted solar power systems using our PowerTracker® technology, now referred to as SunPower® Tracker. SunPower® Tracker is a single-axis tracking system that automatically pivots solar
ement throughout the day. We believe this tracking feature increases the amount of sunlight that is captured and converted into energy by up to 30% over flat or fixed-tilt systems depending on geographic location and local climate conditions. A single motor and drive mechanism can control 10 to 20 rows, or more than 200 kilowatts of solar panels. The multi-row feature represents a cost advantage for our customers over dual axis tracking systems, as such systems require more motors, drives, land, and power to operate per kilowatt of capacity. The SunPower® Tracker system can be assembled onsite, and is easily scalable. We have installed ground-mounted systems integrating SunPower® Tracker in a wide range of geographical markets including Arizona, California, Hawaii, Nevada, New Jersey, Germany, Portugal, Spain and South Korea.
Fixed Tilt and SunPower® Tracker Systems for Parking Structures
We have developed and patented several designs for solar power systems for parking structures in multiple configurations. These dual use systems typically incorporate solar panels into the roof of a carport or similar structure to deliver onsite solar power while providing shade and protection. Aesthetically pleasing, standardized and scalable, they are well suited for parking lots adjacent to facilities. In addition, we have incorporated our SunPower® Tracker technology into certain of our systems for elevated parking structures to provide a differentiated product offering to our customers.
Other System Offerings
We have other products that leverage our core systems. For example, our metal roof system is designed for sloped-metal roof buildings, which are used in some winery and warehouse applications. This solar power system is designed for rapid installation. We also offer other architectural products such as day lighting with translucent solar panels.

5
Balance of System Components
SunPower branded inverters, mounting structures, charge controllers, grid interconnection equipment and other devices depending upon the specific requirements of a particular system and project.
Client Services Sold Through Our Systems Segment
We provide our customers and partners with a variety of services, including system design, energy efficiency, financial consulting and analysis, construction management and maintenance and monitoring.
System Design
on, site conditions and energy needs. During the preliminary design phase, we conduct a site audit and building assessment for onsite generation feasibility and identify energy efficiency savings opportunities. We model the performance of a proposed system design taking into
also identify necessary permits and design our systems to comply with applicable building codes and other regulations.
Financial Consulting and Analysis
We offer financial consulting services to our customers and assist them in developing funding strategies for solar ny financial
companies and organizations which provide project development financing and bonding for our customers. To date, we have successfully arranged financing for clients ranging from simple loans and tax-advantaged operating leases to long-term, multi-party power purchase agreements.
Construction Management
We offer general contracting services and employ project managers to oversee all aspects of system installation, including securing necessary permits and approvals. Subcontractors, typically electricians and roofers, usually provide the construction labor, tools and heavy equipment for solar system installation. We have developed relationships with subcontractors in many target markets, and require subcontractors to be licensed, carry appropriate insurance and adhere to the local labor and payroll requirements. Our construction management services include system testing, commissioning and management of utility network interconnection.
Maintenance and Monitoring
We also offer post-installation services in support of our solar power systems, including:
Operations and Maintenance: Our systems have a design life in excess of 25 years. We typically provide our customers with a one-, two-, five- or ten-year parts and workmanship system warranty, after which the customer may extend the period covered by our warranty for an additional fee. We also pass through to customers long-term warranties from the original equipment manufacturers, or OEMs, of certain system components. Warranties of 20 years from solar panel suppliers are standard, while inverters typically carry a two-, five- or ten-year warranty. We offer our customers a comprehensive suite of solar power system maintenance services ranging from preventive maintenance to rapid-response outage restoration and inverter repair. Our Standard Service Agreement includes continuous remote monitoring, system performance reports, and a 24/7 technical support line. Our Plus Level Service Agreement includes all of the Standard Service features plus on-site preventive and corrective maintenance using regionally-located field service technicians.
Monitoring: We have developed a proprietary set of advanced monitoring applications built upon the leading electric utility real-time monitoring platform. The monitoring service continuously scans the operational status and performance of the solar system and automatically identifies system outages and performance deficiencies to our 24/7 monitoring technicians. If the monitoring technicians cannot identify the cause of the problem within a predetermined response time, the issue is escalated to our performance engineers for further analysis and diagnostics. If the performance
6
engineers cannot resolve the problem within the service response time, the issue is escalated to our field service team to
our customer website (www.sunpowermonitor.com). Some customers choose to install electronic kiosks for flat-panel displays to track performance information at their facility. We believe these displays enhance our brand and educate the public and prospective customers about solar power.
In 2008 we released the SunPower Monitoring System designed primarily for residential customers. This system enables residential customers to view their daily, monthly and annual solar energy production remotely via a web interface as well as in their home with a dedicated display.
Energy Efficiency Consulting and Related Services Sold Through Our Systems Segment
In addition to our solar power systems, we provide related energy efficiency services designed to increase the total return on investment through an integrated, seamless solution. We provide custom solar power generation and demand side management solutions to minimize facility energy use and demand, improve building operation controls and increase the comfort level of building occupants.
Corporate History
We were originally incorporated in California in April 1985 by Dr. Richard Swanson to develop and commercialize high-efficiency solar cell technologies. Cypress Semiconductor Corporation, or Cypress, made a significant investment in SunPower in 2002. In November 2004, Cypress acquired 100% ownership of all outstanding shares of our capital stock, excluding unexercised warrants and options. In November 2005, we reincorporated in Delaware, created two classes of common stock and held the initial public offering, or IPO, of class A common stock. After completion of our IPO, Cypress held all the outstanding shares of our class B common stock. On September 29, 2008, Cypress completed a spin-off of all of its shares of our class B common stock, in the form of a pro rata dividend to the holders of record as of September 17, 2008 of Cypress common stock. As a result, our class B common stock now trades publicly and is listed on the Nasdaq Global Select Market, along with our class A common stock.
Research and Development
We engage in extensive research and development efforts to improve solar cell efficiency, enhance our Systems Segment products and reduce manufacturing cost and complexity. Our research and development organization works closely with our manufacturing facilities, our equipment suppliers and our customers to improve our solar cell design and to lower cell, panel and system product manufacturing and assembly costs. In addition, we have dedicated employees who work closely with our current and potential suppliers of crystalline silicon, a key raw material used in the manufacture of our solar cells, to develop specifications that meet our standards and ensure the high quality we require, while at the same time controlling costs.
We have government contracts that enable us to more rapidly develop new technologies and pursue additional research opportunities while helping to offset our research and development expense. In the third quarter of 2007, we signed a Solar America Initiative research and development agreement with the U.S. Department of Energy in which we were awarded $10.8 million in the first budgetary period. Total funding for the three-year effort is estimated to be $24.9 million. Our cost share requirement under this program, including lower-tier subcontract awards, is anticipated to be $28.1 million. Payments received under these contracts offset our research and development expense by approximately 25%, 21% and 8% in fiscal 2008, 2007 and 2006, respectively. Our research and development expenditures, net of payments received under these contracts, were approximately $21.5 million, $13.6 million and $9.7 million for fiscal 2008, 2007 and 2006, respectively.
as a result of such grants, please see including Our reliance on government programs to partially fund our research and development programs could impair our ability to commercialize our solar power

7
Manufacturing
The solar cell value chain starts with high purity silicon called polysilicon. Polysilicon is created by refining quartz or sand. Polysilicon is melted and grown into crystalline ingots by companies specializing in ingot growth, such as our joint venture located in South Korea named Woongjin Energy Co., Ltd, or Woongjin Energy. The ingots are sliced and the wafers are processed into solar cells in our own manufacturing facilities and in a joint venture named First Philec Solar Corporation, or First Philec Solar, located in the Philippines, and by other vendors. We also purchase wafers and polysilicon from third-party vendors on a purchase order or contract basis.
We manufacture our solar cells through our subsidiary, SunPower Philippines Manufacturing Limited, in two facilities located near Manila in the Philippines. Our first facility, or FAB1, has 215,000 square feet and began operations in the fall of 2004. We currently operate four solar cell manufacturing lines, with a total rated manufacturing capacity of 108 megawatts per year at this FAB1. In August 2006, we purchased a 344,000 square foot building in the Philippines, or FAB2. This building is approximately 20 miles from FAB1 and was constructed to house up to twelve solar cell manufacturing lines. FAB2 began operations in the summer of 2007 and we currently operate eight solar cell manufacturing lines, with a total rated manufacturing capacity of 306 megawatts per year at this FAB2. By the end of 2009, we plan to operate 16 solar cell manufacturing lines in total with an aggregate manufacturing capacity of 574 megawatts per year. In addition, we plan to begin production in 2010 on the first line of our planned third solar cell manufacturing facility, or FAB3, which will be constructed in Malaysia. FAB3 will be constructed in two phases, with an aggregate manufacturing capacity of more than 500 megawatts per year after the completion of the first phase, and an expected aggregate manufacturing capacity of more than 1 gigawatt per year when the second phase is completed.
We manufacture our solar panels at our solar panel assembly facility located in the Philippines. Our solar panels are also manufactured for us by a third-party subcontractor in China. We currently operate seven solar panel manufacturing lines with a rated manufacturing capacity of 210 megawatts of solar panels per year.
Over the past 15 years, we have developed a core competency in processing thin silicon wafers. This proprietary semiconductor processing expertise involves specialized equipment and facilities that we believe allow us to process thin wafers while minimizing breakage and accurately controlling the effect of metallic contaminants and other non-desirable process conditions.
We source the balance of system components based on quality, performance and cost considerations using solar cells and solar panels supplied internally as well as from other third-party suppliers. We generally assemble proprietary components, such as cementitious coatings and certain adhesive applications, while we purchase generally available components from third-party suppliers. Certain of our products, such as our PowerGuard® and SunTile® products, are assembled at our or a third- cts such as our SunPower® Tracker and SunPower® T-10 commercial roof tiles are field assembled with components shipped directly from suppliers. We currently have the capacity to produce up to an aggregate of twenty megawatts of our PowerGuard® and SunTile® products per year, depending on product mix, in our California assembly plant or third-
Supplier Relationships
Crystalline silicon is the leading commercial material for solar cells and is used in several forms, including single-crystalline, or monocrystalline silicon, multicrystalline, or polycrystalline silicon, ribbon and sheet silicon and thin-layer silicon. We believe our supplier relationships and various short- and long-term contracts will afford us the volume of material required to meet our planned output. For more information about risks related to our crystalline silicon, please see including Limited competition among suppliers has required us in some instances to enter into long-term, firm commitment supply agreements that could result in excess or insufficient inventory
With respect to suppliers for our Components Segment, we purchase polysilicon, silicon ingots, inverters, solar panels and a balance of system components on both a contracted and a purchase order basis. We have contracted with some of our suppliers for multi-year supply agreements. Under such agreements, we have annual minimum purchase obligations and in certain cases prepayment obligations.

8
With respect to suppliers for our Systems Segment, we are able to utilize solar panels from various manufacturers depending on power, performance and cost requirements for our construction projects. We historically partnered, and intend to continue to partner, with solar cell and panel manufacturers that offer the most advanced solar panel technologies and the highest quality products.
Customers
Components Customers
We currently sell our solar power products to installers and resellers, including our global dealer network. We sell our products in North America, Europe, Asia and Australia, principally in regions where government incentives have accelerated solar power adoption. We currently work with a number of customers who have specific expertise and capabilities in a given market segment or geographic region. As we expand our manufacturing capacity, we anticipate developing additional customer relationships in other markets and geographic regions to continue to decrease our customer concentration and dependence.
We have four components customers that each accounted for more than 10 percent of our total revenue in fiscal 2006, and less than 10 percent of our total revenue in both fiscal 2008 and 2007 as follows:
Year Ended
December 28,
2008 December 30,
2007 December 31,
2006Significant components customers: Conergy AG * * 25% Solon AG * * 24% PowerLight** n.a. n.a. 16% General Electric Company*** * * 10%
* denotes less than 10% during the period ** acquired by us on January 10, 2007 *** includes its subcontracting partner, Plexus Corporation
International sales comprise the majority of components revenue and represented approximately 67%, 64% and 68% of components revenue in fiscal 2008, 2007 and 2006, respectively. We anticipate that a significant amount of our total revenue will continue to be generated by sales to customers outside the United States. A significant portion of our sales are denominated in Euros and we have entered into foreign currency forward exchange and option contracts to protect against an unfavorable U.S. dollar versus the Euro exchange rate. For more information about risks related to currency fluctuations, please see including We have significant international activities and customers, and plan to continue these efforts, which subject us to additional business risks, including logistical
A table providing total revenue by geography for the last three fiscal years is found in Note 17 to Consolidated Financial Statements in "Item 8: Financial Statements and Supplementary Data."
Systems Customers
Our systems customers include commercial and governmental entities, investors, utilities, production home builders and home owners. We work with construction, system integration and financing companies to deliver our solar power systems to the end-users of electricity. In the United States, we often work with financing companies that purchase solar power systems from us, and then sell solar electricity generated from these systems under power purchase agreements to end-users. Under power purchase agreements, the end-users typically pay the financing companies over an extended period of time based on energy they consume from the solar power systems, rather than paying for the full capital cost of purchasing the solar power systems. Worldwide, more than 500 SunPower solar power systems are commissioned or in construction, rated in the aggregate at more than 400 megawatts of peak capacity. In addition, our new homes division and our dealer network have deployed thousands of SunPower rooftop solar systems to residential customers. We have solar power system projects completed or in the process of being completed in various countries, including Germany, Italy, Portugal, South Korea, Spain and the United States.

9
We have two systems customers that each accounted for more than 10 percent of our total revenue in each of fiscal 2008 and 2007 as follows:
Year Ended
December 28,
2008 December 30,
2007Significant systems customers: Naturener Group 18% *Sedwick Corporate, S.L. 11% *SolarPack * 18% MMA Renewable Ventures * 16%
* denotes less than 10% during the period
Domestic and international systems sales represented approximately 38% and 62%, respectively, of our systems revenue in fiscal 2008 and 51% and 49%, respectively, of our systems revenue in fiscal 2007. Installations in California and Spain accounted for 34% and 54%, respectively, of our systems revenue for fiscal 2008. Installations in California, Nevada and Spain accounted for 24%, 22% and 46%, respectively, of our systems revenue for fiscal 2007. In June and July 2008, we energized several large-scale solar power plants in Spain rated at over 40 megawatts in the aggregate. In December 2007, we completed the construction of an approximately 14 megawatt solar power plant at Nellis Air Force Base in Nevada that currently represents our largest installed solar power project in North America.
Marketing and Sales
We market and sell solar electric power technologies worldwide both through a direct sales force and resellers, including our global dealer network. We have direct sales personnel or representatives in Australia, Germany, Italy, Korea, Singapore, Spain, Switzerland and the United States. And during fiscal 2008, we tripled the size of our dealer network by adding more than 350 dealers worldwide. Approximately 69%, 85% and 73% of our total revenue for fiscal 2008, 2007 and 2006, respectively, were derived through our direct sales force and sales affiliates, with the remainder from resellers. We provide warranty coverage on systems we sell through our direct sales force, sales affiliates and resellers. To the extent we sell through resellers, we may provide system design and support services while the resellers are responsible for construction, maintenance and service.
Our marketing programs include conferences and technology seminars, sales training, public relations and advertising. Our marketing group is also responsible for driving many qualified leads to support our sales teams lead generation efforts, assessing the productivity of our lead pipeline, and measuring marketing-generated leads to closed sales. We support our customers through our field application engineering and customer support organizations. We have marketing staff in San Jose and Richmond, California, United States, as well as in Geneva, Switzerland. Please see Note 17 of Notes to our Consolidated Financial Statements for information regarding our revenue by geographic region.
Backlog
Components Segment: Our solar cell, solar panel and inverter sales within the Components Segment are typically ordered by customers under standard purchase orders with relatively short delivery lead-times, generally within one to three months. We have entered into long-term supply agreements with certain customers that contain minimum firm purchase commitments. However, specific products that are to be delivered and the related delivery schedules under these long-term contracts are generally subject to revision by our customers.
Systems Segment: Our systems revenue is primarily comprised of engineering, procurement and construction, or EPC, projects which are governed by customer contracts that require us to deliver functioning solar power systems. EPC projects are generally completed within 6 to 36 months from the date of the contract signing. In addition, our Systems Segment also derives revenue from sales of certain solar power products and services that are smaller in scope than an EPC project. Our Systems Segment backlog represents the uncompleted portion of contracted and financed projects. For example, we have more than one gigawatt of contingent customer orders, including our contract with PG&E to design and build a 250 megawatt solar power plant in California. However, this contract is contingent and is not yet a financed project, therefore, it is excluded from backlog as of December 28, 2008. Our contract with FPL to design and build two
10
solar photovoltaic power plants totaling 35 megawatts in Florida is a financed project and is included in backlog as of December 28, 2008. Our EPC projects and contracts in our new homes group are often cancelable by our customers under certain situations. In addition, systems project revenue and related costs are often subject to delays or scope modifications based on change orders agreed to with our customers, or changes in the estimated construction costs to be incurred in completing the project.
Management believes that backlog at any particular date is not necessarily a meaningful indicator of future revenue for any particular period of time because our backlog excludes contracts signed and completed in the same quarter and contracts still subject to obtaining project financing. Backlog totaled approximately $1,144 million and $778 million as of December 28, 2008 and December 30, 2007, respectively. Approximately $450 million of our backlog at December 28, 2008 is currently planned to be recognized as revenue during fiscal 2009.
Competition
The market for solar electric power technologies is competitive and continually evolving. We expect to face increased competition, which may result in price reductions, reduced margins or loss of market share. Our solar power products compete with a large number of competitors in the solar power market, including, but not limited to, Evergreen Solar, Inc., First Solar, Inc., Q-Cells AG, Sanyo Corporation, Sharp Corporation and Suntech Power Holdings Co., Ltd. We may also face competition from some of our resellers, who may develop products internally that compete with our product and service offerings, or who may enter into strategic relationships with or acquire other existing solar power system providers. To the extent that government funding for research and development grants, customer tax rebates and other programs that promote the use of solar and other renewable forms of energy are limited, we compete for such funds, both directly and indirectly, with other renewable energy providers and customers.
In addition, universities, research institutions and other companies have brought to market alternative technologies such as thin films and concentrators, which compete with our technology in certain applications. Furthermore, the solar power market in general competes with conventional fossil fuels supplied by utilities and other sources of renewable energy such as wind, hydro, biomass, concentrated solar power and emerging distributed generation technologies such as micro-turbines, sterling engines and fuel cells. We believe solar power has certain advantages when compared to these other power generating technologies and offers a stable power price compared to utility network power, which typically increases as fossil fuel prices increase. In addition, solar power systems are deployed in many sizes and configurations and do not produce air, water and noise emissions. Most other distributed generation technologies create environmental impacts of some sort. The current high up-front cost of solar relative to utility network power, however, is the primary market barrier for on-grid applications.
In the large-scale on-grid solar power systems market, we face direct competition from a number of companies, including those that manufacture, distribute, or install solar power systems as well as construction companies that have expanded into the renewable sector. In addition, we will occasionally compete with distributed generation equipment suppliers.
We believe that the key competitive factors in the market for solar cells and solar panels include:
levelized cost of energy, or LCOE, an evaluation of the life-cycle energy costs and life-cycle energy production;
power efficiency and performance;
price;
aesthetic appearance of solar cells and panels;
strength of distribution relationships; and
timeliness of new product introductions.

11
The principal elements of competition in the solar systems market include technical expertise, experience, delivery capabilities, diversity of product offerings, financing structures, marketing and sales, price, product performance, quality, efficiency and reliability, and technical service and support. We believe that we compete favorably with respect to each of these factors, although we may be at a disadvantage in comparison to larger companies with broader product lines and greater technical service and support capabilities and financial resources. For more information about risks related to our competition, please see including If we fail to successfully develop and introduce new and enhanced products and services, we may not be able to compete effectively, and our ability to generate revenues will
Intellectual Property
We rely on a combination of patent, copyright, trade secret, trademark and contractual protections to establish and is our registered trademark in countries throughout the world for use with
solar cells, solar panels and mounting systems. We also hold registered trademarks for PowerLight®, PowerGuard®, PowerTracker® and SunTile® in certain countries. We are seeking and will continue to seek registration of the
customers to enter into confidentiality and nondisclosure agreements before we disclose any sensitive aspects of our solar cells, technology or business plans, and we typically enter into proprietary information agreements with employees and consultants.
Although we apply for patents to protect our technology, our revenue is not dependent on any particular patent we own. We currently own multiple patents and patent applications which cover aspects of the technology in the solar cells and mounting systems that we currently manufacture and market. Material patents that relate to our systems products and services primarily relate to our rooftop mounting products and ground-mounted tracking products. The remaining lifetimes of such patents range from one to twenty years. We intend to continue assessing appropriate opportunities for patent protection of those aspects of our technology, designs, and methodologies and processes that we believe provide significant competitive advantages to us, and for licensing opportunities of new technologies relevant to our business. We additionally rely on trade secret rights to protect our proprietary information and know-how. We employ proprietary processes and customized equipment in our manufacturing facilities.
For more information about risks related to our intellectual property, please see including We are dependent on our intellectual property, and we may face intellectual property infringement claims that could be time- and We rely substantially upon trade secret laws and contractual restrictions to protect our proprietary rights, and, if these rights are
and We may not obtain sufficient patent protection on the technology embodied in the solar cells or solar system components we currently
Public Policy Considerations
Different policy mechanisms have been used by governments to accelerate the adoption of solar power. Examples of customer-focused financial mechanisms include capital cost rebates, performance-based incentives, feed-in tariffs, tax credits and net metering. Capital cost rebates provide funds to customers based on power system. Performance-based incentives provide funding to a customer based on the energy produced by their solar system. Feed-in tariffs pay customers for solar power system generation based on kilowatt-hours produced, at a rate
United States and other countries, net metering has often been used as a supplemental program in conjunction with other policy mechanisms. Under net metering, a customer can generate more energy than used, during which periods the
equal amount of power at a later time. Net metering encourages customers to size their systems to match their electricity consumption over a period of time, such as monthly or annually, rather than limiting solar generation to matching
In addition to the mechanisms described above, new market development mechanisms to encourage the use of renewable energy sources continue to emerge. For example, many states in the United States have adopted renewable portfolio standards which mandate that a certain portion of electricity delivered to customers come from a set of eligible

12
renewable energy resources. In certain developing countries, governments are establishing initiatives to expand access to electricity, including initiatives to support off-grid rural electrification using solar power. For more information about risks related to public policies, please see including Existing regulations and policies and changes to these regulations and policies may present technical, regulatory and economic barriers to the purchase and
Environmental Regulations
We use, generate and discharge toxic, volatile or otherwise hazardous chemicals and wastes in our research and development, manufacturing and construction activities. We are subject to a variety of foreign, federal, state and local governmental laws and regulations related to the purchase, storage, use and disposal of hazardous materials.
We believe that we have all environmental permits necessary to conduct our business and expect to obtain all necessary environmental permits for FAB3 and future construction activities. We believe that we have properly handled our hazardous materials and wastes and have appropriately remediated any contamination at any of our premises. We are not aware of any pending or threatened environmental investigation, proceeding or action by foreign, federal, state or local agencies, or third-parties involving our current facilities. Any failure by us to control the use of, or to restrict adequately the discharge of, hazardous substances could subject us to substantial financial liabilities, operational interruptions and adverse publicity, any of which could materially and adversely affect our business, results of operations and financial condition.
Employees
As of December 28, 2008, we had approximately 5,400 employees worldwide, including approximately 540 employees located in the United States, 4,710 employees located in the Philippines and 150 employees located in other countries. Of these employees, approximately 4,460 were engaged in manufacturing, 150 employees in construction projects, 150 employees in research and development, 470 employees in sales and marketing and 170 employees in general and administrative. None of our employees are covered by a collective bargaining agreement. We have never experienced a work stoppage and we believe relations with our employees are good.
Available Information
We make available our Annual Reports on Form 10-K, Quarterly Reports on Form 10-Q, Current Reports on Form 8-K, and amendments to those reports filed or furnished pursuant to Section 13(a) or Section 15(d) of the Securities Exchange Act of 1934 free of charge on our website at www.sunpowercorp.com, as soon as reasonably practicable after they are electronically filed or furnished to the Securities and Exchange Commission, or the SEC. Additionally, copies of materials filed by us with the SEC may 100Public Reference Room, the public may contact 1-800-SEC-0330. Copies of material filed by us with the SEC may also be obtained by writing to us at our corporate headquarters, SunPower Corporation, Attention: Investor Relations, 3939 North First Street, San Jose, California 95134, or by calling (408) 240-5500. The contents of our website are not incorporated into, or otherwise to be regarded as a part of, this Annual Report on Form 10-K.

13
ITEM 1A: RISK FACTORS
Our operations and financial results are subject to various risks and uncertainties, including risks related to our supply chain, sales channels including availability of project financing, liquidity, operations, intellectual property, and our debt and equity securities. Although we believe that we have identified and discussed below the key risk factors affecting our business, there may be additional risks and uncertainties that are not presently known or that are not currently believed to be significant that may also adversely affect our business, financial condition, results of operations, cash flows, and trading price of our class A and class B common stock as well as our 1.25% debentures and 0.75% debentures.
Risks Related to Our Supply Chain
We will continue to be dependent on a limited number of third-party suppliers for certain raw materials and components for our products, which could prevent us from delivering our products to our customers within required timeframes, which could result in sales and installation delays, cancellations, liquidated damages and loss of market share.
We rely on a limited number of third-party suppliers for certain raw materials and components for our solar cells and power systems such as polysilicon and inverters. If we fail to develop or maintain our relationships with our limited suppliers, we may be unable to manufacture our products or our products may be available only at a higher cost or after a long delay, which could prevent us from delivering our products to our customers within required timeframes and we may experience order cancellation and loss of market share. To the extent the processes that our suppliers use to manufacture components are proprietary, we may be unable to obtain comparable components from alternative suppliers.
to raise capital if required to expand their production or satisfy their operating capital requirements. As a result, they could be unable to supply necessary raw materials, inventory and capital equipment to us which we would require to support our planned sales operations which would in turn negatively impact our sales volumes and cash flows. The failure of a supplier to supply raw materials or components in a timely manner, or to supply raw materials or components that meet our quality, quantity and cost requirements, could impair our ability to manufacture our products or increase their costs. If we cannot obtain substitute materials or components on a timely basis or on acceptable terms, we could be prevented from delivering our products to our customers within required timeframes, which could result in sales and installation delays, cancellations, liquidated damages and loss of market share, any of which could have a material adverse effect on our business and results of operations.
As polysilicon supply increases, the corresponding increase in the global supply of solar cells and panels may cause substantial downward pressure on the prices of such products, resulting in lower revenues and earnings.
The scarcity of polysilicon during the past few years has resulted in the underutilization of solar panel manufacturing capacity at many competitors or potential competitors, particularly in China. If additional polysilicon becomes available in the market over the next two years, solar panel production globally could increase. Decreases in polysilicon pricing and increases in solar panel production could each result in substantial downward pressure on the price of solar cells and panels, including SunPower products. Such price reductions could have a negative impact on our revenue and earnings, and materially adversely affect our business and financial condition.
Limited competition among suppliers has required us in some instances to enter into long-term, firm commitment supply agreements that could result in excess or insufficient inventory and place us at a competitive disadvantage.
Due to the industry-wide shortage of polysilicon experienced during the past few years, we have purchased polysilicon that we resell to third-party ingot and wafer manufacturers who deliver wafers to us that we then use in the manufacturing of our solar cells. Without sufficient polysilicon, some of those ingot and wafer manufacturers would not be able to produce the wafers on which we rely. To match our estimated customer demand forecasts and growth strategy for the next several years, we have entered into multiple long-term supply agreements. Some agreements provide for fixed or inflation-adjusted pricing, substantial prepayment obligations, and firm purchase commitments that require us to pay for the supply whether or not we accept delivery. If such agreements require us to purchase more polysilicon, ingots or wafers than required to meet our actual customer demand over time, the resulting excess inventory could materially and negatively impact our results of operations. In addition, if the prices under our long-term supply agreements result in

14
our paying more for such supplies than the current market prices available to our competitors, we may also be placed at a competitive disadvantage, and our revenues could decline. However, if our agreements provide insufficient inventory to meet customer demand, or if our suppliers are unable or unwilling to provide us with the contracted quantities, we may purchase additional supply at available market prices which could be greater than expected and could materially and negatively impact our results of operations. Such market prices could also be greater than prices paid by our competitors, placing us at a competitive disadvantage and leading to a decline in our revenue. Further, we face significant specific counterparty risk under long-term supply agreements when dealing with suppliers without a long, stable production and financial history. In the event any such supplier experiences financial difficulties, it may be difficult or impossible, or may require substantial time and expense, for us to recover any or all of our prepayments. Any of the foregoing could materially harm our financial condition and results of operations.
If third-party manufacturers become unable or unwilling to sell their solar cells and panels to us as a direct competitor in some markets, our business and results of operations may be materially negatively affected.
We plan to purchase a portion of our total product mix from third-party manufacturers of solar cells and panels. Such products increase our inventory available for sale to systems customers in some markets. However, such manufacturers may be our direct competitors. If they are unable or unwilling to sell to us, we may not have sufficient products available to sell to systems customers and satisfy our sales commitments, thereby materially and negatively affecting our business and results of operations.
Risks Related to Our Sales Channels
The execution of our growth strategy is dependent upon the continued availability of third-party financing arrangements for our customers, and is affected by general economic conditions.
The general economy and limited availability of credit and liquidity could materially and adversely affect our business and results of operations. Many purchasers of our systems projects have entered into third-party arrangements to finance their systems over an extended period of time while many end-customers have chosen to purchase solar electricity under a power purchase agreement, or PPA, with a financing company that purchases the system from us or our authorized dealers. In addition, under our power purchase business model, we often execute PPAs directly with the end-user customer purchasing solar electricity, with the expectation that we will later assign the PPA to a financier. Under such arrangements, the financier separately contracts with us to build and acquire the solar system, and then sells the electricity to the end-user customer under the assigned PPA. When executing PPAs with the end-user customers, we seek to mitigate the risk that a financier will not be available for the project by allowing termination of the PPA in such event without penalty. However, we may not always be successful in negotiating for penalty-free termination rights for failure to secure financing, and certain end-user customers have required substantial financial penalties in exchange for such rights. These structured finance arrangements are complex and may not be feasible in many situations.
Due to the general reduction in available credit to would-be borrowers and the poor state of economies worldwide, customers may be unable or unwilling to finance the cost of our products, or the parties that have historically provided this financing may cease to do so, or only do so on terms that are substantially less favorable for us or our customers, any of which could materially and adversely affect our revenue and growth in all segments of our business. If economic recovery is slow in the United States or elsewhere, we may experience decreases in the demand for our solar power products, which may harm our operating results. In addition, a rise in interest rates would likely cost of financing our products and could reduce their profits and expected returns on investment in our products. Similarly, the general reduction in available credit to would-be borrowers, the poor state of economies worldwide, and the condition of housing markets worldwide, could delay or reduce our sales of products to new homebuilders and authorized resellers. Collecting payment from customers facing liquidity challenges may also be difficult.
The reduction, modification or elimination of government and economic incentives could cause our revenue to decline and harm our financial results.
The market for on-from the utility network or sold to a utility under tariff, depends in large part on the availability and size of government mandates and economic incentives because, at present, the cost of solar power exceeds retail electric rates in many

15
locations. Such incentives vary by geographic market. Various government bodies in many countries, most notably Spain, the United States, Germany, Italy, South Korea, Canada, Japan, Portugal, Greece, France and Australia, have provided incentives in the form of feed-in tariffs, rebates, tax credits, renewable portfolio standards, and other incentives and mandates to end-users, distributors, system integrators and manufacturers of solar power products to promote the use of solar energy in on-grid applications and to reduce dependency on other forms of energy. Some of these government mandates and economic incentives are scheduled to be reduced or to expire, or could be eliminated altogether. Because our sales are into the on-grid market, the reduction, modification or elimination of government mandates and economic incentives in one or more of our customer markets would materially and adversely affect the growth of such markets or result in increased price competition, either of which could cause our revenue to decline and harm our financial results.
Existing regulations and policies and changes to these regulations and policies may present technical, regulatory and economic barriers to the purchase and use of solar power products, which may significantly reduce demand for our products and services.
The market for electricity generation products is heavily influenced by federal, state and local government regulations and policies concerning the electric utility industry in the U.S. and abroad, as well as policies promulgated by electric utilities. These regulations and policies often relate to electricity pricing and technical interconnection of customer-owned electricity generation, and could deter further investment in the research and development of alternative energy sources as well as customer purchases of solar power technology, which could result in a significant reduction in the potential demand for our solar power products. We anticipate that our solar power products and their installation will continue to be subject to oversight and regulation in accordance with federal, state and local regulations relating to construction, safety, environmental protection, utility interconnection and metering, and related matters. It is difficult to track the requirements of individual states and design equipment to comply with the varying standards. Any new regulations or policies pertaining to our solar power products may result in significant additional expenses to us, our
tion in demand for our solar power products.
We may incur unexpected warranty and product liability claims that could materially and adversely affect our financial condition and results of operations.
In our Components Segment, our current standard product warranty for our solar panels includes a 10-year warranty period for defects in materials and workmanship and a 20-year warranty period for declines in power performance as well as a one-year warranty on the functionality of our solar cells. We believe our warranty periods are consistent with industry practice. Due to the long warranty period, we bear the risk of extensive warranty claims long after we have shipped product and recognized revenue. Although we conduct accelerated testing of our solar cells and have several years of experience with our all-back-contact cell architecture, our solar panels have not and cannot be tested in an environment simulating the 20-year warranty period and it is difficult to test for all conditions that may occur in the field. We have sold solar cells since late 2004.
In our Systems Segment, our current standard warranty for our solar power systems differs by geography and end-customer application and includes either a 1-, 2- or 5-year comprehensive parts and workmanship warranty, after which the customer may typically extend the period covered by its warranty for an additional fee. While we generally pass through manufacturer warranties we receive from our suppliers to our customers, we are responsible for repairing or
the manufacturer disputes or otherwise fails to honor its warranty obligations, we may be required to incur substantial costs before we are compensated, if at all, by the manufacturer. Furthermore, our warranties may exceed the period of any warranties from our suppliers covering components, such as inverters, included in our systems. Due to the long warranty period, we bear the risk of extensive warranty claims long after we have completed a project and recognized revenues.
Any increase in the defect rate of our products would cause us to increase the amount of warranty reserves and have a corresponding negative impact on our results of operations. Further, potential future product failures could cause us to incur substantial expense to repair or replace defective products, and we have agreed to indemnify our customers and our distributors in some circumstances against liability from defects in our solar cells. A successful indemnification claim against us could require us to make significant damage payments. Repair and replacement costs, as well as successful indemnification claims, could materially and negatively impact our financial condition and results of operations.

16
Like other retailers, distributors and manufacturers of products that are used by customers, we face an inherent risk of exposure to product liability claims in the event that the use of the solar power products into which our solar cells and solar panels are incorporated results in injury. We may be subject to warranty and product liability claims in the event that our solar power systems fail to perform as expected or if a failure of our solar power systems results, or is alleged to result, in bodily injury, property damage or other damages. Since our solar power products are electricity producing devices, it is possible that our products could result in injury, whether by product malfunctions, defects, improper installation or other causes. In addition, since we only began selling our solar cells and solar panels in late 2004 and the products we are developing incorporate new technologies and use new installation methods, we cannot predict whether or not product liability claims will be brought against us in the future or the effect of any resulting negative publicity on our business. Moreover, we may not have adequate resources in the event of a successful claim against us. We have evaluated the potential risks we face and believe that we have appropriate levels of insurance for product liability claims. We rely on our general liability insurance to cover product liability claims and have not obtained separate product liability insurance. However, a successful warranty or product liability claim against us that is not covered by insurance or is in excess of our available insurance limits could require us to make significant payments of damages. In addition, quality issues can have various other ramifications, including delays in the recognition of revenue, loss of revenue, loss of future sales opportunities, increased costs associated with repairing or replacing products, and a negative impact on our goodwill and reputation, which could also adversely affect our business and operating results.
If we fail to successfully develop and introduce new and enhanced products and services, we may not be able to compete effectively, and our ability to generate revenues will suffer.
The solar power market is characterized by continually changing technology requiring improved features, such as increased efficiency and higher power output and improved aesthetics. Technologies developed by our direct competitors, including thin film solar panels, concentrating solar cells, solar thermal electric and other solar technologies, may provide power at lower costs than our products. We also face competition in some markets from other power generation sources, including conventional fossil fuels, wind, biomass, and hydro. Our failure to further refine our technology and develop and introduce new solar power products could cause our products to become uncompetitive or obsolete, which could reduce our market share and cause our sales to decline. This will require us to continuously develop new solar power products and enhancements for existing solar power products to keep pace with evolving industry standards, competitive pricing and changing customer requirements. As we introduce new or enhanced products or integrate new technology into our products, we will face risks relating to such transitions including, among other
arising from the integration of new technology and a potentially different sales and support environment relating to any new technology. Our failure to manage the transition to newer products or the integration of newer technology into our products could aresults and financial condition.
A limited number of customers are expected to continue to comprise a significant portion of our revenues and any decrease in revenue from these customers could have a significant adverse effect on us.
Even though we expect our customer base to increase and our revenue streams to diversify, a substantial portion of our net revenues could continue to depend on sales to a limited number of customers and the loss of sales to or inability to collect from these customers would have a significant negative impact on our business. Our agreements with these customers may be cancelled if we fail to meet certain product specifications or materially breach the agreement or in the event of bankruptcy, and our customers may seek to renegotiate the terms of current agreements or renewals. In addition, the failure by any significant customer to pay for orders, whether due to liquidity issues or otherwise, could materially and negatively affect our results of operations.
We generally do not have long-term agreements with our customers and accordingly could lose customers without warning, which could cause our operating results to fluctuate.
In our Components Segment, our solar cells and solar panel products are generally not sold pursuant to long-term agreements with customers, but instead are sold on a purchase order basis. In our Systems Segment, we typically contract to perform large projects with no assurance of repeat business from the same customers in the future. Although we believe that cancellations on our purchase orders to date have been insignificant, our customers may cancel or
17
reschedule purchase orders with us on relatively short notice. Cancellations or rescheduling of customer orders could result in the delay or loss of anticipated sales without allowing us sufficient time to reduce, or delay the incurrence of, our corresponding inventory and operating expenses. In addition, changes in forecasts or the timing of orders from these or other customers expose us to the risks of inventory shortages or excess inventory. These circumstances, in addition to the completion and non-repetition of large systems projects, variations in average selling prices, changes in the relative mix of sales of components versus system products, and the fact that our supply agreements are generally long-term in nature and many of our other operating costs are fixed, in turn could cause our operating results to fluctuate and may result in a material adverse effect in our business.
Our Systems Segment could be adversely affected by seasonal trends and construction cycles.
Our Systems Segment is subject to significant industry-specific seasonal fluctuations. Its sales have historically reflected these seasonal trends with the largest percentage of total revenues being realized during the last two calendar quarters. Low seasonal demand normally results in reduced shipments and revenues in the first two calendar quarters. There are various reasons for this seasonality, mostly related to economic incentives and weather patterns. For example, in European countries with feed-in tariffs, the construction of solar power systems may be concentrated during the second half of the calendar year, largely due to the annual reduction of the applicable minimum feed-in tariff and the fact that the coldest winter months are January through March. In the United States, customers will sometimes make purchasing decisions towards the end of the year in order to take advantage of tax credits or for other budgetary reasons. In addition, sales in the new home development market are often tied to construction market demands which tend to follow national trends in construction, including declining sales during cold weather months.
The competitive environment in which our systems business operates often requires us to undertake post-sale customer obligations, which could materially and adversely affect our financial condition and results of operations if our post-sale customer obligations are more costly than expected.
We are often required as a condition of financing or at the request of our end customer to undertake certain post-sale obligations such as:
System output performance guaranties;
System maintenance;
Liquidated damage payments or customer termination rights if the system we are constructing is not commissioned within specified timeframes or other construction milestones are not achieved;
Guaranties of certain minimum residual value of the system at specified future dates; and
System put-rights whereby we could be required to buy-future dates.
Such financing arrangements and post-sale obligations involve complex accounting analyses and judgments regarding the timing of revenue and expense recognition and in certain situations these factors may require us to defer revenue recognition until projects are completed, which could adversely affect revenue and profits in a particular period.
Risks Related to Our Liquidity
Due to the general economic environment and other factors, we may be unable to generate sufficient cash flows or obtain access to external financing necessary to fund our operations and make adequate capital investments as planned.
We anticipate that our expenses will increase substantially in the foreseeable future. To develop new products, support future growth, achieve operating efficiencies and maintain product quality, we must make significant capital investments in manufacturing technology, facilities and capital equipment, research and development, and product and process technology. We also anticipate increased costs as we expand our manufacturing operations, hire additional personnel, pay more or make advance payments for raw material, especially polysilicon, increase our sales and

18
marketing efforts, invest in joint ventures and acquisitions, and continue our research and development efforts with respect to our products and manufacturing technologies. We expect total capital expenditures in the range of $350 million to $400 million in 2009 as we continue to increase our solar cell and solar panel manufacturing capacity. These expenditures could be greater if we decide to bring capacity on line more rapidly.
We believe that our current cash and cash equivalents, cash generated from operations, funds available under our facility agreement with the Malaysian government, and, if necessary, borrowings under our credit agreement with Wells Fargo Bank, N.A., or Wells Fargo, and/or potential availability of future sources of funding will be sufficient to fund our capital and operating expenditures over the next 12 months. The uncollateralized revolving credit line and uncollateralized letter of credit subfeature of the Wells Fargo credit agreement are scheduled to expire on July 3, 2009, and we are negotiating another amendment to further extend the expiration date. If we do not agree to amend the credit agreement to futher extend the deadline, all borrowings under the uncollateralized revolving credit line must be repaid by July 3, 2009, and all letters of credit issued under the uncollateralized letter of credit subfeature expire on or before July 3, 2009 unless we provide by such date collateral in the form of cash or cash equivalents in the aggregate amount available to be drawn under letters of credit outstanding at such time. Our cash flows from operations depend primarily on the volume of components sold and systems installed, average selling prices, per unit manufacturing costs and other operating costs.
However, if our financial results or operating plans change from our current assumptions, or if the holders of our outstanding convertible debentures elect to convert the debentures into cash or cash and shares of class A common stock, we may not have sufficient resources to support our business plan or pay cash in connection with the redemption of outstanding debentures. If our capital resources are insufficient to satisfy our liquidity requirements, we may seek to sell additional equity securities or debt securities or obtain other debt financing; although, the current economic environment could also limit our ability to raise capital by issuing new equity or debt securities on acceptable terms, and lenders may be unwilling to lend funds on acceptable terms that would be required to supplement cash flows to support operations. Further, following the spin-off of our shares by Cypress on September 29, 2008, our ability to issue equity
Our agreements with Cypress require us to indemnify Cypress for certain tax liabilities. These indemnification obligations and related contractual restrictions may limit our ability to obtain additional financing, participate in future acquisitions or pursue other business initiativessell assets, reduce or delay capital investments, or refinance or restructure our debt.
There can be no assurance that we will be able to generate sufficient cash flows, find other sources of capital or access capital markets to fund our operations and projects, make adequate capital investments to remain competitive in terms of technology development and cost efficiency. If adequate funds and alternative resources are not available on acceptable terms, our ability to fund our operations, develop and expand our manufacturing operations and distribution network, maintain our research and development efforts or otherwise respond to competitive pressures would be significantly impaired. Our inability to do the foregoing could have a material adverse effect on our business and results of operations.
If the recent credit market conditions continue or worsen, they could have a material adverse impact on our investment portfolio.
Recent U.S. sub-prime mortgage defaults have had a significant impact across various sectors of the financial markets, causing global credit and liquidity issues. During fiscal 2008, the net asset value of the Reserve Primary Fund and the Reserve International Liquidity Fund fell below $1.00. We had $8.2 million invested in the Reserve Funds on December 28, 2008, and we have estimated our loss to be approximately $1.0 million based on an evaluation of the fair value of the securities held by the Reserve Funds and the net asset value that was last published by the Reserve Funds before the funds suspended redemptions.
While we expect to receive substantially all of our current holdings in the Reserve Funds within the next nine months, it is possible we may encounter difficulties in receiving distributions given the current credit market conditions. If market conditions were to deteriorate even further such that the current fair value were not achievable, we could realize additional losses in our holdings with the Reserve Funds and distributions could be further delayed. There can be no assurance that our other investments, particularly in this unfavorable market and economic environment, will not face similar risks of loss.

19
Additionally, beginning in February 2008, the auction rate securities market experienced a significant increase in the number of failed auctions, resulting from a lack of liquidity, which occurs when sell orders exceed buy orders, and does not necessarily signify a default by the issuer. Of the $26.1 million invested in auction rate securities on December 28, 2008, we have estimated the loss to be approximately $2.5 million and we recorded an impairment charge of $2.5
r Consolidated Statements of Operations thereby establishing a new cost basis of $23.6 million for the auction rate securities. All five auction rate securities invested in at December 28, 2008 have failed to clear at auctions. For failed auctions, we continue to earn interest on these investments at the maximum contractual rate as the issuer is obligated under contractual terms to pay penalty rates should auctions fail. Even if we need to access these funds, we will not be able to do so until a future auction is successful, the issuer redeems the securities, a buyer is found outside of the auction process, or the securities mature. If these auction rate securities are unable to successfully clear at future auctions or issuers do not redeem the securities, we may be required to further adjust the carrying value of the securities and record an impairment charge which could materially adversely impact our results of operations and financial condition.
If our investment portfolio decreases in value or if we are unable to access funds held as auction rate securities, we may have insufficient liquidity to fund our planned operations and capital requirements, which may materially and negatively affect our financial condition and results of operations.
Our current tax holidays in the Philippines will expire within the next several years.
registration with the Philippine Economic Zone Authority, which provide that we pay no income tax in the Philippines. Our current income tax holidays expire within the next several years beginning in 2010, and we intend to apply for extensions and renewals upon expiration. However, these tax holidays may or may not be extended. We believe that as our Philippine tax holidays expire, (a) gross income attributable to activities covered by our Philippine Economic Zone Authority registrations will be taxed at a 5% preferential rate, and (b) our Philippine net income attributable to all other activities will be taxed at the statutory Philippine corporate income tax rate, currently 32%. An increase in our tax liability could materially and negatively affect our financial condition and results of operations.
Because we self-insure for certain indemnities we have made to our officers and directors, potential claims could materially and negatively impact our financial condition and results of operations.
Our certificate of incorporation, by-laws and indemnification agreements require us to indemnify our officers and directors for certain liabilities that may arise in the course of their service to us. We primarily self-insure with respect topotential indemnifiable claims. Although we have insured our officers and directors against certain potential third-party claims for which we are legally or financially unable to indemnify them, we intend to primarily self-insure with respect to potential third-party claims which give rise to direct liability to such third-party or an indemnification duty on our part.If we were required to pay a significant amount on account of these liabilities for which we self-insure, our business, financial condition and results of operations could be materially harmed.
Our substantial indebtedness and other contractual commitments could adversely affect our business, financial condition and results of operations, as well as our ability to meet any of our payment obligations under the debentures and our other debt.
We currently have a significant amount of debt and debt service requirements that could have material consequences on our future operations, including:
making it more difficult for us to meet our payment and other obligations under the debentures and our other outstanding debt;
resulting in an event of default if we fail to comply with the financial and other restrictive covenants contained in our debt agreements, which event of default could result in all of our debt becoming immediately due and payable;
reducing the availability of our cash flow to fund working capital, capital expenditures, acquisitions and other general corporate purposes, and limiting our ability to obtain additional financing for these purposes;

20
subjecting us to the risk of increased sensitivity to interest rate increases on our indebtedness with variable interest rates, including borrowings under our new credit facility;
limiting our flexibility in planning for, or reacting to, and increasing our vulnerability to, changes in our business, the industry in which we operate and the general economy; and
placing us at a competitive disadvantage compared to our competitors that have less debt or are less leveraged.
Any of the above-listed factors could have an adverse effect on our business, financial condition and results of operations and our ability to meet our payment obligations under the debentures and our other debt. In addition, we also have significant contractual commitments for the purchase of polysilicon, some of which involve prepayments, and we may enter into additional, similar long-term supply agreements in the future. Further, if the holders of our outstanding debentures convert their debentures, the principal amount must be settled in cash and to the extent that the conversion obligation exceeds the principal amount of any debentures converted, we must satisfy the remaining conversion obligation of the 1.25% debentures in shares of our class A common stock, and we maintain the right to satisfy the remaining conversion obligation of the 0.75% debentures in shares of our class A common stock or cash. During the fourth quarter of fiscal 2008, holders of $1.4 million in aggregate principal amount of the 1.25% debentures converted their debentures. Future conversions could materially and adversely affect our liquidity and our ability to meet our payment obligations under our debt.
Our credit agreements contain covenant restrictions that may limit our ability to operate our business.
We may be unable to respond to changes in business and economic conditions, engage in transactions that might otherwise be beneficial to us, and obtain additional financing, if needed because our credit agreement with Wells Fargo and facility agreement with the Government of Malaysia contain, and any of our other future debt agreements may contain, covenant restrictions that limit our ability to, among other things:
incur additional debt, assume obligations in connection with letters of credit, or issue guarantees;
create liens;
make certain investments or acquisitions;
enter into transactions with our affiliates;
sell certain assets;
redeem capital stock or make other restricted payments;
declare or pay dividends or make other distributions to stockholders; and
merge or consolidate with any person.
Our ability to comply with these covenants is dependent on our future performance, which will be subject to many factors, some of which are beyond our control, including prevailing economic conditions. In addition, our failure to comply with these covenants could result in a default under the debentures and our other debt, which could permit the holders to accelerate such debt. If any of our debt is accelerated, we may not have sufficient funds available to repay such debt, which could materially and negatively affect our financial condition and results of operation.
21
Risks Related to Our Operations
We may not be able to increase or sustain our recent growth rate, and we may not be able to manage our future growth effectively.
We may not be able to continue to expand our business or manage future growth. We plan to significantly increase our production capacity between 2009 and 2010, which will require successful execution of
expanding our existing manufacturing facilities and developing new manufacturing facilities, which would increase our fixed costs and, if such facilities are underutilized, would negatively impact our results of operations;
ensuring delivery of adequate polysilicon and ingots;
developing more efficient wafer-slicing methods;
enhancing our customer resource management and manufacturing management systems;
implementing and improving additional and existing administrative, financial and operations systems, procedures and controls, including the need to update and integrate our financial internal control systems in SP Systems and in our Philippines facility with those of our San Jose, California headquarters;
hiring additional employees;
expanding and upgrading our technological capabilities;
manage multiple relationships with our customers, suppliers and other third-parties;
maintaining adequate liquidity and financial resources; and
continuing to increase our revenues from operations.
Our recent expansion has placed, and our planned expansion and any other future expansion will continue to place, a significant strain on our management, personnel, systems and resources. Expanding our manufacturing facilities or developing facilities may be delayed by difficulties such as unavailability of equipment or supplies or equipment malfunction. Ensuring delivery of adequate polysilicon and ingots is subject to many market risks including scarcity, significant price fluctuations and competition. Maintaining adequate liquidity is dependent upon a variety of factors including continued revenues from operations and compliance with our indentures and credit agreements. In addition, following the spin-off of our shares by Cypress on September 29, 2008, our ability to issue equity for financing purposes will be restricted by our tax sharing agreement with Cypress. If we are unsuccessful in any of these areas, we may not be able to achieve our growth strategy and increase production capacity as planned during the foreseeable future. If we are unable to manage our growth effectively, we may not be able to take advantage of market opportunities, develop new solar cells and other products, satisfy customer requirements, execute our business plan or respond to competitive pressures.
We have significant international activities and customers, and plan to continue these efforts, which subject us to additional business risks, including logistical complexity and political instability.
In fiscal 2008, 2007 and 2006, a substantial portion of our sales was made to customers outside of the United States, and a substantial portion of our supply agreements is with supply and equipment vendors located outside of the United States. Historically, we have had significant sales in Austria, Germany, Italy, Spain and South Korea. Currently our solar cell production lines are located at our manufacturing facilities in the Philippines, and we plan to construct another manufacturing facility in Malaysia. In addition, a majority of our assembly functions have historically been conducted by a third-party subcontractor in China. Risks we face in conducting business internationally include:
multiple, conflicting and changing laws and regulations, export and import restrictions, employment laws,

22
regulatory requirements and other government approvals, permits and licenses;
difficulties and costs in staffing and managing foreign operations as well as cultural differences;
potentially adverse tax consequences associated with our permanent establishment of operations in more countries;
relatively uncertain legal systems, including potentially limited protection for intellectual property rights, and laws, regulations and policies which impose additional restrictions on the ability of foreign companies to conduct business in certain countries or otherwise place them at a competitive disadvantage in relation to domestic companies;
inadequate local infrastructure and developing telecommunications infrastructures;
financial risks, such as longer sales and payment cycles and greater difficulty collecting accounts receivable;
currency fluctuations and government-fixed foreign exchange rates and the effects of currency hedging activity or inability to hedge currency fluctuations; and
political and economic instability, including wars, acts of terrorism, political unrest, boycotts, curtailments of trade and other business restrictions.
If we are unable to successfully manage any such risks, any one or more could materially and negatively affect our business, financial condition and results of operations.
Our operating results will be subject to fluctuations and are inherently unpredictable.
To maintain our profitability, we will need to generate and sustain higher revenue while maintaining reasonable cost and expense levels. We do not know if our revenue will grow, or if it will grow sufficiently to outpace our expenses, which we expect to increase as we expand our manufacturing capacity. We may not be able to sustain or increase profitability on a quarterly or an annual basis. Our quarterly revenue and operating results will be difficult to predict and have in the past fluctuated from quarter to quarter. In particular, our Systems Segment is difficult to forecast and is susceptible to large fluctuations in financial results. The amount, timing and mix of sales of our Systems Segment, often for a single medium or large-scale project, may cause large fluctuations in our revenue and other financial results. Further, our revenue mix of high margin material sales versus lower margin projects in the Systems Segment can fluctuate dramatically quarter to quarter, which may adversely affect our revenue and financial results in any given period. Finally, our ability to meet project completion schedules for an individual project and the corresponding revenue impact under the percentage-of-completion method of recognizing revenue, may similarly cause large fluctuations in our revenue and other financial results. This may cause us to miss any future guidance announced by us.
We base our planned operating expenses in part on our expectations of future revenue, and a significant portion of our expenses will be fixed in the short-term. If revenue for a particular quarter is lower than we expect, we likely will be unable to proportionately reduce our operating expenses for that quarter, which would harm our operating results for that quarter. This may cause us to miss any guidance announced by us.
If we experience interruptions in the operation of our solar cell production lines or are unable to add additional production lines, it would likely result in lower revenue and earnings than anticipated.
We currently have twelve solar cell manufacturing lines in production which are located at our manufacturing facilities in the Philippines. If our current or future production lines were to experience any problems or downtime, we would be unable to meet our production targets and our business would suffer. If any piece of equipment were to break down or experience downtime, it could cause our production lines to go down. We have started operations in our second solar cell manufacturing facility nearby our existing facility in the Philippines and we plan to construct another manufacturing facility in Malaysia. This expansion has required and will continue to require significant management attention, a significant investment of capital and substantial engineering expenditures and is subject to significant risks including:

23
we may experience cost overruns, delays, equipment problems and other operating difficulties;
we may experience difficulties expanding our processes to larger production capacity;
our custom-built equipment may take longer and cost more to engineer than planned and may never operate as designed; and
we are incorporating first-time equipment designs and technology improvements, which we expect to lower unit capital and operating costs, but this new technology may not be successful.
If we experience any of these or similar difficulties, we may be unable to complete the addition of new production lines on schedule in order to expand our manufacturing facilities and our manufacturing capacity could be substantially constrained. If this were to occur, our per-unit manufacturing costs would increase, we would be unable to increase sales or gross margins as planned and our earnings would likely be materially impaired.
If we do not achieve satisfactory yields or quality in manufacturing our solar cells, our sales could decrease and our relationships with our customers and our reputation may be harmed.
The manufacture of solar cells is a highly complex process. Minor deviations in the manufacturing process can cause substantial decreases in yield and in some cases, cause production to be suspended or yield no output. We have from time to time experienced lower than anticipated manufacturing yields. This often occurs during the production of new products or the installation and start-up of new process technologies or equipment. As we expand our manufacturing capacity and bring additional lines or facilities into production, we may experience lower yields initially as is typical with any new equipment or process. We also expect to experience lower yields as we continue the initial migration of our manufacturing processes to thinner wafers. If we do not achieve planned yields, our product costs could increase, and product availability would decrease resulting in lower revenues than expected.
Additionally, products as complex as ours may contain undetected errors or defects, especially when first introduced. For example, our solar cells and solar panels may contain defects that are not detected until after they are shipped or are installed because we cannot test for all possible scenarios. These defects could cause us to incur significant re-engineering costs, divert the attention of our engineering personnel from product development efforts and significantly affect our customer relations and business reputation. If we deliver solar cells or solar panels with errors or defects, including cells or panels of third-party manufacturers, or if there is a perception that such solar cells or solar panels contain errors or defects, our credibility and the market acceptance and sales of our products could be harmed.
We obtain capital equipment used in our manufacturing process from sole suppliers and if this equipment is damaged or otherwise unavailable, our ability to deliver products on time will suffer, which in turn could result in order cancellations and loss of revenue.
Some of the capital equipment used in the manufacture of our solar power products and in our wafer-slicing operations have been developed and made specifically for us, is not readily available from multiple vendors and would be difficult to repair or replace if it were to become damaged or stop working. If any of these suppliers were to experience financial difficulties or go out of business, or if there were any damage to or a breakdown of our manufacturing or wafer-slicing equipment at a time when we are manufacturing commercial quantities of our products,
quality and on terms acceptable to us, could delay our capacity expansion of our manufacturing facility and otherwise disrupt our production schedule or increase our costs of production.
We depend on a third-party subcontractor in China to assemble a significant portion of our solar cells into solar panels and any failure to obtain sufficient assembly and test capacity could significantly delay our ability to ship our solar panels and damage our customer relationships.
Historically, we have relied on Jiawei SolarChina Co., Ltd., a third-party subcontractor in China, to assemble a significant portion of our solar cells into solar panels and perform panel testing and to manage packaging, warehousing and shipping of our solar panels. We do not have a long-term agreement with Jiawei and we typically obtain its services

24
based on short-term purchase orders that are generally aligned and our sales forecasts. As a result of outsourcing a significant portion of this final step in our production, we face several significant risks, including limited control over assembly and testing capacity, delivery schedules, quality assurance, manufacturing yields and production costs. If the operations of Jiawei were disrupted or its financial stability impaired, or if it were unable or unwilling to devote capacity to our solar panels in a timely manner, our business would suffer as we may be unable to produce finished solar panels on a timely basis. We also risk customer delays resulting from an inability to move module production to an alternate provider, and it may not be possible to obtain sufficient capacity or comparable production costs at another facility in a timely manner. In addition, migrating our design methodology to a new third-party subcontractor or to a captive panel assembly facility could involve increased costs, resources and development time, and utilizing additional third-party subcontractors could expose us to further risk of losing control over our intellectual property and the quality of our solar panels. Further, we supply inventory to Jiawei and bear the risk of loss, theft or damage to our inventory while it is held in its facilities. Any reduction in the supply of solar panels could impair our revenue by significantly delaying our ability to ship products and potentially damage our relationships with new and existing customers.
We established a captive solar panel assembly facility, and, if this panel manufacturing facility is unable to produce high quality solar panels at commercially reasonable costs, our revenue growth and gross margin could be adversely affected.
We currently run seven solar panel assembly lines in the Philippines. This factory commenced commercial production during the fourth quarter of 2006. Much of the manufacturing equipment and technology in this factory is new and ramping to achieve their full rated capacity. In the event that this factory is unable to ramp production with commercially reasonable yields and competitive production costs, our anticipated revenue growth and gross margin will be adversely affected.
Our Systems Segment acts as the general contractor for our customers in connection with the installations of our solar power systems and is subject to risks associated with construction, cost overruns, delays and other contingencies tied to performance bonds and letters of credit, which could have a material adverse effect on our business and results of operations.
Our Systems Segment acts as the general contractor for our customers in connection with the installation of our solar power systems. All essential costs are estimated at the time of entering into the sales contract for a particular project, and these are reflected in the overall price that we charge our customers for the project. These cost estimates are preliminary and may or may not be covered by contracts between us or the other project developers, subcontractors, suppliers and other parties to the project. In addition, we require qualified, licensed subcontractors to install most of our systems. Shortages of such skilled labor could significantly delay a project or otherwise increase our costs. Should miscalculations in planning a project or defective or late execution occur, we may not achieve our expected margins or cover our costs. Also, some systems customers require performance bonds issued by a bonding agency or letters of credit issued by financial institutions. Due to the general performance risk inherent in construction activities, it has become increasingly difficult recently to secure suitable bonding agencies willing to provide performance bonding, and obtaining letters of credit requires adequate collateral because we have not obtained a credit rating. In the event we are unable to obtain bonding or sufficient letters of credit, we will be unable to bid on, or enter into, sales contracts requiring such bonding.
In addition, some of our larger systems customers require that we pay substantial liquidated damages for each day or other period its solar installation is not completed beyond an agreed target date, up to and including the return of the entire project sale price. This is particularly true in Europe, where long-term, fixed feed-in tariffs available to investors are typically set during a prescribed period of project completion, but the fixed amount declines over time for projects completed in subsequent periods. We face material financial penalties in the event we fail to meet the completion deadlines, including but not limited a full refund of the contract price paid by the customers. In certain cases we do not control all of the events which could give rise to these penalties, such as reliance on the local utility to timely complete electrical substation construction.
Furthermore, investors often require that the solar power system generate specified levels of electricity in order to maintain their investment returns, allocating substantial risk and financial penalties to us if those levels are not achieved, up to and including the return of the entire project sale price. Also, our customers often require protections in the form of

25
conditional payments, payment retentions or holdbacks, and similar arrangements that condition its future payments on performance. Delays in solar panel or other supply shipments, other construction delays, unexpected performance problems in electricity generation or other events could cause us to fail to meet these performance criteria, resulting in unanticipated and severe revenue and earnings losses and financial penalties. Construction delays are often caused by inclement weather, failure to timely receive necessary approvals and permits, or delays in obtaining necessary solar panels, inverters or other materials. Additionally, we sometimes purchase land in connection with project development and assume the risk of project completion. All such risks could have a material adverse effect on our business and results of operations.
We may be unable to achieve our goal of reducing the cost of installed solar systems by 50 percent by 2012, which may negatively impact our ability to sell our products in a competitive environment, resulting in lower revenues, gross margins and earnings.
To reduce the cost of installed solar systems by 50 percent by 2012, as compared against the cost in 2006, we will have to achieve cost savings across the entire value chain from designing to manufacturing to distributing to selling and ultimately to installing solar systems. We have identified specific areas of potential savings and are pursuing targeted goals. However, such cost savings are dependent upon decreasing silicon prices and lowering manufacturing costs. In addition, we continue to explore cost effective methods of installing solar systems. If we are unsuccessful in our efforts to reduce the cost of installed solar systems by 50 percent by 2012, our revenues, gross margins and earnings may be negatively impacted in the competitive environment. Such risks would be exacerbated if governmental and fiscal incentives are reduced, or if these lower prices have been assumed in connection with our sales commitments and we are then unable to realize the expected reduction in cost of revenues, or if an increase in the global supply of solar cells and solar panels causes substantial downward pressure on prices of our products.
Acquisitions of other companies or investments in joint ventures with other companies could materially and adversely
To increase our business and maintain our competitive position, we may acquire other companies or engage in joint ventures in the future. Acquisitions and joint ventures involve a number of risks that could harm our business and result in the acquired business or joint venture not performing as expected, including:
insufficient experience with technologies and markets in which the acquired business is involved, which may be necessary to successfully operate and integrate the business;
problems integrating the acquired operations, personnel, technologies or products with the existing business and products;
diversion of management time and attention from the core business to the acquired business or joint venture;
potential failure to retain key technical, management, sales and other personnel of the acquired business or joint venture;
difficulties in retaining relationships with suppliers and customers of the acquired business, particularly where such customers or suppliers compete with us;
reliance upon joint ventures which we do not control;
subsequent impairment of the acquired assets, including intangible assets; and
assumption of liabilities including, but not limited to, lawsuits, tax examinations, warranty issues, etc.
Additionally, we may decide that it is in our best interests to enter into acquisitions or joint ventures that are dilutive to earnings per share or that negatively impact margins as a whole. Acquisitions or joint ventures could also require investment of significant financial resources and require us to obtain additional equity financing, which may dilute our
-off of our shares by Cypress on September 29, 2008, our ability to issue equity, including to acquire companies or assets, is subject to limits

26
as descr Our agreements with Cypress require us to indemnify Cypress for certain tax liabilities. These indemnification obligations and related contractual restrictions may limit our ability to obtain additional financing, participate in future acquisitions or pursue other business initiativespursuing acquisitions or investments that we would otherwise pursue, our growth and strategy could be impaired.
To the extent that we invest in upstream suppliers or downstream channel capabilities, we may experience competition or channel conflict with certain of our existing and potential suppliers and customers. Specifically, existing and potential suppliers and customers may perceive that we are competing directly with them by virtue of such investments and may decide to reduce or eliminate their supply volume to us or order volume from us. In particular, any supply reductions from our polysilicon, ingot or wafer suppliers could materially reduce manufacturing volume.
Our agreements with Cypress require us to indemnify Cypress for certain tax liabilities. These indemnification obligations and related contractual restrictions may limit our ability to obtain additional financing, participate in future acquisitions or pursue other business initiatives.
We have entered into a tax sharing agreement with Cypress, under which we and Cypress agree to indemnify one another for certain taxes and similar obligations that the other party could incur under certain circumstances. In general, we will be responsible for taxes relating to our business. As of September 29, 2008, Cypress distributed the shares of SunPower to its shareholders, so we are no longer eligible to file any state combined returns. To the extent that we become entitled to certain tax benefits on our separate tax returns existing as of such date, we will distribute the amount of such beof December 28, 2008, potential future payments to Cypress, which would be made over a period of several years, aggregate approximately $18.7 million. The majority of the deductions giving rise to these potential tax benefit payments were created by employee stock transactions. Because there is uncertainty as to our ability to use these deductions, the portion created by employee stock transactions are not reflected on our Consolidated Balance Sheets. If these deductions were reflected on the Consolidated Balance Sheets, they could be accounted for as an increase to deferred tax assets and
Cypress has obtained a ruling from the Internal Revenue Service, or IRS, that the distribution by Cypress of our class B common stock to Cypress stockholders qualified as a tax-free distribution under Section 355 of the Internal Revenue Code, or Code. Despite that ruling, the distribution may nonetheless be taxable to Cypress if 50% or more of our voting power or economic value is acquired as part of a plan or series of related transactions that includes the distribution of our stock. The tax sharing agreement requires us to indemnify Cypress for any liability incurred as a result of issuances or dispositions of our stock after the distribution, other than liability attributable solely to certain
e to Cypress. Under current law, for up to two years after the distribution (or possibly longer if we are acting pursuant to a preexisting plan), our obligation to indemnify Cypress will be triggered if we issue stock or otherwise participate in one or more financing or acquisition transactions in which 50% or more of our voting power or economic value is acquired as part of a plan or series of related transactions that includes the distribution.
-off of its shares of our class B common stock, on August 12, 2008, we and Cypress entered into an Amendment No. 1 to the Tax Sharing Agreement, or the Amended Tax Sharing Agreement, to address certain transactions that may affect the tax treatment of the spin-off and certain other matters.
Under the Amended Tax Sharing Agreement, we are required to provide notice to Cypress of certain transactions that could give rise to our indemnification obligation described above. Such transactions include a conversion of any or all of our class B common stock to class A common stock or any similar recapitalization transaction or series of related
from (A) issuances and dispositions of our stock prior to the spin-off and (B) any acquisition of our stock by Cypress after the spin-off.
Under the Amended Tax Sharing Agreement, we also agreed that, for a period of 25 months following the spin-off, we will not (i) effect a Recapitalization or (ii) enter into or facilitate any other transaction resulting in an acquisition of our stock without first obtaining the written consent of Cypress; if such transaction (either alone or when taken together with one or more other transactions entered into or facilitated by us consummated after August 4, 2008 and during the 25-month period following the spin-off) would involve the acquisition of more than 25% of our

27
(A) certain qualifying acquisitions of our stock issued in connection with the performance of services, (B) any acquisition of our stock for which we furnish to Cypress prior to such acquisition an opinion of counsel and supporting documentation, in form and
the adoption by us of a standard stockholder rights plan. We further agreed that we will not (i) effect a Recapitalization during the 36 month period following the spin-off without first obtaining a Tax Opinion to the effect that such Recapitalization (either alone or when taken together with any other transaction or transactions) will not cause the spin-off to become taxable, or (ii) seek any private ruling, including any supplemental private ruling, from the IRS with regard to the spin-off, or any transaction having any bearing on the tax treatment of the spin-off, without the prior written consent of Cypress.
Our ability to use our equity to obtain additional financing or to engage in acquisition transactions for a period of time after the tax-free distribution of our shares by Cypress will be restricted if we can only sell or issue a limited amount of our stock before triggering our obligation to indemnify Cypress for taxes relating to the distribution of our stock. Cypress made a complete distribution of its shares of our class B common stock on September 29, 2008 when our total outstanding capital stock was 85.8 million shares. Thus, in order to avoid causing an indemnification obligation to Cypress, we could not, for up two years (or possibly longer) after the date of the distribution, issue 85.8 million or more shares of our class A common stock or participate in one or more transactions (excluding the distribution itself) in which 42 million or more shares of our then-existing class A common stock were acquired, if any such transaction(s) are in connection with a plan or series of related transactions that includes the distribution. If we were to participate in such a transaction, and thereby triggered tax to Cypress on the distribution, then assuming that Cypress distributed 42 million
40% for federal and state income tax purposes, the fair market value of our class of the distribution, our liability under our indemnification obligation to Cypress would be approximately $504.0 million.
Our headquarters and manufacturing facilities, as well as the facilities of certain of our key subcontractors, are located in regions that are subject to earthquakes and other natural disasters.
Our headquarters and research and development operations are located in California, our manufacturing facilities are located in the Philippines, and the facilities of our subcontractor for assembly and test of solar panels are located in China. Since we do not have redundant facilities, any significant earthquake, tsunami or other natural disaster in these countries could materially disrupt our production capabilities and could result in our experiencing a significant delay in delivery, or substantial shortage, of our solar cells.
We could unexpectedly be adversely affected by violations of the U.S. Foreign Corrupt Practices Act and similar worldwide anti-bribery laws.
The U.S. Foreign Corrupt Practices Act, or FCPA, and similar anti-bribery laws in other jurisdictions generally prohibit companies and their intermediaries from making improper payments to non-U.S. officials for the purpose of obtaining or retaining business. Our policies mandate compliance with these anti-bribery laws. We operate in many parts of the world that have experienced governmental corruption to some degree and, in certain circumstances, strict compliance with anti-bribery laws may conflict with local customs and practices. We train our key staff concerning FCPA issues, and we also inform many of our partners, subcontractors, agents and others who work for us or on our behalf that they must comply with FCPA requirements. There can be no assurance that our internal controls and procedures will always protect us from the reckless or criminal acts committed by our employees, subcontractors or agents. If we are found to be liable for FCPA violations (either due to our own acts or our inadvertence, or due to the acts or inadvertence of others), we could suffer from criminal or civil penalties or other sanctions which could have a material adverse effect on our business.
Compliance with environmental regulations can be expensive, and noncompliance with these regulations may result in adverse publicity and potentially significant monetary damages and fines.
We are required to comply with all foreign, U.S. federal, state and local laws and regulations regarding pollution control and protection of the environment. In addition, under some statutes and regulations, a government agency, or other parties, may seek recovery and response costs from operators of property where releases of hazardous substances have occurred or are ongoing, even if the operator was not responsible for such release or otherwise at fault. We use,

28
generate and discharge toxic, volatile and otherwise hazardous chemicals and wastes in our research and development and manufacturing activities. Any failure by us to control the use of, or to restrict adequately the discharge of, hazardous substances could subject us to potentially significant monetary damages and fines or suspensions in our business operations. In addition, if more stringent laws and regulations are adopted in the future, the costs of compliance with these new laws and regulations could be substantial. To date such laws and regulations have not had a significant impact on our operations, and we believe that we have all necessary permits to conduct their respective operations as they are presently conducted. If we fail to comply with present or future environmental laws and regulations, however, we may be required to pay substantial fines, suspend production or cease operations.
Our success depends on the continuing contributions of our key personnel.
We rely heavily on the services of our key executive officers and the loss of services of any principal member of our management team could adversely impact our operations. In addition, we anticipate that we will need to hire a significant number of highly skilled technical, manufacturing, sales, marketing, administrative and accounting personnel. The competition for qualified personnel is intense in our industry. We may not be successful in attracting and retaining sufficient numbers of qualified personnel to support our anticipated growth. However, we cannot guarantee that any employee will remain employed with us for any definite period of time since all of our employees, including our key executive officers, serve at-will and may terminate their employment at any time for any reason.
Risks Related to Our Intellectual Property
Loss of government programs that partially fund our research and development programs would increase our research and development expenses.
We selectively pursue contract research, product development and market development programs funded by various agencies of the federal and state governments to complement and enhance our own resources. Funding from government grants is generally recorded as an offset to our research and development expense. These government agencies may not continue their commitment to programs relevant to our development projects. Moreover, we may not be able to compete successfully to obtain funding through these or other programs, and generally government agencies may unilaterally terminate or modify such agreements. A reduction or discontinuance of these programs, or of our participation in these programs, would increase our research and development expenses, which could materially and adversely affect our results of operations and could impair our ability to develop competitive solar power products and services.
Our reliance on government programs to partially fund our research and development programs could impair our ability to commercialize our solar power products and services.
Government funding of some of our research and development efforts imposes certain restrictions on our ability to commercialize results and may grant commercialization rights to the government. In some funding awards, the government is entitled to intellectual property rights arising from the related research. Such rights could include a nonexclusive, nontransferable, irrevocable, paid-up license to practice or have practiced each subject invention developed under an award throughout the world by or on behalf of the government, or the right to require us to grant a license to the developed technology or products to a third-party or, if we refuse, the government may grant the license itself, if the government determines that action is necessary because we fail to achieve practical application of the technology, or because action is necessary to alleviate health or safety needs, to meet requirements of federal regulations, or to give the United States industry preference. Accepting government funding can also require that manufacturing of products developed with federal funding be conducted in the United States.
We are dependent on our intellectual property, and we may face intellectual property infringement claims that could be time-consuming and costly to defend and could result in the loss of significant rights.
From time to time, we, our respective customers or third-parties with whom we work may receive letters, including letters from various industry participants, alleging infringement of their patents. Although we are not currently aware of any parties pursuing or intending to pursue infringement claims against us, we cannot assure investors that we will not be subject to such claims in the future. Additionally, we are required by contract to indemnify some of our customers and our third-party intellectual property providers for certain costs and damages of patent infringement in

29
-liability. This practice may subject us to significant indemnification claims by our customers and our third-party providers. We cannot assure investors that indemnification claims will not be made or that these claims will not harm our business, operating results or financial condition. Intellectual property litigation is very expensive and time-consuming
operating results or financial condition. If there is a successful claim of infringement against us, our customers or our third-party intellectual property providers, we may be required to pay substantial damages to the party claiming infringement, stop selling products or using technology that contains the allegedly infringing intellectual property, or enter into royalty or license agreements that may not be available on acceptable terms, if at all. Parties making infringement claims may also be able to bring an action before the International Trade Commission that could result in an order stopping the importation into the United States of our solar cells. Any of these judgments could materially damage our business. We may have to develop non-infringing technology, and our failure in doing so or in obtaining licenses to the proprietary rights on a timely basis could have a material adverse effect on our business.
We have filed, and, may continue to file claims against other parties for infringing our intellectual property that may be very costly and may not be resolved in our favor.
To protect our intellectual property rights and to maintain our competitive advantage, we have, and may continue to, file suits against parties who we believe infringe our intellectual property. Intellectual property litigation is expensiveand time consuminon our business, operating results or financial condition, and our enforcement efforts may not be successful. In addition, the validity of our patents may be challenged in such litigation. Our participation in intellectual property enforcement actions may negatively impact our financial results.
We may not be able to prevent others from using the term SunPower or similar terms in connection with their solar power products which could adversely affect the market recognition of our name and our revenue.
panels. We are seeking similar registratin some of these jurisdictions. We hold registered trademarks for SunPower®, PowerLight®, PowerGuard®, PowerTracker® and SunTile®, in certain countries, including the U.S. We have not registered, and may not be able to register, these trademarks in other key countries. In the foreign jurisdictions where we are unable to obtain or have not tried to obtain registrations, others may be able to sell their products using trademarks compromising or incorporating
her chosen brands, we may face trademark disputes and may have to market our products with other trademarks, which may undermine our marketing efforts. We may encounter trademark disputes with companies using marks which are confusingly similar to the SunPower mark, or our other marks, which if not resolved favorably could cause our branding efforts to suffer. In addition, we may have difficulty in establishing strong brand recognition with consumers if others use similar marks for similar products.
We rely substantially upon trade secret laws and contractual restrictions to protect our proprietary rights, and, if these rights are not sufficiently protected, our ability to compete and generate revenue could suffer.
We seek to protect our proprietary manufacturing processes, documentation and other written materials primarily under trade secret and copyright laws. We also typically require employees and consultants with access to our proprietary information to execute confidentiality agreements. The steps taken by us to protect our proprietary information may not be adequate to prevent misappropriation of our technology. In addition, our proprietary rights may not be adequately protected because:
people may not be deterred from misappropriating our technologies despite the existence of laws or contracts prohibiting it;
policing unauthorized use of our intellectual property may be difficult, expensive and time-consuming, and we may be unable to determine the extent of any unauthorized use;

30
the laws of other countries in which we market our solar cells, such as some countries in the Asia/Pacific region, may offer little or no protection for our proprietary technologies; and
reports we file in connection with government-sponsored research contracts are generally available to the public and third-parties may obtain some aspects of our sensitive confidential information.
Reverse engineering, unauthorized copying or other misappropriation of our proprietary technologies could enable third-parties to benefit from our technologies without compensating us for doing so. Any inability to adequately protect our proprietary rights could harm our ability to compete, to generate revenue and to grow our business.
We may not obtain sufficient patent protection on the technology embodied in the solar cells or solar system components we currently manufacture and market, which could harm our competitive position and increase our expenses.
Although we substantially rely on trade secret laws and contractual restrictions to protect the technology in the solar cells and solar system components we currently manufacture and market, our success and ability to compete in the future may also depend to a significant degree upon obtaining patent protection for our proprietary technology. We currently own multiple patents and patent applications which cover aspects of the technology in the solar cells and mounting systems that we currently manufacture and market. Material patents that relate to our systems products and services primarily relate to our rooftop mounting products and ground-mounted tracking products. We intend to continue to seek patent protection for those aspects of our technology, designs, and methodologies and processes that we believe provide significant competitive advantages.
Our patent applications may not result in issued patents, and even if they result in issued patents, the patents may not have claims of the scope we seek or we may have to refile patent applications due to newly discovered prior art. In addition, any issued patents may be challenged, invalidated or declared unenforceable, or even if we obtain an award of damages for infringement by a third-party, such award could prove insufficient to compensate for all damages incurred as a result of such infringement. The term of any issued patents would be 20 years from their filing date and if our applications are pending for a long time period, we may have a correspondingly shorter term for any patent that may issue. Our present and future patents may provide only limited protection for our technology and may not be sufficient to provide competitive advantages to us. For example, competitors could develop similar or more advantageous technologies on their own or design around our patents. Also, patent protection in certain foreign countries may not be available or may be limited in scope and any patents obtained may not be as readily enforceable as in the United States, making it difficult for us to effectively protect our intellectual property from misuse or infringement by other companies in these countries. Our inability to obtain and enforce our intellectual property rights in some countries may harm our business. In addition, given the costs of obtaining patent protection, we may choose not to protect certain innovations that later turn out to be important.
Risks Related to Our Debt and Equity Securities
Conversion of our outstanding debentures, future substantial issuances or dispositions of our class A or class B common stock or other securities, could dilute ownership and earnings per share or cause the market price of our stock to decrease.
To the extent we issue class A common stock upon conversion of debentures, the conversion of some or all of such debentures will dilute the ownership interests of existing stockholders, including holders who had previously converted their debentures. Any sales in the public market of the class A and class B common stock issuable upon such conversion could adversely affect prevailing market prices of our class A and class B common stock. Sales of our class A or class B common stock in the public market or sales of any of our other securities could dilute ownership and earnings per share, and even the perception that such sales could occur and could cause the market prices of our class A and class B common stock to decline. In addition, the existence of our outstanding debentures may encourage short selling of our common stock by market participants who expect that the conversion of the debentures could depress the prices of our class A and class B common stock.
Approximately 4.7 million shares of class A common stock were lent to underwriters of our debenture offerings, including approximately 2.9 million shares lent to Lehman Brothers International (Europe) Limited, or LBIE, and

31
approximately 1.8 million shares lent to Credit Suisse International, or CSI. Such shares were lent to facilitate later hedging arrangements of future purchases for debentures in the after-market. Shares still held by CSI may be freely sold into the market at any time, and such sales could depress our stock price. In addition, any hedging activity facilitated by our debenture underwriters would involve short sales or privately negotiated derivatives transactions. Due to the September 15, 2008 bankruptcy filing of Lehman and commencement of administrative proceedings for LBIE in the U.K., we recorded the shares lent to LBIE as issued and outstanding as of September 15, 2008, for the purpose of computing and reporting basic and diluted earnings per share. If Credit Suisse Securities (USA) LLC or its affiliates, including CSI, were to file bankruptcy or commence similar administrative, liquidating, restructuring or other proceedings, we may have to consider approximately 1.8 million shares lent to CSI as issued and outstanding for purposes of calculating earnings per share which would further dilute our earnings per share. These or other similar transactions could further negatively affect our stock price.
The price of our class A common stock, and therefore of our outstanding debentures, as well as our class B common stock may fluctuate significantly, and a liquid trading market for our class A and class B common stock may not be sustained.
Our class A and class B common stock has a limited trading history in the public markets, and during that period has experienced extreme price and volume fluctuations. The trading price of our class A and class B common stock could be subject to wide fluctuations due to the factors discussed in this risk factors section. In addition, the stock market in general, and The Nasdaq Global Select Market and the securities of technology companies and solar companies in particular, have experienced severe price and volume fluctuations. These trading prices and valuations, including our own market valuation and those of companies in our industry generally, may not be sustainable. These broad market and industry factors may decrease the market price of our class A and class B common stock, regardless of our actual operating performance. Because the debentures are convertible into our class A common stock, volatility or depressed prices of our class A common stock could have a similar effect on the trading price of these debentures.
The difference in the voting rights and liquidity could result in different market values for shares of our class A and our class B common stock.
The rights of class A and class B common stock are substantially similar, except with respect to voting. The class B common stock is entitled to eight votes per share and the class A common stock is entitled to one vote per share. Additionally, our restated certificate of incorporation imposed certain limitations on the rights of holders of class B common stock to vote the full number of their shares. The difference in the voting rights of our class A and class B common stock could reduce the value of our class A common stock to the extent that any investor or potential future purchaser of our common stock ascribes value to the right of our class B common stock to eight votes per share. In addition, the lack of a long trading history and lower trading volume of the class B common stock, compared to the class A common stock, could result in lower trading prices for the class B common stock.
Delaware law and our certificate of incorporation and bylaws contain anti-takeover provisions, our outstanding debentures provide for a right to convert upon certain events, and our board of directors entered into a rights agreement and declared a rights dividend, any of which could delay or discourage takeover attempts that stockholders may consider favorable.
Provisions in our restated certificate of incorporation and bylaws may have the effect of delaying or preventing a change of control or changes in our management. These provisions include the following:
the right of the board of directors to elect a director to fill a vacancy created by the expansion of the board of directors;
the prohibition of cumulative voting in the election of directors, which would otherwise allow less than a majority of stockholders to elect director candidates;
the requirement for advance notice for nominations for election to the board of directors or for proposing matters that can be acted upon at a stockho
the ability of the board of directors to issue, without stockholder approval, up to approximately 10.0 million

32
shares of preferred stock with terms set by the board of directors, which rights could be senior to those of common stock; and
our board of directors is divided into three classes of directors, with the classes to be as nearly equal in number as possible;
no action can be taken by stockholders except at an annual or special meeting of the stockholders called in accordance with our bylaws, and stockholders may not act by written consent;
stockholders may not call special meetings of the stockholders;
limitations on the voting rights of our stockholders with more than 15% of our class B common stock subject to receipt by Cypress of a supplemental ruling from the IRS that the effectiveness of the restriction will not prevent the favorable rulings received by Cypress with respect to certain tax issues arising under Section 355 of the Code in connection with the spin-off from having full force and effect; and
our board of directors is able to alter our bylaws without obtaining stockholder approval.
Certain provisions of our outstanding debentures could make it more difficult or more expensive for a third-party to acquire us. Upon the occurrence of certain transactions constituting a fundamental change, holders of our outstanding debentures will have the right, at their option, to require us to repurchase, at a cash repurchase price equal to 100% of the principal amount plus accrued and unpaid interest on the debentures, all of their debentures or any portion of the principal amount of such debentures in integral multiples of $1,000. We may also be required to issue additional shares of our class A common stock upon conversion of such debentures in the event of certain fundamental changes. In addition, on August 12, 2008, we entered into a Rights Agreement with Computershare Trust Company, N.A. and our board of directors declared an accompanying rights dividend. The Rights Agreement became effective upon completion
-off of our shares of class B common stock to the holders of Cypress common stock. The Rights Agreement contains specific features designed to address the potential for an acquirer or significant investor to take advantage of our capital structure and unfairly discriminate between classes of our common stock. Specifically, the Rights Agreement is designed to address the inequities that could result if an investor, by acquiring 20% or more of the outstanding shares of class B common stock, were able to gain significant voting influence over our company without making a correspondingly significant economic investment. Our board of directors determined that the rights dividend became payable to the holders of record of our common stock as of the close of business on September 29, 2008. The
attempts that stockholders may consider favorable.
ITEM 1B: UNRESOLVED STAFF COMMENTS
None.
ITEM 2: PROPERTIES
Our corporate headquarters is located in San Jose, California, where we occupy approximately 60,000 square feet under a lease from Cypress that expires in April 2011. In Richmond, California, we occupy approximately 207,000 square feet for office, light industrial and research and development use under a lease from an unaffiliated third-party that expires in December 2018. In addition to these facilities, we also have our European headquarters located in Geneva, Switzerland where we occupy approximately 4,000 square feet under a lease that expires in September 2012 as well as sales and support offices in Southern California, New Jersey, Australia, Canada, Germany, Italy, Spain, and South Korea, all of which are leased from unaffiliated third-parties.
We leased from Cypress an approximately 215,000 square foot building in the Philippines from fiscal 2003 through April 2008, which serves as FAB1 with four solar cell manufacturing lines in operation. In May 2008, we purchased FAB1 from Cypress and assumed the lease for the land from an unaffiliated third-party for a total purchase price of $9.5 million. The lease for the land expires in May 2048 and is renewable for an additional 25 years. In August 2006, we purchased a 344,000 square foot building (FAB2) in the Philippines. FAB2 is approximately 20 miles from FAB1 and is being developed to house up to twelve solar cell manufacturing lines. We currently operate twelve solar cell

33
manufacturing lines in our two solar cell manufacturing facilities, with a total rated manufacturing capacity of 414 megawatts per year. By the end of 2009, we plan to operate 16 solar cell manufacturing lines with an aggregate manufacturing capacity of 574 megawatts per year. We plan to begin production in 2010 on the first line of FAB3 which will be constructed in Malaysia. FAB3 will be constructed in two phases, with an aggregate manufacturing capacity of more than 500 megawatts per year after the completion of the first phase, and an expected aggregate manufacturing capacity of more than 1 gigawatt per year when the second phase is completed. In January 2008, we completed the construction of an approximately 175,000 square foot building in the Philippines. This facility serves as our solar panel assembly facility that currently operates seven solar panel manufacturing lines with a rated manufacturing capacity of 210 megawatts of solar panels per year. We may require additional space in the future, which may not be available on commercially reasonable terms or in the location we desire.
Because of the interrelation of our business segments, both the Components Segment and Systems Segment use substantially all of the properties at least in part, and we retain the flexibility to use each of the properties in whole or inpart for each of the segments. Therefore, we do not identify or allocate assets by business segment. For more information on property, plant and equipment by country, see Note 17 of Notes to our Consolidated Financial Statements in "Item 8: Financial Statements and Supplemental Data."
ITEM 3: LEGAL PROCEEDINGS
From time to time we are a party to litigation matters and claims that are normal in the course of our operations. While we believe that the ultimate outcome of these matters will not have a material adverse effect on us, the outcome of these matters is not determinable and negative outcomes may adversely affect our financial position, liquidity or results of operations.
ITEM 4: SUBMISSION OF MATTERS TO A VOTE OF SECURITY HOLDERS
No matters were submitted to a vote of our stockholders during the fourth quarter of fiscal 2008.
PART II
ITEM 5: ISSUER PURCHASES OF EQUITY SECURITIES
Our class A and class B common stock is listed on the Nasdaq Global Select Market under the trading symbol
during fiscal 2008 and 2007 are as follows:
SPWRA SPWRB* For the year ended December 28, 2008 High Low High Low Fourth quarter $ 77.25 $ 19.00 $ 71.47 $ 11.94 Third quarter 97.55 61.23 Second quarter 99.58 72.71 First quarter 131.29 54.95 For the year ended December 30, 2007 High Low High Low Fourth quarter $ 164.49 $ 81.50 $ $ Third quarter 86.93 59.64 Second quarter 65.55 45.84 First quarter 48.11 35.40
* Our class B common stock started trading publicly on September 30, 2008.
As of February 13, 2009, there were approximately 608 and 1,054 record holders of our class A and class B common stock, respectively. A substantially greater number of holders of our class A and class B common stock are in
ers and other financial institutions.

34
Dividends
We have never declared or paid any cash dividend on our common stock, and we do not currently intend to pay any cash dividend on our common stock in the foreseeable future. We intend to retain future earnings, if any, to finance the operation and expansion of our business.
debentures issued in February 2007 and July 2007 allow the holders to convert their bonds into our class A common
Recent Sales of Unregistered Securities
We conducted no unregistered sales of equity securities during the fourth quarter of fiscal 2008.
Issuer Purchases of Equity Securities
Period
Total Number ofShares
Purchased(1)(in thousands)
Average Price
Paid Per Share
Total Number of Shares Purchased as Part of Publicly Announced Plans or Programs
Maximum Number of Shares That May Yet Be
Purchased Under the Publicly Announced Plans
or ProgramsOctober 27, 2008 through
November 23, 2008 15 $34.95 November 24, 2008 through
December 28, 2008 9 $32.82 Total 24 $34.16
(1) The total number of shares purchased includes shares surrendered to satisfy tax withholding obligations in connection with the vesting of restricted stock issued to employees.
Equity Compensation Plan Information
The following table provides certain information as of December 28, 2008 with respect to our equity compensation plans under which shares of class A common stock are authorized for issuance (in thousands, except dollar figures):
Plan CategoryNumber of securities tobe issued upon exerciseof outstanding options,
warrants and rights
Weighted averageexercise price of
outstandingoptions, warrants
and rights
Number of securities remainingavailable for future issuanceunder equity compensationplans (excluding securities
reflected in the first column)Equity compensation plans
approved by security holders 2,008 $8.99 1,268 Equity compensation shares not
approved by security holders 17 (1) $2.00 Total 2,025 (2) $8.93 1,268
(1) Represents one option to purchase shares of class A common stock issued to one SunPower employee on June 17, 2004 with an exercise price of $2.00, vesting over five years.
(2) This table excludes options to purchase an aggregate of approximately 520,000 shares of class A common stock, at a weighted average exercise price of $9.03 per share, that we assumed in connection with the acquisition of PowerLight (now known as SP Systems) in January 2007.

35
Company Stock Price Performance
The following graph compares the performance of an investment in our class A common stock from the pricing of our IPO on November 17, 2005 through December 28, 2008, with the NASDAQ Market Index and with four comparable issuers: Evergreen Solar, Inc., Energy Conversion Devices, Inc., Suntech Power Holdings Co., Ltd. and First Solar, Inc. The graph assumes $100 was invested on November 17, 2005 in our class A common stock at the closing price of $25.45 per share and at the closing prices for the NASDAQ Market Index, Evergreen Solar, Inc. and Energy Conversion Devices, Inc. The graph also assumes $100 was invested at the closing prices of the common stock for Suntech Power Holdings Co., Ltd. on December 14, 2005 and First Solar, Inc. on November 17, 2006. In addition, the graph also assumes that any dividends were reinvested on the date of payment without payment of any commissions. The performance shown in the graph represents past performance and should not be considered an indication of future performance.
ASSUMES $100 INVESTED ON NOVEMBER 17, 2005ASSUMES DIVIDEND REINVESTED
FISCAL YEAR ENDED DECEMBER 28, 2008
11/17/05 12/30/05 12/31/06 12/30/07 12/28/08SunPower Corporation $ 100.00 $ 133.56 $ 146.05 $ 514.93 $ 139.02 NASDAQ Market Index 100.00 99.32 108.77 120.45 68.92 Evergreen Solar, Inc. 100.00 89.27 63.45 144.34 23.55 Energy Conversion Devices, Inc. 100.00 130.15 108.53 105.78 74.77 Suntech Power Holdings Co., Ltd.(1) 181.67 226.73 545.27 68.60 First Solar, Inc.(2) 149.20 1,330.20 675.05
(1) The common stock of Suntech Power Holdings Co., Ltd. started trading publicly on December 14, 2005. (2) The common stock of First Solar, Inc. started trading publicly on November 17, 2006.
$0.00
$200.00
$400.00
$600.00
$800.00
$1,000.00
$1,200.00
$1,400.00
SunPower Corporation NASDAQ Market Index
Evergreen Solar Energy Conversion Devices
SunTech Power Holdings First Solar
12/31/0612/30/05 12/30/07
12/28/08
COMPARISON OF CUMULATIVE TOTAL RETURN

36
ITEM 6: SELECTED CONSOLIDATED FINANCIAL DATA
The following sel Item 7: Discussion and Analysis of Financial Condition and Results of Operations Item 8: Financial Statements and Supplementary Data rt on Form 10-K.
On November 9, 2004, Cypress acquired 100% ownership of all outstanding shares of our capital stock, excluding
SunPower by Cypress and created a new basis of accounting. The Consolidated Balance Sheets and Statements of Operations data in this Annual Report on Form 10-K prior and up to November 8, 2004 refer to the Predecessor Company and this period is referred to as the pre-merger period, while the Consolidated Balance Sheets and Statements of Operations data subsequent to November 8, 2004 refer to the Successor Company and this period is referred to as the post-merger period. A black line has been drawn between the accompanying financial statements to distinguish between the pre-merger and post-merger periods. After the close of trading on September 29, 2008, Cypress completed a spin-off of all of its shares of our class B common stock, in the form of a pro rata dividend to the holders of record as of September 17, 2008 of Cypress common stock.
On January 10, 2007, we completed the acquisition of PowerLight Corporation, a leading global provider of large-scale solar power systems, which we renamed SunPower Corporation, Systems (SP Systems) in June 2007. SP Systems designs, manufactures, markets and sells solar electric power system technology that integrates solar cells and solar panels manufactured by us and other suppliers to convert sunlight to electricity compatible with the utility network. The results of SP Systems have been included in the following selected consolidated financial information from January 10, 2007. See Note 3 of Notes to our Consolidated Financial Statements.
We report our results of operations on the basis of 52- or 53-week periods, ending on the Sunday closest to December 31. The combined periods of fiscal 2004 ended on January 2, 2005 and included 53 weeks. Fiscal 2005 ended on January 1, 2006, fiscal 2006 ended on December 31, 2006, fiscal 2007 ended on December 30, 2007, fiscal 2008 ended on December 28, 2008 and each fiscal year included 52 weeks. Our fiscal quarters end on the Sunday closest to the end of the applicable calendar quarter, except in a 53-week fiscal year in which the additional week falls into the fourth quarter of that fiscal year.

37
Successor CompanyPredecessorCompany
Year Ended
Nov. 9, 2004Through
Jan. 2, 2005
Dec. 29, 2003
ThroughNov. 8, 2004(In thousands, except per share data)
December 28,2008
December 30,2007
December 31,2006
January 1,2006
Consolidated Statements of Operations Data Revenue: Systems $ 820,632 $ 464,178 $ — $ — $ — $ — Components 614,287 310,612 236,510 78,736 4,055 6,830 Total revenue 1,434,919 774,790 236,510 78,736 4,055 6,830Cost of revenue: Cost of systems revenue 653,569 386,511 — — — — Cost of components revenue 417,669 240,475 186,042 74,353 6,079 9,498 Total cost of revenue 1,071,238 626,986 186,042 74,353 6,079 9,498 Gross margin 363,681 147,804 50,468 4,383 (2,024) (2,668)Operating income (loss) 168,467 2,342 19,107 (12,985) (4,552) (19,499)Income (loss) before income taxes and equity
in earnings of unconsolidated investees 147,584 3,560 28,461 (15,793) (5,609) (23,302)Income (loss) before equity in earnings of
unconsolidated investees 78,216 9,480 26,516 (15,843) (5,609) (23,302)Net income (loss) $ 92,293 $ 9,202 $ 26,516 $ (15,843) $ (5,609) $ (23,302) Net income (loss) per share of class A and
class B common stock: Basic(1) $ 1.15 $ 0.12 $ 0.40 $ (0.68) $ (2,804.50) $ (5.51) Diluted(1) $ 1.09 $ 0.11 $ 0.37 $ (0.68) $ (2,804.50) $ (5.51) Weighted-average shares: Basic (1) 80,522 75,413 65,864 23,306 2 4,230
Diluted(1) 84,446 81,227 71,087 23,306 2 4,230
(1) As of September 15, 2008, the date on which Lehman filed a petition for protection under Chapter 11 of the U.S. bankruptcy code and LBIE commenced administrative proceedings (analogous to bankruptcy) in the United Kingdom, approximately 2.9 million shares of class A common stock lent to LBIE in connection with the 1.25% debentures are included in basic weighted-average common shares. Basic weighted-average common shares exclude approximately 1.8 million shares of class A common stock lent to CSI in connection with the 0.75% debentures. See Note 15 of Notes to our Consolidated Financial Statements for a detailed explanation of the determination of the shares used in computing basic and diluted net income (loss) per share.
(In thousands)December 28,
2008December 30,
2007December 31,
2006January 1,
2006 January 2,
2005 Consolidated Balance Sheets Data Cash, cash equivalents and short-term
investments (excluding restricted cash) $ 219,510 $ 390,667 $ 182,092 $ 143,592 $ 3,776Working capital (deficiency) 396,849 93,953 228,269 155,243 (54,314)Total assets 2,076,135 1,653,738 576,836 317,654 89,646Long-term debt 54,598 — — — —Convertible debt 423,608 425,000 — — —Deferred tax liability 8,115 6,213 46 336 —Customer advances, net of current portion 91,359 60,153 27,687 28,438 —Other long-term liabilities 25,950 14,975 — — —Notes payable to Cypress, net of current
portion — — — — 21,673Convertible preferred stock — — — — 8,552Total stockholders’ equity (deficit) 1,021,374 864,090 488,771 258,650 (10,664)

38
ITEM 7: AND ANALYSIS OF FINANCIAL CONDITION AND RESULTS OF OPERATIONS
General
We are a vertically integrated solar products and services company that designs, manufactures and markets high-performance solar electric power technologies. Our solar cells and solar panels are manufactured using proprietary processes, and our technologies are based on more than 15 years of research and development. Of all the solar cells available for the mass market, we believe our solar cells have the highest conversion efficiency, a measurement of the amount of sunlight converted by the solar cell into electricity. Our solar power products are sold through our components business segment, or Components Segment. In January 2007, we acquired PowerLight Corporation, or PowerLight, now known as SunPower Corporation, Systems, or SP Systems, which developed, engineered, manufactured and delivered large-scale solar power systems. These activities are now performed by our systems business segment, or our Systems Segment. Our solar power systems, which generate electricity, integrate solar cells and panels manufactured by us as well as other suppliers.
In November 2005, we raised net proceeds of $145.6 million in an initial public offering, or IPO, of 8.8 million shares of class A common stock at a price of $18.00 per share. In June 2006, we completed a follow-on public offering of 7.0 million shares of our class A common stock, at a per share price of $29.50, and received net proceeds of $197.4 million. In July 2007, we completed a follow-on public offering of 2.7 million shares of our class A common stock, at a discounted per share price of $64.50, and received net proceeds of $167.4 million.
In February 2007, we issued $200.0 million in principal amount of our 1.25% senior convertible debentures to Lehman Brothers Inc., or Lehman Brothers, and lent approximately 2.9 million shares of our class A common stock to Lehman Brothers International (Europe) Limited, or LBIE. Net proceeds from the issuance of our 1.25% senior convertible debentures in February 2007 were $194.0 million. We did not receive any proceeds from the approximate 2.9 million loaned shares of our class A common stock, but received a nominal lending fee. In July 2007, we issued $225.0 million in principal amount of our 0.75% senior convertible debentures to Credit Suisse Securities (USA) LLC, or Credit Suisse, and lent approximately 1.8 million shares of our class A common stock to Credit Suisse International, or CSI. Net proceeds from the issuance of our 0.75% senior convertible debentures in July 2007 were $220.1 million. We did not receive any proceeds from the approximate 1.8 million loaned shares of class A common stock, but received a nominal lending fee. See Note 11 of Notes to our Consolidated Financial Statements.
In January 2007, we completed the acquisition of PowerLight, a privately-held company which developed, engineered, manufactured and delivered large-scale solar power systems for residential, commercial, government and utility customers worldwide. These activities are now performed by our Systems Segment. As a result of the acquisition, PowerLight became our wholly-
s name recognition. We believe the acquisition will enable us to develop the next generation of solar products and solutions that will accelerate reduction in solar system cost to compete with retail electric rates without incentives and simplify and improve customer experience. The total purchase consideration and future stock compensation for the transaction was $334.4 million, consisting of $120.7 million in cash and $213.7 million in common stock, restricted stock, stock options and related acquisition costs. See Note 3 of Notes to our Consolidated Financial Statements.
After completion of our IPO in November 2005, Cypress Semiconductor Corporation, or Cypress, held, in the aggregate, approximately 52.0 million shares of our class B common stock, representing all of our then-outstanding class B common stock. On May 4, 2007 and August 18, 2008, Cypress completed the sale of 7.5 million shares and 2.5 million shares, respectively, of our class B common stock in offerings pursuant to Rule 144 of the Securities Act. Such shares converted to 10.0 million shares of class A common stock upon the sale. We were a majority-owned subsidiary of Cypress through September 29, 2008. After the close of trading on September 29, 2008, Cypress completed a spin-off of all of its shares of our class B common stock, in the form of a pro rata dividend to the holders of record as of September 17, 2008 of Cypress common stock. As a result, our class B common stock now trades publicly and is listed on the Nasdaq Global Select Market, along with our class A common stock.

39
Financial Operations Overview
The following describes certain line items in our Consolidated Statements of Operations:
Total Revenue
Systems Segment Revenue: Our systems revenue represents sales of engineering, procurement and construction, or EPC, projects and other services relating to solar electric power systems that integrate our solar panels and balance of systems components, as well as materials sourced from other manufacturers. In the United States, where customers often utilize rebate and tax credit programs in connection with projects rated one megawatt or less of capacity, we typically sell solar systems rated up to one megawatt of capacity to provide a supplemental, distributed source of electricity for a
-party investors as central-station solar power plants, typically rated from one to twenty megawatts, which generate electricity for sale under tariff to regional and public utilities. We also sell our solar systems under materials-only sales contracts in the United States, Europe and Asia. The balance of our systems revenue are generally derived from sales to new home builders for residential applications and maintenance revenue from servicing installed solar systems. We expect the current credit market conditions to continue through at least the first half of fiscal 2009, negatively affecting our ability to finance systems projects. The U.S. utility and power plant market demand for renewable energy is expected to grow over 50% annually over the next five years.
Components Segment Revenue: Our components revenue represents sales of our solar cells, solar panels and inverters to solar systems installers and other resellers. Factors affecting our components revenue include unit volumes of solar cells and solar panels produced and shipped, average selling prices, product mix, product demand and the percentage of our construction projects sourced with SunPower solar panels sold through the Systems Segment which reduces the inventory available to sell through our Components Segment. We have experienced quarter-over-quarter unit volume increases in shipments of our solar power products since we began commercial production in the fourth quarter of 2004. From fiscal 2005 through 2008, we have experienced increases in average selling prices for our solar power products primarily due to the strength of end-market demand and favorable currency exchange rates. Accordingly, our Components Segment's average selling prices were slightly higher during fiscal 2008 compared to the same period in fiscal 2007 and 2006. Over the next several years, we expect average selling prices for our solar power products to decline as the market becomes more competitive, as certain products mature and as manufacturers are able to lower their manufacturing costs and pass on some of the savings to their customers.
Cost of Revenue
Systems Segment Cost of Revenue: Our cost of systems revenue consists primarily of solar panels, mounting systems, inverters and subcontractor costs. The cost of solar panels is the single largest cost element in our cost of systems revenue. Our Systems Segment sourced approximately 60% of its solar panel installations with SunPower solar panels in fiscal 2008 compared to 27% in fiscal 2007. Over time, we expect that our Systems Segment will increase the percentage of its construction projects sourced with SunPower solar panels to as much as 80% in fiscal 2009. Our Systems Segment generally experiences higher gross margin on construction projects that utilize SunPower solar panels compared to construction projects that utilize solar panels purchased from third-parties.
In connection with the acquisition of PowerLight (now known as SP Systems) in January 2007, there were $79.5 million of identifiable purchased intangible assets, of which $56.8 million was being amortized to cost of systems revenue on a straight-line basis over periods ranging from one to five years. As a result of our new branding strategy, during the quarter ended July 1, 2007, the PowerLight tradename asset with a net book value of $14.1 million was written off as an impairment of acquisition-related intangible assets. As such, the remaining balance of $41.2 million of intangible assets, which are related to purchased patents, technology and backlog are being amortized to cost of systems revenue on a straight-line basis over periods ranging from one to four years.
Our cost of systems revenue will also fluctuate from period to period due to the mix of projects completed and recognized as revenue, in particular between large projects and large commercial installation projects. Our gross profit each quarter is affected by a number of factors, including the types of projects in process and their various stages of completion, the gross margins estimated for those projects in progress and the actual system group department overhead costs. Historically, revenue from materials-only sales contracts generate a higher gross margin percentage for our

40
Systems Segment than revenue generated from turnkey contracts which generate higher revenue per watt from providing both materials as well as EPC management services.
Almost all of our Systems Segment construction contracts are fixed price contracts. However, we have in several instances obtained change orders that reimburse us for additional unexpected costs due to various reasons. The Systems Segment also has long-term agreements for solar cell and solar panel purchases with several major solar panel manufacturers, some with liquidated damages and/or take-or-pay arrangements. An increase in project costs, including solar panel, inverter and subcontractor costs, over the term of a construction contract could have a negative impact on
adjustments for inventory reserves. We are seeking to improve gross profit over time as we implement cost reduction efforts, improve manufacturing processes, and seek better and less expensive materials globally, as we grow the business to attain economies of scale on fixed costs. Any increase in gross profit based on these items, however, could be partially or completely offset by increased raw material costs or our inability to increase revenue in line with expectations, and other competitive pressures on gross margin.
Components Segment Cost of Revenue: Our cost of components revenue consists primarily of silicon ingots and wafers used in the production of solar cells, along with other materials such as chemicals and gases that are needed to transform silicon wafers into solar cells. For our solar panels, our cost of revenue includes the cost of solar cells and raw materials such as glass, frame, backing and other materials, as well as the assembly costs we pay to our third-party subcontractor in China. Our Components Segment gross profit each quarter is affected by a number of factors, including average selling prices for our products, our product mix, our actual manufacturing costs, the utilization rate of our solar cell manufacturing facilities and changes in amortization of intangible assets.
From time to time, we enter into agreements whereby the selling price for certain of our solar power products is fixed over a defined period. An increase in our manufacturing costs over such a defined period could have a negative impact on our overall gross profit. Our gross profit may also be impacted by fluctuations in manufacturing yield rates and certain adjustments for inventory reserves. We expect our gross profit to increase over time as we improve our manufacturing processes and as we grow our business and leverage certain of our fixed costs. An expected increase in gross profit based on manufacturing efficiencies, however, could be partially or completely offset by increased raw material costs or decreased revenue. Our inv
Other Cost of Revenue Factors: Other factors contributing to cost of revenue include depreciation, provisions for estimated warranty, salaries, personnel-related costs, freight, royalties, facilities expenses and manufacturing supplies associated with contracting revenue and solar cell fabrication as well as factory pre-operating costs associated with our second solar cell manufacturing facility, or FAB2, and our solar panel assembly facility. Such pre-operating costs included compensation and training costs for factory workers as well as utilities and consumable materials associated with preproduction activities. Additionally, within our own solar panel assembly facility in the Philippines we incur personnel-related costs, depreciation, utilities and other occupancy costs. To date, demand for our solar power products has been robust and our production output has increased allowing us to spread a significant amount of our fixed costs over relatively high production volume, thereby reducing our per unit fixed cost. We currently operate twelve solar cell manufacturing lines in our two solar cell manufacturing facilities, with a total rated manufacturing capacity of 414 megawatts per year. In addition, we currently operate seven solar panel manufacturing lines in our solar panel assembly facility, with a total rated manufacturing capacity of 210 megawatts per year. By the end of 2009, we plan to operate 16 solar cell manufacturing lines with an aggregate manufacturing capacity of 574 megawatts per year. We plan to begin production in 2010 on the first line of our planned third solar cell manufacturing facility, or FAB3, which will be constructed in Malaysia. FAB3 will be constructed in two phases, with an aggregate manufacturing capacity of more than 500 megawatts per year after the completion of the first phase, and an expected aggregate manufacturing capacity of more than 1 gigawatt per year when the second phase is completed. As we build additional manufacturing lines or facilities, our fixed costs will increase, and the overall utilization rate of our solar cell manufacturing and solar panel assembly facilities could decline, which could negatively impact our gross margin. This decline may continue until a

41
Operating Expenses
Our operating expenses include research and development expense, sales, general and administrative expense, purchased in-process research and development expense and impairment of acquisition-related intangible assets. Research and development expense consists primarily of salaries and related personnel costs, depreciation and the cost of solar cell and solar panel materials and services used for the development of products, including experiment and testing. We expect our research and development expense to continually increase in absolute dollars as we continue to develop new processes to further improve the conversion efficiency of our solar cells and reduce their manufacturing cost, and as we develop new products to diversify our product offerings.
Research and development expense is reported net of any funding received under contracts with governmental agencies because such contracts are considered collaborative arrangements. These awards are typically structured such that only direct costs, research and development overhead, procurement overhead and general and administrative expenses that satisfy government accounting regulations are reimbursed. In addition, our government awards from state agencies will usually require us to pay to the granting governmental agency certain royalties based on sales of products developed with grant funding or economic benefit derived from incremental improvements funded. Royalties paid to governmental agencies will be charged to the cost of goods sold. Our funding from government contracts offset our research and development expense by approximately 25%, 21% and 8% in fiscal 2008, 2007 and 2006, respectively.
Sales, general and administrative expense for our business consists primarily of salaries and related personnel costs, professional fees, insurance and other selling and marketing expenses. We expect our sales, general and administrative expense to increase in absolute dollars as we expand our sales and marketing efforts, hire additional personnel and improve our information technology infrastructure to support our growth. However, assuming our revenue increases as we expect, over time we anticipate that our sales, general and administrative expense will continue to decrease as a percentage of revenue.
Purchased in-process research and development expense for fiscal 2007 of $9.6 million resulted from the acquisition of PowerLight (now known as SP Systems), as technological feasibility associated with the in-process research and development projects had not been established and no alternative future use existed. In addition, as a result of the change in our branding strategy during the quarter ended July 1, 2007, the net book value of the PowerLight tradename of $14.1 million was written off as an impairment of acquisition-related intangible assets.
Other Income (Expense), Net
Interest income consists of interest earned on cash, cash equivalents, restricted cash and investments. Interest expense primarily relates to interest due on convertible debt and outstanding customer advance payments (see Note 8 of Notes to our Consolidated Financial Statements). In February 2007, we issued $200.0 million in principal amount of our 1.25% senior convertible debentures and in July 2007, we issued $225.0 million in principal amount of our 0.75% senior convertible debentures (see Note 11 of Notes to our Consolidated Financial Statements). Other, net consists primarily of the write-off of unamortized debt issuance costs as a result of the market price conversion trigger on our senior convertible debentures being met in December 2007, amortization of debt issuance costs, impairment of investments, gains or losses from derivatives and foreign exchange.
Income Taxes
For financial reporting purposes, during periods when we were a subsidiary of Cypress, income tax expense and deferred income tax balances has historically been calculated as if we were a separate entity and had prepared our own separate tax return. Effective with the closing of our follow-on public offering of common stock in June 2006, we are no longer eligible to file federal and most state consolidated tax returns with Cypress. As of September 29, 2008, Cypress completed a spin-off of all of its shares of our class B common stock to its shareholders, so we are no longer eligible to file any state combined tax returns with Cypress. Accordingly, we have agreed to pay Cypress for any federal income tax credit or net operating loss carryforwards utilized in our federal tax returns in subsequent periods that originated while
differences between financial statement and income tax bases of assets and liabilities. Valuation allowances are provided against deferred tax assets when management cannot conclude that it is more likely than not that some portion or all deferred tax assets will be realized. See Notes 1, 2 and 13 of Notes to our Consolidated Financial Statements.

42
registration with the Philippine Economic Zone Authority, which provide that we pay no income tax in the Philippines. Our current income tax holidays expire within the next several years beginning in 2010, and we intend to apply for extensions and renewals upon expiration. However, these tax holidays may or may not be extended. We believe that as our Philippine tax holidays expire, (a) gross income attributable to activities covered by our Philippine Economic Zone Authority registrations will be taxed at a 5% preferential rate, and (b) our Philippine net income attributable to all other activities will be taxed at the statutory Philippine corporate income tax rate, currently 32%. Fiscal 2007 was the first year for which profitable operations benefitted from the Philippine tax ruling.
Equity in Earnings of Unconsolidated Investees
In the third quarter of fiscal 2006, we entered into an agreement to form Woongjin Energy Co., Ltd, or Woongjin Energy, a joint venture to manufacture monocrystalline silicon ingots. This joint venture is located in South Korea and began manufacturing in the third quarter of fiscal 2007. In October 2007, we entered into an agreement to form First Philec Solar Corporation, or First Philec Solar, a joint venture to provide wafer slicing services of silicon ingots. This joint venture is located in the Philippines and became operational in the second quarter of fiscal 2008. We
long-
Consolidated Financial Statements.
Critical Accounting Policies and Estimates
Our discussion and analysis of our financial condition and results of operations are based on our financial statements, which have been prepared in accordance with generally accepted accounting principles in the United States. The preparation of these financial statements requires us to make estimates and judgments that affect the reported amounts of assets, liabilities, revenue and expenses. We base our estimates on historical experience and on various other assumptions that we believe to be reasonable under the circumstances, the results of which form the basis for making judgments about the carrying values of assets and liabilities that are not readily apparent from other sources. Actual results may differ from these estimates under different assumptions or conditions. Our most critical policies include: (a) revenue recognition, which impacts the recording of revenue; (b) allowance for doubtful accounts and sales returns, which impacts sales, general and administrative expense; (c) warranty reserves, which impact cost of revenue and gross margin; (d) valuation of inventories, which impacts cost of revenue and gross margin; (e) accounting for equity in earnings of joint ventures, which impacts net income; (f) valuation of long-lived assets, which impacts write-offs of goodwill and other intangible assets; (g) valuation of goodwill impairment, which impacts operating expense; (h) purchase accounting, which impacts fair value of goodwill, other intangible assets and in-process research and development expense; (i) fair value of financial instruments; and (j) accounting for income taxes which impacts our tax provision (benefit). We also have other key accounting policies that are less subjective and, therefore, judgments in their application would not have a material impact on our reported results of operations. The following is a discussion of our most critical policies as of and for the year ended December 28, 2008, as well as the estimates and judgments involved.
Revenue Recognition
Our systems revenue is primarily comprised of EPC projects which are governed by customer contracts that require us to deliver functioning solar power systems and are generally completed within three to nine months from commencement of construction. In addition, our Systems Segment also derives revenue from sales of certain solar power products and services that are smaller in scope than an EPC contract. We recognize revenue from fixed price construction contracts under American Institute of Certified Public Accountants, or AICPA, Statement of Position, or SOP, 81- -Type and Certain Production- -1, using the percentage-of-completion method of accounting. Under this method, systems revenue arising from fixed price construction contracts is recognized as work is performed based on the percentage of incurred costs to estimated total forecasted costs utilizing the most recent estimates of forecasted costs.
In addition to the EPC deliverable, a limited number of arrangements also include multiple deliverables such as post-installation systems monitoring and maintenance and system output performance guarantees. For contracts with

43
separately priced performance guarantees or maintenance, we recognize revenue related to such separately priced elements on a straight-line basis over the contract period in accordance with Financial Accounting Standards Board, or FASB, Technical Bulletin, or FTB, 90- ranty and Product
-1. For contracts including performance guarantees or maintenance contracts not separately priced, we follow the guidance in Emerging Issues Task Force Issue, or EITF, No. 00-Arrangements with -21, to determine whether the entire contract has more than one unit of accounting.
We have determined that post-installation systems monitoring and maintenance, and system output performance guarantees qualify as separate units of accounting under EITF 00-21. Such post-installation elements are deferred at the time the contract is executed and are recognized to income over the contractual term under Staff Accounting Bulletin, or SAB, No. 104. The remaining EPC is recognized to income on a percentage-of-completion basis under SOP 81-1.
In addition, when arrangements include contingent revenue clauses such as liquidated damages or customer termination or put rights for non-performance, we defer the contingent revenue until such time as the contingencies expire.
Incurred costs include all direct material, labor, subcontract costs and those indirect costs related to contract performance, such as indirect labor, supplies and tools. Job material costs are included in incurred costs when the job materials have been installed. Revenue is deferred and recognized upon installation, in accordance with the percentage-of-completion method of accounting. Job materials are considered installed materials when they are permanently attached or fitted to the solar power system as
Due to inherent uncertainties in estimating cost, job costs estimates are reviewed and/or updated by management working within the Systems Segment. The Systems Segment determines the completed percentage of installed job
-site representative. The completed percentage of installed job materials is then used for each job to calculate the month-end job material costs incurred. Direct labor, subcontractor and other costs are charged to contract costs as incurred. Provisions for estimated losses on uncompleted contracts, if any, are recognized in the period in which the loss first becomes probable and reasonably estimable. Contracts may include profit incentives such as milestone bonuses. These profit incentives are included in the contract value when their realization is reasonably assured.
We sell our components products, as well as our balance of systems products from the Systems Segment, to system integrators and original equipment manufacturers, or OEMs, and recognize revenue, net of accruals for estimated sales returns, when persuasive evidence of an arrangement exists, the product has shipped, title and risk of loss has passed to the customer, the sales price is fixed and determinable, collectability of the resulting receivable is reasonably assured and the rights and risks of ownership have passed to the customer. We do not currently have any significant post-shipment obligations, including installation, training or customer acceptance clauses with any of our customers, which could have an impact on revenue recognition. As such, we record revenue and trade receivables for the selling price when the above conditions are met. Our revenue recognition is consistent across product lines and sales practices are consistent across all geographic locations.
Allowance for Doubtful Accounts and Sales Returns
We maintain allowances for doubtful accounts for estimated losses resulting from the inability of our customers to make required payments. A considerable amount of judgment is required to assess the likelihood of the ultimate realization of accounts receivables. We make our estimates of the collectability of our accounts receivable by analyzing historical bad debts, specific customer creditworthiness and current economic trends. The allowance for doubtful accounts was $1.9 million and $1.4 million as of December 28, 2008 and December 30, 2007, respectively.
In addition, at the time revenue is recognized, we simultaneously record estimates for sales returns which reduces revenue. These estimates are based on historical sales returns, analysis of credit memo data and other known factors. Actual returns could differ from these estimates. The allowance for sales returns was $0.2 million and $0.4 million as of December 28, 2008 and December 30, 2007, respectively.

44
Warranty Reserves
It is customary in our business and industry to warrant or guarantee the performance of our solar panels at certain levels of conversion efficiency for extended periods, often as long as 20 years. It is also customary to warrant or guarantee the functionality of our solar cells for at least 10 years. In addition, we generally provide a warranty on our systems for a period of 5 to 10 years. We also pass through to customers long-term warranties from the OEMs of certain system components. Warranties of 20 years from solar panels suppliers are standard, while inverters typically carry a 2-, 5- or 10-year warranty. We therefore maintain warranty reserves to cover potential liability that could arise from these guarantees. Our potential liability is generally in the form of product replacement or repair. Our warranty reserves reflect our best estimate of such liabilities and are based on our analysis of product returns, results of industry-standard accelerated testing, unique facts and circumstances involved in each particular construction contract and various other assumptions that we believe to be reasonable under the circumstances. We recognize our warranty reserve as a component of cost of revenue. Our warranty reserve includes specific accruals for known product and system issues and an accrual for an estimate of incurred but not reported product and system issues based on historical activity. Due to effective product testing and the short turnaround time between product shipment and the detection and correction of product failures, accruals for warranties issued were $14.2 million, $10.8 million and $3.2 million during fiscal 2008, 2007 and 2006, respectively, and the year-over-year increase is primarily attributable to increased sales of our products. See Note 9 of Notes to our Consolidated Financial Statements.
Valuation of Inventory
Inventory is valued at the lower of cost or market. Certain factors could impact the realizable value of our inventory, so we continually evaluate the recoverability based on assumptions about customer demand and market conditions. The evaluation may take into consideration historic usage, expected demand, anticipated sales price, new product development schedules, the effect new products might have on the sale of existing products, product obsolescence, customer concentrations, product merchantability and other factors. The reserve or write-down is equal to the difference between the cost of inventory and the estimated market value based upon assumptions about future demand and market conditions. If actual market conditions are less favorable than those projected by management, additional inventory reserves or write-downs may be required that could negatively impact our gross margin and operating results. If actual market conditions are more favorable, we may have higher gross margin when products that have been previously reserved or written down are eventually sold.
Equity in Earnings of Unconsolidated Investees
We account for our investment in Woongjin Energy located in South Korea and First Philec Solar located in the Philippines under APB Opinion No. 1
-
Consolidated Statements of Operations. As of December 28, 2008 and December 30, 2007, we had a 40.0% and 19.9% equity investment, respectively, in Woongjin Energy. As of December 28, 2008 and December 30, 2007, we had a
we adjust the net income (loss) of each joint venture to conform to U.S. GAAP and multiply that by our equity investment.
We periodically evaluate the qualitative and quantitative attributes of our relationship with Woongjin Energy and First Philec Solar to determine whether we are the primary beneficiary of the joint ventures and need to consolidate their financial results into our financial statements in accordance with FASB Staff Position, or FSP, Interpretation No. 46
Energy and First Philec Solar as we have concluded that we are not the primary beneficiary of any of the above joint
residual returns. See Note 10 of the Notes to our Consolidated Financial Statements for discussions of our joint ventures.

45
Valuation of Long-Lived Assets
Our long-lived assets include manufacturing equipment and facilities as well as certain intangible assets. Our business requires heavy investment in manufacturing facilities that are technologically advanced but can quickly become significantly under-utilized or rendered obsolete by rapid changes in demand for solar power products produced in those facilities. In November 2004, Cypress acquired 100% ownership of all outstanding shares of our capital stock, and as a
recording intangible assets including purchased technology, patents, trademarks, distribution agreement and goodwill. In January 2007, we acquired PowerLight, and in January 2008 and July 2008, we acquired Solar Solutions (subsequently renamed SunPower Italia S.r.l., or SunPower Italia) and Solar Sales Pty. Ltd. (subsequently renamed SunPower Corporation Australia Pty. Ltd., or SunPower Australia), respectively. In connection with the transactions, we recorded all the acquired assets and liabilities at their fair values on the date of the acquisition, including goodwill and identified intangible assets.
We evaluate our long-lived assets, including property, plant and equipment and purchased intangible assets with finite lives, for impairment whenever events or changes in circumstances indicate that the carrying value of such assets may not be recoverable. Prior to fiscal 2007, we operated in one business segment and therefore impairment of long-lived assets was assessed at the enterprise level. As a result of the acquisition of PowerLight, we began operating in two business segments, the Systems Segment and Components Segment, and impairment of long-lived assets is assessed at the business segment level. Factors considered important that could result in an impairment review include significant underperformance relative to expected historical or projected future operating results, significant changes in the manner of use of acquired assets or the strategy for our business and significant negative industry or economic trends. Impairments are recognized based on the difference between the fair value of the asset and its carrying value, and fair value is generally measured based on discounted cash flow analyses.
In fiscal 2008, we recorded a $2.2 million impairment charge to cost of components revenue for manufacturing equipment lofabrication facility that manufactured our imaging and infrared detector products, we evaluated our alternatives relating to the future plans for this business and decided to wind-down our activities related to the imaging detector product line in the first quarter of fiscal 2008. In fiscal 2007, we recorded $14.4 million of impairment charges relating to long-lived assets, primarily related to a $14.1 million write-off of the carrying value of the PowerLight tradename resulting from a change in our branding strategy.
Goodwill Impairment Testing
On November 9, 2004, Cypress acquired 100% ownership of all outstanding shares of our capital stock, excluding
us, including its equity investment and pro rata share of our losses in our financial statements by recording intangible assets including purchased technology, patents, trademarks, distribution agreement and goodwill. In January 2007, we acquired PowerLight, and in January 2008 and July 2008, we acquired SunPower Italia and SunPower Australia, respectively, and as a result of the transactions, we were required to record all assets and liabilities acquired under the purchase acquisition, including goodwill and identified intangible assets, at fair value in our financial statements. We perform a goodwill impairment test on an annual basis and will perform an assessment between annual tests in certain circumstances. The process of evaluating the potential impairment of goodwill is highly subjective and requires significant judgment at many points during the analysis. In estimating the fair value of our business, we make estimates and judgments about our future cash flows. Our cash flow forecasts are based on assumptions that are consistent with the plans and estimates we use to manage our business. See Note 4 of Notes to our Consolidated Financial Statements.
Purchase Accounting
We record all assets and liabilities acquired in purchase acquisitions, including goodwill, identified intangible assets and in-process research and development, at fair value as required by SFAS No. The initial recording of goodwill, identified intangible assets and in-process research and development requires certain estimates and assumptions especially concerning the determination of the fair values and useful lives of the acquired intangible assets. The judgments made in the context of the purchase price allocation can materially impact our future results of operations. Accordingly, for significant acquisitions, we obtain assistance from third-party valuation

46
specialists. The valuations are based on information available at the acquisition date. Goodwill is not amortized but is subject to annual tests for impairment or more often if events or circumstances indicate they may be impaired. Other identified intangible assets are amortized over their estimated useful lives and are subject to impairment if events or circumstances indicate a possible inability to realize the carrying amount. See Note 3 and 4 of Notes to our Consolidated Financial Statements.
Fair Value of Financial Instruments
Effective December 31, 2007, we adopted the provisions of SFAS No. No. 157, which defines fair value as the price that would be received to sell an asset or paid to transfer a liability in an orderly transaction between market participants at the measurement date. Our financial assets and financial liabilities that require recognition under SFAS No. 157 include available-for-sale securities under SFAS No. Investment in Certain Debt and over-the-counter, or OTC, foreign currency derivatives and use a valuation model to derive the value of option and forward contracts. In determining fair value, we use various valuation techniques, including market and income approaches to value available-for-sale securities and foreign currency derivatives. SFAS No. 157 establishes a hierarchy for inputs used in measuring fair value that maximizes the use of observable inputs and minimizes the use of unobservable inputs by requiring that the observable inputs be used when available. Observable inputs are inputs that market participants would use in pricing the asset or liability developed based on market data obtained from sources independent of us. Unobservable inputs are inputs that reflect our assumptions about the assumptions market participants would use in pricing the asset or liability developed based on the best information available in the circumstances. As such, fair value is a market-based measure considered from the perspective of a market participant who holds the asset or owes the liability rather than an entity-specific measure. The hierarchy is broken down into three levels based on the reliability of inputs as follows:
Level 1 Valuations based on quoted prices in active markets for identical assets or liabilities that we have the ability to access. Since valuations are based on quoted prices that are readily and regularly available in an active market, valuation of these products does not entail a significant degree of judgment. Financial assets utilizing Level 1 inputs include most money market funds and bank notes.
Level 2 Valuations based on quoted prices in markets that are not active or for which all significant inputs are observable, directly or indirectly. Financial assets utilizing Level 2 inputs include foreign currency option contracts and forward exchange contracts and some corporate securities. The selection of a particular model to value an OTC foreign currency derivative depends upon the contractual term of, and specific risks inherent with, the instrument as well as the availability of pricing information in the market. We generally use similar models to value similar instruments. Valuation models require a variety of inputs, including contractual terms, market prices, yield curves, credit curves and measures of volatility. For OTC foreign currency derivatives that trade in liquid markets, such as generic forward, option and swap contracts, model inputs can generally be verified and model selections do not involve significant management judgment.
Level 3 Valuations based on inputs that are unobservable and significant to the overall fair value measurement. Financial assets utilizing Level 3 inputs include money market funds comprised of the Reserve Primary Fund and the Reserve International Liquidity Fund, collectively referred to as the Reserve Funds, and corporate securities comprised of auction rate securities. We use the market approach to estimate the price that would be received to sell our Reserve Funds in an orderly transaction between market participants ("exit price"). We reviewed the underlying holdings and estimated the price of underlying fund holdings to estimate the fair value of these funds. We use an income approach valuation model to estimate the exit price of the auction rate securities, which is derived as the weighted average present value of expected cash flows over various periods of illiquidity, using a risk adjusted discount rate that is based on the credit risk and liquidity risk of the securities.
Availability of observable inputs can vary from instrument to instrument and to the extent that valuation is based on inputs that are less observable or unobservable in the market, the determination of fair value requires more judgment. Accordingly, the degree of judgment exercised by our management in determining fair value is greatest for instruments categorized in Level 3. In certain cases, the inputs used to measure fair value may fall into different levels of the fair value hierarchy. In such cases, for disclosure purposes the level in the fair value hierarchy within which the fair

47
value measurement in its entirety falls is determined based on the lowest level input that is significant to the fair value measurement in its entirety. In regards to our Reserve Funds, the market approach was based on both Level 2 (term, maturity dates, rates and credit risk) and Level 3 inputs. We determined that the Level 3 inputs, particularly the liquidity premium, were the most significant to the overall fair value measurement. In regards to our auction rate securities, the income approach valuation model was based on both Level 2 (credit quality and interest rates) and Level 3 inputs. We determined that the Level 3 inputs were the most significant to the overall fair value measurement, particularly the estimates of risk adjusted discount rates and ranges of expected periods of illiquidity.
Unrealized gains and losses of our available-for-sale securities and foreign currency derivatives are excluded from earnings and reported as a component of other comprehensive income (loss) on the Consolidated Balance Sheets. Additionally, we assess whether an other-than-temporary impairment loss on our available-for-sale securities has occurred due to declines in fair value or other market conditions. Declines in fair value that are considered other-than-temporary are recorded in other, net in the Consolidated Statements of Operations.
In general, investments with original maturities of greater than ninety days and remaining maturities of less than one year are classified as short-term investments. Investments with maturities beyond one year may also be classified as short-term based on their highly liquid nature and because such investments represent the investment of cash that is available for current operations.
We also invest in auction rate securities that are typically over-collateralized and secured by pools of student loans originated under the Federal Family Education Loan Program, or FFELP, that are guaranteed and insured by the U.S. Department of Education. In addition, all auction rate securities held are rated by one or more of the Nationally Recognized Statistical Rating Organizations, or NRSRO, as triple-A. Historically, these securities have provided liquidity through a Dutch auction at pre-determined intervals every seven to 49 days. When auction rate securities fail to clear at auction and we are unable to estimate when the impacted auction rate securities will clear at the next auction, we classify these as long-
curities generally are between 20 to 30 years. A failed auction results in a lack of liquidity, which occurs when sell orders exceed buy orders, and does not necessarily signify a default by the issuer. Beginning in February 2008, the auction rate securities market experienced a significant increase in the number of
Item 1A Risk Factors If the recent credit market conditions continue or worsen, they could have a material adverse impact on our investment portfolio. Notes to our Consolidated Financial Statements.
Accounting for Income Taxes
Our global operations involve manufacturing, research and development and selling activities. Profit from non-U.S. activities is subject to local country taxes but not subject to United States tax until repatriated to the United States. It is our intention to indefinitely reinvest these earnings outside the United States. We record a valuation allowance to reduce our deferred tax assets to the amount that is more likely than not to be realized. In assessing the need for a valuation allowance, we consider historical levels of income, expectations and risks associated with the estimates of future taxable income and ongoing prudent and feasible tax planning strategies. In the event we determine that we would be able to realize additional deferred tax assets in the future in excess of the net recorded amount, or if we subsequently determine that realization of an amount previously recorded is unlikely, we would record an adjustment to the deferred tax asset valuation allowance, which would change income in the period of adjustment.
Income Taxes, and Related Implementation Issueprescribes a recognition threshold that a tax position is required to meet before being recognized in the financial statements and provides guidance on de-recognition, measurement, classification, interest and penalties, accounting in interim periods, disclosure and transition issues. FIN 48 contains a two-step approach to recognizing and measuring uncertain tax positions accounted for in accordance with SFAS No. 109. The first step is to evaluate the tax position for recognition by determining if the weight of available evidence indicates that it is more likely than not that the position will be sustained on audit, including resolution of related appeals or litigation processes, if any. The second step is to measure the tax benefit as the largest amount that is more than 50% likely of being realized upon ultimate settlement.

48
The calculation of tax liabilities involves dealing with uncertainties in the application of complex global tax regulations. We recognize potential liabilities for anticipated tax audit issues in the United States and other tax jurisdictions based on our estimate of whether, and the extent to which, additional taxes will be due. If payment of these amounts ultimately proves to be unnecessary, the reversal of the liabilities would result in tax benefits being recognized in the period when we determine the liabilities are no longer necessary. If the estimate of tax liabilities proves to be less than the ultimate tax assessment, a further charge to expense would result. We accrue interest and penalties on tax contingencies as required by FIN 48 and SFAS No. 109. This interest and penalty accrual is classified as income tax provision (benefit) in the Consolidated Statements of Operations and is not considered material. See Note 13 of Notes to our Consolidated Financial Statements.
In addition, foreign exchange gains (losses) may result from estimated tax liabilities, which are expected to be realized in currencies other than the U.S. dollar.
Results of Operations
Revenue
Year Ended
(Dollars in thousands) December 28,
2008 December 30,
2007 December 31,
2006Systems revenue $ 820,632 $ 464,178 $Components revenue 614,287 310,612 236,510
Total revenue $ 1,434,919 $ 774,790 $ 236,510
Total Revenue: During fiscal 2008 and 2007, our total revenue was $1,434.9 million and $774.8 million, respectively, an increase of 85%. Our fiscal 2007 revenue increased 228% compared to our total revenue in 2006 of $236.5 million. The significant increase in our total revenue from fiscal 2007 to 2008 is attributable in part to the Systems S -scale solar power plants in
and the continued increases in unit production and unit shipments of both solar cells and solar panels as we have expanded our manufacturing capacity. The significant increase in our total revenue from fiscal 2006 to 2007 resulted from the combination of an increase in components revenue of approximately $74.1 million during fiscal 2007, and the addition of $464.2 million in systems revenue for fiscal 2007, as a result of the acquisition of PowerLight (now known as SP Systems). We had twelve, seven and four solar cell manufacturing lines in our two solar cell manufacturing facilities as of December 28, 2008, December 30, 2007 and December 31, 2006, respectively, with a total rated manufacturing capacity of 414 megawatts, 214 megawatts and 108 megawatts, respectively, per year. During fiscal 2008, 2007 and 2006, our two solar cell manufacturing facilities produced 236.9 megawatts, 100.1 megatwatts and 66.7 megawatts, respectively.
Sales outside the United States represented approximately 64%, 55% and 68% of our total revenue for fiscal 2008, 2007 and 2006, respectively, and we expect international sales to remain a significant portion of overall sales for the foreseeable future. International sales as a percentage of our total revenue increased approximately 9% from fiscal 2007 to 2008 as our Systems Segment installed more than 40 megawatts of production for several large-scale solar power plants in Spain in fiscal 2008, and our Components Segment continues to expand our global dealer network, with an emphasis on European expansion. International sales as a percentage of our total revenue decreased approximately 13% from fiscal 2006 to 2007 primarily due to the completion of an approximately 14 megawatt solar power plant at Nellis Air Force Base in Nevada that currently represents our largest installed solar power project in North America.

49
Concentrations: We have eight customers that each accounted for more than 10 percent of our total revenue in one or more of fiscal 2008, 2007 and 2006 as follows:
Year Ended
December 28,
2008 December 30,
2007 December 31,
2006Significant customers: Business Segment Naturener Group Systems 18% * %Sedwick Corporate, S.L. Systems 11% * %SolarPack Systems * 18% %MMA Renewable Ventures Systems * 16% %Conergy AG Components * * 25% Solon AG Components * * 24% PowerLight** Components n.a. n.a. 16% General Electric Company*** Components * * 10%
* denotes less than 10% during the period ** acquired by us on January 10, 2007 *** includes its subcontracting partner, Plexus Corporation
We generate revenue from two business segments, as follows:
Systems Segment Revenue: Our systems revenue for fiscal 2008 and 2007 was $820.6 million and $464.2 million, respectively, which accounted for 57% and 60%, respectively, of our total revenue. We had no systems revenue in fiscal 2006. For fiscal 2008 and 2007, 92% and 84%, respectively, of systems revenue was from EPC construction contracts and the remaining 8% and 16%, respectively, was from materials-only sales contracts. Our systems revenue is largely dependent on the timing of revenue recognition on large construction projects and, accordingly, will fluctuate from period to period. For fiscal 2008, our Systems Segment benefited from strong power plant scale demand in Europe, primarily in Spain, and reflected the completion of Spain based projects before the expiration of the pre-existing feed-in tariff in September 2008. For fiscal 2007, our Systems Segment benefited from strong demand for our solar power systems in a rapidly growing solar business environment, particularly with respect to the ongoing evolution of country-specific customer incentive programs.
Naturener Group, Sedwick Corporate, S.L., SolarPack and MMA Renewable Ventures purchased systems from us as central-station power plants which generate electricity for sale to commercial customers and under tariff to regional and public utilities customers. In fiscal 2008 and 2007, approximately 37% and 32%, respectively, of our total revenue was derived from such sales of systems to financing companies that engage in power purchase agreements with end-users of electricity.
Components Segment Revenue: Components revenue for fiscal 2008, 2007 and 2006 was $614.3 million, $310.6 million and $236.5 million, respectively, or 43%, 40% and 100%, respectively, of our total revenue. During fiscal 2008, our Components Segment benefited from strong demand in the residential and small commercial roof-top markets through our dealer network in both Europe and the United States. During fiscal 2008, we tripled the size of our dealer network by adding more than 350 dealers worldwide. During fiscal 2007 and 2006, our Components Segment benefited from continued strong world-wide demand for our solar power products, increasing sequential quarterly average selling prices and production volume output.
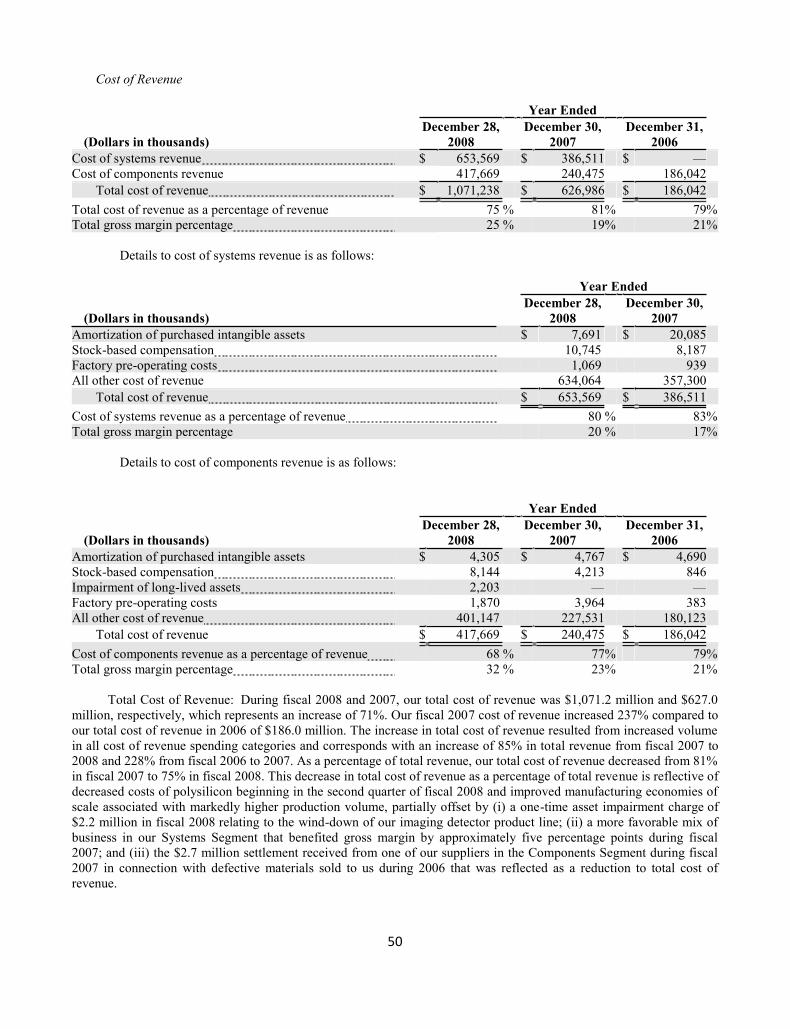
50
Cost of Revenue
Year Ended
(Dollars in thousands) December 28,
2008 December 30,
2007 December 31,
2006 Cost of systems revenue $ 653,569 $ 386,511 $ Cost of components revenue 417,669 240,475 186,042
Total cost of revenue $ 1,071,238 $ 626,986 $ 186,042 Total cost of revenue as a percentage of revenue 75 % 81% 79 %Total gross margin percentage 25 % 19% 21 %
Details to cost of systems revenue is as follows:
Year Ended
(Dollars in thousands) December 28,
2008 December 30,
2007 Amortization of purchased intangible assets $ 7,691 $ 20,085 Stock-based compensation 10,745 8,187 Factory pre-operating costs 1,069 939 All other cost of revenue 634,064 357,300
Total cost of revenue $ 653,569 $ 386,511 Cost of systems revenue as a percentage of revenue 80 % 83 %Total gross margin percentage 20 % 17 %
Details to cost of components revenue is as follows:
Year Ended
(Dollars in thousands) December 28,
2008 December 30,
2007 December 31,
2006 Amortization of purchased intangible assets $ 4,305 $ 4,767 $ 4,690 Stock-based compensation 8,144 4,213 846 Impairment of long-lived assets 2,203 Factory pre-operating costs 1,870 3,964 383 All other cost of revenue 401,147 227,531 180,123
Total cost of revenue $ 417,669 $ 240,475 $ 186,042 Cost of components revenue as a percentage of revenue 68 % 77% 79 %Total gross margin percentage 32 % 23% 21 %
Total Cost of Revenue: During fiscal 2008 and 2007, our total cost of revenue was $1,071.2 million and $627.0 million, respectively, which represents an increase of 71%. Our fiscal 2007 cost of revenue increased 237% compared to our total cost of revenue in 2006 of $186.0 million. The increase in total cost of revenue resulted from increased volume in all cost of revenue spending categories and corresponds with an increase of 85% in total revenue from fiscal 2007 to 2008 and 228% from fiscal 2006 to 2007. As a percentage of total revenue, our total cost of revenue decreased from 81% in fiscal 2007 to 75% in fiscal 2008. This decrease in total cost of revenue as a percentage of total revenue is reflective of decreased costs of polysilicon beginning in the second quarter of fiscal 2008 and improved manufacturing economies of scale associated with markedly higher production volume, partially offset by (i) a one-time asset impairment charge of $2.2 million in fiscal 2008 relating to the wind-down of our imaging detector product line; (ii) a more favorable mix of business in our Systems Segment that benefited gross margin by approximately five percentage points during fiscal 2007; and (iii) the $2.7 million settlement received from one of our suppliers in the Components Segment during fiscal 2007 in connection with defective materials sold to us during 2006 that was reflected as a reduction to total cost of revenue.
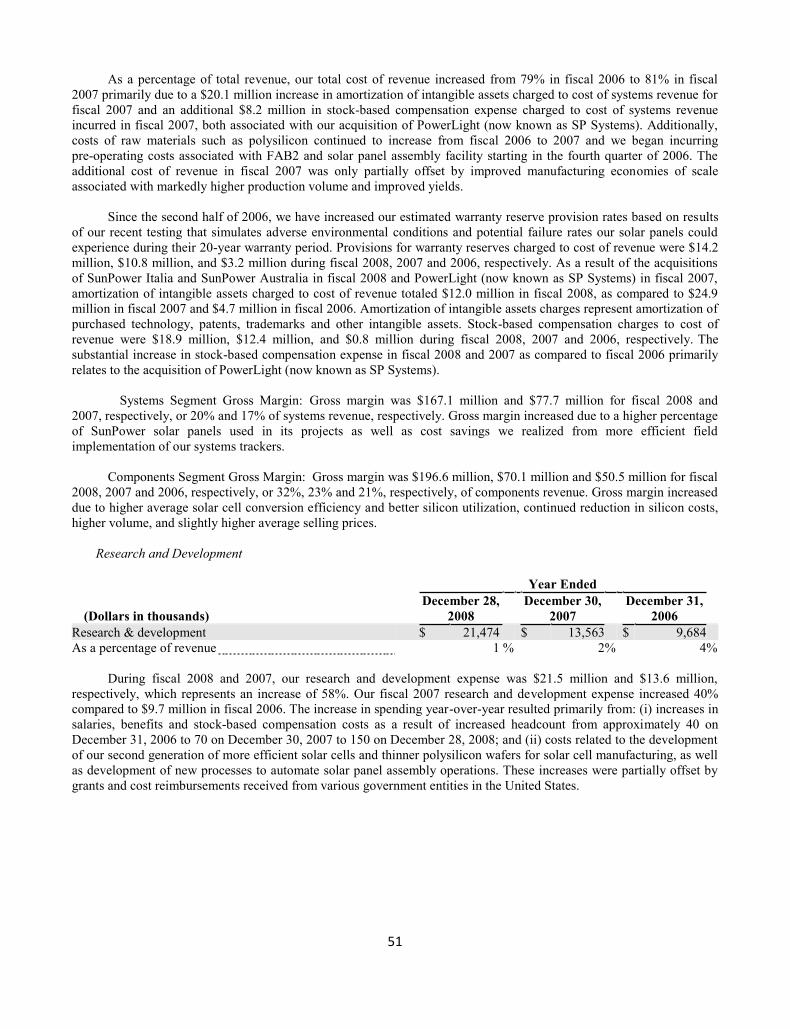
51
As a percentage of total revenue, our total cost of revenue increased from 79% in fiscal 2006 to 81% in fiscal 2007 primarily due to a $20.1 million increase in amortization of intangible assets charged to cost of systems revenue for fiscal 2007 and an additional $8.2 million in stock-based compensation expense charged to cost of systems revenue incurred in fiscal 2007, both associated with our acquisition of PowerLight (now known as SP Systems). Additionally, costs of raw materials such as polysilicon continued to increase from fiscal 2006 to 2007 and we began incurring pre-operating costs associated with FAB2 and solar panel assembly facility starting in the fourth quarter of 2006. The additional cost of revenue in fiscal 2007 was only partially offset by improved manufacturing economies of scale associated with markedly higher production volume and improved yields.
Since the second half of 2006, we have increased our estimated warranty reserve provision rates based on results of our recent testing that simulates adverse environmental conditions and potential failure rates our solar panels could experience during their 20-year warranty period. Provisions for warranty reserves charged to cost of revenue were $14.2 million, $10.8 million, and $3.2 million during fiscal 2008, 2007 and 2006, respectively. As a result of the acquisitions of SunPower Italia and SunPower Australia in fiscal 2008 and PowerLight (now known as SP Systems) in fiscal 2007, amortization of intangible assets charged to cost of revenue totaled $12.0 million in fiscal 2008, as compared to $24.9 million in fiscal 2007 and $4.7 million in fiscal 2006. Amortization of intangible assets charges represent amortization of purchased technology, patents, trademarks and other intangible assets. Stock-based compensation charges to cost of revenue were $18.9 million, $12.4 million, and $0.8 million during fiscal 2008, 2007 and 2006, respectively. The substantial increase in stock-based compensation expense in fiscal 2008 and 2007 as compared to fiscal 2006 primarily relates to the acquisition of PowerLight (now known as SP Systems).
Systems Segment Gross Margin: Gross margin was $167.1 million and $77.7 million for fiscal 2008 and 2007, respectively, or 20% and 17% of systems revenue, respectively. Gross margin increased due to a higher percentage of SunPower solar panels used in its projects as well as cost savings we realized from more efficient field implementation of our systems trackers.
Components Segment Gross Margin: Gross margin was $196.6 million, $70.1 million and $50.5 million for fiscal 2008, 2007 and 2006, respectively, or 32%, 23% and 21%, respectively, of components revenue. Gross margin increased due to higher average solar cell conversion efficiency and better silicon utilization, continued reduction in silicon costs, higher volume, and slightly higher average selling prices.
Research and Development
Year Ended
(Dollars in thousands) December 28,
2008 December 30,
2007 December 31,
2006 Research & development $ 21,474 $ 13,563 $ 9,684 As a percentage of revenue 1 % 2% 4%
During fiscal 2008 and 2007, our research and development expense was $21.5 million and $13.6 million, respectively, which represents an increase of 58%. Our fiscal 2007 research and development expense increased 40% compared to $9.7 million in fiscal 2006. The increase in spending year-over-year resulted primarily from: (i) increases in salaries, benefits and stock-based compensation costs as a result of increased headcount from approximately 40 on December 31, 2006 to 70 on December 30, 2007 to 150 on December 28, 2008; and (ii) costs related to the development of our second generation of more efficient solar cells and thinner polysilicon wafers for solar cell manufacturing, as well as development of new processes to automate solar panel assembly operations. These increases were partially offset by grants and cost reimbursements received from various government entities in the United States.

52
Sales, General and Administrative
Year Ended
(Dollars in thousands) December 28,
2008 December 30,
2007 December 31,
2006 Sales, general & administrative $ 173,740 $ 108,256 $ 21,677 As a percentage of revenue 12 % 14% 9%
During fiscal 2008 and 2007, our sales, general and administrative expense, or SG&A expense, was $173.7 million and $108.3 million, respectively, which represents an increase of 60%. Our fiscal 2007 SG&A expense increased 399% compared to $21.7 million in fiscal 2006. The increase in costs year-over-year resulted primarily from higher spending in all of the functional areas to support the growth of our business. Headcount related to SG&A expense increased from approximately 90 on December 31, 2006 to 230 on December 30, 2007 to 640 on December 28, 2008. Additional costs increases were related to sales and marketing spending to expand our global dealer network primarily in Europe and global branding initiatives, as well as increased expenses associated with deployment of a new enterprise resource planning system, legal and accounting services. During fiscal 2008, 2007 and 2006, stock-based compensation included in our SG&A expense was approximately $47.3 million, $37.0 million and $2.8 million, respectively. As a percentage of revenue, SG&A expense decreased to 12% in fiscal 2008 from 14% in fiscal 2007, because these expenses increased at a lower rate than the rate of growth of our revenue. SG&A expense increased from 9% in fiscal 2006 to 14% in fiscal 2007 largely due to the acquisition and integration of PowerLight (now known as SP Systems).
Purchased In-Process Research and Development, or IPR&D
Year Ended
(Dollars in thousands) December 28,
2008 December 30,
2007 December 31,
2006 Purchased in-process research and development $ $ 9,575 $ As a percentage of revenue n.a. 1% n.a.
For fiscal 2007, we recorded an IPR&D charge of $9.6 million in connection with the acquisition of PowerLight (now known as SP Systems) in January 2007, as technological feasibility associated with the IPR&D projects had not been established and no alternative future use existed. No in-process research and development expense was recorded for fiscal 2008 and 2006. See Note 3 of Notes to our Consolidated Financial Statements.
Impairment of Acquisition-Related Intangible Assets
Year Ended
(Dollars in thousands) December 28,
2008 December 30,
2007 December 31,
2006 Impairment of acquisition-related intangible assets $ $ 14,068 $ As a percentage of revenue n.a. 2% n.a.
For fiscal 2007, we recognized a charge for the impairment of acquisition-related intangible assets of $14.1 million. In June 2007, we changed our branding strategy and consolidated all of our product and service offerings under the SunPower tradename. As a result of the change in our branding strategy, during the quarter ended July 1, 2007, the net book value of the PowerLight tradename of $14.1 million was written off as an impairment of acquisition-related intangible assets. See Note 3 and 4 of Notes to our Consolidated Financial Statements.

53
Other Income (Expense), Net
Year Ended
(Dollars in thousands) December 28,
2008 December 30,
2007 December 31,
2006 Interest income $ 10,789 $ 13,882 $ 10,086 As a percentage of revenue 1% 2% 4%Interest expense $ (4,387) $ (5,071) $ (1,809) As a percentage of revenue (0) % (1)% (1) %Other, net $ (27,285) $ (7,593) $ 1,077 As a percentage of revenue (2) % (1)% 0%
Interest income during fiscal 2008, 2007 and 2006 primarily represents interest income earned on our cash, cash equivalents, restricted cash and investments during these periods. The decrease in interest income of 22% from fiscal 2007 to 2008 resulted from lower cash holdings related to capital expenditures for our manufacturing capacity expansion. The increase in interest income of 38% from fiscal 2006 to 2007 is primarily the effect of interest earned on $581.5 million in net proceeds from our class A common stock and convertible debenture offerings in February and July 2007, partially offset by the use of cash for capital expenditures for our manufacturing capacity expansion.
Interest expense during fiscal 2008 and 2007 relates to interest due on convertible debt and customer advance payments. Interest expense during fiscal 2006 primarily relates to customer advance payments. The decrease in interest expense of 13% from fiscal 2007 to 2008 resulted from capitalized interest of $1.4 million in fiscal 2008. The increase in interest expense of 180% from fiscal 2006 to 2007 is primarily due to interest related to the aggregate of $425.0 million in convertible debentures issued in February and July 2007. Our convertible debt was used in part to fund our capital expenditures for our manufacturing capacity expansion.
In May 2008, the FASB issued FSP APB 14-Settled in Cash upon Conver -1, which clarifies the accounting for convertible debt instruments that may be settled in cash upon conversion. FSP APB 14-1 significantly impacts the accounting for our convertible debt by requiring us to separately account for the liability and equity components of the convertible debt in a manner that reflects interest expense equal to our non-convertible debt borrowing rate. FSP APB 14-1 may result in significantly higher non-cash interest expense on our convertible debt. FSP APB 14-1 is effective for fiscal years and interim periods beginning after December 15, 2008, and retrospective application will be required for all periods presented.
The following table summarizes the components of other, net:
Year Ended
(In thousands) December 28,
2008 December 30,
2007 December 31,
2006 Write-off of unamortized debt issuance costs $ (972) $ (8,260) $ Amortization of debt issuance costs (1,710) Impairment of investments (5,408) Gain (loss) on derivatives and foreign exchange, net of tax (20,602) 2,086 863 Other income (expense), net (303) 291 214
Total other, net $ (27,285) $ (7,593) $ 1,077
Other, net expenses during fiscal 2008 consists primarily of losses totaling $6.5 million from expensing the time value of option contracts, losses totaling $14.1 million on derivatives and foreign exchange largely due to the volatility in the current markets, a $1.0 million write-off of unamortized debt issuance costs as a result of the market price conversion trigger on our senior convertible debentures being met in December 2007 and impairment charges totaling $5.4 million for auction rate securities, certain money market securities and non-publicly traded investments. Other, net expenses during fiscal 2007 consists primarily of a write-off of unamortized debt issuance costs totaling $8.3 million and amortization of debt issuance costs totaling $1.7 million, offset slightly by gains totaling $2.1 million from derivatives and foreign exchange. For fiscal 2006, other, net income consists primarily of gains from derivatives and foreign

54
exchange.
Income Taxes
Year Ended
(Dollars in thousands) December 28,
2008 December 30,
2007 December 31,
2006 Income tax provision (benefit) $ 69,368 $ (5,920) $ 1,945 As a percentage of revenue 5 % (1)% 1%
In fiscal 2008, our income tax expense was primarily composed of domestic and foreign income taxes in certain jurisdictions where our operations are profitable. In fiscal 2007, our income tax benefit was principally the result of recognition of deferred tax assets to the extent of deferred tax liabilities created by the acquisition of PowerLight (now known as SP Systems) in January 2007, net of foreign income taxes in profitable jurisdictions where the tax rates are less than the U.S. statutory rate. In fiscal 2006, our income tax expense was predominately for foreign income taxes in certain jurisdictions where operations were profitable.
As of December 28, 2008, we had federal net operating loss carryforwards of approximately $57.6 million. These federal net operating loss carryforwards will expire in 2027. We had California state net operating loss carryforwards of approximately $73.6 million as of December 28, 2008, which expire at various dates from 2011 to 2017. We also had research and development credit carryforwards of approximately $4.0 million for federal tax purposes and $4.6 million for state tax purposes. We have provided a valuation allowance on our deferred tax assets in the U.S., consisting primarily of net operating loss carryforwards and credits, because of the uncertainty of their realizability. We expect it is more likely than not that we will not realize our net deferred tax assets as of December 28, 2008. In the event we determine that the realization of these deferred tax assets associated with our acquisition of PowerLight (now known as
allowance will first reduce goodwill, then intangible assets and lastly as a reduction to the provision for taxes. Due in 382 of the Internal Revenue Code,
or the Code. Accordingly, our use of a portion of the net operating loss carryforwards and credit carryforwards is limited by the annual limitations described in Sections 382 and 383 of the Code. The majority of the net operating loss carryforwards were created by employee stock transactions. Because there is uncertainty as to the realizability of the loss carryforwards, the portion created by employee stock transactions are not reflected on our Consolidated Balance Sheets.
Equity in earnings of unconsolidated investees
Year Ended
(Dollars in thousands) December 28,
2008 December 30,
2007 December 31,
2006 Equity in earnings of unconsolidated investees, net of taxes $ 14,077 $ (278) $ As a percentage of revenue 1 % (0)% n.a.
During fiscal 2008 and 2007, our equity in earnings of unconsolidated investees were gains of $14.1 million and losses of $0.3 million, respectively. e totaled $14.2 million in fiscal 2008 as compared to a loss of $0.3 million in fiscal 2007 due to 1) increases in production since Woongjin Energy began manufacturing in the third quarter of fiscal 2007; 2) our equity investment increased from 19.9% as of December 30, 2007 to 40.0% as of December 28, 2008; and 3) a $6.3 million foreign currency transaction gain that resulted from the strengthening of the U.S. dollar versus the Korean Won. First Philec Solar became operational in the second quarter of fiscaConsolidated Financial Statements.
Liquidity and Capital Resources
In December 2008, we borrowed Malaysian Ringgit 190.0 million, or approximately $54.6 million, from the Malaysian Government under a Malaysian Ringgit 1.0 billion, or approximately $287.4 million, facility agreement we entered into in connection with the construction of FAB3 in Malaysia. In February 2007, we raised $194.0 million net

55
proceeds from the issuance of 1.25% senior convertible debentures. In July 2007, we raised $220.1 million net proceeds from the issuance of 0.75% senior convertible debentures and $167.4 million net proceeds from the completion of a follow-on offering of 2.7 million shares of our class A common stock. In June 2006, we received net proceeds of approximately $197.4 million from a follow-on offering of 7.0 million shares of class A common stock.
Cash Flows
A summary of the sources and uses of cash and cash equivalents is as follows:
Year Ended
(Dollars in thousands) December 28,
2008 December 30,
2007 December 31,
2006 Net cash provided by (used in) operating activities $ 153,647 $ 2,372 $ (45,966)Net cash used in investing activities (325,790 ) (474,118) (133,330)Net cash provided by financing activities 93,381 584,625 201,300
Operating Activities
Net cash provided by operating activities of $153.6 million in fiscal 2008 was primarily the result of net income of $92.3 million, plus non-cash charges totaling $149.3 million for depreciation, impairment of investments and long-lived assets, amortization, write-off of debt issuance costs and stock-based compensation expense, less non-cash income of $14.1 million for our equity share in earnings of joint ventures, as well as increases in accounts payable and other accrued liabilities of $147.2 million, mainly due to capital expenditures for our manufacturing capacity expansion, and customer advances of $40.1 million, primarily for future polysilicon purchases by customers that manufacture ingots which are sold back to us under an ingot supply agreement. These items were partially offset by decreases in billings in excess of costs and estimated earnings of $57.4 million related to contractual timing of system project billings, as well as increases in inventories of $99.0 million, mainly due to our agreement to design and build two solar photovoltaic power plants for Florida Power & Light Company, or FPL, accounts receivable of $57.6 million and other changes in operating assets and liabilities totaling $47.2 million. The significant increases in substantially all of our operating assets and liabilities resulted from our substantial revenue increase in fiscal 2008 compared to previous years which impacted net income and working capital.
Net cash generated from operating activities of $2.4 million in fiscal 2007 was primarily the result of net income of $9.2 million, plus non-cash charges totaling $141.0 million for depreciation, amortization, purchased in-process research and development, impairment of acquisition-related intangible assets, write-off of debt issuance costs, stock-based compensation expense and equity share in loss of joint ventures. In addition, cash provided by operating activities in fiscal 2007 resulted from increases in accounts payable and other accrued liabilities of $42.3 million, billings in excess of costs and estimated earnings of $29.9 million and customer advances of $29.4 million. These items were partially offset by increases in inventory of $69.2 million, advances to suppliers of $83.6 million related to our existing supply agreements, accounts receivable of $42.7 million, costs and estimated earnings in excess of billings of $32.6 million related to contractual timing of system project billings and other changes in operating assets and liabilities totaling $21.3 million. The significant increases in substantially all of our operating assets and liabilities resulted from the acquisition of PowerLight (now known as SP Systems), as well as our substantial revenue increase in fiscal 2007 compared to previous years which impacted net income and working capital.
Net cash used in operating activities was $46.0 million in fiscal 2006, which primarily represents our net income of $26.5 million, offset by $77.4 million of advance payments to raw material suppliers. The net impact of all other sources and uses of fiscal 2006 cash flows from operations was a net increase of $4.9 million comprised of non-cash charges for depreciation, amortization and stock-based compensation and changes in operating assets and liabilities.
Investing Activities
Net cash used in investing activities during fiscal 2008, 2007 and 2006 was $325.8 million, $474.1 million and $133.3 million, respectively, which primarily relates to capital expenditures of $265.5 million, $193.4 million and $100.2 million, respectively, incurred during each year. Capital expenditures were mainly associated with manufacturing capacity expansion in the Philippines. Also during fiscal 2008, (i) restricted cash increased by $107.4 million for

56
advanced payments received from customers that we provided security in the form of cash collateralized bank standby letters of credit and for the first drawdown under the facility agreement with the Malaysian government; (ii) we paid cash of $18.3 million for the acquisitions of SunPower Italia and SunPower Australia, net of cash acquired; and (iii) we invested an additional $24.6 million in joint ventures and other private companies. Cash used in investing activities was partially offset by $90.1 million in proceeds received from the sales of available-for-sale securities, net of available-for-sale securities purchased during the period and investment in the Reserve Funds re-designated from cash and cash equivalents to short-term investments.
During fiscal 2007, (i) we used $118.0 million of cash for purchases of available-for-sale securities, net of available-for-sale securities sold during the year; (ii) we paid $98.6 million in cash for the acquisition of PowerLight, net of cash acquired; (iii) we had $63.2 million of restricted cash for advanced payments received from customers that we provided security in the form of cash collateralized bank standby letters of credit; and (iv) we invested $0.9 million in our First Philec Solar joint venture. During fiscal 2006, (i) we used $16.5 million to purchase short-term marketable investment securities, net of short-term marketable investment securities sold during the year; (ii) we loaned $10.0 million to PowerLight, which we subsequently acquired on January 10, 2007 and (iii) we invested $5.0 million in our Woongjin Energy joint venture.
Financing Activities
Net cash provided by financing activities during fiscal 2008 reflects proceeds received of Malaysian Ringgit 190.0 million (approximately $54.6 million) from the Malaysian Government under our facility agreement, $5.1 million from stock option exercises and $41.5 million in excess tax benefits from stock-based award activity, partially offset by cash paid of $6.7 million for treasury stock purchases that were used to pay withholding taxes on vested restricted stock and $1.2 million for conversion of convertible debt.
Net cash provided by financing activities during fiscal 2007 primarily reflects (i) $194.0 million in net proceeds from the issuance of $200.0 million in principal amount of 1.25% senior convertible debentures in February 2007; (ii) $220.1 million in net proceeds from the issuance of $225.0 million in principal amount of 0.75% senior convertible debentures in July 2007; and (iii) $167.4 million in net proceeds from our follow-on public offering of 2.7 million shares of our class A common stock in July 2007. Also during fiscal 2007, we paid $3.6 million on an outstanding line of credit, paid $2.0 million for treasury stock purchases used to pay withholding taxes on vested restricted stock, received $8.5 million in proceeds from stock option exercises and received $0.2 million from employees for the conversion of stock appreciation rights to restricted stock units.
Net cash provided by financing activities during fiscal 2006 reflects $197.4 million in net proceeds from our follow-on public offering of 7.0 million shares of our class A common stock in June 2006 and receipt of $3.9 million in proceeds from exercises of employee stock options.
Debt and Credit Sources
Line of Credit
On July 13, 2007, we entered into a credit agreement with Wells Fargo Bank, N.A., or Wells Fargo, that was amended from time to time, providing for a $50.0 million uncollateralized revolving credit line, with a $50.0 million uncollateralized letter of credit subfeature, and a separate $150.0 million collateralized letter of credit facility as of December 28, 2008. We may borrow up to $50.0 million and request that Wells Fargo issue up to $50.0 million in letters of credit under the uncollateralized letter of credit subfeature. Letters of credit issued under the subfeature reduce our borrowing capacity under the revolving credit line. Additionally, we may request that Wells Fargo issue up to $150.0 million in letters of credit under the collateralized letter of credit facility through July 31, 2012. As detailed in the agreement, we pay interest of LIBOR plus 1.25% on outstanding borrowings under the uncollateralized revolving credit line, and a fee of 1.0% and 0.2% for outstanding letters of credit under the uncollateralized letter of credit subfeature and collateralized letter of credit facility, respectively. At any time, we can prepay outstanding loans. In February 2009, we amended the credit agreement to extend the expiration date for the uncollateralized revolving credit line and uncollateralized letter of credit subfeature from April 4, 2009 to July 3, 2009. In addition, we are negotiating another amendment to revise the existing credit agreement with Wells Fargo to further extend the expiration date for the uncollateralized revolving credit line and uncollateralized letter of credit subfeature. All letters of credit issued under the

57
collateralized letter of credit facility expire no later than July 31, 2012. If we and Wells Fargo do not agree to amend the credit agreement to futher extend the deadline, all borrowings under the uncollateralized revolving credit line must be repaid by July 3, 2009, and all letters of credit issued under the uncollateralized letter of credit subfeature expire on or before July 3, 2009 unless we provide by such date collateral in the form of cash or cash equivalents in the aggregate amount available to be drawn under letters of credit outstanding at such time.
In connection with the credit agreement, we entered into a security agreement with Wells Fargo, granting a security interest in a securities account and deposit account to secure our obligations in connection with any letters of credit that might be issued under the credit agreement. SunPower North America, Inc., SP Systems and SunPower Systems SA, our wholly-owned subsidiaries, also entered into an associated continuing guaranty with Wells Fargo. The terms of the credit agreement include certain conditions to borrowings, representations and covenants, and events of default customary for financing transactions of this type. If we fail to comply with the financial and other restrictive covenants contained in the credit agreement resulting in an event of default, all debt could become immediately due and payable. Financial and other restrictive covenants include, but are not limited to, net income adjusted for purchase accounting not less than $1.00 in each period of four consecutive quarters as of the recently completed fiscal quarter, total liabilities divided by tangible net worth not exceeding two to one as of the end of each fiscal quarter; and no declaration or payment of dividends.
As of December 28, 2008 and December 30, 2007, letters of credit totaling $29.9 million and $32.0 million, respectively, were issued by Wells Fargo under the uncollateralized letter of credit subfeature. In addition, letters of credit totaling $76.5 million and $47.9 million were issued by Wells Fargo under the collateralized letter of credit facility as of December 28, 2008 and December 30, 2007, respectively. On December 28, 2008 and December 30, 2007, cash available to be borrowed under the uncollateralized revolving credit line was $20.1 million and $18.0 million, respectively, and includes letter of credit capacities available to be issued by Wells Fargo under the uncollateralized letter of credit subfeature of $20.1 million and $8.0 million, respectively. Letters of credit available under the collateralized letter of credit facility at December 28, 2008 and December 30, 2007 totaled $73.5 million and $2.1 million, respectively. See Note 11 of Notes to our Consolidated Financial Statements.
Debt Issuance with the Malaysian Government
On December 18, 2008, we entered into a facility agreement with the Malaysian Government. In connection with the facility agreement, we executed a debenture and deed of assignment in favor of the Malaysian Government, granting a security interest in a deposit account and all assets of SunPower Malaysia Manufacturing Sdn. Bhd., our wholly-owned subsidiary, to secure our obligations under the facility agreement.
Under the terms of the facility agreement, we may borrow up to Malaysian Ringgit 1.0 billion, or approximately $287.4 million, to finance the construction of FAB3 in Malaysia. The loans within the facility agreement are divided into two tranches that may be drawn through June 2010. Principal is to be repaid in six quarterly payments starting in July 2015, and a non-weighted average interest rate of approximately 4.4% per annum accrues and is payable starting in July 2015. As of December 28, 2008, we had borrowed Malaysian Ringgit 190.0 million, or approximately $54.6 million, under the facility agreement. In January 2009, we borrowed an additional Malaysian Ringgit 185.0 million, or approximately $51.0 million, under the facility agreement. We have the ability to prepay outstanding loans and all borrowings must be repaid by October 30, 2016. The terms of the facility agreement include certain conditions to borrowings, representations and covenants, and events of default customary for financing transactions of this type.
1.25% and 0.75% Convertible Debt Issuance
In February 2007, we issued $200.0 million in principal amount of our 1.25% senior convertible debentures, or the 1.25% debentures, and received net proceeds of $194.0 million. Interest on the 1.25% debentures is payable on February 15 and August 15 of each year, commencing August 15, 2007. The 1.25% debentures will mature on February 15, 2027. Holders may require us to repurchase all or a portion of their 1.25% debentures on each of February 15, 2012, February 15, 2017 and February 15, 2022, or if we experience certain types of corporate transactions constituting a fundamental change. Any repurchase of the 1.25% debentures pursuant to these provisions will be for cash at a price equal to 100% of the principal amount of the 1.25% debentures to be repurchased plus accrued and unpaid interest. In addition, we may redeem some or all of the 1.25% debentures on or after February 15, 2012 for cash at a redemption price equal to 100% of the principal amount of the 1.25% debentures to be redeemed plus accrued and

58
unpaid interest.
In July 2007, we issued $225.0 million in principal amount of our 0.75% senior convertible debentures, or the 0.75% debentures, and received net proceeds of $220.1 million. Interest on the 0.75% debentures is payable on February 1 and August 1 of each year, commencing February 1, 2008. The 0.75% debentures will mature on August 1, 2027. Holders may require us to repurchase all or a portion of their 0.75% debentures on each of August 1, 2010, August 1, 2015, August 1, 2020 and August 1, 2025, or if we experience certain types of corporate transactions constituting a fundamental change. Any repurchase of the 0.75% debentures pursuant to these provisions will be for cash at a price equal to 100% of the principal amount of the 0.75% debentures to be repurchased plus accrued and unpaid interest. In addition, we may redeem some or all of the 0.75% debentures on or after August 1, 2010 for cash at a redemption price equal to 100% of the principal amount of the 0.75% debentures to be redeemed plus accrued and unpaid interest. Therefore, the 0.75% debentures will be classified as short-term debt in our Consolidated Balance Sheets beginning on August 1, 2009. See Note 11 of Notes to our Consolidated Financial Statements.
Liquidity
As of December 28, 2008, we had cash and cash equivalents of $202.3 million as compared to $285.2 million as of December 30, 2007. Our cash balances are held in numerous locations throughout the world, including substantial amounts held outside of the U.S. Most of the amounts held outside of the U.S. could be repatriated to the U.S. but, under current law, would be subject to U.S. federal income taxes, less applicable foreign tax credits. We have accrued U.S. federal taxes on the earnings of our foreign subsidiaries except when the earnings are considered indefinitely reinvested outside of the U.S. Repatriation could result in additional U.S. federal income tax payments in future years.
In addition, we had short-term investments and long-term investments of $17.2 million and $23.6 million as of December 28, 2008, respectively, as compared to $105.5 million and $29.1 million as of December 30, 2007, respectively. The decrease in the balance of our cash and cash equivalents, short-term investments and long-term investments as of December 28, 2008 compared to the balance as of December 30, 2007 was due primarily to the liquidation of a substantial portion of our investment portfolio to fund our capital expenditures for our manufacturing capacity expansion.
Of the $26.1 million invested in auction rate securities on December 28, 2008, we have estimated the loss to be approximately $2.5 million and Statements of Operations thereby establishing a new cost basis of $23.6 million for the auction rate securities. If market conditions were to deteriorate even further such that the current fair value were not achievable, we could realize additional impairment losses related to our auction rate securities. As of December 28, 2008, we held five auction rate securities totaling $23.6 million as compared to ten auction rate securities totaling $50.8 million as of December 30, 2007. These auction rate securities are typically over-collateralized and secured by pools of student loans originated under the FFELP and are guaranteed and insured by the U.S. Department of Education. In addition, all auction rate securities held are rated by one or more of the NRSROs as triple-A. Beginning in February 2008, the auction rate securities market experienced a significant increase in the number of failed auctions, resulting from a lack of liquidity, which occurs when sell orders exceed buy orders, and does not necessarily signify a default by the issuer. All auction rate securities invested in at December 28, 2008 and $29.1 million out of $50.8 million invested in auction rate securities at December 30, 2007 have failed to clear at auctions in subsequent periods. For failed auctions, we continue to earn interest on these investments at the maximum contractual rate as the issuer is obligated under contractual terms to pay penalty rates should auctions fail. Historically, failed auctions have rarely occurred, however, such failures could continue to occur in the future. In the event we need to access these funds, we will not be able to do so until a future auction is successful, the issuer redeems the securities, a buyer is found outside of the auction process or the securities mature. Accordingly, auction rate securities at December 28, 2008 and December 30, 2007 totaling $23.6 million and $29.1 million, respectively, are classified as long-term investments on the Consolidated Balance Sheets, because they are not expected to be used to fund current operations and consistent with the stated contractual maturities of the securities.
In the second quarter of fiscal 2008, we sold auction rate securities with a carrying value of $12.5 million for their stated par value of $13.0 million to the issuer of the securities outside of the auction process. On February 4, 2009, we sold an additional auction rate security with a carrying value of $4.5 million on December 28, 2008 for $4.6 million to a third-party outside of the auction process.

59
For the year ended December 30, 2007, the closing price of our class A common stock equaled or exceeded 125% of the $56.75 per share initial effective conversion price governing the 1.25% debentures and the $82.24 per share initial effective conversion price governing the 0.75% debentures, for 20 out of 30 consecutive trading days ending on December 30, 2007. As a result, the market price conversion trigger pursuant to the terms of both debentures was satisfied. As of the first trading day of the first quarter in fiscal 2008, holders of the 1.25% debentures and 0.75% debentures were able to exercise their right to convert the debentures any day in that fiscal quarter. Therefore, since holders of the 1.25% debentures and 0.75% debentures were able to exercise their right to convert the debentures in the first quarter of fiscal 2008, we classified the $425.0 million in aggregate convertible debt as short-term debt in our Consolidated Balance Sheets as of December 30, 2007. In addition, we wrote off $8.2 million and $1.0 million of unamortized debt issuance costs in the fourth quarter of fiscal 2007 and first quarter of fiscal 2008, respectively. No holders of the 1.25% debentures and 0.75% debentures exercised their right to convert the debentures in the first quarter of fiscal 2008.
For the quarter ended September 28, 2008, the closing price of our class A common stock equaled or exceeded $70.94, or 125% of the applicable conversion price for our 1.25% debentures, for 20 out of 30 consecutive trading days ending on September 28, 2008, thus satisfying the market price conversion trigger pursuant to the terms of the 1.25% debentures. During the fourth quarter in fiscal 2008, holders of the 1.25% debentures were able to exercise their right to convert the debentures any day in that fiscal quarter. As of December 28, 2008, we received notices for the conversion of approximately $1.4 million of the 1.25% debentures which we have settled for approximately $1.2 million in cash and 1,000 shares of class A common stock.
Because the closing price of our class A common stock on at least 20 of the last 30 trading days during the fiscal quarter ended December 28, 2008 did not equal or exceed $70.94, or 125% of the applicable conversion price for our 1.25% debentures, and $102.80, or 125% of the applicable conversion price governing our 0.75% debentures, holders of both debentures are unable to exercise their right to convert the debentures, based on the market price conversion trigger, any day in the first quarter of fiscal 2009, which began on December 29, 2008. Accordingly, we classified the $423.6 million in aggregate convertible debt as long-term debt in our Consolidated Balance Sheets as of December 28, 2008. This test is repeated each fiscal quarter, therefore, if the market price conversion trigger is satisfied in a subsequentquarter, the debentures may again be re-classified as short-term debt. See Note 11 of Notes to our Consolidated Financial Statements.
In addition, the holders of our 1.25% debentures and 0.75% debentures would be able to exercise their right to convert the debentures during the five consecutive business days immediately following any five consecutive trading days in which the trading price of our senior convertible debentures is less than 98% of the average of the closing sale price of a share of class A common stock during the five consecutive trading days, multiplied by the applicable conversion rate. On December 28, 2008, our 1.25% debentures and 0.75% debentures traded significantly below their historic trading prices. If the trading prices of our debentures continue to decline, holders of the debentures may have the right to convert the debentures in the future.
We believe that our current cash and cash equivalents, cash generated from operations, and funds available from the credit agreement with Wells Fargo and facility agreement with the Malaysian Government will be sufficient to meet our working capital and capital expenditure commitments for at least the next 12 months. However, there can be no assurance that our liquidity will be adequate over time. For instance, we expect to continue to make significant capital expenditures in our manufacturing facilities, including through building purchases or long-term leases, and, in May 2008, we announced plans to construct FAB3 which will be located in Malaysia. We expect total capital expenditures in the range of $350 million to $400 million in 2009 as we continue to increase our solar cell and solar panel manufacturing capacity in the Philippines and Malaysia. These expenditures would be greater if we decide to bring capacity on line more rapidly. If our capital resources are insufficient to satisfy our liquidity requirements, we may seek to sell additional equity securities or debt securities or obtain other debt financing. However, after the tax-free distribution of our shares by Cypress on September 29, 2008, our ability to sell additional equity securities to obtain additional financing is limited before triggering our obligation to indemnify Cypress for taxes relating to the distribution of our class B common stock. The sale of additional equity securities or convertible debt securities would result in additional dilution to our stockholders and may not be available on favorable terms or at all, particularly in light of the current crises in the financial and credit markets. Additional debt would result in increased expenses and would likely impose new restrictive covenants like the covenants under the credit agreement with Wells Fargo. Financing arrangements may not be available to us, or may not be available in amounts or on terms acceptable to us.

60
We expect to experience growth in our operating expenses, including our research and development, sales and marketing and general and administrative expenses, for the foreseeable future to execute our business strategy. We may also be required to purchase polysilicon in advance to secure our wafer supplies or purchase third-party solar panels and materials in advance to support systems projects. We intend to fund these activities with existing cash and cash equivalents, cash generated from operations and, if necessary, borrowings under our credit agreement with Wells Fargo. These anticipated increases in operating expenses may not result in an increase in our revenue and our anticipated revenue may not be sufficient to support these increased expenditures. We anticipate that operating expenses, working capital and capital expenditures will constitute a significant use of our cash resources.
Contractual Obligations
The following summarizes our contractual obligations at December 28, 2008:
Payments Due by Period
(In thousands) Total 2009 2010 2011
2012 2013
Beyond2013
Customer advances, including interest $ 111,440 $ 19,800 $ 27,640 $ 16,000 $ 48,000
Loan from Malaysian Government 54,598 54,598 Convertible debt, including interest 499,965 4,170 8,340 8,340 479,115 Lease commitments 41,970 5,502 8,935 5,997 21,536 Utility obligations 750 750 Royalty obligations 585 585 Non-cancelable purchase orders 113,127 112,477 650 Purchase commitments under
agreements 3,253,823 344,009 1,051,213 568,218 1,290,383 Total $ 4,076,258 $ 486,543 $ 1,096,778 $ 598,555 $ 1,894,382
Customer advances and interest on customer advances relate to advance payments received from customers for future purchases of solar power products. Loan from the Malaysian Government relates to amounts borrowed for the financing and operation of FAB3 to be constructed in Malaysia. Convertible debt and interest on convertible debt relate to the aggregate of $423.6 million in principal amount of our senior convertible debentures. For the purpose of the table above, we assume that all holders of the convertible debt will hold the debentures through the date of maturity in fiscal 2027 and upon conversion, the values of the convertible debt are equal to the aggregate principal amount of $423.6 million with no premiums. Lease commitments primarily relate to our 5-year lease agreement with Cypress for our headquarters in San Jose, California, an 11-year lease agreement with an unaffiliated third-party for our administrative, research and development offices in Richmond, California and other leases for various office space. Utility obligations relate to our 11-year lease agreement with an unaffiliated third-party for our administrative, research and development offices in Richmond, California. Royalty obligations result from several of the Systems Segment government awards and existing agreements. Non-cancelable purchase orders relate to purchases of raw materials for inventory, services and manufacturing equipment from a variety of vendors. Purchase commitments under agreements relate to arrangements entered into with suppliers of polysilicon, ingots, wafers, solar cells and solar panels as well as agreements to purchase solar renewable energy certificates from solar installation owners in New Jersey. These agreements specify future quantities and pricing of products to be supplied by the vendors for periods up to eleven years and there are certain consequences, such as forfeiture of advanced deposits and liquidated damages relating to previous purchases, in the event that we terminate the arrangements.

61
As of December 28, 2008 and December 30, 2007, total liabilities associated with uncertain tax positions under FIN 48 were $12.8 million and $4.1 million, respectively, and are included in other long-term liabilities on our Consolidated Balance Sheets at December 28, 2008 and December 30, 2007, respectively, as they are not expected to be paid within the next twelve months. Due to the complexity and uncertainty associated with our tax positions, we cannot make a reasonably reliable estimate of the period in which cash settlement will be made for our liabilities associated with uncertain tax positions in other long-term liabilities, therefore, they have been excluded from the table above. See Note 9 of Notes to our Consolidated Financial Statements.
Polysilicon Supply Agreement
In January 2009, we entered into a polysilicon supply agreement with Hemlock Semiconductor Corporation, or Hemlock. The agreement provides the general terms and conditions pursuant to which we will purchase, on a firm commitment basis, fixed annual quantities of polysilicon at specified prices from 2011 through 2020. Under the agreement, we are required to make prepayments to Hemlock of $14.5 million in 2009, $101.8 million in 2010, $101.8 million in 2011, and $72.7 million in 2012, and such prepayments will be credited against future deliveries of polysilicon to us. We expect to supply the polysilicon to third-parties that will manufacture ingots and wafers for us using such polysilicon. The aggregate quantity of polysilicon to be purchased over the term of the agreement is expected to support approximate 3.5 gigawatts of solar cell manufacturing production based on our expected silicon utilization during such period.
Off-Balance-Sheet Arrangements
As of December 28, 2008, we did not have any significant off-balance-sheet arrangements, as defined in Item 303(a)(4)(ii) of SEC Regulation S-K.
Recent Accounting Pronouncements
See Note 1 of Notes to our Consolidated Financial Statements for a description of certain other recent accounting pronouncements including the expected dates of adoption and effects on our results of operations and financial condition.
ITEM 7A: QUANTITATIVE AND QUALITATIVE DISCLOSURES ABOUT MARKET RISK
Interest Rate Risk
We are exposed to interest rate risk because many of our customers depend on debt financing to purchase our solar power systems. An increase in interest rates could make it difficult for our customers to secure the financing necessary to purchase our solar power systems on favorable terms, or at all, and thus lower demand for our solar power products, reduce revenue and adversely impact our operating results. An increase in interest rates could lower a
er systems, which, in each case, could cause our customers to seek alternative investments that promise higher returns or demand higher returns from our solar power systems, reduce gross margin and adversely impact our operating results. This risk is becoming more significant to our Systems Segment, which is placing increasing reliance upon direct sales to financial institutions which sell electricity to end customers under a power purchase agreement. This sales model is highly sensitive to interest rate fluctuations and the availability of liquidity, and would be adversely affected by increases in interest rates or liquidity constraints.
In addition, our investment portfolio consists of a variety of financial instruments that exposes us to interest rate risk, including, but not limited to, money market funds, bank notes, commercial paper and corporate securities. These investments are generally classified as available-for-sale and, consequently, are recorded on our balance sheet at fair market value with their related unrealized gain or loss reflected as a component of accumulated other comprehensive
-term nature of our investment portfolio, we do not believe that an immediate 10% increase in interest rates would have a material effect on the fair market value of our portfolio. Since we believe we have the ability to liquidate this portfolio, we do not expect our operating results or cash flows to be materially affected to any significant degree by a sudden change in market interest rates on our investment portfolio.
62
Reserve Funds
At December 28, 2008, we had $7.2 million invested in Reserve Funds. The net asset value per share for the Reserve Funds fell below $1.00 because the funds had investments in Lehman, which filed for bankruptcy on September 15, 2008. As a result of this event, the Reserve Funds wrote down their investments in Lehman to zero. We have estimated our loss on the Reserve Funds to be approximately $1.0 million based on an evaluation of the fair value of the securities held by the Reserve Funds and the net asset value that was last published by the Reserve Funds before the
our Consolidated Statements of Operations, thereby establishing a new cost basis for each fund.
On January 30, 2009 and February 20, 2009, we received a distribution of $2.1 million and $1.6 million, respectively, from the Reserve Funds. We expect that the remaining distribution of $3.5 million from the Reserve Funds will occur over the remaining nine months as the investments held in the funds mature. While we expect to receive substantially all of our current holdings in the Reserve Funds within the next nine months, it is possible we may encounter difficulties in receiving distributions given the current credit market conditions. If market conditions were to deteriorate even further such that the current fair value were not achievable, we could realize additional losses in our holdings with the Reserve Funds and distributions could be further delayed. See Note 6 of Notes to our Consolidated Financial Statements.
Auction Rate Securities
Auction rate securities are variable rate debt instruments with interest rates that, unless they fail to clear at
generally are between 20 to 30 years. The auction rate securities are classified as available for sale under SFAS No. 115 and are recorded at fair value. Typically, the carrying value of auction rate securities approximates fair value due to the frequent resetting of the interest rates. Of the $26.1 million invested in auction rate securities on December 28, 2008, we have estimated the loss to be approximately $2.5 million and we recorded an impairment charge of $2.5 million in
million for the auction rate securities. If market conditions were to deteriorate even further such that the current fair value were not achievable, we could realize additional impairment losses related to our auction rate securities. All auction rate securities invested in at December 28, 2008 and $29.1 million out of $50.8 million invested in auction rate securities at December 30, 2007 have failed to clear at auctions in subsequent periods. These auction rate securities are typically over-collateralized and secured by pools of student loans originated under the FFELP and are guaranteed and insured by the U.S. Department of Education. In addition, all auction rate securities held are rated by one or more of the NRSROs as triple-A. We continue to earn interest on these investments at the maximum contractual rate as the issuer is obligated under contractual terms to pay penalty rates should auctions fail. In the second quarter of fiscal 2008, we sold auction rate securities with a carrying value of $12.5 million for their stated par value of $13.0 million to the issuer of the securities outside of the auction process. On February 4, 2009, we sold an additional auction rate security with a carrying value of $4.5 million on December 28, 2008 for $4.6 million to a third-party outside of the auction process. See Note 6 of Notes to our Consolidated Financial Statements. We will continue to analyze our auction rate securities each reporting period for impairment and may be required to record additional impairment charges if the issuer of the auction rate securities is unable to successfully close future auctions or does not redeem the securities.
Convertible Debt
The fair market value of our 1.25% debentures and 0.75% debentures is subject to interest rate risk, market price risk and other factors due to the convertible feature of the debentures. The fair market value of the debentures will generally increase as interest rates fall and decrease as interest rates rise. In addition, the fair market value of the debentures will generally increase as the market price of our common stock increases and decrease as the market price falls. The interest and market value changes affect the fair market value of the debentures but do not impact our financial position, cash flows or results of operations due to the fixed nature of the debt obligations. As of December 28, 2008 and December 30, 2007, the estimated fair value of the debentures was approximately $310.7 million and $831.9 million, respectively, based on quoted market prices as reported by Bloomberg. A 10% increase in quoted market prices would increase the estimated fair value of the debentures to approximately $341.8 million and $915.1 million as of December 28, 2008 and December 30, 2007, respectively, and a 10% decrease in the quoted market prices would decrease the estimated fair value of the debentures to $279.7 million and $748.7 million, respectively.
63
Investments in Non-Public Companies
Our investments held in non-public companies expose us to equity price risk. As of December 28, 2008, non-publicly traded investments of $3.1 million are accounted for using the cost method and $29.0 million are accounted for using the equity method. As of December 30, 2007, non-publicly traded investments of $5.3 million were accounted for using the equity method. These strategic investments in third-parties are subject to risk of changes in market value, which if determined to be other-than-temporary, could result in realized impairment losses. We generally do not attempt to reduce or eliminate our market exposure in these cost and equity method investments. We regularly monitor these non-publicly traded investments for impairment and record reductions in the carrying values when necessary. Circumstances that indicate an other-than-temporary decline include valuation ascribed to the issuing company in subsequent financing rounds, decreases in quoted market price and declines in operations of the issuer. During fiscal 2008, we recorded an other-than-temporary impairment charge of $1.9 million in our Consolidated Statements of Operations related to our non-publicly traded investment accounted for using the cost method, due to the recent deterioration of the credit market and economic environment. If the recent credit market conditions continue or worsen, we may be required to record an additional impairment charge, which could be material. There can be no assurance that our cost and equity method investments will not face additional risks of loss. See Note 6 and 10 of Notes to our Consolidated Financial Statements.
Foreign Currency Exchange Risk
Our exposure to adverse movements in foreign currency exchange rates is primarily related to sales to European customers that are denominated in Euros. Revenue generated from European customers represented approximately 57%, 50% and 58% of our total revenue for fiscal 2008, 2007 and 2006, respectively. A 10% change in the Euro exchange rate would have impacted our revenue by $72.0 million, $35.9 million and $13.8 million in fiscal 2008, 2007 and 2006, respectively. In connection with our global tax planning, we recently changed the functional currency of certain European subsidiaries from U.S. dollar to Euro, resulting in greater exposure to changes in the value of the Euro. Implementation of this tax strategy had, and will continue to have, the ancillary effect of limiting our ability to fully hedge certain Euro-denominated revenue. From December 28, 2008 to February 13, 2009, the exchange rate to convert one Euro to U.S. dollars decreased from approximately $1.40 to $1.29. This decrease in the value of the Euro relative to the U.S. dollar is expected to have an adverse impact on our revenue, gross margin and profitability in the foreseeable future.
In the past, we have experienced an adverse impact on our revenue, gross margin and profitability as a result of foreign currency fluctuations. When foreign currencies appreciate against the U.S. dollar, inventory and expenses denominated in foreign currencies become more expensive. Strengthening of the Korean Won against the U.S. dollar could result in a foreign currency translation loss by our joint venture, Woongjin Energy, which in turn negatively impacts our equity in earnings of the unconsolidated investee. In addition, strengthening of the Malaysian Ringgit against the U.S. dollar will increase our liability under the facility agreement with the Malaysian Government. An increase in the value of the U.S. dollar relative to foreign currencies could make our solar power products more expensive for international customers, thus potentially leading to a reduction in demand, our sales and profitability. Furthermore, many of our competitors are foreign companies that could benefit from such a currency fluctuation, making it more difficult for us to compete with those companies. We currently conduct hedging activities which involve the use of option and forward contracts to address our exposure to changes in the foreign exchange rate between the U.S. dollar and other currencies. As of December 28, 2008, we held option and forward contracts totaling $147.5 million and $431.1 million, respectively. As of December 30, 2007, we held forward contracts totaling $202.8 million. We have experienced losses on derivatives and foreign exchange, net of tax of $20.6 million in fiscal 2008 largely due to the volatility in the current markets as compared to gains of $2.1 million and $0.9 million in fiscal 2007 and 2006, respectively. We cannot predict the impact of future exchange rate fluctuations on our business and operating results. In the past, we have experienced an adverse impact on our revenue and profitability as a result of foreign currency fluctuations. We believe that we may have increased risk associated with currency fluctuations in the future.

64
ITEM 8: FINANCIAL STATEMENTS AND SUPPLEMENTARY DATA
SUNPOWER CORPORATION
INDEX TO CONSOLIDATED FINANCIAL STATEMENTS
Page
REPORT OF INDEPENDENT REGISTERED PUBLIC ACCOUNTING FIRM 65 FINANCIAL STATEMENTS
CONSOLIDATED BALANCE SHEETS 66 CONSOLIDATED STATEMENTS OF OPERATIONS 67 CONSOLIDATED STATEMENTS 68 CONSOLIDATED STATEMENTS OF COMPREHENSIVE INCOME 69 CONSOLIDATED STATEMENTS OF CASH FLOWS 70 NOTES TO CONSOLIDATED FINANCIAL STATEMENTS 71 SCHEDULE II VALUATION AND QUALIFYING ACCOUNTS 128

65
Report of Independent Registered Public Accounting Firm
To the Board of Directors and Stockholders of SunPower Corporation:
In our opinion, the consolidated financial statements listed in the accompanying index appearing under Item 8 present fairly, in all material respects, the financial position of SunPower Corporation and its subsidiaries (the
each of the three years in the period ended December 28, 2008 in conformity with accounting principles generally accepted in the United States of America. In addition, in our opinion, the financial statement schedule listed in the accompanying index appearing under Item 8 presents fairly, in all material respects, the information set forth therein when read in conjunction with the related consolidated financial statements. Also in our opinion, the Company maintained, in all material respects, effective internal control over financial reporting as of December 28, 2008, based on criteria established in Internal Control - Integrated Framework issued by the Committee of Sponsoring Organizations of the Treadway Commission (COSO). The Company's management is responsible for these financial statements and financial statement schedule, for maintaining effective internal control over financial reporting and for its assessment of
Financial Reporting appearing under Item 9A. Our responsibility is to express opinions on these financial statements, on the financial statement schedule, and on the Company's internal control over financial reporting based on our integrated audits. We conducted our audits in accordance with the standards of the Public Company Accounting Oversight Board (United States). Those standards require that we plan and perform the audits to obtain reasonable assurance about whether the financial statements are free of material misstatement and whether effective internal control over financial reporting was maintained in all material respects. Our audits of the financial statements included examining, on a test basis, evidence supporting the amounts and disclosures in the financial statements, assessing the accounting principles used and significant estimates made by management, and evaluating the overall financial statement presentation. Our audit of internal control over financial reporting included obtaining an understanding of internal control over financial reporting, assessing the risk that a material weakness exists, and testing and evaluating the design and operating effectiveness of internal control based on the assessed risk. Our audits also included performing such other procedures as we considered necessary in the circumstances. We believe that our audits provide a reasonable basis for our opinions.
As discussed in Note 12 to the consolidated financial statements, the Company changed the manner in which it accounts for uncertain tax positions in 2007.
esigned to provide reasonable assurance regarding the reliability of financial reporting and the preparation of financial statements for external purposes in accordance with generally accepted accounting principles. ial reporting includes those policies and procedures that (i) pertain to the maintenance of records that, in reasonable detail, accurately and fairly reflect the transactions and dispositions of the assets of the company; (ii) provide reasonable assurance that transactions are recorded as necessary to permit preparation of financial statements in accordance with generally accepted accounting principles, and that receipts and expenditures of the company are being made only in accordance with authorizations of management and directors of the company; and (iii) provide reasonable assurance regarding prevention or timely
financial statements.
Because of its inherent limitations, internal control over financial reporting may not prevent or detect misstatements. Also, projections of any evaluation of effectiveness to future periods are subject to the risk that controls may become inadequate because of changes in conditions, or that the degree of compliance with the policies or procedures may deteriorate.
/s/ PricewaterhouseCoopers LLP
San Jose, California February 25, 2009

66
SunPower Corporation
Consolidated Balance Sheets(In thousands, except share and per share data)
December 28,
2008 December 30,
2007Assets Current assets:
Cash and cash equivalents $ 202,331 $ 285,214 Restricted cash, current portion 13,240 Short-term investments 17,179 105,453 Accounts receivable, net 194,222 138,250 Costs and estimated earnings in excess of billings 30,326 39,136 Inventories 251,388 148,820 Advances to suppliers, current portion 43,190 52,277 Prepaid expenses and other current assets 96,104 33,110
Total current assets 847,980 802,260 Restricted cash, net of current portion 162,037 67,887 Long-term investments 23,577 29,050 Property, plant and equipment, net 612,687 377,994 Goodwill 196,720 184,684 Intangible assets, net 39,490 50,946 Advances to suppliers, net of current portion 119,420 108,943 Other long-term assets 74,224 31,974 Total assets $ 2,076,135 $ 1,653,738
Current liabilities:
Accounts payable $ 263,241 $ 124,723 Accrued liabilities 157,049 79,434 Billings in excess of costs and estimated earnings 11,806 69,900 Customer advances, current portion 19,035 9,250 Convertible debt, current portion 425,000
Total current liabilities 451,131 708,307 Long-term debt 54,598 Convertible debt, net of current portion 423,608 Deferred tax liability, net of current portion 8,115 6,213 Customer advances, net of current portion 91,359 60,153 Other long-term liabilities 25,950 14,975 Total liabilities 1,054,761 789,648 Commitments and Contingencies (Note 9)
Preferred stock, $0.001 par value, 10,042,490 shares authorized; none issued and
outstanding Common stock, $0.001 par value, 217,500,000 shares of class A common stock
authorized; $0.001 par value, 150,000,000 shares and 157,500,000 shares of class B common stock authorized; 44,055,644 and 40,289,719 shares of class A common stock issued; 43,849,566 and 40,176,957 shares of class A common stock outstanding; 42,033,287 and 44,533,287 shares of class B common stock issued and outstanding, at December 28, 2008 and December 30, 2007, respectively 86 85
Additional paid-in capital 1,003,954 883,033 Accumulated other comprehensive income (loss) (25,611) 5,762 Retained earnings (deficit) 51,602 (22,815 )
1,030,031 866,065 Less: shares of class A common stock held in treasury, at cost; 206,078 and 112,762 shares
at December 28, 2008 and December 30, 2007, respectively (8,657) (1,975 ) 1,021,374 864,090 $ 2,076,135 $ 1,653,738
The accompanying notes are an integral part of these financial statements.

67
SunPower Corporation
Consolidated Statements of Operations(In thousands, except per share data)
Year Ended
December 28,
2008 December 30,
2007 December 31,
2006Revenue:
Systems $ 820,632 $ 464,178 $Components 614,287 310,612 236,510
Total revenue 1,434,919 774,790 236,510 Costs and expenses:
Cost of systems revenue 653,569 386,511 Cost of components revenue 417,669 240,475 186,042 Research and development 21,474 13,563 9,684Sales, general and administrative 173,740 108,256 21,677 Purchased in-process research and development 9,575 Impairment of acquisition-related intangible assets 14,068
Total costs and expenses 1,266,452 772,448 217,403 Operating income 168,467 2,342 19,107 Other income (expense):
Interest income 10,789 13,882 10,086 Interest expense (4,387) (5,071) (1,809 )Other, net (27,285) (7,593) 1,077
Other income (expense), net (20,883) 1,218 9,354Income before income taxes and equity in earnings of
unconsolidated investees 147,584 3,560 28,461 Income tax provision (benefit) 69,368 (5,920) 1,945
Income before equity in earnings of unconsolidated investees 78,216 9,480 26,516 Equity in earnings of unconsolidated investees, net of taxes 14,077 (278)
Net income $ 92,293 $ 9,202 $ 26,516 Net income per share of class A and class B common stock:
Basic $ 1.15 $ 0.12 $ 0.40 Diluted $ 1.09 $ 0.11 $ 0.37
Weighted-average shares:
Basic 80,522 75,413 65,864 Diluted 84,446 81,227 71,087
The accompanying notes are an integral part of these financial statements.

68
SunP
ower
Cor
pora
tion
(In
thou
sand
s)
Cla
ss A
and
Cla
ss B
C
omm
on S
tock
Shar
es
V
alue
Add
ition
al
Paid
-inC
apita
l
T
reas
ury
Stoc
k
Acc
umul
ated
Oth
erC
ompr
ehen
sive
Inco
me
(Los
s)
Ret
aine
dE
arni
ngs
(Def
icit)
Tot
al
Equ
ityB
alan
ces a
t Jan
uary
1, 2
006
61,0
92$
61$
316,
617
$$
505
$(5
8,53
3)$
258,
650
Issu
ance
of c
omm
on st
ock
upon
exe
rcis
e of
opt
ions
1,52
9
2
3,86
7
3,86
9 Is
suan
ce o
f res
trict
ed st
ock
to e
mpl
oyee
s, ne
t of c
ance
llatio
ns22
8
Issu
ance
of c
omm
on st
ock
in re
latio
n to
follo
w-o
n of
ferin
g, n
et o
f offe
ring
expe
nses
7,00
0
7
197,
424
19
7,43
1 St
ock-
base
d co
mpe
nsat
ion
expe
nse
4,91
1
4,91
1 N
et u
nrea
lized
loss
on
deriv
ativ
es a
nd in
vest
men
ts, n
et o
f tax
(2
,606
)
(2
,606
)N
et in
com
e
26
,516
26,5
16
Bal
ance
s at D
ecem
ber
31, 2
006
69,8
49
70
522,
819
(2
,101
)
(32,
017)
48
8,77
1Is
suan
ce o
f com
mon
stoc
k up
on e
xerc
ise
of o
ptio
ns2,
817
3
8,
718
8,
721
Issu
ance
of r
estri
cted
stoc
k to
em
ploy
ees,
net o
f can
cella
tions
608
Is
suan
ce o
f com
mon
stoc
k in
rela
tion
to fo
llow
-on
offe
ring,
net
of o
fferin
g ex
pens
es2,
695
3
16
7,37
6
167,
379
Issu
ance
of c
omm
on st
ock
in re
latio
n to
shar
e le
ndin
g ar
rang
emen
ts4,
747
5
5Is
suan
ce o
f com
mon
stoc
k fo
r pur
chas
e ac
quisi
tion
4,10
7
4
111,
262
11
1,26
6 St
ock
optio
ns a
ssum
ed in
rela
tion
to a
cqui
sitio
n
21
,280
21,2
80
Stoc
k-ba
sed
com
pens
atio
n ex
pens
e
51
,578
51,5
78
Purc
hase
s of t
reas
ury
stoc
k(1
13)
(1
,975
)
(1
,975
)C
umul
ativ
e tra
nsla
tion
adju
stmen
t, ne
t of t
ax
9,74
6
9,
746
Net
unr
ealiz
ed lo
ss o
n de
rivat
ives
and
inve
stm
ents
, net
of t
ax
(1,8
83)
(1,8
83 )
Net
inco
me
9,20
2
9,20
2 B
alan
ces a
t Dec
embe
r 30
, 200
784
,710
85
88
3,03
3
(1,9
75)
5,76
2
(22,
815)
86
4,09
0Is
suan
ce o
f com
mon
stoc
k up
on e
xerc
ise
of o
ptio
ns1,
129
1
5,
127
5,
128
Issu
ance
of r
estri
cted
stoc
k to
em
ploy
ees,
net o
f can
cella
tions
96
Issu
ance
of c
omm
on st
ock
for p
urch
ase
acqu
isitio
n40
3,05
4
3,05
4 Is
suan
ce o
f com
mon
stoc
k fo
r con
vers
ion
of c
onve
rtibl
e de
bt1
40
40
Ex
cess
tax
bene
fits f
rom
stoc
k-ba
sed
awar
d ac
tivity
41,5
24
41
,524
St
ock-
base
d co
mpe
nsat
ion
expe
nse
71,1
76
71
,176
D
istri
butio
n to
Cyp
ress
und
er ta
x sh
arin
g ag
reem
ent
(17,
876 )
(1
7,87
6 )Pu
rcha
ses o
f tre
asur
y st
ock
(93)
(6
,682
)
(6
,682
)C
umul
ativ
e tra
nsla
tion
adju
stmen
t, ne
t of t
ax
(9,2
64)
(9,2
64 )
Net
unr
ealiz
ed lo
ss o
n de
rivat
ives
and
inve
stm
ents
, net
of t
ax
(22,
109)
(22,
109 )
Net
inco
me
92,2
93
92
,293
B
alan
ces a
t Dec
embe
r 28
, 200
885
,883
$86
$1,
003,
954
$(8
,657
)$
(25,
611)
$51
,602
$1,
021,
374
The
acco
mpa
nyin
g no
tes a
re a
n in
tegr
al p
art o
f the
se fi
nanc
ial s
tate
men
ts.

69
SunPower Corporation
Consolidated Statements of Comprehensive Income(In thousands)
Year Ended
December 28,
2008 December 30,
2007 December 31,
2006Net income $ 92,293 $ 9,202 $ 26,516 Other comprehensive income:
Cumulative translation adjustment, net of tax (9,264 ) 9,746 Unrealized loss on derivatives, net of tax (22,145 ) (1,843 ) (2,602 )Unrealized gain (loss) on investments, net of tax 36 (40 ) (4 )
Total comprehensive income $ 60,920 $ 17,065 $ 23,910
The accompanying notes are an integral part of these financial statements.
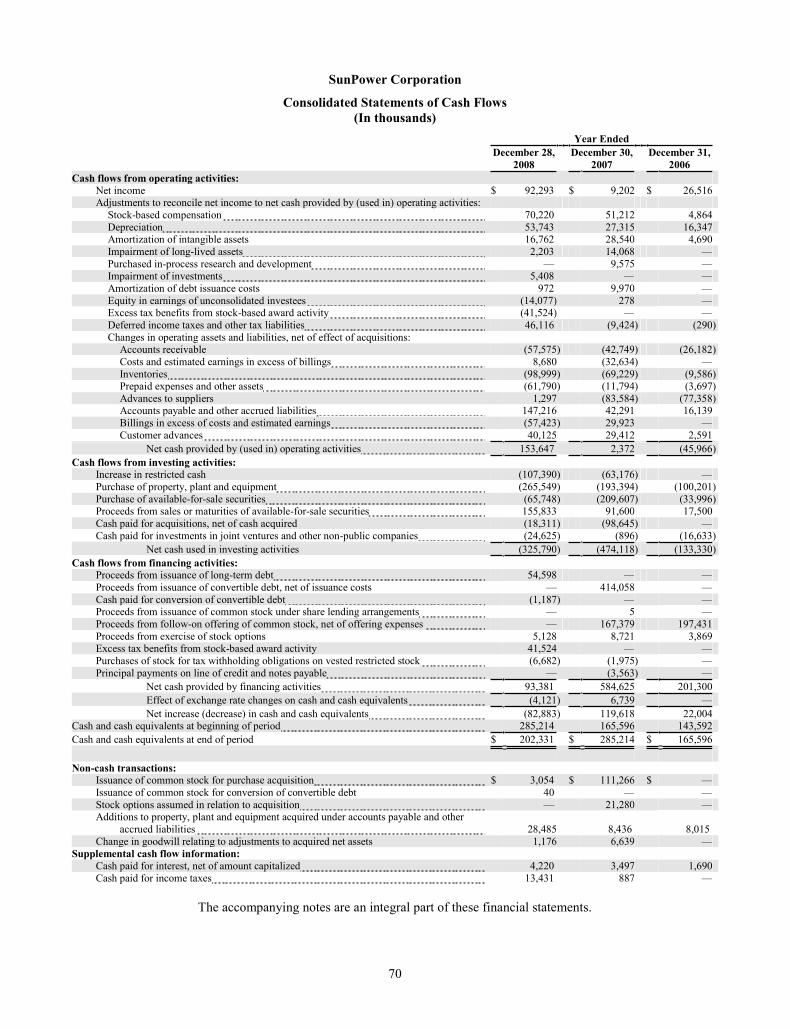
70
SunPower Corporation
Consolidated Statements of Cash Flows(In thousands)
Year Ended
December 28,
2008 December 30,
2007 December 31,
2006Cash flows from operating activities: Net income $ 92,293 $ 9,202 $ 26,516 Adjustments to reconcile net income to net cash provided by (used in) operating activities:
Stock-based compensation 70,220 51,212 4,864 Depreciation 53,743 27,315 16,347 Amortization of intangible assets 16,762 28,540 4,690 Impairment of long-lived assets 2,203 14,068 Purchased in-process research and development 9,575 Impairment of investments 5,408 Amortization of debt issuance costs 972 9,970 Equity in earnings of unconsolidated investees (14,077) 278 Excess tax benefits from stock-based award activity (41,524) Deferred income taxes and other tax liabilities 46,116 (9,424) (290 )
Changes in operating assets and liabilities, net of effect of acquisitions: Accounts receivable (57,575) (42,749) (26,182 )
Costs and estimated earnings in excess of billings 8,680 (32,634) Inventories (98,999) (69,229) (9,586 )Prepaid expenses and other assets (61,790) (11,794) (3,697 )Advances to suppliers 1,297 (83,584) (77,358 )Accounts payable and other accrued liabilities 147,216 42,291 16,139 Billings in excess of costs and estimated earnings (57,423) 29,923 Customer advances 40,125 29,412 2,591
Net cash provided by (used in) operating activities 153,647 2,372 (45,966 )Cash flows from investing activities:
Increase in restricted cash (107,390) (63,176) Purchase of property, plant and equipment (265,549) (193,394) (100,201 )Purchase of available-for-sale securities (65,748) (209,607) (33,996 )Proceeds from sales or maturities of available-for-sale securities 155,833 91,600 17,500 Cash paid for acquisitions, net of cash acquired (18,311) (98,645) Cash paid for investments in joint ventures and other non-public companies (24,625) (896) (16,633 )
Net cash used in investing activities (325,790) (474,118) (133,330 )Cash flows from financing activities:
Proceeds from issuance of long-term debt 54,598 Proceeds from issuance of convertible debt, net of issuance costs 414,058 Cash paid for conversion of convertible debt (1,187) Proceeds from issuance of common stock under share lending arrangements 5 Proceeds from follow-on offering of common stock, net of offering expenses 167,379 197,431 Proceeds from exercise of stock options 5,128 8,721 3,869 Excess tax benefits from stock-based award activity 41,524 Purchases of stock for tax withholding obligations on vested restricted stock (6,682) (1,975) Principal payments on line of credit and notes payable (3,563)
Net cash provided by financing activities 93,381 584,625 201,300 Effect of exchange rate changes on cash and cash equivalents (4,121) 6,739 Net increase (decrease) in cash and cash equivalents (82,883) 119,618 22,004 Cash and cash equivalents at beginning of period 285,214 165,596 143,592 Cash and cash equivalents at end of period $ 202,331 $ 285,214 $ 165,596 Non-cash transactions: Issuance of common stock for purchase acquisition $ 3,054 $ 111,266 $ Issuance of common stock for conversion of convertible debt 40 Stock options assumed in relation to acquisition 21,280
Additions to property, plant and equipment acquired under accounts payable and other accrued liabilities 28,485 8,436 8,015
Change in goodwill relating to adjustments to acquired net assets 1,176 6,639 Supplemental cash flow information: Cash paid for interest, net of amount capitalized 4,220 3,497 1,690 Cash paid for income taxes 13,431 887
The accompanying notes are an integral part of these financial statements.

71
SunPower Corporation
Notes to Consolidated Financial Statements
Note 1. THE COMPANY AND SUMMARY OF SIGNIFICANT ACCOUNTING POLICIES
The Company
markets high-manufactured using proprietary processes, and our technologies are based on more than 15 years of research and
In November 2005, the Company raised net proc8.8 million shares of class A common stock at a price of $18.00 per share. In June 2006, the Company completed a follow-on public offering of 7.0 million shares of its class A common stock, at a per share price of $29.50, and received net proceeds of $197.4 million. In July 2007, the Company completed a follow-on public offering of 2.7 million shares of its class A common stock, at a discounted per share price of $64.50, and received net proceeds of $167.4 million.
In February 2007, the Company issued $200.0 million in principal amount of its 1.25% senior convertible
common stock to convertible debentures in February 2007 were $194.0 million. The Company did not receive any proceeds from the approximate 2.9 million loaned shares of its class A common stock, but received a nominal lending fee. On September
bankruptcy code, and LBIE commenced administration proceedings (analogous to bankruptcy) in the United Kingdom (see Note 11). In July 2007, the Company issued $225.0 million in principal amount of its 0.75% senior convertible
res of its
debentures in July 2007 were $220.1 million. The Company did not receive any proceeds from the approximate 1.8 million loaned shares of class A common stock, but received a nominal lending fee (see Note 11).
privately-held company which developed, engineered, manufactured and delivered large-scale solar power systems for residential, commercial, government and utility customers worldwide. These activities are now performed by the
-owned subsidiary of
then-outstanding class B common stock. On May 4, 2007 and August 18, 2008, Cypress completed the sale of 7.5 miRule 144 of the Securities Act. Such shares converted to 10.0 million shares of class A common stock upon the sale. The Company was a majority-owned subsidiary of Cypress through September 29, 2008. After the close of trading on the
29, 2008, Cypress completed a spin-off of all of its shares of the rata dividend to the holders of record as of September 17, 2008
ee Note 2 for additional information regarding transactions with Cypress.
The Company is subject to a number of risks and uncertainties including, but not limited to, availability of third- l downward pressure on product pricing as new polysilicon manufacturers begin operating and the worldwide supply of solar cells and panels increases, the possible reduction or elimination of government and economic incentives that encourage industry growth, the challenges of achieving its goal to reduce costs of installed solar systems by 50% by 2012 to maintain competitiveness, difficulties in

72
claims.
Summary of Significant Accounting Policies
Principles of Consolidation
The Consolidated Financial Statements are prepared in accordance with accounting principles generally accepted in the United States of America ("United States" or "U.S.") and include the accounts of the Company and all of its subsidiaries. Intercompany transactions and balances have been eliminated in consolidation.
Reclassifications
Certain prior period balances have been reclassified to conform to the current period presentation in the
previously reported results of operations or retained earnings (deficit).
Fiscal Years
The Company reports results of operations on the basis of 52- or 53-week periods, ending on the Sunday closest to December 31. Fiscal 2008 ended on December 28, 2008, fiscal 2007 ended on December 30, 2007 and fiscal 2006 ended on December 31, 2006. Each of fiscal 2008, 2007 and 2006 consisted of 52 weeks.
Management Estimates
The preparation of financial statements in conformity with accounting principles generally accepted in the United assumptions that affect the amounts reported in the
financial statements and accompanying notes. Significant estimates in these financial statements include -of- nd sales returns,
inventory write-downs, estimates for future cash flows and economic useful lives of property, plant and equipment, goodwill, intangible assets and other long-term assets, asset impairments, certain accrued liabilities including accrued warranty reserves, income taxes and tax valuation allowances and investments in joint ventures. Actual results could differ from those estimates.
Fair Value of Financial Instruments
The fair value of a financial instrument is the price that would be received to sell an asset or paid to transfer a liability in an orderly transaction between market participants at the measurement date. The carrying values of cash and cash equivalents, accounts receivable, accounts payable and accrued liabilities approximate their respective fair values due to their short-its estimated fair values. Investments in available-for-sale securities are carried at fair value based on quoted market prices or estimated based on market conditions and risks existing at each balance sheet date. Foreign currency derivatives are carried at fair value based on quoted market prices for financial instruments with similar characteristics. Unrealized
-for-sale securities and foreign currency derivatives are excluded from earnings and reported as a component of other comprehensive income (loss) in the Consolidated Balance Sheets. Additionally, the Company assesses whether an other-than-temporary impairment loss on its available-for-sale securities has occurred due to declines in fair value or other market conditions. Declines in fair value that are considered other-than-
Comprehensive Income
Comprehensive income is defined as the change in equity during a period from non-owner sources. The
-owned foreign subsidiaries whose assets and liabilities are translated from their respective functional currencies at exchange rates in effect at the balance sheet date, and revenues and expenses are translated at average exchange rates prevailing during the applicable period and (iii) changes in unrealized gains or losses, net of tax, for derivatives designated as cash flow hedges (see Note 12) and available-for-sale securities carried at their fair value (see Note 6). Comprehensive income is presented in the Consolidated Statements of

73
Comprehensive Income.
Cash Equivalents
Highly liquid investments with original or remaining maturities of ninety days or less at the date of purchase are considered cash equivalents.
Cash in Restricted Accounts
As of December 28, 2008 and December 30, 2007, the Company provided security for advance payments received in fiscal 2007 from a customer in the form of $20.0 million held in an escrow account, all of which is considered
continuing through 2019, the balance in the escrow account will be reduced as the advance payments are to be applied as
customer to manufacture ingots, and potentially wafers, which are to be sold to the Company under an ingot supply agreement. The funds held in the escrow account may be released at any time in exchange for bank guarantees, letters of credit issued under the collateralized letter of credit facility and/or asset collateralization (see Note 8).
The Company also enters into various contractual agreements to build turnkey photovoltaic projects for customers in Europe, Korea and the United States. As part of the contractual agreements with the customers in Europe and Korea, the Company may receive advance payments that are collateralized by providing letters of credit issued by Wells Fargo
provide construction period letters of credit, to assure the customers of contract completion, for a period of approximately one year. In many cases, the Company is also asked to issue warranty period letters of credit to assure the customers that the Company will meet its warranty obligations, typically for the first two years after the project is installed. The Company issues letters of credit for such purposes through its line of credit facility with Wells Fargo. The credit agreement with Wells Fargo requires the Company to collateralize the full value of letters of credit issued under the collateralized letter of credit facility for such purposes with cash placed in an interest bearing restricted account with Wells Fargo. As long as the collateralized letters of credit are outstanding, the Company will not be able to withdraw the associated funds in the restricted account, though all interest earned on such restricted funds can be withdrawn periodically. As of December 28, 2008 and December 30, 2007, outstanding collateralized letters of credit issued by Wells Fargo totaled $76.5 million and $47.9 million, respectively, of which $67.8 million and $45.4 million, respectively, relate to contractual agreements with customers in Europe and Korea (see Note 11).
In January 2008, the Company entered into an Option Agreemenwhich the Company will deliver cash advance payments to NorSun for the purchase of polysilicon under a long-term polysilicon supply agreement with NorSun. As of December 28, 2008, the Company deposited $16.0 million in an
In addition, the Company entered into a facility agreement with the Malaysian Government on December 18, 2008, in which the Company may borrow up to Malaysian Ringgit 1.0 billion (approximately $287.4 million) to finance the construction of its planned third solar cell manufacturing facility in Malaysia. As of December 28, 2008, the Company borrowed Malaysian Ringgit 190.0 million (approximately $54.6 million) under the facility agreement, all of
e11).
Short-Term and Long-Term Investments
The Company invests in auction rate securities which are carried at their market values. Such securities are bought
issuance of the securities, the interest rate on the securities resets periodically at pre-determined intervals every 7 to 49 days, based on the market demand at the reset period. Historically, all auction rate securities were classified as short-term investments because the Company was able to liquidate these at its discretion at the reset period. When auction rate securities fail to clear at auction and the Company is unable to estimate when the impacted auction rate securities will clear at the next auction, the Company classifies these as long-term consistent with the stated contractual maturities of

74
The Company also invests in money market securities, bank notes, commercial paper and corporate securities with maturities greater than ninety days. In general, investments with original maturities of greater than ninety days and remaining maturities of less than one year are classified as short-term investments. Investments with maturities beyond one year may be classified as short-term based on their highly liquid nature and because such investments represent the investment of cash that is available for current operations. Despite the long-term maturities, the Company has the ability
within its normal operating cycles. The Company has classified these investments as available-for-sale securities under
Inventories
Inventories are stated at the lower of cost or market. Standard cost approximates actual cost on a first-in, first-out basis. The Company routinely evaluates quantities and values of inventory in light of current market conditions and market trends, and records reserves for quantities in excess of demand and product obsolescence. The evaluation may take into consideration historic usage, expected demand, anticipated sales price, new product development schedules, the effect new products might have on the sale of existing products, product obsolescence, customer concentrations, product merchantability and other factors. Market conditions are subject to change and actual consumption of inventory could
has not historically been a significant factor in the valuation of inventories. The Company also regularly reviews the cost of inventory against their estimated market value and records a lower of cost or market reserve for inventories that have a cost in excess of estimated market value. Inventory reserves, once recorded, are not reversed until the inventories have been subsequently disposed of.
Property, Plant and Equipment
Property, plant and equipment are stated at cost, less accumulated depreciation. Depreciation is computed for financial reporting purposes using the straight-line method over the estimated useful lives of the assets as presented below. Leasehold improvements are amortized over the shorter of the estimated useful lives of the assets or the remaining term of the lease. Repairs and maintenance costs are expensed as incurred.
Useful Lives
in Years Building 15 Manufacturing equipment 2 to 7 Computer equipment 2 to 7 Furniture and fixtures 3 to 5 Leasehold improvements 5 to 15
Long-Lived Assets
The Company evaluates its long-lived assets, including property, plant and equipment and intangible assets with finite lives, for impairment whenever events or changes in circumstances indicate that the carrying value of such assets may not be recoverable in accordance with SFAS No. -Lived
underperformance relative to expected historical or projected future operating results, significant changes in the manner of use of acquired assets and significant negative industry or economic trends. Impairments are recognized based on the difference between the fair value of the asset and its carrying value. Fair value is generally measured based on either quoted market prices, if available, or discounted cash flow analyses.
Goodwill and Intangible Assets
The Company accounts for goodwill and other intangible assets in accordance with SFAS No. Goodwill and
are tested for impairment on an annual basis or whenever events or changes in circumstances indicate that the carrying amount of these assets may not be recoverable. The Company performs its annual test of impairment for goodwill in the
75
third quarter of its fiscal year. Intangible assets with finite useful lives are amortized using the straight-line method over their useful lives ranging primarily from one to six years and are reviewed for impairment in accordance with SFAS No. 144 (see Note 4).
Product Warranties
The Company warrants or guarantees the performance of solar panels that the Company manufactures at certain levels of conversion efficiency for extended periods, often as long as 20 years. It also warrants that the solar cells will be free from defects for at least 10 years. In addition, the Company generally provides warranty on systems they install for a period of 5 to 10 years. The Company also passes through to customers long-term warranties from the original equipment manufacturers are standard, while inverters typically carry a 2-, 5- or 10-year warranty. Therefore, the Company maintains warranty
in the form of product replacement or repair. Warranty liabilities and are recognized as a cost of revenue. The Company continuously monitors product returns for warranty failures and maintains a reserve for the related warranty expenses based on historical experience of similar products as well as various other assumptions that are considered reasonable under the circumstances. The warranty reserve includes specific accruals for known product and system issues and an accrual for an estimate of incurred but not reported product and system issues based on historical activity (see Note 9).
Revenue Recognition
Construction Contracts
governed by customer contracts that require the Company to deliver functioning solar power systems and are generally completed within three to nine months from commencement of construction. In addition, the Systems Segment also derives revenues from sales of certain solar power products and services that are smaller in scope than an EPC contract. The Company recognizes revenues from fixed price contracts under American Institute of Certified Public Accountants
- for Performance of Construction-Type and Certain Production- - -of-completion method of accounting. Under this method, systems revenue arising from fixed price construction contracts is recognized as work is performed based on the percentage of incurred costs to estimated total forecasted costs utilizing the most recent estimates of forecasted costs.
In addition to the EPC deliverable, a limited number of arrangements also include multiple deliverables such as post-installation systems monitoring and maintenance and system output performance guarantees. For contracts with separately priced performance guarantees or maintenance, the Company recognizes revenue related to such separately priced elements over the co
-- ees or maintenance contracts not separately priced, the
-- has more than one unit of accounting.
The Company has determined that post-installation systems monitoring and maintenance, and system output performance guarantees qualify as separate units of accounting under EITF 00-21. Such post-installation elements are deferred at the time the contract is executed and are recognized to income over the contractual term under Staff
rcentage-of-completion basis under SOP 81-1.
In addition, when arrangements include contingent revenue clauses such as liquidated damages or customer termination or put rights for non-performance, the Company defers the contingent revenue until such time as the contingencies expire.
Incurred costs include all direct material, labor, subcontract costs, and those indirect costs related to contract performance, such as indirect labor, supplies and tools. Job material costs are included in incurred costs when the job materials have been installed. Revenue is deferred and recognized upon installation, in accordance with the percentage-of-completion method of accounting. Job materials are considered installed materials when they are
76
permanently attached or fitt
Due to inherent uncertainties in estimating cost, job costs estimates are reviewed and/or updated by management working within the Systems Segment. The Systems Segment determines the completed percentage of installed job
-site representative. The completed percentage of installed job materials is then used for each job to calculate the month-end job material costs incurred. Direct labor, subcontractor, and other costs are charged to contract costs as incurred. Provisions for estimated losses on uncompleted contracts, if any, are recognized in the period in which the loss first becomes probable and reasonably estimable. Contracts may include profit incentives such as milestone bonuses. These profit incentives are included in the contract value when their realization is reasonably assured.
Components Products
The Company sells its components products, as well as its balance of systems products from the Systems Segment, to system integrators and OEMs and recognizes revenue, net of accruals for estimated sales returns, when persuasive evidence of an arrangement exists, delivery of the product has occurred and title and risk of loss has passed to the customer, the sales price is fixed or determinable, collectability of the resulting receivable is reasonably assured and the rights and risks of ownership have passed to the customer. Other than standard warranty obligations, there are no rights of return and there are no significant post-shipment obligations, including installation, training or customer acceptance clauses, with any of its customers that could have an impact on revenue recognition. As such, the Company records a trade receivable for the selling price when the above conditions are met, and reduces inventory for the carrying
nd sales practices are consistent across all geographic areas. In addition, the Company records a charge to operating expense and a credit to allowance for doubtful accounts when customer accounts receivable are deemed uncollectible.
The provision for estimated sales returns on product sales is recorded in the same period the related revenues are recorded. These estimates are based on historical sales returns, analysis of credit memo data and other known factors. Actual returns could differ from these estimates. The Company recorded charges for sales returns on product sales of $0.1 million, $2.2 million and $0.8 million in fiscal 2008, 2007 and 2006, respectively. Amounts utilized against the sales return allowance aggregated $0.2 million, $2.2 million and $0.5 million in fiscal 2008, 2007 and 2006, respectively. The allowance for sales returns was $0.2 million and $0.4 million as of December 28, 2008 and December 30, 2007, respectively.
Shipping and Handling Costs
The Company records costs related to shipping and handling in cost of revenue.
Advertising Costs
Advertising costs are expensed as incurred. Advertising expense totaled approximately $2.2 million, $2.3 million and $0.8 million in fiscal 2008, 2007 and 2006, respectively.
Research and Development Costs
Research and development costs consist primarily of compensation and related costs for personnel, materials, supplies and equipment depreciation. All research and development costs are expensed as incurred. In the third quarter of 2007, the Company signed a Solar America Initiative research and development agreement with the U.S. Department of Energy in which it was awarded $10.8 million in the first budgetary period. Total funding for the three-year effort is estimated to be $24.9 million -tier subcontract awards, is anticipated to be $28.1 million. Amounts invoiced under these arrangements are offset against research and development expense as costs are incurred in accordance with the agreements with the government agency. Payments received under these contracts offset research and development expense by approximately 25%, 21% and 8% in fiscal 2008, 2007 and 2006, respectively.

77
Remeasurement of Foreign Currency Transactions
The Company and the majority of its subsidiaries use their respective local currency as their functional currency. Accordingly, foreign currency assets and liabilities are remeasured using exchange rates in effect at the end of the period, except for non-monetary assets, such as property, plant and equipment, which are remeasured using historical exchange rates. Revenues and costs are remeasured using average exchange rates for the period, except for income items related to non-monetary assets and liabilities, such as depreciation, that are remeasured using historical exchange rates. The Company includes gains or losses from foreign currency remeasurement in other, net of the Consolidated Statements of Operations with the other hedging activities described in Note 11. The Company experienced losses on derivatives and foreign exchange, net of tax of $20.6 million in fiscal 2008 largely due to the volatility in the current markets as compared to gains of $2.1 million and $0.9 million in fiscal 2007 and 2006, respectively. Certain foreign subsidiaries designate the local currency as their functional currency, and the Company records the translation of their assets and liabilities into U.S. dollars at the balance sheet date, and the translation of their revenues and expenses into U.S. dollars using average exchange rates for the period, as translation adjustments and includes them as a component of accumulated other comprehensive income (loss) in the Consolidated Balance Sheets.
As of December 28, 2008 and December 30, 2007, the Company had Euro-denominated accounts receivable of 69.0 million (approximately $96.8 million) and 53.7 million (approximately $79.0 million), respectively. In addition, as of December 28, 2008 and December 30, 2007, the Company had Euro-denominated customer advances (see Note 8) of 19.7 million (approximately $28.1 million) and 19.7 million (approximately $29.0 million), respectively.
Concentration of Credit Risk
Financial instruments that potentially subject the Company to concentrations of credit risk are primarily cash, cash
investment policy requires cash, cash equivalents, restricted cash and investments to be placed with high-credit quality institutions and to limit the amount of credit risk from any one issuer. The Company performs ongoing credit evaluations
s not require collateral. The Company maintains an allowance for doubtful accounts based upon the expected collectability of all accounts receivable, which takes into consideration an analysis of historical bad debts, specific customer creditworthiness and current economic trends. The allowance for doubtful accounts was $1.9 million and $1.4 million as of December 28, 2008 and December 30, 2007, respectively. For fiscal 2008, 2007 and 2006, the Company provided $2.2 million, $0.8 million and $0.3 million, respectively, for allowance for doubtful accounts. During fiscal 2008, 2007 and 2006, the Company wrote off $1.7 million, zero and $32,000 of bad debts, respectively. No customer accounted for 10% or more of accounts receivable as of December 28, 2008 and one customer accounted for 21% of accounts receivable as of December 30, 2007.
Income Taxes
For financial reporting purposes, income tax expense and deferred income tax balances were calculated as if the Company were a separate entity and had prepared its own separate tax return. Deferred tax assets and liabilities are recognized for temporary differences between financial statement and income tax bases of assets and liabilities. Valuation allowances are provided against deferred tax assets when management cannot conclude that it is more likely than not that some portion or all deferred tax assets will be realized. The Company accrues interest and penalties on tax
ncome Taxes, and Related This interest
and penalty accrual is classified as income tax provision (benefit) in the Consolidated Statements of Operations and was not material for any periods presented.
In addition, foreign exchange gains (losses) may result from estimated tax liabilities, which are expected to be settled in currencies other than the U.S. dollar.
low-on public offering of 7.0 million shares of its class A common stock in June 2006, the Company was no longer eligible to file federal and most state consolidated tax returns with Cypress. As of September 29, 2008, Cypress distributed all of its shares shareholders, so the Company is no longer eligible to file any state combined returns with Cypress. Accordingly, the Company has agreed to pay Cypress for any federal income tax credit or net operating loss carryforwards utilized in its

78
federal tax returns in subsequent periods
obligations concerning various tax liabilities (see Notes 2 and 14).
Investments in Equity Interests
Investments in entities in which the Company can exercise significant influence, but does not own a majority equity interest or otherwise control, are acc
as equity in earnings of unconsolidated investees on the Consolidated Statements of Operations. The Company monitors its investments for other-than-temporary impairment by considering factors such as current economic and market conditions and the operating performance of the entities and records reductions in carrying values when necessary. The fair value of privately held investments is estimated using the best available information as of the valuation date, including current earnings trends, undiscounted cash flows, quoted stock prices of comparable public companies, and other company specific information, including recent financing rounds.
Recent Accounting Pronouncements
In December 2007, the FASB issued SFAS No. No. No. 141 "Business Combinations" ("SFAS No. 141"). SFAS No. 141(R) will
significantly change the accounting for business combinations in a number of areas including the treatment of contingent consideration, contingencies, acquisition costs, in-process research and development and restructuring costs. In addition, under SFAS No. 141(R), changes in deferred tax asset valuation allowances and acquired income tax uncertainties in a business combination after the measurement period will impact income tax expense. SFAS No. 141(R) is effective for fiscal years beginning after December 15, 2008 and will be adopted by the Company for any purchase business combinations consummated subsequent to December 28, 2008.
In December 2007, the FASB issued SFAS No. ntrolling Interests in Consolidated Financial Statements an amendment of Accounting Research Bulletin No. accounting and reporting for minority interests, which will be recharacterized as noncontrolling interests and classified as a component of equity. This new consolidation method will significantly change the accounting for transactions with minority interest holders. SFAS No. 160 is effective for fiscal years beginning after December 15, 2008. The Company is currently evaluating the potential impact, if any, of the adoption of SFAS No. 160 on its financial position and results of operations.
In February FAS 157-2 Statement No. - -
fair value in the financial statements on a recurring basis, until fiscal years beginning after November 15, 2008. With the exception of investments and foreign currency derivatives held, this deferral makes SFAS No. 157 effective for the Company beginning in the first quarter of fiscal 2009. The Company is currently evaluating the potential impact, if any, of the adoption of SFAS No. 157 on measurement of fair value of its nonfinancial assets, including goodwill, and nonfinancial liabilities.
In March 2008, the FASB issued SFAS No. closures about Derivative Instruments and Hedging Activities an amendment of SFAS No. derivative instruments and hedging activities. SFAS No. 161 specifically requires entities to provide enhanced disclosures addressing the following: (a) how and why an entity uses derivative instruments; (b) how derivative instruments and related hedged items are accounted for under SFAS No. and Hedging Activit and its related interpretations; and (c) how derivative instruments and related
fiscal years and interim periods beginning after November 15, 2008. The Company is currently evaluating the potential impact, if any, of the adoption of SFAS No. 161 on its financial position, results of operations and disclosures.
In April 2008, the FASB issued FSP SFAS No. 142-142-determine the useful life of a recognized intangible asset under SFAS No. 142. FSP 142-3 also requires expanded

79
disclosure related to the determination of intangible asset useful lives. FSP 142-3 is effective for fiscal years beginning after December 15, 2008. The Company is currently evaluating the potential impact, if any, of the adoption of FSP 142-3 on its financial position, results of operations and disclosures.
to be used in the preparation of financial statements of nongovernmental entities that are presented in conformity with U.S. GAAP. This Statement is effective 60 days following the SEC's approval of the Public Company Accounting Oversight Board amendments to AU Section 411
adheres to the hierarchy of U.S. GAAP as presented in SFAS No. 162 and the adoption of SFAS No. 162 during the fourth quarter in fiscal 2008 did not have a material impact on its financial position, results of operations and disclosures.
In May 2008, the FASB issued FSP APB 14-Settled in Cash upon Conversion (Includin -for convertible debt instruments that may be settled in cash upon conversion, including partial cash settlement. FSP APB 14-1 significantly impacts the accounting for instruments commonly referred to as Instruments B, Instruments C and Instruments X from EITF Issue No. 90-
- ny combination of cash and shares
-convertible debt borrowing rate. FSP APB 14-1 is effective for fiscal years and interim periods beginning after December 15, 2008, and retrospective application will be required for all periods presented. The new guidance may have a significant impact on the
outstanding convertible debt balance of $423.6 million, potentially resulting in significantly higher non-cash interest expense on its convertible debt (see Note 11). The Company is currently evaluating the potential impact of the new guidance on its results of operations and financial condition.
In June 2008, the FASB issued FSP EITF 03-6- -Based -6- ), which clarified that all outstanding unvested
share-based payment awards that contain rights to nonforteitable dividends participate in undistributed earnings with common shareholders. Awards of this nature are considered participating securities and the two-class method of computing basic and diluted earnings per share must be applied. FSP EITF 03-6-1 is effective for fiscal years beginning
In October 2008, the FASB issued FSP SFAS No. 157- 157-
determined when the market for that financial asset is inactive. FSP 157-3 is applicable to the valuation of auction rate securities held by the Company for which there was no active market as of December 28, 2008. FSP 157-3 was effective upon issuance, including prior periods for which financial statements had not been issued (see Note 6). The adoption of FSP 157-and results of operations.
In November 2008, the FASB ratified EITF Issue No. 08--
involving equity method investments. EITF 08-6 is effective for fiscal years beginning after December 15, 2008, with early adoption prohibited. The Company is currently evaluating the potential impact, if any, of the adoption of EITF 08-06 on its financial position, results of operations and disclosures.
In November 2008, the FASB ratified EITF Issue No. 08--
not intend to actively use but intends to hold to prevent its competitors from obtaining access to them. EITF 08-07 requires an acquirer in a business combination to account for a defensive intangible asset as a separate unit of accounting which should be amortized to expense over the period the asset diminishes in value. EITF 08-07 is effective for fiscal years beginning after December 15, 2008, with early adoption prohibited. The Company is currently evaluating the potential impact, if any, of the adoption of EITF 08-07 on its financial position, results of operations and disclosures.
In December 2008, the FASB issued FSP SFAS No. FIN 46(R)-46(R)-

80
to provide additional disclosures about their involvement with variable interest entities. FSP 46(R)-8 is intended to
and is effective for fiscal years and interim periods beginning after December 15, 2008. The adoption of FSP 46(R)-8
operations and disclosures (see Note 10).
Note 2. TRANSACTIONS WITH CYPRESS
Purchases of Imaging and Infrared Detector Products from Cypress
The Company historically purchased fabricated semiconductor wafers from Cypress at intercompany prices pricing methodology. In December 2007, Cypress announced the planned
products. The planned closure is expected to be completed in the first quarter of fiscal 2009. The Company evaluated its alternatives relating to the future plans for this business and decided to wind-down its activities related to the imaging detector product line in the first quarter of fiscal 2008. Accordingly, in the first quarter of fiscal 2008, cost of components revenue included a $2.2 million impairment charge to long-lived assets primarily related to manufacturing equipment located in the Texas wafer fabrication facility. The Company did not purchase wafers from Cypress in the second, third and fourth quarters of fiscal 2008. Wafer purchases totaled $0.6 million, $4.7 million and $7.2 million in fiscal 2008, 2007 and 2006, respectively.
Administrative Services Provided by Cypress
Cypress seconded employees and consultants to the Company for different time periods for which the Company paid their fully-burdened compensation. In addition, Cypress personnel rendered services to the Company to assist with administrative functions such as employee benefits and other Cypress corporate services and infrastructure. Cypress
-burdened compensation. In the case of the Philippines subsidiary, which entered into a services agreement for such secondments and other consulting services in January 2005, the Company paid the fully burdened compensation plus 10%. The amounts that the Company has recorded as general and administrative expenses in the accompanying statements of operations for these services was approximately $3.5 million, $1.8 million and $1.5 million in fiscal 2008, 2007 and 2006, respectively.
Leased Facility in the Philippines
In 2003, the Company and Cypress reached an understanding that the Company would build out and occupy a building owned by Cypress for its first solar cell manufacturing facility in the Philippines. The Company entered into a lease agreement for this facility and a sublease for the land under which the Company paid Cypress at a rate equal to the cost to Cypress for that facility (including taxes, insurance, repairs and improvements). Under the lease agreement, the Company had the right to purchase the facilioriginal purchase price of approximately $8.0 million, plus interest computed on a variable index starting on the date of purchase by Cypress until the sale to the Company, unless such purchase option was exercised after a change of control of the Company, in which case the purchase price would be at a market rate, as reasonably determined by Cypress. In May 2008, the Company exercised its right to purchase the facility from Cypress and assumed the lease for the land from an unaffiliated third-party for a total purchase price of $9.5 million. The lease for the land expires in May 2048 and is renewable for an additional 25 years. Rent expense paid to Cypress for this building was $0.1 million for fiscal 2008 and $0.3 million in each of fiscal 2007 and 2006.
Leased Headquarters Facility in San Jose, California
In May 2006, the Company entered into a lease agreement for its approximately 44,000 square foot headquarters, which is located in a building owned by Cypress in San Jose, California, for $6.0 million over the five-year term of the lease. In October 2008, the Company amended the lease agreement, increasing the rentable square footage and the total lease obligations to approximately 60,000 and $7.6 million, respectively, over the five-year term of the lease. In the event Cypress decides to sell the building, the Company has the right of first refusal to purchase the building at a fair market price which will be based on comparable sales in the area. Rent expense paid to Cypress for this facility was $1.5 million, $1.3 million and $0.6 million in fiscal 2008, 2007 and 2006, respectively.

81
Employee Matters Agreement
In October 2005, the Company entered into an employee matters agreement with Cypress to allocate assets, liabilities and responsibilities relating to its current and former U.S. and international employees and its participation in the employee benefits plans that Cypress sponsored and maintained. In July 2008, the Company transferred all accounts
fare -off of its shares
agreement.
Indemnification and Insurance Matters Agreement
The Company will indemnify Cypress and its affiliates, agents, successors and assigns from all liabilities arising acilities, or arising
r- he vicinity
of the Philippines facility which the Company occupies, or arising out of operations occurring at such facility, whether prior to or after the separation, to the extent that those liabilities were caused by the Company; arising out of hazardous materials found on, under or about any landfill, waste, storage, transfer or recycling site and resulting from hazardous
California and Philippines facilities prior to the separation; and arising out of the construction activity conducted by or
The indemnification and insurance matters agreement also contains provisions governing the insurance coverage, which was under the Cypress insurance policies. As of September 29, 2008, the Company has obtained its own separate policies for the coverage previously provided under the indemnification and insurance matters agreement.
Tax Sharing Agreement
concerning various tax liabilities. The tax sharing agreement is structured such that Cypress will pay all federal, state,
liability or benefit will be determined based upon its separate return tax liability as defined under the tax sharing agreement. Such liability or benefit will be based on a pro forma calculation as if the Company were filing a separate income tax return in each jurisdiction, rather than on a combined or consolidated basis with Cypress subject to adjustments as set forth in the tax sharing agreement.
purposes and certain state income tax purposes. On September 29, 2008, the Company ceased to be a member of
those credit or loss carryforwards existing as of such date, the Company will distribute to Cypress the tax effect, estimated to be 40% for federal and state income tax purposes, of the amount of such tax loss carryforwards so utilized, and the amount of any credit carryforwards so utilized. The Company
28, 2008, the Company has $44.0 million of federal net operating loss carryforwards and approximately $73.5 million of California net operating loss carryforwards meaning that such potential future payments to Cypress, which would be made over a period of several years, would therefore aggregate approximately $18.7 million.
The majority of these net operating loss carryforwards were created by employee stock transactions. Because there is uncertainty as to the realizability of these loss carryforwards, the portion created by employee stock transactions
ted Balance Sheets.
The Company will continue to be jointly and severally liable for any tax liability as governed under federal, state and local law during all periods in which it is deemed to be a member of the Cypress consolidated or combined group.

82
Accordingly, although the tax sharing agreement allocates tax liabilities between Cypress and all its consolidated
liable in the event that any federal tax liability was incurred, but not discharged, by any other member of the group.
The Company will continue to be jointly and severally liable to Cypress until the statute of limitations run for all years where the Company joined in the filing of tax returns with Cypress. If Cypress experiences adjustments to their tax liability pursuant to tax examinations, the Company may incur an incremental liability.
Subject to certain caveats, Cypress has obtained a ruling from the Internal Revenue Servi-free
distribution under Section nonetheless be taxable to Cypress under Section economic value is acquired as part of a plan or series of related transactions that includes the distribution of the
attributable to certain dispositions of the Co 355(e) of the Code.
The tax sharing agreement further provides for cooperation with respect to tax matters, the exchange of information and the retention of records which may affect the income tax liability of either party. Disputes arising between Cypress and the Company relating to matters covered by the tax sharing agreement are subject to resolution through specific dispute resolution provisions contained in the agreement.
-Cypress, on August 12, 2008, entered into an Amendment No. 1 to Tax Sharing
-off and certain other matters.
Under the Amended Tax Sharing Agreement, the Company is required to provide notice to Cypress of certain
application of Section 355(e) of the Code or similar provision of other applicable law to the spin-off as a result of one or more acquisitions (within the meaning of Section -off. An acquisition for
B common stock to class A common stock or any similar recapitalization transaction or series of related transactions (a
(A) to the spin-off and (B) stock by Cypress after the spin-off.
Under the Amended Tax Sharing Agreement, the Company also agreed that, for a period of 25 months following the spin-off, it will not (i) effect a Recapitalization or (ii) enter into or facilitate any other transaction resulting in an
written consent of Cypress; provided, the Company is not required to (either alone or when taken together with one or more other transactions entered into or facilitated by the Company consummated after August 4, 2008 and during the 25-month period following the spin-off) would involve the acquisition for purposes of Section 355(e) of the Code after August
any acquisition of the Section 1.355-7(d)(8) in connection with the performance
of services, (B) opinion of co
Section 1.355-7(d)(9), (C) an acquisition of the ing a public offering) for which the Company furnishes to Cypress prior to such
acquisition a Tax Opinion to the effect that such acquisition will qualify under the so-contained in Treasury Regulation Section 1.355-7(b)(2) or (D) the adoption by the Company of a standard stockholder rights plan. The Company further agreed that it will not (i) effect a Recapitalization during the 36 month period following the spin-off without first obtaining a Tax Opinion to the effect that such Recapitalization (either alone or when taken together with any other transaction or transactions) will not cause the spin-off to become taxable under Section 355(e), or (ii) seek any private ruling, including any supplemental private ruling, from the IRS with regard to the spin-off, or any transaction having any bearing on the tax treatment of the spin-off, without the prior written consent of

83
Cypress.
Note 3. BUSINESS COMBINATIONS
On July 23, 2008, the Company completed the acquisition of Solar Sales, a solar systems integration and product distribution company based in Australia. Solar Sales distributes components such as solar panels and inverters via a national network of dealers throughout Australia, and designs, builds and commissions large-scale commercial systems. Prior to the acquisition, Solar Sales had been a customer of the Company since fiscal 2005. As a result of the acquisition, Solar Sales became a wholly-owned subsidiary of the Company. In connection with the acquisition, the
esults of operations.
Solar Solutions
On January 8, 2008, the Company completed the acquisition of Solar Solutions, a solar systems integration and product distribution company based in Italy. Solar Solutions was a division of Combigas S.r.l., a petroleum products trading firm. Active since 2002, Solar Solutions distributes components such as solar panels and inverters, and offers turnkey solar power systems and standard system kits via a network of dealers throughout Italy. Prior to the acquisition, Solar Solutions had been a customer of the Company since fiscal 2006. As a result of the acquisition, Solar Solutions became a wholly-owned subsidiary of the Company. In connection with the acquisition, the Company changed Solar
PowerLight
On January 10, 2007, the Company completed its acquisition of PowerLight. The results of PowerLight have been included in the consolidated results of the Company since January 10, 2007. As a result of the PowerLight acquisition, all of the outstanding shares of PowerLight, and a portion of each vested option to purchase shares of PowerLight, were cancelled, and all of the outstanding options to purchase shares of PowerLight (other than the portion of each vested option that was cancelled) were assumed by the Company in exchange for aggregate consideration of (i) approximately $120.7 million in cash plus (ii) (a) assumed vested and unvested PowerLight stock options, which options vest on the same schedule as the assumed PowerLight stock options, and (b) employees of PowerLight in connection with the acquisition which, along with approximately 0.5 million of the shares issuable upon exercise of assumed PowerLight stock options, are subject to certain transfer restrictions and a repurchase option by the Company, both of which lapse over a two-year period following the acquisition under the terms of certain equity restriction agreements. The Company under the terms of the acquisition agreement also issued an additional 0.2 million shares of restricted class A common stock to certain employees of PowerLight, which shares are subject to certain transfer restrictions which will lapse over 4 years following the acquisition. In June 2007, the Company changed
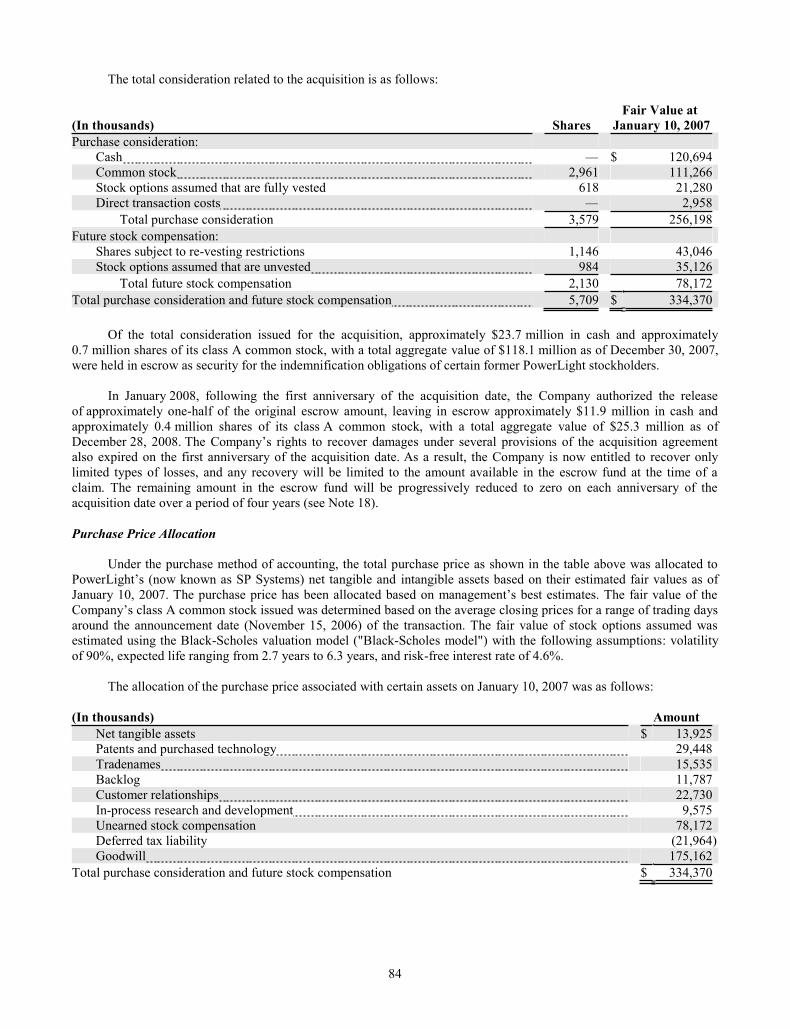
84
The total consideration related to the acquisition is as follows:
(In thousands) Shares Fair Value at
January 10, 2007Purchase consideration:
Cash $ 120,694 Common stock 2,961 111,266 Stock options assumed that are fully vested 618 21,280 Direct transaction costs 2,958
Total purchase consideration 3,579 256,198 Future stock compensation:
Shares subject to re-vesting restrictions 1,146 43,046 Stock options assumed that are unvested 984 35,126
Total future stock compensation 2,130 78,172 Total purchase consideration and future stock compensation 5,709 $ 334,370
Of the total consideration issued for the acquisition, approximately $23.7 million in cash and approximately 0.7 million shares of its class A common stock, with a total aggregate value of $118.1 million as of December 30, 2007, were held in escrow as security for the indemnification obligations of certain former PowerLight stockholders.
In January 2008, following the first anniversary of the acquisition date, the Company authorized the release of approximately one-half of the original escrow amount, leaving in escrow approximately $11.9 million in cash and approximately 0.4 million shares of its class A common stock, with a total aggregate value of $25.3 million as of December 28, 2008. also expired on the first anniversary of the acquisition date. As a result, the Company is now entitled to recover only limited types of losses, and any recovery will be limited to the amount available in the escrow fund at the time of a claim. The remaining amount in the escrow fund will be progressively reduced to zero on each anniversary of the acquisition date over a period of four years (see Note 18).
Purchase Price Allocation
Under the purchase method of accounting, the total purchase price as shown in the table above was allocated to intangible assets based on their estimated fair values as of
ing prices for a range of trading days around the announcement date (November 15, 2006) of the transaction. The fair value of stock options assumed was estimated using the Black-Scholes valuation model ("Black-Scholes model") with the following assumptions: volatility of 90%, expected life ranging from 2.7 years to 6.3 years, and risk-free interest rate of 4.6%.
The allocation of the purchase price associated with certain assets on January 10, 2007 was as follows:
(In thousands) AmountNet tangible assets $ 13,925 Patents and purchased technology 29,448 Tradenames 15,535 Backlog 11,787 Customer relationships 22,730 In-process research and development 9,575Unearned stock compensation 78,172 Deferred tax liability (21,964 )Goodwill 175,162
Total purchase consideration and future stock compensation $ 334,370

85
Net tangible assets acquired on January 10, 2007 consisted of the following:
(In thousands) AmountCash and cash equivalents $ 22,049 Restricted cash 4,711Accounts receivable, net 40,080 Costs and estimated earnings in excess of billings 9,136Inventories 28,146 Deferred project costs 24,932 Prepaid expenses and other assets 23,740
Total assets acquired 152,794 Accounts payable (60,707 )Billings in excess of costs and estimated earnings (35,887 )Other accrued expenses and liabilities (42,275 )
Total liabilities assumed (138,869 )Net assets acquired $ 13,925
The Company accounted for its acquisition of PowerLight in accordance with SFAS No. 141. Accordingly, all intercompany receivables and payables related to PowerLight at the acquisition date were eliminated in purchase accounting effective January 10, 2007.
Acquired Identifiable Intangible Assets
The following table presents certain information on the acquired identifiable intangible assets:
Intangible Assets Method of ValuationDiscount
Rate UsedRoyalty
Rate UsedEstimated Useful Life
Patents and purchased technology Relief from royalty method 25% 3% 4 years Tradenames Relief from royalty method 25% 1% 5 years Backlog Income approach 20% % 1 year Customer relationships Income approach 22% % 6 years
branding strategy and changing P2007, the Company recognized an impairment charge of $14.1 million, which represented the net book value of the PowerLight tradename.
Amortization expense for fiscal 2008 and 2007 was as follows:
(In thousands) December 28,
2008 December 30,
2007Cost of systems revenue $ 7,691 $ 20,085 Sales, general and administrative 3,787 3,688
Total amortization expense $ 11,478 $ 23,773
In-
In connection with the acquisition of PowerLight (now known as SP Systems), the Company recorded an IPR&D charge of $9.6 million in the first quarter of fiscal 2007, as technological feasibility associated with the IPR&D projects had not been established and no alternative future use existed.
These IPR&D projects consisted of two components: design automation tool and tracking systems and other. In assessing the projects, the Company considered key characteristics of the technology as well as its future prospects, the

86
The value of IPR&D was determined using the income approach method, which calculated the sum of the discounted future cash flows attributable to the projects once commercially viable using a 40% discount rate, which were derived from a weighted-average cost of capital analysis and adjusted to reflect the stage of completion and the level of risks associated with the projects. The percentage of completion for each project was determined by identifying the research and development expenses invested in the project as a ratio of the total estimated development costs required to bring the project to technical and commercial feasibility. The following table summarizes certain information related to each project:
Stage of
Completion Total Cost
Incurred to Date Total
Remaining CostsDesign Automation Tool As of January 10, 2007 (acquisition date) 8% $ 0.2 million $ 2.4 million As of December 28, 2008 100% $ 1.4 million $ Tracking System and Other As of January 10, 2007 (acquisition date) 25% $ 0.2 million $ 0.6 million As of December 28, 2008 100% $ 0.8 million $
Status of IPR&D:
At the close of the first quarter in fiscal 2008, the first release of the design automation tool software was deployed to production. As of December 28, 2008, the Company has incurred total project costs of $1.4 million, of which $1.2 million was incurred after the acquisition, and total costs to complete the project was $1.2 million less than the original estimate of $2.6 million. The Company completed the design automation tool project approximately two years and three quarters earlier than the original estimated completion date of December 2010.
The Company completed the tracking systems project in June 2007 and incurred total project costs of $0.8 million, of which $0.6 million was incurred after the acquisition. Both the actual completion date and the total projects costs were in line with the original estimates.
Pro Forma Financial Information (Unaudited)
Supplemental information on an unaudited pro forma basis, as if the acquisition of PowerLight was completed at the beginning of fiscal years 2007 and 2006, is as follows:
Year Ended
(In thousands, except per share amounts) December 30,
2007 December 31,
2006Revenue $ 777,104 $ 442,115 Net income (loss) $ 7,094 $ (57,635 )Basic net income (loss) per share $ 0.09 $ (0.84)Diluted net income (loss) per share $ 0.09 $ (0.84)
The unaudited pro forma supplemental information is based on estimates and assumptions, which the Company believes are reasonable. The unaudited pro forma supplemental information includes non-recurring in-process research and development charge of $9.6 million recorded in the first quarter ended April 1, 2007 and April 2, 2006. The unaudited pro forma supplemental information prepared by management is not necessarily indicative of the consolidated financial position or results of operations in future periods or the results that actually would have been realized had the Company and PowerLight been a combined company during the specified periods.
Note 4. GOODWILL AND INTANGIBLE ASSETS
On November 9, 2004, Cypress completed the acquisition of SunPower. As a result, the Company became a wholly-owned subsidiary of Cypress. Under the purchase method of accounting, the total purchase price was allocated to
stimated fair values as of November 9, 2004. This

87
er 9, 2004, derived from the net carrying balance previously reported by Cypress on November 9, 2004, consisted of intangible assets valued at $24.0 million and goodwill valued at $2.9 million. After the close of trading on September 29, 2008, Cypress completed a spin-record as of September 17, 2008 of Cypress common stock.
Goodwill
The following table presents the changes in the carrying amount of goodwill under the Company's reportable business segments:
(In thousands) Components
Business Segment Systems
Business Segment TotalAs of December 31, 2006 $ 2,883 $ $ 2,883
Goodwill acquired 175,162 175,162 Adjustments 6,639 6,639
As of December 30, 2007 2,883 181,801 184,684 Goodwill acquired 11,688 11,688 Adjustments 1,176 1,176Cumulative translation adjustment, net of tax (828) (828 )
As of December 28, 2008 $ 14,919 $ 181,801 $ 196,720
Changes to goodwill during fiscal 2008 resulted from the acquisitions of SunPower Italia and SunPower Australia. Approximately $11.7 million had been allocated to goodwill within the Components Segment, which represents the excess of the purchase price over the fair value of the underlying net tangible and intangible assets of SunPower Italia and SunPower Australia. SunPower Italia is a Euro functional currency subsidiary and SunPower Australia is an Australian dollar functional currency subsidiary. Therefore, the Company records a translation adjustment for the
and intangible assets into U.S. dollar. As of December 28, 2008, the cumulative translation adjustment decreased the balance of goodwill by $0.8 million. Also during fiscal 2008, the Company recorded an adjustment to increase goodwill by $1.1 million to adjust the value of acquired investments and deferred tax liability.
During fiscal 2007, approximately $175.2 million had been allocated to goodwill within the Systems Segment, which represents the excess of the purchase price over the fair value of the underlying net tangible and intangible assets of PowerLight (now known as SP Systems). During fiscal 2007, the Company recorded adjustments aggregating $6.6 million to increase goodwill related to the purchase of PowerLight (now known as SP Systems) on January 10, 2007 to $181.8 million. The adjustments included a change in the estimated receivable for an existing project as of the acquisition date which was subsequently determined to be unearned and, thus, the receivable will not be paid, an additional loss provision on a construction project contracted as of the acquisition date and was subsequently determined to have a larger loss than originally estimated, as well as adjustments to the value of certain acquired assets and liabilities.
In accordance with SFAS No. 142, goodwill will not be amortized but instead will be tested for impairment at least annually, or more frequently if certain indicators are present. The Company conducts its annual impairment test of goodwill as of the Sunday closest to the end of the third fiscal quarter of each year. Impairment of goodwill is tested at
including goodwill, to the fair value of that segment. To determine market approach. In performing its analysis, the Company uses the best information available under the circumstances, including reasonable and supportable assumptions and projections. If the carrying amount of the reporting unit exceeds its implied fair value, goodwill is considered impaired and a second step is performed to measure the amount of impairment loss, if any. Based on its last impairment test as of September 28, 2008, the Company determined there was no impairment. In the event that management determines that the value of goodwill has become impaired, the Company will incur an accounting charge for the amount of the impairment during the fiscal quarter in which the determination is made.

88
Intangible Assets
The following tables present details of the Company's acquired identifiable intangible assets:
(In thousands) Gross AccumulatedAmortization Net
As of December 28, 2008 Patents and purchased technology $ 51,398 $ (31,322) $ 20,076 Tradenames 2,501 (1,685) 816 Backlog 11,787 (11,787) Customer relationships and other 27,456 (8,858) 18,598
$ 93,142 $ (53,652) $ 39,490 As of December 30, 2007
Patents and purchased technology $ 51,398 $ (20,630) $ 30,768 Tradenames 1,603 (808) 795 Backlog 11,787 (11,460) 327 Customer relationships and other 23,193 (4,137) 19,056
$ 87,981 $ (37,035) $ 50,946
In connection with the acquisitions of SunPower Italia and SunPower Australia, the Company recorded $6.2 million of intangible assets less $1.0 million of cumulative translation adjustment for acquired intangible assets in the year ended December 28, 2008. In connection with the acquisition of PowerLight (now known as SP Systems), the Company recorded $79.5 million of intangible assets in the first quarter of fiscal 2007, of which $15.5 million was related to the PowerLight tradename. The determination of the fair value and useful life of the tradename was based on
to market its systems products and services under the PowerLight brand. Based on
the quarter ended July 1, 2007, the Company recognized an impairment charge of $14.1 million, which represented the net book value of the PowerLight tradename.
expense for intangible assets totaled $16.8 million, $28.5 million and $4.7 million in fiscal 2008, 2007 and 2006, respectively. As of December 28, 2008, the estimated future amortization expense related to intangible assets is as follows (in thousands):
2009 $ 16,262 2010 14,675 2011 4,5462012 3,902Thereafter 105 $ 39,490

89
Note 5. BALANCE SHEET COMPONENTS
(In thousands) December 28,
2008 December 30,
2007Accounts receivable, net:
Accounts receivable, gross $ 196,316 $ 139,991 Less: Allowance for doubtful accounts (1,863 ) (1,373 )Less: Allowance for sales returns (231 ) (368 )
$ 194,222 $ 138,250
Costs and estimated earnings in excess of billings on contracts in progress and billings in excess of costs and estimated earnings on contracts in progress consists of the following: Costs and estimated earnings in excess of billings on contracts in progress $ 30,326 $ 39,136 Billings in excess of costs and estimated earnings on contracts in progress (11,806) (69,900 )
$ 18,520 $ (30,764 )Contracts in progress at year end:
Costs incurred to date $ 552,211 $ 481,340 Estimated earnings to date 166,901 145,643
Contract revenue earned to date 719,112 626,983 Less: Billings to date, including earned incentive rebates (700,592) (657,747 )
$ (18,520) $ (30,764 )Inventories:
Raw materials(1) $ 130,082 $ 89,604 Work-in-process 15,505 2,027Finished goods 105,801 57,189
$ 251,388 $ 148,820 (1) In addition to polysilicon and other raw materials for solar cell manufacturing,
raw materials include solar panels purchased from third-party vendors and installation materials for systems projects.
Prepaid expenses and other current assets:
VAT receivables, current portion $ 26,489 $ 7,266Deferred tax assets, current portion 5,658 8,437Foreign currency forward exchange contracts 11,443 Other receivables(2) 36,749 9,946Other prepaid expenses 15,765 7,461
$ 96,104 $ 33,110 (2) Includes tolling agreements with suppliers in which the Company provides polysilicon required for silicon ingot manufacturing and procures the manufactured silicon ingots from the supplier (see Note 9).
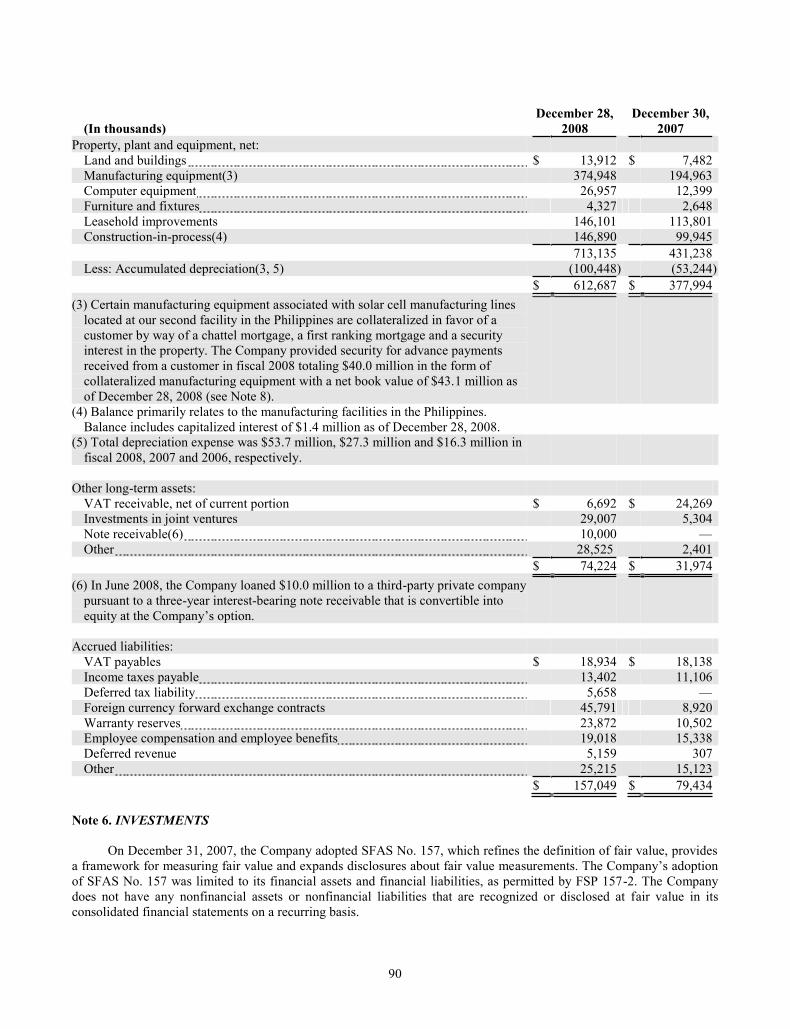
90
(In thousands) December 28,
2008 December 30,
2007Property, plant and equipment, net:
Land and buildings $ 13,912 $ 7,482Manufacturing equipment(3) 374,948 194,963 Computer equipment 26,957 12,399 Furniture and fixtures 4,327 2,648Leasehold improvements 146,101 113,801 Construction-in-process(4) 146,890 99,945
713,135 431,238 Less: Accumulated depreciation(3, 5) (100,448) (53,244 )
$ 612,687 $ 377,994 (3) Certain manufacturing equipment associated with solar cell manufacturing lines
located at our second facility in the Philippines are collateralized in favor of a customer by way of a chattel mortgage, a first ranking mortgage and a security interest in the property. The Company provided security for advance payments received from a customer in fiscal 2008 totaling $40.0 million in the form of collateralized manufacturing equipment with a net book value of $43.1 million as of December 28, 2008 (see Note 8).
(4) Balance primarily relates to the manufacturing facilities in the Philippines. Balance includes capitalized interest of $1.4 million as of December 28, 2008.
(5) Total depreciation expense was $53.7 million, $27.3 million and $16.3 million in fiscal 2008, 2007 and 2006, respectively.
Other long-term assets:
VAT receivable, net of current portion $ 6,692 $ 24,269 Investments in joint ventures 29,007 5,304Note receivable(6) 10,000 Other 28,525 2,401
$ 74,224 $ 31,974 (6) In June 2008, the Company loaned $10.0 million to a third-party private company
pursuant to a three-year interest-bearing note receivable that is convertible into
Accrued liabilities:
VAT payables $ 18,934 $ 18,138 Income taxes payable 13,402 11,106 Deferred tax liability 5,658 Foreign currency forward exchange contracts 45,791 8,920Warranty reserves 23,872 10,502 Employee compensation and employee benefits 19,018 15,338 Deferred revenue 5,159 307 Other 25,215 15,123
$ 157,049 $ 79,434
Note 6. INVESTMENTS
On December 31, 2007, the Company adopted SFAS No. 157, which refines the definition of fair value, provides a framework for measuring fair value and expands disclosures about fair value meof SFAS No. 157 was limited to its financial assets and financial liabilities, as permitted by FSP 157-2. The Company does not have any nonfinancial assets or nonfinancial liabilities that are recognized or disclosed at fair value in its consolidated financial statements on a recurring basis.
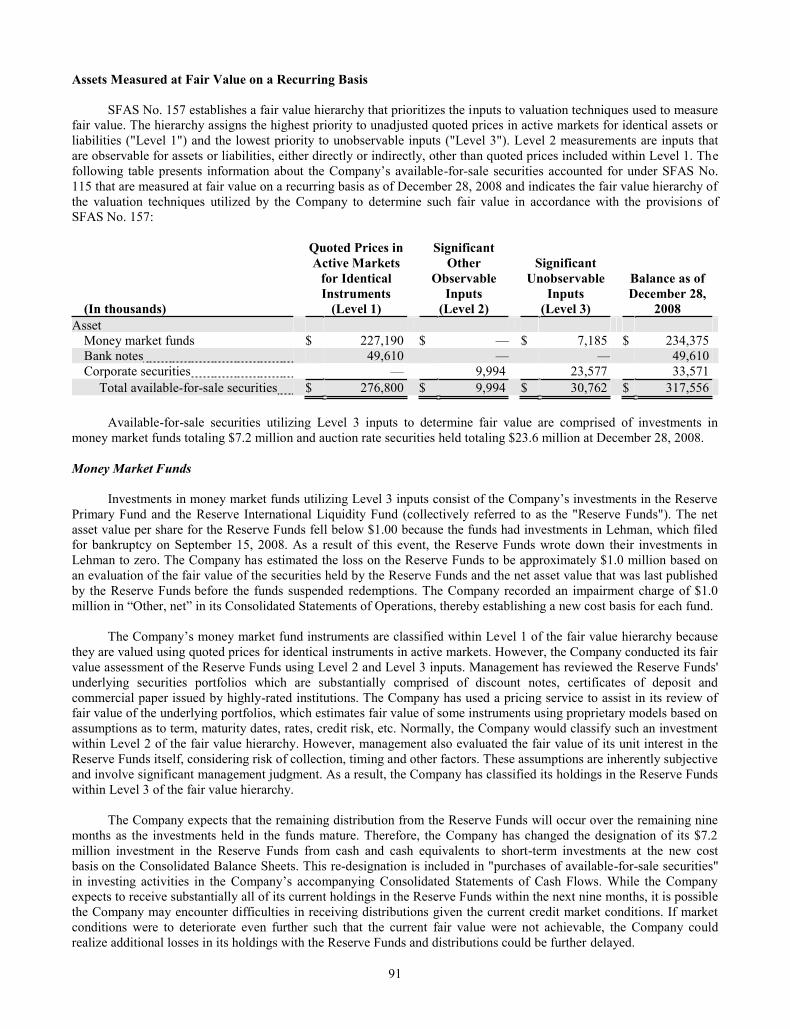
91
Assets Measured at Fair Value on a Recurring Basis
SFAS No. 157 establishes a fair value hierarchy that prioritizes the inputs to valuation techniques used to measure fair value. The hierarchy assigns the highest priority to unadjusted quoted prices in active markets for identical assets or liabilities ("Level 1") and the lowest priority to unobservable inputs ("Level 3"). Level 2 measurements are inputs that are observable for assets or liabilities, either directly or indirectly, other than quoted prices included within Level 1. The
-for-sale securities accounted for under SFAS No. 115 that are measured at fair value on a recurring basis as of December 28, 2008 and indicates the fair value hierarchy of the valuation techniques utilized by the Company to determine such fair value in accordance with the provisions of SFAS No. 157:
(In thousands)
Quoted Prices in Active Markets
for IdenticalInstruments
(Level 1)
Significant Other
Observable Inputs
(Level 2)
SignificantUnobservable
Inputs(Level 3)
Balance as ofDecember 28,
2008Asset
Money market funds $ 227,190 $ $ 7,185 $ 234,375 Bank notes 49,610 49,610 Corporate securities 9,994 23,577 33,571
Total available-for-sale securities $ 276,800 $ 9,994 $ 30,762 $ 317,556
Available-for-sale securities utilizing Level 3 inputs to determine fair value are comprised of investments in money market funds totaling $7.2 million and auction rate securities held totaling $23.6 million at December 28, 2008.
Money Market Funds
Primary Fund and the Reserve International Liquidity Fund (collectively referred to as the "Reserve Funds"). The net asset value per share for the Reserve Funds fell below $1.00 because the funds had investments in Lehman, which filed for bankruptcy on September 15, 2008. As a result of this event, the Reserve Funds wrote down their investments in Lehman to zero. The Company has estimated the loss on the Reserve Funds to be approximately $1.0 million based on an evaluation of the fair value of the securities held by the Reserve Funds and the net asset value that was last published by the Reserve Funds before the funds suspended redemptions. The Company recorded an impairment charge of $1.0
Consolidated Statements of Operations, thereby establishing a new cost basis for each fund.
vel 1 of the fair value hierarchy because they are valued using quoted prices for identical instruments in active markets. However, the Company conducted its fair value assessment of the Reserve Funds using Level 2 and Level 3 inputs. Management has reviewed the Reserve Funds' underlying securities portfolios which are substantially comprised of discount notes, certificates of deposit and commercial paper issued by highly-rated institutions. The Company has used a pricing service to assist in its review of fair value of the underlying portfolios, which estimates fair value of some instruments using proprietary models based on assumptions as to term, maturity dates, rates, credit risk, etc. Normally, the Company would classify such an investment within Level 2 of the fair value hierarchy. However, management also evaluated the fair value of its unit interest in the Reserve Funds itself, considering risk of collection, timing and other factors. These assumptions are inherently subjective and involve significant management judgment. As a result, the Company has classified its holdings in the Reserve Funds within Level 3 of the fair value hierarchy.
The Company expects that the remaining distribution from the Reserve Funds will occur over the remaining nine months as the investments held in the funds mature. Therefore, the Company has changed the designation of its $7.2 million investment in the Reserve Funds from cash and cash equivalents to short-term investments at the new cost basis on the Consolidated Balance Sheets. This re-designation is included in "purchases of available-for-sale securities"
expects to receive substantially all of its current holdings in the Reserve Funds within the next nine months, it is possible the Company may encounter difficulties in receiving distributions given the current credit market conditions. If market conditions were to deteriorate even further such that the current fair value were not achievable, the Company could realize additional losses in its holdings with the Reserve Funds and distributions could be further delayed.

92
Auction Rate Securities
Auction rate securities held are typically over-collateralized and secured by pools of student loans originated
of Education. In addition, all auction rate securities held are rated by one or more of the Nationally Recognized -A. Historically, these securities have provided liquidity through a
Dutch auction at pre-determined intervals every 7 to 49 days. At the end of each reset period, investors can continue to hthese securities generally are between 20 to 30 years. Beginning in February 2008, the auction rate securities market experienced a significant increase in the number of failed auctions, resulting from a lack of liquidity, which occurs when sell orders exceed buy orders, and does not necessarily signify a default by the issuer.
All auction rate securities invested in at December 28, 2008 and $29.1 million of $50.8 million invested in auction rate securities at December 30, 2007 have failed to clear at auctions in subsequent periods. For failed auctions, the Company continues to earn interest on these investments at the maximum contractual rate as the issuer is obligated under contractual terms to pay penalty rates should auctions fail. Historically, failed auctions have rarely occurred, however, such failures could continue to occur in the future. In the event the Company needs to access these funds, the Company will not be able to do so until a future auction is successful, the issuer redeems the securities, a buyer is found outside of the auction process or the securities mature. Accordingly, auction rate securities at December 28, 2008 and December 30, 2007 totaling $23.6 million and $29.1 million, respectively, are classified as long-term investments on the Consolidated Balance Sheets, because they are not expected to be used to fund current operations and consistent with the stated contractual maturities of the securities.
The Company determined that use of a valuation model was the best available technique for measuring the fair value of its auction rate securities. The Company used an income approach valuation model to estimate the price that would be received to sell its securities in an orderly transaction between market participants ("exit price") as of December 28, 2008. The exit price was derived as the weighted average present value of expected cash flows over various periods of illiquidity, using a risk-adjusted discount rate that was based on the credit risk and liquidity risk of thesecurities. While the valuation model was based on both Level 2 (credit quality and interest rates) and Level 3 inputs, the Company determined that the Level 3 inputs were the most significant to the overall fair value measurement, particularly the estimates of risk adjusted discount rates and ranges of expected periods of illiquidity. The valuation model also reflected the Company's intention to hold its auction rate securities until they can be liquidated in a market that facilitatesorderly transactions. The following key assumptions were used in the valuation model:
5 years to liquidity; continued receipt of contractual interest which provides a premium spread for failed auctions; and discount rates ranging from 4.5% to 6.0%, which incorporates a spread for both credit and liquidity risk.
Based on these assumptions, the Company estimated that auction rate securities with a stated par value of $26.1 million would be valued at approximately 91% of their stated par value, or $23.6 million, representing a decline in value of approximately $2.5 million. The Company currently has the ability and intent to hold these securities until they can be liquidated in a market that facilitates orderly transactions. However, due to the length of time that has passed since the auctions failed and the ongoing uncertainties regarding future access to liquidity, the Company has determined the impairment is other-than-temporary. The Company recorded the other-than-temporary impairment loss of $2.5 million in
provides a summa -for-sale securities utilizing Level 3 inputs as of December 28, 2008:

93
(In thousands) Money Market
Funds Auction Rate
Securities Balance at December 31, 2007 $ $
Transfers from Level 1 to Level 3 26,677 Transfers from Level 2 to Level 3 29,050 Purchases 10,000 Sales (1) (18,498) (13,000 )
(994) (2,473 )Balance at December 28, 2008 (2) $ 7,185 $ 23,577
(1) In the second quarter of fiscal 2008, the Company sold auction rate securities with a carrying value of $12.5 million for their stated par value of $13.0 million to the issuer of the securities outside of the auction process. In the fourth quarter of fiscal 2008, the Company received a distribution of $18.5 million from the Reserve Funds.
(2) On February 4, 2009, the Company sold an auction rate security with a carrying value of $4.5 million on December 28, 2008 for $4.6 million to a third-party outside of the auction process. In addition, the Company received a distribution of $2.1 million and $1.6 million from the Reserve Funds on January 30, 2009 and February 20, 2009, respectively.
The following table summarizes unrealized gains and losses by major security type designated as available-for-sale:
December 28, 2008 December 30, 2007 Unrealized Unrealized
(In thousands) Cost GrossGains
GrossLosses
FairValue Cost
GrossGains
GrossLosses
FairValue
Money market funds $ 234,375 $ $ $ 234,375 $ 281,458 $ $ $ 281,458 Bank notes 49,610 49,610 Corporate securities 33,579 2 (10) 33,571 92,395 6 (50) 92,351 Commercial paper 78,163 2 (2) 78,163
Total available-for-sale securities $ 317,564 $ 2 $ (10) $ 317,556 $ 452,016 $ 8 $ (52) $ 451,972
The following table summarizes the fair value a -for-sale securities, aggregated by type of investment instrument and length of time that individual securities have been in a continuous unrealized loss position:
As of December 28, 2008 Less than 12 Months 12 Months or Greater Total
(In thousands) Fair Value
Gross Unrealized
Losses Fair Value
Gross Unrealized
Losses Fair Value
Gross Unrealized
LossesCorporate securities $ 4,992 $ (10 ) $ $ $ 4,992 $ (10)
As of December 28, 2008, the Company did not have any investments in available-for-sale securities that were in an unrealized loss position for 12 months or greater. The decline in fair value of these corporate securities was primarily related to changes in interest rates. The Company has concluded that no other-than-temporary impairment losses occurred in fiscal 2008 in regards to these corporate securities because changes in interest rates are considered temporary in nature for which the Company has recorded an unrealized loss within comprehensive income (loss), a component of stockholders' equity. The Company has the ability and intent to hold these corporate securities until a recovery of fair value. In addition, the Company evaluated the near-term prospects of the corporate securities in relation to the severity
securities for a reasonable period of time, the Company did not consider these investments to be other-than-temporarily

94
impaired. If it is determined that the fair value of these corporate securities is other-than-temporarily impaired, the Company would record a loss in its Consolidated Statements of Operations in the future, which could be material.
The classification and contractual maturities of available-for-sale securities is as follows:
(In thousands) December 28,
2008 December 30,
2007Included in:
Cash equivalents $ 101,523 $ 249,582 Short-term restricted cash(1, 2) 13,240 Short-term investments 17,179 105,453 Long-term restricted cash(1) 162,037 67,887 Long-term investments 23,577 29,050
$ 317,556 $ 451,972 Contractual maturities:
Due in less than one year $ 186,540 $ 396,228 Due from one to two years (3) 3,206 4,994Due from two to 30 years 127,810 50,750
$ 317,556 $ 451,972
(1) The Company provided security in the form of cash collateralized bank standby letters of credit for advance payments received from customers.
(2) The Company received proceeds of Malaysian Ringgit 190.0 million (approximately $54.6 million) from the Malaysian Government under its facility agreement to finance the construction of its planned third solar cell manufacturing facility in Malaysia.
(3) The Company classifies all available-for-sale securities that are intended to be available for use in current operations as short term investments.
Investments in Non-Public Companies
The Company holds minority investments in certain non-public companies. The Company regularly monitors these minority investments for impairment and records reductions in the carrying values when necessary. Circumstances that indicate an other-than-temporary decline include valuation ascribed to the issuing company in subsequent financing rounds, decreases in quoted market price and declines in operations of the issuer. The Company has $3.1 million in investments accounted for under the cost method and $29.0 million in investments accounted under the equity method on December 28, 2008 (see Note 10). As of December 30, 2007, non-publicly traded investments of $5.3 million are accounted for under the equity method. During fiscal 2008, the Company recorded an other-than-temporary impairment charge of $1.9 million on its non-publicly traded investment accounted for using the cost method, due to the recent deterioration of the credit market and economic environment.
Note 7. ADVANCES TO SUPPLIERS
The Company has entered into agreements with various polysilicon, ingot, wafer, solar cells and solar panel vendors and manufacturers. These agreements specify future quantities and pricing of products to be supplied by the vendors for periods up to 11 years. Certain agreements also provide for penalties or forfeiture of advanced deposits in the event the Company terminates the arrangements (see Note 9). Under certain of these agreements, the Company is required to make prepayments to the vendors over the terms of the arrangements. In fiscal 2008, the Company paid advances totaling $52.9 million in accordance with the terms of existing supply agreements. As of December 28, 2008 and December 30, 2007, advances to suppliers totaled $162.6 million and $161.2 million, respectively, the current portion of which is $43.2 million and $52.3 million, respectively.

95
tions related to these agreements as of December 28, 2008 are as follows (in thousands):
2009 $ 83,556 2010 59,642 2011 19,792 $ 162,990
In January 2009, the Company paid an additional advance of $5.6 million in accordance with the terms of an existing supply agreement.
Note 8. CUSTOMER ADVANCES
From time to time, the Company enters into agreements where customers make advances for future purchases of solar power products. In general, the Company pays no interest on the advances and applies the advances as shipments of product occur.
In August 2007, the Company entered into an agreement with one of its customers to supply polysilicon. Under the polysilicon agreement, the customer has agreed to make material aggregate cash advance payments to the Company in fiscal 2007 and 2008. Commencing in fiscal 2010 and continuing through 2019, these advance payments are to be
used by the customer to manufacture ingots, and potentially wafers, which are to be sold to the Company under an ingot supply agreement. The Company received advances of $40.0 million in each year ended December 28, 2008 and December 30, 2007 from this customer, all of which is classified as long-term customer advances in the accompanying Consolidated Balance Sheets. The Company provided security for advances of $40.0 million received in fiscal 2008 in the form of collateralized manufacturing equipment with a net book value of $43.1 million as of December 28, 2008 (see Note 5).
In April 2005, the Company entered into an agreement with one of its customers to supply solar cells. As part of this agreement, the customer agreed to fund 30 million Euros (approximately $35.5 million) for the expansion of the
1, 2006,
settlement of principal on the advances is to be recognized over product deliveries at a specified rate on a per-unit-of-product-delivered basis through December 31, 2010. The Company paid interest on the remaining unpaid balance of 1.0 million Euros (approximately $1.4 million) and 1.4 million Euros (approximately $1.9 million) in fiscal 2008 and 2007, respectively. As of December 28, 2008, the remaining outstanding advance was 12.5 million Euros (approximately $17.5 million) of which $8.4 million had been classified in current portion of customer advances and $9.1 million in long-term customer advances in the accompanying Consolidated Balance Sheets, based on projected product shipment dates. As of December 30, 2007, the remaining outstanding advance was 19.7 million Euros (approximately $29.0 million) of which $8.8 million and $20.2 million has been classified in current portion of customer advances and in long-term customer advances, respectively. The Company has utilized all funds advanced by this
facturing capacity.
The Company has also entered into other agreements with customers who have made advance payments for solar products. These advances will be applied as shipments of product occur. As of December 28, 2008 and December 30, 2007, such customers had made advances of $12.9 million and $0.4 million, respectively.

96
The estimated utilization of advances from customers and the related interest of $1.0 million thereto are (in thousands):
2009 $ 19,800 2010 19,317 2011 8,323 2012 8,000 2013 8,000 Thereafter 48,000 $ 111,440
Note 9. COMMITMENTS AND CONTINGENCIES
Operating Lease Commitments
The Company leases its San Jose, California facility under a non-cancelable operating lease from Cypress, which expires in April 2011 (see Note 2). The lease requires the Company to pay property taxes, insurance and certain other costs. In addition, the Company leases its Richmond, California facility under a non-cancelable operating lease from an unaffiliated third-party, which expires in September 2018. The Company also has various lease arrangements, including its European headquarters located in Geneva, Switzerland under a lease that expires in September 2012, as well as sales and support offices in Southern California, New Jersey, Australia, Canada, Germany, Italy, Spain and South Korea, all of which are leased from unaffiliated third-parties. Future minimum obligations under all non-cancelable operating leases as of December 28, 2008 are as follows (in thousands):
2009 $ 5,5022010 5,0782011 3,8572012 3,0322013 2,965Thereafter 21,536 $ 41,970
Rent expense, including the rent paid to Cypress for the San Jose, California facility and the first solar cell manufacturing facility in the Philippines (see Note 2), was $6.9 million, $3.3 million and $1.3 million in fiscal 2008, 2007 and 2006, respectively.
Purchase Commitments
The Company purchases raw materials for inventory, services and manufacturing equipment from a variety of vendors. During the normal course of business, in order to manage manufacturing lead times and help assure adequate supply, the Company enters into agreements with contract manufacturers and suppliers that either allow them to procure goods and services based upon specifications defined by the Company, or that establish parameters defining the
ess needs prior to firm orders being placed. Consequently, only a -cancelable and
unconditional commitments.
The Company also has agreements with several suppliers, including joint ventures, for the procurement of polysilicon, ingots, wafers, solar cells and solar panels which specify future quantities and pricing of products to be supplied by the vendors for periods up to 11 years and provide for certain consequences, such as forfeiture of advanced deposits and liquidated damages relating to previous purchases, in the event that the Company terminates the arrangements (see Note 7).
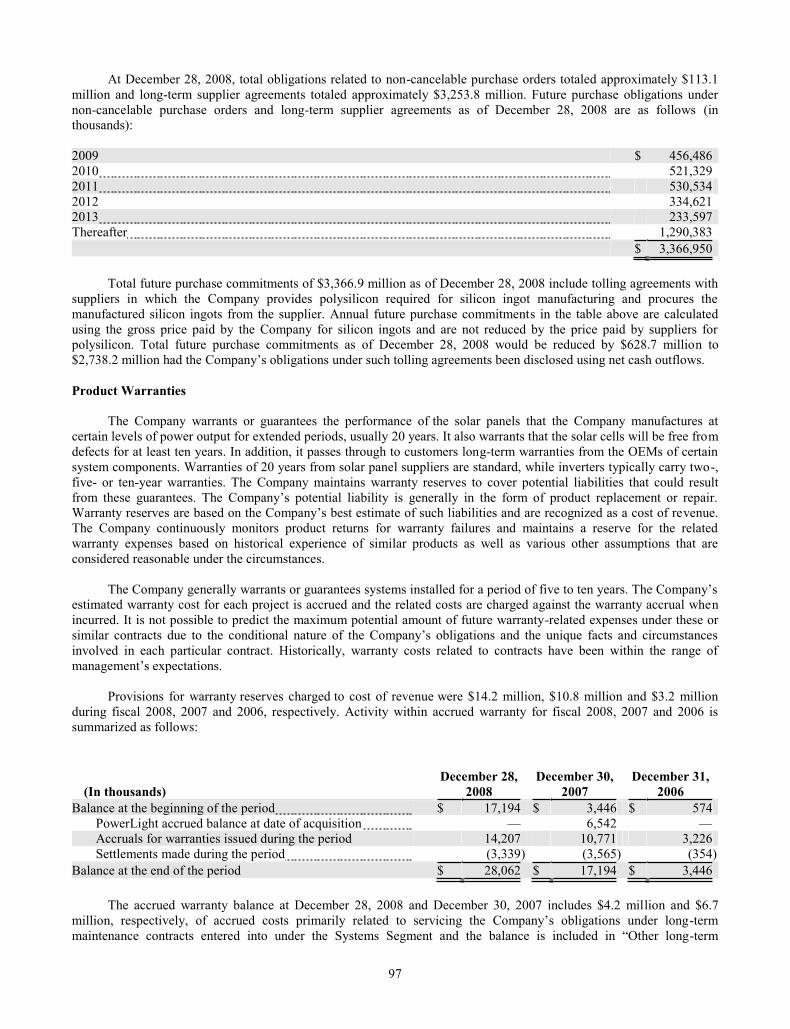
97
At December 28, 2008, total obligations related to non-cancelable purchase orders totaled approximately $113.1 million and long-term supplier agreements totaled approximately $3,253.8 million. Future purchase obligations under non-cancelable purchase orders and long-term supplier agreements as of December 28, 2008 are as follows (in thousands):
2009 $ 456,486 2010 521,329 2011 530,534 2012 334,621 2013 233,597 Thereafter 1,290,383 $ 3,366,950
Total future purchase commitments of $3,366.9 million as of December 28, 2008 include tolling agreements with suppliers in which the Company provides polysilicon required for silicon ingot manufacturing and procures the manufactured silicon ingots from the supplier. Annual future purchase commitments in the table above are calculated using the gross price paid by the Company for silicon ingots and are not reduced by the price paid by suppliers for polysilicon. Total future purchase commitments as of December 28, 2008 would be reduced by $628.7 million to
Product Warranties
The Company warrants or guarantees the performance of the solar panels that the Company manufactures at certain levels of power output for extended periods, usually 20 years. It also warrants that the solar cells will be free from defects for at least ten years. In addition, it passes through to customers long-term warranties from the OEMs of certain system components. Warranties of 20 years from solar panel suppliers are standard, while inverters typically carry two-, five- or ten-year warranties. The Company maintains warranty reserves to cover potential liabilities that could result
venue. The Company continuously monitors product returns for warranty failures and maintains a reserve for the related warranty expenses based on historical experience of similar products as well as various other assumptions that are considered reasonable under the circumstances.
estimated warranty cost for each project is accrued and the related costs are charged against the warranty accrual when incurred. It is not possible to predict the maximum potential amount of future warranty-related expenses under these or
involved in each particular contract. Historically, warranty costs related to contracts have been within the range of
Provisions for warranty reserves charged to cost of revenue were $14.2 million, $10.8 million and $3.2 million during fiscal 2008, 2007 and 2006, respectively. Activity within accrued warranty for fiscal 2008, 2007 and 2006 is summarized as follows:
(In thousands) December 28,
2008 December 30,
2007 December 31,
2006Balance at the beginning of the period $ 17,194 $ 3,446 $ 574 PowerLight accrued balance at date of acquisition 6,542 Accruals for warranties issued during the period 14,207 10,771 3,226 Settlements made during the period (3,339 ) (3,565) (354 )Balance at the end of the period $ 28,062 $ 17,194 $ 3,446
The accrued warranty balance at December 28, 2008 and December 30, 2007 includes $4.2 million and $6.7 -term -term

98
Consolidated Balance Sheets.
FIN 48 Uncertain Tax Positions
As of December 28, 2008 and December 30, 2007, total liabilities associated with FIN 48, uncertain tax positions were $12.8 million and $4.1 million, respectively, and are included in "Other long-term liabilities" on its Consolidated Balance Sheets at December 28, 2008 and December 30, 2007, respectively, as they are not expected to be paid within the next twelve months. Due to the complexity and uncertainty associated with its tax positions, the Company cannot make a reasonably reliable estimate of the period in which cash settlement will be made for its liabilities associated with uncertain tax positions in "Other long-term liabilities."
Royalty Obligations
As of January 10, 2007, the Company assumed certain royalty obligations related to existing agreements entered into by PowerLight before the date of acquisition. In September 2002, PowerLight entered into a Technology Assignment and Services Agreement and other ancillary agreements, subsequently amended in December 2005, with Jefferson Shingleton and MaxTracker Services, LLC, a New York limited liability company controlled by Mr. Shingleton. Under the agreements, the PowerTracker®, now referred to as SunPower® Tracker, was acquired through an assignment and acquisition of the patents associated with the product from Mr. Shingleton and the Company is obligated to pay Mr. Shingleton royalties on the tracker systems that it sells. In addition, several of the Systems
products developed or enhanced from such government awards. The Company incurred royalty expense totaling $1.5 million and $2.6 million in fiscal 2008 and 2007, respectively, which were charged to cost of systems revenue. As of
royalty liabilities totaled $0.6 million and $0.3 million, respectively.
Indemnifications
The Company is a party to a variety of agreements pursuant to which it may be obligated to indemnify the other party with respect to certain matters. Typically, these obligations arise in connection with contracts and license agreements or the sale of assets, under which the Company customarily agrees to hold the other party harmless against losses arising from a breach of warranties, representations and covenants related to such matters as title to assets sold, negligent acts, damage to property, validity of certain intellectual property rights, non-infringement of third-party rights and certain tax related matters. In each of these circumstances, payment by the Company is typically subject to the other party making a claim to the Company pursuant to the procedures specified in the particular contract. These procedures
representations or covenants, to control the defense or settlement of any third-party claims brought against the other
replace or correct the products or terminate the agreement with a refund to the other party), duration and/or amounts. In some instances, the Company may have recourse against third-parties and/or insurance covering certain payments made by the Company.
Legal Matters
From time to time the Company is a party to litigation matters and claims that are normal in the course of its operations. While the Company believes that the ultimate outcome of these matters will not have a material adverse effect on the Company, the outcome of these matters is not determinable and negative outcomes may adversely affect its financial position, liquidity or results of operations.
Note 10. JOINT VENTURES
In the third quarter of fiscal 2006, the Company entered into an agreement with Woongjin Coway Co., Ltd.
manufacture monocrystalline silicon ingots. Under the joint venture, the Company and Woongjin have funded the joint venture through capital investments. In addition, Woongjin Energy obtained a $33.0 million loan originally guaranteed

99
by Woongjin. Until Woongjin Energy engages in an IPO, Woongjin Energy will refrain from declaring or making any distributions, including dividends, unless its debt-to-equity ratio immediately following such distribution would not be greater than 200.0%. The Company supplies polysilicon, services and technical support required for the silicon ingot manufacturing to the joint venture, and the Company procures the manufactured silicon ingots from the joint venture under a five-year agreement. Woongjin Energy began manufacturing in the third quarter of fiscal 2007. In fiscal 2008 and 2007, the Company paid $52.7 million and $2.3 million, respectively, to Woongjin Energy for manufacturing silicon ingots. As of December 28, 2008 and December 30, 2007, $22.5 million and $2.4 million, respectively, remained due and payable to Woongjin Energy.
In October 2007, the Company entered into an agreement with Woongjin and Woongjin Holdings Co., Ltd.
Holdings and Woongjin Holdings assumed all rights and obligations formerly owned by Woongjin under the joint venture agreement described above, including the $33.0 million loan guarantee. In January 2008, the Company and Woongjin Holdings provided Woongjin Energy with additional funding through capital investments in which the Company invested an additional $5.4 million in the joint venture.
As of December 28, 2008, the Company had a $24.0 million investment in the joint venture on its Consolidated Balance Sheets which consisted of a 40.0% equity investment. As of December 30, 2007, the Company had a $4.4 million investment in the joint venture on its Consolidated Balance Sheets which consisted of a 19.9% equity investment
additional 20.1% equity ownership in the joint venture. The Company exercised the option and converted the note into equity in September 2008. The Company periodically evaluates the qualitative and quantitative attributes of its relationship with Woongjin Energy to determine whether the Company is the primary beneficiary of the joint venture
concluded it is not the primary beneficiary of the joint venture because Woongjin Energy supplies only a portion of the
estimated economic life of the joint venture. In addition, the Company believes that Woongjin Holdings is the primary beneficiary of the joint venture because Woongjin Holdings guarantees the initial $33.0 million loan for Woongjin Energy and exercises significant control ov
The Company accounts for its investment in Woongjin Energy using the equity method of accounting, in which -
in the Consolidated -over-year due to 1)
increases in production since Woongjin Energy began manufacturing in the third quarter of fiscal 2007; 2) the y investment increased from 19.9% as of December 30, 2007 to 40.0% as of December 28, 2008; and 3)
a $6.3 million foreign currency transaction gain resulted from the strengthening of the U.S. dollar versus the Korean Won. Neither party has contractual oblimaximum exposure to loss as a result of its involvement with Woongjin Energy is limited to its investment of $24.0 million as of December 28, 2008.
In fiscal 2008 and 2007, the Company conducted other related-party transactions with Woongjin Energy. For fiscal 2008 and 2007, the Company recognized $5.6 million and $5.8 million, respectively, in components revenue related to the sale of solar panels to Woongjin Energy. As of December 28, 2008 and December 30, 2007, $0.8 million and $3.2 million, respectively, remained due and receivable from Woongjin Energy related to the sale of solar panels.
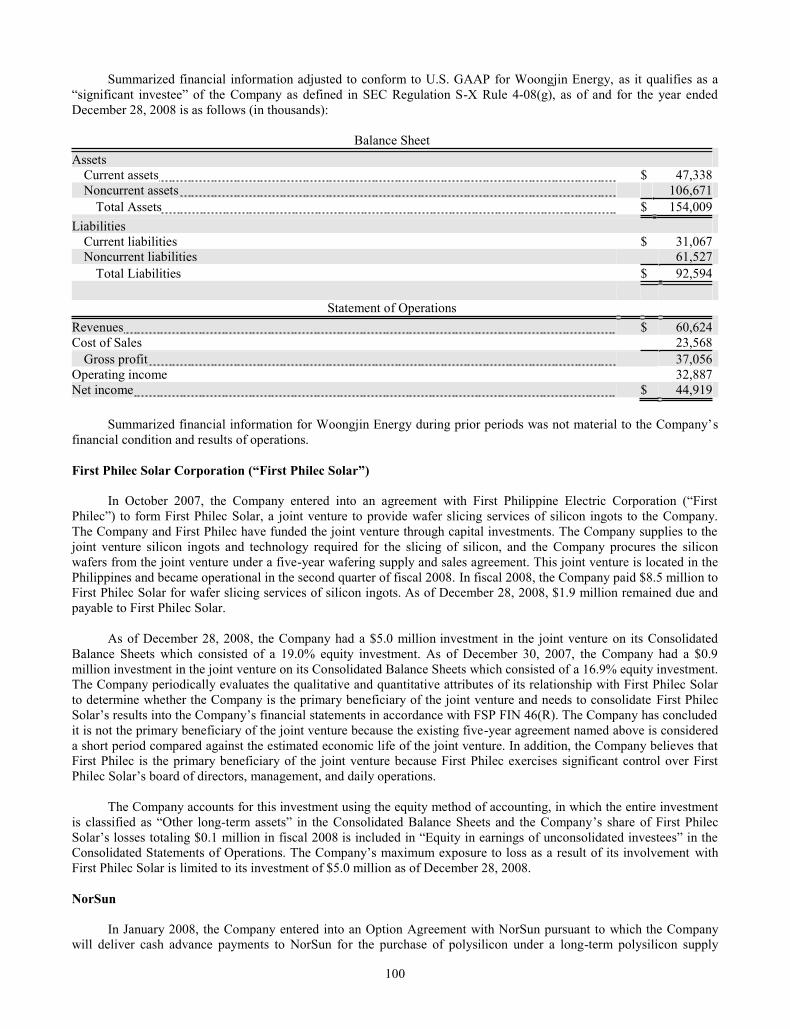
100
Summarized financial information adjusted to conform to U.S. GAAP for Woongjin Energy, as it qualifies as a -X Rule 4-08(g), as of and for the year ended
December 28, 2008 is as follows (in thousands):
Balance Sheet Assets
Current assets $ 47,338 Noncurrent assets 106,671
Total Assets $ 154,009 Liabilities
Current liabilities $ 31,067 Noncurrent liabilities 61,527
Total Liabilities $ 92,594
Statement of Operations Revenues $ 60,624 Cost of Sales 23,568
Gross profit 37,056 Operating income 32,887 Net income $ 44,919
sfinancial condition and results of operations.
joint venture to provide wafer slicing services of silicon ingots to the Company. The Company and First Philec have funded the joint venture through capital investments. The Company supplies to the joint venture silicon ingots and technology required for the slicing of silicon, and the Company procures the silicon wafers from the joint venture under a five-year wafering supply and sales agreement. This joint venture is located in the Philippines and became operational in the second quarter of fiscal 2008. In fiscal 2008, the Company paid $8.5 million to First Philec Solar for wafer slicing services of silicon ingots. As of December 28, 2008, $1.9 million remained due and payable to First Philec Solar.
As of December 28, 2008, the Company had a $5.0 million investment in the joint venture on its Consolidated Balance Sheets which consisted of a 19.0% equity investment. As of December 30, 2007, the Company had a $0.9 million investment in the joint venture on its Consolidated Balance Sheets which consisted of a 16.9% equity investment. The Company periodically evaluates the qualitative and quantitative attributes of its relationship with First Philec Solar to determine whether the Company is the primary beneficiary of the joint venture and needs to consolidate First Philec
it is not the primary beneficiary of the joint venture because the existing five-year agreement named above is considered a short period compared against the estimated economic life of the joint venture. In addition, the Company believes that First Philec is the primary beneficiary of the joint venture because First Philec exercises significant control over First
ard of directors, management, and daily operations.
The Company accounts for this investment using the equity method of accounting, in which the entire investment -
with First Philec Solar is limited to its investment of $5.0 million as of December 28, 2008.
NorSun
In January 2008, the Company entered into an Option Agreement with NorSun pursuant to which the Company will deliver cash advance payments to NorSun for the purchase of polysilicon under a long-term polysilicon supply

101
agreement with NorSun, which NorSun will use to partly fund its portion of the equity investment in the joint venture with Swicorp Joussour Company and Chemical Development Company for the construction of a new polysilicon
right to such advance payments. NorSun will initially hold a fifty percent equity interest in the joint venture. Under the terms of the Option Agreement, the Company may exercise a call option and apply the advance payments to purchase
The Company may exercise its option at any time until six months following the commercial operation of the Saudi Arabian polysilicon manufacturing facility. The Option Agreement also provides NorSun an option to put half, subject to certain adjustments, of its fifty percent equity interest in the joint venture to the Company. 1, 2009 through six months following commercial operation of the polysilicon manufacturing facility. The Company accounts for the put and call options as one instrument, which are measured at fair value at each reporting period. The changes in the fair value of the combined option Operations. The fair value of the combined option at December 28, 2008 was not material.
Note 11. DEBT AND CREDIT SOURCES
Line of Credit
On July 13, 2007, the Company entered into a credit agreement with Wells Fargo and has entered into amendments to the credit agreement from time to time. As of December 28, 2008, the credit agreement provides for a $50.0 million uncollateralized revolving credit line, with a $50.0 million uncollateralized letter of credit subfeature, and a separate $150.0 million collateralized letter of credit facility. The Company may borrow up to $50.0 million and request that Wells Fargo issue up to $50.0 million in letters of credit under the uncollateralized letter of credit subfeature. Letters
ne. Additionally, the Company may request that Wells Fargo issue up to $150.0 million in letters of credit under the collateralized letter of credit facility through July 31, 2012. As detailed in the agreement, the Company pays interest of LIBOR plus 1.25% on outstanding borrowings under the uncollateralized revolving credit line, and a fee of 1.0% and 0.2% for outstanding letters of credit under the uncollateralized letter of credit subfeature and collateralized letter of credit facility, respectively. At any time, the Company can prepay outstanding loans. In February 2009, the Company amended the credit agreement to extend the expiration date for the uncollateralized revolving credit line and uncollateralized letter of credit subfeature from April 4, 2009 to July 3, 2009. In addition, the Company is negotiating another amendment to revise the existing credit agreement with Wells Fargo to further extend the expiration date for the uncollateralized revolving credit line and uncollateralized letter of credit subfeature. All letters of credit issued under thecollateralized letter of credit facility expire no later than July 31, 2012. If the Company and Wells Fargo do not agree to amend the credit agreement to futher extend the deadline, all borrowings under the uncollateralized revolving credit line must be repaid by July 3, 2009, and all letters of credit issued under the uncollateralized letter of credit subfeature expire on or before July 3, 2009 unless the Company provides by such date collateral in the form of cash or cash equivalents in the aggregate amount available to be drawn under letters of credit outstanding at such time.
In connection with the credit agreement, the Company entered into a security agreement with Wells Fargo, granting a security interest in a securities account and deposit account to secure its obligations in connection with any letters of credit that might be issued under the credit agreement. SunPower North America, Inc., SP Systems and SunPower Systems SA, all wholly-owned subsidiaries of the Company, also entered into an associated continuing guaranty with Wells Fargo. The terms of the credit agreement include certain conditions to borrowings, representations and covenants, and events of default customary for financing transactions of this type. If the Company fails to comply with the financial and other restrictive covenants contained in the credit agreement resulting in an event of default, all debt could become immediately due and payable. Financial and other restrictive covenants include, but are not limited to, net income adjusted for purchase accounting not less than $1.00 in each period of four consecutive quarters as of the recently completed fiscal quarter, total liabilities divided by tangible net worth not exceeding two to one as of the end of each fiscal quarter; and no declaration or payment of dividends.
As of December 28, 2008 and December 30, 2007, letters of credit totaling $29.9 million and $32.0 million, respectively, were issued by Wells Fargo under the uncollateralized letter of credit subfeature. In addition, letters of credit totaling $76.5 million and $47.9 million were issued by Wells Fargo under the collateralized letter of credit facility as of December 28, 2008 and December 30, 2007, respectively. On December 28, 2008 and December 30, 2007, cash available to be borrowed under the uncollateralized revolving credit line was $20.1 million and $18.0 million, respectively, and includes letter of credit capacities available to be issued by Wells Fargo under the uncollateralized
102
letter of credit subfeature of $20.1 million and $8.0 million, respectively. Letters of credit available under the collateralized letter of credit facility at December 28, 2008 and December 30, 2007 totaled $73.5 million and $2.1 million, respectively.
Debt Issuance with the Malaysian Government
On December 18, 2008, the Company entered into a facility agreement with the Malaysian Government. In connection with the facility agreement, the Company executed a debenture and deed of assignment in favor of the Malaysian Government, granting a security interest in a deposit account and all assets of SunPower Malaysia
-owned subsidiary of the Company, to secure its obligations under the facility agreement.
Under the terms of the facility agreement, the Company may borrow up to Malaysian Ringgit 1.0 billion (approximately $287.4 million) to finance the construction of its planned third solar cell manufacturing facility in Malaysia. The loans within the facility agreement are divided into two tranches that may be drawn through June 2010. Principal is to be repaid in six quarterly payments starting in July 2015, and a non-weighted average interest rate of approximately 4.4% per annum accrues and is payable starting in July 2015. As of December 28, 2008, the Company had borrowed Malaysian Ringgit 190.0 million (approximately $54.6 million) under the facility agreement. In January 2009, the Company borrowed an additional Malaysian Ringgit 185.0 million (approximately $51.0 million) under the facility agreement. The Company has the ability to prepay outstanding loans and all borrowings must be repaid by October 30, 2016. The terms of the facility agreement include certain conditions to borrowings, representations and covenants, and events of default customary for financing transactions of this type.
1.25% and 0.75% Convertible Debt Issuance
In February 2007, the Company issued $200.0 million in principal amount of its 1.25% senior convertible debentures. Interest on the 1.25% debentures is payable on February 15 and August 15 of each year, commencing August 15, 2007. The 1.25% debentures will mature on February 15, 2027. Holders may require the Company to repurchase all or a portion of their 1.25% debentures on each of February 15, 2012, February 15, 2017 and February 15, 2022, or if the Company experiences certain types of corporate transactions constituting a fundamental change. In addition, the Company may redeem some or all of the 1.25% debentures on or after February 15, 2012. The 1.25% debentures are initially convertible, subject to certain conditions, into cash up to the lesser of the principal amount or the conversion value. If the conversion value is greater than $1,000, then the excess conversion value will be convertible into common stock. The initial effective conversion price of the 1.25% debentures is approximately $56.75 per share, which represented a premium of 27.5% to the closing price of the Company's common stock on the date of issuance. The applicable conversion rate will be subject to customary adjustments in certain circumstances.
In July 2007, the Company issued $225.0 million in principal amount of its 0.75% senior convertible debentures. Interest on the 0.75% debentures is payable on February 1 and August 1 of each year, commencing February 1, 2008. The 0.75% debentures will mature on August 1, 2027. Holders may require the Company to repurchase all or a portion of their 0.75% debentures on each of August 1, 2010, August 1, 2015, August 1, 2020, and August 1, 2025, or if the Company is involved in certain types of corporate transactions constituting a fundamental change. In addition, the Company may redeem some or all of the 0.75% debentures on or after August 1, 2010. Therefore, the 0.75% debentures will be classified as short-0.75% debentures are initially convertible, subject to certain conditions, into cash up to the lesser of the principal amount or the conversion value. If the conversion value is greater than $1,000, then the excess conversion value will be
effective conversion price of the 0.75% debentures is approximately $82.24 per share, which represented a premium of 27.5% to the closing price of the Company's common stock on the date of issuance. The applicable conversion rate will be subject to customary adjustments in certain circumstances.
The 1.25% debentures and 0.75% debentures are senior, unsecured obligations of the Company, ranking equally with all existing and future senior unsecured indebtedness of the Company. The 1.25% debentures and 0.75% debentures ar
debentures and 0.75% debentures do not contain any covenants or sinking fund requirements.

103
exceeded 125% of the $56.75 per share initial effective conversion price governing the 1.25% debentures and the closing
conversion price governing the 0.75% debentures, for 20 out of 30 consecutive trading days ending on December 30, 2007. As a result, the market price conversion trigger pursuant to the terms of both debentures was satisfied. As of the first trading day of the first quarter in fiscal 2008, holders of the 1.25% debentures and 0.75% debentures were able to exercise their right to convert the debentures any day in that fiscal quarter. Therefore, since holders of the 1.25% debentures and 0.75% debentures were able to exercise their right to convert the debentures in the first quarter of fiscal 2008, the Company classified the $425.0 million in aggregate convertible debt as short-term debt in its Consolidated Balance Sheets as of December 30, 2007. In addition, the Company wrote off $8.2 million and $1.0 million of unamortized debt issuance costs in the fourth quarter of fiscal 2007 and first quarter of fiscal 2008, respectively. No holders of the 1.25% debentures and 0.75% debentures exercised their right to convert the debentures in the first quarter of fiscal 2008.
For the quarter ended September 28, 2008, the closing prexceeded 125% of the $56.75 per share initial effective conversion price governing the 1.25% debentures for 20 out of 30 consecutive trading days ending on September 28, 2008, thus satisfying the market price conversion trigger pursuant to the terms of the 1.25% debentures. During the fourth quarter in fiscal 2008, holders of the 1.25% debentures were able to exercise their right to convert the debentures any day in that fiscal quarter. As of December 28, 2008, the Company received notices for the conversion of approximately $1.4 million of the 1.25% debentures which the Company has settled for approximately $1.2 million in cash and 1,000 shares of class A common stock.
Because the closing price of the during the fiscal quarter ending December 28, 2008 did not equal or exceed $70.94, or 125% of the applicable conversion price for its 1.25% debentures, and $102.80, or 125% of the applicable conversion price governing our 0.75% debentures, holders of the 1.25% debentures and 0.75% debentures are unable to exercise their right to convert the debentures, based on the market price conversion trigger, any day in the first quarter of fiscal 2009, which began on December 29, 2008. Accordingly, the Company classified the $423.6 million in aggregate convertible debt as long-term debt in its Consolidated Balance Sheets as of December 28, 2008. This test is repeated each fiscal quarter, therefore, if the market price conversion trigger is satisfied in a subsequent quarter, the debentures may again be re-classified as short-term debt.
As of December 28, 2008 December 30, 2007
(In thousands) Carrying Value Fair Value* Carrying Value Fair Value*1.25% debentures $ 198,608 $ 143,991 $ 200,000 $ 465,576 0.75% debentures 225,000 166,747 225,000 366,316 Total convertible debt $ 423,608 $ 310,738 $ 425,000 $ 831,892
* The fair value of the convertible debt was determined based on quoted market prices as reported by Bloomberg.
February 2007 Amended and Restated Share Lending Arrangement and July 2007 Share Lending Arrangement
Concurrent with the offering of the 1.25% debentures, the Company lent approximately 2.9 million shares of its class A common stock to LBIE, an affiliate of Lehman Brothers, one of the underwriters of the 1.25% debentures. Concurrent with the offering of the 0.75% debentures, the Company also lent approximately 1.8 million shares of its class A common stock to CSI, an affiliate of Credit Suisse, one of the underwriters of the 0.75% debentures. The loaned shares are to be used to facilitate the establishment by investors in the 1.25% debentures and 0.75% debentures of
ments for subsequent purchasers of both the 1.25% may issue in the future. The Company did not receive any proceeds from these offerings of class A common stock, but received a nominal lending fee of $0.001 per share for each share of common stock that is loaned pursuant to the share lending agreements described below.

104
Share loans under the share lending agreement terminate and the borrowed shares must be returned to the Company under the following circumstances: (i) LBIE and CSI may terminate all or any portion of a loan at any time; (ii) the Company may terminate any or all of the outstanding loans upon a default by LBIE and CSI under the share lending agreement, including a breach by LBIE and CSI of any of its representations and warranties, covenants or agreements under the share lending agreement, or the bankruptcy or administrative proceeding of LBIE and CSI; or (iii) if the Company enters into a merger or similar business combination transaction with an unaffiliated third-party (as defined in the agreement). In addition, CSI has agreed to return to the Company any borrowed shares in its possession on the date anticipated to be five business days before the closing of certain merger or similar business combinations described in the share lending agreement. Except in limited circumstances, any such shares returned to the Company cannot be re-borrowed.
Any shares loaned to LBIE and CSI are considered issued and outstanding for corporate law purposes and,
including the right to vote the shares on all matters submitted to a vote of the Compreceive any dividends or other distributions that the Company may pay or make on its outstanding shares of class A common stock. The shares are listed for trading on The Nasdaq Global Select Market.
While the share lending agreement does not require cash payment upon return of the shares, physical settlement is required (i.e., the loaned shares must be returned at the end of the arrangement). In view of this share return provision and other contractual undertakings of LBIE and CSI in the share lending agreement, which have the effect of substantially eliminating the economic dilution that otherwise would result from the issuance of the borrowed shares, historically the loaned shares were not considered issued and outstanding for the purpose of computing and reporting the
filed a petition for protection under Chapter 11 of the U.S. bankruptcy code, and LBIE commenced administration proceedings (analogous to bankruptcy) in the United Kingdom. After reviewing the circumstances of the Lehman bankruptcy and LBIE administration proceedings, the Company records the shares lent to LBIE as issued and outstanding starting on September 15, 2008, the date on which LBIE commenced administration proceedings, for the
The shares lent to CSI will continue to be excbasic and diluted weighted average shares or earnings per share. If Credit Suisse or its affiliates, including CSI, were to file bankruptcy or commence similar administrative, liquidating, restructuring or other proceedings, the Company may have to consider approximately 1.8 million shares lent to CSI as issued and outstanding for purposes of calculating earnings per share.
Note 12. FOREIGN CURRENCY DERIVATIVES
The Company has non-U.S. subsprimarily in Europe. As a result, the Company is exposed to risks associated with changes in foreign currency exchange
nstruments to manage the exposures associated with purchases of foreign sourced equipment, net asset or liability positions of its subsidiaries and forecasted revenues and expenses. The counterparties to these hedging transactions are creditworthy multinational banks and the risk of counterparty nonperformance associated with these contracts is not expected to be material. In connection with its global tax planning, the Company recently changed the flow of transactions to European subsidiaries that have Euro functional currency, resulting in greater exposure to changes in the value of the Euro. Implementation of this tax strategy had, and will
-denominated revenue. The Company currently does not enter into foreign currency derivative financial instruments for speculative or trading purposes.
Under SFAS No. 133, the Company is required to recognize all derivative instruments as either assets or liabilities at fair value in the Consolidated Balance Sheets. The Company calculates the fair value of its option and forward contracts based on market volatilities, spot rates and interest differentials from published sources. The following table presents information ab28, 2008 and indicates the fair value hierarchy of the valuation techniques utilized by the Company to determine such fair value in accordance with the provisions of SFAS No. 157:

105
(In thousands) Balance Sheet Location
Significant OtherObservable Inputs
(Level 2)Asset Foreign currency forward exchange contracts Prepaid expenses and other current assets $ 2,592 Foreign currency option contracts Prepaid expenses and other current assets 8,851 $ 11,443 Liability Foreign currency forward exchange contracts Accrued liabilities $ 29,816 Foreign currency option contracts Accrued liabilities 15,975 $ 45,791
Cash Flow Hedges
In accordance with SFAS No. 133, the Company accounts for its hedges of forecasted foreign currency revenue and cost of revenue as cash flow hedges. Changes in fair value of the effective portion of hedge contracts are recorded in
effective portion of unrealized losses recorded in accumulated other comprehensive income (loss) were $26.1 million, $3.9 million and $2.1 million as of December 28, 2008, December 30, 2007 and December 31, 2006, respectively. Amounts deferred in accumulated other comprehensive income (loss) are reclassified to other, net in the Consolidated Statements of Operations in the periods in which the hedged exposure impacts earnings. As of December 28, 2008, the Company had outstanding cash flow hedge forward contracts and option contracts with an aggregate notional value of $364.5 million and $147.5 million, respectively. As of December 30, 2007, the Company had outstanding cash flow hedge forward contracts with an aggregate notional value of $140.1 million. The maturity dates of the outstanding contracts at December 28, 2008 ranged from January 2009 to December 2009. In the second quarter of fiscal 2008, the Company discontinued a portion of an existing cash flow hedge of foreign currency revenue when it determined it was probable that the original forecasted transaction would not occur by the end of the originally specified time period. The amount of derivative loss totaling $0.8 million was reclassified from accumulated other comprehensive income (loss) to other, net in fiscal 2008 as a result of the discontinuance of the cash flow hedge.
Cash flow hedges are tested for effectiveness each period on a average to average rate basis using regression was immaterial during fiscal 2008, 2007 and
2006. effectiveness. The premium paid or time value of an option whose strike price is equal to or greater than the market price on the date of purchase is recorded as an asset in the Consolidated Balance Sheets. Thereafter, any change to this time
a loss of $6.5 million for fiscal 2008 due to loss in time value.
Other Derivatives
Other derivatives not designated as hedging instruments under SFAS No. 133 consist of forward contracts used to hedge the net balance sheet effect of foreign currency denominated assets and liabilities primarily for intercompany transactions, receivables from customers, prepayments to suppliers and advances received from customers. The Company records its hedges of foreign currency denominated monetary assets and liabilities at fair value with the related gains or losses recorded in other, net. The gains or losses on these contracts are substantially offset by transaction gains or losses on the underlying balances being hedged. As of December 28, 2008 and December 30, 2007, the Company held forward contracts with an aggregate notional value of $66.6 million and $62.7 million, respectively, to hedge the risks associated with foreign currency denominated assets and liabilities.
Note 13. INCOME TAXES
The Company applies SFAS No. 109, which requires the Company to recognize deferred tax assets and liabilities for expected future tax consequences of events that have been recognized in the financial statements or tax returns. Under this method, deferred tax assets and liabilities are determined based on the difference between the financial

106
statement and tax basis of assets and liabilities using the enacted tax rates in effect for the year in which the differences are expected to reverse. SFAS No. 109 requires deferred tax assets and liabilities to be adjusted when the tax rates or other provisions of the income tax laws change.
The geographic distribution of income (loss) before income taxes and equity in earnings of unconsolidated investees and the components of provision for (benefit from) income taxes are summarized below:
Year Ended
(In thousands) December 28,
2008 December 30,
2007 December 31,
2006 Geographic distribution of income (loss) before income taxes
and equity in earnings of unconsolidated investees: U.S. income (loss) $ 25,145 $ (93,881) $ 3,419 Non-U.S. income 122,439 97,441 25,042
Income before income taxes and equity in earnings of unconsolidated investees $ 147,584 $ 3,560 $ 28,461
Provision for (benefit from) income taxes:
Current tax (benefit) expense Federal $ 61,699 $ (67) $ 241 State 11,641 647 100 Foreign 15,253 12,319 1,604
Total current tax expense 88,593 12,899 1,945 Deferred tax benefit
Federal (17,253 ) (14,499) State (1,972 ) (4,320) Foreign
Total deferred tax benefit (19,225 ) (18,819) Provision for (benefit from) income taxes $ 69,368 $ (5,920) $ 1,945
The income tax provision (benefit) differs from the amounts obtained by applying the statutory U.S. federal tax rate to income before taxes as shown below:
Year Ended
(In thousands) December 28,
2008 December 30,
2007 December 31,
2006 Statutory rate 35 % 35% 35%Tax at U.S. statutory rate $ 51,654 $ 1,246 $ 9,961 Foreign rate differential (21,472 ) (20,731) (7,162)State income taxes, net of benefit 11,064 647 65 Recognition of prior year benefits (1,205)Purchased in-process research and development 3,351 Impairment of acquisition-related intangible assets 4,924 Alternative minimum tax 67 Tax credits (research and development/investment tax credit) (9,933 ) Amortization of intangible assets 5,287 Non-deductible unrealized gain (loss) 3,292 Book-to-tax differences 8,197 Benefit of net operating losses not recognized 1,329 Non-deductible stock option compensation expense 19,581 3,227 241 Other, net 1,698 20 45
Total $ 69,368 $ (5,920) $ 1,945

107
(In thousands)December 28,
2008 December 30,
2007 Deferred tax assets:
Net operating loss carryforwards $ 864 $ 709 Research and development credit and California manufacturing
credit carryforwards 2,466 1,491 Reserves and accruals 30,103 16,456 SFAS No. 133 unrealized losses 3,482 SFAS No. 123(R) stock deductions 30,184 13,630
Total deferred tax asset 67,099 32,286 Valuation allowance (45,932 ) (13,924 )
Total deferred tax asset, net of valuation allowance 21,167 18,362 Deferred tax liabilities:
Intangible assets (13,774 ) (16,138 )Equity interest in Woongjin Energy (5,600 )
Total deferred tax liabilities (19,374 ) (16,138 )Net deferred tax asset $ 1,793 $ 2,224
As of December 28, 2008, the Company had federal net operating loss carryforwards of approximately $57.6 million for tax purposes, which relate to stock deductions that when realized will benefit equity. These federal net operating loss carryforwards will expire in 2027. As of December 28, 2008, the Company had California state net operating loss carryforwards of approximately $73.6 million for tax purposes, of which $58.6 million relate to stock deductions that when realized will benefit equity. These California net operating loss carryforwards will expire at various dates from 2011 to 2017. The Company also had research and development credit carryforwards of approximately $4.0 million for federal tax purpnet operating loss carryforwards is dependent upon the Company being able to generate taxable income in future periods and may be limited due to restrictions imposed on utilization of net operating loss and credit carryforwards under federal and state laws upon a change in ownership, such as the transaction with Cypress.
The Company is subject to tax holidays in the Philippines, where it manufactures its products. The tax holidays are scheduled to expire within the next several years beginning in 2010, unless extended. The Company is subject to a tax holiday in Switzerland, where it sells its products. This tax holiday is scheduled to expire in 2009, and the Company is currently in discussions with the Swiss authority regarding an extension.
approximately $154.1 million that are intended to be indefinitely reinvested outside the U.S. and, accordingly, no provision for U.S. federal and state tax has been made for the distribution of these earnings. At December 28, 2008 the amount of the unrecognized deferred tax liability on the indefinitely reinvested earnings was $61.6 million.
Unrecognized Tax Benefits
On January 1, 2007, the Company adopted the provisions for FIN 48, which is an interpretation of SFAS No. 109. FIN 48 prescribes a recognition threshold that a tax position is required to meet before being recognized in the financial statements and provides guidance on de-recognition, measurement, classification, interest and penalties, accounting in interim periods, disclosure and transition issues. FIN 48 contains a two-step approach to recognizing and measuring uncertain tax positions accounted for in accordance with SFAS No. 109. The first step is to evaluate the tax position for recognition by determining if the weight of available evidence indicates that it is more likely than not that the position will be sustained on audit, including resolution of related appeals or litigation processes, if any. The second step is to measure the tax benefit as the largest amount that is more than 50% likely of being realized upon ultimate settlement.
The total amount of unrecognized tax benefits recorded in the Consolidated Balance Sheets at the date of adoption was approximately $1.1 million, which, if recognized, would affect ththe beginning and ending amounts of unrecognized tax benefits for the years ended December 28, 2008 and December 30, 2007 is as follows:

108
(In thousands) December 28,
2008 December 30,
2007Balance at the beginning of the period $ 4,172 $ 1,120
Additions based on tax positions related to the current period 8,593 2,726Additions for tax positions of prior periods 326
Balance at the end of the period $ 12,765 $ 4,172
Management believes that events that could occur in the next 12 months and cause a change in unrecognized tax benefits include, but are not limited to, the following:
commencement, continuation or compforeign taxing authorities; and
The calculation of unrecognized tax benefits involves dealing with uncertainties in the application of complex global tax regulations. Uncertainties include, but are not limited to, the impact of legislative, regulatory and judicial developments, transfer pricing and the application of withholding taxes. Management regularly atax positions in light of legislative, bilateral tax treaty, regulatory and judicial developments in the countries in which theCompany does business. Management determined that an estimate of the range of reasonably possible change in the amounts of unrecognized tax benefits within the next 12 months cannot be made.
accordance with the provisions of SFAS No. 109, which requires an assessment of both positive and negative evidence. When determining whether it is more likely than not that deferred assets are recoverable, with such assessment being required on a jurisdiction by jurisdiction basis, management believes that sufficient uncertainty exists with regard to the realizability of these assets such that a valuation allowance is necessary. Factors considered in providing a valuation allowance include the lack of a significant history of consistent profits, the lack of consistent profitability in the solar industry, and the lack of carryback capacity to realize these assets. Based on the absence of sufficient positive objective evidence, management is unable to assert that it is more likely than not that the Company will generate sufficient taxable income to realize these remaining net deferred tax assets. The amount of the deferred tax assets valuation allowance, however, could be reduced in future periods to the extent that future taxable income is realized. A portion of the valuation allowance would be released to income tax expense as it offsets deferred tax assets acquired in the acquisition of PowerLight (now known as SP Systems).
The Company adopted SFAS No. 141(R) on December 29, 2008. SFAS No. 141(R) amends the guidance in SFAS No. 109 and FIN 48 on the accounting for changes in assumed liabilities for acquired income tax uncertainties. As a result of the amendments, the manner in which changes in liabilities for income tax uncertainties are recognized is consistent with the general requirements of SFAS No. 141(R) for adjustments during the measurement period, which adjust the accounting for the business combination, and adjustments outside of the measurement period, which do not result in adjustments to the accounting for the business combination. Accordingly, changes in a liability for an assumed income tax uncertainty will be recognized as an element of the business combination if the change occurs during the measurement period, or as an adjustment to income tax expense and not as an adjustment to the accounting for the business combination. This represents a significant change from the requirements under SFAS No. 141 and SFAS No. 109, before the effective date of SFAS No. 141(R). Under that literature, changes in liabilities for acquired income tax uncertainties were accounted for as an element of the business combination, generally as a reduction to goodwill.
Classification of Interest and Penalties
The Company accrues interest and penalties on tax contingencies as required by FIN 48 and SFAS No. 109. This interest and penalty accrual is classified as income tax provision (benefit) in the Consolidated Statements of Operations and was not material for any periods presented.
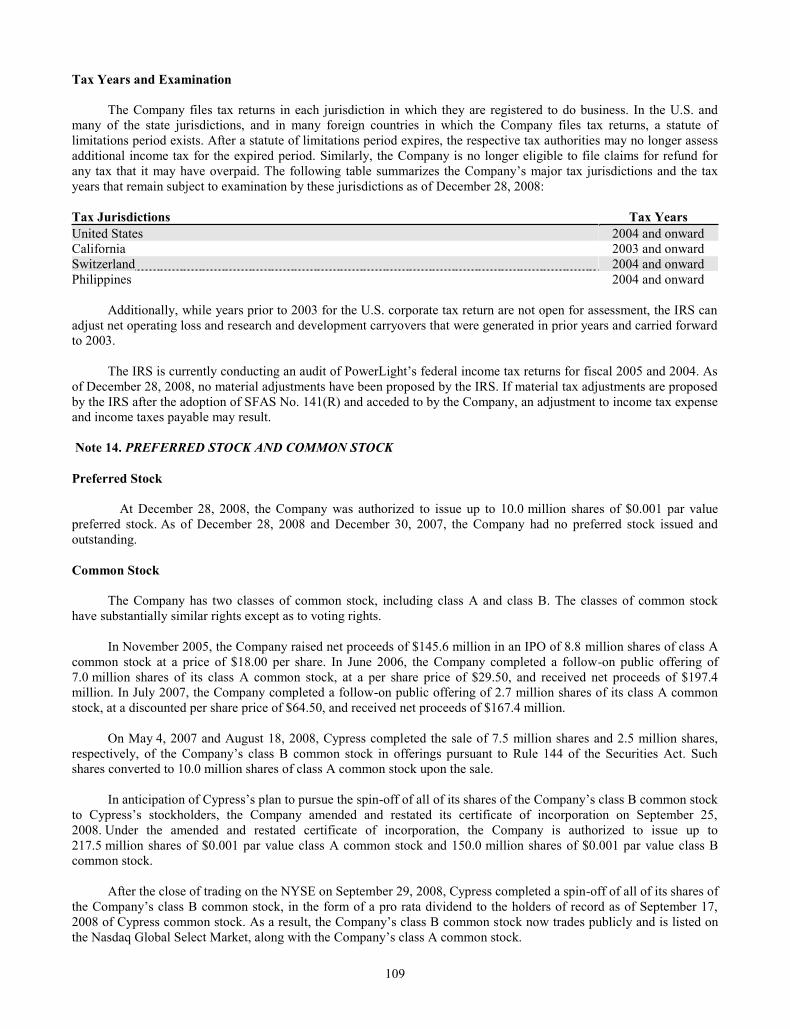
109
Tax Years and Examination
The Company files tax returns in each jurisdiction in which they are registered to do business. In the U.S. and many of the state jurisdictions, and in many foreign countries in which the Company files tax returns, a statute of limitations period exists. After a statute of limitations period expires, the respective tax authorities may no longer assess additional income tax for the expired period. Similarly, the Company is no longer eligible to file claims for refund for any tax that it may have overpaid. The following years that remain subject to examination by these jurisdictions as of December 28, 2008:
Tax Jurisdictions Tax YearsUnited States 2004 and onward California 2003 and onward Switzerland 2004 and onward Philippines 2004 and onward
Additionally, while years prior to 2003 for the U.S. corporate tax return are not open for assessment, the IRS can adjust net operating loss and research and development carryovers that were generated in prior years and carried forward to 2003.
The IRS iof December 28, 2008, no material adjustments have been proposed by the IRS. If material tax adjustments are proposed by the IRS after the adoption of SFAS No. 141(R) and acceded to by the Company, an adjustment to income tax expense and income taxes payable may result.
Note 14. PREFERRED STOCK AND COMMON STOCK
Preferred Stock
At December 28, 2008, the Company was authorized to issue up to 10.0 million shares of $0.001 par value preferred stock. As of December 28, 2008 and December 30, 2007, the Company had no preferred stock issued and outstanding.
Common Stock
The Company has two classes of common stock, including class A and class B. The classes of common stock have substantially similar rights except as to voting rights.
In November 2005, the Company raised net proceeds of $145.6 million in an IPO of 8.8 million shares of class A common stock at a price of $18.00 per share. In June 2006, the Company completed a follow-on public offering of 7.0 million shares of its class A common stock, at a per share price of $29.50, and received net proceeds of $197.4 million. In July 2007, the Company completed a follow-on public offering of 2.7 million shares of its class A common stock, at a discounted per share price of $64.50, and received net proceeds of $167.4 million.
On May 4, 2007 and August 18, 2008, Cypress completed the sale of 7.5 million shares and 2.5 million shares,
shares converted to 10.0 million shares of class A common stock upon the sale.
In -
2008. Under the amended and restated certificate of incorporation, the Company is authorized to issue up to 217.5 million shares of $0.001 par value class A common stock and 150.0 million shares of $0.001 par value class B common stock.
After the close of trading on the NYSE on September 29, 2008, Cypress completed a spin-off of all of its shares of
tock now trades publicly and is listed on

110
Common stock consisted of the following:
(In thousands, except share data)December 28,
2008 December 30,
2007Class A common stock, $0.001 par value; 217,500,000 shares authorized;
44,055,644* and 40,289,719* shares issued; 43,849,566* and 40,176,957* shares outstanding, at December 28, 2008 and December 30, 2007, respectively $ 44 $ 40
Class B common stock, $0.001 par value; 150,000,000 shares and 157,500,000 shares authorized; 42,033,287 and 44,533,287 shares issued and outstanding, at December 28, 2008 and December 30, 2007, respectively 42 45
Total common stock $ 86 $ 85
* Includes approximately 0.7 million shares of restricted stock and a total of 4.7 million shares of class A common stock lent to LBIE and CSI.
Shares Reserved for Future Issuance
The Company had shares of class A common stock reserved for future issuance as follows:
(In thousands) December 28,
2008 December 30,
2007Stock option plans 3,813 3,982
As of December 28, 2008, the voting and dividend rights of the common stock were as follows:
Voting Rights Common Stock
The class A common stock is entitled to one vote per share while the class B common stock is entitled to eight votes per share on all matters to be held by Cypress and was convertible at any time into class A common stock by its holder on a share for share basis. After the close of trading on the NYSE on September 29, 2008, Cypress completed a spin-off of all of its shares of
Following the spin-B common stock cannot convert the class lass A common stock.
Pursuant to the amended and restated certificate of incorporation, effective as of the date the IRS issued a
shares of class B common stock with respect to the election or removal of directors is restricted to 15% of the outstanding shares of class B common stock, unless such holder of class B common stock has an equivalent percentage
common stock. Because the restriction on the voting power of a holder of more
regarding the spin-off, the amended and restated certificate of incorporation provided that this voting restriction would not become effective until such date (but would automatically be effective as of such date), if any, that the IRS issued a supplemental ruling that the effectiveness of the restriction will not prevent the favorable rulings received by Cypress with respect to certain tax issues arising under Section 355 of the Code in connection with the spin-off from having full force and effect. On December 1, 2008, the IRS issued such supplemental ruling, therefore, the voting restriction provision of the amended and restated certificate of incorporation is effective.
In addition, on August 12, 2008, the Company entered into a rights agreement with Computershare Trust Company, N.A., as rights agents. The rights agre -off of the
specific features designed to address the potential for an acquirer or significant investor to take advantage of the
the rights agreement is designed to address the inequities that could result if an investor, by acquiring 20% or more of the outstanding shares of class B common stock, were able to gain significant voting influence over the Company without
pil
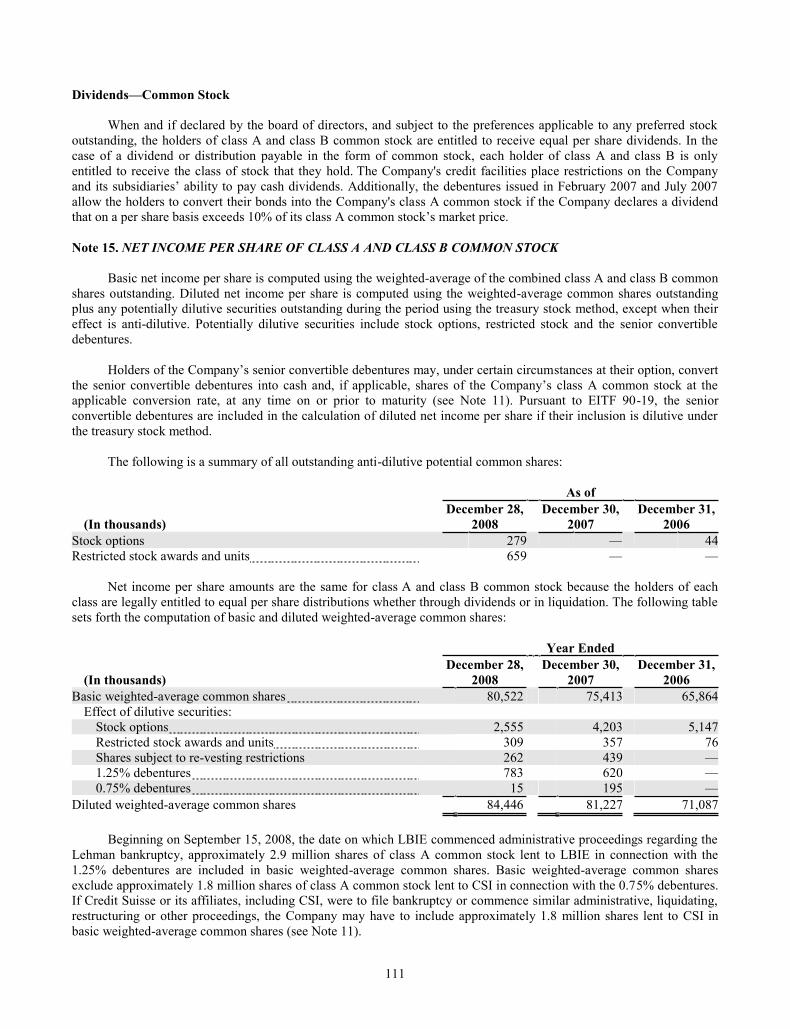
111
Dividends Common Stock
When and if declared by the board of directors, and subject to the preferences applicable to any preferred stock outstanding, the holders of class A and class B common stock are entitled to receive equal per share dividends. In the case of a dividend or distribution payable in the form of common stock, each holder of class A and class B is only entitled to receive the class of stock that they hold. The Company's credit facilities place restrictions on the Company
allow the holders to convert their bonds into the Company's class A common stock if the Company declares a dividend
Note 15. NET INCOME PER SHARE OF CLASS A AND CLASS B COMMON STOCK
Basic net income per share is computed using the weighted-average of the combined class A and class B common shares outstanding. Diluted net income per share is computed using the weighted-average common shares outstanding plus any potentially dilutive securities outstanding during the period using the treasury stock method, except when their effect is anti-dilutive. Potentially dilutive securities include stock options, restricted stock and the senior convertible debentures.
stances at their option, convert
applicable conversion rate, at any time on or prior to maturity (see Note 11). Pursuant to EITF 90-19, the senior convertible debentures are included in the calculation of diluted net income per share if their inclusion is dilutive under the treasury stock method.
The following is a summary of all outstanding anti-dilutive potential common shares:
As of
(In thousands) December 28,
2008 December 30,
2007 December 31,
2006Stock options 279 44 Restricted stock awards and units 659
Net income per share amounts are the same for class A and class B common stock because the holders of each class are legally entitled to equal per share distributions whether through dividends or in liquidation. The following table sets forth the computation of basic and diluted weighted-average common shares:
Year Ended
(In thousands) December 28,
2008 December 30,
2007 December 31,
2006Basic weighted-average common shares 80,522 75,413 65,864
Effect of dilutive securities: Stock options 2,555 4,203 5,147Restricted stock awards and units 309 357 76 Shares subject to re-vesting restrictions 262 439 1.25% debentures 783 620 0.75% debentures 15 195
Diluted weighted-average common shares 84,446 81,227 71,087
Beginning on September 15, 2008, the date on which LBIE commenced administrative proceedings regarding the Lehman bankruptcy, approximately 2.9 million shares of class A common stock lent to LBIE in connection with the 1.25% debentures are included in basic weighted-average common shares. Basic weighted-average common shares exclude approximately 1.8 million shares of class A common stock lent to CSI in connection with the 0.75% debentures. If Credit Suisse or its affiliates, including CSI, were to file bankruptcy or commence similar administrative, liquidating, restructuring or other proceedings, the Company may have to include approximately 1.8 million shares lent to CSI in basic weighted-average common shares (see Note 11).

112
For the year ended December 28, 2008, dilutive potential common shares includes approximately 0.8 million shares for the impact of the 1.25% debentures, and approximately 15,000 shares for the impact of the 0.75% debentures, as the Company had experienced a substantial increase in its common stock price during the first three quarters of fiscal 2008 as compared to the market price conversion trigger pursuant to the terms of the 1.25% and 0.75% debentures (see Note 11). Similarly, for the year ended December 30, 2007, dilutive potential common shares includes approximately 0.6 million shares for the impact of the 1.25% debentures, and approximately 0.2 million shares for the impact of the 0.75% debentures, as the Company had experienced a substantial increase in its common stock price during the second half of fiscal 2007. Under the treasury stock method, such senior convertible debentures will generally have a dilutive impact on net income per share if the for the senior convertible debentures.
Note 16. STOCK-BASED COMPENSATION AND OTHER EMPLOYEE BENEFIT PLANS
During the preparation of its consolidated financial statements for the year ended December 28, 2008, the Company identified errors in its financial statements related to the year ended December 30, 2007, which resulted in a $1.3 million overstatement of stock-based compensation expense. The Company corrected these errors in its consolidated financial statements for the year ended December 28, 2008, which resulted in a $1.3 million credit to income before income taxes and equity in earnings of unconsolidated investees and net income. The out-of-period effect is not material to -year 2008 results, and, is not material to any financial statements of prior periods.
The following table summarizes the consolidated stock-based compensation expense by line item in the Consolidated Statements of Operations:
(In thousands) December 28,
2008 December 30,
2007December 31,
2006Cost of systems revenue $ 10,745 $ 8,187 $Cost of components revenue 8,144 4,213 846 Research and development 3,988 1,817 1,197Sales, general and administrative 47,343 36,995 2,821
Total stock-based compensation expense $ 70,220 $ 51,212 $ 4,864
Consolidated net cash proceeds from the issuance of shares in connection with exercises of stock options under
respectively. The Company recognized an income tax benefit from stock option exercises of $41.5 million for fiscal 2008. No income tax benefit was realized from stock option exercises during fiscal 2007 and 2006. As required, the Company presents excess tax benefits from stock-based award activity, if any, as financing cash flows rather than operating cash flows.
The following table summarizes the consolidated stock-based compensation expense, by type of awards:
(In thousands) December 28,
2008 December 30,
2007December 31,
2006Employee stock options $ 4,256 $ 7,165 $ 3,930Non-employee stock options 304 Restricted stock awards and units 38,032 13,121 677 Shares and options released from re-vesting restrictions 28,888 31,292 Change in stock-based compensation capitalized in inventory (956 ) (366 ) (47)
Total stock-based compensation expense $ 70,220 $ 51,212 $ 4,864
In connection with the acquisition of PowerLight (now known as SP Systems) on January 10, 2007, 1.1 million
were valued at $60.4 million, are subject to certain transfer restrictions and a repurchase option held by the Company. The Company is recognizing expense as the re-vesting restrictions of these shares lapse over the two-year period beginning on the date of acquisition. The value of shares released from such re-vesting restrictions is included in stock-based compensation expense in the table above.

113
The following table summarizes the unrecognized stock-based compensation cost by type of awards:
(In thousands, except years)
As ofDecember 28,
2008
Weighted-AverageAmortization Period
(in years)Stock options $ 11,731 2.8 Restricted stock awards and units 92,756 2.6 Shares subject to re-vesting restrictions 168
Total unrecognized stock-based compensation cost $ 104,655 2.6
For stock options issued prior to the adoption of SFAS No. --based compensation cost
using the graded amortization method. For all other awards, stock-based compensation cost is recognized on a straight-line basis. Additionally, the Company issues new shares upon exercises of options by employees.
Valuation Assumptions
The determination of fair value of each stock option award on the date of grant using the Black-Scholes valuation model is affected by the stock price as well as assumptions regarding a number of highly complex and subjective variables. These variables include, but are not limited to, expected stock price volatility over the term of the awards, and actual and projected employee stock option exercise behaviors. The following weighted average assumptions were used for fiscal 2008, 2007 and 2006:
Year Ended
December 28,
2008 December 30,
2007 December 31,
2006Expected term 6.5 years 6.5 years 6.5 years Risk-free interest rate 2.69 - 3.46% 4.58 - 4.68% 4.80 - 5.11% Volatility 60% 90% 92% Dividend yield 0% 0% 0%
Expected Term:
The Company continues to utilize the simplified method under the provisions of SAB No. 110, an amendment to SAB No. 107, for estimating expected term, instead of its historical exercise data. The Company elected not to base the expected term on historical data because of the significant difference in its status before and after the effective date of SFAS No. 123(R). The Company was a privately-held company until its IPO, and the only available liquidation event for
lock-up restrictions expired, a majority of the optionees were unable to exercise and sell vested options.
Volatility:
In fiscal 2008, the Company computed the expected volatility for its equity awards based on its historical volatility from traded options with a term of 6.5 years and class A common stock. Prior to fiscal 2008, the Company computed the expected volatility for its equity awards based on historical volatility rates for a publicly-traded U.S.-based direct competitor. Because of the limited history of its stock trading publicly, the Company did not believe that its historical volatility would be representative of the expected volatility for its equity awards.
Risk-Free Interest Rate and Dividend Yield:
The interest rate is based on the U.S. Treasury yield curve in effect at the time of grant. Since the Company does not pay and does not expect to pay dividends, the expected dividend yield is zero.
Equity Incentive Programs

114
Stock Option Plans:
and Com PowerLight Plan was assumed by the Company by way of the acquisition of PowerLight on January 10, 2007. Under the terms of all three plans, the Company may issue incentive or non-statutory stock options or stock purchase rights to directors, employees and consultants to purchase common
shareholders in November 2005. The 2005 Plan replaced the 1996 Plan and allows not only for the grant of options, but also for the grant of stock appreciation rights, restricted stock grants, restricted stock units and other equity rights. The 2005 Plan also allows for tax withholding obligations related to stock option exercises or restricted stock awards to be satisfied through the retention of shares otherwise released upon vesting. The PowerLight Plan was adopted by
se of 1.7 million shares and, beginning in fiscal 2009 through 2015, an automatic annual increase in the number of shares available for grant under the 2005 Plan. The automatic annual increase is equal to the lower of three percent of the outstanding sharecommon stock measured on the last day of the immediately preceding fiscal quarter, 6.0 million shares, or such other
28, 2008, approximately 1.3 million shares were available for grant under the 2005 Plan. No new awards are being granted under the 1996 Plan or the PowerLight Plan.
Incentive stock options may be granted at no less than the fair value of the common stock on the date of grant. Non-statutory stock options and stock purchase rights may be granted at no less than 85% of the fair value of the common stock at the date of grant. The options and rights become exercisable when and as determined by the
ough these terms generally do not exceed ten years for stock options. Under the 1996 and 2005 Plans, the options typically vest over five years with a one-year cliff and monthly vesting thereafter. Under the PowerLight Plan, the options typically vest over five years with yearly cliff vesting.
The majority of shares issued are net of the minimum statutory withholding requirements that the Company pays on behalf of its employees. During fiscal 2008 and 2007, the Company withheld approximately 93,000 shares and 113,000 shares, respectively, to satisfy $6.7 Company paid this amount in cash to the appropriate taxing authorities. Shares withheld are treated as common stock repurchases for accounting and disclosure purposes and reduce the number of shares outstanding upon vesting.
Shares
(in thousands)
Weighted-AverageExercise
Price Per ShareOutstanding as of January 1, 2006 6,572 3.41
Granted 44 39.05Exercised (1,529) 2.54 Forfeited (107) 4.14
Outstanding as of December 31, 2006 4,980 3.97 Options exchanged/assumed in connection with PowerLight acquisition 1,602 5.54 Granted 18 56.20Exercised (2,817) 3.01 Forfeited (82) 13.36
Outstanding as of December 30, 2007 3,701 5.44 Granted 170 48.10Exercised (1,129) 3.60 Forfeited (197) 7.28
Outstanding as of December 28, 2008 2,545 8.96 Exercisable as of December 28, 2008 1,432 4.41

115
$29.00, $44.09 and $31.02, respectively. The intrinsic value of options exercised in fiscal 2008, 2007 and 2006 were $83.7 million, $168.4 million and $47.7 million, respectively. The total fair value of options vested in fiscal 2008, 2007 and 2006 were $4.4 million, $7.2 million and $3.8 million, respectively.
-vested stock options and restricted stock activities thereafter:
Stock Options Restricted Stock Awards and Units
Shares
(in thousands)
Weighted-Average
Exercise PricePer Share
Shares(in thousands)
Weighted-Average
Grant Date FairValue Per Share
Outstanding as of January 1, 2006 4,789 $ 3.82 15 $ 30.04Granted 44 39.05 230 35.43Forfeited (1,692 ) 3.56 (16) 30.92
Outstanding as of December 31, 2006 3,141 4.45 229 35.40Granted 1,620 6.10 1,141 71.64Vested(1) (2,225 ) 3.28 (105) 43.18Forfeited (82 ) 12.94 (91) 51.00
Outstanding as of December 30, 2007 2,454 6.29 1,174 68.74Granted 170 48.10 911 70.02Vested(1) (1,314 ) 4.32 (357) 84.73Forfeited (197 ) 7.28 (124) 73.18
Outstanding as of December 28, 2008 1,113 14.82 1,604 69.71
(1) Restricted stock awards and units vested include shares withheld on behalf of employees to satisfy the minimum statutory tax withholding requirements.
Options Outstanding Options Exercisable
Range of Exercise Price
Shares (in thousands)
Weighted-Average
RemainingContractual
Life (in years)
Weighted-AverageExercisePrice per
Share
AggregateIntrinsic
Value(in thousands)
Shares (inthousands)
Weighted-Average
RemainingContractual
Life (in years)
Weighted-AverageExercisePrice per
Share
AggregateIntrinsic
Value(in thousands)
$ 0.04 1.77 464 3.47 $ 0.51 $ 16,184 334 3.78 $ 0.53 $ 11,632 2.00 7.00 1,505 5.97 3.68 47,696 965 5.93 3.54 30,729
9.50 17.00 145 6.81 10.19 3,651 66 6.81 10.21 1,656 17.46 43.01 315 8.03 26.46 2,956 63 7.45 28.91 457 44.50 67.93 116 9.35 61.89 4 8.36 56.20 2,545 5.97 8.96 $ 70,487 1,432 5.55 4.41 $ 44,474
The aggregate intrinsic value in the preceding table represents the total pre-tax intrinsic value, based on the price of $35.38 at December 26, 2008, which would have been received by the option holders
had all option holders exercised their options as of that date.
As of December 28, 2008, stock options vested and expected to vest totaled approximately 2.5 million shares, with a weighted-average remaining contractual life of 6.0 years and a weighted-average exercise price of $8.96 per share and an aggregate intrinsic value of approximately $70.5 million. The total number of in-the-money options exercisable was 1.4 million shares as of December 28, 2008.
Options Issued to Non-Employees:
There were no options issued to non-employees in fiscal 2008, 2007 and 2006.

116
Stock Unit Plan:
In September except its executive officers and directors are eligible to participate, although the Company currently intends to limit participation to its non-U.S. employees who board of directors awards participants the right to receive cash payments from the Company in an amount equal to the
d the date the employee redeems the award. The right to redeem the award typically vests in the same manner as options vest under the 2005 Stock Unit Plan. In July 2006, the board of directors amended the terms of the plan to increase the maximum number of stock units that may be subject to stock unit awards granted under the 2005 Stock Unit Plan from 100,000 to 300,000 stock units.
As of December 28, 2008, the Company has granted approximately 236,000 stock units to 2,200 employees in the Philippines at an average unit price of $39.80. Pursuant to a voluntary exchange offer that concluded in November 2007, approximately 53,000 stock units were exchanged for approximately 32,000 restricted stock units issued under the
ted a second voluntary exchange offer that concluded in May 2008, in which approximately 109,000 stock units were exchanged for approximately 50,000 restricted stock units issued under
During fiscal 2008, 2007 and 2006, the Company recognized $0.1 million, $2.4 million and $0.6 million, respectively, of total compensation expense associated with the 2005 Stock Unit Plan.
Other Employee Benefit Plans:
The Company has a statutory pension plan covering its employees in the Philippines. Consistent with the requirements of local law, the Company accrues for the unfunded portion of the obligation and plans to appoint a third-party trustee of the retirement funds by the end of fiscal 2009. The outstanding liability of this pension plan was $0.6 million on both December 28, 2008 and December 30, 2007.
insurance and other benefit plans (other than the stock plans and stock purchase plans). In July 2008, the Company
o participate
Note 17. SEGMENT AND GEOGRAPHICAL INFORMATION
Prior to fiscal year 2007, the Company operated in one business segment comprising the design, manufacture and sale of solar electric power products based on its proprietary processes and technologies. Following the acquisition of PowerLight, the Company operates in two business segments: systems and components. The Systems Segment generally represents sales directly to systems owners of engineering, procurement, construction and other services relating to solar
materials sourcesolar cells, solar panels and inverters to solar systems installers and other resellers, including our global dealer network. The Chief Operating Decision Maker
the performance of both operating segments using information about their revenue and gross margin.
The following tables present revenue by geography and segment, gross margin by segment, revenue by significant customer and property, plant and equipment information based on geographic region. Revenue is based on the destination of the shipments. Property, plant and equipment are based on the physical location of the assets:
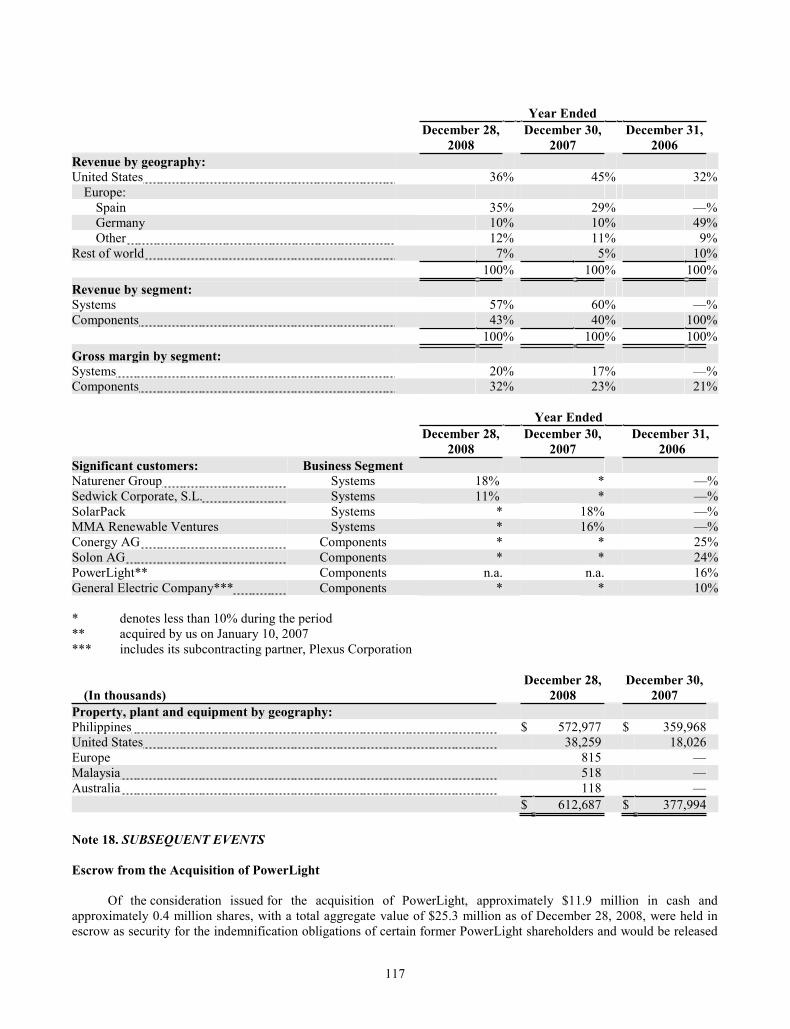
117
Year Ended
December 28,
2008 December 30,
2007 December 31,
2006 Revenue by geography: United States 36% 45 % 32 %
Europe: Spain 35% 29 % %Germany 10% 10 % 49 %Other 12% 11 % 9%
Rest of world 7% 5% 10 % 100% 100 % 100 %Revenue by segment: Systems 57% 60 % %Components 43% 40 % 100 % 100% 100 % 100 %Gross margin by segment: Systems 20% 17 % %Components 32% 23 % 21 %
Year Ended
December 28,
2008 December 30,
2007 December 31,
2006Significant customers: Business Segment Naturener Group Systems 18% * %Sedwick Corporate, S.L. Systems 11% * %SolarPack Systems * 18% %MMA Renewable Ventures Systems * 16% %Conergy AG Components * * 25% Solon AG Components * * 24% PowerLight** Components n.a. n.a. 16% General Electric Company*** Components * * 10%
* denotes less than 10% during the period ** acquired by us on January 10, 2007 *** includes its subcontracting partner, Plexus Corporation
(In thousands) December 28,
2008 December 30,
2007 Property, plant and equipment by geography: Philippines $ 572,977 $ 359,968 United States 38,259 18,026 Europe 815 Malaysia 518 Australia 118 $ 612,687 $ 377,994
Note 18. SUBSEQUENT EVENTS
Escrow from the Acquisition of PowerLight
Of the consideration issued for the acquisition of PowerLight, approximately $11.9 million in cash and approximately 0.4 million shares, with a total aggregate value of $25.3 million as of December 28, 2008, were held in escrow as security for the indemnification obligations of certain former PowerLight shareholders and would be released

118
over a period of five years from the acquisition date of January 10, 2007, ending on January 10, 2012 (see Note 3). Following the second anniversary of the acquisition date (January 10, 2009), the Company authorized the release of approximately one-half of the escrow amount, leaving approximately $7.0 million in cash and approximately 0.2 million shares of its class A common stock.
Polysilicon Supply Agreement
In January 2009, the Company entered into a polysilicon supply agreement with Hemlock Semiconductor ). The agreement provides the general terms and conditions pursuant to which the Company will
purchase, on a firm commitment basis, fixed annual quantities of polysilicon at specified prices from 2011 through 2020. Under the agreement, the Company is required to make prepayments to Hemlock of $14.5 million in 2009, $101.8 million in 2010, $101.8 million in 2011, and $72.7 million in 2012, and such prepayments will be credited against future deliveries of polysilicon to the Company. The Company expects to supply the polysilicon to third-parties that will manufacture ingots and wafers for the Company using such polysilicon. The aggregate quantity of polysilicon to be purchased over the term of the agreement is expected to support approximate 3.5 gigawatts of solar cell manufacturing
Election of Mr. McDaniel to serve as a member of the Board of Directors and on the Audit Committee
ectors elected Thomas R. McDaniel to serve as a member of the Board of Directors and on its Audit Committee. Mr. McDaniel was designated a Class III director under section 3.1
-Laws, which provides for a classifed Board. Under the terms of the 2005 Plan, Mr. McDaniel received a grant of 6,600 restricted Stock Units, of which twenty percent will vest on each anniversary of the date of grant until entirely vested by the fifth anniversary of the date of grant.
SELECTED UNAUDITED QUARTERLY FINANCIAL DATA
During the preparation of its consolidated financial statements for the year ended December 28, 2008, the Company identified errors in its financial statements related to each of the three-month periods ended March 30, 2008, June 29, 2008 and September 28, 2008. These errors resulted in understatements of net income for the three months ended:
March 30, 2008 by $0.4 million, which includes $0.3 million overstatement of interest expense and $0.1 million understatement of equity in earnings of unconsolidated subsidiaries, net of taxes.
June 29, 2008 by $1.7 million, which includes $0.3 million overstatement of interest expense and $1.4 million understatement of equity in earnings of unconsolidated subsidiaries, net of taxes.
September 28, 2008 by $4.8 million, which includes $2.4 million understatement of gross margin, $0.4 million overstatement of interest expense and $0.2 million understatement of equity in earnings of unconsolidated subsidiaries, net of taxes.
The Company corrected these errors in the three-month period ended December 28, 2008, which resulted in a $6.9 million credit to net income. The Company has concluded that the out-of-period effect of these adjustments is not material to any of its previously issued condensed consolidated financial statements.

119
Consolidated Statements of Operations
Three Months Ended(In thousands, except per share data) December 28 September 28 June 29 March 30
Fiscal 2008: Revenue $ 400,967 $ 377,500 $ 382,751 $ 273,701 Gross margin 111,710 105,621 93,030 53,320 Net income 29,549 21,379 28,608 12,757 Net income per share of class A and class B common stock, basic 0.35 0.27 0.36 0.16 Net income per share of class A and class B common stock, diluted 0.35 0.25 0.34 0.15
Three Months Ended(In thousands, except per share data) December 30 (a) September 30 July 1 (b) April 1 (c)
Fiscal 2007: Revenue $ 224,343 $ 234,334 $ 173,766 $ 142,347 Gross margin 47,182 38,405 29,792 32,425 Net income (loss) 4,876 8,431 (5,345 ) 1,240Net income (loss) per share of class A and class B common stock, basic 0.06 0.11 (0.07) 0.02 Net income (loss) per share of class A and class B common stock, diluted 0.06 0.10 (0.07) 0.02
(a) Included a charge of $8.3 million for the write-off of unamortized debt issuance costs as a result of the market price conversion trigger on its senior convertible debentures being met.
(b) Included a charge of $14.1 million for the impairment of acquisition-related intangible assets. (c) Included a charge of $9.6 million for purchased in-process research and development.
ITEM 9: CHANGES IN AND DISAGREEMENTS WITH ACCOUNTANTS ON ACCOUNTING AND FINANCIAL DISCLOSURES
None.
ITEM 9A: CONTROLS AND PROCEDURES
Disclosure Controls and Procedures
-15(e) and 15d-15(e) underequired to be disclosed by us in reports that we file or submit under the Exchange Act is recorded, processed, summarized, and reported within the time periods specified in Securities and Exchange Commission rules and forms, and that such information is accumulated and communicated to our management, including our Chief Executive Officer and Chief Financial Officer, as appropriate, to allow timely decisions regarding required disclosure. In designing and evaluating our disclosure controls and procedures, management recognized that disclosure controls and procedures, no matter how well conceived and operated, can provide only reasonable, not absolute, assurance that the objectives of the disclosure controls and procedures are met. Additionally, in designing disclosure controls and procedures, our management is required to apply its judgment in evaluating the cost-benefit relationship of possible disclosure controls and procedures. The design of any disclosure controls and procedures also is based in part upon certain assumptions about the likelihood of future events, and there can be no assurance that any design will succeed in achieving its stated goals under all potential future conditions.
Based on their evaluation as of the end of the period covered by this Annual Report on Form 10-K and subject to the foregoing, our Chief Executive Officer and Chief Financial Officer have concluded that our disclosure controls and procedures were effective.

120
Our management is responsible for establishing and maintaining adequate internal control over financial reporting as defined in Rule 13a-15(f) of the Exchange Act. Because of its inherent limitations, internal control over financial reporting may not prevent or detect misstatements and can only provide reasonable assurance with respect to financial statement preparation. Also, projections of any evaluation of effectiveness to future periods are subject to the risk that controls may become inadequate because of changes in conditions, or that the degree of compliance with the policies or procedures may deteriorate.
We assessed the effectiveness of our internal control over financial reporting as of December 28, 2008. In making this assessment, we used the criteria set forth by the Committee of Sponsoring Organizations of the Treadway
Internal Control Integrated Framework. Based on our assessment using those criteria, our management (including our Chief Executive Officer and Chief Financial Officer) concluded that our internal control over financial reporting was effective as of December 28, 2008.
The effectiveness of our internal control over financial reporting as of December 28, 2008 has been audited by PricewaterhouseCoopers LLP, an independent registered public accounting firm, as stated in their report which appears on page 65 of this Annual Report on Form 10-K.
Changes in Internal Control over Financial Reporting
We maintain a system of internal control over financial reporting that is designed to provide reasonable assurance that our books and records accurately reflect our transactions and that our established policies and procedures are followed. There were no changes in our internal control over financial reporting that occurred during the quarter ended December 28, 2008 that has materially affected, or is reasonably likely to materially affect, our internal control over financial reporting.
subsidiaries around the world, which resulted in a material update to our system of internal control over financial reporting. Issues encountered subsequent to implementation caused us to further revise our internal control process and procedures in order to correct and supplement our processing capabilities within the new system in that quarter. Throughout the ERP system stabilization period we will continue to improve and enhance our system of internal control over financial reporting.
ITEM 9B: OTHER INFORMATION
Borrowing under Malaysian Facility Agreement
As we disclosed in a current report on Form 8-K filed with the Securities and Exchange Commission on December 24, 2008, SunPower Malaysia Manufacturing Sdn. Bhd., or SunPower Malaysia, our Malaysian subsidiary, entered into a facility agreement with the Government of Malaysia. SunPower Malaysia concurrently executed a debenture and deed of assignment in favor of the Malaysian Government, granting a security interest in a deposit account
We borrowed Malaysian Ringgit 190.0 million (approximately $54.6 million) under the facility agreement in December 2008, and we borrowed Malaysian Ringgit 185.0 million (approximately $51.0 million) under the facility agreement in January 2009.
Under the terms of the facility agreement, SunPower Malaysia may borrow up to Malaysian Ringgit 1.0 billion (approximately $287.4 million) to finance the construction of its manufacturing facility in Malaysia. The loans within the facility agreement are divided into two tranches, and the weighted average interest rate applicable to the two tranches is competitive with the cost of borrowing under our existing credit agreement with Wells Fargo. The loans can be drawn upon through 2010. Principal is to be repaid in six quarterly payments starting in June 2015. SunPower Malaysia has the ability to prepay outstanding loans. All borrowings must be repaid by October 30, 2016. The loan documents include certain conditions to borrowings, representations and covenants, and events of default customary for financing transactions of this type.

121
Wells Fargo Amendment
On February 24, 2009, we entered into an amendment to our credit agreement with Wells Fargo. The amendment extends the expiration date from April 4, 2009 to July 3, 2009 for the uncollateralized revolving credit line and uncollateralized letter of credit subfeature.
In connection with the original credit agreement, we entered into a security agreement with Wells Fargo, granting a security interest in a deposit account to collateralize certain obligations in connection with any letters of credit that
In connection with an amendment in 2008, we entered into another security agreement with Wells Fargo, granting a security interest in a securities account to collateralize certain obligations. SunPower North America, Inc., SunPower Corporation, Systems, and SunPower Systems SA have each agreed to guarantee obligations owed to Wells Fargo under the credit agreement.
and request that Wells Fargo issue up to $50 million in letters of credit under the uncollateralized letter of credit subfeature, provided that any letters of credit issued and outstanding under the uncollateralized letter of credit subfeature will reduce our borrowing capacity. Until July 31, 2012, we may request that Wells Fargo issue up to $150 million in
will pay interest on outstanding borrowings and a fee for issued and outstanding letters of credit. We have the ability at any time to prepay outstanding loans. All borrowings must be repaid by July 3, 2009, and all letters of credit issued under the uncollateralized letter of credit subfeature shall expire on or before July 3, 2009 unless we provide by such date collateral in the form of cash or cash equivalents in the aggregate amount available to be drawn under letters of credit outstanding at such time. All letters of credit issued under the collateralized letter of credit line shall expire no later than July 31, 2012. The loan documents include certain conditions to borrowings, representations and covenants, and events of default customary for financing transactions of this type.
PART III
Certain information required by Part III is omitted from this Annual Report on Form 10-K. We intend to file a definitive Proxy Statement pursuant to Regulation 14A not later than 120 days after the end of the fiscal year covered by this Annual Report on Form 10-K, and certain information included therein is incorporated herein by reference.
ITEM 10: DIRECTORS, EXECUTIVE OFFICERS AND CORPORATE GOVERNANCE
The information required by this Item concerning our directors is incorporated by reference from the information set forth in the section entitl
The information required by this Item concerning our executive officers is incorporated by reference to the d Certain Beneficial
Owners
The information required by this Item concerning compliance with Section 16(a) of the Securities Exchange Act of 1934 is incorporated by reference from the informat Section 16(a) Beneficial Ownership Reporting Compliance in our Proxy Statement.
We have adopted a code of ethics, entitled Code of Business Conduct and Ethics, that applies to all of our directors, officers and employees, including our principal executive officer, principal financial officer, and principal accounting officer. We have made it available, free of charge, on our website at www.sunpowercorp.com, and if we amend it or grant any waiver under it that applies to our principal executive officer, principal financial officer, or principal accounting officer, we will promptly post that amendment or waiver on our website as well.
The information required by this Item concerning our audit committee and audit committee financial expert is Committee
Membership

122
ITEM 11: EXECUTIVE COMPENSATION
The information required by this Item concerning executive compensation is incorporated by reference from the
isclosures Compensation Committee Interlocks and Insider
The information required by this item concerning compensation of directors is incorporated by reference from the information set forth in the section entitled
ITEM 12: SECURITY OWNERSHIP OF CERTAIN BENEFICIAL OWNERS AND MANAGEMENT AND RELATED STOCKHOLDER MATTERS
The information required by this Item concerning equity compensation plan information is incorporated by
Statement.
The information required by this Item regarding security ownership of certain beneficial owners, directors and executive o
ITEM 13: CERTAIN RELATIONSHIPS AND RELATED TRANSACTIONS, AND DIRECTOR INDEPENDENCE
Information required by this Item regarding director independence and transactions with related persons is Board
ITEM 14: PRINCIPAL ACCOUNTANT FEES AND SERVICES
The information required by this Item is incorporated by reference from the information set forth in the sections Ratification of the Selection of
PART IV
ITEM 15: EXHIBITS AND FINANCIAL STATEMENT SCHEDULES
(a) The following documents are filed as a part of this Annual Report on Form 10-K:
1. Financial Statements:
Page Report of Independent Registered Public Accounting Firm 65 Consolidated Balance Sheets 66 Consolidated Statements of Operations 67
68 Consolidated Statements of Comprehensive Income 69 Consolidated Statements of Cash Flows 70 Notes to Consolidated Financial Statements 71
2. Financial Statement Schedule:
Page Schedule II Valuation and Qualifying Accounts 128
All other financial statement schedules are omitted as the required information is inapplicable or the

123
information is presented in the Consolidated Financial Statements or Notes to Consolidated Financial Statements under Item 8 of this Annual Report on Form 10-K.
3. Exhibits:
See (b) below.
(b) Exhibits:
EXHIBIT INDEX
Exhibit Number Description
3.1 Form of Restated Certificate of Incorporation of SunPower Corporation (incorporated by reference to s Current Report on Form 8-K filed with the Securities and Exchange
Commission on August 12, 2008). 3.2 Amended and Restated By-Laws of SunPower Corporation (incorporated by reference to Exhibit 3.1 to the
-K filed with the Securities and Exchange Commission on November 7, 2008).
4.1 Registration Statement on Form S-1/A filed with the Securities and Exchange Commission on November 14, 2005).
4.2 Specimen Class Registration Statement on Form S-3ASR filed with the Securities and Exchange Commission on September 10, 2008).
4.3 Indenture, dated February 7, 2007, by and between SunPower Corporation and Wells Fargo Bank, National -K
filed with the Securities and Exchange Commission on February 8, 2007). 4.4 First Supplemental Indenture, dated February 7, 2007, by and between SunPower Corporation and Wells
Report on Form 8-K filed with the Securities and Exchange Commission on February 8, 2007). 4.5 Form of Second Supplemental Indenture, by and between SunPower Corporation and Wells Fargo Bank,
8-Kfiled with the Securities and Exchange Commission on July 26, 2007).
4.6 Rights Agreement, dated as of August 12, 2008, by and between the Registrant and Computershare Trust Company, N.A., as Rights Agent, including the form of Certificate of Designation of Series A Junior Participating Preferred Stock, the form of Certificate of Designation of Series B Junior Participating Preferred Stock and the forms of Right Certificates, Assignment and Election to Purchase and the Summary of Rights attached thereto as Exhibits A, B, C and D, respectively (incorporated by reference to Exhibit 4.1
8-K filed with the Securities and Exchange Commission on August 12, 2008).
10.1 Share Lending Agreement, dated July 25, 2007, by and among SunPower Corporation, Credit Suisse International and Credit Suisse Securities (USA) LLC (incorporated by reference to Exhibit 10.1 of
-K filed with the Securities and Exchange Commission on July 26, 2007).
10.2 Amended and Restated Share Lending Agreement, dated July 25, 2007, by and among SunPower Corporation, Lehman Brothers International (Europe) Limited and Lehman Brothers Inc. (incorporated by reference to Exhibit 10. -K filed with the Securities and Exchange Commission on July 26, 2007).
10.3^ SunPower Corporation 1996 Stock Plan and form of agreements thereunder (incorporated by reference to egistration Statement on Form S-1 filed with the Securities and Exchange
Commission on August 25, 2005). 10.4^
Registration Statement on Form S-1/A filed with the Securities and Exchange Commission on October 31, 2005).

124
Exhibit Number Description10.5^ Second Amended and Restated SunPower Corporation 2005 Stock Incentive Plan and forms of agreements
thereunder (incorporated by refe -8filed with the Securities and Exchange Commission on May 9, 2008).
10.6^ PowerLight Corporation Common Stock Option and Common Stock Purchase Plan (incorporated by reference to Ex -8 filed with the Securities and Exchange Commission on January 25, 2007).
10.7^ Form of PowerLight Corporation Incentive/Non-Qualified Stock Option, Market Standoff and Stock Restriction AgreeRegistration Statement on Form S-8 filed with the Securities and Exchange Commission on January 25, 2007).
10.8^ Form of PowerLight Corporation Non-Qualified Stock Option, Market Standoff and Stock Restriction
Registration Statement on Form S-8 filed with the Securities and Exchange Commission on January 25, 2007).
10.9^ Form of Non-Qualified Stock Option Agreement, by and between PowerLight Corporation and Dan Shugar -8 filed with
the Securities and Exchange Commission on January 25, 2007). 10.10 Form of Indemnification Agreement for Directors and Officers (incorporated by reference to Exhibit 10.8 to
-Q filed with the Securities and Exchange Commission on November 7, 2008).
10.11^* Form of Employment Agreement for Executive Officers, including Messrs. Werner, Arriola, Hernandez, Dinwoodie, Ledesma, Wenger, Shugar, Neese, Richards and Swanson.
10.12^ Amended and Restated SunPower Corporation Annual Key Employee Bonus Plan (incorporated by-Q filed with the Securities and
Exchange Commission on August 8, 2008). 10.13^ SunPower Corporation Quarterly Key Initiative Bonus Plan (incorporated by reference to Exhibit 10.1 to the
-Q filed with the Securities and Exchange Commission on May 9, 2008).
10.14^ SunPower Corporation Management Career Transition Plan (incorporated by reference to Exhibit 10.6 to the Report on Form 10-Q filed with the Securities and Exchange Commission on
November 7, 2008). 10.15 Office Lease Agreement, dated May 15, 2006 between SunPower Corporation and Cypress Semiconductor
Corporation (incorporated by reference to Exhibit 10.36 to -Qfiled with the Securities and Exchange Commission on May 16, 2006).
10.16 First Amendment to Lease, dated December 12, 2006, by and between SunPower Corporation and Cypress Semiconductor Corporation (incorpoon Form 10-Q filed with the Securities and Exchange Commission on May 9, 2008).
10.17 Second Amendment to Lease, dated July 1, 2007, by and between SunPower Corporation and Cypress
on Form 10-Q filed with the Securities and Exchange Commission on May 9, 2008). 10.18 Third Amendment to Lease, dated April 7, 2008, by and between SunPower Corporation and Cypress
on Form 10-Q filed with the Securities and Exchange Commission on August 8, 2008). 10.19 Fourth Amendment to Lease, effective August 12, 2008, by and between SunPower Corporation and
s QuarterlyReport on Form 10-Q filed with the Securities and Exchange Commission on November 7, 2008).
10.20* Fifth Amendment to Lease, dated October 1, 2008, by and between SunPower Corporation and Cypress Semiconductor Corporation.
10.21 Standard Industrial / Commercial Multi-Tenant Lease, dated December 15, 2006, by and between
Quarterly Report on Form 10-Q filed with the Securities and Exchange Commission on May 11, 2007). 10.22 First Amendment to Lease, dated May 24, 2007, by and between PowerLight Corporation and FPOC, LLC
-Q filed with theSecurities and Exchange Commission on August 7, 2007).
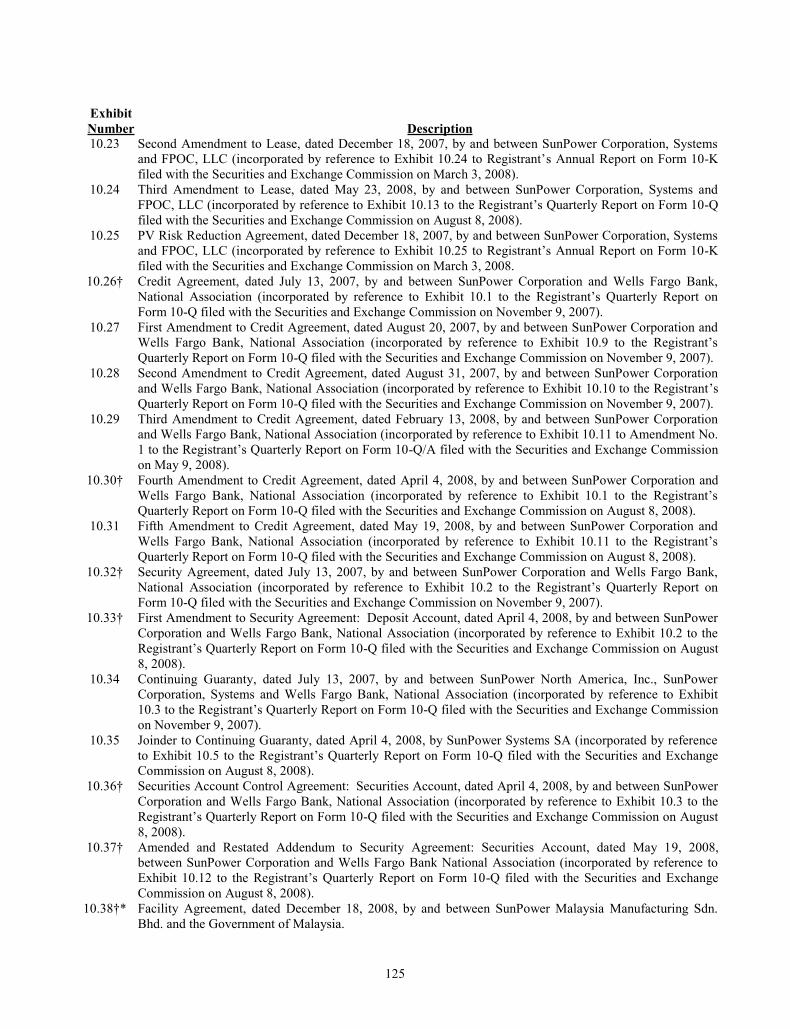
125
Exhibit Number Description10.23 Second Amendment to Lease, dated December 18, 2007, by and between SunPower Corporation, Systems
s Annual Report on Form 10-Kfiled with the Securities and Exchange Commission on March 3, 2008).
10.24 Third Amendment to Lease, dated May 23, 2008, by and between SunPower Corporation, Systems and FPOC, LLC (incorporated by reference to Exhibit 10.13 to -Qfiled with the Securities and Exchange Commission on August 8, 2008).
10.25 PV Risk Reduction Agreement, dated December 18, 2007, by and between SunPower Corporation, Systems and FPOC, LLC (incorporated by r -Kfiled with the Securities and Exchange Commission on March 3, 2008.
Credit Agreement, dated July 13, 2007, by and between SunPower Corporation and Wells Fargo Bank, National AssocForm 10-Q filed with the Securities and Exchange Commission on November 9, 2007).
10.27 First Amendment to Credit Agreement, dated August 20, 2007, by and between SunPower Corporation and
Quarterly Report on Form 10-Q filed with the Securities and Exchange Commission on November 9, 2007). 10.28 Second Amendment to Credit Agreement, dated August 31, 2007, by and between SunPower Corporation
and Wells Fargo Bank, National Association (incorporated by reference to Exhibit 10.10 to the RegistrantQuarterly Report on Form 10-Q filed with the Securities and Exchange Commission on November 9, 2007).
10.29 Third Amendment to Credit Agreement, dated February 13, 2008, by and between SunPower Corporation and Wells Fargo Bank, National Association (incorporated by reference to Exhibit 10.11 to Amendment No.
-Q/A filed with the Securities and Exchange Commission on May 9, 2008).
Fourth Amendment to Credit Agreement, dated April 4, 2008, by and between SunPower Corporation and
Quarterly Report on Form 10-Q filed with the Securities and Exchange Commission on August 8, 2008). 10.31 Fifth Amendment to Credit Agreement, dated May 19, 2008, by and between SunPower Corporation and
Quarterly Report on Form 10-Q filed with the Securities and Exchange Commission on August 8, 2008). Security Agreement, dated July 13, 2007, by and between SunPower Corporation and Wells Fargo Bank,
Form 10-Q filed with the Securities and Exchange Commission on November 9, 2007). First Amendment to Security Agreement: Deposit Account, dated April 4, 2008, by and between SunPower
Corporation and Wells Fargo Bank, National Association (incorporated by reference to Exhibit 10.2 to the -Q filed with the Securities and Exchange Commission on August
8, 2008). 10.34 Continuing Guaranty, dated July 13, 2007, by and between SunPower North America, Inc., SunPower
Corporation, Systems and Wells Fargo Bank, National Association (incorporated by reference to Exhibit arterly Report on Form 10-Q filed with the Securities and Exchange Commission
on November 9, 2007). 10.35 Joinder to Continuing Guaranty, dated April 4, 2008, by SunPower Systems SA (incorporated by reference
Report on Form 10-Q filed with the Securities and Exchange Commission on August 8, 2008).
Securities Account Control Agreement: Securities Account, dated April 4, 2008, by and between SunPower Corporation and Wells Fargo Bank, National Association (incorporated by reference to Exhibit 10.3 to the
-Q filed with the Securities and Exchange Commission on August 8, 2008).
Amended and Restated Addendum to Security Agreement: Securities Account, dated May 19, 2008,between SunPower Corporation and Wells Fargo Bank National Association (incorporated by reference to
-Q filed with the Securities and Exchange Commission on August 8, 2008).
Facility Agreement, dated December 18, 2008, by and between SunPower Malaysia Manufacturing Sdn. Bhd. and the Government of Malaysia.

126
Exhibit Number Description
Debenture, dated December 18, 2008, by and between SunPower Malaysia Manufacturing Sdn. Bhd. and the Government of Malaysia.
Deed of Assignment, dated December 18, 2008, by and between SunPower Malaysia Manufacturing Sdn. Bhd. and the Government of Malaysia.
Supply Agreement, dated June 30, 2006, by and between SunPower Philippines Manufacturing, Ltd. and DC
10-Q filed with the Securities and Exchange Commission on August 16, 2006). Long-Term Supply Agreement II, dated July 16, 2007, by and between SunPower Corporation and Hemlock
Reportfiled with the Securities and Exchange Commission on November 9, 2007).
Form of Long-Term Polysilicon Supply Agreement, effective January 10, 2008, by and between SunPower Corporation and a joint venture (JVCo) to be formed by NorSun AS, Swicorp Joussour Company and
Report on Form 10-Q filed with the Securities and Exchange Commission on May 9, 2008). Long-Term Polysilicon Supply Agreement, effective January 10, 2008, by and between SunPower
on Form 10-Q filed with the Securities and Exchange Commission on May 9, 2008). Poly Silicon Supply Agreement, dated February 8, 2008, by and between SunPower Corporation and Jupiter
10-Q filed with the Securities Exchange Commission on May 9, 2008). Ingot Supply Agreement, dated December 22, 2006, by and between SunPower Corporation and Woongjin
port on Form10-K filed with the Securities and Exchange Commission on March 2, 2007).
Amendment No. 1 to Ingot Supply Agreement, dated August 4, 2008, by and between SunPower Corporation and Woongjin Energy Co., Ltd. (incorporated by reference to Quarterly Report on Form 10-Q filed with the Securities and Exchange Commission on November 7, 2008).
Long-Term Ingot and Wafer Supply Agreement, dated August 9, 2007, by and between SunPower Corporation and NorSun on Form 10-Q filed with the Securities and Exchange Commission on November 9, 2007).
Wafering Supply and Sales Agreement, dated October 1, 2007, by and between SunPower PhilippinesManufacturing Ltd. and First Philec Solar Corp. (incorporated by reference to Exhibit 10.12 to the
-Q filed with the Securities and Exchange Commission on November 9, 2007).
Ingot/Wafer Agreement, dated December 3, 2007, by and between SunPower Corporation and Jiawei
10-K filed with the Securities and Exchange Commission on March 3, 2008). First Amendment to Ingot and Wafer Agreement, dated May 13, 2008, by and between SunPower
Quarterly Report on Form 10-Q filed with the Securities and Exchange Commission on August 8, 2008). Polysilicon Supply Agreement, dated December 22, 2006, by and between SunPower Philippines
Manufacturing, Ltd. and Woongjin Energy Co., Ltd. (incorporated by reference to Exhibit 10.61 to the -K filed with the Securities and Exchange Commission on March 2,
2007). Amendment to Polysilicon Suppy Agreement, dated January 8, 2008, by and between SunPower Philippines
Manufacturing, Ltd. and Woongjin Energy Co., Ltd. (incorporated by reference to Exhibit 10.4 to the -Q filed with the Securities and Exchange Commission on May 9,
2008). Amendment No. 2 to Polysilicon Supply Agreement, dated August 4, 2008, by and between SunPower
Philippines Manufacturing, Ltd. and Woognjin Energy Co., Ltd. (incorporated by reference to Exhibit 10.3 erly Report on Form 10-Q filed with the Securities and Exchange Commission on
November 7, 2008). Long-Term Polysilicon Supply Agreement, dated August 9, 2007, by and between SunPower Corporation
and NorSun AS (incorporated by reference to Exhibit 110-Q filed with the Securities and Exchange Commission on November 9, 2007).
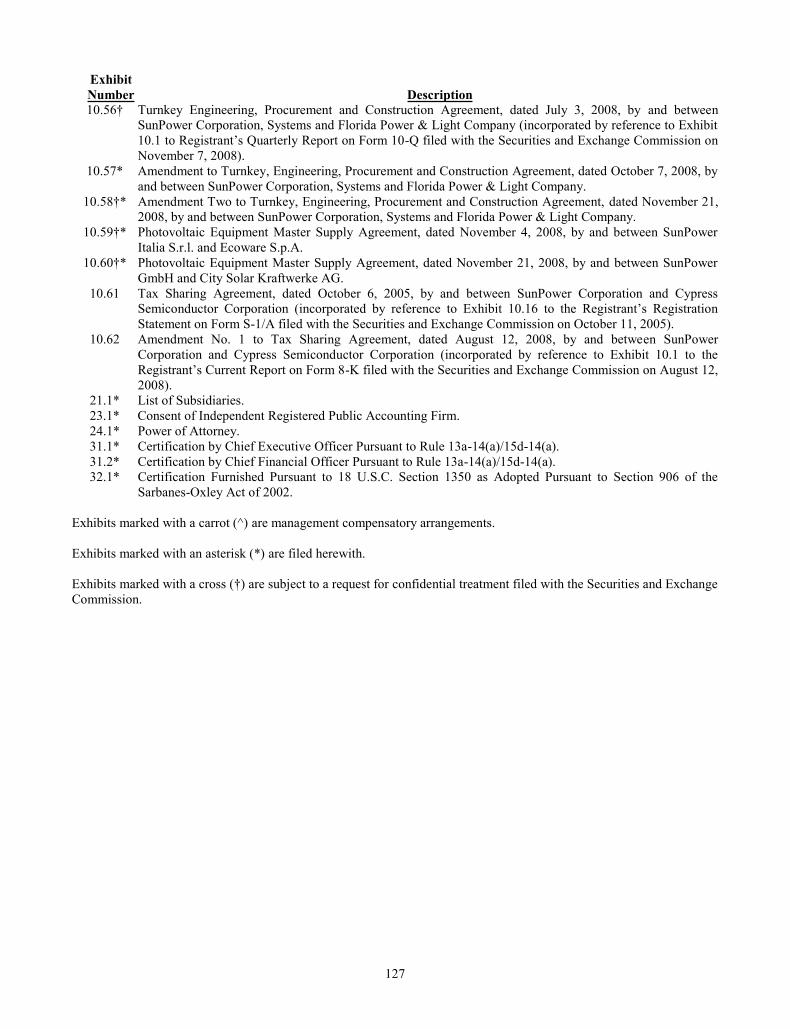
127
Exhibit Number Description
Turnkey Engineering, Procurement and Construction Agreement, dated July 3, 2008, by and betweenSunPower Corporation, Systems and Florida Power & Light Company (incorporated by reference to Exhibit
-Q filed with the Securities and Exchange Commission on November 7, 2008).
10.57* Amendment to Turnkey, Engineering, Procurement and Construction Agreement, dated October 7, 2008, by and between SunPower Corporation, Systems and Florida Power & Light Company.
Amendment Two to Turnkey, Engineering, Procurement and Construction Agreement, dated November 21, 2008, by and between SunPower Corporation, Systems and Florida Power & Light Company.
Photovoltaic Equipment Master Supply Agreement, dated November 4, 2008, by and between SunPower Italia S.r.l. and Ecoware S.p.A.
Photovoltaic Equipment Master Supply Agreement, dated November 21, 2008, by and between SunPower GmbH and City Solar Kraftwerke AG.
10.61 Tax Sharing Agreement, dated October 6, 2005, by and between SunPower Corporation and Cypress Semiconductor Corporation (Statement on Form S-1/A filed with the Securities and Exchange Commission on October 11, 2005).
10.62 Amendment No. 1 to Tax Sharing Agreement, dated August 12, 2008, by and between SunPowerCorporation and Cypress Semiconductor Corporation (incorporated by reference to Exhibit 10.1 to the
-K filed with the Securities and Exchange Commission on August 12, 2008).
21.1* List of Subsidiaries. 23.1* Consent of Independent Registered Public Accounting Firm. 24.1* Power of Attorney. 31.1* Certification by Chief Executive Officer Pursuant to Rule 13a-14(a)/15d-14(a). 31.2* Certification by Chief Financial Officer Pursuant to Rule 13a-14(a)/15d-14(a). 32.1* Certification Furnished Pursuant to 18 U.S.C. Section 1350 as Adopted Pursuant to Section 906 of the
Sarbanes-Oxley Act of 2002.
Exhibits marked with a carrot (^) are management compensatory arrangements.
Exhibits marked with an asterisk (*) are filed herewith.
Commission.

128
(c) Financial Statement Schedules:
SCHEDULE IIVALUATION AND QUALIFYING ACCOUNTS
(In thousands)
Balance atBeginning of
Period
Charges (Releases) to
Expenses/Revenues Deductions
Balance at End of Period
Allowance for doubtful accounts: Year ended December 28, 2008 $ 1,373 $ 2,182 $ (1,692) $ 1,863 Year ended December 30, 2007 557 816 1,373 Year ended December 31, 2006 317 272 (32) 557
Allowance for sales returns: Year ended December 28, 2008 $ 368 $ 63 $ (200) $ 231 Year ended December 30, 2007 445 2,172 (2,249) 368 Year ended December 31, 2006 110 808 (473) 445
Valuation allowance for deferred tax asset: Year ended December 28, 2008 $ 13,924 $ 32,008 $ $ 45,932 Year ended December 30, 2007 9,836 4,088 13,924 Year ended December 31, 2006 9,278 558 9,836

129
SIGNATURES
Pursuant to the requirements of Section 13 or 15(d) of the Securities Exchange Act of 1934, the registrant has duly caused this report to be signed on its behalf by the undersigned, thereto duly authorized.
SUNPOWER CORPORATION Dated: February 26, 2008 By: /s/ DENNIS V. ARRIOLA Dennis V. Arriola
Senior Vice President and
Chief Financial Officer
Pursuant to the requirements of the Securities Exchange Act of 1934, this Report has been signed below by the following persons on behalf of the registrant and in the capacities and on the dates indicated.
Signature Title Date /s/ THOMAS H. WERNER Chief Executive Officer and Director February 26, 2008
Thomas H. Werner (Principal Executive Officer)
/s/ DENNIS V. ARRIOLA Senior Vice President and
Chief Financial Officer
February 26, 2008 Dennis V. Arriola (Principal Financial and Accounting Officer)
* Chairman of the Board of Directors February 26, 2008
T.J. Rodgers * Director February 26, 2008
W. Steve Albrecht * Director February 26, 2008
Betsy S. Atkins * Director February 26, 2008
Uwe-Ernst Bufe * Director February 26, 2008
Thomas R. McDaniel * Director February 26, 2008
Patrick Wood
*By: /s/ DENNIS V. ARRIOLADennis V. Arriola Power of Attorney

130
EXHIBIT INDEX
Exhibit Number Description10.11^* Form of Employment Agreement for Executive Officers, including Messrs. Werner, Arriola, Hernandez,
Dinwoodie, Ledesma, Wenger, Shugar, Neese, Richards and Swanson. 10.20* Fifth Amendment to Lease, dated October 1, 2008, by and between SunPower Corporation and Cypress
Semiconductor Corporation. Facility Agreement, dated December 18, 2008, by and between SunPower Malaysia Manufacturing Sdn.
Bhd. and the Government of Malaysia. Debenture, dated December 18, 2008, by and between SunPower Malaysia Manufacturing Sdn. Bhd. and
the Government of Malaysia. Deed of Assignment, dated December 18, 2008, by and between SunPower Malaysia Manufacturing Sdn.
Bhd. and the Government of Malaysia. 10.57* Amendment to Turnkey, Engineering, Procurement and Construction Agreement, dated October 7, 2008,
by and between SunPower Corporation, Systems and Florida Power & Light Company. Amendment Two to Turnkey, Engineering, Procurement and Construction Agreement, dated November 21,
2008, by and between SunPower Corporation, Systems and Florida Power & Light Company. Photovoltaic Equipment Master Supply Agreement, dated November 4, 2008, by and between SunPower
Italia S.r.l. and Ecoware S.p.A. Photovoltaic Equipment Master Supply Agreement, dated November 21, 2008, by and between SunPower
GmbH and City Solar Kraftwerke AG. 21.1* List of Subsidiaries. 23.1* Consent of Independent Registered Public Accounting Firm. 24.1* Power of Attorney. 31.1* Certification by Chief Executive Officer Pursuant to Rule 13a-14(a)/15d-14(a). 31.2* Certification by Chief Financial Officer Pursuant to Rule 13a-14(a)/15d-14(a). 32.1* Certification Furnished Pursuant to 18 U.S.C. Section 1350 as Adopted Pursuant to Section 906 of the
Sarbanes-Oxley Act of 2002.
Exhibits marked with a carrot (^) are management compensatory arrangements.
Exhibits marked with an asterisk (*) are filed herewith.
Commission.

131
EXHIBIT 31.1
CERTIFICATIONS
I, Thomas H. Werner, Chief Executive Officer of SunPower Corporation, certify that:
1. I have reviewed this Annual Report on Form 10-K of SunPower Corporation;
2. Based on my knowledge, this report does not contain any untrue statement of a material fact or omit to state a material fact necessary to make the statements made, in light of the circumstances under which such statements were made, not misleading with respect to the period covered by this report;
3. Based on my knowledge, the financial statements, and other financial information included in this report, fairly present in all material respects the financial condition, results of operations and cash flows of the registrant as of, and for, the periods presented in this report;
4.controls and procedures (as defined in Exchange Act Rules 13a-15(e) and 15d-15(e)) and internal control over financial reporting (as defined in Exchange Act Rules 13a-15(f) and 15d-15(f)) for the registrant and have:
(a) Designed such disclosure controls and procedures, or caused such disclosure controls and procedures to be designed under our supervision, to ensure that material information relating to the registrant, including its consolidated subsidiaries, is made known to us by others within those entities, particularly during the period in which this report is being prepared;
(b) Designed such internal control over financial reporting, or caused such internal control over financial reporting to be designed under our supervision, to provide reasonable assurance regarding the reliability of financial reporting and the preparation of financial statements for external purposes in accordance with generally accepted accounting principles;
(c) this report our conclusions about the effectiveness of the disclosure controls and procedures, as of the end of the period covered by this report based on such evaluation; and
(d) control over financial reporting that
annual report) that has materially affected, or is reasonably likely to materially affect, the regicontrol over financial reporting; and
5.
directors (or persons performing the equivalent functions):
(a) All significant deficiencies and material weaknesses in the design or operation of internal control over financial reporting which are reasonablsummarize and report financial information; and
(b) Any fraud, whether or not material, that involves management or other employees who have a significant role in the reg
Date: February 26, 2009
/S/ THOMAS H. WERNER Thomas H. Werner Chief Executive Officer (Principal Executive Officer)

132
EXHIBIT 31.2
CERTIFICATIONS
I, Dennis V. Arriola, Senior Vice President and Chief Financial Officer of SunPower Corporation, certify that:
1. I have reviewed this Annual Report on Form 10-K of SunPower Corporation;
2. Based on my knowledge, this report does not contain any untrue statement of a material fact or omit to state a material fact necessary to make the statements made, in light of the circumstances under which such statements were made, not misleading with respect to the period covered by this report;
3. Based on my knowledge, the financial statements, and other financial information included in this report, fairly present in all material respects the financial condition, results of operations and cash flows of the registrant as of, and for, the periods presented in this report;
4. stablishing and maintaining disclosure controls and procedures (as defined in Exchange Act Rules 13a-15(e) and 15d-15(e)) and internal control over financial reporting (as defined in Exchange Act Rules 13a-15(f) and 15d-15(f)) for the registrant and have:
(a) Designed such disclosure controls and procedures, or caused such disclosure controls and procedures to be designed under our supervision, to ensure that material information relating to the registrant, including its consolidated subsidiaries, is made known to us by others within those entities, particularly during the period in which this report is being prepared;
(b) Designed such internal control over financial reporting, or caused such internal control over financial reporting to be designed under our supervision, to provide reasonable assurance regarding the reliability of financial reporting and the preparation of financial statements for external purposes in accordance with generally accepted accounting principles;
(c) this report our conclusions about the effectiveness of the disclosure controls and procedures, as of the end of the period covered by this report based on such evaluation; and
(d) e of an
control over financial reporting; and
5. ent evaluation of internal
directors (or persons performing the equivalent functions):
(a) All significant deficiencies and material weaknesses in the design or operation of internal control
summarize and report financial information; and
(b) Any fraud, whether or not material, that involves management or other employees who have a
Date: February 26, 2009
/s/ DENNIS V. ARRIOLA Dennis V. Arriola Senior Vice President and Chief Financial Officer (Principal Financial and Accounting Officer)

133
EXHIBIT 32.1
CERTIFICATION OF CHIEF EXECUTIVE OFFICER ANDCHIEF FINANCIAL OFFICER PURSUANT TO
18 U.S.C. SECTION 1350, AS ADOPTED PURSUANT TOSECTION 906 OF THE SARBANES-OXLEY ACT OF 2002
-K for the period ended December 28, 2008 as filed with the Securities and Thomas H. Werner, Chief Executive Officer, and Dennis V. Arriola, Chief Financial Officer, of the Company, certifies, pursuant to 18 U.S.C. Section 1350, as adopted pursuant to Section 906 of the Sarbanes-Oxley Act of 2002, that, to the best of his knowledge and belief:
(1) The Report fully complies with the requirements of Section 13(a) or 15(d) of the Securities Exchange Act of 1934; and
(2) The information contained in the Report fairly presents, in all material respects, the financial condition and result of operations of the Company.
Dated: February 26, 2009
/S/ THOMAS H. WERNER Thomas H. Werner Chief Executive Officer (Principal Executive Officer) /S/ DENNIS V. ARRIOLA Dennis V. Arriola Senior Vice President and Chief Financial Officer (Principal Financial and Accounting Officer)
The foregoing certification is being furnished solely pursuant to 18 U.S.C. Section 1350 and is not being filed as part of the Report or as a separate disclosure statement.

(This page intentionally left blank)

NOTICE OF THE 2009 ANNUAL MEETING OF STOCKHOLDERS
TO ALL SUNPOWER STOCKHOLDERS:
Corporation, a Delaware corporation, will be held on:
Date: Friday, May 8, 2009
Time: Noon Pacific Time
Place: Cypress Semiconductor Corporation, 198 Champion Court, San Jose, California 95134
Items of Business:
1. The re-election of two directors to serve as Class I directors on our board of fiscal year 2009;
2. The ratification of the appointment of PricewaterhouseCoopers LLP as our independent registered public accounting firm for fiscal year 2009; and
3. To transact such other business as may properly come before the Annual Meeting or any adjournment or postponement thereof.
The foregoing items of business are more fully described in the proxy statement accompanying this Notice. On March 23, 2009 we began mailing to stockholders either a Notice of Internet Availability of Proxy Materials or this notice of the Annual Meeting, the proxy statement and the form of proxy.
All stockholders are cordially invited to attend the Annual Meeting in person. Only stockholders of record at the close of business on March any adjournment or postponement of the Annual Meeting. Any registered stockholder in attendance at the Annual Meeting and entitled to vote may do so in person even if such stockholder returned a proxy.
San Jose, California FOR THE BOARD OF DIRECTORS March 23, 2009
Bruce R. Ledesma Corporate Secretary
IMPORTANT: WHETHER OR NOT YOU EXPECT TO ATTEND THE ANNUAL MEETING, PLEASE COMPLETE, DATE AND SIGN THE PROXY CARD AND MAIL IT PROMPTLY, OR YOU MAY VOTE BY TELEPHONE OR VIA THE INTERNET BY FOLLOWING THE DIRECTIONS ON THE PROXY CARD. ANY ONE OF THESE METHODS WILL ENSURE REPRESENTATION OF YOUR SHARES AT THE ANNUAL MEETING. NO POSTAGE NEED BE AFFIXED TO THE COMPANY-PROVIDED PROXY CARD ENVELOPE IF MAILED IN THE UNITED STATES.

(This page intentionally left blank)

i
PROXY STATEMENT FOR 2009 ANNUAL MEETING OF STOCKHOLDERS
TABLE OF CONTENTS
Page INFORMATION CONCERNING SOLICITATION AND VOTING 1
General 1Important Notice Regarding the Availability of Proxy Materials 1 Delivery of Voting Materials 1Record Date and Shares Outstanding 2Voting 2How Your Proxy Will Be Voted 3Revoking Your Proxy 4Solicitation of Proxies 4Voting Results 4
PROPOSAL ONE—RE-ELECTION OF CLASS I DIRECTORS 5BOARD STRUCTURE 7
Determination of Independence 7Board Meetings 7Board Committees 7Audit Committee 7Compensation Committee 8Compensation Committee Interlocks and Insider Participation 8 Nominating and Corporate Governance Committee 8
CORPORATE GOVERNANCE 9Stockholder Communications with Board of Directors 9Directors’ Attendance at Our Annual Meetings 9Submission of Stockholder Proposal for the 2010 Annual Meeting 9Related Persons Transactions Policy and Procedures 10Certain Relationships and Related Person Transactions 10Arrangements with Cypress Semiconductor Corporation 11
AUDIT COMMITTEE REPORT 14 COMPENSATION COMMITTEE REPORT 16 DIRECTOR COMPENSATION 17
2008 Director Compensation Table 17Director Cash Compensation 17Director Equity Awards 17
EXECUTIVE OFFICERS 19 COMPENSATION DISCUSSION AND ANALYSIS 21
Executive Summary 21 Named Executive Officers 21General Philosophy and Objectives 21 Benchmarking 22 Compensation Components 22 Employment Agreements and Severance Arrangements 25Section 162(m) Treatment Regarding Performance-Based Equity Awards 26 Indemnification of Officers and Directors 26Other Disclosures 26

ii
Page EXECUTIVE COMPENSATION 27
Compensation of Named Executive Officers 272008 Summary Compensation Table 272008 Grants of Plan-Based Awards Table 29Non-Equity Incentive Plan Compensation 30 Estimated Future Payouts Under Non-Equity Incentive Plan Awards Table 30 2008 Total Non-Equity Incentive Plan Compensation Table 31 Equity Incentive Plan Compensation 32 Employment Agreements and Potential Payments Upon Termination or Change of Control 32Termination Payments Table 36Outstanding Equity Awards At 2008 Fiscal Year-End Table 40 2008 Option Exercises and Stock Vested Table 42
PROPOSAL TWO—RATIFICATION OF THE APPOINTMENT OF INDEPENDENT REGISTERED PUBLIC ACCOUNTING FIRM FOR FISCAL YEAR 2009
43
SECURITY OWNERSHIP OF MANAGEMENT AND CERTAIN BENEFICIAL OWNERS 44 Section 16(a) Beneficial Ownership Reporting Compliance 46
EQUITY COMPENSATION PLAN INFORMATION 46

1
SUNPOWER CORPORATION 3939 North First Street
San Jose, California 95134
PROXY STATEMENT FOR 2009 ANNUAL MEETING OF STOCKHOLDERS
INFORMATION CONCERNING SOLICITATION AND VOTING
General
furnishing this proxy
Meeting of Stockholders to be held on May 8, 2009 at noon Pacific Time at Cypress Semiconductor Corporation, 198 Champion Court, San Jose, California, or at any adjournment(s), continuation(s) or postponement(s) of the meeting (the
Compa
2007 and ended on December 28, 2008.
Our principal executive offices are located at 3939 North First Street, San Jose, California 95134, and our telephone number is (408) 240-5500.
Important Notice Regarding the Availability of Proxy Materials
We have elected this year to take advantage of rules recently adopted by the Securities and Exchange Commission (the s, which allow us to make our proxy solicitation materials available to our
stockholders over the Internet. Under these rules, on or about March 23, 2009, we started mailing to certain of our stockholders a Notice of Internet Availability of Proxy Materials (the Internet Availability contains instructions on how our stockholders can both access the proxy solicitation materials and our 2008 Annual Report online and vote online. By sending the Notice of Internet Availability instead of paper copies of the proxy materials, we expect to lower the costs and reduce the environmental impact of our Annual Meeting.
Our proxy solicitation materials and our 2008 Annual Report are available at www.proxyvote.com.
Stockholders receiving the Notice of Internet Availability may request a paper or electronic copy of our proxy solicitation materials by following the instructions set forth on the Notice of Internet Availability. Stockholders who did notreceive the Notice of Internet Availability will continue to receive a paper or electronic copy of our proxy solicitation materials, which were first mailed to stockholders and made public on or about March 23, 2009.
Delivery of Voting Materials
If you would like to reduce our costs in mailing proxy materials, you can consent to receiving all future proxy statements, proxy cards and annual reports electronically via e-mail or the internet. To sign up for electronic delivery, pleasefollow the instructions provided for voting via the Internet and, when prompted, indicate that you agree to receive or access proxy materials electronically in future years.
To reduce the expenses of delivering duplicate materials to our stockholders, we are taking advantage of householding rules that permit us to deliver only one set of proxy solicitation materials, proxy card, and our Annual Report for the fiscal year ended December 28, 2008, or one copy of the Notice of Internet Availability, to stockholders who share the same address, unless otherwise requested. Each stockholder retains a separate right to vote on all matters presented at the meeting.
If you share an address with another stockholder and have received only one set of materials, you may write or call us to request a separate copy of these materials at no cost to you. For future annual meetings, you may request separate materialsor request that we only send one set of materials to you if you are receiving multiple copies by writing to us at SunPower

2
Corporation, 3939 North First Street, San Jose, California 95134, Attention: Corporate Secretary, or calling us at (408) 240-5500.
A copy of our Annual Report on Form 10-K has been furnished with this proxy statement to each stockholder. A stockholder may also request a copy of our Annual Report on Form 10-K by writing to our Corporate Secretary at 3939 North First Street, San Jose, California 95134. Upon receipt of such request, we will provide a copy of our Annual Report on Form 10-K without charge, including the financial statements required to be filed with the Securities and Exchange Commission pursuant to Rule 13a-Annual Report on Form 10-K is also available on our website at http://investors.sunpowercorp.com/sec.cfm.
Record Date and Shares Outstanding
Stockholders who owned shares of our common stock, par value $0.001 per share, at the close of business on March 10, 2009, which we refer to as the Record Date, are entitled to notice of, and to vote at, the Annual Meeting. On the Record Date, we had 43,970,148 shares of class A common stock outstanding and 42,033,287 shares of class B common stock outstanding. Our shares of common stock are divided into class A and class B shares as summarized in the table below. Until September 29, 2008, Cypress Semiconductor Corporation held all of the outstanding shares of our class B common stock, which represented a controlling interest in our combined class A and class B common stock. However, after the close of trading on September 29, 2008, Cypress distributed all of its shares of our class B common stock to its stockholders of record as of September 17, 2008. For more information about beneficial ownership of our issued and outstanding common stock, please
Classes of Common Stock
Number of Shares
Outstanding(#)Ownership
Percentage(%)Class A Non-Affiliates 34,328,239 39.9 Class A Affiliates 9,641,909 11.2 Class B Non-Affiliates 29,163,102 33.9 Class B Affiliates 12,870,185 15.0
Total 86,003,435 100.0
Voting
Each holder of shares of class A common stock is entitled to one vote for each share of class A common stock held as of the Record Date, and each holder of shares of class B common stock is entitled to eight votes for each share of class B common stock held as of the Record Date. The class A common stock and class B common stock are voting as a single class on all matters described in this proxy statement. Cumulating votes is not permitted under our Bylaws.
Pursuant to our amended and restated certificate of incorporation, effective as December 1, 2008, the voting power of a holder of more than 15% of our outstanding shares of class B common stock with respect to the election or removal of directors is restricted to only 15% of the outstanding shares of class B common stock, unless such holder of class B common stock also has an equivalent higher percentage ownership of our outstanding class A common stock.
In addition, on August 12, 2008, we entered into a rights agreement with Computershare Trust Company, N.A., as rights agents. The rights agreement became effective on September 29, 2008. The rights agreement contains specific features designed to address the potential for an acquirer or significant investor to take advantage of our capital structure and unfairly discriminate between classes of our common stock. Specifically, the rights agreement is designed to address the inequities that could result if an investor, by acquiring 20% or more of the outstanding shares of class B common stock, were able to gain significant voting influence over our corporate affairs without making a correspondingly significant economic
ld delay or discourage takeover attempts that stockholders may consider favorable.
Many of our stockholders hold their shares through a stockbroker, bank or other nominee, rather than directly in their own name. As summarized below, there are distinctions between shares held of record and those beneficially owned.
Stockholder of Record. If your shares are registered directly in your name with our transfer agent, Computershare Trust Company N.A., you are considered, with respect to those shares, the stockholder of record and these proxy solicitation materials are being furnished to you directly by us.
Beneficial Owner. If your shares are held in a stock brokerage account, or by a bank or other nominee (also known as are considered the beneficial owner of such shares held in street name, and these
proxy solicitation materials are being furnished to you by your broker, bank or other nominee, who is considered, with respect to those shares, the stockholder of record. As the beneficial owner, you have the right to direct your broker, bank or

3
other nominee as to how to vote your shares. You are also invited to attend the Annual Meeting. However, since you are not the stockholder of record, you may not automatically vote your shares in person at the Annual Meeting.
How To Vote. If you hold shares directly as a stockholder of record, you can vote in one of the following three ways:
(1) Vote via the Internet at www.proxyvote.com. Use the Internet to transmit your voting instructions and for electronic delivery of information up until 11:59 p.m. Eastern Time on May 7, 2009. Have your Notice of Internet Availability or proxy card in hand when you access the website and then follow the instructions.
(2) Vote by Telephone at 1-800-690-6903. Use a touch-tone telephone to transmit your voting instructions up until 11:59 p.m. Eastern Time on May 7, 2009. Have your Notice of Internet Availability or proxy card in hand when you call and then follow the instructions. Toll free in the U.S. and Canada.
(3) Vote by Mail. Mark, sign and date your proxy card and return it in the postage-paid envelope we have provided with any paper copy of the proxy statement, or return the proxy card to SunPower Corporation, c/o Broadridge, 51 Mercedes Way, Edgewood, NY 11717.
If you hold shares beneficially in street name, you may submit your voting instructions in the manner prescribed by your broker, bank or other nominee by following the instructions provided by your broker, bank or other nominee. Shares registered in street name may be voted in person by you only if you obtain a signed proxy from the broker, bank or other nominee who holds your shares, giving you the right to vote the shares. You may contact your broker, bank or other nominee to obtain a proxy card, bring it with you and vote your shares at the Annual Meeting.
Even if you plan to attend the Annual Meeting, we recommend that you vote your shares in advance as described above so that your vote will be counted if you later decide not to attend the Annual Meeting.
Quorum. A quorum, which is the holders of at least a majority of our stock issued and outstanding and entitled to vote as of the Record Date, is required to be present in person or by proxy at the Annual Meeting in order to hold the Annual Meeting and to conduct business. Your shares will be counted as being present at the Annual Meeting if you appear in person at the Annual Meeting (and are the stockholder of record for your shares), if you vote your shares by telephone or over the
-- when a nominee holding shares for a
beneficial owner does not vote on a particular proposal because the nominee does not have discretionary voting power with respect to that item and has not received instructions from the beneficial owner. Votes against a particular proposal will alsobe counted both to determine the presence or absence of a quorum and to determine whether the requisite number of voting shares has been obtained.
Votes Required for Proposal One. Election of a director requires the affirmative vote of the holders of a plurality of votes represented by the shares present in person or represented by proxy at a meeting at which a quorum is present. The two persons receiving the greatest number of votes at the Annual Meeting shall be elected as directors.
Votes Required for Proposal Two. Ratification of the appointment of our independent registered public accounting firm requires the affirmative vote of the holders of a majority of our stock having voting power and present in person or represented by proxy at the Annual Meeting.
Treatment of Broker Non-Votes; Abstentions. With respect to Proposal One, election of a director requires the affirmative vote of the holders of a plurality of the shares present; so, the two persons receiving the greatest number of votes
-broker non-
-which proxy authority has been withheld with respect to any matter are not deemed to be entitled to vote for purposes of
-in the tabulation of the voting results on any issues requiring the approval of the holders of a majority of our stock having voting power and present in person or represented by proxy at the Annual Meeting. Abstentions, however, are deemed to be entitled to vote for purposes of determining whether stockholder approval of that matter has been obtained, and they would be included in the tabulation of voting results as votes against the proposal. Therefore, including abstentions in the tabulation increases the required number of affirmative votes necessary to approve Proposal Two.
How Your Proxy Will Be Voted
If you complete and submit your proxy card or vote via the internet or by telephone, the shares represented by your proxy will be voted at the Annual Meeting in accordance with your instructions. If you submit your proxy card by mail, but do not fill out the voting instructions on the proxy card, the shares represented by your proxy will be voted in favor of Proposals One and Two. In addition, if any other matters properly come before the Annual Meeting, it is the intention of the

4
persons named in the enclosed proxy card to vote the shares they represent as directed by the Board. We have not received notice of any other matters that may properly be presented at the Annual Meeting.
Revoking Your Proxy
You may revoke your proxy at any time prior to the date of the Annual Meeting by: (1) submitting a later-dated vote in person at the Annual Meeting, via the Internet, by telephone or by mail; or (2) delivering instructions to us at 3939 North First Street, San Jose, California 95134 to the attention of our Corporate Secretary. Any notice of revocation sent to us must
attendance at the Annual Meeting after having executed and delivered a valid proxy card or vote via the internet or by telephone will not in and of itself constitute a revocation of your proxy. If you intend to revoke your proxy by voting in person at the Annual Meeting, you will be required to give oral notice of your intention to do so to the Inspector of Elections
bank or other nominee regarding how to revoke your proxy.
Solicitation of Proxies
We will pay for the cost of this proxy solicitation. We may reimburse brokerage firms and other persons representing beneficial owners of shares for their expenses in forwarding or furnishing proxy solicitation materials to such beneficial owners. Proxies may also be solicited personally or by telephone, telegram, or facsimile by certain of our directors, officers,and regular employees, without additional compensation.
Voting Results
Quarterly Report on Form 10-Q for the fiscal quarter ending June 28, 2009.
WHETHER OR NOT YOU EXPECT TO ATTEND THE ANNUAL MEETING IN PERSON, YOU ARE REQUESTED TO COMPLETE, DATE, AND SIGN THE PROXY CARD AND RETURN IT PROMPTLY, OR VOTE BY TELEPHONE OR VIA THE INTERNET BY FOLLOWING THE DIRECTIONS ON THE PROXY CARD. BY RETURNING YOUR PROXY CARD OR VOTING BY PHONE OR INTERNET PROMPTLY, YOU CAN HELP US AVOID THE EXPENSE OF FOLLOW-UP MAILINGS TO ENSURE A QUORUM IS PRESENT AT THE ANNUAL MEETING. STOCKHOLDERS WHO ATTEND THE ANNUAL MEETING MAY REVOKE A PRIOR PROXY VOTE AND VOTE THEIR SHARES IN PERSON AS SET FORTH IN THIS PROXY STATEMENT.
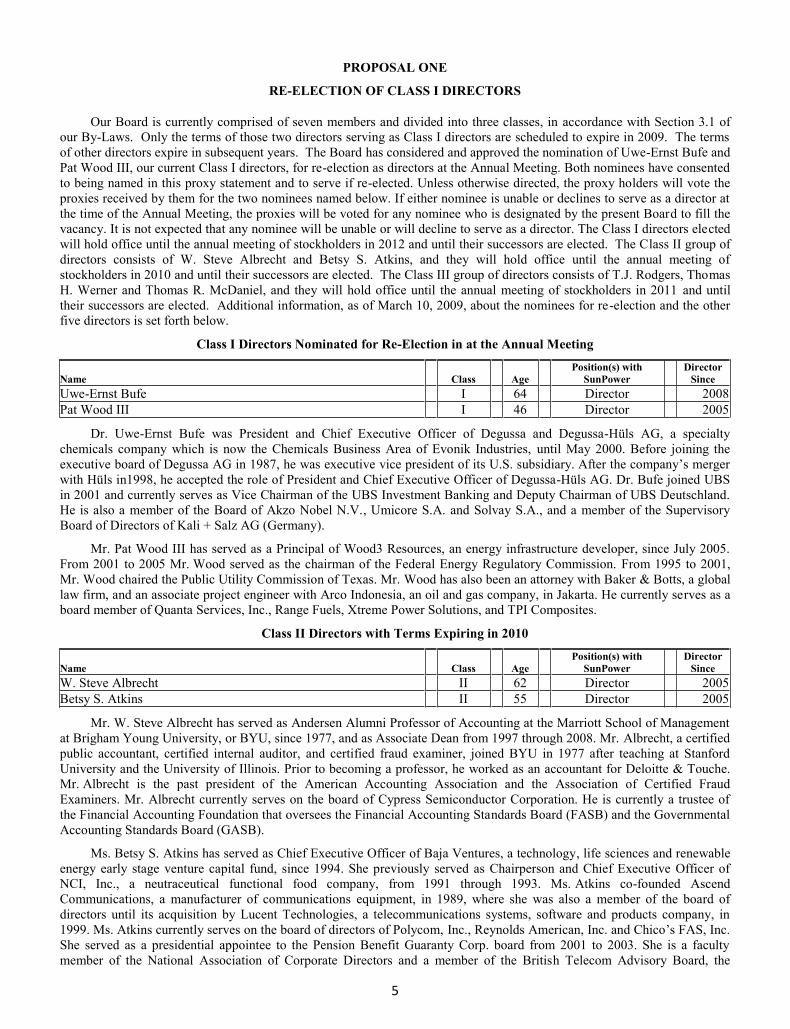
5
PROPOSAL ONE
RE-ELECTION OF CLASS I DIRECTORS
Our Board is currently comprised of seven members and divided into three classes, in accordance with Section 3.1 of our By-Laws. Only the terms of those two directors serving as Class I directors are scheduled to expire in 2009. The terms of other directors expire in subsequent years. The Board has considered and approved the nomination of Uwe-Ernst Bufe and Pat Wood III, our current Class I directors, for re-election as directors at the Annual Meeting. Both nominees have consented to being named in this proxy statement and to serve if re-elected. Unless otherwise directed, the proxy holders will vote the proxies received by them for the two nominees named below. If either nominee is unable or declines to serve as a director at the time of the Annual Meeting, the proxies will be voted for any nominee who is designated by the present Board to fill the vacancy. It is not expected that any nominee will be unable or will decline to serve as a director. The Class I directors electedwill hold office until the annual meeting of stockholders in 2012 and until their successors are elected. The Class II group ofdirectors consists of W. Steve Albrecht and Betsy S. Atkins, and they will hold office until the annual meeting of stockholders in 2010 and until their successors are elected. The Class III group of directors consists of T.J. Rodgers, ThomasH. Werner and Thomas R. McDaniel, and they will hold office until the annual meeting of stockholders in 2011 and until their successors are elected. Additional information, as of March 10, 2009, about the nominees for re-election and the other five directors is set forth below.
Class I Directors Nominated for Re-Election in at the Annual Meeting
Name Class Age Position(s) with
SunPower Director
SinceUwe-Ernst Bufe I 64 Director 2008 Pat Wood III I 46 Director 2005
Dr. Uwe-Ernst Bufe was President and Chief Executive Officer of Degussa and Degussa-Hüls AG, a specialty chemicals company which is now the Chemicals Business Area of Evonik Industries, until May 2000. Before joining the executive board of Degussa AG in 1987, he was executive vice president of its U.S. subsidiary. with Hüls in1998, he accepted the role of President and Chief Executive Officer of Degussa-Hüls AG. Dr. Bufe joined UBS in 2001 and currently serves as Vice Chairman of the UBS Investment Banking and Deputy Chairman of UBS Deutschland. He is also a member of the Board of Akzo Nobel N.V., Umicore S.A. and Solvay S.A., and a member of the Supervisory Board of Directors of Kali + Salz AG (Germany).
Mr. Pat Wood III has served as a Principal of Wood3 Resources, an energy infrastructure developer, since July 2005. From 2001 to 2005 Mr. Wood served as the chairman of the Federal Energy Regulatory Commission. From 1995 to 2001, Mr. Wood chaired the Public Utility Commission of Texas. Mr. Wood has also been an attorney with Baker & Botts, a global law firm, and an associate project engineer with Arco Indonesia, an oil and gas company, in Jakarta. He currently serves as a board member of Quanta Services, Inc., Range Fuels, Xtreme Power Solutions, and TPI Composites.
Class II Directors with Terms Expiring in 2010
Name Class Age Position(s) with
SunPower Director
SinceW. Steve Albrecht II 62 Director 2005 Betsy S. Atkins II 55 Director 2005
Mr. W. Steve Albrecht has served as Andersen Alumni Professor of Accounting at the Marriott School of Management at Brigham Young University, or BYU, since 1977, and as Associate Dean from 1997 through 2008. Mr. Albrecht, a certified public accountant, certified internal auditor, and certified fraud examiner, joined BYU in 1977 after teaching at Stanford University and the University of Illinois. Prior to becoming a professor, he worked as an accountant for Deloitte & Touche. Mr. Albrecht is the past president of the American Accounting Association and the Association of Certified Fraud Examiners. Mr. Albrecht currently serves on the board of Cypress Semiconductor Corporation. He is currently a trustee of the Financial Accounting Foundation that oversees the Financial Accounting Standards Board (FASB) and the Governmental Accounting Standards Board (GASB).
Ms. Betsy S. Atkins has served as Chief Executive Officer of Baja Ventures, a technology, life sciences and renewable energy early stage venture capital fund, since 1994. She previously served as Chairperson and Chief Executive Officer of NCI, Inc., a neutraceutical functional food company, from 1991 through 1993. Ms. Atkins co-founded Ascend Communications, a manufacturer of communications equipment, in 1989, where she was also a member of the board of directors until its acquisition by Lucent Technologies, a telecommunications systems, software and products company, in 1999. Ms. Atkins currently serves on the board of directors of Polycom, She served as a presidential appointee to the Pension Benefit Guaranty Corp. board from 2001 to 2003. She is a faculty member of the National Association of Corporate Directors and a member of the British Telecom Advisory Board, the

6
NASDAQ Exchange LLC board, and the Council on Foreign Relations. Ms. Atkins is member of Florida International s.
Class III Directors with Terms Expiring in 2011
Name Class Age Position(s) with
SunPower Director
SinceThomas R. McDaniel III 59 Director 2009 T.J. Rodgers III 60 Chairman 2002 Thomas H. Werner III 49 CEO and Director 2003
Mr. Thomas R. McDaniel was Executive Vice President, Chief Financial Officer and Treasurer of Edison International, a generator and distributor of electric power and investor in infrastructure and energy assets, before retiring in July 2008 after37 years of service. Prior to January 2005, Mr. McDaniel was Chairman, Chief Executive Officer and President of Edison Mission Energy, a power generation business specializing in the development, acquisition, construction, management and operation of power production facilities. Mr. McDaniel was also Chief Executive Officer and a director of Edison Capital, a provider of capital and financial services supporting the growth of energy and infrastructure projects, products and services, both domestically and internationally. Mr. McDaniel currently serves on the board of directors of the Senior Care Action Network (SCAN) and SCAN Foundation. Through the McDaniel Family Foundation, he is also actively involved in a variety of charitable activities such as the Boys and Girls Club of Huntington Beach, the Adult Day Care Center and the Free Wheelchair Mission.
Mr. T.J. Rodgers is Chairman of our Board. Mr. Rodgers is a co-founder of Cypress Semiconductor Corporation, a semiconductor company, and has been the President and Chief Executive Officer of Cypress and a member of its board of directors since 1982. Mr. Rodgers also serves as a director of Bloom Energy (formerly Ion America) and Silicon Light Machines. Mr. Rodgers is also a member of the Board of Trustees at Dartmouth College.
Mr. Thomas H. Werner has served as our Chief Executive Officer and a member of our Board since 2003. Prior to joining SunPower, from 2001 to 2003, Mr. Werner served as Chief Executive Officer of Silicon Light Machines, Inc., an optical solutions subsidiary of Cypress Semiconductor Corporation. From 1998 to 2001, Mr. Werner was Vice President and General Manager of the Business Connectivity Group of 3Com Corp., a network solutions company. Mr. Werner currently serves as a board member of Cree, Inc. and the Silicon Valley Leadership Group.
THE BOARD OF EACH OF THE PROPOSED NOMINEES.

7
BOARD STRUCTURE
Determination of Independence
It is our policy that a majority of our directors be independent. Our Board has determined that five of our seven directors, namely Mr. Albrecht, Ms. Atkins, Dr. Bufe, Mr. McDaniel, and Mr. Wood, meet the standards for independence as defined by applicable listing standards of the Nasdaq Global Market and rules and regulations of the Securities Exchange Commission. Our Board has also determined that Mr. Werner, our Chief Executive Officer, and Mr. Rodgers, the Chief Executive Officer of our former controlling stockholder Cypress Semiconductor Corporation, are defined by applicable listing standards of the Nasdaq Global Market. There are no family relationships among any of our directors or executive officers.
Board Meetings
Our Board held four regular, quarterly meetings and ten special meetings during fiscal year 2008. During fiscal year 2008, each director attended at least 75% of the aggregate number of meetings of the Board and its committees on which such director served. Our independent directors held three executive sessions during regular, quarterly meetings without management present during fiscal year 2008.
Board Committees
We believe that good corporate governance is important to ensure that we are managed for the long-term benefit of our stockholders. Our Board has established committees to ensure that we maintain strong corporate governance standards. Our Board has standing Audit, Compensation, and Nominating and Corporate Governance committees. The charters of our Board committees are available on our website at http://investors.sunpowercorp.com/documents.cfm. You may also request copies of our committee charters free of charge by writing to SunPower Corporation, 3939 North First Street, San Jose, California 95134, Attention: Corporate Secretary. Below is a summary of our committee structure and membership information.
Director Audit Committee Compensation
Committee
Nominating and Corporate Governance
Committee W. Steve Albrecht Chair Member Member Betsy S. Atkins Member Chair Member Uwe-Ernst Bufe -- Member Member Thomas R. McDaniel Member -- -- T.J. Rodgers -- -- -- Thomas H. Werner -- -- -- Pat Wood III Member Member Chair
Audit Committee
Our Audit Committee is a separately-designated standing committee established in accordance with Section 3(a)(58)(A) of the Securities Exchange Act of 1934, as amended. Each of the members of our Audit Committee is that term is defined in Section 10A of the Exchange Act and as defined by applicable listing standards of the Nasdaq Global Market. Each member of the Audit Committee is financially literate and has the requisite financial sophistication as required by the applicable listing standards of the Nasdaq Global Market. In addition, the Board has determined that Mr. Albrecht
Commission regulations d Election of Class I
The purpose of the Audit Committee, pursuant to its charter, is to:
provide oversight of our accounting and financial reporting processes and the audit of our financial statements and internal controls by our independent registered public accounting firm;assist the Board in the oversight of: (1) the integrity of our financial statements; (2) our compliance with legal and regulatory requirements; (3) qualifications and independence; and (4) the performance of our internal audit function;prepare an audit committee report as required by the Securities and Exchange Commission to be included in our annual proxy statement; andprovide to the Board such information and materials as it may deem necessary to make the Board aware of financial matters requiring the attention of the Board.

8
The Audit Committee also serves as the representative of the Board with respect to its oversight of the matters described in the Report the receipt, retention and treatment of complaints received by us regarding accounting, internal accounting controls or auditing matters, and (2) the confidential, anonymous submission by our employees of concerns regarding accounting or auditing matters. The Audit Committee promptly reviews such complaints and concerns, if any, and confirms none had been received since its last regularly scheduled meeting.
Compensation Committee
Each of the members of the Compensation Committee is Nasdaq Global Market. The Compensation Committee held 11 meetings during 2008.
The Compensation Committee, pursuant to its charter, assists the Board in discharging its duties with respect to:
the formulation, implementation, review, and modification of the compensation of our directors and executive officers;the preparation of an annual report of the Compensation Committee for inclusion in our annual proxy statement or Annual Report on Form 10-K, in accordance with applicable rules of the Securities and Exchange Commission and applicable listing standards of the Nasdaq Global Market;reviewing and discussing the Compensation Discussion and Analysis with management; and the administration of our stock plans, including the Second Amended and Restated SunPower Corporation 2005 Stock Incentive Plan.
In certain instances, the Compensation Committee has delegated limited authority to our Chief Executive Officer with respect to compensation and equity awards for employees other than our executive officers. For more information on our processes and procedures for the consideration and determination of executive and director compensation, see
Compensation Committee Interlocks and Insider Participation
No member of our Compensation Committee was at any time during fiscal 2008 one of our officers or employees, or is one of our former officers or employees. No member of our Compensation Committee had any relationship requiring disclosure under Item 404 and Item 407(e)(4) of Regulation S-K. Additionally, during 2008, none of our executive officers or directors was a member of the board of directors, or any committee of the board of directors, of any other entity such that therelationship would be construed to constitute a committee interlock within the meaning of the rules and regulations of the Securities and Exchange Commission.
Nominating and Corporate Governance Committee
Each of the members of the Nominating and Corporate Governance Committee is applicable listing standards of the Nasdaq Global Market. The Nominating and Corporate Governance Committee held 5 meetings during 2008.
The Nominating and Corporate Governance Committee, pursuant to its charter, assists the Board in discharging its responsibilities with respect to:
the identification of individuals qualified to become directors and the selection or recommendation of candidates for all directorships to be filled by the Board or by the stockholders; and the development, maintenance and recommendation of a set of corporate governance principles applicable to us, and for periodically reviewing such principles.

9
CORPORATE GOVERNANCE
Stockholder Communications with Board of Directors
We provide a process by which stockholders may send communications to our Board, any committee of the Board, our non-management directors or any particular director. Stockholders can contact our non-management directors by sending such communications to the chairman of the Nominating and Corporate Governance Committee, c/o Corporate Secretary, SunPower Corporation, 3939 North First Street, San Jose, California 95134. Stockholders wishing to communicate with a particular Board member, a particular Board committee or the Board as a whole, may send a written communication to our Corporate Secretary, SunPower Corporation, 3939 North First Street, San Jose, California 95134. The Corporate Secretary will forward such communication to the full Board, to the appropriate committee or to any individual director or directors to whom the communication is addressed, unless the communication is unduly hostile, threatening, illegal, or harassing, in which case the Corporate Secretary has the authority to discard the communication or take appropriate legal action regarding the communication.
Although we do not have a formal policy that mandates the attendance of our directors at our annual stockholder meetings, our directors are encouraged to attend. All directors are expected to attend the 2009 Annual Meeting, and four of the then five directors attended our 2008 Annual Meeting.
Submission of Stockholder Proposal for the 2010 Annual Meeting
As a SunPower stockholder, you may submit a proposal, including director nominations, for consideration at future annual meetings of stockholders.
Stockholder Proposals. For stockholder proposals to be considered for inclusion in our 2010 proxy statement, the written proposal must be received by our Corporate Secretary, at our corporate offices at 3939 North First Street, San Jose, California 95134, no earlier than January 8, 2010 and no later than February 7, 2010. We have discretionary power, but are not obligated, to consider stockholder proposals submitted after February 7, 2010. If the date of the 2010 annual meeting is moved more than 25 days before or after the anniversary date of the 2009 Annual Meeting, the deadline for inclusion of proposals in our proxy statement will instead be the tenth business day following notice of the date of the 2010 annual meeting of stockholders. Such proposals will also need to comply with Securities and Exchange Commission regulations, such as Rule 14a-8 of the Exchange Act regarding the inclusion of stockholder proposals in any company-sponsored proxy material.
Nomination of Director Candidates. Our Nominating and Corporate Governance Committee will consider director candidates recommended by our stockholders. Such nominations should be directed to the Nominating and Corporate Governance Committee, c/o Corporate Secretary, SunPower Corporation, 3939 North First Street, San Jose, California 95134. In addition, the stockholder must give notice of a nomination to our Corporate Secretary, and such notice must be
following:
the name, age, business address, residence address and record address of such nominee;
the principal occupation or employment of such nominee;
the class or series and number of shares of our stock owned beneficially or of record by such nominee;
any information relating to the nominee that would be required to be disclosed in our proxy statement;
the nominee holder for, and number of, shares owned beneficially but not of record by such person;
whether and the extent to which any hedging or other transaction or series of transactions has been entered into by or on behalf of, or any other agreement, arrangement or understanding (including any derivative or short positions, profit interests, options or borrowed or loaned shares) has been made, the effect or intent of which is to mitigate loss to or manage risk or benefit of share price changes for, or to increase or decrease the voting power of, such person with respect to any share of our stock;
to the extent known by the stockholder giving the notice, the name and address of any other stockholder supporting the nominee for election or reelection as a director on the date of such stockholder's notice;
a description of all arrangements or understandings between or among such persons pursuant to which the nomination(s) are to be made by the stockholder and any relationship between or among the stockholder giving notice and any person acting in concert, directly or indirectly, with such stockholder and any person controlling,

10
controlled by or under common control with such stockholder, on the one hand, and each proposed nominee, on the other hand; and
a representation that the stockholder intends to appear in person or by proxy at the meeting to nominate the persons named in its notice.
If a director nomination is made pursuant to the process set forth above, the Nominating and Corporate Governance Committee of the Board will apply the same criteria in evaluating the nominee as it would any other board nominee candidate, and will recommend to the Board whether or not the stockholder nominee should be included as a candidate for election in our proxy statement. The nominee and nominating stockholder should be willing to provide any information reasonably requested by the Nominating and Corporate Governance Committee in connection with its evaluation. The Board shall make the final determination whether or not a nominee will be included in the proxy statement and on the proxy card for election.
Once either a search firm selected by the Nominating and Corporate Governance Committee or a stockholder has provided our Nominating and Corporate Governance Committee with the identity of a prospective candidate, the Nominating and Corporate Governance Committee communicates the identity and known background and experience of the candidate to the Board. If warranted by a polling of the Board, members of our Nominating and Corporate Governance Committee and/or other members of our senior management may interview the candidate. If the Nominating and Governance Committee reacts favorably to a candidate, the candidate is next invited to interview with the members of the Board who are not on the Nominating and Governance Committee. The Nominating and Governance Committee then makes a final determination whether to recommend the candidate to the Board for directorship. The Nominating and Governance Committee currently has not set specific, minimum qualifications or criteria for nominees that it proposes for Board membership, but evaluates the
served if our directors bring to the Board a variety of experience and backgrounds and, among other things, demonstrated integrity, executive leadership and financial, marketing or business knowledge and experience.
Related Persons Transactions Policy and Procedures
It is our general policy to conduct our business activities and transactions with the highest level of integrity and ethical standards and in accordance with all applicable laws. In addition, it is our policy to avoid situations that create an actual orpotential conflict between our interests and the personal interests of our officers and directors. Such principles are describedin our Code of Business Conduct and Ethics. Our Code of Business Conduct and Ethics is applicable to our directors, officers, and employees (including our principal executive officer, principal financial officer and principal accounting officer)and is designed to promote compliance with the laws applicable to our business, accounting standards, and proper and ethical business methods and practices. Our Code of Business Conduct and Ethics is available on our website at http://investors.sunpowercorp.com/ governance.cfmwriting to us at SunPower Corporation, 3939 North First Street, San Jose, California 95134, Attention: Corporate Secretary. If we amend or grant a waiver under it applicable to our principal executive officer, principal financial officer or principal accounting officer, we will post a copy of such amendment or waiver on our website.
Under the corporate governance principles adopted by the Nominating and Corporate Governance Committee, that committee is responsible for considering questions of possible conflicts of interest of officers and directors. In addition, related party transactions must be approved by the Audit Committee in compliance with the rules of the Nasdaq Global Market and our Code of Business Conduct and Ethics, and the Audit Committee must present material related party transactions to the full Board of Directors for approval. A related party transaction will only be approved if the directors determine that it is in the best interests of SunPower. If a director is involved in the transaction, he or she will be recusedfrom all voting and approval processes in connection with the transaction.
Certain Relationships and Related Person Transactions
Other than the compensation agreements and other arrangements described herein, and the transactions with Cypress Semiconductor Corporation described below, since the start of our last fiscal year on December 31, 2007, there has not been, nor is there currently proposed, any transaction or series of similar transactions to which we were or will be a party:
in which the amount involved exceeded or will exceed $120,000; and
in which any current director, director nominee, executive officer, beneficial owner of more than 5% of any class of our common stock, or any immediate family member of such persons had or will have a direct or indirect material interest.
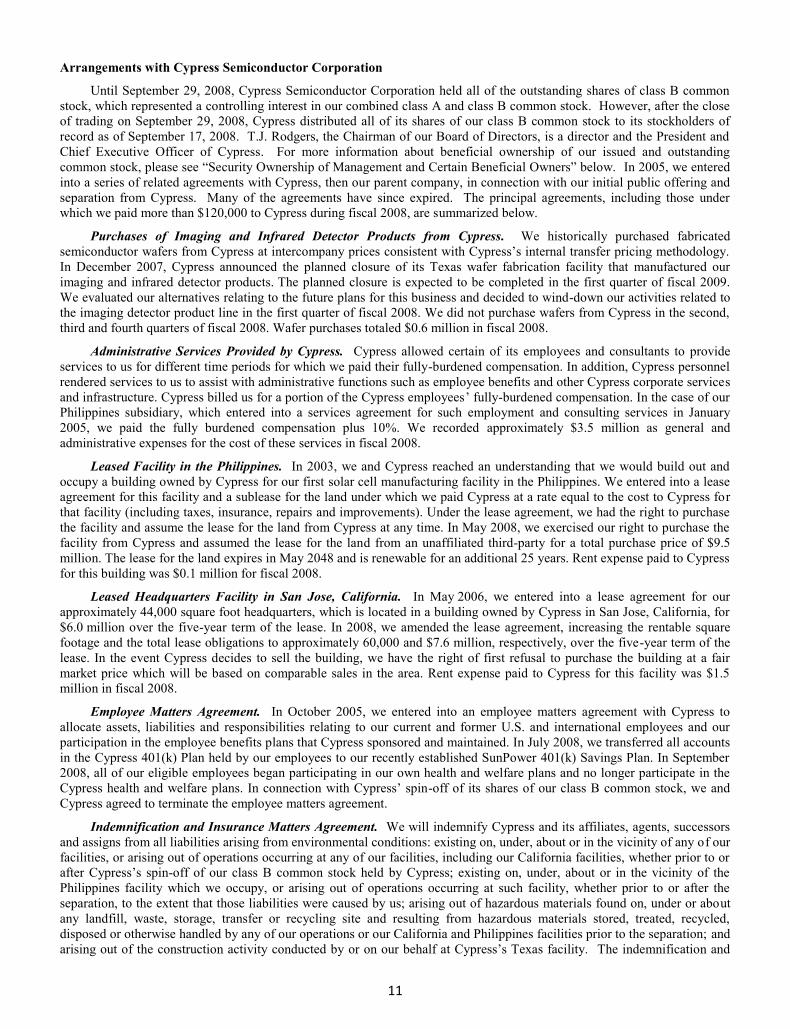
11
Arrangements with Cypress Semiconductor Corporation
Until September 29, 2008, Cypress Semiconductor Corporation held all of the outstanding shares of class B common stock, which represented a controlling interest in our combined class A and class B common stock. However, after the close of trading on September 29, 2008, Cypress distributed all of its shares of our class B common stock to its stockholders of record as of September 17, 2008. T.J. Rodgers, the Chairman of our Board of Directors, is a director and the President and Chief Executive Officer of Cypress. For more information about beneficial ownership of our issued and outstanding
In 2005, we entered into a series of related agreements with Cypress, then our parent company, in connection with our initial public offering and separation from Cypress. Many of the agreements have since expired. The principal agreements, including those under which we paid more than $120,000 to Cypress during fiscal 2008, are summarized below.
Purchases of Imaging and Infrared Detector Products from Cypress. We historically purchased fabricated
In December 2007, Cypress announced the planned closure of its Texas wafer fabrication facility that manufactured our imaging and infrared detector products. The planned closure is expected to be completed in the first quarter of fiscal 2009. We evaluated our alternatives relating to the future plans for this business and decided to wind-down our activities related tothe imaging detector product line in the first quarter of fiscal 2008. We did not purchase wafers from Cypress in the second, third and fourth quarters of fiscal 2008. Wafer purchases totaled $0.6 million in fiscal 2008.
Administrative Services Provided by Cypress. Cypress allowed certain of its employees and consultants to provide services to us for different time periods for which we paid their fully-burdened compensation. In addition, Cypress personnel rendered services to us to assist with administrative functions such as employee benefits and other Cypress corporate services and infrastructure. Cypress billed us for a portion of the Cypress employees -burdened compensation. In the case of our Philippines subsidiary, which entered into a services agreement for such employment and consulting services in January 2005, we paid the fully burdened compensation plus 10%. We recorded approximately $3.5 million as general and administrative expenses for the cost of these services in fiscal 2008.
Leased Facility in the Philippines. In 2003, we and Cypress reached an understanding that we would build out and occupy a building owned by Cypress for our first solar cell manufacturing facility in the Philippines. We entered into a lease agreement for this facility and a sublease for the land under which we paid Cypress at a rate equal to the cost to Cypress for that facility (including taxes, insurance, repairs and improvements). Under the lease agreement, we had the right to purchase the facility and assume the lease for the land from Cypress at any time. In May 2008, we exercised our right to purchase the facility from Cypress and assumed the lease for the land from an unaffiliated third-party for a total purchase price of $9.5 million. The lease for the land expires in May 2048 and is renewable for an additional 25 years. Rent expense paid to Cypress for this building was $0.1 million for fiscal 2008.
Leased Headquarters Facility in San Jose, California. In May 2006, we entered into a lease agreement for our approximately 44,000 square foot headquarters, which is located in a building owned by Cypress in San Jose, California, for $6.0 million over the five-year term of the lease. In 2008, we amended the lease agreement, increasing the rentable square footage and the total lease obligations to approximately 60,000 and $7.6 million, respectively, over the five-year term of the lease. In the event Cypress decides to sell the building, we have the right of first refusal to purchase the building at a fairmarket price which will be based on comparable sales in the area. Rent expense paid to Cypress for this facility was $1.5 million in fiscal 2008.
Employee Matters Agreement. In October 2005, we entered into an employee matters agreement with Cypress to allocate assets, liabilities and responsibilities relating to our current and former U.S. and international employees and our participation in the employee benefits plans that Cypress sponsored and maintained. In July 2008, we transferred all accounts in the Cypress 401(k) Plan held by our employees to our recently established SunPower 401(k) Savings Plan. In September 2008, all of our eligible employees began participating in our own health and welfare plans and no longer participate in the
-off of its shares of our class B common stock, we and Cypress agreed to terminate the employee matters agreement.
Indemnification and Insurance Matters Agreement. We will indemnify Cypress and its affiliates, agents, successors and assigns from all liabilities arising from environmental conditions: existing on, under, about or in the vicinity of any of our facilities, or arising out of operations occurring at any of our facilities, including our California facilities, whether prior to or
-off of our class B common stock held by Cypress; existing on, under, about or in the vicinity of the Philippines facility which we occupy, or arising out of operations occurring at such facility, whether prior to or after the separation, to the extent that those liabilities were caused by us; arising out of hazardous materials found on, under or aboutany landfill, waste, storage, transfer or recycling site and resulting from hazardous materials stored, treated, recycled, disposed or otherwise handled by any of our operations or our California and Philippines facilities prior to the separation; andarising out of th The indemnification and

12
insurance matters agreement also contains provisions governing our insurance coverage, which was under the Cypress insurance policies. As of September 29, 2008, we had obtained our own separate policies for the coverage previously provided under the indemnification and insurance matters agreement.
Tax Sharing Agreement. We have entered into a tax sharing agreement with Cypress providing for each of tobligations concerning various tax liabilities. The tax sharing agreement is structured such that Cypress will pay all federal,state, local and foreign taxes that are calculated on a consolidated or combined basis (while being a member of Cypreconsolidated or combined group pursuant to federal, state, local and foreign tax law). Our portion of such tax liability or benefit will be determined based upon our separate return tax liability as defined under the tax sharing agreement. Such liability or benefit will be based on a pro forma calculation as if we were filing a separate income tax return in each jurisdiction, rather than on a combined or consolidated basis with Cypress subject to adjustments as set forth in the tax sharing agreement.
O
state income tax purposes. To the extent that we become entitled to utilize on our separate tax returns portions of those creditor loss carryforwards existing as of such date, we will distribute to Cypress the tax effect, estimated to be 40% for federal and state income tax purposes, of the amount of such tax loss carryforwards so utilized, and the amount of any credit
December 28, 2008, we had $44.0 million of federal net operating loss carryforwards and approximately $73.5 million of California net operating loss carryforwards. Such potential future payments to Cypress, which would be made over a period of several years, would therefore aggregate approximately $18.7 million.
The majority of these net operating loss carryforwards were created by employee stock transactions. Because there is uncertainty as to the realizability of these loss carryforwards, the portion created by employee stock transactions are not reflected on our Consolidated Balance Sheets.
We will continue to be jointly and severally liable for any tax liability as governed under federal, state and local law during all periods in which we are deemed to be a member of the Cypress consolidated or combined group. Accordingly, although the tax sharing agreement allocates tax liabilities between Cypress and all its consolidated subsidiaries, for any
any federal tax liability was incurred, but not discharged, by any other member of the group.
We will continue to be jointly and severally liable to Cypress until the statute of limitations run for all years where we joined in the filing of tax returns with Cypress. If Cypress experiences adjustments to their tax liability pursuant to tax examinations, we may incur an incremental liability.
the distribution by Cypress of our class B common stock to Cypress stockholders qualified as a tax-free distribution under SectionCypress under Section 355(e) of the Code if 50% or more of our voting power or economic value is acquired as part of a plan or series of related transactions that includes the distribution of our stock. The tax sharing agreement includes our obligationto indemnify Cypress for any liability incurred as a result of issuances or dispositions of our stock after the distribution, other
ur stock to its stockholders to be taxable to Cypress under Section 355(e) of the Code.
The tax sharing agreement further provides for cooperation with respect to tax matters, the exchange of information and the retention of records which may affect the income tax liability of either party. Disputes arising between Cypress and us relating to matters covered by the tax sharing agreement are subject to resolution through specific dispute resolution provisions contained in the agreement.
-off of its shares of our class B common stock, we and Cypress, on August 12, 2008, entered into an Amendment No. transactions that may affect the tax treatment of the spin-off and certain other matters.
Under the Amended Tax Sharing Agreement, we are required to provide notice to Cypress of certain transactions that could give rise to our indemnification obligation relating to taxes resulting from the application of Section 355(e) of the Codeor similar provision of other applicable law to the spin-off as a result of one or more acquisitions (within the meaning of Section 355(e)) of our stock after the spin-off. An acquisition for these purposes includes any such acquisition attributable toa conversion of any or all of our class B common stock to class A common stock or any similar recapitalization transaction or
result solely from (A) issuances and dispositions of our stock prior to the spin-off and (B) any acquisition of our stock by Cypress after the spin-off.

13
Under the Amended Tax Sharing Agreement, we also agreed that, for a period of 25 months following the spin-off, we will not (i) effect a Recapitalization or (ii) enter into or facilitate any other transaction resulting in an acquisition (within the meaning of Section 355(e) of the Code) of our stock without first obtaining the written consent of Cypress; provided, we are
transactions entered into or facilitated by us consummated after August 4, 2008 and during the 25-month period following the spin-off) would involve the acquisition for purposes of Section 355(e) of the Code after August 4, 2008 of more than 25% of
any acquisition of our stock that will qualify under Treasury Regulation Section 1.355-7(d)(8) in connection with the performance of services, (B) any acquisition of our stock for which we furnish to Cypress prior to such acquisition an opinion of counsel and such acquisition will qualify under Treasury Regulation Section 1.355-7(d)(9), (C) an acquisition of our stock (other than involving a public offering) for which we furnish to Cypress prior to such acquisition a Tax Opinion to the effect that such acquisition will qualify under the so- Section 1.355-7(b)(2) or (D) the adoption by us of a standard stockholder rights plan. We further agreed that we will not (i) effect a Recapitalization during the 36 month period following the spin-off without first obtaining a Tax Opinion to the effect that such Recapitalization (either alone or when taken together with any other transaction or transactions) will not cause the spin-off tobecome taxable under Section 355(e), or (ii) seek any private ruling, including any supplemental private ruling, from the IRS with regard to the spin-off, or any transaction having any bearing on the tax treatment of the spin-off, without the prior written consent of Cypress.
14
AUDIT COMMITTEE REPORT
The Audit Committee of our Board of Directors serves as the representative of the Board of Directors with respect to its oversight of:
our accounting and financial reporting processes and the audit of our financial statements;
the integrity of our financial statements;
our internal controls;
our compliance with legal and regulatory requirements and efficacy of and compliance with our corporate policies;
the performance of our internal audit function.
The Audit Committee also reviews the performance of our independent registered public accounting firm, PricewaterhouseCoopers LLP, in the annual audit of financial statements and in assignments unrelated to the audit, and
The Audit Committee provides the Board such information and materials as it may deem necessary to make the Board aware of financial matters requiring the attention of the Board. The Audit Committee reviews our financial disclosures, and meets privately, outside the presence of our management, with our independent registered public accounting firm. In fulfilling its oversight responsibilities, the Audit Committee reviewed and discussed the audited financial statements in our Annual Report on Form 10-K for our fiscal year ended December 28, 2008 with management, including a discussion of the quality and substance of the accounting principles, the reasonableness of significant judgments made in connection with the audited financial statements, and the clarity of disclosures in the financial statements. The Audit Committee reports on these meetings to our Board of Directors.
Our management has primary responsibility for preparing our financial statements and for our financial reporting process. In addition, our management is responsible for establishing and maintaining adequate internal control over financial reporting. Our independent registered public accounting firm, PricewaterhouseCoopers LLP, is responsible for expressing an opinion on the conformity of our financial statements to generally accepted accounting principles, and on the effectiveness of our internal control over financial reporting.
The Audit Committee reports as follows:
(1) The Audit Committee has reviewed and discussed the audited financial statements for fiscal year 2008 with our management.
(2) The Audit Committee has discussed with PricewaterhouseCoopers LLP, our independent registered public accounting firm, the matters required to be discussed by Statement on Auditing Standards No. 61, as amended (AICPA, Professional Standards, Vol. 1, AU Section 380, as adopted by the Public Company Accounting Oversight Board in Rule 3200T).
(3) The Audit Committee has received the written disclosures and the letter from PricewaterhouseCoopers LLP required by the applicable requirements of the Public Company Accounting Oversight Board, and has discussed with
-audit services to us is compatible with its independence.
The Audit Committee has adopted a policy that requires advance approval of all audit, audit-related, tax services, and other services performed by the independent registered public accounting firm. The policy provides for pre-approval by the Audit Committee (or its Chair pursuant to delegated authority) of specifically defined audit and non-audit services. Unless the specific service has been previously pre-approved with respect to that fiscal year, the Audit Committee (or its Chair pursuant to delegated authority) must approve the specific service before the independent registered public accounting firm is engaged to perform such services for us.

15
Based on the review and discussion referred to in items (1) through (3) above, the Audit Committee recommended to our Board of Directors, and the Board approved, the inclusion of our audited financial statements in our Annual Report on Form 10-K for the fiscal year ended December 28, 2008, as filed with the Securities and Exchange Commission. The Audit Committee also recommended the reappointment of PricewaterhouseCoopers LLP as our independent registered public accounting firm for fiscal year 2009.
AUDIT COMMITTEE OF THE BOARD OF DIRECTORS
W. Steve Albrecht, ChairBetsy S. AtkinsThomas R. McDaniel Pat Wood III

16
COMPENSATION COMMITTEE REPORT
The following report has been submitted by the Compensation Committee of the Board of Directors:
The Compensation Committee of the Board of Directors has reviewed and discussed our Compensation Discussion and Analysis with management. Based on this review and discussion, the Compensation Committee recommended to the Board of Directors that the Compensation Discussion and Analysis be included in our definitive proxy statement on Schedule 14A for our 2009 Annual Meeting, which is incorporated by reference in our Annual Report on Form 10-K for the fiscal year ended December 28, 2008, each as filed with the Securities and Exchange Commission.
The foregoing report was submitted by the Compensation Committee of the Board and shall not be deemed to be sion or
Section 18 of the Securities Exchange Act of 1934.
COMPENSATION COMMITTEE OFTHE BOARD OF DIRECTORS
Betsy S. Atkins, ChairW. Steve AlbrechtUwe-Ernst Bufe Pat Wood III
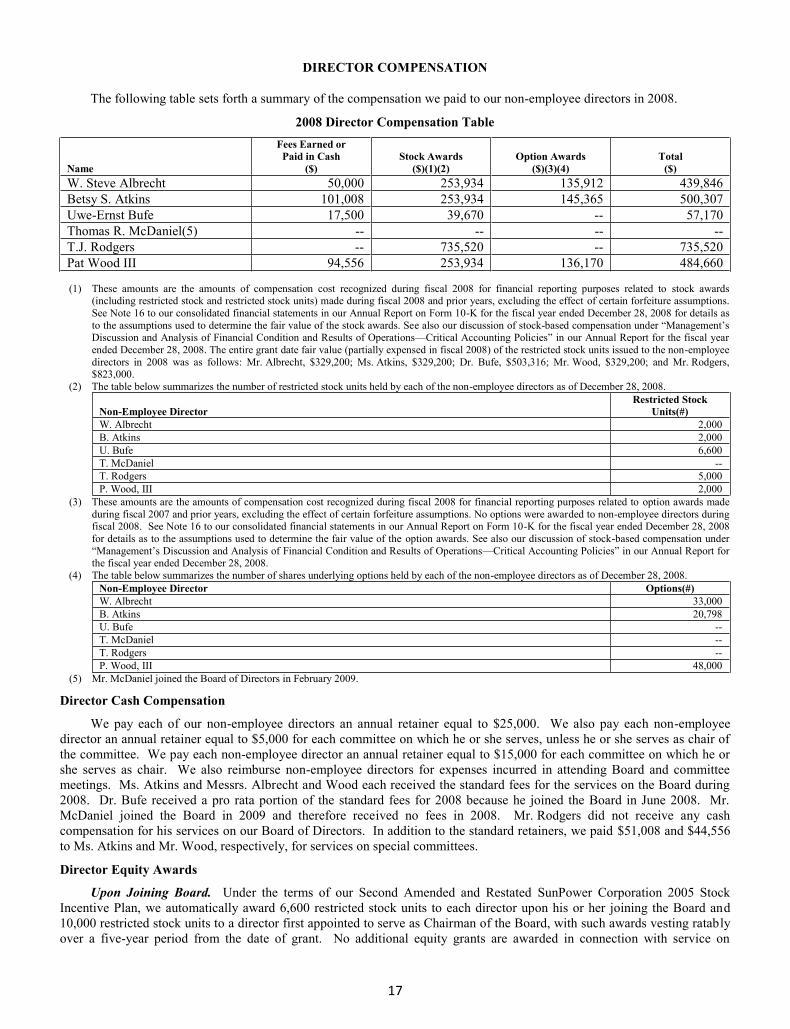
17
DIRECTOR COMPENSATION
The following table sets forth a summary of the compensation we paid to our non-employee directors in 2008.
2008 Director Compensation Table
Name
Fees Earned or Paid in Cash
($) Stock Awards
($)(1)(2) Option Awards
($)(3)(4) Total
($) W. Steve Albrecht 50,000 253,934 135,912 439,846 Betsy S. Atkins 101,008 253,934 145,365 500,307 Uwe-Ernst Bufe 17,500 39,670 -- 57,170 Thomas R. McDaniel(5) -- -- -- -- T.J. Rodgers -- 735,520 -- 735,520 Pat Wood III 94,556 253,934 136,170 484,660
(1) These amounts are the amounts of compensation cost recognized during fiscal 2008 for financial reporting purposes related to stock awards (including restricted stock and restricted stock units) made during fiscal 2008 and prior years, excluding the effect of certain forfeiture assumptions. See Note 16 to our consolidated financial statements in our Annual Report on Form 10-K for the fiscal year ended December 28, 2008 for details as to the assumptions used to determine the fair value of the stock awards. See also our discussion of stock-Discussion and Analysis of Financial Condition and Results of Operationsended December 28, 2008. The entire grant date fair value (partially expensed in fiscal 2008) of the restricted stock units issued to the non-employee directors in 2008 was as follows: Mr. Albrecht, $329,200; Ms. Atkins, $329,200; Dr. Bufe, $503,316; Mr. Wood, $329,200; and Mr. Rodgers, $823,000.
(2) The table below summarizes the number of restricted stock units held by each of the non-employee directors as of December 28, 2008.
Non-Employee Director Restricted Stock
Units(#) W. Albrecht 2,000 B. Atkins 2,000 U. Bufe 6,600 T. McDaniel --T. Rodgers 5,000 P. Wood, III 2,000
(3) These amounts are the amounts of compensation cost recognized during fiscal 2008 for financial reporting purposes related to option awards made during fiscal 2007 and prior years, excluding the effect of certain forfeiture assumptions. No options were awarded to non-employee directors during fiscal 2008. See Note 16 to our consolidated financial statements in our Annual Report on Form 10-K for the fiscal year ended December 28, 2008 for details as to the assumptions used to determine the fair value of the option awards. See also our discussion of stock-based compensation under
the fiscal year ended December 28, 2008. (4) The table below summarizes the number of shares underlying options held by each of the non-employee directors as of December 28, 2008.
Non-Employee Director Options(#) W. Albrecht 33,000 B. Atkins 20,798 U. Bufe --T. McDaniel --T. Rodgers --P. Wood, III 48,000
(5) Mr. McDaniel joined the Board of Directors in February 2009.
Director Cash Compensation
We pay each of our non-employee directors an annual retainer equal to $25,000. We also pay each non-employee director an annual retainer equal to $5,000 for each committee on which he or she serves, unless he or she serves as chair of the committee. We pay each non-employee director an annual retainer equal to $15,000 for each committee on which he or she serves as chair. We also reimburse non-employee directors for expenses incurred in attending Board and committee meetings. Ms. Atkins and Messrs. Albrecht and Wood each received the standard fees for the services on the Board during 2008. Dr. Bufe received a pro rata portion of the standard fees for 2008 because he joined the Board in June 2008. Mr. McDaniel joined the Board in 2009 and therefore received no fees in 2008. Mr. Rodgers did not receive any cash compensation for his services on our Board of Directors. In addition to the standard retainers, we paid $51,008 and $44,556 to Ms. Atkins and Mr. Wood, respectively, for services on special committees.
Director Equity Awards
Upon Joining Board. Under the terms of our Second Amended and Restated SunPower Corporation 2005 Stock Incentive Plan, we automatically award 6,600 restricted stock units to each director upon his or her joining the Board and 10,000 restricted stock units to a director first appointed to serve as Chairman of the Board, with such awards vesting ratablyover a five-year period from the date of grant. No additional equity grants are awarded in connection with service on

18
committees. During fiscal 2008, Dr. Bufe received a grant of 6,600 restricted stock units upon his joining the Board. During 2009, Mr. McDaniel received a grant of 6,600 restricted stock units in 2009 upon his joining the Board.
Annual Awards. Under the terms of our Second Amended and Restated SunPower Corporation 2005 Stock Incentive Plan, on the first business day after each annual meeting of stockholders, we award 4,000 restricted stock units to each director other than the Chairman of the Board and 10,000 restricted stock units to the Chairman of the Board, if the director has served for at least six months prior to the annual meeting. Such awards vest quarterly over a one-year period from the date of grant. No additional grants are awarded in connection with service on committees. During fiscal 2008, Ms. Atkins and Messrs. Albrecht and Wood each received an award of 4,000 restricted stock units, and Mr. Rodgers received an award of 10,000 restricted stock units. Mr. Rodgers engages in certain management activities in addition to participating in board meetings, including among other things participating in periodic technology reviews and oversight, and other management activities. In March 2009, the Compensation Committee reviewed director compensation under existing provisions of our Second Amended and Restated SunPower Corporation 2005 Stock Incentive Plan, in light of current market conditions and the appropriate role of a Chairman of the Board of Directors. The Compensation Committee determined that the automatic grants to the Chairman should be reduced from 10,000 to 8,000 restricted stock units upon first appointment to the role and following each annual meeting of stockholders. Based on the Compensation CoDirectors approved the proposed amendment, and the reduced award amount shall be effective as of the Annual Meeting of Stockholders to be held on May 8, 2009.

19
EXECUTIVE OFFICERS
Certain information, as of March 10, 2009, regarding each of our executive officers is set forth below. Name Age PositionThomas H. Werner 49 Chief Executive Officer Dennis V. Arriola 48 Senior Vice President and Chief Financial Officer Bruce R. Ledesma 41 General Counsel and Corporate Secretary Marty T. Neese 46 Chief Operating Officer Douglas J. Richards 50 Vice President, Human Resources & Corporate Services Daniel S. Shugar 45 President, SunPower Corporation, Systems Richard M. Swanson 63 President and Chief Technical Officer, SunPower Corporation Howard J. Wenger 49 President, Global Business Units
Mr. Thomas H. Werner has served as our Chief Executive Officer and a member of our Board since 2003. Prior to joining SunPower, from 2001 to 2003, Mr. Werner served as Chief Executive Officer of Silicon Light Machines, Inc., an optical solutions subsidiary of Cypress Semiconductor Corporation. From 1998 to 2001, Mr. Werner was Vice President and General Manager of the Business Connectivity Group of 3Com Corp., a network solutions company. Mr. Werner currently serves as a board member of Cree, Inc. and the Silicon Valley Leadership Group.
Mr. Dennis V. Arriola has served as our Senior Vice President and Chief Financial Officer since November 2008. From 2006 to November 2008, Mr. Arriola served as Vice President and Chief Financial Officer of San Diego Gas & Electric and Souther From 2001 to 2006, Mr. Arriola served as Vice President of Communications and Investor Relations for Sempra Energy. From 1998 to 2001, he was
Manager, South American Operations. From 1994 to 1998, he was Vice President and Treasurer for Pacific Enterprises/Southern California Gas Company. Mr. Arriola formerly served as a trustee for the Tomás Rivera Policy Institute in Los Angeles, and also as a member of the board of directors of the San Diego Symphony.
Mr. Bruce R. Ledesma has served as our General Counsel and Corporate Secretary since January 2007. From 2005 to 2007 Mr. Ledesma served as General Counsel of PowerLight Corporation. From 2002 to 2004 Mr. Ledesma served as the Executive Vice President and General Counsel of Barra, Inc., a financial risk management company. From 2000 to 2002 Mr. ral Counsel. From 1993 to 1998, Mr. Ledesma practiced as a corporate attorney for Latham & Watkins LLP. Mr. Ledesma currently serves as a board member of Tahoe-Baikal Institute, a nonprofit organization.
Mr. Marty T. Neese has served as our Chief Operating Officer since June 2008. From October 2007 to June 2008, Mr. Neese served as Executive Vice President, Worldwide Operations of Flextronics International Ltd., a manufacturing services company. From September 2004 to October 2007, Mr. Neese served in a variety of senior management positions at Solectron Corporation, a manufacturing services company, most recently as its Executive Vice President, Worldwide Operations. From September 2000 to September 2004 Mr. Neese served in various management roles, most recently as Vice President, Program Management and Sales Operations of Sanmina-SCI, an EMS provider of end-to-end manufacturing solutions.
Mr. Douglas J. Richards has served as our Vice President, Human Resources and Corporate Services since September 2007. From 2006 to 2007, Mr. Richards was Vice President of Human Resources and Administration for SelectBuild, a construction services company and a wholly-owned subsidiary of BMHC, and from 2000 to 2006, Mr. Richards was Senior Vice President of Human Resources and Administration for BlueArc, a provider of high performance unified network storage systems to enterprise markets.
Mr. Daniel S. Shugar has served as President of our subsidiary SunPower Corporation, Systems (formerly known as PowerLight Corporation), a position he held since January 2007, when we acquired PowerLight Corporation. In March 2009, Mr. Shugar began a previously announced leave of absence expected to continue nine to twelve months so that he can pursue personal interests. Mr. Shugar joined PowerLight in January 1996. Prior to entering the photovoltaics industry, he
of transmission planning and substation operations. Mr. Shugar also serves as a member of the Board of Trustees of the American Solar Energy Society.
Dr. Richard M. Swanson co-founded SunPower Corporation in 1985. He has served as our President and Chief Technical Officer since 2003. Prior to his current position, Dr. Swanson served as our Chief Executive Officer and President from 1991 to 2003 and our Vice President and Director of Technology from 1990 to 1991. From 1976 to 1991, Dr. Swanson served as a professor of electrical engineering at Stanford University.

20
Mr. Howard J. Wenger has served as our President, Global Business Units since August 2008, prior to which he served as our Senior Vice President, Global Business Units since February 2008, and as our Vice President, Global Business Units since January 2007. From 2003 to 2007, Mr. Wenger served as Executive Vice President and a member of the board of directors for PowerLight Corporation, a solar system integration company that we acquired in January 2007 and later renamed SunPower Corporation, Systems. From 2000 to 2003, he was Vice President, North American Business of AstroPower Inc., a solar power manufacturer and system provider. From 1998 to 2000 Mr. Wenger was the Director, Grid-Connected Business, for AstroPower. From 1993 to 1998 Mr. Wenger co-founded and managed Pacific Energy Group, a solar power consulting firm, and, from 1989 to 1993, Mr. Wenger worked for the Pacific Gas & Electric Company, a utility company in northern California, in both photovoltaic research and strategic planning.

21
COMPENSATION DISCUSSION AND ANALYSIS
Executive Summary
This Compensation Discussion and Analysis provides an overview of our compensation policies with respect to compensation paid to each of the named executive officers during the fiscal year ended December 28, 2008. The Compensation Committee of the Board of Directors determined each element of their compensation. For 2008, the Compensation Committee established a total compensation target at or above the 50th percentile of a peer group of companies. In each instance, the cash compensation base salary in particular was set at or slightly below the 50th percentile, and compensation opportunities under incentive plans were set between the 50th and 75th percentiles so that a significant portion of the executive officers total compensation depended upon actual corporate and individual performance.
th percentile for fiscal 2008, while his performance-based cash bonus targets and performance-based equity award target were set at approximately the 75th
percentile. The Compensation Committee determined that tying a significant portion of compensation to performance was consistent with rewarding individuals who contributed to increased long-term value for stockholders. Consistent with this philosophy and as a result of our missing certain corporate financial targets during the fourth fiscal quarter of 2008, our named executive officers received no payouts under our 2008 Quarterly Bonus Program. During fiscal 2008, we also entered into change of control agreements with the named executive officers that generally entitle named executive officers, other than our Chief Executive Officer, to payments and accelerated vesting only in connection with change of control scenarios. In addition, we adopted a severance plan for our named executive officers and other key employees that provides limited severance and no accelerated vesting, avoiding any potential windfall to executive officers without delivering long-term value to stockholders.
Named Executive Officers
As reported in this proxy statement, our named executive officers for fiscal 2008 consist of the seven individuals listed in the table below.
Name Title Thomas H. Werner Chief Executive Officer Dennis V. Arriola Senior Vice President and Chief Financial Officer
Thomas L. Dinwoodie Founder and Chief Technology Officer, SunPower Corporation, Systems
Emmanuel T. Hernandez Vice President, Finance and former Chief Financial Officer Bruce R. Ledesma General Counsel and Corporate Secretary Daniel S. Shugar President, SunPower Corporation, Systems Howard J. Wenger President, Global Business Units
General Philosophy and Objectives
For fiscal 2008, we designed and implemented a compensation program designed primarily to reward our named executive officers for positive financial performance and achievement of corporate objectives consistent with increasing long-term stockholder value. Our compensation program was premised on the following primary goals:
aligning executive compensation with business objectives and performance,
enabling us to attract, retain and reward executive officers who contribute to our long-term success,
attracting and retaining the best people in the industry, and
providing additional long-term incentives to officers and employees to work to maximize stockholder value.
The Compensation Committee of our Board of Directors is responsible for managing compensation of our executive officers, including the named executive officers, consistent with our primary goals. The Compensation Committee consists entirely of independent directors in accordance with applicable listing standards of the Nasdaq Global Markets and Section 162(m) of the Internal Revenue Code. The Compensation Committee annually reviews and, as necessary and appropriate,
named executive officers total compensation opportunities at or above the 50th percentile of our peer group of companies during fiscal 2008. When determining appropriate compensation for executive officers, the Compensation Committee considered advice of independent compensation consultants, recommendations from management and internal compensation specialists, and practices of companies within our peer group.

22
Benchmarking
The Compensation Committee retained Radford Surveys + Consulting, a business unit of Aon Corporation, or Radford, a compensation consulting firm, to identify and maintain a list of our peer group of companies. Due to the relative youth of the solar industry in 2008, however, Radford provided information regarding compensation programs at certain semiconductor and capital equipment companies with annual revenue between $1 billion and $3 billion and headquarters in northern California. The Compensation Committee also asked Radford to include companies that we identified as among our peer group, which we believed most closely matched our core business. The companies included in our peer group are listed below.
Altera LSI Logic
Atmel National Semiconductor
Coherent Novellus Systems
Cypress Semiconductor Corporation Omnivision Technologies
Evergreen Solar Palm
First Solar Plantronics
Harris Stratex Networks Polycom
Integrated Device Technology Spansion
JDS Uniphase Verigy US
Komag Vishay Siliconix
Lam Research Xerox International Partners
Logitech Xilinx
Radford also advised the Compensation Committee in connection with evaluating our compensation practices, developing and implementing our executive compensation program and philosophy, establishing total compensation targets, and setting specific compensation components to reach the determined total compensation targets. With respect to each company in our peer group, Radford provided compensation data including base salaries, cash bonus awards as a percentage of base salaries, total cash compensation, and equity awards.
Compensation Components
The Compensation Committee allocated total compensation among various elements including base salary, discretionary cash bonus awards, performance-based cash bonus awards, time-based equity awards, performance-based equity awards, and perquisites and other compensation. The table below provides an overview of each element of compensation and is followed by a further discussion of such elements.
Compensation Component Objective and Basis Form Base salary Provide base compensation that is competitive for each role CashDiscretionary cash bonus awards
Attract top executive talent from other companies Cash
Performance-based cash bonus awards
Short term incentive to drive company performance and align executives interests with stockhold
Cash
Time-based equity awards Long-term incentive to align executives interests with stockholdinterests; retain executives through long-term vesting and potential wealth accumulation
Restricted stock units; options
Performance-based equity awards
Long-term incentive to drive company performance and align executives interests with stockholdthrough long-term vesting and potential wealth accumulation
Restricted stock units
Perquisites and other compensation
Provide standard compensation arrangements as discussed below Various
offered our executive officers against compensation offered by our peer group companies to their executive officers, the tax and accounting consequences of certain types of equity compensation when determining compensation packages, and a desire to allocate a higher proportion of total compensation through performance-based equity incentive awards.

23
Base Salary. For fiscal 2008, we established base salaries for our executives based on the scope of their responsibilities, and took into account competitive market compensation paid by companies in our competitive peer group for similar positions. Generally, we believed that base salaries for executive officers should be targeted at or below the 50th
percentile of the range of salaries for executive officers in similar positions and with similar responsibilities at comparablecompanies in line with our compensation philosophy in order to best attract, retain and equitably reward our executives.
th percentile and increased the other compensation components to set his total compensation target at or above the 50th percentile.
We review base salaries annually, and adjust base salaries from time to time to realign salaries with market levels, experience,
criticality of position and expected future performance. Our Compensation Committee approves the employee salary for our Chief Executive Officer, and for each named executive officer below the Chief Executive Officer level based on the Chief E
Based on information presented to our Compensation Committee by Radford regarding market ranges for salaries at , other than the Chief Ex
salary, at approximately the 50th percentile of our peer group of companies, and adjusted during the past year, criticality of position, and expected future performance. As a result, we believe that we compensated ournamed executive officers equitably in 2008 when compared to competitive or similar companies. The table below sets forth the salaries in effect in fiscal 2007 compared against fiscal 2008 for each of our named executive officers.
Name 2007 Base Salary 2008 Base Salary(1) Thomas H. Werner 323,000 360,000 Dennis V. Arriola(2) -- 425,000 Thomas L. Dinwoodie 243,300 250,000 Emmanuel T. Hernandez 310,000 330,000 Bruce R. Ledesma 225,000 250,000 Daniel S. Shugar 243,300 260,000 Howard J. Wenger(3) 232,500 310,000
(1)(2) Mr. Arriola joined us on November 10, 2008. (3) President, Global Business
Units, from $275,000 to $310,000 on August 18, 2008.
Discretionary Cash Bonus Awards. During 2008 we continued our principle of providing short-term cash bonus awards only in limited circumstances and instead emphasized performance-based cash awards. We believe performance-
iscretionary short-term cash bonus award granted to a named executive officer during 2008 was a $300,000 sign-on bonus for Mr. Arriola in connection with our hiring him in November 2008. This bonus was granted principally as a recruitment incentive and as a means of compensating Mr. Arriola for his foregoing a bonus opportunity at his prior employer.
Performance-Based Cash Bonus Awards. Rather than institute a discretionary cash bonus program for our named executive officers, we adopted two performance-based cash bonus plans during fiscal 2008. The first such plan is our Annual Key Employee Bonus Plan, under which we adopted a 2008 program we refer to as our 2008 Annual Bonus Program. The second such plan is our Key Employee Quarterly Key Initiative Bonus Plan, under which we adopted a 2008 program we refer to as our 2008 Quarterly Bonus Program. These plans provide performance-based cash bonus awards that align executive compensation with business objectives and performance.
While we set base salaries for our executive officers at or slightly below the 50th percentile, we relied on performance-based cash bonus awards to establish a target of total cash compensation between the 50th and 75th percentiles. In doing so, we recognized that this made our bonus targets higher than the median bonus programs among our peer group. We believed this to be necessary to achieve our goals of attracting, retaining and motivating our executive officer team. For each individual, a target bonus was established between the 50th and 75th percentile, and adjusted during the past year, criticality of position, and expected future performance. However, to more directly align the interests of our executive officers with increasing long-term stockholder value, we allocated two-annual target bonus awards under the 2008 Annual Bonus Program and only one-third under the 2008 Quarterly Bonus Program. Our Compensation Committee approved the individual bonus program incentive level for our Chief Executive
recommendations. The table below summarizes the total target payout, including awards under the 2008 Annual Bonus Program and the 2008 Quarterly Bonus Program, as a percentage of annual base salary, for each named executive officer during fiscal 2007 and fiscal 2008, and the allocation between the 2008 Annual Bonus Program and the 2008 Quarterly Bonus Program. The target payouts under the 2008 Annual Bonus Program were effective as of the beginning of the fiscal

24
year while the target payouts under the 2008 Quarterly Bonus Program were effective as of the beginning of the quarter following approval by the Compensation Committee.
Name
2007 Total Target Payout
(including Annual and Quarterly Programs) as Percentage of
Annual Salary(%)
2008 Total Target Payout
(including Annual and Quarterly Programs) as Percentage of
Annual Salary(%)
2008 Quarterly Bonus Program
Target Payout as Percentage of
Annual Salary(%)
2008 Annual Bonus Program
Target Payout as Percentage of
Annual Salary(%)
Thomas H. Werner 80 200 66.7 133.3 Dennis V. Arriola(1) -- 70 23.3 46.7 Emmanuel T. Hernandez 80 80 26.7 53.3 Thomas L. Dinwoodie 50 50 16.7 33.3 Bruce R. Ledesma 50 50 16.7 33.3 Daniel S. Shugar 50 50 16.7 33.3 Howard J. Wenger(2) 50 80 26.7 53.3
(1) Mr. Arriola, who joined us on November 10, 2008, was ineligible to participate in our bonus plans during 2007 and 2008. (2) Mr. obal
Business Units, from 70% to 80% on August 18, 2008.
Both the 2008 Annual Bonus Program and the 2008 Quarterly Bonus Program included formulas that calculate actual bonus payments to named executive officers. Payouts under our 2008 Annual Bonus Program required our achieving certain corporate milestones, consisting of annual revenue and profit before tax targets. Payouts under our 2008 Quarterly Bonus Program required our achieving certain corporate milestones, including quarterly revenue and profit before tax targets, as well as the individual achieving personal milestones. The corporate milestones were selected after considering our history of growth and then-current expectations regarding our future growth, as well as potential challenges in achieving such future growth. The corporate milestones were intended to constitute a challenging goal, without any certainty of achievement, that would benefit stockholders and thereby justify compensating the named executive officers accordingly.
Awards under the 2008 Annual Bonus Program were formula-driven and were assessed at the end of the fiscal year based on our attainment of revenue and profit before tax targets for the year. The Compensation Committee approved our annual revenue and profit before tax targets at the beginning of fiscal 2008. We exceeded our revenue and profit before tax goals for 2008, and awards were paid in February 2009. Such bonus payments are reflected in the 2008 Non-Equity
Awards under the 2008 Quarterly Plan were also formula-driven and were assessed following the end of each fiscal quarter. The Compensation Committee approved our quarterly revenue and profit before tax targets at the beginning of each fiscal quarter. We exceeded our revenue and profit before tax goals for the first three fiscal quarters during 2008 but failed to
almilestones. Bonuses were paid only for performance during the first three quarters under the 2008 Quarterly Bonus Program because we did not achieve our corporate milestones under the 2008 Quarterly Bonus Program for the fourth fiscal quarter. Such bonus payments are reflected in the 2008 Non-Equity Incentive Plan Tadiscussion of applicable targets and results follows.
In addition to the 2008 Annual Bonus Program and 2008 Quarterly Bonus Program, we offered cash payments to all employees, including our named executive officers, under our patent award program. The patent award program entitles employees to pre-determined cash bonus payments upon achievement of specific milestones, including filing patent applications with and obtaining patent approval from the U.S. Patent and Trademark Office. During 2008, Messrs. Dinwoodie and Shugar both earned payments under the patent award program.
Time-Based and Performance-Based Equity Awards. Our Compensation Committee believes that long-term company performance is best achieved through an ownership culture that encourages long-term performance by our executive officers through the use of equity-based awards. Our Second Amended and Restated SunPower Corporation 2005 Stock Incentive Plan permits the grant of stock options, stock appreciation rights, restricted shares, restricted stock units, performance shares, and other stock-based awards. Consistent with our goal to attract, retain and reward the best available talent, and in light ofour setting our total direct compensation at or above the 50th percentile of our peer group of companies, we targeted long-term equity awards at the 75th
performance during the past year, value of unvested versus vested equity grants from prior years, criticality of position, and expected future performance. Actual equity awards consisted of a mix of one-third time-based equity awards and two-thirds performance-based equity awards.

25
Since 2007, our Compensation Committee has standardized equity compensation ranges for our executive officers based on position and applicable targets. However, because our class A common stock has experienced a volatile trading history, our Compensation Committee reviewed its trading patterns quarterly during 2008 and adjusted equity award tables used by the Compensation Committee and management in granting equity awards to the executive officers and employees. If the value of our class A common stock had changed by more than 30% from when the equity award table was last set, the Compensation Committee increased or decreased the range of equity awards accordingly so that named executive officers and other employees would be granted a number of equity awards valued consistently with predetermined targets for equity compensation.
Time-based equity awards were used principally as a retention tool during 2008. In connection with our annual review of executive officer compensation, we awarded restricted stock units and in certain cases options to purchase shares of our class A common stock to named executive officers in 2008. Such awards generally vest ratably over a three-year period from the applicable date of grant. Because Mr. Werner had not received any equity awards since our initial public offering in 2005, the Compensation Committee granted to him a special award of 10,000 restricted stock units that vested immediately upon gr -below.
Performance-based equity awards were used principally as incentive compensation during 2008. In connection with our annual review of executive officer compensation in January 2008, we established certain corporate milestones, consisting of annual revenue and profit before tax targets, and a formula under which actual awards would be calculated after completion of the 2008 fiscal year. The corporate milestones were selected after considering our history of growth and then-current expectations regarding our future growth, as well as potential challenges in achieving such future growth. The corporate milestones were intended to constitute a challenging goal, without any certainty of achievement, that would benefit stockholders and thereby justify compensating the named executive officers accordingly. Based on achievement of the corporate milestones, our named executive offices received restricted stock units that generally vest ratably over a three-year
-
Perquisites and Other Compensation. Perquisites were not a material portion of the overall compensation program for our executives in 2008. We provided certain perquisites and other personal benefits, such as health, vision, and life insurance, which are generally available to all employees. In addition, we permitted Messrs. Dinwoodie and Wenger to have personal use of a vehicle leased by the company for business purposes. We also provided matching contributions to the 401(k) accounts of Messrs. Dinwoodie, Ledesma, Shugar, and Wenger. Such matching contributions are a continuation of the benefits program of PowerLight Corporation that existed before our acquisition of PowerLight in January 2007, and remained generally available to all employees of that subsidiary during 2008. For fiscal 2009, we adopted a new 401(k) plan and offer matching contributions to all eligible employees, including our named executive officers. We also agreed to reimburse Mr. Arriola for legal expenses incurred in connection with review of his employment agreement and relocation expenses incurred in connection with his joining us and relocating from San Diego to the San Francisco Bay Area. We anticipate incurring these costs in 2009.
Pension Benefits. None of our named executive officers participate in or have account balances in qualified or non-qualified defined benefit plans sponsored by us.
Nonqualified Deferred Compensation. None of our named executive officers participate in or have account balances in non-qualified defined contribution plans or other deferred compensation plans maintained by us.
Employment Agreements and Severance Arrangements
During fiscal 2008 we reviewed our existing employment agreements and severance obligations in light of industry practices. Previously, we had entered into limited agreements with our named executive officers. Certain individuals who had joined us in connection with our acquisition of PowerLight in 2007 entered into employment agreements with us that entitled them to benefits in certain cases of employment termination. Other individuals were entitled to limited severance benefits set forth in their original offer letters. Based on advice from Radford, we undertook to standardize our employment practices and severance benefits for executive officers in 2008 and accordingly established a form of change of control agreement that was executed with each named executive officer. Generally, the agreements entitle named executive officers to certain calculated payments tied to base salary and bonus targets and accelerated vesting of their outstanding equity awards, but only in connection with change of control scenarios, except in the case of the Chief Executive Officer who receives accelerated vesting of outstanding equity awards even if terminated without cause or if he resigns for good reason without a change of control having occurred. We also adopted a severance pl
and bonus targets, if termination of employment occurs without a change of control having occurred. The severance plan does not entitle any of the plan participants to accelerated vesting of outstanding equity awards. The Compensation Committee believed that officers who were terminated outside of a change of control context should not receive a potential

26
windfall of accelerated equity awards without delivering an increase in long-term value to stockholder. Unique provisions were included in certain agreements, but the Compensation committee believes the agreements and Management Career Transition Plan provide benefits that are consistent with industry practice. For more information about the named executive
Employment Agreements and Potential Payments Upon Termination or Change of Control
Section 162(m) Treatment Regarding Performance-Based Equity Awards
Under Section 162(m) of the Internal Revenue Code of 1986, as amended, a public company is generally denied deductions for compensation paid to the Chief Executive Officer and the next four most highly compensated executive officers to the extent the compensation for any such individual exceeds one million dollars for the taxable year. Our Compensation Committee intends to preserve the deductibility of compensation payable to our executives, although deductibility will be only one among a number of factors considered in determining appropriate levels or modes of compensation.
Indemnification of Officers and Directors
Under Article VIII of our Amended and Restated Certificate of Incorporation and Article 6 of our Restated Bylaws, we will indemnify our directors, officers, employees and other agents to the maximum extent allowed under Delaware corporate law. Delaware corporate law generally provides for officers, directors and other corporate agents to be indemnified in situations including under certain circumstances for liabilities (including reimbursement for expenses) arising under the Securities Act of 1933, as amended. We have entered into agreements with our directors and officers that will require us, among other things, to indemnify them against certain liabilities that may arise by reason of their status or service as directors or officers of SunPower Corporation and its subsidiaries to the fullest extent permitted by law. We have been informed,
controlling us for liabilities arising under the Securities Act, such indemnification is against public policy as expressed in the Securities Act and is therefore unenforceable.
Other Disclosures
We do not maintain any equity or other security ownership guidelines or requirements for our executives. We do not have a policy regarding adjustment or recovery of awards or payments if the relevant performance goals or measures upon which they are based are restated or otherwise adjusted so that awards or payments are reduced.

27
EXECUTIVE COMPENSATION
Compensation of Named Executive Officers
of each of the named executive officers for services rendered during fiscal 2008 and, with respect to certain named executive officers, fiscal 2007 and fiscal 2006. For fiscal 2008, our named executive officers consisted of our Chief Executive Officer,two individuals who served as our Chief Financial Officer during 2008, three most highly compensated individuals who served as executive officers as of December 28, 2008, and one highly compensated individual who served as an executive officer during 2008 but who was not serving as an executive officer as of December 28, 2008. Messrs. Dinwoodie, Ledesma, and Wenger joined us in January 2007 in connection with our acquisition of PowerLight Corporation; therefore, information regarding their compensation addresses compensation earned by them only thereafter. Mr. Arriola joined us in November 2008; therefore, information regarding his compensation addresses compensation earned by him only thereafter. The primary
-on bonus (for Mr. Arriola only), performance-based bonuses under our 2008 Annual Bonus Program and 2008 Quarterly Bonus Program, awards of restricted stock units subject to time-based vesting, awards of options to purchase shares of our class A common stock (for Mr. Arriola only) subject to time-based vesting, and awards of performance-based restricted stock units subject to achievement of corporate milestones and subsequent time-based vesting.
de -
information regarding the long-term equity incentives awarded to our named executive officers. The tables entitled -
ble value and actual value realized with respect to their equity awards during fiscal 2008.
2008 Summary Compensation Table
Name and Principal Position YearSalary ($)(1)
Bonus ($)(2)
Stock Awards ($)(3)
Option Awards ($)(3)
Non-Equity Incentive Plan Compensation
($)(4)
All Other Compensation
($)(5) Total
($)Thomas H. Werner, Chief Executive Officer
2008 362,466 -- 3,104,598 160,571 678,915 9,307 4,315,857 2007 323,000 -- -- 212,543 206,092 -- 741,635 2006 315,096 -- -- 385,549 198,838 -- 899,483
Dennis V. Arriola, Senior Vice President and
Chief Financial Officer 2008 57,212 300,000 53,004 23,647 -- 12,686 446,549 Thomas L. Dinwoodie, Founder and Chief Technology Officer,
SunPower Corporation, Systems
2008 269,261 19,916,205 -- 124,333 12,548 20,322,347
2007 242,997 -- 20,638,377 -- 90,445 -- 20,971,819 Emmanuel T. Hernandez, Vice President, Finance and former
Chief Financial Officer(6)
2008 336,533 -- 1,015,340 35,039 236,933 6,851 1,630,696 2007 321,923 -- 47,820 241,379 192,197 -- 803,319 2006 307,582 -- -- 622,859 176,109 -- 1,106,550
Bruce R. Ledesma, General Counsel and Corporate
Secretary
2008 251,924 1,436,310 -- 115,367 11,592 1,815,193
2007 221,430 -- 445,852 597,396 84,297 -- 1,348,975 Daniel S. Shugar, President, SunPower Corporation,
Systems 2008 264,874 -- 7,938,592 -- 123,346 11,754 8,338,566 Howard J. Wenger, President, Global Business Units
2008 285,969 -- 3,215,458 -- 186,600 5,332 3,693,359 2007 232,344 -- 802,529 1,758,511 85,437 -- 2,878,821
(1) Salary represents actual salary earned during each applicable year, and includes base salary and actual payments for accrued vacation and holidays. (2) Excludes the following bonuses paid to Messrs. Dinwoodie, Wenger and Ledesma after our acquisition of PowerLight Corporation in January 2007,
based on their performance as officers of PowerLight Corporation during 2006: $32,197, $36,383, and $30,391, respectively. sign-on bonus paid in November 2008.
(3) Represents the amounts of compensation cost recognized during the applicable fiscal year for financial reporting purposes related to awards made during fiscal 2008 and prior years, excluding the effect of certain forfeiture assumptions. See Note 16 to our consolidated financial statements in our Annual Report on Form 10-K for the fiscal year ended December 28, 2008 for details as to the assumptions used to determine the fair value of the awards. See also our discussion of stock-based compeOperations -K for the fiscal year ended December 28, 2008. Such compensation costs, with respect to Messrs. Dinwoodie, Ledesma, Shugar and Wenger, also include costs recognized in connection with the lapsing of restrictions previously imposed by equity restriction agreements executed in connection with our acquisition of PowerLight Corporation in 2007. The equity

28
(4) Consists of amounts earned under our 2008 Annual Bonus Program and our 2008 Quarterly Bonus Program. Additional information about non-equity incentive plan compensation earned during fiscal 2008 is set forth below in the 2008 Total Non-Equity Incentive Plan Compensation Table.
(5) All other compensation consists of the elements summarized in the table below. The value of personal use of a leased car is the pro rata amount ofcost incurred by us as estimated by the individual. .
NameHealth
BenefitsGroup Life Insurance 401(k) Match Relocation Legal Fees
Personal Use of Leased Car Total
T. Werner 8,748 559 -- -- -- -- 9,307 D. Arriola -- 104 -- 6,526 6,056 -- 12,686 T. Dinwoodie 8,748 568 2,563 -- -- 669 12,548 E. Hernandez 6,066 785 -- -- -- -- 6,851 B. Ledesma 8,748 240 2,604 -- -- -- 11,592 D. Shugar 8,748 383 2,623 -- -- -- 11,754 H. Wenger 540 421 2,623 -- -- 1,748 5,332
(6) Mr. Hernandez resigned as our Chief Financial Officer on November 10, 2008, when Mr. Arriola was appointed our Senior Vice President and ChiefFinancial Officer.

29
Dur
ing
2008
, our
nam
ed e
xecu
tive
offic
ers
earn
ed p
lan-
base
d re
stric
ted
stoc
k un
its a
nd o
ptio
ns to
pur
chas
e sh
ares
of o
ur c
lass
A c
omm
on s
tock
und
er o
ur S
econ
d A
men
ded
and
Res
tate
d Su
nPow
er C
orpo
ratio
n 20
05 S
tock
Ince
ntiv
e Pl
an.
They
als
o ea
rned
cas
h bo
nus
awar
ds u
nder
our
200
8 A
nnua
l Pro
gram
and
our
200
8 Q
uarte
rly
Bon
us P
rogr
am. T
he fo
llow
ing
tabl
e se
ts fo
rth in
form
atio
n re
gard
ing
the
stoc
k aw
ards
and
cas
h bo
nus a
war
ds g
rant
ed to
eac
h na
med
exe
cutiv
e of
ficer
dur
ing
2008
.
2008
Gra
nts o
f Pla
n-B
ased
Aw
ards
Tab
le
Nam
e G
rant
D
ate(
2)
Est
imat
ed F
utur
e Pa
yout
s Und
er N
on-
Equ
ity In
cent
ive
Plan
Aw
ards
(1)
Est
imat
ed P
ossib
le P
ayou
ts U
nder
Equ
ity
Ince
ntiv
e Pl
an A
war
ds(2
) A
ll ot
her
Stoc
k A
war
ds:
Num
ber
of
Shar
es o
f St
ock
or
Uni
ts (#
)
All
othe
r O
ptio
n A
war
ds:
Num
ber
of
Secu
ritie
s U
nder
lyin
g O
ptio
ns (#
)
Exe
rcis
e or
B
ase
Pric
e of
O
ptio
n A
war
ds
($/S
h)
Gra
nt D
ate
Fair
Val
ue o
f St
ock
and
Opt
ion
Aw
ards
($)
Thr
esho
ld
($)
Tar
get
($)
Max
imum
($
) T
hres
hold
(#
) T
arge
t (#
)M
axim
um
(#)
T. W
erne
r 1/
31/0
8(3)
--
48
0,00
0 96
0,00
0 --
--
--
--
--
--
--
1/
31/0
8(4)
--
23
3,83
3 25
7,21
6 --
--
--
--
--
--
--
5/
8/08
(5)
--
--
--
--
33,3
50
50,0
25
--
--
--
4,18
6,09
2 1/
31/0
8(6)
--
--
--
--
--
--
16
,650
--
--
1,
150,
349
1/31
/08(
7)
--
--
--
--
--
--
10,0
00
--
--
690,
900
D. A
rrio
la
11/1
2/08
(8)
--
--
--
--
--
--
50,0
00
--
--
1,23
6,00
0 11
/12/
08(9
) --
--
--
--
--
--
--
50
,000
24
.72
735,
580
T. D
inw
oodi
e 1/
31/0
8(3)
--
83
,333
16
6,66
7 --
--
--
--
--
--
--
1/
31/0
8(4)
--
41
,388
45
,526
--
--
--
--
--
--
--
5/
8/08
(5)
--
--
--
--
5,00
0 7,
500
--
--
--
627,
600
1/31
/08(
6)
--
--
--
--
--
--
2,50
0 --
--
17
2,72
5 E.
Her
nand
ez
1/31
/08(
3)
--
176,
000
352,
000
--
--
--
--
--
--
--
1/31
/08(
4)
--
86,6
67
95,3
33
--
--
--
--
--
--
--
5/8/
08(5
) --
--
--
--
20
,000
30
,000
--
--
--
2,
510,
400
1/31
/08(
6)
--
--
--
--
10,0
00
--
--
690,
900
B. L
edes
ma
1/31
/08(
3)
--
83,3
33
166,
667
--
----
--
--
--
--
1/31
/08(
4)
--
40,6
25
44,6
88
--
--
--
--
--
--
--
5/8/
08(5
) --
--
--
--
5,
000
7,50
0 --
--
--
62
7,60
0 1/
31/0
8(6)
--
--
--
--
--
--
2,
500
--
--
172,
725
D. S
huga
r 1/
31/0
8(3)
--
86
,667
17
3,33
3 --
--
--
--
--
--
--
1/
31/0
8(4)
--
42
,638
46
,901
--
--
--
--
--
--
--
5/
8/08
(5)
--
--
--
--
6,00
0 9,
000
--
--
--
753,
120
1/31
/08(
6)
--
--
--
--
--
--
3,00
0 --
--
20
7,27
0 H
. Wen
ger
1/31
/08(
3)
--
165,
333
330,
667
--
--
--
--
--
--
--
1/31
/08(
4)
--
68,3
55
75,1
90
--
--
--
--
--
--
--
5/8/
08(5
) --
--
--
--
8,
000
12,0
00
--
--
--
1,00
4,16
0 1/
31/0
8(6)
--
--
--
--
--
--4,
000
--
--
276,
360

30
(1) Additional information about estimated future payouts under non-Under Non-
(2) The possible payouts under equity incentive plan awards represent performance-based restricted stock units. The Compensation Committee of our Board of Directors approved the awards on January 31, 2008 when it also approved the other cited awards; however, the awards were made subject to stockholders approving our Second Amended and Restated SunPower Corporation 2005 Stock Incentive Plan at the 2008 annual meeting ofstockholders on May 8, 2008. The stockholders approved the plan.
(3) Includes award under our 2008 Annual Bonus Program. Achievement of certain corporate milestones could reduce payouts to zero when applied to the formula. As a result, threshold payouts were inapplicable for each named executive officer.
(4) Includes award under our 2008 Quarterly Bonus Program. Achievement of certain corporate milestones could reduce payouts to zero when applied to the formula. As a result, threshold payouts were inapplicable for each named executive officer.
(5) Includes award of restricted stock units, subject to achievement of specific corporate milestones in addition to time-based vesting requirements, under our Second Amended and Restated SunPower Corporation 2005 Stock Incentive Plan. Failure to achieve certain corporate milestones could have resulted in zero restricted stock units being awarded. Actual results were determined in 2009, and the award vests ratably on January 31, 2009, January 31, 2010, and January 31, 2011. The maximum attainable was 110% of the target. The closing price of our class A common stock was $83.68 on May 8, 2008.
(6) Includes award of restricted stock units, subject to time based vesting requirements, under our Second Amended and Restated SunPower Corporation 2005 Stock Incentive Plan. The award vests ratably on January 31, 2009, January 31, 2010, and January 31, 2011. The closing price of our class A common stock was $69.09 on January 31, 2008.
(7) Includes award of restricted stock units, under our Second Amended and Restated SunPower Corporation 2005 Stock Incentive Plan. The award vested immediately upon grant on January 31, 2008. The closing price of our class A common stock was $69.09 on January 31, 2008.
(8) Includes award of restricted stock units, subject to time based vesting requirements, under our Second Amended and Restated SunPower Corporation 2005 Stock Incentive Plan. The award vests ratably on November 12, 2009, November 12, 2010, and November 12, 2011. The closing price of our class A common stock was $24.72 on November 12, 2008.
(9) Includes award of option to purchase shares of our class A common stock, subject to time based vesting requirements, under our Second Amended and Restated SunPower Corporation 2005 Stock Incentive Plan. The award vests ratably on November 12, 2009, November 12, 2010, November 12, 2011, and November 12, 2012. The closing price of our class A common stock was $24.72 on November 12, 2008.
Non-Equity Incentive Plan Compensation
During fiscal 2008, our named executive officers were eligible for cash bonus payments under two bonus plans. The first plan was our Annual Key Employee Bonus Plan, under which we adopted our 2008 Annual Bonus Program. The second plan was our Key Employee Quarterly Key Initiative Plan, under which we adopted our 2008 Quarterly Bonus Program. The
-Equity Incentive Plan Awards Tab
and the 2008 Quarterly Bonus Program. Under the terms of both bonus plans, failure to achieve certain corporate or individual milestones could have resulted in zero payouts under any given period. For example, no cash bonuses were awarded with respect to the fourth fiscal quarter of 2008 because we failed to achieve certain corporate milestones. The tableentit -two bonus plans to each named executive officer during fiscal 2008, as well as two awards made under our patent award program. Our patent award program is designed to recognize individual contributions to the development of our corporate portfolio of intellectual property. Upon achievement of certain key milestones, cash payments are awarded to eligible individuals, including our named executive officers.
Estimated Future Payouts Under Non-Equity Incentive Plan Awards Table
Name
2008 Quarterly Bonus Program 2008 Annual Bonus
Program Target
($)
2008 Annual Bonus
Program Max ($)
Q1Target
($) Q1 Max
($)
Q2Target
($) Q2 Max
($)
Q3Target
($) Q3 Max
($)
Q4Target
($) Q4 Max
($) T. Werner 53,833 59,216 60,000 66,000 60,000 66,000 60,000 66,000 480,000 960,000 D. Arriola -- -- -- -- -- -- -- -- -- -- T. Dinwoodie 10,138 11,151 10,417 11,458 10,417 11,458 10,417 11,458 83,333 166,667 E. Hernandez 20,667 22,733 22,000 24,200 22,000 24,200 22,000 24,200 176,000 352,000 B. Ledesma 9,375 10,313 10,417 11,458 10,417 11,458 10,417 11,458 83,333 166,667 D. Shugar 10,138 11,151 10,833 11,917 10,833 11,917 10,833 11,917 86,667 173,333 H. Wenger 13,563 14,919 16,042 17,646 18,083 19,892 20,667 22,733 165,333 330,667

31
2008 Total Non-Equity Incentive Plan Compensation Table
Name
2008 Quarterly Plan Compensation 2008 Annual Bonus
Program Compensation
Payout ($)
Patent Award Program Payout
($)
Total Non-Equity
Incentive Plan Compensation
($) Q1 Payout
($) Q2 Payout
($) Q3 Payout
($) Q4 Payout
($) Thomas H. Werner 43,574 56,274 51,619 -- 527,448 -- 678,915 Dennis V. Arriola -- -- -- -- -- -- --Thomas L. Dinwoodie 10,138 10,417 10,207 -- 91,571 2,000 124,333 Emmanuel T. Hernandez 10,229 16,544 16,762 -- 193,398 -- 236,933 Bruce R. Ledesma 8,099 8,406 7,291 -- 91,571 -- 115,367
Daniel S. Shugar 7,522 10,508 8,882 -- 95,234 1,200 123,346
Howard J. Wenger 9,969 12,352 13,020 -- 151,259 -- 186,600
2008 Annual Bonus Program. Awards under the 2008 Annual Bonus Program were formula-driven. At the beginning of fiscal 2008, the Compensation Committee of our Board of Directors established the two performance metrics: a revenue target and a profit before tax target. For purposes of comparing the actual operating income results against the performance goals following the performance period, both the target and the actual operating income were to be adjusted to exclude certain events during fiscal 2008. Based on the formula, if we achieved less than 80% of the revenue target, or if we achieved less than 80% of the profit before tax target, no bonus would be payable under the 2008 Annual Bonus Program. At a minimum, we had to achieve 80% of both targets before any awards would payable. If both targets were achieved, bonus awards were calculated based upon the following formulas, giving equal weight to both financial metrics:
If actual revenue equaled 80 80% and 100% of e
% for each percent by which the target was exceeded, up to a maximum of 200%. The
Bonus Program would ever exceed 200% of the target bonus award. The performance targets, set at the beginning of fiscal 2008, were assessed at the end of fiscal 2008. Based on our attainment of revenue and profit before tax targets for the year, awards under the 2008 Annual Bonus Program were paid in February 2009. Such bonus payments are reflected in the tables above. Under our 2008 Annual Bonus Program, we achieved 114.8% of our revenue target and 104.7% of our profit before tax target.
2008 Quarterly Bonus Program. Awards under the 2008 Quarterly Bonus Program were also formula-driven. At the beginning of each fiscal quarter during 2008, the Compensation Committee of our Board of Directors established corporate performance metrics, consisting of a profit before tax target and a set of corporate milestones representing key initiatives that would support our corporate business plan. Also at the beginning of each fiscal quarter, each named executive officer was responsible for establishing personal metrics, subject to approval by the Compensation Committee, representing key
Based on the formula, if we achieved less than 80% of the profit before tax target, or if we achieved less than 60% of the corporate milestones, no bonus would be payable under the 2008 Quarterly Bonus Program. If we achieved at least 80% of the profit before tax target and greater than 80% of the corporate milestones, then bonus awards were calculated based upon the following formula:
If we achieved at least 80% of the profit before tax target but between 60 and 80% of the corporate milestones, then bonus awards were calculated based upon the following formula:
be zero. If both the we achieved 80% or greater of the profit before tax target and greater than 100% of our corporate milestones, a bonus award would be prorated and paid above 100%, subject to a maximum cap of 110
Is are established at the beginning of each fiscal

32
quarter proposed by the individual and reviewed and approved by the Chief Executive Officer, in the case of named executive officers other than the Chief Executive Officer Is consist solely of the corporate milestones that Board of Directors establishes after discussion with the Chief Executive Officer. KIs are designed to be objective, measurable goals that support the concurrent quarterly and annual corporate milestones and that are attainable but not certain. The combined personal KI scores for the named executive officers ranged from 49.5% to 100.0%, and averaged 82.0% during the year. Under our 2008 Quarterly Bonus Program, the quarterly corporate milestone scores ranged from 71.5% to 93.6%, and averaged 83.0% during fiscal 2008.
Equity Incentive Plan Compensation
To further align executive compensation with maximizing stockholder value, our Compensation Committee granted to our named executive officers certain performance-based equity awards, consisting of restricted stock units that would be released and begin time-based vesting only upon achievement of certain corporate objectives. At the beginning of fiscal 2008, our Compensation Committee established qualifying two criteria: a revenue target and a GAAP operating income target. For purposes of comparing the actual operating income results against the performance goals following the performance period, both the target and the actual operating income were to be adjusted to exclude certain events during fiscal 2008. Based on the formula, if we achieved less than 90% of the revenue target, or if we achieved less than 80% of the operating income target, no performance-based restricted stock units would be released and begin vesting. If we achieved at least 90% of the revenue target and at least 80% of the operating income target, then performance-based grants were calculated based upon the following formula:
percentage. If we achi
achieved 80% of the operating income target
until reaching 100%. If we achieved 100% of the operating inc
120%. In connection with our 2008 performance-based equity awards, we achieved 114.8% of our revenue target and 112.7% of our operating income target.
Employment Agreements and Potential Payments Upon Termination or Change of Control
We have entered into employment agreements and award agreements under our equity plans with certain of our executive officers, including our named executive officers, and we have adopted a severance policy entitled the
service, the participant will forfeit any outstanding equity awards except that a participant will have 90 days following termination of employment or service to exercise any then-vested options or stock appreciation rights (one year if termination of employment or service is a result of the participare entitled to receive certain payments from us or our affiliates in the event of certain change of control or termination events.
Employment Agreements. During 2008, with the approval of the Compensation Committee of our Board of Directors, we entered into employment agreements with several executive officers, including among others Messrs. Arriola, Dinwoodie, Hernandez, Ledesma, Shugar, Wenger, and Werner. The employment agreements superseded prior agreements of a similar nature. employment - d at any time by either party. Each employment agreement provides for a three-year term that will automatically renew unless we provide notice of our intent not to renew at least 120 days prior to the renewal date. The agreements do not specify salary, bonus or other basic compensation terms, but instead alary, annual bonus and equity compensation will be determined in accordance with our normal practices. Instead, the primary purpose of the agreements is to provide certain severance benefits for employment terminations in connection with a change of control (as defined in the agreement). or if the executive resigns for good reason (as defined in the agreement), and if such termination or resignation is in connection with a change of control, then the agreements also provide that the executive is entitled to the following benefits:
a lump-salary;

33
a lump-sum payment equal to any earned but unpaid annual bonus for a completed fiscal year;
a lump-
our benefit plans our expense;
a lump- and paid time off; and
reimbursement of up to $15,000 for services of an outplacement firm mutually acceptable to us and the executive.
In addition, if we terminate fsuch termination or resignation is in connection with a change of control, then the agreements also provide the following benefits to the individual:
ome fully vested and (as applicable) exercisable as of the termination date and remain exercisable for the time period otherwise applicable to such equity awards following such termination date pursuant to the applicable equity incentive plan and equity award agreement; and
all provisions regarding forfeiture, restrictions on transfer, and our rights of repurchase, in each case otherwise applicable to shares of restricted stock or restricted stock units shall lapse as of the termination date.
In addition, forfeiture, restrictions on transfer and our rights of repurchase upon termination of employment without cause or resignation for good reason, regardless of whether such termination is in connection with a change of control; provided, however, that
-based equity awards.
rovides for him to have received a sign-on bonus of $300,000, subject to a pro rata refund if he leaves before completing one year of employment. If Mr. Arriola resigns for good reason or is terminated without cause before the passage of one year, then he he is entitled to reimbursement of legal fees, up to $10,000, incurred in connection with a review of his offer letter. Finally,
up to 12 months of temporary housing, assistance in selling his home in the San Diego area, including up to $500,000 of compensation for loss on the sale of his home, reimbursement of certain costs in purchasing a new home, gross up for tax obligations, and, if Mr. Arriola is terminated without cause during his first year of employment, up to $100,000 in reimbursement of relocation expenses to return to San Diego.
faith: (i) acts or omissions constituting gross negligence or willful misconduct on the part of the executive with respect to the
contendere to, crimes involving fraud, misappropriation or embezzlement, or a felony crime of moral turpitude, (iii) the that
his violation or breach was reasonably based on the advice of our outside counsel, or willful violation of any of our published
contractual dutdamage to us or our business; provided that if any of the foregoing events is capable of being cured, we will provide notice tothe executive describing the nature of such event and the executive will thereafter have thirty (30) days to cure such event. In
on a combined basis, excluding a reduction that is applied to substantially all of our other senior executives; provided, however, that for purposes of this clause (iii) whether a reduction in target bonus has occurred shall be determined without any regard to any actual bonus payments made to the executive, or (iv) a relocation of
-five (45) miles from our current business location. The e
employment agreement, the executive gives notice to us of the occurrence of such event and we fail to cure the event within thirty (30) days following its receipt of such notice from the executive, and the executive terminates service within twenty-four (24) months following a change of control.

34
The September 29, 2008 distribution by Cypress Semiconductor Corporation of all of its shares of our class B common stock did not constitute under the employment agreements.
If any of the severance payments, accelerated vesting and lapsing of restrictions would
ull or delivered as to such lesser extent which would result in no portion of such benefits being subject to such taxes, interest or penalties, whichever results in the executive receiving, on an after-tax basis, the greatest amount of benefits. We providpayments.
Prior to receiving the benefits described in the employment agreements, the executive will be required to sign a separation agreement and release of claims. In addition, the benefits will be conditioned upon the executive not soliciting employees or customers for one year following the termination date. termination without cause or resignation for good reason is not in connection with a change of control, his severance benefits will be conditioned upon a non-competition arrangement lasting one year following employment termination.
Management Career Transition Plan. During 2008, we also adopted a corporate policy entitled the Management Career Transition Plan. It addresses severance for employment terminations not in connection with a change of control. Participants in the Plan include the Chief Executive Officer and those employees who have been employed by us for at least 6 months and report directly to him (including our named executive officers, though Mr. Arriola becomes eligible in May 2009 because he joined us in November 2008), as well as other key employees who are recommended for participation by the Chief Executive Officer. Under the terms of the Plan, Mr. Werner and the employees reporting to him will be eligible for the benefits following a termination of employment without cause (as defined in the Plan), or resignation for good reason (as defined in the Plan), so long as such termination or resignation is not in connection with a change of control (as defined inthe Plan). Such benefits include:
a lump-salary;
a lump-sum payment equal to any earned but unpaid annual bonus for a completed fiscal year;
a lump-year, based on the amount of time between the start of the fiscal year and the termination date;
continuation of suc our benefit plans our expense; and
a lump- off.
of the Internal Revenue Code and be subject to excise tax or any interest or penalties payable with respect to such excise tax,then the portion of such benefits being subject to such taxes, interest or penalties, whichever results in the executive receiving, on anafter-tax basis, the greatest amount of benefits.
Businesses in our industry face a number of risks, including the risk of being acquired in the future. We believe that entering into change of control and severance arrangements with certain of our executives has helped us attract and retain excellent executive talent. Without these provisions, these executives may not have chosen to accept employment with us or remain employed by us.
Tabular Disclosure of Termination Payments. The following tables summarize the estimated payments that would be made on December 28, 2008 to our named executive officers upon certain events including:
termination with cause or voluntary resignation;
involuntary termination without cause or voluntary resignation for good reason in connection with a change of control;
involuntary termination without cause or voluntarily resignation for good reason not in connection with a change of control;
retirement; or
discontinued service due to death or disability,

35
as described in their respective employment agreements, and under the Management Career Transition Plan, assuming each such event had occurred on December 28, 2008. The dollar value identified with respect to each type of equity award is based on each off holdings as of December 28, 2008 and the $38.38 per share closing price for our class A common stock on December 26, 2008, the last trading day of our fiscal year ended December 28, 2008. For more information on each
-Year
impact of certain provisions of the employment agreements that provide that, in the event any payments under the employment agreements would constitute parachute payments under Section 280G of the Internal Revenue Code or be subject to the excise tax of Section 4999 of the Internal Revenue Code, then such payments should be either delivered in full or reduced to result in no portion being subject to such tax provisions and still yield the greatest payment to the individual on an after tax basis.

36
Ter
min
atio
n Pa
ymen
ts T
able
Nam
e T
erm
inat
ion
Scen
ario
C
ontin
ued
Sala
ry($
)
Bon
us a
nd
Acc
eler
ated
N
on-E
quity
In
cent
ive
Plan
($)
Acc
eler
ated
O
ptio
ns($
)
Acc
eler
ated
R
estr
icte
d St
ock(
$)
Acc
eler
ated
R
estr
icte
d St
ock
Uni
ts($
)
Con
tinue
d M
edic
al
Ben
efits
($)
Out
plac
e-
men
t Ser
vice
s T
otal
($)
T. W
erne
r Te
rmin
atio
n w
ith c
ause
or
volu
ntar
y re
sign
atio
n w
ithou
t go
od re
ason
--
--
--
--
--
--
--
--
In
volu
ntar
y te
rmin
atio
n w
ithou
t ca
use
or v
olun
tary
resi
gnat
ion
for
good
reas
on in
con
nect
ion
with
ch
ange
of c
ontro
l 1,
080,
000
2,68
7,44
8 4,
058,
665
--
2,35
8,96
2
10,8
93
--
10,1
95,9
68
Invo
lunt
ary
term
inat
ion
with
out
caus
e or
vol
unta
ry re
sign
atio
n fo
r go
od re
ason
not
in c
onne
ctio
n w
ith c
hang
e of
con
trol
720,
000
527,
448
4,05
8,66
5
--2,
358,
962
7,
262
--
7,67
2,33
7 R
etire
men
t --
--
--
--
--
--
--
--
Dea
th o
r dis
abili
ty
--
--
--
----
--
--
--
D
. Arr
iola
Te
rmin
atio
n w
ith c
ause
or
volu
ntar
y re
sign
atio
n w
ithou
t go
od re
ason
--
--
--
--
--
--
--
--
Invo
lunt
ary
term
inat
ion
with
out
caus
e or
vol
unta
ry re
sign
atio
n fo
r go
od re
ason
in c
onne
ctio
n w
ith
chan
ge o
f con
trol(1
) 85
0,00
0 97
0,00
0 53
3,00
0 --
1,76
9,00
0 5,
192
15,0
00
4,14
2,19
2 In
volu
ntar
y te
rmin
atio
n w
ithou
t ca
use
or v
olun
tary
resi
gnat
ion
for
good
reas
on n
ot in
con
nect
ion
with
cha
nge
of c
ontro
l(1)(
2)
--
375,
000
--
----
--
--
37
5,00
0 R
etire
men
t --
--
--
--
--
--
--
--
Dea
th o
r dis
abili
ty
--
--
--
----
--
--
--
(1
)In
clud
es re
leas
e of
unv
este
d si
gn-o
n bo
nus p
lus,
in th
e ev
ent o
f onl
y a
term
inat
ion
with
out c
ause
, the
max
imum
relo
catio
n re
imbu
rsem
ent.
(2)
Mr.
Arri
ola
was
inel
igib
le to
par
ticip
ate
in th
e M
anag
emen
t Car
eer T
rans
ition
Pla
n as
of D
ecem
ber 2
8, 2
008
beca
use
as o
f suc
h da
te h
e ha
d be
en e
mpl
oyed
for f
ewer
than
six
mon
ths.

37
Nam
e T
erm
inat
ion
Scen
ario
C
ontin
ued
Sala
ry($
)
Bon
us a
nd
Acc
eler
ated
N
on-E
quity
In
cent
ive
Plan
($)
Acc
eler
ated
O
ptio
ns($
)
Acc
eler
ated
R
estr
icte
d St
ock(
$)
Acc
eler
ated
R
estr
icte
d St
ock
Uni
ts($
)
Con
tinue
d M
edic
al
Ben
efits
($)
Out
plac
e-
men
t Ser
vice
s T
otal
($)
T. D
inw
oodi
e Te
rmin
atio
n w
ith c
ause
or
volu
ntar
y re
sign
atio
n w
ithou
t go
od re
ason
--
--
--
--
--
--
--
--
Invo
lunt
ary
term
inat
ion
with
out
caus
e or
vol
unta
ry re
sign
atio
n fo
r go
od re
ason
in c
onne
ctio
n w
ith
chan
ge o
f con
trol
500,
000
341,
571
--
--35
3,80
0 8,
048
15,0
00
1,21
8,41
9 In
volu
ntar
y te
rmin
atio
n w
ithou
t ca
use
or v
olun
tary
resi
gnat
ion
for
good
reas
on n
ot in
con
nect
ion
with
cha
nge
of c
ontro
l 25
0,00
0 91
,571
--
--
--
4,02
4 --
34
5,59
5 R
etire
men
t --
--
--
--
--
--
--
--
Dea
th o
r dis
abili
ty
--
--
--
----
--
--
--
E.
Her
nand
ez
Term
inat
ion
with
cau
se o
r vo
lunt
ary
resi
gnat
ion
with
out
good
reas
on
--
--
--
----
--
--
--
In
volu
ntar
y te
rmin
atio
n w
ithou
t ca
use
or v
olun
tary
resi
gnat
ion
for
good
reas
on in
con
nect
ion
with
ch
ange
of c
ontro
l 66
0,00
0 72
1,39
8 --
13
2,67
5 1,
415,
200
5,67
0 15
,000
2,
949,
943
Invo
lunt
ary
term
inat
ion
with
out
caus
e or
vol
unta
ry re
sign
atio
n fo
r go
od re
ason
not
in c
onne
ctio
n w
ith c
hang
e of
con
trol
330,
000
193,
398
--
----
2,
835
--
526,
233
Ret
irem
ent
--
--
--
----
--
--
--
D
eath
or d
isab
ility
--
--
--
--
--
--
--
--

38
Nam
e T
erm
inat
ion
Scen
ario
C
ontin
ued
Sala
ry($
)
Bon
us a
nd
Acc
eler
ated
N
on-E
quity
In
cent
ive
Plan
($)
Acc
eler
ated
O
ptio
ns($
)
Acc
eler
ated
R
estr
icte
d St
ock(
$)
Acc
eler
ated
R
estr
icte
d St
ock
Uni
ts($
)
Con
tinue
d M
edic
al
Ben
efits
($)
Out
plac
e-
men
t Ser
vice
s T
otal
($)
B. L
edes
ma
Term
inat
ion
with
cau
se o
r vo
lunt
ary
resi
gnat
ion
with
out
good
reas
on
--
--
--
----
--
--
--
In
volu
ntar
y te
rmin
atio
n w
ithou
t ca
use
or v
olun
tary
resi
gnat
ion
for
good
reas
on in
con
nect
ion
with
ch
ange
of c
ontro
l 50
0,00
0 34
1,57
1 --
1,35
2,36
1
353,
800
7,
285
15,0
00
2,57
0,01
7 In
volu
ntar
y te
rmin
atio
n w
ithou
t ca
use
or v
olun
tary
resi
gnat
ion
for
good
reas
on n
ot in
con
nect
ion
with
cha
nge
of c
ontro
l 25
0,00
0 91
,571
--
--
--
3,64
2 --
34
5,21
3 R
etire
men
t --
--
--
--
--
--
--
--
Dea
th o
r dis
abili
ty
--
--
--
----
--
--
--
D
. Shu
gar
Term
inat
ion
with
cau
se o
r vo
lunt
ary
resi
gnat
ion
with
out
good
reas
on
--
--
--
----
--
--
--
In
volu
ntar
y te
rmin
atio
n w
ithou
t ca
use
or v
olun
tary
resi
gnat
ion
for
good
reas
on in
con
nect
ion
with
ch
ange
of c
ontro
l 52
0,00
0 35
5,23
4 --
3,18
1,55
4
424,
560
6,
683
15,0
00
4,50
3,03
1 In
volu
ntar
y te
rmin
atio
n w
ithou
t ca
use
or v
olun
tary
resi
gnat
ion
for
good
reas
on n
ot in
con
nect
ion
with
cha
nge
of c
ontro
l 26
0,00
0 95
,234
--
--
--
3,34
2 --
35
8,57
6 R
etire
men
t --
--
--
--
--
--
--
--
Dea
th o
r dis
abili
ty
--
--
--
----
--
--
--

39
Nam
e T
erm
inat
ion
Scen
ario
C
ontin
ued
Sala
ry($
)
Bon
us a
nd
Acc
eler
ated
N
on-E
quity
In
cent
ive
Plan
($)
Acc
eler
ated
O
ptio
ns($
)
Acc
eler
ated
R
estr
icte
d St
ock(
$)
Acc
eler
ated
R
estr
icte
d St
ock
Uni
ts($
)
Con
tinue
d M
edic
al
Ben
efits
($)
Out
plac
e-
men
t Ser
vice
s T
otal
($)
H. W
enge
r Te
rmin
atio
n w
ith c
ause
or
volu
ntar
y re
sign
atio
n w
ithou
t go
od re
ason
--
--
--
--
--
--
--
--
Invo
lunt
ary
term
inat
ion
with
out
caus
e or
vol
unta
ry re
sign
atio
n fo
r go
od re
ason
in c
onne
ctio
n w
ith
chan
ge o
f con
trol
620,
000
647,
259
--
2,
731,
170
56
6,08
0
--
15,0
00
4,57
9,50
9 In
volu
ntar
y te
rmin
atio
n w
ithou
t ca
use
or v
olun
tary
resi
gnat
ion
for
good
reas
on n
ot in
con
nect
ion
with
cha
nge
of c
ontro
l 31
0,00
0 15
1,25
9 --
--
--
--
--
461,
259
Ret
irem
ent
--
--
--
----
--
--
--
D
eath
or d
isab
ility
--
--
--
--
--
--
--
--
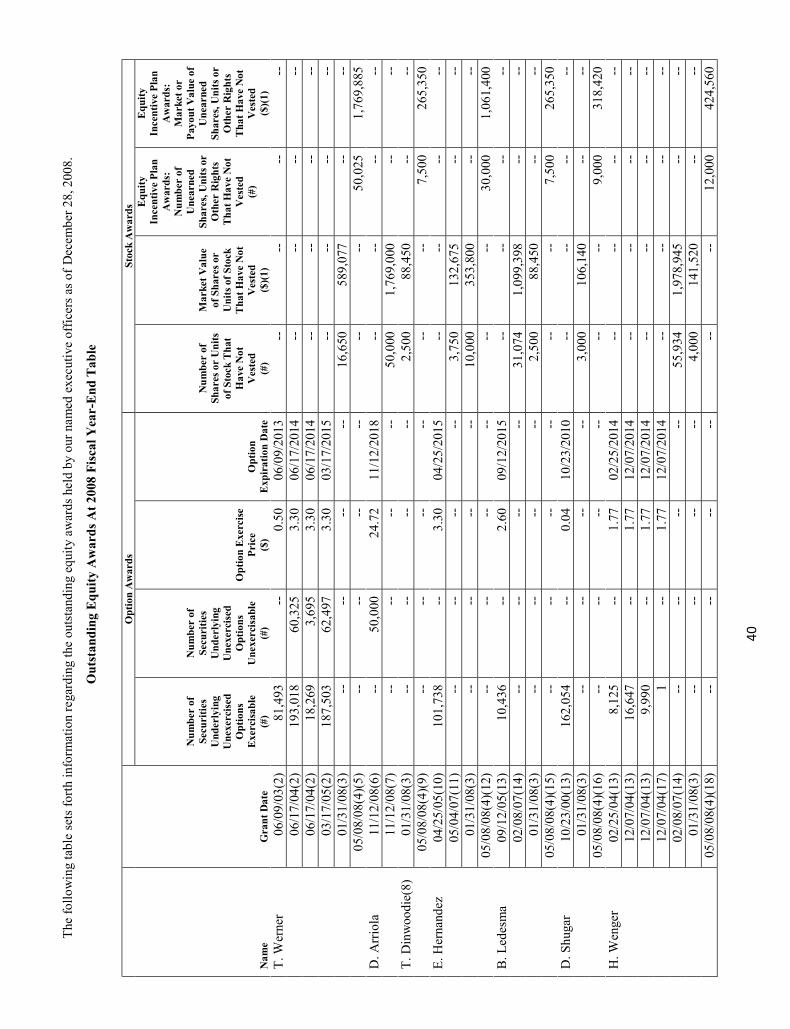
40
The
follo
win
g ta
ble
sets
forth
info
rmat
ion
rega
rdin
g th
e ou
tsta
ndin
g eq
uity
aw
ards
hel
d by
our
nam
ed e
xecu
tive
offic
ers a
s of D
ecem
ber 2
8, 2
008.
Out
stan
ding
Equ
ity A
war
ds A
t 200
8 Fi
scal
Yea
r-E
nd T
able
Nam
eG
rant
Dat
e
Opt
ion
Aw
ards
St
ock
Aw
ards
Num
ber
of
Secu
ritie
s U
nder
lyin
g U
nexe
rcis
ed
Opt
ions
E
xerc
isabl
e (#
)
Num
ber
of
Secu
ritie
s U
nder
lyin
g U
nexe
rcis
ed
Opt
ions
U
nexe
rcis
able
(#
)
Opt
ion
Exe
rcise
Pr
ice
($)
Opt
ion
Exp
irat
ion
Dat
e
Num
ber
of
Shar
es o
r U
nits
of
Sto
ck T
hat
Hav
e N
ot
Ves
ted
(#)
Mar
ket V
alue
of
Sha
res o
r U
nits
of S
tock
T
hat H
ave
Not
V
este
d ($
)(1)
Equ
ity
Ince
ntiv
e Pl
an
Aw
ards
: N
umbe
r of
U
near
ned
Shar
es, U
nits
or
Oth
er R
ight
s T
hat H
ave
Not
V
este
d (#
)
Equ
ity
Ince
ntiv
e Pl
an
Aw
ards
: M
arke
t or
Payo
ut V
alue
of
Une
arne
d Sh
ares
, Uni
ts o
r O
ther
Rig
hts
Tha
t Hav
e N
ot
Ves
ted
($)(1
) T.
Wer
ner
06/0
9/03
(2)
81,4
93
--
0.50
06
/09/
2013
--
--
--
--
06
/17/
04(2
) 19
3,01
8 60
,325
3.
30
06/1
7/20
14
--
--
--
--
06/1
7/04
(2)
18,2
69
3,69
5 3.
30
06/1
7/20
14
--
--
--
--
03/1
7/05
(2)
187,
503
62,4
97
3.30
03
/17/
2015
--
--
--
--
01
/31/
08(3
) --
--
--
--
16
,650
58
9,07
7 --
--
05
/08/
08(4
)(5)
--
--
--
--
--
--
50
,025
1,
769,
885
D. A
rrio
la
11/1
2/08
(6)
--
50,0
00
24.7
2 11
/12/
2018
--
--
--
--
11
/12/
08(7
) --
--
--
--
50
,000
1,
769,
000
--
--
T. D
inw
oodi
e(8)
01
/31/
08(3
) --
--
--
--
2,
500
88,4
50
--
--
05/0
8/08
(4)(
9)
--
--
--
--
--
--
7,50
0 26
5,35
0 E.
Her
nand
ez
04/2
5/05
(10)
10
1,73
8 --
3.
30
04/2
5/20
15
--
--
--
--
05/0
4/07
(11)
--
--
--
--
3,
750
132,
675
--
--
01
/31/
08(3
) --
--
--
--
10
,000
35
3,80
0 --
--
05
/08/
08(4
)(12
) --
--
--
--
--
--
30
,000
1,
061,
400
B. L
edes
ma
09/1
2/05
(13)
10
,436
--
2.
60
09/1
2/20
15
--
--
--
--
02/0
8/07
(14)
--
--
--
--
31
,074
1,
099,
398
--
--
01/3
1/08
(3)
--
--
--
--
2,50
0 88
,450
--
--
05
/08/
08(4
)(15
) --
--
--
--
--
--
7,
500
265,
350
D. S
huga
r 10
/23/
00(1
3)
162,
054
--
0.04
10
/23/
2010
--
--
--
--
01
/31/
08(3
) --
--
--
--
3,
000
106,
140
--
--
05/0
8/08
(4)(
16)
--
--
--
--
--
--
9,00
0 31
8,42
0 H
. Wen
ger
02/2
5/04
(13)
8,
125
--
1.77
02
/25/
2014
--
--
--
--
12
/07/
04(1
3)
16,6
47
--
1.77
12
/07/
2014
--
--
--
--
12
/07/
04(1
3)
9,99
0 --
1.
77
12/0
7/20
14
--
--
--
--
12/0
7/04
(17)
1
--
1.77
12
/07/
2014
--
--
--
--
02
/08/
07(1
4)
--
--
--
--
55,9
34
1,97
8,94
5 --
--
01
/31/
08(3
) --
--
--
--
4,
000
141,
520
--
--
05/0
8/08
(4)(
18)
--
--
--
--
--
--
12,0
00
424,
560

41
(1)
The
clos
ing
pric
e of
our
cla
ss A
com
mon
stoc
k on
Dec
embe
r 26,
200
8 w
as $
35.3
8.
(2)
Each
of t
hese
opt
ions
has
a te
n-ye
ar te
rm, v
ests
ove
r a fi
ve-y
ear p
erio
d of
em
ploy
men
t fro
m th
e da
te o
f gra
nt, w
ith a
one
-yea
r ini
tial c
liff v
estin
g pe
riod
and
mon
thly
ves
ting
ther
eafte
r, an
d ha
s an
exer
cise
pr
ice
equa
l to
the
mar
ket v
alue
on
gran
t dat
e.
(3)
Each
of t
hese
aw
ards
of r
estri
cted
stoc
k un
its sh
all v
est i
n th
ree
equa
l ins
tallm
ents
on
each
of J
anua
ry 3
1, 2
009,
Janu
ary
31, 2
010
and
Janu
ary
31, 2
011.
(4
) O
n Ja
nuar
y 31
, 200
8, e
ach
nam
ed e
xecu
tive
offic
er w
as a
war
ded
a nu
mbe
r of p
erfo
rman
ce-b
ased
rest
ricte
d st
ock
units
(PSU
s) w
ithin
a p
rese
t ran
ge, w
ith th
e ac
tual
num
ber c
ontin
gent
upo
n (i)
the
appr
oval
by
our
stoc
khol
ders
of t
he S
econ
d A
men
ded
and
Res
tate
d Su
nPow
er C
orpo
ratio
n 20
05 S
tock
Ince
ntiv
e Pl
an, a
s pro
pose
d at
the
annu
al m
eetin
g of
stoc
khol
ders
on
May
8, 2
008,
and
(ii)
the
achi
evem
ent o
f ce
rtain
per
form
ance
crit
eria
. Our
Com
pens
atio
n C
omm
ittee
con
firm
ed a
chie
vem
ent o
f the
per
form
ance
crit
eria
on
Janu
ary
29, 2
009
and,
bas
ed o
n th
at a
sses
smen
t, de
term
ined
the
num
ber o
f act
ual P
SUs,
whi
ch v
est i
n th
ree
equa
l ins
tallm
ents
on
each
of J
anua
ry 3
1, 2
009,
Janu
ary
31, 2
010
and
Janu
ary
31, 2
011.
(5
) R
epre
sent
s max
imum
aw
ard
unde
r equ
ity in
cent
ive
plan
aw
ard;
44,
635
restr
icte
d st
ock
units
wer
e ac
tual
ly a
war
ded
in 2
009
base
d on
act
ual p
erfo
rman
ce d
urin
g fis
cal 2
008.
(6
) Th
is o
ptio
n ha
s a te
n-ye
ar te
rm a
nd sh
all v
est i
n eq
ual a
nnua
l ins
tallm
ents
ove
r a fo
ur-y
ear p
erio
d on
eac
h of
Nov
embe
r 12,
200
9, N
ovem
ber 1
2, 2
010,
Nov
embe
r 12,
201
1 an
d N
ovem
ber 1
2, 2
012.
(7
) Th
is a
war
d of
rest
ricte
d sto
ck u
nits
shal
l ves
t in
equa
l ann
ual i
nsta
llmen
ts o
ver a
thre
e-ye
ar p
erio
d on
eac
h of
Nov
embe
r 12,
200
9, N
ovem
ber 1
2, 2
010
and
Nov
embe
r 12,
201
1.
(8)
Excl
udes
sha
res
held
by
Mr.
Din
woo
die
and
subj
ect t
o an
equ
ity re
stric
tion
agre
emen
t ent
ered
into
in c
onne
ctio
n w
ith o
ur a
cqui
sitio
n of
Pow
erLi
ght C
orpo
ratio
n in
Jan
uary
200
7. T
he e
quity
rest
rictio
n
(9)
Rep
rese
nts m
axim
um a
war
d un
der e
quity
ince
ntiv
e pl
an a
war
d; 6
,692
rest
ricte
d sto
ck u
nits
wer
e ac
tual
ly a
war
ded
in 2
009
base
d on
act
ual p
erfo
rman
ce d
urin
g fis
cal 2
008.
(1
0)
This
opt
ion
has a
ten-
year
term
, ves
ts m
onth
ly o
ver a
thre
e-ye
ar p
erio
d of
em
ploy
men
t fro
m th
e da
te o
f gra
nt, a
nd h
as a
n ex
erci
se p
rice
equa
l to
the
mar
ket v
alue
on
gran
t dat
e.
(11)
Th
is a
war
d of
rest
ricte
d st
ock
units
ves
ts ra
tabl
y ov
er a
four
yea
r per
iod
of e
mpl
oym
ent f
rom
the
date
of g
rant
, with
a o
ne-y
ear i
nitia
l clif
f ves
ting
perio
d an
d an
nual
ves
ting
ther
eafte
r. (1
2)
Rep
rese
nts m
axim
um a
war
d un
der e
quity
ince
ntiv
e pl
an a
war
d; 2
6,76
8 re
stric
ted
stoc
k un
its w
ere
actu
ally
aw
arde
d in
200
9 ba
sed
on a
ctua
l per
form
ance
dur
ing
fisca
l 200
8.
(13)
Th
ese
optio
ns h
ave
a te
n-ye
ar te
rm, w
ere
fully
ves
ted,
and
hav
e ne
d an
exe
rcis
e pr
ice
less
than
the
mar
ket v
alue
on
gran
t dat
e. H
owev
er, t
he sh
ares
und
erly
ing
thes
e re
mai
ning
opt
ions
wer
e su
bjec
t to
equi
ty re
stric
tion
agre
emen
ts e
xecu
ted
in c
onne
ctio
n w
ith o
ur a
cqui
sitio
n of
Pow
erLi
ght C
orpo
ratio
n in
20
07.
The
equi
ty
(14)
Ea
ch o
f the
se a
war
ds o
f res
trict
ed st
ock
shal
l ves
t in
four
equ
al in
stal
lmen
ts o
n ea
ch o
f Jan
uary
10,
200
9, Ja
nuar
y 10
, 201
0, Ja
nuar
y 10
, 201
1, a
nd Ja
nuar
y 10
, 201
2.
(15)
R
epre
sent
s max
imum
aw
ard
unde
r equ
ity in
cent
ive
plan
aw
ard;
6,6
92 re
stric
ted
stock
uni
ts w
ere
actu
ally
aw
arde
d in
200
9 ba
sed
on a
ctua
l per
form
ance
dur
ing
fisca
l 200
8.
(16)
R
epre
sent
s max
imum
aw
ard
unde
r equ
ity in
cent
ive
plan
aw
ard;
8,0
30 re
stric
ted
stock
uni
ts w
ere
actu
ally
aw
arde
d in
200
9 ba
sed
on a
ctua
l per
form
ance
dur
ing
fisca
l 200
8.
(17)
Th
is o
ptio
n ha
s a te
n-ye
ar te
rm a
nd w
as fu
lly v
este
d, a
nd h
as a
n ex
erci
se p
rice
equa
l to
the
mar
ket v
alue
on
gran
t dat
e.
(18)
R
epre
sent
s max
imum
aw
ard
unde
r equ
ity in
cent
ive
plan
aw
ard;
10,
707
restr
icte
d st
ock
units
wer
e ac
tual
ly a
war
ded
in 2
009
base
d on
act
ual p
erfo
rman
ce d
urin
g fis
cal 2
008.

42
The following table sets forth the number of shares acquired pursuant to the exercise of options or the vesting of stock awards by our named executive officers during 2008 and the aggregate dollar amount realized by our named executive officers upon such event.
2008 Option Exercises and Stock Vested Table
Named Executive Officer
Option Awards Stock Awards Number of
Shares Acquired on Exercise (#)
Value Realized on Exercise
($)(1)
Number of Shares
Acquired on Vesting (#)
Value Realized on
Vesting ($)(2)
Thomas H. Werner 179,000 11,698,015 10,000 690,900 Dennis V. Arriola -- -- -- -- Thomas L. Dinwoodie (3) -- -- -- -- Daniel S. Shugar 108,027 8,707,556 -- -- Howard J. Wenger 32,381 2,400,682 18,645 2,064,188 Bruce R. Ledesma 12,717 729,290 10,359 1,146,845 Emmanuel T. Hernandez 100,000 7,116,850 1,250 100,125
(1) The aggregate dollar value realized upon the exercise of an option represents the difference between the market price of the underlying shares on the
date of exercise and the exercise price of the option, multiplied by the number of shares purchased. (2) The aggregate dollar value realized upon the vesting of a stock award represents the fair market value of the underlying shares on the vesting date
multiplied by the number of shares vested. (3) Excludes shares held by Mr. Dinwoodie and subject to an equity restriction agreement entered into in connection with our acquisition of PowerLight
43
PROPOSAL TWO
RATIFICATION OF THE APPOINTMENT OF INDEPENDENT REGISTERED PUBLIC ACCOUNTING FIRM FOR FISCAL YEAR 2009
The Board of Directors, upon recommendation of the Audit Committee, has reappointed the firm of PricewaterhouseCoopers LLP as our independent registered public accounting firm for the fiscal year ending January 3, 2010, subject to ratification by our stockholders.
PricewaterhouseCoopers LLP has served as our auditor since 2003. A representative of PricewaterhouseCoopers LLP is expected to be present at the Annual Meeting and will have an opportunity to make a statement if he or she desires to do so, and is expected to be available to respond to appropriate questions.
Stockholder ratification of the selection of PricewaterhouseCoopers LLP as our independent registered public accounting firm is not required by our By-Laws or other applicable legal requirements. However, the Board is submitting the selection of PricewaterhouseCoopers LLP to the stockholders for ratification as a matter of good corporate governance.
If the stockholders fail to ratify the selection of our independent registered accounting firm, the Audit Committee and the Board will reconsider whether or not to retain that firm. Even if the selection is ratified, the Board, at its discretion, may direct the appointment of a different independent registered public accounting firm at any time during the year if it
All fees billed to us by PricewaterhouseCoopers LLP were pre-approved by the Audit Committee. Fees billed to us by PricewaterhouseCoopers LLP during fiscal years 2007 and 2008 were as follows:
Services 2007 2008 Audit Fees $1,979,000 $2,901,000 Audit-Related Fees 294,000 121,000 Tax Fees 183,000 713,000 All Other Fees -- --
Total $2,456,000 $3,735,000
Audit Fees: Audit fees for 2007 and 2008 were for professional services rendered in connection with audits of our consolidated financial statements, statutory audits of our subsidiary companies, quarterly reviews and assistance with documents that we filed with the Securities and Exchange Commission (including our Forms S-3, S-8, 10-Q, 10-K and 8-K). Audit fees for 2007 were for professional services also rendered in connection with the issuance of comfort letters in connection with our February 2007 and July 2007 public offerings and the issuance of the auditors consents.
Audit-Related Fees: Audit-related fees for 2007 and 2008 were for professional services rendered in connection with consultations with management on various accounting matters.
Tax Fees: Tax fees for 2007 and 2008 were for tax return preparation assistance and expatriate tax services, general tax planning and international tax consulting.
All Other Fees: SunPower was not billed any other fees by PricewaterhouseCoopers LLP in 2007 or 2008.
THE BOOF THE APPOINTMENT OF PRICEWATERHOUSECOOPERS LLP AS OUR INDEPENDENT REGISTERED PUBLIC ACCOUNTING FIRM FOR FISCAL YEAR 2009.

44
SECURITY OWNERSHIP OF MANAGEMENT AND CERTAIN BENEFICIAL OWNERS
The following table sets forth certain information regarding beneficial ownership of our class A and class B common stock as of March 10, 2009, the Record Date, except as described below, by:
each of our directors and director nominees;
our Chief Executive Officer, both individuals who served as our Chief Financial Officer during fiscal 2008, each of the three most highly compensated individuals who served as our other executive officers at fiscal year-end, and another highly compensated individual who served as an executive officer during fiscal 2008 but who was not serving as an executive officer at fiscal year-end, whom we collectively identify as our “named executive officers”;
our directors, director nominees and executive officers as a group; and
each person (including any “group” as that term is used in Section 13(d)(3) of the Securities Exchange Act of 1934) who is known by us to beneficially own more than 5% of any class of our common stock.
Applicable beneficial ownership percentages listed below are based on 43,970,148 shares of class A common stock and 42,033,287 shares of class B common stock outstanding as of the Record Date. The business address for each of our directors and executive officers is our corporate headquarters at 3939 North First Street, San Jose, California 95134.
Shares Beneficially Owned(1)% TotalVoting
Power(2)
Class ACommon Stock
Class BCommon Stock
Directors, Director Nominees and Named Executive Officers Shares % Shares %W. Steve Albrecht(3) 24,602 * 904 * *Dennis V. Arriola -- -- -- -- -- Betsy S. Atkins(4) 5,600 * -- -- *Uwe-Ernst Bufe -- -- -- -- -- Thomas L. Dinwoodie(5) 1,649,849 3.8 -- -- * Emmanuel T. Hernandez(6) 105,753 * 5,241 * *Bruce R. Ledesma(7) 51,056 * -- -- *Thomas R. McDaniel -- -- -- -- -- T.J. Rodgers(8) 27,500 * 136,978 * *Daniel S. Shugar(9) 190,267 * -- -- *Howard J. Wenger(10) 98,917 * -- -- *Thomas H. Werner(11) 616,670 1.4 -- -- *Pat Wood III(12) 39,602 * -- -- *
All Current Directors, Director Nominees and Executive Officers as a Group (15 persons)(13) 1,153,747 2.6 138,104 * *
Other Persons Aletheia Research and Management, Inc.(14) 100 Wilshire Blvd., Suite 1960 Los Angeles, CA 90401 3,700,297 8.4 -- -- * FMR, LLC and Edward C. Johnson, III(15) 82 Devonshire Street Boston, MA 02109 -- -- 5,313,942 12.6 11.2 Janus Capital Management LLC(16) 151 Detroit Street Denver, Colorado 80206 3,324,545 7.6 -- -- *T. Rowe Price Associates, Inc.(17) 100 E. Pratt Street Baltimore, MD 21202 -- -- 4,713,107 11.2 9.9 Wellington Management Company LLP(18) 75 State Street Boston, Massachusetts 02109 2,335,912 5.3 2,705,032 6.4 6.3

45
* Less than 1%. (1) Beneficial ownership is determined in accordance with the rules of the Securities and Exchange Commission and generally includes voting or
investment power with respect to the securities. In computing the number of shares beneficially owned by a person and the percentage ownership ofthat person, shares underlying restricted stock units and options held by that person that will vest and be exercisable within 60 days of March 10, 2009, are deemed to be outstanding. Such shares, however, are not deemed to be outstanding for the purpose of computing the percentage ownership of any other person.
(2) Percentage total voting power represents voting power with respect to all shares of our class A common stock and class B common stock, voting as a single class. Each holder of class B common stock is entitled to eight votes per share of class B common stock and each holder of class A common stock is entitled to one vote per share of class A common stock on all matters to be submitted to stockholders for vote. The class A and class B common stock vote together as a single class on all matters submitted to a vote of our stockholders, except as otherwise may be required by law.
(3) Includes 7,000 shares of class A common stock, 904 shares of class B common stock, 16,602 shares of class A common stock issuable upon exercise of options exercisable within 60 days of March 10, 2009, and 1,000 shares of class A common stock issuable upon vesting of restricted stock units.
(4) Includes 2,000 shares of class A common stock, 2,600 shares of class A common stock issuable upon exercise of options exercisable within 60 days of March 10, 2009, and 1,000 shares of class A common stock issuable upon vesting of restricted stock units.
(5) Includes 1,490,449 shares of class A common stock held by the Dinwoodie-Meservey Family Living Trust, of which Mr. Dinwoodie and his wife are the Trustees, 11,621 shares of class A common stock held by the Jaelyn Wolf Irrevocable Trust UAD May 5, 2005, of which Mr. Dinwoodie is the Trustee, 11,621 shares of class A common stock held by the Ariel Wolf Irrevocable Trust UAD May 5, 2005, of which Mr. Dinwoodie is the Trustee. Mr. Dinwoodie disclaims beneficial ownership of the shares held in these trusts. In connection with the sale of PowerLight Corporation to SunPower, Mr. Dinwoodie also contributed individually held unrestricted shares and shares he controls in his capacity as Trustee into an escrow account for the benefit of SunPower to secure certain representations, warranties, covenants and other matters made to SunPower as part of the terms of sale. As ofMarch 10, 2009, the escrow account contained 134,706 shares belonging to Mr. Dinwoodie.
(6) Includes 265 shares of class A common stock held by the Hernandez Family LLC, of which Mr. Hernandez is the Managing Member, 3,185 shares of class B common stock held by the Hernandez 2003 Revocable Trust, of which Mr. Hernandez and his wife are Trustees, 1,028 shares of class B common stock held in the Emmanuel T. Hernandez ACF Timothy Hernandez U/CA/UTMA and 1,028 shares of class B common stock held in the Emmanuel T. Hernandez ACF Katherine Hernandez U/CA/UTMA, of which Mr. Hernandez is the Custodian, 3,750 restricted shares of class A common stock, and 101,738 shares of class A common stock issuable upon exercise of options exercisable within 60 days of March 10, 2009. Mr. Hernandez disclaims beneficial ownership of the shares held in the LLC, the Trust
(7) Includes 19,904 shares of class A common stock, 20,716 restricted shares of class A common stock, and 10,436 shares of class A common stock issuable upon exercise of options exercisable within 60 days of March 10, 2009.
(8) Includes 25,000 shares of class A common stock, 136,978 shares of class B common stock, and 2,500 shares of class A common stock issuable upon vesting of restricted stock units.
(9) Includes 28,213 shares of class A common stock and 162,054 shares of class A common stock issuable upon exercise of options exercisable within 60 days of March 10, 2009.
(10) Includes 26,865 shares of class A common stock, 37,289 restricted shares of class A common stock, and 34,763 shares of class A common stock issuable upon exercise of options exercisable within 60 days of March 10, 2009.
(11) Includes 77,033 shares of class A common stock and 539,637 shares of class A common stock issuable upon exercise of options exercisable within 60 days of March 10, 2009.
(12) Includes 7,000 shares of class A common stock, 31,602 shares of class A common stock issuable upon exercise of options exercisable within 60 days of March 10, 2009, and 1,000 shares of class A common stock issuable upon vesting of restricted stock units.
(13) Includes the shares described in footnotes 1-5 and 7-12 plus 24,135 shares of class A common stock held by three additional executive officers, 222 shares of class B common stock held by one additional executive officer, 2,250 restricted shares of class A common stock held by one additional executive officer, and 73,148 shares of class A common stock issuable upon exercise of options exercisable within 60 days of March 10, 2009 held by one additional executive officer.
(14) The ownership information set forth in the table is based on information contained in a statement on Schedule 13G, filed with the SEC on February 17, 2009 by Aletheia Research and Management, Inc., which indicated that it has beneficial ownership of 3,700,297 shares of class A common stock, with sole voting and dispositive power with respect to said shares.
(15) The ownership information set forth in the table is based on information contained in a statement on Schedule 13G, filed with the SEC on January 12, 2009 by FMR, LLC and Edward C. Johnson 3d, which indicated that the parties have beneficial ownership of 5,313,942 shares of class B common stock, with sole voting power with respect to 258 shares and sole dispositive power with respect to 5,313,942 shares.
(16) The ownership information set forth in the table is based on information contained in a statement on Schedule 13G, filed with the SEC on February 17, 2009 by Janus Capital Management, LLC, which indicated that it has beneficial ownership of 3,324,545 shares of class A common stock, with sole voting and dispositive power with respect to 3,316,345 shares and shared voting and dispositive power with respect to 8,200 shares.
(17) The ownership information set forth in the table is based on information contained in a statement on Schedule 13G/A, filed with the SEC on February 12, 2009 by T. Rowe Price Associates, Inc., which indicated that it has beneficial ownership of 4,713,107 shares of class B common stock, with sole voting power with respect to 1,777,761 shares and sole dispositive power with respect to 4,690,507 shares.
(18) The ownership information set forth in the table is based on information contained in two separate statements on Schedule 13G, each filed with the SEC on February 17, 2009 by Wellington Management Company, LLP, the first which indicated that it has beneficial ownership of 2,335,912 shares of class A common stock, with shared voting power with respect to 2,026,140 shares and shared dispositive power with respect to 2,335,912 shares, and the second which indicated that it has beneficial ownership of 2,705,032 shares of class B common stock, with shared voting power with respect to 1,762,686 shares and shared dispositive power with respect to 2,705,032 shares.

46
Section 16(a) Beneficial Ownership Reporting Compliance
Section 16(a) of the Securities Exchange Act of 1934 requires our executive officers and directors, and persons who own more than 10% of a registered class of our equity securities, to file an initial report of ownership on Form 3 and reports of changes in ownership on Forms 4 or 5 with the Securities and Exchange Commission and the Nasdaq Global Market. Such executive officers, directors and greater than 10% stockholders are also required by Securities and Exchange Commission regulations to furnish us with copies of all Section 16 forms that they file. We periodically remind our directors and executiveofficers of their reporting obligations and assist in making the required disclosures once we have been notified that a reportable event has occurred. We are required to report in this proxy statement any failure by any of the above-mentioned persons to make timely Section 16 reports.
Based solely on our review of the copies of such forms received by us, and written representations from our directors and executive officers, we are unaware of any instances of noncompliance, or late compliance, with Section 16(a) filing requirements by our directors, executive officers or greater than 10% stockholders during fiscal 2008.
EQUITY COMPENSATION PLAN INFORMATION
The following table provides certain information as of December 28, 2008 with respect to our equity compensation plans under which our equity securities are authorized for issuance (in thousands, except dollar figures).
Plan Category
Number of securities
to be issued upon
exercise of outstanding
options,warrants and rights
Weighted average exerciseprice of
outstandingoptions,
warrants and rights
Number of securitiesremaining availablefor future issuance
under equity compensation plans(excluding securitiesreflected in the first
column)Equity compensation plans approved by security holders 2,008 $8.99 1,268 Equity compensation shares not approved by security holders(1) 17 $2.00 --
Total(2) 2,025 $8.93 1,268
(1) Represents one option to purchase shares of class A common stock issued to one employee on June 17, 2004 with an exercise price of $2.00, vesting over five years.
(2) This table excludes options to purchase an aggregate of approximately 520,000 shares of class A common stock, at a weighted average exercise price of $9.03 per share, that we assumed in connection with the acquisition of PowerLight Corporation in January 2007. Our Second Amended and Restated SunPower Corporation 2005 Stock Incentive Plan includes an automatic share reserve increase feature effective for 2009 through 2015. This share reserve increase feature will cause an annual and automatic increase in the number of shares of our class A common stock reserved for issuance under the Stock Incentive Plan in an amount each year equal to the least of: 3% of the outstanding shares of all classes of our common stock measured on the last day of the immediately preceding fiscal year; 6,000,000 shares; and such other number of shares as determined by our Board.

EXECUTIVE OFFICERS
Thomas H. WernerChief Executive Offi cer
Dennis V. ArriolaSr. Vice President andChief Financial Offi cer
Bruce R. LedesmaGeneral Counsel andCorporate Secretary
Marty T. NeeseChief Operating Offi cer
Douglas J. RichardsVice President, Human Resources& Corporate Services
Daniel S. ShugarPresident, SunPower Corporation, Systems
Richard M. SwansonPresident and Chief Technical Offi cer, SunPower Corporation
Howard J. WengerPresident, Global Business Units
BOARD OF DIRECTORS
T.J. RodgersChairman of the Board
W. Steve AlbrechtDirector
Betsy S. AtkinsDirector
Uwe-Ernst BufeDirector
Thomas R. McDanielDirector
Thomas H. WernerDirector
Pat Wood IIIDirector
A Quarter Century of Innovation
2008 Annual Report www.sunpowercorp.com
Utility & Power PlantsCommercial New HomesResidential Retrofi t

20 Years of InnovationA Quarter Century of Innovation
CORPORATE HEADQUARTERSSunPower Corporation3939 North First StreetSan Jose, California 95134 USA(408) 240-5500
EUROPEAN HEADQUARTERSSunPower Systems SA8, Avenue De Frontenex1207 Geneva, Switzerland+41 (0) 22 304 1400
www.sunpowercorp.com