Embed Size (px)
Citation preview
Chatfield Watershed
2008 Chatfield Watershed Authority:
Quality Assurance Project Plan (QAPP), Sampling and Analysis Plan (SAP) and Standard Operating Procedures (SOP)
Version 2008.01 November 2007
Chatfield Watershed Authority 1529 South Telluride Street
Aurora, Colorado 80017-4333
Direct questions concerning this Monitoring Plan to:
Russell N. Clayshulte Authority Manager
Telephone: 303-751-7144
iii
Acceptance Page
The Chatfield Watershed Authority approved this Sampling and Analysis Plan and Quality Assurance Project Plan document on November , 2007 Chatfield Watershed Authority _____________________________________ Co-Chair Date _____________________________________ Co-Chair Date _____________________________________
Administrator Date Water Quality Control Division _____________________________________ Staff Date

iv
TABLE OF CONTENTS
1.0 CHATFIELD WATER QUALITY MONITORING PROGRAM............. 1
2.0 MONITORING PROGRAM MANAGEMENT ...................................... 4
2.1 Project/Task Organization ................................................................................. 4
2.2 Chatfield Watershed Authority (CWA).............................................................. 4
2.3 Technical Review Committee (TRC) ................................................................. 4
2.4 Program Administrator ...................................................................................... 5
2.5 Consultant Project Manager.............................................................................. 5
2.6 Consultant Field Leader .................................................................................... 5
2.7 Consultant Field Technicians............................................................................ 5
2.8 Subcontracted Analytical Laboratories............................................................ 5
3.0 MONITORING OBJECTIVES AND DATA EVALUATION ................. 5
3.1.0. Evaluation of Data ....................................................................................... 6
3.1.1. Graphical Presentation of Data.................................................................. 6
3.1.2. Contingent Sampling of Strontia Springs Releases ................................ 6
3.1.3. Participation in USPWPA Monitoring Activities ....................................... 7
3.2 Data Quality Objectives ..................................................................................... 7
3.2.0. Precision and Accuracy.............................................................................. 7
3.2.1. Representative Sample Sites ..................................................................... 9
3.2.2. Comparability .............................................................................................. 9
Completeness ........................................................................................................... 9
3.3 Documentation and Records............................................................................. 9
4.0 MEASUREMENT AND DATA ACQUISITION .................................. 10
4.1 Sampling Process Design ............................................................................... 10
4.1.0. Sampling Sites........................................................................................... 10
4.1.1. Basic Monitoring Program........................................................................ 10
4.1.2. Massey Draw Monitoring Program .......................................................... 10
4.2 Parameter Rationale......................................................................................... 12
4.2.0. Important Trophic Indicators.................................................................... 12
4.2.1. Field Parameters ....................................................................................... 12
4.2.2. Miscellaneous Notes................................................................................. 13
4.2.3. Nutrient Analyses...................................................................................... 13
4.2.4. Biological Analyses .................................................................................. 13
4.2.5. Metals Analyses (Including Hardness).................................................... 13
4.3 Watershed Monitoring...................................................................................... 14
4.4 Reservoir Monitoring ....................................................................................... 14
4.4.0. Unsafe Reservoir Conditions................................................................... 16
v
4.5 Sampling Methods Requirements................................................................... 16
4.6 Sample Handling and Custody Requirements............................................... 17
4.6.0. Chain-of-Custody ...................................................................................... 17
4.6.1. Sample Labeling........................................................................................ 18
4.6.2. Sample Handling ....................................................................................... 18
4.6.3. Failed Chain-of-Custody and Corrective Action..................................... 18
4.7 Analytical Method Requirements.................................................................... 19
4.8 Failures in Measurement Systems and Corrective Actions ......................... 20
4.9 Quality Control Requirements......................................................................... 20
4.9.0. Sampling Quality Control Requirements ................................................ 20
4.9.1. Laboratory Measurement Quality Control Requirements...................... 21
4.9.2. Quality Control Failures and Corrective Action ..................................... 23
4.10 Instrument and Equipment Testing/Maintenance...................................... 23
4.10.0. Instrument Calibration and Frequency................................................ 23
4.10.1. Supply Inspection and Acceptance Requirements ............................ 24
4.10.2. Other Data Acquisitions........................................................................ 24
5.0 DATA MANAGEMENT, ASSESSMENT AND OVERSIGHT ........... 24
5.1 Data Management............................................................................................. 24
5.2 Assessment and Response Actions............................................................... 25
5.3 Consultant Reports and Presentations .......................................................... 25
5.4 Data Validation and Usability .......................................................................... 26
6.0 STANDARD OPERATING PROCEDURES...................................... 27
6.1 Purpose ............................................................................................................. 27
6.2 Field-Survey Preparations............................................................................... 27
6.3 Sample Containers And Preservation ............................................................ 28
6.4 In-Stream Water Sampling............................................................................... 28
6.5 In-Reservoir Depth And Secchi Depth Measurement ................................... 30
6.6 In-Reservoir Water Sample Collection ........................................................... 30
6.7 Metals Chemistry Water Sample Collection................................................... 31
6.8 In-Reservoir Sediment Sample Collection ..................................................... 32
6.9 Alluvial Well Sampling ..................................................................................... 33
6.10 Phytoplankton Sampling.............................................................................. 33
6.11 Zooplankton Sampling ................................................................................. 34
6.12 Visual Flow Measurements.......................................................................... 34
6.13 Field Measurements ..................................................................................... 35
6.14 Field QA/QC Samples ................................................................................... 35
6.14.0. Field Duplicates ..................................................................................... 35
6.14.1. Field Blanks............................................................................................ 36
vi
6.14.2. Equipment Blanks ................................................................................. 36
6.15 Sample Shipment, If Necessary .................................................................. 36
7.0 AUTHORITY REFERENCES ............................................................ 37
LIST OF TABLES
Table 1 Sampling Parameters.................................................................................... 3
Table 2 Data Precision and Accuracy Estimates........................................................ 8
Table 3 Basic Monitoring Program Parameters........................................................ 11
Table 4 Sampling Methods....................................................................................... 16
Table 5 Analytical Methods ...................................................................................... 19
Table 6 Field Equipment Calibration Requirements ................................................. 23
Table 7 Samples Are Delivered To These Laboratories For Analyses. ................... 36
LIST OF FIGURES
Figure 1 Chatfield Watershed...................................................................................... 1
Figure 2 Sampling Sites............................................................................................... 3
Figure 3 Project Organization...................................................................................... 4
Figure 4 Carlson Seasonal TSI Index.......................... Error! Bookmark not defined. Figure 5 Walker Annual TSI Index............................... Error! Bookmark not defined.
LIST OF EQUATIONS
Equation 1 Field Relative Percent Difference............................................................. 21
Equation 2 Laboratory Relative Percent Difference ................................................... 21
Equation 3 Laboratory Control Sample Percent Recovery......................................... 22
Equation 4 Matrix Spike Percent Recovery................................................................ 22
1
1.0 CHATFIELD WATER QUALITY MONITORING PROGRAM
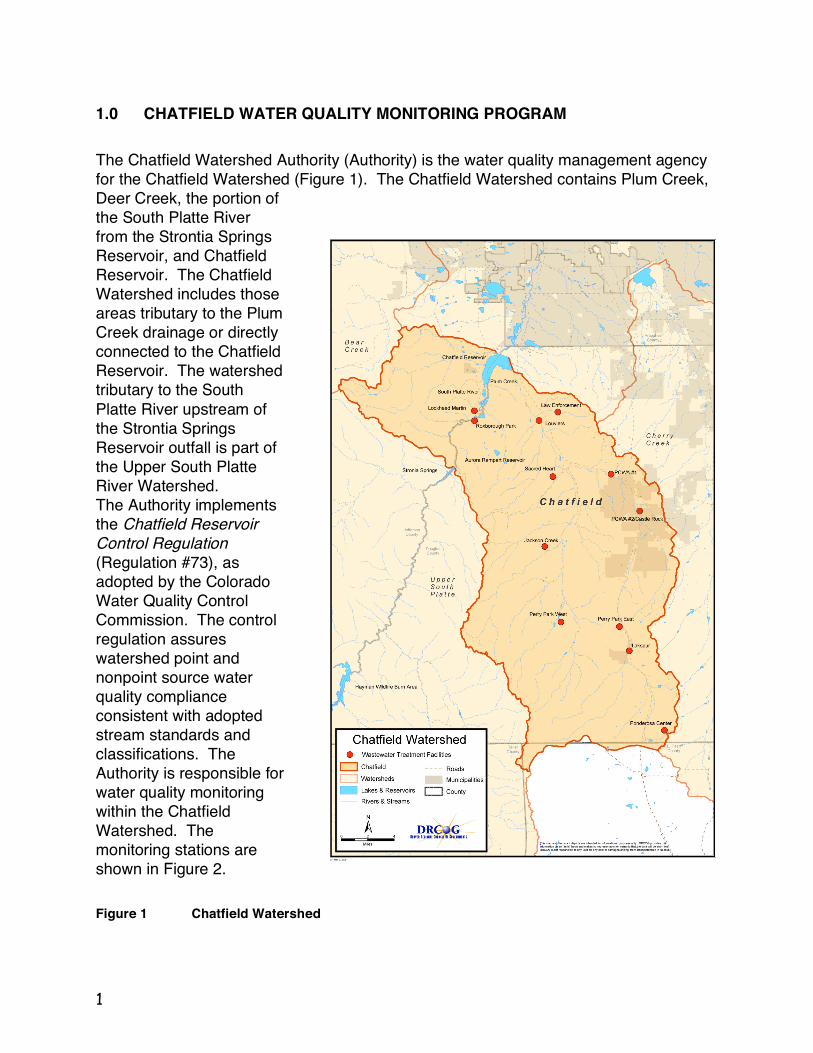
The Chatfield Watershed Authority (Authority) is the water quality management agency for the Chatfield Watershed (Figure 1). The Chatfield Watershed contains Plum Creek, Deer Creek, the portion of the South Platte River from the Strontia Springs Reservoir, and Chatfield Reservoir. The Chatfield Watershed includes those areas tributary to the Plum Creek drainage or directly connected to the Chatfield Reservoir. The watershed tributary to the South Platte River upstream of the Strontia Springs Reservoir outfall is part of the Upper South Platte River Watershed. The Authority implements the Chatfield Reservoir Control Regulation (Regulation #73), as adopted by the Colorado Water Quality Control Commission. The control regulation assures watershed point and nonpoint source water quality compliance consistent with adopted stream standards and classifications. The Authority is responsible for water quality monitoring within the Chatfield Watershed. The monitoring stations are shown in Figure 2.
Figure 1 Chatfield Watershed

2

3
Figure 2 Sampling Sites
The water quality-monitoring program samples selected parameters at inflow (South Platte River and Plum Creek) and output (South Platte River) stations and within Chatfield Reservoir Table 1).
Table 1 Sampling Parameters
________________________________________________________________ Field parameters Temperature, pH, specific conductance, dissolved
oxygen, instantaneous flow & Secchi depth Miscellaneous analyses Total suspended solids, E. coli & total organic carbon Nutrient analyses Phosphorous and nitrogen species Biological analyses Chlorophyll-a, phytoplankton & zooplankton Metals analyses 16 metals including hardness
4
________________________________________________________________
2.0 MONITORING PROGRAM MANAGEMENT
2.1 Project/Task Organization
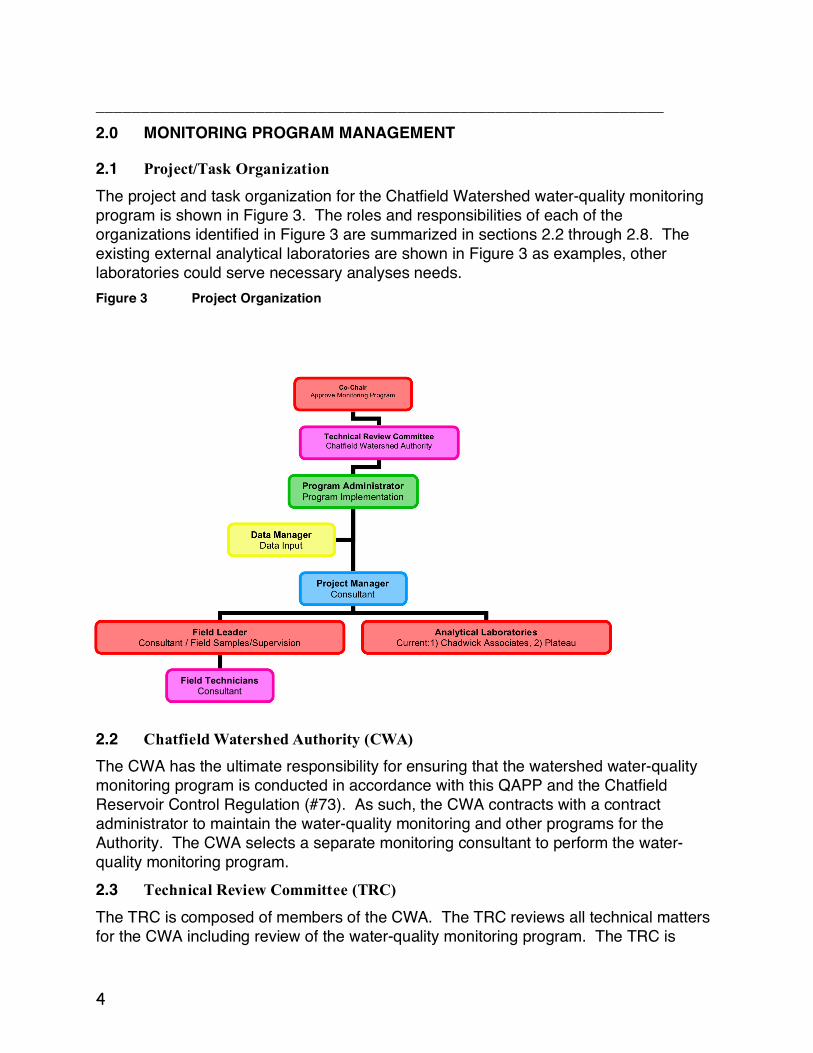
The project and task organization for the Chatfield Watershed water-quality monitoring program is shown in Figure 3. The roles and responsibilities of each of the organizations identified in Figure 3 are summarized in sections 2.2 through 2.8. The existing external analytical laboratories are shown in Figure 3 as examples, other laboratories could serve necessary analyses needs.
Figure 3 Project Organization
2.2 Chatfield Watershed Authority (CWA)
The CWA has the ultimate responsibility for ensuring that the watershed water-quality monitoring program is conducted in accordance with this QAPP and the Chatfield Reservoir Control Regulation (#73). As such, the CWA contracts with a contract administrator to maintain the water-quality monitoring and other programs for the Authority. The CWA selects a separate monitoring consultant to perform the water-quality monitoring program.
2.3 Technical Review Committee (TRC)
The TRC is composed of members of the CWA. The TRC reviews all technical matters for the CWA including review of the water-quality monitoring program. The TRC is
Co-Chair
Approve Monitoring Program
Technical Review Committee Chatfield Watershed Authority
Program Administrator Program Implementation
Data Manager Data Input
Project Manager Consultant
Field Leader Consultant / Field Samples/Supervision
Analytical Laboratories Current:1) Chadwick Associates, 2) Plateau
Field Technicians Consultant
5
responsible for the review and approval of this QAPP and SAP and other monitoring program documents and periodically reviews the status of the monitoring program. The TRC determines the monitoring program compliance with the intent of the control regulation.
2.4 Program Administrator
The Program Administrator is responsible for overseeing the consultant in the performance of the water-quality monitoring program and acting on behalf of the CWA to ensure that the program is conducted in accordance with all requirements.
2.5 Consultant Project Manager
The consultant Project Manager is responsible for the implementation of this QAPP and the water-quality monitoring program. The consultant Project Manager ensures that the program is staffed with the appropriate number of qualified and trained staff and performs periodic oversight of field teams. The consultant Project Manager reviews field data sheets, verification/validation of analytical data, maintenance of the program database, and all required reporting. The Project Manager performs required quality assurance and quality control duties.
2.6 Consultant Field Leader
The consultant Field Leader appoints trained and qualified field teams to perform monitoring activities. The consultant Field Leader schedules laboratory and other required services and reviews and approve all field data sheets prior to transmittal to the consultant Project Manager.
2.7 Consultant Field Technicians
The consultant field technicians are responsible for conducting all field activities in accordance with this QAPP and SAP and the standard operating procedures (SOPs) adopted by the CWA.
2.8 Subcontracted Analytical Laboratories.
The subcontracted analytical laboratories perform all analyses requested by the consultant Project Manager in accordance with established procedures and approved quality assurance plans.
3.0 MONITORING OBJECTIVES AND DATA EVALUATION
6
The Authority determines the monitoring program in cooperation with the Colorado Water Quality Control Division (WQCD). Questions answered by the monitoring program are:
1) Does Chatfield Reservoir meet the growing season total phosphorus standard and chlorophyll goal, annually?
2) Are total phosphorus loads in compliance with the TMAL?
Water-quality data characterize the trophic state of the reservoir, evaluate trends in the watershed and assess compliance with the adopted control regulation. The in-reservoir total phosphorus data are used by the Division to determine compliance with the total phosphorus standard of 0.027 mg/L (27 ug/L) as a growing season average (July-September). The monitoring program characterizes inputs into the reservoir, the reservoir water column and outflow from the reservoir. Project/Task Description
3.1.0. Evaluation of Data
In addition to the routine compilation and presentation of the monitoring data collected, the consultant will perform more extensive evaluation of the data. Examples of the data evaluations include:
1. Perform time-trend and spatial analyses for selected annual monitoring programs; or
2. Evaluate historical data.
3. Verify and validate data, and conduct statistical evaluation for outliers.
3.1.1. Graphical Presentation of Data
In addition to the compilation and presentation of tabular forms of the monitoring data collected, the consultant provides additional graphical presentations of the data at TRC and Authority meetings and in the annual monitoring report to assist in data evaluation.
3.1.2. Contingent Sampling of Strontia Springs Releases
In the event that releases from Strontia Springs reservoir are required to flush sediment resulting from past or future forest fires, special sampling events along the South Platte River may be conducted coincidentally with these releases. When these sampling events are required, other portions of this monitoring program, principally the data evaluation activities, will be scaled back as approved by the CWA.
7
3.1.3. Participation in USPWPA Monitoring Activities
When it is determined that the CWA and Upper South Platte Watershed Protection Association (USPWPA) need to conduct joint monitoring activities, this monitoring program will be modified to reflect such activities.
1. The Authority has added a representative from the USPWPA to the membership list and provides copies of all distribution materials.
2. The Authority established a joint monitoring review workgroup and shared
presentations on monitoring efforts, existing data, water quality trends and potential future programs. They provided recommendations on types of appropriate monitoring activities, data needs and listed minimum parameters for various types of monitoring efforts.
3. The Authority has reviewed modeling assumptions and supporting material for
load allocation partitioning with USPWPA. The USPWPA agreed that the assumptions and allocations were supportable by evidence, but additional data from the upper watershed will be generated to validate the assumptions and allocations. Limited funding has precluded the USPWPA and Authority from beginning a joint monitoring program between watersheds.
3.2 Data Quality Objectives
The project objective is to collect data that complies with WQCD rules for surface-water quality monitoring programs, to support decisions related to TMDL development, stream standards modifications, permit decisions, and water quality assessments. The following paragraphs define the measurement performance criteria necessary to support the project objective.
3.2.0. Precision and Accuracy
Accuracy and precision are crucial aspects of analytical data and this monitoring program. Accuracy is defined as “the degree of agreement of a measured value with the true or expected value.” In other words, accuracy is hitting the bullseye on a target. Laboratory accuracy is measured in Percent Recoveries (PR). Precision is “the degree of mutual agreement characteristic of independent measurements as the result of repeated application of the process under specified conditions.” In other words, precision is the relative size of a group of shots on a target. Laboratory precision is measured in Relative Percent Difference (RPD). PR and RPD are measured and reported by labs for every individual analysis. Table 2 illustrates the precision and
8
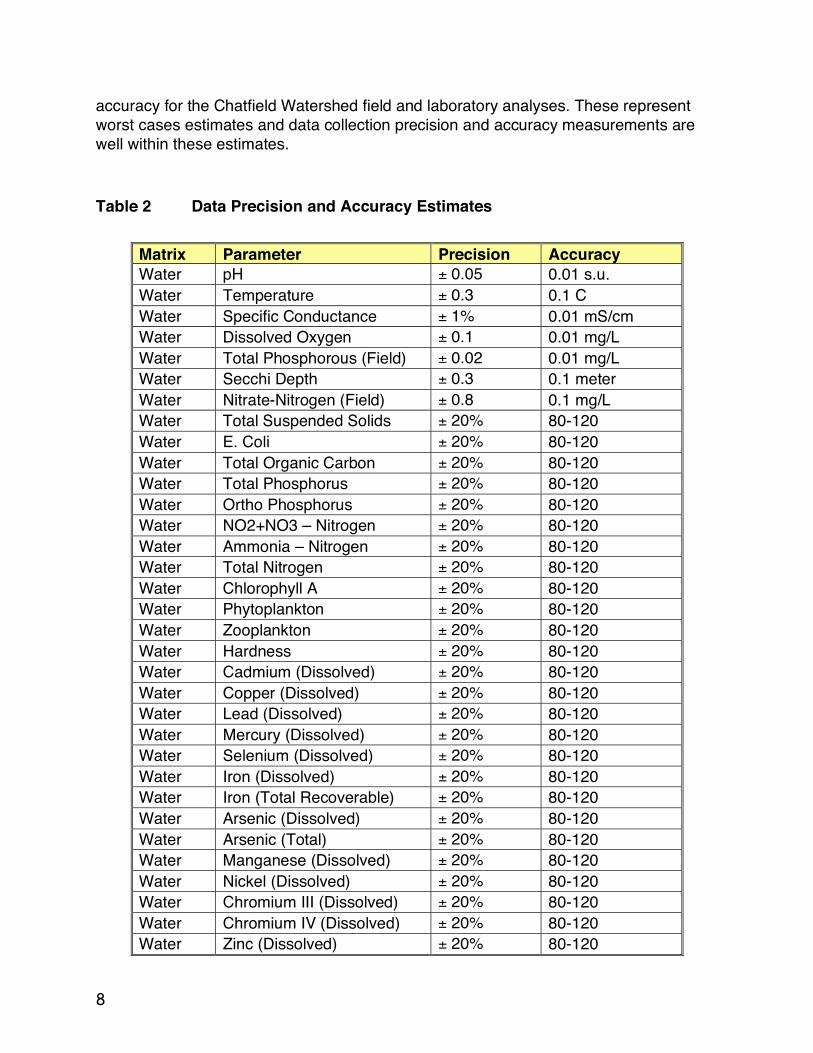
accuracy for the Chatfield Watershed field and laboratory analyses. These represent worst cases estimates and data collection precision and accuracy measurements are well within these estimates.
Table 2 Data Precision and Accuracy Estimates
Matrix Parameter Precision Accuracy Water pH ± 0.05 0.01 s.u. Water Temperature ± 0.3 0.1 C Water Specific Conductance ± 1% 0.01 mS/cm Water Dissolved Oxygen ± 0.1 0.01 mg/L Water Total Phosphorous (Field) ± 0.02 0.01 mg/L Water Secchi Depth ± 0.3 0.1 meter Water Nitrate-Nitrogen (Field) ± 0.8 0.1 mg/L Water Total Suspended Solids ± 20% 80-120 Water E. Coli ± 20% 80-120 Water Total Organic Carbon ± 20% 80-120 Water Total Phosphorus ± 20% 80-120 Water Ortho Phosphorus ± 20% 80-120 Water NO2+NO3 – Nitrogen ± 20% 80-120 Water Ammonia – Nitrogen ± 20% 80-120 Water Total Nitrogen ± 20% 80-120 Water Chlorophyll A ± 20% 80-120 Water Phytoplankton ± 20% 80-120 Water Zooplankton ± 20% 80-120 Water Hardness ± 20% 80-120 Water Cadmium (Dissolved) ± 20% 80-120 Water Copper (Dissolved) ± 20% 80-120 Water Lead (Dissolved) ± 20% 80-120 Water Mercury (Dissolved) ± 20% 80-120 Water Selenium (Dissolved) ± 20% 80-120 Water Iron (Dissolved) ± 20% 80-120 Water Iron (Total Recoverable) ± 20% 80-120 Water Arsenic (Dissolved) ± 20% 80-120 Water Arsenic (Total) ± 20% 80-120 Water Manganese (Dissolved) ± 20% 80-120 Water Nickel (Dissolved) ± 20% 80-120 Water Chromium III (Dissolved) ± 20% 80-120 Water Chromium IV (Dissolved) ± 20% 80-120 Water Zinc (Dissolved) ± 20% 80-120
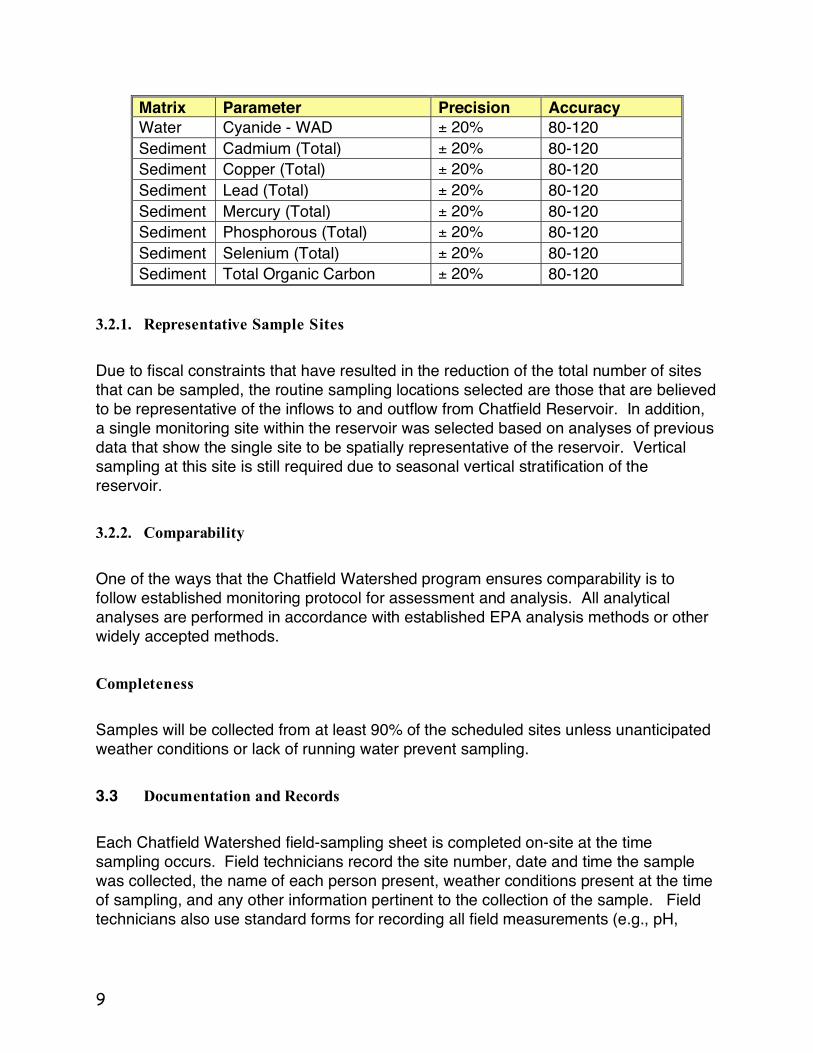
9
Matrix Parameter Precision Accuracy Water Cyanide - WAD ± 20% 80-120 Sediment Cadmium (Total) ± 20% 80-120 Sediment Copper (Total) ± 20% 80-120 Sediment Lead (Total) ± 20% 80-120 Sediment Mercury (Total) ± 20% 80-120 Sediment Phosphorous (Total) ± 20% 80-120 Sediment Selenium (Total) ± 20% 80-120 Sediment Total Organic Carbon ± 20% 80-120
3.2.1. Representative Sample Sites
Due to fiscal constraints that have resulted in the reduction of the total number of sites that can be sampled, the routine sampling locations selected are those that are believed to be representative of the inflows to and outflow from Chatfield Reservoir. In addition, a single monitoring site within the reservoir was selected based on analyses of previous data that show the single site to be spatially representative of the reservoir. Vertical sampling at this site is still required due to seasonal vertical stratification of the reservoir.
3.2.2. Comparability
One of the ways that the Chatfield Watershed program ensures comparability is to follow established monitoring protocol for assessment and analysis. All analytical analyses are performed in accordance with established EPA analysis methods or other widely accepted methods.
Completeness
Samples will be collected from at least 90% of the scheduled sites unless unanticipated weather conditions or lack of running water prevent sampling.
3.3 Documentation and Records
Each Chatfield Watershed field-sampling sheet is completed on-site at the time sampling occurs. Field technicians record the site number, date and time the sample was collected, the name of each person present, weather conditions present at the time of sampling, and any other information pertinent to the collection of the sample. Field technicians also use standard forms for recording all field measurements (e.g., pH,
10
temperature, conductivity, etc.) for each sampling location. The information is consistent with meta-data requirements of STORET. The field technicians copy each field sheet and keep a copy of their records. The original is returned to the consultant s office where they are archived for three years. The consultant maintains hard and electronic copies of all analytical data.
4.0 MEASUREMENT AND DATA ACQUISITION
4.1 Sampling Process Design
4.1.0. Sampling Sites
The inflow/outflow and reservoir monitoring sites used by the Authority are shown in section 1.0. Alluvial monitoring well locations sampled seasonally during alternate (even) years.
4.1.1. Basic Monitoring Program
The basic monitoring program parameters are provided in Table 3, and the rationale for the selection of these parameters is provided in section 4.2.
4.1.2. Massey Draw Monitoring Program
The Chatfield Watershed Authority will continue limited water quality monitoring in Massey Draw from 2003 through 2005. The Massey Draw monitoring program is incorporated into the Authority s standard monitoring program. The Authority assumes all costs for the monitoring program. This monitoring effort is valued at $2,800 per year for a total monitoring commitment from 2002-2005 of about $9,600. This monitoring effort will be used to establish pre-construction trends for both dry and wet weather events within Massey Draw. The sampling will generally be limited to the spring through fall runoff seasons. The three water quality parameters include: total nitrogen, total phosphorous, and total suspended solids. On an annual basis, the Authority will sample for three dry weather events with a single grab sample taken at the lower site prior to crossing highway C-470. On an annual basis, three stormwater runoff events will be taken with sampling at three points on the hydrograph for each event. Flow measurements will be taken for each sample. The Authority may add additional monitoring depending on initial data results.
11
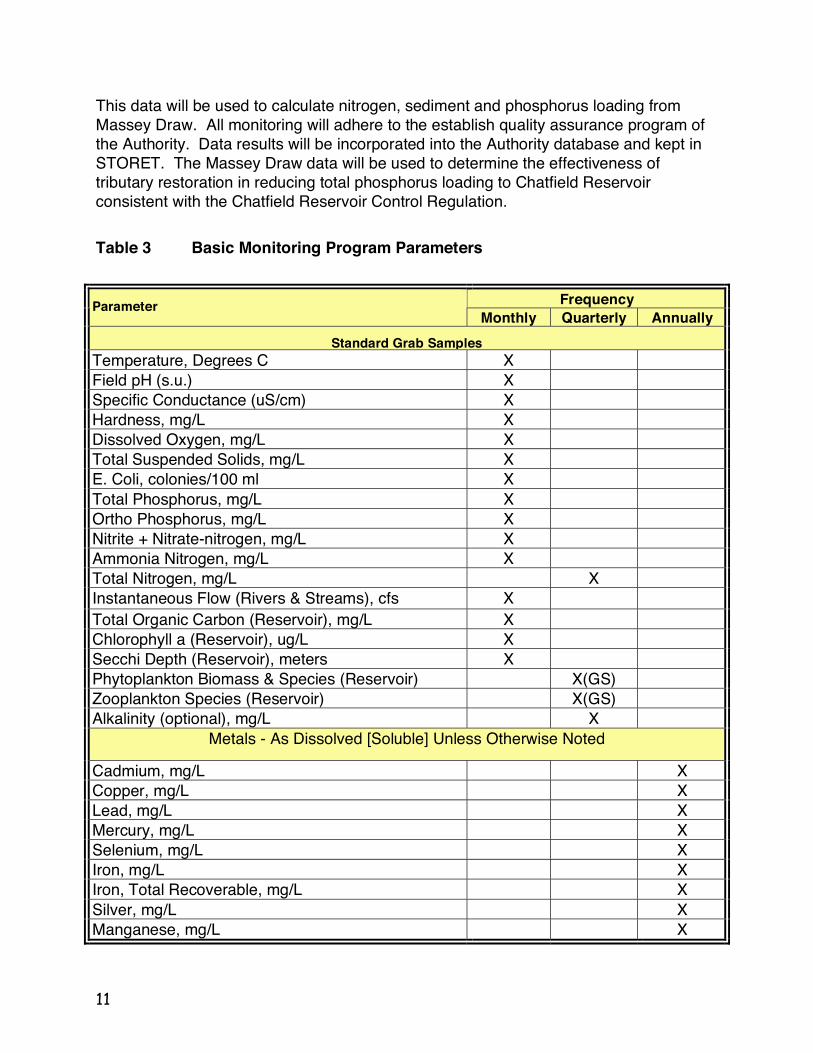
This data will be used to calculate nitrogen, sediment and phosphorus loading from Massey Draw. All monitoring will adhere to the establish quality assurance program of the Authority. Data results will be incorporated into the Authority database and kept in STORET. The Massey Draw data will be used to determine the effectiveness of tributary restoration in reducing total phosphorus loading to Chatfield Reservoir consistent with the Chatfield Reservoir Control Regulation.
Table 3 Basic Monitoring Program Parameters
Frequency Parameter Monthly Quarterly Annually
Standard Grab Samples Temperature, Degrees C X Field pH (s.u.) X Specific Conductance (uS/cm) X Hardness, mg/L X Dissolved Oxygen, mg/L X Total Suspended Solids, mg/L X E. Coli, colonies/100 ml X Total Phosphorus, mg/L X Ortho Phosphorus, mg/L X Nitrite + Nitrate-nitrogen, mg/L X Ammonia Nitrogen, mg/L X Total Nitrogen, mg/L X Instantaneous Flow (Rivers & Streams), cfs X Total Organic Carbon (Reservoir), mg/L X Chlorophyll a (Reservoir), ug/L X Secchi Depth (Reservoir), meters X Phytoplankton Biomass & Species (Reservoir) X(GS) Zooplankton Species (Reservoir) X(GS) Alkalinity (optional), mg/L X
Metals - As Dissolved [Soluble] Unless Otherwise Noted Cadmium, mg/L X Copper, mg/L X Lead, mg/L X Mercury, mg/L X Selenium, mg/L X Iron, mg/L X Iron, Total Recoverable, mg/L X Silver, mg/L X Manganese, mg/L X
12
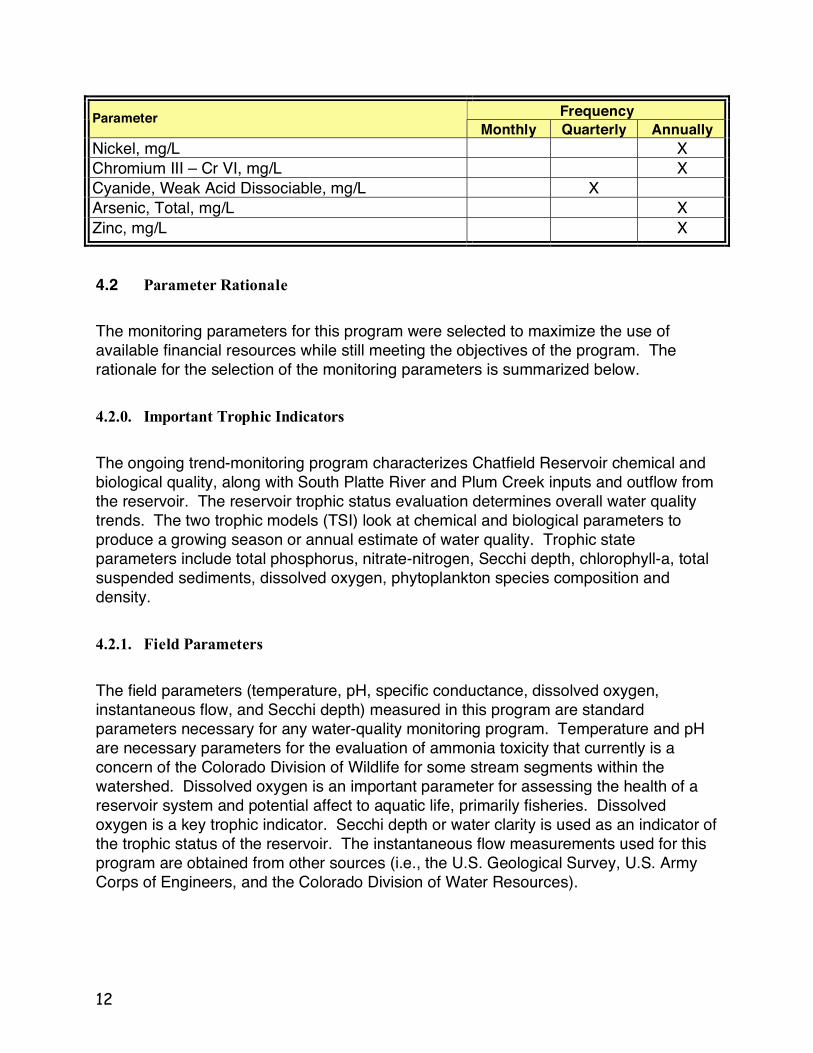
Frequency Parameter Monthly Quarterly Annually
Nickel, mg/L X Chromium III – Cr VI, mg/L X Cyanide, Weak Acid Dissociable, mg/L X Arsenic, Total, mg/L X Zinc, mg/L X
4.2 Parameter Rationale
The monitoring parameters for this program were selected to maximize the use of available financial resources while still meeting the objectives of the program. The rationale for the selection of the monitoring parameters is summarized below.
4.2.0. Important Trophic Indicators
The ongoing trend-monitoring program characterizes Chatfield Reservoir chemical and biological quality, along with South Platte River and Plum Creek inputs and outflow from the reservoir. The reservoir trophic status evaluation determines overall water quality trends. The two trophic models (TSI) look at chemical and biological parameters to produce a growing season or annual estimate of water quality. Trophic state parameters include total phosphorus, nitrate-nitrogen, Secchi depth, chlorophyll-a, total suspended sediments, dissolved oxygen, phytoplankton species composition and density.
4.2.1. Field Parameters
The field parameters (temperature, pH, specific conductance, dissolved oxygen, instantaneous flow, and Secchi depth) measured in this program are standard parameters necessary for any water-quality monitoring program. Temperature and pH are necessary parameters for the evaluation of ammonia toxicity that currently is a concern of the Colorado Division of Wildlife for some stream segments within the watershed. Dissolved oxygen is an important parameter for assessing the health of a reservoir system and potential affect to aquatic life, primarily fisheries. Dissolved oxygen is a key trophic indicator. Secchi depth or water clarity is used as an indicator of the trophic status of the reservoir. The instantaneous flow measurements used for this program are obtained from other sources (i.e., the U.S. Geological Survey, U.S. Army Corps of Engineers, and the Colorado Division of Water Resources).
13
4.2.2. Miscellaneous Notes
The analysis of total suspended solids characterizes mass loading and deposition into the reservoir. Analysis for E. coli replaced the fecal coliform analyses performed previously for consistency with measurements performed by the Colorado State Parks for swim beaches at Chatfield Reservoir. Total organic carbon analysis was added to the program to gain information that may be required for potential future changes in water-quality standards for the South Platte River.
4.2.3. Nutrient Analyses
Analysis of nutrient species (phosphorous and nitrogen species) is necessary for the assessment of compliance with the total phosphorous standard for Chatfield Reservoir as specified in the Chatfield Control Regulation and to monitor the trophic status of the reservoir. In addition, these species are measured in samples from the watershed in order to assess the relative contributions of nutrients to the Reservoir from the inflowing streams and rivers. Nutrient management is a critical objective of the long-range watershed and reservoir management program of the Authority.
4.2.4. Biological Analyses
Analysis of samples for chlorophyll a is required to assess attainment of the chlorophyll a goal for Chatfield Reservoir and is an indicator of the trophic status of the reservoir. Measurement of phytoplankton and zooplankton species provides useful information for assessing the overall health of the reservoir and trends in the numbers and types of species can be used to assess stability and changes in water quality within the reservoir on a seasonal, annual and long-term basis. In addition, because fishing is one of the principal recreational activities at Chatfield Reservoir, the biological data collected under this program can also provide insight into the status of fisheries. Additional correlation and evaluation of the biological data collected under this program will be performed as necessary.
4.2.5. Metals Analyses (Including Hardness)
Based on the analysis of metals data collected during 1997 through 1999, the frequency of analyses for metals in this program was reduced significantly in 2000 with one annual sample being collected. This same frequency will be employed during 2003-2005 in order to continue to monitor potential changes in metals concentrations in the watershed and reservoir. Hardness data are required for assessment of compliance with water-quality standards for metals. Collected water quality metal data doesn t indicate that
14
metals are degrading water quality within the reservoir. Consequently, a single annual data set can be used to determine major changes in input concentrations.
4.3 Watershed Monitoring
Monthly water-quality sampling is done at two major inputs to Chatfield Reservoir (Plum Creek and the South Platte River) and at the reservoir outfall for the basic water-quality parameters.
1. Monitoring locations at existing gauging stations include the South Platte River at Waterton (Colorado State Engineer, historically reported stream flows at USGS station 06708000, Field Code SP), for Plum Creek at Titan Road near Louviers (USGS station 06709530, Field Code PC), and for the South Platte River just downstream from Chatfield Reservoir (Field Code SO).
2. No direct flow measurements are made at inflow/outflow sites; rather, discharge
values are obtained from the appropriate data sources (U.S. Army Corps of Engineers, Colorado Water Resources Division, or the USGS, respectively) for the three-inflow/outflow sites.
3. Only total (unfiltered) nutrient concentrations are analyzed. 4. Sampling frequency - Inflow and reservoir-outflow samples are collected monthly
with doubled up (bi-monthly) sampling during the growing season months of July, August, and September. Thus, the total annual inflow and outflow sampling surveys equals 15.
5. Approximately 15 percent of the water-quality laboratory analyses are duplicate
or spike samples for quality-control/quality-assurance (QC/QA) purposes.
6. When contingent sampling events are required due to releases from Strontia Springs Reservoir, samples will be collected at 2 locations, the routine monitoring location in the South Platte River at Waterton and in the South Platte River below Strontia Springs Reservoir. Samples collected during these events are analyzed for the complete set of basic monitoring parameters, including metals.
4.4 Reservoir Monitoring
1. The in-reservoir monitoring is done at one reservoir location (Field Code RM) for
both depth-specific samples and vertical profiles for the basic water-quality parameters. The single reservoir monitoring location has been shown through previous data analyses to be spatially representative of the reservoir. Vertical sampling is still required due to seasonal vertical stratification of the reservoir.
15
2. The water column samples are taken from depth specific samples at three depths: the bottom one meter of the water column, the mid-euphotic zone (as determined from Secchi-depth readings) and the top one-meter of the water column.
3. Nutrients and total suspended solids are collected at the three separate depths.
4. Chlorophyll is sampled only from the top 1 meter of the water column in an
integrated sample. This sampling procedure is consistent with the method recommended previously by the Colorado Water Quality Division for Chatfield Reservoir.
5. Sampling scheduling requires monthly surveys with doubled up (bi-monthly)
sampling during the growing season months of July, August, and September. Samples for surveys that could not be conducted due to unsafe ice conditions will be added to the growing season sampling program. The total annual reservoir sampling surveys will always equal 15.
6. In-reservoir sampling is conducted from a boat during open water conditions
and by auguring through ice during winter ice-cover conditions. The boat does not need to anchor when sampling, but drift will be minimized. The Chatfield State Parks has provided the boat for monitoring and it is assumed that they will continue to provide the boat support.
7. Approximately 15 percent of the water-quality laboratory analyses are duplicate
or spike samples for quality-control/quality-assurance (QC/QA) purposes. 8. The depth profile is field monitored for temperature (degrees C), pH, dissolved
oxygen (mg/L) and specific conductance (uS/cm). These profiles include the entire water-column with a measurement increment of one meter.
9. A total of six phytoplankton surveys are done at the reservoir site for cell-counts
and species identification. Biological samples collected quarterly (spring, fall, winter) and three times during the growing season (July, August and September). Samples are taken from the mid-euphotic zone using standard collection and identification procedures.
10. Zooplankton species identification will be done one time during growing season
using standard collection and identification procedures. 11. An annual reservoir bottom sediment characterization is done on a one-time
basis during the growing season.
16
12. A sediment box core sample of surface sediments will be obtained at the profile monitoring station (The contractor needs to specify the SOP for this sampling requirement).
13. Sediment analyses will include five indicator metals. 14. Sediment analyses include total organic carbon, percent silts and clays, and
total phosphorus.
4.4.0. Unsafe Reservoir Conditions
The Project Manager is not expected to sample the reservoir under unsafe conditions, which can include high winds, storms or weak ice. When the field leader determines reservoir sampling can t occur due to unsafe conditions, inlet and outlet sampling can still occur. The reservoir sample taken within 3 days is considered as representative of the same sample set as the inlet and outlet sample. The Project Manager is responsible for determining representiveness of the delayed reservoir sample. Reservoir sampling from day 4 through 5 requires approval of the Program Administrator. Reservoir sampling after five days is a new data set.
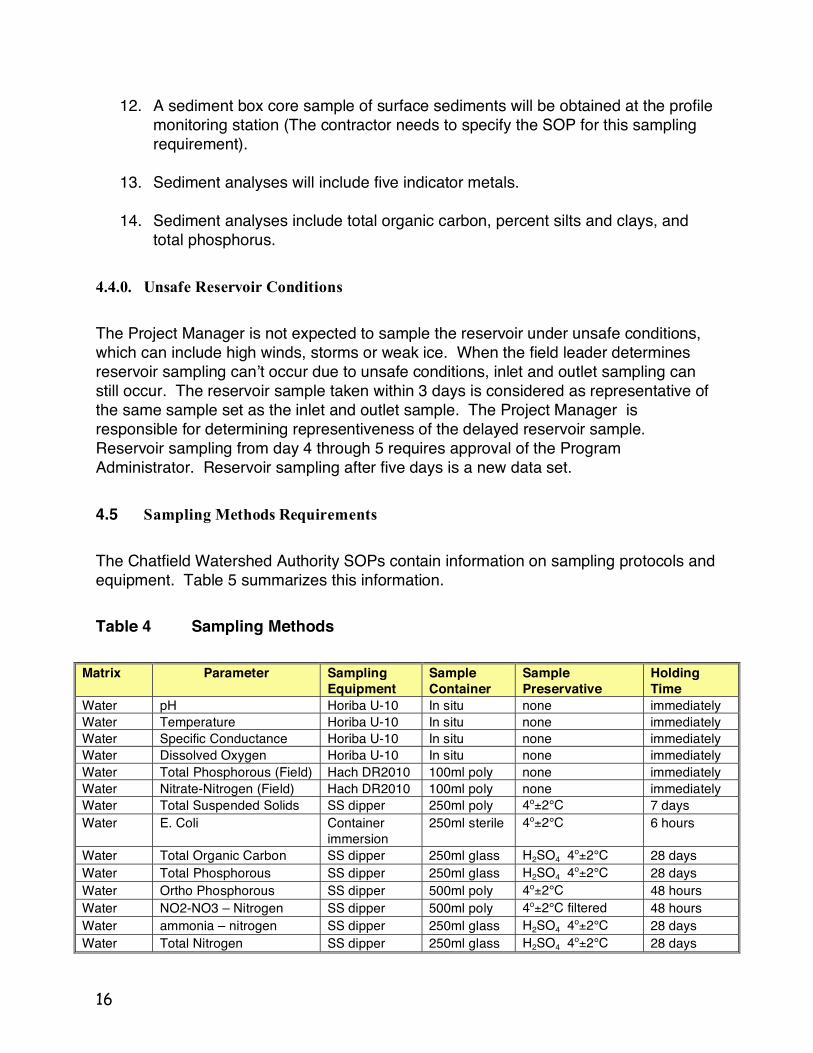
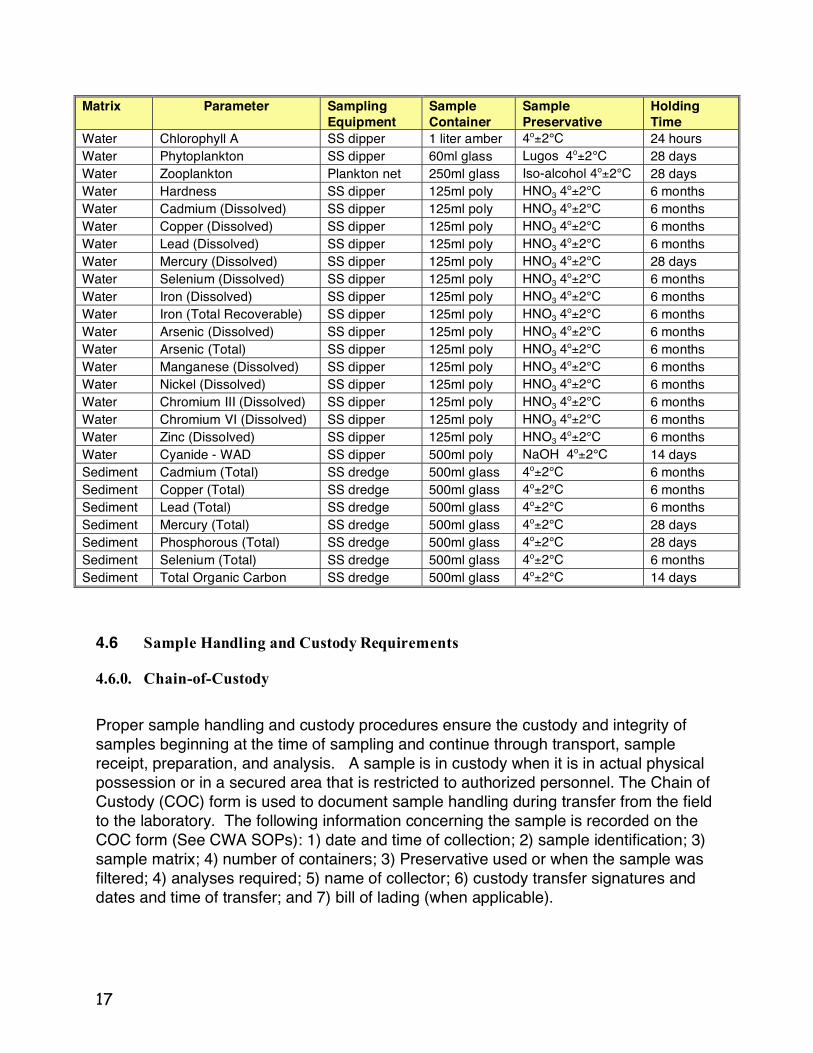
4.5 Sampling Methods Requirements
The Chatfield Watershed Authority SOPs contain information on sampling protocols and equipment. Table 5 summarizes this information.
Table 4 Sampling Methods
Matrix Parameter Sampling
Equipment Sample Container
Sample Preservative
Holding Time
Water pH Horiba U-10 In situ none immediately Water Temperature Horiba U-10 In situ none immediately Water Specific Conductance Horiba U-10 In situ none immediately Water Dissolved Oxygen Horiba U-10 In situ none immediately Water Total Phosphorous (Field) Hach DR2010 100ml poly none immediately Water Nitrate-Nitrogen (Field) Hach DR2010 100ml poly none immediately Water Total Suspended Solids SS dipper 250ml poly 4o±2°C 7 days Water E. Coli Container
immersion 250ml sterile 4o±2°C 6 hours
Water Total Organic Carbon SS dipper 250ml glass H2SO4 4o±2°C 28 days
Water Total Phosphorous SS dipper 250ml glass H2SO4 4o±2°C 28 days
Water Ortho Phosphorous SS dipper 500ml poly 4o±2°C 48 hours Water NO2-NO3 – Nitrogen SS dipper 500ml poly 4o±2°C filtered 48 hours Water ammonia – nitrogen SS dipper 250ml glass H2SO4 4
o±2°C 28 days Water Total Nitrogen SS dipper 250ml glass H2SO4 4
o±2°C 28 days
17
Matrix Parameter Sampling Equipment
Sample Container
Sample Preservative
Holding Time
Water Chlorophyll A SS dipper 1 liter amber 4o±2°C 24 hours Water Phytoplankton SS dipper 60ml glass Lugos 4o±2°C 28 days Water Zooplankton Plankton net 250ml glass Iso-alcohol 4o±2°C 28 days Water Hardness SS dipper 125ml poly HNO3 4
o±2°C 6 months Water Cadmium (Dissolved) SS dipper 125ml poly HNO3 4
o±2°C 6 months Water Copper (Dissolved) SS dipper 125ml poly HNO3 4
o±2°C 6 months Water Lead (Dissolved) SS dipper 125ml poly HNO3 4
o±2°C 6 months Water Mercury (Dissolved) SS dipper 125ml poly HNO3 4
o±2°C 28 days Water Selenium (Dissolved) SS dipper 125ml poly HNO3 4
o±2°C 6 months Water Iron (Dissolved) SS dipper 125ml poly HNO3 4
o±2°C 6 months Water Iron (Total Recoverable) SS dipper 125ml poly HNO3 4
o±2°C 6 months Water Arsenic (Dissolved) SS dipper 125ml poly HNO3 4
o±2°C 6 months Water Arsenic (Total) SS dipper 125ml poly HNO3 4
o±2°C 6 months Water Manganese (Dissolved) SS dipper 125ml poly HNO3 4
o±2°C 6 months Water Nickel (Dissolved) SS dipper 125ml poly HNO3 4
o±2°C 6 months Water Chromium III (Dissolved) SS dipper 125ml poly HNO3 4
o±2°C 6 months Water Chromium VI (Dissolved) SS dipper 125ml poly HNO3 4
o±2°C 6 months Water Zinc (Dissolved) SS dipper 125ml poly HNO3 4
o±2°C 6 months Water Cyanide - WAD SS dipper 500ml poly NaOH 4o±2°C 14 days Sediment Cadmium (Total) SS dredge 500ml glass 4o±2°C 6 months Sediment Copper (Total) SS dredge 500ml glass 4o±2°C 6 months Sediment Lead (Total) SS dredge 500ml glass 4o±2°C 6 months Sediment Mercury (Total) SS dredge 500ml glass 4o±2°C 28 days Sediment Phosphorous (Total) SS dredge 500ml glass 4o±2°C 28 days Sediment Selenium (Total) SS dredge 500ml glass 4o±2°C 6 months Sediment Total Organic Carbon SS dredge 500ml glass 4o±2°C 14 days
4.6 Sample Handling and Custody Requirements
4.6.0. Chain-of-Custody
Proper sample handling and custody procedures ensure the custody and integrity of samples beginning at the time of sampling and continue through transport, sample receipt, preparation, and analysis. A sample is in custody when it is in actual physical possession or in a secured area that is restricted to authorized personnel. The Chain of Custody (COC) form is used to document sample handling during transfer from the field to the laboratory. The following information concerning the sample is recorded on the COC form (See CWA SOPs): 1) date and time of collection; 2) sample identification; 3) sample matrix; 4) number of containers; 3) Preservative used or when the sample was filtered; 4) analyses required; 5) name of collector; 6) custody transfer signatures and dates and time of transfer; and 7) bill of lading (when applicable).
18
4.6.1. Sample Labeling
Samples are labeled on the container (or on a label) with an indelible marker. Label information includes the sample identification, the date and time of sampling, and the preservative added when applicable.
4.6.2. Sample Handling
All samples submitted to the laboratory for analyses must have proper documentation as to its source, method of collection, and maintenance of integrity during transport and delivery. Field personnel maintain custody of the samples until they are either relinquished directly to a laboratory or to a common carrier (e.g., Federal Express) for shipment to a laboratory. The samples are received in the laboratory by the sample custodian or assigned alternate. After checking the COC form for completeness, the sample custodian records the date, time, and signs the form. The sample custodian also verifies that all custody seals are intact and immediately notifies the consultant when it appears that the custody of the samples may have been compromised. The sample custodian also verifies the temperature of the samples and notifies the consultant when the temperature is not within prescribed limits (for samples that are directly delivered to the laboratory, the chilling process must be initiated, but it is recognized that the samples may not have reached the prescribed limits). Each analytical laboratory used for this program maintains an internal quality control system for handling samples before, during, and after analyses.
4.6.3. Failed Chain-of-Custody and Corrective Action
All issues associated with chain-of-custody procedures are immediately reported to the consultant Project Manager. These include such items as delays in transfer, resulting in holding time violations; violations of sample preservation requirements; incomplete documentation, including signatures; possible tampering of samples; broken or spilled samples, etc. The consultant Project Manager, in consultation with the Project Administrator will determine when the procedural violation may have compromised the validity of the resulting data. The consultant Project Manager in consultation with the Project Administrator will decide how the issue will be resolved based on best professional judgment and inform the TRC and Authority. Possible courses of action include, document and proceed; redo the entire sampling event (At no cost to the Authority); or selectively analyze samples. The resolution of the situation will be reported to the TRC and Authority at the next regularly scheduled meeting.
19
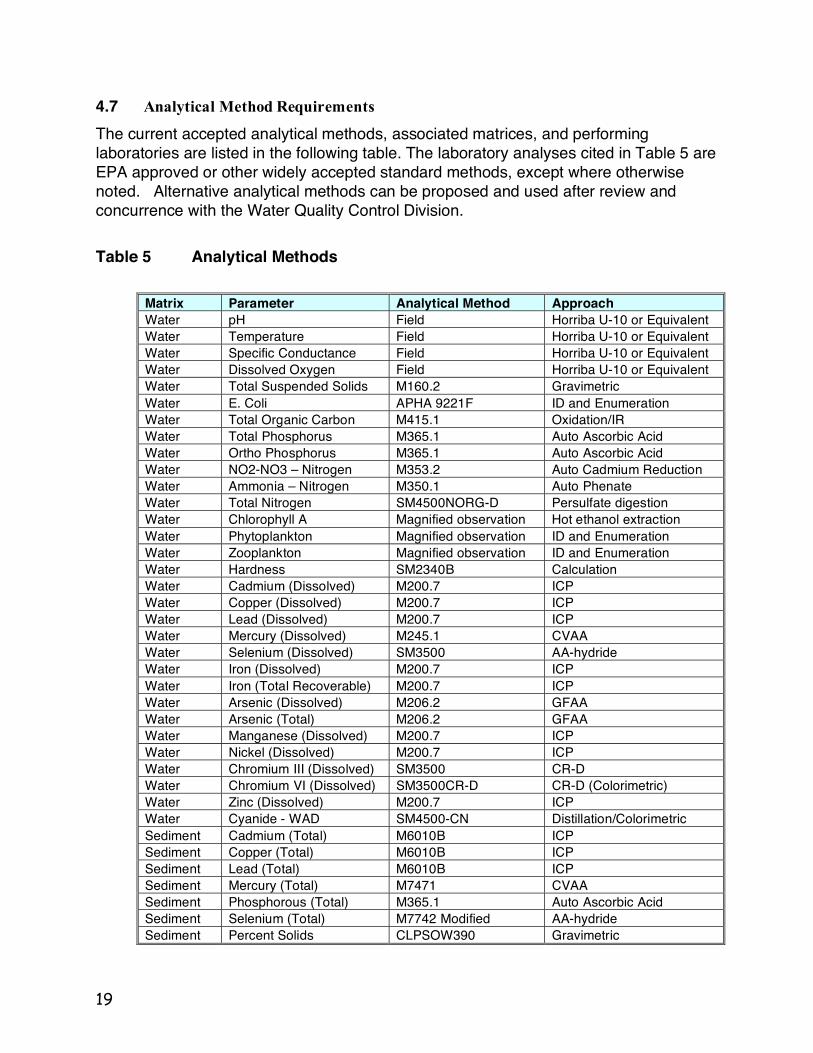
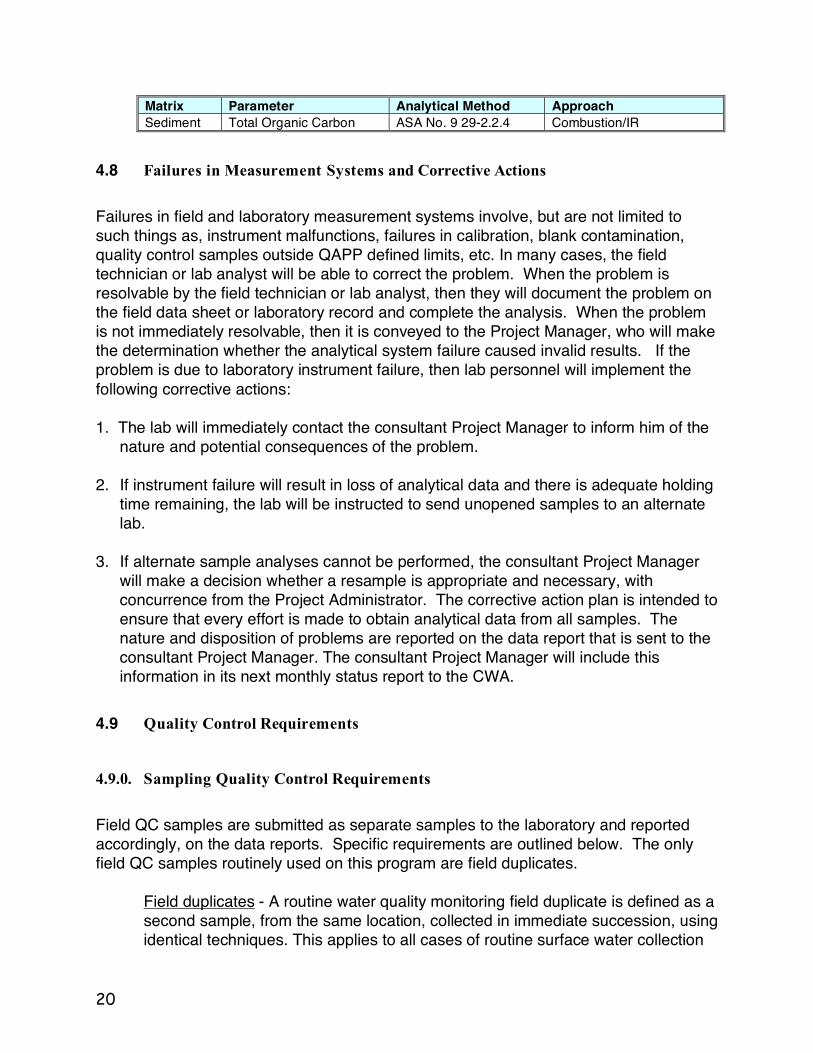
4.7 Analytical Method Requirements
The current accepted analytical methods, associated matrices, and performing laboratories are listed in the following table. The laboratory analyses cited in Table 5 are EPA approved or other widely accepted standard methods, except where otherwise noted. Alternative analytical methods can be proposed and used after review and concurrence with the Water Quality Control Division.
Table 5 Analytical Methods
Matrix Parameter Analytical Method Approach Water pH Field Horriba U-10 or Equivalent Water Temperature Field Horriba U-10 or Equivalent Water Specific Conductance Field Horriba U-10 or Equivalent Water Dissolved Oxygen Field Horriba U-10 or Equivalent Water Total Suspended Solids M160.2 Gravimetric Water E. Coli APHA 9221F ID and Enumeration Water Total Organic Carbon M415.1 Oxidation/IR Water Total Phosphorus M365.1 Auto Ascorbic Acid Water Ortho Phosphorus M365.1 Auto Ascorbic Acid Water NO2-NO3 – Nitrogen M353.2 Auto Cadmium Reduction Water Ammonia – Nitrogen M350.1 Auto Phenate Water Total Nitrogen SM4500NORG-D Persulfate digestion Water Chlorophyll A Magnified observation Hot ethanol extraction Water Phytoplankton Magnified observation ID and Enumeration Water Zooplankton Magnified observation ID and Enumeration Water Hardness SM2340B Calculation Water Cadmium (Dissolved) M200.7 ICP Water Copper (Dissolved) M200.7 ICP Water Lead (Dissolved) M200.7 ICP Water Mercury (Dissolved) M245.1 CVAA Water Selenium (Dissolved) SM3500 AA-hydride Water Iron (Dissolved) M200.7 ICP Water Iron (Total Recoverable) M200.7 ICP Water Arsenic (Dissolved) M206.2 GFAA Water Arsenic (Total) M206.2 GFAA Water Manganese (Dissolved) M200.7 ICP Water Nickel (Dissolved) M200.7 ICP Water Chromium III (Dissolved) SM3500 CR-D Water Chromium VI (Dissolved) SM3500CR-D CR-D (Colorimetric) Water Zinc (Dissolved) M200.7 ICP Water Cyanide - WAD SM4500-CN Distillation/Colorimetric Sediment Cadmium (Total) M6010B ICP Sediment Copper (Total) M6010B ICP Sediment Lead (Total) M6010B ICP Sediment Mercury (Total) M7471 CVAA Sediment Phosphorous (Total) M365.1 Auto Ascorbic Acid Sediment Selenium (Total) M7742 Modified AA-hydride Sediment Percent Solids CLPSOW390 Gravimetric
20
Matrix Parameter Analytical Method Approach Sediment Total Organic Carbon ASA No. 9 29-2.2.4 Combustion/IR
4.8 Failures in Measurement Systems and Corrective Actions
Failures in field and laboratory measurement systems involve, but are not limited to such things as, instrument malfunctions, failures in calibration, blank contamination, quality control samples outside QAPP defined limits, etc. In many cases, the field technician or lab analyst will be able to correct the problem. When the problem is resolvable by the field technician or lab analyst, then they will document the problem on the field data sheet or laboratory record and complete the analysis. When the problem is not immediately resolvable, then it is conveyed to the Project Manager, who will make the determination whether the analytical system failure caused invalid results. If the problem is due to laboratory instrument failure, then lab personnel will implement the following corrective actions: 1. The lab will immediately contact the consultant Project Manager to inform him of the
nature and potential consequences of the problem. 2. If instrument failure will result in loss of analytical data and there is adequate holding
time remaining, the lab will be instructed to send unopened samples to an alternate lab.
3. If alternate sample analyses cannot be performed, the consultant Project Manager
will make a decision whether a resample is appropriate and necessary, with concurrence from the Project Administrator. The corrective action plan is intended to ensure that every effort is made to obtain analytical data from all samples. The nature and disposition of problems are reported on the data report that is sent to the consultant Project Manager. The consultant Project Manager will include this information in its next monthly status report to the CWA.
4.9 Quality Control Requirements
4.9.0. Sampling Quality Control Requirements
Field QC samples are submitted as separate samples to the laboratory and reported accordingly, on the data reports. Specific requirements are outlined below. The only field QC samples routinely used on this program are field duplicates.
Field duplicates - A routine water quality monitoring field duplicate is defined as a second sample, from the same location, collected in immediate succession, using identical techniques. This applies to all cases of routine surface water collection
21
procedures, including in-stream grab samples, bucket grab samples (e.g., from bridges), pumps, and other water sampling devices. Field duplicates are collected on all samples on a 10% basis. Duplicate samples are sealed handled, stored, shipped, and analyzed in the sample manner as the primary sample. Precision of duplicate results is calculated by the relative percent difference (RPD) as defined by 100 times the difference (range) of each duplicate set, divided by the average value (mean) of the set. For duplicate results, D1 and D2, the RPD is calculated from the following equation:
Equation 1 Field Relative Percent Difference
RPD = ((D1-D2)*100)/((D1+D2)/2)
Best professional judgment is used to determine the acceptability of field duplicate analyses.
4.9.1. Laboratory Measurement Quality Control Requirements
Detailed laboratory QC requirements are contained within each laboratory Quality Assurance Plan and are also specified in the EPA-approved analytical methods. The minimum requirements that all participants abide by are stated below.
Laboratory duplicate - Laboratory duplicates are used to assess precision. A laboratory duplicate is prepared by splitting aliquots of a single sample (or a matrix spike or a laboratory control standard) in the laboratory. Both samples are carried through the entire preparation and analytical process. Laboratory duplicates are performed on 10% of samples analyzed. Precision is calculated by the relative percent difference (RPD) of duplicate results as defined by 100 times the difference (range) of each duplicate set, divided by the average value (mean) of the set. For duplicate results, D1 and D2, the RPD is calculated from the following equation:
Equation 2 Laboratory Relative Percent Difference
RPD = ((D1-D2)*100)/((D1+D2)/2)
Laboratory Control Standard (LCS) - A laboratory control sample is analyte-free water spiked with the analyte of interest prepared from standardized reference material. The laboratory control standard is generally spiked at a level less than or equal to the mid-point of the calibration curve for each analyte. The LCS is carried through the complete preparation and analytical process. The LCS is used to document the accuracy of the method due to the analytical process. LCS s are generally run at a rate of one per batch. Acceptability criteria are
22
laboratory specific and usually based on results of past laboratory data. The analysis of LCS s is a measure of accuracy and is calculated by Percent Recovery (%R) and defined as 100 times the observed concentration, divided by the true concentration of the spike. Acceptance criteria are based on laboratory control charts, but not greater than the prescribed criteria. The formula used to calculate percent recovery, where %R is percent recovery includes SR as the sample result and SA as the spike added:
Equation 3 Laboratory Control Sample Percent Recovery
Percent R = SR * 100/SA
Matrix spikes (MS)- A matrix spike is an aliquot of sample spiked with a known concentration of the analyte of interest. Percent recovery of the known concentration of added analyte is used to assess accuracy of the analytical process. The spiking occurs prior to sample preparation and analysis. The MS is spiked at a level less than or equal to the midpoint of the calibration or analysis range for each analyte. The MS is used to document the accuracy of a method due to sample matrix and not to control the analytical process. The analysis of matrix spikes is a measure of accuracy and is calculated by Percent Recovery %R is defined as 100 times the observed concentration, minus the sample concentration, divided by the true concentration of the spike. The formula used to calculate percent recovery, where %R is percent recovery; SSR is the observed spiked sample concentration; SR is the sample concentration; and, SA is the spike added; is:
Equation 4 Matrix Spike Percent Recovery
Percent R = [(SSR -SR)/SA] * 100
Method blank- a method blank is an analyte-free matrix to which all reagents are added in the same volumes or proportions as used in the sample processing. The method blank is carried through the complete sample preparation and analytical procedure. The method blank is used to document contamination in the preparatory and analytical processes. The analysis of method blanks will yield values less than the Minimum Analytical Level. For very high-level analyses blank value will be less then 5% of the lowest value of the batch.
Additional method specific QC requirements - Additional QC samples are run (e.g., surrogates, internal standards, continuing calibration samples, interference check samples) as specified in the methods. The requirements for these samples, their acceptance criteria, and corrective action are method-specific and are therefore not listed in this plan.
23
4.9.2. Quality Control Failures and Corrective Action
The consultant Project Manager, in consultation with the Project Administrator, evaluates all sampling QC excursions. In that differences in duplicate sample results are used to assess the entire sampling process, including environmental variability, the arbitrary rejection of results based on pre-determined limits is not practical. Therefore, judgment will be relied upon in evaluating results. Rejecting sample results based on wide variability is a possibility. Notations of field duplicate excursions are noted in the consultant s monthly status report and annual data report. The laboratory staff evaluates laboratory measurement failures. The dispositions of such failures and conveyance to the CWA are discussed under Failed Analytical Systems and Corrective Action section.
4.10 Instrument and Equipment Testing/Maintenance
All sampling equipment testing and maintenance requirements are detailed in the these SOPs. Equipment records are kept on all field equipment and a supply of critical spare parts is maintained. All laboratory tools, gauges, instruments, and equipment testing and maintenance requirements are contained within each laboratory s Quality Assurance Manual. Testing and maintenance records are maintained and are available for inspection by the consultant and/or CWA.
4.10.0. Instrument Calibration and Frequency
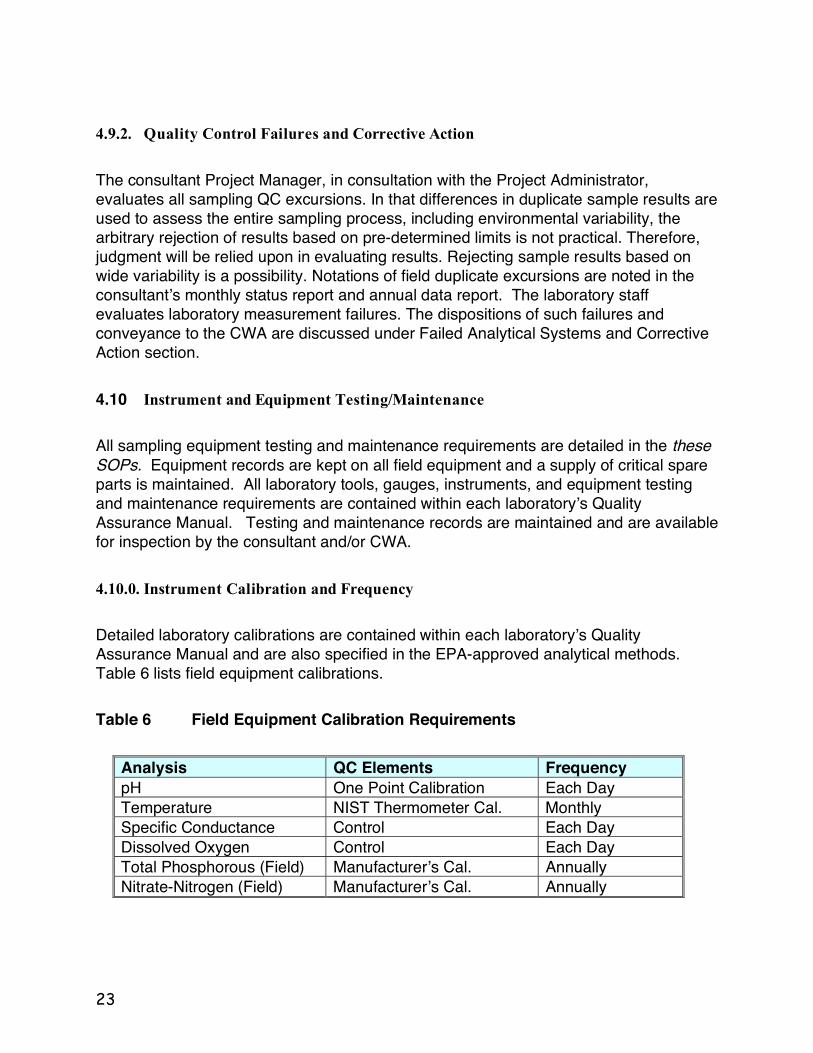
Detailed laboratory calibrations are contained within each laboratory s Quality Assurance Manual and are also specified in the EPA-approved analytical methods. Table 6 lists field equipment calibrations.
Table 6 Field Equipment Calibration Requirements
Analysis QC Elements Frequency pH One Point Calibration Each Day Temperature NIST Thermometer Cal. Monthly Specific Conductance Control Each Day Dissolved Oxygen Control Each Day Total Phosphorous (Field) Manufacturer s Cal. Annually Nitrate-Nitrogen (Field) Manufacturer s Cal. Annually
24
4.10.1. Supply Inspection and Acceptance Requirements
The procurement of equipment and supplies and verification that the equipment and supplies received met the required specifications is a critical step to maintain the quality of samples collected under this program. As applicable, procurement documents include: a definitive scope of work; administrative requirements; technical requirements describing items to be furnished; applicable quality requirements for the supplier(s); right of access to supplier's facilities and records for the purposes of inspections and audit; and documents to be provided by the supplier in support of compliance to procurement requirements. Procurement documents are reviewed by the Project Manager to ensure they include appropriate and adequate provisions to meet intended requirements. Once procured items are received, receiving personnel will ensure that the items received are in conformance with the specifications of the order. Any items determined to not be in conformance will be clearly identified as such in order to prevent their use. All documentation regarding quality received with the items shall be maintained as quality records and shall be traceable to the items procured via lot numbers, bar codes, or other appropriate system. Examples of these types of records include documentation related to cleanliness levels of equipment and sample containers.
4.10.2. Other Data Acquisitions
In addition to the data collected under this monitoring program, data is obtained from the following sources for use in preparation of the annual data report: 1) stream flow data for Plum Creek (field code PC) – U.S. Geological Survey; 2) stream flow data for the South Platte River (field code SP) – Colorado Division of Water Resources; and 3) stream flow data for the Chatfield Reservoir outfall (field code SO) – U.S. Army Corps of Engineers. These data are included in the annual data report but are not used for making any regulatory decisions. Consequently, no additional quality requirements are applied to these data. These data are qualified as provisional data in the annual data report to indicate that the agencies have not completed verification of the data.
5.0 DATA MANAGEMENT, ASSESSMENT AND OVERSIGHT
5.1 Data Management
Field data sheets are reviewed and signed by the sampling team leader at the end of each sampling event. Field sheets are then given to the consultant Project Manager for review. Any discrepancies noted during this review are promptly resolved. Field and laboratory data are recorded in an Access database developed by the project consultant and are transferred electronically to the Authority's administrator in conjunction with the final annual monitoring report. A database is maintained by the consultant which
25
contains information on each site visit including (at a minimum) sampling date, sampling time, consultant personnel, volunteer assistance, weather conditions, subjective stream and reservoir observations or conditions (e.g., reservoir - choppy surface with turbid green water), problems, instrument calibrations, and quality assurance and quality control samples. The database belongs to the CWA and must be transferred to the Authority on request. The Access database has been designed so that the majority of the analytical data received from laboratories can be loaded into the database directly from electronic files received from the laboratory. The database also performs some basic error checking routines when the electronic files are loaded to flag erroneous data prior to the data being loaded into the database. Data is analyzed with EXCEL spreadsheets.
5.2 Assessment and Response Actions
Review of Chatfield Watershed field activities is the responsibility of the consultant Field Leader, in conjunction with the consultant Project Manager. Each field team will be accompanied and their performance evaluated by one of these individuals once a year. When possible, field technicians in need of performance improvement will be retrained on-site during the evaluation. When errors in sampling techniques are consistently identified, additional training may be scheduled more frequently. All field and laboratory activities may be reviewed by state, CWA and other appropriate personnel as requested.
5.3 Consultant Reports and Presentations
The consultant produces an annual basic data report summarizing results of a calendar-year-monitoring program. This report contains a summary table of mean, standard deviation, and range data results for each sampling site. The processed data tables for each station and sampling period are included as an appendix. A summary table from the database will identify any problems encountered in the monitoring program. The quality assurance and quality control results will be summarized and any problem data flagged. The consultant will attend and make presentations at four meetings with the Chatfield Watershed Authority. The consultant provides an estimated 15-minute presentation which highlights the monitoring program status, data results, variability of selected water-quality conditions, problems encountered, and reservoir limnological status and input load characterizations. In addition, the consultant will attend at least four meetings with the TRC to discuss the status of the monitoring program.
26
5.4 Data Validation and Usability
All data obtained from field and laboratory measurements will be reviewed and verified for integrity and continuity, reasonableness, and conformance to project requirements, and then validated against the data quality objectives. Only those data that are supported by appropriate quality control data and meet the data quality objectives defined for this project will be considered acceptable. The procedures for verification and validation of data are described below. The consultant Field Leader will be responsible for ensuring that field data are properly reviewed, verified, and submitted in the required format to the consultant Project Manager. Likewise, the Laboratory Supervisor for each laboratory will be responsible for ensuring that laboratory data are reviewed, verified, and submitted in the required format to the consultant Project Manager for uploading to the project database. The consultant Project Manager is responsible for verifying that field and laboratory data have been entered correctly into the project database and for validating that all data collected meet the data quality objectives of the project. All data will be verified to ensure they are representative of the samples analyzed and locations where measurements were made, and that the data and associated quality control data conform to project specifications. The consultant staff and management and subcontract laboratories are responsible for verifying the data each task generates or handles. The field and laboratory staff ensures the verification of raw data, electronically generated data, and data on chain-of-custody forms and hardcopy output from instruments. Verification of data will be performed using self-assessments and peer review, as appropriate to the project task, followed by technical review by the consultant Project Manager. The data to be verified are evaluated against project specifications and are checked for errors, especially errors in transcription, calculations, and data input. Potential outliers are identified by examination for unreasonable data, or identified using computer-based statistical software. When a question arises or an error or potential outlier is identified, the consultant Project Manager is responsible to resolve the issue. Issues that can be corrected are corrected and documented electronically or by initialing and dating the associated paperwork. When an issue cannot be corrected, the task manager consults with the Project Administrator to establish the appropriate course of action, or the data associated with the issue are rejected. The consultant Project Manager is responsible for validating that the verified data are usable. One element of the validation process involves evaluating the data again for anomalies. The consultant Project Manager may designate other experienced water quality experts familiar with the project to perform this evaluation. Before data validation can be completed the consultant Project Manger must address any suspected errors or anomalous data.
27
As soon as possible after each sampling event, calculations and determinations for precision, completeness, and accuracy will be made and corrective action implemented if needed. When data quality indicators do not meet the project s specifications, data may be discarded and re-sampling may occur. The cause of failure will be evaluated. When the cause is found to be equipment failure, calibration/maintenance techniques will be reassessed and improved. When the problem is found to be sampling team error, team members will be retrained. Any limitations on data use will be detailed in both monthly status and annual data reports, and other documentation as needed. When failure to meet project specifications is found to be unrelated to equipment, methods, or sample error, specifications may be revised for the next sampling season.
6.0 STANDARD OPERATING PROCEDURES
6.1 Purpose
The standard operating procedures (SOP) describe the collection, preparation, and handling of surface water from streams and reservoirs, alluvial well, and sediment samples. These SOPs are applicable to the water-quality monitoring program for the Chatfield Watershed Authority (CWA). SOPs are used in conjunction with the CWA Quality Assurance Project Plan and Sampling and Analysis Plan (QAPP/SAP) that defines sample locations, schedules, list of analytes, and quality assurance/quality control (QA/QC) procedures.
6.2 Field-Survey Preparations
All field instruments and meters are calibrated and a maintenance check is performed to ensure proper function. Calibration of the equipment is conducted in accordance with the manufacturers' specifications (The Program Administrator maintains a PDF file on the Manufacturers Instructions for Calibration, Maintenance and Use Of Hach Dr 2010 Spectrophotometer And Horiba U-10 Water Quality Checker). Spare parts are kept on hand while in the field in the event of an equipment malfunction. A record of all calibrations, standardization including standard lots and expiration datesand maintenance is maintained in a bound logbook. Information on dates, operator, time, location, comments and recommended maintenance also are recorded for each use. The logbook is inspected regularly by the Project Manager to ensure recommended maintenance is completed. The Project Manager will sign and date the logbook to indicate approval. Several general procedures are applicable to the collection of all surface water samples. These procedures include:
1. Prepare all sampling equipment and containers prior to site visit;
28
2. Follow sampling plan in every detail;
3. Document steps in the sampling procedures (The Project Manager will maintain
field forms that can be used for documenting sampling procedures); 4. Evaluate site for safety hazards and any physical conditions that may affect sample
condition before commencing sample collection; 5. Observe number and location of sample points, landmarks, references, and routes
of access or escape;
6. Record pertinent observations, including a sketch, where appropriate, identifying sample locations;
7. Collect samples and securely closing containers as quickly as feasible; and
8. Make field observations (pH, temperature, specific conductance) at the source
using a probe rather than in the containers, whenever possible.
6.3 Sample Containers And Preservation
Refer SOPs for specifications for sample containers, preservatives, and holding times for all analytes. In addition to any preservatives specified in the SOPs, all samples will be placed in a cooler on ice immediately after sample collection.
6.4 In-Stream Water Sampling
In-stream water samples are collected as grab or composite samples. Composite samples can be flow or time based. Grab samples characterize a medium at a particular point in time and space. Grab samples are collected by container immersion or by using a transfer device such as a beaker or dipper. A representative sample is obtained as near the centroid of flow as safety allows. Sample sites located in standing water or near streambanks will be avoided. Sampling from the upstream side of a bridge aids in the prevention of contamination of the sample from paint chips or dirt from the road. When suspended particles are unlikely to be uniformly distributed across the channel cross section, a composite sample consisting of several grab samples is used. Do not include large non-homogeneous particles, such as leaves and detritus, in the sample. Collection of in-stream water samples by container immersion is performed as follows:
1. Submerge the sample bottle below the water surface with the opening pointing upstream at the centroid of the stream flow.
29
2. The sampler will minimize the disturbance of bottom sediment.
3. Allow container to fill to the desired volume.
4. Sample containers containing preservatives are filled to just below the bottom of the container neck to prevent loss of preservative.
5. Remove container from the water.
6. Decontaminate the sample containers outside surface by rinsing with deionized
water.
7. Tighten sample container lid.
8. Complete all information on the sample label.
9. Sign and date custody seal and place over the sample container s lid.
10. Place sample in a zip-lock bag and seal.
11. Place bagged sample in a prepared U.S. Department of Transportation (DOT) compliant shipping container with ice as required.
Collection of in-stream water samples by the dip and transfer method is performed as follows:
1. Select the correct composition of the transfer device for the selected analytes.
2. Decontaminate the transfer device.
3. Place the device at the centroid of stream flow facing upstream
4. Rinse the device three times with surface water.
5. Collect and transfer sample directly into sample container.
6. Do not overfill containers that have preservative.
7. Do not let transfer device contact anything except surface water.
8. Tighten sample container lid.
9. Decontaminate sample container s outside surface by rinsing with deionized or distilled water.
30
10. Complete all information on sample label.
11. Sign and date custody seal and place over the container lid.
12. Place in a zip-lock plastic bag and seal.
13. Place bagged samples in a prepared DOT-compliant shipping container with ice
as required.
6.5 In-Reservoir Depth And Secchi Depth Measurement
Sample depths are measured with a calibrated sounding line to the nearest 0.1-meter. The mid-euphotic sampling point is determined by using a Secchi disk as follows:
1. The sampler must not wear sunglasses.
2. Measurements are taken between 9 a.m. and 3 p.m. and the time noted.
3. Weather and other conditions are noted.
4. Measure on the shady side of the boat with the sampler s face as close to the surface as possible.
5. Lower the Secchi disk until it disappears from view.
6. Raise the disk until it reappears and record this depth.
7. Repeat the procedure three times and average the results.
6.6 In-Reservoir Water Sample Collection
Reservoir samples are collected from approximately the same location for every event. The sample location is determined by visual orientation, due west of the Chatfield Dam outlet tower and due south of a permanent picnic structure on the north bank. The lake is sounded to locate a point with a water depth of 11 meters, or 33 feet. The boat is then anchored if drift control is necessary. Water samples at the appropriate depths are collected with a Van Dorn or a similar discrete-zone sampling device. A Van Dorn sampler consists of an 18-inch long, three-inch diameter PVC cylinder, open on both ends, with a mechanism that can be triggered to close the caps of the sampler at the desired sampling depth, thereby collecting a discrete sample at the depth where the caps were closed. The method followed for such a sampler is as follows:
31
1. Rinse Van Dorn samplers and sample transfer device with reservoir water.
2. Open the device and lower it to the desired depth using a calibrated rope.
3. Gently raise and lower to device to rinse it at the sampling depth.
4. Trigger the closure mechanism to collect the sample and lift to the surface.
5. Rinse sample transfer device with sample water
6. Transfer sample into sample containers.
7. Tighten sample container lid.
8. Decontaminate sample container outside surface by rinsing with deionized water.
9. Complete all information on the sample label.
10. Sign and date custody seal and place over the sample container s lid.
11. Place sample in a zip-lock plastic bag.
12. Place bagged sample in prepared DOT-compliant shipping container with ice
when required. In-reservoir water samples are taken through the ice using this same method when it is safe to do so. A Secchi disc reading will not be reliable so the mid-euphotic zone will be assumed at 1.5 meters.
6.7 Metals Chemistry Water Sample Collection
Samples that will be submitted to a laboratory for analysis of dissolved metals are filtered prior to transferring into sample containers. Do not preserve the samples prior to filtration. These samples are filtered using a vacuum filter holder, hand-vacuum pump, flask with a side arm, and 0.45- m filter paper. The method to be followed is as follows:
1. Thoroughly decontaminate the filter holder and flask with deionized water.
2. Place a new 0.45 μm filter paper on the vacuum filter holder and re-attach the funnel to the filter holder.
3. Insert the stopper of the filter holder into the flask.
32
4. Attach the hand-vacuum pump to the side arm of the flask.
5. Pour the sample water into the funnel and begin pumping the vacuum pump to draw the water through the filter into the flask. Repeat until sample has been filtered.
6. Transfer the sample from the flask into the appropriate sample containers.
7. Tighten sample container lid.
8. Decontaminate sample container s outside surface by rinsing with deionized
water.
9. Complete all information on sample label.
10. Sign and date custody seal and place over the sample container lid.
11. Place sample in a zip-lock plastic bag.
12. Place bagged sample in prepared DOT-compliant shipping container with ice as required.
6.8 In-Reservoir Sediment Sample Collection
Reservoir sediment samples are obtained by using an Ekman Dredge or similar device. The sampler in current use is a metal clamshell-type dredge approximately 8-inches across, attached at the hinge to a line by which the sampler is dropped to the bottom. After dropping to the bottom, the jaws of the sampler are quickly closed by triggering the mechanism from the surface. Details of the sampling method are as follows:
1. Rinse the device in reservoir water.
2. Lower the device to the reservoir bottom.
3. Trigger the closure mechanism and lift to the surface.
4. Transfer the sample into a stainless steel mixing bowl.
5. Mix the sample to homogenize after required volume is obtained.
6. Transfer sample into sample containers with a stainless steel spoon after mixing.
7. Wipe residual sample from sample container cap threads.
33
8. Tighten sample container s lid.
9. Decontaminate sample container s outside surface by rinsing with deionized
water.
10. Complete all information on sample label.
11. Sign and date custody seal and place over sample container s lid
12. Place sample in a zip-lock bag.
13. Place bagged sample in prepared DOT conveyance with ice when required.
6.9 Alluvial Well Sampling
The well sampling sites consist of a faucet at the wellhead, a pumping station, or open cistern. Sampling procedures for the pumped wells follow the sampling by dip and transfer method after the water source has been purged of stale water. Notes regarding the color, flow, and general character of the water are recorded. The open cistern is sampled with a transfer device secured with a rope. The device is lowered into the water and the sample transferred to the sample containers using the dip and transfer method. Safety issues will cause any sampling activities to cease.
6.10 Phytoplankton Sampling
Phytoplankton samples are collected at the same location and using the same methods as the in-reservoir water samples. Phytoplankton samples are always collected from the mid-euphotic sampling depth. Samples are placed into an amber glass jar and preserved with Lugols Iodine Solution. Phytoplankton samples are packed in a cooler with blue ice and then transported to the University of Colorado Limnology Laboratory in Boulder for analysis. Samples are typically delivered to the lab on the same day they are collected.
34
6.11 Zooplankton Sampling
Zooplankton samples are typically collected only once per year. Zooplankton samples are collected at the same location as the in-reservoir water samples. So as not to compromise the integrity of the water samples, the zooplankton sample is always collected following the collection of water samples. Collection of zooplankton samples is done with a 500-micorn sieve zooplankton net. Collection of zooplankton samples using a zooplankton net is performed as follows:
1. Rinse the device with reservoir water.
2. Fill the collection vessel at the end of the net with reservoir water to provide weight.
3. Lower the net to the bottom of the sample column (1 meter from the bottom) in
such a manner so as to prevent the net from becoming inverted.
4. Slowly raise the net through the water column to the surface.
5. Rinse all organic matter from the net into the collection vessel using distilled water.
6. Pour the contents of the vessel into a stainless-steel composting bowl.
7. Repeat the sampling procedure two more times for a total of three sample
collections. 8. Pour the composites into the net to remove excess water. 9. Rinse the net contents into the collection vessel for a concentrated sample. 10. Transfer the sample to the required sample container prepared with the
appropriate alcohol preservative.
6.12 Visual Flow Measurements
Flow measurements are determined in the field using a tape measure, stopwatch, and a float. The float will be light enough to represent the current of the stream but not be influenced by air current. Flow measurements are taken after the collection of samples. Choose a section of streambed that uniformly matches one of the three area types: rectangular, inverted triangle, or semicircle. Measure the width and the depth of the streambed to the nearest 0.1 ft and apply it to one of the following formulas for a cross sectional area:
35
• Rectangular area = (width) X (depth)
• Triangular area = [(width) X (depth)]
• Semicircle area = (3.14 X depth) [note depth will be of the width]
Measure a section of streambed between two and six feet to the nearest foot. Start the float upstream from the measured section and time it as it flows through the measured section in the centroid of flow. Repeat the timing procedure three times to get an average value in seconds. Multiply the cross sectional area by the measured streambed length and divide by the average seconds to get a result in the units of cubic feet per second. Field-flow measurements are compared to any additional available flow data for the sampling site from sources such as the USGS, State of Colorado, or U.S. Army COE.
6.13 Field Measurements
Field measurements of indicator variables consist of dissolved oxygen (DO), Specific conductivity (SC), temperature, and pH. Measurements of DO and pH are recorded to the nearest 0.1 of the appropriate units; temperature is recorded to the nearest 0.5° C. Use, calibration, and maintenance procedures follow the manufacturer instructions. Field measurements are taken at the source whenever possible or from the holding container used for sample collection prior transferring the sample to the sample containers. All water quality meters are calibrated and proper function ensured prior to leaving for the field. Upon arriving at the first sample location the instrument is calibrated and the results documented on the field log.
6.14 Field QA/QC Samples
The goal of the QA/QC program is to ensure the accuracy, precision, completeness, representativeness, and comparability of sampling data. In order to document the consistency and accuracy of analytical data generated by the contract water-quality laboratory, one or more of the following QA/QC samples can be employed. The CWA QAPP/SAP defines which QA/QC samples are to be collected and the frequency of collection.
6.14.0. Field Duplicates
A double volume of water is collected and preserved at the appropriate sampling site. The sample is then divided into identical containers that are given different location identification names. Label sample collection time for the duplicate sample will be entered
36
as four letters (e.g., AAAA, BBBB, CCCC, XXXX, YYYY, ZZZZ). These are recorded in the field notes for future reference. Both samples are submitted to the laboratory for identical analyses. The laboratory is not advised of the duplication.
6.14.1. Field Blanks
A volume of commercially distilled water is taken to the field and placed in an identical sample container using the sampling techniques employed for standard sampling. The procedure for identifying duplicate samples above is followed for field blanks.
6.14.2. Equipment Blanks
Equipment blanks are prepared for metals-in-water samples whenever a new batch of filters is used or every tenth sample filtered (or collected for total metal analysis). Equipment blanks consist of a volume of commercially distilled water that is taken to the field and filtered and/or handled like a regular sample. The procedure for identifying duplicate samples above is followed for equipment blanks.
6.15 Sample Shipment, If Necessary
Samples going to labs outside the Denver-metro area are packed into plastic bags and placed in a DOT-compliant shipping container (e.g., cooler) with sufficient ice to maintain sample temperatures as close to 4° C as feasible for a 24-hour period. Void space within the container is filled with packing material to avoid shifting of the samples during transport. The completed, signed, and dated chain-of-custody (COC) is enclosed in a plastic bag and placed inside the container on top of the contents. Copies of the COC and the shipping bill are kept with the field notes. The container lid is closed and secured with two complete wraps of packaging tape. Labeling consists of directional labels on all four sides and fragile stickers and the shipping label on the lid of the container. The container is shipped overnight to the contracted lab using a commercial carrier (e.g., Federal Express). Samples going to labs in the Denver metro area are transported in a cooler on ice and delivered the same day as collection or secured in a refrigerator pending delivery. Currently , various laboratories are involved in the data analysis (Table 7)
Table 7 Samples Are Delivered To These Laboratories For Analyses.
37
Laboratory Location Analyses ACZ Laboratory, Inc. Steamboat Springs, CO All metals and non-metals chemistry Chadwick & Associates Littleton, CO Chlorophyll a, E. Coli CU Limnology Laboratory Boulder, CO Phytoplankton Plateau Ecosystems Wheat Ridge, CO Zooplankton
7.0 AUTHORITY REFERENCES
Chatfield Basin Authority 1995. Chatfield Basin Authority Funding Alternatives Review. Prepared for the Chatfield Basin Authority by Mulhern MRE, Inc., June 1994.
Chatfield Basin Authority 1995. Nonpoint Source Compliance Report: Summary of the Nonpoint Source Management Program for the Chatfield Sub-watershed. Prepared for the Chatfield Basin Authority by the Denver Regional Council of Governments, Denver, October 17, 22 p. Chatfield Basin Authority 1995. Project Specific Water Quality Monitoring Guidance. Prepared for the Chatfield Basin Authority by the Denver Regional Council of Governments, Denver, October 17, 10 p. Chatfield Basin Authority 1995. Chatfield Watershed Monitoring Program Standard Operating Procedures. Prepared for the Chatfield Basin Authority by the Denver Regional Council of Governments, Denver, October 17, 12 p. Chatfield Basin Authority 1995. Chatfield Watershed Project and Activity Database. Prepared for the Chatfield Basin Authority by the Denver Regional Council of Governments, Denver, October 25, 16 p. Chatfield Watershed Authority 1996. 1996 Chatfield Watershed Authority Annual Report. Prepared for the Chatfield Watershed Authority by the Denver Regional Council of Governments, Denver. Chatfield Watershed Authority 1997. Chatfield Watershed and Reservoir: 1986-1995 Historical Data Analysis and Monitoring Program Review. Prepared for the Chatfield Watershed Authority by the Denver Regional Council of Governments, Denver. 74 p. Chatfield Watershed Authority 1997. 1997 Water Quality Data Packet. Prepared for the Chatfield Watershed Authority by the Denver Regional Council of Governments, Denver. Chatfield Watershed Authority 1997. Chatfield Watershed Authority 5-year Nonpoint Source Program Priorities 1997-2003. Prepared for the Chatfield Watershed Authority by the Denver Regional Council of Governments, Denver. 8 p.
38
Chatfield Watershed Authority 1998. Chatfield Watershed Authority Long-Range Nonpoint Source Strategies 1998-2020. Prepared for the Chatfield Watershed Authority by the Denver Regional Council of Governments, Denver. 17 p. Chatfield Watershed Authority 1999. Chatfield Watershed Authority Annual Report. Prepared for the Chatfield Watershed Authority by the Denver Regional Council of Governments, Denver. Chatfield Watershed Authority 2000. Chatfield Watershed Authority Annual Report and Fact Sheet Series. Prepared for the Chatfield Watershed Authority by the Denver Regional Council of Governments, Denver. Chatfield Watershed Authority 2000. Water Quality Trading Guidelines. Chatfield Watershed Authority, April 18, 2000. Chatfield Watershed Authority 2001. Chatfield Watershed Authority Annual Report and Fact Sheet Series. Prepared for the Chatfield Watershed Authority by the Denver Regional Council of Governments, Denver. Chatfield Watershed Authority 2002. Chatfield Watershed Authority Bylaws. Adopted By Board On April 24, 2002
Chatfield Watershed Authority 2002. Chatfield Watershed Authority Annual Report and Fact Sheets. Prepared for the Chatfield Watershed Authority by RNC Consulting, Aurora, Colorado. Chatfield Watershed Authority 2003. 2003-2005 Chatfield Watershed Authority: Quality Assurance Project Plan (QAPP), Sampling and Analysis Plan (SAP) and Standard Operating Procedures (SOP) Version 2.0, January 1, 2003. Prepared for the Chatfield Watershed Authority by RNC Consulting, Aurora, Colorado. Chatfield Watershed Authority 2004. Wastewater Utility Plan Review Team and Submittal Requirements For Chatfield Technical Review Committee and Authority Board Actions. Prepared for the Chatfield Watershed Authority by RNC Consulting, Aurora, Colorado. DRCOG. 1984. Chatfield Reservoir Clean Lakes study. Denver Regional Council of Governments, Denver. 155p. DRCOG. 1988. Chatfield Basin Water Quality Study. Denver Regional Council of Governments, Denver. 104p. DRCOG. 1990. The Status of QUAL2e Modeling in the Denver Region. Denver Regional Council of Governments, Denver. 13p.
39
DRCOG. 1994. Clean Water Plan, Volume II. Denver Regional Council of Governments, Denver. 133 p. DRCOG. 1998. Metro Vision 2020: Clean Water Plan Policies, Assessments and Management Programs. Denver Regional Council of Governments, Denver. 185 p., April 15, 1998. Woodward-Clyde Consultants. 1992. Nonpoint Source Management Plan for Chatfield Reservoir.