Embed Size (px)
Citation preview
APRIL 2008
ir.orionworld.com
Ticker 001800KS

1
91.7% Orion Food Co.
100% Orion Food(S) Co.
100% Orion Snack Co.
100% Orion Food(G) Co.
100% Orion Food Rus Co.
100% Orion Food Vina Co.
ConfectionaryConfectionary
90.3% OCN
64.8% Badook TV
78.5% On Game
92.9% DigitalOnmedia
76.0% Donggu
65.3% Soosung
68.9% Youngdong
52.8% Dongbu
100.0% Orion Snack
57.5% Mediaplex
100.0% Sports ToTo Online
International
49.0% Beijing Zhongguan
63.2% Sports ToTo
88.8% Rise On
Megabox Cinema
2
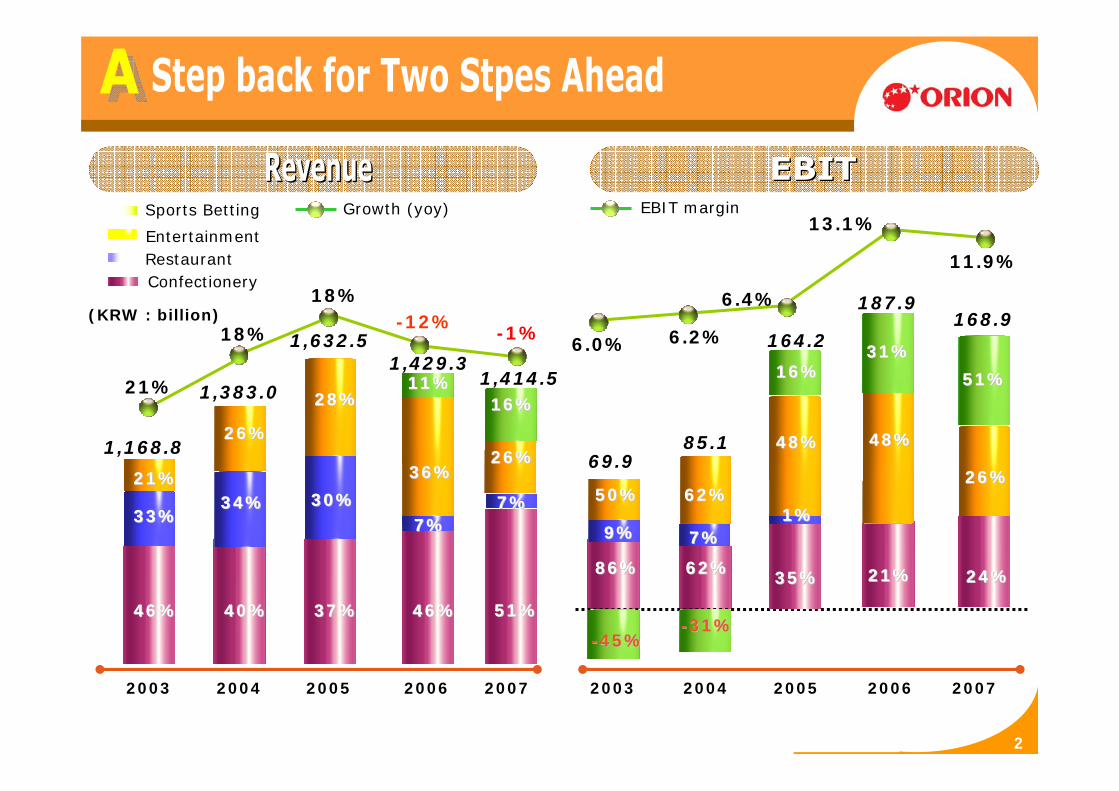
2003 2004 2005 2006
46%46% 40%40% 37%37% 46%46%
33%33%34%34%
21%21%30%30%
7%7%
26%26%
28%28%
36%36%
11%11%21%
18%
18%-12%
Sports Betting
EntertainmentRestaurantConfectionery
(KRW : billion)
1,168.8
1,383.0
1,632.51,429.3
2003 2004 2005 2006 2007
86%86% 62%62%
9%9% 7%7%
6.0%
69.9
--45%45%
50%50%
--31%31%
85.1
Growth (yoy)
62%62%
35%35%
164.2
1%1%
48%48%
16%16%
21%21%
187.9
48%48%
31%31%
13.1%
2007
51%51%
7%7%
26%26%
16%16%1,414.5
-1%
21%21%
168.9
26%26%
51%51%
24%24%
EBIT margin
6.2%
6.4%
11.9%

3Production Base
4 Geographies 60 countries12 Production bases
KoreaGreater China
Russia (CIS, East Europe)Vietnam (Southeast Asia)
2003 2004 2005 2006
90%90% 88%88% 82%82%
10%10% 12%12%
18%18%
7%4%
10%
Overseas
Local
(KRW : billion)
537.0557.4
612.8
Growth (yoy)
78%78%
22%22%
8%
661.9
2007
71%71%
29%29%
9%
719.3
513.0 512.1502.9488.1482.0

4
16.3%16.3%
27.0%27.0%
16.5%16.5%
40.2%40.2% 2007
CROWN
LOTTEORION
HAITAI
ORION27.1%
28.1%
25.3%26.1%
2003 2004 2005 2006 2007
27.0%
40.1%
LOTTE40.3%39.7% 40.2%40.0%
2003 2004 2005 2006
1,838
1,9061,871
3.7% -1.8%
Growth (yoy)
(KRW : billion)
1,865
-0.3%
1,826
-1.9%
1,893
2007
Biscuit
Snack
Gum
Pie
Choco
Candy
3.7%
5
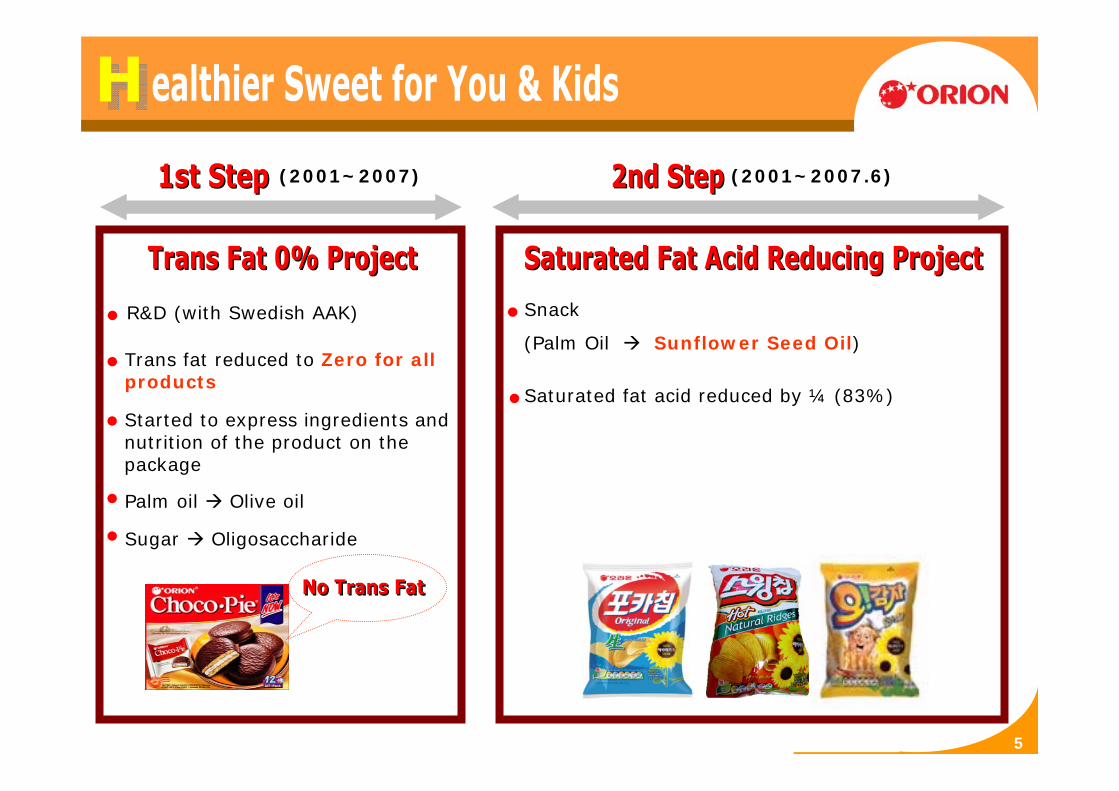
R&D (with Swedish AAK)
Trans fat reduced to Zero for all products
Snack
(Palm Oil Sunflower Seed Oil)
(2001~2007) (2001~2007.6)
Started to express ingredients and nutrition of the product on the package
Saturated fat acid reduced by ¼ (83%)
Palm oil Olive oil
Sugar Oligosaccharide

6
Launching 4 healthy Energy Bars
Improving existing products healthier
MSG Artificial Color
Food Preservative
NO NO NO
Calcium Protein Iron DHA Fiber Collagen Whole Grain
CPF Balance
arbohydrate 65%
at 20%
rotein 15%
R&D (with Seoul University, Dr. Tae Woo, You)
High Protein Bar (Soy Bean)
Cereal Bar (99 Kcal)
- 120Kcal, Chia Seed which is good for diet
- Low cal product with vitamin, fiber and mineral
- 100% Whole Grain cake coated with dark chocolateAdopting Green Package system
(environment friendly – bean oil)
Dark Chocolate Cake
Rice Bar
(2001~2008)
- 100% organic rice base bar

7
1997 1998 1999
Operating Profit Margin
Gross Profit Margin
1999 2000 2001 2002
452.7455.7
479.2
528.9
(KRW:billion won )
12%40.7%
38.1%
11%
7%
38.4%
147.4
106.2
142.3
100.7
151.6
110.8
150.6
110.3
0.7%
5.2%
10.4%Growth (%, yoy)
SalesManufacturing CostsMaterial Costs

8
2004 2005 2006 2007
(KRW:billion won )
ChinaRussia
2003
51%
25%
24%
54.8
48%
26%
35%
68.9
53%
25%
22%
109.5
58%
23%
19%
147.9
58%
19%
22%
Vietnam etc207.2
CAGR : 41%
Orion Food G Company (Gwangzau)
Orion Food Company (Beijing)
Orion Food Russia (Moscow)
Orion Snack Company (Beijing)
Orion Food S Company (Shanghai)
Orion Food Vina Company(Hochimin)

9
BeijingQingdao
ShanghaiGuangzou
City Agents
2002004 4 85 12185 121
20052005 150 200150 200
20062006 230230 285285
20072007 350350 340340
2003 2004 2005 2006 2007
53.3
55%
45%
ExportLocal
52%
48%
63.9
94.7
61%
39%
71%
29%
122.5
79%
20%
153.6
CAGR : 43%
122.1
86.5
58.033.229.3
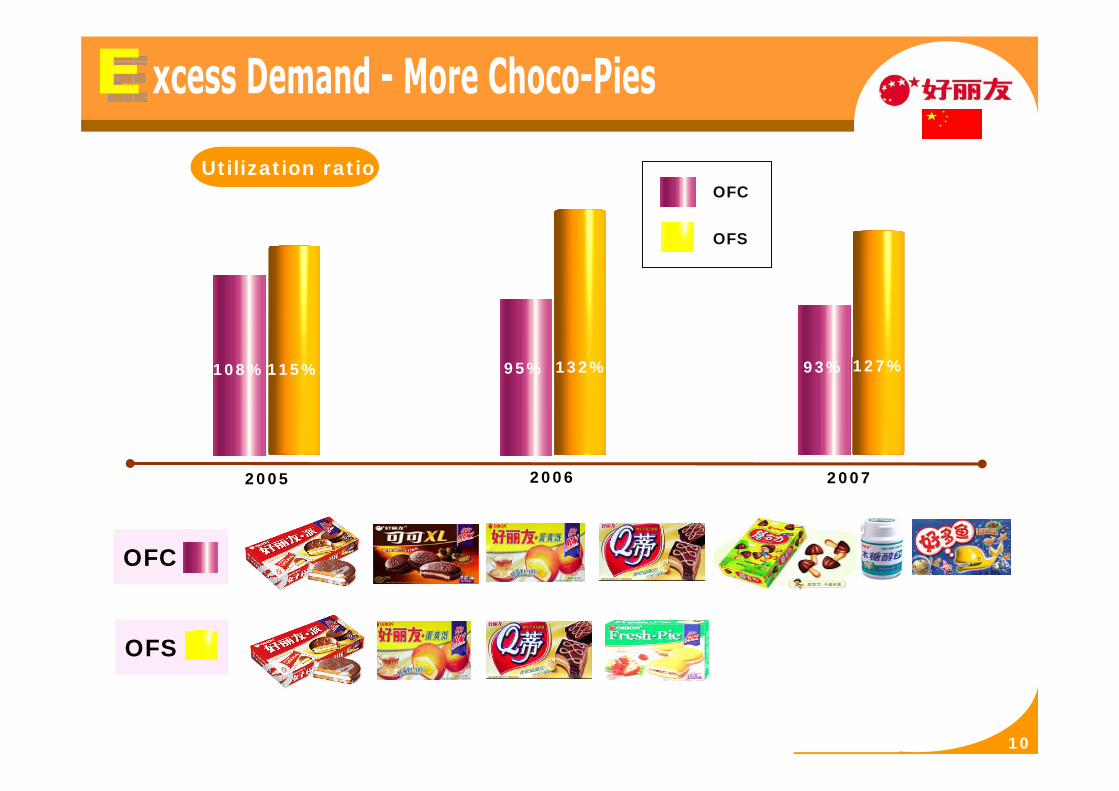
2005 2006 2007
108%115% 95% 132% 93% 127%
OFC
OFS
OFC
OFS
10
Utilization ratio

11
• No.1 Brand recognition for the last
5 years (CCTV/People’s Daily)
• Pie Market Share 60%
• 300 mn pieces
• OFC (Beijing) / OFS (Shanghai)
OSC (Beijing) / OFG (Gwangzau)
• Only selling on cash (NO A/R)
Brand Recognition
Market Share
Numbers of ChocopieSold per a year
Production localization
Bargaining power

12
2003 2004 2005 2006 2007
OFR
Local
13.4
1.9
17.8
27.2
5.7
33.3
17.5
38.8
29.0
IRK●
KRY●
★●
ROS
NOV
KRS EKA
★
SPB
MOSZveni
TverITverII4 trn Market
2 trn Market ★
★
8 trn Market
VLD★Kazakhstan
Ukraina
Ural mountains
CAGR : 30%
★SAM
●

13
HANOI
DANANG
DALAT
HO-CHI-MIN
* * Age Group under 25 accounts for 50% its populationAge Group under 25 accounts for 50% its population
2003 2004 2005 2006 2007
OFVLocal
4.2
1.4
6.9
26.8
8.6
5.2
16.6
CAGR : 41%

14
77.149.611.1-13.0 -40.4Net Profits
77.149.611.1-13.0 -40.4RecurringProfits
86.758.125.7-24.6-31.6Operating Profits
229.7164.290.0 18.0 0.1Sales
1,325.2912.1457.2138.828.3Bet Size
20072006KRWbillion 2003 2004 2005
28.5%
35.4%37.7%OPM
Pools Betting
Fixed Odds
Products
Deregulated twice
1st, 2nd DeregulationsMore Sports Added (2 6, International Events)
Increase in # of Rounds (90 1000)
Fixed Odds Game
-136.7%
-31,600%
TOTO
PROTO


![Oxitec Overview 2008 V3 Portuguese (Pdf) [Modo De Compatibilidade]](https://img.pdfslide.net/doc/110x75/55a28e471a28ab09588b46e1/oxitec-overview-2008-v3-portuguese-pdf-modo-de-compatibilidade.jpg)