Embed Size (px)
Citation preview
U.S. Department of Education
Cover Sheet Type of School(Check all that apply)
Public PrivateX
MIddleElementaryX High K-12Charter Title I Magnet Choice
Mr. Stephen Dinger Name of Principal(Specify: Ms., Miss, Mrs., Dr., Mr., Other) (As it should appear in the official records)
Official School Name St. John's Lutheran School(As it should appear in the official records)
School Mailing Address 4500 Buena Vista Road (If address is P.O. Box, also include street address.)
City Zip Code+4(9 digits total)State
Bakersfield California 93311-9702
County Kern State School Code Number* 6928998
Telephone (661) 664-8090 Fax (661) 664-1327
Web site/URL www.sjlschool.org E-mail [email protected]
I have reviewed the information in this application, including the eligibility requirements on page 3, and certify that to the best of my knowledge all information is accurate.
Principal's Signature
Date
Name of Superintendent Mr. Stephen Dinger(Specify: Ms., Miss, Mrs., Dr., Mr., Other)
District Name CNH District of Lutheran Church - Missouri S Tel. (925) 245-4000
I have reviewed the information in this application, including the eligibility requirements on page 3, and certify that to the best of my knowledge all information is accurate.
(Superintendent’s Signature)
Date
Name of School Board President/Chairperson Mr. John Bianchi
(Specify: Ms., Miss, Mrs., Dr., Mr., Other)
I have reviewed the information in this application, including the eligibility requirements on page 3, and certify that to the best of my knowledge all information is accurate.
(School Board President’s/Chairperson’s Signature)
Date
*Private Schools: If the information requested is not applicable, write N/A in the space.Mail by commercial carrier (FedEx, UPS) or courier original signed cover sheet to Aba Kumi, Director, NCLB-Blue Ribbon Schools Program, US Department of Education, 400 Maryland Avenue, SW, Room 5E103, Washington DC 20202-8173.
2008 No Child Left Behind–Blue Ribbon Schools Program
NCLB-BRS (2008) Page 1 of 28
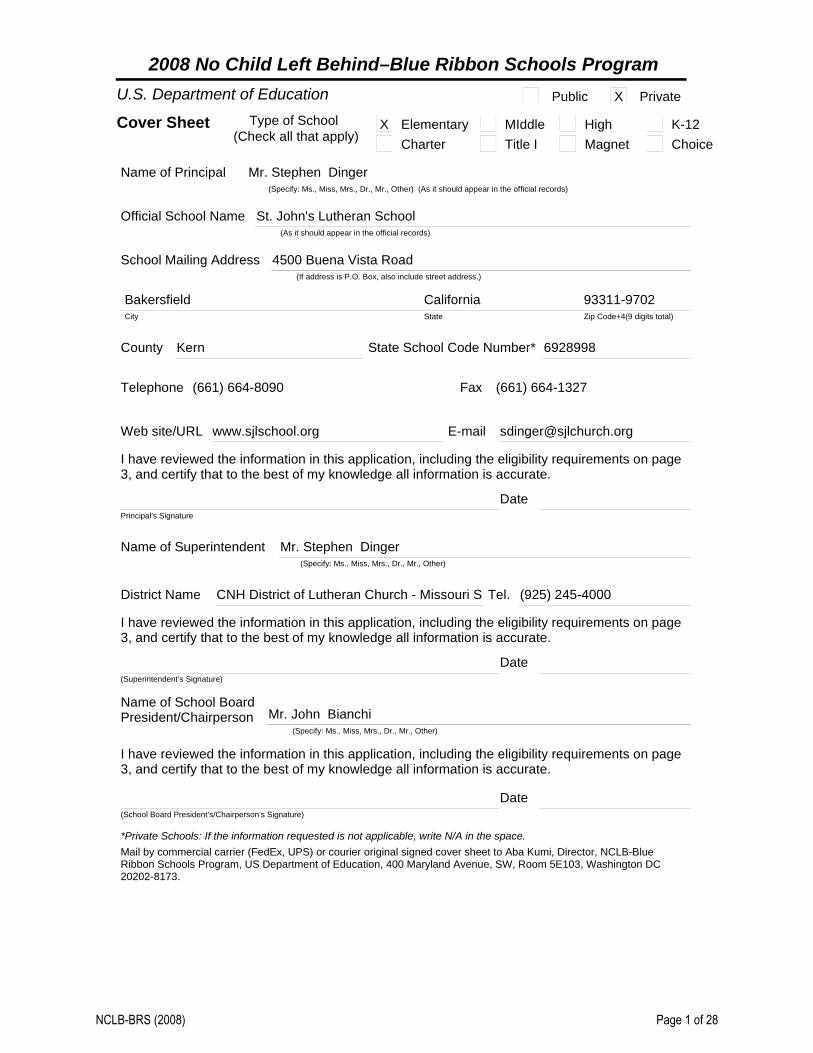
PART I - ELIGIBILITY CERTIFICATIONInclude this page in the school’s application as page 2.
The signatures on the first page of this application certify that each of the statements below concerning the school’s eligibility and compliance with U.S. Department of Education, Office for Civil Rights (OCR) requirements is true and correct.
1. The school has some configuration that includes grades K-12. (Schools on the same campus with one principal, even K-12 schools, must apply as an entire school.)
The school has made adequate yearly progress each year for the past two years and has not been identified by the state as “persistently dangerous” within the last two years. To meet final eligibility, the school must meet the state’s adequate yearly progress requirement in the 2007-2008 school year.
If the school includes grades 7 or higher, the school must have foreign language as a part of its core curriculum.
The school has been in existence for five full years, that is, from at least September 2002 and has not received the No Child Left Behind–Blue Ribbon Schools award in the past five years.
The nominated school or district is not refusing OCR access to information necessary to investigate a civil rights complaint or to conduct a district wide compliance review.
OCR has not issued a violation letter of findings to the school district concluding that the nominated school or the district as a whole has violated one or more of the civil rights statutes. A violation letter of findings will not be considered outstanding if OCR has accepted a corrective action plan from the district to remedy the violation.
The U.S. Department of Justice does not have a pending suit alleging that the nominated school or the school district as a whole has violated one or more of the civil rights statutes or the Constitution’s equal protection clause.
There are no findings of violations of the Individuals with Disabilities Education Act in a U.S. Department of Education monitoring report that apply to the school or school district in question; or if there are such findings, the state or district has corrected, or agreed to correct, the findings.
2.
3.
4.
5.
6.
7.
8.
NCLB-BRS (2008) Page 2 of 28
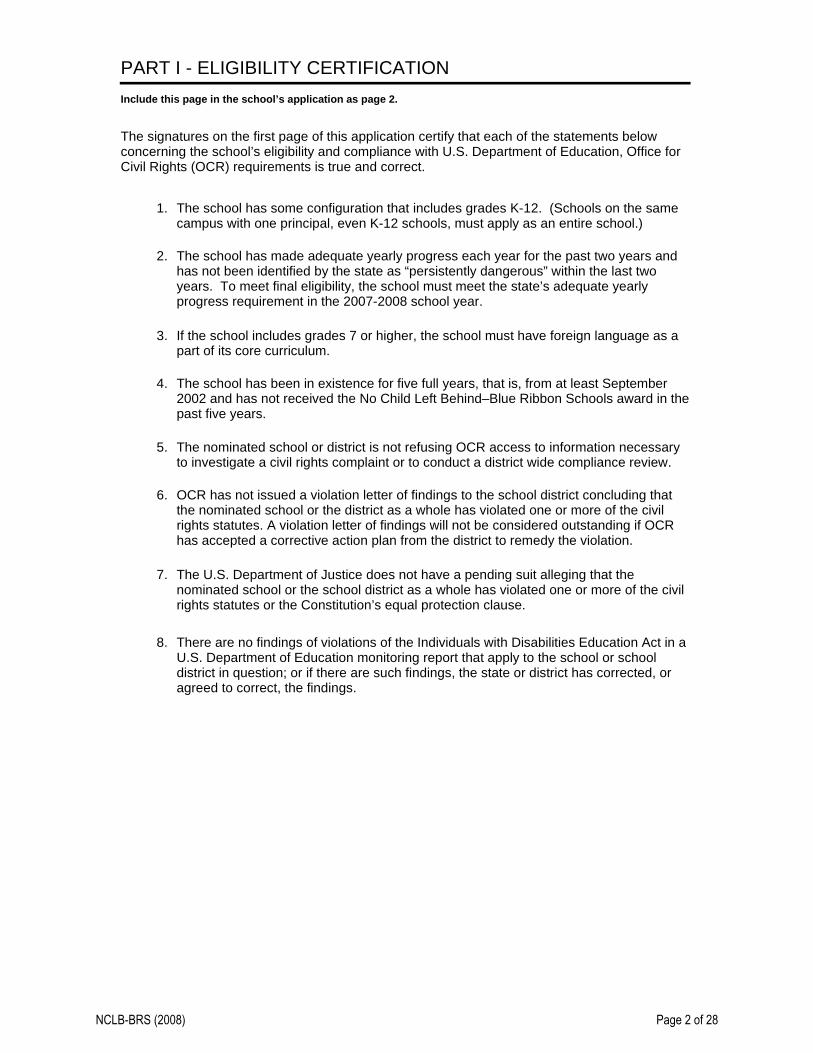
PART II - DEMOGRAPHIC DATA
All data are the most recent year available. Throughout the document, round numbers to the nearest whole number to avoid decimals, except for numbers below 1, which should be rounded to the nearest tenth.
DISTRICT (Question 1-2 not applicable to private schools)
1. Number of schools in the district: Elementary schools
Middle schools
Junior High Schools
High schools
Other
TOTAL0
District Per Pupil Expenditure:2.
Average State Per Pupil Expenditure:
SCHOOL (To be completed by all schools)
3.
Small city or town in a rural area[ ]
Urban or large central city[ ]Suburban school with characteristics typical of an urban are[ ]Suburban[ X ]
Rural[ ]
Number of years the principal has been in her/his position at this school.34.
If fewer than three years, how long was the previous principal at this school?5
Category that best describes the area where the school is located:
5. Number of students as of October 1 enrolled at each grade level or its equivalent in applying school only:
Grade # of Males
# of Females
Grade Total
Pre KK123456
e Grade # of Males
# of Females
Grade Total
789101112
Other
TOTAL STUDENTS IN THE APPLYING SCHOOL
025 20 4514 26 4018 18 3614 13 278 18 2611 14 2510 12 22
13 14 2710 12 22
00000
270
NCLB-BRS (2008) Page 3 of 28
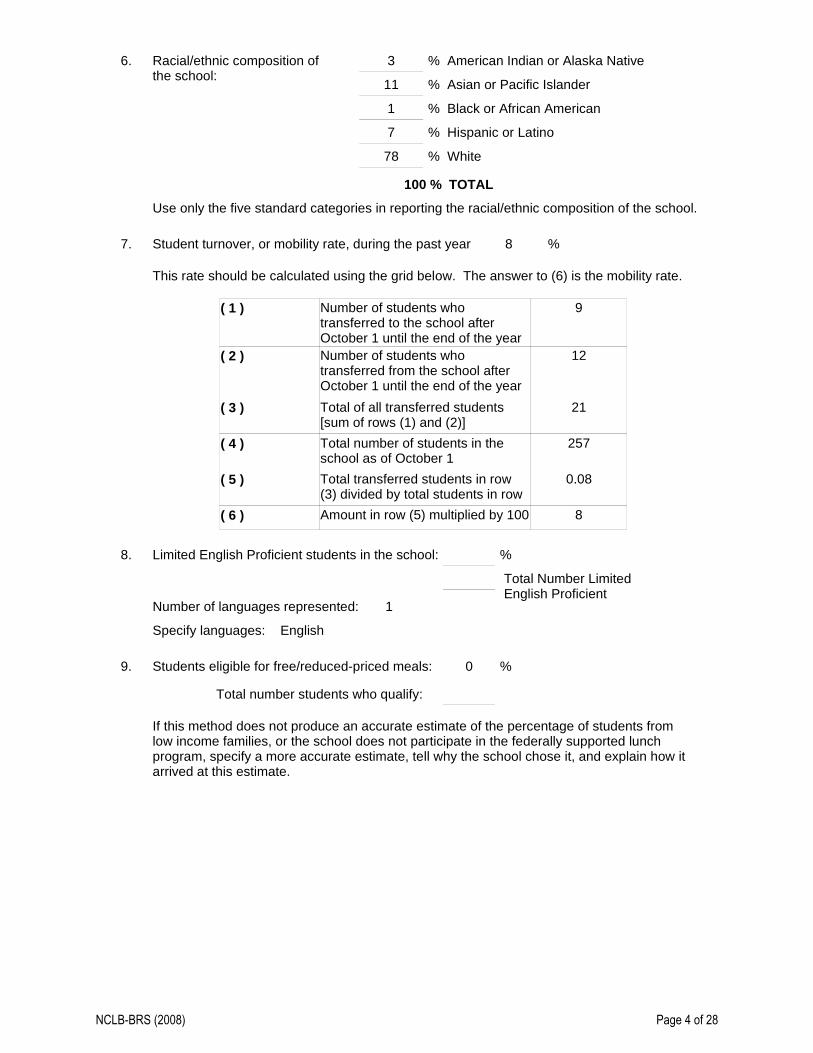
6. Racial/ethnic composition of the school: % Asian or Pacific Islander11
% Black or African American1
% American Indian or Alaska Native3
% Hispanic or Latino7
% White78
100 % TOTAL
Use only the five standard categories in reporting the racial/ethnic composition of the school.
Student turnover, or mobility rate, during the past year 87. %
This rate should be calculated using the grid below. The answer to (6) is the mobility rate.
Number of students who transferred to the school after October 1 until the end of the yearNumber of students who transferred from the school after October 1 until the end of the yearTotal of all transferred students [sum of rows (1) and (2)]Total number of students in the school as of October 1 Total transferred students in row (3) divided by total students in row Amount in row (5) multiplied by 100
( 1 )
( 2 )
( 3 )
( 4 )
( 5 )
( 6 )
9
12
257
8
21
0.08
8. Limited English Proficient students in the school: %
Total Number Limited English Proficient
Number of languages represented: 1
Specify languages: English
9. Students eligible for free/reduced-priced meals: 0 %
Total number students who qualify:
If this method does not produce an accurate estimate of the percentage of students from low income families, or the school does not participate in the federally supported lunch program, specify a more accurate estimate, tell why the school chose it, and explain how it arrived at this estimate.
NCLB-BRS (2008) Page 4 of 28
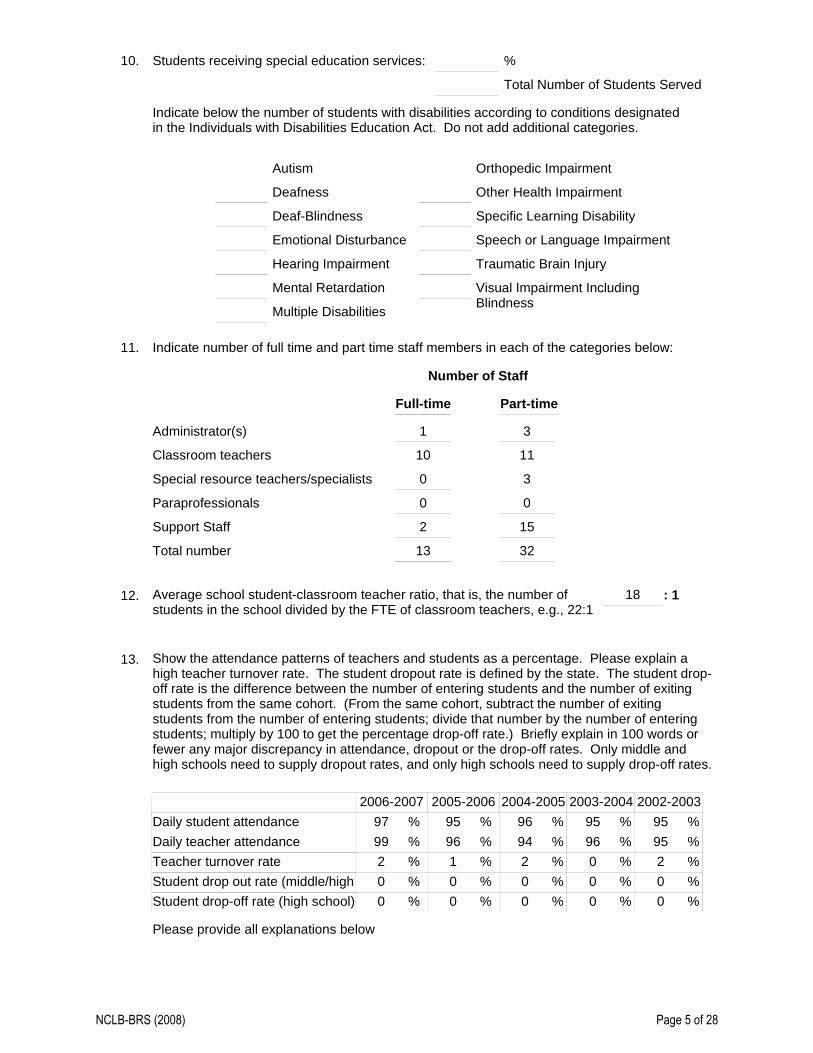
10. Students receiving special education services: %
Total Number of Students Served
Indicate below the number of students with disabilities according to conditions designated in the Individuals with Disabilities Education Act. Do not add additional categories.
Autism
Deafness
Deaf-Blindness
Emotional Disturbance
Hearing Impairment
Mental Retardation
Multiple Disabilities
Orthopedic Impairment
Other Health Impairment
Specific Learning Disability
Speech or Language Impairment
Traumatic Brain Injury
Visual Impairment Including Blindness
11. Indicate number of full time and part time staff members in each of the categories below:
Administrator(s) 1
Full-time
Classroom teachers 10
Special resource teachers/specialists 0
Paraprofessionals 0
Support Staff 2
Total number 13
3
Part-time
11
3
0
15
32
Number of Staff
12. Average school student-classroom teacher ratio, that is, the number of students in the school divided by the FTE of classroom teachers, e.g., 22:1
18 : 1
13. Show the attendance patterns of teachers and students as a percentage. Please explain a high teacher turnover rate. The student dropout rate is defined by the state. The student drop-off rate is the difference between the number of entering students and the number of exiting students from the same cohort. (From the same cohort, subtract the number of exiting students from the number of entering students; divide that number by the number of entering students; multiply by 100 to get the percentage drop-off rate.) Briefly explain in 100 words or fewer any major discrepancy in attendance, dropout or the drop-off rates. Only middle and high schools need to supply dropout rates, and only high schools need to supply drop-off rates.
2006-2007 2005-2006 2004-2005 2003-2004 2002-2003Daily student attendanceDaily teacher attendanceTeacher turnover rateStudent drop out rate (middle/highStudent drop-off rate (high school)
97 %99 %2 %0 %0 %
95 %96 %1 %0 %0 %
96 %94 %2 %0 %0 %
95 %96 %0 %0 %0 %
95 %95 %2 %0 %0 %
Please provide all explanations below
NCLB-BRS (2008) Page 5 of 28
PART III - SUMMARY
St. John's Lutheran School (SJLS) has a rich history and a vibrant future. SJLS was initially estthe 1940's to formally educate the children of St. John's Lutheran Church academically and spiSJLS was initially located in the heart of Bakersfield and has moved twice as the city, congregaschool grew. The community has positively responded, making SJLS one of the largest Christeducational systems in Bakersfield.
The school's mission statement is: 'That all may know Jesus, St. John's Lutheran School standfamily in shaping lives through nurturing each child with a strong academic and Christ-centerededucation'. Education at SJLS hinges on a strong relationship with the student and his/her famTeachers strive to create this relationship early on by visiting each student in his/her home befoday of school.
Regular communication occurs through weekly newsletters, web information, and conferences.work to maintain a warm and inviting classroom environment and welcome parent help in the clThe school administration also values and encourages high parental involvement through volunsoliciting feedback and involving them in task forces that provide direct opportunities for parent participation and partnership. Parents have also responded heartily to SJLS with their time andfinancial support.
SJLS endeavors to offer a premiere education to the Bakersfield community. SJLS seeks curriis exciting and challenging. Adopting the Core Knowledge Curriculum in 1998 was a major stepend. In the past two years the school has added and expanded programs such as Spanish, TeArt, PE and Music to all grades. SJLS seeks educators who are superior in their field. The teahas an average of 15 years of experience and over half hold a Master's Degree. The Western Aof Schools and Colleges and the National Lutheran School Accreditation Association accredit S
Students at SJLS enjoy a full day of learning that occurs in and out of the classroom. As a meanurturing the younger students, and providing leadership and role model experiences for the oldstudents, SJLS has created cross-age activities. The 'Chapel Buddy Program' teams a SeventhGrade student with a Kindergarten student for the weekly chapel service. They sit together andstudent helps the younger one to be involved in worship. The 'Reading Buddy Program' teams students with Kindergarten students for weekly shared reading. The Valley Achievement PeerProgram is an off-campus bi-weekly program in which SJLS upper grade students travel to VallAchievement Center, a school for autistic children. SJLS students are paired with children fromthey engage in a variety of activities together.
Each year the Eighth Graders leave campus for several days to tour the state capital in Sacramthen go to San Francisco. The Sixth Graders spend a week at Camp K.E.E.P (Kern EnvironmeEducation Program). This is an outdoor education program. Fifth Grade students spend three dTejon. Here the students reenact fort life as it was in the 1860's. These types of activities rewastudents with hands-on learning as they grow in their knowledge of history, government and sc
Many graduates of SJLS have gone on into community high schools to become leaders scholaswell as in other areas of high school life. A recent survey of 62 graduates of SJLS found that of respondents, all have been enrolled in college preparatory classes and many have taken GATEand Advanced Placement classes. It is very common to have an SJLS graduate as a valedictorarea's many high schools.
NCLB-BRS (2008) Page 6 of 28
PART IV - INDICATORS OF ACADEMIC SUCCESS
1. Assessment Results:
SJLS utilizes the Iowa Test of Basic Skills (ITBS) standardized tests each year to assess the achof its students and to determine how its students rank nationally. In the spring, achievement testadministered to all students in Grades One through Eight, and ability tests are administered to stGrades One, Three, Five, and Seven. The ITBS allows SJLS to norm reference its scores with oLutheran schools in Southern California and with schools nationwide. Over the past three years students have scored, on average, two grade equivalents higher than their peers. They have alsthe 90th percentile nationwide on a consistent basis.
These comparisons give SJLS points of reference. They indicate that SJLS students are amongtier of students across the nation, and they are also achieving at a high level when compared to osimilar private school students. This information is very valuable. Since Bakersfield is tied to theindustry, it is a highly transient community. Each school year new students are added to classes transfer out from across the country and world. This mobility can have a significant impact on clacomposition and resulting test scores. It also has an effect on the curricular decisions of SJLS. Tcurricula must be chosen to accommodate its mobile community. One way to measure if the cureffective is through standardized test scores.
The 2007 ITBS scores reveal that of all eight grades tested, six scored above the 90th percentileindicating that on average those students are performing above 90% of their peers nationwide. Tgrades that did not score in the 90th percentile are within two and five points of it. This indicatesaverage, these scores are at the top ranks of schools nationwide. Both grades did experience a usual influx of new students which may explain these test scores.
The 2007 math scores are much higher. Seven of the eight grades scored well within the 90th pwith one grade missing the 90th percentile by one point. Again, these scores indicate that SJLS are receiving a strong education in mathematics instruction at every level.
Although standardized test scores are valuable and objective indicators of academic success thethe sole indicator. The daily interactions of student and teachers along with quarterly reports formcomplete picture of a student's success. The students benefit from a strong curriculum, involvedand dedicated teachers. These three components are important for academic success. The testcan be viewed as results of these components indicating that SJLS students can be proud of theachievements.
2. Using Assessment Results:SJLS finds valuable information in the results that the assessments produce for both individual sand for the school as a whole. They are:
Identifying individual student's strengths and weaknesses Identifying individual student's growth compared to previous year's scores Identifying individual teacher's strengths and weaknessesIdentifying strengths and weaknesses in content areasIdentifying curricular areas that need re-evaluation
This information, when compared to past years' test results, can help parents and teachers strateto encourage and support students. Identifying a student's strength areas may result in advanceplacement. Conversely, student weaknesses may result in further assessment for additional edusupport or possible grade retention. Teachers are also able to recognize areas of teaching strenweakness. Teachers who exhibit strengths in certain curricular areas can be utilized as mentors
The faculty reviews test data in light of curricular decisions. If there is a trend of weakness in a sthe corresponding curricular materials are reviewed. One example follows. The spelling scores students were consistently low some years ago. The faculty formed a committee to review the cuspelling materials. This group recommended replacing the materials with more effective instrumefaculty also analyzed its current teaching of spelling and resolved to implement a variety of stratedeliver the material to the students. The result has been that spelling scores are increasing.
NCLB-BRS (2008) Page 7 of 28
3. Communicating Assessment Results:
Communicating the achievements of students is a top priority at SJLS and it is shared in a varietBeginning at the home visit prior to school, teachers keep students and their families informed ostudent and classroom expectations, topics of study and homework. Weekly newsletters are sewith the student and are also posted on the teacher's link on the school's web site. The principaproduces a bimonthly newsletter that highlights school-related activities and topics.
At the end of each quarter a report card for each student is produced and delivered to parents. hold conferences with all students and parents after the first and third quarters. Teachers are alavailable to confer at other times upon a parent's request. At these conferences, parents, studeteachers discuss student strengths as well as areas that need attention. Strategies for improvemimplementation of those strategies are suggested and planned at that time. Teachers also use leways of informing parents of a student's achievements. Phone calls to the home, written notes aconversations are also methods used.
The ITBS tests results are received after the school year has ended. Individual student test resumailed to their families, along with a cover letter that overviews the scores for the student and thParents are encouraged to direct any specific questions about results to the classroom teacher. results are given to teachers. Results are shared at faculty meetings and with the school adviso
4. Sharing Success:
SJLS is affiliated with the Lutheran Church ' Missouri Synod (LC-MS) and its local California-NevHawaii District. As such, it is affiliated with one of the largest Protestant school systems in the UStates. District school administrators meet six times per year to share information about each scas events and successes. Teachers in the district schools also gather twice a year for professiodevelopment where schools share their successes.
SJLS benefits from a good relationship with the Panama Buena Vista School District (PBVSD), opublic school district. This relationship has been cultivated over the years. SJLS teachers have invited to participate in staff development that the public school has hosted. SJLS's principal keeregular contact with the administrators of the PBVSD as well. Currently, SJLS is benefiting fromrelationship, as it has been included in a $250,000 Safe School's grant awarded to PBVSD.
SJLS also publishes a brochure that is given to those who are seeking information for enrollmenpurposes. This information is available on the school's website. This brochure identifies the scmission, objectives, curriculum, as well as its achievements.
SJLS is fully accredited by the Western Association of Schools and Colleges (WASC), most recerenewed in 2007. In addition, SJLS is one of only 500 schools in the United States accredited virigorous National Lutheran School Accreditation (NLSA) process.
NCLB-BRS (2008) Page 8 of 28
PART V - CURRICULUM AND INSTRUCTION
1. Curriculum:
SJLS provides a challenging curriculum for its thriving students. The curriculum is established by thand Superintendent and is aligned with the Core Knowledge Curriculum and the California State Dof Education Standards. In keeping with the mission of the school, teachers relate instruction and their faith life.
Core Knowledge is a sequenced, content-based curriculum that is outlined for each grade level in tof language arts, mathematics, history, geography, science and fine arts. This sequence provides foundation of learning at each grade level that builds on itself from year to year. The strength of thcurriculum is that it offers each grade level a plan of learning that avoids repetition or gaps in learnbegan introducing parts of the Core Knowledge sequence with Science, History and Geography in subsequent years the Language Arts, Mathematics and Fine Arts components were added.
Religion: Instruction includes daily devotions, weekly Chapel, Bible Study, church history, Scriptureand basic Christian doctrine.
Language Arts: Reading, Phonics, Grammar, Spelling, Literature, Writing, and Oral Language are components of Language Arts instruction.
Mathematics: Instruction includes number sense, fact practice, pre-algebra, algebra, and geometryInstruction is activity-based and teacher led. Saxon Math is a program that promotes student mastaught throughout the grades.
Social Studies: Students are taught geography, history, citizenship, constitution, and current eventslevels. Science: Instruction throughout the grade level includes concepts in Life Science, Earth Science, aPhysical Science.
Fine Arts: Both performing and visual arts are taught to all grades. The Art teacher provides instruca week familiarizing the students with various media and art appreciation. The Band instructor giveindividual and group lessons. Students receive choral music instruction weekly as well as Music appreciation. Music instruction is delivered both by the classroom teacher and the Music Teacher. also many opportunities throughout the year for performance in the areas of Art, Music and Drama
Physical Education: Students receive Physical Education twice a week. The P.E. program focuseflexibility, endurance and frequency to provide better physical health. Foreign Language: Spanish is taught twice a week in all grades. Conversation and basic vocabulaprimary focus. This foreign language curriculum meets the requirements of the NCLB-BRS progra
Technology: All students receive Technology instruction twice a week, allowing students to improvskills through age-appropriate and creative lessons. SJLS has a Computer Lab equipped with 28 cEach lab computer is equipped with software that offers keyboarding skills. In addition, each classrequipped with one computer.
2a. (Elementary Schools) Reading:
SJLS faculty, administration and parents recognize the foundational importance of reading. The facstrives to instill the love of reading as a lifelong skill for all children beginning in Kindergarten. The program at SJLS is developed from the Core Knowledge Sequence. One of the recommended reading programs that works well with the Core Knowledge Curriculum isOpen Court Reading program. It is a basal reading program that upholds solid instruction in compdecoding, application, and writing. Open Court is utilized in Kindergarten through Third Grades. Ereading unit consists of three parts. Part one includes phonemic awareness, sounds and letters, fland word knowledge. The second part of the unit stresses reading comprehension and applicatioliterature selections. The third part of the lesson focuses on other areas of language such as gramwriting process, vocabulary and spelling.
NCLB-BRS (2008) Page 9 of 28
The reading program in grades Four through Eight is literature-based. Writing, grammar and usagtaught through the literature selections that are outlined in the Core Knowledge Sequence. Studentgiven many opportunities to engage in expository and imaginative writing as they prepare book repessays. They are taught research methods utilizing a variety of sources such as encyclopedias, mand on-line sources.
All students study a variety of literature recommended in the Core Knowledge Sequence including nonfiction, drama, poetry, short stories, novels, essays, speeches, sayings, phrases, and commonforeign phrases. Supplemental materials are used to teach spelling (A Reason for Spelling), handwReason for Handwriting), and grammar (The Shurley Method of English). The Third through Eighthstudents prepare literary pieces for the Kern County Oral Language competition. Students in Gradethrough Eight also compete in the county spelling bee. The school's library seeks to supplement creading materials with acquisitions reflective of the Core Knowledge curriculum.
3. Additional Curriculum Area:
Another aspect of becoming literate is the understanding of English grammar and writing techniqueStudents are taught from First Grade through Eighth Grade at SJLS through the Shurley Method ofThis is a curriculum that utilizes repetition to learn the components of English grammar and parts ofBecause each lesson has components of 'see, hear, say, and do', The Shurley Method of English needs of a wide variety of learning styles.
Beginning in First Grade students start learning catchy jingles that help them remember the variousspeech. Each part of speech is then examined as to its role in a complete sentence. For example,begin examining simple sentences (Subject ' Verb) but quickly become adept at more complex senstructures, as they advance in grade levels, which include Article Adjectives, Adjectives, Subject NoVerbs, Adverbs, Prepositions and Objects of Prepositions. Identifying these parts of speech and thin sentences is taught in all grades through a scripted group of questions and answers performed inby the entire class and led by the teacher. Parts of speech are labeled, and even the most complexsentence structures are readily analyzed.
Having learned sentence structure, students are equipped with a strong foundation as they participwriting process. Students become confident writers who are more explicit and skillful. This succesincreased self-esteem and confidence not only in English but also in other subject areas.
4. Instructional Methods:
St. John's teaching staff is dedicated to designing lessons that will deliver age-appropriate instructstudents so that each one is able to develop his/her unique strengths and abilities. In order to achoutcome for every student, the following methods of teaching are applied:
Direct Instruction: This method is usually deductive and includes lecture, drill, demonstrations, andquestioning. Teachers of upper grade students more commonly use, but are not restricted to, direcinstruction. Indirect Instruction: This instructional method is more student-centered and activity-based. Studeengaged in discussions, investigations, observations, problem solving, data acquisition and the forof ideas as they regularly work in collaborative groups. These activities are very widely employed lower grades where an emphasis on kinesthetic learning is vital.
SJLS teachers understand the importance of knowing the learning needs of their students. They rdevote time at faculty meetings to the discussion of improved instruction. Early in the school yearattempt to identify the learning styles of their students: whether they are visual, auditory, or tactile/kinesthetic. Additionally SJLS teachers have recently learned to recognize student preferendefined by the Myers-Briggs Type Indicator (extravert/introvert, sensor/intuitor, thinker/feeler, or judger/perceiver). Thinking of students in these terms helps teachers modulate their instruction to effective.
5. Professional Development:
SJLS faculty, administration, and parents consider professional development to be fundamental forimprovement of teacher effectiveness and student learning. Teachers need to stay current in skills
NCLB-BRS (2008) Page 10 of 28
knowledge and implementation of effective teaching strategies. To support these beliefs, a ProfessDevelopment Plan has been adopted.
SJLS teachers meet twice a month to discuss professional growth topics. One week a month they the book Five Dysfunctions of a Team by Patrick M. Lencioni. Another week a month they discussGreat Teachers Do Differently: Fourteen Things That Matter Most by Todd Whitaker. At each of thdiscussions, the faculty is led to examine the individual role of a teacher and his/her practices as a professional. These are very inspiring meetings and over the past years have been instrumental indeveloping a strong professional educational team.
Yearly the entire teaching staff of SJLS attends a three-day conference hosted by either the CaliforNevada-Hawaii District of the Lutheran Church ' Missouri Synod or the California Association of PriSchools Organization (CAPSO). These conferences include workshops and all-group sessions witnationally renowned speakers. These conferences are motivational as teachers return to their claswith new ideas and a renewed sense of purpose.
SJLS teachers are also given the opportunity to take part in additional conferences and workshopschoice. The school's budget allows for conference fees to be reimbursed to the teacher as well as expenses.
SJLS teachers are encouraged to observe in their peer's classrooms, within SJLS as well as in claoff-site. SJLS encourages advanced education by reimbursing teachers for a portion of tuition and fees. When a teacher has successfully completed an advanced degree his/her salary is increased
NCLB-BRS (2008) Page 11 of 28
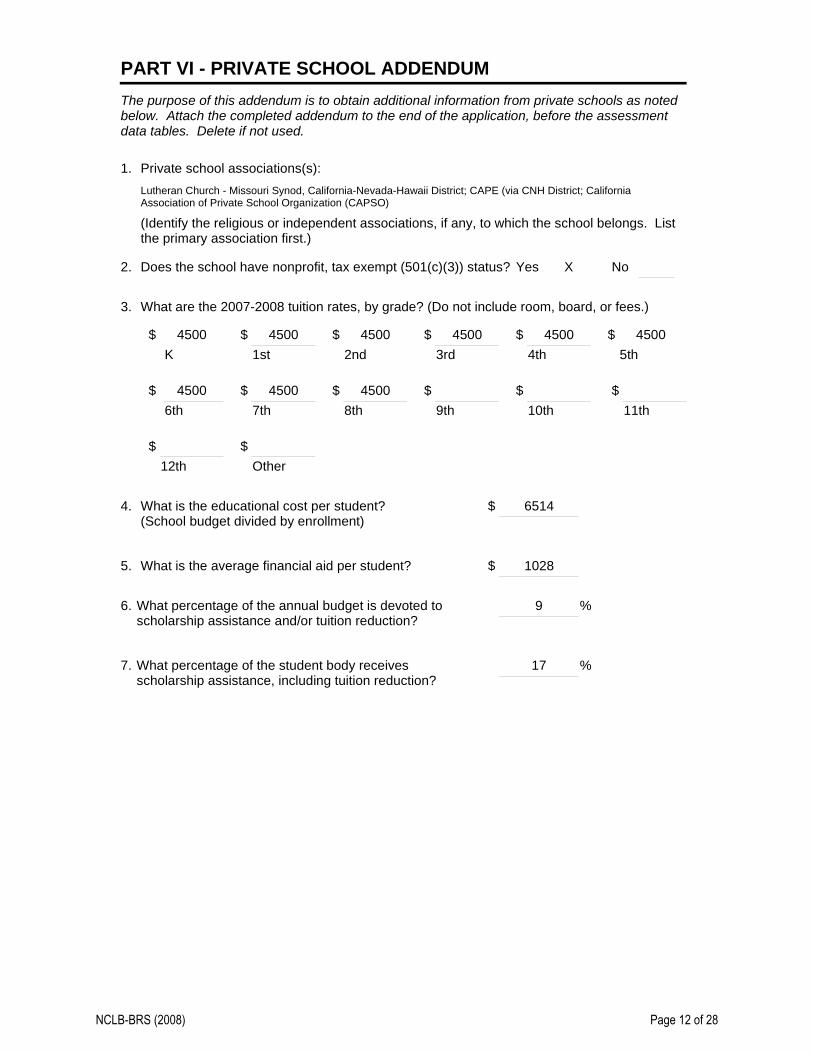
PART VI - PRIVATE SCHOOL ADDENDUMThe purpose of this addendum is to obtain additional information from private schools as noted below. Attach the completed addendum to the end of the application, before the assessment data tables. Delete if not used.
1. Private school associations(s):Lutheran Church - Missouri Synod, California-Nevada-Hawaii District; CAPE (via CNH District; California Association of Private School Organization (CAPSO)
(Identify the religious or independent associations, if any, to which the school belongs. List the primary association first.)
2. Yes X NoDoes the school have nonprofit, tax exempt (501(c)(3)) status?
3. What are the 2007-2008 tuition rates, by grade? (Do not include room, board, or fees.)
$ 4500K
$ 45002nd
$ 45003rd
$ 45004th
$ 45005th
$ 45006th
$ 45007th
$ 45008th
$9th
$10th
$11th
$ 45001st
$12th
$Other
What is the educational cost per student? (School budget divided by enrollment)
65144. $
What is the average financial aid per student? 10285. $
What percentage of the annual budget is devoted to scholarship assistance and/or tuition reduction?
96. %
What percentage of the student body receives scholarship assistance, including tuition reduction?
177. %
NCLB-BRS (2008) Page 12 of 28
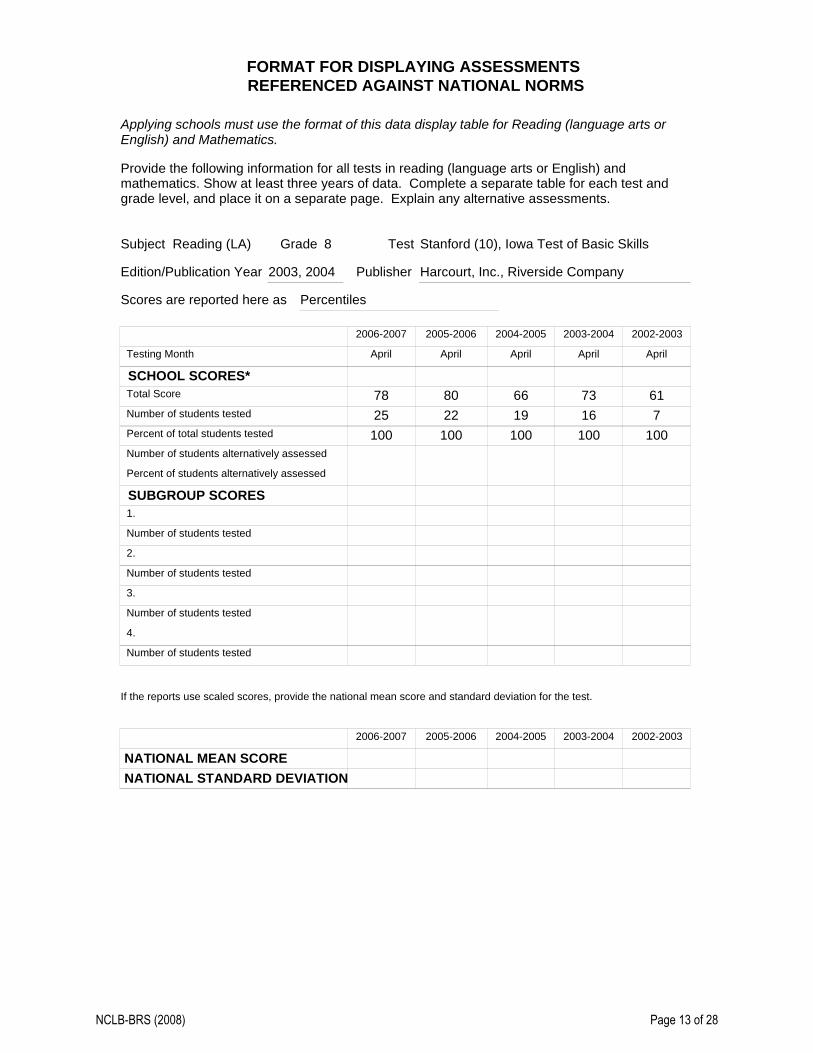
FORMAT FOR DISPLAYING ASSESSMENTS REFERENCED AGAINST NATIONAL NORMS
Applying schools must use the format of this data display table for Reading (language arts or English) and Mathematics.
Provide the following information for all tests in reading (language arts or English) and mathematics. Show at least three years of data. Complete a separate table for each test and grade level, and place it on a separate page. Explain any alternative assessments.
Testing Month
SCHOOL SCORES*
2006-2007 2005-2006 2004-2005 2003-2004 2002-2003
Subject Reading (LA) Grade 8 Test Stanford (10), Iowa Test of Basic Skills
Edition/Publication Year 2003, 2004 Publisher Harcourt, Inc., Riverside Company
Scores are reported here as Percentiles
Total Score
Number of students tested
Percent of total students tested
Number of students alternatively assessed
Percent of students alternatively assessed
SUBGROUP SCORES 1.
Number of students tested
2.
Number of students tested
3.
4.
Number of students tested
April
7825100
Number of students tested
April
8022100
April
6619100
April
7316100
April
617
100
If the reports use scaled scores, provide the national mean score and standard deviation for the test.
2006-2007 2005-2006 2004-2005 2003-2004 2002-2003
NATIONAL MEAN SCORE NATIONAL STANDARD DEVIATION
NCLB-BRS (2008) Page 13 of 28

Testing Month
SCHOOL SCORES*
2006-2007 2005-2006 2004-2005 2003-2004 2002-2003
Subject Math Grade 8 Test Stanford (10), Iowa Test of Basic Skills
Edition/Publication Year 2003, 2004 Publisher Harcourt, Inc., Riverside Company
Scores are reported here as Percentiles
Total Score
Number of students tested
Percent of total students tested
Number of students alternatively assessed
Percent of students alternatively assessed
SUBGROUP SCORES 1.
Number of students tested
2.
Number of students tested
3.
4.
Number of students tested
April
7525100
Number of students tested
April
8622100
April
7819100
April
6816100
April
887
100
If the reports use scaled scores, provide the national mean score and standard deviation for the test.
2006-2007 2005-2006 2004-2005 2003-2004 2002-2003
NATIONAL MEAN SCORE NATIONAL STANDARD DEVIATION
NCLB-BRS (2008) Page 14 of 28
Testing Month
SCHOOL SCORES*
2006-2007 2005-2006 2004-2005 2003-2004 2002-2003
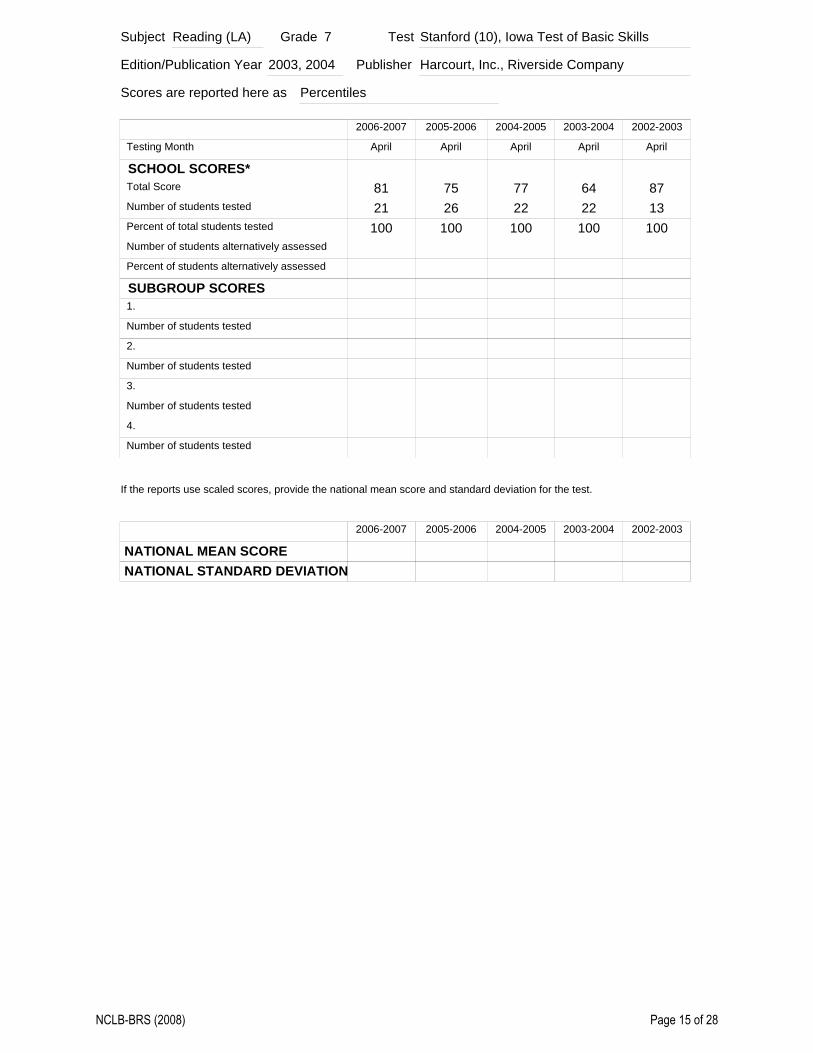
Subject Reading (LA) Grade 7 Test Stanford (10), Iowa Test of Basic Skills
Edition/Publication Year 2003, 2004 Publisher Harcourt, Inc., Riverside Company
Scores are reported here as Percentiles
Total Score
Number of students tested
Percent of total students tested
Number of students alternatively assessed
Percent of students alternatively assessed
SUBGROUP SCORES 1.
Number of students tested
2.
Number of students tested
3.
4.
Number of students tested
April
8121100
Number of students tested
April
7526100
April
7722100
April
6422100
April
8713100
If the reports use scaled scores, provide the national mean score and standard deviation for the test.
2006-2007 2005-2006 2004-2005 2003-2004 2002-2003
NATIONAL MEAN SCORE NATIONAL STANDARD DEVIATION
NCLB-BRS (2008) Page 15 of 28

Testing Month
SCHOOL SCORES*
2006-2007 2005-2006 2004-2005 2003-2004 2002-2003
Subject Math Grade 7 Test Stanford (10), Iowa Test of Basic Skills
Edition/Publication Year 2003, 2004 Publisher Harcourt, Inc., Riverside Company
Scores are reported here as Percentiles
Total Score
Number of students tested
Percent of total students tested
Number of students alternatively assessed
Percent of students alternatively assessed
SUBGROUP SCORES 1.
Number of students tested
2.
Number of students tested
3.
4.
Number of students tested
April
8421100
Number of students tested
April
7626100
April
8522100
April
7622100
April
9013100
If the reports use scaled scores, provide the national mean score and standard deviation for the test.
2006-2007 2005-2006 2004-2005 2003-2004 2002-2003
NATIONAL MEAN SCORE NATIONAL STANDARD DEVIATION
NCLB-BRS (2008) Page 16 of 28
Testing Month
SCHOOL SCORES*
2006-2007 2005-2006 2004-2005 2003-2004 2002-2003
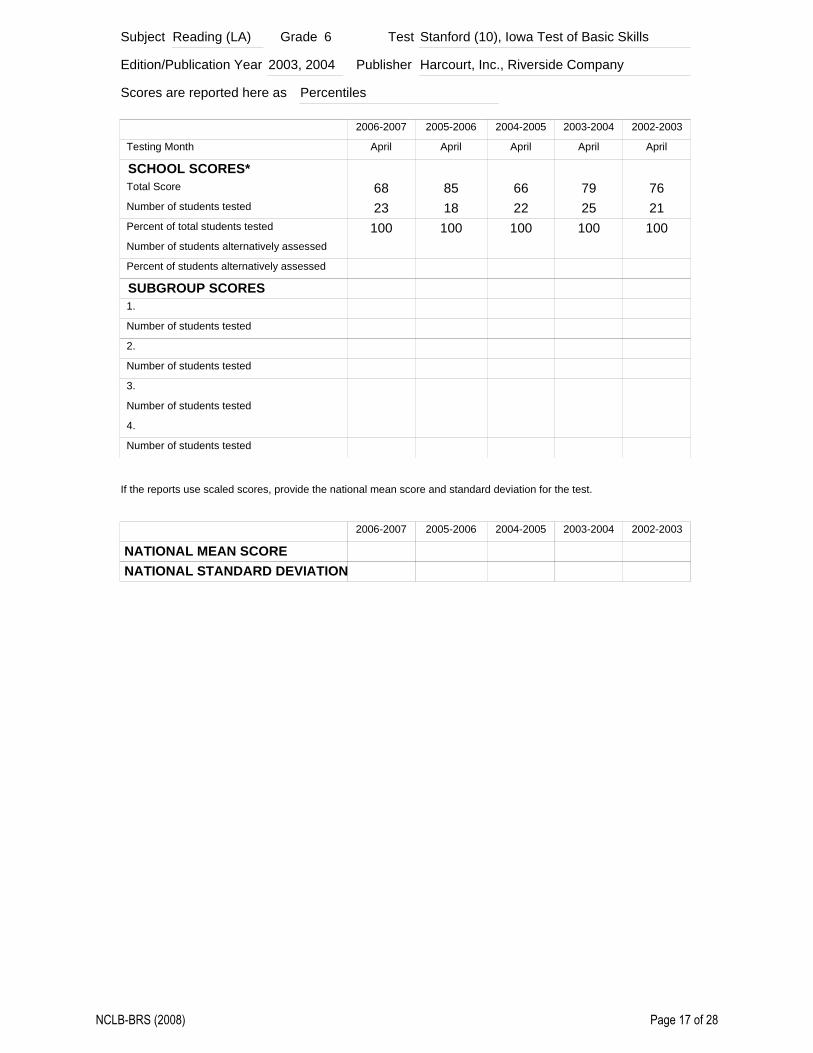
Subject Reading (LA) Grade 6 Test Stanford (10), Iowa Test of Basic Skills
Edition/Publication Year 2003, 2004 Publisher Harcourt, Inc., Riverside Company
Scores are reported here as Percentiles
Total Score
Number of students tested
Percent of total students tested
Number of students alternatively assessed
Percent of students alternatively assessed
SUBGROUP SCORES 1.
Number of students tested
2.
Number of students tested
3.
4.
Number of students tested
April
6823100
Number of students tested
April
8518100
April
6622100
April
7925100
April
7621100
If the reports use scaled scores, provide the national mean score and standard deviation for the test.
2006-2007 2005-2006 2004-2005 2003-2004 2002-2003
NATIONAL MEAN SCORE NATIONAL STANDARD DEVIATION
NCLB-BRS (2008) Page 17 of 28

Testing Month
SCHOOL SCORES*
2006-2007 2005-2006 2004-2005 2003-2004 2002-2003
Subject Math Grade 6 Test Stanford (10), Iowa Test of Basic Skills
Edition/Publication Year 2003, 2004 Publisher Harcourt, Inc., Riverside Company
Scores are reported here as Percentiles
Total Score
Number of students tested
Percent of total students tested
Number of students alternatively assessed
Percent of students alternatively assessed
SUBGROUP SCORES 1.
Number of students tested
2.
Number of students tested
3.
4.
Number of students tested
April
7223100
Number of students tested
April
8518100
April
7222100
April
8425100
April
8921100
If the reports use scaled scores, provide the national mean score and standard deviation for the test.
2006-2007 2005-2006 2004-2005 2003-2004 2002-2003
NATIONAL MEAN SCORE NATIONAL STANDARD DEVIATION
NCLB-BRS (2008) Page 18 of 28

Testing Month
SCHOOL SCORES*
2006-2007 2005-2006 2004-2005 2003-2004 2002-2003
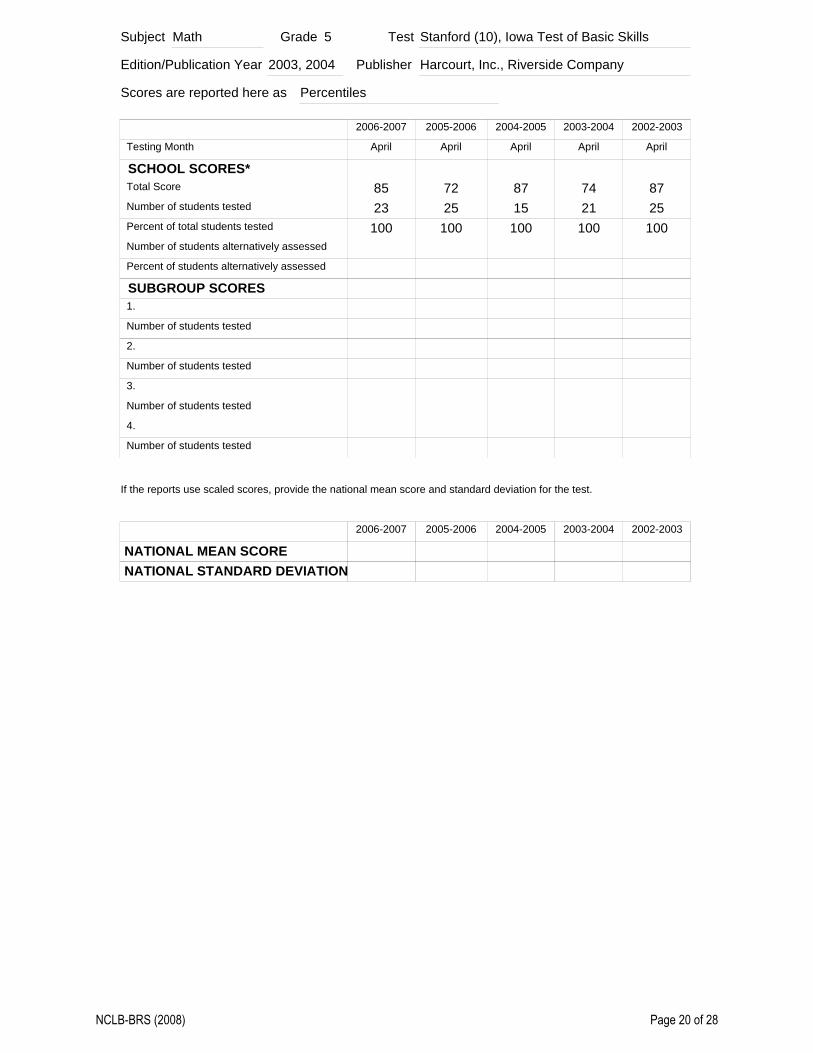
Subject Reading (LA) Grade 5 Test Stanford (10), Iowa Test of Basic Skills
Edition/Publication Year 2003, 2004 Publisher Harcourt, Inc., Riverside Company
Scores are reported here as Percentiles
Total Score
Number of students tested
Percent of total students tested
Number of students alternatively assessed
Percent of students alternatively assessed
SUBGROUP SCORES 1.
Number of students tested
2.
Number of students tested
3.
4.
Number of students tested
April
7023100
Number of students tested
April
7025100
April
8015100
April
6821100
April
7125100
If the reports use scaled scores, provide the national mean score and standard deviation for the test.
2006-2007 2005-2006 2004-2005 2003-2004 2002-2003
NATIONAL MEAN SCORE NATIONAL STANDARD DEVIATION
NCLB-BRS (2008) Page 19 of 28
Testing Month
SCHOOL SCORES*
2006-2007 2005-2006 2004-2005 2003-2004 2002-2003
Subject Math Grade 5 Test Stanford (10), Iowa Test of Basic Skills
Edition/Publication Year 2003, 2004 Publisher Harcourt, Inc., Riverside Company
Scores are reported here as Percentiles
Total Score
Number of students tested
Percent of total students tested
Number of students alternatively assessed
Percent of students alternatively assessed
SUBGROUP SCORES 1.
Number of students tested
2.
Number of students tested
3.
4.
Number of students tested
April
8523100
Number of students tested
April
7225100
April
8715100
April
7421100
April
8725100
If the reports use scaled scores, provide the national mean score and standard deviation for the test.
2006-2007 2005-2006 2004-2005 2003-2004 2002-2003
NATIONAL MEAN SCORE NATIONAL STANDARD DEVIATION
NCLB-BRS (2008) Page 20 of 28

Testing Month
SCHOOL SCORES*
2006-2007 2005-2006 2004-2005 2003-2004 2002-2003
Subject Reading (LA) Grade 4 Test Stanford (10), Iowa Test of Basic Skills
Edition/Publication Year 2003, 2004 Publisher Harcourt, Inc., Riverside Company
Scores are reported here as Percentiles
Total Score
Number of students tested
Percent of total students tested
Number of students alternatively assessed
Percent of students alternatively assessed
SUBGROUP SCORES 1.
Number of students tested
2.
Number of students tested
3.
4.
Number of students tested
April
7826100
Number of students tested
April
6921100
April
7824100
April
8017100
April
552296
If the reports use scaled scores, provide the national mean score and standard deviation for the test.
2006-2007 2005-2006 2004-2005 2003-2004 2002-2003
NATIONAL MEAN SCORE NATIONAL STANDARD DEVIATION
NCLB-BRS (2008) Page 21 of 28

Testing Month
SCHOOL SCORES*
2006-2007 2005-2006 2004-2005 2003-2004 2002-2003
Subject Math Grade 4 Test Stanford (10), Iowa Test of Basic Skills
Edition/Publication Year 2003, 2004 Publisher Harcourt, Inc., Riverside Company
Scores are reported here as Percentiles
Total Score
Number of students tested
Percent of total students tested
Number of students alternatively assessed
Percent of students alternatively assessed
SUBGROUP SCORES 1.
Number of students tested
2.
Number of students tested
3.
4.
Number of students tested
April
8526100
Number of students tested
April
8021100
April
7824100
April
8017100
April
802296
If the reports use scaled scores, provide the national mean score and standard deviation for the test.
2006-2007 2005-2006 2004-2005 2003-2004 2002-2003
NATIONAL MEAN SCORE NATIONAL STANDARD DEVIATION
NCLB-BRS (2008) Page 22 of 28

Testing Month
SCHOOL SCORES*
2006-2007 2005-2006 2004-2005 2003-2004 2002-2003
Subject Reading (LA) Grade 3 Test Stanford (10), Iowa Test of Basic Skills
Edition/Publication Year 2003, 2004 Publisher Harcourt, Inc., Riverside Company
Scores are reported here as Percentiles
Total Score
Number of students tested
Percent of total students tested
Number of students alternatively assessed
Percent of students alternatively assessed
SUBGROUP SCORES 1.
Number of students tested
2.
Number of students tested
3.
4.
Number of students tested
April
8224100
Number of students tested
April
7829100
April
7728100
April
8126100
April
8023100
If the reports use scaled scores, provide the national mean score and standard deviation for the test.
2006-2007 2005-2006 2004-2005 2003-2004 2002-2003
NATIONAL MEAN SCORE NATIONAL STANDARD DEVIATION
NCLB-BRS (2008) Page 23 of 28

Testing Month
SCHOOL SCORES*
2006-2007 2005-2006 2004-2005 2003-2004 2002-2003
Subject Math Grade 3 Test Stanford (10), Iowa Test of Basic Skills
Edition/Publication Year 2003, 2004 Publisher Harcourt, Inc., Riverside Company
Scores are reported here as Percentiles
Total Score
Number of students tested
Percent of total students tested
Number of students alternatively assessed
Percent of students alternatively assessed
SUBGROUP SCORES 1.
Number of students tested
2.
Number of students tested
3.
4.
Number of students tested
April
8824100
Number of students tested
April
8529100
April
8628100
April
8226100
April
9323100
If the reports use scaled scores, provide the national mean score and standard deviation for the test.
2006-2007 2005-2006 2004-2005 2003-2004 2002-2003
NATIONAL MEAN SCORE NATIONAL STANDARD DEVIATION
NCLB-BRS (2008) Page 24 of 28

Testing Month
SCHOOL SCORES*
2006-2007 2005-2006 2004-2005 2003-2004 2002-2003
Subject Reading (LA) Grade 2 Test Stanford (10), Iowa Test of Basic Skills
Edition/Publication Year 2003, 2004 Publisher Harcourt, Inc., Riverside Company
Scores are reported here as Percentiles
Total Score
Number of students tested
Percent of total students tested
Number of students alternatively assessed
Percent of students alternatively assessed
SUBGROUP SCORES 1.
Number of students tested
2.
Number of students tested
3.
4.
Number of students tested
April
7827100
Number of students tested
April
8026100
April
7328100
April
7230100
April
772897
If the reports use scaled scores, provide the national mean score and standard deviation for the test.
2006-2007 2005-2006 2004-2005 2003-2004 2002-2003
NATIONAL MEAN SCORE NATIONAL STANDARD DEVIATION
NCLB-BRS (2008) Page 25 of 28

Testing Month
SCHOOL SCORES*
2006-2007 2005-2006 2004-2005 2003-2004 2002-2003
Subject Math Grade 2 Test Stanford (10), Iowa Test of Basic Skills
Edition/Publication Year 2003, 2004 Publisher Harcourt, Inc., Riverside Company
Scores are reported here as Percentiles
Total Score
Number of students tested
Percent of total students tested
Number of students alternatively assessed
Percent of students alternatively assessed
SUBGROUP SCORES 1.
Number of students tested
2.
Number of students tested
3.
4.
Number of students tested
April
8827100
Number of students tested
April
8726100
April
8728100
April
8530100
April
762897
If the reports use scaled scores, provide the national mean score and standard deviation for the test.
2006-2007 2005-2006 2004-2005 2003-2004 2002-2003
NATIONAL MEAN SCORE NATIONAL STANDARD DEVIATION
NCLB-BRS (2008) Page 26 of 28
Testing Month
SCHOOL SCORES*
2006-2007 2005-2006 2004-2005 2003-2004 2002-2003
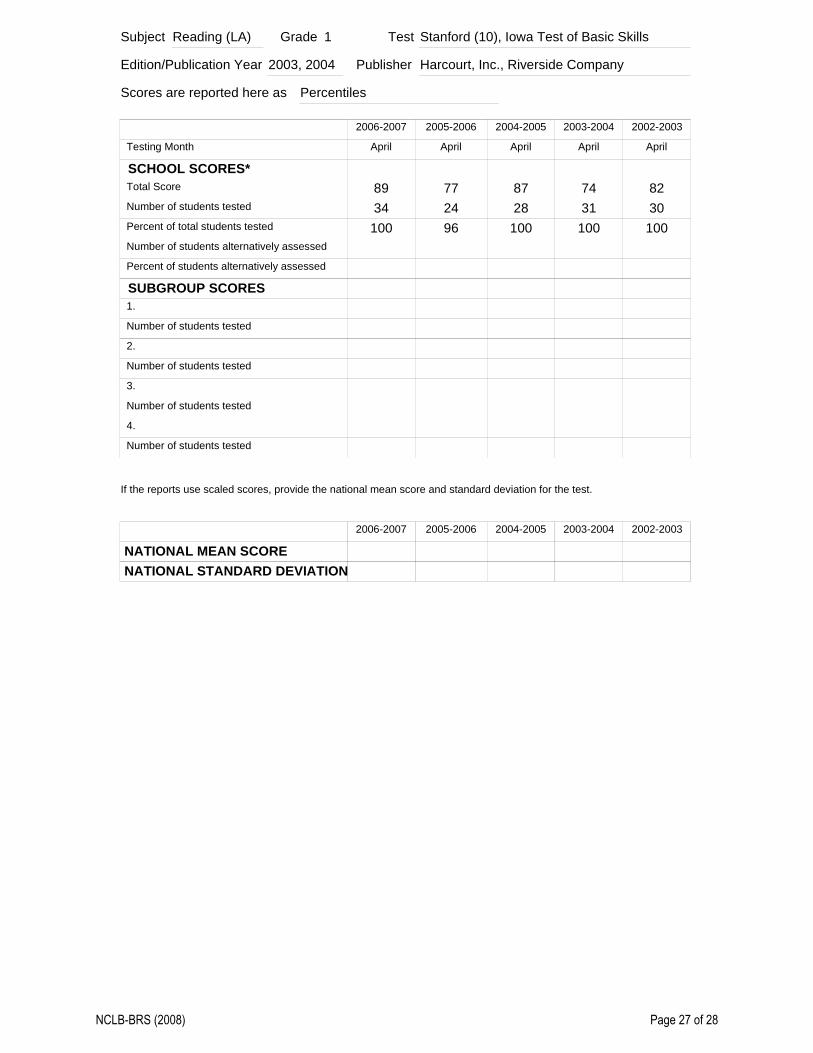
Subject Reading (LA) Grade 1 Test Stanford (10), Iowa Test of Basic Skills
Edition/Publication Year 2003, 2004 Publisher Harcourt, Inc., Riverside Company
Scores are reported here as Percentiles
Total Score
Number of students tested
Percent of total students tested
Number of students alternatively assessed
Percent of students alternatively assessed
SUBGROUP SCORES 1.
Number of students tested
2.
Number of students tested
3.
4.
Number of students tested
April
8934100
Number of students tested
April
772496
April
8728100
April
7431100
April
8230100
If the reports use scaled scores, provide the national mean score and standard deviation for the test.
2006-2007 2005-2006 2004-2005 2003-2004 2002-2003
NATIONAL MEAN SCORE NATIONAL STANDARD DEVIATION
NCLB-BRS (2008) Page 27 of 28

Testing Month
SCHOOL SCORES*
2006-2007 2005-2006 2004-2005 2003-2004 2002-2003
Subject Math Grade 1 Test Stanford (10), Iowa Test of Basic Skills
Edition/Publication Year 2003, 2004 Publisher Harcourt, Inc., Riverside Company
Scores are reported here as Percentiles
Total Score
Number of students tested
Percent of total students tested
Number of students alternatively assessed
Percent of students alternatively assessed
SUBGROUP SCORES 1.
Number of students tested
2.
Number of students tested
3.
4.
Number of students tested
April
8734100
Number of students tested
April
902496
April
8028100
April
7731100
April
6830100
If the reports use scaled scores, provide the national mean score and standard deviation for the test.
2006-2007 2005-2006 2004-2005 2003-2004 2002-2003
NATIONAL MEAN SCORE NATIONAL STANDARD DEVIATION
NCLB-BRS (2008) Page 28 of 28