Embed Size (px)
Citation preview

APPENDIX B3: Report on dredge performance from SSP (survey sensor package) data.
2008 Survey NOAA Clam Dredge Performance Review April 23, 2009 Summary The review of the 2008 NOAA clam survey tows described below accomplished the following tasks. 1) Grade the tows based on the previously developed manifold pressure “good”/”bad” criteria. For
the 2008 survey this required development of a manifold pressure proxy based on pump amps due to a SSP failure towards the end of the survey. A total of 67 stations out of 453 were determined to be “bad” by the criteria.
2) Grade the tows based on the previously developed Y Tilt (dredge fore/aft angle) “good”/”bad” criteria. For the 2008 survey it was determined that sensor issues were likely creating false excessive Y tilt motions and the Y Tilt criteria should not be used. Based on this decision, the 2005 NOAA survey tows were re-reviewed for Y tilt issues and a similar determination was made. This resulted in one station, #218, previously labeled bad for Y tilt being included in a re-analysis of the 2005 survey data.
3) Evaluate the effect of changing the dredge pump, pump power cable, and SSP during the survey on the dredge’s performance. The end conclusion is there was no noticeable effect on the survey results.
4) Investigate several SSP data anomalies, particularly fluctuations in frequency recorded and minor variations in pump amps and manifold pressure trends that occurred during the survey. It was determined that these anomalies were likely sensor issues or a minor pump problem that had no noticeable effect on the survey results.
Review of Survey Dredge Pump Performance Relationships
Figure 1 - Blocked Manifold Good Pressure Blocked Intake
In evaluating the performance of the NOAA clam survey, several key pieces of data are used,
pump manifold pressure and pump electrical operating parameters. The key data is the manifold pressure with the electrical data serving as a backup to missing manifold pressure data and to verify the pump was seeing a consistent electrical supply.
48th SAW Assessment Report Ocean quahog; Appendix B3
365

Figure 1 shows the two dredge pump pressure problems, a blocked pump discharge manifold (pressure increase) or a blocked pump intake (pressure decrease). For a centrifugal pump such as used on the survey dredge, in both blockage cases the pump amps will fall in proportion the increase or decrease in manifold pressure. Thus with a suitable proxy, missing manifold pressures can be recreated using the amps data recorded.
The frequency and voltage data, along with the amps data, is primary used to verify a consistent electrical supply to the dredge pump motor. For the NOAA survey dredge the frequency should be 60 hertz and the voltage should be a relatively consistent value. The frequency is set by the rpm’s of the generator which is governed to between 59.5 and 60.5 hertz depending on load. The voltage recorded is the voltage at the dredge pump and typically runs around 400 volts depending on power cable length. Introduction
Figure 2 - SSP Mean Values for Differential Pressure, Amps, Volts, Frequency
A review of the Survey Sensor Pack (SSP) data from the 2008 NOAA clam survey was undertaken to evaluate the performance of the dredge for each of the survey tows. The SSP’s mean Manifold Differential Pressure, Pump Amps Draw, Pump Voltage, and Frequency for tows 1 to 405 are plotted in Figure 2. Tows 406 to 453 are not plotted due to a failure of the SSP package. For reference survey leg 1 was stations 1 to 169, survey leg 2 was stations 170 to 319, and survey leg 3 was stations 320to 453. For the 2008 clam survey, (4) onboard events happened. 1) The dredge pump failed during station 169 tow and was replaced with the backup unit for tows
170 till the survey end. 2) The pump power cable was replaced at station 241 with a longer cable to allow tows in deeper
waters. The longer cable remained for the rest of the tows.
48th SAW Assessment Report Ocean quahog; Appendix B3
366

3) The primary SSP package failed towards station 269 and was replaced with the backup SSP for station 270 on.
4) The backup SSP failed from station 406 till the end of the survey. A visual review of the SSP data showed the following issues of concern. 1) There were large number of tows with significant drops in the manifold differential pressure and
pump amps. (Same as occurred during 2005 survey) 2) There was modest, about 3 to 5 psi, jump in the manifold differential pressure for the last third of
the survey. 3) The frequency recorded from station 1 to 169 varied from 60 to 70 hertz. The frequency then
stabilized at 60 hertz till about station 220 when it started a slow rise followed by a jump to over 70 hertz at station 241. The frequency then stabilized at 60 hertz till the end of the survey.
4) The dredge Y tilt (fore/aft) and X tilt (side/side) seemed to have greater fluctuations than previous surveys.
Figure 3 - Clam Dredge Pump Performance - 2008 NOAA Survey To help evaluate the effect of the onboard events and SSP data concerns a plot of the dredge pump’s general operating performance, Figure 3, was done to see trends over the entire survey. This plot was done using stations ending in (5) or if that station had problems, such as a clogged manifold, the next nearest good station was used. Note the manifold pressure, red line, is plotted at a 10 times scale. Effect of Dredge Pump Replacement at Station 170
The dredge’s pump was replaced at station 170 and is shown on figure 3 with the black short dashed line. When the new second pump was installed the manifold pressure jumped up roughly 1
48th SAW Assessment Report Ocean quahog; Appendix B3
367

psi to about 38.5 psi (red line figure 3). The pressure increase would be expected over the first pump’s now worn condition, but did not increase to the first pump’s “new” pressure of about 40 psi.
This is likely due to the fact that the second pump appears to have more internal running resistance than the first pump by the jump in amps draw (blue line figure 3) and power (magenta line figure 3) from about 275 amps, 160 VA, for the first pump to 300 amps, 180 VA, for the second pump. The increase in internal resistance could be from tighter bearings, shaft seals, or running clearances and would cause the second pump to run slightly slower than the first pump which would produce less manifold pressure.
Also interestingly the fluctuation in recorded frequency up to replacement of the pump disappeared and a steady 60 hertz was now being recorded (see figure 2). The variation in frequency from 60 to 70 hertz is not possible as this is a direct function of the ship’s generator rpm’s which are governed to 59.5 to 60.5 hertz depending on load. Variations of the size recorded would be easily noticed by ship’s engineer and at 70 hertz would have likely tripped automatic over-speed safety shutdowns. In addition the higher frequencies, if they did occur, would have caused the dredge pump to run at significantly higher speeds which would have boosted the manifold pressure and raised the amps draw, neither of which occurred. The frequency variations could have been due to problems in the first pump which eventually caused the pump motor failure.
Based on the above the change in dredge pumps would have had no noticeable effect on the performance of the survey dredge as the key manifold pressure remained within the normal operating band of 35 to 40 psi. Effect of Dredge Pump Power Cable Replacement at Station 241
The dredge pump’s power cable was replaced at station 241 with a longer cable to allow sampling in deeper water and is shown on figure 3 with the black long/short dashed line. When the new longer cable was installed there was a drop in voltage (green line figure 3) at the pump from about 405 volts to 390 volts which would be expected from the higher resistance of the longer cable. There was a corresponding increase in the amps draw (blue line figure 3) from 300 amps to 315 which would also be expected as the dredge pump power draw (magenta line figure 3) remained the same.
Most importantly the key manifold pressure (red line figure 3) over the power cable change followed the general small downward typical of a survey pump wearing normally over the course of a survey. Based on this the change in dredge pump’s power cable would have had no noticeable effect on the performance of the survey dredge as the key manifold pressure remained within the normal operating band of 35 to 40 psi. Replacement of Primary SSP at Station 270
The primary SSP was replaced at station 270 due to onboard data review which was indicating a SSP failure. The frequency recorded had started to rise after station 220 and then jumped to a completely impossible 74/75 hertz (see above discussion). In addition station 268 had no SSP differential pressure and station 270 recorded no SSP data at all. These failures had followed a string of stations with low recorded manifold pressures.
The frequency data recorded by the second SSP after station 271 did return to an expected steady value of 60 hertz. In addition the voltages recorded at the pump remained steady at around 390 volts between the first and 2nd SSP’s. Both of these indicate a correctly functioning second SSP.
48th SAW Assessment Report Ocean quahog; Appendix B3
368

Figure 4 - SSP vs Mini-Logger Ambient Pressure - 2008 NOAA Survey
A further check was done by comparing the SSP recorded ambient pressure to the ambient pressure recorded by the mini-loggers (see figure 4). The SSP ambient pressure (blue line figure 4) tracks the mini-logger pressure (green and red lines figure 4) very closely both before and after the change in SSP’s. Note the SSP value changed from psi to decibars at station 226/227 which will be discussed later. This change in units did not affect any of the review work undertaken.
The average dredge running angle recorded by the SSP’s inclinometer was also compared between the first and second SSP units. (Note stations used were the good stations used to develop dredge pump performance plot in figure 3.) Y Tilt X Tilt First SSP Stations 1 to 269 3.39 2.72 Second SSP Stations 270 to 405 2.76 2.63 Both the Y (fore/aft) and X (side/side) tilt angles are within the at sea calibration errors that were done to set up the second SSP.
A review of the pump voltage, recorded by the SSP’s, and pump amps, recorded independently of the SSP’s, was also done to compare first and second SSP functionality. The amps (blue line figure 3) and voltages (green line figure 3) are steady from station 1 to about station 260 as would be expected. From station 260 to about station 285 though, the amps increased significantly then declined to “normal” values at station 325 and remained steady for the rest of the survey.
This increase in pump amps could only be caused by increased running resistance in the pump such as shell hash binding the pump impeller. An increase in manifold pressure would not
48th SAW Assessment Report Ocean quahog; Appendix B3
369

cause this increase in amps. Whatever was causing the binding eventually wore away and the running resistance eventually returned to normal conditions. The corresponding dip and rise in voltage and increase then drop in power demand (magenta line figure 3) supports this theory.
The manifold pressure though should have dipped slightly during this episode as the added running resistance would have slowed the pump rpm’s down. This did not occur though as the manifold pressure (red line figure 3) was recorded to be steadily rising and continued do so well past when this anomaly in amps draw was over. From the following discussions it appears the manifold pressure was likely having sensor issues and coupled with the fact that the amps anomaly occurred over the change in SSP’s suggests the change in SSP’s was not a factor.
The manifold pressure (red line figure 3) on the other hand was not recorded by the second SSP for stations 270 to 285 and then started recording till the complete failure of the second SSP at station 406. When the manifold pressure started recording at station 286 it had jumped slightly about 1 psi above the first SSP’s last values, and then showed a sharp rise from about 36 psi to about 41 psi around station 325. The manifold pressure then dropped to a steady value of about 39 psi at station 345 and remained steady there after to the failure of the second SSP at station 405.
The small initial jump in pressure is within calibration errors from the first SSP to the second SSP. However from past surveys the manifold pressure should have followed a steady small downward trend due to pump wear (red dashed line figure 3). The rise in and fall in manifold pressure could be indicating a slightly plugged manifold but the pump amps, recorded independent of the SSPs, (blue line figure 3) did not drop/rise in agreement.
From the analysis of the 2005 NOAA clam survey, an unknown drift in the manifold pressure sensor readings before the pump was started (blue line figure 5b) occurred which created a false rise in the recorded manifold pressure (green line figure 5b). A possible sensor drift was also investigated for the 2008 survey, but as shown in figure 5a the same drift did not occur. Unlike the 2005 survey, the 2008 survey manifold pressure before pump start (blue line figure 5a) staid steady throughout the survey.
Figure 5a - 2008 Dredge Manifold Pressure Figure 5b - 2005 Dredge Manifold Pressure
The SSP differential pressure sensor was changed from the 2005 survey’s Trans Metric P022 unit to a Stellar Technology DT1900 unit for the 2008 survey which could explain the difference between 2005 and 2008 surveys. Neither manufacture was able to provide any insight into the sensor’s performance.
Based on the above, no definitive judgment can be passed on the performance of the second SSP unit or the effect of the data recorded on the survey. However the second SSP’s frequency values were steady at 60 hertz, voltage remained the same between the two SSP’s, and the SSP
48th SAW Assessment Report Ocean quahog; Appendix B3
370

ambient pressure matched the mini-logger values, all indicating consistent SSP operation. The change in manifold pressure, the key dredge performance measuring criteria, however is
a concern about the second SSP unit. The change in manifold pressures though is fairly small and the value stays within the accepted 40 to 35 psi normal range. Further the stations with pump problems shown by the second SSP (station 402 figure 6) data have amp readings, recorded independently of the SSP, that are consistent and follow the patterns as occurred with the first SSP data (station 045 figure 6) and previous surveys (station 262 figure 6). Because of this the good/bad manifold pressure criteria is still valid for stations recorded by the second SSP.
Figure 6 - 2008 & 2005 Survey 1st and 2nd SSP Manifold Pressure vs. Amps Survey Dredge Y Tilt and X Tilt Fluctuations
From the visual inspection of the survey tow data plots the dredge Y tilt (fore/aft) and X tilt (side/side) seemed to have greater fluctuations than previous surveys. Several examples of tow Y and X tilt are shown in figure 7, with station 187 being typical of a “good” station for Y and X data. (Note different Y and X scales for degrees)
Figure 7 - NOAA Dredge 2008 Survey Y/X Tilt SSP Data Plot Examples
48th SAW Assessment Report Ocean quahog; Appendix B3
371

The SSP uses a 2 axis conductive liquid inclinometer to measure the Y and X tilt angles. This type of inclinometer measures the angle by sensing the level of a conductive fluid using (5) probes. Based on discussions with the clinometers’ manufacture, the liquid used in the SSP’s inclinometer has a viscosity about the same as water. Because of this the clinometers’ liquid would be suspect to several error producing situations. 1) The liquid can slosh from sharp impacts or jolts. 2) The liquid can go into harmonic resonance at about 10 hertz (10 times per second).
Figure 8 - 2008 Station 187 and 083 Comparison of SSP Y Tilt Plots
The sloshing of the clinometers liquid from sharp fore and aft jolting movements as the dredge jerks horizontally over the bottom can appear as a vertical Y tilting of the dredge. The rapid large vertical swings of station 083 tow ( red line figure 8) are most likely from sloshing of the clinometers’ conductive liquid due to the dredge jerking fore/aft horizontally through the bottom, not actual dredge vertical movement. The large 10 degree vertical swings at the end the tow are most likely from the clinometers’ conductive liquid sloshing in resonance. (Good station 187 Y tilt, blue line, is plotted as a comparison.)
48th SAW Assessment Report Ocean quahog; Appendix B3
372

Figure 9 - NOAA Clam Dredge Nose Lifting Force Calculation
Further evidence the large Y tilt swings are from the inclinometer sloshing is the large towline pull that would be required to lift the nose of the dredge off the bottom. Figure 9 is an estimation of the towline pull that would be required to lift the nose of the dredge off the bottom. From a moment balance calculation, approximately 7,700 #’s of towline pull would be required to just balance the dredge on the aft end of the runners. But this 7,700 # towline pull also creates a horizontal pulling force of 6,700 #’s, more than ample to pull the dredge forward, particularly after the dredge’s knife is completely above the bottom at a Y angle rise of about 4.4 degrees.
The last evidence the large Y tilt swings are from the inclinometer sloshing is the physical fact that it is not possible for the dredge’s large flat runners to bury in the bottom as the plots would suggest. For station 083 shown, its normal running angle appears to be about 3 degrees (time 100 to 150 red line figure 8). Yet from the plots the dredge and its runners are burying 5 to 10 degrees on 1 second intervals in to the bottom, not a realistic situation. The 1 to 2 degree bounces on roughly 5 second intervals for station 187 (blue line figure 8) are realistic.
48th SAW Assessment Report Ocean quahog; Appendix B3
373

Figure 10 - 2008 Station 187 and 083 Comparison of SSP X Tilt Plots
As with Y tilt, sharp sideways jolting movements of the dredge can appear as an excessive side X tilting of the dredge. The rapid large X swings of station 083 tow ( red line figure 10) are again most likely from sloshing of the clinometers’ conductive liquid, probably in resonance during the 20 degree plus swings. (Good station 187 Y tilt, blue line, is plotted as a comparison.)
Because these rapid Y and X tilt fluctuations are likely due to a SSP sensor problem, and are not the actual movement of the dredge, these fluctuations can be ignored in evaluating the dredge’s performance. Extreme problems in the dredge’s running angle such as shown by the station 144 plots in figure 7 will not be ignored by this assumption. In this case the dredge jumped up about 40 degrees for a brief period in the latter part of the tow due to a sudden very large 5 knot increase in vessel speed. This non fishing period though will be compensated for in the tow length calculations and thus be correctly accounted for in the survey results. As such the Y-Tilt Criteria developed for the 2005 survey is no longer applicable and was not applied to the 2008 survey.
Based on the above, the 2005 NOAA survey Y and X tilt plots were re-evaluated and similar Y and X fluctuations were noted, though with a significant lesser number of occurrences than the 2008 survey. Typical examples of stations from the 2005 NOAA survey are shown in figure 11. Station 137 is a typical good station for smooth Y and X tilt plots. Station shows similar Y and X tilt fluctuations to the 2008 survey discussed above. The one 2005 survey station that was flagged as “bad” by the Y-Tilt criteria was station 218 shown in figure 11. As discussed above the Y tilt spike in the middle of the tow will be accounted for in the tow length calculations and thus station 218 can be placed back into the survey calculations.
48th SAW Assessment Report Ocean quahog; Appendix B3
374

Figure 11 - NOAA Dredge 2005 Survey Y/X Tilt SSP Data Plot Examples SSP vs Mini-Logger Ambient Pressure Comparison
From figure 4 there was an interesting anomaly in the SSP ambient pressure recorded in the data files. The SSP ambient pressure (blue line figure 4) tracks the mini-logger ambient pressure in psi (green line figure 4) up to station 226. At station 227 the SSP ambient pressure now tracks the mini-logger ambient pressure in decibars (red line figure 4) till the SSP data ends at station 405. In the excel data files the column header for SSP ambient pressure is “PRESS.AM9291” up to station 226, then switches to “PRESS.AM.SSP” for the remainder of the survey tows. This switch in header labels also occurred for SSP ambient temperature, tilt X, and tilt Y.
This unit jump appears to only have occurred in the SSP ambient pressure data. The SSP ambient temperature tracked the mini-logger ambient temperature across the full survey (see figure 12). The average Y tilt and X tilt before and after stations 226/227 was also calculated to see if a problem occurred. The Y and X tilt was stopped at station 269 when the SSP was replaced and there is a minor calibration difference between the two SSP units as discussed previously. Again from the data below it dose not appear if there was any change in the X or Y before to after station 226/227. (Note stations used in these comparisons were the good stations used to develop dredge pump performance plot in figure 3.)
Y Tilt X Tilt First SSP Stations 1 to 226 3.39 2.71 First SSP Stations 227 to 269 3.38 2.75 Based on the above, this unit switch did not affect any of the 2008 survey tow review.
48th SAW Assessment Report Ocean quahog; Appendix B3
375

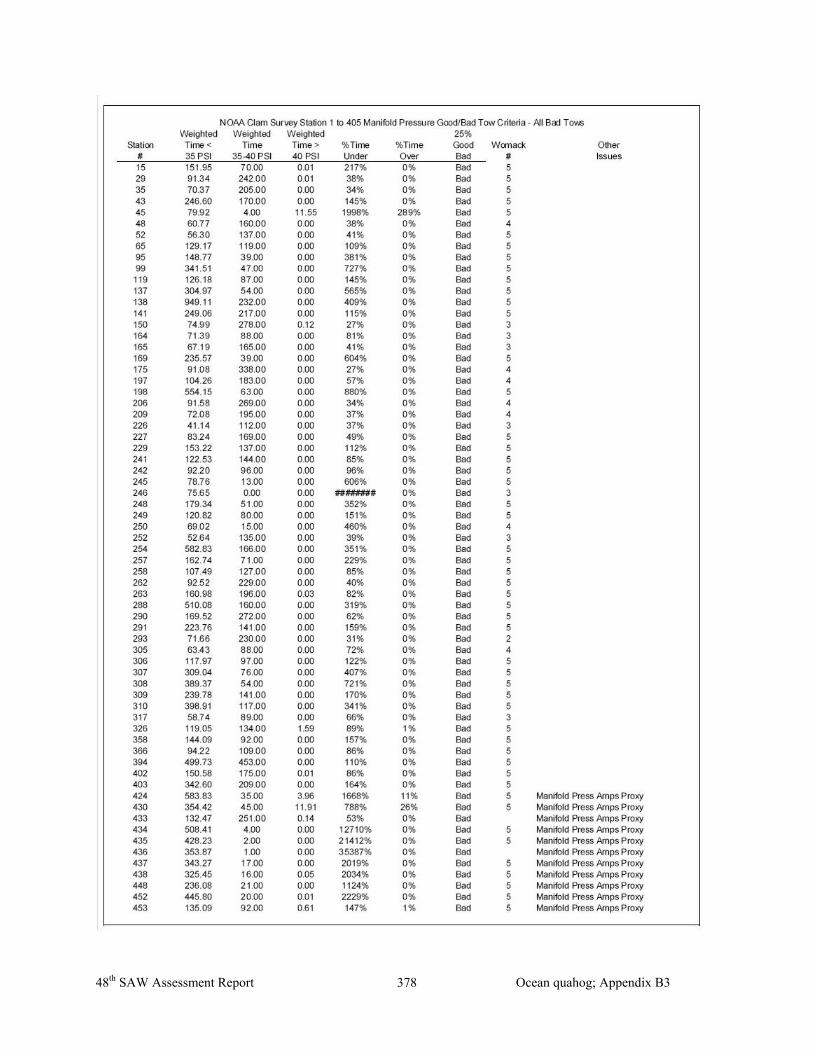
Figure 12 - SSP vs. Mini-Logger Ambient Temperature - 2008 NOAA Survey Application of Manifold Pressure Good/Bad Tow Criteria to 2008 Survey
As with the 2005 NOAA clam survey, there were numerous stations that experienced manifold pressure problems during the 2008 survey. These suspect stations were evaluated using the good/bad manifold pressure criteria that was developed for the 2005 survey. In summary the criteria compares the time the manifold pressure was in the “normal” operating range of 35 to 40 psi with the time it was outside of that range. If the time outside of the range exceeded the time within the normal range by more than 25%, the tow is labeled a “bad” tow.
The 2008 survey did present one problem in using the good/bad manifold pressure criteria, the lack off SSP manifold pressure data after station 405. Fortunately the dredge pump’s amp draw is recorded independent of the SSP’s and was available for use in these latter stations. Figure 13 is a plot of several stations that experienced pressure problems were both SSP manifold pressure and amps were available. This plot was used to develop a manifold pressure from amps proxy that would allow use of the good/bad manifold pressure criteria for stations after 405.
48th SAW Assessment Report Ocean quahog; Appendix B3
376

Figure 13 - Manifold Pressure vs. Pump Amps Proxy
The selected proxy is the black line in figure 13. This proxy was set by visual trial and error to best match stations 403, 358, and 366. These stations were selected as they occurred towards the end of the SSP available data and best matched the amps/pressure relationship of a normally operating pump in the latter tows.
The list on the following page are the stations determined to be “bad” by the manifold pressure criteria.
48th SAW Assessment Report Ocean quahog; Appendix B3
377
48th SAW Assessment Report Ocean quahog; Appendix B3
378