Embed Size (px)
DESCRIPTION
Comprehensive Employment Report
Citation preview

2009-2010 Placement Surveyof 2007-2008 Graduates
University of North Dakota
Institutional Report
Carmen WilliamsSue EricksonMichael Braget
Office of Institutional Research April 20, 2010
Prepared for Career ServicesDivision of Student and Outreach Services “Empowering Students to Realize Their Dreams”
TTAABBLLEE OOFF CCOONNTTEENNTTSS Table of Contents ................................................................................................................. 2
Executive Summary .............................................................................................................. 3
Graphical Highlights .............................................................................................................. 4
A. Introduction ..................................................................................................................... 5
B. Methodology ..................................................................................................................... 5
C. Response Rate ................................................................................................................ 5
D. Data Analysis ................................................................................................................... 5
E. Selected Results ............................................................................................................... 5
1. Demographic Information ........................................................................................... 5
2. Employment Information ............................................................................................ 6
3. Pursuing Additional Education .................................................................................. 6
4. Place of Residence .................................................................................................... 6
5. North Dakota Retention Information .......................................................................... 7
6. North Dakota Employment Information ..................................................................... 7
7. Employer and Annual Salary Information .................................................................. 8
8. Internship/Cooperative Education Participation ........................................................ 9
9. Current Position in Relation to UND Education ......................................................... 9
10. UND Career Services/Cooperative Education Office .............................................. 10
11. Final Observations ................................................................................................... 10
F. Ten-year Trends Based on Previous Placement Studies ............................................... 11
Appendices
Appendix 1. Placement Survey Questionnaire .......................................................... 12
Appendix 2. Tables 1-15 ........................................................................................... 13
Appendix 3. Ten-year Trends .................................................................................... 23
Appendix 4. Tables 24-25 ......................................................................................... 27
Appendix 5. Why or Why Not (contact Career Services for further information) ...... 31
Appendix 6. Name of Employers (contact Career Services for further information) .. 38
2009-2010 Placement Survey Office of Institutional Research, University of North Dakota April 20, 2010
_________________________________________________________________________________________________________ Page 2

EEXXEECCUUTTIIVVEE SSUUMMMMAARRYY ■ 1,736 UND undergraduate alumni who graduated in December 2007, May 2008, and August 2008 were mailed
a questionnaire seeking demographic and employment information. A total of 624 alumni participated in the survey. After adjusting for bad addresses, an adjusted response rate of 38% was attained.
■ 95% of respondents indicated being either employed or currently a student. While 95% is relatively high, this is
the lowest percentage record in 10+ years that this survey has been administered. ■ 89% of respondents indicated that their current position is “directly related” or “somewhat related” to the
education they received at UND. ■ Respondents reported residing in 49 states. 68% of respondents are currently residing in North Dakota (40%)
or Minnesota (28%). Overall, North Dakota retained 173 (60%) of the 288 respondents who graduated from a ND high school. This is the highest percentage reported by this survey; the past five years are as follows: 2009=48%, 2008=53%, 2007=53%, 2006=52%, 2005=51%.
■ 172 (28%) respondents are pursuing additional education, of which 64 (37%) are at UND. Last year, a total of
158 (23%) of the respondents reported pursuing additional education and 50 (32%) studied at UND.
■ Females (n=117) pursue an additional degree at more than twice the rate as males (n=55) do. At UND, 70% of the re-enrollees are females (n=45) compared to 30% males (n=19).
■ 64% (last year=59%) of the respondents believe there are job opportunities for them in their area of interest in North Dakota. 47% (last year=41%) of respondents indicated that if a job were available in their area of interest they would want employment in North Dakota.
■ Respondents indicating “yes” they would want North Dakota employment frequently cited the following
reasons: close to family, like the community or state, job opportunities and cost of living.
■ Respondents indicating “no” or “unsure” they would want North Dakota employment frequently cited the following as their reasons: climate, proximity to family, preference for another state/metropolitan area, and limited job opportunities.
■ The reported average annual salary was $40,793 in which UND female graduates report average annual
earnings of 92% of their male counterparts.
■ 57% of respondents reported that they used the services of, or attended events sponsored by, UND Career Services/Coop Ed while at UND (last year=53%). The students who used these services reported a higher rate of relationship (directly related or somewhat related) of their current position to their UND education.
■ 46% of the respondents indicated that they participated in an internship or cooperative education program
while attending UND. The participants of these programs also reported an average salary $3,327 higher than those who did not participate in such programs (last year’s difference was $2,393).
2009-2010 Placement Survey Office of Institutional Research, University of North Dakota April 20, 2010
_________________________________________________________________________________________________________ Page 3

90.9%
65.1%
96.2%
88.1%
75.3%
49.1%
43.5%
9.1%
23.8%
1.9%
3.6%
15.1%
40.7%
37.9%
11.1%
1.9%
8.3%
9.6%
10.2%
18.6%
SMHS
SEM
NURS
JDOSAS
EHD
BPA
A&S
Directly related Somewhat related Not at all related
Study at Male Female All AllUND 19 45 64 50Other
schools
2008-09
36 72 108 108
2009-10
$37,05
8
$41,26
7
$31,15
4
$33,66
5
$48,34
7 $62,30
6
$45,54
3
$31,611
$36,942
$30,319
$23,033
$45,702 $56,318
$32,750
$38,955
$44,210
$29,246
$34,077
$53,039
$55,472
$51,111
$43,031
$43,865
$30,840
$37,335 $4
9,738
$$62,760
$45,900
$0
$10,000
$20,000
$30,000
$40,000
$50,000
$60,000
$70,000
A&S BPA EHD JDOSAS NURS SEM SMHS
Overall North Dakota Minnesota Other
41.7%
25.4%
51.9%
23.3%
48.0%
43.8%
43.2%
37.5%
34.3%
24.1%
17.4%
29.3%
33.9%
26.2%
20.8%
40.3%
24.1%
59.3%
22.7%
22.3%
30.6%
SMHS
SEM
NURS
JDOSAS
EHD
BPA
A&S
North Dakota Minnesota Other
Yes 64% (59%)No 18% (24%)Not Sure 17% (16%)
Yes 47% (41%)No 31% (37%)Not Sure 22% (22%)
Yes 57% (53%)No 43% (47%)
Do you believe there are job opportuniites for you in your area of interest in ND? (prior yr)
If a job were available in your area of interest would you want employment in ND? (prior yr)
Did you use the services or attend events sponsored by UND Career Services while you studied at UND? (prior yr)
2009-2010 UND Placement Survey Highlights of the 2007-2008 Graduates
How closely is your current position related to your education? Sorted by College (Total 100% per college)
2009-10 2008-09College % Yes % YesA&S 30% 28%BPA 62% 45%EHD 49% 48%JDOSAS 29% 26%NURS 61% 62%SEM 65% 51%SMHS 71% 51%TOTAL 46% 40%
In which state do you currently reside? Sorted by college (Total 100% per college)
Participated in an internship or co-op program?
Pursuing further education?
Average Annual Salary Sorted by College and Residence
UNIVERSITY OF NORTH DAKOTA 2009-2010 PLACEMENT SURVEY
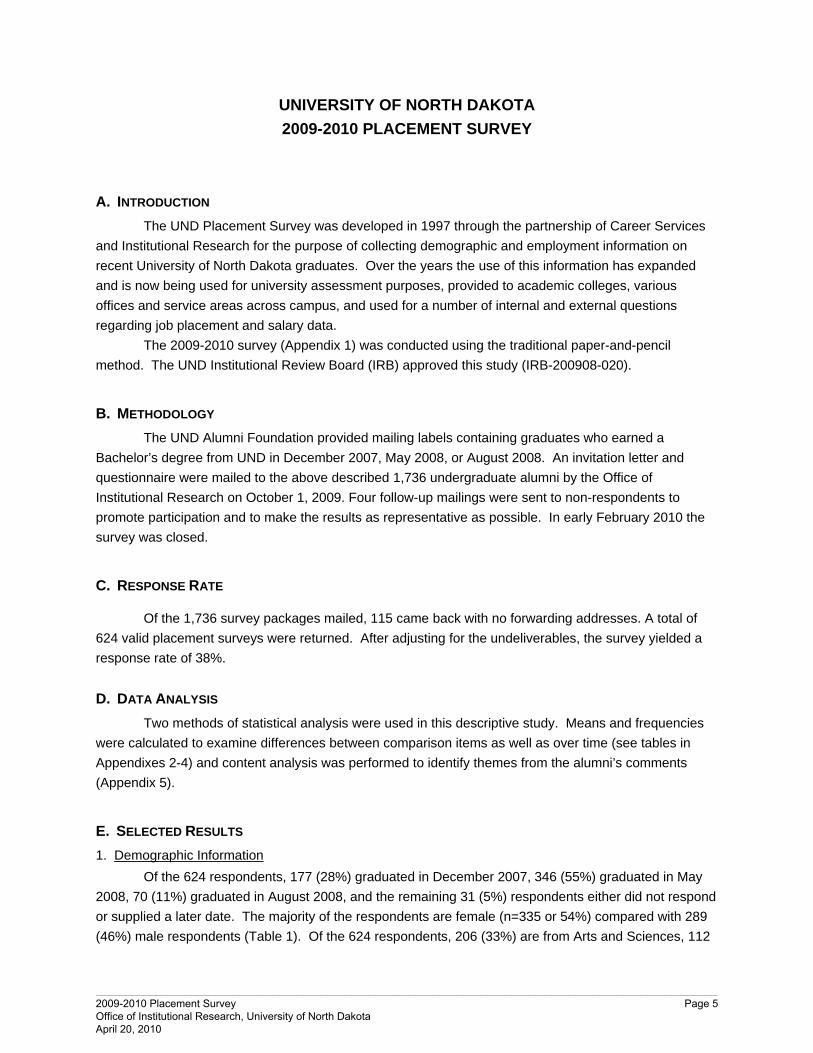
A. INTRODUCTION
The UND Placement Survey was developed in 1997 through the partnership of Career Services and Institutional Research for the purpose of collecting demographic and employment information on recent University of North Dakota graduates. Over the years the use of this information has expanded and is now being used for university assessment purposes, provided to academic colleges, various offices and service areas across campus, and used for a number of internal and external questions regarding job placement and salary data.
The 2009-2010 survey (Appendix 1) was conducted using the traditional paper-and-pencil method. The UND Institutional Review Board (IRB) approved this study (IRB-200908-020).
B. METHODOLOGY The UND Alumni Foundation provided mailing labels containing graduates who earned a
Bachelor’s degree from UND in December 2007, May 2008, or August 2008. An invitation letter and questionnaire were mailed to the above described 1,736 undergraduate alumni by the Office of Institutional Research on October 1, 2009. Four follow-up mailings were sent to non-respondents to promote participation and to make the results as representative as possible. In early February 2010 the survey was closed.
C. RESPONSE RATE
Of the 1,736 survey packages mailed, 115 came back with no forwarding addresses. A total of 624 valid placement surveys were returned. After adjusting for the undeliverables, the survey yielded a response rate of 38%.
D. DATA ANALYSIS Two methods of statistical analysis were used in this descriptive study. Means and frequencies were calculated to examine differences between comparison items as well as over time (see tables in Appendixes 2-4) and content analysis was performed to identify themes from the alumni’s comments (Appendix 5).
E. SELECTED RESULTS 1. Demographic Information
Of the 624 respondents, 177 (28%) graduated in December 2007, 346 (55%) graduated in May 2008, 70 (11%) graduated in August 2008, and the remaining 31 (5%) respondents either did not respond or supplied a later date. The majority of the respondents are female (n=335 or 54%) compared with 289 (46%) male respondents (Table 1). Of the 624 respondents, 206 (33%) are from Arts and Sciences, 112
2009-2010 Placement Survey Office of Institutional Research, University of North Dakota April 20, 2010
_________________________________________________________________________________________________________ Page 5

(18%) are from Business and Public Administration, 86 (14%) are from Odegard School of Aerospace Sciences, 75 (12%) are from Education and Human Development, 67 (11%) are from Engineering and Mines, 54 (9%) are from Nursing, and 24 (4%) are from Medicine and Health Sciences (Table 1).
A total of 288 respondents (46%) graduated from high schools in North Dakota, 197 (32%) graduated from high schools in Minnesota, 129 (21%) graduated from U.S. high schools outside of North Dakota and Minnesota, 9 (1%) respondents graduated from another country, and 1 respondent did not report where their high school was located (Table 5).
2. Employment Information
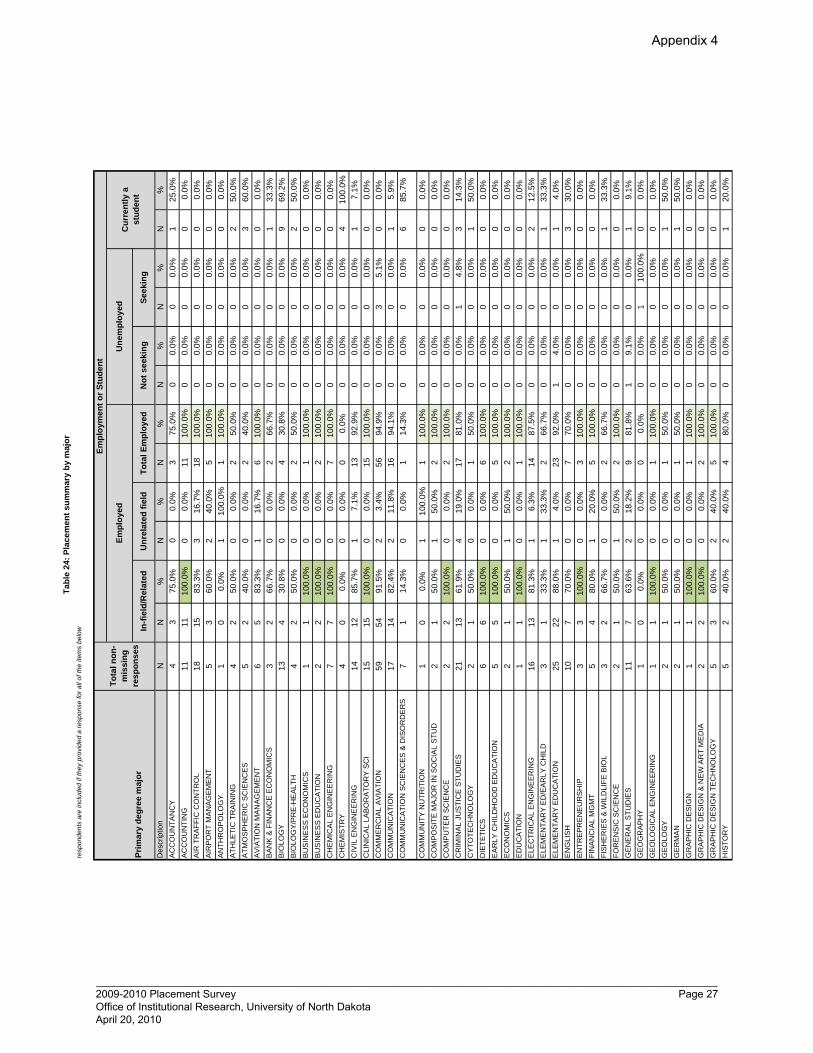
When asked to indicate employment status, 479 (77%) respondents reported being employed, 28 (5%) unemployed and 113 (18%) reported being a current student (Table 2). Last year it was reported that 568 (82%) respondents were employed, 19 (3%) unemployed, and 104 (15%) a student. Overall for the current survey, 592 (95%) of the respondents indicated being either employed or currently a student. While 95% is relatively high, this is the lowest percentage recorded in the ten-plus years that this survey has been administered (Table 17). The colleges with percentage rates below the mean are Arts and Sciences (93.2% employed or student), Engineering and Mines (94.0% employed or student) and Odegard School of Aerospace Sciences (94.1% employed or student). Up until last year, Engineering and Mines’ students had been reporting one of the highest employment or enrollment rates for nearly the entire decade. Table 24 is a new table that reports employment rates by (primary) major. Forty-one of the 83 major fields produced 100% employment and of those, 27 major fields produced 100% of their students employed in an in-field or related career path. 3. Pursuing Additional Education
The survey asked “Whether you are employed or not, are you currently a student?” One hundred seventy-two respondents (28%) are pursuing additional education; 140 as full-time students and 32 as part-time students (Table 3). Of the 172 of respondents, 64 (37%) are studying at UND. Another 10 students are pursuing a degree at one of the University of Minnesota institutions followed by 5 students indicating enrollment at North Dakota State University. Last year, a total of 158 (23%) of the respondents reported pursuing additional education and 50 (32%) studied at UND.
Table 3 also lists advanced education by gender. Females (n=117) pursue an additional degree at more than twice the rate as males (n=55). At UND, 70% of the re-enrollees are females (n=45) compared to 30% males (n=19).
Table 4 lists the degrees that the respondents report pursuing. Of the 156 respondents, 15 (10%) are pursuing a degree less than a Master’s degree, 88 (56%) are pursuing a Master’s degree and 53 (34%) are pursuing a Doctorate/professional degree. Table 4a reports this information for the last four years and shows that this is a year that more students are pursuing another degree. 4. Place of Residence
Recent UND graduates are residing across the country (Table 6). Respondents reported residing in 49 states, the U.S. territory of Guam (n=1), and countries of Hong Kong (n=1), Ireland (n=1), Japan (n=1), Malawi (n=1) and Morocco (n=1). A total of 249 (40%) graduates are residing in North Dakota and 174 (28%) graduates reside in Minnesota.
2009-2010 Placement Survey Office of Institutional Research, University of North Dakota April 20, 2010
_________________________________________________________________________________________________________ Page 6

Tables 7a and 7b present current residence of respondents by academic college. Reported from Table 7b, of the 624 respondents, 249 (40%) are currently living in North Dakota, 174 (28%) reside in Minnesota, and 201 (32%) reside in other states/countries.
Looking at the North Dakota residency distribution by college, 52% of the 54 nursing student respondents reside in state which is up from the 38% reported in North Dakota last year. In fact, counting the College of Nursing students, five of the seven colleges are seen with the largest percentage of their graduating students still residing in North Dakota (A&S=43%, BPA=44%, EHD=48%, SMHS=42%); the two colleges with fewer North Dakota residents are Odegard School of Aerospace Sciences (23%) and Engineering and Mines (25%). Last year, only two colleges had more North Dakota graduates residing in-state: Education and Human Development (44%) and Nursing (38%).
5. North Dakota Retention Information
With so many more graduates currently residing in North Dakota, it is no surprise that North Dakota is seeing the highest rate of retention to date (of 13 survey administrations, see Table 22). While only 48% of the UND respondents (who graduated from high school in North Dakota) stayed in North Dakota last year, 60% were retained this year (Table 8). A similar trend, although not nearly the high percentage rates as reported for North Dakota, is seen with prior Minnesota residents (students graduating from Minnesota high schools). That is, North Dakota is seeing the highest rate of retention to date of Minnesotans choosing to stay in North Dakota (Table 23) with 21% of the respondents indicating their current residency in North Dakota. In addition, 25% of the UND graduates (34 of 138 respondents) who graduated from a U.S. high school outside of North Dakota or Minnesota are currently residing in North Dakota. This is up from the 14% (21 of 153 respondents) reported last year.
In summary, of the 249 UND graduates currently residing in North Dakota, 173 (70%) graduated from high school in North Dakota, 42 (17%) graduated from high school in Minnesota, and 34 (14%) graduated from high schools from states (or country) outside of North Dakota and Minnesota.
6. North Dakota Employment Information
In response to the question, “Do you believe there are job opportunities for you in your area of interest in North Dakota,” 400 (64%) respondents indicated “yes”, 113 (18%) indicated “no”, 104 (17%) indicated “not sure”, and 6 (1%) did not respond (Table 9). Again, the affirmative response is higher than last year when 59% of the respondents indicated “yes” for North Dakota job opportunities and 24% responded “no”. Respondents who graduated from North Dakota high schools are more likely to believe the existence of the job opportunities (73%) in their area of interest in North Dakota than their counterparts who graduated from high schools in Minnesota (66%), and other states (43%). Last year, 64% of the North Dakota graduates responded “yes” compared to 57% of Minnesotans and 50% of students in other states.
When asked, “If a job were available in your area of interest, would you want employment in North Dakota?” (Table 10). A total of 292 (47%) respondents indicated “yes” (last year=41%) and 193 (31%) indicated “no” (last year=37%). Those who responded “not sure” fell into the same percentage as last year at 22%. Again, respondents who graduated from North Dakota high schools (64%) are more likely to want to accept employment in their area of interest in North Dakota than their counterparts who graduated from high schools in Minnesota (37%), and other states (25%). The most significant change from last year was with the number of graduates who are from Minnesota. Last year, only 25% of
2009-2010 Placement Survey Office of Institutional Research, University of North Dakota April 20, 2010
_________________________________________________________________________________________________________ Page 7

Minnesotans expressed interest in possible employment in North Dakota compared to the more recent 37%. The larger gap wasn’t seen with the North Dakota group as 61% reported last year their interest in North Dakota employment.
Respondents were also asked to explain the reasons they would or would not want employment in North Dakota. A content analysis was performed to identify themes from their comments (Appendix 5); 401 of the 624 respondents (64%) entered their comments. Respondents indicating “yes” they would want employment in North Dakota frequently cited the following reasons: close to family, like the community or state, job opportunities, good place to raise a family, and cost of living. Respondents indicating “no” they would not want employment in North Dakota frequently cited the following reasons: climate, proximity to family, preference for another state, preference for living in a metropolitan area. Fewer than in the past cited reasons such as limited career advancement opportunities or low salaries as a reason for not preferring North Dakota. Respondents indicating “not sure” if they would want employment in North Dakota frequently cited the following reasons: limited job opportunities, preference for another location or larger metropolitan area, and proximity to family. 7. Employer and Annual Salary Information
In the final section of the survey, the question “Who is your current employer?” was stated as “optional” with the expectation that not all respondents would report the name of their employer. Of the 624 respondents, 519 (83%) reported the name of employers with 11 respondents reporting being self-employed. Information about the 519 employer names (Appendix 6) can be requested by contacting the UND Career Services Office.
Another survey question, “What is your current annual salary?” was also stated as “optional” with the expectation that not all respondents would feel comfortable indicating their salary. Of the 624 respondents, 445 (71%) provided their salary information. After excluding the salaries of respondents who identified themselves as students, 416 (67%) salaries were used for calculating various averages. The reported annual salaries range from $9,900 to $160,000. The average annual salary reported was $40,793 (Table 11), up slightly from the $39,135 reported last year. Average annual reported salary was $42,413 for males, which is higher than the $39,173 reported for females. Overall, UND female graduates on average earn 92% of the annual salary of UND male graduates. This is higher than the 87% ratio reported last year but lower than the 97% ratio two years prior.
Males averaged higher salaries than females in six of the seven colleges. The only college with women reporting a higher salary than men was in Education and Human Development (F = 102% of M). The six colleges where men reported the higher average salaries were in: Arts and Sciences (F = 94% of M), Business and Public Administration (F = 94% of M), Odegard School of Aerospace Sciences (F = 95% of M), Nursing (F = 77% of M), Engineering and Mines (F = 95% of M), and Medicine and Health Sciences (F = 87% of M).
Disparities in salary based on the geographic locations among respondents were also observed (Table 12). The average annual salary is $35,532 for those currently residing in North Dakota ($35,518 last year), $42,665 for those residing in Minnesota ($39,576 last year) and $45,264 for those residing outside of North Dakota or Minnesota ($41,439 last year). When comparing average salary by college, the highest average annual salary of $62,306 was reported by the Engineering and Mines respondents. The Engineering students residing outside of North Dakota and Minnesota reported the overall highest
2009-2010 Placement Survey Office of Institutional Research, University of North Dakota April 20, 2010
_________________________________________________________________________________________________________ Page 8

average salary at $70,000. By comparison, the lowest average annual salary ($23,033) was reported by respondents graduating from Odegard School of Aerospace Sciences who currently reside in North Dakota, followed by graduates from Education and Human Development who currently reside in Minnesota who reported their average salary of $29,246.
Salary data is also presented by degree major in Table 25. 411 non-student respondents reported their degree major as well as their salary. The largest differences between low and high salaries within the degree major categories are found with mechanical engineering (low=$48,000 to high=$145,000), marketing (low=$24,900 to high=$112,000), general studies (low=$11,000 to high=$98,000), management (low=$24,000 to high=$100,000), and communication (low=$29,995 to high=$90,000).
8. Internship/Cooperative Education Participation
Among the 621 graduates who responded to this question, 286 (46%) indicated that they were involved in an internship or cooperative education program while attending UND (Table 13-1), up from the 40% who indicated such participation last year. The highest percentage of participants is seen from Medicine and Health Sciences (71%), Engineering and Mines (65%), Business and Public Administration (62%) and Nursing (61%). The fewest participants are from Odegard School of Aerospace Sciences (29%) and Arts and Sciences (30%). About half (49%) of the respondents from Education and Human Development participated in an internship or cooperative education program. Sixty-six percent of respondents who participated in an internship or cooperative education program indicated that their current employment position is “directly related” to the education they received at UND compared to 62% who did not participate in an internship or cooperative education program (Table 14-1).
Of the internship/cooperative education participants, 210 respondents reported an average annual salary of $42,461. In comparison, 213 respondents, who did not participate in an internship or cooperative education program and gave annual salary information, reported an average annual salary of $39,134 (Table 14-2) representing a $3,327 difference in earned salary. Last year the difference in salary of those reporting participation or not was $2,393.
9. Current Position in Relation to UND Education
When asked “How closely is your current position related to the education you received at UND?” 579 graduates responded to that question. Overall, 513 (89%) indicated that their current position is either “directly related” or “somewhat related” to the education they received at UND (Table 13-2). The graduates reporting at the highest rate that their current position is “directly related” or “somewhat related,” graduated from the Medicine and Health Sciences (100%), Nursing (98%), Odegard School of Aerospace Sciences (92%) and Education and Human Development (90%). Graduates from Business and Public Administration (90%) and Engineering and Mines (89%) also reported a high relationship between their current position and their UND education. Respondents from the College of Arts and Sciences (81%) reported the lowest relationship between their current position and their UND education.
2009-2010 Placement Survey Office of Institutional Research, University of North Dakota April 20, 2010
_________________________________________________________________________________________________________ Page 9

10. UND Career Services/Cooperative Education Office
Three-hundred forty-seven (57%) respondents indicated that they had used the services of or attended events sponsored by the UND Career Services/Cooperative Education Office while attending UND (Table 15-1). By college, Nursing (77%), Engineering and Mines (77%) and Business and Public Administration (71%) are the students participating the most in these events or services. Fewer students from Medicine and Health Sciences (21%) and Education and Human Development (38%) reported they had used Career Services or attended related events.
Of those respondents who reported that their current employment is “directly related” to the education they received at UND, 57% indicated they had used Career Services while they studied at UND, compared to 43% who did not use Career Services or attend related events (Table 15-2). Of the respondents reporting that their current employment is “somewhat related” to the education they received at UND, a similar trend was seen; 60% indicated using Career Services, compared to 40% who did not use these services. Lastly, of the respondents who reported that their current employment was “not at all related” to the education they received at UND, 55% indicated they had used Career Services, compared to 45% who did not use Career Services or attended related events.
11. Final Observations
During times of high unemployment and economic recovery, it is important to watch trends such as the ones obtained through a placement survey. These trends help provide career-related information so the institution can help promote various services and events that help students find more success in the job market. For example, students who participate in internships see a higher relationship between their current position and education. Students who participate in internships or co-op programs also earn a higher salary than those students who don’t participate in these programs. Students who attend Career Services events or partake in their services also see a higher relationship between their current position and education.
For North Dakota residents (those graduating from a North Dakota high school) the retention rate increased considerably from last year’s rate of 48% to 60% this year. However, there is still a large exodus from North Dakota of educated and talented graduates – of which many of them report that they believe there are opportunities in the state. That is, 64% of recent graduates believe job opportunities exist in North Dakota but only 40% of them stay.
Research shows that when there is high unemployment, student enrollment heightens. This similar trend is apparent at UND. Last year 23% of the respondents reported pursuing additional education compared to this year’s 28%. Also, more students are staying at UND with 32% reporting UND enrollment last year compared to 37% this year.
Information collected by this survey can be a benefit not only to Career Services, but to the colleges and individual departments at UND as well. This information can be used by offices in resource allocation, curriculum planning and determining how well they are accomplishing their goals. These offices can also use the information to help answer career-related questions from student inquiries, such as entering salary data by program, employment rates, additional education pursued, and employers of UND’s recent graduates.
2009-2010 Placement Survey Office of Institutional Research, University of North Dakota April 20, 2010
_________________________________________________________________________________________________________ Page 10

F. TEN-YEAR TRENDS BASED ON PREVIOUS PLACEMENT STUDIES Appendix 3 contains year-by-year information on graduation years of 1998-1999 to 2007-2008.
Table 17 & Chart 1: Employment status Table 18 & Chart 2: Annual salary Table 19 How closely is your current position related to your education? Table 20: Do you believe there are job opportunities in your area of interest in ND? Table 21: If a job were available in your area of interest, would you want employment in ND? Table 22 & Chart 3: Retention of North Dakota High School Graduates in ND after attending UND Table 23 & Chart 4: Retention of Minnesota High School Graduates in ND after attending UND
2009-2010 Placement Survey Office of Institutional Research, University of North Dakota April 20, 2010
_________________________________________________________________________________________________________ Page 11

2009-2010 Placement SurveyPlease fill out the survey and mail it to: Office of Institutional Research University of North Dakota Grand Forks, ND 58202-7106 or fax it to 701-777-2494. Thank you.
The University of North Dakota Institutional Review Board has approved this study (IRB-2008##-###). The survey data will be kept confidential and anonymous. It will be analyzed by demographic variables (academic majors, geographic locations, and gender) and studied in aggregate form.
1. When did you complete your last degree at UND? ____ 1) December 2007 ____ 2) May 2008 ____ 3) August 2008 4) Others (write in) _________ 2. What was your last degree? ______________________ (such as Bachelor of Science in Chemistry)
Your last major: _____________________ (first major), _________________ (second major, if applicable) 3. What is your gender? ____ 1) male ____ 2) female 4. In which U.S. state or country did you graduate from high school? ________________________________ 5. In which U.S. state or country do you currently reside? _________________________________________ 6. While you were a student, did you participate in an internship or co-op program? ___ 1) yes ___ 2) no 7. Did you use the services, and/or attend events sponsored by UND Career Services or Cooperative Education while you studied at UND? ____ 1) yes ____ 2) no 8. Do you believe there are job opportunities for you in your area of interest in North Dakota? ____ 1) yes ____ 2) no ____ 3) not sure 9. If a job were available in your area of interest, would you want employment in North Dakota? ____ 1) yes ____ 2) no ____ 3) not sure
Why or why not? __________________________________________________________________________ 10. Which of the following best describes your current status: (please choose only one) ____ 1) currently employed, not seeking employment ____ 2) currently employed, seeking other employment ____ 3) currently unemployed, not seeking employment ____ 4) currently unemployed, seeking employment ____ 5) currently a student 11. Whether you are employed or not, are you currently a student? ____ 1) yes, part-time ____ 2) yes, full-time ____ 3) not currently a student
If currently a student, which school are you attending? ____________________________________ Degree(s) pursuing: _____________________ Major(s): ___________________________________ When did you start pursuing additional education? Fall of ____ Spring of ____ Summer of ____
12, Who is your current employer? ___________________________________________________________ 13. What is your current position/title? ________________________________________________________ _ 14. What is your current annual salary? _______________________________________________________ 15. How closely is your current position related to the education you received at UND? ____ 1) directly related ____ 2) somewhat related ____ 3) not at all relate
2009-2010 Placement Survey Office of Institutional Research, University of North Dakota April 20, 2010
_________________________________________________________________________________________________________ Page 12
Appendix 1

Tables 1-15 All tables and graphs utilize the following abbreviations
Abbreviation College Abbreviation College Abbreviation College
A&S Arts and Sciences JDOSAS John D. Odegard School of Aerospace Sciences
SEM Engineering and Mines
BPA Business and Public Administration NURS Nursing SMHS
School of Medicine and Health Sciences
EHD Education and Human Development
Table 1. Demographics of survey respondents
College
Total Respondents Male Female
N % N N
A&S 206 33.0% 75 131
BPA 112 17.9% 66 46
EHD 75 12.0% 14 61
JDOSAS 86 13.8% 70 16
NURS 54 8.7% 6 48
SEM 67 10.7% 53 14
SMHS 24 3.8% 5 19
Total 624 100.0% 289 335
Table 2. Which of the following best describes you?
College Total
Respondent
Employed Unemployed
Currently a Student
Currently employed or a student (by
college)
Not Seeking Seeking
Not Seeking Seeking Number Percent
A&S 205 81 35 4 10 75 191 93.2%
BPA 111 81 22 0 2 6 109 98.2%
EHD 74 46 13 1 1 13 72 97.3%
JDOSAS 85 44 33 0 5 3 80 94.1%
NURS 54 49 3 1 0 1 53 98.1%
SEM 67 49 5 0 4 9 63 94.0%
SMHS 24 16 2 0 0 6 24 100.0%
Total 620 366 113 6 22 113 592 95.5%
2009-2010 Placement Survey Office of Institutional Research, University of North Dakota April 20, 2010
_________________________________________________________________________________________________________ Page 13
Appendix 2
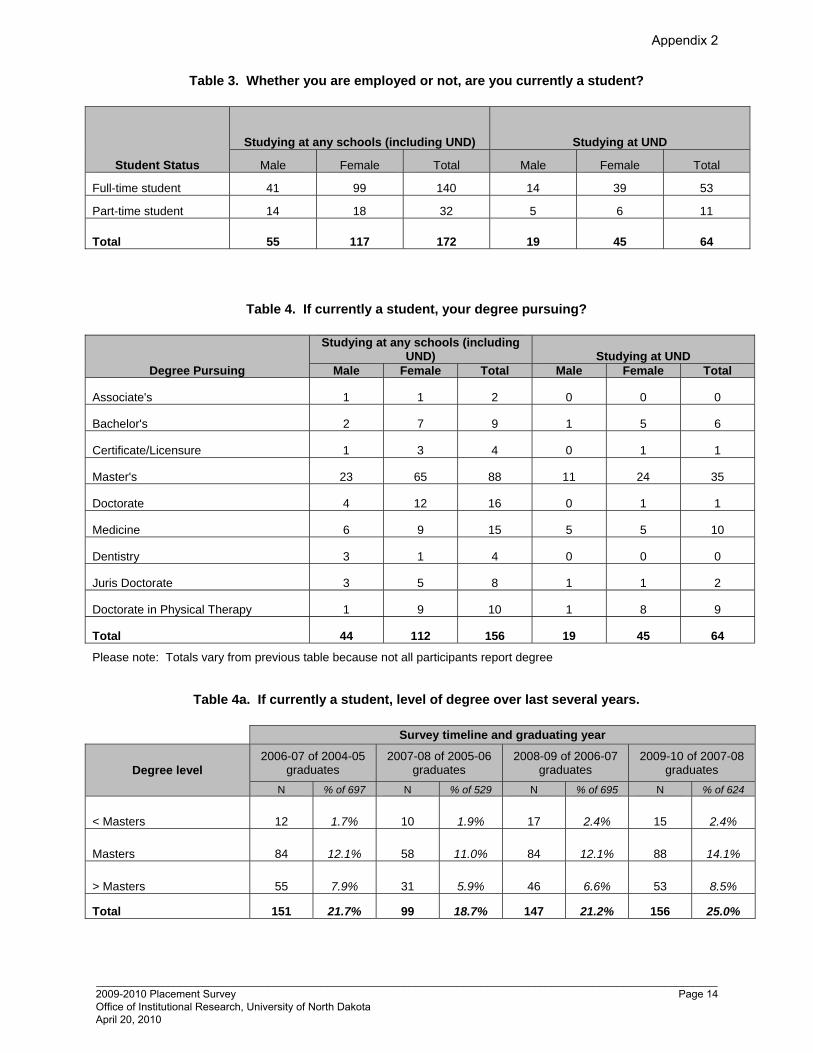
Table 3. Whether you are employed or not, are you currently a student?
Student Status
Studying at any schools (including UND) Studying at UND
Male Female Total Male Female Total
Full-time student 41 99 140 14 39 53
Part-time student 14 18 32 5 6 11
Total 55 117 172 19 45 64
Table 4. If currently a student, your degree pursuing?
Degree Pursuing
Studying at any schools (including UND) Studying at UND
Male Female Total Male Female Total
Associate's 1 1 2 0 0 0
Bachelor's 2 7 9 1 5 6
Certificate/Licensure 1 3 4 0 1 1
Master's 23 65 88 11 24 35
Doctorate 4 12 16 0 1 1
Medicine 6 9 15 5 5 10
Dentistry 3 1 4 0 0 0
Juris Doctorate 3 5 8 1 1 2
Doctorate in Physical Therapy 1 9 10 1 8 9
Total 44 112 156 19 45 64
Please note: Totals vary from previous table because not all participants report degree
Table 4a. If currently a student, level of degree over last several years.
Survey timeline and graduating year
Degree level 2006-07 of 2004-05
graduates 2007-08 of 2005-06
graduates 2008-09 of 2006-07
graduates 2009-10 of 2007-08
graduates N % of 697 N % of 529 N % of 695 N % of 624
< Masters 12 1.7% 10 1.9% 17 2.4% 15 2.4%
Masters 84 12.1% 58 11.0% 84 12.1% 88 14.1%
> Masters 55 7.9% 31 5.9% 46 6.6% 53 8.5%
Total 151 21.7% 99 18.7% 147 21.2% 156 25.0%
2009-2010 Placement Survey Office of Institutional Research, University of North Dakota April 20, 2010
_________________________________________________________________________________________________________ Page 14
Appendix 2

Table 5. In which state did you graduate from high school? State / Country A & S BPA EHD JDOSAS NURS SEM SMHS Total N
Total %
ND 114 61 44 5 31 24 9 288 46.2% MN 62 32 23 26 15 29 10 197 31.6% SD 6 6 1 7 2 2 1 25 4.0% WA 3 1 9 3 16 2.6% MT 2 1 1 2 2 2 10 1.6% CO 2 2 2 3 9 1.4% CA 2 1 5 8 1.3% WI 2 1 4 1 8 1.3% IA 1 1 1 2 1 1 1 8 1.3% HI 1 4 5 0.8% OR 1 1 1 1 4 0.6% TX 1 2 3 0.5% NM 1 1 1 3 0.5% IL 2 2 0.3% NY 1 1 2 0.3% AZ 1 1 2 0.3% OH 2 2 0.3% ID 1 1 2 0.3% MO 1 1 2 0.3% IN 1 1 2 0.3% NC 1 1 2 0.3% WY 1 1 0.2% PA 1 1 0.2% VA 1 1 0.2% NE 1 1 0.2% UT 1 1 0.2% NJ 1 1 0.2% FL 1 1 0.2% AK 1 1 0.2% MA 1 1 0.2% LA 1 1 0.2% DE 1 1 0.2% KY 1 1 0.2% CT 1 1 0.2% SC 1 1 0.2% NH 0 0.0% MD 0 0.0% MI 0 0.0% GA 0 0.0% KS 0 0.0% NV 0 0.0% MS 0 0.0% AL 0 0.0% AR 0 0.0% ME 0 0.0% TN 0 0.0% US Total 202 111 73 86 52 66 24 614 98.6% Other Countries 4 1 2 1 1 9 1.4% ALL 206 112 75 86 53 67 24 623 100.0% Unknown 1 1 Total 206 112 75 86 54 67 24 624
2009-2010 Placement Survey Office of Institutional Research, University of North Dakota April 20, 2010
_________________________________________________________________________________________________________ Page 15
Appendix 2

Table 6. In which state do you currently reside? State / Country A & S BPA EHD JDOSAS NURS SEM SMHS Total N
Total %
ND 89 49 36 20 28 17 10 249 40% MN 54 38 22 15 13 23 9 174 28% CO 9 6 3 2 2 3 2 27 4% WA 2 2 7 6 17 3% TX 4 1 1 2 1 4 13 2% AZ 4 1 1 1 2 1 10 2% WI 2 1 5 1 1 10 2% IA 4 3 1 1 9 1% CA 2 2 1 1 2 1 9 1% IL 4 1 2 1 1 9 1% NC 4 2 1 7 1% FL 2 3 1 6 1% SD 2 1 2 1 6 1% MI 2 3 5 1% AK 1 2 2 5 1% DC 2 2 4 1% MT 1 1 1 3 0% VA 1 2 3 0% OR 3 3 0% GA 1 1 1 3 0% NV 2 1 3 0% NY 1 2 3 0% NE 1 2 3 0% OK 1 2 3 0% OH 2 2 0% ID 1 1 2 0% IN 1 1 2 0% CT 2 2 0% KS 1 1 2 0% AL 2 2 0% MO 1 1 2 0% HI 1 1 2 0% MA 1 1 0% PA 1 1 0% WY 1 1 0% UT 1 1 0% NM 1 1 0% TN 1 1 0% SC 1 1 0% AR 1 1 0% NJ 0 0% MD 0 0% NH 0 0% LA 0 0% ME 0 0% MS 0 0% WV 0 0% KY 0 0% State Unknown 3 1 3 2 9 1%
US Total 203 111 74 85 54 67 23 617 99% Other Countries 2 1 1 1 1 6 1%
All 205 112 75 86 54 67 24 623 100% Unknown 1 1 0% Total 206 112 75 86 54 67 24 624 100%
2009-2010 Placement Survey Office of Institutional Research, University of North Dakota April 20, 2010
_________________________________________________________________________________________________________ Page 16
Appendix 2

Table 7a: In which state do you currently reside? (percentage by state group)
College # of
Respondent
North Dakota Minnesota All Others
N % per state N % per state N % per state
A&S 206 89 35.7% 54 31.0% 63 31.3%
BPA 112 49 19.7% 38 21.8% 25 12.4%
EHD 75 36 14.5% 22 12.6% 17 8.5%
JDOSAS 86 20 8.0% 15 8.6% 51 25.4%
NURS 54 28 11.2% 13 7.5% 13 6.5%
SEM 67 17 6.8% 23 13.2% 27 13.4%
SMHS 24 10 4.0% 9 5.2% 5 2.5%
Total 624 249 100.0% 174 100.0% 201 100.0%
Table 7b: In which state do you currently reside?
(percentage by college)
College # of
Respondent
North Dakota Minnesota All Others
N % per
college N % per
college N % per
college
A&S 206 89 43.2% 54 26.2% 63 30.6%
BPA 112 49 43.8% 38 33.9% 25 22.3%
EHD 75 36 48.0% 22 29.3% 17 22.7%
JDOSAS 86 20 23.3% 15 17.4% 51 59.3%
NURS 54 28 51.9% 13 24.1% 13 24.1%
SEM 67 17 25.4% 23 34.3% 27 40.3%
SMHS 24 10 41.7% 9 37.5% 5 20.8%
Total 624 249 39.9% 174 27.9% 201 32.2%
2009-2010 Placement Survey Office of Institutional Research, University of North Dakota April 20, 2010
_________________________________________________________________________________________________________ Page 17
Appendix 2

Table 8. Retention in North Dakota
Retention in North Dakota Current Residence
Percentage retained from ND HS to current ND resident->
ND MN Other states
Other countries Unknown Total
60.1%
High School Location
ND 288 173 50 64 1 0 288
MN 197 42 106 48 1 0 197
Other states 129 32 17 76 4 0 129
Other countries 9 2 1 6 0 9
Unknown 1 0 1 1
Total 624 249 174 194 6 1 624
Table 9. Do you believe there are job opportunities for you in your area of interest in North Dakota?
Believe there are job
opportunity in ND
# of Respondent ND high school
graduate MN high school
graduate Other state high school graduate Other countries
N % N % N % N % N %
Yes 400 64.2% 210 72.9% 130 66.0% 57 42.5% 3 75.0%
No 113 18.1% 40 13.9% 27 13.7% 45 33.6% 1 25.0%
Not Sure 104 16.7% 36 12.5% 38 19.3% 30 22.4% 0.0%
Did not report 6 1.0% 2 0.7% 2 1.0% 2 1.5% 0.0%
Total 623 100.0% 288 100.0% 197 100.0% 134 100.0% 4 100.0%
Table 10. If a job were available in your area of interest would you want employment in North Dakota?
Want employment
in ND
# of Respondent ND high school
graduate MN high school
graduate Other state high school graduate Other countries
N % N % N % N % N %
Yes 292 46.9% 183 63.5% 72 36.5% 34 25.4% 3 75.0%
No 193 31.0% 50 17.4% 75 38.1% 67 50.0% 1 25.0%
Not Sure 134 21.5% 53 18.4% 49 24.9% 32 23.9% 0.0%
Did not report 4 0.6% 2 0.7% 1 0.5% 1 0.7% 0.0%
Total 623 100.0% 288 100.0% 197 100.0% 134 100.0% 4 100.0%
2009-2010 Placement Survey Office of Institutional Research, University of North Dakota April 20, 2010
_________________________________________________________________________________________________________ Page 18
Appendix 2

Table 11. What is your current annual salary? (assistantships excluded)
College
Self-reported salary 2009-10
Gender N Mean F:M Mean
Ratio Minimum Maximum
A & S
Female 56 $36,030
93.8%
$11,000 $160,000
Male 43 $38,396 $10,500 $80,000
Total 99 $37,058 $10,500 $160,000
BPA
Female 36 $39,627
93.5%
$15,000 $112,000
Male 53 $42,380 $14,440 $100,000
Total 89 $41,267 $14,440 $112,000
EHD
Female 42 $30,254
101.6%
$10,000 $41,000
Male 11 $29,772 $16,000 $60,000
Total 53 $30,154 $10,000 $60,000
JDOSAS
Female 11 $32,227
95.0%
$20,000 $60,000
Male 59 $33,933 $9,900 $65,000
Total 70 $33,665 $9,900 $65,000
NURS
Female 40 $47,348
76.8%
$32,000 $90,000
Male 3 $61,666 $40,000 $80,000
Total 43 $48,347 $32,000 $90,000
SEM
Female 11 $59,918
95.0%
$48,000 $90,000
Male 35 $63,088 $40,000 $145,000
Total 46 $62,306 $40,000 $145,000
SMHS
Female 12 $43,891
86.9%
$16,000 $60,000
Male 4 $50,500 $40,000 $60,000
Total 16 $45,543 $16,000 $60,000
Total
Female 208 $39,173
92.4%
$10,000 $160,000
Male 208 $42,413 $9,900 $145,000
Total 416 $40,793 $9,900 $160,000
Appendix 2
2009-2010 Placement Survey Office of Institutional Research, University of North Dakota April 20, 2010
_________________________________________________________________________________________________________ Page 19

Table 12. Average annual salary by college and current residing state (assistantships excluded)
College
Total Number of Survey Respondents
(n=290) Residing in North
Dakota (n=80) Residing in
Minnesota (n=84)
Residing in Other than ND & MN
(n=126)
N Average salary N
Average salary N
Average salary N
Average salary
A&S 99 $37,058 40 $31,611 33 $38,955 26 $43,031
BPA 89 $41,267 35 $36,942 32 $44,210 22 $43,865
EHD 53 $30,154 30 $30,319 13 $29,246 10 $30,840
JDOSAS 70 $33,665 15 $23,033 13 $34,077 42 $37,335
NURS 43 $48,347 23 $45,702 10 $53,039 10 $49,738
SEM 46 $62,306 11 $56,318 14 $55,472 21 $70,000
SMHS 16 $45,543 4 $32,750 9 $51,111 3 $45,900
Total Respondents 416 $40,793 158 $35,532 124 $42,665 134 $45,264
Table 13-1. Did you participate in an internship or co-op program?
College
Number of respondents
answered this question
Participated in an internship or co-op
Did not participate in an internship or co-op
N % per college N % per college
A&S 204 62 30.4% 142 69.6%
BPA 112 69 61.6% 43 38.4%
EHD 75 37 49.3% 38 50.7%
JDOSAS 86 25 29.1% 61 70.9%
NURS 54 33 61.1% 21 38.9%
SEM 66 43 65.2% 23 34.8%
SMHS 24 17 70.8% 7 29.2%
Total 621 286 46.1% 335 53.9%
2009-2010 Placement Survey Office of Institutional Research, University of North Dakota April 20, 2010
_________________________________________________________________________________________________________ Page 20
Appendix 2

Table 13-2. How closely is your current position related to the education you received at UND?
College
Number of respondents
answered this question
Directly Related Somewhat Related Not at all Related
N % per
college N % per
college N % per
college
A&S 177 77 43.5% 67 37.9% 33 18.6%
BPA 108 53 49.1% 44 40.7% 11 10.2%
EHD 73 55 75.3% 11 15.1% 7 9.6%
JDOSAS 84 74 88.1% 3 3.6% 7 8.3%
NURS 52 50 96.2% 1 1.9% 1 1.9%
SEM 63 41 65.1% 15 23.8% 7 11.1%
SMHS 22 20 90.9% 2 9.1% 0.0%
Total 579 370 63.9% 143 24.7% 66 11.4%
Table 14-1. Did you participate in an internship or co-op program? (by the position related to the UND education)
Internship or Co-op Program Participation
How closely the position related to the UND education Directly related Somewhat related Not at all related Total respondents N % N % N % N %
Completed an internship or co-op 177 65.8% 67 24.9% 25 9.3% 269 100.0% Did not participate in an internship or co-op 191 62.2% 75 24.4% 41 13.4% 307 100.0%
Overall 368 63.9% 142 24.7% 66 11.5% 576 100.0%
Table 14-2. Average annual salary by internship or co-op participation
Internship or Co-op Program Participation
Annual Salary - Male Annual Salary - Female Annual Salary - Total *
N Mean N Mean N Mean
Completed an internship or co-op 87 $44,842 114 $40,642 201 $42,461
Did not participate in an internship or co-op 120 $40,755 93 $37,041 213 $39,134 N=number of respondents who provided their salary
2009-2010 Placement Survey Office of Institutional Research, University of North Dakota April 20, 2010
_________________________________________________________________________________________________________ Page 21
Appendix 2

Table 15-1. Did you use the services of or attend events sponsored by UND Career Services/Cooperative Education while you studied at UND? (by college)
College
Number of participants who
answered this question
Had Used Career Services Had Not Used Career Services
Total Total
N N % N %
A&S 202 106 52.5% 96 47.5%
BPA 110 78 70.9% 32 29.1%
EHD 74 28 37.8% 46 62.2%
JDOSAS 84 38 45.2% 46 54.8%
NURS 53 41 77.4% 12 22.6%
SEM 66 51 77.3% 15 22.7%
SMHS 24 5 20.8% 19 79.2%
Total 613 347 56.6% 266 43.4%
Table 15-2: Did you use the services of or attend events sponsored by UND Career Services/ Cooperative Education while you studied at UND? (by the position related to the UND education)
Your current position related to the education you
received at UND
Number of participants who answered both
questions
Had Used Career Services Had Not Used Career
Services
Total Total
N N % N %
Directly related 361 206 57.1% 155 42.9%
Somewhat related 142 85 59.9% 57 40.1%
Not at all related 66 36 54.5% 30 45.5%
Total 569 327 57.5% 242 42.5%
2009-2010 Placement Survey Office of Institutional Research, University of North Dakota April 20, 2010
_________________________________________________________________________________________________________ Page 22
Appendix 2

Ten Year Trends
Table 16: Response rate of graduates
Report Year 2000-2001
2001-2002
2002-2003
2003-2004
2004-2005
2005-2006
2006-2007
2007-2008
2008-2009
2009-2010
Graduation Year
1998-1999
1999-2000
2000-2001
2001-2002
2002-2003
2003-2004
2004-2005
2005-2006
2006-2007
2007-2008
Response Rate 60.0% 61.4% 54.6% 53.8% 42.0% 50.2% 44.2% 37.0% 40.2% 38.5%
Table 17: Percent employed or a student
UND Graduation
1998-1999
1999-2000
2000-2001
2001-2002
2002-2003
2003-2004
2004-2005
2005-2006
2006-2007
2007-2008
A&S 95.5% 93.8% 96.3% 96.6% 97.7% 96.8% 97.3% 96.1% 95.8% 93.2%
BPA 96.3% 95.1% 97.2% 97.2% 97.1% 95.0% 97.7% 97.3% 99.3% 98.2%
EHD 98.0% 95.6% 98.4% 98.4% 90.0% 96.9% 93.5% 94.4% 97.9% 97.3%
JDOSAS 97.9% 97.1% 97.5% 97.5% 92.9% 95.9% 99.2% 100.0% 96.0% 94.1%
NURS 100.0% 100.0% 98.3% 98.3% 100.0% 98.0% 94.9% 97.5% 96.9% 98.1%
SEM 97.1% 98.3% 100.0% 100.0% 100.0% 100.0% 100.0% 100.0% 97.6% 94.0%
SMHS 100.0% 98.8% 97.1% 97.1% 100.0% 100.0% 100.0% 100.0% 100.0% 100.0%
Overall 97.1% 96.6% 97.4% 96.5% 96.4% 96.6% 97.4% 97.5% 97.3% 95.5%
Table 18: What is your current annual salary? (*Assistantships excluded)
UND Grad Year
1998-1999
1999-2000
2000-2001
2001-2002*
2002-2003*
2003-2004*
2004-2005*
2005-2006*
2006-2007*
2007-2008
A&S $28,633 $31,122 $28,209 $30,110 $30,790 $28,425 $31,522 $33,829 $34,786 $37,058
BPA $33,972 $36,097 $36,788 $35,588 $43,188 $38,865 $38,857 $41,163 $41,052 $41,267
EHD $24,798 $26,942 $25,571 $27,820 $25,867 $28,700 $31,369 $31,510 $29,336 $30,154
JDOSAS $28,850 $32,064 $37,739 $33,376 $31,287 $34,317 $32,673 $32,635 $38,035 $33,665
NURS $35,001 $34,657 $38,521 $39,348 $41,229 $39,485 $43,236 $45,014 $42,161 $48,347
SEM $46,858 $51,470 $50,417 $44,072 $48,062 $50,340 $55,945 $56,232 $63,450 $62,306
SMHS $35,229 $40,019 $43,955 $39,173 $41,612 $47,350 $39,933 $44,111 $45,325 $45,543
2009-2010 Placement Survey Office of Institutional Research, University of North Dakota April 20, 2010
_________________________________________________________________________________________________________ Page 23
Appendix 3
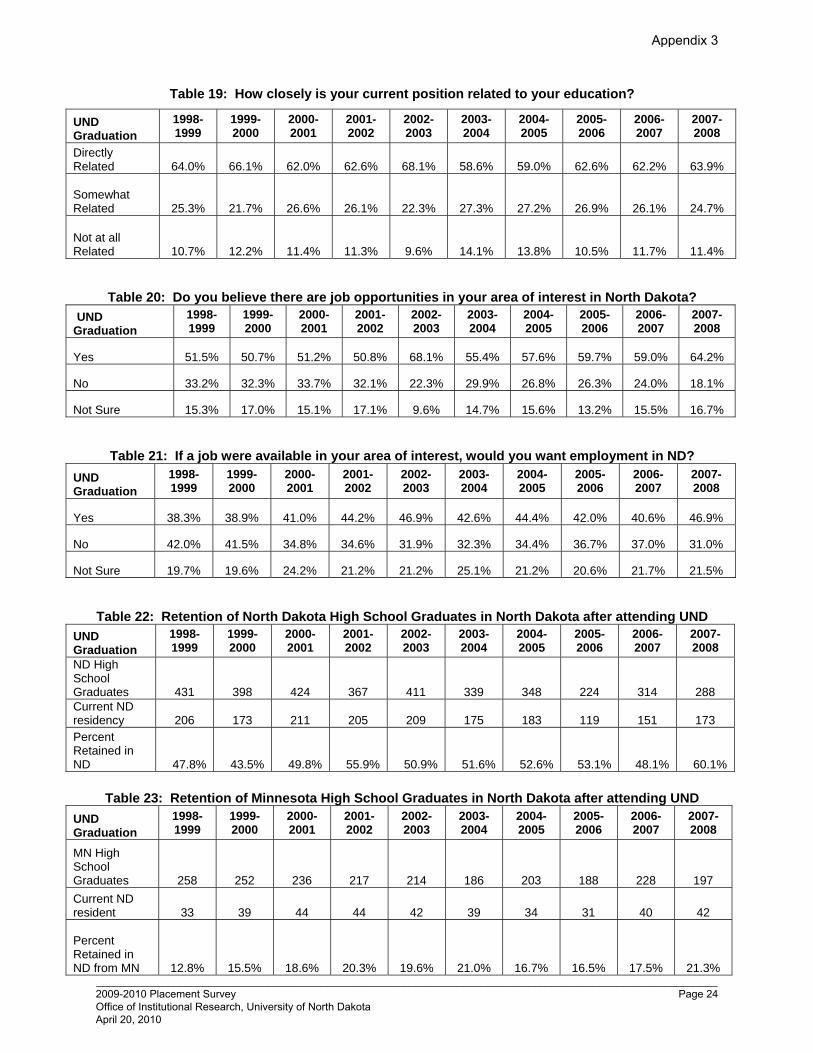
Table 19: How closely is your current position related to your education?
UND Graduation
1998-1999
1999-2000
2000-2001
2001-2002
2002-2003
2003-2004
2004-2005
2005-2006
2006-2007
2007-2008
Directly Related 64.0% 66.1% 62.0% 62.6% 68.1% 58.6% 59.0% 62.6% 62.2% 63.9%
Somewhat Related 25.3% 21.7% 26.6% 26.1% 22.3% 27.3% 27.2% 26.9% 26.1% 24.7%
Not at all Related 10.7% 12.2% 11.4% 11.3% 9.6% 14.1% 13.8% 10.5% 11.7% 11.4%
Table 20: Do you believe there are job opportunities in your area of interest in North Dakota? UND Graduation
1998-1999
1999-2000
2000-2001
2001-2002
2002-2003
2003-2004
2004-2005
2005-2006
2006-2007
2007-2008
Yes 51.5% 50.7% 51.2% 50.8% 68.1% 55.4% 57.6% 59.7% 59.0% 64.2%
No 33.2% 32.3% 33.7% 32.1% 22.3% 29.9% 26.8% 26.3% 24.0% 18.1%
Not Sure 15.3% 17.0% 15.1% 17.1% 9.6% 14.7% 15.6% 13.2% 15.5% 16.7%
Table 21: If a job were available in your area of interest, would you want employment in ND? UND Graduation
1998-1999
1999-2000
2000-2001
2001-2002
2002-2003
2003-2004
2004-2005
2005-2006
2006-2007
2007-2008
Yes 38.3% 38.9% 41.0% 44.2% 46.9% 42.6% 44.4% 42.0% 40.6% 46.9%
No 42.0% 41.5% 34.8% 34.6% 31.9% 32.3% 34.4% 36.7% 37.0% 31.0%
Not Sure 19.7% 19.6% 24.2% 21.2% 21.2% 25.1% 21.2% 20.6% 21.7% 21.5%
Table 22: Retention of North Dakota High School Graduates in North Dakota after attending UND
UND Graduation
1998-1999
1999-2000
2000-2001
2001-2002
2002-2003
2003-2004
2004-2005
2005-2006
2006-2007
2007-2008
ND High School Graduates 431 398 424 367 411 339 348 224 314 288 Current ND residency 206 173 211 205 209 175 183 119 151 173 Percent Retained in ND 47.8% 43.5% 49.8% 55.9% 50.9% 51.6% 52.6% 53.1% 48.1% 60.1%
Table 23: Retention of Minnesota High School Graduates in North Dakota after attending UND
UND Graduation
1998-1999
1999-2000
2000-2001
2001-2002
2002-2003
2003-2004
2004-2005
2005-2006
2006-2007
2007-2008
MN High School Graduates 258 252 236 217 214 186 203 188 228 197 Current ND resident 33 39 44 44 42 39 34 31 40 42
Percent Retained in ND from MN 12.8% 15.5% 18.6% 20.3% 19.6% 21.0% 16.7% 16.5% 17.5% 21.3%
2009-2010 Placement Survey Office of Institutional Research, University of North Dakota April 20, 2010
_________________________________________________________________________________________________________ Page 24
Appendix 3

Chart 1. Percentage of graduates reporting to be either employed or a student
Chart 2. Average annual salary of survey respondents
2009-2010 Placement Survey Office of Institutional Research, University of North Dakota April 20, 2010
_________________________________________________________________________________________________________ Page 25
Appendix 3

Chart 3. North Dakota employment of UND graduates who attended a ND high school
Chart 4. North Dakota employment of UND graduates who attended a MN high school
2009-2010 Placement Survey Office of Institutional Research, University of North Dakota April 20, 2010
_________________________________________________________________________________________________________ Page 26
Appendix 3
Prim
ary
degr
ee m
ajor
Des
crip
tion
NN
%N
%N
%N
%N
%N
%A
CC
OU
NTA
NC
Y4
375
.0%
00.
0%3
75.0
%0
0.0%
00.
0%1
25.0
%A
CC
OU
NTI
NG
1111
100.
0%0
0.0%
1110
0.0%
00.
0%0
0.0%
00.
0%A
IR T
RA
FFIC
CO
NTR
OL
1815
83.3
%3
16.7
%18
100.
0%0
0.0%
00.
0%0
0.0%
AIR
PO
RT
MA
NA
GE
ME
NT
53
60.0
%2
40.0
%5
100.
0%0
0.0%
00.
0%0
0.0%
AN
THR
OP
OLO
GY
10
0.0%
110
0.0%
110
0.0%
00.
0%0
0.0%
00.
0%A
THLE
TIC
TR
AIN
ING
42
50.0
%0
0.0%
250
.0%
00.
0%0
0.0%
250
.0%
ATM
OS
PH
ER
IC S
CIE
NC
ES
52
40.0
%0
0.0%
240
.0%
00.
0%0
0.0%
360
.0%
AV
IATI
ON
MA
NA
GE
ME
NT
65
83.3
%1
16.7
%6
100.
0%0
0.0%
00.
0%0
0.0%
BA
NK
& F
INA
NC
E E
CO
NO
MIC
S3
266
.7%
00.
0%2
66.7
%0
0.0%
00.
0%1
33.3
%B
IOLO
GY
134
30.8
%0
0.0%
430
.8%
00.
0%0
0.0%
969
.2%
BIO
LOG
Y/P
RE
-HE
ALT
H4
250
.0%
00.
0%2
50.0
%0
0.0%
00.
0%2
50.0
%B
US
INE
SS
EC
ON
OM
ICS
11
100.
0%0
0.0%
110
0.0%
00.
0%0
0.0%
00.
0%B
US
INE
SS
ED
UC
ATI
ON
22
100.
0%0
0.0%
210
0.0%
00.
0%0
0.0%
00.
0%C
HE
MIC
AL
EN
GIN
EE
RIN
G7
710
0.0%
00.
0%7
100.
0%0
0.0%
00.
0%0
0.0%
CH
EM
ISTR
Y4
00.
0%0
0.0%
00.
0%0
0.0%
00.
0%4
100.
0%C
IVIL
EN
GIN
EE
RIN
G14
1285
.7%
17.
1%13
92.9
%0
0.0%
00.
0%1
7.1%
CLI
NIC
AL
LAB
OR
ATO
RY
SC
I15
1510
0.0%
00.
0%15
100.
0%0
0.0%
00.
0%0
0.0%
CO
MM
ER
CIA
L A
VIA
TIO
N59
5491
.5%
23.
4%56
94.9
%0
0.0%
35.
1%0
0.0%
CO
MM
UN
ICA
TIO
N17
1482
.4%
211
.8%
1694
.1%
00.
0%0
0.0%
15.
9%C
OM
MU
NIC
ATI
ON
SC
IEN
CE
S &
DIS
OR
DE
RS
71
14.3
%0
0.0%
114
.3%
00.
0%0
0.0%
685
.7%
CO
MM
UN
ITY
NU
TRIT
ION
10
0.0%
110
0.0%
110
0.0%
00.
0%0
0.0%
00.
0%C
OM
PO
SIT
E M
AJO
R IN
SO
CIA
L S
TUD
21
50.0
%1
50.0
%2
100.
0%0
0.0%
00.
0%0
0.0%
CO
MP
UTE
R S
CIE
NC
E2
210
0.0%
00.
0%2
100.
0%0
0.0%
00.
0%0
0.0%
CR
IMIN
AL
JUS
TIC
E S
TUD
IES
2113
61.9
%4
19.0
%17
81.0
%0
0.0%
14.
8%3
14.3
%C
YTO
TEC
HN
OLO
GY
21
50.0
%0
0.0%
150
.0%
00.
0%0
0.0%
150
.0%
DIE
TETI
CS
66
100.
0%0
0.0%
610
0.0%
00.
0%0
0.0%
00.
0%E
AR
LY C
HIL
DH
OO
D E
DU
CA
TIO
N5
510
0.0%
00.
0%5
100.
0%0
0.0%
00.
0%0
0.0%
EC
ON
OM
ICS
21
50.0
%1
50.0
%2
100.
0%0
0.0%
00.
0%0
0.0%
ED
UC
ATI
ON
11
100.
0%0
0.0%
110
0.0%
00.
0%0
0.0%
00.
0%E
LEC
TRIC
AL
EN
GIN
EE
RIN
G16
1381
.3%
16.
3%14
87.5
%0
0.0%
00.
0%2
12.5
%E
LEM
EN
TAR
Y E
D/E
AR
LY C
HIL
D3
133
.3%
133
.3%
266
.7%
00.
0%0
0.0%
133
.3%
ELE
ME
NTA
RY
ED
UC
ATI
ON
2522
88.0
%1
4.0%
2392
.0%
14.
0%0
0.0%
14.
0%E
NG
LIS
H10
770
.0%
00.
0%7
70.0
%0
0.0%
00.
0%3
30.0
%E
NTR
EP
RE
NE
UR
SH
IP3
310
0.0%
00.
0%3
100.
0%0
0.0%
00.
0%0
0.0%
FIN
AN
CIA
L M
GM
T5
480
.0%
120
.0%
510
0.0%
00.
0%0
0.0%
00.
0%FI
SH
ER
IES
& W
ILD
LIFE
BIO
L3
266
.7%
00.
0%2
66.7
%0
0.0%
00.
0%1
33.3
%FO
RE
NS
IC S
CIE
NC
E2
150
.0%
150
.0%
210
0.0%
00.
0%0
0.0%
00.
0%G
EN
ER
AL
STU
DIE
S11
763
.6%
218
.2%
981
.8%
19.
1%0
0.0%
19.
1%G
EO
GR
AP
HY
10
0.0%
00.
0%0
0.0%
00.
0%1
100.
0%0
0.0%
GE
OLO
GIC
AL
EN
GIN
EE
RIN
G1
110
0.0%
00.
0%1
100.
0%0
0.0%
00.
0%0
0.0%
GE
OLO
GY
21
50.0
%0
0.0%
150
.0%
00.
0%0
0.0%
150
.0%
GE
RM
AN
21
50.0
%0
0.0%
150
.0%
00.
0%0
0.0%
150
.0%
GR
AP
HIC
DE
SIG
N1
110
0.0%
00.
0%1
100.
0%0
0.0%
00.
0%0
0.0%
GR
AP
HIC
DE
SIG
N &
NE
W A
RT
ME
DIA
22
100.
0%0
0.0%
210
0.0%
00.
0%0
0.0%
00.
0%G
RA
PH
IC D
ES
IGN
TE
CH
NO
LOG
Y5
360
.0%
240
.0%
510
0.0%
00.
0%0
0.0%
00.
0%H
ISTO
RY
52
40.0
%2
40.0
%4
80.0
%0
0.0%
00.
0%1
20.0
%
Tabl
e 24
: Pla
cem
ent s
umm
ary
by m
ajor
resp
onde
nts
are
incl
uded
if th
ey p
rovi
ded
a re
spon
se fo
r all
of th
e ite
ms
belo
w
Unr
elat
ed fi
eld
Tota
l Em
ploy
ed
Une
mpl
oyed
Not
see
king
Seek
ing
Cur
rent
ly a
st
uden
t
Tota
l non
-m
issi
ng
resp
onse
s
Empl
oym
ent o
r Stu
dent
In-fi
eld/
Rel
ated
Empl
oyed
2009-2010 Placement Survey Office of Institutional Research, University of North Dakota April 20, 2010
_________________________________________________________________________________________________________ Page 27
Appendix 4

Prim
ary
degr
ee m
ajor
Des
crip
tion
NN
%N
%N
%N
%N
%N
%
Tabl
e 24
: Pla
cem
ent s
umm
ary
by m
ajor
resp
onde
nts
are
incl
uded
if th
ey p
rovi
ded
a re
spon
se fo
r all
of th
e ite
ms
belo
w
Unr
elat
ed fi
eld
Tota
l Em
ploy
ed
Une
mpl
oyed
Not
see
king
Seek
ing
Cur
rent
ly a
st
uden
t
Tota
l non
-m
issi
ng
resp
onse
s
Empl
oym
ent o
r Stu
dent
In-fi
eld/
Rel
ated
Empl
oyed
HO
NO
RS
PR
OG
RA
M2
00.
0%0
0.0%
00.
0%0
0.0%
00.
0%2
100.
0%IN
DU
STR
IAL
TEC
HN
OLO
GY
66
100.
0%0
0.0%
610
0.0%
00.
0%0
0.0%
00.
0%IN
FOR
MA
TIO
N S
YS
TEM
S3
266
.7%
133
.3%
310
0.0%
00.
0%0
0.0%
00.
0%IN
TER
DIS
CIP
LIN
AR
Y S
TUD
IES
52
40.0
%0
0.0%
240
.0%
00.
0%0
0.0%
360
.0%
INV
ES
TME
NTS
21
50.0
%0
0.0%
150
.0%
00.
0%0
0.0%
150
.0%
KIN
ES
IOLO
GY
11
100.
0%0
0.0%
110
0.0%
00.
0%0
0.0%
00.
0%M
AN
AG
EM
EN
T29
2689
.7%
310
.3%
2910
0.0%
00.
0%0
0.0%
00.
0%M
AN
AG
ER
IAL
FIN
AN
CE
& C
OR
PO
RA
TE
AC
CO
UN
TIN
G2
150
.0%
150
.0%
210
0.0%
00.
0%0
0.0%
00.
0%
MA
RK
ETI
NG
2119
90.5
%1
4.8%
2095
.2%
00.
0%0
0.0%
14.
8%M
ATH
EM
ATI
CS
11
100.
0%0
0.0%
110
0.0%
00.
0%0
0.0%
00.
0%M
EC
HA
NIC
AL
EN
GIN
EE
RIN
G24
1770
.8%
312
.5%
2083
.3%
00.
0%0
0.0%
416
.7%
ME
DIC
AL
TEC
HN
OLO
GY
10
0.0%
00.
0%0
0.0%
00.
0%0
0.0%
110
0.0%
ME
DIC
INE
11
100.
0%0
0.0%
110
0.0%
00.
0%0
0.0%
00.
0%M
US
IC E
DU
CA
TIO
N1
110
0.0%
00.
0%1
100.
0%0
0.0%
00.
0%0
0.0%
MU
SIC
TH
ER
AP
Y2
210
0.0%
00.
0%2
100.
0%0
0.0%
00.
0%0
0.0%
NU
RS
ING
4545
100.
0%0
0.0%
4510
0.0%
00.
0%0
0.0%
00.
0%O
CC
UP
SA
FE &
EN
VIR
HE
ALT
H1
00.
0%0
0.0%
00.
0%0
0.0%
00.
0%1
100.
0%O
CC
UP
ATI
ON
AL
THE
RA
PY
11
100.
0%0
0.0%
110
0.0%
00.
0%0
0.0%
00.
0%P
HY
SIC
AL
ED
UC
ATI
ON
92
22.2
%0
0.0%
222
.2%
00.
0%0
0.0%
777
.8%
PH
YS
ICA
L E
DU
CA
TIO
N, E
XE
RC
ISE
S1
00.
0%0
0.0%
00.
0%0
0.0%
00.
0%1
100.
0%P
HY
SIC
AL
THE
RA
PY
10
0.0%
00.
0%0
0.0%
00.
0%0
0.0%
110
0.0%
PO
LITI
CA
L S
CIE
NC
E8
562
.5%
112
.5%
675
.0%
00.
0%0
0.0%
225
.0%
PS
YC
HO
LOG
Y18
738
.9%
15.
6%8
44.4
%1
5.6%
00.
0%9
50.0
%P
UB
LIC
AD
MIN
ISTR
ATI
ON
11
100.
0%0
0.0%
110
0.0%
00.
0%0
0.0%
00.
0%R
EC
/LE
ISU
RE
SE
RV
ICE
S5
510
0.0%
00.
0%5
100.
0%0
0.0%
00.
0%0
0.0%
RE
HA
B A
ND
HU
MA
N S
ER
VIC
ES
11
100.
0%0
0.0%
110
0.0%
00.
0%0
0.0%
00.
0%S
EC
ON
DA
RY
ED
UC
ATI
ON
11
100.
0%0
0.0%
110
0.0%
00.
0%0
0.0%
00.
0%S
OC
IAL
SC
IEN
CE
31
33.3
%1
33.3
%2
66.7
%0
0.0%
133
.3%
00.
0%S
OC
IAL
STU
DIE
S1
00.
0%0
0.0%
00.
0%0
0.0%
00.
0%1
100.
0%S
OC
IAL
WO
RK
1916
84.2
%0
0.0%
1684
.2%
00.
0%1
5.3%
210
.5%
SO
CIO
LOG
Y5
240
.0%
120
.0%
360
.0%
120
.0%
00.
0%1
20.0
%S
PA
NIS
H3
310
0.0%
00.
0%3
100.
0%0
0.0%
00.
0%0
0.0%
SP
EC
IAL
ED
UC
ATI
ON
STR
ATE
GIS
T1
110
0.0%
00.
0%1
100.
0%0
0.0%
00.
0%0
0.0%
THE
ATR
E1
00.
0%0
0.0%
00.
0%0
0.0%
00.
0%1
100.
0%U
RB
AN
DE
VE
LOP
ME
NT
10
0.0%
00.
0%0
0.0%
00.
0%1
100.
0%0
0.0%
VIS
UA
L A
RTS
10
0.0%
110
0.0%
110
0.0%
00.
0%0
0.0%
00.
0%To
tal
567
427
75.3
%44
7.8%
471
83.1
%4
0.7%
81.
4%84
14.8
%
2009-2010 Placement Survey Office of Institutional Research, University of North Dakota April 20, 2010
_________________________________________________________________________________________________________ Page 28
Appendix 4

Primary degree major N Obs N Mean Std Dev Minimum MaximumACCOUNTANCY 4 3 $ 43,167 $ 18,373 $ 22,000 $ 55,000 ACCOUNTING 11 11 $ 47,718 $ 4,196 $ 41,000 $ 54,000 AIR TRAFFIC CONTROL 19 17 $ 44,992 $ 13,380 $ 14,000 $ 65,000
Table 25: Salary data by majorMissing data may indicate that the salary data was not provided or that the graduate is currently a student and working toward another degree.
Analysis Variable : Salary
AIRPORT MANAGEMENT 5 5 $ 43,400 $ 16,931 $ 21,000 $ 62,500 ANTHROPOLOGY 1 1 $ 30,000 $ 30,000 $ 30,000 ATHLETIC TRAINING 4 2 $ 25,850 $ 13,930 $ 16,000 $ 35,700 ATMOSPHERIC SCIENCES 5 2 $ 35,500 $ 16,263 $ 24,000 $ 47,000 AVIATION MANAGEMENT 6 6 $ 24,990 $ 9,672 $ 14,440 $ 40,000 BANK & FINANCE ECONOMICS 3 1 $ 40,000 $ 40,000 $ 40,000 BIOLOGY 21 4 $ 40,250 $ 8,342 $ 33,000 $ 52,000 BIOLOGY/PRE-HEALTH 6 2 $ 34,000 $ 8,485 $ 28,000 $ 40,000 BUSINESS ECONOMICS 2 1 $ 36,000 $ 36,000 $ 36,000 BUSINESS EDUCATION 2 2 $ 30,500 $ 4,950 $ 27,000 $ 34,000 CHEMICAL ENGINEERING 7 6 $ 65,667 $ 12,687 $ 52,000 $ 89,500 CIVIL ENGINEERING 14 10 $ 52,511 $ 7,752 $ 42,000 $ 65,000 CLINICAL LABORATORY SCI 15 15 $ 46,596 $ 8,311 $ 33,946 $ 60,000 COMMERCIAL AVIATION 60 51 $ 29,857 $ 11,259 $ 9,900 $ 55,000 COMMUNICATION 18 13 $ 46 046 $ 19 137 $ 29 995 $ 90 000COMMUNICATION 18 13 $ 46,046 $ 19,137 $ 29,995 $ 90,000 COMMUNICATION SCIENCES & DISORDERS
10 1 $ 36,000 $ 36,000 $ 36,000
COMPOSITE MAJOR IN SOCIAL STUD 2 2 $ 28,500 $ 4,950 $ 25,000 $ 32,000
CRIMINAL JUSTICE STUDIES 21 15 $ 36,772 $ 10,957 $ 19,573 $ 60,000 CYTOTECHNOLOGY 2 1 $ 52,000 $ 52,000 $ 52,000 DIETETICS 6 6 $ 39,530 $ 4,300 $ 32,000 $ 43,680 EARLY CHILDHOOD EDUCATION 5 5 $ 30 400 $ 3 209 $ 27 000 $ 35 000EARLY CHILDHOOD EDUCATION 5 5 $ 30,400 $ 3,209 $ 27,000 $ 35,000 ECONOMICS 2 2 $ 40,500 $ 707 $ 40,000 $ 41,000 ELECTRICAL ENGINEERING 16 12 $ 61,000 $ 14,460 $ 40,000 $ 90,000 ELEMENTARY ED/EARLY CHILD 3 2 $ 23,150 $ 7,283 $ 18,000 $ 28,300 ELEMENTARY EDUCATION 26 21 $ 29,281 $ 7,433 $ 11,000 $ 40,000 ENGLISH 13 5 $ 32,453 $ 3,811 $ 26,000 $ 35,000 ENTREPRENEURSHIP 3 3 $ 39,667 $ 8,963 $ 34,000 $ 50,000 FINANCIAL MGMT 5 5 $ 32,800 $ 10,109 $ 15,000 $ 40,000 FINANCIAL MGMT 5 5 $ 32,800 $ 10,109 $ 15,000 $ 40,000 FISHERIES & WILDLIFE BIOL 3 2 $ 28,500 $ 4,950 $ 25,000 $ 32,000 FORENSIC SCIENCE 2 2 $ 38,000 $ 8,485 $ 32,000 $ 44,000 GENERAL STUDIES 11 7 $ 39,680 $ 28,995 $ 11,000 $ 98,000 GEOLOGICAL ENGINEERING 2 1 $ 50,000 $ 50,000 $ 50,000 GEOLOGY 2 1 $ 60,000 $ 60,000 $ 60,000 GERMAN 2 1 $ 35,000 $ 35,000 $ 35,000 GRAPHIC DESIGN 1 1 $ 10,500 $ 10,500 $ 10,500 GRAPHIC DESIGN & NEW ART MEDIA 3 1 $ 34,000 $ 34,000 $ 34,000
GRAPHIC DESIGN TECHNOLOGY 5 4 $ 27,000 $ 10,392 $ 12,000 $ 36,000 HISTORY 6 2 $ 29,000 $ 1,414 $ 28,000 $ 30,000 INDUSTRIAL TECHNOLOGY 6 5 $ 50,600 $ 11,992 $ 40,000 $ 70,000 INFORMATION SYSTEMS 3 2 $ 34,500 $ 707 $ 34,000 $ 35,000 INTERDISCIPLINARY STUDIES 5 1 $ 41,000 $ 41,000 $ 41,000 INVESTMENTS 3 1 $ 60,000 $ 60,000 $ 60,000 INVESTMENTS 3 1 $ 60,000 $ 60,000 $ 60,000 MANAGEMENT 30 22 $ 40,148 $ 17,993 $ 24,000 $ 100,000 MANAGERIAL FINANCE & CORPORATE ACCOUNTING
2 2 $ 37,792 $ 17,265 $ 25,584 $ 50,000
MARKETING 22 19 $ 44,847 $ 24,783 $ 24,900 $ 112,000 2009-2010 Placement Survey Office of Institutional Research, University of North Dakota April 20, 2010
_________________________________________________________________________________________________________ Page 29
Appendix 4

Primary degree major N Obs N Mean Std Dev Minimum Maximum
Table 25: Salary data by majorMissing data may indicate that the salary data was not provided or that the graduate is currently a student and working toward another degree.
Analysis Variable : Salary
MATHEMATICS 2 2 $ 32,000 $ - $ 32,000 $ 32,000 MECHANICAL ENGINEERING 26 18 $ 67,611 $ 24,935 $ 48,000 $ 145,000 MEDICINE 1 1 $ 46,500 $ 46,500 $ 46,500 MUSIC EDUCATION 1 1 $ 20,000 $ 20,000 $ 20,000 MUSIC THERAPY 2 2 $ 29,763 $ 5,321 $ 26,000 $ 33,525 NURSING 46 37 $ 49,777 $ 11,633 $ 36,000 $ 90,000 PHYSICAL EDUCATION 10 1 $ 26,795 $ 26,795 $ 26,795 POLITICAL SCIENCE 8 5 $ 36,400 $ 6,986 $ 24,000 $ 40,000 PSYCHOLOGY 24 8 $ 28,448 $ 4,492 $ 22,000 $ 35,000 PUBLIC ADMINISTRATION 1 1 $ 36,000 $ 36,000 $ 36,000 REC/LEISURE SERVICES 5 4 $ 24 250 $ 11 786 $ 10 000 $ 37 000REC/LEISURE SERVICES 5 4 $ 24,250 $ 11,786 $ 10,000 $ 37,000 RHS 1 1 $ 22,000 $ 22,000 $ 22,000 SECONDARY EDUCATION 1 1 $ 29,000 $ 29,000 $ 29,000 SOCIAL SCIENCE 3 2 $ 46,250 $ 25,102 $ 28,500 $ 64,000 SOCIAL WORK 19 15 $ 35,145 $ 8,734 $ 24,000 $ 60,000 SOCIOLOGY 5 2 $ 20,500 $ 2,121 $ 19,000 $ 22,000 SPANISH 3 2 $ 25,520 $ 2,150 $ 24,000 $ 27,040 SPECIAL EDUCATION STRATEGIST 1 1 $ 34,000 $ 34,000 $ 34,000 SPECIAL EDUCATION STRATEGIST 1 1 $ 34,000 $ 34,000 $ 34,000 VISUAL ARTS 2 1 $ 21,000 $ 21,000 $ 21,000
2009-2010 Placement Survey Office of Institutional Research, University of North Dakota April 20, 2010
_________________________________________________________________________________________________________ Page 30
Appendix 4