Embed Size (px)
Citation preview

2009-2010 Florida Change to a Primary Enforcement Law for Seat Belt Use
Final Report
September 2010
For: The Florida Department of Transportation
By: Preusser Research Group, Inc.
Mark G. Solomon, Robert H.B. Chaffe, James L. Nichols
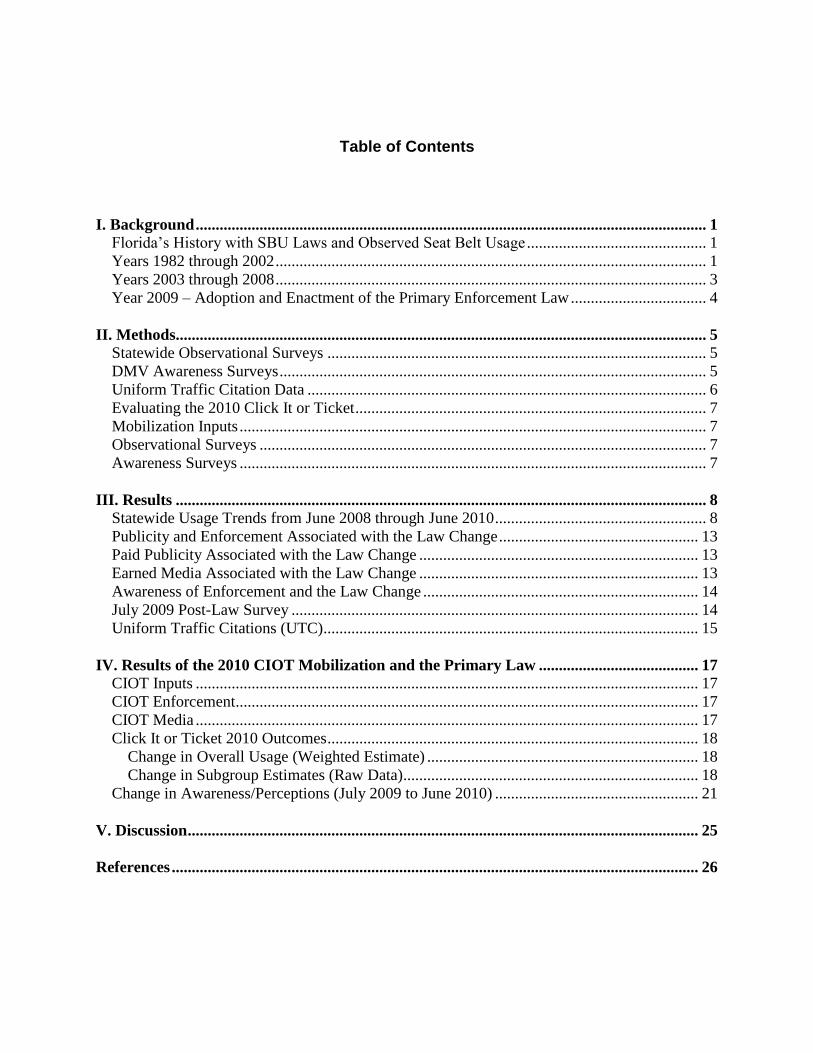
Table of Contents
I. Background ................................................................................................................................ 1
Florida’s History with SBU Laws and Observed Seat Belt Usage ............................................. 1 Years 1982 through 2002 ............................................................................................................ 1 Years 2003 through 2008 ............................................................................................................ 3
Year 2009 – Adoption and Enactment of the Primary Enforcement Law .................................. 4
II. Methods..................................................................................................................................... 5 Statewide Observational Surveys ............................................................................................... 5 DMV Awareness Surveys ........................................................................................................... 5 Uniform Traffic Citation Data .................................................................................................... 6
Evaluating the 2010 Click It or Ticket ........................................................................................ 7 Mobilization Inputs ..................................................................................................................... 7 Observational Surveys ................................................................................................................ 7
Awareness Surveys ..................................................................................................................... 7
III. Results ..................................................................................................................................... 8 Statewide Usage Trends from June 2008 through June 2010 ..................................................... 8 Publicity and Enforcement Associated with the Law Change .................................................. 13
Paid Publicity Associated with the Law Change ...................................................................... 13
Earned Media Associated with the Law Change ...................................................................... 13 Awareness of Enforcement and the Law Change ..................................................................... 14 July 2009 Post-Law Survey ...................................................................................................... 14
Uniform Traffic Citations (UTC).............................................................................................. 15
IV. Results of the 2010 CIOT Mobilization and the Primary Law ........................................ 17 CIOT Inputs .............................................................................................................................. 17 CIOT Enforcement.................................................................................................................... 17 CIOT Media .............................................................................................................................. 17
Click It or Ticket 2010 Outcomes ............................................................................................. 18 Change in Overall Usage (Weighted Estimate) .................................................................... 18 Change in Subgroup Estimates (Raw Data).......................................................................... 18
Change in Awareness/Perceptions (July 2009 to June 2010) ................................................... 21
V. Discussion ................................................................................................................................ 25
References .................................................................................................................................... 26
1
I. Background
The State of Florida passed a primary enforcement seat belt bill (SB 344) on April 29, 2009 and
the Governor signed that bill into law on May 6, 2009, with an effective date of June 30, 2009.
The new law created an uninterrupted change from secondary enforcement of seat belt violations
to primary enforcement. The new law presented an opportunity to evaluate the impact of a
change to primary enforcement in a State regularly participating in annual Click It or Ticket
(CIOT) mobilizations, with a relatively high seat belt usage rate (82%).
The Florida Department of Transportation’s Office of Highway Safety contracted with Preusser
Research Group, Inc. (PRG) for an evaluation of the uninterrupted change from secondary to
primary enforcement of seat belt violations. PRG examined the characteristics of the outcomes
of the law change and its association with ongoing CIOT Mobilizations.
Florida’s History with SBU Laws and Observed Seat Belt Usage
Years 1982 through 2002
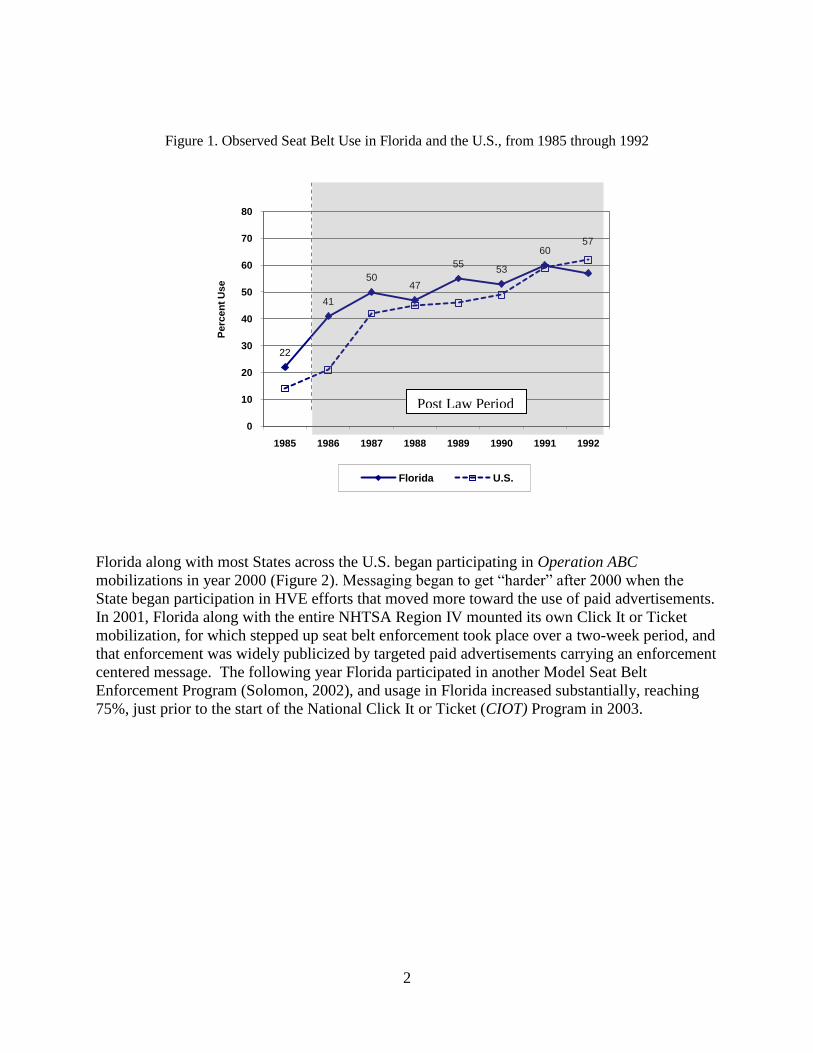
The State of Florida implemented its first adult seat belt law on July 1, 1986. The law was a
secondary-law, meaning that, a Florida law enforcement officer could cite a motorist for not
wearing a seat belt but only after observing some other violation. Florida’s observed seat belt
usage rate was low (22%) before the passage of that law (Figure 1). Shortly after enactment, but
prior to the implementation of the new law, Florida reported a somewhat higher use rate (28%).
It wasn’t until after the new secondary law was put into effect, that the State reported
considerable improvement (41%; 2nd
half of 1986). The following year the State reported even
higher belt usage (50%) before reporting a decline (47%) in 1988.
Belt usage increased again from 1988 to 1989 (+8 points) and then again from 1990 to 1991 (+7
points). At that time, Florida participated in the National 70% by ’92 program, the first
nationwide enforcement mobilization -- also called Operation Buckle Down. During most of this
early law period, Florida’s use rate was slightly higher than the national use rate, as measured by
NHTSA’s 19-city survey.1 That gap declined, however, as more states enacted seat belt laws and
participated in national enforcement efforts.
Prior to 2000, the State of Florida typically used “soft” enforcement messages for campaigns to
increase seat belt usage. The State used slogans such as “Thumbs Up” and “Operation Beltway”
rather than harder enforcement messaging like “Click It or Ticket.” At that time, message
delivery was typically through the use of Public Service Announcements (PSAs) rather than paid
placement of advertisements, and earned media. In addition, due to the State’s secondary law
status, the State preferred using saturation patrols or regular traffic patrols rather than
checkpoints and or enforcement zones.
1 During this period, from 1984 to 1992, when the national use rate derived from the 19-city survey, the sources for
such information were as follows: 1983 use rates (Perkins, Cynecki, and Goryl, 1984); 1984 use rates (Goryl and
Cynecki, 1985); 1985 use rates (Goryl, 1986); 1986 use rates (Goryl and Bowman, 1987); 1987-88 use rates
(Bowman and Rounds, 1988 and 1989); and 1989-91 use rates (Datta and Guzek; 1990, 1991, and 1992).
2
Figure 1. Observed Seat Belt Use in Florida and the U.S., from 1985 through 1992
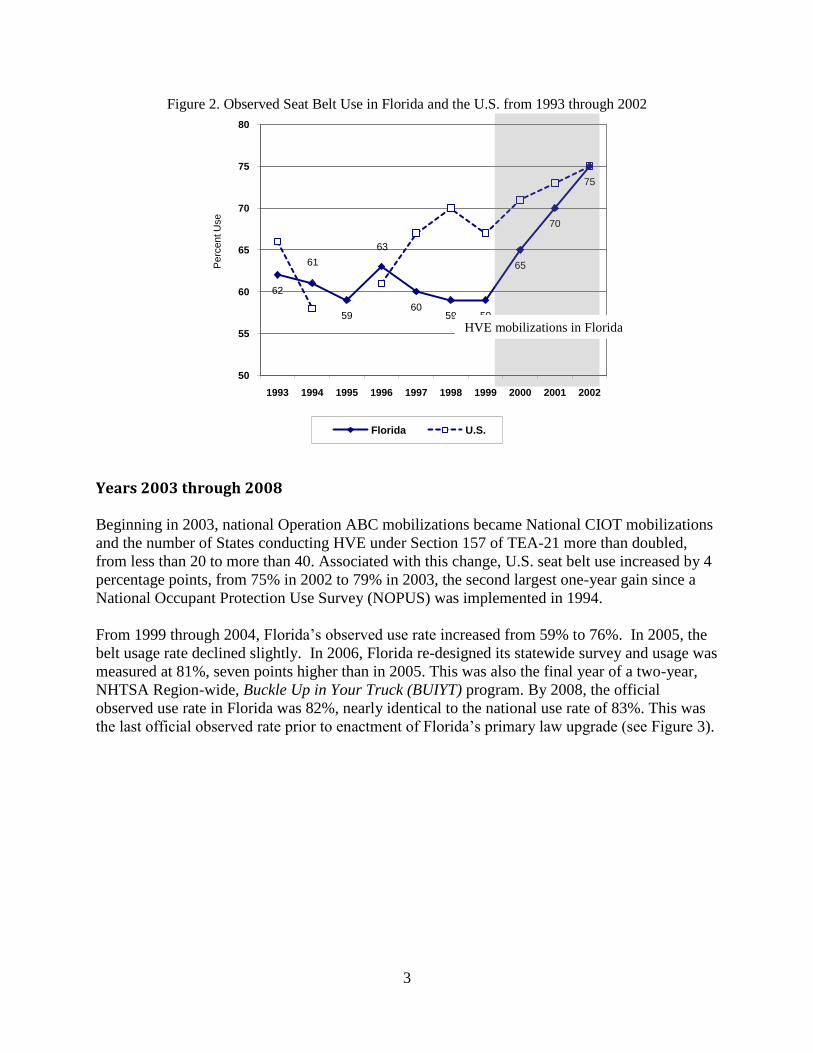
Florida along with most States across the U.S. began participating in Operation ABC
mobilizations in year 2000 (Figure 2). Messaging began to get “harder” after 2000 when the
State began participation in HVE efforts that moved more toward the use of paid advertisements.
In 2001, Florida along with the entire NHTSA Region IV mounted its own Click It or Ticket
mobilization, for which stepped up seat belt enforcement took place over a two-week period, and
that enforcement was widely publicized by targeted paid advertisements carrying an enforcement
centered message. The following year Florida participated in another Model Seat Belt
Enforcement Program (Solomon, 2002), and usage in Florida increased substantially, reaching
75%, just prior to the start of the National Click It or Ticket (CIOT) Program in 2003.
22
41
5047
5553
6057
0
10
20
30
40
50
60
70
80
1985 1986 1987 1988 1989 1990 1991 1992
Pe
rce
nt
Us
e
Florida U.S.
Post Law Period
3
Figure 2. Observed Seat Belt Use in Florida and the U.S. from 1993 through 2002
Years 2003 through 2008
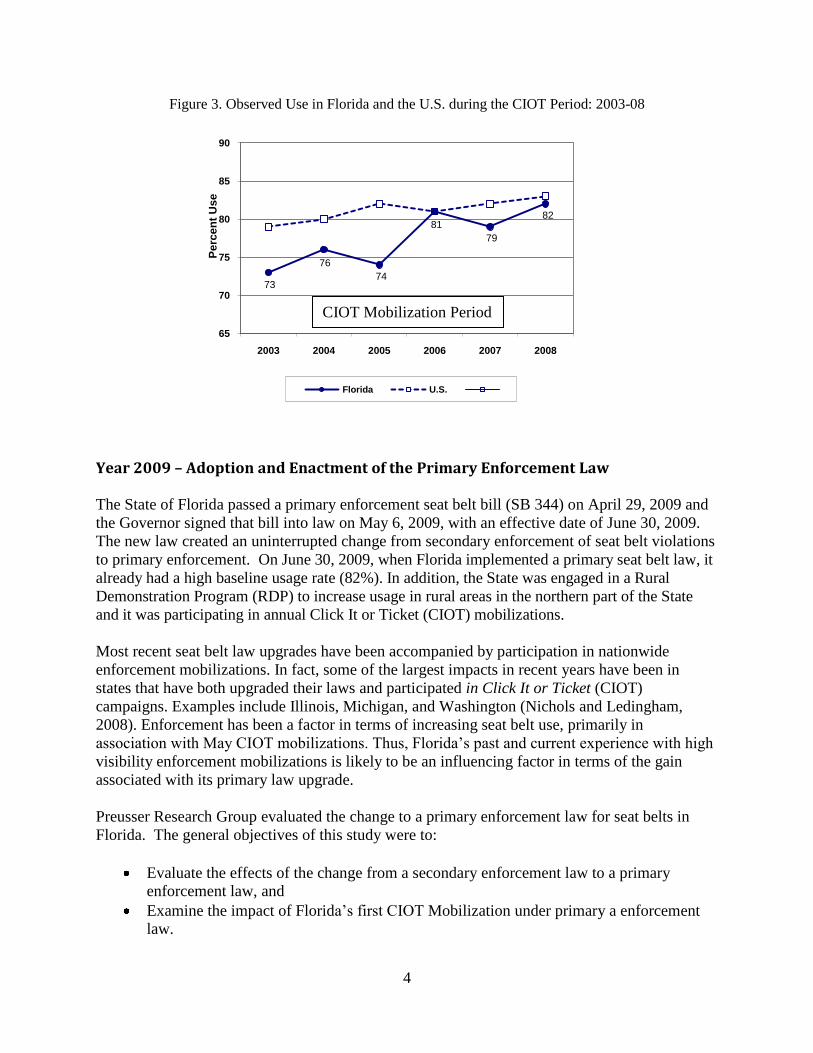
Beginning in 2003, national Operation ABC mobilizations became National CIOT mobilizations
and the number of States conducting HVE under Section 157 of TEA-21 more than doubled,
from less than 20 to more than 40. Associated with this change, U.S. seat belt use increased by 4
percentage points, from 75% in 2002 to 79% in 2003, the second largest one-year gain since a
National Occupant Protection Use Survey (NOPUS) was implemented in 1994.
From 1999 through 2004, Florida’s observed use rate increased from 59% to 76%. In 2005, the
belt usage rate declined slightly. In 2006, Florida re-designed its statewide survey and usage was
measured at 81%, seven points higher than in 2005. This was also the final year of a two-year,
NHTSA Region-wide, Buckle Up in Your Truck (BUIYT) program. By 2008, the official
observed use rate in Florida was 82%, nearly identical to the national use rate of 83%. This was
the last official observed rate prior to enactment of Florida’s primary law upgrade (see Figure 3).
62
61
59
63
6059 59
65
70
75
50
55
60
65
70
75
80
1993 1994 1995 1996 1997 1998 1999 2000 2001 2002
Pe
rce
nt U
se
Florida U.S.
HVE mobilizations in Florida
4
Figure 3. Observed Use in Florida and the U.S. during the CIOT Period: 2003-08
Year 2009 – Adoption and Enactment of the Primary Enforcement Law
The State of Florida passed a primary enforcement seat belt bill (SB 344) on April 29, 2009 and
the Governor signed that bill into law on May 6, 2009, with an effective date of June 30, 2009.
The new law created an uninterrupted change from secondary enforcement of seat belt violations
to primary enforcement. On June 30, 2009, when Florida implemented a primary seat belt law, it
already had a high baseline usage rate (82%). In addition, the State was engaged in a Rural
Demonstration Program (RDP) to increase usage in rural areas in the northern part of the State
and it was participating in annual Click It or Ticket (CIOT) mobilizations.
Most recent seat belt law upgrades have been accompanied by participation in nationwide
enforcement mobilizations. In fact, some of the largest impacts in recent years have been in
states that have both upgraded their laws and participated in Click It or Ticket (CIOT)
campaigns. Examples include Illinois, Michigan, and Washington (Nichols and Ledingham,
2008). Enforcement has been a factor in terms of increasing seat belt use, primarily in
association with May CIOT mobilizations. Thus, Florida’s past and current experience with high
visibility enforcement mobilizations is likely to be an influencing factor in terms of the gain
associated with its primary law upgrade.
Preusser Research Group evaluated the change to a primary enforcement law for seat belts in
Florida. The general objectives of this study were to:
Evaluate the effects of the change from a secondary enforcement law to a primary
enforcement law, and
Examine the impact of Florida’s first CIOT Mobilization under primary a enforcement
law.
73
76
74
81
79
82
65
70
75
80
85
90
2003 2004 2005 2006 2007 2008
Pe
rce
nt
Us
e
Florida U.S.
CIOT Mobilization Period
5
II. Methods
Statewide Observational Surveys
Questions regarding changes in seat belt use were addressed by 150-site statewide observational
surveys conducted before and after May mobilizations periods, from 2006 through 2010. An
additional statewide survey was conducted in July 2009, immediately after the upgrade went into
effect. The results of these surveys provide the primary data for evaluating the impact of the
Florida primary law on observed usage. Each of these surveys met the requirements NHTSA set
for measuring statewide seat belt use, under Transportation Equity Act for the 21st Century
(TEA-21).
[Six waves of 45-site surveys were conducted in north Florida from February 2009 through June
2010 as part of an evaluation of Florida’s participation in a Rural Demonstration Program
(RDP). These surveys were conducted in February, March, June, October, and November of
2009 and in June of 2010. The surveys were not statistically representative samples of the 36-
county region that was targeted by the RDP. Rather, they provided an index of seat belt usage
that was used to estimate change in the targeted area from one wave to another and from just
prior to the law upgrade (March and June of 2009) to just after the upgrade (October and
November of 2009). Results of the RDP program, including program inputs and outcomes are
covered in-depth in another PRG Report (Report Title: Evaluation of Florida’s Rural
Demonstration Program) submitted to the Florida Department of Transportation.]
The key questions PRG sought to answer with the Statewide Observational survey data were:
Did statewide seat belt use increase with the new primary law, and if so, when and by
how much?
Did the primary enforcement law have differential effects relative to race/ethnicity, age,
gender, vehicle type, urban versus rural areas, etc?
DMV Awareness Surveys
Questions regarding awareness and perceptions regarding the seat belt law and its enforcement
were addressed by means of one-page, paper-and-pencil surveys conducted at 16 Department of
Motor Vehicle Licensing Centers (DMV). These surveys were conducted in July 2009, soon after
the law change and again in June 2010, immediately after the 2010 CIOT Mobilization.
[As was the case with observational surveys, a subsample of (6) DMV licensing centers was
selected for awareness surveys in the northern part of the State as part of the State’s RDP
evaluation. These surveys were conducted at the same time the RDP observational surveys were
conducted (i.e., February, March, June, October, and November of 2009 and June of 2010). As
previously mentioned, the results of the RDP program are covered in another PRG Report
(Report Title: Evaluation of Florida’s Rural Demonstration Program) submitted to the Florida
Department of Transportation.]
Sixteen DMV License Stations distributed one-page, self administered, pen-and-paper surveys to
motorists waiting for service. These surveys included several questions asked in previous
6
surveys used to evaluate seat belt demonstration projects (e.g., Buckle Up In Your Truck
programs and Rural Demonstration Programs), but they also included questions regarding the
new primary seat belt law. These questions asked whether or not an officer could stop a vehicle
based only upon a seat belt violation and whether or not an officer should be able to stop a
vehicle based only on a seat belt violation.
Six of the licensing stations were located in primarily urban counties and 10 were located in
more rural counties. Each licensing center was asked to collect up to 200 surveys, with a goal of
1,600 surveys collected across all 16 sites. The following DMV centers were located in urban
counties (cities in parentheses): Leon (Tallahassee); Duval (Jacksonville); Orange (Orlando);
Pinellas (Tampa); Dade (Miami); Palm Beach. The remainder were located in the following rural
counties (and cities): Columbia (Lake City); Dixie (Cross City); Gadsden (Quincy); Hardee
(Wauchula); Highlands (Sebring); Jackson (Marianna); Okeechobee (Okeechobee); Polk (Lake
Wales); Putnam (East Palatka); and Santa Rosa (Milton). 2
In general, key questions that PRG sought to answer in the two surveys conducted were:
Do drivers know the State of Florida has a primary enforcement law?
Are drivers receptive towards the seat belt law in the State of Florida?
Did awareness of primary enforcement vary relative to race/ethnicity, age, gender,
vehicle type, urban versus rural areas, etc?
Did awareness of the law increase or decline in the 12-month period after the law
change?
In addition, responses to other questions were examined to determine levels of awareness
regarding special seat belt enforcement efforts and seat belt messages; perceptions of risk of
getting a ticket for not buckling up; and media sources for message awareness.
Uniform Traffic Citation Data
With regard to enforcement activity, Florida uses a Uniform Traffic Citation (UTC) system
whereby all traffic citations issued by law enforcement are routed through the Florida
Department of Highway Safety and Motor Vehicles. PRG examined UTC data for seat belt
violations, from January 2005 through January 2010, to identify any shift in the total number of
citations issued over time.
In general, the key question that PRG sought to answer using UTC data was:
Did seat belt enforcement increase after changing to a primary law for seat belts.
2 Based on location, these centers were located as follows: eight centers were located in the northern part of the State
(i.e., in Santa Rosa, Jackson, Gadsen, Lean, Columbia, Duval, Dixie, and Putnam counties) and eight centers in
counties located in the central and southern part of the State (i.e., in Hillsborough, Orange, Polk, Hardee, Highlands,
Okeechobee, Palm Beach, and Miami-Dade counties).
7
Evaluating the 2010 Click It or Ticket
Mobilization Inputs
Statewide indices of media and enforcement activity that were part of Florida’s participation in
annual statewide Click It or Ticket (CIOT) mobilizations were used to gauge the level of media
and enforcement activity for three years prior to the law change (2006-2008); the year of the
change (2009), and the year following the change (2010). These data were obtained from
NHTSA’s Mobilizations, Crackdowns, and Sustained Enforcement database, where activity data
are entered annually by the States. These data include: dollars spent for paid media; number of
ads run on radio and television; number of news stories run on radio and television; number and
percent of total enforcement agencies participating in CIOT mobilizations; and number of
citations issued for seat belt (and child passenger safety) violations.
Observational Surveys
Statewide seat belt surveys were examined for changes in statewide belt use from immediately
before the 2010 CIOT Mobilization to immediately after the conclusion of the mobilization.
Each of these surveys met the requirements NHTSA set for measuring statewide seat belt use,
under Transportation Equity Act for the 21st Century (TEA-21).
Awareness Surveys
As mentioned above, PRG aided the Florida Department of Motor Vehicles (DMV) in
conducting awareness surveys in July 2009, immediately after the primary law had been put into
effect and again in June 2010, about one full year after the law was implemented just after the
conclusion of the 2010 CIOT mobilization. Both rounds of surveys were collected using the
same procedures and at the same locations as the July 2009 survey collection effort.
The general question PRG sought to answer with this case study was:
Did the new law result in different levels of mobilization inputs and outcomes?
8
III. Results
Statewide Usage Trends from June 2008 through June 2010
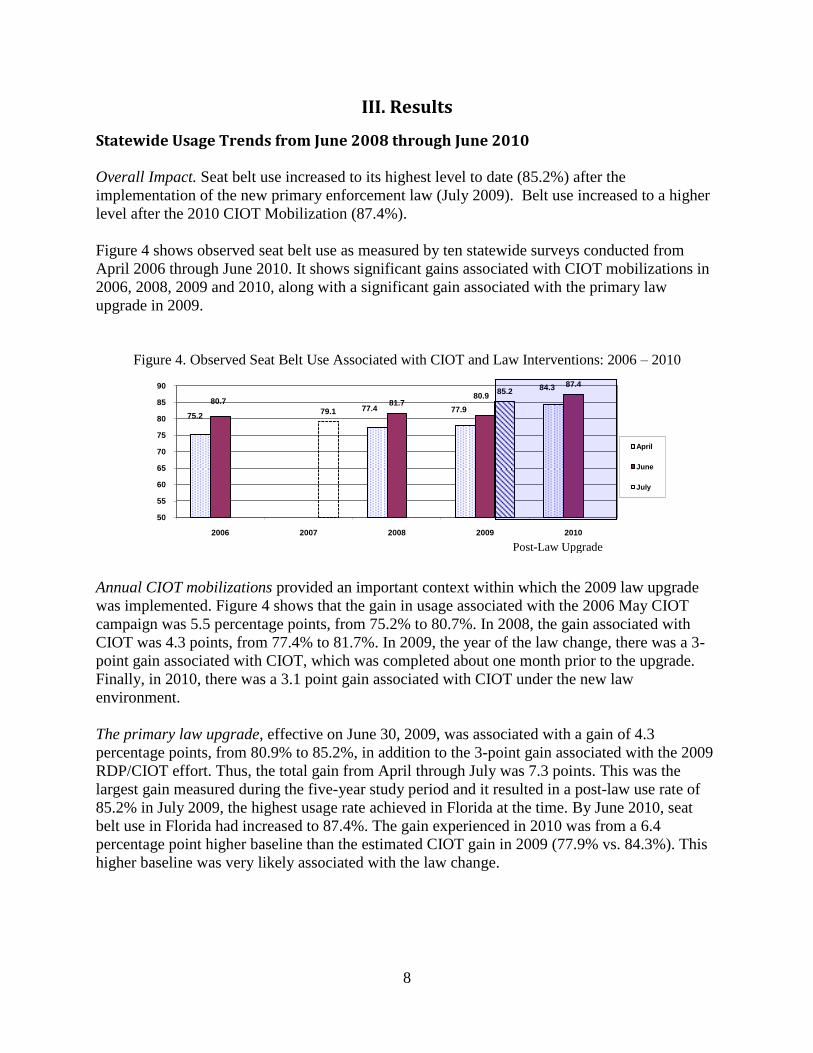
Overall Impact. Seat belt use increased to its highest level to date (85.2%) after the
implementation of the new primary enforcement law (July 2009). Belt use increased to a higher
level after the 2010 CIOT Mobilization (87.4%).
Figure 4 shows observed seat belt use as measured by ten statewide surveys conducted from
April 2006 through June 2010. It shows significant gains associated with CIOT mobilizations in
2006, 2008, 2009 and 2010, along with a significant gain associated with the primary law
upgrade in 2009.
Figure 4. Observed Seat Belt Use Associated with CIOT and Law Interventions: 2006 – 2010
Annual CIOT mobilizations provided an important context within which the 2009 law upgrade
was implemented. Figure 4 shows that the gain in usage associated with the 2006 May CIOT
campaign was 5.5 percentage points, from 75.2% to 80.7%. In 2008, the gain associated with
CIOT was 4.3 points, from 77.4% to 81.7%. In 2009, the year of the law change, there was a 3-
point gain associated with CIOT, which was completed about one month prior to the upgrade.
Finally, in 2010, there was a 3.1 point gain associated with CIOT under the new law
environment.
The primary law upgrade, effective on June 30, 2009, was associated with a gain of 4.3
percentage points, from 80.9% to 85.2%, in addition to the 3-point gain associated with the 2009
RDP/CIOT effort. Thus, the total gain from April through July was 7.3 points. This was the
largest gain measured during the five-year study period and it resulted in a post-law use rate of
85.2% in July 2009, the highest usage rate achieved in Florida at the time. By June 2010, seat
belt use in Florida had increased to 87.4%. The gain experienced in 2010 was from a 6.4
percentage point higher baseline than the estimated CIOT gain in 2009 (77.9% vs. 84.3%). This
higher baseline was very likely associated with the law change.
75.277.4 77.9
84.3
80.7 81.780.9
87.4
79.1
85.2
50
55
60
65
70
75
80
85
90
2006 2007 2008 2009 2010
April
June
July
Post-Law Upgrade
9
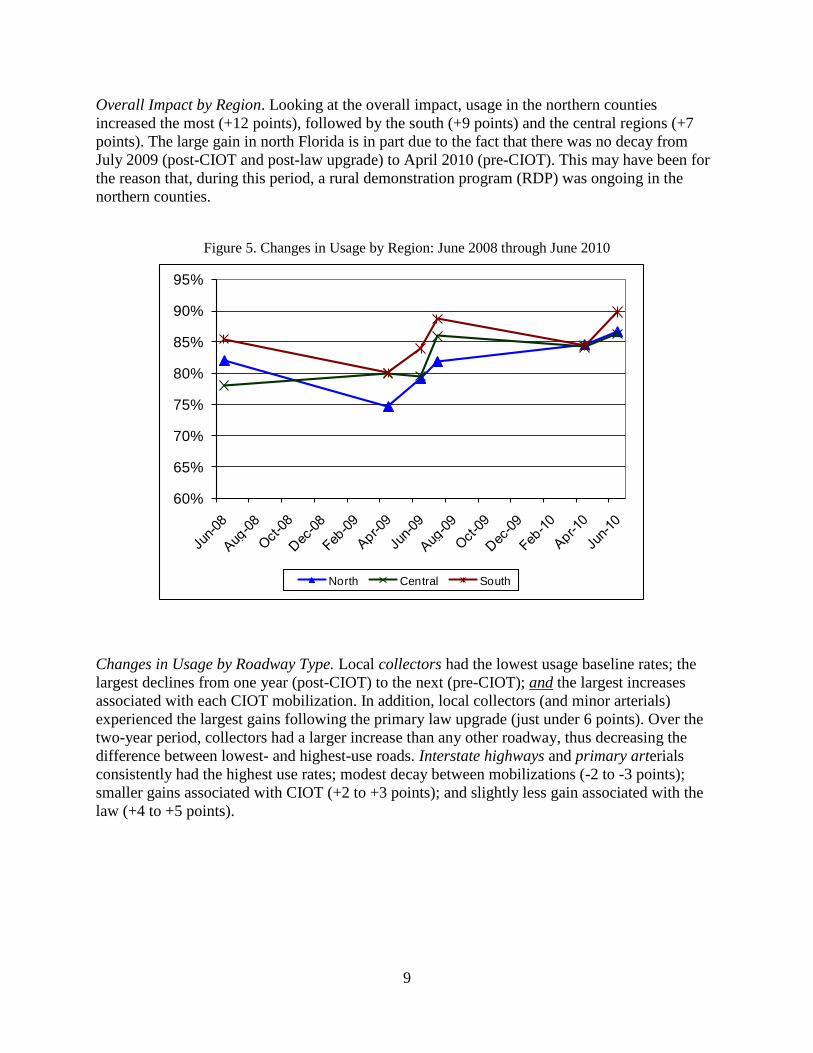
Overall Impact by Region. Looking at the overall impact, usage in the northern counties
increased the most (+12 points), followed by the south (+9 points) and the central regions (+7
points). The large gain in north Florida is in part due to the fact that there was no decay from
July 2009 (post-CIOT and post-law upgrade) to April 2010 (pre-CIOT). This may have been for
the reason that, during this period, a rural demonstration program (RDP) was ongoing in the
northern counties.
Figure 5. Changes in Usage by Region: June 2008 through June 2010
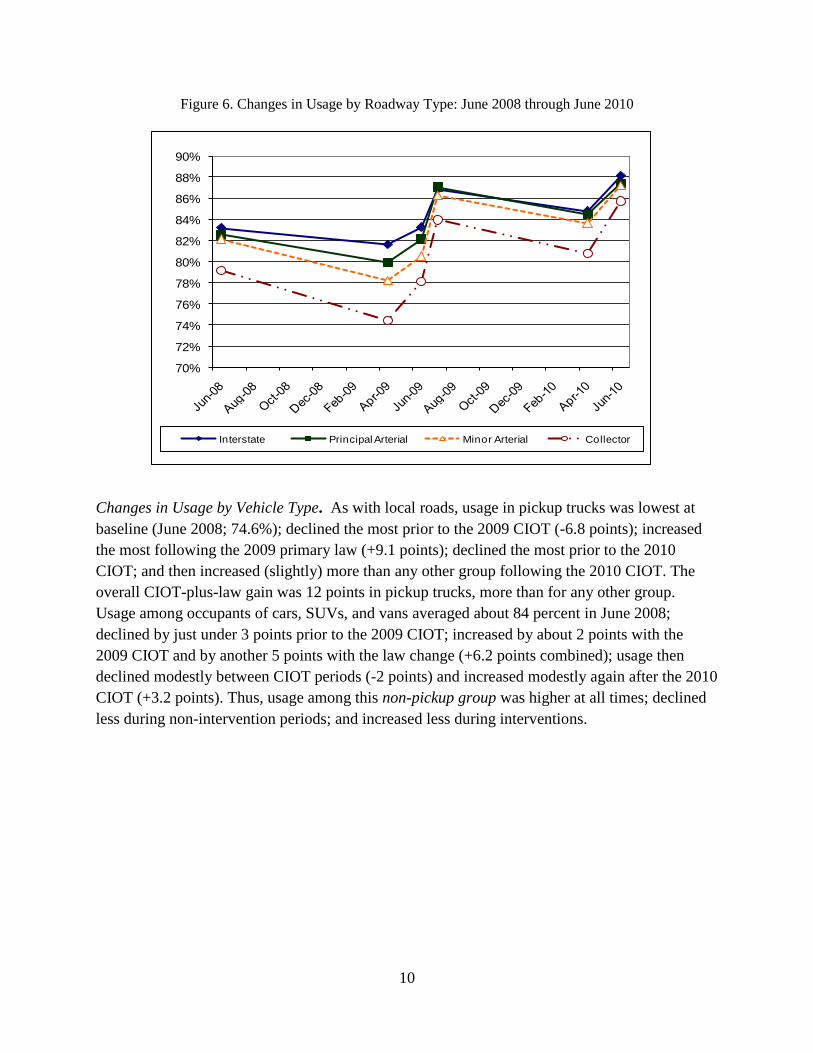
Changes in Usage by Roadway Type. Local collectors had the lowest usage baseline rates; the
largest declines from one year (post-CIOT) to the next (pre-CIOT); and the largest increases
associated with each CIOT mobilization. In addition, local collectors (and minor arterials)
experienced the largest gains following the primary law upgrade (just under 6 points). Over the
two-year period, collectors had a larger increase than any other roadway, thus decreasing the
difference between lowest- and highest-use roads. Interstate highways and primary arterials
consistently had the highest use rates; modest decay between mobilizations (-2 to -3 points);
smaller gains associated with CIOT (+2 to +3 points); and slightly less gain associated with the
law (+4 to +5 points).
60%
65%
70%
75%
80%
85%
90%
95%
North Central South
10
Figure 6. Changes in Usage by Roadway Type: June 2008 through June 2010
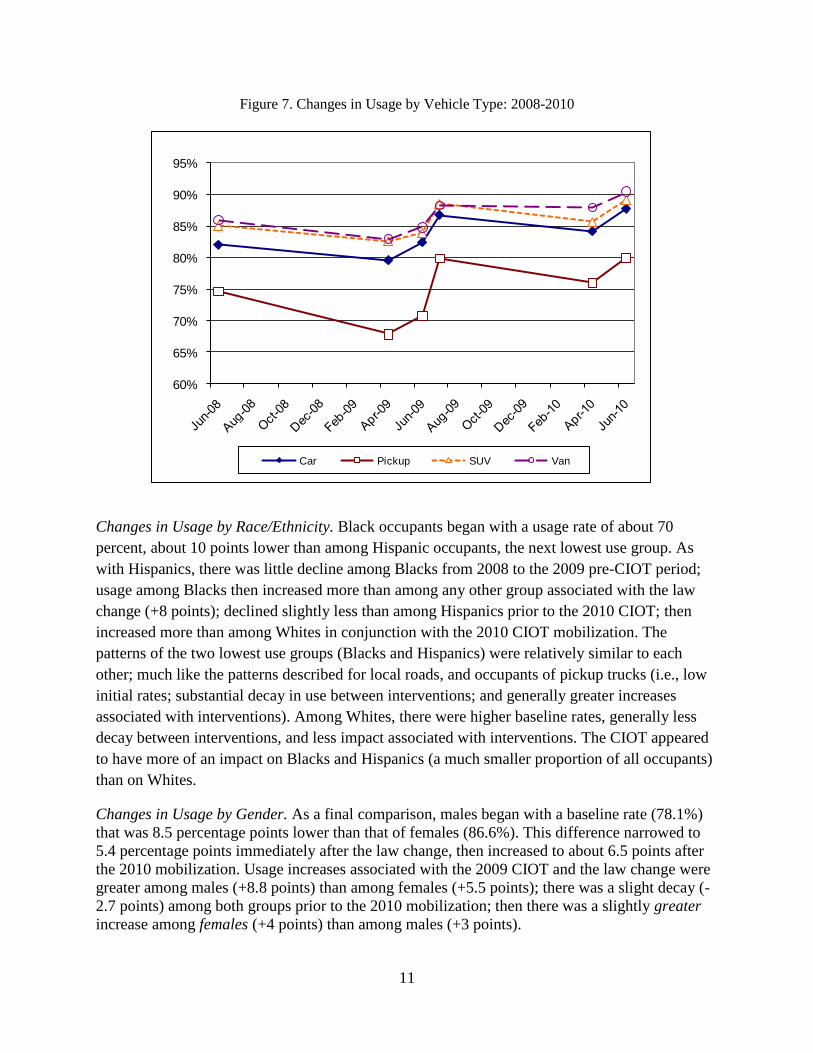
Changes in Usage by Vehicle Type. As with local roads, usage in pickup trucks was lowest at
baseline (June 2008; 74.6%); declined the most prior to the 2009 CIOT (-6.8 points); increased
the most following the 2009 primary law (+9.1 points); declined the most prior to the 2010
CIOT; and then increased (slightly) more than any other group following the 2010 CIOT. The
overall CIOT-plus-law gain was 12 points in pickup trucks, more than for any other group.
Usage among occupants of cars, SUVs, and vans averaged about 84 percent in June 2008;
declined by just under 3 points prior to the 2009 CIOT; increased by about 2 points with the
2009 CIOT and by another 5 points with the law change (+6.2 points combined); usage then
declined modestly between CIOT periods (-2 points) and increased modestly again after the 2010
CIOT (+3.2 points). Thus, usage among this non-pickup group was higher at all times; declined
less during non-intervention periods; and increased less during interventions.
70%
72%
74%
76%
78%
80%
82%
84%
86%
88%
90%
Interstate Principal Arterial Minor Arterial Collector
11
Figure 7. Changes in Usage by Vehicle Type: 2008-2010
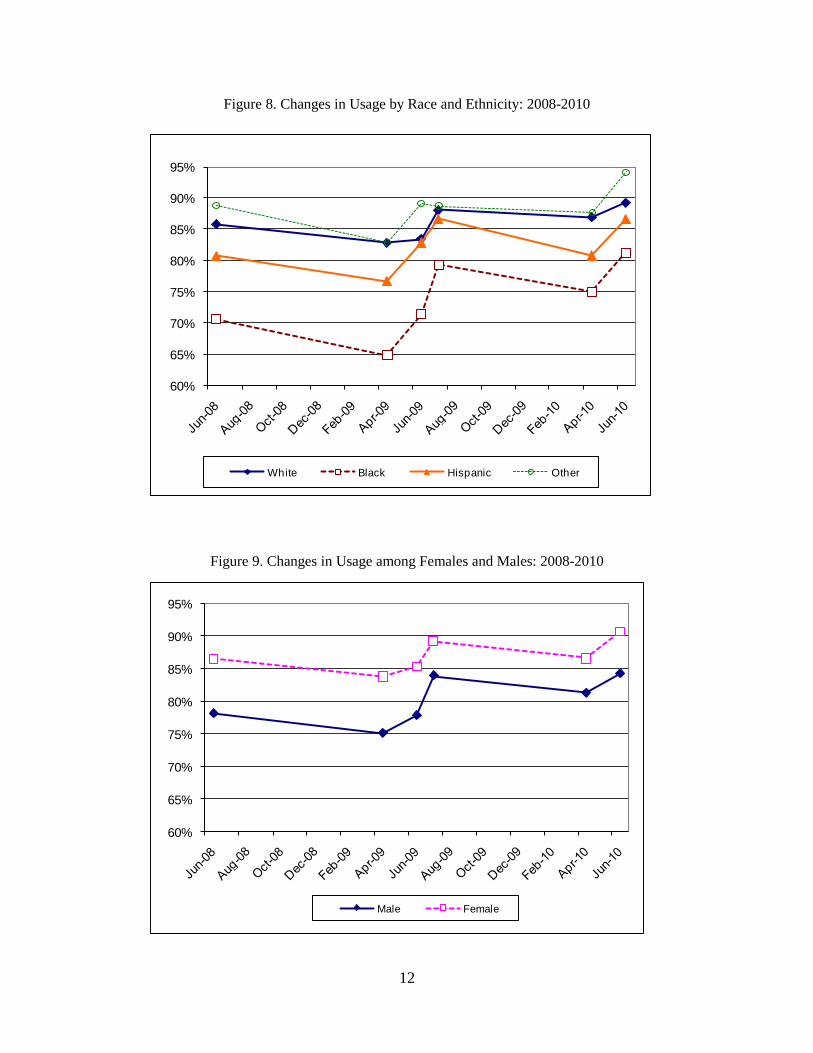
Changes in Usage by Race/Ethnicity. Black occupants began with a usage rate of about 70
percent, about 10 points lower than among Hispanic occupants, the next lowest use group. As
with Hispanics, there was little decline among Blacks from 2008 to the 2009 pre-CIOT period;
usage among Blacks then increased more than among any other group associated with the law
change (+8 points); declined slightly less than among Hispanics prior to the 2010 CIOT; then
increased more than among Whites in conjunction with the 2010 CIOT mobilization. The
patterns of the two lowest use groups (Blacks and Hispanics) were relatively similar to each
other; much like the patterns described for local roads, and occupants of pickup trucks (i.e., low
initial rates; substantial decay in use between interventions; and generally greater increases
associated with interventions). Among Whites, there were higher baseline rates, generally less
decay between interventions, and less impact associated with interventions. The CIOT appeared
to have more of an impact on Blacks and Hispanics (a much smaller proportion of all occupants)
than on Whites.
Changes in Usage by Gender. As a final comparison, males began with a baseline rate (78.1%)
that was 8.5 percentage points lower than that of females (86.6%). This difference narrowed to
5.4 percentage points immediately after the law change, then increased to about 6.5 points after
the 2010 mobilization. Usage increases associated with the 2009 CIOT and the law change were
greater among males (+8.8 points) than among females (+5.5 points); there was a slight decay (-
2.7 points) among both groups prior to the 2010 mobilization; then there was a slightly greater
increase among females (+4 points) than among males (+3 points).
60%
65%
70%
75%
80%
85%
90%
95%
Car Pickup SUV Van
12
Figure 8. Changes in Usage by Race and Ethnicity: 2008-2010
Figure 9. Changes in Usage among Females and Males: 2008-2010
60%
65%
70%
75%
80%
85%
90%
95%
Male Female
60%
65%
70%
75%
80%
85%
90%
95%
White Black Hispanic Other
13
In summary. The combination of the 2009 CIOT and the primary law change had a large and
significant impact on usage in 2009, resulting in greater increases among lowest usage groups.
Generally, the gains experienced by the lowest use groups decayed over time, until the 2010
mobilization, when there were additional gains. By June 2010, there were smaller differences
between the lowest-use groups and other groups than there was the case in 2008 or in April of
2009. Clearly, the CIOT mobilization had an impact in seatbelt use in each year, and the move to
primary in 2009 had a slightly greater impact.
Publicity and Enforcement Associated with the Law Change
In order to understand the environment in which the primary law upgrade occurred, it is
important to examine the enforcement and media activity regarding seat belt use that occurred
before, during, and after the law change. PRG obtained reasonably complete media and
enforcement data regarding statewide activity associated with the May CIOT mobilizations. PRG
obtained monthly (UTC) data on seat belt citations from 2005 through January 2010. Following
is a description of the levels and trends in activity based on these various data sets.
Paid Publicity Associated with the Law Change
Paid publicity was associated with the law change. It is important to remember that the primary
law was passed only weeks before the 2009 CIOT Mobilization took place and the law was
implemented approximately three weeks after the Mobilizations conclusion. Ample resources
were put into the 2009 CIOT Mobilization, including paid publicity. The amount of paid
publicity used at that time is covered a subsequent section of this paper.
Earned Media Associated with the Law Change
Earned Media: Stories Associated with the Law Change. There was no formal reporting of
stories associated with the primary law upgrade and there were no media events conducted with
regard to the law change (that PRG is aware of). However, a search of the internet resulted in the
identification of a substantial number of articles that focused on the change. Most of these
articles focused on the fact that officers could now stop a car and ticket someone who was not
buckled up, without having to observe another traffic (or other) offense. The information found
on the web came from news outlets and from the websites of various organizations (e.g., Florida
Highway Patrol, various legal firms, an Interstate 4 Information Center, etc.). Generally, the
messaging was supportive of the new law; warned motorists that they can now be stopped;
pointed out that the fine (+ other costs) is near $100; mentioned the safety-related benefits;
providing examples of both survivors and teens killed; and noted the $35 million incentive for
Florida to enact a primary law, etc. It was not possible to quantify the level of this earned media
without a media-monitoring effort.
14
Awareness of Enforcement and the Law Change
July 2009 Post-Law Survey
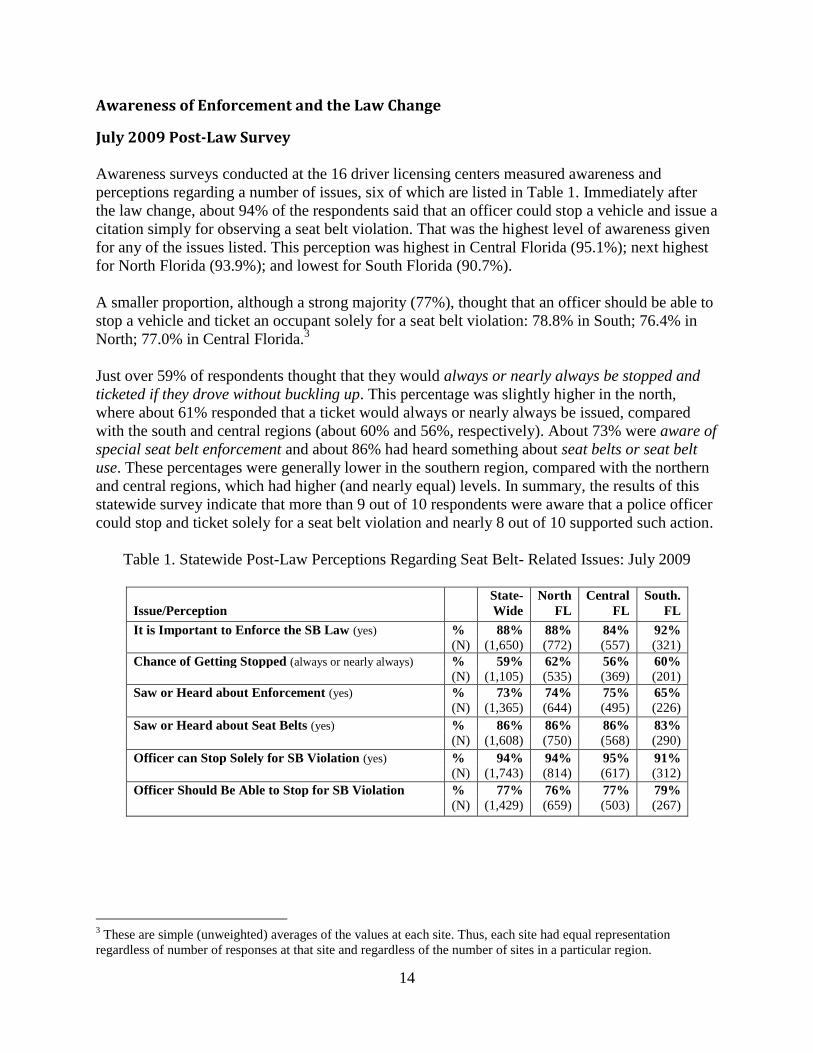
Awareness surveys conducted at the 16 driver licensing centers measured awareness and
perceptions regarding a number of issues, six of which are listed in Table 1. Immediately after
the law change, about 94% of the respondents said that an officer could stop a vehicle and issue a
citation simply for observing a seat belt violation. That was the highest level of awareness given
for any of the issues listed. This perception was highest in Central Florida (95.1%); next highest
for North Florida (93.9%); and lowest for South Florida (90.7%).
A smaller proportion, although a strong majority (77%), thought that an officer should be able to
stop a vehicle and ticket an occupant solely for a seat belt violation: 78.8% in South; 76.4% in
North; 77.0% in Central Florida.3
Just over 59% of respondents thought that they would always or nearly always be stopped and
ticketed if they drove without buckling up. This percentage was slightly higher in the north,
where about 61% responded that a ticket would always or nearly always be issued, compared
with the south and central regions (about 60% and 56%, respectively). About 73% were aware of
special seat belt enforcement and about 86% had heard something about seat belts or seat belt
use. These percentages were generally lower in the southern region, compared with the northern
and central regions, which had higher (and nearly equal) levels. In summary, the results of this
statewide survey indicate that more than 9 out of 10 respondents were aware that a police officer
could stop and ticket solely for a seat belt violation and nearly 8 out of 10 supported such action.
Table 1. Statewide Post-Law Perceptions Regarding Seat Belt- Related Issues: July 2009
Issue/Perception
State-
Wide
North
FL
Central
FL
South.
FL
It is Important to Enforce the SB Law (yes) % 88% 88% 84% 92%
(N) (1,650) (772) (557) (321)
Chance of Getting Stopped (always or nearly always) % 59% 62% 56% 60%
(N) (1,105) (535) (369) (201)
Saw or Heard about Enforcement (yes) % 73% 74% 75% 65%
(N) (1,365) (644) (495) (226)
Saw or Heard about Seat Belts (yes) % 86% 86% 86% 83%
(N) (1,608) (750) (568) (290)
Officer can Stop Solely for SB Violation (yes) % 94% 94% 95% 91%
(N) (1,743) (814) (617) (312)
Officer Should Be Able to Stop for SB Violation % 77% 76% 77% 79%
(N) (1,429) (659) (503) (267)
3 These are simple (unweighted) averages of the values at each site. Thus, each site had equal representation
regardless of number of responses at that site and regardless of the number of sites in a particular region.
15
Uniform Traffic Citations (UTC)
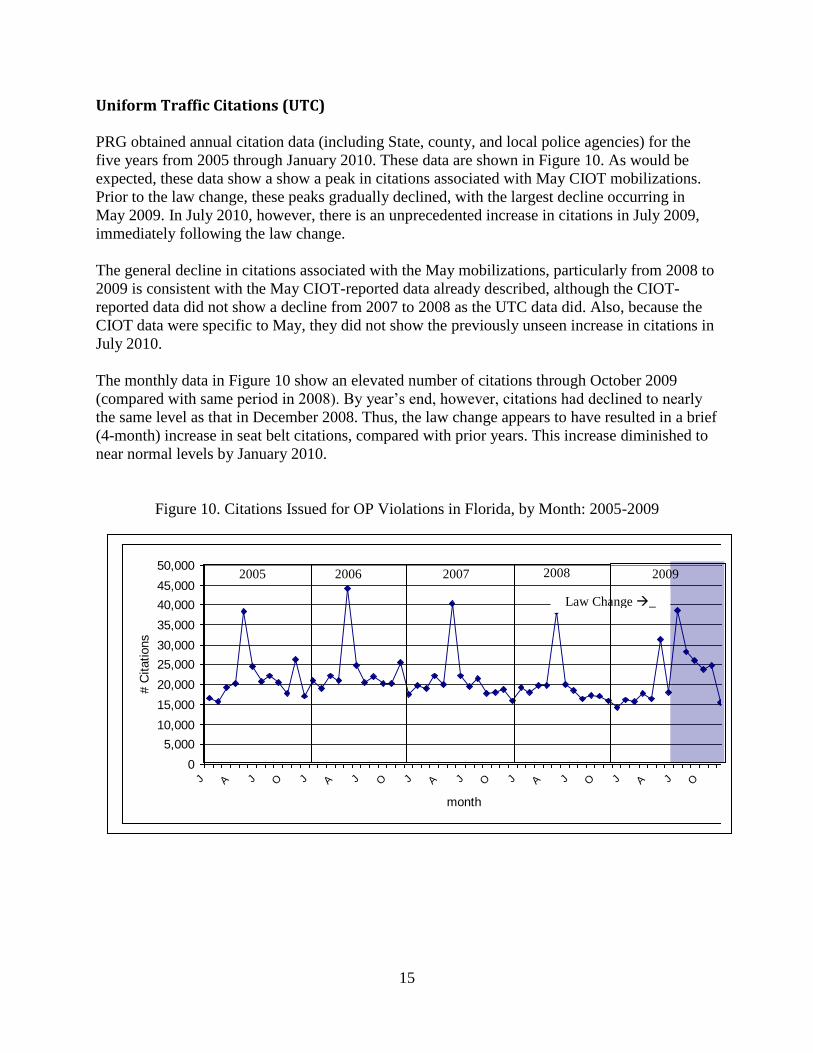
PRG obtained annual citation data (including State, county, and local police agencies) for the
five years from 2005 through January 2010. These data are shown in Figure 10. As would be
expected, these data show a show a peak in citations associated with May CIOT mobilizations.
Prior to the law change, these peaks gradually declined, with the largest decline occurring in
May 2009. In July 2010, however, there is an unprecedented increase in citations in July 2009,
immediately following the law change.
The general decline in citations associated with the May mobilizations, particularly from 2008 to
2009 is consistent with the May CIOT-reported data already described, although the CIOT-
reported data did not show a decline from 2007 to 2008 as the UTC data did. Also, because the
CIOT data were specific to May, they did not show the previously unseen increase in citations in
July 2010.
The monthly data in Figure 10 show an elevated number of citations through October 2009
(compared with same period in 2008). By year’s end, however, citations had declined to nearly
the same level as that in December 2008. Thus, the law change appears to have resulted in a brief
(4-month) increase in seat belt citations, compared with prior years. This increase diminished to
near normal levels by January 2010.
Figure 10. Citations Issued for OP Violations in Florida, by Month: 2005-2009
0
5,000
10,000
15,000
20,000
25,000
30,000
35,000
40,000
45,000
50,000
J A J O J A J O J A J O J A J O J A J O
month
# C
itations
Law Change _
2005 2006 2007 2008 2009
16
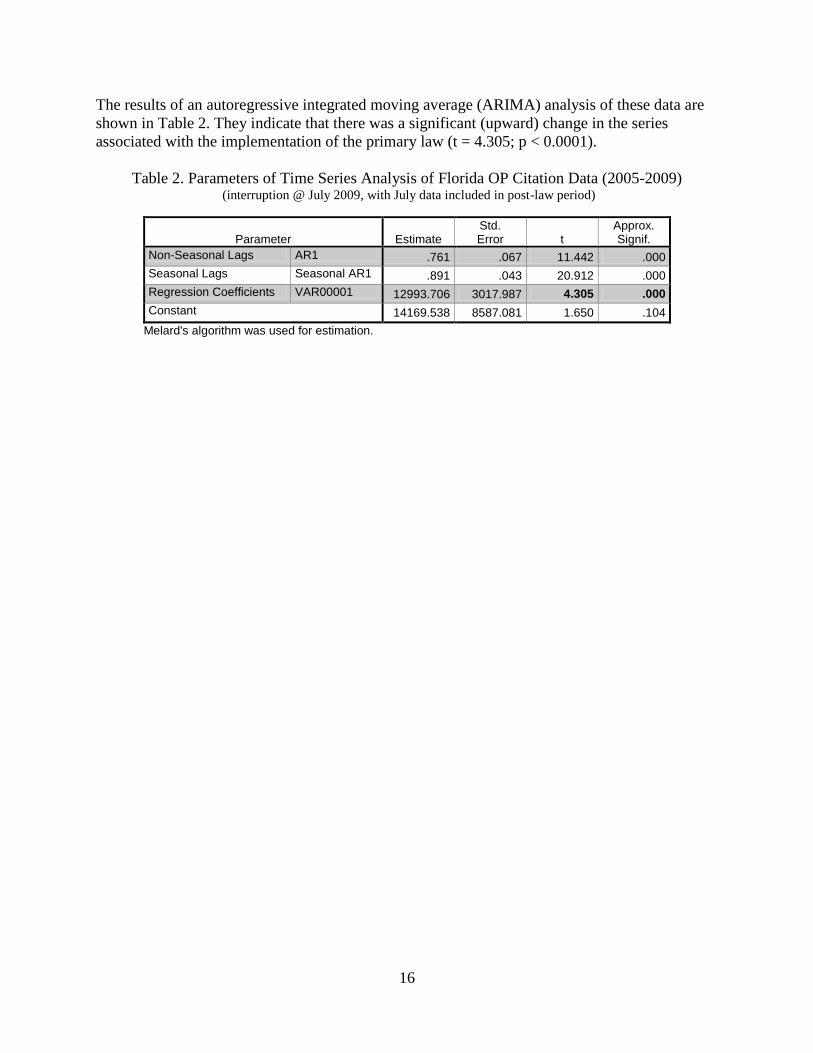
The results of an autoregressive integrated moving average (ARIMA) analysis of these data are
shown in Table 2. They indicate that there was a significant (upward) change in the series
associated with the implementation of the primary law (t = 4.305; p < 0.0001).
Table 2. Parameters of Time Series Analysis of Florida OP Citation Data (2005-2009) (interruption @ July 2009, with July data included in post-law period)
Parameter Estimate Std. Error t
Approx. Signif.
Non-Seasonal Lags AR1 .761 .067 11.442 .000
Seasonal Lags Seasonal AR1 .891 .043 20.912 .000
Regression Coefficients VAR00001 12993.706 3017.987 4.305 .000
Constant 14169.538 8587.081 1.650 .104
Melard's algorithm was used for estimation.
17
IV. Results of the 2010 CIOT Mobilization and the Primary Law
The 2010 CIOT Mobilization was the first High Visibility Enforcement (HVE) seat belt program
conducted in Florida under a primary law. PRG examined annual mobilization inputs and
outcomes for four years leading up to the time of the law change and the first year after, in year
2010. Amount of publicity and enforcement, awareness, and seat belt usage were tracked to
determine if the new law resulted in different levels of program inputs and outcomes.
CIOT Inputs
CIOT Enforcement
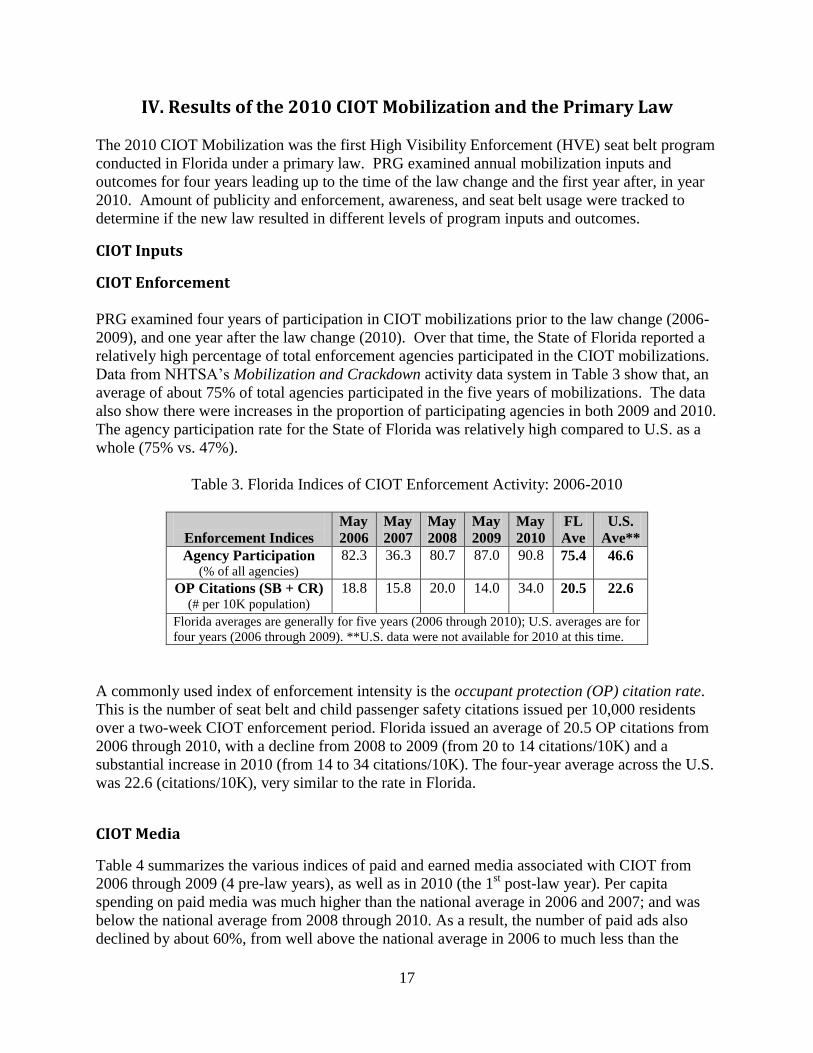
PRG examined four years of participation in CIOT mobilizations prior to the law change (2006-
2009), and one year after the law change (2010). Over that time, the State of Florida reported a
relatively high percentage of total enforcement agencies participated in the CIOT mobilizations.
Data from NHTSA’s Mobilization and Crackdown activity data system in Table 3 show that, an
average of about 75% of total agencies participated in the five years of mobilizations. The data
also show there were increases in the proportion of participating agencies in both 2009 and 2010.
The agency participation rate for the State of Florida was relatively high compared to U.S. as a
whole (75% vs. 47%).
Table 3. Florida Indices of CIOT Enforcement Activity: 2006-2010
Enforcement Indices
May
2006
May
2007
May
2008
May
2009
May
2010
FL
Ave
U.S.
Ave**
Agency Participation (% of all agencies)
82.3 36.3 80.7 87.0 90.8 75.4 46.6
OP Citations (SB + CR) (# per 10K population)
18.8 15.8 20.0 14.0 34.0
20.5 22.6
Florida averages are generally for five years (2006 through 2010); U.S. averages are for
four years (2006 through 2009). **U.S. data were not available for 2010 at this time.
A commonly used index of enforcement intensity is the occupant protection (OP) citation rate.
This is the number of seat belt and child passenger safety citations issued per 10,000 residents
over a two-week CIOT enforcement period. Florida issued an average of 20.5 OP citations from
2006 through 2010, with a decline from 2008 to 2009 (from 20 to 14 citations/10K) and a
substantial increase in 2010 (from 14 to 34 citations/10K). The four-year average across the U.S.
was 22.6 (citations/10K), very similar to the rate in Florida.
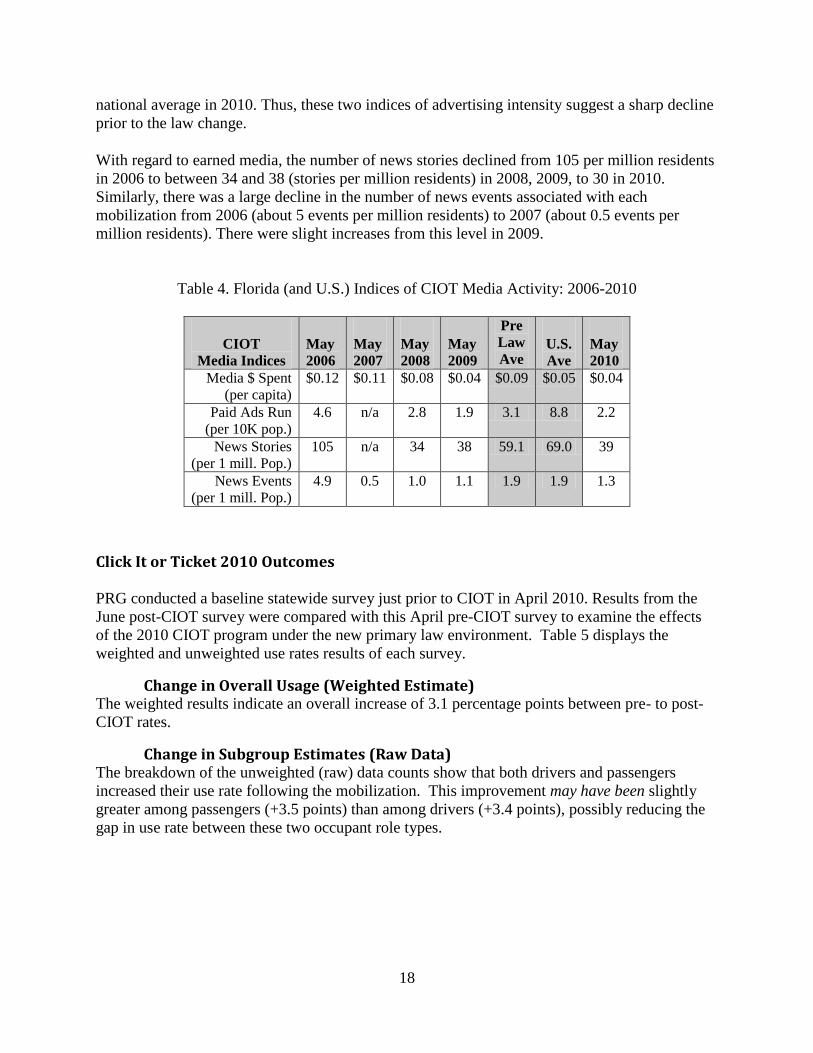
CIOT Media
Table 4 summarizes the various indices of paid and earned media associated with CIOT from
2006 through 2009 (4 pre-law years), as well as in 2010 (the 1st post-law year). Per capita
spending on paid media was much higher than the national average in 2006 and 2007; and was
below the national average from 2008 through 2010. As a result, the number of paid ads also
declined by about 60%, from well above the national average in 2006 to much less than the
18
national average in 2010. Thus, these two indices of advertising intensity suggest a sharp decline
prior to the law change.
With regard to earned media, the number of news stories declined from 105 per million residents
in 2006 to between 34 and 38 (stories per million residents) in 2008, 2009, to 30 in 2010.
Similarly, there was a large decline in the number of news events associated with each
mobilization from 2006 (about 5 events per million residents) to 2007 (about 0.5 events per
million residents). There were slight increases from this level in 2009.
Table 4. Florida (and U.S.) Indices of CIOT Media Activity: 2006-2010
CIOT
Media Indices
May 2006
May 2007
May 2008
May 2009
Pre Law Ave
U.S. Ave
May 2010
Media $ Spent (per capita)
$0.12 $0.11 $0.08 $0.04 $0.09 $0.05 $0.04
Paid Ads Run (per 10K pop.)
4.6 n/a 2.8 1.9 3.1 8.8 2.2
News Stories (per 1 mill. Pop.)
105 n/a 34 38 59.1 69.0 39
News Events (per 1 mill. Pop.)
4.9 0.5 1.0 1.1 1.9 1.9 1.3
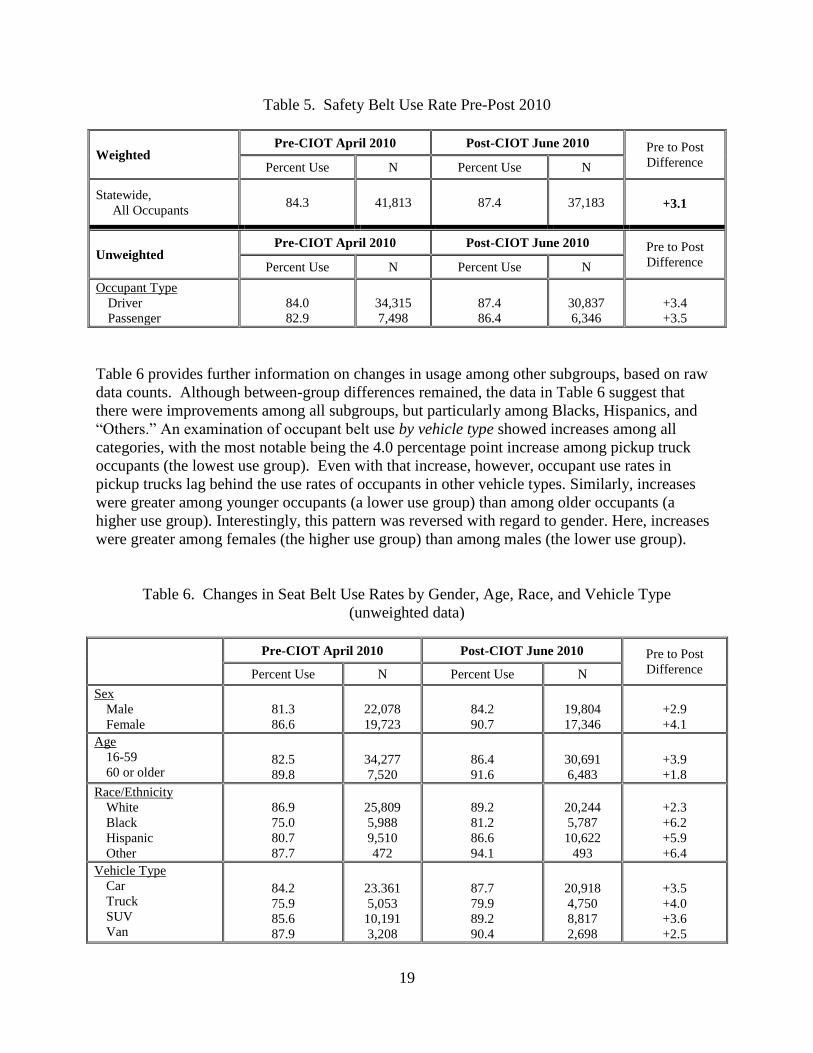
Click It or Ticket 2010 Outcomes PRG conducted a baseline statewide survey just prior to CIOT in April 2010. Results from the
June post-CIOT survey were compared with this April pre-CIOT survey to examine the effects
of the 2010 CIOT program under the new primary law environment. Table 5 displays the
weighted and unweighted use rates results of each survey.
Change in Overall Usage (Weighted Estimate) The weighted results indicate an overall increase of 3.1 percentage points between pre- to post-
CIOT rates.
Change in Subgroup Estimates (Raw Data) The breakdown of the unweighted (raw) data counts show that both drivers and passengers
increased their use rate following the mobilization. This improvement may have been slightly
greater among passengers (+3.5 points) than among drivers (+3.4 points), possibly reducing the
gap in use rate between these two occupant role types.
19
Table 5. Safety Belt Use Rate Pre-Post 2010
Weighted Pre-CIOT April 2010 Post-CIOT June 2010 Pre to Post
Difference Percent Use N Percent Use N
Statewide,
All Occupants 84.3 41,813 87.4 37,183
+3.1
Unweighted Pre-CIOT April 2010 Post-CIOT June 2010 Pre to Post
Difference Percent Use N Percent Use N
Occupant Type
Driver
Passenger
84.0
82.9
34,315
7,498
87.4
86.4
30,837
6,346
+3.4
+3.5
Table 6 provides further information on changes in usage among other subgroups, based on raw
data counts. Although between-group differences remained, the data in Table 6 suggest that
there were improvements among all subgroups, but particularly among Blacks, Hispanics, and
“Others.” An examination of occupant belt use by vehicle type showed increases among all
categories, with the most notable being the 4.0 percentage point increase among pickup truck
occupants (the lowest use group). Even with that increase, however, occupant use rates in
pickup trucks lag behind the use rates of occupants in other vehicle types. Similarly, increases
were greater among younger occupants (a lower use group) than among older occupants (a
higher use group). Interestingly, this pattern was reversed with regard to gender. Here, increases
were greater among females (the higher use group) than among males (the lower use group).
Table 6. Changes in Seat Belt Use Rates by Gender, Age, Race, and Vehicle Type
(unweighted data)
Pre-CIOT April 2010 Post-CIOT June 2010 Pre to Post
Difference Percent Use N Percent Use N
Sex
Male
Female
81.3
86.6
22,078
19,723
84.2
90.7
19,804
17,346
+2.9
+4.1
Age
16-59
60 or older 82.5
89.8
34,277
7,520
86.4
91.6
30,691
6,483
+3.9
+1.8
Race/Ethnicity
White
Black
Hispanic
Other
86.9
75.0
80.7
87.7
25,809
5,988
9,510
472
89.2
81.2
86.6
94.1
20,244
5,787
10,622
493
+2.3
+6.2
+5.9
+6.4
Vehicle Type
Car
Truck
SUV
Van
84.2
75.9
85.6
87.9
23.361
5,053
10,191
3,208
87.7
79.9
89.2
90.4
20,918
4,750
8,817
2,698
+3.5
+4.0
+3.6
+2.5

20
The data presented in Table 7 concern location and daily travel characteristics. Nearly all the
data presented demonstrate increases in usage from pre-CIOT (April) to post-CIOT (June).
Increases were measured across all regions (i.e., North, Central, and South). Further breakdowns
show that while the North region had one county (Marion) where no increase was measured,
increases in belt use were measured in all of the remaining 11 counties observed, with increases
ranging from 0.8 points (in Hillsborough County) to 7.0 points (in Lee County).
Table 7. Changes in Seat Belt Use Rates by Region, County, Road Type, and Day of Week
(unweighted data)
Pre-CIOT April 2010 Post-CIOT June 2010 Pre to Post
Difference Percent Use N Percent Use N
Region and County
North Duval County
Leon County
Marion County
Central Hillsborough County
Orange County
Pinellas County
Polk County
South Broward County
Collier County
Lee County
Miami-Dade County
Palm Beach County
85.4
86.4
85.7
81.7
84.2
84.8
81.5
85.0
85.6
83.0
81.6
91.1
87.2
78.9
83.6
6,719
3,947
1,543
1,199
13,624
4,101
3,038
4,150
2,335
21,470
5,949
2,112
3,439
6,113
3,856
87.6
88.9
89.4
81.5
86.1
85.6
83.8
88.5
87.1
87.9
87.0
93.7
93.0
85.9
89.2
7,025
4,115
1,534
1,316
11,380
3,904
3,038
2,815
1,623
18,778
5,704
895
1,490
6,714
3,975
+2.2
+2.5
+3.7
-0.1
+1.9
+0.8
+2.4
+3.5
+1.6
+4.9
+5.4
+2.6
+5.8
+7.0
+5.6
Roadway Type
Interstate
Principal Arterial
Minor Arterial
Collector
84.7
84.5
83.6
80.8
9,462
14,712
12,168
5,471
88.1
87.4
87.2
85.7
9,269
12,336
10,697
4,881
+3.4
+2.9
+3.6
+4.9
Day of Week
Monday
Tuesday
Wednesday
Thursday
Friday
Saturday
Sunday
84.1
84.8
83.9
84.0
82.6
83.6
84.5
5,063
6,563
5,071
5,345
8,111
7,695
3,965
88.8
87.6
87.3
88.4
84.6
87.4
87.8
5,364
4,923
3,326
5,200
6,959
7,306
4,105
+4.7
+2.8
+3.4
+4.4
+2.0
+3.8
+3.3
Increases were measured on all road types, with the highest point increases among the more local
roads (with lower baseline rates). Examining belt use by day of week showed improvement on all
days, surpassing 87 percent on all days except Friday.
In summary, the 2010 CIOT Mobilization achieved its goal of increasing belt use under the
relatively new primary law environment, in spite of large gains seen in 2009. Improvement was
measured across nearly all subgroups, although between-group differences remained even after
21
the 2010 CIOT. These trends and between-group differences will be examined in more detail in
the next section.
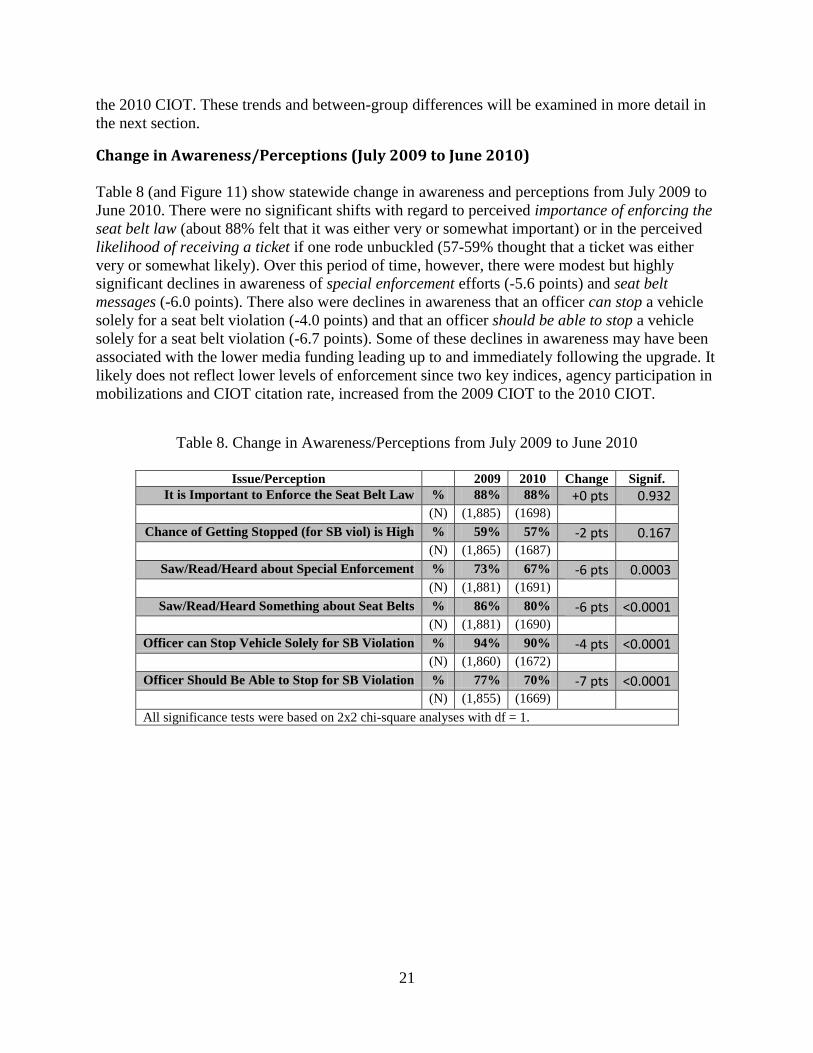
Change in Awareness/Perceptions (July 2009 to June 2010)
Table 8 (and Figure 11) show statewide change in awareness and perceptions from July 2009 to
June 2010. There were no significant shifts with regard to perceived importance of enforcing the
seat belt law (about 88% felt that it was either very or somewhat important) or in the perceived
likelihood of receiving a ticket if one rode unbuckled (57-59% thought that a ticket was either
very or somewhat likely). Over this period of time, however, there were modest but highly
significant declines in awareness of special enforcement efforts (-5.6 points) and seat belt
messages (-6.0 points). There also were declines in awareness that an officer can stop a vehicle
solely for a seat belt violation (-4.0 points) and that an officer should be able to stop a vehicle
solely for a seat belt violation (-6.7 points). Some of these declines in awareness may have been
associated with the lower media funding leading up to and immediately following the upgrade. It
likely does not reflect lower levels of enforcement since two key indices, agency participation in
mobilizations and CIOT citation rate, increased from the 2009 CIOT to the 2010 CIOT.
Table 8. Change in Awareness/Perceptions from July 2009 to June 2010
Issue/Perception 2009 2010 Change Signif.
It is Important to Enforce the Seat Belt Law % 88% 88% +0 pts 0.932 (N) (1,885) (1698)
Chance of Getting Stopped (for SB viol) is High % 59% 57% -2 pts 0.167 (N) (1,865) (1687)
Saw/Read/Heard about Special Enforcement % 73% 67% -6 pts 0.0003 (N) (1,881) (1691)
Saw/Read/Heard Something about Seat Belts % 86% 80% -6 pts <0.0001 (N) (1,881) (1690)
Officer can Stop Vehicle Solely for SB Violation % 94% 90% -4 pts <0.0001 (N) (1,860) (1672)
Officer Should Be Able to Stop for SB Violation % 77% 70% -7 pts <0.0001
(N) (1,855) (1669)
All significance tests were based on 2x2 chi-square analyses with df = 1.
22
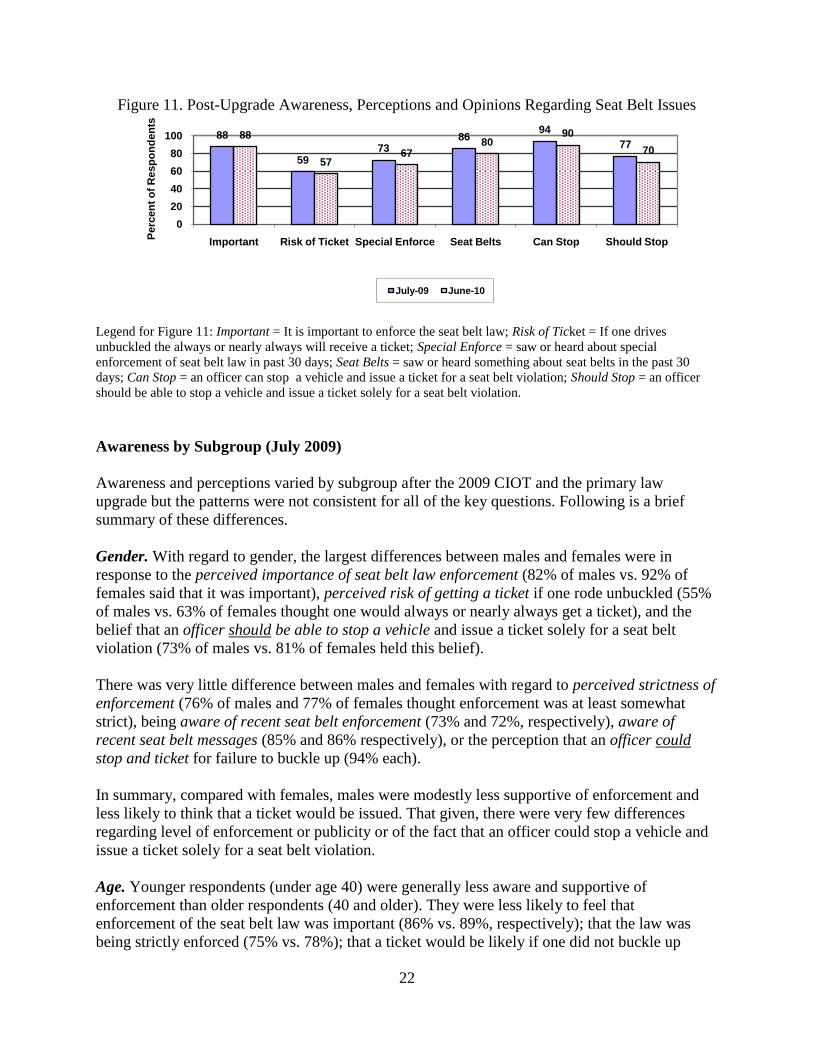
Figure 11. Post-Upgrade Awareness, Perceptions and Opinions Regarding Seat Belt Issues
Legend for Figure 11: Important = It is important to enforce the seat belt law; Risk of Ticket = If one drives
unbuckled the always or nearly always will receive a ticket; Special Enforce = saw or heard about special
enforcement of seat belt law in past 30 days; Seat Belts = saw or heard something about seat belts in the past 30
days; Can Stop = an officer can stop a vehicle and issue a ticket for a seat belt violation; Should Stop = an officer
should be able to stop a vehicle and issue a ticket solely for a seat belt violation.
Awareness by Subgroup (July 2009)
Awareness and perceptions varied by subgroup after the 2009 CIOT and the primary law
upgrade but the patterns were not consistent for all of the key questions. Following is a brief
summary of these differences.
Gender. With regard to gender, the largest differences between males and females were in
response to the perceived importance of seat belt law enforcement (82% of males vs. 92% of
females said that it was important), perceived risk of getting a ticket if one rode unbuckled (55%
of males vs. 63% of females thought one would always or nearly always get a ticket), and the
belief that an officer should be able to stop a vehicle and issue a ticket solely for a seat belt
violation (73% of males vs. 81% of females held this belief).
There was very little difference between males and females with regard to perceived strictness of
enforcement (76% of males and 77% of females thought enforcement was at least somewhat
strict), being aware of recent seat belt enforcement (73% and 72%, respectively), aware of
recent seat belt messages (85% and 86% respectively), or the perception that an officer could
stop and ticket for failure to buckle up (94% each).
In summary, compared with females, males were modestly less supportive of enforcement and
less likely to think that a ticket would be issued. That given, there were very few differences
regarding level of enforcement or publicity or of the fact that an officer could stop a vehicle and
issue a ticket solely for a seat belt violation.
Age. Younger respondents (under age 40) were generally less aware and supportive of
enforcement than older respondents (40 and older). They were less likely to feel that
enforcement of the seat belt law was important (86% vs. 89%, respectively); that the law was
being strictly enforced (75% vs. 78%); that a ticket would be likely if one did not buckle up
88
5973
8694
7788
5767
8090
70
0
20
40
60
80
100
Important Risk of Ticket Special Enforce Seat Belts Can Stop Should Stop
Perc
en
t o
f R
esp
on
den
ts
July-09 June-10
23
(56% vs. 63%); to be aware of enforcement (72% vs. 74%) or aware of seat belt messages (83%
vs. 88%); to be aware of the ability of an officer to issue a ticket solely for a seat belt violation
(93% vs. 95%) or to express support for that ability (73% vs. 81%). That said, the differences
were modest, except for the perceived risk of getting a ticket if one rode unbuckled (7-point
difference) and the belief that an officer should be able to stop a vehicle and issue a ticket solely
for a seat belt violation (9-point difference).
Race. This summary looks only at differences between Whites and Blacks, which were the two
largest racial groups (about 1,175 White respondents about 380 Black respondents). The number
of Asians and Native Americans was small (about 60 and 10, respectively) and their results were
highly variable. There was a reasonably large group of about 200 “Other” respondents but the
make up of that group was very heterogeneous and thus not easily defined. There were very little
differences between Whites and Blacks with regard to perceived importance of enforcing the seat
belt law, perceived risk of getting a ticket for non-use, or having heard recent seat belt messages.
There was a modest difference with regard to perceived strictness of enforcement (75% among
Whites, 78% among Blacks). Blacks were more likely than Whites to be aware of recent
enforcement (77% and 72%, respectively) but Blacks were less likely than Whites to be aware
that police could stop and ticket solely for a seat belt violation (91% and 95%, respectively).
Finally, a smaller proportion of Blacks thought that police should be able to stop and ticket a
motorist simply for a seat belt violation (71% and 76%, respectively).
Ethnicity. About 300 respondents indicated that they were of Hispanic ethnicity and about 1,450
indicated that they were not Hispanic. There was very little difference between these two groups
with regard to perceived strictness of enforcement or awareness of recent enforcement or seat
belt messages (although Hispanics were slightly more aware of both enforcement and messages).
There also was little or no difference between Hispanics and non-Hispanics in their awareness
that police can stop and ticket for a seat belt violation.
There were substantial differences with regard to the importance of enforcing the seat belt law
(95% of Hispanics and 86% of non-Hispanics said it was important), in the perceived likelihood
of getting a ticket if unbuckled (64% of Hispanics and 58% of non-Hispanics said a ticket would
always or nearly always be given), and in the belief that police should be able to stop and ticket a
motorist solely for a seat belt violation (86% of Hispanics and 75% of non-Hispanics).
Vehicle Type. The largest group of respondents, about 900, said that they most often drove a
passenger car; about 300 drove a pickup; another 300 drove an SUV; and about 100 drove a van.
Another 78 said they drove some other vehicle type and about 50 checked multiple vehicle types.
The patterns in awareness and perceptions associated with these subcategories were not strong or
consistent. Perhaps the most consistent pattern was among occupants of pickup trucks.
Proportionately fewer of them felt that it was important to enforce the seat belt law (82% vs.
88% of non-pickup respondents); a smaller percentage of these occupants thought that a ticket
would always or nearly always be issued for a seat belt violation (55% vs. 59%); and
proportionately fewer thought that a police officer should be able to stop a vehicle and issue a
ticket solely for a seat belt violation (74% vs. 78%). Responses among occupants of pickups and
all others were nearly identical with regard to the perceived strictness by which the law was
being enforced, recent efforts to enforce the seat belt law, and the fact that an officer can stop
24
and ticket solely for a seat belt violation. Occupants of pickups were more likely to say that they
had seen recent messages about seat belt use (90% vs. 85%).
In summary of awareness levels by subgroup, there was a tendency for lower use groups, such as
males, younger occupants, and occupants of pickup trucks to be less supportive of enforcement
and to perceive less risk of getting a ticket. These groups generally provided the lowest support
for the primary enforcement provisions of the new law. Hispanics, on the other hand, were more
likely to be aware of recent enforcement, to believe that it was important, to think that the risk of
getting a ticket for not buckling up was higher, and to support primary enforcement provisions.
25
V. Discussion
Studies of primary law upgrades have shown that they frequently affect higher risk groups at
least as much as lower risk groups. Upgrades have, for example, resulted in significant increases
in usage among young males, drivers of pickup trucks, rural occupants, drinking drivers and
occupants killed in late night crashes (Eby et al., 2002; Voas et al., 2007; and Masten, 2007).
On June 30, 2009, when Florida implemented a primary seat belt law, it already had a high
baseline usage rate compared with past law upgrades. In addition, the State was engaged in a
Rural Demonstration Program (RDP) to increase usage in rural areas in the northern part of the
State, and it was participating in annual Click It or Ticket (CIOT) mobilizations.
The 2009 CIOT mobilization occurred after the new law had passed but before the law was
implemented. There was some evidence that the 2009 CIOT mobilization was less intense than in
prior years, and the decrease in intensity is likely associated with the smaller gain in usage (about
3 percentage points). Immediately after the law change, PRG measured an additional 4.3 point
increase in seat belt usage statewide (from 80.9% post-CIOT to 85.2% post-upgrade). Perhaps
most importantly, the impact of the law change was greatest among low-use groups, including
males, Black occupants, and occupants of pickup trucks.
After the primary law was put into effect, awareness surveys indicated that 90% of respondents
were aware of the fact that police could stop and ticket a motorist solely for a seat belt violation
(i.e., primary enforcement). In addition, this provision was supported by about three-quarters of
all respondents.
The 2010 CIOT mobilization was the State of Florida’s first High Visibility Enforcement program
for seat belts under a primary enforcement law. Enforcement intensity increased to levels not seen
before, and that is likely associated with additional gains in statewide belt usage. Once again,
increases were greatest among the lowest use subgroups.
The conclusion of this case study is that the primary law upgrade in Florida had an immediate and
significant impact on program activities and observed usage.
26
References
Bowman, B.L. and Rounds, D.A. (1989). Restraint System Usage in the Traffic Population: 1988
Annual Report. DOT HS 807 447. Washington, DC: National Highway Traffic Safety
Administration.
Bowman, B.L. and Rounds, D.A. (1988). Restraint System Usage in the Traffic Population: 1987
Annual Report. DOT HS 807 342. Washington, DC: National Highway Traffic Safety
Administration.
Datta, T.K. and Guzek, P. (1992). Restraint System Use in 19 U.S. Cities: 1991 Annual Report.
DOT HS 808 148. Washington DC: National Highway Traffic Safety Administration.
Datta, T.K. and Guzek, P. (1991). Restraint System Use in 19 U.S. Cities: 1990 Annual Report.
DOT HS 808 xxx. Washington DC: National Highway Traffic Safety Administration.
Datta, T.K. and Guzek, P. (1990). Restraint System Use in 19 U.S. Cities: 1989 Annual Report.
DOT HS 807 595. Washington DC: National Highway Traffic Safety Administration.
Eby, DW, Vivoda, JM, and Fordyce, TA. (2002) The effects of standard enforcement on
Michigan safety belt use. Accident Analysis and Prevention 34:815-823.
Goryl, M.E. (1986). Restraint System Usage in the Traffic Population: 1985 Annual Report.
DOT HS 806 978. Washington, DC: National Highway Traffic Safety Administration.
Goryl, M.E. and Bowman, B.L. (1987). Restraint System Usage in the Traffic Population: 1986
Annual Report. DOT HS 807 080. Washington, DC: National Highway Traffic Safety
Administration.
Goryl, M.E., and Cynecki, M.J. (1985). Restraint System Usage in the Traffic Population. DOT
HS 806 714. Washington, DC: National Highway Traffic Safety Administration.
Masten, S. (2007). The effects of changing to primary enforcement on daytime and nightttime
seat belt use. Traffic Safety Facts: Research Note. DOT HS 810 743. Washington DC: National
Highway Traffic Safety Administration.
National Highway Traffic Safety Administration (2010). Seat belt use in 2009 – use rates in the
states and territories. Traffic Safety Facts. DOT HS 811 324: Washington DC
Nichols, J.L. and Ledingham, K.A. (2008) The impact of legislation, enforcement, and sanctions
on safety belt use. NCHRP Report 601. Washington, D.C.: Transportation Research Board.
Perkins, D.D., Cynecki, M.J., and Goryl, M. (1984). Restraint System Usage in the Traffic
Population. DOT HS 806 582. Washington, DC: National Highway Traffic Safety
Administration.
Solomon, MG. (2002). NHTSA Region IV Click It or Ticket Campaign. DOT HS 809 404.
Washington, DC: National Highway Traffic Safety Administration.
27
Voas, R.B., Fell, J.C., Tippetts, A.S., Blackman, K., and Nichols, J.L. (in press) Impact of
primary safety belt laws on alcohol-related front-seat occupant fatalities: five case studies.
Beltsville, Maryland: Pacific Institute for Research and Evaluation.