Embed Size (px)
Citation preview

Institutional Research and Planning 440 Day Hall Ithaca, New York 14853
2009 Alumni Survey
The 2009 Alumni Survey was administered to Cornell alumni of the class of 1998. The office of Alumni Affairs identified 2,955 alumni from the class of 1998; 2,829 had valid email and/or mailing addresses. The survey was administered both over the web (with the first invitation to participate over the web going out March 10) as well as with a paper instrument sent through regular mail (with the first survey mailing going out April 2). The survey closed June 1. There were a total of 897 responses to the Alumni Survey, for a total response rate of about 32%. The results of the 2009 Alumni Survey are displayed in the tables that follow. It may be most useful to refer to the survey questionnaire first in order to identify questions of interest. Once questions of interest are identified, tables with results can be found using the supplied bookmarks (by clicking on the bookmark image to the left) or by using the search function within Adobe Acrobat Reader. In the tables below, the first row presents the distribution of responses for a given question among all responding Cornell alumni. The 2009 Alumni Survey was also administered at a number of other private, highly selective, research universities. The next two rows of each table present the distribution of responses from the alumni at those institutions grouped together into two different “norm groups.” The groups are “Other Ivies” (an aggregation of other Ivy League universities) and “Other Universities” (an aggregation of some non‐Ivy universities). The next panel of each table presents the distribution of responses to a given question for two groups distinguished by responses to a survey question about prior giving: “Which of the following statements best describes your financial contributions to your undergraduate institution?” Cornell alumni are classified as “Not a donor” and “Donor” on that basis. Similarly, respondents were asked “Today, how connected do you feel to your undergraduate institution?” In the following tables, Cornell respondents who responded “Not very connected” are distinguished from respondents who responded as at least “Somewhat connected.” Finally, the distribution of responses for each item is shown by undergraduate college.

Row percentages within...
Have you enrolled in a graduate or professional degree program since
graduating from Cornell?Yes No
Cornell and Norm Groups** Cornell 71.4 28.6
Other Ivies 76.2 23.8
Other Universities 70.4 29.6
Cornell, by Past Donor Not a donor 72.5 27.5
Donor 71.1 28.9
Cornell, by Connection Not connected 73.7 26.3
Connected 70.9 29.1
Cornell, by College** ALS 72.3 27.7
AAP 50.0 50.0
Arts 79.5 20.5
Engineering 65.5 34.5
Human Ec 81.4 18.6
Hotel 45.9 54.1
ILR 82.9 17.1
** p<.01, * p<.05 (based on chi‐square)
2009 Alumni Survey Cornell University
Institutional Resarch and Planning Page 2

Row percentages within...
Are you enrolled in a graduate or professional degree program now?
Yes, I am a full‐time student
Yes, I am a part‐time student No
Cornell and Norm Groups* Cornell 3.6 3.5 93.0
Other Ivies 6.5 3.3 90.3
Other Universities 6.5 3.3 90.2
Cornell, by Past Donor Not a donor 5.0 4.6 90.4
Donor 3.0 2.8 94.2
Cornell, by Connection Not connected 4.1 2.7 93.2
Connected 3.4 3.7 92.9
Cornell, by College ALS 3.1 3.1 93.8
AAP 0.0 0.0 100.0
Arts 4.1 3.2 92.8
Engineering 3.7 3.1 93.2
Human Ec 4.3 2.9 92.8
Hotel 0.0 0.0 100.0
ILR 2.9 2.9 94.1
** p<.01, * p<.05 (based on chi‐square)
2009 Alumni Survey Cornell University
Institutional Resarch and Planning Page 3

Arts 37 10 19 25 3 0 0
Row percentages within...
How many years after you finished college did you start your graduate or professional education?
Immediately (the
following fall or spring) 1 year later
2‐3 years later
4‐6 years later
7‐10 years later
11 or more years later
Cornell and Norm Groups** Cornell 36.7 10.2 18.7 25.8 8.4 0.2
Other Ivies 26.0 13.8 24.8 26.5 7.9 1.1
Other Universities 31.1 13.6 21.6 24.3 9.1 0.3
Cornell, by Past Donor Not a donor 35.3 11.5 21.1 23.4 8.7 0.0
Donor 36.5 9.8 18.1 26.9 8.3 0.3
Cornell, by Connection Not connected 25.9 11.1 19.4 34.3 9.3 0.0
Connected 38.9 9.5 18.8 24.2 8.3 0.2
Cornell, by College* ALS 45.3 8.5 15.4 24.8 6.0 0.0
AAP 33.3 25.0 8.3 33.3 0.0 0.0
Arts 37.3.3 10.7.7 19.2.2 25.4.4 7.37. 0.0.
Engineering 36.2 2.9 17.1 30.5 12.4 1.0
Human Ec 37.5 16.1 26.8 12.5 7.1 0.0
Hotel 0.0 0.0 29.4 58.8 11.8 0.0
ILR 31.0 13.8 24.1 20.7 10.3 0.0
** p<.01, * p<.05 (based on chi‐square)
2009 Alumni Survey Cornell University
Institutional Resarch and Planning Page 4

Hotel 48 33 18 0 0 0 0 0 0
Row percentages within...
Altogether, for how many years have you attended graduate or professional school?
None 1 to 2 years 3 to 4 years 5 to 6 years 7 to 10 years11 or more
yearsCornell and Norm Groups** Cornell 25.0 32.0 28.4 8.5 5.6 0.5
Other Ivies 24.6 26.2 29.6 12.4 7.0 0.3
Other Universities 29.7 26.8 25.8 11.7 5.7 0.3
Cornell, by Past Donor Not a donor 24.0 30.9 27.1 10.8 6.3 1.0
Donor 25.0 32.9 29.4 7.2 5.3 0.2
Cornell, by Connection Not connected 21.6 41.7 25.2 7.2 4.3 0.0
Connected 25.4 30.3 28.8 9.0 5.9 0.6
Cornell, by College** ALS 20.3 31.8 25.7 10.8 11.5 0.0
AAP 42.9 38.1 19.0 0.0 0.0 0.0
Arts 18.9 29.0 33.6 11.1 6.0 1.4
Engineering 31.4 41.8 19.6 3.9 3.3 0.0
Human Ec 16.4 26.9 35.8 11.9 9.0 0.0
Hotel 48.5.5 33.3.3 18.2.2 0.0. 0.0. 0.0.
ILR 14.7 23.5 58.8 2.9 0.0 0.0
** p<.01, * p<.05 (based on chi‐square)
2009 Alumni Survey Cornell University
Institutional Resarch and Planning Page 5

Hotel 0 0 0 0 17 29 52
Row percentages within...
How well did Cornell prepare you for graduate or professional school?
Very poorlyLess than adequately Adequately
More than adequately Very well
Cornell and Norm Groups* Cornell 0.5 1.8 15.1 25.0 57.6
Other Ivies 0.4 2.0 10.8 24.0 62.8
Other Universities 0.4 1.4 11.3 22.4 64.5
Cornell, by Past Donor Not a donor 0.9 2.3 18.6 27.4 50.7
Donor 0.3 1.6 12.4 23.6 62.2
Cornell, by Connection** Not connected 2.8 4.7 18.7 31.8 42.1
Connected 0.0 1.0 13.8 23.3 61.9
Cornell, by College ALS 1.7 1.7 20.3 16.9 59.3
AAP 0.0 0.0 16.7 41.7 41.7
Arts 0.0 3.4 16.0 30.3 50.3
Engineering 0.0 1.0 9.5 26.7 62.9
Human Ec 0.0 1.8 17.9 10.7 69.6
Hotel 0.0. 0.0. 17.6.6 29.4.4 52.9.9
ILR 0.0 0.0 13.8 24.1 62.1
** p<.01, * p<.05 (based on chi‐square)
2009 Alumni Survey Cornell University
Institutional Resarch and Planning Page 6

education?
44 1.9 7 6 7 7 7 7 7 7 8 8 0 0
Row percentages within...
What was the total amount you borrowed to finance your graduate or professional
No loans $1 ‐ $9,999$10,0$19,9
00 ‐ 99
$20$2
,000 ‐ 9,999
$30,000 ‐ $39,999
$40,000$49,999
‐ $50,00$74,9
0 ‐ 99
$75$99
,000 ‐ ,999
$100,000 ‐ $149,999
$150,000 or more
More than $0 but
unable to estimate
Cornell and Norm Groups* Cornell 36.4 2.4 6.3 5.4 6.3 7.3 11.2 7.3 11.4 5.2 0.7
Other Ivies 41.7 3.1 4.2 4.8 5.3 4.1 10.1 7.0 12.2 6.3 1.3
Other Universities 40.6 2.9 5.1 5.5 5.8 5.2 10.1 8.3 9.9 5.8 0.8
Cornell, by Past Donor Not a donor 30.1 2.3 6.0 7.4 8.3 6.9 13.9 6.5 10.6 6.9 0.9
Donor 40.0 2.6 6.8 4.2 5.5 7.3 9.9 7.8 11.7 3.9 0.5
Cornell, by Connection Not connected 29.2 2.8 6.6 5.7 7.5 9.4 14.2 3.8 13.2 6.6 0.9
Connected 38.3 2.5 6.7 5.2 6.4 6.7 9.8 8.1 11.0 4.8 0.6
Cornell, by College ALS 30.8 2.6 8.5 3.4 6.0 6.8 14.5 7.7 10.3 7.7 1.7
AAP 41.7 0.0 8.3 0.0 16.7 8.3 8.3 8.3 8.3 0.0 0.0
Arts 38.6 2.3 5.7 6.8 4.5 8.0 9.1 7.4 11.4 6.3 0.0
EnginEngineeringeering 44.2.2 1.9 6.76. 9.69. 6.76. 7.7. 7.7. 6.7 4.8 3.8 0.06. 4. 3. .
Human Ec 35.7 3.6 3.6 1.8 5.4 5.4 14.3 8.9 12.5 7.1 1.8
Hotel 31.3 6.3 6.3 6.3 6.3 6.3 12.5 12.5 12.5 0.0 0.0
ILR 31.0 3.4 3.4 3.4 3.4 10.3 10.3 3.4 31.0 0.0 0.0
** p<.01, * p<.05 (based on chi‐square)
2009 Alumni Survey Cornell University
Institutional Resarch and Planning Page 7

AAP 16 .2 .7 0 0 0 0 0 0 0 0 2 3 0 0 0 0
Row percentages within...
In what type of organization is your principal employment?
eSelf‐
mployedPrivate
profitfor‐ High
educaer tion
Kedu
‐12 cation
Intʹl org. in US
Intʹl orgoutsideUS
. US
Milita ry Fed govʹt
State and local govʹt, (except
education)
Private non‐profit, (except
education/intʹl orgs.) Other
Cornell and Norm Groups* Cornell 7.0 52.3 11.3 3.8 5.1 1.1 0.5 3.8 2.5 8.1 4.6
Other Ivies 9.1 46.1 13.4 4.9 2.8 1.1 0.4 3.8 3.1 9.1 6.3
Other Universities 10.0 46.1 12.2 4.9 4.0 1.0 0.7 3.6 2.5 8.8 6.1
Cornell, by Past Donor Not a donor 8.2 44.4 12.3 5.6 4.5 1.5 0.4 4.5 3.4 9.7 5.6
Donor 6.4 55.8 11.0 2.8 5.4 1.0 0.6 3.6 1.8 7.6 4.0
Cornell, by Connection Not connected 5.2 50.7 6.0 3.7 6.0 0.0 0.0 5.2 6.0 11.9 5.2
Connected 7.5 51.7 12.5 3.9 4.7 1.4 0.6 3.7 1.9 7.7 4.3
Cornell, by College** ALS 7.4 48.3 8.1 4.0 6.0 1.3 1.3 4.0 4.7 11.4 3.4
AAP 16.7.7 54.254 16.716 0.0. 0.0. 0.0. 0.0. 4.2 8.3 0.0 0.04. 8. . .
Arts 3.0 46.5 12.9 4.0 7.4 1.5 0.0 5.9 3.5 8.9 6.4
Engineering 6.7 71.1 2.7 2.0 4.7 0.0 1.3 2.7 1.3 4.0 3.4
Human Ec 7.9 44.4 14.3 4.8 3.2 1.6 0.0 6.3 1.6 11.1 4.8
Hotel 16.1 61.3 0.0 0.0 6.5 6.5 0.0 0.0 0.0 6.5 3.2
ILR 6.7 70.0 6.7 0.0 10.0 0.0 0.0 3.3 0.0 0.0 3.3
** p<.01, * p<.05 (based on chi‐square)
2009 Alumni Survey Cornell University
Institutional Resarch and Planning Page 8

Yes, same Yes, related No, not
Row percentages within...
Which of the following best describes your current position?
Entry level Mid‐level Senior levelExecutive
levelChief
ExecutiveCornell and Norm Groups Cornell 10.9 57.8 22.1 4.0 5.1
Other Ivies 13.6 54.0 21.5 4.7 6.2
Other Universities 13.2 53.2 23.4 4.1 6.1
Cornell, by Past Donor Not a donor 14.1 60.3 17.9 3.4 4.2
Donor 9.3 57.1 23.5 4.3 5.9
Cornell, by Connection Not connected 12.8 59.4 22.6 3.8 1.5
Connected 10.4 57.9 21.4 4.1 6.2
Cornell, by College** ALS 8.1 58.8 21.6 6.1 5.4
AAP 8.7 47.8 30.4 0.0 13.0
Arts 17.6 57.8 19.6 3.0 2.0
Engineering 6.7 55.7 28.2 3.4 6.0
Human Ec 11.7 60.0 21.7 3.3 3.3
Hotel 0.0 54.8 25.8 3.2 16.1
ILR 0.0 73.3 16.7 0.0 10.0
** p<.01, * p<.05 (based on chi‐square)
Row percentages within...
Is your current position related to your undergraduate field(s) of study?
Yes, same field as major
Yes, related to major
No, not related
Cornell and Norm Groups** Cornell 24.2 37.6 38.2
Other Ivies 17.3 36.4 46.4
Other Universities 20.4 37.4 42.2
Cornell, by Past Donor Not a donor 23.1 33.2 43.7
Donor 24.9 40.0 35.1
Cornell, by Connection Not connected 19.5 35.3 45.1
Connected 25.4 37.6 37.0
Cornell, by College** ALS 24.2 44.3 31.5
AAP 50.0 29.2 20.8
Arts 16.3 38.6 45.0
Engineering 28.9 33.6 37.6
Human Ec 19.0 47.6 33.3
Hotel 45.2 29.0 25.8
ILR 27.6 24.1 48.3
** p<.01, * p<.05 (based on chi‐square)
2009 Alumni Survey Cornell University
Institutional Resarch and Planning Page 9

Row percentages within...
How would you characterize the course of your career so far?
Staying in the same field
Moving around
within one general field
Changing fields once or
twice
Changing fields three or more times
Cornell and Norm Groups Cornell 42.3 25.7 27.3 4.8
Other Ivies 37.6 26.6 30.2 5.6
Other Universities 37.4 26.7 31.0 4.8
Cornell, by Past Donor Not a donor 42.1 23.4 29.8 4.7
Donor 42.4 26.9 26.1 4.6
Cornell, by Connection Not connected 44.6 17.6 32.4 5.4
Connected 42.2 26.9 26.3 4.6
Cornell, by College* ALS 48.8 24.4 25.6 1.3
AAP 58.3 29.2 8.3 4.2
Arts 44.0 23.9 29.4 2.8
Engineering 39.4 23.0 32.1 5.5
Human Ec 30.4 39.1 24.6 5.8
Hotel 32.4 35.1 21.6 10.8
ILR 45.7 25.7 20.0 8.6
** p<.01, * p<.05 (based on chi‐square)
2009 Alumni Survey Cornell University
Institutional Resarch and Planning Page 10

ILR 0 0 9 40 0 0 2 9 9 42 6
Row percentages within...What is your principal occupation right now? (aggregated)
Educator Health Legal Science Engineer Creative Business OtherCornell and Norm Groups* C* ornell 9.4 14.8 10.6 6.7 14.4 5.2 30.6 8.4
Other Ivies 12.7 16.4 12.9 5.2 7.3 7.7 29.4 8.4
Other Universities 10.4 15.6 10.6 5.9 11.8 7.5 30.2 8.0
Cornell, by Past Donor* Not a donor 9.5 17.1 12.2 7.6 14.8 7.6 23.4 7.9
Donor 9.3 13.7 9.7 6.0 14.2 3.8 34.6 8.7
Cornell, by Connection Not connected 7.9 16.6 13.2 4.6 13.2 7.9 25.8 10.6
Connected 9.5 14.6 9.6 7.4 14.1 4.4 32.2 8.3
Cornell, by College** ALS 7.4 21.5 7.4 10.4 7.4 4.9 28.8 12.3
AAP 13.0 8.7 4.3 4.3 47.8 13.0 4.3 4.3
Arts 11.3 19.8 15.3 9.0 5.0 8.6 23.4 7.7
Engineering 7.3 5.5 4.2 2.4 43.6 0.0 32.1 4.8
Human Ec 12.9 22.9 8.6 5.7 2.9 2.9 34.3 10.0
Hotel 0.0 0.0 5.4 0.0 5.4 0.0 81.1 8.1
ILR 0.0. 2.92. 40.0.0 0.0. 2.9. 2.9 42.9 8.62. .9 8.
** p<.01, * p<.05 (based on chi‐square)
2009 Alumni Survey Cornell University
Institutional Resarch and Planning Page 11

Row percentages within...
Row percentages within...
How well did Cornell prepare you for your current career?
Very poorlyLess than adequately Adequately
More than adequately Very well
Cornell and Norm Groups Cornell 0.1 2.8 23.2 33.5 40.3
Other Ivies 1.0 2.7 19.6 31.9 44.8
Other Universities 0.9 2.7 21.6 32.6 42.1
Cornell, by Past Donor* Not a donor 0.0 3.1 29.4 31.7 35.8
Donor 0.2 2.6 19.4 34.9 42.9
Cornell, by Connection** Not connected 0.0 8.2 36.3 31.5 24.0
Connected 0.0 1.8 20.3 33.9 44.0
Cornell, by College ALS 0.0 1.8 25.2 32.5 40.5
AAP 0.0 4.3 13.0 26.1 56.5
Arts 0.5 3.2 25.5 32.7 38.2
Engineering 0.0 1.8 24.1 35.5 38.6
Human Ec 0.0 4.3 18.8 43.5 33.3
Hotel 0.0 0.0 21.6 27.0 51.4
ILR 0.0 0.0 23.5 26.5 50.0
** p<.01, * p<.05 (based on chi‐square)
Row percentages within...
Overall, how satisfied are you with the course of your career thus far?Very
dissatisfieddissatisfiedGenerally dissatisfieddissatisfied AmbivalentAmbivalent
Generally satisfiedsatisfied Very satisfiedVery satisfied
Cornell and Norm Groups Cornell 1.0 3.8 11.0 51.9 32.2
Other Ivies 0.9 4.6 10.8 48.0 35.7
Other Universities 0.9 4.0 9.4 50.0 35.7
Cornell, by Past Donor Not a donor 0.7 3.9 13.5 53.9 28.0
Donor 1.3 3.6 9.5 50.6 35.0
Cornell, by Connection** Not connected 2.7 6.0 15.3 52.7 23.3
Connected 0.7 3.1 10.2 51.4 34.6
Cornell, by College ALS 1.2 0.6 7.9 55.5 34.8
AAP 0.0 4.3 4.3 56.5 34.8
Arts 2.2 2.7 13.0 51.6 30.5
Engineering 0.0 4.2 10.3 58.2 27.3
Human Ec 0.0 5.7 5.7 51.4 37.1
Hotel 2.7 2.7 10.8 43.2 40.5
ILR 0.0 2.9 17.1 48.6 31.4
** p<.01, * p<.05 (based on chi‐square)
2009 Alumni Survey Cornell University
Institutional Resarch and Planning Page 12

Row percentages within...
For how many of your undergraduate years, if any, were you an active
participant in the following: Student or campus government
None One YearTwo Years or
MoreCornell and Norm Groups** Cornell 91.3 4.3 4.4
Other Ivies 89.6 4.6 5.8
Other Universities 86.3 6.5 7.2
Cornell, by Past Donor Not a donor 91.8 4.4 3.7
Donor 91.1 4.2 4.7
Cornell, by Connection Not connected 93.2 2.0 4.8
Connected 90.9 4.8 4.2
Cornell, by College* ALS 88.1 7.5 4.4
AAP 95.7 4.3 0.0
Arts 92.9 2.8 4.2
Engineering 96.9 1.3 1.9
Human Ec 91.3 2.9 5.8
Hotel 88.9 2.8 8.3
ILR 79.4 14.7 5.9
** p<.01, * p<.05 (based on chi‐square)
Row percentages within...
...Intercollegiate athletics (including club sports)
None One YearTwo Years or
MoreCornell and Norm Groups** Cornell 76.6 6.6 16.8
Other Ivies 64.5 8.6 26.9
Other Universities 70.5 9.0 20.5
Cornell, by Past Donor* Not a donor 80.2 7.7 12.1
Donor 74.4 6.0 19.6
Cornell, by Connection Not connected 83.2 6.0 10.7
Connected 74.6 6.7 18.7
Cornell, by College ALS 78.1 6.9 15.0
AAP 87.0 4.3 8.7
Arts 77.7 6.5 15.8
Engineering 71.6 8.6 19.8
Human Ec 75.7 1.4 22.9
Hotel 80.6 8.3 11.1
ILR 76.5 0.0 23.5
** p<.01, * p<.05 (based on chi‐square)
2009 Alumni Survey Cornell University
Institutional Resarch and Planning Page 13
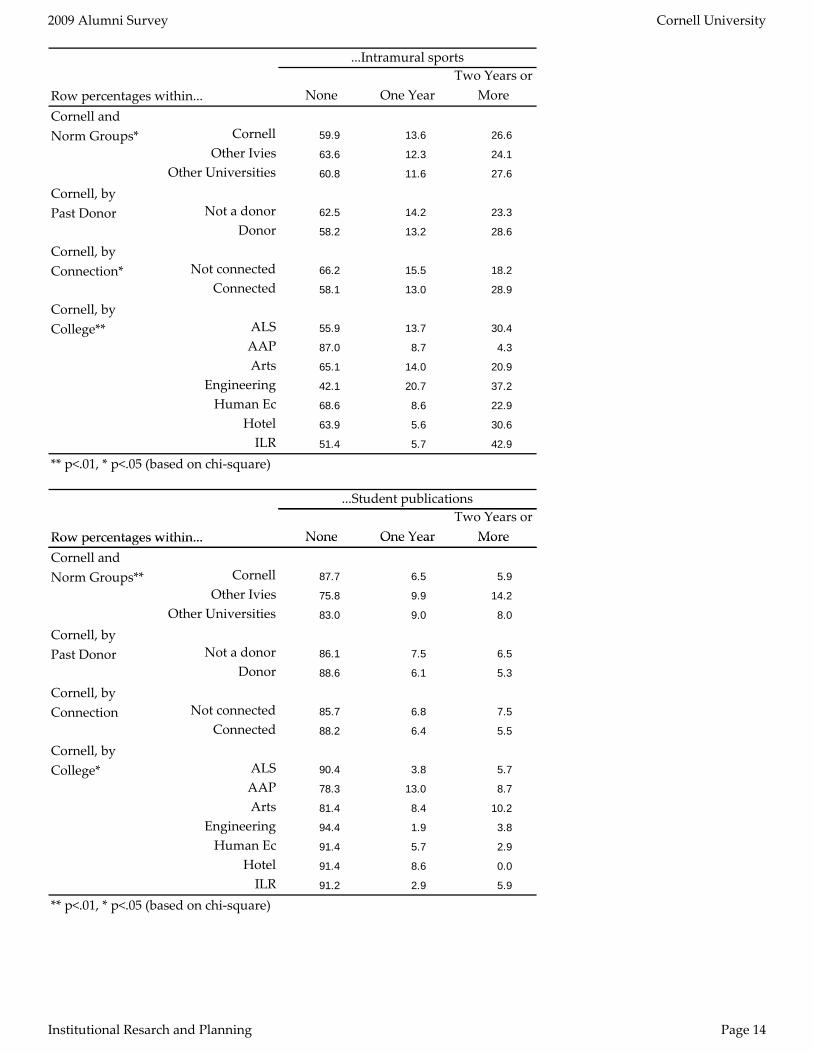
Row percentages within...
Row percentages within...
...Intramural sports
None One YearTwo Years or
MoreCornell and Norm Groups* Cornell 59.9 13.6 26.6
Other Ivies 63.6 12.3 24.1
Other Universities 60.8 11.6 27.6
Cornell, by Past Donor Not a donor 62.5 14.2 23.3
Donor 58.2 13.2 28.6
Cornell, by Connection* Not connected 66.2 15.5 18.2
Connected 58.1 13.0 28.9
Cornell, by College** ALS 55.9 13.7 30.4
AAP 87.0 8.7 4.3
Arts 65.1 14.0 20.9
Engineering 42.1 20.7 37.2
Human Ec 68.6 8.6 22.9
Hotel 63.9 5.6 30.6
ILR 51.4 5.7 42.9
** p<.01, * p<.05 (based on chi‐square)
Row percentages within...
...Student publications
NoneNone One YearOne YearTwo Years or
MoreMoreCornell and Norm Groups** Cornell 87.7 6.5 5.9
Other Ivies 75.8 9.9 14.2
Other Universities 83.0 9.0 8.0
Cornell, by Past Donor Not a donor 86.1 7.5 6.5
Donor 88.6 6.1 5.3
Cornell, by Connection Not connected 85.7 6.8 7.5
Connected 88.2 6.4 5.5
Cornell, by College* ALS 90.4 3.8 5.7
AAP 78.3 13.0 8.7
Arts 81.4 8.4 10.2
Engineering 94.4 1.9 3.8
Human Ec 91.4 5.7 2.9
Hotel 91.4 8.6 0.0
ILR 91.2 2.9 5.9
** p<.01, * p<.05 (based on chi‐square)
2009 Alumni Survey Cornell University
Institutional Resarch and Planning Page 14

Row percentages within...
Row percentages within...
...Performing arts music
None One YearTwo Years or
MoreCornell and Norm Groups** Cornell 77.9 6.2 16.0
Other Ivies 69.2 7.0 23.7
Other Universities 70.9 7.9 21.2
Cornell, by Past Donor Not a donor 76.0 7.1 16.9
Donor 78.9 5.3 15.8
Cornell, by Connection Not connected 76.9 7.5 15.6
Connected 78.2 5.7 16.1
Cornell, by College* ALS 79.1 5.1 15.8
AAP 82.6 4.3 13.0
Arts 68.1 8.3 23.6
Engineering 80.2 3.7 16.0
Human Ec 88.6 2.9 8.6
Hotel 82.9 11.4 5.7
ILR 88.2 5.9 5.9
** p<.01, * p<.05 (based on chi‐square)
Row percentages within...
...Political organization or club
NoneNone One YearOne YearTwo Years or
MoreMoreCornell and Norm Groups** Cornell 86.0 5.7 8.3
Other Ivies 81.2 6.8 12.0
Other Universities 84.5 5.5 10.0
Cornell, by Past Donor* Not a donor 81.8 7.4 10.8
Donor 88.0 4.9 7.0
Cornell, by Connection Not connected 91.1 3.4 5.5
Connected 85.2 6.3 8.5
Cornell, by College** ALS 91.8 5.1 3.2
AAP 73.9 4.3 21.7
Arts 81.2 6.6 12.2
Engineering 93.1 1.3 5.6
Human Ec 84.3 7.1 8.6
Hotel 91.4 5.7 2.9
ILR 79.4 8.8 11.8
** p<.01, * p<.05 (based on chi‐square)
2009 Alumni Survey Cornell University
Institutional Resarch and Planning Page 15

Two Years or
Row percentages within...
...Ethnic or cultural club or organization
None One YearTwo Years or
MoreCornell and Norm Groups Cornell 72.5 7.4 20.1
Other Ivies 71.5 5.8 22.7
Other Universities 71.1 7.0 21.9
Cornell, by Past Donor Not a donor 69.9 7.8 22.3
Donor 74.3 7.2 18.4
Cornell, by Connection Not connected 74.0 9.6 16.4
Connected 72.7 6.9 20.4
Cornell, by College** ALS 79.1 6.3 14.6
AAP 50.0 9.1 40.9
Arts 67.6 9.9 22.5
Engineering 77.6 4.3 18.0
Human Ec 73.9 5.8 20.3
Hotel 54.3 11.4 34.3
ILR 82.4 14.7 2.9
** p<.01, * p<.05 (based on chi‐square)
Row percentages within...
...Academic club, honor society, or professional association
None One YearTwo Years or
MoreCornell and Norm Groups** Cornell 59.1 10.2 30.7
Other Ivies 75.7 9.5 14.8
Other Universities 67.3 10.7 22.0
Cornell, by Past Donor* Not a donor 65.7 8.1 26.3
Donor 55.3 11.7 33.1
Cornell, by Connection Not connected 64.6 10.2 25.2
Connected 57.8 10.2 32.0
Cornell, by College ALS 56.9 11.3 31.9
AAP 60.9 8.7 30.4
Arts 61.9 10.2 27.9
Engineering 54.4 12.5 33.1
Human Ec 48.6 10.0 41.4
Hotel 45.7 8.6 45.7
ILR 52.9 5.9 41.2
** p<.01, * p<.05 (based on chi‐square)
2009 Alumni Survey Cornell University
Institutional Resarch and Planning Page 16

Row percentages within...
Row percentages within...
...Community service
None One YearTwo Years or
MoreCornell and Norm Groups** Cornell 52.6 13.9 33.5
Other Ivies 42.4 16.7 40.9
Other Universities 43.8 17.7 38.4
Cornell, by Past Donor** Not a donor 58.6 14.5 26.9
Donor 48.8 13.6 37.7
Cornell, by Connection* Not connected 62.6 10.2 27.2
Connected 50.2 14.6 35.3
Cornell, by College** ALS 46.0 17.4 36.6
AAP 56.5 13.0 30.4
Arts 50.2 11.3 38.5
Engineering 65.8 13.7 20.5
Human Ec 40.0 17.1 42.9
Hotel 45.7 22.9 31.4
ILR 61.8 2.9 35.3
** p<.01, * p<.05 (based on chi‐square)
Row percentages within...
...Fraternity/sorority
NoneNone One YearOne YearTwo Years or
MoreMoreCornell and Norm Groups** Cornell 65.9 2.7 31.4
Other Ivies 79.0 1.8 19.2
Other Universities 71.2 2.4 26.5
Cornell, by Past Donor** Not a donor 74.8 3.4 21.8
Donor 60.6 2.4 37.0
Cornell, by Connection** Not connected 82.2 4.1 13.7
Connected 62.6 2.4 35.0
Cornell, by College** ALS 62.3 1.9 35.8
AAP 82.6 4.3 13.0
Arts 67.8 2.8 29.4
Engineering 73.5 2.5 24.1
Human Ec 52.9 0.0 47.1
Hotel 47.2 0.0 52.8
ILR 28.6 5.7 65.7
** p<.01, * p<.05 (based on chi‐square)
2009 Alumni Survey Cornell University
Institutional Resarch and Planning Page 17

academic year
Row percentages within...
...Religious groups/organized religious activities
None One YearTwo Years or
MoreCornell and Norm Groups** Cornell 79.1 4.5 16.4
Other Ivies 78.0 4.5 17.5
Other Universities 74.2 5.5 20.3
Cornell, by Past Donor Not a donor 79.7 3.0 17.2
Donor 79.1 5.3 15.6
Cornell, by Connection Not connected 81.6 4.1 14.3
Connected 78.8 4.4 16.8
Cornell, by College ALS 86.0 2.5 11.5
AAP 81.8 0.0 18.2
Arts 77.1 7.0 15.9
Engineering 80.1 3.7 16.1
Human Ec 70.0 5.7 24.3
Hotel 82.9 2.9 14.3
ILR 73.5 2.9 23.5
** p<.01, * p<.05 (based on chi‐square)
Row percentages within...
...On‐campus employment during academic year
None One YearTwo Years or
MoreCornell and Norm Groups Cornell 36.7 10.3 53.0
Other Ivies 39.0 10.3 50.8
Other Universities 37.5 12.4 50.2
Cornell, by Past Donor Not a donor 35.1 9.7 55.2
Donor 37.2 10.3 52.5
Cornell, by Connection Not connected 38.0 11.3 50.7
Connected 36.3 9.3 54.4
Cornell, by College ALS 32.5 9.4 58.1
AAP 21.7 21.7 56.5
Arts 36.3 7.4 56.3
Engineering 40.1 10.5 49.4
Human Ec 47.1 14.3 38.6
Hotel 25.7 5.7 68.6
ILR 35.3 11.8 52.9
** p<.01, * p<.05 (based on chi‐square)
2009 Alumni Survey Cornell University
Institutional Resarch and Planning Page 18

Row percentages within...
...Off‐campus employment during academic year
None One YearTwo Years or
MoreCornell and Norm Groups** Cornell 78.3 7.8 14.0
Other Ivies 78.0 9.0 13.0
Other Universities 70.0 10.5 19.6
Cornell, by Past Donor Not a donor 76.5 9.2 14.3
Donor 79.1 6.8 14.1
Cornell, by Connection Not connected 78.2 7.5 14.3
Connected 78.5 7.7 13.7
Cornell, by College* ALS 80.1 5.8 14.1
AAP 72.7 4.5 22.7
Arts 81.9 6.0 12.1
Engineering 87.0 6.8 6.2
Human Ec 65.7 15.7 18.6
Hotel 75.0 13.9 11.1
ILR 70.6 5.9 23.5
** p<.01, * p<.05 (based on chi‐square)
Row percentages within...
While you were an undergraduate did undergraduate did
you...Work with a faculty member on his or her
research?Yes No
Cornell and Norm Groups Cornell 36.3 63.7
Other Ivies 35.3 64.7
Other Universities 37.1 62.9
Cornell, by Past Donor Not a donor 39.1 60.9
Donor 34.9 65.1
Cornell, by Connection Not connected 36.0 64.0
Connected 36.2 63.8
Cornell, by College** ALS 38.3 61.7
AAP 8.7 91.3
Arts 41.6 58.4
Engineering 34.4 65.6
Human Ec 45.7 54.3
Hotel 13.9 86.1
ILR 14.7 85.3
** p<.01, * p<.05 (based on chi‐square)
2009 Alumni Survey Cornell University
Institutional Resarch and Planning Page 19

Row percentages within...
Row percentages within...
...Interact with faculty on activities other than research coursework?Yes No
Cornell and Norm Groups* Cornell 51.7 48.3
Other Ivies 46.9 53.1
Other Universities 48.8 51.2
Cornell, by Past Donor Not a donor 49.2 50.8
Donor 53.2 46.8
Cornell, by Connection Not connected 45.3 54.7
Connected 52.6 47.4
Cornell, by College* ALS 52.8 47.2
AAP 65.2 34.8
Arts 49.3 50.7
Engineering 40.5 59.5
Human Ec 60.9 39.1
Hotel 66.7 33.3
ILR 52.9 47.1
** p<.01, * p<.05 (based on chi‐square)
Row percentages within... ...Study abroad?YesYes NoNo
Cornell and Norm Groups** Cornell 19.2 80.8
Other Ivies 24.8 75.2
Other Universities 28.4 71.6
Cornell, by Past Donor Not a donor 19.6 80.4
Donor 18.8 81.2
Cornell, by Connection Not connected 20.0 80.0
Connected 19.0 81.0
Cornell, by College** ALS 20.2 79.8
AAP 69.6 30.4
Arts 18.7 81.3
Engineering 3.7 96.3
Human Ec 34.8 65.2
Hotel 41.7 58.3
ILR 17.6 82.4
** p<.01, * p<.05 (based on chi‐square)
2009 Alumni Survey Cornell University
Institutional Resarch and Planning Page 20

Row percentages within...
Row percentages within...
...Study at another college in the U.S.?
Yes NoCornell and Norm Groups** Cornell 15.2 84.8
Other Ivies 8.4 91.6
Other Universities 12.9 87.1
Cornell, by Past Donor Not a donor 18.3 81.7
Donor 13.4 86.6
Cornell, by Connection Not connected 18.2 81.8
Connected 14.9 85.1
Cornell, by College ALS 10.1 89.9
AAP 8.7 91.3
Arts 8.3 91.7
Engineering 7.4 92.6
Human Ec 14.5 85.5
Hotel 2.9 97.1
ILR 8.8 91.2
** p<.01, * p<.05 (based on chi‐square)
Row percentages within...
...Engage in independent study for credit?YesYes NoNo
Cornell and Norm Groups Cornell 32.2 67.8
Other Ivies 31.2 68.8
Other Universities 31.1 68.9
Cornell, by Past Donor** Not a donor 38.9 61.1
Donor 28.8 71.2
Cornell, by Connection Not connected 38.3 61.7
Connected 31.0 69.0
Cornell, by College** ALS 28.0 72.0
AAP 52.2 47.8
Arts 36.7 63.3
Engineering 23.9 76.1
Human Ec 34.8 65.2
Hotel 11.1 88.9
ILR 29.4 70.6
** p<.01, * p<.05 (based on chi‐square)
2009 Alumni Survey Cornell University
Institutional Resarch and Planning Page 21

Row percentages within...
Row percentages within...
...Have an internship during a school term?
Yes NoCornell and Norm Groups** Cornell 20.5 79.5
Other Ivies 14.4 85.6
Other Universities 24.5 75.5
Cornell, by Past Donor Not a donor 20.9 79.1
Donor 20.1 79.9
Cornell, by Connection Not connected 24.3 75.7
Connected 19.1 80.9
Cornell, by College** ALS 11.7 88.3
AAP 17.4 82.6
Arts 12.5 87.5
Engineering 31.9 68.1
Human Ec 24.6 75.4
Hotel 30.6 69.4
ILR 38.2 61.8
** p<.01, * p<.05 (based on chi‐square)
Row percentages within...
...Have an internship during a school term?
YesYes NoNoCornell and Norm Groups** Cornell 20.5 79.5
Other Ivies 14.4 85.6
Other Universities 24.5 75.5
Cornell, by Past Donor Not a donor 20.9 79.1
Donor 20.1 79.9
Cornell, by Connection Not connected 24.3 75.7
Connected 19.1 80.9
Cornell, by College** ALS 11.7 88.3
AAP 17.4 82.6
Arts 12.5 87.5
Engineering 31.9 68.1
Human Ec 24.6 75.4
Hotel 30.6 69.4
ILR 38.2 61.8
** p<.01, * p<.05 (based on chi‐square)
2009 Alumni Survey Cornell University
Institutional Resarch and Planning Page 22

Row percentages within...
Row percentages within...
...Have a summer (non‐term) internship?Yes No
Cornell and Norm Groups** Cornell 59.6 40.4
Other Ivies 65.4 34.6
Other Universities 57.9 42.1
Cornell, by Past Donor** Not a donor 53.5 46.5
Donor 62.9 37.1
Cornell, by Connection Not connected 58.0 42.0
Connected 59.6 40.4
Cornell, by College** ALS 55.9 44.1
AAP 69.6 30.4
Arts 52.3 47.7
Engineering 67.1 32.9
Human Ec 64.3 35.7
Hotel 97.2 2.8
ILR 73.5 26.5
** p<.01, * p<.05 (based on chi‐square)
Row percentages within...
While an undergraduate, about how often did you have conversations with faculty outside of class?
NeverNever RarelyRarely OccasionallyOccasionally OftenOften Very OftenVery OftenCornell and Norm Groups Cornell 4.8 32.4 38.8 16.8 7.1
Other Ivies 4.2 35.0 38.8 14.7 7.4
Other Universities 4.8 35.7 36.9 14.8 7.8
Cornell, by Past Donor Not a donor 5.9 33.8 36.7 16.4 7.2
Donor 4.2 31.5 39.7 17.3 7.3
Cornell, by Connection** Not connected 5.3 44.7 34.2 12.5 3.3
Connected 4.7 29.9 39.7 17.4 8.3
Cornell, by College** ALS 4.9 36.0 39.6 11.6 7.9
AAP 0.0 13.0 47.8 26.1 13.0
Arts 5.9 30.5 41.4 16.8 5.5
Engineering 9.0 40.4 37.3 10.8 2.4
Human Ec 2.9 27.1 32.9 24.3 12.9
Hotel 0.0 16.7 44.4 27.8 11.1
ILR 5.7 40.0 37.1 14.3 2.9
** p<.01, * p<.05 (based on chi‐square)
2009 Alumni Survey Cornell University
Institutional Resarch and Planning Page 23

Cornell and
Row percentages within...For how many of your undergraduate years did you live on campus?Never One year Two years Three years Four years
Cornell and Norm Groups** Cornell 4.3 32.8 37.0 15.2 10.7
Other Ivies 0.7 6.9 14.0 23.0 55.3
Other Universities 2.6 5.7 21.3 22.4 48.0
Cornell, by Past Donor Not a donor 4.6 35.1 32.8 15.7 11.8
Donor 4.2 31.1 39.3 15.1 10.2
Cornell, by Connection Not connected 5.9 31.6 34.9 19.1 8.6
Connected 3.9 32.8 38.0 14.4 10.9
Cornell, by College ALS 1.2 28.7 42.1 19.5 8.5
AAP 0.0 30.4 52.2 4.3 13.0
Arts 0.5 28.5 39.4 15.4 16.3
Engineering 0.0 34.9 39.2 15.1 10.8
Human Ec 0.0 36.2 40.6 14.5 8.7
Hotel 2.8 47.2 19.4 16.7 13.9
ILR 0.0 34.3 37.1 20.0 8.6
** p<.01, * p<.05 (based on chi‐square)
Row percentages within...
Overall, how satisfied are you with your undergraduate education?Very
DissatisfiedGenerally Dissatisfied Ambivalent
Generally Satisfied
Very Satisfied
Cornell and Norm Groups** Cornell 0.1 1.2 5.8 39.1 53.8
Other Ivies 0.6 1.4 5.7 30.8 61.5
Other Universities 0.4 1.7 4.9 33.6 59.4
Cornell, by Past Donor** Not a donor 0.3 1.7 9.3 41.1 47.7
Donor 0.0 0.9 4.0 37.7 57.4
Cornell, by Connection** Not connected 0.0 4.0 16.6 46.4 33.1
Connected 0.1 0.6 3.7 36.8 58.8
Cornell, by College ALS 0.0 0.6 4.3 41.5 53.7
AAP 0.0 0.0 0.0 40.9 59.1
Arts 0.5 1.8 7.7 39.8 50.2
Engineering 0.0 0.6 4.3 46.0 49.1
Human Ec 0.0 1.5 4.5 34.3 59.7
Hotel 0.0 0.0 2.8 27.8 69.4
ILR 0.0 0.0 2.9 51.4 45.7
** p<.01, * p<.05 (based on chi‐square)
2009 Alumni Survey Cornell University
Institutional Resarch and Planning Page 24

undergraduate experience prepared you to: Write effectively
Row percentages within...
Would you encourage a current high school senior who resembles you when you were a high school senior?
Definitely Would NOT
Probably Would NOT Maybe
Probably Would
Definitely Would
Cornell and Norm Groups* Cornell 0.8 2.2 6.6 18.3 72.1
Other Ivies 1.1 2.5 6.0 15.0 75.4
Other Universities 0.7 3.3 7.2 17.5 71.3
Cornell, by Past Donor** Not a donor 2.0 3.6 9.6 22.1 62.7
Donor 0.2 1.5 4.9 16.1 77.4
Cornell, by Connection** Not connected 3.3 6.6 19.7 23.7 46.7
Connected 0.3 1.3 3.8 17.1 77.6
Cornell, by College** ALS 1.2 1.2 10.4 12.2 75.0
AAP 0.0 0.0 0.0 18.2 81.8
Arts 0.0 3.6 8.6 20.4 67.4
Engineering 0.6 1.9 4.3 26.5 66.7
Human Ec 0.0 0.0 8.8 10.3 80.9
Hotel 0.0 2.8 0.0 2.8 94.4
ILR 0.0 0.0 2.9 25.7 71.4
** p<.01, * p<.05 (based on chi‐square)
Row percentages within...
Based on what you know now, how well do you think your undergraduate experience prepared you to: Write effectively
Very PoorlyLess than Adequately Adequately
More than Adequately Very Well
Cornell and Norm Groups** Cornell 0.2 5.4 28.3 33.1 33.1
Other Ivies 0.7 3.8 18.0 30.8 46.7
Other Universities 1.1 5.6 23.3 33.0 36.9
Cornell, by Past Donor Not a donor 0.3 7.3 29.8 28.5 34.1
Donor 0.2 4.2 27.1 36.2 32.4
Cornell, by Connection** Not connected 0.7 10.6 33.1 24.5 31.1
Connected 0.1 4.4 27.4 35.0 33.0
Cornell, by College** ALS 0.6 6.2 34.6 30.9 27.8
AAP 4.3 8.7 43.5 26.1 17.4
Arts 0.0 5.0 22.3 31.4 41.4
Engineering 0.0 9.2 31.3 35.6 23.9
Human Ec 0.0 1.4 33.3 34.8 30.4
Hotel 0.0 2.8 30.6 36.1 30.6
ILR 0.0 0.0 29.4 47.1 23.5
** p<.01, * p<.05 (based on chi‐square)
2009 Alumni Survey Cornell University
Institutional Resarch and Planning Page 25

Row percentages within...
Row percentages within...
...Communicate well orally
Very PoorlyLess than Adequately Adequately
More than Adequately Very Well
Cornell and Norm Groups** Cornell 0.5 7.9 32.6 34.4 24.6
Other Ivies 0.8 7.1 28.1 31.6 32.4
Other Universities 1.5 9.3 30.4 32.4 26.5
Cornell, by Past Donor Not a donor 0.3 10.2 36.3 30.0 23.1
Donor 0.6 6.8 30.1 37.3 25.2
Cornell, by Connection** Not connected 0.7 17.3 37.3 30.0 14.7
Connected 0.4 5.7 32.0 35.2 26.6
Cornell, by College** ALS 0.6 3.1 36.4 36.4 23.5
AAP 0.0 4.3 13.0 56.5 26.1
Arts 0.5 11.0 36.1 30.1 22.4
Engineering 0.0 13.5 36.8 31.9 17.8
Human Ec 1.4 1.4 30.4 42.0 24.6
Hotel 0.0 0.0 11.4 40.0 48.6
ILR 0.0 2.9 26.5 50.0 20.6
** p<.01, * p<.05 (based on chi‐square)
Row percentages within...
...Think analytically and logically
Very PoorlyVery PoorlyLess than AdequatelyAdequately AdequatelyAdequately
More than AdequatelyAdequately Very WellVery Well
Cornell and Norm Groups Cornell 0.0 1.6 13.7 29.3 55.4
Other Ivies 0.2 1.4 10.7 30.8 56.9
Other Universities 0.2 1.3 10.0 31.1 57.3
Cornell, by Past Donor Not a donor 0.0 2.3 16.2 30.1 51.3
Donor 0.0 1.3 12.1 29.2 57.4
Cornell, by Connection** Not connected 0.0 5.4 22.8 30.2 41.6
Connected 0.0 0.7 11.9 28.9 58.5
Cornell, by College ALS 0.0 1.2 12.9 33.1 52.8
AAP 0.0 0.0 17.4 21.7 60.9
Arts 0.0 3.2 12.8 31.1 53.0
Engineering 0.0 0.6 5.6 24.1 69.8
Human Ec 0.0 2.9 14.7 29.4 52.9
Hotel 0.0 0.0 13.9 44.4 41.7
ILR 0.0 0.0 14.7 35.3 50.0
** p<.01, * p<.05 (based on chi‐square)
2009 Alumni Survey Cornell University
Institutional Resarch and Planning Page 26

Row percentages within...
Row percentages within...
...Formulate creative original ideas and solutions
Very PoorlyLess than Adequately Adequately
More than Adequately Very Well
Cornell and Norm Groups** Cornell 0.1 3.3 24.7 34.3 37.6
Other Ivies 0.8 3.8 18.4 34.7 42.4
Other Universities 0.3 4.4 19.2 36.2 39.9
Cornell, by Past Donor Not a donor 0.3 3.3 27.4 32.7 36.3
Donor 0.0 3.3 22.7 35.0 39.0
Cornell, by Connection** Not connected 0.7 9.9 34.4 31.8 23.2
Connected 0.0 1.8 22.9 34.5 40.9
Cornell, by College ALS 0.0 4.9 25.8 36.2 33.1
AAP 0.0 0.0 0.0 34.8 65.2
Arts 0.5 4.1 21.4 35.0 39.1
Engineering 0.0 3.1 28.2 30.1 38.7
Human Ec 0.0 1.5 27.9 29.4 41.2
Hotel 0.0 2.8 27.8 36.1 33.3
ILR 0.0 2.9 26.5 47.1 23.5
** p<.01, * p<.05 (based on chi‐square)
Row percentages within...
...Acquire new skills and knowledge on your own
Very PoorlyVery PoorlyLess than AdequatelyAdequately AdequatelyAdequately
More than AdequatelyAdequately Very WellVery Well
Cornell and Norm Groups** Cornell 0.2 2.7 16.9 34.7 45.5
Other Ivies 0.5 2.1 13.5 31.2 52.6
Other Universities 0.3 2.9 13.0 34.0 49.8
Cornell, by Past Donor* Not a donor 0.7 4.0 20.2 34.1 41.1
Donor 0.0 1.8 15.0 34.9 48.3
Cornell, by Connection** Not connected 1.3 7.3 27.3 36.7 27.3
Connected 0.0 1.8 14.5 34.3 49.5
Cornell, by College ALS 0.0 3.1 14.7 36.2 46.0
AAP 0.0 0.0 0.0 39.1 60.9
Arts 0.5 2.8 14.2 36.7 45.9
Engineering 0.0 3.1 17.2 30.7 49.1
Human Ec 1.4 1.4 15.9 36.2 44.9
Hotel 0.0 0.0 19.4 41.7 38.9
ILR 0.0 0.0 25.7 45.7 28.6
** p<.01, * p<.05 (based on chi‐square)
2009 Alumni Survey Cornell University
Institutional Resarch and Planning Page 27

Row percentages within...
Row percentages within...
...Use quantitative tools
Very PoorlyLess than Adequately Adequately
More than Adequately Very Well
Cornell and Norm Groups** Cornell 0.7 6.8 28.8 30.8 32.8
Other Ivies 2.4 11.4 31.5 27.3 27.4
Other Universities 1.6 8.3 26.2 30.8 33.0
Cornell, by Past Donor Not a donor 1.3 7.3 31.7 31.7 28.0
Donor 0.4 6.6 26.8 30.1 36.0
Cornell, by Connection** Not connected 2.0 10.1 36.2 31.5 20.1
Connected 0.4 6.0 27.4 30.4 35.7
Cornell, by College** ALS 0.0 7.4 28.4 35.2 29.0
AAP 4.3 8.7 43.5 17.4 26.1
Arts 0.9 9.2 35.3 28.9 25.7
Engineering 0.0 0.6 16.7 26.5 56.2
Human Ec 0.0 8.8 35.3 36.8 19.1
Hotel 0.0 5.6 25.0 30.6 38.9
ILR 0.0 6.1 30.3 42.4 21.2
** p<.01, * p<.05 (based on chi‐square)
Row percentages within...
...Read or speak a foreign language
Very PoorlyVery PoorlyLess than AdequatelyAdequately AdequatelyAdequately
More than AdequatelyAdequately Very WellVery Well
Cornell and Norm Groups** Cornell 20.9 29.1 27.7 13.5 8.8
Other Ivies 8.8 20.5 36.6 17.6 16.5
Other Universities 15.1 22.7 32.3 15.2 14.7
Cornell, by Past Donor Not a donor 18.3 31.5 30.1 13.1 6.9
Donor 22.4 27.9 26.1 13.7 9.9
Cornell, by Connection** Not connected 20.4 37.3 31.7 10.6 0.0
Connected 21.5 27.2 26.7 14.7 10.0
Cornell, by College** ALS 34.9 27.5 20.8 9.4 7.4
AAP 8.7 26.1 39.1 17.4 8.7
Arts 5.5 20.2 38.1 20.6 15.6
Engineering 31.4 31.4 25.6 8.3 3.2
Human Ec 25.8 43.5 21.0 8.1 1.6
Hotel 14.7 26.5 32.4 14.7 11.8
ILR 33.3 42.4 15.2 3.0 6.1
** p<.01, * p<.05 (based on chi‐square)
2009 Alumni Survey Cornell University
Institutional Resarch and Planning Page 28

Row percentages within...
Row percentages within...
...Gain in‐depth knowledge of a field
Very PoorlyLess than Adequately Adequately
More than Adequately Very Well
Cornell and Norm Groups Cornell 0.4 4.9 24.2 34.5 35.9
Other Ivies 1.1 6.2 23.2 34.7 34.7
Other Universities 1.3 6.0 23.5 36.3 32.9
Cornell, by Past Donor Not a donor 0.3 4.7 28.0 33.0 34.0
Donor 0.4 5.1 22.0 34.9 37.6
Cornell, by Connection** Not connected 0.0 10.1 35.1 34.5 20.3
Connected 0.3 4.0 22.0 34.3 39.4
Cornell, by College ALS 0.0 4.3 26.5 34.0 35.2
AAP 0.0 0.0 17.4 39.1 43.5
Arts 0.9 6.4 24.7 32.0 36.1
Engineering 0.0 5.0 26.1 35.4 33.5
Human Ec 0.0 2.9 24.6 44.9 27.5
Hotel 0.0 0.0 11.1 19.4 69.4
ILR 0.0 2.9 20.0 51.4 25.7
** p<.01, * p<.05 (based on chi‐square)
Row percentages within...
...Understand social problems
Very PoorlyVery PoorlyLess than AdequatelyAdequately AdequatelyAdequately
More than AdequatelyAdequately Very WellVery Well
Cornell and Norm Groups** Cornell 2.3 13.6 31.7 29.3 23.1
Other Ivies 1.7 8.1 26.0 33.2 30.9
Other Universities 2.5 11.9 28.6 30.6 26.5
Cornell, by Past Donor Not a donor 2.6 16.2 32.1 29.8 19.2
Donor 2.2 11.8 31.5 29.5 25.0
Cornell, by Connection** Not connected 6.1 20.9 33.1 28.4 11.5
Connected 1.5 12.4 31.5 29.6 25.1
Cornell, by College** ALS 3.1 12.3 39.9 25.2 19.6
AAP 0.0 8.7 39.1 26.1 26.1
Arts 1.8 15.6 22.0 33.9 26.6
Engineering 4.3 23.0 44.1 21.7 6.8
Human Ec 1.4 4.3 13.0 36.2 44.9
Hotel 2.8 8.3 47.2 22.2 19.4
ILR 0.0 2.9 23.5 41.2 32.4
** p<.01, * p<.05 (based on chi‐square)
2009 Alumni Survey Cornell University
Institutional Resarch and Planning Page 29

Row percentages within...
Row percentages within...
...Be an effective leader
Very PoorlyLess than Adequately Adequately
More than Adequately Very Well
Cornell and Norm Groups** Cornell 0.9 11.2 34.2 29.1 24.6
Other Ivies 1.7 10.1 26.9 32.5 28.8
Other Universities 1.9 11.1 29.5 32.0 25.5
Cornell, by Past Donor** Not a donor 1.0 15.1 39.1 26.4 18.4
Donor 0.9 9.0 31.4 30.7 27.9
Cornell, by Connection** Not connected 3.4 27.4 34.2 22.6 12.3
Connected 0.4 7.9 33.5 31.3 26.8
Cornell, by College* ALS 0.6 8.1 36.9 30.0 24.4
AAP 4.3 13.0 30.4 21.7 30.4
Arts 0.9 15.1 32.6 28.4 22.9
Engineering 1.2 13.0 38.5 28.0 19.3
Human Ec 0.0 4.4 32.4 35.3 27.9
Hotel 0.0 0.0 13.9 36.1 50.0
ILR 0.0 5.7 34.3 28.6 31.4
** p<.01, * p<.05 (based on chi‐square)
Row percentages within...
...Work effectively as a member of a team
Very PoorlyVery PoorlyLess than AdequatelyAdequately AdequatelyAdequately
More than AdequatelyAdequately Very WellVery Well
Cornell and Norm Groups Cornell 0.6 5.6 23.4 35.5 34.8
Other Ivies 1.3 6.7 23.4 33.0 35.6
Other Universities 1.1 6.3 23.4 35.1 34.1
Cornell, by Past Donor** Not a donor 0.0 6.0 28.9 38.9 26.2
Donor 0.9 5.5 20.1 33.6 39.9
Cornell, by Connection** Not connected 2.0 12.8 36.2 31.5 17.4
Connected 0.3 4.0 20.6 36.6 38.5
Cornell, by College** ALS 0.0 3.1 22.8 38.9 35.2
AAP 4.3 8.7 30.4 34.8 21.7
Arts 0.9 8.7 29.7 32.9 27.9
Engineering 0.6 3.1 20.2 38.7 37.4
Human Ec 0.0 4.3 15.9 44.9 34.8
Hotel 0.0 0.0 11.1 22.2 66.7
ILR 0.0 5.7 20.0 31.4 42.9
** p<.01, * p<.05 (based on chi‐square)
2009 Alumni Survey Cornell University
Institutional Resarch and Planning Page 30

Row percentages within...
Row percentages within...
...Be self‐confident
Very PoorlyLess than Adequately Adequately
More than Adequately Very Well
Cornell and Norm Groups* Cornell 1.9 6.4 25.5 32.9 33.3
Other Ivies 2.4 7.0 20.4 31.3 38.9
Other Universities 2.6 7.8 21.4 32.7 35.5
Cornell, by Past Donor Not a donor 1.7 8.3 28.0 32.7 29.3
Donor 2.0 5.5 23.7 33.0 35.8
Cornell, by Connection** Not connected 4.0 10.7 35.6 31.5 18.1
Connected 1.5 5.4 23.7 32.8 36.6
Cornell, by College ALS 1.2 4.3 23.5 35.8 35.2
AAP 0.0 4.3 30.4 26.1 39.1
Arts 3.2 5.1 27.6 31.8 32.3
Engineering 1.2 8.0 25.2 32.5 33.1
Human Ec 0.0 8.7 24.6 34.8 31.9
Hotel 0.0 0.0 13.9 33.3 52.8
ILR 0.0 2.9 17.6 47.1 32.4
** p<.01, * p<.05 (based on chi‐square)
Row percentages within...
...Be an active member of your community
Very PoorlyVery PoorlyLess than AdequatelyAdequately AdequatelyAdequately
More than AdequatelyAdequately Very WellVery Well
Cornell and Norm Groups** Cornell 1.9 17.0 32.2 26.8 22.0
Other Ivies 2.3 9.4 28.0 29.9 30.5
Other Universities 2.9 11.6 30.7 28.1 26.7
Cornell, by Past Donor** Not a donor 2.7 23.6 32.6 23.3 17.9
Donor 1.5 13.3 32.2 28.7 24.3
Cornell, by Connection** Not connected 3.4 36.1 32.7 18.4 9.5
Connected 1.6 13.1 32.6 28.2 24.5
Cornell, by College** ALS 1.2 18.0 28.0 33.5 19.3
AAP 4.3 17.4 21.7 34.8 21.7
Arts 2.7 12.8 37.9 26.0 20.5
Engineering 1.3 26.3 36.9 20.0 15.6
Human Ec 0.0 8.7 23.2 34.8 33.3
Hotel 2.8 11.1 36.1 19.4 30.6
ILR 0.0 14.3 25.7 28.6 31.4
** p<.01, * p<.05 (based on chi‐square)
2009 Alumni Survey Cornell University
Institutional Resarch and Planning Page 31

Row percentages within...
Row percentages within...
...Maintain a healthy lifestyle
Very PoorlyLess than Adequately Adequately
More than Adequately Very Well
Cornell and Norm Groups** Cornell 4.9 21.9 39.5 20.1 13.5
Other Ivies 6.6 21.4 36.7 21.4 13.9
Other Universities 7.5 20.2 33.5 22.1 16.7
Cornell, by Past Donor* Not a donor 7.0 25.3 40.0 16.7 11.0
Donor 3.9 19.6 39.7 22.0 14.8
Cornell, by Connection** Not connected 10.3 29.5 39.0 15.8 5.5
Connected 3.8 20.2 39.9 20.9 15.2
Cornell, by College ALS 3.1 21.6 46.3 17.3 11.7
AAP 13.0 17.4 43.5 17.4 8.7
Arts 5.9 21.0 38.4 19.6 15.1
Engineering 5.0 27.7 34.0 20.8 12.6
Human Ec 2.9 11.6 46.4 23.2 15.9
Hotel 5.6 22.2 38.9 13.9 19.4
ILR 8.8 17.6 29.4 38.2 5.9
** p<.01, * p<.05 (based on chi‐square)
Row percentages within...
...Relate well to different races/nations/religions
Very PoorlyVery PoorlyLess than AdequatelyAdequately AdequatelyAdequately
More than AdequatelyAdequately Very WellVery Well
Cornell and Norm Groups** Cornell 1.5 6.4 22.4 34.0 35.7
Other Ivies 1.6 4.2 19.8 31.1 43.3
Other Universities 1.0 4.4 19.6 31.2 43.7
Cornell, by Past Donor Not a donor 2.0 8.0 23.3 36.2 30.6
Donor 1.3 5.5 22.0 32.6 38.6
Cornell, by Connection** Not connected 4.0 16.1 27.5 30.2 22.1
Connected 0.9 4.4 21.7 34.7 38.4
Cornell, by College** ALS 1.2 6.2 21.6 34.6 36.4
AAP 0.0 13.0 17.4 39.1 30.4
Arts 1.8 9.1 24.2 32.4 32.4
Engineering 0.6 6.1 20.2 38.0 35.0
Human Ec 0.0 1.4 36.2 33.3 29.0
Hotel 2.8 2.8 5.6 16.7 72.2
ILR 2.9 8.6 17.1 48.6 22.9
** p<.01, * p<.05 (based on chi‐square)
2009 Alumni Survey Cornell University
Institutional Resarch and Planning Page 32

Row percentages within...
Row percentages within...
...Understand role of science and technology in society
Very PoorlyLess than Adequately Adequately
More than Adequately Very Well
Cornell and Norm Groups** Cornell 1.4 7.5 25.6 32.1 33.4
Other Ivies 1.5 8.9 28.0 30.6 31.0
Other Universities 1.9 7.1 24.0 31.0 36.0
Cornell, by Past Donor Not a donor 2.0 10.0 26.2 28.6 33.2
Donor 1.1 6.1 25.0 33.9 33.9
Cornell, by Connection** Not connected 5.4 13.5 31.1 29.1 20.9
Connected 0.6 6.2 24.4 33.0 35.8
Cornell, by College** ALS 1.2 3.1 18.6 34.2 42.9
AAP 4.3 26.1 21.7 21.7 26.1
Arts 2.7 7.3 26.9 31.5 31.5
Engineering 0.0 3.7 24.1 37.7 34.6
Human Ec 1.4 13.0 24.6 34.8 26.1
Hotel 0.0 16.7 41.7 25.0 16.7
ILR 2.9 5.9 55.9 14.7 20.6
** p<.01, * p<.05 (based on chi‐square)
Row percentages within...
...Understand the significance of art, music, literature, & drama
Very PoorlyVery PoorlyLess than AdequatelyAdequately AdequatelyAdequately
More than AdequatelyAdequately Very WellVery Well
Cornell and Norm Groups** Cornell 2.5 14.7 36.3 24.9 21.7
Other Ivies 1.5 4.9 23.0 30.2 40.4
Other Universities 2.6 10.6 27.9 29.5 29.5
Cornell, by Past Donor* Not a donor 2.3 17.9 37.9 19.6 22.3
Donor 2.6 12.4 35.7 27.7 21.6
Cornell, by Connection** Not connected 4.1 24.3 39.9 20.3 11.5
Connected 2.2 13.0 35.3 25.3 24.2
Cornell, by College** ALS 3.1 15.5 36.6 26.1 18.6
AAP 0.0 0.0 17.4 39.1 43.5
Arts 0.9 9.1 36.1 24.2 29.7
Engineering 4.3 19.8 41.4 23.5 11.1
Human Ec 2.9 23.2 33.3 24.6 15.9
Hotel 0.0 22.2 44.4 22.2 11.1
ILR 0.0 11.8 52.9 20.6 14.7
** p<.01, * p<.05 (based on chi‐square)
2009 Alumni Survey Cornell University
Institutional Resarch and Planning Page 33

types of financial support
Arts 39 39 54 20 .1 24 7
Row percentages within...
Did you receive financial aid as an undergraduate? If so, please use this list to describe the you received. Mark all that apply.
I direc
finan
d not eive cial aid
Need‐based grants
Subsidized loans Other loans
Work‐stemploym
udy ent
Other forms of aid (e.g., merit scholarships/
prizes)
No response to any of these questions
Cornell and Norm Groups* C* ornell 36.2 35.5 51.0 19.6 38.3 30.0 5.9
Other Ivies 43.3 35.9 44.9 21.1 36.4 24.5 3.9
Other Universities 37.3 38.0 46.6 22.9 33.9 36.0 8.3
Cornell, by Past Donor* Not a donor 33.1 42.3 54.4 21.3 40.7 30.5 5.2
Donor 38.5 32.3 49.2 18.9 37.4 29.4 5.4
Cornell, by Connection Not connected 31.6 43.4 57.9 21.7 39.5 30.3 5.9
Connected 37.3 34.3 49.3 19.2 38.2 29.8 5.7
Cornell, by College** ALS 28.0 30.5 54.3 25.6 37.2 32.9 5.5
AAP 30.4 56.5 60.9 34.8 65.2 34.8 4.3
Arts 39.3.3 39.7.7 54.3.3 20.5.5 41.1 24.7 2.741 .7 2.
Engineering 34.8 39.0 50.0 16.5 39.6 34.1 10.4
Human Ec 47.1 27.1 42.9 8.6 31.4 31.4 5.7
Hotel 44.4 38.9 41.7 16.7 44.4 33.3 0.0
ILR 40.0 28.6 48.6 31.4 40.0 37.1 5.7
** p<.01, * p<.05 (based on chi‐square)
2009 Alumni Survey Cornell University
Institutional Resarch and Planning Page 34

your undergraduate education?
Ec 52 9 2.9 4 4 4 8 8 5.9 9 5 4
Row percentages within...
At the time you graduated, approximately what was the total amount you borrowed to finance
No loans $1 ‐ $4,999$5,00$9,99
0 ‐ 9
$10$1
,000 ‐ 4,999
$15,000 ‐ $19,999
$20,000 ‐$24,999
$25,00$29,9
0 ‐ 99
$30,000 ‐ $49,999
$50,000 or more
More than $0 but unable to
estimateCornell and Norm Groups** Cornell 40.5 1.3 4.0 7.2 7.5 9.3 8.9 9.9 5.7 5.7
Other Ivies 45.9 1.1 3.3 5.5 7.2 7.8 6.1 8.3 9.2 5.5
Other Universities 46.4 1.3 3.9 5.2 7.4 8.4 6.5 8.6 7.7 4.4
Cornell, by Past Donor** Not a donor 37.7 0.7 4.3 4.6 7.9 9.3 11.9 11.6 8.3 3.6
Donor 42.0 1.6 3.8 8.8 7.3 9.1 7.3 9.1 4.2 6.6
Cornell, by Connection Not connected 36.0 0.7 2.0 6.0 10.7 9.3 9.3 12.7 10.0 3.3
Connected 41.3 1.5 4.0 7.3 7.0 9.4 8.9 9.1 5.0 6.5
Cornell, by College ALS 35.0 3.1 5.5 7.4 10.4 13.5 9.2 6.1 3.7 6.1
AAP 34.8 0.0 8.7 0.0 8.7 4.3 13.0 8.7 8.7 13.0
Arts 38.2 0.0 2.8 10.1 6.9 6.9 10.1 11.5 7.4 6.0
Engineering 42.3 1.8 4.3 5.5 5.5 11.0 8.6 12.3 3.7 4.9
HuHumanman Ec 52.9.9 2.92. 2.9 4.4. 7.47. 8.8. 5.9 5.9 1.5 7.45. 1. 7.
Hotel 48.6 0.0 0.0 11.4 0.0 11.4 5.7 8.6 11.4 2.9
ILR 42.9 0.0 2.9 14.3 8.6 5.7 5.7 11.4 2.9 5.7
** p<.01, * p<.05 (based on chi‐square)
2009 Alumni Survey Cornell University
Institutional Resarch and Planning Page 35

Row percentages within...
Did the benefits you received from attending your undergraduate institution outweigh the financial costs to you and
your family?Yes,
definitely MaybeNo,
definitely notCornell and Norm Groups** Cornell 79.6 16.4 4.0
Other Ivies 78.7 18.6 2.7
Other Universities 76.4 19.3 4.3
Cornell, by Past Donor** Not a donor 69.9 23.5 6.6
Donor 85.7 11.8 2.6
Cornell, by Connection** Not connected 58.9 31.8 9.3
Connected 83.9 13.3 2.8
Cornell, by College ALS 84.6 14.8 0.6
AAP 73.9 21.7 4.3
Arts 74.0 20.1 5.9
Engineering 76.9 18.1 5.0
Human Ec 85.3 13.2 1.5
Hotel 94.4 5.6 0.0
ILR 79.4 17.6 2.9
** p<.01, * p<.05 (based on chi‐square)
2009 Alumni Survey Cornell University
Institutional Resarch and Planning Page 36

... broad liberal arts education
Row percentages within...
How would you change the emphasis your undergraduate institution places on these aspects of undergraduate education? Overall emphasis
on teachingReduce a great deal
Reduce somewhat
Keep about the same
Increase somewhat
Increase a great deal
Cornell and Norm Groups Cornell 0.1 0.5 50.4 36.2 12.8
Other Ivies 0.0 0.2 49.4 35.7 14.6
Other Universities 0.0 0.5 50.2 36.3 13.0
Cornell, by Past Donor* Not a donor 0.0 1.4 48.6 35.1 14.9
Donor 0.2 0.0 51.4 36.7 11.8
Cornell, by Connection** Not connected 0.0 1.5 37.2 38.0 23.4
Connected 0.2 0.3 53.0 35.7 10.8
Cornell, by College ALS 0.6 0.6 48.7 38.3 11.7
AAP 0.0 0.0 52.4 38.1 9.5
Arts 0.0 0.5 46.9 36.2 16.4
Engineering 0.0 1.3 57.1 32.5 9.1
Human Ec 0.0 0.0 55.7 31.1 13.1
Hotel 0.0 0.0 65.6 25.0 9.4
ILR 0.0 0.0 35.3 52.9 11.8
** p<.01, * p<.05 (based on chi‐square)
Row percentages within...
...A broad liberal arts educationA Reduce a great deal
Reduce somewhat
Keep about the same
Increase somewhat
Increase a great deal
Cornell and Norm Groups** Cornell 0.5 8.1 65.8 20.3 5.3
Other Ivies 0.4 3.8 75.5 15.6 4.8
Other Universities 0.8 5.7 67.4 21.0 5.1
Cornell, by Past Donor Not a donor 0.7 7.4 67.4 17.7 6.7
Donor 0.4 8.2 65.3 21.5 4.6
Cornell, by Connection Not connected 1.4 9.2 58.2 23.4 7.8
Connected 0.3 7.7 67.2 19.8 4.9
Cornell, by College** ALS 0.0 12.3 57.8 24.7 5.2
AAP 0.0 15.0 50.0 20.0 15.0
Arts 0.0 5.1 74.3 16.4 4.2
Engineering 0.0 11.6 62.6 23.2 2.6
Human Ec 0.0 3.2 69.8 20.6 6.3
Hotel 3.3 13.3 50.0 20.0 13.3
ILR 5.9 2.9 67.6 17.6 5.9
** p<.01, * p<.05 (based on chi‐square)
2009 Alumni Survey Cornell University
Institutional Resarch and Planning Page 37

Row percentages within...
Row percentages within...
...Fostering public serviceReduce a great deal
Reduce somewhat
Keep about the same
Increase somewhat
Increase a great deal
Cornell and Norm Groups* Cornell 0.6 2.9 40.0 46.5 10.0
Other Ivies 0.6 2.3 47.4 40.4 9.4
Other Universities 0.7 2.0 44.0 43.6 9.8
Cornell, by Past Donor Not a donor 1.1 2.8 36.9 47.9 11.3
Donor 0.4 2.9 41.8 45.5 9.5
Cornell, by Connection Not connected 0.0 2.1 32.1 50.7 15.0
Connected 0.8 3.1 41.3 45.8 9.0
Cornell, by College* ALS 1.3 0.6 42.9 41.6 13.6
AAP 0.0 0.0 27.3 50.0 22.7
Arts 1.5 1.5 39.8 49.0 8.3
Engineering 0.0 7.2 41.4 45.4 5.9
Human Ec 0.0 1.6 35.5 48.4 14.5
Hotel 0.0 3.0 39.4 45.5 12.1
ILR 0.0 0.0 41.2 55.9 2.9
** p<.01, * p<.05 (based on chi‐square)
Row percentages within...
...Teaching leadership skillsReduce a great dealgreat deal
Reduce somewhatsomewhat
Keep about the samethe same
Increase somewhatsomewhat
Increase a great dealgreat deal
Cornell and Norm Groups** Cornell 0.1 0.5 33.2 48.6 17.6
Other Ivies 0.1 0.9 36.4 48.1 14.4
Other Universities 0.1 0.6 32.6 48.3 18.4
Cornell, by Past Donor Not a donor 0.4 0.4 31.7 47.9 19.7
Donor 0.0 0.6 34.1 48.9 16.5
Cornell, by Connection* Not connected 0.0 0.0 27.1 46.4 26.4
Connected 0.2 0.6 34.4 49.2 15.7
Cornell, by College ALS 0.0 0.0 34.0 49.7 16.4
AAP 0.0 0.0 31.8 36.4 31.8
Arts 0.5 0.5 34.3 49.5 15.2
Engineering 0.0 0.0 27.5 50.3 22.2
Human Ec 0.0 0.0 25.4 58.7 15.9
Hotel 0.0 0.0 45.5 39.4 15.2
ILR 0.0 0.0 37.1 57.1 5.7
** p<.01, * p<.05 (based on chi‐square)
2009 Alumni Survey Cornell University
Institutional Resarch and Planning Page 38
Row percentages within...
Row percentages within...
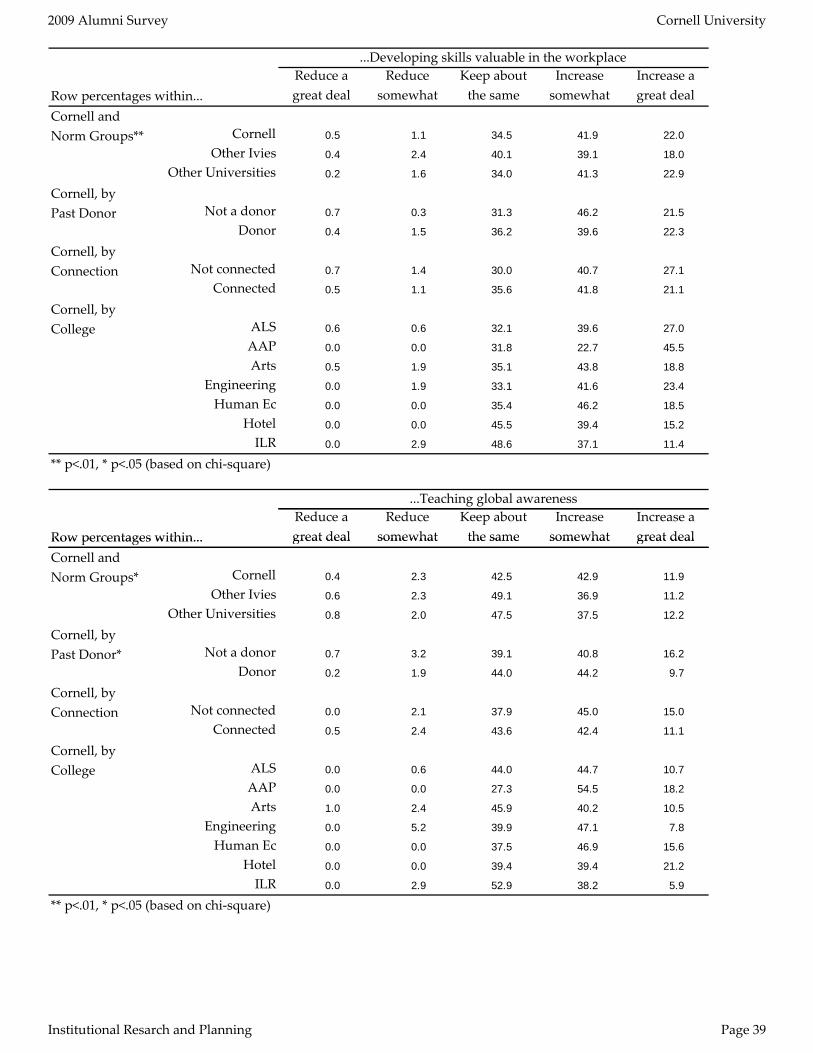
...Developing skills valuable in the workplaceReduce a great deal
Reduce somewhat
Keep about the same
Increase somewhat
Increase a great deal
Cornell and Norm Groups** Cornell 0.5 1.1 34.5 41.9 22.0
Other Ivies 0.4 2.4 40.1 39.1 18.0
Other Universities 0.2 1.6 34.0 41.3 22.9
Cornell, by Past Donor Not a donor 0.7 0.3 31.3 46.2 21.5
Donor 0.4 1.5 36.2 39.6 22.3
Cornell, by Connection Not connected 0.7 1.4 30.0 40.7 27.1
Connected 0.5 1.1 35.6 41.8 21.1
Cornell, by College ALS 0.6 0.6 32.1 39.6 27.0
AAP 0.0 0.0 31.8 22.7 45.5
Arts 0.5 1.9 35.1 43.8 18.8
Engineering 0.0 1.9 33.1 41.6 23.4
Human Ec 0.0 0.0 35.4 46.2 18.5
Hotel 0.0 0.0 45.5 39.4 15.2
ILR 0.0 2.9 48.6 37.1 11.4
** p<.01, * p<.05 (based on chi‐square)
Row percentages within...
...Teaching global awarenessReduce a great dealgreat deal
Reduce somewhatsomewhat
Keep about the samethe same
Increase somewhatsomewhat
Increase a great dealgreat deal
Cornell and Norm Groups* Cornell 0.4 2.3 42.5 42.9 11.9
Other Ivies 0.6 2.3 49.1 36.9 11.2
Other Universities 0.8 2.0 47.5 37.5 12.2
Cornell, by Past Donor* Not a donor 0.7 3.2 39.1 40.8 16.2
Donor 0.2 1.9 44.0 44.2 9.7
Cornell, by Connection Not connected 0.0 2.1 37.9 45.0 15.0
Connected 0.5 2.4 43.6 42.4 11.1
Cornell, by College ALS 0.0 0.6 44.0 44.7 10.7
AAP 0.0 0.0 27.3 54.5 18.2
Arts 1.0 2.4 45.9 40.2 10.5
Engineering 0.0 5.2 39.9 47.1 7.8
Human Ec 0.0 0.0 37.5 46.9 15.6
Hotel 0.0 0.0 39.4 39.4 21.2
ILR 0.0 2.9 52.9 38.2 5.9
** p<.01, * p<.05 (based on chi‐square)
2009 Alumni Survey Cornell University
Institutional Resarch and Planning Page 39

Row percentages within...
Row percentages within...
...Promoting moral and ethical developmentReduce a great deal
Reduce somewhat
Keep about the same
Increase somewhat
Increase a great deal
Cornell and Norm Groups Cornell 0.0 1.6 51.2 35.5 11.7
Other Ivies 0.5 1.9 52.3 33.8 11.4
Other Universities 0.6 1.8 53.6 32.9 11.1
Cornell, by Past Donor Not a donor 0.0 2.1 48.8 33.8 15.3
Donor 0.0 1.3 52.6 36.3 9.8
Cornell, by Connection** Not connected 0.0 1.4 39.6 40.3 18.7
Connected 0.0 1.7 53.2 34.8 10.4
Cornell, by College ALS 0.0 0.6 56.8 33.5 9.0
AAP 0.0 0.0 31.8 50.0 18.2
Arts 0.0 1.4 51.9 35.7 11.0
Engineering 0.0 4.6 50.3 37.7 7.3
Human Ec 0.0 0.0 47.6 41.3 11.1
Hotel 0.0 0.0 57.6 21.2 21.2
ILR 0.0 0.0 48.5 42.4 9.1
** p<.01, * p<.05 (based on chi‐square)
Row percentages within...
...Faculty‐student contact outside classReduce a great dealgreat deal
Reduce somewhatsomewhat
Keep about the samethe same
Increase somewhatsomewhat
Increase a great dealgreat deal
Cornell and Norm Groups* Cornell 0.0 0.2 31.4 46.7 21.6
Other Ivies 0.0 0.1 27.8 47.2 24.9
Other Universities 0.0 0.4 30.9 45.8 22.9
Cornell, by Past Donor Not a donor 0.0 0.3 31.5 44.8 23.4
Donor 0.0 0.2 31.1 47.9 20.8
Cornell, by Connection Not connected 0.0 0.0 27.0 48.2 24.8
Connected 0.0 0.3 32.6 45.9 21.2
Cornell, by College* ALS 0.0 0.6 35.0 43.3 21.0
AAP 0.0 0.0 36.4 31.8 31.8
Arts 0.0 0.5 30.1 45.9 23.4
Engineering 0.0 0.0 28.2 58.3 13.5
Human Ec 0.0 0.0 22.4 50.7 26.9
Hotel 0.0 0.0 41.2 23.5 35.3
ILR 0.0 0.0 14.7 64.7 20.6
** p<.01, * p<.05 (based on chi‐square)
2009 Alumni Survey Cornell University
Institutional Resarch and Planning Page 40

Not Somewhat
Row percentages within...
...Fostering teamwork and cooperationReduce a great deal
Reduce somewhat
Keep about the same
Increase somewhat
Increase a great deal
Cornell and Norm Groups Cornell 0.2 0.7 50.4 35.9 12.7
Other Ivies 0.1 0.6 47.6 40.0 11.7
Other Universities 0.1 0.9 50.5 37.1 11.4
Cornell, by Past Donor Not a donor 0.3 1.0 49.1 37.0 12.5
Donor 0.2 0.6 51.4 35.0 12.8
Cornell, by Connection Not connected 0.0 0.7 39.4 43.7 16.2
Connected 0.3 0.8 52.9 34.0 12.1
Cornell, by College ALS 0.0 0.0 57.9 28.9 13.2
AAP 0.0 0.0 40.9 36.4 22.7
Arts 0.5 1.9 48.8 37.0 11.8
Engineering 0.0 0.0 52.2 37.6 10.2
Human Ec 0.0 0.0 48.5 36.4 15.2
Hotel 0.0 0.0 60.0 34.3 5.7
ILR 0.0 0.0 48.6 42.9 8.6
** p<.01, * p<.05 (based on chi‐square)
Row percentages within...
Today, how connected do you feel to your undergraduate institution?
Not very veryconnected
Somewhat connected
Moderately Moderatelyconnected
Very Veryconnected
Cornell and Norm Groups** Cornell 18.1 31.7 35.0 15.2
Other Ivies 13.6 29.6 39.9 16.8
Other Universities 16.4 33.5 35.6 14.5
Cornell, by Past Donor** Not a donor 31.9 32.2 28.2 7.7
Donor 9.6 31.5 39.3 19.7
Cornell, by Connection** Not connected 100.0 0.0 0.0 0.0
Connected 0.0 38.7 42.8 18.6
Cornell, by College ALS 19.9 33.5 29.8 16.8
AAP 13.6 22.7 45.5 18.2
Arts 18.1 32.6 36.3 13.0
Engineering 17.6 34.6 35.2 12.6
Human Ec 13.0 24.6 44.9 17.4
Hotel 11.1 25.0 50.0 13.9
ILR 18.2 21.2 39.4 21.2
** p<.01, * p<.05 (based on chi‐square)
2009 Alumni Survey Cornell University
Institutional Resarch and Planning Page 41

Row percentages within...
When you think about your connection to your undergraduate institution today, how important is each of the following to you? Your
class (year of graduation)Not
important at all
Somewhat important
Very important Essential
Not applicable
Cornell and Norm Groups** Cornell 22.9 51.6 20.2 4.6 0.7
Other Ivies 12.1 43.9 31.1 12.6 0.3
Other Universities 16.3 44.6 27.4 11.2 0.5
Cornell, by Past Donor** Not a donor 32.7 47.9 14.5 4.0 1.0
Donor 16.9 54.1 23.5 5.0 0.6
Cornell, by Connection** Not connected 49.3 38.5 7.4 3.4 1.4
Connected 17.5 54.1 23.0 5.0 0.4
Cornell, by College ALS 17.8 56.4 20.2 5.5 0.0
AAP 21.7 60.9 8.7 8.7 0.0
Arts 22.3 50.0 20.9 6.4 0.5
Engineering 18.6 51.6 24.8 3.1 1.9
Human Ec 20.9 50.7 22.4 6.0 0.0
Hotel 13.9 47.2 30.6 8.3 0.0
ILR 8.6 60.0 28.6 2.9 0.0
** p<.01, * p<.05 (based on chi‐square)
Row percentages within...
...Your academic department or majorNot
important at all
Somewhat important
Very important Essential
Not applicable
Cornell and Norm Groups** Cornell 16.6 42.4 29.8 11.1 0.2
Other Ivies 33.8 45.2 15.8 5.0 0.3
Other Universities 26.6 45.1 21.0 7.0 0.3
Cornell, by Past Donor Not a donor 17.2 45.5 26.4 10.6 0.3
Donor 16.1 40.7 31.7 11.4 0.0
Cornell, by Connection** Not connected 31.3 43.5 16.3 8.2 0.7
Connected 13.6 41.8 32.7 11.8 0.1
Cornell, by College** ALS 16.0 47.2 30.1 6.7 0.0
AAP 4.3 13.0 39.1 43.5 0.0
Arts 20.0 50.0 21.4 8.6 0.0
Engineering 11.9 43.1 37.5 7.5 0.0
Human Ec 20.3 42.0 31.9 5.8 0.0
Hotel 5.7 8.6 28.6 54.3 2.9
ILR 14.3 37.1 40.0 5.7 2.9
** p<.01, * p<.05 (based on chi‐square)
2009 Alumni Survey Cornell University
Institutional Resarch and Planning Page 42

Not
Row percentages within...
...Your school or college (within a university)Not
important at all
Somewhat important
Very important Essential
Not applicable
Cornell and Norm Groups** Cornell 15.3 43.9 29.6 11.1 0.1
Other Ivies 29.3 33.9 18.5 7.3 11.0
Other Universities 34.9 36.6 16.9 5.5 6.2
Cornell, by Past Donor Not a donor 17.5 45.5 26.1 10.6 0.3
Donor 13.9 43.3 31.4 11.3 0.0
Cornell, by Connection** Not connected 30.6 39.5 21.8 7.5 0.7
Connected 12.4 44.3 31.3 12.1 0.0
Cornell, by College** ALS 17.7 48.2 29.9 4.3 0.0
AAP 8.7 21.7 21.7 47.8 0.0
Arts 18.2 50.9 24.5 6.4 0.0
Engineering 14.4 42.5 37.5 5.0 0.6
Human Ec 14.5 42.0 30.4 13.0 0.0
Hotel 2.8 2.8 22.2 72.2 0.0
ILR 5.7 51.4 28.6 14.3 0.0
** p<.01, * p<.05 (based on chi‐square)
Row percentages within...
...Your undergraduate institution as a wholeNot
important at all
Somewhat important
Very important Essential
Not applicable
Cornell and Norm Groups Cornell 2.4 23.6 43.1 30.6 0.2
Other Ivies 2.8 27.5 40.7 28.7 0.3
Other Universities 3.0 24.9 40.7 31.2 0.2
Cornell, by Past Donor** Not a donor 3.9 30.3 39.5 26.0 0.3
Donor 1.6 19.7 44.8 33.6 0.2
Cornell, by Connection** Not connected 8.7 46.3 27.5 16.8 0.7
Connected 1.2 19.1 46.9 32.8 0.1
Cornell, by College ALS 2.4 23.8 39.0 34.8 0.0
AAP 0.0 34.8 30.4 30.4 4.3
Arts 2.7 22.7 45.5 28.6 0.5
Engineering 2.5 26.1 43.5 28.0 0.0
Human Ec 2.9 17.4 47.8 31.9 0.0
Hotel 5.6 22.2 52.8 19.4 0.0
ILR 0.0 29.4 44.1 26.5 0.0
** p<.01, * p<.05 (based on chi‐square)
2009 Alumni Survey Cornell University
Institutional Resarch and Planning Page 43

Not
Row percentages within...
...Your fraternity/sororityNot
important at all
Somewhat important
Very important Essential
Not applicable
Cornell and Norm Groups** Cornell 14.3 10.3 9.8 5.6 60.0
Other Ivies 20.1 7.4 5.1 4.3 63.1
Other Universities 17.1 10.4 7.5 5.6 59.5
Cornell, by Past Donor** Not a donor 16.2 6.3 7.3 3.3 67.0
Donor 12.9 12.7 11.4 7.0 56.0
Cornell, by Connection** Not connected 23.0 5.4 2.7 2.7 66.2
Connected 12.2 11.1 11.3 6.5 58.9
Cornell, by College** ALS 13.0 8.6 14.2 6.8 57.4
AAP 17.4 13.0 4.3 0.0 65.2
Arts 12.3 11.9 8.7 4.1 63.0
Engineering 9.9 7.5 6.2 8.7 67.7
Human Ec 14.5 21.7 8.7 7.2 47.8
Hotel 25.0 11.1 13.9 8.3 41.7
ILR 14.7 17.6 29.4 8.8 29.4
** p<.01, * p<.05 (based on chi‐square)
Row percentages within...
...Your clubs/organizationsNot
important at all
Somewhat important
Very important Essential
Not applicable
Cornell and Norm Groups** Cornell 28.6 25.8 11.3 6.7 27.6
Other Ivies 27.8 27.7 17.1 9.4 18.0
Other Universities 30.8 26.9 13.8 6.9 21.6
Cornell, by Past Donor Not a donor 28.2 21.6 11.6 6.6 31.9
Donor 28.7 27.8 11.2 6.8 25.4
Cornell, by Connection* Not connected 34.7 17.0 7.5 6.1 34.7
Connected 27.5 27.6 11.9 7.0 26.0
Cornell, by College ALS 32.3 23.0 8.1 8.1 28.6
AAP 40.9 13.6 13.6 4.5 27.3
Arts 25.6 29.7 11.4 7.8 25.6
Engineering 23.1 27.5 13.8 8.8 26.9
Human Ec 30.4 30.4 13.0 5.8 20.3
Hotel 42.9 28.6 5.7 0.0 22.9
ILR 22.9 34.3 14.3 5.7 22.9
** p<.01, * p<.05 (based on chi‐square)
2009 Alumni Survey Cornell University
Institutional Resarch and Planning Page 44

Not
Row percentages within...
...AthleticsNot
important at all
Somewhat important
Very important Essential
Not applicable
Cornell and Norm Groups** Cornell 28.7 19.7 10.0 4.4 37.2
Other Ivies 36.4 17.0 8.0 7.8 30.8
Other Universities 29.5 20.5 14.0 10.3 25.7
Cornell, by Past Donor** Not a donor 34.6 15.9 6.0 1.7 41.9
Donor 25.1 22.0 12.3 6.1 34.5
Cornell, by Connection** Not connected 38.5 12.8 2.7 0.7 45.3
Connected 26.2 21.1 11.7 5.3 35.7
Cornell, by College ALS 25.3 20.4 10.5 4.9 38.9
AAP 34.8 13.0 0.0 0.0 52.2
Arts 32.3 19.4 8.8 4.1 35.5
Engineering 25.3 20.4 11.7 4.3 38.3
Human Ec 29.0 18.8 7.2 8.7 36.2
Hotel 31.4 22.9 8.6 2.9 34.3
ILR 20.0 20.0 20.0 14.3 25.7
** p<.01, * p<.05 (based on chi‐square)
Row percentages within...
...Your residence hallNot
important at all
Somewhat important
Very important Essential
Not applicable
Cornell and Norm Groups** Cornell 56.0 19.9 6.5 2.1 15.4
Other Ivies 48.0 27.5 11.5 4.6 8.4
Other Universities 39.8 29.6 14.7 7.2 8.8
Cornell, by Past Donor Not a donor 57.5 17.6 6.0 1.7 17.3
Donor 55.2 20.9 7.0 2.4 14.5
Cornell, by Connection* Not connected 59.2 18.4 2.0 0.7 19.7
Connected 55.7 20.3 7.3 2.5 14.2
Cornell, by College ALS 58.6 20.4 7.4 2.5 11.1
AAP 56.5 17.4 21.7 0.0 4.3
Arts 53.2 26.4 7.3 3.2 10.0
Engineering 62.1 18.6 5.0 1.9 12.4
Human Ec 61.8 19.1 2.9 4.4 11.8
Hotel 60.0 14.3 8.6 0.0 17.1
ILR 60.0 20.0 2.9 0.0 17.1
** p<.01, * p<.05 (based on chi‐square)
2009 Alumni Survey Cornell University
Institutional Resarch and Planning Page 45

Not
Row percentages within...
...Local alumni/ae clubNot
important at all
Somewhat important
Very important Essential
Not applicable
Cornell and Norm Groups** Cornell 32.1 40.2 12.4 6.1 9.1
Other Ivies 41.8 36.3 10.4 3.6 7.9
Other Universities 37.5 37.7 12.5 3.7 8.6
Cornell, by Past Donor** Not a donor 34.0 33.0 13.3 6.3 13.3
Donor 31.1 44.0 12.1 6.0 6.8
Cornell, by Connection** Not connected 43.8 32.2 7.5 3.4 13.0
Connected 29.6 41.9 13.6 6.7 8.2
Cornell, by College** ALS 35.4 40.4 10.6 3.7 9.9
AAP 43.5 13.0 21.7 17.4 4.3
Arts 35.3 39.4 12.8 4.6 7.8
Engineering 28.0 44.7 11.8 6.2 9.3
Human Ec 31.9 42.0 14.5 5.8 5.8
Hotel 13.9 33.3 30.6 19.4 2.8
ILR 28.6 51.4 5.7 2.9 11.4
** p<.01, * p<.05 (based on chi‐square)
Row percentages within...
...Friendships from collegeNot
important at all
Somewhat important
Very important Essential
Not applicable
Cornell and Norm Groups** Cornell 1.9 12.3 28.3 56.7 0.8
Other Ivies 1.0 9.3 22.6 66.7 0.3
Other Universities 1.8 10.1 24.9 62.7 0.5
Cornell, by Past Donor Not a donor 3.0 14.5 28.0 53.3 1.3
Donor 1.1 10.9 28.6 58.8 0.5
Cornell, by Connection** Not connected 6.7 24.0 32.7 36.0 0.7
Connected 0.9 9.6 27.6 61.1 0.9
Cornell, by College ALS 3.1 9.9 27.8 59.3 0.0
AAP 0.0 13.0 17.4 69.6 0.0
Arts 1.4 9.1 27.9 61.6 0.0
Engineering 1.2 11.0 29.4 58.3 0.0
Human Ec 0.0 5.8 18.8 75.4 0.0
Hotel 5.6 5.6 33.3 55.6 0.0
ILR 2.9 17.1 31.4 48.6 0.0
** p<.01, * p<.05 (based on chi‐square)
2009 Alumni Survey Cornell University
Institutional Resarch and Planning Page 46

all that apply.
AAP 80 33 7 7 6 7 7 0 0 7
Row percentages within...
In the past five years have you participated in any of the following activities? Mark
Vicam
sited pus
Attended a reunion
Worked as admissions volunteer
Worked career advisormentor
(studentsalumni/a
as
/ or e)
Mentoadvisstude
organiz
red/ ed nt ation
Worfundvolu
ked as raising nteer
Worked as class/reunion volunteer
Worked as other college/ university volunteer
Cornell and Norm Groups* C* ornell 88.3 40.2 19.1 13.5 3.9 3.8 3.8 12.3
Other Ivies 89.6 60.0 31.8 14.6 4.6 6.1 5.6 12.2
Other Universities 91.6 48.3 20.8 12.0 3.4 4.8 8.6 10.1
Cornell, by Past Donor** Not a donor 89.4 33.3 13.1 8.1 4.5 0.5 0.5 11.1
Donor 87.8 43.1 21.7 16.1 3.7 5.3 5.1 12.7
Cornell, by Connection** Not connected 87.0 20.3 8.7 8.7 1.4 0.0 0.0 2.9
Connected 88.5 42.7 20.6 13.9 4.4 4.2 4.4 13.7
Cornell, by College** ALS 93.5 45.5 15.4 17.1 2.4 0.8 0.8 6.5
AAP 80.0.0 33.3.3 6.76. 6.76. 6.7. 6.7 0.0 6.76. . 6.
Arts 87.7 40.6 16.1 10.3 3.2 3.2 2.6 7.7
Engineering 87.1 38.8 19.0 12.1 2.6 6.9 4.3 18.1
Human Ec 81.4 45.8 23.7 25.4 5.1 6.8 6.8 20.3
Hotel 80.0 33.3 40.0 16.7 3.3 6.7 3.3 26.7
ILR 92.6 55.6 33.3 7.4 7.4 0.0 11.1 7.4
** p<.01, * p<.05 (based on chi‐square)
2009 Alumni Survey Cornell University
Institutional Resarch and Planning Page 47

** 01 * 05 (base on square)
Row percentages within...
Which of the following statements best describes your financial contributions to Cornell?
I have not contributed ‐ do not plan to in the future.
I have not contributed ‐ plan to in the
future.
I have contributed ‐ will give less in the future.
I have contributed ‐ will give at same level in
future.
I have contributed ‐ will give
more in the future.
Cornell and Norm Groups** Cornell 13.7 22.1 6.7 33.3 24.4
Other Ivies 10.8 17.0 5.0 34.7 32.6
Other Universities 12.7 21.3 5.7 33.1 27.2
Cornell, by Past Donor** Not a donor 38.2 61.8 0.0 0.0 0.0
Donor 0.0 0.0 10.3 51.7 37.9
Cornell, by Connection** Not connected 37.0 28.1 13.7 13.0 8.2
Connected 9.0 20.6 5.1 37.8 27.6
Cornell, by College ALS 11.7 25.8 8.0 31.9 22.7
AAP 30.4 21.7 0.0 17.4 30.4
Arts 14.3 22.1 7.4 31.3 24.9
Engineering 11.1 18.5 6.8 43.2 20.4
Human Ec 10.1 23.2 4.3 30.4 31.9
Hotel 11.4 20.0 0.0 45.7 22.9
ILR 5.9 14.7 5.9 38.2 35.3
** p< 01 * p< 05 (based on chi square) p<. , p<. d chi‐
2009 Alumni Survey Cornell University
Institutional Resarch and Planning Page 48

... notes and newsletters
Row percentages within...
In the past year, how often have you received news or information about your undergraduate institution from
each of these sources? Alumni Magazine(s)Rarely/ Never Occasionally Often Very Often
Cornell and Norm Groups** Cornell 22.5 34.7 27.7 15.0
Other Ivies 2.9 15.2 45.2 36.7
Other Universities 5.4 20.4 43.5 30.7
Cornell, by Past Donor** Not a donor 36.8 40.9 16.8 5.5
Donor 14.9 31.2 33.6 20.4
Cornell, by Connection** Not connected 39.0 41.1 15.6 4.3
Connected 19.3 33.3 30.0 17.4
Cornell, by College** ALS 23.0 34.8 24.8 17.4
AAP 39.1 39.1 13.0 8.7
Arts 32.2 28.4 25.1 14.2
Engineering 13.8 38.1 35.0 13.1
Human Ec 13.2 38.2 26.5 22.1
Hotel 8.3 27.8 36.1 27.8
ILR 31.4 14.3 31.4 22.9
** p<.01, * p<.05 (based on chi‐square)
Row percentages within...
...Class notes and newslettersClass Rarely/ Never Occasionally Often Very Often
Cornell and Norm Groups** Cornell 26.4 43.9 20.3 9.4
Other Ivies 16.7 32.8 31.3 19.1
Other Universities 26.0 30.6 26.8 16.7
Cornell, by Past Donor** Not a donor 38.2 46.9 11.1 3.8
Donor 20.1 42.4 25.1 12.5
Cornell, by Connection** Not connected 41.7 46.0 10.1 2.2
Connected 23.2 43.5 22.4 10.9
Cornell, by College** ALS 29.1 46.8 13.3 10.8
AAP 30.4 56.5 8.7 4.3
Arts 28.0 43.6 19.4 9.0
Engineering 31.6 38.0 23.4 7.0
Human Ec 19.4 44.8 22.4 13.4
Hotel 11.4 25.7 45.7 17.1
ILR 20.0 37.1 37.1 5.7
** p<.01, * p<.05 (based on chi‐square)
2009 Alumni Survey Cornell University
Institutional Resarch and Planning Page 49

Row percentages within...
Row percentages within...
...Campus newspapers(s) and other publicationsRarely/ Never Occasionally Often Very Often
Cornell and Norm Groups** Cornell 67.6 21.3 7.3 3.7
Other Ivies 64.4 19.7 10.0 5.8
Other Universities 69.7 17.9 8.5 4.0
Cornell, by Past Donor** Not a donor 74.9 17.4 4.9 2.8
Donor 63.6 23.7 8.6 4.1
Cornell, by Connection** Not connected 86.9 12.4 0.7 0.0
Connected 63.9 23.1 8.5 4.5
Cornell, by College* ALS 63.9 25.9 6.3 3.8
AAP 65.2 26.1 8.7 0.0
Arts 73.3 18.6 5.7 2.4
Engineering 73.9 18.5 5.7 1.9
Human Ec 67.2 25.4 3.0 4.5
Hotel 60.0 22.9 8.6 8.6
ILR 51.4 22.9 22.9 2.9
** p<.01, * p<.05 (based on chi‐square)
Row percentages within...
...National newspapers and magazinesRarely/ NeverNever OccasionallyOccasionally OftenOften Very OftenVery Often
Cornell and Norm Groups** Cornell 47.9 44.4 5.5 2.2
Other Ivies 35.5 50.4 8.6 5.4
Other Universities 38.4 45.9 10.5 5.2
Cornell, by Past Donor** Not a donor 56.4 37.3 5.9 0.3
Donor 43.0 48.6 5.4 3.0
Cornell, by Connection** Not connected 70.1 28.5 1.5 0.0
Connected 43.8 47.4 6.3 2.5
Cornell, by College ALS 52.2 39.6 5.7 2.5
AAP 52.2 43.5 4.3 0.0
Arts 46.4 45.9 4.3 3.3
Engineering 51.0 44.6 3.2 1.3
Human Ec 50.7 38.8 7.5 3.0
Hotel 55.6 27.8 11.1 5.6
ILR 33.3 54.5 9.1 3.0
** p<.01, * p<.05 (based on chi‐square)
2009 Alumni Survey Cornell University
Institutional Resarch and Planning Page 50

Row percentages within...
Row percentages within...
...The college/university websiteRarely/ Never Occasionally Often Very Often
Cornell and Norm Groups** Cornell 36.3 49.8 9.5 4.3
Other Ivies 39.4 49.2 7.9 3.4
Other Universities 34.2 49.9 12.0 3.9
Cornell, by Past Donor Not a donor 40.8 47.8 9.0 2.4
Donor 33.5 51.2 9.9 5.4
Cornell, by Connection** Not connected 61.6 35.5 2.2 0.7
Connected 31.4 52.2 11.2 5.2
Cornell, by College ALS 39.9 46.2 8.2 5.7
AAP 47.8 52.2 0.0 0.0
Arts 36.5 49.5 10.1 3.8
Engineering 35.9 55.8 5.8 2.6
Human Ec 33.8 54.4 10.3 1.5
Hotel 38.9 36.1 16.7 8.3
ILR 42.9 42.9 11.4 2.9
** p<.01, * p<.05 (based on chi‐square)
Row percentages within...
...Class or alumni orgainzation website(s)Rarely/ NeverNever OccasionallyOccasionally OftenOften Very OftenVery Often
Cornell and Norm Groups Cornell 52.2 37.3 8.3 2.2
Other Ivies 51.9 37.8 8.3 2.1
Other Universities 53.6 34.2 9.4 2.8
Cornell, by Past Donor Not a donor 57.2 33.3 7.7 1.8
Donor 49.3 39.5 8.8 2.4
Cornell, by Connection** Not connected 69.6 23.0 7.4 0.0
Connected 49.0 39.9 8.3 2.7
Cornell, by College ALS 52.5 38.6 6.3 2.5
AAP 47.8 47.8 4.3 0.0
Arts 51.7 34.3 11.1 2.9
Engineering 52.8 39.0 7.5 0.6
Human Ec 52.9 38.2 7.4 1.5
Hotel 28.6 48.6 14.3 8.6
ILR 54.3 40.0 5.7 0.0
** p<.01, * p<.05 (based on chi‐square)
2009 Alumni Survey Cornell University
Institutional Resarch and Planning Page 51

Row percentages within...
Row percentages within...
...BlogsRarely/ Never Occasionally Often Very Often
Cornell and Norm Groups** Cornell 92.2 7.3 0.4 0.1
Other Ivies 89.8 8.7 1.0 0.4
Other Universities 88.7 8.7 1.9 0.7
Cornell, by Past Donor Not a donor 94.3 5.7 0.0 0.0
Donor 91.0 8.2 0.6 0.2
Cornell, by Connection** Not connected 98.5 0.7 0.0 0.7
Connected 91.3 8.2 0.4 0.0
Cornell, by College ALS 96.2 3.8 0.0 0.0
AAP 91.3 8.7 0.0 0.0
Arts 94.7 4.8 0.5 0.0
Engineering 86.6 12.1 0.6 0.6
Human Ec 95.6 4.4 0.0 0.0
Hotel 91.4 5.7 2.9 0.0
ILR 97.1 2.9 0.0 0.0
** p<.01, * p<.05 (based on chi‐square)
Row percentages within...
...Social networking sitesRarely/ NeverNever OccasionallyOccasionally OftenOften Very OftenVery Often
Cornell and Norm Groups** Cornell 62.4 28.0 8.3 1.3
Other Ivies 54.5 30.8 11.5 3.2
Other Universities 52.9 32.0 11.8 3.3
Cornell, by Past Donor Not a donor 66.0 25.6 7.7 0.7
Donor 60.0 29.6 8.8 1.7
Cornell, by Connection** Not connected 80.7 13.3 5.9 0.0
Connected 58.9 30.8 8.6 1.6
Cornell, by College* ALS 72.6 19.1 5.7 2.5
AAP 52.2 21.7 26.1 0.0
Arts 62.0 31.7 4.3 1.9
Engineering 58.2 32.9 8.2 0.6
Human Ec 58.8 26.5 11.8 2.9
Hotel 51.4 37.1 11.4 0.0
ILR 57.1 31.4 11.4 0.0
** p<.01, * p<.05 (based on chi‐square)
2009 Alumni Survey Cornell University
Institutional Resarch and Planning Page 52

Row percentages within...
Row percentages within...
...Fundraising communicationsRarely/ Never Occasionally Often Very Often
Cornell and Norm Groups** Cornell 38.5 41.0 15.8 4.7
Other Ivies 27.6 43.2 20.2 8.9
Other Universities 29.7 41.6 20.2 8.5
Cornell, by Past Donor** Not a donor 52.3 31.6 11.9 4.2
Donor 31.1 46.0 17.9 5.1
Cornell, by Connection** Not connected 56.3 29.6 10.4 3.7
Connected 34.8 43.5 16.7 5.0
Cornell, by College ALS 35.7 45.9 13.4 5.1
AAP 34.8 47.8 13.0 4.3
Arts 39.6 40.6 15.5 4.3
Engineering 44.6 37.6 14.0 3.8
Human Ec 32.4 39.7 20.6 7.4
Hotel 45.7 22.9 22.9 8.6
ILR 42.9 42.9 11.4 2.9
** p<.01, * p<.05 (based on chi‐square)
Row percentages within...
...E‐mails from your college or departmentRarely/ NeverNever OccasionallyOccasionally OftenOften Very OftenVery Often
Cornell and Norm Groups** Cornell 45.6 37.4 13.4 3.6
Other Ivies 68.1 23.8 6.6 1.5
Other Universities 61.4 29.1 8.1 1.5
Cornell, by Past Donor** Not a donor 54.5 29.7 12.2 3.5
Donor 40.8 41.7 14.0 3.5
Cornell, by Connection** Not connected 60.0 25.2 12.6 2.2
Connected 42.8 39.8 13.4 4.0
Cornell, by College** ALS 41.9 35.0 17.5 5.6
AAP 39.1 39.1 21.7 0.0
Arts 67.8 26.4 5.8 0.0
Engineering 38.0 48.7 10.8 2.5
Human Ec 20.9 49.3 26.9 3.0
Hotel 28.6 28.6 22.9 20.0
ILR 26.5 52.9 11.8 8.8
** p<.01, * p<.05 (based on chi‐square)
2009 Alumni Survey Cornell University
Institutional Resarch and Planning Page 53

Row percentages within...
Row percentages within...
...E‐mails from alumni organizationsRarely/ Never Occasionally Often Very Often
Cornell and Norm Groups Cornell 24.8 45.0 23.6 6.7
Other Ivies 25.1 48.0 21.7 5.2
Other Universities 24.4 47.0 23.2 5.5
Cornell, by Past Donor** Not a donor 34.4 39.2 20.1 6.3
Donor 19.6 48.2 25.3 6.9
Cornell, by Connection** Not connected 43.1 39.4 13.9 3.6
Connected 20.8 46.1 25.7 7.3
Cornell, by College ALS 26.9 42.5 21.9 8.8
AAP 30.4 39.1 30.4 0.0
Arts 26.3 45.0 23.4 5.3
Engineering 18.9 49.7 23.9 7.5
Human Ec 21.2 50.0 22.7 6.1
Hotel 8.6 31.4 40.0 20.0
ILR 20.6 47.1 23.5 8.8
** p<.01, * p<.05 (based on chi‐square)
Row percentages within...
...Class reunions and alumni eventsRarely/ NeverNever OccasionallyOccasionally OftenOften Very OftenVery Often
Cornell and Norm Groups** Cornell 34.7 49.1 13.5 2.8
Other Ivies 22.1 53.0 20.3 4.6
Other Universities 24.5 50.3 20.2 4.9
Cornell, by Past Donor** Not a donor 43.4 45.8 10.1 0.7
Donor 29.5 51.1 15.4 3.9
Cornell, by Connection** Not connected 51.9 42.2 5.2 0.7
Connected 31.1 50.3 15.3 3.3
Cornell, by College ALS 34.0 50.3 13.2 2.5
AAP 31.8 54.5 13.6 0.0
Arts 37.2 44.0 16.9 1.9
Engineering 34.8 53.2 10.1 1.9
Human Ec 35.3 48.5 11.8 4.4
Hotel 17.1 54.3 17.1 11.4
ILR 29.4 47.1 17.6 5.9
** p<.01, * p<.05 (based on chi‐square)
2009 Alumni Survey Cornell University
Institutional Resarch and Planning Page 54

Row percentages within...
Row percentages within...
...Events on‐campusRarely/ Never Occasionally Often Very Often
Cornell and Norm Groups** Cornell 66.3 27.7 4.7 1.2
Other Ivies 61.5 31.7 5.3 1.4
Other Universities 59.5 31.4 7.7 1.5
Cornell, by Past Donor** Not a donor 74.6 20.8 2.8 1.8
Donor 61.8 31.5 5.8 0.9
Cornell, by Connection** Not connected 84.4 14.8 0.0 0.7
Connected 62.8 30.2 5.7 1.4
Cornell, by College ALS 67.5 28.0 3.2 1.3
AAP 68.2 27.3 4.5 0.0
Arts 72.0 24.2 3.4 0.5
Engineering 65.8 28.5 4.4 1.3
Human Ec 72.1 22.1 2.9 2.9
Hotel 51.4 37.1 8.6 2.9
ILR 64.7 29.4 5.9 0.0
** p<.01, * p<.05 (based on chi‐square)
Row percentages within...
...Events off‐campusRarely/ NeverNever OccasionallyOccasionally OftenOften Very OftenVery Often
Cornell and Norm Groups Cornell 51.6 35.3 10.6 2.4
Other Ivies 53.4 36.6 8.7 1.3
Other Universities 52.4 37.1 9.3 1.2
Cornell, by Past Donor** Not a donor 60.2 31.7 7.0 1.1
Donor 46.6 37.7 12.5 3.2
Cornell, by Connection** Not connected 67.2 32.1 0.7 0.0
Connected 48.9 35.7 12.4 3.0
Cornell, by College** ALS 57.3 33.1 7.0 2.5
AAP 45.5 45.5 9.1 0.0
Arts 54.6 33.2 11.2 1.0
Engineering 48.4 40.3 10.1 1.3
Human Ec 47.8 40.3 7.5 4.5
Hotel 28.6 34.3 25.7 11.4
ILR 52.9 26.5 17.6 2.9
** p<.01, * p<.05 (based on chi‐square)
2009 Alumni Survey Cornell University
Institutional Resarch and Planning Page 55

Row percentages within...
Row percentages within...
...Talking (etc.) with other alumni/aeRarely/ Never Occasionally Often Very Often
Cornell and Norm Groups** Cornell 23.7 42.6 24.4 9.2
Other Ivies 16.2 41.2 29.4 13.2
Other Universities 20.5 42.3 26.3 10.9
Cornell, by Past Donor** Not a donor 34.3 41.3 18.2 6.3
Donor 17.5 43.4 28.1 10.9
Cornell, by Connection** Not connected 47.4 42.2 8.1 2.2
Connected 18.9 42.7 27.6 10.8
Cornell, by College* ALS 25.9 40.5 24.1 9.5
AAP 22.7 36.4 18.2 22.7
Arts 16.9 49.8 24.2 9.2
Engineering 22.2 48.1 24.1 5.7
Human Ec 20.9 37.3 28.4 13.4
Hotel 17.1 28.6 48.6 5.7
ILR 30.3 36.4 18.2 15.2
** p<.01, * p<.05 (based on chi‐square)
Row percentages within...
...Talking (etc.) with current studentsRarely/ NeverNever OccasionallyOccasionally OftenOften Very OftenVery Often
Cornell and Norm Groups Cornell 79.1 15.6 3.9 1.3
Other Ivies 76.1 18.6 3.8 1.5
Other Universities 78.4 16.9 3.5 1.2
Cornell, by Past Donor Not a donor 82.0 12.4 3.5 2.1
Donor 77.7 17.2 4.2 0.9
Cornell, by Connection** Not connected 93.3 5.2 1.5 0.0
Connected 76.6 17.7 4.1 1.7
Cornell, by College** ALS 79.0 15.3 3.2 2.5
AAP 85.7 9.5 4.8 0.0
Arts 85.0 13.5 1.0 0.5
Engineering 80.6 17.4 1.9 0.0
Human Ec 63.2 27.9 7.4 1.5
Hotel 76.5 11.8 8.8 2.9
ILR 82.4 5.9 8.8 2.9
** p<.01, * p<.05 (based on chi‐square)
2009 Alumni Survey Cornell University
Institutional Resarch and Planning Page 56

Reduce a Reduce about Increase Increase a
Row percentages within...
How would you change the emphasis your undergraduate institution places on the following aspects of college/university life? Supporting faculty research
Reduce a great deal
Reduce somewhat
Keep about the same
Increase somewhat
Increase a great deal I donʹt know
Cornell and Norm Groups Cornell 0.5 5.5 61.9 17.3 5.5 9.3
Other Ivies 1.0 6.6 60.2 17.6 3.4 11.1
Other Universities 1.2 5.8 62.1 16.3 3.7 10.9
Cornell, by Past Donor Not a donor 0.3 6.3 61.2 15.0 6.6 10.5
Donor 0.6 5.2 62.1 18.6 5.0 8.6
Cornell, by Connection** Not connected 2.2 10.4 57.5 13.4 1.5 14.9
Connected 0.1 4.3 63.6 17.5 6.4 8.1
Cornell, by College** ALS 0.6 2.5 68.7 15.3 4.3 8.6
AAP 0.0 8.7 34.8 21.7 13.0 21.7
Arts 0.0 6.2 61.9 17.6 5.2 9.0
Engineering 0.6 7.8 67.5 15.6 4.5 3.9
Human Ec 1.5 4.5 50.0 16.7 7.6 19.7
Hotel 0.0 2.9 42.9 25.7 5.7 22.9
ILR 0.0 0.0 79.4 11.8 0.0 8.8
** p<.01, * p<.05 (based on chi‐square)
Row percentages within...
...Commitment to intellectual freedomReduce a great deal
Reduce somewhat
Keep about Keepthe same
Increase somewhat
Increase a great deal I donʹt know
Cornell and Norm Groups Cornell 0.4 0.8 63.3 23.5 5.8 6.3
Other Ivies 0.1 1.0 62.9 22.8 6.3 6.9
Other Universities 0.1 1.0 60.5 25.1 6.6 6.8
Cornell, by Past Donor Not a donor 0.3 1.0 61.3 22.0 7.3 8.0
Donor 0.4 0.7 64.4 24.2 5.0 5.2
Cornell, by Connection Not connected 1.5 1.5 59.0 23.1 6.0 9.0
Connected 0.1 0.7 63.8 23.4 5.9 5.9
Cornell, by College** ALS 1.2 0.6 68.9 18.6 3.7 6.8
AAP 0.0 8.7 43.5 17.4 21.7 8.7
Arts 0.0 0.0 66.2 23.3 6.2 4.3
Engineering 0.0 1.3 65.4 23.7 3.8 5.8
Human Ec 0.0 0.0 54.5 27.3 9.1 9.1
Hotel 0.0 0.0 50.0 23.5 5.9 20.6
ILR 0.0 0.0 73.5 23.5 0.0 2.9
** p<.01, * p<.05 (based on chi‐square)
2009 Alumni Survey Cornell University
Institutional Resarch and Planning Page 57

I t Row percentages within...
Row percentages within...
...Developing a diverse facultyReduce a great deal
Reduce somewhat
Keep about the same
Increase somewhat
Increase a great deal I donʹt know
Cornell and Norm Groups** Cornell 1.2 5.0 54.3 26.2 7.2 6.1
Other Ivies 1.6 4.9 48.9 28.0 11.5 5.0
Other Universities 1.5 3.5 50.2 26.3 11.8 6.7
Cornell, by Past Donor Not a donor 1.8 6.0 52.6 23.5 9.1 7.0
Donor 0.9 4.6 55.0 27.6 6.3 5.6
Cornell, by Connection Not connected 1.5 8.9 48.9 23.0 10.4 7.4
Connected 1.2 4.0 55.6 27.0 6.5 5.8
Cornell, by College* ALS 1.3 5.0 57.5 20.6 8.1 7.5
AAP 0.0 8.7 30.4 39.1 13.0 8.7
Arts 1.4 3.8 56.2 27.1 7.6 3.8
Engineering 1.3 8.3 61.8 21.0 1.9 5.7
Human Ec 0.0 0.0 38.8 38.8 11.9 10.4
Hotel 0.0 2.9 51.4 34.3 5.7 5.7
ILR 2.9 11.8 55.9 20.6 5.9 2.9
** p<.01, * p<.05 (based on chi‐square)
Row percentages within...
...Developing a diverse student bodyReduce a great dealgreat deal
Reduce somewhatsomewhat
Keep about the samethe same
Increase somewhatsomewhat
Increase a great dealgreat deal I donʹt knowdon know
Cornell and Norm Groups* Cornell 1.8 5.8 56.4 24.3 8.4 3.4
Other Ivies 1.5 4.8 51.4 26.5 12.0 3.8
Other Universities 1.5 3.9 52.4 25.8 12.1 4.3
Cornell, by Past Donor Not a donor 3.2 7.4 52.6 23.2 9.5 4.2
Donor 1.1 5.0 58.1 24.9 8.0 3.0
Cornell, by Connection* Not connected 2.2 8.9 44.4 27.4 13.3 3.7
Connected 1.6 4.7 58.9 23.9 7.6 3.3
Cornell, by College* ALS 1.9 4.4 60.6 21.9 7.5 3.8
AAP 0.0 13.0 47.8 17.4 17.4 4.3
Arts 1.9 3.8 58.1 25.7 8.6 1.9
Engineering 1.3 8.9 65.6 15.9 2.5 5.7
Human Ec 0.0 7.5 41.8 37.3 10.4 3.0
Hotel 0.0 2.9 47.1 32.4 14.7 2.9
ILR 2.9 14.7 52.9 26.5 2.9 0.0
** p<.01, * p<.05 (based on chi‐square)
2009 Alumni Survey Cornell University
Institutional Resarch and Planning Page 58

I t Row percentages within...
Row percentages within...
...Emphasis on inter‐collegiate athleticsReduce a great deal
Reduce somewhat
Keep about the same
Increase somewhat
Increase a great deal I donʹt know
Cornell and Norm Groups** Cornell 3.7 9.7 59.5 13.9 3.1 10.0
Other Ivies 5.4 15.0 57.0 10.7 3.0 8.9
Other Universities 2.8 11.1 62.4 11.9 3.5 8.2
Cornell, by Past Donor** Not a donor 7.8 13.1 52.5 11.3 2.8 12.4
Donor 1.7 8.0 63.0 15.2 3.2 8.9
Cornell, by Connection Not connected 6.7 14.2 54.5 10.4 3.7 10.4
Connected 3.1 8.9 60.4 14.9 3.1 9.5
Cornell, by College** ALS 1.9 5.6 60.6 14.4 4.4 13.1
AAP 13.6 18.2 40.9 4.5 0.0 22.7
Arts 4.3 12.0 60.8 13.4 2.9 6.7
Engineering 1.9 13.0 58.4 16.2 1.9 8.4
Human Ec 0.0 9.0 61.2 11.9 3.0 14.9
Hotel 0.0 0.0 60.0 22.9 2.9 14.3
ILR 5.9 0.0 50.0 23.5 8.8 11.8
** p<.01, * p<.05 (based on chi‐square)
Row percentages within...
...Level of need‐based financial aidReduce a great dealgreat deal
Reduce somewhatsomewhat
Keep about the samethe same
Increase somewhatsomewhat
Increase a great dealgreat deal I donʹt knowdon know
Cornell and Norm Groups** Cornell 0.4 1.4 30.8 38.7 18.3 10.3
Other Ivies 0.3 1.0 30.1 38.2 22.4 8.1
Other Universities 0.4 1.3 29.9 39.1 18.5 10.8
Cornell, by Past Donor* Not a donor 0.0 0.7 30.2 37.5 23.5 8.1
Donor 0.6 1.9 31.2 39.3 15.6 11.5
Cornell, by Connection* Not connected 0.0 1.5 27.1 32.3 27.8 11.3
Connected 0.4 1.5 31.6 40.1 16.3 10.1
Cornell, by College* ALS 0.0 0.6 28.1 43.1 16.3 11.9
AAP 4.3 0.0 30.4 30.4 26.1 8.7
Arts 0.5 1.9 29.0 37.6 23.8 7.1
Engineering 0.0 1.9 39.4 36.8 11.6 10.3
Human Ec 0.0 1.5 25.4 47.8 6.0 19.4
Hotel 0.0 2.9 37.1 28.6 20.0 11.4
ILR 0.0 0.0 32.4 35.3 20.6 11.8
** p<.01, * p<.05 (based on chi‐square)
2009 Alumni Survey Cornell University
Institutional Resarch and Planning Page 59

I t Row percentages within...
Row percentages within...
...Level of non‐need‐based (merit) aidReduce a great deal
Reduce somewhat
Keep about the same
Increase somewhat
Increase a great deal I donʹt know
Cornell and Norm Groups** Cornell 0.7 3.7 35.8 35.5 11.9 12.3
Other Ivies 2.1 3.7 46.3 28.1 9.6 10.2
Other Universities 1.0 2.9 39.9 32.3 11.9 12.1
Cornell, by Past Donor* Not a donor 1.1 2.8 37.9 30.9 16.1 11.2
Donor 0.6 4.3 34.6 38.3 9.9 12.5
Cornell, by Connection Not connected 2.3 3.0 34.6 31.6 17.3 11.3
Connected 0.4 3.7 36.2 36.5 11.0 12.2
Cornell, by College** ALS 0.0 3.8 35.2 36.5 11.3 13.2
AAP 0.0 4.3 8.7 21.7 43.5 21.7
Arts 1.0 4.8 32.9 36.7 14.8 10.0
Engineering 0.6 2.6 43.5 35.7 7.8 9.7
Human Ec 0.0 0.0 31.3 44.8 4.5 19.4
Hotel 0.0 0.0 42.9 28.6 14.3 14.3
ILR 2.9 5.9 35.3 23.5 14.7 17.6
** p<.01, * p<.05 (based on chi‐square)
Row percentages within...
...Containing the cost of educationReduce a great dealgreat deal
Reduce somewhatsomewhat
Keep about the samethe same
Increase somewhatsomewhat
Increase a great dealgreat deal I donʹt knowdon know
Cornell and Norm Groups Cornell 0.1 1.4 19.9 36.0 38.7 3.8
Other Ivies 0.3 1.1 22.1 35.1 36.6 4.8
Other Universities 0.5 1.7 20.8 35.1 36.8 5.2
Cornell, by Past Donor** Not a donor 0.3 2.1 18.4 29.2 46.5 3.5
Donor 0.0 1.1 20.4 39.8 34.6 4.1
Cornell, by Connection* Not connected 0.7 0.7 15.6 31.1 47.4 4.4
Connected 0.0 1.6 20.6 37.1 37.1 3.6
Cornell, by College ALS 0.6 1.9 18.1 38.1 36.3 5.0
AAP 0.0 0.0 13.0 13.0 60.9 13.0
Arts 0.0 2.8 17.5 35.5 41.7 2.4
Engineering 0.0 0.0 20.6 40.6 35.5 3.2
Human Ec 0.0 0.0 16.2 52.9 26.5 4.4
Hotel 0.0 2.9 20.0 28.6 48.6 0.0
ILR 0.0 0.0 29.4 35.3 29.4 5.9
** p<.01, * p<.05 (based on chi‐square)
2009 Alumni Survey Cornell University
Institutional Resarch and Planning Page 60

Row percentages within...
...Responsiveness to alumni/ae concernsReduce a great deal
Reduce somewhat
Keep about the same
Increase somewhat
Increase a great deal I donʹt know
Cornell and Norm Groups** Cornell 0.0 1.3 53.7 22.3 5.4 17.3
Other Ivies 0.8 3.0 52.8 20.4 6.5 16.6
Other Universities 0.3 1.7 50.5 22.6 7.3 17.6
Cornell, by Past Donor* Not a donor 0.0 1.7 47.7 21.6 7.3 21.6
Donor 0.0 1.1 56.8 22.5 4.5 15.1
Cornell, by Connection** Not connected 0.0 1.5 38.1 20.1 8.2 32.1
Connected 0.0 1.3 56.5 22.7 4.6 14.8
Cornell, by College ALS 0.0 0.6 58.8 20.0 3.1 17.5
AAP 0.0 4.3 39.1 21.7 8.7 26.1
Arts 0.0 1.9 51.9 23.3 7.1 15.7
Engineering 0.0 1.9 56.1 20.6 3.9 17.4
Human Ec 0.0 3.0 47.8 19.4 4.5 25.4
Hotel 0.0 0.0 51.4 28.6 8.6 11.4
ILR 0.0 0.0 58.8 23.5 2.9 14.7
** p<.01, * p<.05 (based on chi‐square)
2009 Alumni Survey Cornell University
Institutional Resarch and Planning Page 61

Not
Row percentages within...
In general, how satisfied would you say you are with your life right now?
Very Dissatisfied
Generally Dissatisfied Ambivalent
Generally Satisfied
Very Satisfied
Cornell and Norm Groups Cornell 0.2 1.9 5.1 50.6 42.1
Other Ivies 0.4 2.1 5.8 44.1 47.5
Other Universities 0.5 1.9 5.5 44.8 47.3
Cornell, by Past Donor Not a donor 0.7 2.8 5.6 51.4 39.6
Donor 0.0 1.5 4.8 50.2 43.5
Cornell, by Connection* Not connected 0.7 3.4 8.3 55.2 32.4
Connected 0.1 1.6 4.3 49.1 44.8
Cornell, by College ALS 0.0 2.5 3.1 47.2 47.2
AAP 0.0 0.0 0.0 65.2 34.8
Arts 0.0 2.9 6.3 51.9 38.9
Engineering 0.6 1.2 5.0 54.0 39.1
Human Ec 0.0 4.3 5.8 42.0 47.8
Hotel 0.0 0.0 2.8 44.4 52.8
ILR 0.0 0.0 3.0 51.5 45.5
** p<.01, * p<.05 (based on chi‐square)
Row percentages within...
Please indicate how important each of the following is to you at this point in your life and career: Raising a family
Not Important at
allSomewhat Important
Very Important Essential
Cornell and Norm Groups Cornell 16.6 17.2 20.0 46.2
Other Ivies 15.5 19.3 20.9 44.3
Other Universities 16.6 17.7 22.0 43.7
Cornell, by Past Donor Not a donor 16.2 17.2 19.9 46.6
Donor 16.9 17.2 19.6 46.2
Cornell, by Connection Not connected 22.1 17.2 22.1 38.6
Connected 15.7 17.4 19.3 47.6
Cornell, by College* ALS 21.4 15.1 16.4 47.2
AAP 21.7 21.7 26.1 30.4
Arts 14.5 17.8 27.6 40.2
Engineering 16.8 23.0 16.1 44.1
Human Ec 11.6 20.3 15.9 52.2
Hotel 11.1 11.1 13.9 63.9
ILR 5.7 14.3 22.9 57.1
** p<.01, * p<.05 (based on chi‐square)
2009 Alumni Survey Cornell University
Institutional Resarch and Planning Page 62

Important at Somewhat Very
Row percentages within...
...Working for social and political changeNot
Important at all
Somewhat Important
Very Important Essential
Cornell and Norm Groups** Cornell 24.1 49.9 19.4 6.6
Other Ivies 17.7 48.5 24.4 9.4
Other Universities 19.8 51.1 22.5 6.7
Cornell, by Past Donor* Not a donor 26.0 43.5 21.9 8.6
Donor 23.1 53.0 18.2 5.7
Cornell, by Connection Not connected 26.2 43.4 22.8 7.6
Connected 23.8 51.4 18.6 6.2
Cornell, by College** ALS 28.1 50.0 17.5 4.4
AAP 4.3 47.8 30.4 17.4
Arts 20.5 50.7 20.9 7.9
Engineering 31.1 54.7 10.6 3.7
Human Ec 19.1 42.6 32.4 5.9
Hotel 35.3 47.1 14.7 2.9
ILR 32.4 50.0 11.8 5.9
** p<.01, * p<.05 (based on chi‐square)
Row percentages within...
...Helping othersNot
Important at all
Somewhat Important
Very Important Essential
Cornell and Norm Groups* Cornell 4.0 39.7 38.3 18.0
Other Ivies 2.9 33.5 42.2 21.4
Other Universities 3.3 36.3 39.7 20.7
Cornell, by Past Donor Not a donor 5.4 35.7 40.8 18.0
Donor 3.3 41.9 37.0 17.8
Cornell, by Connection Not connected 6.8 38.1 38.8 16.3
Connected 3.4 40.4 37.8 18.4
Cornell, by College** ALS 3.1 39.8 39.8 17.4
AAP 0.0 34.8 39.1 26.1
Arts 2.8 36.3 41.4 19.5
Engineering 6.2 56.8 29.0 8.0
Human Ec 5.8 29.0 37.7 27.5
Hotel 8.6 45.7 31.4 14.3
ILR 2.9 34.3 42.9 20.0
** p<.01, * p<.05 (based on chi‐square)
2009 Alumni Survey Cornell University
Institutional Resarch and Planning Page 63

Not
Row percentages within...
...Participating in religious activities and groupsNot
Important at all
Somewhat Important
Very Important Essential
Cornell and Norm Groups** Cornell 57.7 26.0 10.1 6.1
Other Ivies 62.4 21.6 9.4 6.7
Other Universities 55.9 23.0 11.7 9.3
Cornell, by Past Donor Not a donor 63.4 21.7 9.8 5.1
Donor 54.6 28.8 10.1 6.6
Cornell, by Connection Not connected 66.2 17.9 10.3 5.5
Connected 55.9 27.9 9.9 6.3
Cornell, by College* ALS 58.8 26.9 9.4 5.0
AAP 65.2 26.1 0.0 8.7
Arts 55.8 27.9 12.6 3.7
Engineering 68.9 14.9 9.9 6.2
Human Ec 43.5 42.0 8.7 5.8
Hotel 51.4 22.9 14.3 11.4
ILR 42.9 40.0 14.3 2.9
** p<.01, * p<.05 (based on chi‐square)
Row percentages within...
...Participating in politics or community affairsNot
Important at all
Somewhat Important
Very Important Essential
Cornell and Norm Groups** Cornell 37.2 47.2 12.8 2.8
Other Ivies 31.2 50.0 14.7 4.1
Other Universities 32.7 49.9 14.6 2.7
Cornell, by Past Donor* Not a donor 38.6 41.6 16.4 3.4
Donor 36.3 50.1 11.0 2.6
Cornell, by Connection Not connected 38.4 43.2 15.1 3.4
Connected 37.1 47.9 12.3 2.7
Cornell, by College** ALS 38.8 43.1 15.0 3.1
AAP 21.7 39.1 26.1 13.0
Arts 30.2 56.3 11.2 2.3
Engineering 47.5 43.2 7.4 1.9
Human Ec 38.2 41.2 19.1 1.5
Hotel 42.9 45.7 8.6 2.9
ILR 35.3 44.1 14.7 5.9
** p<.01, * p<.05 (based on chi‐square)
2009 Alumni Survey Cornell University
Institutional Resarch and Planning Page 64

Not
Row percentages within...
...Being well off financiallyNot
Important at all
Somewhat Important
Very Important Essential
Cornell and Norm Groups** Cornell 2.8 35.7 44.5 17.0
Other Ivies 4.6 42.4 40.5 12.5
Other Universities 4.2 40.2 42.4 13.2
Cornell, by Past Donor Not a donor 3.7 37.1 43.2 16.0
Donor 2.4 35.0 45.2 17.4
Cornell, by Connection Not connected 3.4 44.2 40.8 11.6
Connected 2.8 34.1 44.7 18.4
Cornell, by College* ALS 2.5 35.4 40.4 21.7
AAP 4.3 43.5 43.5 8.7
Arts 3.7 37.2 44.2 14.9
Engineering 1.2 27.2 51.9 19.8
Human Ec 7.2 42.0 30.4 20.3
Hotel 0.0 20.0 71.4 8.6
ILR 0.0 29.4 52.9 17.6
** p<.01, * p<.05 (based on chi‐square)
Row percentages within...
...Being involved in artistic activitiesNot
Important at all
Somewhat Important
Very Important Essential
Cornell and Norm Groups* Cornell 32.8 42.5 17.8 7.0
Other Ivies 30.0 40.0 19.9 10.1
Other Universities 30.5 42.7 18.8 7.9
Cornell, by Past Donor** Not a donor 31.2 37.7 20.2 11.0
Donor 33.5 45.2 16.4 5.0
Cornell, by Connection Not connected 32.9 39.7 19.2 8.2
Connected 32.7 43.0 17.8 6.5
Cornell, by College** ALS 35.6 46.3 14.4 3.8
AAP 0.0 34.8 30.4 34.8
Arts 28.8 41.4 19.1 10.7
Engineering 41.6 40.4 14.9 3.1
Human Ec 26.1 53.6 17.4 2.9
Hotel 38.2 44.1 17.6 0.0
ILR 48.5 30.3 18.2 3.0
** p<.01, * p<.05 (based on chi‐square)
2009 Alumni Survey Cornell University
Institutional Resarch and Planning Page 65

Not
Row percentages within...
...Traveling abroadNot
Important at all
Somewhat Important
Very Important Essential
Cornell and Norm Groups** Cornell 17.9 40.6 28.3 13.2
Other Ivies 13.7 38.0 32.5 15.8
Other Universities 14.9 36.9 32.4 15.8
Cornell, by Past Donor Not a donor 18.0 41.2 26.9 13.9
Donor 17.9 40.7 28.6 12.8
Cornell, by Connection Not connected 21.2 42.5 24.7 11.6
Connected 17.2 40.1 29.0 13.7
Cornell, by College* ALS 25.0 38.1 25.0 11.9
AAP 4.3 39.1 30.4 26.1
Arts 14.0 35.3 32.6 18.1
Engineering 18.5 43.2 30.2 8.0
Human Ec 15.9 49.3 26.1 8.7
Hotel 20.0 37.1 34.3 8.6
ILR 29.4 35.3 26.5 8.8
** p<.01, * p<.05 (based on chi‐square)
Row percentages within...
...Interacting with people of diverse backgroundsNot
Important at all
Somewhat Important
Very Important Essential
Cornell and Norm Groups** Cornell 8.4 44.7 33.5 13.3
Other Ivies 6.1 36.6 38.7 18.7
Other Universities 6.7 37.2 37.9 18.2
Cornell, by Past Donor Not a donor 9.5 42.9 31.6 16.0
Donor 7.7 45.6 34.9 11.8
Cornell, by Connection Not connected 8.2 49.3 28.8 13.7
Connected 8.3 43.7 34.9 13.1
Cornell, by College ALS 10.7 49.1 29.6 10.7
AAP 4.3 34.8 39.1 21.7
Arts 5.6 47.4 34.9 12.1
Engineering 11.7 48.1 32.7 7.4
Human Ec 8.8 38.2 36.8 16.2
Hotel 20.0 22.9 37.1 20.0
ILR 11.8 44.1 38.2 5.9
** p<.01, * p<.05 (based on chi‐square)
2009 Alumni Survey Cornell University
Institutional Resarch and Planning Page 66

Not
Row percentages within...
...Gaining recognition from colleaguesNot
Important at all
Somewhat Important
Very Important Essential
Cornell and Norm Groups Cornell 13.4 46.6 32.5 7.6
Other Ivies 12.3 44.7 34.3 8.6
Other Universities 13.9 46.4 32.4 7.3
Cornell, by Past Donor Not a donor 13.3 48.1 29.7 8.9
Donor 13.4 46.1 33.5 7.0
Cornell, by Connection** Not connected 18.8 52.8 20.8 7.6
Connected 12.7 44.8 34.8 7.7
Cornell, by College ALS 13.0 48.4 32.9 5.6
AAP 17.4 34.8 43.5 4.3
Arts 9.3 43.3 37.7 9.8
Engineering 13.8 50.0 28.8 7.5
Human Ec 14.5 53.6 27.5 4.3
Hotel 17.1 48.6 28.6 5.7
ILR 11.8 35.3 50.0 2.9
** p<.01, * p<.05 (based on chi‐square)
Row percentages within...
...Contributing to science and innovationNot
Important at all
Somewhat Important
Very Important Essential
Cornell and Norm Groups** Cornell 33.4 34.9 23.8 7.9
Other Ivies 40.9 33.9 17.6 7.6
Other Universities 38.1 34.5 19.7 7.8
Cornell, by Past Donor Not a donor 32.8 37.5 20.5 9.2
Donor 33.7 33.5 25.8 7.0
Cornell, by Connection** Not connected 31.9 47.9 13.2 6.9
Connected 33.7 32.5 25.8 8.0
Cornell, by College** ALS 26.7 34.8 27.3 11.2
AAP 39.1 39.1 17.4 4.3
Arts 39.1 30.7 24.2 6.0
Engineering 20.6 42.5 30.0 6.9
Human Ec 36.2 40.6 17.4 5.8
Hotel 60.0 28.6 11.4 0.0
ILR 48.5 36.4 15.2 0.0
** p<.01, * p<.05 (based on chi‐square)
2009 Alumni Survey Cornell University
Institutional Resarch and Planning Page 67

Not
Row percentages within...
...Being successful in a business of your ownNot
Important at all
Somewhat Important
Very Important Essential
Cornell and Norm Groups Cornell 46.2 22.4 20.0 11.4
Other Ivies 46.6 25.1 18.4 10.0
Other Universities 44.5 24.6 20.6 10.3
Cornell, by Past Donor Not a donor 43.5 21.9 21.9 12.7
Donor 47.7 22.7 18.9 10.7
Cornell, by Connection Not connected 49.3 21.1 19.0 10.6
Connected 45.4 22.8 20.3 11.4
Cornell, by College** ALS 49.1 20.5 18.6 11.8
AAP 22.7 13.6 36.4 27.3
Arts 48.6 21.0 25.2 5.1
Engineering 39.4 26.3 20.6 13.8
Human Ec 55.2 23.9 13.4 7.5
Hotel 34.3 17.1 28.6 20.0
ILR 48.5 27.3 21.2 3.0
** p<.01, * p<.05 (based on chi‐square)
Row percentages within...
...Having administrative and managerial responsibilityNot
Important at all
Somewhat Important
Very Important Essential
Cornell and Norm Groups Cornell 22.9 34.3 33.2 9.6
Other Ivies 27.3 34.7 29.0 9.0
Other Universities 24.6 36.0 29.9 9.5
Cornell, by Past Donor Not a donor 25.0 34.2 31.2 9.6
Donor 22.0 34.1 34.1 9.7
Cornell, by Connection Not connected 27.3 35.7 31.5 5.6
Connected 22.1 33.6 34.0 10.3
Cornell, by College** ALS 23.0 36.0 29.8 11.2
AAP 17.4 30.4 30.4 21.7
Arts 25.1 37.2 32.1 5.6
Engineering 22.4 31.1 35.4 11.2
Human Ec 29.0 29.0 33.3 8.7
Hotel 2.9 25.7 48.6 22.9
ILR 8.8 41.2 50.0 0.0
** p<.01, * p<.05 (based on chi‐square)
2009 Alumni Survey Cornell University
Institutional Resarch and Planning Page 68
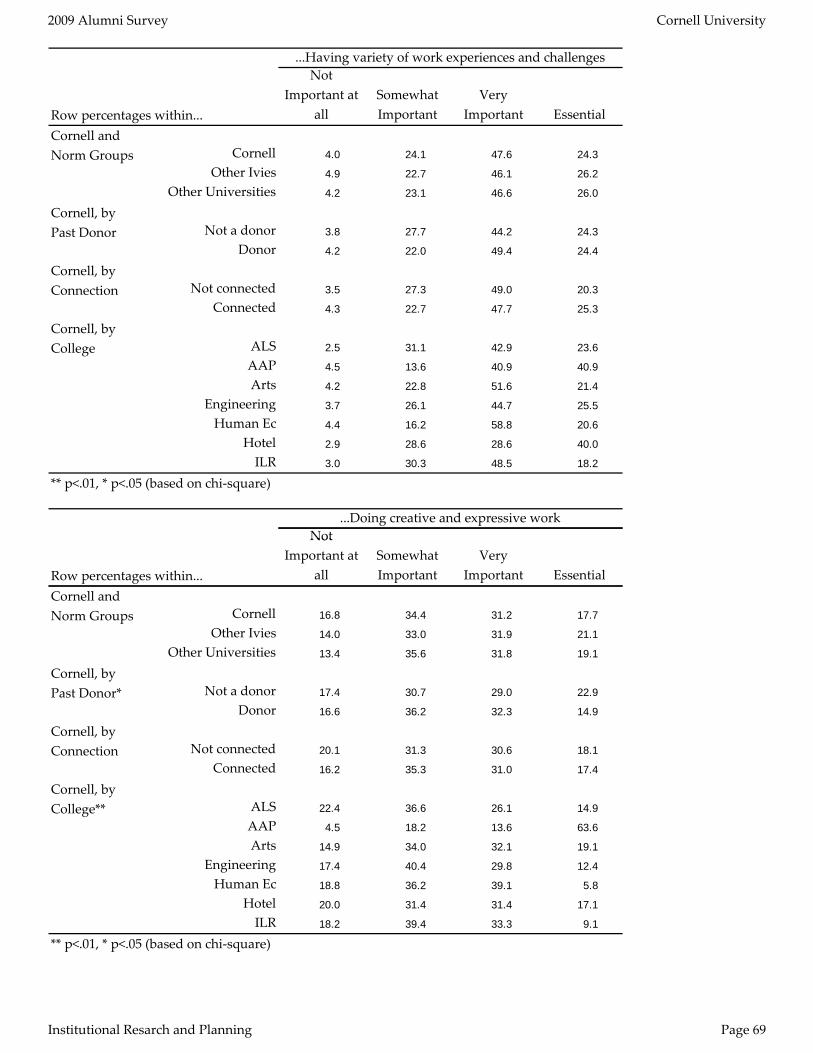
Not
Row percentages within...
...Having variety of work experiences and challengesNot
Important at all
Somewhat Important
Very Important Essential
Cornell and Norm Groups Cornell 4.0 24.1 47.6 24.3
Other Ivies 4.9 22.7 46.1 26.2
Other Universities 4.2 23.1 46.6 26.0
Cornell, by Past Donor Not a donor 3.8 27.7 44.2 24.3
Donor 4.2 22.0 49.4 24.4
Cornell, by Connection Not connected 3.5 27.3 49.0 20.3
Connected 4.3 22.7 47.7 25.3
Cornell, by College ALS 2.5 31.1 42.9 23.6
AAP 4.5 13.6 40.9 40.9
Arts 4.2 22.8 51.6 21.4
Engineering 3.7 26.1 44.7 25.5
Human Ec 4.4 16.2 58.8 20.6
Hotel 2.9 28.6 28.6 40.0
ILR 3.0 30.3 48.5 18.2
** p<.01, * p<.05 (based on chi‐square)
Row percentages within...
...Doing creative and expressive workNot
Important at all
Somewhat Important
Very Important Essential
Cornell and Norm Groups Cornell 16.8 34.4 31.2 17.7
Other Ivies 14.0 33.0 31.9 21.1
Other Universities 13.4 35.6 31.8 19.1
Cornell, by Past Donor* Not a donor 17.4 30.7 29.0 22.9
Donor 16.6 36.2 32.3 14.9
Cornell, by Connection Not connected 20.1 31.3 30.6 18.1
Connected 16.2 35.3 31.0 17.4
Cornell, by College** ALS 22.4 36.6 26.1 14.9
AAP 4.5 18.2 13.6 63.6
Arts 14.9 34.0 32.1 19.1
Engineering 17.4 40.4 29.8 12.4
Human Ec 18.8 36.2 39.1 5.8
Hotel 20.0 31.4 31.4 17.1
ILR 18.2 39.4 33.3 9.1
** p<.01, * p<.05 (based on chi‐square)
2009 Alumni Survey Cornell University
Institutional Resarch and Planning Page 69

Not
Row percentages within...
...Maintaining balance between personal life and careerNot
Important at all
Somewhat Important
Very Important Essential
Cornell and Norm Groups Cornell 0.5 6.8 32.3 60.4
Other Ivies 1.1 8.7 29.5 60.7
Other Universities 1.4 7.7 29.0 61.9
Cornell, by Past Donor Not a donor 0.3 5.5 33.4 60.8
Donor 0.6 7.4 31.9 60.1
Cornell, by Connection Not connected 0.0 7.0 33.6 59.4
Connected 0.6 6.5 32.2 60.8
Cornell, by College ALS 0.0 7.5 29.2 63.4
AAP 0.0 4.5 31.8 63.6
Arts 0.5 5.1 33.6 60.7
Engineering 0.6 9.3 37.9 52.2
Human Ec 0.0 4.3 30.4 65.2
Hotel 0.0 2.9 25.7 71.4
ILR 0.0 11.8 47.1 41.2
** p<.01, * p<.05 (based on chi‐square)
Row percentages within...
...Doing work in accordance with philosophy/religionNot
Important at all
Somewhat Important
Very Important Essential
Cornell and Norm Groups* Cornell 32.6 30.7 21.2 15.4
Other Ivies 27.7 31.3 24.5 16.4
Other Universities 26.2 33.4 23.7 16.6
Cornell, by Past Donor* Not a donor 31.5 27.7 20.5 20.2
Donor 33.6 32.3 21.4 12.7
Cornell, by Connection Not connected 32.9 31.5 17.5 18.2
Connected 32.6 30.6 22.0 14.8
Cornell, by College ALS 33.5 31.7 22.4 12.4
AAP 22.7 22.7 18.2 36.4
Arts 31.3 32.7 21.5 14.5
Engineering 41.3 29.4 18.1 11.3
Human Ec 30.4 31.9 26.1 11.6
Hotel 31.4 37.1 22.9 8.6
ILR 38.2 35.3 17.6 8.8
** p<.01, * p<.05 (based on chi‐square)
2009 Alumni Survey Cornell University
Institutional Resarch and Planning Page 70

or
Row percentages within...
How often in your personal or professional life do you interact with these different kinds of people? People from other cultures or countriesRarely or never Seldom Occasionally Often Very Often
Cornell and Norm Groups Cornell 1.7 5.1 17.2 27.4 48.6
Other Ivies 0.7 3.7 17.5 28.4 49.8
Other Universities 1.1 4.7 16.6 27.7 49.9
Cornell, by Past Donor Not a donor 2.0 5.1 17.7 25.9 49.1
Donor 1.5 5.1 17.1 28.1 48.3
Cornell, by Connection* Not connected 3.5 8.4 14.0 21.7 52.4
Connected 1.3 4.4 17.8 28.5 47.9
Cornell, by College ALS 0.6 9.3 18.0 25.5 46.6
AAP 0.0 4.3 30.4 21.7 43.5
Arts 1.9 5.1 12.6 30.8 49.5
Engineering 1.9 3.7 18.6 26.1 49.7
Human Ec 2.9 4.3 18.8 23.2 50.7
Hotel 0.0 2.9 20.0 25.7 51.4
ILR 3.0 3.0 15.2 36.4 42.4
** p<.01, * p<.05 (based on chi‐square)
Row percentages within...
...People of different race/ethnicity than youRarely or Rarelynever Seldom Occasionally Often Very Often
Cornell and Norm Groups* Cornell 0.8 3.4 12.0 28.1 55.6
Other Ivies 0.2 1.9 11.3 29.5 57.1
Other Universities 0.3 2.4 10.9 27.5 59.0
Cornell, by Past Donor Not a donor 0.7 3.4 13.7 28.7 53.6
Donor 0.9 3.5 11.2 27.7 56.7
Cornell, by Connection Not connected 1.4 4.9 12.6 21.0 60.1
Connected 0.7 2.9 12.1 29.7 54.6
Cornell, by College ALS 0.6 5.0 12.4 24.2 57.8
AAP 0.0 4.3 13.0 39.1 43.5
Arts 0.9 2.8 11.2 31.8 53.3
Engineering 0.0 3.7 16.1 26.7 53.4
Human Ec 2.9 2.9 8.7 18.8 66.7
Hotel 0.0 0.0 11.4 34.3 54.3
ILR 0.0 6.1 9.1 39.4 45.5
** p<.01, * p<.05 (based on chi‐square)
2009 Alumni Survey Cornell University
Institutional Resarch and Planning Page 71

Row percentages within...
Row percentages within...
...People with different religion than youRarely or never Seldom Occasionally Often Very Often
Cornell and Norm Groups Cornell 0.4 2.6 8.8 29.1 59.2
Other Ivies 0.3 1.3 8.2 30.4 59.8
Other Universities 0.2 1.7 9.5 30.0 58.6
Cornell, by Past Donor Not a donor 0.7 3.1 9.9 29.5 56.8
Donor 0.2 2.4 8.3 28.8 60.3
Cornell, by Connection Not connected 0.7 1.4 10.5 30.1 57.3
Connected 0.3 2.8 8.1 28.8 59.9
Cornell, by College ALS 0.6 3.1 8.7 25.5 62.1
AAP 0.0 0.0 4.3 39.1 56.5
Arts 0.9 4.2 4.2 30.2 60.4
Engineering 0.0 1.9 12.6 29.6 56.0
Human Ec 0.0 2.9 5.8 21.7 69.6
Hotel 0.0 2.9 2.9 28.6 65.7
ILR 0.0 0.0 6.1 36.4 57.6
** p<.01, * p<.05 (based on chi‐square)
Row percentages within...
...People from different economic background than youRarely or nevernever SeldomSeldom OccasionallyOccasionally OftenOften Very OftenVery Often
Cornell and Norm Groups Cornell 0.5 5.0 22.2 32.4 39.9
Other Ivies 0.7 5.7 22.1 30.6 40.9
Other Universities 0.8 6.5 21.9 30.5 40.2
Cornell, by Past Donor Not a donor 0.7 3.1 22.9 32.9 40.4
Donor 0.4 6.1 21.9 31.8 39.9
Cornell, by Connection Not connected 1.4 5.6 20.4 29.6 43.0
Connected 0.3 5.0 22.4 33.0 39.3
Cornell, by College ALS 0.6 4.3 21.7 28.0 45.3
AAP 0.0 0.0 21.7 39.1 39.1
Arts 0.9 3.8 23.5 31.9 39.9
Engineering 0.0 9.4 25.0 31.9 33.8
Human Ec 0.0 4.3 20.3 31.9 43.5
Hotel 0.0 8.6 22.9 28.6 40.0
ILR 3.0 3.0 21.2 33.3 39.4
** p<.01, * p<.05 (based on chi‐square)
2009 Alumni Survey Cornell University
Institutional Resarch and Planning Page 72

Row percentages within...
...People with different political beliefs values than yoursRarely or never Seldom Occasionally Often Very Often
Cornell and Norm Groups** Cornell 0.4 2.6 19.6 34.1 43.3
Other Ivies 0.7 5.1 20.7 32.7 40.7
Other Universities 0.4 3.6 18.1 34.6 43.3
Cornell, by Past Donor* Not a donor 1.0 1.7 22.5 35.5 39.2
Donor 0.0 3.1 18.0 33.0 45.9
Cornell, by Connection Not connected 0.7 2.1 25.9 32.2 39.2
Connected 0.3 2.6 18.2 34.6 44.3
Cornell, by College ALS 0.0 2.5 19.3 29.2 49.1
AAP 4.3 0.0 30.4 43.5 21.7
Arts 0.5 2.3 16.4 36.9 43.9
Engineering 0.6 1.9 20.5 37.3 39.8
Human Ec 0.0 5.8 26.1 27.5 40.6
Hotel 0.0 0.0 11.4 37.1 51.4
ILR 0.0 3.0 9.1 39.4 48.5
** p<.01, * p<.05 (based on chi‐square)
2009 Alumni Survey Cornell University
Institutional Resarch and Planning Page 73
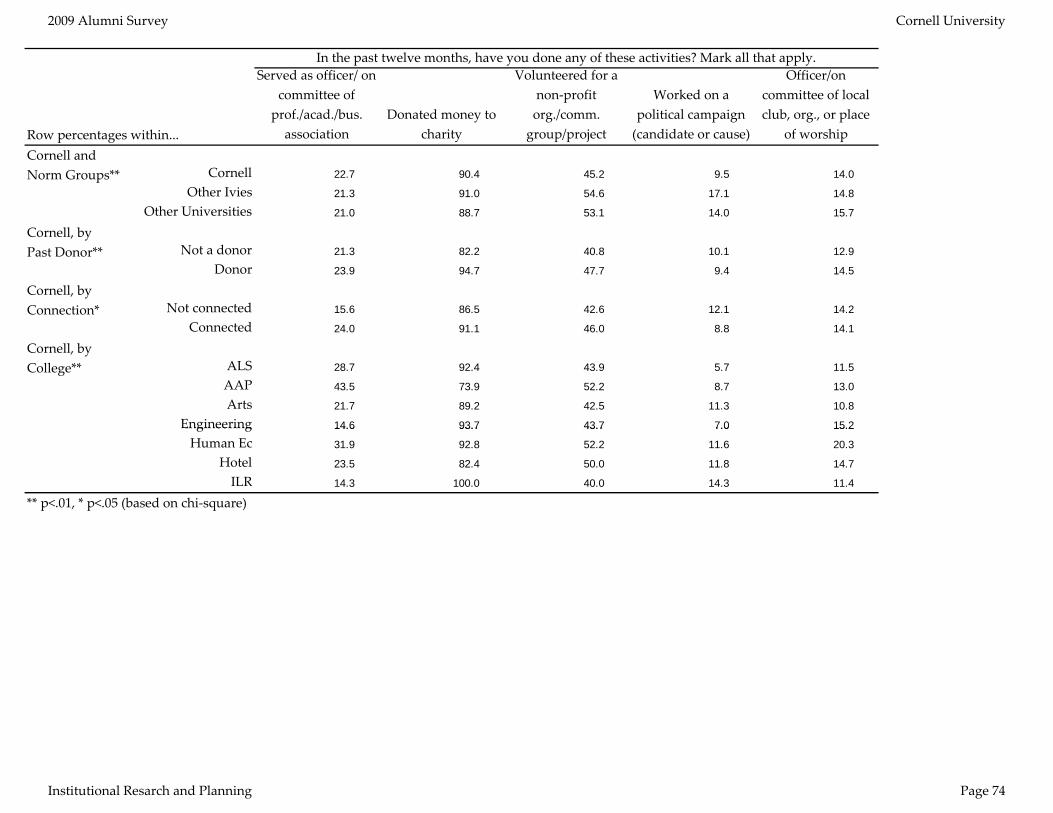
all that apply.
14 93 43 0 15
Row percentages within...
In the past twelve months, have you done any of these activities? MarkServed as
commprof./aassoc
officer/ on ittee of cad./bus. iation
Donated money to charity
Volunteered for anon‐profit org./comm. group/project
Worked on a
political campaign (candidate or cause)
Officer/on committee of local club, org., or place
of worshipCornell and Norm Groups** Cornell 22.7 90.4 45.2 9.5 14.0
Other Ivies 21.3 91.0 54.6 17.1 14.8
Other Universities 21.0 88.7 53.1 14.0 15.7
Cornell, by Past Donor** Not a donor 21.3 82.2 40.8 10.1 12.9
Donor 23.9 94.7 47.7 9.4 14.5
Cornell, by Connection* Not connected 15.6 86.5 42.6 12.1 14.2
Connected 24.0 91.1 46.0 8.8 14.1
Cornell, by College** ALS 28.7 92.4 43.9 5.7 11.5
AAP 43.5 73.9 52.2 8.7 13.0
Arts 21.7 89.2 42.5 11.3 10.8
EnginEngineeringeering 14.6.6 93.7.7 43.7.7 7.0 15.27. .2
Human Ec 31.9 92.8 52.2 11.6 20.3
Hotel 23.5 82.4 50.0 11.8 14.7
ILR 14.3 100.0 40.0 14.3 11.4
** p<.01, * p<.05 (based on chi‐square)
2009 Alumni Survey Cornell University
Institutional Resarch and Planning Page 74

(continued)
3 9 84 .3 18 17
Row percentages within...
In the past twelve months, have you done any of these activities? Mark all that apply.
On agover
board/co
local nment mmission
Boardprof(lo
member non‐it organization cal/national) Voted
Attendedcharitabl
(fundraisinfunction
a e g) Attended a political
meeting or rally Donated bloodCornell and Norm Groups** Cornell 1.5 12.5 90.0 49.2 18.2 14.2
Other Ivies 1.2 13.7 89.9 56.4 27.3 11.8
Other Universities 1.4 11.6 90.1 51.9 23.6 12.9
Cornell, by Past Donor** Not a donor 2.1 10.8 90.2 41.1 18.5 11.8
Donor 1.3 13.4 89.9 54.0 18.4 15.5
Cornell, by Connection* Not connected 2.8 14.2 88.7 38.3 19.1 14.9
Connected 1.3 12.0 90.4 50.9 17.1 14.2
Cornell, by College** ALS 2.5 11.5 93.0 50.3 13.4 12.1
AAP 4.3 34.8 95.7 52.2 26.1 21.7
Arts 0.5 11.3 89.6 45.3 18.4 13.2
EnginEngineeringeering 1.31. 8.98. 84.2.2 44.3 18.4 17.144 .4 .1
Human Ec 1.4 15.9 92.8 60.9 26.1 14.5
Hotel 2.9 11.8 82.4 67.6 14.7 26.5
ILR 2.9 5.7 94.3 62.9 22.9 14.3
** p<.01, * p<.05 (based on chi‐square)
2009 Alumni Survey Cornell University
Institutional Resarch and Planning Page 75

of the following types of groups?
AAP 80 0 0 0.0 50 0 0 15 0 0 10
Row percentages within...
During the past twelve months, have you been involved, beyond making a donation, with any Mark all that apply.
Proacab
ass
fessional, demic, or usiness ociation A labor union
A parenassociationschool gro(e.g., PTA
tsʹ or up )
Anoeduca
related(incl. ass
ther tion‐ group alum. oc.)
unfr
Your dergrad. aternity/ sorority
An adult sports club or league, or an outdoor
activity club
A youth organization (youth sports, scouts, 4 ‐H,
etc.)
A religious organization (other than attending services)
Cornell and Norm Groups** Cornell 57.3 4.5 10.9 31.2 7.8 23.1 7.7 15.4
Other Ivies 54.6 4.1 10.1 34.7 6.6 23.9 7.7 16.5
Other Universities 54.6 3.8 10.3 32.1 7.5 23.9 8.8 20.3
Cornell, by Past Donor* Not a donor 57.1 5.3 10.6 23.3 4.5 24.1 6.9 15.1
Donor 57.9 4.1 11.0 35.4 9.7 22.7 8.2 15.6
Cornell, by Connection** Not connected 45.4 6.5 8.3 21.3 0.9 23.1 7.4 15.7
Connected 59.3 4.1 11.5 33.3 9.3 23.0 7.7 15.3
Cornell, by College** ALS 60.7 5.2 9.6 24.4 5.9 20.7 6.7 11.1
AAP 80.0.0 0.0. 0.0 50.0.0 0.0. 15.0 0.0 10.0.0 . .0
Arts 58.7 3.9 9.5 25.7 7.8 19.0 5.6 14.0
Engineering 44.2 3.1 10.1 31.0 10.9 33.3 7.0 15.5
Human Ec 56.9 6.2 12.3 49.2 10.8 26.2 9.2 21.5
Hotel 67.7 0.0 6.5 38.7 9.7 16.1 3.2 22.6
ILR 77.8 11.1 11.1 48.1 18.5 25.9 7.4 25.9
** p<.01, * p<.05 (based on chi‐square)
2009 Alumni Survey Cornell University
Institutional Resarch and Planning Page 76

with any of the following
ALS 16 9 .3 9 18 32 15College
Row percentages within...
During the past twelve months, have you been involved, beyond making a donation,types of groups? Mark all that apply. (continued)
Neighomtenaor cr
hborhood eowner or nt assoc., ime watch group
A service organizationnot college frat/sor (e.g.,
Lions, Kiwanis)
A charity/so
welfareorganizatprovidinservice
cial ion g s
A sociaor civilorgani
l action rights zation
A ldi
studa
iterary/art scussion/ y group or musical group
Other hobby, investment, or garden club or
society
Any other kind of club or
organizationCornell and Norm Groups** Cornell 17.8 4.6 21.0 8.7 22.0 30.0 21.7
Other Ivies 17.7 4.6 27.9 13.0 27.2 28.6 23.6
Other Universities 19.2 6.2 25.8 9.5 24.3 29.8 24.5
Cornell, by Past Donor* Not a donor 14.7 3.7 20.0 9.8 21.6 34.7 22.0
Donor 19.7 5.2 21.2 8.2 22.2 27.9 21.8
Cornell, by Connection** Not connected 15.7 1.9 24.1 13.0 28.7 30.6 18.5
Connected 18.4 5.1 20.8 7.7 20.6 30.0 22.8
Cornell, by College** ALS 16.3.3 5.95. 19.19 3 5.95. 18.5 32.6 15.6.5 .6 .6
AAP 35.0 15.0 25.0 30.0 35.0 30.0 10.0
Arts 17.9 3.4 21.8 7.8 26.3 27.9 18.4
Engineering 17.8 3.9 19.4 5.4 19.4 34.1 25.6
Human Ec 20.0 3.1 36.9 15.4 23.1 27.7 23.1
Hotel 12.9 3.2 12.9 0.0 9.7 25.8 41.9
ILR 14.8 7.4 22.2 11.1 25.9 11.1 11.1
** p<.01, * p<.05 (based on chi‐square)
2009 Alumni Survey Cornell University
Institutional Resarch and Planning Page 77

Married or
Row percentages within...
In the past twelve months, how often have you done volunteer work?
Not at all
Once or twice in the past
yearEvery few months
About once a month
About once a week
More than once a week
Cornell and Norm Groups Cornell 32.7 34.7 15.4 9.3 4.8 3.1
Other Ivies 28.6 36.5 16.0 10.0 5.6 3.4
Other Universities 28.1 36.7 17.5 8.4 5.4 4.0
Cornell, by Past Donor Not a donor 39.5 30.6 13.6 9.2 4.8 2.4
Donor 29.0 36.8 16.7 9.4 4.8 3.3
Cornell, by Connection Not connected 41.8 26.0 15.1 8.2 4.8 4.1
Connected 30.9 36.2 15.5 9.7 5.0 2.7
Cornell, by College ALS 32.9 34.2 15.5 10.6 3.1 3.7
AAP 30.4 21.7 13.0 17.4 8.7 8.7
Arts 31.9 37.6 15.5 8.0 4.2 2.8
Engineering 36.0 37.3 11.8 5.0 6.8 3.1
Human Ec 23.2 37.7 17.4 15.9 2.9 2.9
Hotel 23.5 38.2 20.6 11.8 2.9 2.9
ILR 37.1 25.7 17.1 14.3 0.0 5.7
** p<.01, * p<.05 (based on chi‐square)
Row percentages within...
What is your current personal status?Married or living with partner Widowed Separated Divorced
Single/none of the above
Cornell and Norm Groups* Cornell 73.4 0.0 0.8 1.3 24.5
Other Ivies 70.7 0.0 0.5 1.1 27.7
Other Universities 68.4 0.0 0.4 1.5 29.7
Cornell, by Past Donor Not a donor 72.1 0.0 1.0 1.3 25.5
Donor 74.1 0.0 0.7 1.3 23.9
Cornell, by Connection Not connected 74.1 0.0 0.7 1.4 23.8
Connected 73.6 0.0 0.9 1.3 24.2
Cornell, by College ALS 75.5 0.0 1.2 1.8 21.5
AAP 60.9 0.0 0.0 0.0 39.1
Arts 64.6 0.0 0.9 1.4 33.0
Engineering 73.6 0.0 0.6 0.6 25.2
Human Ec 76.8 0.0 0.0 0.0 23.2
Hotel 83.3 0.0 2.8 2.8 11.1
ILR 85.7 0.0 0.0 0.0 14.3
** p<.01, * p<.05 (based on chi‐square)
2009 Alumni Survey Cornell University
Institutional Resarch and Planning Page 78

0 2 3 5 6 12 17 23 Row percentages within...
Row percentages within...How many children do you have?
None One Two Three Four or MoreCornell and Norm Groups** Cornell 57.3 23.1 16.3 2.8 0.5
Other Ivies 64.6 21.6 11.7 1.5 0.6
Other Universities 64.4 19.3 13.3 2.2 0.7
Cornell, by Past Donor Not a donor 59.1 22.6 13.9 4.1 0.3
Donor 56.2 23.4 17.8 2.0 0.5
Cornell, by Connection Not connected 59.3 24.8 13.1 1.4 1.4
Connected 56.7 22.7 17.3 3.1 0.3
Cornell, by College ALS 55.8 25.2 16.6 1.8 0.6
AAP 78.3 21.7 0.0 0.0 0.0
Arts 67.0 19.3 11.8 1.9 0.0
Engineering 58.0 21.0 16.7 3.7 0.6
Human Ec 59.4 23.2 15.9 1.4 0.0
Hotel 38.9 38.9 16.7 5.6 0.0
ILR 34.3 37.1 25.7 2.9 0.0
** p<.01, * p<.05 (based on chi‐square)
Row percentages within...
Please indicate if you have any children in each of these age ranges. Mark all that apply.
Children 0‐2Children Children 3‐5Children Children 6‐12ChildrenChildren 13‐
17Children 18‐
23Children 24 or olderor older
Cornell and Norm Groups** Cornell 83.1 33.5 11.2 2.2 1.6 1.6
Other Ivies 92.6 25.7 4.8 0.4 0.0 0.3
Other Universities 85.0 32.0 9.3 1.9 0.6 0.4
Cornell, by Past Donor Not a donor 81.1 31.1 15.6 2.5 2.5 2.5
Donor 84.2 34.6 8.8 2.1 0.8 1.3
Cornell, by Connection Not connected 90.0 30.0 5.0 0.0 3.3 3.3
Connected 81.5 34.2 12.1 2.7 1.3 1.3
Cornell, by College ALS 84.0 32.0 13.3 1.3 0.0 0.0
AAP 100.0 0.0 0.0 0.0 0.0 0.0
Arts 90.0 31.4 5.7 1.4 0.0 0.0
Engineering 88.2 38.2 10.3 0.0 0.0 0.0
Human Ec 85.7 25.0 7.1 7.1 0.0 0.0
Hotel 86.4 36.4 9.1 0.0 0.0 0.0
ILR 91.3 30.4 8.7 0.0 0.0 0.0
** p<.01, * p<.05 (based on chi‐square)
2009 Alumni Survey Cornell University
Institutional Resarch and Planning Page 79

reasons? Mark all that
Ec 23 13 0 0 5 23 1
Row percentages within...
Since graduating from college, have you not worked for an extended period for any of the followingapply.
Maternitylea
/paternity ve Caring for children
Caring for other family members
For your ownhealth
Unemployed/looking for work
Planning Starting a business
Cornell and Norm Groups C** ornell 19.1 10.7 1.4 3.7 26.9 4.3
Other Ivies 16.3 6.7 2.0 3.2 24.7 6.0
Other Universities 17.1 8.8 2.4 3.3 26.1 7.0
Cornell, by Past Donor Not a donor 14.9 10.3 1.5 3.1 30.3 3.8
Donor 21.4 10.7 1.3 4.1 25.1 4.6
Cornell, by Connection Not connected 16.8 9.2 1.5 6.1 30.5 2.3
Connected 19.3 11.4 1.4 3.3 25.7 4.7
Cornell, by College** ALS 16.6 7.9 0.0 0.0 23.2 2.0
AAP 6.3 6.3 0.0 12.5 37.5 12.5
Arts 19.4 12.2 3.9 4.4 26.1 2.8
Engineering 13.7 5.0 0.0 1.4 29.5 5.0
HumHumanan Ec 23.7.7 13.6.6 0.0. 8.58. 23.7 5.1.7 5.
Hotel 35.5 19.4 0.0 6.5 16.1 6.5
ILR 28.0 16.0 0.0 8.0 24.0 4.0
** p<.01, * p<.05 (based on chi‐square)
2009 Alumni Survey Cornell University
Institutional Resarch and Planning Page 80

for any of the following
Arts 9 3 18 4 4 40
Row percentages within...
Since graduating from college, have you not worked for an extended period reasons? Mark all that apply. (continued)
Workinpersona(book, ende
g on a l project artistic avor)
Voluengagun
nteering or ing in other paid work
Traveling or just taking time off Other reasons
Besides school time, always
worked at least half time
Cornell and Norm Groups C** ornell 3.6 6.3 16.5 3.4 44.4
Other Ivies 7.8 7.8 24.5 4.7 43.2
Other Universities 5.9 6.3 21.7 4.1 42.8
Cornell, by Past Donor Not a donor 4.6 6.5 18.4 5.0 41.0
Donor 2.8 6.1 15.7 2.6 46.4
Cornell, by Connection Not connected 4.6 7.6 15.3 6.1 42.0
Connected 3.3 5.7 16.4 2.8 45.9
Cornell, by College** ALS 3.3 4.0 10.6 4.0 53.6
AAP 12.5 12.5 18.8 0.0 37.5
Arts 3.93. 8.38. 18.3.3 4.4 40.6. .6
Engineering 1.4 1.4 18.0 3.6 47.5
Human Ec 0.0 6.8 13.6 1.7 45.8
Hotel 0.0 3.2 25.8 6.5 45.2
ILR 4.0 4.0 8.0 0.0 32.0
** p<.01, * p<.05 (based on chi‐square)
2009 Alumni Survey Cornell University
Institutional Resarch and Planning Page 81

No HS Grad or
Row percentages within...
About how many years altogether were you not working for pay at least half time?
None Less than 1 yr 1‐2 yrs 3‐5 yrsMore than five years
Cornell and Norm Groups** Cornell 30.1 46.5 16.2 4.8 2.4
Other Ivies 43.1 34.2 16.1 4.5 2.1
Other Universities 41.8 36.0 14.8 5.0 2.4
Cornell, by Past Donor Not a donor 26.4 47.1 17.8 6.7 1.9
Donor 32.6 45.8 15.6 3.6 2.5
Cornell, by Connection Not connected 25.8 46.4 16.5 8.2 3.1
Connected 31.4 45.5 16.7 4.1 2.4
Cornell, by College* ALS 34.3 51.0 8.8 4.9 1.0
AAP 45.0 30.0 20.0 5.0 0.0
Arts 27.2 43.5 19.0 5.4 4.8
Engineering 26.0 56.7 15.4 1.0 1.0
Human Ec 32.6 52.2 6.5 8.7 0.0
Hotel 19.0 42.9 33.3 4.8 0.0
ILR 39.3 42.9 10.7 0.0 7.1
** p<.01, * p<.05 (based on chi‐square)
Row percentages within...
Motherʹs highest level of educationNo HS diploma HS diploma Some college Assoc degree Bach degree
Grad or prof profdegree
Cornell and Norm Groups** Cornell 2.9 11.8 7.4 8.4 30.7 38.8
Other Ivies 2.4 8.6 6.1 5.6 30.1 47.2
Other Universities 2.1 11.4 8.1 6.4 34.8 37.3
Cornell, by Past Donor Not a donor 3.0 16.2 7.4 7.8 30.4 35.1
Donor 2.8 9.2 7.6 8.9 31.0 40.6
Cornell, by Connection Not connected 6.1 14.2 6.8 9.5 30.4 33.1
Connected 2.2 11.1 7.5 8.1 31.1 40.0
Cornell, by College ALS 3.1 15.4 3.1 8.6 33.3 36.4
AAP 13.6 9.1 4.5 4.5 31.8 36.4
Arts 2.8 10.8 8.5 5.6 33.8 38.5
Engineering 1.9 9.3 9.9 8.6 30.9 39.5
Human Ec 2.9 8.7 5.8 7.2 23.2 52.2
Hotel 5.6 5.6 8.3 11.1 36.1 33.3
ILR 0.0 11.4 11.4 11.4 20.0 45.7
** p<.01, * p<.05 (based on chi‐square)
2009 Alumni Survey Cornell University
Institutional Resarch and Planning Page 82

Row percentages within...
Fatherʹs highest level of educationNo HS diploma HS diploma Some college Assoc degree Bach degree
Grad or prof degree
Cornell and Norm Groups** Cornell 3.0 8.5 6.8 3.5 25.3 53.0
Other Ivies 2.2 5.9 4.5 2.1 19.0 66.3
Other Universities 2.3 7.1 5.9 3.3 25.3 56.0
Cornell, by Past Donor Not a donor 3.8 11.3 7.2 3.4 25.8 48.5
Donor 2.4 7.1 6.5 3.5 25.3 55.1
Cornell, by Connection Not connected 4.1 10.2 3.4 3.4 25.9 53.1
Connected 2.7 7.9 7.3 3.6 25.1 53.4
Cornell, by College ALS 3.1 12.5 5.6 5.0 26.3 47.5
AAP 4.8 14.3 0.0 0.0 14.3 66.7
Arts 2.4 6.2 8.1 2.9 23.8 56.7
Engineering 3.1 5.0 4.3 3.7 29.2 54.7
Human Ec 1.4 5.8 8.7 0.0 27.5 56.5
Hotel 8.3 0.0 11.1 2.8 22.2 55.6
ILR 2.9 11.4 2.9 2.9 25.7 54.3
** p<.01, * p<.05 (based on chi‐square)
Row percentages within...
What is your citizenship? Mark all that apply.
United States citizen
U.S. U.S.permanent resident
Non‐United States citizen
Cornell and Norm Groups** Cornell 96.7 2.4 2.8
Other Ivies 94.0 2.5 5.6
Other Universities 95.5 1.6 4.1
Cornell, by Past Donor* Not a donor 95.6 2.4 4.8
Donor 97.4 2.4 1.7
Cornell, by Connection Not connected 95.2 3.4 4.1
Connected 97.2 2.1 2.5
Cornell, by College** ALS 98.8 1.2 1.2
AAP 95.7 0.0 8.7
Arts 98.6 0.9 3.3
Engineering 92.6 6.1 2.5
Human Ec 97.1 1.4 1.4
Hotel 94.1 5.9 5.9
ILR 100.0 0.0 2.9
** p<.01, * p<.05 (based on chi‐square)
2009 Alumni Survey Cornell University
Institutional Resarch and Planning Page 83

Row percentages within...
If you are a U.S. citizen, were you born a citizen of
the United States or naturalized?
Born a US citizen
Naturalized citizen
Cornell and Norm Groups Cornell 89.0 11.0
Other Ivies 91.6 8.4
Other Universities 91.3 8.7
Cornell, by Past Donor Not a donor 87.5 12.5
Donor 89.9 10.1
Cornell, by Connection Not connected 87.7 12.3
Connected 89.4 10.6
Cornell, by College ALS 91.9 8.1
AAP 77.3 22.7
Arts 87.9 12.1
Engineering 86.7 13.3
Human Ec 89.4 10.6
Hotel 93.5 6.5
ILR 94.1 5.9
** p<.01, * p<.05 (based on chi‐square)
Row percentages within...
What is your gender?
Female MaleTransgender/
otherCornell and Norm Groups Cornell 55.2 44.6 0.2
Other Ivies 52.5 47.4 0.1
Other Universities 53.2 46.8 0.0
Cornell, by Past Donor Not a donor 60.6 39.1 0.3
Donor 52.7 47.2 0.2
Cornell, by Connection Not connected 55.1 44.2 0.7
Connected 54.9 45.0 0.1
Cornell, by College** ALS 56.8 43.2 0.0
AAP 39.1 60.9 0.0
Arts 48.6 50.9 0.5
Engineering 71.8 28.2 0.0
Human Ec 36.2 63.8 0.0
Hotel 47.2 52.8 0.0
ILR 52.9 47.1 0.0
** p<.01, * p<.05 (based on chi‐square)
2009 Alumni Survey Cornell University
Institutional Resarch and Planning Page 84

Thinking back to when you started college how would you say your
Row percentages within...
What is your race or ethnic group? Mark all that apply.American Indian or Alaskan Native Asian
Black or African American
Hispanic or Latino
Native Hawaiian or Other Pacific Islander White
Cornell and Norm Groups** Cornell 0.6 14.0 2.2 8.7 1.9 77.0
Other Ivies 1.1 19.5 5.8 5.9 0.4 74.1
Other Universities 0.9 19.8 6.1 6.8 0.8 70.6
Cornell, by Past Donor* Not a donor 0.0 16.2 1.7 9.3 3.1 73.1
Donor 0.9 12.4 2.4 8.5 1.3 79.3
Cornell, by Connection Not connected 0.0 19.4 2.1 9.7 1.4 70.8
Connected 0.8 12.3 2.3 8.6 2.1 78.6
Cornell, by College** ALS 0.0 10.6 2.5 10.0 3.8 78.1
AAP 0.0 18.2 9.1 13.6 9.1 59.1
Arts 0.5 14.3 3.3 8.1 1.0 76.7
Engineering 0.6 19.1 0.0 10.2 1.9 72.6
Human Ec 1.5 16.2 2.9 2.9 0.0 80.9
Hotel 0.0 16.7 2.8 16.7 2.8 72.2
ILR 2.9 2.9 0.0 0.0 0.0 97.1
** p<.01, * p<.05 (based on chi‐square)
Row percentages within...
Thinking back to when you started college, how would you say your , familyʹs standard of living compared to all American families?
Far below average
Below average Average
Above average
Far above average
Cornell and Norm Groups** Cornell 2.6 13.3 29.5 46.0 8.6
Other Ivies 2.1 8.5 22.9 50.5 16.1
Other Universities 2.2 11.0 28.9 47.3 10.7
Cornell, by Past Donor Not a donor 2.4 13.9 33.1 43.9 6.8
Donor 2.6 13.3 27.3 47.3 9.6
Cornell, by Connection Not connected 4.1 14.4 35.6 37.7 8.2
Connected 2.1 13.3 28.2 47.5 9.0
Cornell, by College ALS 0.6 11.7 39.3 45.4 3.1
AAP 4.3 13.0 26.1 39.1 17.4
Arts 2.4 14.6 23.6 50.0 9.4
Engineering 3.7 13.0 26.7 47.2 9.3
Human Ec 2.9 7.2 30.4 46.4 13.0
Hotel 2.9 5.7 22.9 57.1 11.4
ILR 2.9 11.8 26.5 52.9 5.9
** p<.01, * p<.05 (based on chi‐square)
2009 Alumni Survey Cornell University
Institutional Resarch and Planning Page 85

Not worried Not too
Row percentages within...
How would you place yourself today?Far below average
Below average Average
Above average
Far above average
Cornell and Norm Groups** Cornell 0.5 2.1 24.5 62.2 10.7
Other Ivies 0.2 2.9 19.4 59.5 18.0
Other Universities 0.4 3.1 22.0 60.3 14.3
Cornell, by Past Donor** Not a donor 0.3 2.0 35.9 55.6 6.1
Donor 0.6 2.2 18.2 65.8 13.2
Cornell, by Connection* Not connected 1.4 1.4 31.5 59.4 6.3
Connected 0.3 1.9 23.1 62.6 12.0
Cornell, by College ALS 0.6 1.9 26.7 60.2 10.6
AAP 0.0 0.0 22.7 72.7 4.5
Arts 0.0 2.8 26.5 59.2 11.4
Engineering 0.0 0.6 15.6 72.5 11.3
Human Ec 1.4 0.0 26.1 62.3 10.1
Hotel 0.0 0.0 13.9 69.4 16.7
ILR 0.0 0.0 12.1 63.6 24.2
** p<.01, * p<.05 (based on chi‐square)
Row percentages within...
How worried are you about not being able to maintain the standard of living you now enjoy?
Not worried at all
Not too worried
Moderately Moderatelyworried Very worried
Cornell and Norm Groups** Cornell 9.4 44.0 37.8 8.8
Other Ivies 12.8 46.9 34.3 6.0
Other Universities 15.3 47.1 31.2 6.4
Cornell, by Past Donor Not a donor 10.5 39.5 39.5 10.5
Donor 8.8 46.7 36.8 7.7
Cornell, by Connection Not connected 9.7 44.8 35.2 10.3
Connected 9.4 44.1 37.9 8.5
Cornell, by College* ALS 10.0 40.0 41.9 8.1
AAP 4.3 30.4 52.2 13.0
Arts 8.5 50.5 35.4 5.7
Engineering 9.8 53.4 31.9 4.9
Human Ec 13.0 37.7 39.1 10.1
Hotel 8.3 25.0 47.2 19.4
ILR 0.0 44.1 52.9 2.9
** p<.01, * p<.05 (based on chi‐square)
2009 Alumni Survey Cornell University
Institutional Resarch and Planning Page 86

Hotel 4 1 3 1 12 28 12 .5 12 1 1 0 0
Row percentages within...
Your individual earnings before taxes in 2008
NoneUnder$25,000
$25,00$49,00
0 ‐ 0
$50,$74
000 ‐ ,999
$7$5,000 ‐ 99,999
$100,000 ‐$124,999
$125,00$149,9
0 ‐ 99
$150$199
,000 ‐ ,999
$200,000 ‐ $249,000
$250,000 ‐ $499,999
More than $500,000
Cornell and Norm Groups** Cornell 3.1 5.1 11.9 20.0 18.7 12.7 9.5 8.3 3.2 6.4 1.2
Other Ivies 3.6 5.5 13.2 20.9 13.1 11.3 7.5 9.1 5.6 7.3 2.9
Other Universities 3.0 7.7 14.3 19.7 14.9 11.7 7.7 8.2 4.1 6.3 2.3
Cornell, by Past Donor** Not a donor 3.3 7.6 14.5 22.9 21.5 8.4 9.8 5.1 2.5 4.0 0.4
Donor 3.0 3.8 10.2 18.4 17.0 15.2 9.4 9.8 3.6 7.8 1.6
Cornell, by Connection Not connected 3.0 8.2 11.2 26.9 16.4 9.7 9.0 3.7 3.7 6.0 2.2
Connected 3.2 4.7 11.9 18.3 19.1 13.3 9.8 9.3 3.2 6.1 1.0
Cornell, by College** ALS 2.0 5.2 13.1 20.3 16.3 11.1 13.1 9.8 3.9 3.9 1.3
AAP 0.0 0.0 13.6 27.3 27.3 18.2 4.5 0.0 0.0 4.5 4.5
Arts 3.1 6.3 12.6 25.7 14.1 13.6 7.9 8.9 1.0 6.3 0.5
Engineering 1.3 1.3 7.9 9.9 25.8 21.2 11.9 9.3 4.0 6.0 1.3
Human Ec 3.2 6.3 12.7 25.4 20.6 6.3 11.1 6.3 3.2 3.2 1.6
Hotel 9.49. 3.13. 3.1. 12.5.5 28.1.1 12.5.5 1212.5 12.5 3.1 3.1 0.0.5 3. 3. .
ILR 3.3 10.0 3.3 6.7 20.0 0.0 10.0 10.0 6.7 30.0 0.0
** p<.01, * p<.05 (based on chi‐square)
2009 Alumni Survey Cornell University
Institutional Resarch and Planning Page 87

Hotel 4 0 0 0 0 0 0 9 13 .3 17 17 24 9
Row percentages within...
Total household income before taxes in 2008
NoneUnder$25,000
$25,00$49,00
0 ‐ 0
$50,$74
000 ‐ ,999
$7$5,000 ‐ 99,999
$100,000 ‐$124,999
$125,00$149,9
0 ‐ 99
$150$199
,000 ‐ ,999
$200,000 ‐ $249,000
$250,000 ‐ $499,999
More than $500,000
Cornell and Norm Groups** Cornell 0.1 1.1 4.1 9.5 15.6 11.8 11.4 15.3 12.4 14.7 3.9
Other Ivies 0.7 1.8 6.5 10.9 10.5 12.0 9.8 13.7 11.2 16.0 6.9
Other Universities 1.0 2.2 6.8 10.8 10.7 14.1 10.2 14.8 11.0 13.7 4.6
Cornell, by Past Donor** Not a donor 0.0 1.6 6.9 12.6 24.8 8.1 11.8 12.6 11.0 8.5 2.0
Donor 0.2 0.8 2.7 7.8 11.0 13.7 11.2 16.5 13.1 18.1 4.9
Cornell, by Connection Not connected 0.0 1.6 3.3 12.3 16.4 9.8 14.8 13.1 9.0 13.9 5.7
Connected 0.2 1.0 4.5 8.9 14.9 12.5 10.8 15.6 13.2 15.1 3.3
Cornell, by College** ALS 0.0 2.1 4.2 9.0 15.3 11.8 13.2 16.0 9.0 15.3 4.2
AAP 0.0 0.0 11.1 11.1 11.1 11.1 16.7 16.7 11.1 0.0 11.1
Arts 0.0 1.2 4.2 16.1 14.3 11.3 10.1 12.5 12.5 16.1 1.8
Engineering 0.0 0.7 3.4 2.7 14.3 15.0 11.6 22.4 15.0 10.9 4.1
Human Ec 0.0 0.0 0.0 13.8 19.0 10.3 15.5 10.3 15.5 13.8 1.7
Hotel 3.43. 0.0. 0.0. 0.0. 6.96. 13.8.8 1010.3 17.2 17.2 24.1 6.9.2 .2 .1 6.
ILR 0.0 0.0 0.0 6.7 6.7 6.7 10.0 6.7 16.7 36.7 10.0
** p<.01, * p<.05 (based on chi‐square)
2009 Alumni Survey Cornell University
Institutional Resarch and Planning Page 88

Cornell by
Row percentages within...
How much interest would you have in attending the following types of alumni/ae events? Professional networking event
Not at all 2 3 4 A great dealCornell and Norm Groups Cornell 13.2 19.2 22.8 24.7 20.1
Cornell, by Past Donor* Not a donor 19.1 19.1 19.1 25.1 17.5
Donor 10.3 19.3 24.7 24.3 21.3
Cornell, by Connection** Not connected 26.4 16.5 27.3 17.4 12.4
Connected 10.8 20.0 21.7 25.8 21.7
Cornell, by College ALS 15.1 23.0 23.0 19.4 19.4
AAP 4.8 9.5 14.3 42.9 28.6
Arts 17.8 16.8 25.4 24.3 15.7
Engineering 9.9 22.4 19.7 27.0 21.1
Human Ec 12.5 15.6 17.2 28.1 26.6
Hotel 6.5 9.7 16.1 35.5 32.3
ILR 3.3 13.3 33.3 23.3 26.7
** p<.01, * p<.05 (based on chi‐square)
Row percentages within......Community service project
Not at all 2 3 4 A great dealCornell and Norm Groups Cornell 14.0 21.6 31.3 21.6 11.4
Cornell, by, Past Donor* Not a donor 19.0 23.8 29.0 19.4 8.9
Donor 11.6 20.8 32.0 22.8 12.8
Cornell, by Connection Not connected 19.2 25.0 30.0 15.8 10.0
Connected 12.9 21.4 31.2 22.9 11.7
Cornell, by College* ALS 17.4 23.2 29.7 15.9 13.8
AAP 0.0 23.8 28.6 38.1 9.5
Arts 12.5 21.7 33.2 23.4 9.2
Engineering 18.5 22.5 33.1 18.5 7.3
Human Ec 6.3 14.3 27.0 27.0 25.4
Hotel 16.1 16.1 19.4 38.7 9.7
ILR 6.7 20.0 40.0 23.3 10.0
** p<.01, * p<.05 (based on chi‐square)
2009 Alumni Survey Cornell University
Institutional Resarch and Planning Page 89

a 17 28 22 21 9 9Past Donor
Row percentages within......Sports event
Not at all 2 3 4 A great dealCornell and Norm Groups Cornell 24.9 19.8 26.4 17.9 11.0
Cornell, by Past Donor** Not a donor 36.3 20.3 21.9 13.9 7.6
Donor 19.1 19.3 28.7 20.0 12.8
Cornell, by Connection** Not connected 48.3 21.7 15.0 10.0 5.0
Connected 19.9 19.6 28.9 19.3 12.3
Cornell, by College ALS 20.9 19.4 25.9 18.7 15.1
AAP 42.9 28.6 19.0 9.5 0.0
Arts 26.3 24.2 22.0 17.2 10.2
Engineering 22.7 18.0 32.0 20.0 7.3
Human Ec 18.8 15.6 28.1 23.4 14.1
Hotel 22.6 6.5 38.7 12.9 19.4
ILR 20.0 13.3 26.7 20.0 20.0
** p<.01, * p<.05 (based on chi‐square)
Row percentages within......Cornell faculty speaker presentation
Not at all 2 3 4 A great dealCornell and Norm Groups Cornell 15.0 26.1 25.0 24.8 9.0
Cornell, by Past Donor Not a donorNot donor 17.5.5 28.8.8 22.2.2 21.7.7 9.9.
Donor 14.0 24.2 26.8 26.5 8.4
Cornell, by Connection Not connected 20.0 30.5 16.8 25.3 7.4
Connected 13.9 25.4 26.6 24.9 9.3
Cornell, by College ALS 19.3 23.7 18.4 31.6 7.0
AAP 11.8 29.4 11.8 47.1 0.0
Arts 11.7 22.7 33.1 23.4 9.1
Engineering 21.2 25.4 22.9 22.9 7.6
Human Ec 11.5 26.2 36.1 16.4 9.8
Hotel 9.5 28.6 38.1 9.5 14.3
ILR 9.1 40.9 18.2 18.2 13.6
** p<.01, * p<.05 (based on chi‐square)
2009 Alumni Survey Cornell University
Institutional Resarch and Planning Page 90

a 17 20 30 22 1Past Donor
Row percentages within......Family oriented activity, such as a picnic at a park or a museum visitNot at all 2 3 4 A great deal
Cornell and Norm Groups Cornell 24.2 23.8 24.7 18.8 8.5
Cornell, by Past Donor Not a donor 24.1 25.9 23.1 21.7 5.2
Donor 24.3 22.1 25.8 17.4 10.4
Cornell, by Connection Not connected 26.6 23.4 24.5 20.2 5.3
Connected 23.4 23.4 25.1 19.1 9.0
Cornell, by College ALS 26.7 17.2 25.9 19.8 10.3
AAP 23.5 29.4 35.3 5.9 5.9
Arts 27.4 23.6 21.0 22.3 5.7
Engineering 21.5 25.6 23.1 18.2 11.6
Human Ec 23.7 27.1 25.4 18.6 5.1
Hotel 26.1 26.1 26.1 13.0 8.7
ILR 20.8 12.5 37.5 16.7 12.5
** p<.01, * p<.05 (based on chi‐square)
Row percentages within......Music, arts or other cultural event
Not at all 2 3 4 A great dealCornell and Norm Groups Cornell 18.0 17.9 32.5 23.0 8.6
Cornell, by Past Donor Not a donorNot donor 17.7.7 20.6.6 30.1.1 22.5.5 9.19.
Donor 18.1 16.4 34.0 23.0 8.6
Cornell, by Connection Not connected 21.4 21.4 25.5 26.5 5.1
Connected 17.8 17.4 33.2 22.3 9.4
Cornell, by College ALS 14.6 18.7 33.3 22.0 11.4
AAP 18.8 18.8 18.8 31.3 12.5
Arts 16.4 19.1 30.3 28.3 5.9
Engineering 20.5 19.7 31.6 20.5 7.7
Human Ec 19.7 16.4 31.1 24.6 8.2
Hotel 21.7 8.7 43.5 17.4 8.7
ILR 11.5 7.7 46.2 23.1 11.5
** p<.01, * p<.05 (based on chi‐square)
2009 Alumni Survey Cornell University
Institutional Resarch and Planning Page 91

ILR 36 8 10 5 15 8 21 1 15 8
Row percentages within...
Which of the following best describes your response to the ballot for Cornell Alumni/ae Trustees?
I return a ballot with my vote.
I do not vote because I do not have enough
information to make an informed choice.
I do not vote because I do not think the cadidates
represent my interests.
I do not vote because I do not have an interest in
this decision.
I do not recall receiving a ballot/
notification.Cornell and Norm Groups Cornell 32.9 22.6 10.3 25.9 8.2
Cornell, by Past Donor Not a donor 37.3 18.4 7.6 27.8 8.9
Donor 30.8 24.3 11.8 25.2 7.8
Cornell, by Connection Not connected 32.4 14.7 13.2 29.4 10.3
Connected 32.8 23.9 10.0 25.1 8.2
Cornell, by College ALS 24.2 27.4 10.5 26.3 11.6
AAP 23.1 30.8 7.7 15.4 23.1
Arts 38.7 22.7 7.6 25.2 5.9
Engineering 33.7 16.3 10.9 29.3 9.8
Human Ec 29.5 20.5 13.6 36.4 0.0
Hotel 33.3 38.9 11.1 11.1 5.6
ILR 36 8. 10 5. 15 8. 21 1. 15 8.
** p<.01, * p<.05 (based on chi‐square)
Row percentages within...
How important is it for you to contribute financially to Cornell?
Not at all 2 3 4Very
importantCornell and Norm Groups Cornell 18.7 22.3 31.5 16.0 11.5
Cornell, by Past Donor* Not a donor 25.0 25.0 26.9 16.3 6.9
Donor 16.1 20.3 33.9 16.1 13.6
Cornell, by Connection* Not connected 26.0 31.2 24.7 11.7 6.5
Connected 17.8 20.6 32.5 16.4 12.9
Cornell, by College ALS 16.2 23.2 29.3 19.2 12.1
AAP 15.4 15.4 38.5 23.1 7.7
Arts 24.4 22.8 27.6 14.2 11.0
Engineering 21.7 18.9 28.3 20.8 10.4
Human Ec 13.5 23.1 40.4 11.5 11.5
Hotel 0.0 22.2 50.0 16.7 11.1
ILR 0.0 15.8 52.6 26.3 5.3
** p<.01, * p<.05 (based on chi‐square)
2009 Alumni Survey Cornell University
Institutional Resarch and Planning Page 92

Hotel 26 7 26 7 46 7
Row percentages within...
If you have contributed financially to Cornell, which one of the following factors has most influenced your decision?
Cornell gave me an
exceptional education.
I received financial aid while I was a
Cornell student.
I believe in the mission
of the university.
Cornell needs my financial support to ensure an excellent
education for future Cornell students.
Cornell keeps me informed and involved
as an alumnus/a.
Cornell and Norm Groups Cornell 37.9 17.7 18.2 20.0 6.2
Cornell, by Past Donor
Donor 37.9 17.1 18.4 19.8 6.8
Cornell, by Connection Not connected 35.1 14.0 17.5 22.8 10.5
Connected 39.3 18.3 17.4 19.2 5.7
Cornell, by College* ALS 39.5 18.5 13.6 19.8 8.6
AAP 62.5 0.0 0.0 37.5 0.0
Arts 37.9 13.7 15.8 30.5 2.1
Engineering 29.1 20.3 19.0 16.5 15.2
Human Ec 43.6 17.9 12.8 20.5 5.1
Hotel 26 7. 26 7. 46 7. 0 00.0 0 00.0
ILR 40.0 25.0 10.0 25.0 0.0
** p<.01, * p<.05 (based on chi‐square)
2009 Alumni Survey Cornell University
Institutional Resarch and Planning Page 93

** 01 * 05 (base on square)
Row percentages within...
If you have not contributed financially to Cornell, which one of the following factors has most influenced your decision?
I am currently not
able to contribute
financially to Cornell.
I did not have a positive
experience at Cornell.
I think Cornell has enough money
I disagree with some of the current policies or direction of
the University.
I place a higher
priority on giving to other non‐profit orgs.
Cornell and Norm Groups Cornell 25.1 13.2 23.9 21.1 16.8
Cornell, by Past Donor Not a donor 31.4 14.4 18.3 16.3 19.6
Cornell, by Connection Not connected 25.7 14.9 25.7 20.3 13.5
Connected 25.6 13.0 22.4 21.8 17.2
Cornell, by College ALS 17.8 15.1 24.7 21.9 20.5
AAP 20.0 10.0 10.0 50.0 10.0
Arts 25.8 14.4 20.6 22.7 16.5
Engineering 13.8 13.8 32.2 21.8 18.4
Human Ec 46.4 17.9 10.7 10.7 14.3
Hotel 15.8 10.5 31.6 26.3 15.8
ILR 50.0 6.3 25.0 6.3 12.5
** p< 01 * p< 05 (based on chi square) p<. , p<. d chi‐
Row percentages within...
How much interest do you have in receiving information from Cornell on each of the following topics? Faculty research updates
None at all 2 3 4 A great dealCornell and Norm Groups Cornell 19.0 24.3 30.3 18.6 7.8
Cornell, by Past Donor Not a donor 20.2 24.9 28.9 17.9 8.1
Donor 18.8 23.9 31.3 18.8 7.3
Cornell, by Connection Not connected 21.3 28.1 28.1 13.5 9.0
Connected 19.2 24.0 29.6 19.9 7.2
Cornell, by College* ALS 14.7 25.3 26.3 26.3 7.4
AAP 6.3 56.3 37.5 0.0 0.0
Arts 19.0 23.4 26.3 17.5 13.9
Engineering 23.7 23.7 34.7 12.7 5.1
Human Ec 23.9 21.7 23.9 26.1 4.3
Hotel 11.5 19.2 50.0 15.4 3.8
ILR 25.0 10.0 45.0 15.0 5.0
** p<.01, * p<.05 (based on chi‐square)
2009 Alumni Survey Cornell University
Institutional Resarch and Planning Page 94

Cornell by
Row percentages within...
...State of the University information (e.g., Presidentʹs address, Universityʹs financial standing, priority initiatives)
None at all 2 3 4 A great dealCornell and Norm Groups Cornell 15.3 19.9 33.4 23.4 8.1
Cornell, by Past Donor Not a donor 18.8 21.8 33.9 18.8 6.7
Donor 13.8 19.0 33.4 24.8 8.9
Cornell, by Connection Not connected 22.5 19.1 33.7 18.0 6.7
Connected 14.1 20.4 32.3 24.8 8.5
Cornell, by College ALS 13.5 20.8 26.0 28.1 11.5
AAP 13.3 33.3 26.7 26.7 0.0
Arts 12.3 18.9 37.7 23.0 8.2
Engineering 19.4 16.7 36.1 21.3 6.5
Human Ec 15.6 24.4 24.4 33.3 2.2
Hotel 8.3 12.5 54.2 16.7 8.3
ILR 19.0 19.0 33.3 19.0 9.5
** p<.01, * p<.05 (based on chi‐square)
Row percentages within......Updates on campus life (e.g., new buildings, academic programs)None at all 2 3 4 A great deal
Cornell and Norm Groups Cornell 19.8 22.4 25.5 24.5 7.8
Cornell, by, Past Donor Not a donor 19.9 24.0 25.3 25.3 5.5
Donor 19.8 22.2 25.8 23.1 9.0
Cornell, by Connection** Not connected 29.4 30.6 18.8 15.3 5.9
Connected 18.3 20.4 26.8 26.8 7.7
Cornell, by College ALS 18.7 24.2 20.9 24.2 12.1
AAP 8.3 16.7 50.0 25.0 0.0
Arts 19.0 22.4 28.4 21.6 8.6
Engineering 23.7 23.7 21.6 24.7 6.2
Human Ec 11.6 20.9 23.3 37.2 7.0
Hotel 13.0 21.7 30.4 30.4 4.3
ILR 15.8 31.6 26.3 21.1 5.3
** p<.01, * p<.05 (based on chi‐square)
2009 Alumni Survey Cornell University
Institutional Resarch and Planning Page 95

a 18 22 30 24 0Past Donor
Row percentages within......Alumni/ae achievements
None at all 2 3 4 A great dealCornell and Norm Groups Cornell 16.4 21.0 27.6 25.6 9.4
Cornell, by Past Donor Not a donor 19.0 19.7 29.2 23.4 8.8
Donor 15.3 21.7 26.2 27.2 9.6
Cornell, by Connection Not connected 19.2 16.4 32.9 26.0 5.5
Connected 16.1 22.0 26.9 25.5 9.4
Cornell, by College ALS 10.7 20.2 26.2 31.0 11.9
AAP 7.7 38.5 7.7 30.8 15.4
Arts 20.4 22.2 27.8 22.2 7.4
Engineering 22.2 20.0 28.9 22.2 6.7
Human Ec 9.5 21.4 31.0 26.2 11.9
Hotel 22.7 27.3 22.7 22.7 4.5
ILR 10.5 10.5 42.1 31.6 5.3
** p<.01, * p<.05 (based on chi‐square)
Row percentages within......Student activities and achievements
None at all 2 3 4 A great dealCornell and Norm Groups Cornell 17.4 23.2 28.9 24.0 6.6
Cornell, by Past Donor Not a donorNot donor 18.2.2 22.7.7 30.7.7 24.4.4 4.04.
Donor 17.3 23.1 27.5 24.0 8.1
Cornell, by Connection Not connected 24.7 18.3 26.9 26.9 3.2
Connected 15.1 24.6 29.3 23.4 7.6
Cornell, by College ALS 17.7 21.9 28.1 25.0 7.3
AAP 6.7 33.3 46.7 13.3 0.0
Arts 13.7 24.4 29.8 25.2 6.9
Engineering 24.7 23.7 23.7 20.6 7.2
Human Ec 11.8 25.5 31.4 25.5 5.9
Hotel 15.8 26.3 26.3 21.1 10.5
ILR 22.7 9.1 36.4 22.7 9.1
** p<.01, * p<.05 (based on chi‐square)
2009 Alumni Survey Cornell University
Institutional Resarch and Planning Page 96