Embed Size (px)
Citation preview

DOI: 10.1021/la900385y 7457Langmuir 2009, 25(13), 7457–7464 Published on Web 04/17/2009
pubs.acs.org/Langmuir
© 2009 American Chemical Society
SurfaceRheology of a PolymerMonolayer: Effects of PolymerChain Length
and Compression Rate
Elisabetta Spigone,† Gil-Young Cho,† Gerald G. Fuller,‡ and Pietro Cicuta*,†
†Cavendish Laboratory and Nanoscience Center, University of Cambridge, Cambridge CB3 0HE, UnitedKingdom, and ‡Department of Chemical Engineering, Stanford University, Stanford, California 94305-5025
Received January 30, 2009. Revised Manuscript Received March 18, 2009
We study surface layers of a simple homopolymer poly(vinyl acetate) on the air-water interface as a function of theconcentration and the polymer molecular weight. Our results suggest that there is an effect of the compression rate onboth the structure of the layers and their rheological behavior, while the length of the chain influences only the rheology.At very low compression speeds, the surface layer of short chains does not exhibit the classical semi-dilute regimebehavior, forming instead a solid phase. For fluid layers, we report on the dependence of surface viscosity upon theconcentration, showing a first crossover, which happens close to the semi-dilute-concentrated regime boundary, from ascaling behavior with the concentration to an Eyring-like liquid. A second rheological transition happens at very highconcentrations, near close packing, where the Newtonian liquid phase gives way to a soft solid phase.
Introduction
Inmultiphase systems, surface films serve to stabilize interfacesand often contribute significantly to the material mechanicalproperties. The primary classes of surface-active molecules aresmall surfactants, lipids, proteins, and bio- or synthetic polymers.Recent research is also focusing on the use of solid colloidalparticles.1 Controlling liquid surface properties is an area ofsignificant interest in diverse areas ranging from designing perso-nal care products and detergents to oil recovery and wastewatermanagement. The rheology of interfaces can play an importantrole in the rheology of the bulk system.2,3 Long-chain polymermolecules can adsorb to liquid interfaces (air-water or oil-water) in a variety of ways. For example, block co-polymers canbe designed with hydrophilic and hydrophobic groups, whichpartition on either side of the interface. At high surface densities,these co-polymer layers can form brushes, with at least part of themolecules extending out of the interface plane.4 At low densities,many synthetic polymers can lie on the interface plane, with theirconformation quite strictly confined to two dimensions.5 Biopo-lymers such as proteins often denature at interfaces, and manyproteins are known to unfold, so that most monomers lie on theinterface.6,7 We focus here, on a simpler case, that of a homo-polymer,which is known to forma flat conformation, lying on theair-water interface plane.8 Looking at the simple homopolymer,we aim to understandnot just the effect of surface confinement onthe equilibrium chain conformation, which has been the object ofprevious work, but also to address the rheology of the polymerfilm. In particular, we want to consider how polymer chain length
influences the shear properties of the film and to understandprocessing parameters, such as how the rate of compressionaffects the film.
The chain conformation, fluctuation behavior, and rheologyof homopolymers in bulk polymer solutions have been stu-died extensively, leading to a set of sophisticated theories andmodels.9,10 In polymer solutions, there are typically four regionsas a function of the increasing concentration: gas, semi-dilute,concentrated, and melt. The boundaries between these regions aswell as the equilibrium thermodynamic functions and linearresponse moduli can be obtained from the scaling theory. Theyare functions simply of the molecular weight Mw and the mono-mer concentration φ. The equilibrium scaling also manifests itselfin the bulk properties; for example, it is well-known that the shearviscosity in an entangled polymer solution scales with the mole-cular weight as η3d∼Mw
3.4. Polymers confined to two dimensions(2D) are generally less well-understood. The scaling arguments byde Gennes and others make predictions for the equilibrium chainconformation of polymers in two dimensions,9 and these havebeen very successful in explaining the statistical properties ofchains at least in some regimes of concentration. For example, thedependence of the radius of gyration upon the concentration inthe semi-dilute regime was verified early on using poly(vinylacetate) (PVAc) as a model system.8 On the other hand, thedynamics of polymers in two dimensions is rather unexplored andless well-understood compared to polymer dynamics in bulksolutions. In part, this is due to the fact that there is less controlon the behavior of polymers on interfaces than in the bulk. Forexample, confinement to an interface leads many organic poly-mers to aggregate and form brittle layers. Other polymers do notspread at all onto interfaces and dissolve into the subphase. Thereare actually only few known systems for which the “universal”behavior expected for two-dimensional “good solvent” or “θsolvent” conditions is found! This is not to say that the idealpolymer behavior is only of academic interest. On the contrary,
*To whom correspondence should be addressed. E-mail: [email protected].(1) Binks, B. P. Curr. Opin. Colloid Interface Sci. 2002, 7, 21.(2) Stone, H. A.; Koehler, S. A.; Hilgenfeldt, S.; Durand, M. J. Phys.: Condens.
Matter 2003, 15, 283.(3) Monroy, F.; Ortega, F.; Rubio, R. G.; Velarde, M. G. Adv. Colloid Interface
Sci. 2007, 134-135, 175–189.(4) Agui�e-B�eghin, V.; Leclerc, E.; Daoud, M.; Douillard, R. J. Colloid Interface
Sci. 1999, 214, 143.(5) Vilanove, R.; Poupinet, D.; Rondelez, F. Macromolecules 1988, 21, 2880.(6) M
::obius, D.; Miller, R. Proteins at Liquid Interfaces; Elsevier: Amsterdam,
The Netherlands, 1998.(7) Cicuta, P.; Hopkinson, I. J. Chem. Phys. 2001, 114, 8659.(8) Vilanove, R.; Rondelez, F. Phys. Rev. Lett. 1980, 45, 1502.
(9) de Gennes, P.-G. Scaling Concepts in Polymer Physics; Cornell UniversityPress: Ithaca, NY, 1979.
(10) Doi, M.; Edwards, S. F. The Theory of Polymer Dynamics; OxfordUniversity Press: New York, 1986.
Dow
nloa
ded
by U
NIV
OF
CA
MB
RID
GE
on
Sept
embe
r 16
, 200
9 | h
ttp://
pubs
.acs
.org
P
ublic
atio
n D
ate
(Web
): A
pril
17, 2
009
| doi
: 10.
1021
/la90
0385
y

7458 DOI: 10.1021/la900385y Langmuir 2009, 25(13), 7457–7464
Article Spigone et al.
even relatively complex molecules, such as proteins and co-polymers, have semi-dilute regimes that are well-described assemi-dilute polymer regimes.4,7 Some bulk behavior has a directcorrespondence in two dimensions, in particular, the existence ofa semi-dilute concentration regime and the excluded volumeeffect. Recent experiments indicate that, on the contrary, thereare other properties that are unique to two dimensions. Forexample, the compressional dynamics (i.e., concentration fluctua-tions) in the semi-dilute regime is described by a time scale that isnot related to the classical bulk mechanisms of Rouse modes orreptation.11
PVAc was the first polymer described as having a “good-solvent” configuration at the air-water interface,8 and it hasbeen studied extensively since then as a model system.11-18
This has enabled various fundamental properties to be ex-plored. While PVAc is a “model” system of choice, it wasalready clear from the work of Monroy et al.19 and ourselves18
that, as the surface layer becomes denser, even this “simple”system displays complex properties. Monroy et al.19 discussedthe presence of a glass transition as a function of the tempera-ture at the high concentration limit of the semi-dilute regime.In previous work, we investigated the onset of a shear mod-ulus, indicating a solidification of the polymer layer, i.e.,“jamming”, at very high concentrations, where the monomersare packed together.18 In the present work, we investigate moredeeply the mechanical properties of PVAc layers, aiming tounderstand the factors that control viscosity and the liquid-solid transition in the monolayer. We perform experimentson PVAc chains with a range of molecular weights, measuringthe response to shear deformation as well as the compressionmodulus. We use a very sensitive surface shear rheometer,a modified Langmuir trough that enables large compressionratios, and a second surface shear rheometer, which iscapable of measuring the frequency dependence of the sur-face shear modulus. We find several new results: (a) layerscompressed continuously at extremely low strain rate donot exhibit the classic semi-dilute polymer phase; (b) through-out the semi-dilute regime, the compression strain ratehas a stronger effect on the dynamical properties than thepolymer chain length; (c) in the concentrated regime, theshear viscosity increases as the exponential of the pressure,in a 2D analogue of Eyring’s theory for pressure dependence ofbulk viscosities. The onset point for this behavior dependsupon both the compression strain rate and the mole-cular weight.
Polymer Monolayers
Conformation and Equilibrium Properties in Two Dimen-
sions. The separation of concentration into four regions, dilute,semi-dilute, concentrated, and melt, has been proposed before.At very low surface densities, the surface pressure increaseslinearly with the increasing surface concentration. The 2D poly-mer layer can be thought of as a two-dimensional gas. The surfacepressure is typically so low that there are no systematic experi-
ments in this regime. For isolated polymer chains, it is well-knownthat the mean end-end distance, R, scales as a power of thepolimerization number N: R = aNν, where a is the Kuhn length(of the order of one or twomonomers for a flexible polymer, suchas PVAc) and ν is the Flory exponent.9 The theoretical predictionfor a flexible polymer in a 2D good solvent is that the chainconformation obeys a self-avoiding random walk statistics, andthe scaling exponent is ν = 0.75.9
There are two useful quantities to describe the concentration of
polymer in the surface layer. One is the (dimensionless) surface
area fraction occupied by monomers, which is labeled in this
paper asφ. The other is themass density (mass of polymer per unit
area), which is labeled as Γ. The two are of course proportional
to each other: φ= Γ� a2/w, withw being the monomermass and
a2 being the area occupied per monomer. The reason for keep-
ing both quantities is that Γ is the experimentally controlled
variable (by spreading and compressing), whereas φ is the natural
variable for the theory. In general, w is well-known, but a2 is not;
therefore, in practice, the effective value of a2 is determined
experimentally from the regimes in isotherms, as performed in
this work.When the concentration is increased above a value φ*, defined
as the overlap packing fraction, the chains can no longer beregarded as isolated. At φ*, the area corresponding to the radii ofgyration Rg covers the available area and the chains have asignificant mutual contact. The overall surface concentration isthe same as that within each unperturbed chain. The dependenceof φ* on N follows from scaling arguments:9
φ� ¼ N1-2ν ð1ÞAbove φ* is the semi-dilute regime, in which the dependence ofthe osmotic pressure Π on φ is stronger than linear, following apower law
Π ¼ Π� φ
φ�� �y
ð2Þ
whereΠ* is the pressure at φ* and the exponent y is a function ofFlory’s exponent ν: y=2ν/(2ν- 1). For good solvent conditions,y = 3. The density-density correlation length ξ falls as a powerlaw of the concentration, starting from a value ξ∼ Rg at φ*.
9 ξ isknown as the blob size. It is expected from entropic reasons thatthe individual chains should remain relatively segregatedthroughout the semi-dilute regime rather than extensively inter-tangled.9
The semi-dilute power law scaling regime lasts up to asurface concentration of φ**. The theoretical argument settingthe upper bound of the semi-dilute regime, i.e., φ**, is that theblob size has dropped to a length comparable to the persistencelength of the chain. In previous work on PVAc, we showed thatthe surface layer can still be compressed considerably aboveφ**, by a factor greater than 4.18 This means that there is asubstantial fraction of free surface area still available at φ**.Above φ**, the pressure increases very slowly with the con-centration. It was shown in ref 18 that a final upturn of thepressure can be seen at a concentration φ***, which wasdescribed as a close packing of the monomers. Around φ***,the monolayer is a 2D polymer melt. The regime between φ**and φ*** is called concentrated.Dynamics in Polymer Monolayers. The dilatational mod-
ulus ε and the shear modulus G characterize the linear responseto a deformation for an isotropicmaterial in 2D. The former givesthe stress response as proportional to a change in area, and anequilibrium dilatational modulus εeq can be determined from
(11) Cicuta, P.; Hopkinson, I. Europhys. Lett. 2004, 68, 65.(12) Yoo, K.-H.; Yu, H. Macromolecules 1989, 22, 4019.(13) Kawaguchi, M.; Sauer, B. S.; Yu, H. Macromolecules 1989, 22, 1735.(14) Sauer, B. B.; Yu, H.; Yazdanian, M.; Zogra, G.; Kim, M. Macromolecules
1989, 22, 2332.(15) Monroy, F.; Ortega, F.; Rubio, R. G. Phys. Rev. E: Stat., Nonlinear, Soft
Matter Phys. 1998, 58, 7629.(16) Monroy, F.; Ortega, F.; Rubio, R. G. J. Phys. Chem. B 1999, 103, 2061.(17) Cicuta, P.; Hopkinson, I. Colloids Surf., A 2004, 233, 97.(18) Ferenczi, T.; Cicuta, P. J. Phys.: Condens. Matter 2005, 17, S3445.(19) Monroy, F.; Ortega, F.; Rubio, R. G. Eur. Phys. J. B 2000, 13, 745.
Dow
nloa
ded
by U
NIV
OF
CA
MB
RID
GE
on
Sept
embe
r 16
, 200
9 | h
ttp://
pubs
.acs
.org
P
ublic
atio
n D
ate
(Web
): A
pril
17, 2
009
| doi
: 10.
1021
/la90
0385
y

DOI: 10.1021/la900385y 7459Langmuir 2009, 25(13), 7457–7464
Spigone et al. Article
quasi-static measurements of the surface pressure as a functionof the area
εeq ¼ -A0dΠ
dAjA0
ð3Þ
When the area of the monolayer is made to oscillate sinusoidallyaroundA0 at a frequencyω, the complex dilationalmodulus ε*(ω)is measured. As usual in linear viscoelasticity, the real part of themodulus ε0(ω) is the elastic in-phase response, and the imaginarypart ε0 0(ω) is the response 90� out of phase with the strain and isproportional to the dissipation.
Analogously, the complex shear modulus G* is defined as theratio of the shear stress response to an induced strain (shapechange at constant area). Similarly, as described above for thecomplex dilational modulus, the complex shear modulus has areal component (in-phase, elastic) response and an imaginarycomponent (outof phase, dissipative) response:G*(ω)=G0(ω)+iG0 0(ω). A liquid-like monolayer is expected to have G0 = 0,whereas it is possible that G00, ε0, and ε00 6¼ 0.
The compressional dynamics involves the motion that poly-mers need to undergo when the concentration is changed. In thesemi-dilute regime, this involves reconfiguration of the chain at alllength scales from the polymer size downward, because the areaavailable per chain changes but so does the statistical correlationof monomer pair distances, i.e., the “blob size” ξ. There does notneed to be rearrangement of the centers of mass of differentpolymers relative to each other. It is well-known and follows fromeqs 2 and 3 that the equilibrium compressional modulus has thesame scaling with the concentration as the osmotic pressure. Theelastic component of the complex compressional modulus is seenexperimentally to have the same scaling with concentration,11
although it can have a higher value than the equilibriummodulus.In other words, there are several cases where it has been shownthat ε0 has a frequency-dependent component in the semi-diluteregime. The compressional viscosity describes the dissipation thatarises in the polymer chain rearrangement. There have been fewattempts to model this theoretically. In previous work, we haveshown that, while ε0 scales the same way as the surface pressure,ε0 ∼ Γy as in eq 2, ε00 scales as ε00 ∼ Γ2y. This suggested the originof ε as a “friction between blobs”.11 For a good solvent chain(y = 3), we expect ε0 0 ∼ Γ6. Up to now there has been nomeasurement of the shear viscosity (which is very small), but itwould be plausible to expect the same scaling form.
Measurements of the dynamics under shear have, thus far,proven elusive for the “model” polymer monolayers, in whichchains lie flat on the liquid interface. This is because the shearmoduli of these systems are very low, except at concentrationsnear close packing.18 There have been studies of shear rheology ofpolymer layers, for example,20 where the shear response becamesignificant but only at a conformational transition involving out-of-plane rearrangement of the chains. It could be expected that, inthe semi-dilute regime (where the absolute concentration is verylow), the surface layer would behave as a fluid dilute suspension,with the polymers contributing to the viscosity, a term linear withthe concentration.
Methods
Langmuir Trough. PVAc can be spread on the surfaceof water to form an insoluble Langmuir film. Relatively dilute(Mw=17000, 0.051mg/mL;Mw=45500, 0.167mg/mL;Mw=170000, 0.189 mg/mL; Mw = 275000, 0.147 mg/mL) solutions
are prepared in tetrahydrofuran (THF, Fischer Scientific), andthen a series of small (∼1 μL) droplets is delivered in successionto the surface with a microsyringe (Hamilton 710RN), typicallydepositing up to 100 μL. The THF evaporates rapidly, leavinga dilute layer ofPVAc. In thiswork,we spread less than0.2mg/m2
of PVAc and rely on continuous compression via the Langmuirtrough barriers to increase the concentration. Other work hadshown that the surface pressure as a function of the concentrationis the samewhether the concentration is increased by the additionof aliquots or continuous compression.15 Our own experimentsshowed that there were systematic differences between the iso-therms, especially in the shear viscosity at high concentrations,depending upon the spreading method. This is not so surprisinggiven that the aliquot method can lead, in principle, to poly-mer overlap if drops are added on a layer with a pre-existing finiteconcentration. We choose instead to work with continuouslyspread layers and actually explore the finer point of the effect ofthe compression strain rate on the polymer layer.
In previous work,18 we had shown that the first compressionwas sightly different from other subsequent compressions per-formed after expansion. In this work, we have focused on the firstcompression only.
The measurable surface tension of the liquid surface, γ, de-creases compared to the value for pure water, γ0, because the filmexerts a certain surface pressure Π, with Π = γ0 - γ. Using aLangmuir trough, an insoluble monolayer can be compressedat different speeds, reducing the available area and, consequently,increasing the surface concentration. The surface pressure Π isrecorded, giving a Π-A isotherm. If a monolayer has longrelaxation times, then the measured surface pressure Π can beaffected by the compression rate, and Π is best thought of as asurface stress.
For the isotherm experiments, we use a trough (model 600,Nima, U.K.) that has a surface area of 20� 30 cm. Two barrierssweep the surface of the liquid, compressing the surface layersymmetrically, as sketched in Figure 1. With this trough, it isnormally possible to compress a surface layer by a factor ofaround 6. We have included a block in the center of the troughthat acts as an “island”, leaving enough free space for theWilhelmy plates but removing 42 cm2 of the surface area. Thisis a large fraction of the area when the barriers are closed andincreases the compression factor to 10.5. The trough was main-tained at 23 �C. Plates (1 cmwide)made of filter paper are used asWilhelmy pressure sensors.We showed in previous work how it ispossible to measure the shear modulus of the surface layer byusing twoWilhelmy sensor plates positioned parallel and perpen-dicular to the axis of compression.21,22 However, that method isnot sensitive enough for the phenomena investigated here; there-fore, pressure was measured with a single sensor, leaving enoughspace to fit the du Nuoy ring for surface rheology, as describedbelow. Unless stated otherwise, we report results on the firstcompression, starting from dilute conditions (Π j 10 -3 N/m).
Surface Rheology. The method of measuring perpendicularpressures in a Langmuir trough has the advantage of relyingsimply on the conventional Langmuir trough hardware, but it isnot the most sensitive technique available to probe shear re-sponse.21 In this work, we wanted to investigate the onset of theshear response. An extremely sensitive rheometer was developedcommercially byCamtel (CIR-100,Camtel,U.K.) and is based ona du Nuoy ring maintained in oscillation on the interface plane.TheCIR-100 is stress-controlled,maintaining a set amplitude andfrequency through feedback. It relies on the “normalized reso-nance” technique, which (in combination with a sensitive trans-ducer)makes it particularly sensitive.We use amodified CIR-100instrument, where the rheometer head is attached toanoptical railand mounted, so that it can be freely positioned over a Langmuirtrough. The ring is lowered onto the liquid surface by turning a
(20) Gavranovic, G. T.; Smith, M. M.; Jeong, W.; Wong, A. Y.; Waymouth,R. M.; Fuller, G. G. J. Phys. Chem. B 2006, 110, 22285–22290.
(21) Cicuta, P.; Terentjev, E. Eur. Phys. J. E 2005, 16, 147.(22) Cicuta, P. J. Colloid Interface Sci. 2007, 308, 93–99.
Dow
nloa
ded
by U
NIV
OF
CA
MB
RID
GE
on
Sept
embe
r 16
, 200
9 | h
ttp://
pubs
.acs
.org
P
ublic
atio
n D
ate
(Web
): A
pril
17, 2
009
| doi
: 10.
1021
/la90
0385
y

7460 DOI: 10.1021/la900385y Langmuir 2009, 25(13), 7457–7464
Article Spigone et al.
precision micrometer movement. An aluminum ring with twoopenings for the layer to flow inside defines the shear deformationgeometry, as sketched in Figure 1. This external ring is 3.5 cm indiameter. The du Nuoy ring is 1.2 cm in diameter. The du Nuoyring is set in oscillation in the surface plane. In this work, theoscillation frequency was set to 3 Hz and the angular amplitudewas 5 μrad. The strain is therefore very small, 2.6� 10-4 %. Thissetup allows the study of the onset of shear viscoelasticity as afunction of the concentration, in particular the detection of verysmall surface viscosities in the polymer layers in the semi-diluteregime.
A powerful surface shear rheometer (ISR) was developed byBrooks et al. and is described fully in refs 23 and 24. It generatessimple shear deformations in the monolayer by inducing oscilla-tions along the axis of a needle that floats on the surface at themidpoint of a linear canal. This instrument is built around acommercial trough (Minitrough, KSV, Finland). We have used ithere to investigate the frequency dependence of the shear mod-ulus, for relatively high packing and high modulus, which are
conditions where the instrument is very precise.24 Frequencysweeps were acquired at a fixed strain amplitude of 3%.
Results
Pressure Isotherms. Pressure isotherms taken in continuouscompression at several compression speeds and for differentmolecular weights are shown in Figure 2. These equilibriumisotherms show a strong dependence upon the compressionspeed. In particular, at the lowest compression speed of 1 cm2/min, which corresponds to a compression strain rate of around10-4 s-1, it is clear that the polymer layers of the molecularweights 45000 and 170 000 exert a significantly reduced osmoticpressure. For the higher compression speeds (2, 5, 20, 100, and300 cm2/min), the isotherms are more similar to each other, but itcan still be seen that, for 45000 and 170 000, the compressionspeed affects the surface pressure. For the highest molecularweight, 275 000, there is little dependence of surface pressureupon the strain rate and similarly for the lowest molecular weight,17 000. For this polymer, it is safe to assume that all of themolecules spread at the interface remain in the surface layer andthat desorption and diffusion into the bulk can be excluded. Wefound that the isotherms of the shortest molecular-weight poly-mer were particularly sensitive to the initial spreading concentra-tion and, particularly, at slow compression speeds, the upturnconcentration and the shape of the pressure isotherms could varywidely. There is clearly some additional complexity in the short-chain molecules, which we do not explore in further detail here.
To investigate further the effect of themolecularweight and thespeed compression on the structure of the monolayer, it is usefulto derive the compression modulus ε from the isotherms, usingeq 3 (values of ε are obtained by fitting the isotherm data with ahigh-grade polynomial. This polynomial function is drawn as asolid line in Figure 3). For Γj 0.8� 10-3 g/m2 orΠj 10� 10-3
N/m, the layer is in the semi-dilute regime. In this regime, the filmcan be thought as a 2D network made of segregated polymerchains and the pressure and compressibility are power laws of theconcentration.We do not study it here but confirm that the Floryexponent found is close to the good solvent value (ν ∼ 3/4). Thecompression moduli increase as the layer is compressed. Welabel ε** the maximum of ε and Γ** and Π** the correspondingsurface concentration and pressure.Wepresent the dependence ofΓ**, Π**, and ε** obtained from Figure 3 in Figures 4, 5 and 6.Note that, for clarity in Figures 3 and 4, we have not included theslowest compression speed reported in Figure 2. The packingfraction at the peak is often taken to be equal to the surfacefraction φ**, introduced above as the boundary between semi-dilute and concentrated regimes.
We observe that the concentration Γ** is insensitive to thespeed of compression, as shown in Figure 6. Note however thatthe slowest compressions are anomalous, and we do not reportthem on this Figure 6, because the state of the polymer does notappear to be a semi-dilute liquid phase. For the fixed compressionrate, it is seen, in Figure 5, that the peak value of the compres-sibility is also independent of the molecular weight.
Despite having the same concentration, the layers at φ** areactually not all the same to each other, because they differ incompressibility and rheological properties. The peak value of thecompression modulus is greatest for the layers being compressedfastest. The strain rate can be obtained by dividing the compres-sion speed by the surface area. In our compressions, the speed ismaintained constant, and this results in an isotherm that covers a(small) range of strain rates. At any given point, we can howeverdetermine the compression strain rate, and in particular, this isinteresting at the peak position of ε.
Figure 1. Diagrams of experimental setup for measurement ofsurface pressure and surface shear rheology. Two instrumentswereused. The Camtel CIR-100 is sketched on top, together with ourtrough setup to increase the compression ratio.The duNuoy ring isheld by a sensitivemechanical transducer tomeasure the torque onthe ring. The ISR developed in Stanford is sketched below. Themagnetic coils are positioned in anti-Helmholtz configuration,generating a magnetic field gradient that moves the magnetizedneedle in the open channel. A linear array sensor measures theneedle displacement. Both instruments are stress-controlled.
(23) Brooks, C. F.; Fuller, G. G.; Curtis, C. W.; Robertson, C. R. Langmuir1999, 15, 2450.(24) Reynaert, S.; Brooks, C. F.; Moldenaers, P.; Vermant, J.; Fuller, G. G. J.
Rheol. 2008, 52, 261–285.
Dow
nloa
ded
by U
NIV
OF
CA
MB
RID
GE
on
Sept
embe
r 16
, 200
9 | h
ttp://
pubs
.acs
.org
P
ublic
atio
n D
ate
(Web
): A
pril
17, 2
009
| doi
: 10.
1021
/la90
0385
y

DOI: 10.1021/la900385y 7461Langmuir 2009, 25(13), 7457–7464
Spigone et al. Article
The peak value of the compression modulus, ε**, is plotted inFigure 4 as a function of the strain rate. As we present it inFigure 4, ε** appears to have a linear dependence upon thelogarithm of the strain rate:
ε�� ∼ c lndA
dtð4Þ
with c being a constant independent of the molecular weight(except forMw= 17000). We stress that the weak dependence ofε upon the strain ratemeans thatwe cannot distinguish just on thebasis of the data with respect to a power law dependence, such as
ε�� ∼ cdA
dt
� �1=nð5Þ
Equation 5 is defined in this form in analogy to the work ofKampf25 on the collapse of dendritic monolayers. Fitting witheq 5 gives n = 11 ( 1.5, which is remarkably similar to thedependence of collapse pressure upon strain rate found in ref 25.However, in the present case, it does not seem appropriate toconsider the “event” at the peak in ε as a failure of thematerial. Inthe absence of a convincingmodel, an exponent value of 1/n= 0.1appears very small and hard to justify on scaling grounds.
The phenomenological law of eq 4 seems more appropriate.The error (from fitting and reproducibility) on the data inFigure 4 is of the order of the symbols used in the Figure 4. Itcan be noted that there is a systematic deviation of the data from
Figure 2. Π-A curves of PVAc monolayer for four different molecular weights and six different compression speeds: (red b) 1 cm2/min,(green9) 2 cm2/min, (blue1) 5 cm2/min, (cyan /) 20 cm2/min, (yellow2) 100 cm2/min, and (magenta+) 300 cm2/min. The slowest isotherms(red b, 1 cm2/min) show a very characteristic shape, distinct from the “classical” semi-dilute regime behavior. We found the Mw = 17000polymer isotherms to be very sensitive on the initial spreading concentration.
Figure 3. Compressionmodulus obtained for differentmolecularweights asmarked and continuous compression at different speeds: (redO)1 cm2/min, (green 0) 2 cm2/min, (blue 3) 5 cm2/min, (cyan /) 20 cm2/min, (yellow 4) 100 cm2/min, and (magenta +) 300 cm2/min.
Figure 4. Peak value of compression modulus plotted against thestrain rate for all of themolecularweights: (redO) 17 000, (green0)45 500, (blue 3) 170 000, and (black 4) 275 000.
Figure 5. Dependence of the maximum compressibility value ε**upon the molecular weight, as labeled in the figure.
(25) Kampf, J. P.; Frank, C.W.; Malmstr::om, E. E.; Hawker, C. J. Science 1999,
283, 1730–1733.
Dow
nloa
ded
by U
NIV
OF
CA
MB
RID
GE
on
Sept
embe
r 16
, 200
9 | h
ttp://
pubs
.acs
.org
P
ublic
atio
n D
ate
(Web
): A
pril
17, 2
009
| doi
: 10.
1021
/la90
0385
y
7462 DOI: 10.1021/la900385y Langmuir 2009, 25(13), 7457–7464
Article Spigone et al.
the formof eq 4,with the high strain rate peak values appearing tolevel off. More fitting parameters would be needed to describethis, and at present, we are not aware of amodel thatwould justifythis. We would just remark that the deviation of the high straindata to the alternative scaling of eq 5 is more severe.Surface Rheological Measurements at Low Density. Ad-
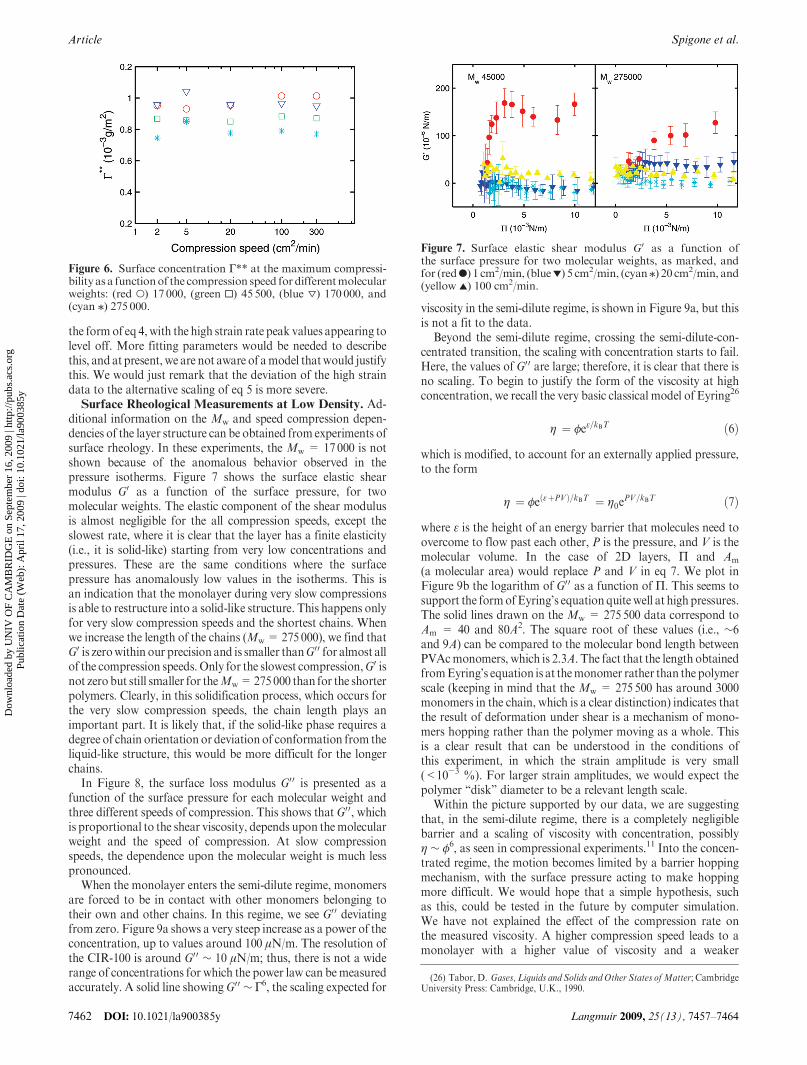
ditional information on the Mw and speed compression depen-dencies of the layer structure can be obtained from experiments ofsurface rheology. In these experiments, the Mw = 17000 is notshown because of the anomalous behavior observed in thepressure isotherms. Figure 7 shows the surface elastic shearmodulus G0 as a function of the surface pressure, for twomolecular weights. The elastic component of the shear modulusis almost negligible for the all compression speeds, except theslowest rate, where it is clear that the layer has a finite elasticity(i.e., it is solid-like) starting from very low concentrations andpressures. These are the same conditions where the surfacepressure has anomalously low values in the isotherms. This isan indication that the monolayer during very slow compressionsis able to restructure into a solid-like structure. This happens onlyfor very slow compression speeds and the shortest chains. Whenwe increase the length of the chains (Mw= 275000), we find thatG0 is zerowithin our precision and is smaller thanG00 for almost allof the compression speeds. Only for the slowest compression,G0 isnot zero but still smaller for theMw=275000 than for the shorterpolymers. Clearly, in this solidification process, which occurs forthe very slow compression speeds, the chain length plays animportant part. It is likely that, if the solid-like phase requires adegree of chain orientation or deviation of conformation from theliquid-like structure, this would be more difficult for the longerchains.
In Figure 8, the surface loss modulus G0 0 is presented as afunction of the surface pressure for each molecular weight andthree different speeds of compression. This shows that G0 0, whichis proportional to the shear viscosity, depends upon themolecularweight and the speed of compression. At slow compressionspeeds, the dependence upon the molecular weight is much lesspronounced.
When the monolayer enters the semi-dilute regime, monomersare forced to be in contact with other monomers belonging totheir own and other chains. In this regime, we see G0 0 deviatingfrom zero. Figure 9a shows a very steep increase as a power of theconcentration, up to values around 100 μN/m. The resolution ofthe CIR-100 is around G0 0 ∼ 10 μN/m; thus, there is not a widerange of concentrations for which the power law can bemeasuredaccurately. A solid line showingG00 ∼ Γ6, the scaling expected for
viscosity in the semi-dilute regime, is shown in Figure 9a, but thisis not a fit to the data.
Beyond the semi-dilute regime, crossing the semi-dilute-con-centrated transition, the scaling with concentration starts to fail.Here, the values of G0 0 are large; therefore, it is clear that there isno scaling. To begin to justify the form of the viscosity at highconcentration, we recall the very basic classical model of Eyring26
η ¼ φeε=kBT ð6Þwhich is modified, to account for an externally applied pressure,to the form
η ¼ φeðεþPVÞ=kBT ¼ η0ePV=kBT ð7Þ
where ε is the height of an energy barrier that molecules need toovercome to flow past each other, P is the pressure, and V is themolecular volume. In the case of 2D layers, Π and Am
(a molecular area) would replace P and V in eq 7. We plot inFigure 9b the logarithm of G0 0 as a function of Π. This seems tosupport the formofEyring’s equationquitewell at highpressures.The solid lines drawn on the Mw = 275500 data correspond toAm = 40 and 80A2. The square root of these values (i.e., ∼6and 9A) can be compared to the molecular bond length betweenPVAcmonomers, which is 2.3A. The fact that the length obtainedfromEyring’s equation is at themonomer rather than the polymerscale (keeping in mind that the Mw = 275500 has around 3000monomers in the chain, which is a clear distinction) indicates thatthe result of deformation under shear is a mechanism of mono-mers hopping rather than the polymer moving as a whole. Thisis a clear result that can be understood in the conditions ofthis experiment, in which the strain amplitude is very small(<10-3 %). For larger strain amplitudes, we would expect thepolymer “disk” diameter to be a relevant length scale.
Within the picture supported by our data, we are suggestingthat, in the semi-dilute regime, there is a completely negligiblebarrier and a scaling of viscosity with concentration, possiblyη ∼ φ
6, as seen in compressional experiments.11 Into the concen-trated regime, the motion becomes limited by a barrier hoppingmechanism, with the surface pressure acting to make hoppingmore difficult. We would hope that a simple hypothesis, suchas this, could be tested in the future by computer simulation.We have not explained the effect of the compression rate onthe measured viscosity. A higher compression speed leads to amonolayer with a higher value of viscosity and a weaker
Figure 6. Surface concentration Γ** at the maximum compressi-bility as a functionof the compression speed for differentmolecularweights: (red O) 17 000, (green 0) 45 500, (blue 3) 170 000, and(cyan /) 275 000.
Figure 7. Surface elastic shear modulus G0 as a function ofthe surface pressure for two molecular weights, as marked, andfor (redb) 1 cm2/min, (blue1) 5 cm2/min, (cyan/) 20 cm2/min, and(yellow 2) 100 cm2/min.
(26) Tabor, D. Gases, Liquids and Solids and Other States ofMatter; CambridgeUniversity Press: Cambridge, U.K., 1990.
Dow
nloa
ded
by U
NIV
OF
CA
MB
RID
GE
on
Sept
embe
r 16
, 200
9 | h
ttp://
pubs
.acs
.org
P
ublic
atio
n D
ate
(Web
): A
pril
17, 2
009
| doi
: 10.
1021
/la90
0385
y

DOI: 10.1021/la900385y 7463Langmuir 2009, 25(13), 7457–7464
Spigone et al. Article
dependence uponΠ, which results in a smaller molecular area inEyring’s theory. A detailed investigation of the crossover pointbetween scaling and Eyring’s liquid theory is beyond the scope ofthis paper, but the data show that the polymer molecular weightand compression strain rate are both important parameters.
An increase of the viscous dissipation in a polymer networkcould have been expected when the length of the chain increases,but the compression rate result is unexpected. Because little isknown of the chain conformation at or around Γ**, it is difficultto present a definitive view. We suggest that the compressionstrain rate could influence the rheological behavior of the mono-layer by forcing the average chain conformation into differentstructures. For example, compression in the trough (which is auniaxial compression) could lead to chain anisotropy and align-ment. However, it should also be considered that the samecompression process, happening over a very large range of strain,
is also forcing the polymers to rearrange both intra- and inter-molecularly. Therefore, the external compression can also be seenas a process that provides a dense monolayer with the energy torandomize its configurations, thereby maintaining a system inequilibrium in a condition where it would otherwise jam orcrystallize. To try and distinguish between these general ideas, acontrol experiment was carried out where shear was first mea-sured during fast compression. Then, compression was halted,and shear viscosity was monitored as a function of time. Therewas no drop in the shear viscosity, which implies that the highshear dissipation is a property of the structure of the monolayer(acquired at high compression speed) but not the fact thatthe monolayer is being compressed quickly.Surface Rheological Measurements at High Density. All
of the data presented above are obtained with the CIR-100instrument showing G00 > G0. From previous work, we know
Figure 8. Surface loss modulusG0 0 as a function of the surface pressure for three different compression speeds, as marked in each panel, andfor molecular weights: (blue 3) 45 000, (cyan /) 170 000, and (yellow 4) 275 000.
Figure 9. Values of G0 0 as a function of (a) concentration and (b) surface pressure for molecular weights, as marked on the panels.Compression speeds are (blue9) 5 cm2/min, (cyanb) 20 cm2/min, and (yellow2) 100 cm2/min. Solid lines are (a) theoretical predictions fromscaling arguments and (b) from Eyring’s theory of viscosity.
Dow
nloa
ded
by U
NIV
OF
CA
MB
RID
GE
on
Sept
embe
r 16
, 200
9 | h
ttp://
pubs
.acs
.org
P
ublic
atio
n D
ate
(Web
): A
pril
17, 2
009
| doi
: 10.
1021
/la90
0385
y

7464 DOI: 10.1021/la900385y Langmuir 2009, 25(13), 7457–7464
Article Spigone et al.
that increasing the concentration even further should lead to anincrease of G0, which we had explained as the complete closepacking of monomers on the surface.18 Figure 10 shows thefrequency dependence of G0 and G00 obtained with the ISR.Because, in a frequency sweep, the monolayer needs to be heldat constant pressure for a long time (tens ofminutes for eachof thelow-frequency points), it was not feasible to acquire this dataduring a single continuous compression. The Langmuir troughwas therefore operated in feedback mode to maintain fixedpressure. It was also not possible to attain the very high concen-tration starting from dilute conditions and during a singlecompression. Therefore, these data correspond to layers thathave been compressed by the addition of further polymer innondilute conditions. Despite these differences [which may makea direct quantitative comparison to the cylindrical internalreflection (CIR) data on first and continuous compressionsinappropriate], we believe that the results shed light on the processof polymer close packing.
The ISR data confirms that, below Π = 29 � 10-3 N/m, theshear response is dominated byG00 and G0 0 ∼ ω, as expected for aNewtonian fluid. This is in agreement with the CIR-100measure-ments above, which showed G0 0 . G0. An interesting transitionhappens at around Π = 31 � 10-3 N/m, with G00 exhibiting aweaker dependence upon the frequency G00 ∼ ω0.5 and the elasticmodulus having a similar magnitude to the viscous modulus.These factors combined indicate that the layer at this stage is in asoft solid state, possibly a two-dimensional analogue of a paste.Remarkably, the behavior at very high packing is almost inde-pendent of the molecular weight, something that is in contrast tobulk polymer melts, where the molecular weight plays a majorrole η3d ∼Mw
3.4. This is an indication that reptation-like mechan-isms are not responsible for the shear response observed here.
Conclusions
We have found that the mechanical and rheological propertiesof PVAc monolayers depend upon not only the polymer chain
length but also how the layer is created and compressed; inparticular, the shear response depends upon the compression rate.
Very slow compressions also gave rise to unexpected and novelbehavior, leading to a solid-likemonolayer at low densities, whichis most evident for the shorter chains. We described this as aprocess of polymer chain rearrangement into a solid state, whichhas time to develop during slow compressions and for moderatelength polymers. For the highest polymer weight, the osmoticpressure in the semi-dilute regime is almost independent ofcompression speed and even the slowest compression does notlead to a solid phase. It would be interesting to explore further thestructural properties of the solid phase and, in particular, themorphology at the molecular scale.
As expected, the transition from a semi-dilute to concentratedregime observed in the isotherms is not affected by the polymerchain length; physically, this transition concentration should onlydepend upon the number of monomers on the surface. The speedof compression is found to affect the magnitude of the elasticityε**, a result which is not described by the equilibrium scalingtheory.
The rheological measurements have provided further evidencethat the structure of these monolayers depends upon the pathwayof formation. The surface pressure and the concentration atwhichG00 starts to increase quickly are related to the molecular weightand the compression speed.
Isotherms of compression and surface rheology of PVAcmonolayers have revealed that the rheological properties of asimple two-dimensional polymer system depend upon the mole-cularweight and the compression speed.Vice versa, the changes inelastic modulus and surface loss shear modulus under differentcompression regimes indicate that the underlying structure of themonolayer is affected by the compression, and it is likely that thepolymer chains are being forced to change their average equili-brium configurations under compression.
Acknowledgment. We thank Kevin Peters for help with CIRmeasurements.
Figure 10. (b)G0 and (O)G0 0 measured as a function of the frequency with the ISR, for differentmolecular weights. Thesemeasurements areat very high packing, performed at constant pressure (as marked in the figure), and show a transition from Newtonian fluid to soft solidbehavior.
Dow
nloa
ded
by U
NIV
OF
CA
MB
RID
GE
on
Sept
embe
r 16
, 200
9 | h
ttp://
pubs
.acs
.org
P
ublic
atio
n D
ate
(Web
): A
pril
17, 2
009
| doi
: 10.
1021
/la90
0385
y