Embed Size (px)
Citation preview
NHTSA’s National Center for Statistics and Analysis 1200 New Jersey Avenue SE., Washington, DC 20590
TRAFFIC SAFETY FACTS2009 Data
DOT HS 811 392
OverviewMotor vehicle travel is the primary means of transportation in the United States, providing an unprecedented degree of mobility. Yet for all its advantages, injuries resulting from motor vehicle crashes are the leading cause of death for people of every age from 3 through 5, 8, 9, and 11 through 33 (based on 2007 data). The mission of the National Highway Traffic Safety Administration is to reduce deaths, injuries, and economic losses from motor vehicle crashes.
In 2009, 33,808 people were killed in the estimated 5,505,000 police-reported motor vehicle traffic crashes; 2,217,000 people were injured; and 3,957,000 crashes involved property damage only. Compared to 2008, this is a 10-percent decrease in the number of fatalities, and a 5-percent decrease in the number of police-reported motor vehicle traffic crashes, people injured, and crashes involving property damage.
An average of 93 people died each day in motor vehicle crashes in 2009 — an average of one every 16 minutes.
Fortunately, much progress has been made in reducing the number of deaths and injuries on our Nation’s highways. In 2009, the fatality rate per 100 million vehicle miles of travel (VMT) fell to a historic low of 1.13. The 2000 rate was 1.53 per 100 million VMT. The National Occupant Protection Use Survey (NOPUS) reported an 84-percent seat belt use rate nationwide for 2009. Data has also shown a decrease in the number of fatalities in alcohol-impaired-driving crashes — from 13,324 in 2000 to 10,839 in 2009. Fatalities in alcohol-impaired-driving crashes when compared to the previous year (2008) decreased by 7.4 percent from 11,711 to 10,839.
This overview fact sheet contains statistics on motor vehicle fatalities based on data from the Fatality Analysis Reporting System (FARS). FARS is a census of fatal crashes within the 50 States, the District of Columbia, and Puerto Rico (although Puerto Rico is not included in U.S. totals). Crash and injury statistics are based on data from the National Automotive Sampling System General Estimates System (GES). GES is a probability-based sample of police-reported crashes, from 60 locations across the country, from which estimates of national totals for injury and property-damage-only crashes are derived.
The following terms will be used to define motorcycle occupants: a motorcycle rider is the operator only; a passenger is any person seated on the motorcycle but not in control of the motorcycle; and any combined reference to the “motorcycle rider” (operator) as well as the “passenger” will be referred to as motorcyclists. NHTSA publications prior to 2007 may not reflect this terminology.
In 2009, there were an estimated 5,505,000 police-reported traffic crashes, in which 33,808 people were killed and 2,217,000 people were injured; 3,957,000 crashes involved property damage only.
An average of 93 people died each day in motor vehicle crashes in 2009 — an average of one every 16 minutes.
NHTSA’s National Center for Statistics and Analysis 1200 New Jersey Avenue SE., Washington, DC 20590
2
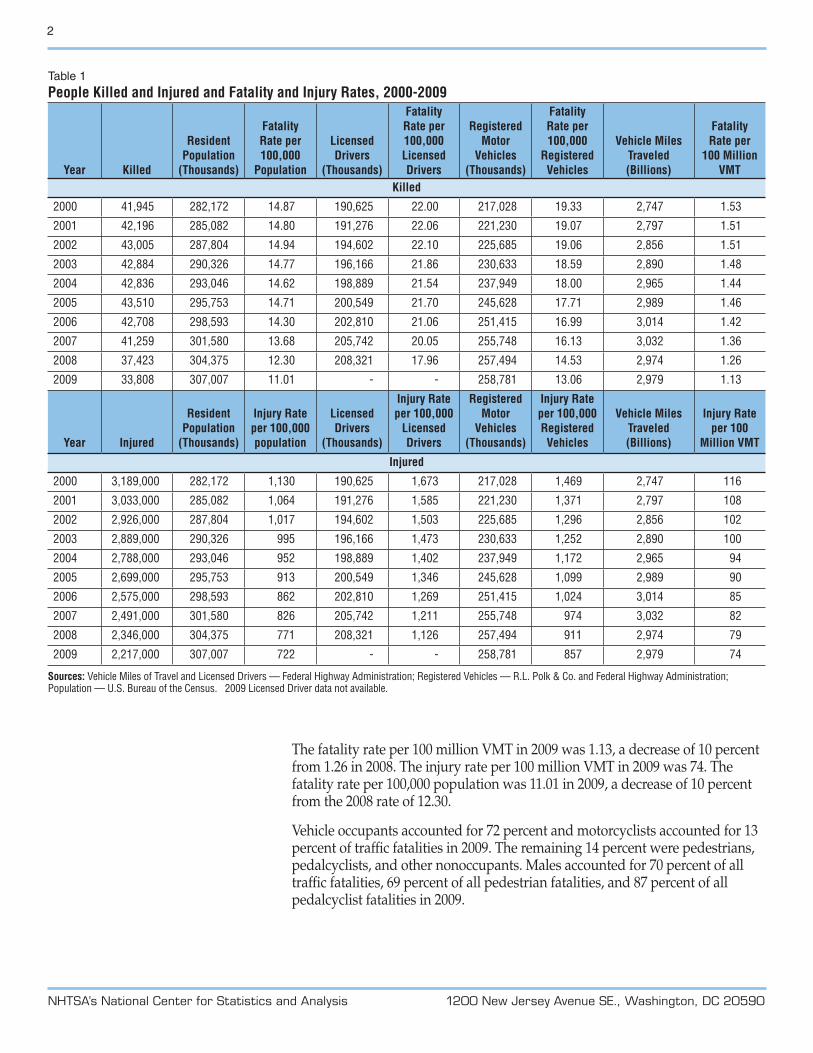
Table 1People Killed and Injured and Fatality and Injury Rates, 2000-2009
Year Killed
Resident Population
(Thousands)
Fatality Rate per 100,000
Population
Licensed Drivers
(Thousands)
Fatality Rate per 100,000 Licensed Drivers
Registered Motor
Vehicles (Thousands)
Fatality Rate per 100,000
Registered Vehicles
Vehicle Miles Traveled (Billions)
Fatality Rate per
100 Million VMT
Killed
2000 41,945 282,172 14.87 190,625 22.00 217,028 19.33 2,747 1.53
2001 42,196 285,082 14.80 191,276 22.06 221,230 19.07 2,797 1.51
2002 43,005 287,804 14.94 194,602 22.10 225,685 19.06 2,856 1.51
2003 42,884 290,326 14.77 196,166 21.86 230,633 18.59 2,890 1.48
2004 42,836 293,046 14.62 198,889 21.54 237,949 18.00 2,965 1.44
2005 43,510 295,753 14.71 200,549 21.70 245,628 17.71 2,989 1.46
2006 42,708 298,593 14.30 202,810 21.06 251,415 16.99 3,014 1.42
2007 41,259 301,580 13.68 205,742 20.05 255,748 16.13 3,032 1.36
2008 37,423 304,375 12.30 208,321 17.96 257,494 14.53 2,974 1.26
2009 33,808 307,007 11.01 - - 258,781 13.06 2,979 1.13
Year Injured
Resident Population
(Thousands)
Injury Rate per 100,000 population
Licensed Drivers
(Thousands)
Injury Rate per 100,000
Licensed Drivers
Registered Motor
Vehicles (Thousands)
Injury Rate per 100,000 Registered Vehicles
Vehicle Miles Traveled (Billions)
Injury Rate per 100
Million VMT
Injured
2000 3,189,000 282,172 1,130 190,625 1,673 217,028 1,469 2,747 116
2001 3,033,000 285,082 1,064 191,276 1,585 221,230 1,371 2,797 108
2002 2,926,000 287,804 1,017 194,602 1,503 225,685 1,296 2,856 102
2003 2,889,000 290,326 995 196,166 1,473 230,633 1,252 2,890 100
2004 2,788,000 293,046 952 198,889 1,402 237,949 1,172 2,965 94
2005 2,699,000 295,753 913 200,549 1,346 245,628 1,099 2,989 90
2006 2,575,000 298,593 862 202,810 1,269 251,415 1,024 3,014 85
2007 2,491,000 301,580 826 205,742 1,211 255,748 974 3,032 82
2008 2,346,000 304,375 771 208,321 1,126 257,494 911 2,974 79
2009 2,217,000 307,007 722 - - 258,781 857 2,979 74
Sources: Vehicle Miles of Travel and Licensed Drivers — Federal Highway Administration; Registered Vehicles — R.L. Polk & Co. and Federal Highway Administration; Population — U.S. Bureau of the Census. 2009 Licensed Driver data not available.
The fatality rate per 100 million VMT in 2009 was 1.13, a decrease of 10 percent from 1.26 in 2008. The injury rate per 100 million VMT in 2009 was 74. The fatality rate per 100,000 population was 11.01 in 2009, a decrease of 10 percent from the 2008 rate of 12.30.
Vehicle occupants accounted for 72 percent and motorcyclists accounted for 13 percent of traffic fatalities in 2009. The remaining 14 percent were pedestrians, pedalcyclists, and other nonoccupants. Males accounted for 70 percent of all traffic fatalities, 69 percent of all pedestrian fatalities, and 87 percent of all pedalcyclist fatalities in 2009.

NHTSA’s National Center for Statistics and Analysis 1200 New Jersey Avenue SE., Washington, DC 20590
3
Table 2Motor Vehicle Occupants, Motorcyclists, and Nonoccupants Killed and Injured, 2000-2009
Year
Occupants by Vehicle TypeMotor-cyclist
Nonoccupants
TotalPassenger
CarsLight
TrucksLarge Trucks Buses
Other/Unknown Total
Pedes-trian
Pedal-cyclist
Other/ Unknown Total
Killed
2000 20,699 11,526 754 22 450 33,451 2,897 4,763 693 141 5,597 41,945
2001 20,320 11,723 708 34 458 33,243 3,197 4,901 732 123 5,756 42,196
2002 20,569 12,274 689 45 528 34,105 3,270 4,851 665 114 5,630 43,005
2003 19,725 12,546 726 41 589 33,627 3,714 4,774 629 140 5,543 42,884
2004 19,192 12,674 766 42 602 33,276 4,028 4,675 727 130 5,532 42,836
2005 18,512 13,037 804 58 659 33,070 4,576 4,892 786 186 5,864 43,510
2006 17,925 12,761 805 27 601 32,119 4,837 4,795 772 185 5,752 42,708
2007 16,614 12,458 805 36 614 30,527 5,174 4,699 701 158 5,558 41,259
2008 14,646 10,816 682 67 580 26,791 5,312 4,414 718 188 5,320 37,423
2009 13,095 10,287 503 26 563 24,474 4,462 4,092 630 150 4,872 33,808
Injured
2000 2,052,000 887,000 31,000 18,000 10,000 2,997,000 58,000 78,000 51,000 5,000 134,000 3,189,000
2001 1,927,000 861,000 29,000 15,000 9,000 2,841,000 60,000 78,000 45,000 8,000 131,000 3,033,000
2002 1,805,000 879,000 26,000 19,000 6,000 2,735,000 65,000 71,000 48,000 7,000 126,000 2,926,000
2003 1,756,000 889,000 27,000 18,000 7,000 2,697,000 67,000 70,000 46,000 8,000 124,000 2,889,000
2004 1,643,000 900,000 27,000 16,000 7,000 2,594,000 76,000 68,000 41,000 9,000 118,000 2,788,000
2005 1,573,000 872,000 27,000 11,000 10,000 2,494,000 87,000 64,000 45,000 8,000 118,000 2,699,000
2006 1,475,000 857,000 23,000 10,000 11,000 2,375,000 88,000 61,000 44,000 7,000 112,000 2,575,000
2007 1,379,000 841,000 23,000 12,000 8,000 2,264,000 103,000 70,000 43,000 10,000 124,000 2,491,000
2008 1,304,000 768,000 23,000 15,000 9,000 2,120,000 96,000 69,000 52,000 9,000 130,000 2,346,000
2009 1,216,000 759,000 17,000 12,000 7,000 2,011,000 90,000 59,000 51,000 7,000 116,000 2,217,000
Occupant ProtectionIn 2009, 49 States and the District of Columbia had seat belt use laws in effect. Use rates vary widely from State to State, reflecting factors such as differences in public attitudes, enforcement practices, legal provisions, and public information and education programs.
From 1975 through 2009, NHTSA estimates that seat belts saved the lives of 267,890 passenger vehicle occupants age 5 and older, including 12,713 lives saved in 2009. If all passenger vehicle occupants over age 4 wore seat belts, an estimated 16,401 lives (that is, an additional 3,688) would have been saved in 2009.
In 2009, it is estimated that 309 children under age 5 were saved as a result of child restraint use, which includes child safety seats and seat belts. Among children, an estimated 9,310 lives were saved by restraints from 1975 through 2009.
NHTSA estimates that 12,713 lives were saved in 2009 by the use of seat belts.

NHTSA’s National Center for Statistics and Analysis 1200 New Jersey Avenue SE., Washington, DC 20590
4
In 2009, 31 percent of passenger car occupants and 35 percent of light-truck occupants involved in fatal crashes were unrestrained.
In fatal crashes, 77 percent of passenger vehicle occupants who were totally ejected from vehicles were killed. Seat belts are effective in preventing total ejections: only 1 percent of the occupants reported to have been using restraints were totally ejected, compared with 31 percent of the unrestrained occupants.
Table 3 shows belt use for passenger vehicle occupants for 2009 compared to belt use in 2000.
Table 3Restraint Use Rates for Passenger Vehicle Occupants in Fatal Crashes, 2000 and 2009
Type of Occupant
Restraint Use Rate (Percent)
2000 2009
Drivers 61 69
All Passengers 53 64
Front Seat 60 70
Rear Seat 50 62
4 Years Old and Younger 76 86
5 Years Old and Older 51 62
All Occupants 58 67
AlcoholDrivers are considered to be alcohol-impaired when their blood alcohol concentration (BAC) is .08 grams per deciliter (g/dL) or higher. Thus, any fatality occurring in a crash involving a driver with a BAC of .08 or higher is considered to be an alcohol-impaired-driving fatality. The term “driver” refers to the operator of any motor vehicle, including a motorcycle.
In 2009, there were 10,839 alcohol-impaired-driving fatalities. This is a decrease of 7.4 percent compared to 2008 (11,711), and it represents an average of one alcohol-impaired-driving fatality every 48 minutes.
The 10,839 alcohol-impaired-driving fatalities in 2009 (32% of total traffic fatalities) represent a 19-percent decrease from the 13,324 alcohol impaired-driving fatalities reported in 2000 (32% of the total).
Over 1.48 million drivers were arrested in 2008 for driving under the influence of alcohol or narcotics (FBI’s Uniform Crime Report, 2008). This is an arrest rate of 1 for every 141 licensed drivers in the United States (based on 2008 figures).
In fatal crashes in 2009, 29 percent of motorcycle riders had a BAC level of .08 g/dL or higher, as compared with 23 percent for drivers of light trucks, 23 percent for passenger car drivers, and 2 percent for drivers of large trucks.
In fatal crashes in 2009, the highest percentages of drivers with BAC levels of .08 g/dL or higher were recorded for drivers 21 to 24 years old (35%), followed by ages 25 to 34 (32%) and 35 to 44 (26%).
Alcohol-impaired-driving fatalities fell to 10,839 in 2009 – 32 percent of all traffic fatalities for the year.
Important Safety InformationChildren in rear-facing child safety seats should not be placed in the front seat of cars equipped with passenger-side frontal air bags. The impact of a deploying air bag striking a rear-facing child safety seat could result in injury to the child. NHTSA also recommends that children age 12 and under sit in the rear seat away from the force of a deploying frontal air bag.
NHTSA’s National Center for Statistics and Analysis 1200 New Jersey Avenue SE., Washington, DC 20590
5
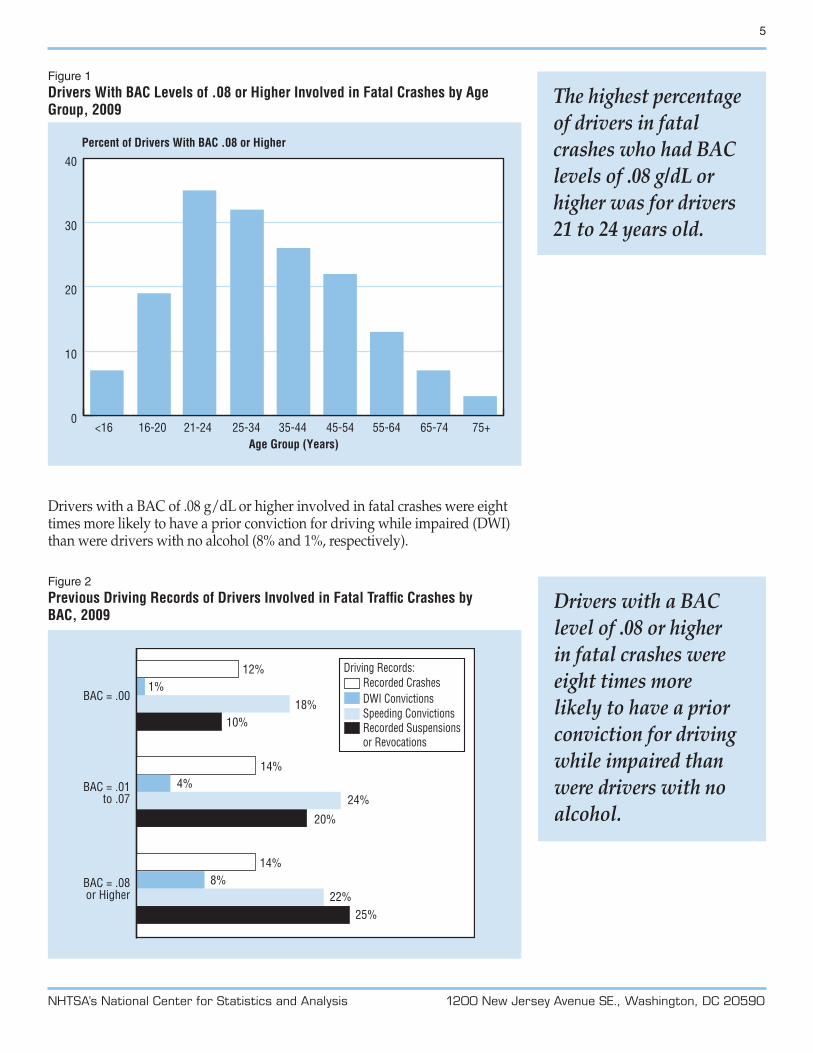
The highest percentage of drivers in fatal crashes who had BAC levels of .08 g/dL or higher was for drivers 21 to 24 years old.
Figure 1Drivers With BAC Levels of .08 or Higher Involved in Fatal Crashes by Age Group, 2009
0
10
20
30
40
Percent of Drivers With BAC .08 or Higher
16-20 21-24 25-34<16 35-44 45-54 55-64Age Group (Years)
65-74 75+
Drivers with a BAC of .08 g/dL or higher involved in fatal crashes were eight times more likely to have a prior conviction for driving while impaired (DWI) than were drivers with no alcohol (8% and 1%, respectively).
Figure 2Previous Driving Records of Drivers Involved in Fatal Traffic Crashes by BAC, 2009
BAC = .00
12%1%
18%10%
14%4%
24%
20%
14%8%
22%25%
BAC = .01to .07
BAC = .08or Higher
Driving Records:
DWI ConvictionsSpeeding Convictions
Recorded Crashes
Recorded Suspensionsor Revocations
Drivers with a BAC level of .08 or higher in fatal crashes were eight times more likely to have a prior conviction for driving while impaired than were drivers with no alcohol.

NHTSA’s National Center for Statistics and Analysis 1200 New Jersey Avenue SE., Washington, DC 20590
6
SpeedingNHTSA considers a crash to be speeding-related if the driver was charged with a speeding-related offense or if an officer indicated that racing, driving too fast for conditions, or exceeding the posted speed limit was a contributing factor in the crash.
Table 4Fatalities in Motor Vehicle Traffic Crashes by Speeding Involvement, 2000–2009
YearSpeeding Not Speeding
Number Percent Number Percent2000 12,552 30 29,393 70
2001 12,924 31 29,272 69
2002 13,799 32 29,206 68
2003 13,499 31 29,385 69
2004 13,291 31 29,545 69
2005 13,583 31 29,927 69
2006 13,609 32 29,099 68
2007 13,140 32 28,119 68
2008 11,767 31 25,656 69
2009 10,591 31 23,217 69
For drivers involved in fatal crashes, young males are the most likely to be speeding. In 2009, 39 percent of the 15- to 20-year-old male drivers who were involved in fatal crashes were speeding at the time of the crash.
Speeding is one of the most prevalent factors contributing to traffic crashes. In 2009, speeding was a contributing factor in 31 percent of all fatal crashes, and 10,591 lives were lost in speeding-related crashes.
Figure 3Speeding Drivers in Fatal Crashes by Age and Sex, 2009
0
5
10
15
20
25
30
35
40
21-24
Percent Speeding
15-20 25-34 35-44 45-54 55-64 65-74 75+Age Group (Years)
Females Males
NHTSA’s National Center for Statistics and Analysis 1200 New Jersey Avenue SE., Washington, DC 20590
7
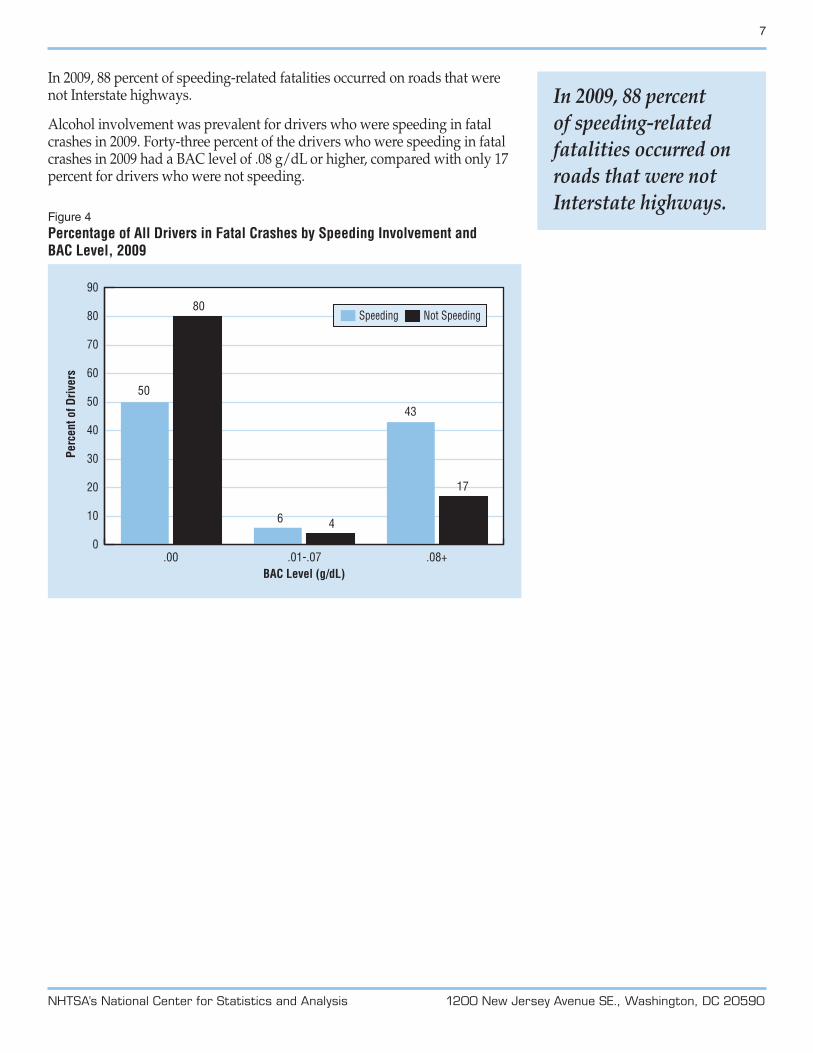
In 2009, 88 percent of speeding-related fatalities occurred on roads that were not Interstate highways.
Alcohol involvement was prevalent for drivers who were speeding in fatal crashes in 2009. Forty-three percent of the drivers who were speeding in fatal crashes in 2009 had a BAC level of .08 g/dL or higher, compared with only 17 percent for drivers who were not speeding.
Figure 4Percentage of All Drivers in Fatal Crashes by Speeding Involvement and BAC Level, 2009
0
10
20
30
40
50
60
70
80
90
Perc
ent o
f Driv
ers
.00
50
80
6 4
43
17
.01-.07BAC Level (g/dL)
.08+
Speeding Not Speeding
In 2009, 88 percent of speeding-related fatalities occurred on roads that were not Interstate highways.
NHTSA’s National Center for Statistics and Analysis 1200 New Jersey Avenue SE., Washington, DC 20590
8
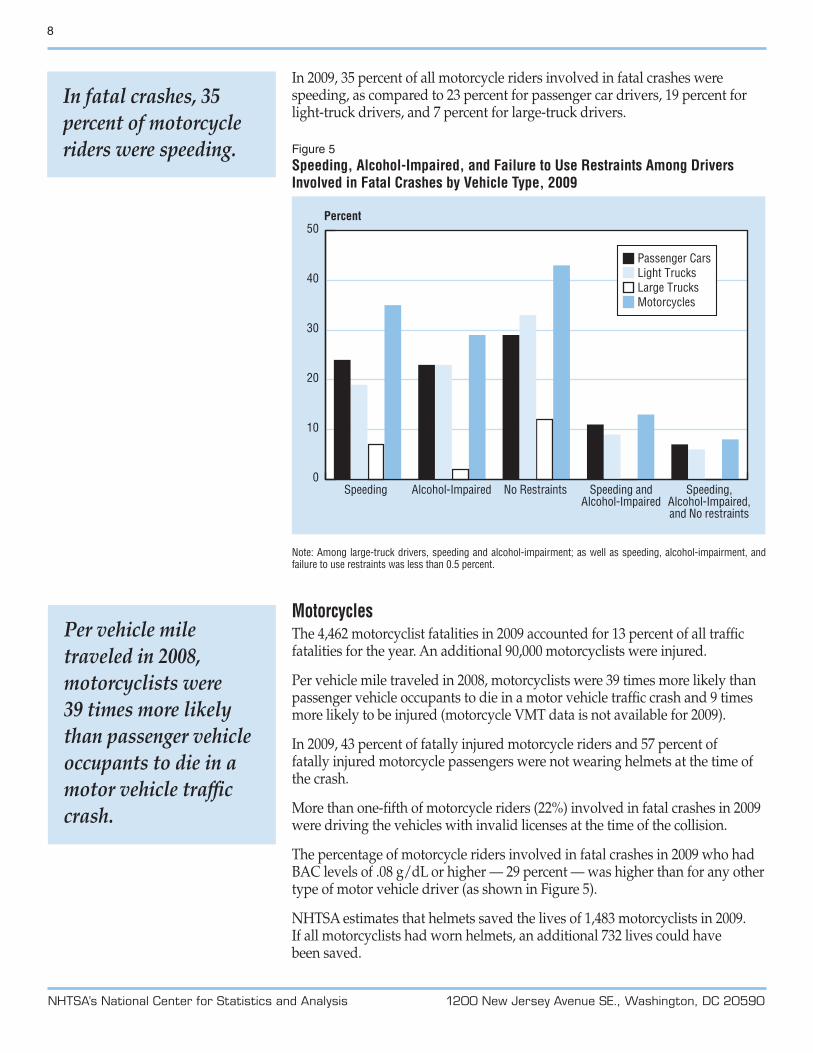
In 2009, 35 percent of all motorcycle riders involved in fatal crashes were speeding, as compared to 23 percent for passenger car drivers, 19 percent for light-truck drivers, and 7 percent for large-truck drivers.
Figure 5Speeding, Alcohol-Impaired, and Failure to Use Restraints Among Drivers Involved in Fatal Crashes by Vehicle Type, 2009
0
10
20
30
40
50Percent
Speeding Alcohol-Impaired No Restraints Speeding andAlcohol-Impaired
Speeding,Alcohol-Impaired,and No restraints
Passenger CarsLight TrucksLarge TrucksMotorcycles
Note: Among large-truck drivers, speeding and alcohol-impairment; as well as speeding, alcohol-impairment, and failure to use restraints was less than 0.5 percent.
MotorcyclesThe 4,462 motorcyclist fatalities in 2009 accounted for 13 percent of all traffic fatalities for the year. An additional 90,000 motorcyclists were injured.
Per vehicle mile traveled in 2008, motorcyclists were 39 times more likely than passenger vehicle occupants to die in a motor vehicle traffic crash and 9 times more likely to be injured (motorcycle VMT data is not available for 2009).
In 2009, 43 percent of fatally injured motorcycle riders and 57 percent of fatally injured motorcycle passengers were not wearing helmets at the time of the crash.
More than one-fifth of motorcycle riders (22%) involved in fatal crashes in 2009 were driving the vehicles with invalid licenses at the time of the collision.
The percentage of motorcycle riders involved in fatal crashes in 2009 who had BAC levels of .08 g/dL or higher — 29 percent — was higher than for any other type of motor vehicle driver (as shown in Figure 5).
NHTSA estimates that helmets saved the lives of 1,483 motorcyclists in 2009. If all motorcyclists had worn helmets, an additional 732 lives could have been saved.
Per vehicle mile traveled in 2008, motorcyclists were 39 times more likely than passenger vehicle occupants to die in a motor vehicle traffic crash.
In fatal crashes, 35 percent of motorcycle riders were speeding.
NHTSA’s National Center for Statistics and Analysis 1200 New Jersey Avenue SE., Washington, DC 20590
9
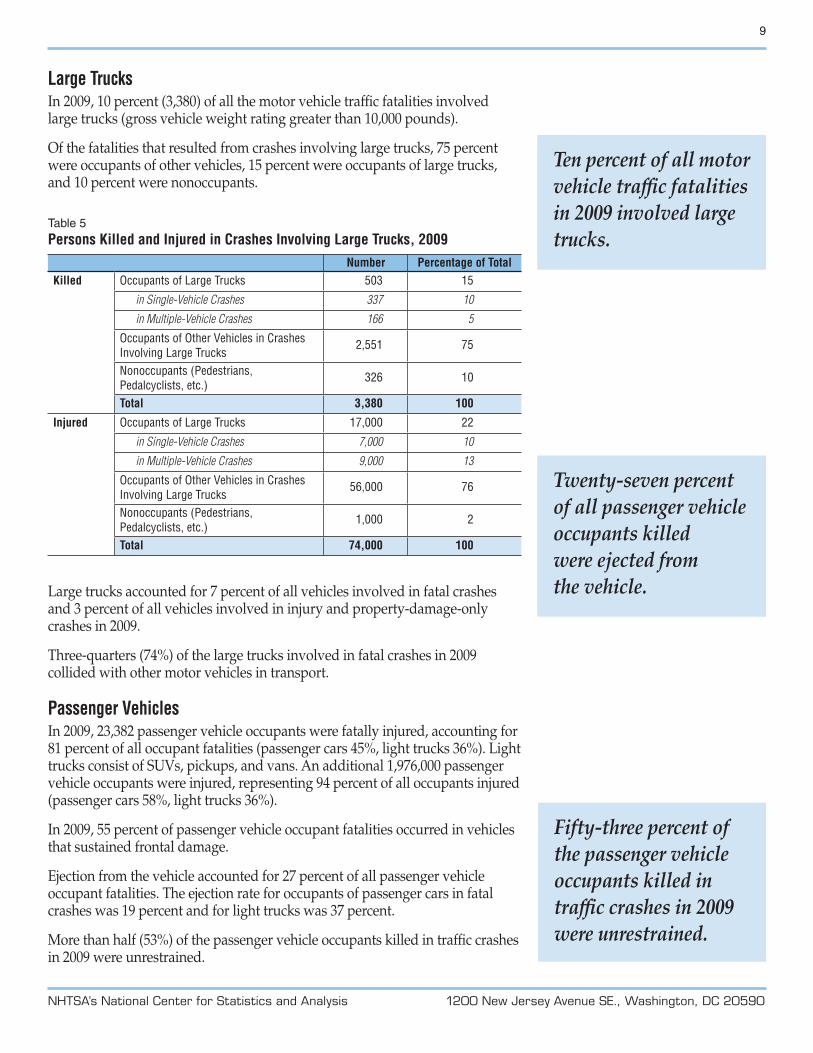
Large TrucksIn 2009, 10 percent (3,380) of all the motor vehicle traffic fatalities involved large trucks (gross vehicle weight rating greater than 10,000 pounds).
Of the fatalities that resulted from crashes involving large trucks, 75 percent were occupants of other vehicles, 15 percent were occupants of large trucks, and 10 percent were nonoccupants.
Table 5Persons Killed and Injured in Crashes Involving Large Trucks, 2009
Number Percentage of TotalKilled Occupants of Large Trucks 503 15
in Single-Vehicle Crashes 337 10
in Multiple-Vehicle Crashes 166 5
Occupants of Other Vehicles in Crashes Involving Large Trucks
2,551 75
Nonoccupants (Pedestrians, Pedalcyclists, etc.)
326 10
Total 3,380 100
Injured Occupants of Large Trucks 17,000 22
in Single-Vehicle Crashes 7,000 10
in Multiple-Vehicle Crashes 9,000 13
Occupants of Other Vehicles in Crashes Involving Large Trucks
56,000 76
Nonoccupants (Pedestrians, Pedalcyclists, etc.)
1,000 2
Total 74,000 100
Large trucks accounted for 7 percent of all vehicles involved in fatal crashes and 3 percent of all vehicles involved in injury and property-damage-only crashes in 2009.
Three-quarters (74%) of the large trucks involved in fatal crashes in 2009 collided with other motor vehicles in transport.
Passenger VehiclesIn 2009, 23,382 passenger vehicle occupants were fatally injured, accounting for 81 percent of all occupant fatalities (passenger cars 45%, light trucks 36%). Light trucks consist of SUVs, pickups, and vans. An additional 1,976,000 passenger vehicle occupants were injured, representing 94 percent of all occupants injured (passenger cars 58%, light trucks 36%).
In 2009, 55 percent of passenger vehicle occupant fatalities occurred in vehicles that sustained frontal damage.
Ejection from the vehicle accounted for 27 percent of all passenger vehicle occupant fatalities. The ejection rate for occupants of passenger cars in fatal crashes was 19 percent and for light trucks was 37 percent.
More than half (53%) of the passenger vehicle occupants killed in traffic crashes in 2009 were unrestrained.
Ten percent of all motor vehicle traffic fatalities in 2009 involved large trucks.
Twenty-seven percent of all passenger vehicle occupants killed were ejected from the vehicle.
Fifty-three percent of the passenger vehicle occupants killed in traffic crashes in 2009 were unrestrained.
NHTSA’s National Center for Statistics and Analysis 1200 New Jersey Avenue SE., Washington, DC 20590
10
SUVs had the highest rollover involvement rate of any vehicle type in fatal crashes — 32 percent, as compared with 28 percent for pickups, 17 percent for vans, and 16 percent for passenger cars.
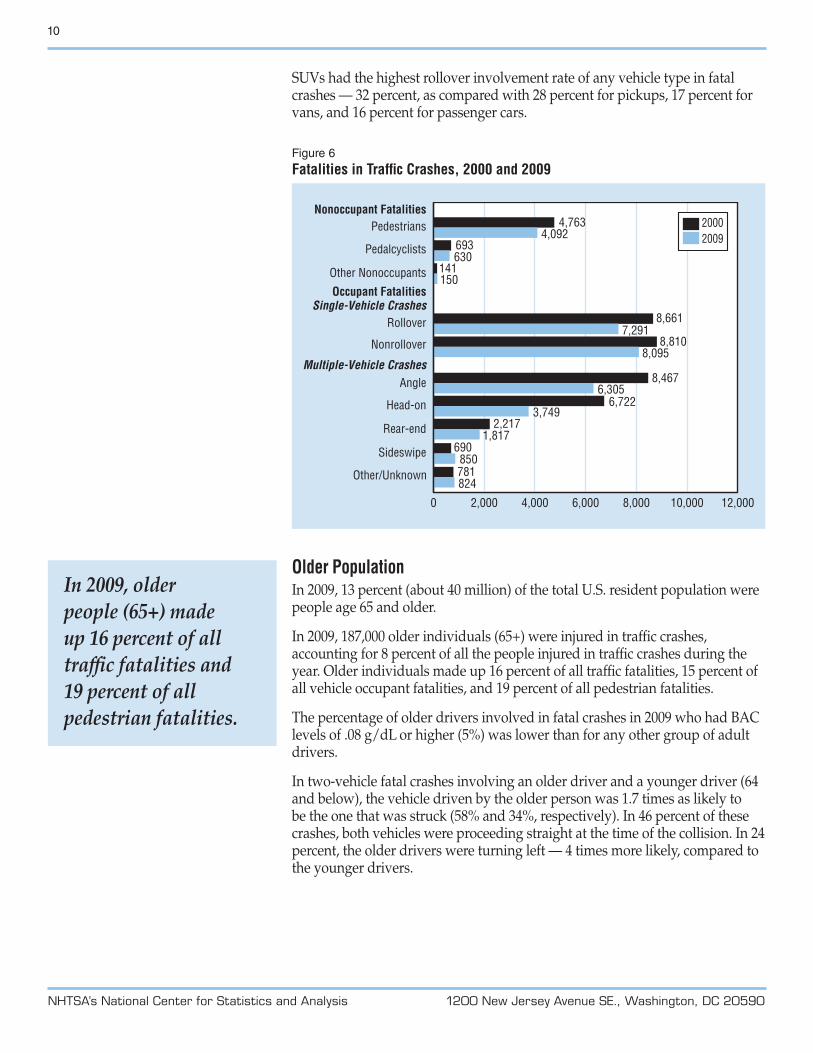
Figure 6Fatalities in Traffic Crashes, 2000 and 2009
0 2,000 4,000 6,000 8,000 10,000 12,000
PedestriansNonoccupant Fatalities
Occupant FatalitiesSingle-Vehicle Crashes
Multiple-Vehicle Crashes
4,7634,092
693630
141150
8,6617,291
8,8108,095
8,4676,305
6,7223,749
2,2171,817
690850781824
Pedalcyclists
Other Nonoccupants
Rollover
Nonrollover
Rear-end
Head-on
Angle
Sideswipe
Other/Unknown
20092000
Older PopulationIn 2009, 13 percent (about 40 million) of the total U.S. resident population were people age 65 and older.
In 2009, 187,000 older individuals (65+) were injured in traffic crashes, accounting for 8 percent of all the people injured in traffic crashes during the year. Older individuals made up 16 percent of all traffic fatalities, 15 percent of all vehicle occupant fatalities, and 19 percent of all pedestrian fatalities.
The percentage of older drivers involved in fatal crashes in 2009 who had BAC levels of .08 g/dL or higher (5%) was lower than for any other group of adult drivers.
In two-vehicle fatal crashes involving an older driver and a younger driver (64 and below), the vehicle driven by the older person was 1.7 times as likely to be the one that was struck (58% and 34%, respectively). In 46 percent of these crashes, both vehicles were proceeding straight at the time of the collision. In 24 percent, the older drivers were turning left — 4 times more likely, compared to the younger drivers.
In 2009, older people (65+) made up 16 percent of all traffic fatalities and 19 percent of all pedestrian fatalities.

NHTSA’s National Center for Statistics and Analysis 1200 New Jersey Avenue SE., Washington, DC 20590
11
Young DriversIn 2009, 5,148 15- to 20-year-old drivers were involved in fatal crashes — a 37-percent decrease from the 8,224 involved in 2000. Driver fatalities for this age group decreased by 35 percent between 2000 and 2009.
Of all (45,230) drivers involved in fatal crashes, 11 percent (5,148) were young drivers, and of all (9,614,000) drivers involved in police-reported crashes, 14 percent (1,337,000) were young drivers.
In 2009, 33 percent of the young drivers (15 to 20 years old) who were killed in crashes had a BAC of .01 g/dL or higher; 28 percent had a BAC of .08 g/dL or higher.
Drivers are less likely to use restraints when they have been drinking. In 2009, 60 percent of the young drivers of passenger vehicles involved in fatal crashes who had been drinking were unrestrained. Of the young drivers who had been drinking and were killed in crashes, 70 percent were unrestrained.
ChildrenIn 2009, of the 33,808 traffic fatalities in the United States, the 14-and-younger age group accounted for 4 percent (1,314). This age group accounted for 3 percent (970) of all vehicle occupant fatalities, 8 percent (179,000) of all the people injured in motor vehicle crashes, and 7 percent (156,000) of all the vehicle occupants injured in crashes. During 2009, fatalities in this age group (1,314) decreased 3 percent from the 1,350 fatalities in 2008.
One-fifth (19%) of all children between the ages of 5 and 9 who were killed in motor vehicle traffic crashes were pedestrians. Among fatalities in children age 14 and younger, pedestrian fatalities accounted for 19 percent in 2009.
In 2009, a total of 1,314 children age 14 and younger were killed in motor vehicle traffic crashes. Of those 1,314 fatalities, 181 (14%) occurred in alcohol-impaired driving crashes. Out of those 181 deaths, half (92) were occupants of a vehicle with a driver who had a BAC level of .08 g/dL or higher. Another 27 children were pedestrians or pedalcyclists who were struck by drivers with a BAC of .08 g/dL or higher.
PedestriansIn 2009, 59,000 pedestrians were injured and 4,092 were killed in traffic crashes in the United States, representing 3 percent of all the people injured in traffic crashes and 12 percent of all traffic fatalities.
On average, a pedestrian is killed in a motor vehicle crash every 128 minutes, and one is injured every 9 minutes.
Alcohol involvement — either for the driver or the pedestrian — was reported in 48 percent of the traffic crashes that resulted in pedestrian fatalities. Of the pedestrians involved, 35 percent had BAC levels of .08 g/dL or higher. Of the drivers involved in these fatal crashes, only 13 percent had BAC levels of .08 g/dL or higher. In 6 percent of the crashes, both the driver and the pedestrian had BAC levels of .08 g/dL or higher.
In 2009, 11 percent of all the drivers involved in fatal crashes were between 15 and 20 years old.
Pedestrian fatalities in 2009 were 14 percent lower than in 2000.
NHTSA’s National Center for Statistics and Analysis 1200 New Jersey Avenue SE., Washington, DC 20590
12
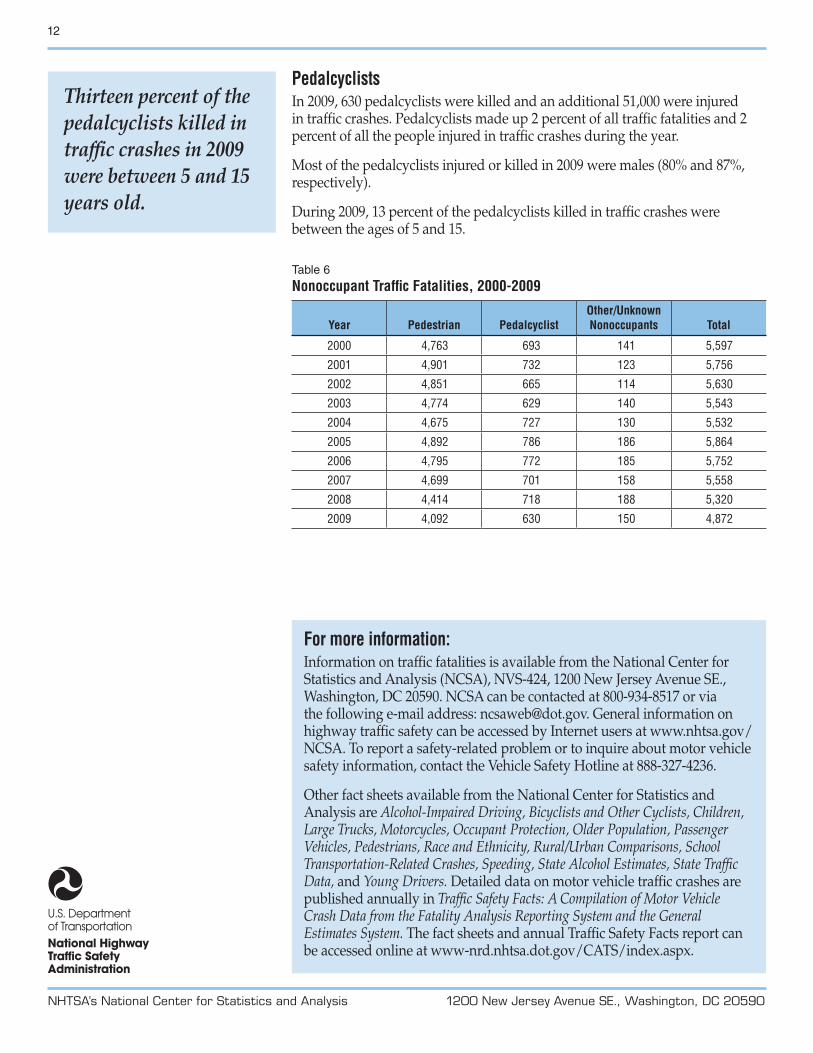
Thirteen percent of the pedalcyclists killed in traffic crashes in 2009 were between 5 and 15 years old.
PedalcyclistsIn 2009, 630 pedalcyclists were killed and an additional 51,000 were injured in traffic crashes. Pedalcyclists made up 2 percent of all traffic fatalities and 2 percent of all the people injured in traffic crashes during the year.
Most of the pedalcyclists injured or killed in 2009 were males (80% and 87%, respectively).
During 2009, 13 percent of the pedalcyclists killed in traffic crashes were between the ages of 5 and 15.
Table 6Nonoccupant Traffic Fatalities, 2000-2009
Year Pedestrian PedalcyclistOther/Unknown Nonoccupants Total
2000 4,763 693 141 5,597
2001 4,901 732 123 5,756
2002 4,851 665 114 5,630
2003 4,774 629 140 5,543
2004 4,675 727 130 5,532
2005 4,892 786 186 5,864
2006 4,795 772 185 5,752
2007 4,699 701 158 5,558
2008 4,414 718 188 5,320
2009 4,092 630 150 4,872
For more information: Information on traffic fatalities is available from the National Center for Statistics and Analysis (NCSA), NVS-424, 1200 New Jersey Avenue SE., Washington, DC 20590. NCSA can be contacted at 800-934-8517 or via the following e-mail address: [email protected]. General information on highway traffic safety can be accessed by Internet users at www.nhtsa.gov/NCSA. To report a safety-related problem or to inquire about motor vehicle safety information, contact the Vehicle Safety Hotline at 888-327-4236.
Other fact sheets available from the National Center for Statistics and Analysis are Alcohol-Impaired Driving, Bicyclists and Other Cyclists, Children, Large Trucks, Motorcycles, Occupant Protection, Older Population, Passenger Vehicles, Pedestrians, Race and Ethnicity, Rural/Urban Comparisons, School Transportation-Related Crashes, Speeding, State Alcohol Estimates, State Traffic Data, and Young Drivers. Detailed data on motor vehicle traffic crashes are published annually in Traffic Safety Facts: A Compilation of Motor Vehicle Crash Data from the Fatality Analysis Reporting System and the General Estimates System. The fact sheets and annual Traffic Safety Facts report can be accessed online at www-nrd.nhtsa.dot.gov/CATS/index.aspx.