Embed Size (px)
Citation preview
8/8/2019 2009 Enrollment Survey
http://slidepdf.com/reader/full/2009-enrollment-survey 1/42
Enrollments in Languages Other Than Englishin United States Institutions of Higher Education,Fall 2009
Nelly Furman, David Goldberg, and Natalia LusinWeb publication, December 2010
All material published by the Modern Language Association in any medium is protected by copyright. Users may
link to the MLA Web page freely and may quote from MLA publications as allowed by the doctrine of fair use.Written permission is required for any other reproduction of material from any MLA publication.
Send requests for permission to reprint material to the MLA permissions manager by mail (26 Broadway, New York,
NY 10004-1789), e-mail ([email protected]), or fax (646 458-0030).
© 2010 by The Modern Language Association of America
8/8/2019 2009 Enrollment Survey
http://slidepdf.com/reader/full/2009-enrollment-survey 2/42
the modern language association o america 1
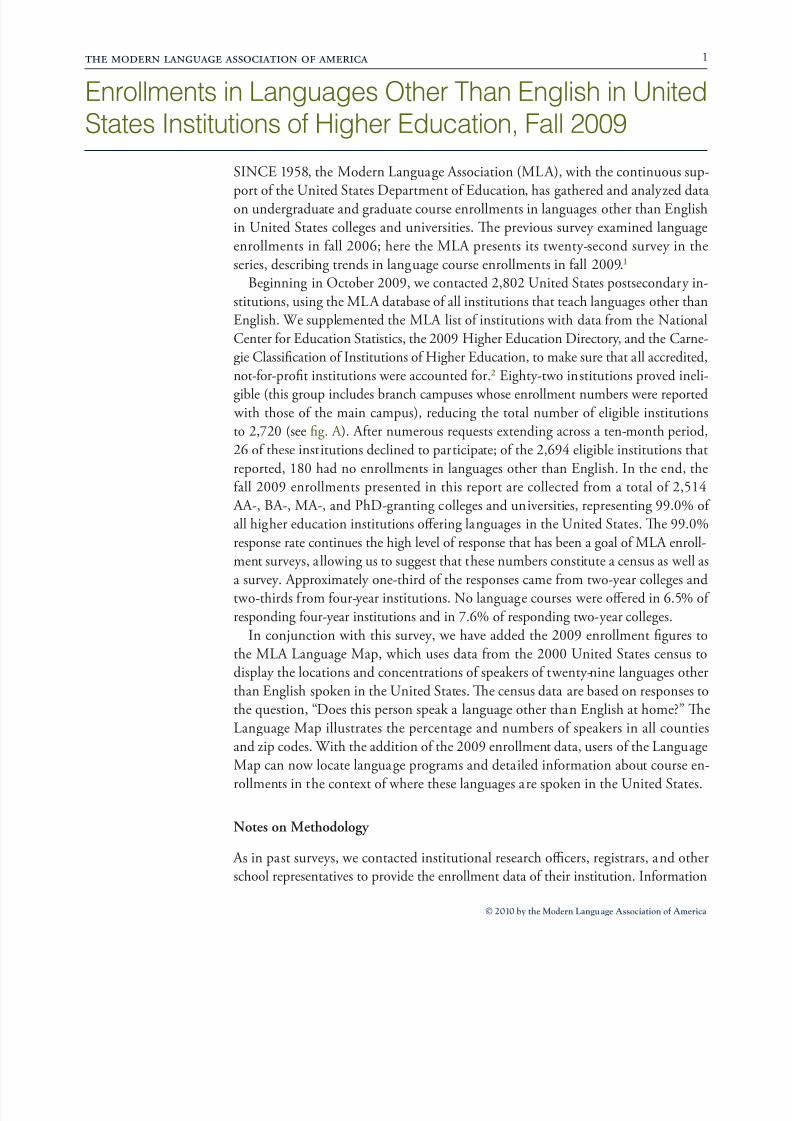
SINCE 1958, the Modern Language Association (MLA), with the continuous sup-
port o the United States Department o Education, has gathered and analyzed dataon undergraduate and graduate course enrollments in languages other than English
in United States colleges and universities. Te previous survey examined language
enrollments in all 2006; here the MLA presents its twenty-second survey in the
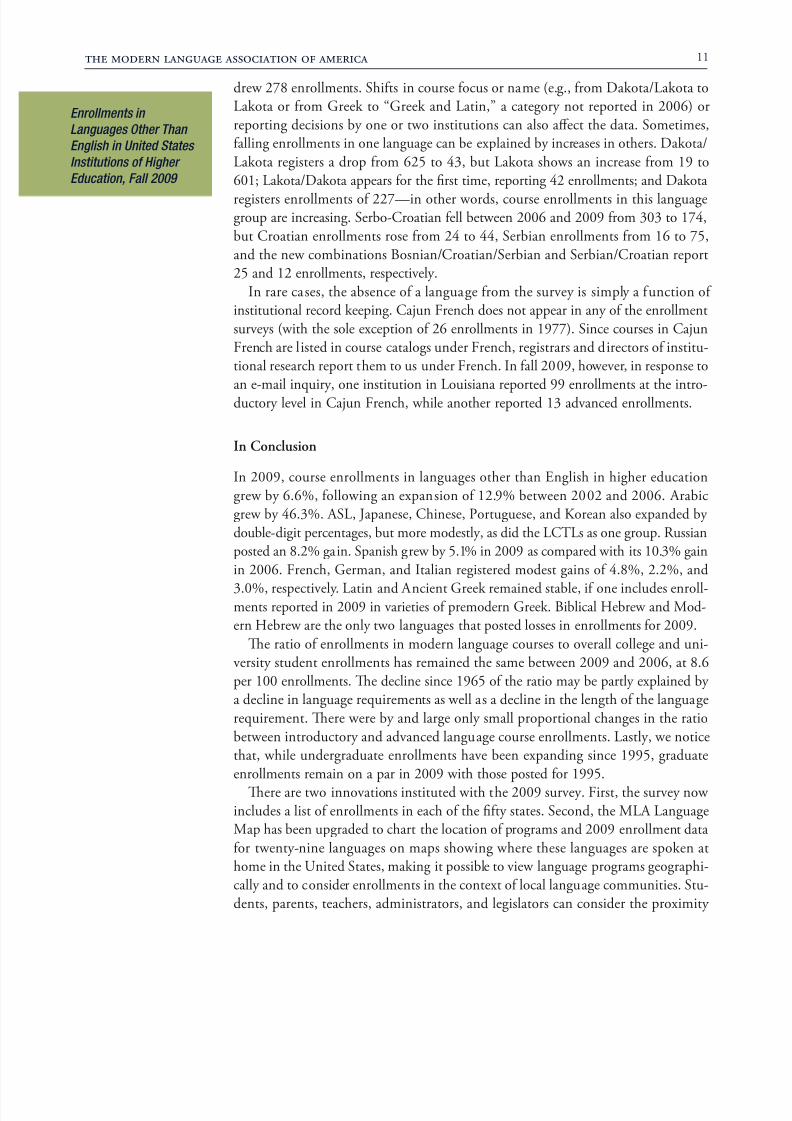
, b 2009.Beginning in October 2009, we contacted 2,802 United States postsecondary in-
stitutions, using the MLA database o all institutions that teach languages other than
English. We supplemented the MLA list o institutions with data rom the National
Center or Education Statistics, the 2009 Higher Education Directory, and the Carne-
gie Classication o Institutions o Higher Education, to make sure that all accredited,
not-or-prot institutions were accounted or. Eighty-two institutions proved ineli-gible (this group includes branch campuses whose enrollment numbers were reported
with those o the main campus), reducing the total number o eligible institutions
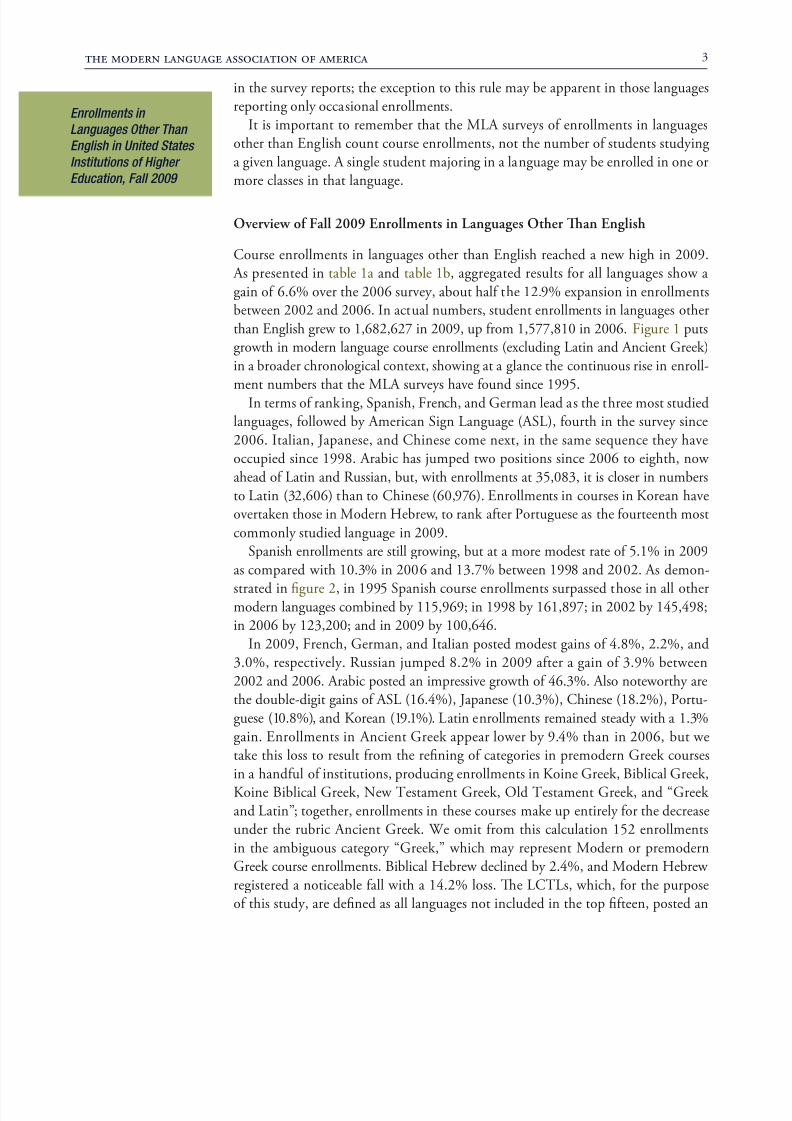
to 2,720 (see g. A ). Ater numerous requests extending across a ten-month period,
26 o these institutions declined to participate; o the 2,694 eligible institutions that
reported, 180 had no enrollments in languages other than English. In the end, the
all 2009 enrollments presented in this report are collected rom a total o 2,514
AA-, BA-, MA-, and PhD-granting colleges and universities, representing 99.0% o
all higher education institutions oering languages in the United States. Te 99.0%
response rate continues the high level o response that has been a goal o MLA enroll-
ment surveys, allowing us to suggest that these numbers constitute a census as well asa survey. Approximately one-third o the responses came rom two-year colleges and
two-thirds rom our-year institutions. No language courses were oered in 6.5% o
responding our-year institutions and in 7.6% o responding two-year colleges.
In conjunction with this survey, we have added the 2009 enrollment gures to
the MLA Language Map, which uses data rom the 2000 United States census to
py pk wy-
than English spoken in the United States. Te census data are based on responses to
q, “D p pk E ?” T
Language Map illustrates the percentage and numbers o speakers in all counties
and zip codes. With the addition o the 2009 enrollment data, users o the Language
Map can now locate language programs and detailed inormation about course en-
x w pk U S.
Notes on Methodology
As in past surveys, we contacted institutional research ocers, registrars, and otherschool representatives to provide the enrollment data o their institution. Inormation
Enrollments in Languages Other Than English in UnitedStates Institutions of Higher Education, Fall 2009
© 2010 by the Modern Language Association of America
8/8/2019 2009 Enrollment Survey
http://slidepdf.com/reader/full/2009-enrollment-survey 3/42
the modern language association o america 2
Enrollments in
Languages Other Than
English in United States
Institutions of Higher
Education, Fall 2009
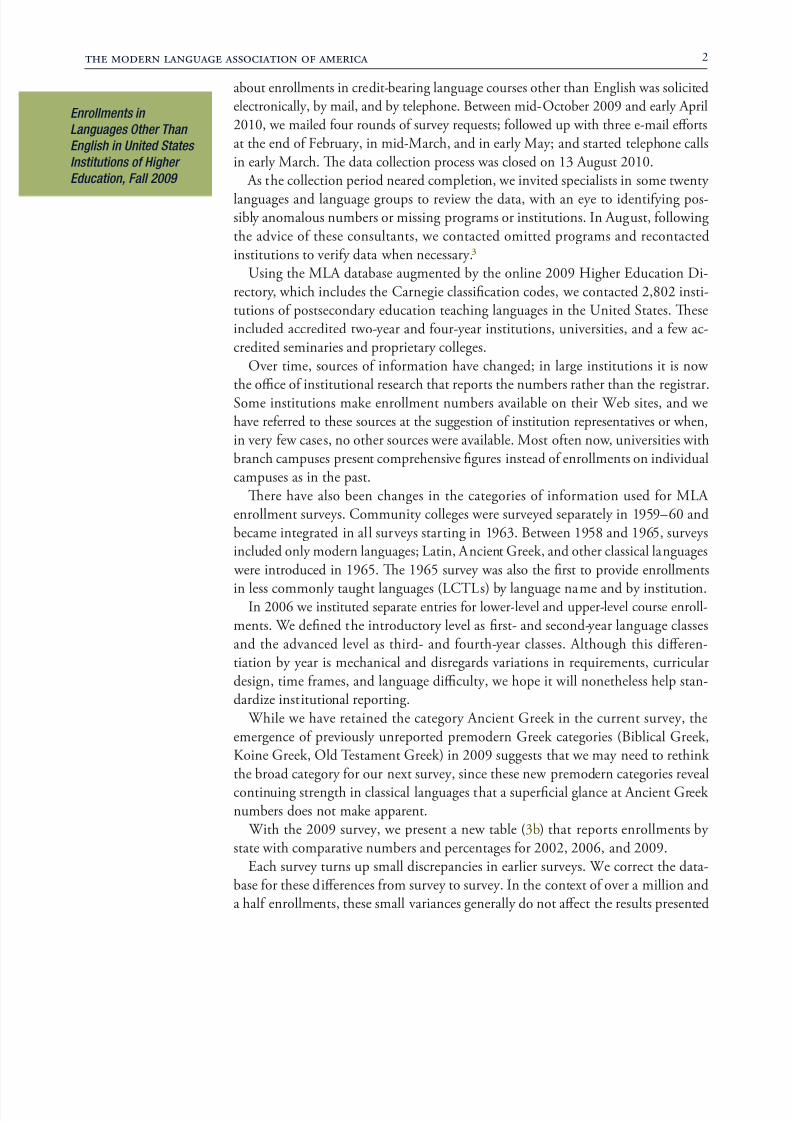
about enrollments in credit-bearing language courses other than English was solicited
electronically, by mail, and by telephone. Between mid-October 2009 and early April
2010, we mailed our rounds o survey requests; ollowed up with three e-mail eorts
at the end o February, in mid-March, and in early May; and started telephone calls
in early March. Te data collection process was closed on 13 August 2010.
As the collection period neared completion, we invited specialists in some twenty languages and language groups to review the data, with an eye to identiying pos-
by b p . I A, w
the advice o these consultants, we contacted omitted programs and recontacted
vy w y.
Using the MLA database augmented by the online 2009 Higher Education Di-
rectory, which includes the Carnegie classication codes, we contacted 2,802 insti-
tutions o postsecondary education teaching languages in the United States. Tese
included accredited two-year and our-year institutions, universities, and a ew ac-
ppy .
Over time, sources o inormation have changed; in large institutions it is now
the oce o institutional research that reports the numbers rather than the registrar.
Some institutions make enrollment numbers available on their Web sites, and we
have reerred to these sources at the suggestion o institution representatives or when,
vy w , w vb. M w, v w
branch campuses present comprehensive gures instead o enrollments on individual
p p.
Tere have also been changes in the categories o inormation used or MLA
enrollment surveys. Community colleges were surveyed separately in 1959–60 and
became integrated in all surveys starting in 1963. Between 1958 and 1965, surveysincluded only modern languages; Latin, Ancient Greek, and other classical languages
were introduced in 1965. Te 1965 survey was also the rst to provide enrollments y (LCL) by by .
In 2006 we instituted separate entries or lower-level and upper-level course enroll-
ments. We dened the introductory level as rst- and second-year language classes
and the advanced level as third- and ourth-year classes. Although this dieren-
tiation by year is mechanical and disregards variations in requirements, curricular
design, time rames, and language diculty, we hope it will nonetheless help stan-
z p.
While we have retained the category Ancient Greek in the current survey, the
emergence o previously unreported premodern Greek categories (Biblical Greek,
Koine Greek, Old estament Greek) in 2009 suggests that we may need to rethink b y x vy, w p v
continuing strength in classical languages that a supercial glance at Ancient Greek
b k pp.
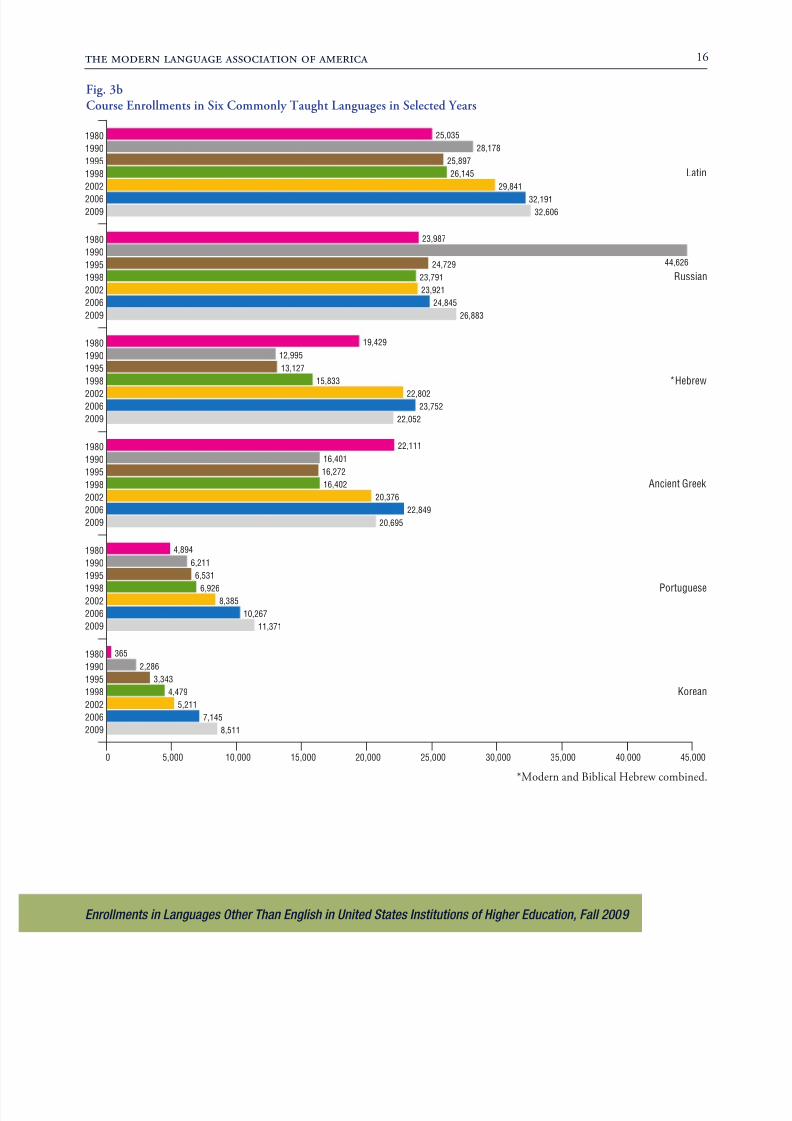
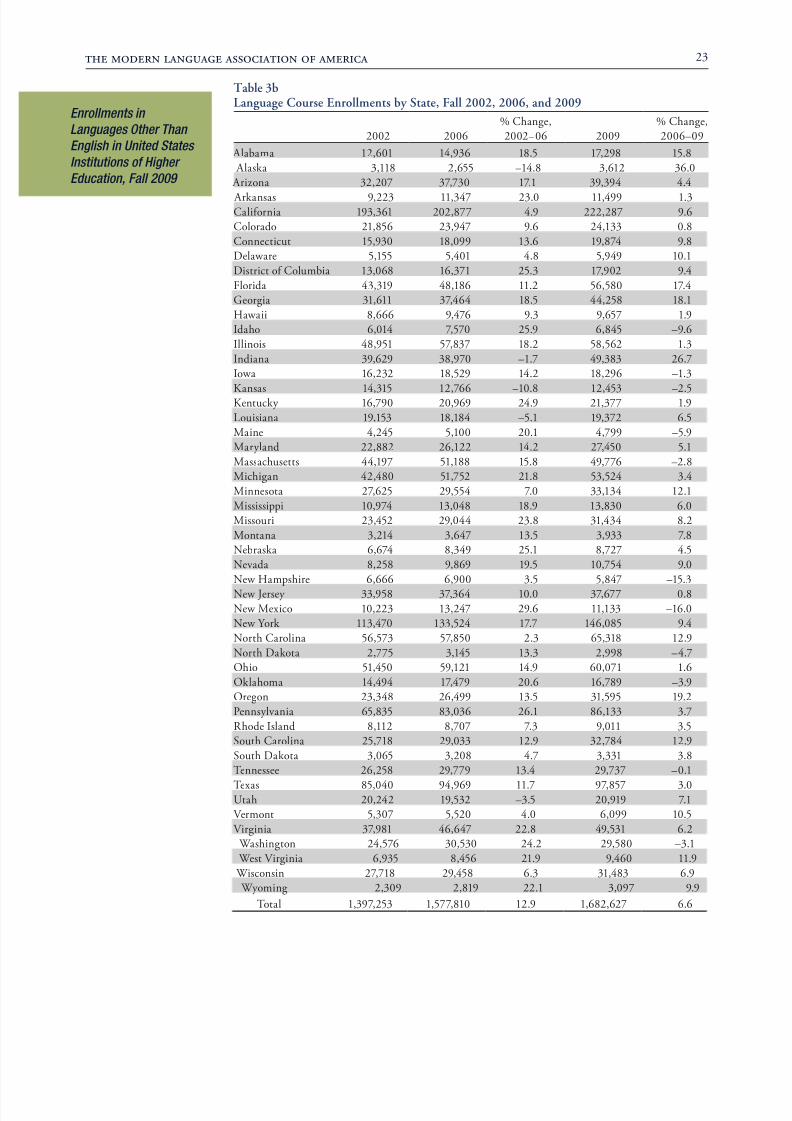
With the 2009 survey, we present a new table (3b) that reports enrollments by
w pv b p 2002, 2006, 2009.
Each survey turns up small discrepancies in earlier surveys. We correct the data-
base or these dierences rom survey to survey. In the context o over a million and
a hal enrollments, these small variances generally do not aect the results presented
8/8/2019 2009 Enrollment Survey
http://slidepdf.com/reader/full/2009-enrollment-survey 4/42
the modern language association o america 3
Enrollments in
Languages Other Than
English in United States
Institutions of Higher
Education, Fall 2009
vy p; xp y b pp
p y .
It is important to remember that the MLA surveys o enrollments in languages
other than English count course enrollments, not the number o students studying
a given language. A single student majoring in a language may be enrolled in one or
.
Overview o Fall 2009 Enrollments in Languages Other Tan English
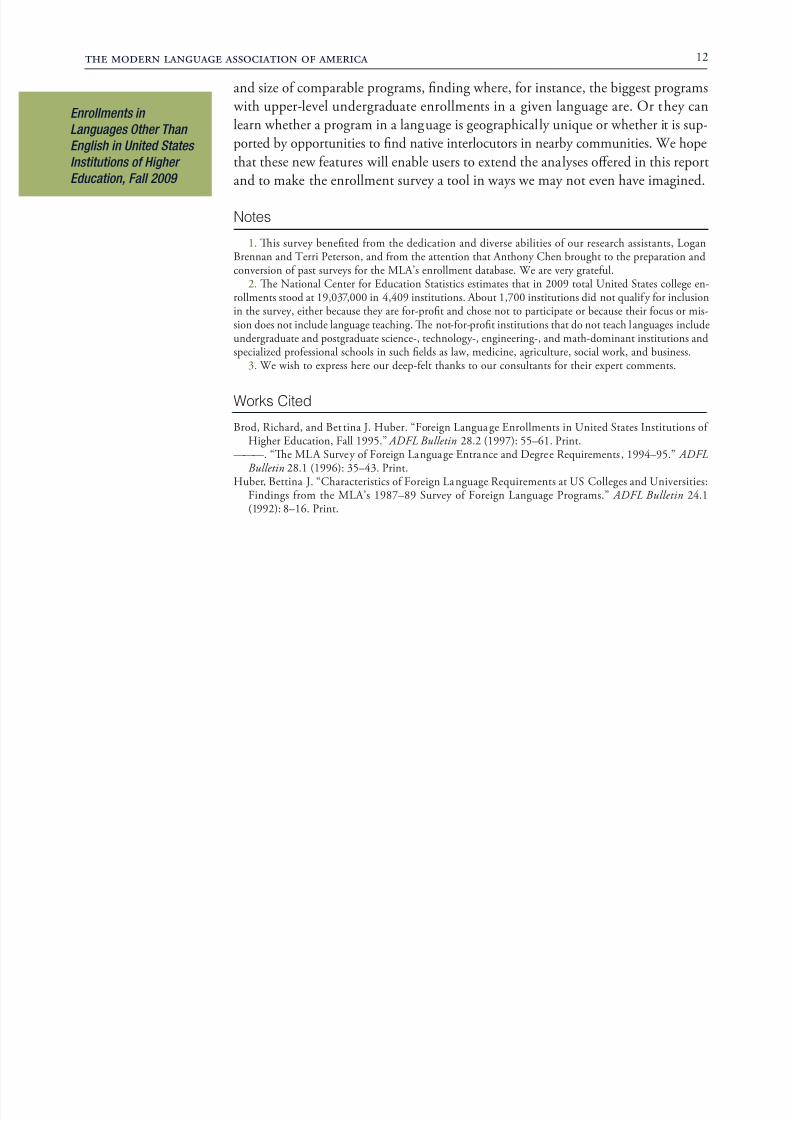
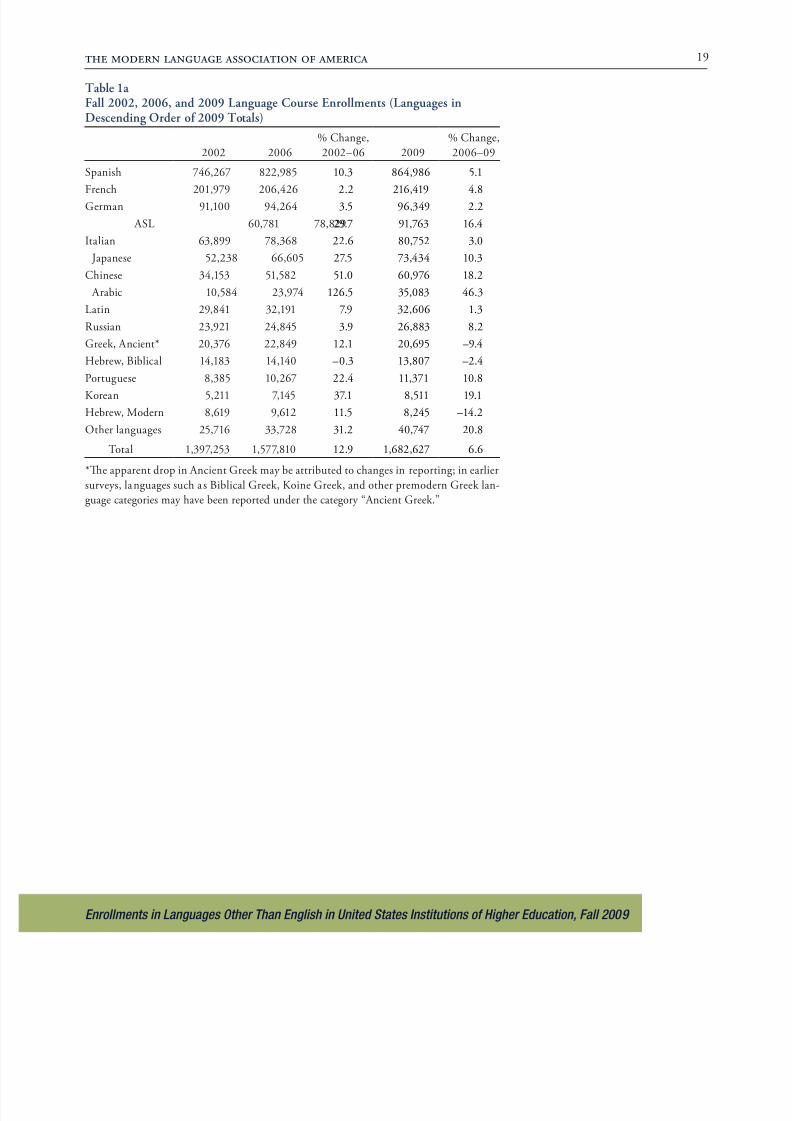
Course enrollments in languages other than English reached a new high in 2009.
As presented in table 1a and table 1b, aggregated results or all languages show a
gain o 6.6% over the 2006 survey, about hal the 12.9% expansion in enrollmentsbetween 2002 and 2006. In actual numbers, student enrollments in languages other
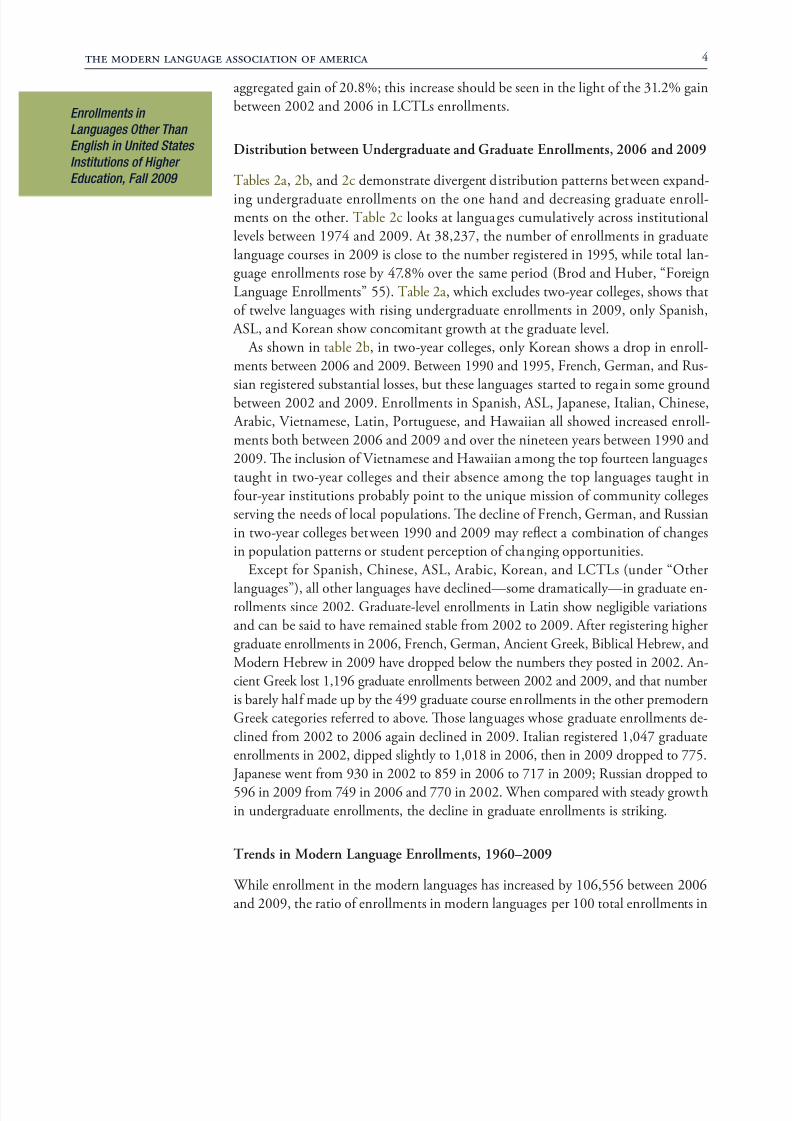
E w 1,682,627 2009, p 1,577,810 2006. F 1 pgrowth in modern language course enrollments (excluding Latin and Ancient Greek)
in a broader chronological context, showing at a glance the continuous rise in enroll-
b MLA vy v 1995.
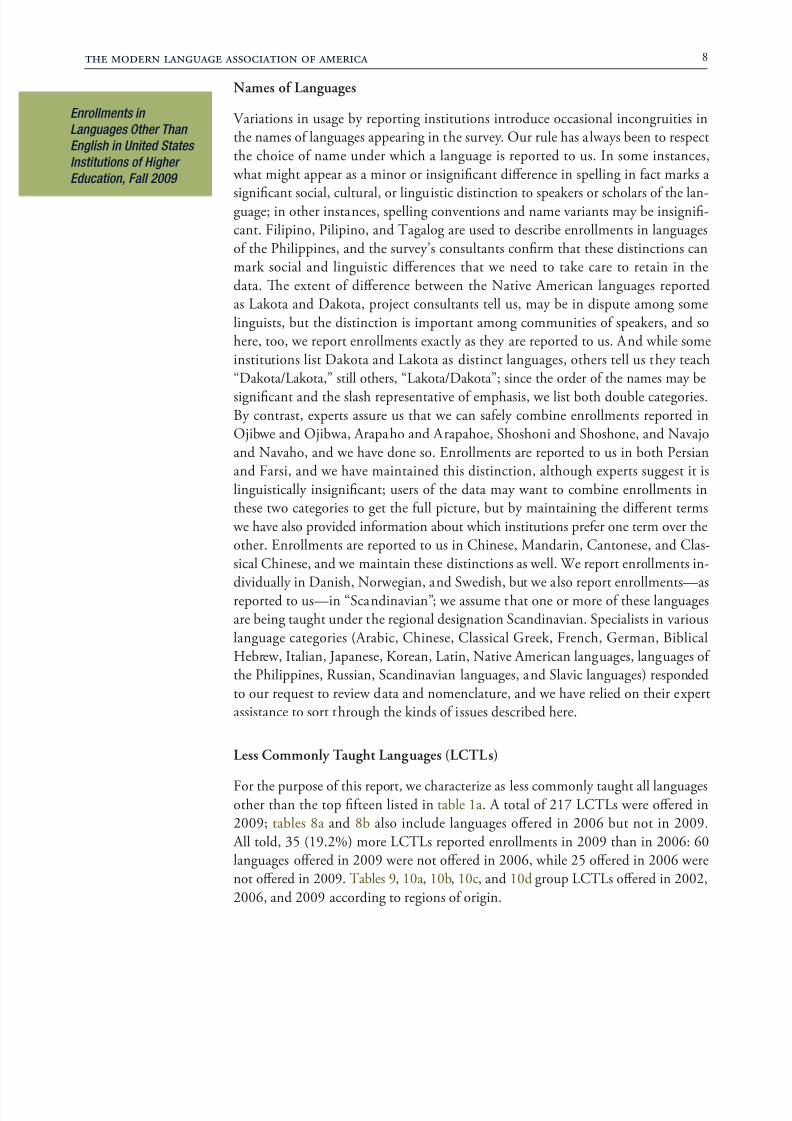
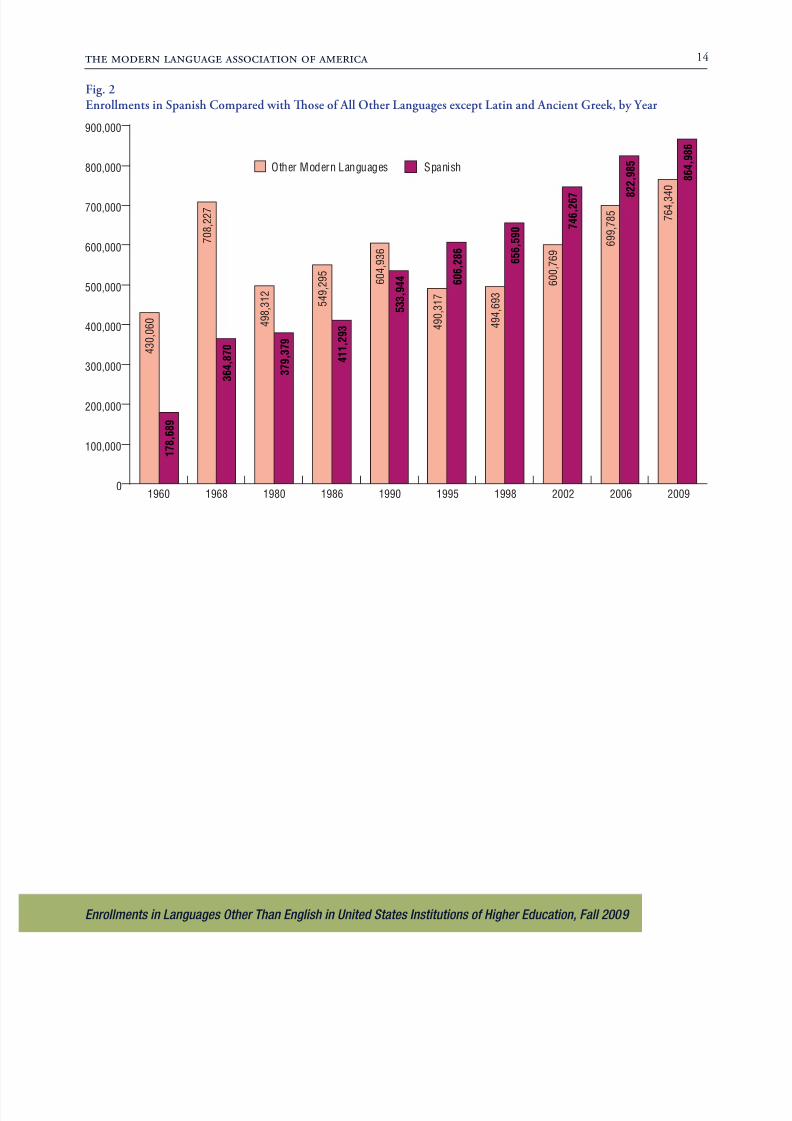
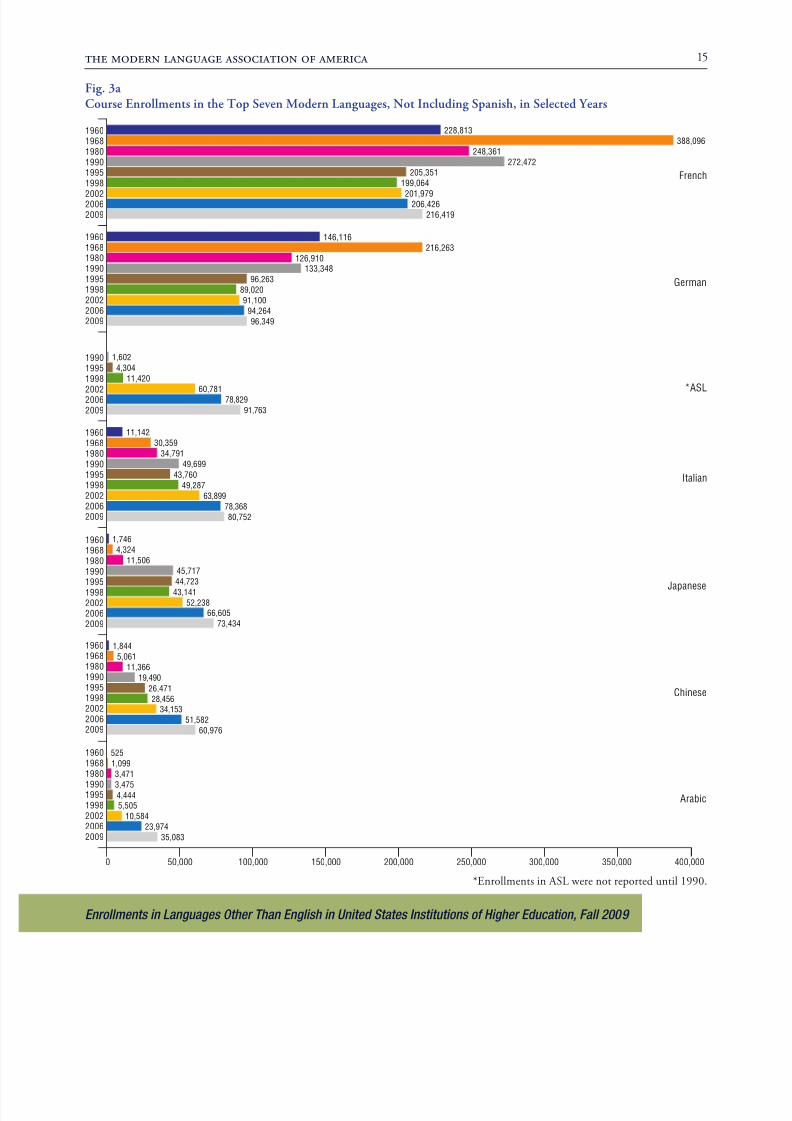
In terms o ranking, Spanish, French, and German lead as the three most studied
languages, ollowed by American Sign Language (ASL), ourth in the survey since
2006. Italian, Japanese, and Chinese come next, in the same sequence they have
occupied since 1998. Arabic has jumped two positions since 2006 to eighth, now
L R, b, w 35,083, b
L (32,606) C (60,976). E K vovertaken those in Modern Hebrew, to rank ater Portuguese as the ourteenth most
y 2009.
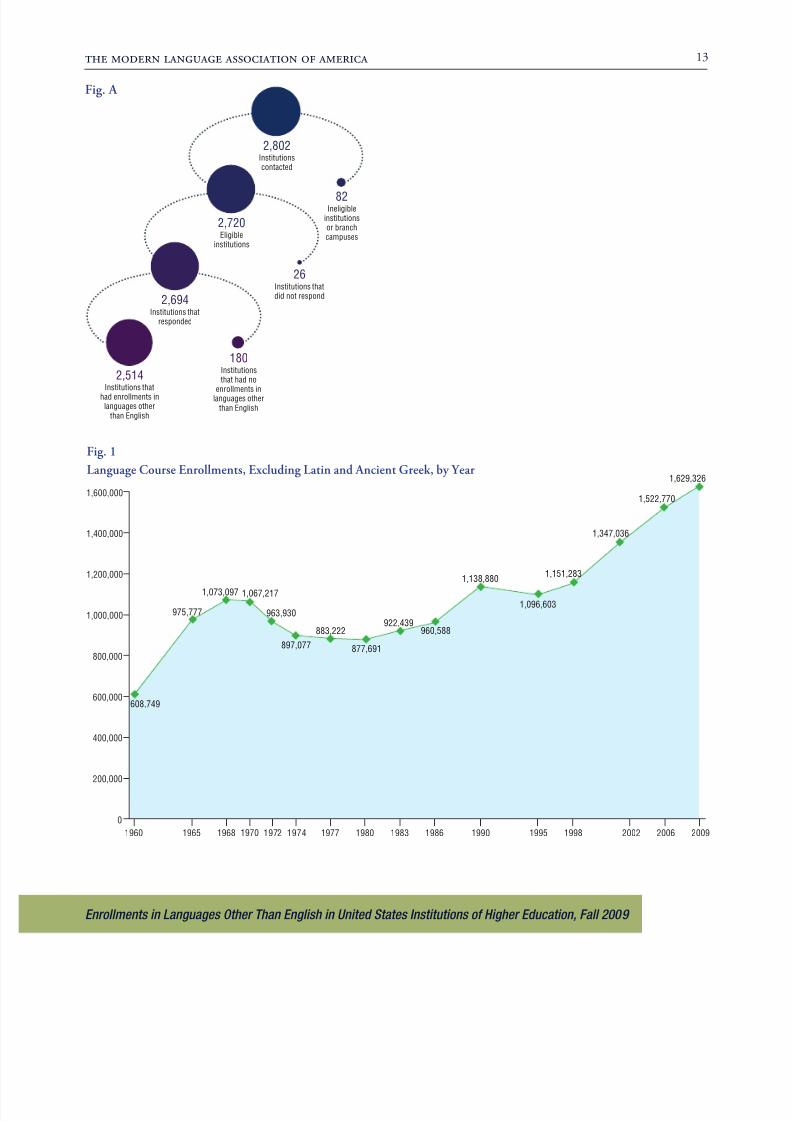
Spanish enrollments are still growing, but at a more modest rate o 5.1% in 2009
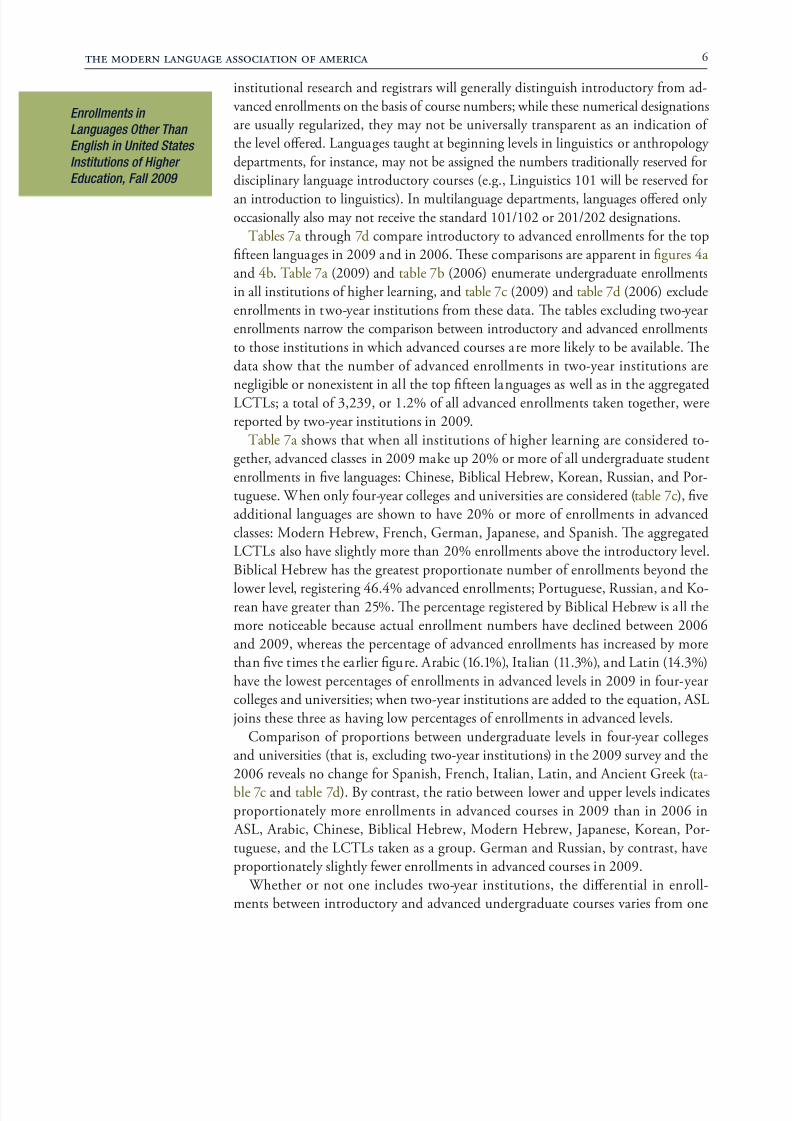
as compared with 10.3% in 2006 and 13.7% between 1998 and 2002. As demon-strated in gure 2, in 1995 Spanish course enrollments surpassed those in all other
modern languages combined by 115,969; in 1998 by 161,897; in 2002 by 145,498;
2006 by 123,200; 2009 by 100,646.
In 2009, French, German, and Italian posted modest gains o 4.8%, 2.2%, and
3.0%, respectively. Russian jumped 8.2% in 2009 ater a gain o 3.9% between
2002 and 2006. Arabic posted an impressive growth o 46.3%. Also noteworthy are
the double-digit gains o ASL (16.4%), Japanese (10.3%), Chinese (18.2%), Portu-
guese (10.8%), and Korean (19.1%). Latin enrollments remained steady with a 1.3%
gain. Enrollments in Ancient Greek appear lower by 9.4% than in 2006, but we
take this loss to result rom the rening o categories in premodern Greek courses , p K Gk, Bb Gk,
Koine Biblical Greek, New estament Greek, Old estament Greek, and “Greek
L”; , k p y
under the rubric Ancient Greek. We omit rom this calculation 152 enrollments
in the ambiguous category “Greek,” which may represent Modern or premodern
Greek course enrollments. Biblical Hebrew declined by 2.4%, and Modern Hebrew
registered a noticeable all with a 14.2% loss. Te LCLs, which, or the purpose
o this study, are dened as all languages not included in the top teen, posted an
8/8/2019 2009 Enrollment Survey
http://slidepdf.com/reader/full/2009-enrollment-survey 5/42
the modern language association o america 4
Enrollments in
Languages Other Than
English in United States
Institutions of Higher
Education, Fall 2009
aggregated gain o 20.8%; this increase should be seen in the light o the 31.2% gain
bw 2002 2006 LCL .
Distribution between Undergraduate and Graduate Enrollments, 2006 and 2009
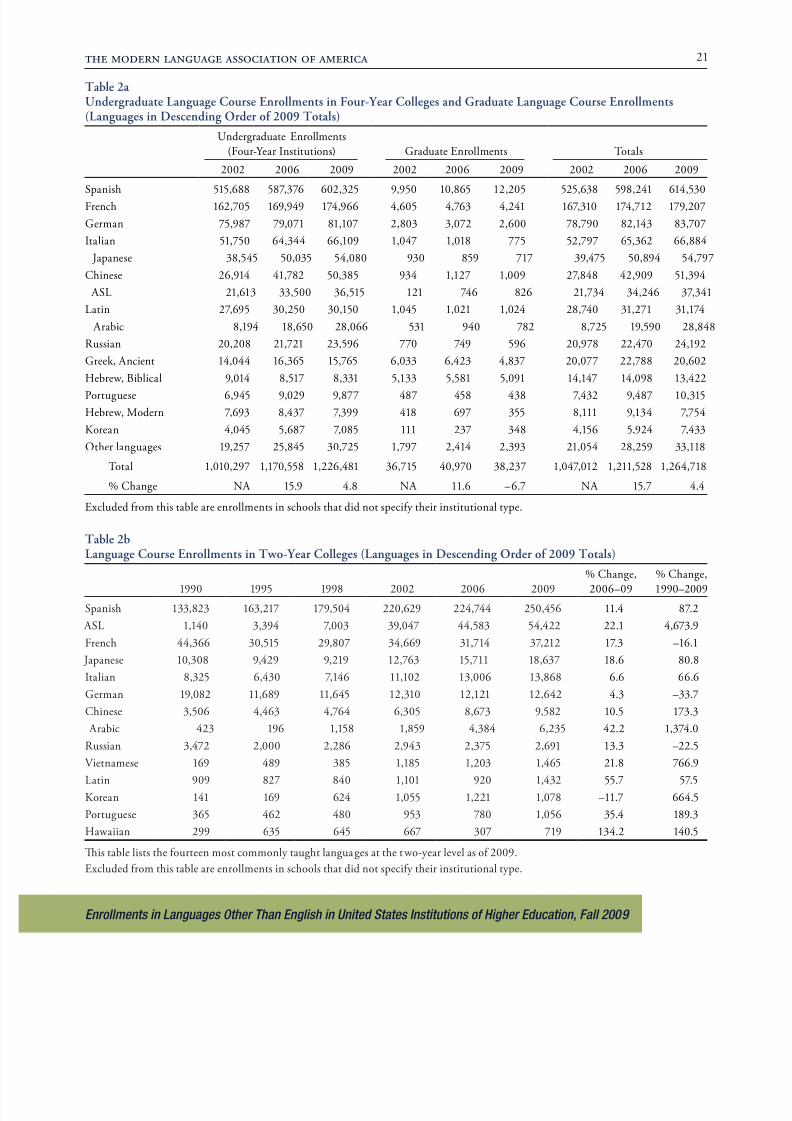
ables 2a, 2b, and 2c demonstrate divergent distribution patterns between expand-ing undergraduate enrollments on the one hand and decreasing graduate enroll-
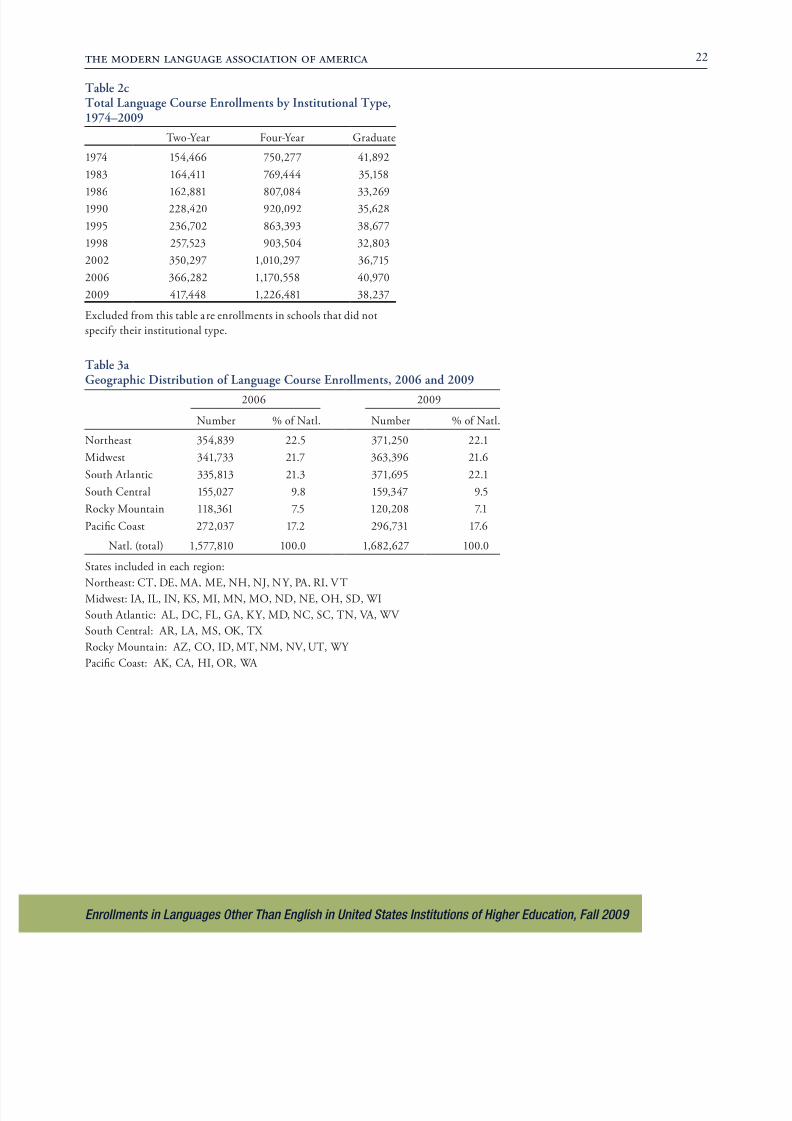
ments on the other. able 2c looks at languages cumulatively across institutional
levels between 1974 and 2009. At 38,237, the number o enrollments in graduate
2009 b 1995, w -
guage enrollments rose by 47.8% over the same period (Brod and Huber, “Foreign
L E” 55). b 2, w x w-y , w
o twelve languages with rising undergraduate enrollments in 2009, only Spanish,
ASL, K w w v.
As shown in table 2b, in two-year colleges, only Korean shows a drop in enroll-
ments between 2006 and 2009. Between 1990 and 1995, French, German, and Rus-
b , b
between 2002 and 2009. Enrollments in Spanish, ASL, Japanese, Italian, Chinese,
Arabic, Vietnamese, Latin, Portuguese, and Hawaiian all showed increased enroll-
ments both between 2006 and 2009 and over the nineteen years between 1990 and
2009. Te inclusion o Vietnamese and Hawaiian among the top ourteen languages
taught in two-year colleges and their absence among the top languages taught in
our-year institutions probably point to the unique mission o community colleges
serving the needs o local populations. Te decline o French, German, and Russian
in two-year colleges between 1990 and 2009 may refect a combination o changes
pp p pp pp.
Except or Spanish, Chinese, ASL, Arabic, Korean, and LCLs (under “Otherlanguages”), all other languages have declined—some dramatically—in graduate en-
rollments since 2002. Graduate-level enrollments in Latin show negligible variations
and can be said to have remained stable rom 2002 to 2009. Ater registering higher
graduate enrollments in 2006, French, German, Ancient Greek, Biblical Hebrew, and
Modern Hebrew in 2009 have dropped below the numbers they posted in 2002. An-
cient Greek lost 1,196 graduate enrollments between 2002 and 2009, and that number
is barely hal made up by the 499 graduate course enrollments in the other premodern
Greek categories reerred to above. Tose languages whose graduate enrollments de-
clined rom 2002 to 2006 again declined in 2009. Italian registered 1,047 graduate
enrollments in 2002, dipped slightly to 1,018 in 2006, then in 2009 dropped to 775. Japanese went rom 930 in 2002 to 859 in 2006 to 717 in 2009; Russian dropped to
596 in 2009 rom 749 in 2006 and 770 in 2002. When compared with steady growth
in undergraduate enrollments, the decline in graduate enrollments is striking.
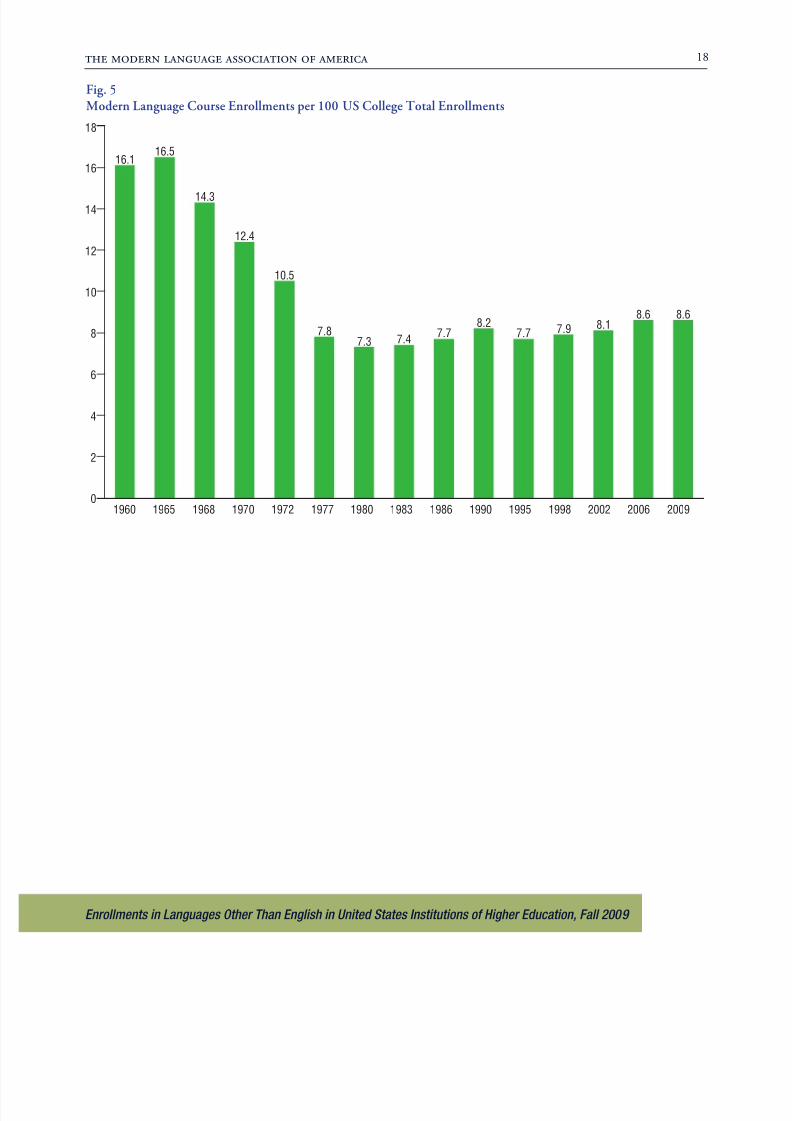
rends in Modern Language Enrollments, 1960–2009
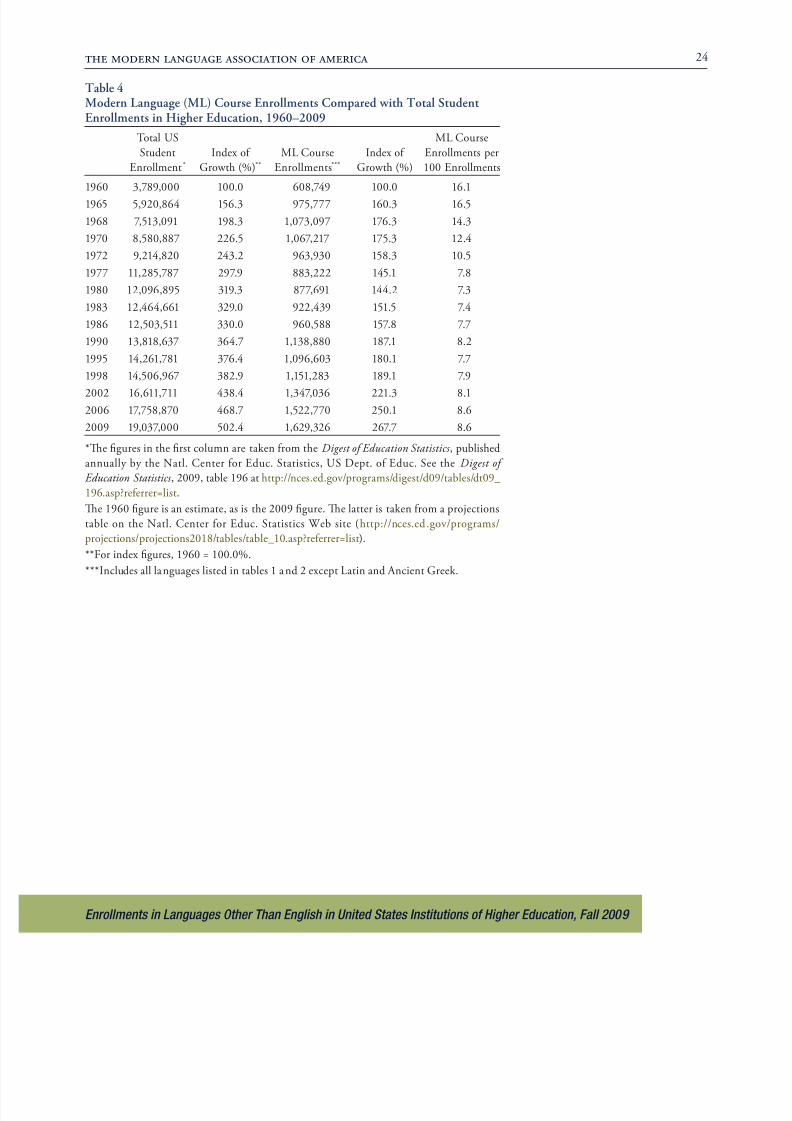
While enrollment in the modern languages has increased by 106,556 between 2006
and 2009, the ratio o enrollments in modern languages per 100 total enrollments in

8/8/2019 2009 Enrollment Survey
http://slidepdf.com/reader/full/2009-enrollment-survey 6/42
the modern language association o america 5
Enrollments in
Languages Other Than
English in United States
Institutions of Higher
Education, Fall 2009
8.6 (b 4). T
posted in 1965, 16.5, as gure 5 makes visible at a glance. As is well documented
(Brod and Huber; Huber), language requirements are less requently encountered at
United States colleges and universities now than in past decades, and the length o
the language requirement has also declined. Both o these actors aect the ratio and
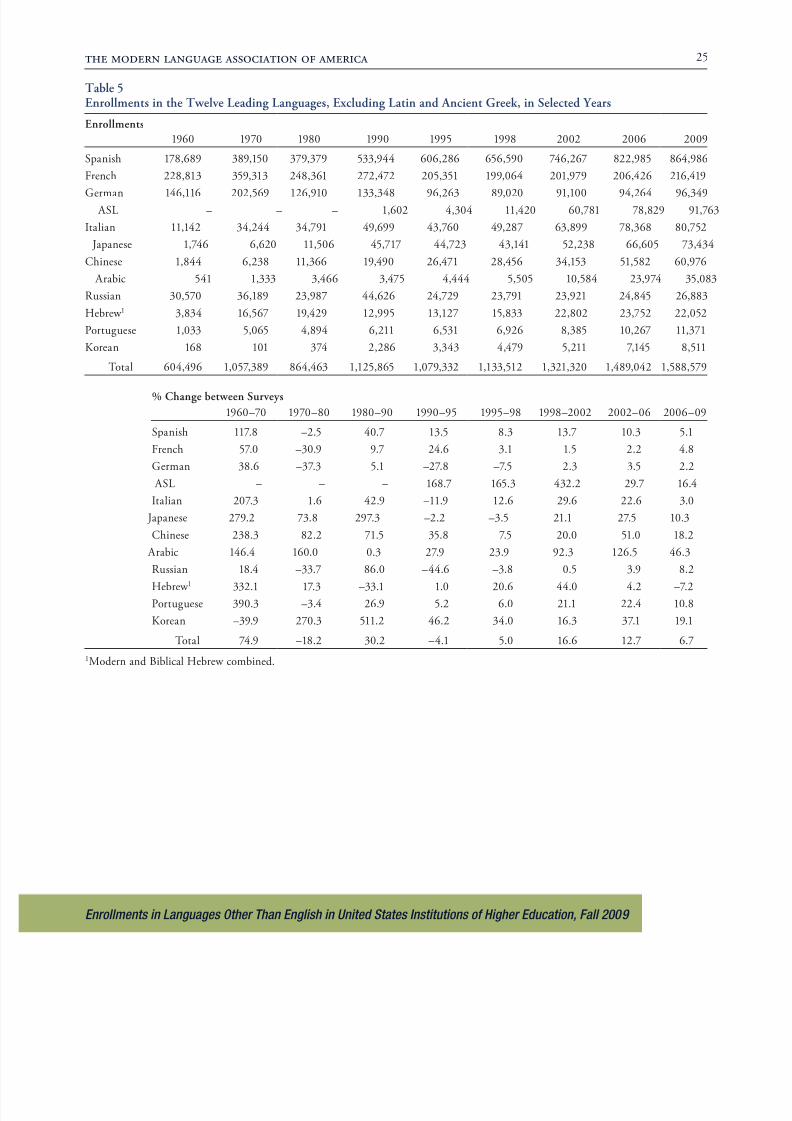
p xp 1960.able 5 presents the number o language course enrollments and the percentage
change between surveys in twelve leading languages over the orty-nine-year span
between 1960 and 2009. Not all languages post steady growth, nor do all languages
w p p. R, xp, b (33.7%) b-
tween 1970 and 1980, posted a gain o 86.0% a decade later, then a 44.6% dip
between 1990 and 1995 and a lesser loss o 3.8% three years later, ollowed by sus-tained modest gains since 1998. Between 1970 and 1980, Spanish, French, German,
Russian, and Portuguese all posted losses, but Japanese, Chinese, Arabic, Hebrew (Biblical and Modern combined), and particularly Korean showed remarkable gains.
I y bw 1990 1998, w Sp , F, G, Jp-
nese, and Russian lost ground, as did Italian between 1990 and 1995. In the last
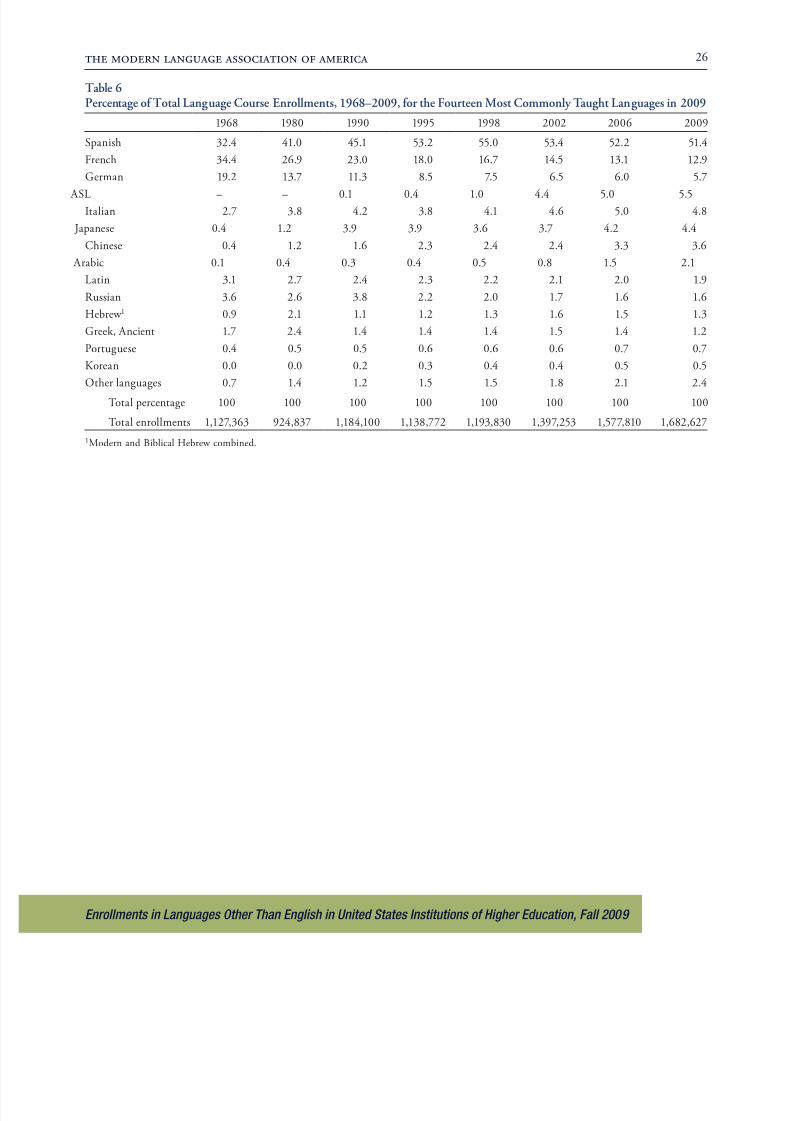
three surveys, enrollments in all modern languages have shown an upward trend.able 6 compares percentages o total course enrollments or ourteen languages and
reveals that, since 2002, the commonly taught languages have registered relatively
small fuctuations in their percentage share o total enrollments. In Arabic, however,
the seemingly small change in percentage share o enrollments represents a doubling
o its percentage share in language course enrollments between 2002 and 2009. Fig-
3 3b .
Ratio o Introductory to Advanced Undergraduate Enrollments
In 2006, we introduced a new eature to the survey, marking the distinction between
enrollments in introductory and advanced courses. In 2009, we continued to collect
p wy. E y y f
degree requirements, whereas enrollments in advanced classes are more indicative
o possible language minors and majors; advanced undergraduate language enroll-
ments may also refect courses taken as a part o proessional preparation: medical
Spanish, business German, and so on. Although dierent languages require dier-
ent time rames or attainment o competency levels, or most European languages
enrollments in advanced classes should indicate the beginning o a unctional level
o competency. Languages such as Arabic, Chinese, Hindi, and Russian requireextended learning periods or most native speakers o English. Despite dierences
in time required or acquisition o competency, the three-year span between surveys
makes it possible to monitor relative changes in competency levels or all languages
and to note institutional response to students’ changing interests in oreign and
.One caveat must be included in any discussion o introductory versus advanced
enrollments: in most cases, numbers are reported to us not by language specialists
but by institutional sta members responsible or maintaining records. Directors o
8/8/2019 2009 Enrollment Survey
http://slidepdf.com/reader/full/2009-enrollment-survey 7/42
the modern language association o america 6
Enrollments in
Languages Other Than
English in United States
Institutions of Higher
Education, Fall 2009
institutional research and registrars will generally distinguish introductory rom ad-
vanced enrollments on the basis o course numbers; while these numerical designations
are usually regularized, they may not be universally transparent as an indication o
the level oered. Languages taught at beginning levels in linguistics or anthropology
departments, or instance, may not be assigned the numbers traditionally reserved or
disciplinary language introductory courses (e.g., Linguistics 101 will be reserved or
an introduction to linguistics). In multilanguage departments, languages oered only
occasionally also may not receive the standard 101/102 or 201/202 designations.
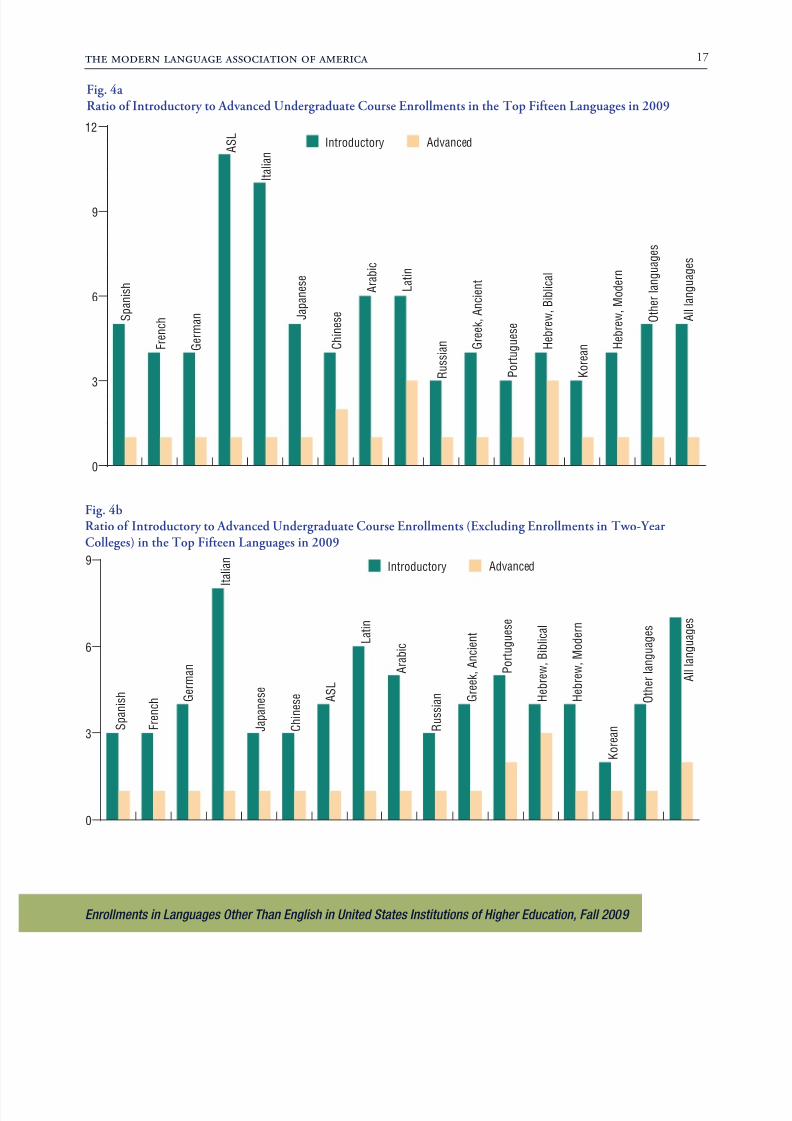
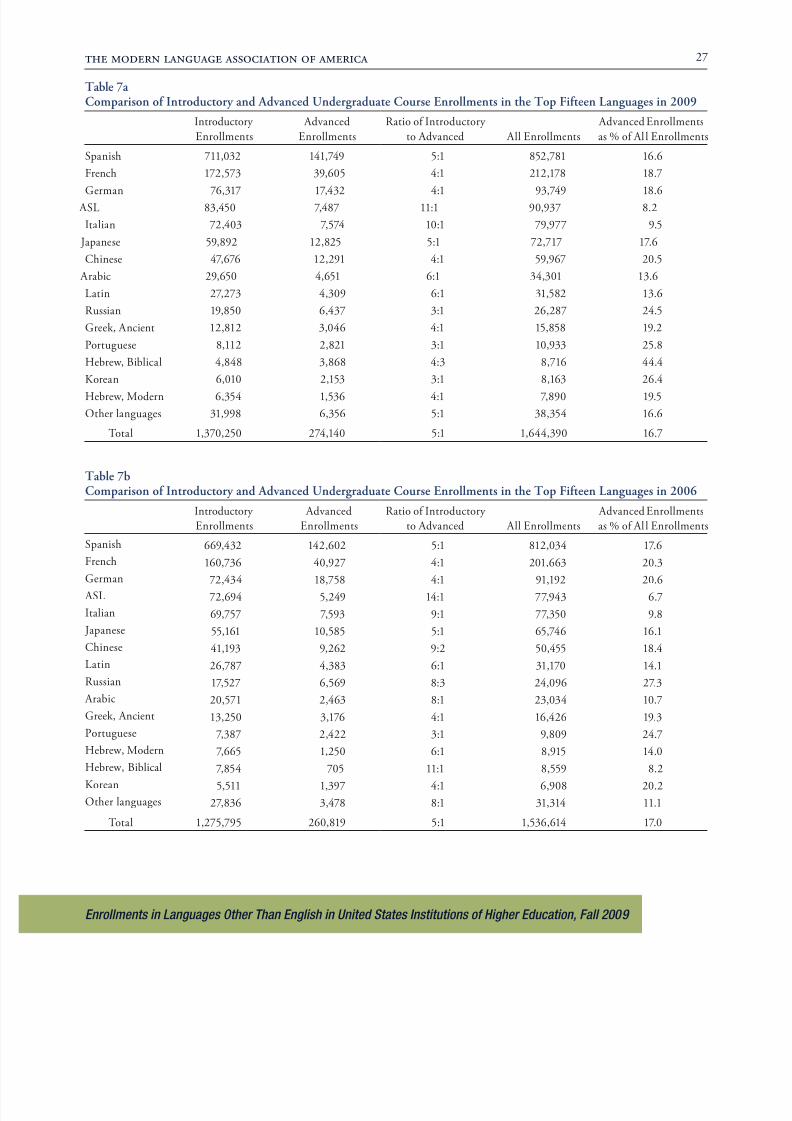
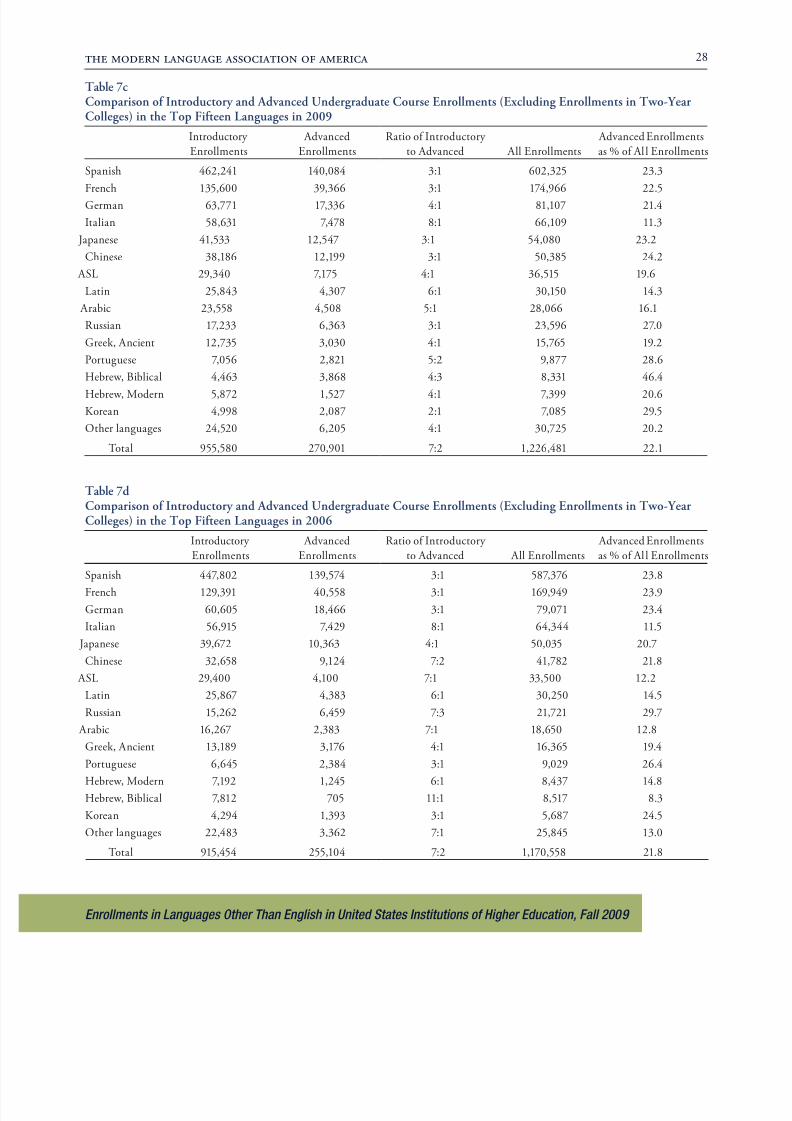
ables 7a through 7d compare introductory to advanced enrollments or the top
teen languages in 2009 and in 2006. Tese comparisons are apparent in gures 4a
4b. b 7 (2009) b 7b (2006)
in all institutions o higher learning, and table 7c (2009) and table 7d (2006) exclude
w-y . T b x w-y
enrollments narrow the comparison between introductory and advanced enrollments
to those institutions in which advanced courses are more likely to be available. Te
data show that the number o advanced enrollments in two-year institutions are
b x p w
LCLs; a total o 3,239, or 1.2% o all advanced enrollments taken together, were
p by w-y 2009.
able 7a shows that when all institutions o higher learning are considered to-
gether, advanced classes in 2009 make up 20% or more o all undergraduate student
v : C, Bb Hbw, K, R, P-
tuguese. When only our-year colleges and universities are considered (table 7c), ve
additional languages are shown to have 20% or more o enrollments in advanced
classes: Modern Hebrew, French, German, Japanese, and Spanish. Te aggregated
LCL v y 20% bv y v.
Biblical Hebrew has the greatest proportionate number o enrollments beyond thelower level, registering 46.4% advanced enrollments; Portuguese, Russian, and Ko-
v 25%. T p by Bb Hbw
more noticeable because actual enrollment numbers have declined between 2006
and 2009, whereas the percentage o advanced enrollments has increased by more
than ve times the earlier gure. Arabic (16.1%), Italian (11.3%), and Latin (14.3%)
have the lowest percentages o enrollments in advanced levels in 2009 in our-year
colleges and universities; when two-year institutions are added to the equation, ASL
j v w p v v.
Comparison o proportions between undergraduate levels in our-year colleges
and universities (that is, excluding two-year institutions) in the 2009 survey and the2006 reveals no change or Spanish, French, Italian, Latin, and Ancient Greek (ta-
ble 7c and table 7d). By contrast, the ratio between lower and upper levels indicates
proportionately more enrollments in advanced courses in 2009 than in 2006 in
ASL, Arabic, Chinese, Biblical Hebrew, Modern Hebrew, Japanese, Korean, Por-
tuguese, and the LCLs taken as a group. German and Russian, by contrast, have
ppy y w v 2009.
Whether or not one includes two-year institutions, the dierential in enroll-
ments between introductory and advanced undergraduate courses varies rom one

8/8/2019 2009 Enrollment Survey
http://slidepdf.com/reader/full/2009-enrollment-survey 8/42
the modern language association o america 7
Enrollments in
Languages Other Than
English in United States
Institutions of Higher
Education, Fall 2009
language to another. able 7c, or instance, shows that or every eight undergradu-
ate enrollments in introductory Italian in our-year colleges and universities, there
is only one enrollment in an advanced Italian course; Latin does slightly better
with a ratio o six to one. Chinese, French, Japanese, Russian, and Spanish seem
stronger in this regard, showing one advanced enrollment or every three at the
introductory level. Ater Biblical Hebrew, the ratio o introductory to advancedcourses in Korean stands out among all the languages: or every two introductory
enrollments, one was reported at the advanced level. Portuguese is close, with a
ratio o ve to two.
It is important to remember that these numbers count enrollments in courses and
not individual students. A ratio o three to one may suggest a viable major; on the
other hand, it may also indicate enrollments buoyed at all levels by strong heritage
interests. It is hard to explain with certainty patterns in the dierences among ratios
showing enrollments at lower and upper levels. In 2009, as in 2006, there are large
w y : Ep w y
being taught in United States institutions (French 3:1; Italian 8:1); non-Europeanlanguages relatively new on the scene (Korean 2:1; Japanese 3:1; Arabic 5:1); classical
languages (Biblical Hebrew 4:3; Latin 6:1; Ancient Greek 4:1). Issues such as na-
tional and local interest, unding and materials availability, and individual program
y b xp .
Geographic Distribution
On a percentage basis between 2006 and 2009, geographic distribution o enroll-
ments has remained almost stable. A close examination reveals only slight shits
among the regions (see table 3a). Te Northeast, the Midwest, the South Central,
Rky M bw 0.1% 0.4% course enrollments between 2006 and 2009: the Northeast went rom representing
22.5% o the national enrollment in language courses to 22.1%, the Midwest rom
21.7% to 21.6%, the South Central rom 9.8% to 9.5%, and the Rocky Mountain
rom 7.5% to 7.1%. Te South Atlantic and the Pacic Coast posted increases, mov-
21.3% 2006 22.1% 2009 17.2% 17.6%, pvy.
o have a more nely grained understanding o language course enrollments,
we are including or the rst time a table o enrollments in 2002, 2006, and 2009
in each o the ty states (table 3b). While between 2002 and 2006, ve states
(Alaska, Indiana, Kansas, Louisiana, and Utah) posted losses, our o these same
w b bw 2006 2009: Ak by 36.0%, Iby 26.7%, and more modest gains or Louisiana at 6.5% and Utah at 7.1%. Only
Kansas registered a decline twice: down by 10.8% between 2002 and 2006 and by
2.5% bw 2006 2009.
In 2009, however, eleven states registered losses. Some states showed modest
declines o less than 5.0%: Iowa, Kansas, Massachusetts, North Dakota, Okla-
homa, ennessee, and Washington. But Idaho slipped by 9.6%, Maine by 5.9%,
and New Hampshire and New Mexico posted double-digit losses o 15.3% and
16.0%, respectively.
8/8/2019 2009 Enrollment Survey
http://slidepdf.com/reader/full/2009-enrollment-survey 9/42
the modern language association o america 8
Enrollments in
Languages Other Than
English in United States
Institutions of Higher
Education, Fall 2009
Names o Languages
Variations in usage by reporting institutions introduce occasional incongruities in
the names o languages appearing in the survey. Our rule has always been to respect
the choice o name under which a language is reported to us. In some instances,
what might appear as a minor or insignicant dierence in spelling in act marks a
signicant social, cultural, or linguistic distinction to speakers or scholars o the lan-guage; in other instances, spelling conventions and name variants may be insigni-
cant. Filipino, Pilipino, and agalog are used to describe enrollments in languages
o the Philippines, and the survey’s consultants conrm that these distinctions can
mark social and linguistic dierences that we need to take care to retain in the
data. Te extent o dierence between the Native American languages reported
as Lakota and Dakota, project consultants tell us, may be in dispute among some
linguists, but the distinction is important among communities o speakers, and so
here, too, we report enrollments exactly as they are reported to us. And while some
institutions list Dakota and Lakota as distinct languages, others tell us they teach
“Dakota/Lakota,” still others, “Lakota/Dakota”; since the order o the names may besignicant and the slash representative o emphasis, we list both double categories.
By contrast, experts assure us that we can saely combine enrollments reported in
Ojibwe and Ojibwa, Arapaho and Arapahoe, Shoshoni and Shoshone, and Navajo
and Navaho, and we have done so. Enrollments are reported to us in both Persian
and Farsi, and we have maintained this distinction, although experts suggest it is
linguistically insignicant; users o the data may want to combine enrollments in
these two categories to get the ull picture, but by maintaining the dierent terms
we have also provided inormation about which institutions preer one term over the
other. Enrollments are reported to us in Chinese, Mandarin, Cantonese, and Clas-
sical Chinese, and we maintain these distinctions as well. We report enrollments in-vy D, Nw, Sw, b w p —
reported to us—in “Scandinavian”; we assume that one or more o these languages
are being taught under the regional designation Scandinavian. Specialists in various
language categories (Arabic, Chinese, Classical Greek, French, German, Biblical
Hbw, I, Jp, K, L, Nv A ,
the Philippines, Russian, Scandinavian languages, and Slavic languages) responded
to our request to review data and nomenclature, and we have relied on their expert
k b .
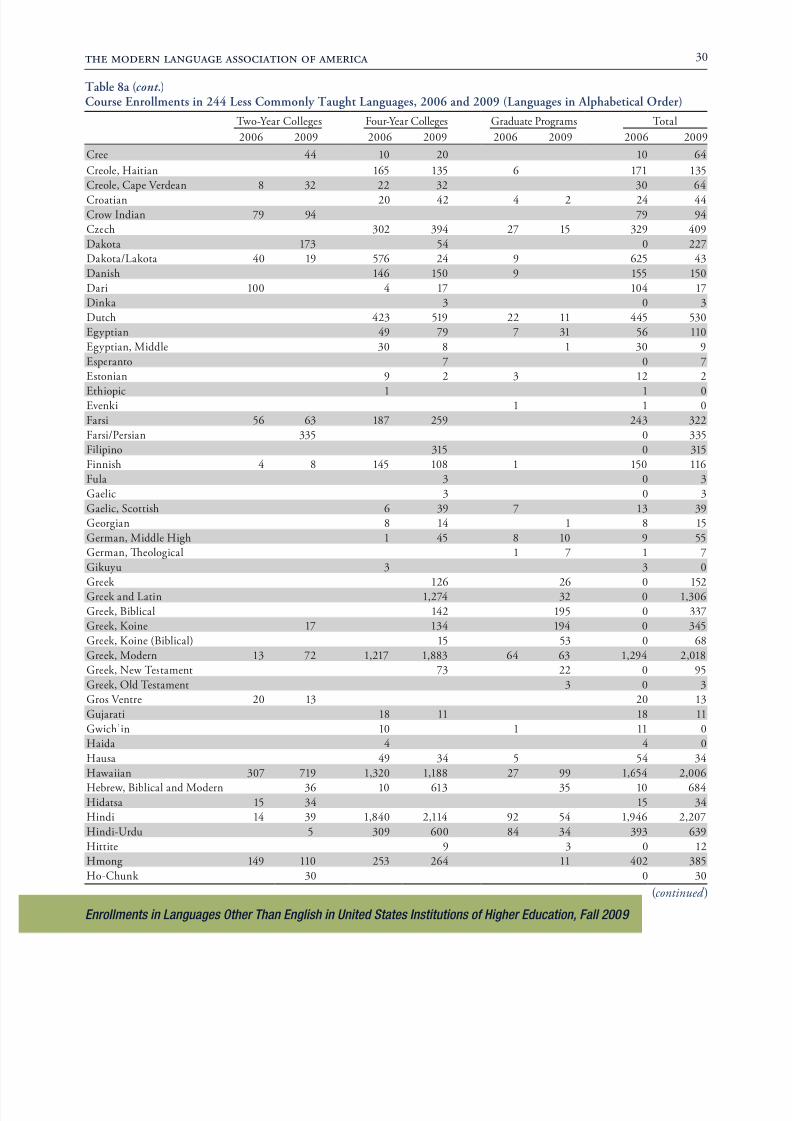
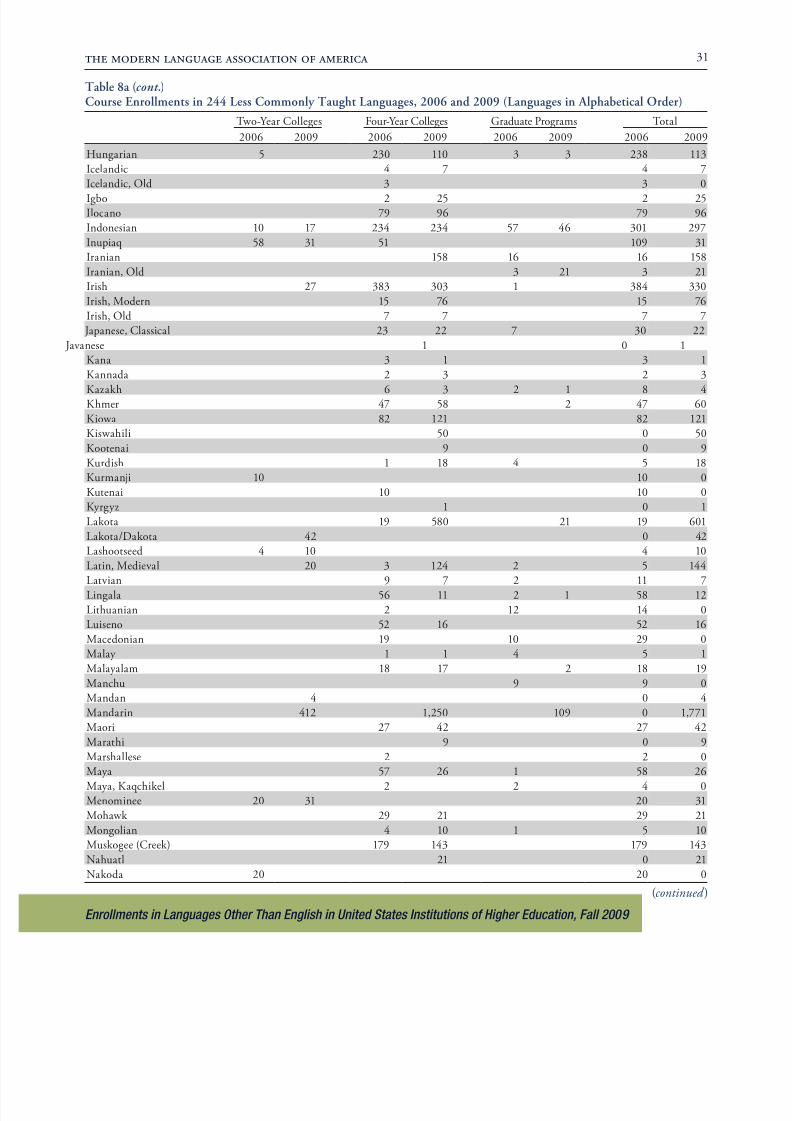
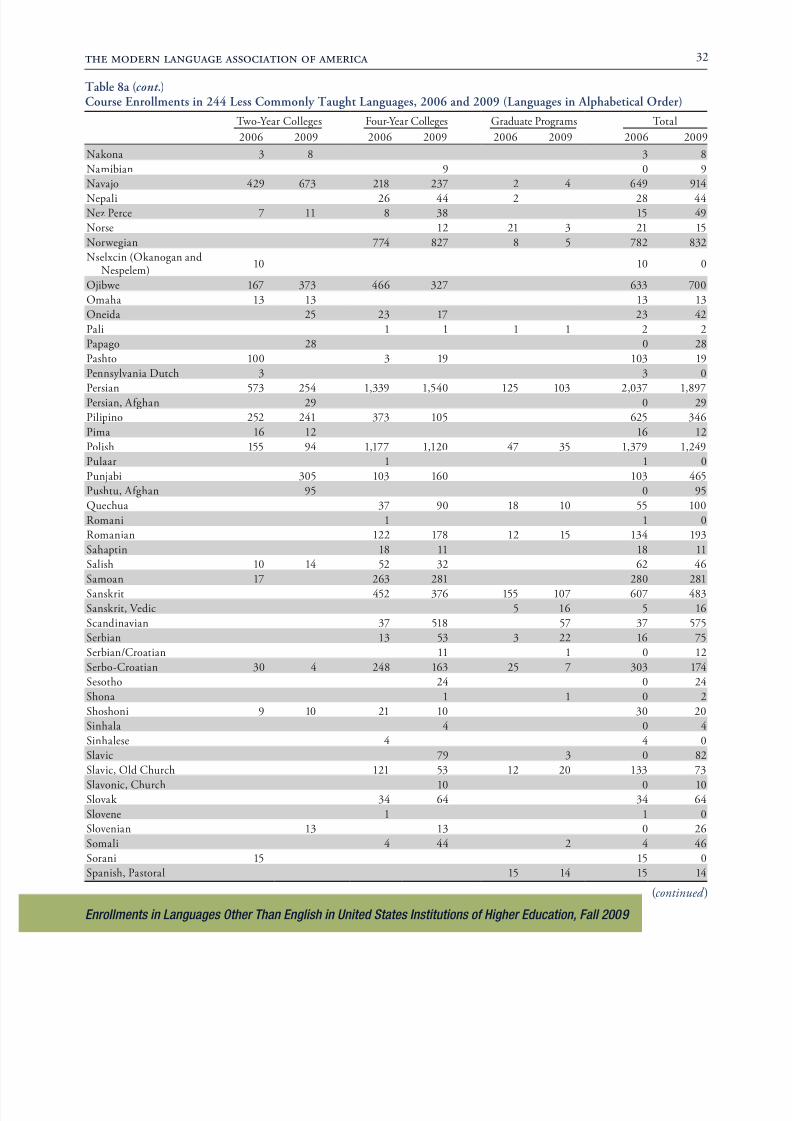
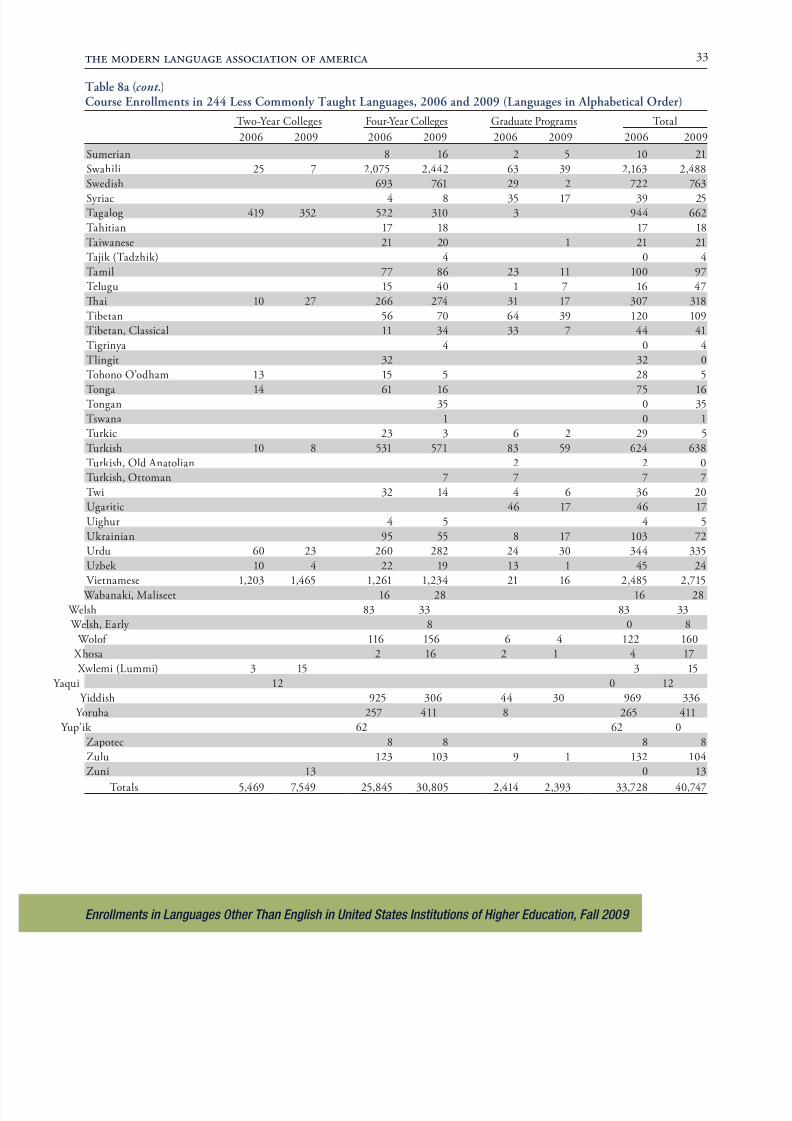
Less Commonly aught Languages (LCLs)
For the purpose o this report, we characterize as less commonly taught all languages
other than the top teen listed in table 1a. A total o 217 LCLs were oered in
2009; tables 8a and 8b also include languages oered in 2006 but not in 2009.
All told, 35 (19.2%) more LCLs reported enrollments in 2009 than in 2006: 60
languages oered in 2009 were not oered in 2006, while 25 oered in 2006 were
not oered in 2009. ables 9, 10a, 10b, 10c, and 10d group LCLs oered in 2002,
2006, 2009 .

8/8/2019 2009 Enrollment Survey
http://slidepdf.com/reader/full/2009-enrollment-survey 10/42
the modern language association o america 9
Enrollments in
Languages Other Than
English in United States
Institutions of Higher
Education, Fall 2009
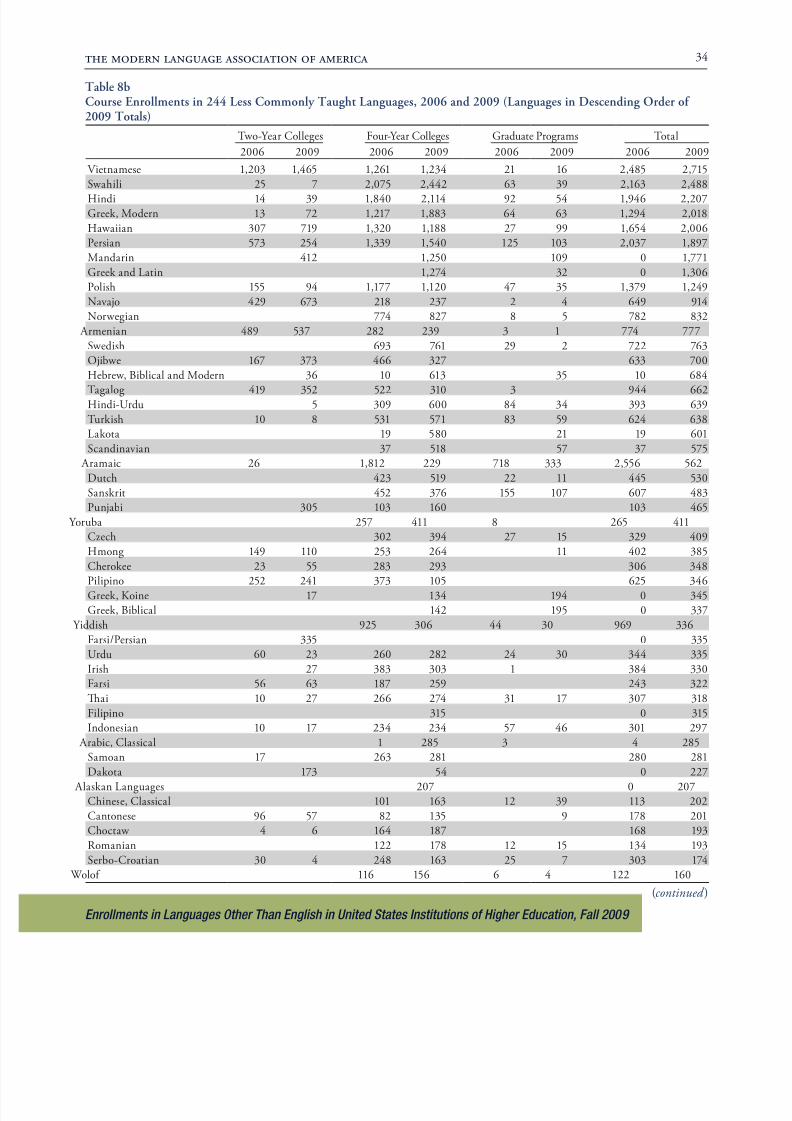
E v LCL by 7,019 (20.8%) bw 2009 w
we surveyed the eld in 2006 (table 9). Growth is not uniorm across languages and
institutional types. Tere were increases in enrollments in roughly two o every three
LCLs at the undergraduate level (including two-year colleges), but in graduate
programs, ewer than two out o every ve LCLs showed increases between 2006
and 2009 (table 8a). O the leading twenty-ve LCLs, twenty report increases inoverall enrollments since 2006 (table 8b). Yet sixteen o the top twenty-ve LCLs
showed decreases in graduate enrollments in the same period. Vietnamese went rom
21 to 16 graduate enrollments in 2009; Swahili, rom 63 to 39; Hindi, rom 92 to
54; Persian, rom 125 to 103 (Persian shows a loss in two-year institutions but an
increase in our-year institutions and a notable increase in our-year institutions o-
ering the language under Farsi); Hindi-Urdu dropped rom 84 to 34; urkish, rom
83 to 59; Swedish, rom 29 to 2; Sanskrit, rom 155 to 107. It is important to repeat
that enrollments represent course enrollments and not students; thus, or instance,
39 graduate enrollments in Swahili might well represent a raction o that number
o students. Tese numbers must also be understood in terms o relative program
size: only 9 (4.1%) o 217 LCLs in 2009 showed total enrollments over 1,000, and
only 64 (29.5%) o 217 showed enrollments over 100. Loss o even a ew graduate
enrollments may represent a proound weakness in the ability o a eld to build or
sustain programs or a national prole. At the same time, a single canceled class in
a all semester can make a language seem to disappear or the three years between
vy U S .
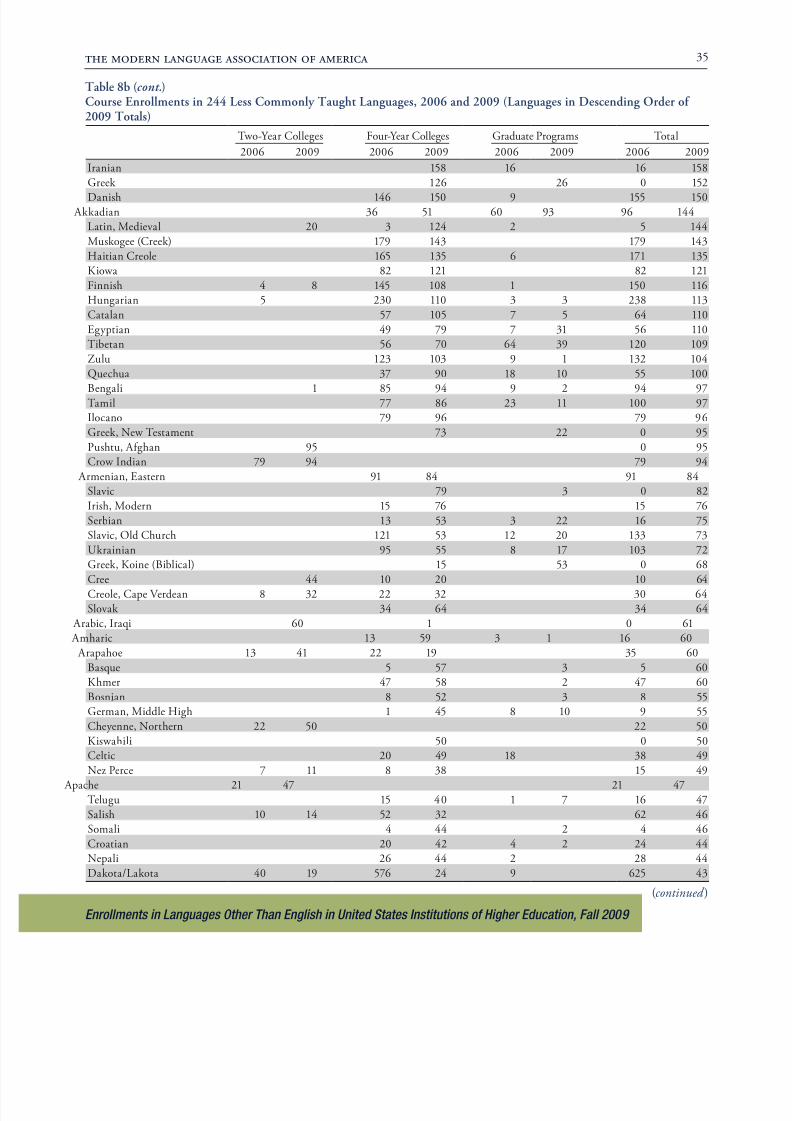
Between 2006 and 2009, the largest increases in enrollments grouped by region
(table 9) were in European languages, which grew by 3,239, or 40.2%, ollowed by
Asian and Pacic languages, where enrollments grew by 2,719, or 27.3%. Native
American languages grew by 1,042 enrollments, or 18.0%, while enrollments in
Middle Eastern and Arican languages grew between 2006 and 2009 by only 19,or 0.2%. Te near absence o growth in enrollments in Middle Eastern and Ari-
can languages is striking in contrast to 2006, when this group showed the greatest
increase since 2002, at 55.9%; by contrast, Asian and Pacic languages continue a
y w 2009, v w by 24.6% bw 2002 2006.
While the enrollments in Middle Eastern and Arican languages barely increased,
the number o these languages being studied increased by 22.9% (rom 48 to 59). In
LCL p, b -
panies increases in enrollments, as in European LCLs, where the 40.2% enroll-
ment growth is paralleled by a 26.8% (rom 41 to 52) increase in languages studied.
Te percentage share o total LCL enrollments by region o origin remains rela-tively stable between 2006 and 2009, although enrollments in European languages
v 3.8% M E A v pp by 5.1%.
Among the less commonly taught Middle Eastern and Arican languages, Swahili
(2,488) and Persian (1,897) attracted the largest enrollments in 2009 (table 10a).
Growth in Swahili continues since its 35.8% increase in 2006, realizing a 15.0%growth between 2006 and 2009. Although Persian continues to be the Middle East-
ern or Arican language with the second most enrollments, its numbers have allen
by 6.9% since 2006; this drop, however, should be seen in the context o a 32.5%

8/8/2019 2009 Enrollment Survey
http://slidepdf.com/reader/full/2009-enrollment-survey 11/42
the modern language association o america 10
Enrollments in
Languages Other Than
English in United States
Institutions of Higher
Education, Fall 2009
rise in Farsi (rom 243 to 322) and the introduction o enrollments under the new heading Farsi/Persian (335). In 2009 Modern Greek replaced Polish as the European
LCL w b (2,018), k 56.0%
2006; enrollments in Polish (1,249) dropped by 9.4% (table 10b). Enrollments in
the teen leading Asian and Pacic LCLs taken together rose in 2009 by 29.1%
(table 10c), ollowing 24.9% growth in 2006, 75.5% in 2002, and a 107.6% spike in1995. Te current survey records solid growth or six o these languages since 2006:
Vietnamese (9.3%), Hindi (13.4%), Hindi-Urdu (62.6%), Punjabi (351.5%), Tai
(3.6%), and Classical Chinese (78.8%). Samoan has gained 0.4%. Some languages
p v : (29.9%), Sk (20.4%), H (4.2%),
Pilipino (44.6%), Urdu (2.6%), and Indonesian (1.3%). Losses in agalog and Pili-
pino enrollments reverse a previous trend, marked by strong growth between 2002
and 2006 (36.2% and 39.2%, respectively), but the total losses (561 enrollments)
in these closely related language categories are in part made up by Filipino (which
specialists see as a closely related but distinct variant), reporting 315 enrollments in
2009 where there were none in 2006. Breaking down these enrollments by insti-
tutional type supports this explanation: the largest losses in Pilipino and agalog
enrollments in 2009 are in our-year institutions, while 2009 enrollments in Filipino
xvy -y (b 8).
Hawaiian continues to report more than twice the enrollments o any other lan-
guage in the Native American group (table 10d). Hawaiian reported 2,006 enroll-
ments in 2009, a 21.3% increase since the previous survey. Hawaiian enrollments
have slipped a little in our-year institutions (rom 1,320 to 1,188) but continue to
gain ground at two-year colleges (rom 307 to 719; see table 8a). Graduate enroll-
ments in Hawaiian have increased rom 27 to 99, suggesting potential or uture
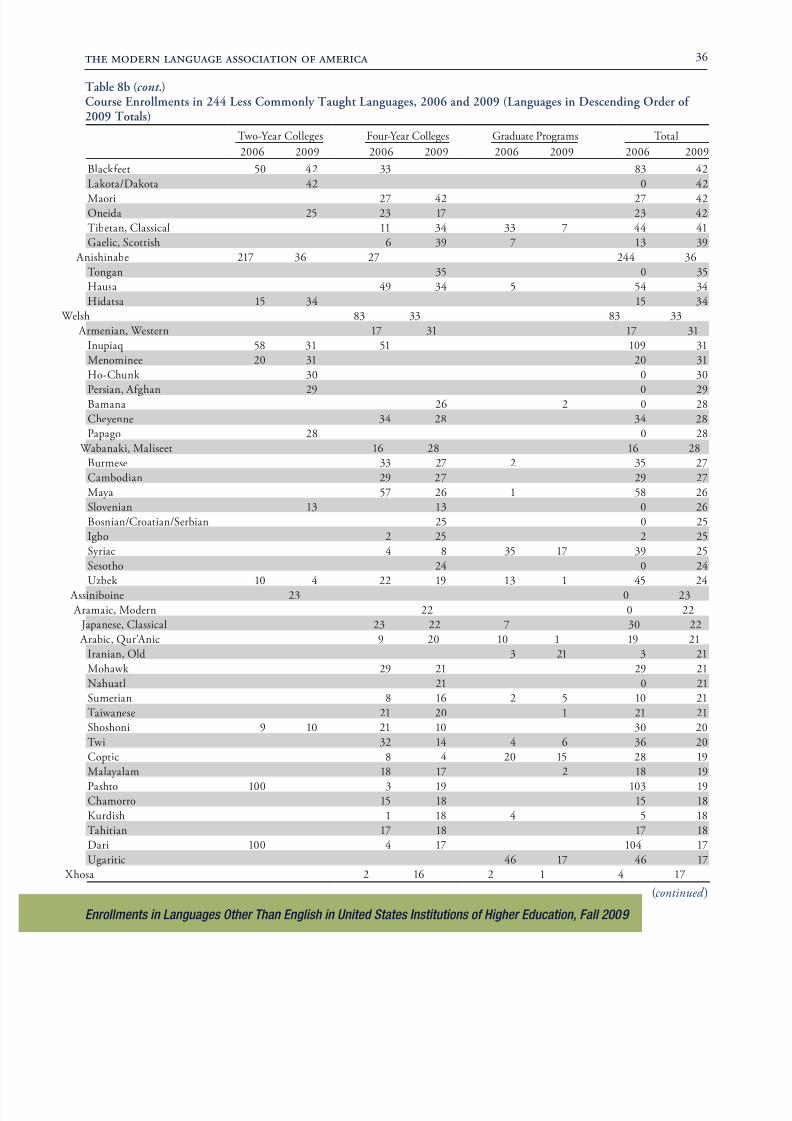
growth that stands out among the LCLs; only 25 o 217 languages show marked
increases in graduate enrollments, and ew at the same enrollment range as pro-portionately as strong as Hawaiian’s. Other Native American languages listed in
b 10 ( p) w y
growth, albeit in relatively small programs. Among the largest enrollments reported
were in Navajo, which grew rom 649 to 914; Ojibwe, increasing rom 633 to 700;
Lakota, up rom 19 to 601 (probably representing growth in reporting institutions,
as well as in enrollments); Cherokee, rom 306 to 348; and Dakota, reporting no
2006 b 227 2009.
In languages with very modest enrollments, the opening or closing o a single pro-
gram or even the decision o a single student to begin or suspend study can aect the
data prooundly—especially when measured in percentages. In 2006, or instance,w , vy bb y, p
comparatively high enrollments in Yiddish (400 and 227, respectively); in 2009,
b w 80 3, b w Yiddish enrollments rom 969 to 336, or 65.3%. Punjabi enrollments rose by 351.5%
in 2009 (rom 103 to 465), although in most o the eleven institutions teaching Pun-
jabi, course enrollments only rose or ell by single digits. Te big changes in Punjabi
were at our institutions in Caliornia, particularly one community college that re-ported zero enrollments in Punjabi in 2006 but in 2009 oered Punjabi courses that
8/8/2019 2009 Enrollment Survey
http://slidepdf.com/reader/full/2009-enrollment-survey 12/42
the modern language association o america 11
Enrollments in
Languages Other Than
English in United States
Institutions of Higher
Education, Fall 2009
w 278 . S (.., Dk/Lk
Lakota or rom Greek to “Greek and Latin,” a category not reported in 2006) or
reporting decisions by one or two institutions can also aect the data. Sometimes,alling enrollments in one language can be explained by increases in others. Dakota/
Lakota registers a drop rom 625 to 43, but Lakota shows an increase rom 19 to
601; Lakota/Dakota appears or the rst time, reporting 42 enrollments; and Dakotaregisters enrollments o 227—in other words, course enrollments in this language
p . Sb-C bw 2006 2009 303 174,
but Croatian enrollments rose rom 24 to 44, Serbian enrollments rom 16 to 75,
and the new combinations Bosnian/Croatian/Serbian and Serbian/Croatian report
25 12 , pvy.
In rare cases, the absence o a language rom the survey is simply a unction o
institutional record keeping. Cajun French does not appear in any o the enrollment
vy (w xp 26 1977). S Cj
French are listed in course catalogs under French, registrars and directors o institu-
tional research report them to us under French. In all 2009, however, in response to
an e-mail inquiry, one institution in Louisiana reported 99 enrollments at the intro-
y v Cj F, w p 13 v .
In Conclusion
In 2009, course enrollments in languages other than English in higher education
grew by 6.6%, ollowing an expansion o 12.9% between 2002 and 2006. Arabic
grew by 46.3%. ASL, Japanese, Chinese, Portuguese, and Korean also expanded by
double-digit percentages, but more modestly, as did the LCLs as one group. Russian
posted an 8.2% gain. Spanish grew by 5.1% in 2009 as compared with its 10.3% gain
in 2006. French, German, and Italian registered modest gains o 4.8%, 2.2%, and3.0%, respectively. Latin and Ancient Greek remained stable, i one includes enroll-
ments reported in 2009 in varieties o premodern Greek. Biblical Hebrew and Mod-
ern Hebrew are the only two languages that posted losses in enrollments or 2009.
Te ratio o enrollments in modern language courses to overall college and uni-
versity student enrollments has remained the same between 2009 and 2006, at 8.6
p 100 . T 1965 y b py xp by
a decline in language requirements as well as a decline in the length o the language
requirement. Tere were by and large only small proportional changes in the ratio
between introductory and advanced language course enrollments. Lastly, we notice
that, while undergraduate enrollments have been expanding since 1995, graduate p 2009 w p 1995.
Tere are two innovations instituted with the 2009 survey. First, the survey now
includes a list o enrollments in each o the ty states. Second, the MLA LanguageMap has been upgraded to chart the location o programs and 2009 enrollment data
wy- p w w pk home in the United States, making it possible to view language programs geographi-
cally and to consider enrollments in the context o local language communities. Stu-
, p, , , pxy
8/8/2019 2009 Enrollment Survey
http://slidepdf.com/reader/full/2009-enrollment-survey 13/42
the modern language association o america 12
Enrollments in
Languages Other Than
English in United States
Institutions of Higher
Education, Fall 2009
and size o comparable programs, nding where, or instance, the biggest programs
w pp-v v . O y
learn whether a program in a language is geographically unique or whether it is sup-
ported by opportunities to nd native interlocutors in nearby communities. We hope
that these new eatures will enable users to extend the analyses oered in this report
and to make the enrollment survey a tool in ways we may not even have imagined.
Notes
1. Tis survey beneted rom the dedication and diverse abilities o our research assistants, LoganB P, Ay C b pp v p vy MLA’ b. W vy .
2. Te National Center or Education Statistics estimates that in 2009 total United States college en-rollments stood at 19,037,000 in 4,409 institutions. About 1,700 institutions did not qualiy or inclusionin the survey, either because they are or-prot and chose not to participate or because their ocus or mis-sion does not include language teaching. Te not-or-prot institutions that do not teach languages includeundergraduate and postgraduate science-, technology-, engineering-, and math-dominant institutions andspecialized proessional schools in such elds as law, medicine, agriculture, social work, and business.
3. W w xp p- k xp .
Works Cited
Brod, Richard, and Bet tina J. Huber. “Foreign Language Enrollments in United States Institutions o H E, F 1995.” ADFL Bulletin 28.2 (1997): 55–61. P.
———. “Te MLA Survey o Foreign Language Entrance and Degree Requirements, 1994–95.” ADFLBulletin 28.1 (1996): 35–43. P.
Huber, Bettina J. “Characteristics o Foreign Language Requirements at US Colleges and Universities:Findings rom the MLA’s 1987–89 Survey o Foreign Language Programs.” ADFL Bulletin 24.1(1992): 8–16. P.
8/8/2019 2009 Enrollment Survey
http://slidepdf.com/reader/full/2009-enrollment-survey 14/42
the modern language association o america 13
Enrollments in Languages Other Than English in United States Institutions of Higher Education, Fall 2009
2,802Institutionscontacted
2,720Eligible
institutions
82Ineligible
institutionsor branchcampuses
2,694Institutions that
responded
26Institutions thatdid not respond
2,514Institutions thathad enrollments inlanguages other
than English
180Institutions
that had noenrollments in
languages otherthan English
Fig. A
608,749
975,777
1,073,097 1,067,217
963,930
897,077
883,222
877,691
922,439960,588
1,138,880
1,096,603
1,151,283
1,347,036
1,522,770
1,629,326
1960 1965 1968 1977 1980 1983 1986 1990 1995 1998 2002 2006 2009
0
200,000
400,000
600,000
800,000
1,000,000
1,200,000
1,400,000
1,600,000
Fig. 1
Language Course Enrollments, Excluding Latin and Ancient Greek, by Year
1970 1972 1974
8/8/2019 2009 Enrollment Survey
http://slidepdf.com/reader/full/2009-enrollment-survey 15/42
the modern language association o america 14
Enrollments in Languages Other Than English in United States Institutions of Higher Education, Fall 2009
1960 1968 1980 1986 1990 1995 1998 2002 2006 20090
100,000
200,000
300,000
400,000
500,000
600,000
700,000
800,000
900,000
4 3 0 ,
0 6 0
1 7 8 ,
6 8 9
7 0 8 ,
2 2 7
3
6 4 ,
8 7 0
4 9 8 ,
3 1 2
3 7 9 ,
3 7 9
5 4 9 ,
2 9 5
4 1 1 ,
2 9 3
6 0 4 ,
9 3 6
5 3 3 ,
9 4 4
4 9 0 ,
3 1 7
6 0 6 ,
2 8 6
4 9 4 ,
6 9 3
6 5 6 ,
5 9 0
6 0 0 ,
7 6 9
7 4 6 ,
2 6 7
6 9 9 ,
7 8 5
8 2
2 ,
9 8 5
7 6 4 ,
3 4 0
8 6 4 ,
9 8 6
Other Modern Languages Spanish
Fig. 2Enrollments in Spanish Compared with Tose of All Other Languages except Latin and Ancient Greek, by Year
8/8/2019 2009 Enrollment Survey
http://slidepdf.com/reader/full/2009-enrollment-survey 16/42
the modern language association o america 15
Enrollments in Languages Other Than English in United States Institutions of Higher Education, Fall 2009
0 50,000 100,000 150,000 200,000 250,000 300,000 350,000 400,000
228,813
388,096
248,361
272,472
205,351
199,064
201,979
206,426
216,419
146,116
216,263
126,910
133,348
96,263
89,020
91,100
94,264
96,349
1,602
4,304
11,42060,781
78,829
91,763
11,142
30,359
34,791
49,699
43,760
49,287
63,899
78,368
80,752
1,746
4,324
11,506
45,717
44,723
43,141
52,238
66,605
73,434
1,844
5,061
11,366
19,490
26,471
28,456
34,153
51,582
60,976
5251,099
3,471
3,475
4,444
5,505
10,584
23,974
35,083
196019681980199019951998200220062009
196019681980199019951998200220062009
19901995
1998200220062009
196019681980199019951998200220062009
196019681980199019951998200220062009
196019681980199019951998200220062009
196019681980199019951998200220062009
Arabic
Chinese
Japanese
Italian
*ASL
German
French
Fig. 3a Course Enrollments in the Top Seven Modern Languages, Not Including Spanish, in Selected Years
*Enrollments in ASL were not reported until 1990.
8/8/2019 2009 Enrollment Survey
http://slidepdf.com/reader/full/2009-enrollment-survey 17/42
the modern language association o america 16
Enrollments in Languages Other Than English in United States Institutions of Higher Education, Fall 2009
0 5,000 10,000 15,000 20,000 25,000 30,000 35,000 40,000 45,000
25,035
28,178
25,897
26,145
29,84132,191
32,606
23,987
44,62624,729
23,791
23,921
24,845
26,883
19,429
12,995
13,127
15,833
22,802
23,752
22,052
22,111
16,401
16,272
16,402
20,376
22,849
20,695
4,894
6,2116,531
6,926
8,385
10,267
11,371
365
2,286
3,343
4,479
5,211
7,145
8,511
1980
1990
1995
1998
20022006
2009
1980
1990
1995
1998
2002
2006
2009
1980
1990
1995
1998
2002
2006
2009
1980
1990
1995
1998
2002
2006
2009
1980
19901995
1998
2002
2006
2009
1980
1990
1995
1998
2002
2006
2009
Fig. 3bCourse Enrollments in Six Commonly Taught Languages in Selected Years
Korean
Portuguese
Ancient Greek
*Hebrew
Russian
Latin
*Modern and Biblical Hebrew combined.
8/8/2019 2009 Enrollment Survey
http://slidepdf.com/reader/full/2009-enrollment-survey 18/42
the modern language association o america 17
Enrollments in Languages Other Than English in United States Institutions of Higher Education, Fall 2009
S p a n i s h
F r e n c h
G e r m a n
A S L
I t a l i a n
J a p a n e s e
C h i n e s e
A r a b i c
L a t i n
R
u s s i a n G
r e e k
, A n c i e n t
P o r t u g u e s e
H e b r e w ,
B i b l i c a l
K
o r e a n H
e b r e w ,
M o d e r n
O t h e r l a n g u a g e s
A l l l a n g u a g e s
0
3
6
9
12
Fig. 4a Ratio of Introductory to Advanced Undergraduate Course Enrollments in the Top Fifteen Languages in 2009
Introductory Advanced
S p a n i s h
F r e n c h G
e r m a n
I t a l i a
n
J a p a n e s e
C h i n e s e A
S L
L a t i n
A r a b i c
R u s s i a n G
r e e k
, A n c i e n t
P o r t u g u e s e
H e b r e w ,
B i b l i c a l
H e b r e w ,
M o d e r n
K
o r e a n
O t h e r l a n g u a g e s
A l l l a n g u a g e s
0
3
6
9
Fig. 4bRatio of Introductory to Advanced Undergraduate Course Enrollments (Excluding Enrollments in Two-YearColleges) in the Top Fifteen Languages in 2009
Introductory Advanced
8/8/2019 2009 Enrollment Survey
http://slidepdf.com/reader/full/2009-enrollment-survey 19/42
the modern language association o america 18
Enrollments in Languages Other Than English in United States Institutions of Higher Education, Fall 2009
1960 1965 1968 1970 1972 1977 1980 1983 1986 1990 1995 1998 2002 2006 20090
2
4
6
8
10
12
14
16
18
16.116.5
14.3
12.4
10.5
7.87.3 7.4
7.78.2
7.7 7.9 8.18.6 8.6
Fig. 5Modern Language Course Enrollments per 100 US College Total Enrollments
8/8/2019 2009 Enrollment Survey
http://slidepdf.com/reader/full/2009-enrollment-survey 20/42
the modern language association o america 19
Enrollments in Languages Other Than English in United States Institutions of Higher Education, Fall 2009
able 1a Fall 2002, 2006, and 2009 Language Course Enrollments (Languages inDescending Order o 2009 otals)
2002 2006
% C,
2002–06 2009
% C,
2006–09
Sp 746,267 822,985 10.3 864,986 5.1
F 201,979 206,426 2.2 216,419 4.8G 91,100 94,264 3.5 96,349 2.2
ASL 60,781 78,82929.7 91,763 16.4
I 63,899 78,368 22.6 80,752 3.0
Jp 52,238 66,605 27.5 73,434 10.3
C 34,153 51,582 51.0 60,976 18.2
Ab 10,584 23,974 126.5 35,083 46.3
L 29,841 32,191 7.9 32,606 1.3
R 23,921 24,845 3.9 26,883 8.2
Gk, A* 20,376 22,849 12.1 20,695 –9.4
Hbw, Bb 14,183 14,140 –0.3 13,807 –2.4
P 8,385 10,267 22.4 11,371 10.8K 5,211 7,145 37.1 8,511 19.1
Hbw, M 8,619 9,612 11.5 8,245 –14.2
O 25,716 33,728 31.2 40,747 20.8
1,397,253 1,577,810 12.9 1,682,627 6.6
*Te apparent drop in Ancient Greek may be attributed to changes in reporting; in earlier
surveys, languages such as Biblical Greek, Koine Greek, and other premodern Greek lan-
y v b p y “A Gk.”

8/8/2019 2009 Enrollment Survey
http://slidepdf.com/reader/full/2009-enrollment-survey 21/42
the modern language association o america 20
Enrollments in Languages Other Than English in United States Institutions of Higher Education, Fall 2009
able 1bFall 2002, 2006, and 2009 Language Course Enrollments (Languages in Alphabetical Order)
2002 2006
% C,
2002–06 2009
% C,
2006–09
Ab 10,584 23,974 126.5 35,083 46.3
ASL 60,781 78,829 29.7 91,763 16.4C 34,153 51,582 51.0 60,976 18.2
F 201,979 206,426 2.2 216,419 4.8
G 91,100 94,264 3.5 96,349 2.2
Gk, A* 20,376 22,849 12.1 20,695 –9.4
Hbw, Bb 14,183 14,140 –0.3 13,807 –2.4
Hbw, M 8,619 9,612 11.5 8,245 –14.2
I 63,899 78,368 22.6 80,752 3.0
Jp 52,238 66,605 27.5 73,434 10.3
K 5,211 7,145 37.1 8,511 19.1
L 29,841 32,191 7.9 32,606 1.3
P 8,385 10,267 22.4 11,371 10.8R 23,921 24,845 3.9 26,883 8.2
Sp 746,267 822,985 10.3 864,986 5.1
O 25,716 33,728 31.2 40,747 20.8
1,397,253 1,577,810 12.9 1,682,627 6.6
*Te apparent drop in Ancient Greek may be attributed to changes in reporting; in earlier
surveys, languages such as Biblical Greek, Koine Greek, and other premodern Greek lan-
y v b p y “A Gk.”
8/8/2019 2009 Enrollment Survey
http://slidepdf.com/reader/full/2009-enrollment-survey 22/42
the modern language association o america 21
Enrollments in Languages Other Than English in United States Institutions of Higher Education, Fall 2009
able 2a Undergraduate Language Course Enrollments in Four-Year Colleges and Graduate Language Course Enrollments(Languages in Descending Order o 2009 otals)
U E
(F-Y I) G E
2002 2006 2009 2002 2006 2009 2002 2006 2009
Sp 515,688 587,376 602,325 9,950 10,865 12,205 525,638 598,241 614,530F 162,705 169,949 174,966 4,605 4,763 4,241 167,310 174,712 179,207
G 75,987 79,071 81,107 2,803 3,072 2,600 78,790 82,143 83,707
I 51,750 64,344 66,109 1,047 1,018 775 52,797 65,362 66,884
Jp 38,545 50,035 54,080 930 859 717 39,475 50,894 54,797
C 26,914 41,782 50,385 934 1,127 1,009 27,848 42,909 51,394
ASL 21,613 33,500 36,515 121 746 826 21,734 34,246 37,341
L 27,695 30,250 30,150 1,045 1,021 1,024 28,740 31,271 31,174
Ab 8,194 18,650 28,066 531 940 782 8,725 19,590 28,848
R 20,208 21,721 23,596 770 749 596 20,978 22,470 24,192
Gk, A 14,044 16,365 15,765 6,033 6,423 4,837 20,077 22,788 20,602
Hbw, Bb 9,014 8,517 8,331 5,133 5,581 5,091 14,147 14,098 13,422P 6,945 9,029 9,877 487 458 438 7,432 9,487 10,315
Hbw, M 7,693 8,437 7,399 418 697 355 8,111 9,134 7,754
K 4,045 5,687 7,085 111 237 348 4,156 5,924 7,433
O 19,257 25,845 30,725 1,797 2,414 2,393 21,054 28,259 33,118
1,010,297 1,170,558 1,226,481 36,715 40,970 38,237 1,047,012 1,211,528 1,264,718
% C NA 15.9 4.8 NA 11.6 –6.7 NA 15.7 4.4
Ex b py yp.
able 2bLanguage Course Enrollments in wo-Year Colleges (Languages in Descending Order o 2009 otals)
1990 1995 1998 2002 2006 2009
% C,
2006–09
% C,
1990–2009
Sp 133,823 163,217 179,504 220,629 224,744 250,456 11.4 87.2
ASL 1,140 3,394 7,003 39,047 44,583 54,422 22.1 4,673.9
F 44,366 30,515 29,807 34,669 31,714 37,212 17.3 –16.1
Jp 10,308 9,429 9,219 12,763 15,711 18,637 18.6 80.8
I 8,325 6,430 7,146 11,102 13,006 13,868 6.6 66.6
G 19,082 11,689 11,645 12,310 12,121 12,642 4.3 –33.7
C 3,506 4,463 4,764 6,305 8,673 9,582 10.5 173.3
Ab 423 196 1,158 1,859 4,384 6,235 42.2 1,374.0
R 3,472 2,000 2,286 2,943 2,375 2,691 13.3 –22.5
V 169 489 385 1,185 1,203 1,465 21.8 766.9
L 909 827 840 1,101 920 1,432 55.7 57.5
K 141 169 624 1,055 1,221 1,078 –11.7 664.5
P 365 462 480 953 780 1,056 35.4 189.3
Hw 299 635 645 667 307 719 134.2 140.5
T b y w-y v 2009.
Ex b py yp.
8/8/2019 2009 Enrollment Survey
http://slidepdf.com/reader/full/2009-enrollment-survey 23/42
the modern language association o america 22
Enrollments in Languages Other Than English in United States Institutions of Higher Education, Fall 2009
able 2cotal Language Course Enrollments by Institutional ype,1974–2009
w-Y F-Y G
1974 154,466 750,277 41,892
1983 164,411 769,444 35,158
1986 162,881 807,084 33,269
1990 228,420 920,092 35,628
1995 236,702 863,393 38,677
1998 257,523 903,504 32,803
2002 350,297 1,010,297 36,715
2006 366,282 1,170,558 40,970
2009 417,448 1,226,481 38,237
Ex b
py yp.
able 3a
Geographic Distribution o Language Course Enrollments, 2006 and 2009
2006 2009
Nb % N. Nb % N.
N 354,839 22.5 371,250 22.1
Mw 341,733 21.7 363,396 21.6
S A 335,813 21.3 371,695 22.1
S C 155,027 9.8 159,347 9.5
Rky M 118,361 7.5 120,208 7.1
P C 272,037 17.2 296,731 17.6
N. () 1,577,810 100.0 1,682,627 100.0
S :N: C, DE, MA, ME, NH, NJ, NY, PA, RI, V
Mw: IA, IL, IN, KS, MI, MN, MO, ND, NE, OH, SD, WI
S A: AL, DC, FL, GA, KY, MD, NC, SC, N, VA, WV
S C: AR, LA, MS, OK, X
Rky M: AZ, CO, ID, M, NM, NV, U, WY
P C: AK, CA, HI, OR, WA
8/8/2019 2009 Enrollment Survey
http://slidepdf.com/reader/full/2009-enrollment-survey 24/42
the modern language association o america 23
Enrollments in
Languages Other Than
English in United States
Institutions of Higher
Education, Fall 2009
able 3b Language Course Enrollments by State, Fall 2002, 2006, and 2009
2002 2006
% C,
2002–06 2009
% C,
2006–09
Ab 12,601 14,936 18.5 17,298 15.8
Ak 3,118 2,655 –14.8 3,612 36.0
Az 32,207 37,730 17.1 39,394 4.4 Ak 9,223 11,347 23.0 11,499 1.3
C 193,361 202,877 4.9 222,287 9.6
C 21,856 23,947 9.6 24,133 0.8
C 15,930 18,099 13.6 19,874 9.8
Dw 5,155 5,401 4.8 5,949 10.1
D Cb 13,068 16,371 25.3 17,902 9.4
F 43,319 48,186 11.2 56,580 17.4
G 31,611 37,464 18.5 44,258 18.1
Hw 8,666 9,476 9.3 9,657 1.9
I 6,014 7,570 25.9 6,845 –9.6
I 48,951 57,837 18.2 58,562 1.3
I 39,629 38,970 –1.7 49,383 26.7
Iw 16,232 18,529 14.2 18,296 –1.3K 14,315 12,766 –10.8 12,453 –2.5
Kky 16,790 20,969 24.9 21,377 1.9
L 19,153 18,184 –5.1 19,372 6.5
M 4,245 5,100 20.1 4,799 –5.9
My 22,882 26,122 14.2 27,450 5.1
M 44,197 51,188 15.8 49,776 –2.8
M 42,480 51,752 21.8 53,524 3.4
M 27,625 29,554 7.0 33,134 12.1
Mpp 10,974 13,048 18.9 13,830 6.0
M 23,452 29,044 23.8 31,434 8.2
M 3,214 3,647 13.5 3,933 7.8
Nbk 6,674 8,349 25.1 8,727 4.5
Nv 8,258 9,869 19.5 10,754 9.0Nw Hp 6,666 6,900 3.5 5,847 –15.3
Nw Jy 33,958 37,364 10.0 37,677 0.8
Nw Mx 10,223 13,247 29.6 11,133 –16.0
Nw Yk 113,470 133,524 17.7 146,085 9.4
N C 56,573 57,850 2.3 65,318 12.9
N Dk 2,775 3,145 13.3 2,998 –4.7
O 51,450 59,121 14.9 60,071 1.6
Ok 14,494 17,479 20.6 16,789 –3.9
O 23,348 26,499 13.5 31,595 19.2
Pyv 65,835 83,036 26.1 86,133 3.7
R I 8,112 8,707 7.3 9,011 3.5
S C 25,718 29,033 12.9 32,784 12.9
S Dk 3,065 3,208 4.7 3,331 3.8 26,258 29,779 13.4 29,737 –0.1
x 85,040 94,969 11.7 97,857 3.0
U 20,242 19,532 –3.5 20,919 7.1
V 5,307 5,520 4.0 6,099 10.5
V 37,981 46,647 22.8 49,531 6.2
W 24,576 30,530 24.2 29,580 –3.1
W V 6,935 8,456 21.9 9,460 11.9
W 27,718 29,458 6.3 31,483 6.9
Wy 2,309 2,819 22.1 3,097 9.9
1,397,253 1,577,810 12.9 1,682,627 6.6
8/8/2019 2009 Enrollment Survey
http://slidepdf.com/reader/full/2009-enrollment-survey 25/42
the modern language association o america 24
Enrollments in Languages Other Than English in United States Institutions of Higher Education, Fall 2009
able 4Modern Language (ML) Course Enrollments Compared with otal StudentEnrollments in Higher Education, 1960–2009
US
S
E *
Ix
Gw (%)**
ML C
E***
Ix
Gw (%)
ML C
E p
100 E
1960 3,789,000 100.0 608,749 100.0 16.11965 5,920,864 156.3 975,777 160.3 16.5
1968 7,513,091 198.3 1,073,097 176.3 14.3
1970 8,580,887 226.5 1,067,217 175.3 12.4
1972 9,214,820 243.2 963,930 158.3 10.5
1977 11,285,787 297.9 883,222 145.1 7.8
1980 12,096,895 319.3 877,691 144.2 7.3
1983 12,464,661 329.0 922,439 151.5 7.4
1986 12,503,511 330.0 960,588 157.8 7.7
1990 13,818,637 364.7 1,138,880 187.1 8.2
1995 14,261,781 376.4 1,096,603 180.1 7.7
1998 14,506,967 382.9 1,151,283 189.1 7.92002 16,611,711 438.4 1,347,036 221.3 8.1
2006 17,758,870 468.7 1,522,770 250.1 8.6
2009 19,037,000 502.4 1,629,326 267.7 8.6
*Te gures in the rst column are taken rom the Digest of Education Statistics , published
annually by the Natl. Center or Educ. Statistics, US Dept. o Educ. See the Digest of
Education Statistics , 2009, table 196 at http://nces.ed.gov/programs/digest/d09/tables/dt09_
196.p?=.
Te 1960 gure is an estimate, as is the 2009 gure. Te latter is taken rom a projections
table on the Natl. Center or Educ. Statistics Web site (http:// nces .ed .gov/ programs/
pj/pj2018/b/b_10.p?=).
**F x , 1960 = 100.0%.
***I b 1 2 xp L A Gk.
8/8/2019 2009 Enrollment Survey
http://slidepdf.com/reader/full/2009-enrollment-survey 26/42
the modern language association o america 25
Enrollments in Languages Other Than English in United States Institutions of Higher Education, Fall 2009
able 5Enrollments in the welve Leading Languages, Excluding Latin and Ancient Greek, in Selected Years
Enrollments
1960 1970 1980 1990 1995 1998 2002 2006 2009
Sp 178,689 389,150 379,379 533,944 606,286 656,590 746,267 822,985 864,986
F 228,813 359,313 248,361 272,472 205,351 199,064 201,979 206,426 216,419
G 146,116 202,569 126,910 133,348 96,263 89,020 91,100 94,264 96,349
ASL – – – 1,602 4,304 11,420 60,781 78,829 91,763
I 11,142 34,244 34,791 49,699 43,760 49,287 63,899 78,368 80,752
Jp 1,746 6,620 11,506 45,717 44,723 43,141 52,238 66,605 73,434
C 1,844 6,238 11,366 19,490 26,471 28,456 34,153 51,582 60,976
Ab 541 1,333 3,466 3,475 4,444 5,505 10,584 23,974 35,083
R 30,570 36,189 23,987 44,626 24,729 23,791 23,921 24,845 26,883
Hbw 1 3,834 16,567 19,429 12,995 13,127 15,833 22,802 23,752 22,052
P 1,033 5,065 4,894 6,211 6,531 6,926 8,385 10,267 11,371
K 168 101 374 2,286 3,343 4,479 5,211 7,145 8,511
604,496 1,057,389 864,463 1,125,865 1,079,332 1,133,512 1,321,320 1,489,042 1,588,579
% Change between Surveys
1960–70 1970–80 1980–90 1990–95 1995–98 1998–2002 2002–06 2006–09
Sp 117.8 –2.5 40.7 13.5 8.3 13.7 10.3 5.1
F 57.0 –30.9 9.7 –24.6 –3.1 1.5 2.2 4.8
G 38.6 –37.3 5.1 –27.8 –7.5 2.3 3.5 2.2
ASL – – – 168.7 165.3 432.2 29.7 16.4
I 207.3 1.6 42.9 –11.9 12.6 29.6 22.6 3.0
Jp 279.2 73.8 297.3 –2.2 –3.5 21.1 27.5 10.3
C 238.3 82.2 71.5 35.8 7.5 20.0 51.0 18.2
Ab 146.4 160.0 0.3 27.9 23.9 92.3 126.5 46.3
R 18.4 –33.7 86.0 –44.6 –3.8 0.5 3.9 8.2
Hbw 1 332.1 17.3 –33.1 1.0 20.6 44.0 4.2 –7.2
P 390.3 –3.4 26.9 5.2 6.0 21.1 22.4 10.8
K –39.9 270.3 511.2 46.2 34.0 16.3 37.1 19.1
74.9 –18.2 30.2 –4.1 5.0 16.6 12.7 6.7
1M Bb Hbw b.
8/8/2019 2009 Enrollment Survey
http://slidepdf.com/reader/full/2009-enrollment-survey 27/42
the modern language association o america 26
Enrollments in Languages Other Than English in United States Institutions of Higher Education, Fall 2009
Table 6Percentage of Total Language Course Enrollments, 1968–2009, for the Fourteen Most Commonly Taught Languages in 2009
1968 1980 1990 1995 1998 2002 2006 2009
Sp 32.4 41.0 45.1 53.2 55.0 53.4 52.2 51.4
F 34.4 26.9 23.0 18.0 16.7 14.5 13.1 12.9
G 19.2 13.7 11.3 8.5 7.5 6.5 6.0 5.7
ASL – – 0.1 0.4 1.0 4.4 5.0 5.5
I 2.7 3.8 4.2 3.8 4.1 4.6 5.0 4.8
Jp 0.4 1.2 3.9 3.9 3.6 3.7 4.2 4.4
C 0.4 1.2 1.6 2.3 2.4 2.4 3.3 3.6
Ab 0.1 0.4 0.3 0.4 0.5 0.8 1.5 2.1
L 3.1 2.7 2.4 2.3 2.2 2.1 2.0 1.9
R 3.6 2.6 3.8 2.2 2.0 1.7 1.6 1.6
Hbw 1 0.9 2.1 1.1 1.2 1.3 1.6 1.5 1.3
Gk, A 1.7 2.4 1.4 1.4 1.4 1.5 1.4 1.2
P 0.4 0.5 0.5 0.6 0.6 0.6 0.7 0.7
K 0.0 0.0 0.2 0.3 0.4 0.4 0.5 0.5
O 0.7 1.4 1.2 1.5 1.5 1.8 2.1 2.4
p 100 100 100 100 100 100 100 100
1,127,363 924,837 1,184,100 1,138,772 1,193,830 1,397,253 1,577,810 1,682,627
1M Bb Hbw b.
8/8/2019 2009 Enrollment Survey
http://slidepdf.com/reader/full/2009-enrollment-survey 28/42
the modern language association o america 27
Enrollments in Languages Other Than English in United States Institutions of Higher Education, Fall 2009
able 7bComparison o Introductory and Advanced Undergraduate Course Enrollments in the op Fiteen Languages in 2006
Iy
E
Av
E
R Iy
Av A E
Av E
% A E
Sp 669,432 142,602 5:1 812,034 17.6
F 160,736 40,927 4:1 201,663 20.3G 72,434 18,758 4:1 91,192 20.6
ASL 72,694 5,249 14:1 77,943 6.7
I 69,757 7,593 9:1 77,350 9.8
Jp 55,161 10,585 5:1 65,746 16.1
C 41,193 9,262 9:2 50,455 18.4
L 26,787 4,383 6:1 31,170 14.1
R 17,527 6,569 8:3 24,096 27.3
Ab 20,571 2,463 8:1 23,034 10.7
Gk, A 13,250 3,176 4:1 16,426 19.3
P 7,387 2,422 3:1 9,809 24.7
Hbw, M 7,665 1,250 6:1 8,915 14.0Hbw, Bb 7,854 705 11:1 8,559 8.2
K 5,511 1,397 4:1 6,908 20.2
O 27,836 3,478 8:1 31,314 11.1
1,275,795 260,819 5:1 1,536,614 17.0
able 7a Comparison o Introductory and Advanced Undergraduate Course Enrollments in the op Fiteen Languages in 2009
Iy
E
Av
E
R Iy
Av A E
Av E
% A E
Sp 711,032 141,749 5:1 852,781 16.6
F 172,573 39,605 4:1 212,178 18.7
G 76,317 17,432 4:1 93,749 18.6 ASL 83,450 7,487 11:1 90,937 8.2
I 72,403 7,574 10:1 79,977 9.5
Jp 59,892 12,825 5:1 72,717 17.6
C 47,676 12,291 4:1 59,967 20.5
Ab 29,650 4,651 6:1 34,301 13.6
L 27,273 4,309 6:1 31,582 13.6
R 19,850 6,437 3:1 26,287 24.5
Gk, A 12,812 3,046 4:1 15,858 19.2
P 8,112 2,821 3:1 10,933 25.8
Hbw, Bb 4,848 3,868 4:3 8,716 44.4
K 6,010 2,153 3:1 8,163 26.4Hbw, M 6,354 1,536 4:1 7,890 19.5
O 31,998 6,356 5:1 38,354 16.6
1,370,250 274,140 5:1 1,644,390 16.7
8/8/2019 2009 Enrollment Survey
http://slidepdf.com/reader/full/2009-enrollment-survey 29/42
the modern language association o america 28
Enrollments in Languages Other Than English in United States Institutions of Higher Education, Fall 2009
able 7cComparison o Introductory and Advanced Undergraduate Course Enrollments (Excluding Enrollments in wo-YearColleges) in the op Fiteen Languages in 2009
Iy
E
Av
E
R Iy
Av A E
Av E
% A E
Sp 462,241 140,084 3:1 602,325 23.3
F 135,600 39,366 3:1 174,966 22.5G 63,771 17,336 4:1 81,107 21.4
I 58,631 7,478 8:1 66,109 11.3
Jp 41,533 12,547 3:1 54,080 23.2
C 38,186 12,199 3:1 50,385 24.2
ASL 29,340 7,175 4:1 36,515 19.6
L 25,843 4,307 6:1 30,150 14.3
Ab 23,558 4,508 5:1 28,066 16.1
R 17,233 6,363 3:1 23,596 27.0
Gk, A 12,735 3,030 4:1 15,765 19.2
P 7,056 2,821 5:2 9,877 28.6
Hbw, Bb 4,463 3,868 4:3 8,331 46.4Hbw, M 5,872 1,527 4:1 7,399 20.6
K 4,998 2,087 2:1 7,085 29.5
O 24,520 6,205 4:1 30,725 20.2
955,580 270,901 7:2 1,226,481 22.1
able 7dComparison o Introductory and Advanced Undergraduate Course Enrollments (Excluding Enrollments in wo-YearColleges) in the op Fiteen Languages in 2006
Iy
E
Av
E
R Iy
Av A E
Av E
% A E
Sp 447,802 139,574 3:1 587,376 23.8
F 129,391 40,558 3:1 169,949 23.9
G 60,605 18,466 3:1 79,071 23.4
I 56,915 7,429 8:1 64,344 11.5
Jp 39,672 10,363 4:1 50,035 20.7
C 32,658 9,124 7:2 41,782 21.8
ASL 29,400 4,100 7:1 33,500 12.2
L 25,867 4,383 6:1 30,250 14.5
R 15,262 6,459 7:3 21,721 29.7
Ab 16,267 2,383 7:1 18,650 12.8
Gk, A 13,189 3,176 4:1 16,365 19.4
P 6,645 2,384 3:1 9,029 26.4
Hbw, M 7,192 1,245 6:1 8,437 14.8
Hbw, Bb 7,812 705 11:1 8,517 8.3
K 4,294 1,393 3:1 5,687 24.5
O 22,483 3,362 7:1 25,845 13.0
915,454 255,104 7:2 1,170,558 21.8

8/8/2019 2009 Enrollment Survey
http://slidepdf.com/reader/full/2009-enrollment-survey 30/42
the modern language association o america 29
Enrollments in Languages Other Than English in United States Institutions of Higher Education, Fall 2009
w-Y C F-Y C G P
2006 2009 2006 2009 2006 2009 2006 2009
Ak 25 4 25 4
Ak 6 13 2 8 13
Akk 36 51 60 93 96 144 Ak L 207 0 207
Ab 1 0 1
A 13 59 3 1 16 60
Ab 217 36 27 244 36
Ap 21 47 21 47
Ab, C 1 285 3 4 285
Ab, Iq 60 1 0 61
Ab, Q’A 9 20 10 1 19 21
Ab, S 3 0 3
A 26 1,812 229 718 333 2,556 562
A, M 22 0 22
A, 8 12 8
Ap 13 41 22 19 35 60 Ak 13 0 13
A 489 537 282 239 3 1 774 777
A, C 7 0 7
A, E 91 84 91 84
A, W 17 31 17 31
Ab 23 0 23
Ay 1 0 1
Azbj 2 0 2
Az 3 0 3
B 26 2 0 28
Bb 41 5 46 0
Bq 5 57 3 5 60
B 1 85 94 9 2 94 97Bk 50 42 33 83 42
B 8 52 3 8 55
B/C/Sb 25 0 25
B 59 12 59 12
B 33 27 2 35 27
Cb 29 27 29 27
C 96 57 82 135 9 178 201
C 57 105 7 5 64 110
C 20 49 18 38 49
C 15 18 15 18
Ck 23 55 283 293 306 348
Cy 34 28 34 28
Cy, N 22 50 22 50Cw 3 0 3
C, C 101 163 12 39 113 202
Cyj 11 0 11
Cppw/C 12 0 12
Cw 4 6 164 187 168 193
C ’A 4 0 4
C 16 12 16 12
Cp 8 4 20 15 28 19
able 8a Course Enrollments in 244 Less Commonly aught Languages, 2006 and 2009 (Languages in Alphabetical Order)
(continued )
8/8/2019 2009 Enrollment Survey
http://slidepdf.com/reader/full/2009-enrollment-survey 31/42
the modern language association o america 30
Enrollments in Languages Other Than English in United States Institutions of Higher Education, Fall 2009
w-Y C F-Y C G P
2006 2009 2006 2009 2006 2009 2006 2009
C 44 10 20 10 64
C, H 165 135 6 171 135
C, Cp V 8 32 22 32 30 64C 20 42 4 2 24 44
Cw I 79 94 79 94
Cz 302 394 27 15 329 409
Dk 173 54 0 227
Dk/Lk 40 19 576 24 9 625 43
D 146 150 9 155 150
D 100 4 17 104 17
Dk 3 0 3
D 423 519 22 11 445 530
Eyp 49 79 7 31 56 110
Eyp, M 30 8 1 30 9
Ep 7 0 7
E 9 2 3 12 2Ep 1 1 0
Evk 1 1 0
F 56 63 187 259 243 322
F/P 335 0 335
Fp 315 0 315
F 4 8 145 108 1 150 116
F 3 0 3
G 3 0 3
G, S 6 39 7 13 39
G 8 14 1 8 15
G, M H 1 45 8 10 9 55
G, T 1 7 1 7
Gky 3 3 0Gk 126 26 0 152
Gk L 1,274 32 0 1,306
Gk, Bb 142 195 0 337
Gk, K 17 134 194 0 345
Gk, K (Bb) 15 53 0 68
Gk, M 13 72 1,217 1,883 64 63 1,294 2,018
Gk, Nw 73 22 0 95
Gk, O 3 0 3
G V 20 13 20 13
Gj 18 11 18 11
Gw’ 10 1 11 0
H 4 4 0
H 49 34 5 54 34Hw 307 719 1,320 1,188 27 99 1,654 2,006
Hbw, Bb M 36 10 613 35 10 684
H 15 34 15 34
H 14 39 1,840 2,114 92 54 1,946 2,207
H-U 5 309 600 84 34 393 639
H 9 3 0 12
H 149 110 253 264 11 402 385
H-Ck 30 0 30
able 8a (cont.)Course Enrollments in 244 Less Commonly aught Languages, 2006 and 2009 (Languages in Alphabetical Order)
(continued )
8/8/2019 2009 Enrollment Survey
http://slidepdf.com/reader/full/2009-enrollment-survey 32/42
the modern language association o america 31
Enrollments in Languages Other Than English in United States Institutions of Higher Education, Fall 2009
w-Y C F-Y C G P
2006 2009 2006 2009 2006 2009 2006 2009
H 5 230 110 3 3 238 113
I 4 7 4 7
I, O 3 3 0Ib 2 25 2 25
I 79 96 79 96
I 10 17 234 234 57 46 301 297
Ipq 58 31 51 109 31
I 158 16 16 158
I, O 3 21 3 21
I 27 383 303 1 384 330
I, M 15 76 15 76
I, O 7 7 7 7
Jp, C 23 22 7 30 22
Jv 1 0 1
K 3 1 3 1
K 2 3 2 3Kzk 6 3 2 1 8 4
K 47 58 2 47 60
Kw 82 121 82 121
Kw 50 0 50
K 9 0 9
K 1 18 4 5 18
Kj 10 10 0
K 10 10 0
Kyyz 1 0 1
Lk 19 580 21 19 601
Lk/Dk 42 0 42
L 4 10 4 10
L, Mv 20 3 124 2 5 144Lv 9 7 2 11 7
L 56 11 2 1 58 12
L 2 12 14 0
L 52 16 52 16
M 19 10 29 0
My 1 1 4 5 1
My 18 17 2 18 19
M 9 9 0
M 4 0 4
M 412 1,250 109 0 1,771
M 27 42 27 42
M 9 0 9
M 2 2 0My 57 26 1 58 26
My, Kqk 2 2 4 0
M 20 31 20 31
Mwk 29 21 29 21
M 4 10 1 5 10
Mk (Ck) 179 143 179 143
N 21 0 21
Nk 20 20 0
able 8a (cont.)Course Enrollments in 244 Less Commonly aught Languages, 2006 and 2009 (Languages in Alphabetical Order)
(continued )
8/8/2019 2009 Enrollment Survey
http://slidepdf.com/reader/full/2009-enrollment-survey 33/42
the modern language association o america 32
Enrollments in Languages Other Than English in United States Institutions of Higher Education, Fall 2009
w-Y C F-Y C G P
2006 2009 2006 2009 2006 2009 2006 2009
Nk 3 8 3 8
Nb 9 0 9
Nvj 429 673 218 237 2 4 649 914Np 26 44 2 28 44
Nz P 7 11 8 38 15 49
N 12 21 3 21 15
Nw 774 827 8 5 782 832
Nx (Ok Np)
10 10 0
Ojbw 167 373 466 327 633 700
O 13 13 13 13
O 25 23 17 23 42
P 1 1 1 1 2 2
Pp 28 0 28
P 100 3 19 103 19
Pyv D 3 3 0P 573 254 1,339 1,540 125 103 2,037 1,897
P, A 29 0 29
Pp 252 241 373 105 625 346
P 16 12 16 12
P 155 94 1,177 1,120 47 35 1,379 1,249
P 1 1 0
Pjb 305 103 160 103 465
P, A 95 0 95
Q 37 90 18 10 55 100
R 1 1 0
R 122 178 12 15 134 193
Sp 18 11 18 11
S 10 14 52 32 62 46S 17 263 281 280 281
Sk 452 376 155 107 607 483
Sk, V 5 16 5 16
Sv 37 518 57 37 575
Sb 13 53 3 22 16 75
Sb/C 11 1 0 12
Sb-C 30 4 248 163 25 7 303 174
S 24 0 24
S 1 1 0 2
S 9 10 21 10 30 20
S 4 0 4
S 4 4 0
Sv 79 3 0 82Sv, O C 121 53 12 20 133 73
Sv, C 10 0 10
Svk 34 64 34 64
Sv 1 1 0
Sv 13 13 0 26
S 4 44 2 4 46
S 15 15 0
Sp, P 15 14 15 14
able 8a (cont.)Course Enrollments in 244 Less Commonly aught Languages, 2006 and 2009 (Languages in Alphabetical Order)
(continued )
8/8/2019 2009 Enrollment Survey
http://slidepdf.com/reader/full/2009-enrollment-survey 34/42
the modern language association o america 33
Enrollments in Languages Other Than English in United States Institutions of Higher Education, Fall 2009
w-Y C F-Y C G P
2006 2009 2006 2009 2006 2009 2006 2009
S 8 16 2 5 10 21
Sw 25 7 2,075 2,442 63 39 2,163 2,488
Sw 693 761 29 2 722 763Sy 4 8 35 17 39 25
419 352 522 310 3 944 662
17 18 17 18
w 21 20 1 21 21
jk (zk) 4 0 4
77 86 23 11 100 97
15 40 1 7 16 47
T 10 27 266 274 31 17 307 318
b 56 70 64 39 120 109
b, C 11 34 33 7 44 41
y 4 0 4
32 32 0
O’ 13 15 5 28 5 14 61 16 75 16
35 0 35
w 1 0 1
k 23 3 6 2 29 5
k 10 8 531 571 83 59 624 638
k, O A 2 2 0
k, O 7 7 7 7
w 32 14 4 6 36 20
U 46 17 46 17
U 4 5 4 5
Uk 95 55 8 17 103 72
U 60 23 260 282 24 30 344 335
Uzbk 10 4 22 19 13 1 45 24V 1,203 1,465 1,261 1,234 21 16 2,485 2,715
Wbk, M 16 28 16 28
W 83 33 83 33
W, Ey 8 0 8
W 116 156 6 4 122 160
X 2 16 2 1 4 17
Xw (L) 3 15 3 15
Yq 12 0 12
Y 925 306 44 30 969 336
Yb 257 411 8 265 411
Yp’k 62 62 0
Zp 8 8 8 8
Z 123 103 9 1 132 104Z 13 0 13
5,469 7,549 25,845 30,805 2,414 2,393 33,728 40,747
able 8a (cont.)Course Enrollments in 244 Less Commonly aught Languages, 2006 and 2009 (Languages in Alphabetical Order)
8/8/2019 2009 Enrollment Survey
http://slidepdf.com/reader/full/2009-enrollment-survey 35/42
the modern language association o america 34
Enrollments in Languages Other Than English in United States Institutions of Higher Education, Fall 2009
w-Y C F-Y C G P
2006 2009 2006 2009 2006 2009 2006 2009
V 1,203 1,465 1,261 1,234 21 16 2,485 2,715
Sw 25 7 2,075 2,442 63 39 2,163 2,488H 14 39 1,840 2,114 92 54 1,946 2,207
Gk, M 13 72 1,217 1,883 64 63 1,294 2,018
Hw 307 719 1,320 1,188 27 99 1,654 2,006
P 573 254 1,339 1,540 125 103 2,037 1,897
M 412 1,250 109 0 1,771
Gk L 1,274 32 0 1,306
P 155 94 1,177 1,120 47 35 1,379 1,249
Nvj 429 673 218 237 2 4 649 914
Nw 774 827 8 5 782 832
A 489 537 282 239 3 1 774 777
Sw 693 761 29 2 722 763
Ojbw 167 373 466 327 633 700
Hbw, Bb M 36 10 613 35 10 684 419 352 522 310 3 944 662
H-U 5 309 600 84 34 393 639
k 10 8 531 571 83 59 624 638
Lk 19 580 21 19 601
Sv 37 518 57 37 575
A 26 1,812 229 718 333 2,556 562
D 423 519 22 11 445 530
Sk 452 376 155 107 607 483
Pjb 305 103 160 103 465
Yb 257 411 8 265 411
Cz 302 394 27 15 329 409
H 149 110 253 264 11 402 385
Ck 23 55 283 293 306 348Pp 252 241 373 105 625 346
Gk, K 17 134 194 0 345
Gk, Bb 142 195 0 337
Y 925 306 44 30 969 336
F/P 335 0 335
U 60 23 260 282 24 30 344 335
I 27 383 303 1 384 330
F 56 63 187 259 243 322
T 10 27 266 274 31 17 307 318
Fp 315 0 315
I 10 17 234 234 57 46 301 297
Ab, C 1 285 3 4 285
S 17 263 281 280 281Dk 173 54 0 227
Ak L 207 0 207
C, C 101 163 12 39 113 202
C 96 57 82 135 9 178 201
Cw 4 6 164 187 168 193
R 122 178 12 15 134 193
Sb-C 30 4 248 163 25 7 303 174
W 116 156 6 4 122 160
able 8bCourse Enrollments in 244 Less Commonly aught Languages, 2006 and 2009 (Languages in Descending Order o 2009 otals)
(continued )
8/8/2019 2009 Enrollment Survey
http://slidepdf.com/reader/full/2009-enrollment-survey 36/42
the modern language association o america 35
Enrollments in Languages Other Than English in United States Institutions of Higher Education, Fall 2009
w-Y C F-Y C G P
2006 2009 2006 2009 2006 2009 2006 2009
I 158 16 16 158
Gk 126 26 0 152D 146 150 9 155 150
Akk 36 51 60 93 96 144
L, Mv 20 3 124 2 5 144
Mk (Ck) 179 143 179 143
H C 165 135 6 171 135
Kw 82 121 82 121
F 4 8 145 108 1 150 116
H 5 230 110 3 3 238 113
C 57 105 7 5 64 110
Eyp 49 79 7 31 56 110
b 56 70 64 39 120 109
Z 123 103 9 1 132 104
Q 37 90 18 10 55 100B 1 85 94 9 2 94 97
77 86 23 11 100 97
I 79 96 79 96
Gk, Nw 73 22 0 95
P, A 95 0 95
Cw I 79 94 79 94
A, E 91 84 91 84
Sv 79 3 0 82
I, M 15 76 15 76
Sb 13 53 3 22 16 75
Sv, O C 121 53 12 20 133 73
Uk 95 55 8 17 103 72
Gk, K (Bb) 15 53 0 68C 44 10 20 10 64
C, Cp V 8 32 22 32 30 64
Svk 34 64 34 64
Ab, Iq 60 1 0 61
A 13 59 3 1 16 60
Ap 13 41 22 19 35 60
Bq 5 57 3 5 60
K 47 58 2 47 60
B 8 52 3 8 55
G, M H 1 45 8 10 9 55
Cy, N 22 50 22 50
Kw 50 0 50
C 20 49 18 38 49Nz P 7 11 8 38 15 49
Ap 21 47 21 47
15 40 1 7 16 47
S 10 14 52 32 62 46
S 4 44 2 4 46
C 20 42 4 2 24 44
Np 26 44 2 28 44
Dk/Lk 40 19 576 24 9 625 43
able 8b (cont.)Course Enrollments in 244 Less Commonly aught Languages, 2006 and 2009 (Languages in Descending Order o 2009 otals)
(continued )
8/8/2019 2009 Enrollment Survey
http://slidepdf.com/reader/full/2009-enrollment-survey 37/42
the modern language association o america 36
Enrollments in Languages Other Than English in United States Institutions of Higher Education, Fall 2009
w-Y C F-Y C G P
2006 2009 2006 2009 2006 2009 2006 2009
Bk 50 42 33 83 42
Lk/Dk 42 0 42M 27 42 27 42
O 25 23 17 23 42
b, C 11 34 33 7 44 41
G, S 6 39 7 13 39
Ab 217 36 27 244 36
35 0 35
H 49 34 5 54 34
H 15 34 15 34
W 83 33 83 33
A, W 17 31 17 31
Ipq 58 31 51 109 31
M 20 31 20 31
H-Ck 30 0 30P, A 29 0 29
B 26 2 0 28
Cy 34 28 34 28
Pp 28 0 28
Wbk, M 16 28 16 28
B 33 27 2 35 27
Cb 29 27 29 27
My 57 26 1 58 26
Sv 13 13 0 26
B/C/Sb 25 0 25
Ib 2 25 2 25
Sy 4 8 35 17 39 25
S 24 0 24Uzbk 10 4 22 19 13 1 45 24
Ab 23 0 23
A, M 22 0 22
Jp, C 23 22 7 30 22
Ab, Q’A 9 20 10 1 19 21
I, O 3 21 3 21
Mwk 29 21 29 21
N 21 0 21
S 8 16 2 5 10 21
w 21 20 1 21 21
S 9 10 21 10 30 20
w 32 14 4 6 36 20
Cp 8 4 20 15 28 19My 18 17 2 18 19
P 100 3 19 103 19
C 15 18 15 18
K 1 18 4 5 18
17 18 17 18
D 100 4 17 104 17
U 46 17 46 17
X 2 16 2 1 4 17
able 8b (cont.)Course Enrollments in 244 Less Commonly aught Languages, 2006 and 2009 (Languages in Descending Order o 2009 otals)
(continued )
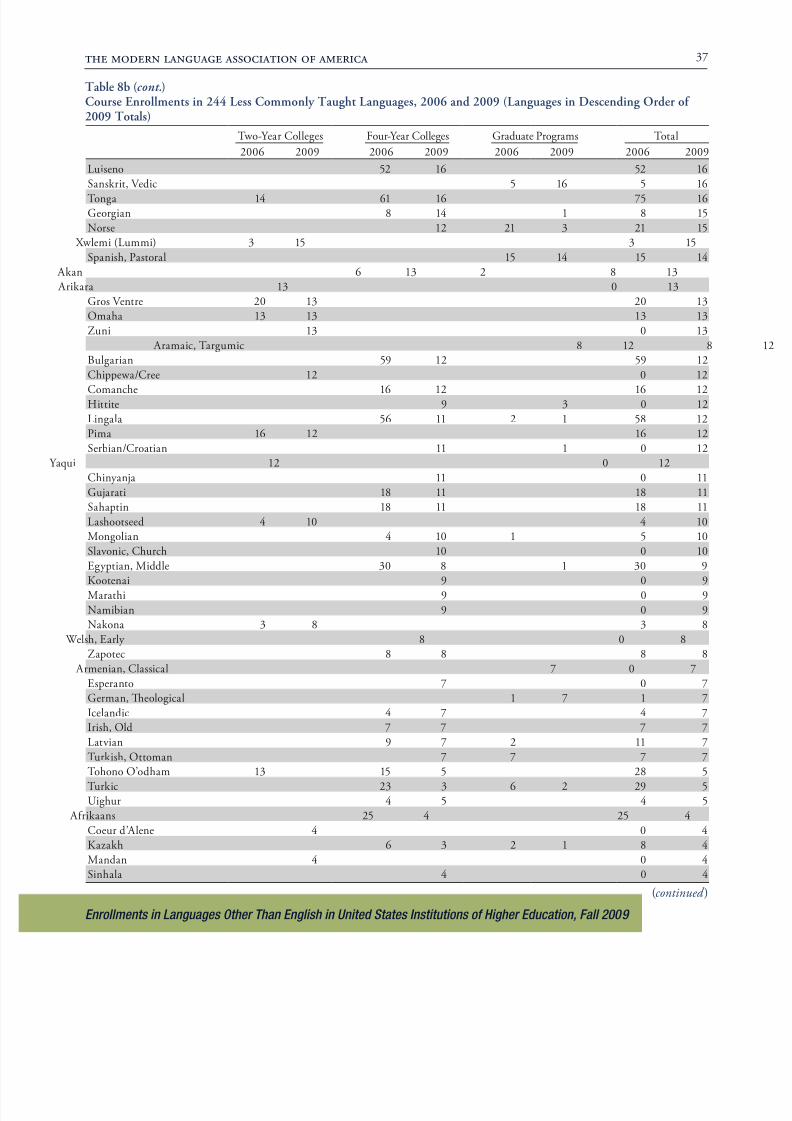
8/8/2019 2009 Enrollment Survey
http://slidepdf.com/reader/full/2009-enrollment-survey 38/42
the modern language association o america 37
Enrollments in Languages Other Than English in United States Institutions of Higher Education, Fall 2009
w-Y C F-Y C G P
2006 2009 2006 2009 2006 2009 2006 2009
L 52 16 52 16
Sk, V 5 16 5 16 14 61 16 75 16
G 8 14 1 8 15
N 12 21 3 21 15
Xw (L) 3 15 3 15
Sp, P 15 14 15 14
Ak 6 13 2 8 13
Ak 13 0 13
G V 20 13 20 13
O 13 13 13 13
Z 13 0 13
A, 8 12 8
B 59 12 59 12
Cppw/C 12 0 12C 16 12 16 12
H 9 3 0 12
L 56 11 2 1 58 12
P 16 12 16 12
Sb/C 11 1 0 12
Yq 12 0 12
Cyj 11 0 11
Gj 18 11 18 11
Sp 18 11 18 11
L 4 10 4 10
M 4 10 1 5 10
Sv, C 10 0 10
Eyp, M 30 8 1 30 9K 9 0 9
M 9 0 9
Nb 9 0 9
Nk 3 8 3 8
W, Ey 8 0 8
Zp 8 8 8 8
A, C 7 0 7
Ep 7 0 7
G, T 1 7 1 7
I 4 7 4 7
I, O 7 7 7 7
Lv 9 7 2 11 7
k, O 7 7 7 7 O’ 13 15 5 28 5
k 23 3 6 2 29 5
U 4 5 4 5
Ak 25 4 25 4
C ’A 4 0 4
Kzk 6 3 2 1 8 4
M 4 0 4
S 4 0 4
able 8b (cont.)Course Enrollments in 244 Less Commonly aught Languages, 2006 and 2009 (Languages in Descending Order o 2009 otals)
(continued )
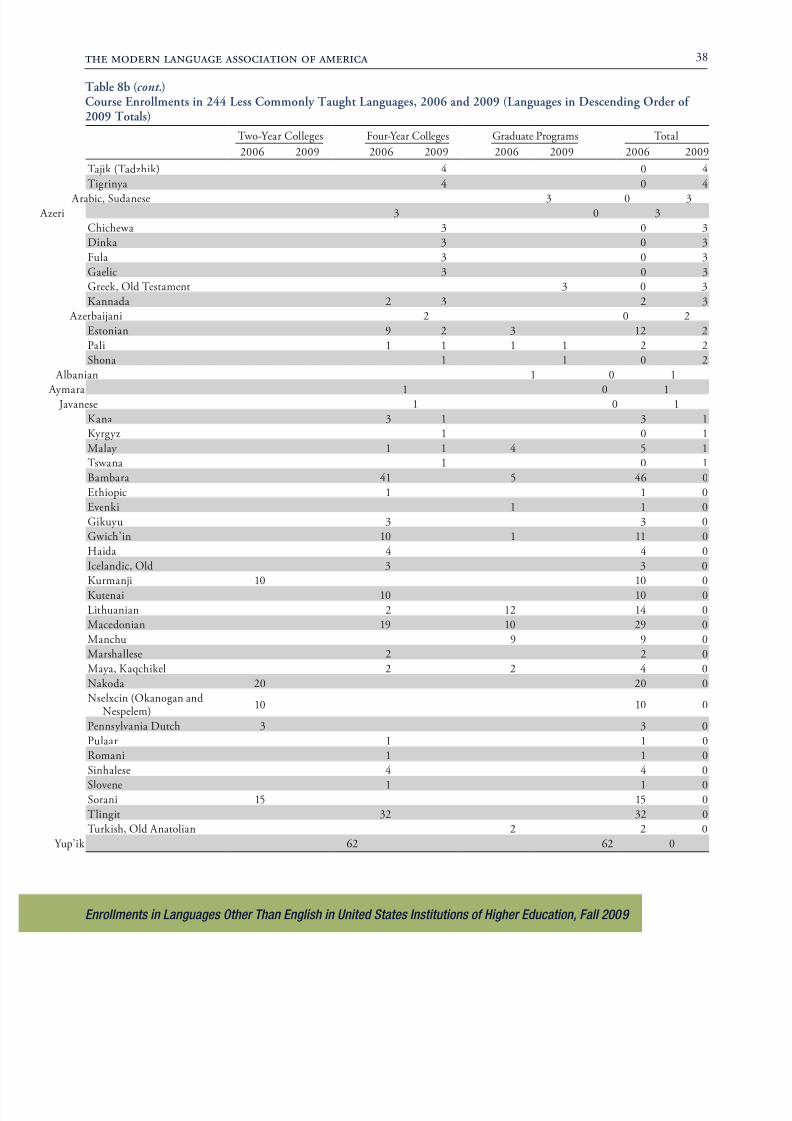
8/8/2019 2009 Enrollment Survey
http://slidepdf.com/reader/full/2009-enrollment-survey 39/42
the modern language association o america 38
Enrollments in Languages Other Than English in United States Institutions of Higher Education, Fall 2009
w-Y C F-Y C G P
2006 2009 2006 2009 2006 2009 2006 2009
jk (zk) 4 0 4
y 4 0 4 Ab, S 3 0 3
Az 3 0 3
Cw 3 0 3
Dk 3 0 3
F 3 0 3
G 3 0 3
Gk, O 3 0 3
K 2 3 2 3
Azbj 2 0 2
E 9 2 3 12 2
P 1 1 1 1 2 2
S 1 1 0 2
Ab 1 0 1 Ay 1 0 1
Jv 1 0 1
K 3 1 3 1
Kyyz 1 0 1
My 1 1 4 5 1
w 1 0 1
Bb 41 5 46 0
Ep 1 1 0
Evk 1 1 0
Gky 3 3 0
Gw’ 10 1 11 0
H 4 4 0
I, O 3 3 0Kj 10 10 0
K 10 10 0
L 2 12 14 0
M 19 10 29 0
M 9 9 0
M 2 2 0
My, Kqk 2 2 4 0
Nk 20 20 0
Nx (Ok Np)
10 10 0
Pyv D 3 3 0
P 1 1 0
R 1 1 0S 4 4 0
Sv 1 1 0
S 15 15 0
32 32 0
k, O A 2 2 0
Yp’k 62 62 0
able 8b (cont.)Course Enrollments in 244 Less Commonly aught Languages, 2006 and 2009 (Languages in Descending Order o 2009 otals)
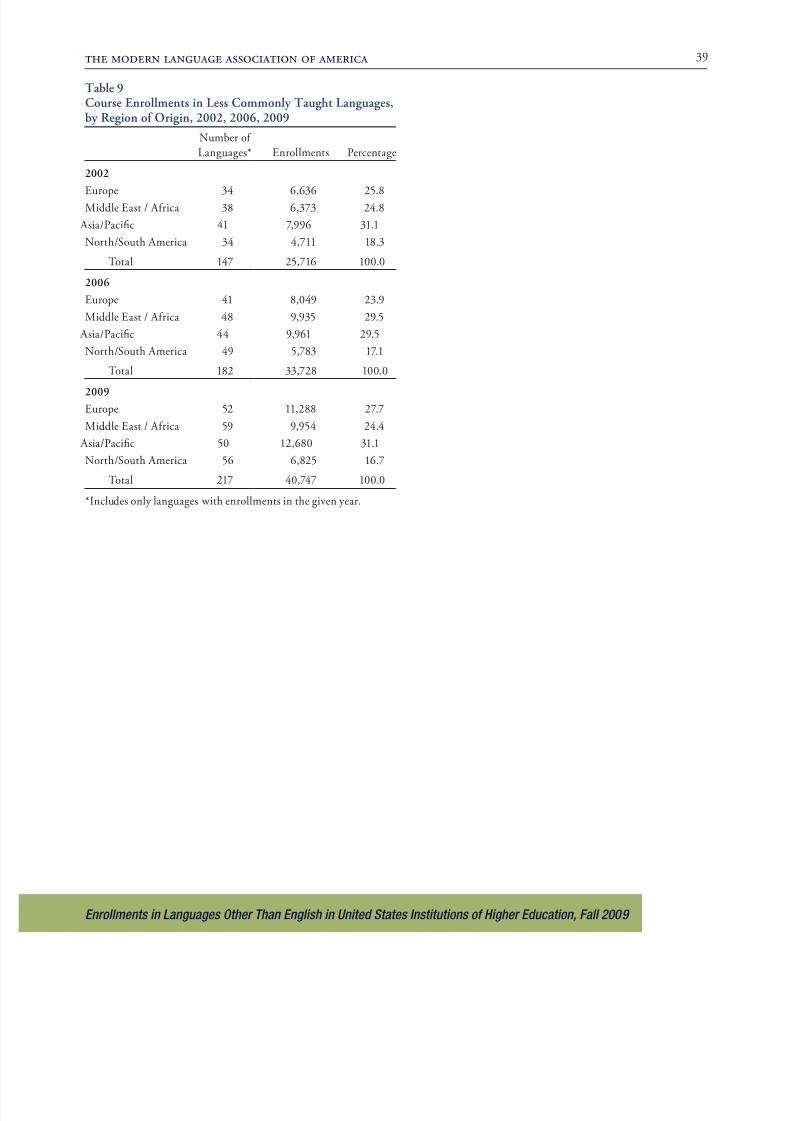
8/8/2019 2009 Enrollment Survey
http://slidepdf.com/reader/full/2009-enrollment-survey 40/42
the modern language association o america 39
Enrollments in Languages Other Than English in United States Institutions of Higher Education, Fall 2009
able 9Course Enrollments in Less Commonly aught Languages,by Region o Origin, 2002, 2006, 2009
Nb
L* E P
2002
Ep 34 6,636 25.8M E / A 38 6,373 24.8
A/P 41 7,996 31.1
N/S A 34 4,711 18.3
147 25,716 100.0
2006
Ep 41 8,049 23.9
M E / A 48 9,935 29.5
A/P 44 9,961 29.5
N/S A 49 5,783 17.1
182 33,728 100.0
2009
Ep 52 11,288 27.7
M E / A 59 9,954 24.4
A/P 50 12,680 31.1
N/S A 56 6,825 16.7
217 40,747 100.0
*I y w v y.
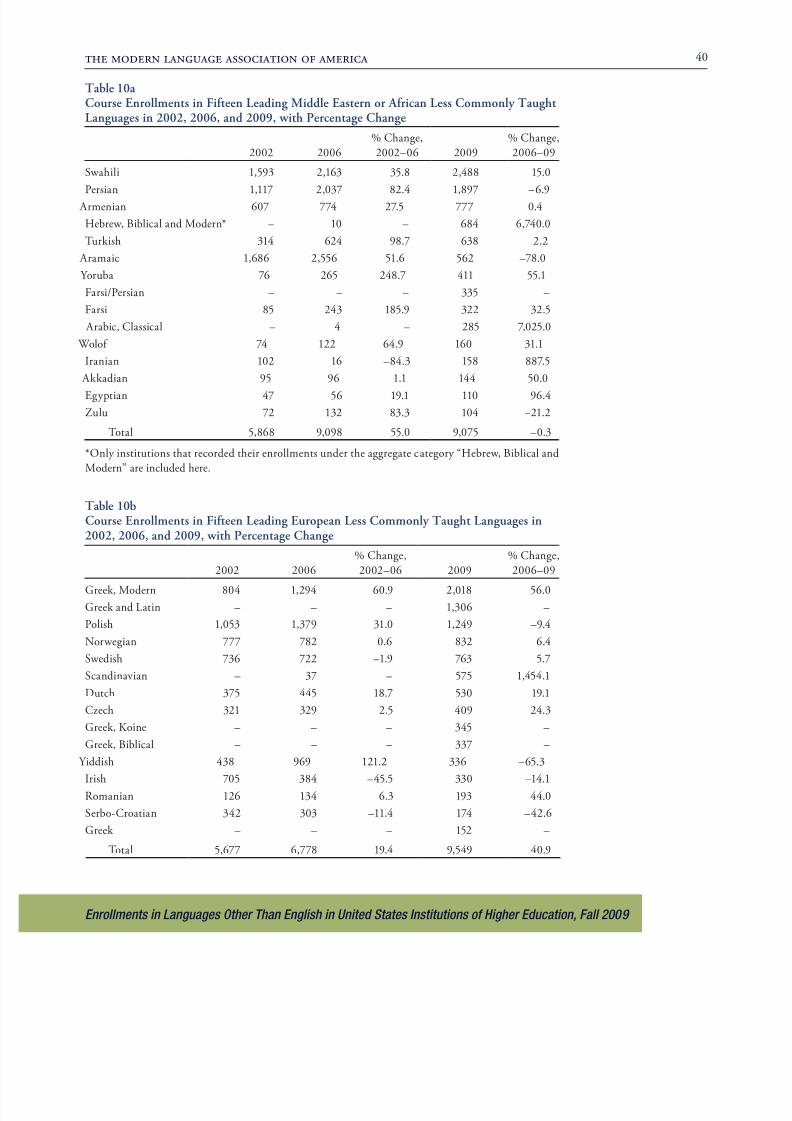
8/8/2019 2009 Enrollment Survey
http://slidepdf.com/reader/full/2009-enrollment-survey 41/42
the modern language association o america 40
Enrollments in Languages Other Than English in United States Institutions of Higher Education, Fall 2009
able 10a Course Enrollments in Fiteen Leading Middle Eastern or Arican Less Commonly aughtLanguages in 2002, 2006, and 2009, with Percentage Change
2002 2006
% C,
2002–06 2009
% C,
2006–09
Sw 1,593 2,163 35.8 2,488 15.0
P 1,117 2,037 82.4 1,897 –6.9 A 607 774 27.5 777 0.4
Hbw, Bb M* – 10 – 684 6,740.0
k 314 624 98.7 638 2.2
A 1,686 2,556 51.6 562 –78.0
Yb 76 265 248.7 411 55.1
F/P – – – 335 –
F 85 243 185.9 322 32.5
Ab, C – 4 – 285 7,025.0
W 74 122 64.9 160 31.1
I 102 16 –84.3 158 887.5
Akk 95 96 1.1 144 50.0Eyp 47 56 19.1 110 96.4
Z 72 132 83.3 104 –21.2
5,868 9,098 55.0 9,075 –0.3
*Only institutions that recorded their enrollments under the aggregate category “Hebrew, Biblical and
M” .
able 10bCourse Enrollments in Fiteen Leading European Less Commonly aught Languages in2002, 2006, and 2009, with Percentage Change
2002 2006
% C,
2002–06 2009
% C,
2006–09
Gk, M 804 1,294 60.9 2,018 56.0
Gk L – – – 1,306 –
P 1,053 1,379 31.0 1,249 –9.4
Nw 777 782 0.6 832 6.4
Sw 736 722 –1.9 763 5.7
Sv – 37 – 575 1,454.1
D 375 445 18.7 530 19.1
Cz 321 329 2.5 409 24.3
Gk, K – – – 345 –
Gk, Bb – – – 337 –
Y 438 969 121.2 336 –65.3
I 705 384 –45.5 330 –14.1
R 126 134 6.3 193 44.0
Sb-C 342 303 –11.4 174 –42.6
Gk – – – 152 –
5,677 6,778 19.4 9,549 40.9
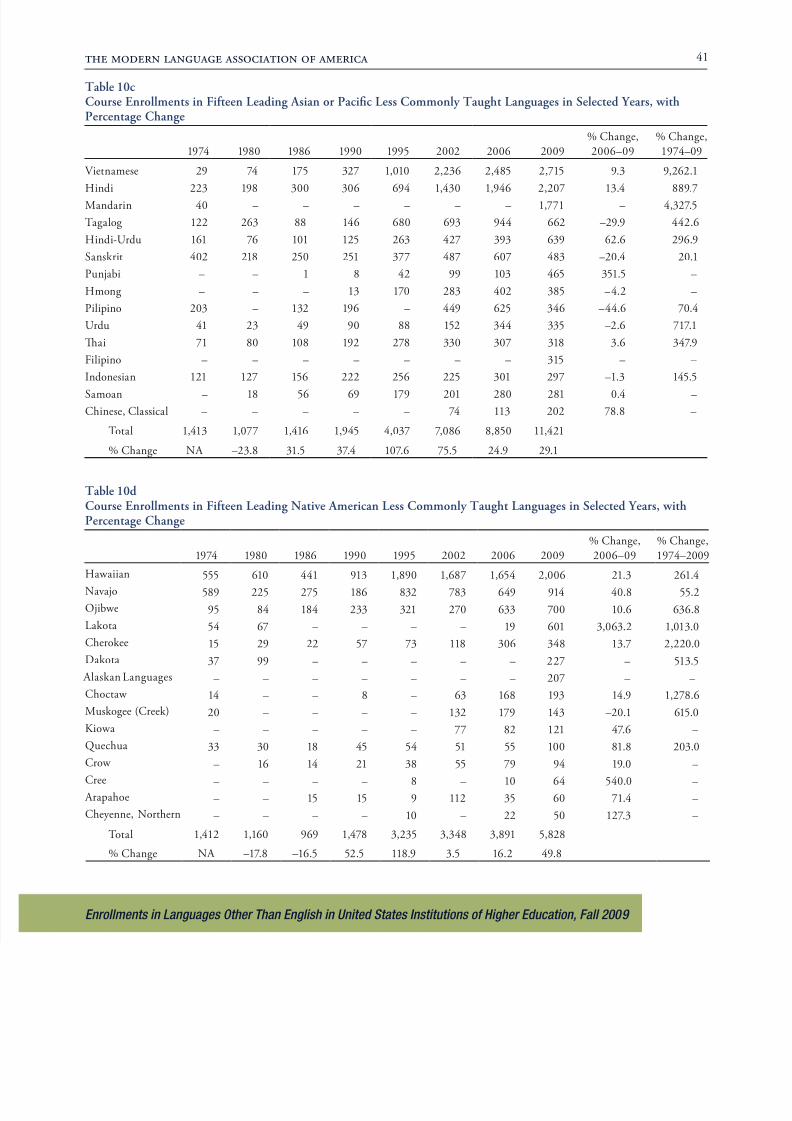
8/8/2019 2009 Enrollment Survey
http://slidepdf.com/reader/full/2009-enrollment-survey 42/42
the modern language association o america 41
able 10dCourse Enrollments in Fiteen Leading Native American Less Commonly aught Languages in Selected Years, withPercentage Change
1974 1980 1986 1990 1995 2002 2006 2009
% C,
2006–09
% C,
1974–2009
Hw 555 610 441 913 1,890 1,687 1,654 2,006 21.3 261.4
Nvj 589 225 275 186 832 783 649 914 40.8 55.2
Ojbw 95 84 184 233 321 270 633 700 10.6 636.8
Lk 54 67 – – – – 19 601 3,063.2 1,013.0
Ck 15 29 22 57 73 118 306 348 13.7 2,220.0
Dk 37 99 – – – – – 227 – 513.5
Ak L – – – – – – – 207 – –
Cw 14 – – 8 – 63 168 193 14.9 1,278.6
Mk (Ck) 20 – – – – 132 179 143 –20.1 615.0
Kw – – – – – 77 82 121 47.6 –
Q 33 30 18 45 54 51 55 100 81.8 203.0
Cw – 16 14 21 38 55 79 94 19.0 –
C – – – – 8 – 10 64 540.0 –
Ap – – 15 15 9 112 35 60 71.4 –
Cy, N – – – – 10 – 22 50 127.3 –
1,412 1,160 969 1,478 3,235 3,348 3,891 5,828
% C NA 17 8 16 5 52 5 118 9 3 5 16 2 49 8
able 10cCourse Enrollments in Fiteen Leading Asian or Pacifc Less Commonly aught Languages in Selected Years, withPercentage Change
1974 1980 1986 1990 1995 2002 2006 2009
% C,
2006–09
% C,
1974–09
V 29 74 175 327 1,010 2,236 2,485 2,715 9.3 9,262.1
H 223 198 300 306 694 1,430 1,946 2,207 13.4 889.7M 40 – – – – – – 1,771 – 4,327.5
122 263 88 146 680 693 944 662 –29.9 442.6
H-U 161 76 101 125 263 427 393 639 62.6 296.9
Sk 402 218 250 251 377 487 607 483 –20.4 20.1
Pjb – – 1 8 42 99 103 465 351.5 –
H – – – 13 170 283 402 385 –4.2 –
Pp 203 – 132 196 – 449 625 346 –44.6 70.4
U 41 23 49 90 88 152 344 335 –2.6 717.1
T 71 80 108 192 278 330 307 318 3.6 347.9
Fp – – – – – – – 315 – –
I 121 127 156 222 256 225 301 297 –1.3 145.5S – 18 56 69 179 201 280 281 0.4 –
C, C – – – – – 74 113 202 78.8 –
1,413 1,077 1,416 1,945 4,037 7,086 8,850 11,421
% C NA –23.8 31.5 37.4 107.6 75.5 24.9 29.1