Embed Size (px)
Citation preview
Serving Pharmaceutical, Biopharmaceutical, Nutraceutical, Life Sciences and Allied IndustriesVo
lume 9
Numb
er 4
| Jun
e 200
9
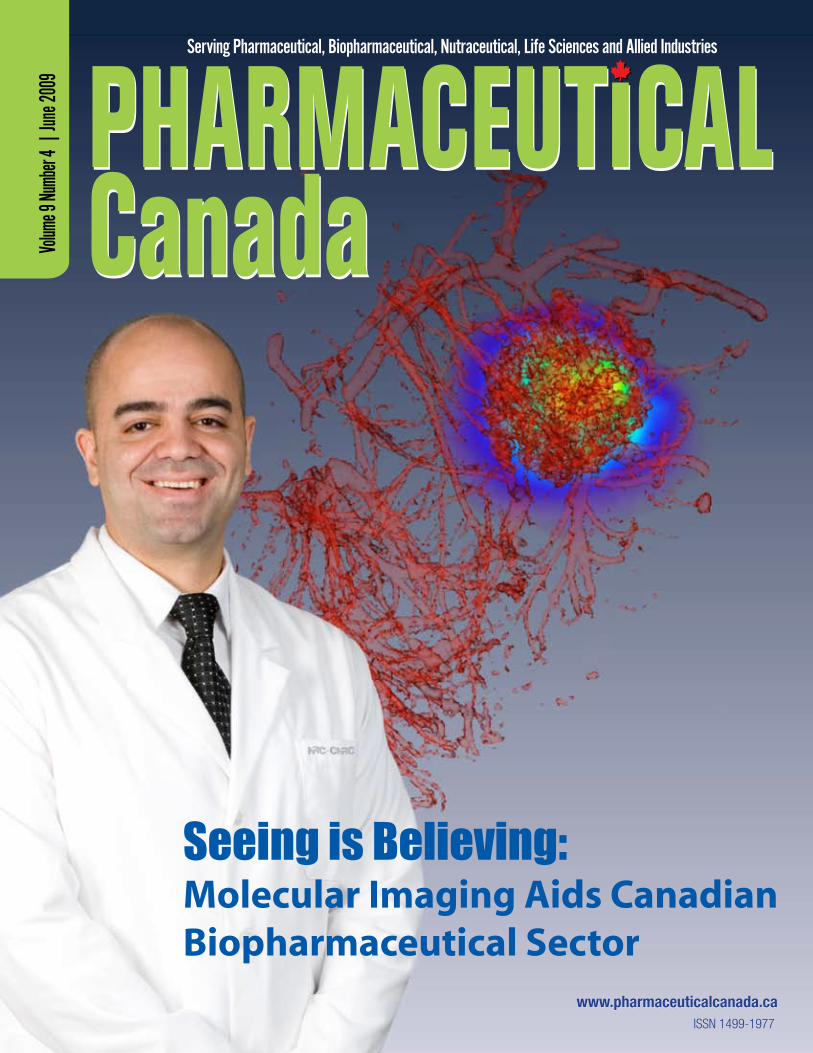
Seeing is Believing: Molecular Imaging Aids Canadian Biopharmaceutical Sector
Passion. Power. Productivity.
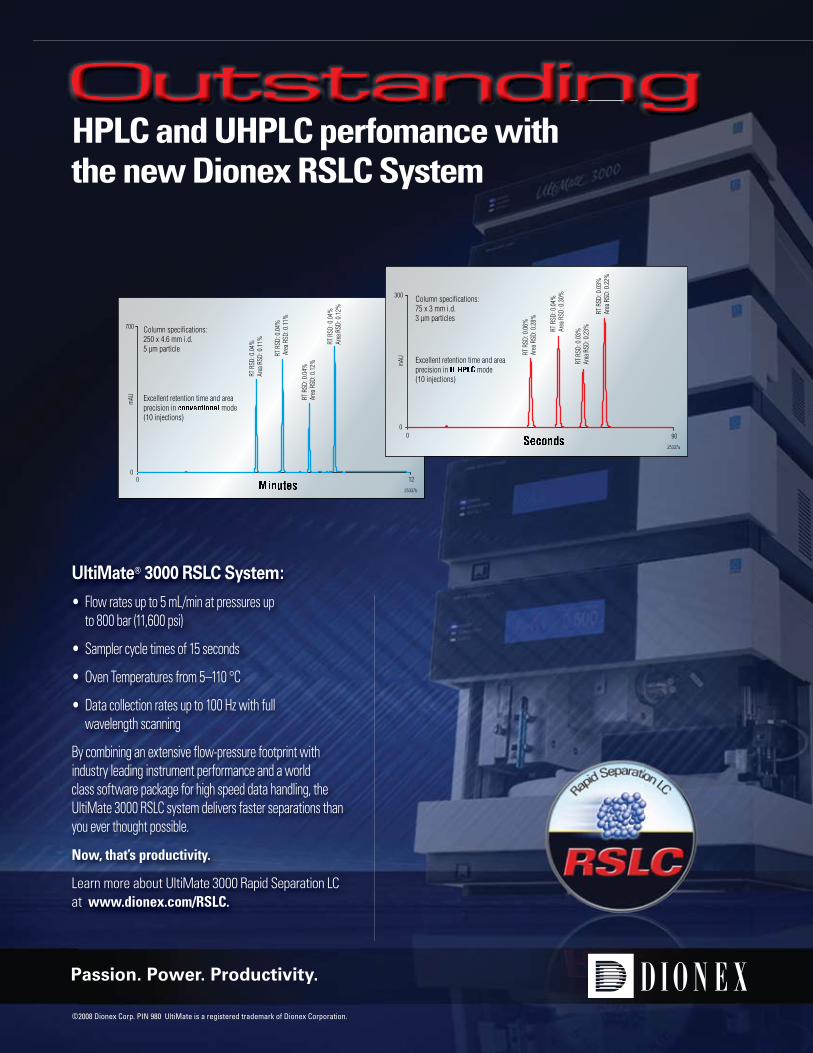
UltiMate® 3000 RSLC System:
• Flow rates up to 5 mL/min at pressures up to 800 bar (11,600 psi)
• Sampler cycle times of 15 seconds
• Oven Temperatures from 5–110 °C
• Data collection rates up to 100 Hz with full wavelength scanning
By combining an extensive flow-pressure footprint with industry leading instrument performance and a world class software package for high speed data handling, the UltiMate 3000 RSLC system delivers faster separations than you ever thought possible.
Now, that’s productivity.
Learn more about UltiMate 3000 Rapid Separation LC at www.dionex.com/RSLC.
©2008 Dionex Corp. PIN 980 UltiMate is a registered trademark of Dionex Corporation.
Outstanding OutstandingHPLC and UHPLC perfomance withthe new Dionex RSLC System
0 120
700
mAU
25337b
Column specifications:250 x 4.6 mm i.d.5 µm particle
Excellent retention time and areaprecision in mode(10 injections)
RT R
SD: 0
.04%
Area
RSD
: 0.1
1%
RT R
SD: 0
.04%
Are
a RSD
: 0.1
1%
RT R
SD: 0
.04%
Ar
ea R
SD: 0
.12%
RT R
SD: 0
.04%
Ar
ea R
SD: 0
.12%
0 900
300
mAU
25337a
Column specifications:75 x 3 mm i.d.3 µm particles
Excellent retention time and areaprecision in mode(10 injections)
RT R
SD: 0
.06%
Ar
ea R
SD: 0
.28%
RT R
SD: 0
.04%
Ar
ea R
SD: 0
.30%
RT R
SD: 0
.03%
Ar
ea R
SD: 0
.23%
RT R
SD: 0
.03%
Ar
ea R
SD: 0
.22%
xxxx
-Axx
x ©
200
5 B
rinkm
ann
Inst
rum
ents
, Inc
.
Full page journal ad Pharmaceutical Canada – PHC
C09
0.A1
.012
4.C
© 2
005
Brin
kman
n In
stru
men
ts, I
nc.
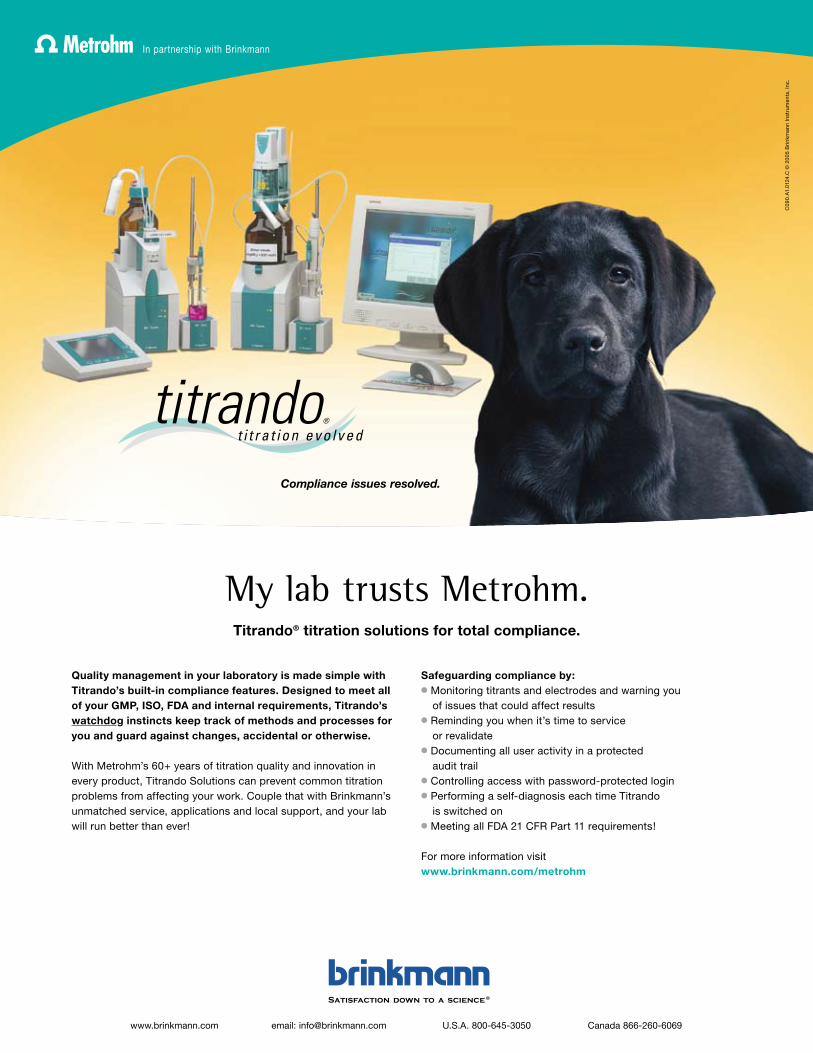
Compliance issues resolved.
Quality management in your laboratory is made simple with Titrando’s built-in compliance features. Designed to meet all of your GMP, ISO, FDA and internal requirements, Titrando’s watchdog instincts keep track of methods and processes for you and guard against changes, accidental or otherwise.
With Metrohm’s 60+ years of titration quality and innovation in every product, Titrando Solutions can prevent common titration problems from affecting your work. Couple that with Brinkmann’s unmatched service, applications and local support, and your lab will run better than ever!
Safeguarding compliance by:� Monitoring titrants and electrodes and warning you
of issues that could affect results� Reminding you when it’s time to service
or revalidate� Documenting all user activity in a protected
audit trail� Controlling access with password-protected login� Performing a self-diagnosis each time Titrando
is switched on� Meeting all FDA 21 CFR Part 11 requirements!
For more information visit www.brinkmann.com /metrohm
My lab trusts Metrohm.Titrando® titration solutions for total compliance.
www.brinkmann.com email: [email protected] U.S.A. 800-645-3050 Canada 866-260-6069
In partnership with Brinkmann
C090.A1.0124.C-PHC.indd 1 5/6/08 9:15:34 AM
For the last 25 years the pharmaceutical industry,consisted of two sectors the Brand name com-panies (Big Pharma) and the Generic compa-nies. The generic companies followed along to
bring copies of the originator product to the market onpatent expiration. Governments, always strugglingwith the cost of health care, liked the idea of less expen-sive versions of the originator drug in the market placeand even encouraged the Generic companies to test thevalidity of the originator patent by offering 180 day
exclusivity as the first Generic approved for the market. Today there are less“small molecule” drugs emerging from drug development laboratories and anumber of the blockbuster molecules are coming off patent in the next coupleof years. A change in the distinction between Generics and the Brand namecompanies is occurring; it is as though Big Pharma is now adapting the gener-icization of drug products as part of the life cycle management of the phar-maceutical product. Brand name companies are adding Generic divisions totheir organizations. Pfizer Inc. recently brokered deals with AurobindoPharma to license an array of generic pills and injectables and Merck & Co. isproposing to buy Insemed’s line of generic biologics (biosimilars)
Small molecule drugs are, at the molecular level, a somewhat bluntinstrument to deal with disease states, they lack specificity and with that lackof specificity here exists the potential for adverse reactions or side effects. Biotechnology offers the ability to create therapeutic agents which can be tai-lored to a specific target; specifically aiming at the biological mechanism thatcauses the problem. Along with this approach a new field of endeavor is cre-ating a novel challenge, that of molecular diagnostics. The growth in this areahas been fueled by the enormous amount of genomic research that is takingplace. The appeal of these diagnostic techniques is that they can lead to earlydiagnosis; treatment is often more affective the earlier a disease state can bedetected and identified. It is likely in the future that the firms that are devel-oping molecular diagnostics to replace the older and often invasive diagnosistechniques will also become themselves targets for the Big Pharma. In essencethe life cycle be started earlier by identifying the need for treatment and inter-vention before the symptoms are manifest. The indications are that the tight-ened economy is leading to a leaner healthier pharmaceutical industry, whichseems poised to bring innovative benefits to the health of nations.
Editor In Chief
Dr. Richard Pike
EDITOR’S Corner
SUBMIT YOUR ARTICLE
Publications Mail Registration Number : 1857827Agreement No: 40046407
ISSN 1499-1977
Pharmaceutical Canada seeks contributions from indus-try experts and writers. Our articles include coverageof technical developments, case studies, industry news,company news, product announcements, and opinionpieces. Submitted articles should discuss some time-ly aspect of pharmaceutical manufacturing, produc-tion, quality & compliance, regulatory affairs, phar-maceutical research and development, or relatedproducts and services. For article inquiries pleasecontact: [email protected]
EDITORIAL ADVISORY BOARD
Laleh BighashCOO, Dean of Pharmaceutical and Scientific Affairs, Academy of Applied Pharmaceutical Sciences
Dr. Nicholas F. CappuccinoCheif Scientific Officer, Eagle Pharmaceuticals
Dr. Roshan CarpenterAssociate Director Regulatory Affairs, GlaxoSmithKline Inc.
Dr. John C. FanarasPresident, Nucro-Technics
Dr. Salim FarahAssociate Director, Quality Assurance, Apotex
Dr. Helen GalatDirector of Manufacturing Improvements, Sanofi Pasteur
Sultan Ghani Acting Director, Bureau of PharmaceuticalSciences, TPD- Health Canada
Dr. Pavel Hadina, MDProfessor of Pharmacology, Department of Cellular and Molecular Medicine, University of Ottawa
Dr. Syed Imtiaz HaiderQuality Affairs Director, Julphar-Gulf Pharmaceutical Ind.
Kim Huynh-Ba Technical Director, Pharmalytik CTS
Jamie Jamshidi CEO/President, PQC Consulting, Inc.
George E. MarkusVice President, Regulatory AffairsGenerex Biotechnology
Dr. Mary Mazur-MelnykConsultant, Innovalinks
Dr. Manny PapadimitropoulosAssociate Director, Clinical Research,Operations, Eli Lilly Canada Inc.
Dr. Richard PikeChief Scientific Officer, IPA Consulting Services
Andrei Ponomarev President, AP-Pharma Compliance Associates (APPCA)
Dr. Saeed A. Qureshi, D.Sc. Senior Research Scientist, Research LaboratoryBureau of Pharmaceutical Sciences, TPD- Health Canada
Dr. Arun V. Ravindran, MD Professor of Psychiatry & Pharmacology, Scientific Director, Institute of Mental Health Research, University of Ottawa
Dr. Ravi TanR&D Manager, Cobalt Pharmaceutical Inc.
Ronald Turton Chief Scientific Officer, QCL Quality Compliance Laboratories
David W. VincentCEO and COO, Validation Technologies, Inc.
Dr. Aaron Wolkoff President, Waters Canada
The Editorial Advisory Board of Pharmaceutical Canada is a distinguished group of specialists representing various facet ofCanadian Pharmaceutical Industry and Academia. Member of theboard review manuscripts and suggest subject matter pertinent to theprofession. All manuscripts must first be submitted to the Editor,Pharmaceutical Canada: [email protected].
Pharmaceutical Canada | 5
ContentsPHARMACEUTICAL CANADA
Volume 9 Number 4 | June 2009
CHIEF ACCOUNTANTCheung & Associate Chartered Accountants
MARKETING & SALESMary Massoudinia Sales & Marketing Manager
GRAPHIC DESIGN & ART WORKArt Director - Rebecca TanGraphic Designer - Fariba Daei
PUBLISHERDr. Mehrdad BarghianPresident Pharmaceutical Canada Inc.
Address: 80 Travail Road, Unit 1 & 2Markham, OntarioCanada, L3S 3H9Tel: (416) 410-7486
Fax: (905) 472-1819 General Inquiry:[email protected] Sales:[email protected]
Editor:[email protected] www.pharmaceuticalcanada.ca
Pharmaceutical Canada is published online quarterly by Pharmaceutical Canada Inc. All rights reserved. No part of this publication may be reproduced or utilized in any form or by any means without written permission from the publisher.
Online Subscription:www.pharmaceuticalcanada.ca
6 Seeing is Believing: Molecular Imaging Aids Canadian Biopharmaceutical Sector
16 Cleaning Validation for the Biotechnology and Biological Industries
32 Insider’s Tips onGlobal Clinical Research
37 News Stand
6 | Pharmaceutical Canada
Seeing is Believing: Molecular Imaging Aids Canadian Biopharmaceutical Sector
By Abedelnasser Abulrob, BPharm, MSc, PhD PharmInstitute for Biological Sciences, National Research Council of Canada, Ottawa, Ontario, K1A0R6, Canada.
Introduction
The age of molecular medicine, born by the sequenc-ing of the human genome, has started changing traditional paradigms in patient treatments and health care delivery. Researchers are making strides towards a future where treatments will match the individual patient’s genetic profiles; a future where personalized medicine will become a standard of care. The molecular methods that make per-sonalized medicine possible include testing for variations in genes, gene expression, proteins, and metabolites – biomarkers. Test results are correlated with clinical factors – such as disease state, prediction of future disease states, drug response, and treatment prognosis – to help physi-cians individualize treatment for each patient. Molecular imaging is an invaluable tool to deliver on the promise of “personalized medicine”—it can provide patient-specific information that allows treatment to be tailored to the specific biological attributes of both the disease and the patient.
Molecular imaging refers to multidisciplinary tech-niques that are involved in remote sensing, visualization, characterization, and measurement of biological processes at the molecular level in humans and other living sys-tems in health and disease. It is the product of concurrent advances in molecular and cellular biology, chemistry, nanotechnology, computing, and imaging science.1
Molecular imaging shows how specific tissues are functioning, as opposed to conventional diagnostic im-aging procedures, which provide anatomical/structural pictures of the body’s organs and tissues. It is an invaluable way to obtain medical information that would otherwise
require surgery or more expensive diagnostic tests or sim-ply be unavailable. Molecular imaging is making a sweep-ing impact on health care—paving the way for a new gen-eration of personalized drugs for Alzheimer’s disease, heart disease, diabetes, schizophrenia and many other diseases.
The techniques used include Radionuclide imaging/nuclear medicine, Magnetic resonance imaging (MRI), optical imaging, computed tomography, ultrasound and others.
The drug discovery and development process is more challenging today than ever before. Only a small fraction of drugs pass successfully through the evaluation processes, and an even smaller fraction survives the approval process. Of 10,000 compounds screened in pre-clinical tests, only 100 are evaluated in animals, 10 advances to clinical trials and only 1 is likely to be marketed. This process of drug de-velopment from concept to clinical testing may take more than a decade and costs up to a $1 billion.2 Innovative ap-proaches and new paradigms that can shorten the overall timeline, reduce attrition, and decrease the cost of drug development are critical to ensure the viability of biophar-maceutical sector.
In the past decade, the R&D expenditures by US pharmaceutical industry increased 270% and the NIH budget for biomedical research doubled. Yet, during the same time, the number of new therapies submitted for Food and Drug Administration (FDA) approval declined by approximately 50%. In response to this crisis in productiv-ity, in 2004, the FDA launched the Critical Path Initiative, an important road-map document with the primary purpose to ensure that basic scientific discoveries translate more
Seeing is Believing
Pharmaceutical Canada | 7
rapidly into new and better medical treatments. FDA rightly contends that “the industry needs new research and tools that will lead to more efficient and successful development and testing of drugs” and “better ways to evaluate safety and to figure out at an early stage if the product is working.3 The FDA Critical path relies on two key premises: (1) imaging is a key technology for assess-ing and accelerating the development of, and guiding the use of new therapeutic options; and (2) synergy between current drug/biologics development programs and cur-rent imaging techniques can be created for drug/biologics development to work in a more cost-effective manner.4,5 It is expected that the implementation of this ‘path’ could cut the time of drug development by more than half – creating a dramatic improvement in the rate at which new drugs can be brought into clinical use, while also making the development cycle more economical.
Molecular imaging promises to reduce the cost of drug discovery and development by providing an objec-tively measured indicator for changes in the biological processes in response to therapy; molecular imaging bio-markers can potentially substitute for clinical end points.6
Imaging biomarker-based surrogate end points could predict benefit from therapy, and thereby help stratify and select patients for clinical drug trials, optimize the response rate and decrease side effects.
After summarizing the basic principles and modalities of molecular imaging, this article will describe new initia-tives and developments in this field in Canadian governe-ment laboratories and how these innovations are impact-ing Canadian biopharma sector.
Basic principles of molecular Imaging modalities
Radionuclide imagingPositron emission tomography (PET) records high-
energy γ-rays emitted from within the subject. Positron-emitting isotopes frequently used include 15O, 13N, 11C, and 18F, the latter used as a substitute for hydrogen. Other less commonly used positron emitters include 14O, 64Cu, 62Cu, 124I, 76Br, 82Rb, and 68Ga. Most of these isotopes are produced in a cyclotron (but some can be produced using a generator (e.g., 68Ga, 82Rb). Labeled molecular probes or radiotracers are introduced into the subject, and PET imag-ing then follows the bio-distribution and concentration of the injected molecules. Many of the positron-emitting isotopes used have relatively short half-lives (e.g., 18F has t1/2 = 110 min), so that the chemical reactions leading to incorporation of the isotope into the parent molecule and subsequent introduction into the subject must take place
relatively quickly.7 β-Emitting isotopes (e.g., 99mTc, 111In, 123I, 131I) can also be used for imaging living subjects but require different types of scanners known as gamma cam-eras, which when rotated around the subject (then known as single photon emission computed tomography, SPECT), can result in production of tomographic images. The sen-sitivity of PET is relatively high (pico-mole/L range), and is independent of the location depth of the reporter probe. Typically, several million cells accumulating the radioligand have to be in relatively close proximity to a PET scanner to be recorded as a distinct entity relative to the background. In SPECT, collimator design is always a compromise be-tween spatial resolution and sensitivity: reducing the size of the holes or using longer septae improves spatial resolu-tion but reduces sensitivity at the same time. PET is there-fore at least a log order more sensitive than SPECT.
PET and SPECT imaging remain the gold standard for molecular imaging and promise to position molecu-lar medicine as an essential tool in providing the highest standards of patient care around the world.8 A recent study demonstrated that physicians changed their intended patient management in 40% of cases when given the ad-ditional advantage of using PET imaging.9
The ability to perform translational research from a cell culture setting to preclinical animal models to clinical applications is one of the most unique and powerful fea-tures of PET technology. Molecular imaging with PET and SPECT may be considered valuable in 4 main areas which are of high interest to pharmaceutical companies: (1) providing the therapeutic rationale for drugs; (2) rational drug dosing; (3) radiolabeling of candidate drugs; and (4) studies of the mechanisms of action.10
Magnetic resonance Imaging (MRI)MRI uses radio-frequency pulses and magnetic fields
to obtain signals from changes in nuclear magnetic mo-ments. Specifically, as the alignment and relaxation of pro-tons occur in response to pulsed radio-frequencies, char-acteristic relaxation times can be measured, most notably T1 (the longitudinal relaxation time) and T2 (the transverse relaxation time). MRI has two particular advantages over techniques that involve the use of radionuclides or optical probes: higher spatial resolution (micrometers rather than millimeters) and the fact that physiological and anatomi-cal information can be extracted simultaneously. However, MRI is several magnitudes less sensitive than radionuclide and optical techniques, which offer higher levels of sen-sitivity for imaging relatively low levels of reporter probe (as low as picomole of radiolabeled substrate for PET, and femtomolar range for optical imaging). Current lack of probe sensitivity is characterized as the “Achilles’ heel”
Seeing is Believing
8 | Pharmaceutical Canada
of MRI. Another technique based on the same principle as MRI, but providing a greater degree of molecular char-acterization is magnetic resonance spectroscopy (MRS), where spectroscopic profiles of the chemical constituents within a sample are obtained.11
Optical ImagingProgress in optical molecular imaging strategies
has come from the recent development of targeted bio-luminescence probes, near-infrared (NIR) fluorophores, activatable NIR fluorophores, and red-shifted fluorescent proteins.12,13 Optical imaging allows for a relatively low-cost alternative to studying reporter gene expression in small animal models. In contrast to fluorescence imaging in the visible light range, the use of the NIR spectrum in the 700–900-nm range maximizes tissue penetration and minimizes autofluorescence from non-target tissue. This is because hemoglobin and water, the major absorbers of visible and infrared light, respectively, have their lowest absorption co-efficients in the NIR region. Optical imaging offers several advantages over other technologies for molecular investi-gations in small animals and, to a lesser extent, in humans. It is easy to use, a number of highly sensitive benchtop fluorescent probes such as the FDA approved, indocyanine green (ICG) have the potential for biocompatibility, there is no need for ionizing radiation, and the equipment is rela-tively inexpensive. Recently, we developed novel optical molecular imaging techniques for early diagnosis of renal failure non-invasively and for detection of blood brain bar-rier disruption after stroke.14,15 A notable theoretical advan-tage of optical techniques is the fact that multiple probes with different spectral characteristics could potentially be used for multi-channel imaging. Therefore, it does not come as a surprise that optical molecular imaging is the fastest growing modality in medical research.
Computed tomography imaging (CT)Images in CT are obtained when component tissues
differentially absorb X-rays as they pass through the body Unlike MRI, CT has relatively poor soft tissue contrast, often making it necessary to administer iodinated contrast media to delineate organs or tumors. In its present use, CT is not a “molecular” imaging technique per se, but instead, dedicated high-resolution CT scanners are available for anatomical imaging, thus complementing the functional information obtained by other modalities discussed above.
Indeed, combining the strengths of morphologi-cal/anatomical and molecular imaging modalities (using multimodality hardware and/or co-registration post-ac-quisition processing) allows the detection of pathophysi-ological changes in early disease phases at high structural resolution.16
Personalized Medicine: the Rise of Molecular Medicine
One of the most important paradigm shifts in con-temporary medicine is the trend toward individualized or personalized medicine. Current therapies are, for the most part, based on an ‘‘average patient’’ and not on individual-specific metrics. Personalized medicine, as it’s referred to by the Society of Nuclear Medicine, is tailored medical treatment based on a person’s unique molecular profile for the detection, treatment or prevention of disease. Personalized medicine is more complex than ‘‘the right agent for the right patient’’. For example, in oncology, targeted anti-cancer drugs are prescribed to patients who have been demonstrated to express the target receptor in excised tumor specimen. In fact, majority of approved tar-geted anti-cancer biologics require documented presence of the target in their product labeling. However, this has not necessarily translated into greater efficacy. One exam-ple can be found in breast cancer with Herceptin, which, in the 30% of breast cancer patients who are HER2-positive, is effective in only 30% (resulting in a 9% response among all patients with breast cancer). This relatively low response rate is compounded by significant rates of cardiotoxicity (18%). Other examples include Avastin and Erbitux, with 10% and 15% response rates, respectively, in patients with metastatic colon cancer. Because patients have different genetic makeup and cancers can be molecularly different within the same patient, the number of potential variables is difficult to analyze and control. The imaging industry, pharmaceutical companies, and regulatory agencies all consider molecular imaging as critical to personalized medicine, as it can enable longitudinal assessment of molecular variables and guide individualized treatments to optimize response and minimize toxicity.17
The search for imaging biomarkers
A biomarker is defined as a physical sign or laboratory measurement that occurs in association with a patho-logical process and that has putative diagnostic and/or prognostic utility. A biomarker that is expected to predict the effect of a therapeutic intervention and is intended to serve as a substitute for a clinical end point for regulatory decision making is called surrogate end point.4 In this con-text, imaging biomarkers may be defined as any anatomi-cal, physiological, biochemical or molecular parameter that is detectable by one or more imaging modalities used to establish the presence and/or severity of disease.18,19
Biomarkers have an increasing number of applica-tions in early development of drugs. Among the preclini-cal uses are in vivo confirmation of activity, exploration
Seeing is Believing
Pharmaceutical Canada | 9
of exposure/response relationships, and selection of lead candidates for clinical testing. In clinical trials Phase I and II, biomarkers can be used to establish the presence of the drug candidate in the target, establish the extent of target coverage, stratify study populations, evaluate clinical and safety issues, assist in dose selection, and provide valuable data supporting the GO/No-GO decision to continue development. In phase III, biomarker can be used to further stratify study populations, conduct efficacy and safety analysis, and supply information that supports documentation for regulatory approval. In post-marketing phase biomarkers can differentiate responders from non-responders, identify new indications, confirm diagnosis, assess safety, and monitor response to provide prognostic indices.20,21
However, all new imaging biomarkers need to under-go a rigorous validation process from cells through animal experiments to clinical trials. This pathway is time-consum-ing and expensive, and innovative approaches are needed to make this process more efficient. In fact, validated biomarkers applied routinely in clinical practice are rare; for example, the lack of adequate surrogate endpoints for Alzheimer’s disease is considered one of the main reasons for the very limited venture capital investment in this area.22
Molecular Imaging at the National Research Council of Canada
Discovery and validation of disease-selective/predic-tive imaging biomarkers, as well as new molecular imaging techniques and agents is fundamentally interdisciplinary process and often requires collaborations among biop-harmaceutical industry, academic institutions, govern-ment R&D, regulatory organizations and hospital centers. The National Research Council of Canada (NRC) is the Government of Canada’s premier organization for R&D with the mandate to undertake, assist and promote scien-tific and industrial research in fields of critical importance to Canada and to provide vital scientific and technological services to the research and industrial communities. NRC’s strategic goal is to contribute to the global competitive-ness of Canadian industry in key sectors, including biop-harma sector.
To respond to the challenge of chronic disease affect-ing ageing Canadian population - demographics predict that these diseases will reach an epidemic proportion in the next 20 years. NRC has mobilized interdisciplinary ex-pertise from its institutes of Life Sciences, Physical Sciences and Engineering Sciences portfolios and has partnered with Canadian biopharmaceutical sector companies and
universities to jointly develop new generation of molecular imaging tools and approaches for early diagnosis and im-proved management of chronic cardiovascular and neuro-degenerative diseases and cancer.
The objective of the molecular imaging initiative at the NRC is to discover and validate novel imaging bio-markers and to develop new molecular imaging tools and techniques applicable to molecular imaging at the vast spectrum of scales – from single molecules to whole bod-ies. The initiative is focused on developing versatile plat-form technologies for image-guided therapeutic delivery that could be ‘adapted’ to various molecular targets and diseases and translated from pre-clinical studies to clinical applications.
To accomplish these goals, NRC has integrated exper-tise, core capacities and technologies critical for the devel-opment pipeline, including a) disease biomarker discovery and validation (NRC Institute for Biological Sciences (NRC-IBS) and NRC Biotechnology Research Institute (NRC-BRI)), b) development of targeting moieties through antibody, peptide and protein engineering (NRC-IBS, NRC-BRI), c) development of nanoparticle carriers and contrast agents (NRC Steacie Institute for Molecular Sciences (NRC-SIMS) and NRC Industrial Materials Institute (NRC-IMI)), d) de-velopment of advanced imaging tools and approaches for cell and tissue imaging (NRC-SIMS and NRC Institute for National Measurement Standards (NRC-INMS)) and in vivo imaging of animals and patients (NRC-IBS and NRC Institute for Biodiagnostics (NRC-IBD)), and e) infrastruc-ture and programs to support the discovery and develop-ment of molecular imaging diagnostics.
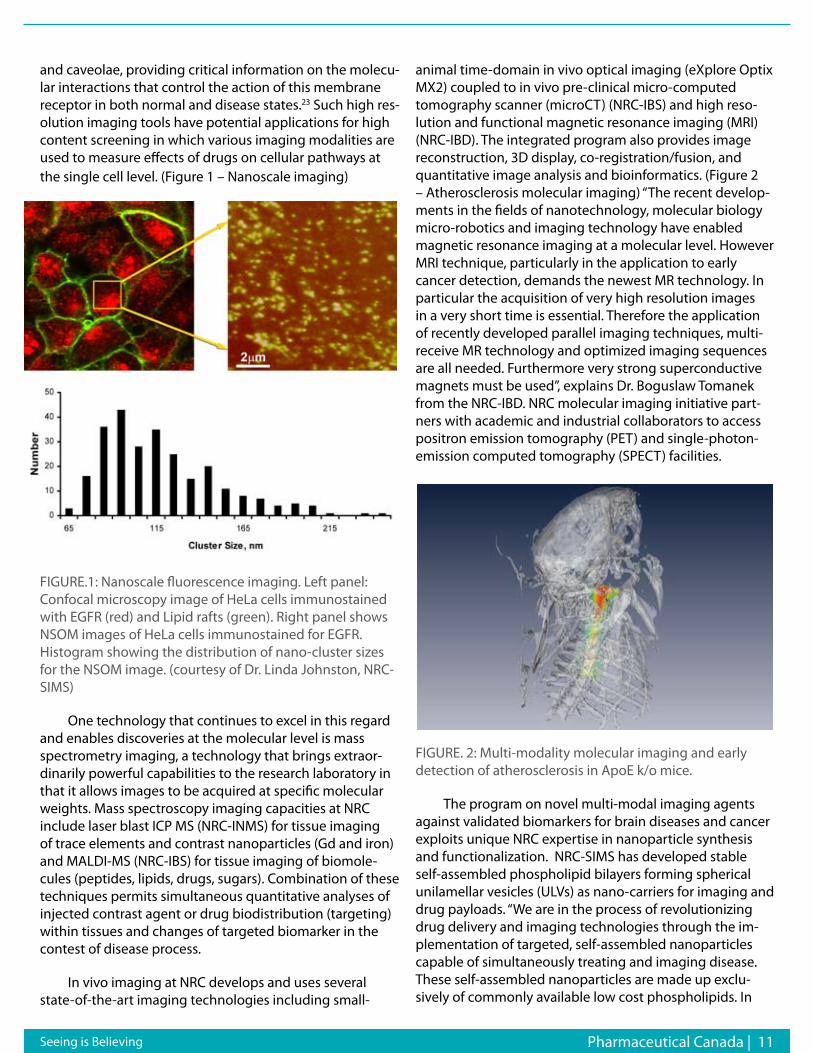
Nano-scale imaging of disease-related cellular pro-cesses is conducted at NRC-SIMS. Despite many advan-tages of fluorescence microscopy methods for cellular imaging, the spatial resolution with traditional lens-based optics and visible wavelengths is limited by diffraction to ~300 nm. Near field scanning optical microscopy (NSOM) and atomic force microscopy (AFM) used by NRC-SIMS allow direct visualization of protein clusters and mem-brane microdomains that are too small to be resolved with conventional fluorescence microscopy. NSOM has an added advantage of being sensitive only to fluorophores that are close to the probe. Dr. Linda Johnston, from NRC-SIMS explains that, “these two factors can provide a significant advantage for imaging proteins in cellular membranes and for understanding how membrane com-partmentalization helps to regulate cell signaling.” Recent collaborative studies between NRC-SIMS and NRC-IBS have demonstrated the utility of NSOM for localizing nanoscale clusters of the cancer target, epidermal growth factor receptor, within distinct membrane domains such as rafts
Seeing is Believing
What has changed in USP <61>?USP <61> Microbial Enumeration Tests
The testing for Total Aerobic Microbial Count and Total Yeast and Molds Count has not been changed and remains in general chapter <61>. However, this chapter has been significantly modified with the removal of the tests for P. Aeruginosa, S. Aureus, E. Coli and Salmonella from general chapter <61> altogether although they remain as they were in general chapter <62>. The organisms and test procedures in general chapter <62> have now become the procedures by which the above organisms must be evaluated. The tests may or may not be using the same media as they were in general chapter <61> so a careful evaluation of your existing Preparatory Test report is necessary to ensure you still comply. If your Preparatory Test was performed following the procedures in general chapter <62>, it is still valid and no further work is necessary but, if it was performed following general chapter <61>, it may no longer be valid and require repeating to comply with general chapter <62>.
QCL - Quality Compliance Laboratories Inc. performs a wide variety of USP microbiological tests on pharmaceutical and nutraceutical raw materials, intermediates and products in compliance with cGMP regulations. We are recommending to our clients that they reevaluate the applicability of the Preparatory Tests they currently have on file in light of these new harmonized requirements. QCL stands ready to reevaluate your samples by repeating the suitability testing of the method and applying the procedures under general chapter <62>.
Toll Free: 1.877.305.0998 www.QCtest.com
11-145 Konrad Cresent, Markham, Ontario L3R 9T9
Pharmaceutical Canada | 11
and caveolae, providing critical information on the molecu-lar interactions that control the action of this membrane receptor in both normal and disease states.23 Such high res-olution imaging tools have potential applications for high content screening in which various imaging modalities are used to measure effects of drugs on cellular pathways at the single cell level. (Figure 1 – Nanoscale imaging)
FIGURE.1: Nanoscale fluorescence imaging. Left panel: Confocal microscopy image of HeLa cells immunostained with EGFR (red) and Lipid rafts (green). Right panel shows NSOM images of HeLa cells immunostained for EGFR. Histogram showing the distribution of nano-cluster sizes for the NSOM image. (courtesy of Dr. Linda Johnston, NRC-SIMS)
One technology that continues to excel in this regard and enables discoveries at the molecular level is mass spectrometry imaging, a technology that brings extraor-dinarily powerful capabilities to the research laboratory in that it allows images to be acquired at specific molecular weights. Mass spectroscopy imaging capacities at NRC include laser blast ICP MS (NRC-INMS) for tissue imaging of trace elements and contrast nanoparticles (Gd and iron) and MALDI-MS (NRC-IBS) for tissue imaging of biomole-cules (peptides, lipids, drugs, sugars). Combination of these techniques permits simultaneous quantitative analyses of injected contrast agent or drug biodistribution (targeting) within tissues and changes of targeted biomarker in the contest of disease process.
In vivo imaging at NRC develops and uses several state-of-the-art imaging technologies including small-
animal time-domain in vivo optical imaging (eXplore Optix MX2) coupled to in vivo pre-clinical micro-computed tomography scanner (microCT) (NRC-IBS) and high reso-lution and functional magnetic resonance imaging (MRI) (NRC-IBD). The integrated program also provides image reconstruction, 3D display, co-registration/fusion, and quantitative image analysis and bioinformatics. (Figure 2 – Atherosclerosis molecular imaging) “The recent develop-ments in the fields of nanotechnology, molecular biology micro-robotics and imaging technology have enabled magnetic resonance imaging at a molecular level. However MRI technique, particularly in the application to early cancer detection, demands the newest MR technology. In particular the acquisition of very high resolution images in a very short time is essential. Therefore the application of recently developed parallel imaging techniques, multi-receive MR technology and optimized imaging sequences are all needed. Furthermore very strong superconductive magnets must be used”, explains Dr. Boguslaw Tomanek from the NRC-IBD. NRC molecular imaging initiative part-ners with academic and industrial collaborators to access positron emission tomography (PET) and single-photon-emission computed tomography (SPECT) facilities.
FIGURE. 2: Multi-modality molecular imaging and early detection of atherosclerosis in ApoE k/o mice.
The program on novel multi-modal imaging agents against validated biomarkers for brain diseases and cancer exploits unique NRC expertise in nanoparticle synthesis and functionalization. NRC-SIMS has developed stable self-assembled phospholipid bilayers forming spherical unilamellar vesicles (ULVs) as nano-carriers for imaging and drug payloads. “We are in the process of revolutionizing drug delivery and imaging technologies through the im-plementation of targeted, self-assembled nanoparticles capable of simultaneously treating and imaging disease. These self-assembled nanoparticles are made up exclu-sively of commonly available low cost phospholipids. In
Seeing is Believing
12 | Pharmaceutical Canada
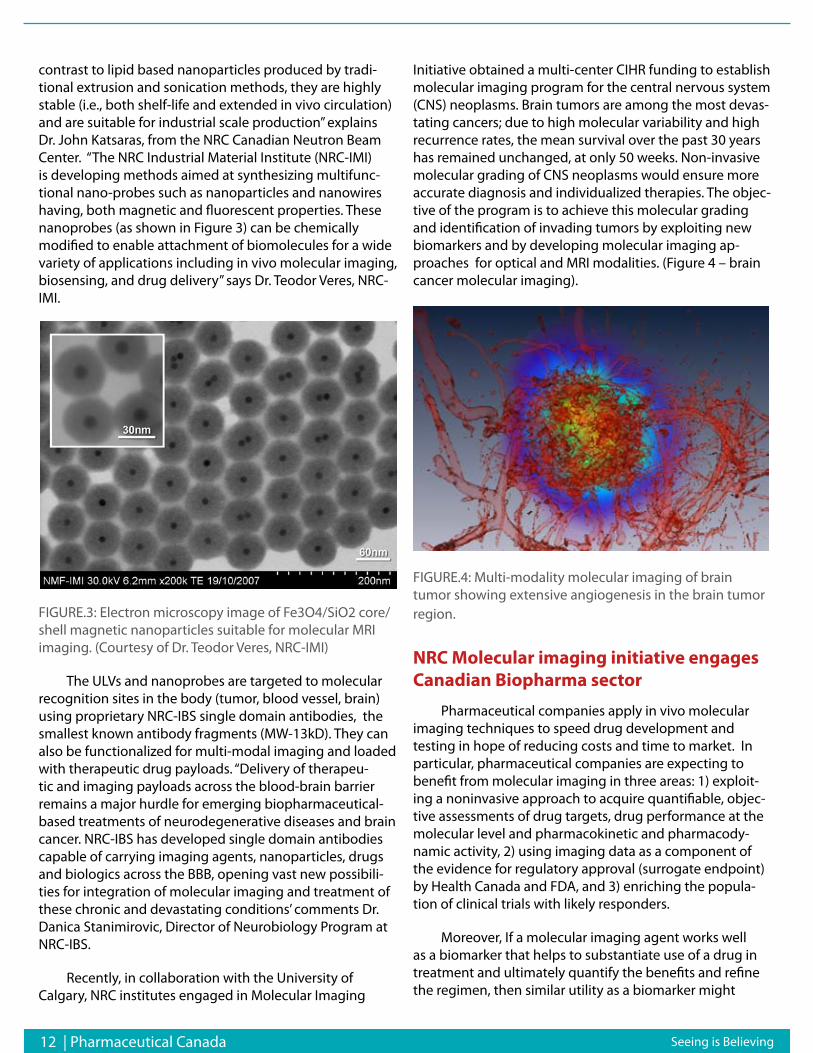
contrast to lipid based nanoparticles produced by tradi-tional extrusion and sonication methods, they are highly stable (i.e., both shelf-life and extended in vivo circulation) and are suitable for industrial scale production” explains Dr. John Katsaras, from the NRC Canadian Neutron Beam Center. “The NRC Industrial Material Institute (NRC-IMI) is developing methods aimed at synthesizing multifunc-tional nano-probes such as nanoparticles and nanowires having, both magnetic and fluorescent properties. These nanoprobes (as shown in Figure 3) can be chemically modified to enable attachment of biomolecules for a wide variety of applications including in vivo molecular imaging, biosensing, and drug delivery” says Dr. Teodor Veres, NRC-IMI.
FIGURE.3: Electron microscopy image of Fe3O4/SiO2 core/shell magnetic nanoparticles suitable for molecular MRI imaging. (Courtesy of Dr. Teodor Veres, NRC-IMI)
The ULVs and nanoprobes are targeted to molecular recognition sites in the body (tumor, blood vessel, brain) using proprietary NRC-IBS single domain antibodies, the smallest known antibody fragments (MW-13kD). They can also be functionalized for multi-modal imaging and loaded with therapeutic drug payloads. “Delivery of therapeu-tic and imaging payloads across the blood-brain barrier remains a major hurdle for emerging biopharmaceutical-based treatments of neurodegenerative diseases and brain cancer. NRC-IBS has developed single domain antibodies capable of carrying imaging agents, nanoparticles, drugs and biologics across the BBB, opening vast new possibili-ties for integration of molecular imaging and treatment of these chronic and devastating conditions’ comments Dr. Danica Stanimirovic, Director of Neurobiology Program at NRC-IBS.
Recently, in collaboration with the University of Calgary, NRC institutes engaged in Molecular Imaging
Initiative obtained a multi-center CIHR funding to establish molecular imaging program for the central nervous system (CNS) neoplasms. Brain tumors are among the most devas-tating cancers; due to high molecular variability and high recurrence rates, the mean survival over the past 30 years has remained unchanged, at only 50 weeks. Non-invasive molecular grading of CNS neoplasms would ensure more accurate diagnosis and individualized therapies. The objec-tive of the program is to achieve this molecular grading and identification of invading tumors by exploiting new biomarkers and by developing molecular imaging ap-proaches for optical and MRI modalities. (Figure 4 – brain cancer molecular imaging).
FIGURE.4: Multi-modality molecular imaging of brain tumor showing extensive angiogenesis in the brain tumor region.
NRC Molecular imaging initiative engages Canadian Biopharma sector
Pharmaceutical companies apply in vivo molecular imaging techniques to speed drug development and testing in hope of reducing costs and time to market. In particular, pharmaceutical companies are expecting to benefit from molecular imaging in three areas: 1) exploit-ing a noninvasive approach to acquire quantifiable, objec-tive assessments of drug targets, drug performance at the molecular level and pharmacokinetic and pharmacody-namic activity, 2) using imaging data as a component of the evidence for regulatory approval (surrogate endpoint) by Health Canada and FDA, and 3) enriching the popula-tion of clinical trials with likely responders.
Moreover, If a molecular imaging agent works well as a biomarker that helps to substantiate use of a drug in treatment and ultimately quantify the benefits and refine the regimen, then similar utility as a biomarker might
Seeing is Believing
Pharmaceutical Canada | 13 Seeing is Believing
apply in the commercial space as a diagnostic. Therefore, the diagnostics industry is interested in partnering to take that biomarker from the R&D space into the clinic as a com-mercial diagnostic agent when it is included in the labeling for a drug. For example, part of GE Healthcare’s strategy to accelerate the development of new therapeutics in-cludes providing pharmaceutical companies the access to novel molecular imaging agents to assess the impact of potential drugs in animal models and, when appropriate, human subjects. Therefore, a new era of industry “pre-competitive” collaboration model will continue to evolve as pharmaceutical, diagnostics and medical device compa-nies work together on the development of new molecular diagnostic tools and molecular imaging agents to improve predictability and efficiency in the process of developing more effective, more affordable, and safer therapeutics for patients.
Canadian contextThe bulk of Canadian biopharmaceutical industry is
composed of small and medium biotech companies that represent half of the whole Canadian biotech industry. Despite its enviable position with respect to the num-ber of biotech firms, Canada biotechnology industry is threatened by the significant investments other countries have made in this sector. Moreover, Canadian companies tend to have on average, lower market capitalization. Altogether Canadian biotech industry generated US$2.7B in revenue in 2007 and raised US$1B in new funding.24 In 2007, the market capitalization of public Canadian bio-tech firms amounted to US$11B. Canadian companies are mostly active at the earlier stages of drug development, with a third that have not yet initiated clinical trials. Our analysis (provided by the NRC-CISTI) reveals that over the past 8 years (2000-2008) NRC’s life science institutes have interacted with 37% of the 179 Canadian companies that develop therapeutics. This indicates the active role NRC is playing in the Canadian biopharmaceutical sector.
NRC’s effort in developing technologies, facilities and expertise in molecular imaging is targeted to Canadian biopharma sector and its unique needs; benefits these initiatives are offering to Canadian companies are outlined in few examples below.
NRC-IBS and Advanced Research Technologies-ART Inc. have established a two-year partnership in service, re-search and development agreements. ART Inc., a Canadian company based in Montreal, is a leader in optical molecular imaging and medical diagnostics for the healthcare and pharmaceutical industries. In collaboration with NRC-IBS, new diagnostic applications for the ART’s time-domain optical pre-clinical imager eXplore Optix™, for detection
of stroke, atherosclerosis and acute renal failure have been developed and adopted by ART as white papers. According to Mr. Mario Khayat, Vice President of Advanced Research Technologies “ART, Advanced Research Technologies, has been working with Dr Abulrob and his team at the NRC’s IBS since 2006. This extensively fruitful collaboration has provided ART with access to world class resources in the fields of molecular imaging and biomarker development that would otherwise have been impossible to access through a single partnership.”
Bioprospecting NB Inc., an early stage drug develop-ment company from Sackville, NB, that develops peptide-based therapeutics for chronic pain and cancer, generated important pre-clinical data on pharmacokinetics and biodistribution of their lead compounds in collaboration with NRC-IBS using optical molecular imaging as a sur-rogate end-point. According to Dr. Jack Stewart, Chief Scientific Officer of Bioprospecting “The team at NRC Institute of Biological Sciences (Ottawa) addressed two questions we brought to them concerning a new drug candidate BioProspecting NB, Inc. is developing. First, we wanted to determine a bio-distribution profile of our lead candidate for ovarian cancer. Our second question was whether or not our lead candidate and backup cross or damage the blood brain barrier. The proposed solutions to these questions were to tag our peptides with Cy5.5 which provided a signal when scanned with a near-infrared emit-ting laser. The advantage was that the tagged peptides could be tracked in live animals over time by non-invasive imaging. The insights from the results of this imaging work allowed us to expand our drug development plan to include unexpected and stronger indications for ovar-ian oncology (among other types). On a final note, the discussions with the team were highly constructive and professional leading to further invaluable insights into our program. We are now contemplating using this technology to examine longer term, multiple dosing with these proven molecular markers”.
AngioChem is a Canadian clinical-stage biotechnology company dedicated to creating and developing new drugs to treat brain diseases. AngioChem’s platform technology enables delivery of drug candidates to the brain. External validation of Angichem technology was undertaken in R&D collaboration with NRC-IBS using molecular imag-ing techniques in brain cancer animal disease model. According to Dr. Reinhard Gabathuler, Chief Scientific Officer of Angiochem “‘in vivo imaging and ex vivo imag-ing of the brain performed at NRC-IBS confirmed that our vector peptide Angiopep2 conjugated to a fluores-cent marker cy5.5 is transported very rapidly in the brain parenchyma and co-localized with markers of the neurons and astrocytes. Visualization of our conjugates in the brain
14 | Pharmaceutical Canada
parenchyma and kinetic uptake studies were very convinc-ing. This external validation of our platform technology which allows transport of various molecules across the BBB is very important for our company and for further product development in CNS disorders and brain cancers’.
Acknowledgements: We would like to thank Mr. Tom Devecseri for his help with graphic and image processing.
ReferencesWeissleder R, Pittet MJ. Imaging in the era of molecular oncol-1. ogy. Nature 2008;452:580-9.
DiMasi J.A. 2. et al., The price of innovation: new estimates of drug development costs, J. Health Econ. 2003, 22:51–185.
Mathews A.W. and Hensley S. “FDA explores obstacles to new 3. drugs: Agency calls for new research and tools – and thinks it can help.” The Wall Street Journal Online, March 16, 2004.
Woodcock J, Woosley R. The FDA critical path initiative and 4. its influence on new drug development. Annu Rev Med. 2008;59:1-12.
Woosley RL, Cossman J. Drug development and the FDA’s 5. Critical Path Initiative. Clin Pharmacol Ther. 2007;81:129-33.
Rudin M, Weissleder R. Molecular imaging in drug discovery 6. and development. Nat Rev Drug Discov. 2003;2:123-31.
Cherry SR. In vivo molecular and genomic imaging: new chal-7. lenges for imaging physics. Phys Med Biol. 2004;49:3-48.
Gambhir SS. Molecular imaging of cancer with positron emis-8. sion tomography. Nat Rev Cancer. 2002;2:683-93.
Hillner BE, Tunuguntla R, Fratkin M. Clinical decisions associ-9. ated with positron emission tomography in a prospective co-hort of patients with suspected or known cancer at one United States center. J Clin Oncol. 2004;22:4147-56.
Willmann JK, van Bruggen N, Dinkelborg LM, Gambhir SS. 10. Molecular imaging in drug development. Nat Rev Drug Discov. 2008;7:591-607.
Winter PM, Caruthers SD, Wickline SA, Lanza GM. Molecular 11. imaging by MRI. Curr Cardiol Rep. 2006;8:65-9.
Ntziachristos V, Ripoll J, Wang LV, Weissleder R. Looking and 12. listening to light: the evolution of whole-body photonic imaging. Nat Biotechnol. 2005 ;23:313-20.
Weissleder R, Ntziachristos V. Shedding light onto live molecu-13. lar targets. Nat Med. 2003; 9:123-8.
Abulrob A, Brunette E, Slinn J, Baumann E, Stanimirovic D. In 14. vivo time domain optical imaging of renal ischemia-reperfusion injury: discrimination based on fluorescence lifetime. Mol Imag-ing. 2007;6:304-14.
Abulrob A, Brunette E, Slinn J, Baumann E, Stanimirovic D. 15. Dynamic Analysis of the blood brain barrier disruption in Ex-
perimental Stroke using Time domain in vivo fluorescence im-aging. Mol Imaging. 2008 in press.
Pichler BJ, Wehrl HF, Judenhofer MS. Latest advances in mo-16. lecular imaging instrumentation. J Nucl Med. 2008;49 Suppl 2:5S-23S.
van’t Veer LJ, Bernards R. Enabling personalized cancer medi-17. cine through analysis of gene-expression patterns. Nature. 2008;452:564-70.
Lesko LJ, Atkinson AJ. Use of biomarkers and surrogate end-18. points in drug development and regulatory decision making: criteria, validation, strategies. Annu. Rev. Pharmacol. Toxicol. 2001;41:347–366.
Willmann JK, van Bruggen N, Dinkelborg LM, Gambhir SS. 19. Molecular imaging in drug development. Nat Rev Drug Discov. 2008;7:591-607.
O’Connor JP, Jackson A, Asselin MC, Buckley DL, Parker GJ, 20. Jayson GC. Quantitative imaging biomarkers in the clinical development of targeted therapeutics: current and future per-spectives. Lancet Oncol. 2008;9:766-76.
Pien HH, Fischman AJ, Thrall JH, Sorensen AG. Using imaging 21. biomarkers to accelerate drug development and clinical trials. Drug Discov Today. 2005;10:259-66.
Doraiswamy PM, Xiong GL. Pharmacological strategies for the 22. prevention of Alzheimer’s disease. Expert Opin Pharmacother. 2006;7:1-10.
Abulrob A, Lu Z, Brunette E, Pulla D, Stanimirovic D & John-23. ston L. Near-field scanning optical microscopy detects nano-scale glycolipid domains in the plasma membrane Journal of Microscopy. 2008;232:225–234.
Beyond borders -Global Biotechnology report 2008; Canada 24. year in review. Ernst & Young.
About the AuthorDr. Abulrob is a Research Officer at the National Research Coun-cil Canada Institute for Biological Sciences and an Adjunct Profes-sor at the Department of Cellular & Molecular Medicine, Faculty of Medicine at the University of Ottawa. Dr. Abulrob is internationally recognized expert in molecular imaging, drug delivery and nano-bio-technology fields. He has been invited numerous times to speak at international conferences and meetings and has published over 60 papers in peer-reviewed Journals, book chapters and proceedings. Dr. Abulrob holds seven patent applications.
Address correspondence to:
Dr. Abedelnasser Abulrob Ph.D.Institute for Biological Sciences, National Research Council of Canada, 1200 Montreal Road, Ottawa, Ontario, K1A 0R6, Canada.
Email: [email protected]: (613) 993-3745 Fax: (613) 941-4475
Seeing is Believing
Regulatory Strategies for Natural Health Products June 15-16, 2009 | Montreal - Canada
Residual Solvents Testing: How to Apply USP <467> June 22-23, 2009 | Montreal - Canada
Aseptic Processing Operations in the Manufacture of Biotech and Pharmaceutical ProductsJune 22-23, 2009 | Montreal - Canada
Biologics ComparabilityJune 25-26, 2009 | Raleigh, North Carolina - USA
Best Practices for Conducting Forced Degradation StudiesNovember 17, 2009 | New York City, NY, USA
Mark Your Calendars!
For more information please visit:
www.ipaevent.com
or call:
416-410-7402
GMP UPDATE 2009Global Perspectives for Pharmaceutical, Biopharmaceutical and Allied Industries
September 24-25, 2009 | Montreal - CanadaThe greatest gathering of GMP Experts from across the globe
addressing most pressing issues on GMPs from:
16 | Pharmaceutical Canada
Regulatory Requirements for Cleaning Validation
Cleaning validation became a major issue in the early 1990s. One major incident involving contamination of a drug product by pesticide residue was just one of many problems which caused the FDA to take notice of the lack of cleaning validation in the pharmaceutical industry. The bulk active drug manufacturers cleaned their pro-cess equipment using a solvent reclaimed from pesticide manufacturing. This was attributed to a poorly controlled cleaning process and procedure. A series of events have occurred subs equently, which have brought us to the cur-rent regulatory state of cleaning and the requirement for cleaning validation .
The importance of cleaning with respect to regulatory compliance with the cGMP is well established in the CFR. These regulations outline the requirements for cleaning, maintaining, and sanitizing processing equipment and utensils (CFR Title 21 Section 2 11.67). The FDA guideline on cleaning validation is another example of the Agency placing a high importance on cleaning validation. With the increasing acceptance of multi-use manufacturing facili-ties, cleaning becomes an issue of even greater impor-tance. A series of events subsequently occurred, which have brought us to the current regulatory state of cleaning and the requirement for cleaning validation. They are:
Current Good Manufacturing Practices Regulations (cGMPs), 1978F D A’s Guide to Inspection of Bulk Pharmaceutical Chemicals, September 1991The Barr Court Decision (U.S. versus Barr Laboratories), February 1993FDA’s Mid-Atlantic Region Inspection Guide for
Cleaning Validation July 1993FDA’s guidance for Industry Manufacturing, Processing, or Holding Active Pharmaceutical Ingredients
The regulatory requirements for cleaning validation have always been an FDA requirement. It was not until 1993, with the Barr decision that it became the focal point of the pharmaceutical industry. Industry requested more guidance from the FDA and in doing so, the 1993 Mid-Atlantic Region Inspection Guide for Cleaning Validation was issued.
Let’s examine these documents in some detail, par-ticularly from the standpoint of cleaning.
Current Good Manufacturing Practice Regulations
§ 211.63 Equipment Design, Size, and LocationEquipment used in the manufacture, processing,
packing, or holding of a drug product shall be of appropri-ate design, adequate size, and suitably located to facilitate operations for its intended use and for its cleaning and maintenance.
§ 211.67 Equipment Cleaning and Maintenance• Equipment and utensils shall be cleaned, main-
tained, and sanitized at appropriate intervals to prevent malfunctions or contamination that would alter the safety, identity, strength, quality, or purity of the drug product beyond the official or other established requirements.
• Written procedures shall be established and fol-lowed for cleaning and maintenance of equipment, includ-
Cleaning Validationfor the Biotechnology and Biological Industries
PART III
Cleaning Validation
By David W. VincentValidation Technologies Inc.
Pharmaceutical Canada | 17
ing utensils, used in the manufacture, processing, pack-ing, or holding of a drug product. These procedures shall include, but are not necessarily limited to, the following:
Assignment of responsibility for cleaning and 1. maintaining equipmentMaintenance and cleaning schedules, including 2. sanitizing schedulesA description in sufficient detail of the methods, 3. equipment, and materials used in cleaning and maintenance operations, and the methods of disassembling and reassembling equipment as necessary to assure proper cleaning and maintenanceRemoval or obliteration of previous batch 4. identificationProtection of clean equipment from contamination 5. prior to useInspection of equipment for cleanliness 6. immediately before use
• Records shall be kept of maintenance, cleaning, sanitizing, and inspection as specified in 211.180 and 211.182.
§ 211.182 Equipment cleaning and Use LogA written record of major equipment cleaning, main-
tenance (except routine maintenance such as lubrication and adjustments), and use shall be included in individual equipment logs that show the date, time, product, and lot number of each batch processed. If equipment is dedi-cated to manufacture of one product, then individual equipment logs are not required, provided that lots or batches of such product follow in numerical order and are manufactured in numerical sequence. In cases where dedicated equipment is employed, the records of cleaning, maintenance, and use shall be part of the batch record. The persons performing and double-checking the clean-ing and maintenance shall date and sign or initial the log indicating that the work was performed. Entries in the log shall be in chronological order.
Guide to Inspection of Bulk Pharmaceutical Chemicals Reference Materials and Training Aid for Investigators, September 1991
The following excerpts are from the Guide to Inspection of Bulk Pharmaceutical Chemicals published by the FDA. Please keep in mind that the following publication is a guide, which the FDA provides to its inspectors, instructing them on how to conduct an inspection of a bulk chemical manufacturing facility and what to look for.
Part II, Equipment (e): Cleaning of Product Contact Surfaces
Cleaning of multiple use equipment is an area where validation must be carried out. The manufacturer should have determined the degree of effectiveness of the clean-ing procedure for each Bulk Pharmaceutical Chemical (BPC) or intermediate used in that particular piece of equipment.
Validation data should verify that the cleaning process will remove residue to an acceptable level. However, it may not be possible to remove absolutely every trace of mate-rial, even with a reasonable number of cleaning cycles. Specific inspection coverage for cleaning should include:
Detailed Cleaning ProcedureThere should be a written equipment cleaning proce-
dure that provides details of what should be done and ma-terials to be utilized. Some manufacturers list the specific solvent for each BPC and intermediate.
For stationary vessels, often Clean-In-Place (CIP) apparatus may be encountered. For evaluation of these systems, diagrams will be necessary, along with identifica-tion of specific valves.
Sampling PlanAfter cleaning, there should be some periodic testing
to assure that the surface has been cleaned to a validated level. One common method is the analysis of the final rinse or solvent for the presence of the substance last used in that piece of equipment. There should always be a specific analytical determination for such a residual substance.
Analytical Method/Cleaning LimitsPart of the answer to the question, ‘How clean is
clean?’ is, ‘How good is your analytical system?’ The sensi-tivity of modern analytical apparatus has lowered some detection thresholds from parts per million down to parts per-billion.
The residue limits established for each piece of appa-ratus should be practical, achievable, and verifiable. When reviewing these limits, ascertain the rationale for estab-lishment at that level. The manufacturer should be able to document by means of data that the residual level permit-ted is scientifically sound.
Another factor to consider is the possible nonunifor-mity of the residue. If residue is found, it may not neces-sarily be at the maximum detectable level due to random sampling, such as taking a swab from a limited area on that piece of equipment.
Cleaning Validation
18 | Pharmaceutical Canada
The Barr Court Decision (U.S. versus Barr Laboratories), February 1993
The main cleaning issue, which emerged from the Barr court decision, pertains to cleaning agents such as soaps and detergents. It is apparent that Judge Wolin is interpreting the cGMPs to require that cleaning agents are identified and that they must also test for the presence of cleaning agent residues. The main effect of this decision was to create a precedent for the present requirements for cleaning validation.
Guide to Inspection of Validation of Cleaning Processes, July 19935
Equipment and utensils shall be cleaned to pre-vent contamination that would alter the safety, identity, strength, quality or purity of the drug product beyond the official or other set established requirements.
All surfaces that come in contact with products shall be clean and free of surface solids, leachable contaminants, and other materials that will hasten the deterioration of the product or otherwise render it less suitable for the intended use.
This is the basic guidance given by the FDA for es-tablishing a level of cleanliness of equipment and utensils used in the production of drug products. This requirement has been expanded into bulk drug substances, including products derived from the “new” biotechnology by the FDA with the statement:
The firm’s rationale for the residue limits established should be logical based on the manufacturer’s knowledge of the materials involved and be practical, achievable, and verifiable.
The FDA has drawn the line on establishing more spe-cific guidance with the statement:
“FDA does not intend to set acceptance specifications or methods for determining whether a cleaning process is validated. It is impractical for FDA to do so due to the wide variation in equipment and products used throughout the bulk and finished dosage form industries.”
Manufacturing, Processing, or Holding Active Pharmaceutical Ingredients, March 1998
Equipment cleaning methods should be validated, where appropriate. In general, cleaning validation efforts should be directed to situations or process steps where contamination or incidental carryover of degradants poses the greatest risk to Active Pharmaceutical Ingredient (API) quality and safety. In early synthesis steps, it may be un-necessary to validate cleaning methods where residues are removed by subsequent purification steps.
Validation of cleaning methods should reflect actual equipment use patterns. If various APIs or intermediates are manufactured in the same equipment and the equip-ment is cleaned by the same process, a worst-case API or intermediate can be selected for purposes of cleaning validation. The worst-case selection should be based on a combination of potency, toxicity, solubility, stability, and difficulty of cleaning.
The cleaning validation protocol should describe the equipment to be cleaned, methods, materials, and extent of cleaning, parameters to be monitored and controlled, and analytical methods. The protocol should also indicate the type of samples (rinse, swabs) to be obtained, and how they are collected, labeled, and transported to the analyz-ing laboratory.
Sampling should include swabbing, rinsing, or alter-native methods (e.g., direct extraction), as appropriate, to detect both insoluble and soluble residues. The sampling methods used should be capable of quantitatively measur-ing levels of residues remaining on the equipment surfaces after cleaning. Swab sampling may be impractical when product contact surfaces are not easily accessible due to equipment design and/or process limitations (e.g., inner surfaces of hoses, transfer pipes, reactor tanks with small ports or handling toxic materials, and small intricate equip-ment such as micronizers and microfluidizers).
Validated analytical methods sensitive enough to detect residuals or contaminants should be in place. The detection limit for each analytical method should be suffi-ciently sensitive to detect the established acceptable level of the residue or contaminant. The method’s attainable recovery level should be established .
Residue limits should be practical, achievable, verifi-able, and based on the most deleterious residue. Limits may be established based on the minimum known phar-macological or physiological activity of the API or its most deleterious component.
Cleaning Validation
Pharmaceutical Canada | 19
Equipment cleaning and sanitization studies should address microbiological and endotoxin contamination for those processes intended or purported to reduce biobur-den or endotoxins in the biologic products, or other pro-cesses where such contamination may be of concern.
Cleaning procedures should be checked by appropri-ate methods after validation to ensure these procedures remain effective when used during routine production. Where feasible, equipment should be examined visually for cleanliness. This may allow detection of gross contamina-tion concentrated in small areas that could go undetected by analytical verification methods.
The following is a list of actives in order of importance that should be include in a cleaning validation program.
Installation and Operational Qualification Phase
Prior to validation of the cleaning process within the manufacturing facility the critical utilities, CIP system, and process equipment should be qualified. The Installation Qualification (IQ) and Operational Qualification (OQ) of the utilities, CIP system, and processing equipment should be successfully executed. This qualification work will provide the basis for assurance prior to the cleaning cycle develop-ment and Performance Qualification (PQ) that the CIP sys-tem and process were installed and operate as they were designed. Successful initial qualification provides the basis for subsequent cleaning validation as it assures that the cleaning cycles developed will not fail the PQ phase due to improper installation or operation of utilities, cleaning, or process equipment. During the IQ/OQ phase, all major components should be identified and challenged. The de-velopment of the CIP system control’s software should be qualified during the development phase of the software and follow the requirements specified by the FDA’s regu-latory compliance and guidance documents. Usually the hardware and software installation are combined in one protocol. The function testing of the CIP systems combines the verification of the hardware and software to ensure they meet the design specification.
Installation Qualification
The installation qualification of the CIP system should include a detailed description of the detergent tanks, pumps, values, control panel, piping, and any peripheral components. The installation is a documented verification that all aspects of the installation of the CIP system adhere to manufacturer’s recommendations, company specifi-cations, and design qualification. The description of the
column should include the following information:
CIP system description Manufacturer’s name• Model number• Material of construction• Pressure and temperature rating• Valves and piping description• Spare parts and instrument lists•
Peripheral equipment such as pH, conductivity, print-ers, and TOC meters should also be described in detail. Other support equipment such as pumps and computer-ized monitoring systems should also be included in the IQ protocol. The protocol should include an installation requirement section in which the installation of pipes, pumps, and labeling of criteria components are veri-fied. The documentation section should list and describe where any important supporting documents are stored. (Drawings, manuals, code requirements, and material specifications.)
At a minimum, each section of the protocol should include the following information:
System description Component summary inspection Material of construction Documentation Drawings Instruments list Computerized system software and hardware
System Description: This section of the protocol should describe the system and its intended use, system specifi-cation, and any ancillary components that will be used to support the purification process.
Component Summary Inspection: This section of the protocol should describe in detail all components of the CIP system. This would also include design specification and installation requirements for the entire system. It should also verify that each major component be tagged and labeled for an identified purpose.
Material of Construction: Those components, which come in contact with the product, should be described in detail. All components of the system, including lubricants, valves, and piping, which have a potential for contacting the product should be listed.
Documentation: The title and location of all support-ing documents (manuals, material specifications, spare
Cleaning Validation

We’ll make your automationdreams grow
Expanded Products and Service Capabilities with acombination of 35 years of automation experience
Automated Solutions for :Dissolution TestingStability Indicating AssayContent Uniformity Testing
“Reduce costs and increase productivity.Can you afford not to Automate?”
For additional information, please visit :www.sotax.com
Two Product Lines, One Group
SOTAX Corp.411 Caredean Dr, Suite AHorsham, PA 19044-1316USAPhone: 215-442-1500Fax: 215-442-1514E-mail [email protected]
Massachusetts OperationsC/O Caliper Life Sciences68 Elm StreetHopkinton, MA 01748-1668USAPhone: 215-442-1500Fax: 215-442-1514
VersionPub:Mise en page 1 5/12/08 10:15 Page 1
Pharmaceutical Canada | 21
parts list, etc.) should be listed.
Drawings: All related drawings and schematics for the entire system should be listed. These documents are valuable when describing the process and also can be used during installation, maintenance, and repairs.
Instruments List: The type, model, manufacturer, range, and classification (critical, non-critical, or reference) of all process instruments should be listed. A critical instrument is one whose failure could have direct impact on the final product quality output. Critical instruments are important because they will be used during the process to make important decisions on the system’s performance. Also, critical instruments will be calibrated and maintained more often than non-critical.
Computerized System Software and Hardware: The type, model, manufacturer, and classification (critical, non-critical, or reference) of all computerized systems components should be listed. The software programs used to control the CIP system should include the developers and/or manufacturer’s name, revision number, type, and serial numbers. All software viewing screens should be compared with the design specification to ensure accuracy. The following are some of the components that should be verified for the computerized system hardware:
Computerized System Hardware Qualification for the CIP System
Design/purchase/engineering specifications Manufacturer’s recommendations Applicable drawings – I/O diagrams, integrate with field devicesApplicable national and local standards Wiring continuity – point to point Electrical grounding Noise isolation Back-up power – UPS Switch/jumper settings Loop checks Communication interface
Printers• Peripherals• Storage devices•
Detailed interconnection diagrams Power requirements Fuse requirements Security procedures Network hardware and software interface (if applicable) Environmental requirements
Software Installation Qualification
The IQ is a documented plan for the performance of inspections and the collection of documentation to verify static attributes of a system. It is vital that a firm has assur-ance that computer programs, especially those that control manufacturing processing, will consistently perform as required to within preestablished operational limits. Successful completion of the IQ assures that computerized systems are designed and installed in a manner consistent with the following:
Software QualificationSource code availability and verification test• Software documentation• Manuals and software• Software test plan• Detailed interconnection diagrams• Software design specifications• Verification of software standards• Functional testing• System disruptions• Security features• Structural testing• Compliance to 21 CFR Part 11 (Electronic Records • and Signatures)
The IQ will describe what the system is intended to do and summarizes all major components of the system. A complete analysis of the system is performed prior to start-up and a field inspection is performed to check static attributes.
Operational Qualification
The operational qualification should verify the func-tionality of the column and the performance attributes of the system during the manufacturing process. It also veri-fies that the equipment, when assembled and used accord-ing to standard operating procedures, does in fact perform its intended function. The OQ should demonstrate that the user has tested the equipment and has found it to be functionally acceptable for manufacturing. Depending on the complexity or use of the CIP system, the OQ protocol should contain some of the following elements:
Installation qualification review Instrument calibration review Validation test equipment and calibration SOP review Operational verification
Computer control functional verification•
Cleaning Validation
22 | Pharmaceutical Canada
Instrumentation verification• System alarm verification• Recorders/detectors• Interlocks verification• Strip chart recorder test• pH monitor and detector test• Conductivity test• Pump control by flow measurement test• Functional testing for cleaning circuits• Printer and training verification•
Installation Qualification Review: The IQ portion of the protocol must be completed and in review by the protocol director prior to execution of the OQ portion of the proto-col. The authorization for executing the OQ portion may be given prior to the finalization of the IQ, as long as there are no installation deviations that affect the performance and results of the testing. It is important that the system has been installed per manufacturer’s recommendations. This ensures that there will be no failures during the OQ, which may be attributed to incorrect installation.
Instrument Calibration Review: This section of the pro-tocol is used to verify that all gauges and/or instruments are entered into the facility calibration program, classi-fied as critical, non-critical, or reference, calibrated using National Institute of Standards and Technology (NIST) traceable or other appropriate standards, and has a current calibration label affixed.
Validation Test Equipment and Calibration: To list the validation test equipment requires executing the OQ and including the calibration and/or certificate of compliance documentation of that equipment as appropriate.
Standard Operating Procedure Review: This section is used to verify that applicable written procedures exist and are functionally adequate for the operation, maintenance, and sanitization of the system. All system-related proce-dures are identified and listed in the data collection form of the protocol. All procedures should be reviewed during the protocol execution to determine the accuracy of each document. If they are not accurate, they should be updat-ed with the correct changes and submitted to document control for processing.
Operational Verification: This section of the protocol will be used to challenge and test each component of the CIP system individually and also as an integrated system. The following are some tests that will be performed de-pending on the complexity of the system:
• Computer Control Functional Verification: If computer control is to be used in the operation or cleaning of the process equipment, validation of the control software and hardware in the system must be addressed. It should be shown that the software functions correctly and is protect-ed from unauthorized alteration. Each logic path should be verified and security access should be challenged. The ability of the system hardware to perform its assigned task should also be shown.
• Instrumentation Verification: All instruments and devices should be tested by simulation, by challeng-ing the system, or by electronic simulation. This test should include the verification of correct instrumentation sequencing.
• System Alarm Verification: All alarms should be tested by simulation of “alarm conditions” either by actu-ally challenging the system or by electronic simulation. This test should include the verification of correct alarm se-quencing. This includes all subcomponents of the system such as chart recorders, conductivity, and pH meters, etc.
• Recorders/Detectors: If the data generated by detec-tors or recorders is used in the process, then the accept-able range, limits of linearity response, reaction time, and response of each detectors and recorders under normal operating parameters should be established. Each detector should be standardized before the functional checks are performed (pH and conductivity meters).
• Interlocks Verification: All interlocks should be tested by simulation of “interlock conditions” either by actually challenging the system or by electronic simulation. This test should include the verification of correct interlock sequencing.
• U-Bend Control Panel Verification: All proximity switches should be verified to the associated UBend to ensure that the proper cleaning cycle has been selected.
• Pump Control by Flow Measurement Test: Pumps should be tested to show that they deliver the correct flow rates under normal operating conditions. It is also used to verify that the accuracy of the flow controller and the pump speed control are functioning correctly.
• Functional Testing for Cleaning Circuits: During func-tional or operational testing, each cleaning cycle process parameters (time, temperature, flow rates, etc.) are chal-lenged and monitored. All cleaning circuits are executed as per cleaning procedures. This will determine if each clean-ing cycle has been correctly developed and is reproducible each time it is run.
Cleaning Validation
Pharmaceutical Canada | 23 Cleaning Validation
• Training Verification: This may be an optional section of the protocol but nevertheless it is probably the most important selection. Since most CIP systems require vari-ous degrees of human interaction, it only makes sense to verify the training of these interactions. The correct setup and operation of the CIP system’s U-Bends and hoses is important for ensuring the success of the cleaning process. A list containing the names of operators, when they were trained, and what procedure they were trained on should be documented into the training form.
Tools for Determining Critical Process Controls
The goals outlined below identify all necessary re-quirements that will be developed as a company progress-es into the cleaning process validation phase. It is essen-tial that all supporting functions of the cleaning process validation program be in place in order to achieve success in all the validation efforts.
During the cleaning development process, the follow-ing techniques should be used to defined critical process parameters:
Flow Diagram – The flow diagram provides a conve-nient basis on which to develop a detailed list of variables and responses.
Variables and Responses – The greatest focus during development should be directed toward potential criti-cal variables and responses. Attention should be devoted to identifying all potential process control and product variables and responses so that all critical aspects can be included in the process summary.
Cause - and - Effect Diagram – An efficient represen-tation of complex relationships between many process variables (causes), and single responses (effects) can be shown by using cause-and-effect diagrams. A center arrow points to a particular single effect. Branches off the central arrow lead to boxes representing specific process steps. Next, principal factors of each process step that can cause or influence the effect are drawn as sub-branches off each branch, until a complete cause-and-effect diagram is de-veloped that is as detailed as possible.
Influence Matrix – Once the variables and responses have been identified, it is useful to summarize their rela-tionships in an influence matrix format (how variables will influence the cleaning process). Each process variable is evaluated, based on available knowledge, for its potential effects on each of the process response or product charac-
teristics. The strength of the relationship between variables and responses can be indicated by the following nota-tion, such as strong (S), moderate (M), weak (W), or none, together with special classification such as unknown (?). Construction of the influence matrix assists in identifying those variables with the greatest influence on key process or product characteristics.
Failure Analysis – Functional analysis, Fault Tree Analysis (FTA) and Failure Mode and Effect Analysis (FMEA) all provide valuable information and it is beneficial to conduct all three. Each provides a diff e rent perspective to guide the design of the medical device. Functional analy-sis emphasizes cost-effective functional requirements. Reliability and robust functionality are developed using FTA and FMEA.
Fault Tree Analysis
FTA is a top down approach to failure mode analy-sis. It assumes a system level failure and identifies critical failure modes within that system. The undesirable event is defined and then traced through the system to identify possible causes. One event is addressed at a time and all possible causes of that event are considered. The analysis proceeds by determining how these system level failures can be caused by individual or combined lower level fail-ures or events. The tree is continued until the subsystem at fault is determined. By determining the underlying causes, corrective actions can be identified to avoid or diminish the effects of the failures. FTA is a great “lead-in” to robust experimental design techniques.
Cleaning Matrix
The matrix approach to cleaning validation is useful for situations where the process equipment is used for multiple products. This approach is convenient for several reasons. They enable us to see at a glance what equipment is contacted by each of the products. This not only gives us an overview for what the potential areas for cross-con-tamination of one product into another are, but indicates any single use equipment for which cleaning might not be as great an issue. The cleaning matrices can simplify the cleaning validation activities by allowing us to establish a logical approach to the cleaning program. The matrices approach to cleaning validation can be a useful tool in establishing worst-case conditions based on solubility of the active in the cleaning solvent, inherent difficulty of the cleaning residue, and the toxicity of the active ingredient. It can also be used to determine whether a piece of equip-
ment is dedicated or non-dedicated.
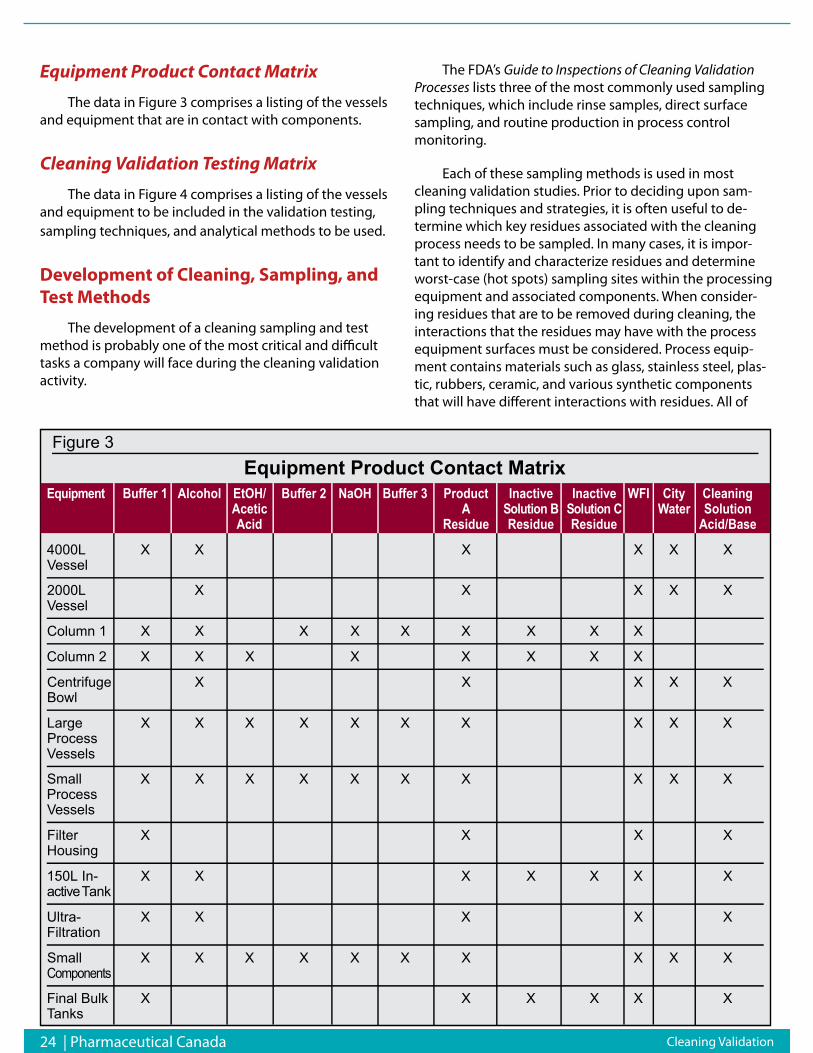
24 | Pharmaceutical Canada
Equipment Product Contact Matrix
The data in Figure 3 comprises a listing of the vessels and equipment that are in contact with components.
Cleaning Validation Testing Matrix
The data in Figure 4 comprises a listing of the vessels and equipment to be included in the validation testing, sampling techniques, and analytical methods to be used.
Development of Cleaning, Sampling, and Test Methods
The development of a cleaning sampling and test method is probably one of the most critical and difficult tasks a company will face during the cleaning validation activity.
The FDA’s Guide to Inspections of Cleaning Validation Processes lists three of the most commonly used sampling techniques, which include rinse samples, direct surface sampling, and routine production in process control monitoring.
Each of these sampling methods is used in most cleaning validation studies. Prior to deciding upon sam-pling techniques and strategies, it is often useful to de-termine which key residues associated with the cleaning process needs to be sampled. In many cases, it is impor-tant to identify and characterize residues and determine worst-case (hot spots) sampling sites within the processing equipment and associated components. When consider-ing residues that are to be removed during cleaning, the interactions that the residues may have with the process equipment surfaces must be considered. Process equip-ment contains materials such as glass, stainless steel, plas-tic, rubbers, ceramic, and various synthetic components that will have different interactions with residues. All of
Figure 3Equipment Product Contact Matrix
t n e m p i u q E Buffer 1 Alcohol EtOH/ Buffer 2 NaOH Buffer 3 Product Inactive Inactive WFI City CleaningAcetic A Solution B Solution C Water SolutionAcid Residue Residue Residue Acid/Base
4000L X X X X X XVessel
2000L X X X X XVessel
Column 1 X X X X X X X X X
Column 2 X X X X X X X X
Centrifuge X X X X XBowl
Large X X X X X X X X X XProcessVessels
Small X X X X X X X X X XProcessVessels
Filter X X X XHousing
150L In- X X X X X X Xv i t c a eT k n a
Ultra- X X X X XFiltration
Small X X X X X X X X X Xs t n e n o p m o C
Final Bulk X X X X X XTanks
Cleaning Validation
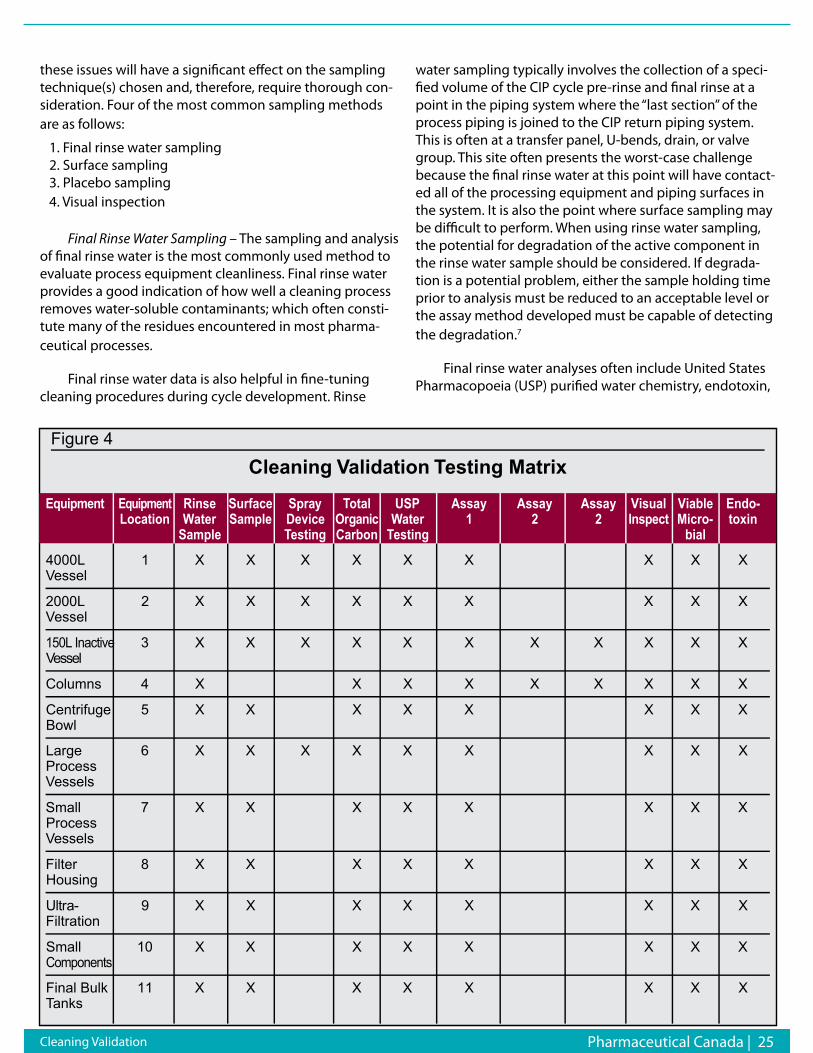
Pharmaceutical Canada | 25 Cleaning Validation
these issues will have a significant effect on the sampling technique(s) chosen and, therefore, require thorough con-sideration. Four of the most common sampling methods are as follows:
1. Final rinse water sampling 2. Surface sampling 3. Placebo sampling 4. Visual inspection
Final Rinse Water Sampling – The sampling and analysis of final rinse water is the most commonly used method to evaluate process equipment cleanliness. Final rinse water provides a good indication of how well a cleaning process removes water-soluble contaminants; which often consti-tute many of the residues encountered in most pharma-ceutical processes.
Final rinse water data is also helpful in fine-tuning cleaning procedures during cycle development. Rinse
water sampling typically involves the collection of a speci-fied volume of the CIP cycle pre-rinse and final rinse at a point in the piping system where the “last section” of the process piping is joined to the CIP return piping system. This is often at a transfer panel, U-bends, drain, or valve group. This site often presents the worst-case challenge because the final rinse water at this point will have contact-ed all of the processing equipment and piping surfaces in the system. It is also the point where surface sampling may be difficult to perform. When using rinse water sampling, the potential for degradation of the active component in the rinse water sample should be considered. If degrada-tion is a potential problem, either the sample holding time prior to analysis must be reduced to an acceptable level or the assay method developed must be capable of detecting the degradation.7
Final rinse water analyses often include United States Pharmacopoeia (USP) purified water chemistry, endotoxin,
Figure 4
Cleaning Validation Testing Matrix
t n e m p i u q E t n e m p i u q E Rinse Surface Spray Total USP Assay Assay Assay Visual Viable Endo-Location Water Sample Device c i n a gr O Water 1 2 2 t c e p s n I Micro- toxin
Sample Testing Carbon Testing bial
4000L 1 X X X X X X X X XVessel
2000L 2 X X X X X X X X XVessel
150L Inactive 3 X X X X X X X X X X XV l e s s e
Columns 4 X X X X X X X X X
Centrifuge 5 X X X X X X X XBowl
Large 6 X X X X X X X X XProcessVessels
Small 7 X X X X X X X XProcessVessels
Filter 8 X X X X X X X XHousing
- ar t l U 9 X X X X X X X XFiltration
Small 10 X X X X X X X XComponents
Final Bulk 11 X X X X X X X XTanks
26 | Pharmaceutical Canada Cleaning Validation
and bioburden, but it should also include analyzing for the active ingredient. It is important to note that rinse water sampling to only compendial methods without assaying for a specific residue is not acceptable to the regulatory agencies. Rinse water sampling, in combination with other sampling techniques, can provide a more complete assess-ment of cleaning efficacy than surface sampling and/or visual inspection alone.8
Surface Sampling – Surface sampling is probably one of the most commonly used methods for establishing the cleanliness of process equipment surfaces. Two of the most commonly used surface sampling methods is swabs and wipes. The swab sampling is a widely used sampling technique that is used for testing product contact surfaces. Swab techniques can include the use of a fiber tipped swab, absorbent wipe, or a filter disc. The swabs are usually saturated with a recovery solvent which causes the disso-lution as well as physical removal of surface contaminates. When using swabs for surface sampling, they should be compatible with the active residue. They should not cause degradation of the compound and should allow extrac-tion of the compound for analysis. The recovery solvent used for swabbing should provide good solubility for the compound and likewise not encourage degradation. The following are some major considerations when selecting a swab for cleaning validation:
Compatibility with active Size Flexibility Solvent resistance – compatibility with recovery solventPotential extractable Sorption into swab material Retention by swab Easy to manipulate-physically Surface contaminant
Surface sampling can provide a more complete and rigorous indication of cleaning efficacy than final rinse water sampling or visual inspection alone. If properly used, surface sampling can recover residues and contaminants that are either soluble or insoluble in water.
Placebo Sampling – The placebo sampling methods can sometimes provide the best simulation of the actual production of a subsequent batch of product. Placebo sampling is used to detect residues on equipment through the processing of a placebo batch during the cleaning process and must be validated. Placebos are used to demonstrate the lack of carryover to the next product. It is important to consider the chemical and physical attributes of the placebo you intend to use. The characteristics of the
process equipment will also have a direct impact on the placebo batch size. This method of sampling is not always accepted by the regulatory agencies and, in practice, is not a favored methodology since placebo batches may be almost as expensive as the actual product made.
Visual Inspection – Although not residue specific, the visual inspection of equipment and piping surfaces can be considered quick and a somewhat effective method of detecting dirty surfaces. While not as quantitative as final rinse water or surface sampling, visual inspection can pro-vide a quick and inexpensive assessment of process equip-ment and piping cleanliness. Visual inspection may also be used to verify that there are no areas within the process-ing equipment and piping systems that contain residues that can be seen with the naked eye. Visual inspection of equipment should be included as part of the final check in a cleaning process and the Quality Assurance (QA) audit or monitoring. It should also be the first step in the actual manufacturing procedure.
Sampling Method Validation – Once a sampling meth-od and materials have been identified for given residues, they must be validated. This often involves the spiking of a representative quantity of in-process material residuals on coupons of material similar in physical nature to the processing equipment and components, and subsequent swabbing and analysis. The sampling validation qualifies that the sampling materials and methods are effective in recovering a reasonable percentage of the likely residues from processing equipment surfaces both prior to and fol-lowing cleaning.
Analytical Methods Selection
The analytical methods selected for cleaning valida-tion studies should be sensitive enough to detect and quantify residual contaminates that may be present within processing equipment following cleaning. The selection of an analytical test method is highly dependent upon the material being sampled, method used to sample (i.e., swabs, rinse solution), the analytical specificity required for the test, the level to which the material must be sampled, and sampling procedures to be used. All analytical meth-ods must be validated in conjunction with the sample collection/extraction system that is used at the appropri-ate detection level. It is also important that the analytical method chosen be of accurate sensitivity to give meaning-ful results when it comes to the calculation of acceptance limits. There are many important factors for selecting a particular analytical method, but whatever one is chosen it is important to consider the amount of time and effort that will be required to validate those methods. Some common
Pharmaceutical Canada | 27
The USP/NF has issued the following statement on their official web site: “BeginningJuly 1, 2008, all drug substances, excipients, and products in the USP-NF are subjectto relevant control of residual solvents, even when no test is specified in the individualmonograph.” This is a substantial additional workload for the QA and QC departmentsof all users of the USP/NF but QCL has multiple GCs equipped with the relevant head-space analyzers ready to assist in your compliance with this official requirement delin-eated in general chapter <467>.
Were you also aware that a continuing stability program is a Regulatory requirementunder the NHP GMP guidelines and that you will be audited for your compliance to thisrequirement? If your natural health product stability program is incomplete, QCL has ICHcompliant and qualified stability chambers ready to receive your samples along with thesoftware to track your studies and the expertise to perform method development, vali-dation and/or the routine testing necessary to ensure worry free compliance.
Mr. Ronald D. TurtonM.Sc., B. Tech., C. Chem.Chief Scientific OfficerQCL-Quality ComplianceLaboratories
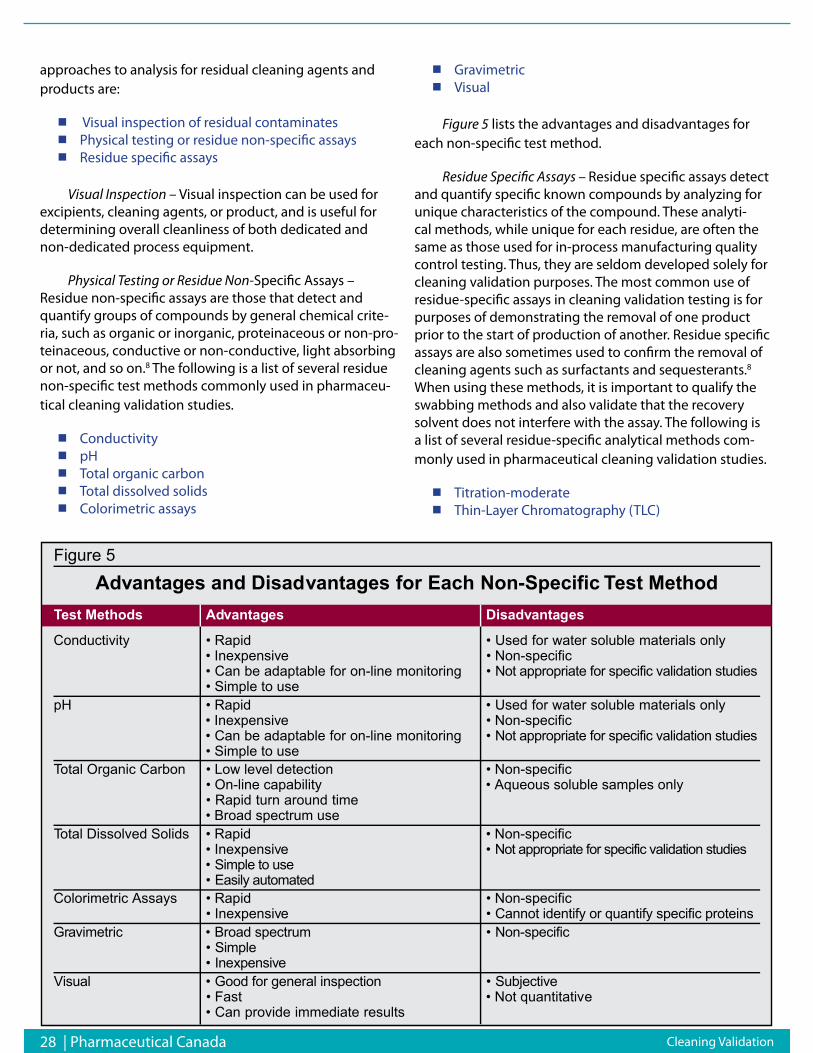
28 | Pharmaceutical Canada
approaches to analysis for residual cleaning agents and products are:
Visual inspection of residual contaminates Physical testing or residue non-specific assays Residue specific assays
Visual Inspection – Visual inspection can be used for excipients, cleaning agents, or product, and is useful for determining overall cleanliness of both dedicated and non-dedicated process equipment.
Physical Testing or Residue Non-Specific Assays – Residue non-specific assays are those that detect and quantify groups of compounds by general chemical crite-ria, such as organic or inorganic, proteinaceous or non-pro-teinaceous, conductive or non-conductive, light absorbing or not, and so on.8 The following is a list of several residue non-specific test methods commonly used in pharmaceu-tical cleaning validation studies.
Conductivity pH Total organic carbon Total dissolved solids Colorimetric assays
Gravimetric Visual
Figure 5 lists the advantages and disadvantages for each non-specific test method.
Residue Specific Assays – Residue specific assays detect and quantify specific known compounds by analyzing for unique characteristics of the compound. These analyti-cal methods, while unique for each residue, are often the same as those used for in-process manufacturing quality control testing. Thus, they are seldom developed solely for cleaning validation purposes. The most common use of residue-specific assays in cleaning validation testing is for purposes of demonstrating the removal of one product prior to the start of production of another. Residue specific assays are also sometimes used to confirm the removal of cleaning agents such as surfactants and sequesterants.8 When using these methods, it is important to qualify the swabbing methods and also validate that the recovery solvent does not interfere with the assay. The following is a list of several residue-specific analytical methods com-monly used in pharmaceutical cleaning validation studies.
Titration-moderate Thin-Layer Chromatography (TLC)
Figure 5
Advantages and Disadvantages for Each Non-Specific Test MethodTest Methods Advantages Disadvantages
Conductivity • Rapid • Used for water soluble materials only• Inexpensive • Non-specific• Can be adaptable for on-line monitoring • Not appropriate for specific validation studies• Simple to use
pH • Rapid • Used for water soluble materials only• Inexpensive • Non-specific• Can be adaptable for on-line monitoring • Not appropriate for specific validation studies• Simple to use
Total Organic Carbon • Low level detection • Non-specific• On-line capability • Aqueous soluble samples only• Rapid turn around time• Broad spectrum use
Total Dissolved Solids • Rapid • Non-specific• Inexpensive • Not appropriate for specific validation studies• Simple to use• Easily automated
Colorimetric Assays • Rapid • Non-specific• Inexpensive • Cannot identify or quantify specific proteins
r G a c ir t e m i v • Broad spectr m u • c i f i c e p s - n o N• e l p m i S• v i s n e p xe n I e
l a u s i V • Good for general inspection • v i t c e j b u S e• Fast • Not quantitative• Can provide immediate results
Cleaning Validation
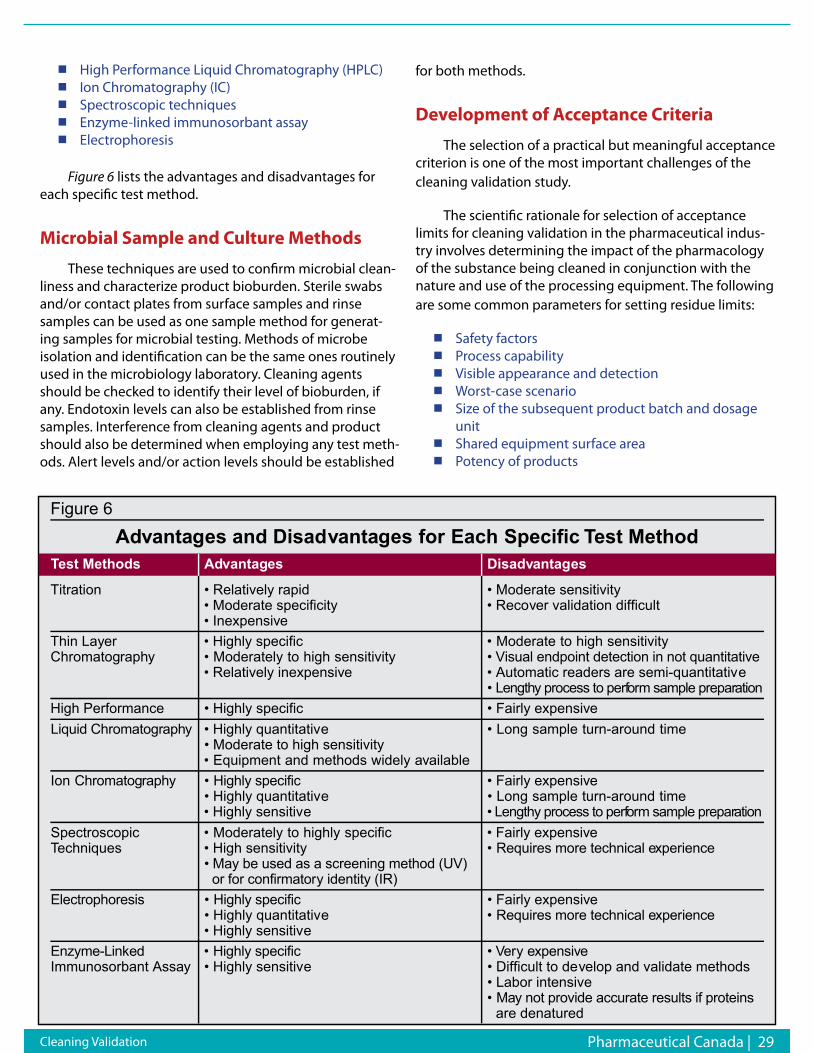
Pharmaceutical Canada | 29 Cleaning Validation
High Performance Liquid Chromatography (HPLC) Ion Chromatography (IC) Spectroscopic techniques Enzyme-linked immunosorbant assay Electrophoresis
Figure 6 lists the advantages and disadvantages for each specific test method.
Microbial Sample and Culture Methods
These techniques are used to confirm microbial clean-liness and characterize product bioburden. Sterile swabs and/or contact plates from surface samples and rinse samples can be used as one sample method for generat-ing samples for microbial testing. Methods of microbe isolation and identification can be the same ones routinely used in the microbiology laboratory. Cleaning agents should be checked to identify their level of bioburden, if any. Endotoxin levels can also be established from rinse samples. Interference from cleaning agents and product should also be determined when employing any test meth-ods. Alert levels and/or action levels should be established
for both methods.
Development of Acceptance Criteria
The selection of a practical but meaningful acceptance criterion is one of the most important challenges of the cleaning validation study.
The scientific rationale for selection of acceptance limits for cleaning validation in the pharmaceutical indus-try involves determining the impact of the pharmacology of the substance being cleaned in conjunction with the nature and use of the processing equipment. The following are some common parameters for setting residue limits:
Safety factors Process capability Visible appearance and detection Worst-case scenario Size of the subsequent product batch and dosage unitShared equipment surface area Potency of products
Figure 6
Advantages and Disadvantages for Each Specific Test MethodTest Methods Advantages Disadvantages
Titration • Relatively rapid • Moderate sensitivity• Moderate specificity • Recover validation difficult• Inexpensive
Thin Layer • Highly specific • Moderate to high sensitivityChromatography • Moderately to high sensitivity • Visual endpoint detection in not quantitative
• Relatively inexpensive • Automatic readers are semi-quantitative• h t g n e L y process to perf r o m sample prepar n o i t a
High Performance • Highly specific • Fairly expensiveLiquid Chromatogr h p a y • Highly quantitative • Long sample turn-around time
• Moderate to high sensitivity• Equipment and methods widely available
Ion g o t a m o r h C r h p a y • Highly specific • Fairly expensive• Highly quantitative • Long sample turn-around time• Highly sensitive • Lengthy process to perf r o m sample prepar n o i t a
Spectroscopic • Moderately to highly specific • Fairly expensiveTechniques • High sensitivity • Requires more technical e e c n e ir e p x
• May be used as a screening method (UV)or for confir r o t a m y identity (IR)
s i s e r o h p o r t c e l E • Highly specific • Fairly expensive• Highly quantitative • Requires more technical e e c n e ir e p x• Highly sensitive
d ek n i L - e m y z n E • Highly specific • V r e y e v i s n e p x eImmunosorbant Assay • Highly sensitive • Difficult to develop and validate methods
• Labor intensive• a M y not provide accurate results if proteins
are denatured
30 | Pharmaceutical Canada
Product versus non-product contact surfaces Critical contact sites versus non-critical Dedicated versus non-dedicated equipment Potency of the substance being cleaned Toxicity and safety data of the substance being cleanedAllergenic nature of the substance being cleaned Assay detection limit
The following are just a few methods used for estab-lishing acceptance criteria:
Safety Factor
The safety factor is one of the most commonly used strategies for developing cleaning acceptance criteria. In any cleaning strategy, which involves a “no effect” dose, or lowest allowable level in the next batch, a safety factor can be used as acceptance criteria. This safety factor provides for assumptions made during alert limit calculations. Most alert limit strategies assume some form of residue distribu-tion, uniform sampling size, and smallest dose or batch size. However, in cases where these assumptions do not hold true, the safety factor provides for a margin of error. Safety factors can be in any increment. Commonly they are 1/10th, 1/100th, or 1/1000th of some determined limit.
The safety factor provides for assumptions made during the alert limits calculations and should not be used to determine specific analytical limitations. For example, the safety factor for the daily dosage of a 400 mcg tablet using an area calculation; the alert limits are commonly set based upon the anticipated swab or rinse surface area re-sults. For this example, the most commonly used swabbing area is 15 cm by 15 cm or 225 cm2. To this “tablet” dose, the
safety factor of 100 is used. For this area, the alert limit is calculated as follows:
400 mcg/100 (Safety Factor) = 4 mcg/225 cm2 = 0.017 mcg/ cm2
10-PPM Carry-Over
The basic scheme behind this method is that no more than 10 ppm of a given product will be carriedover to any one dose of the next product to be manufactured. This method is based upon the regulations for maximum allowable quantities of toxic substances in food products. The FDA’s guidance documents for determining residue limits is that they must be logical, practical, achievable, and verifiable. While this method of establishing limits is commonly used in the pharmaceutical industry, it may not be practical for all manufacturing processes. Ascientific ra-tionale or justification should be used when selecting this method. It must also be defensible to the FDA.
Visual
No quantity of residue will be visibly detected on equipment after cleaning procedures are performed. Since it is possible to set residue limits for a monitoring program at or above the level of visual detection, it may be necessary to quantitatively define the visual detection level. In general, this level is in the range of 200 – 500 mcg of drug per 225cm2. This area is roughly equivalent to the surface contact area of a human hand. This translates into visual detection of about one mcg per cm2 surface area. Although this method is subjective, it does provide a first pass for inspection and a guideline for dedicated single use equipment.6
Cleaning Validation
TE
L:
(
24
8)
7
22
-4
96
9
IN
FO
@G
IL
MA
NG
RP
.C
OM
W
WW
.G
IL
MA
NG
RP
.C
OM
C O U N T G I L M A N I N F O R A G G R E S S I V E T I M E L I N E S , O N - T I M E A N D I N - B U D G E T P R O J E C T E X E C U T I O N S
B I O T E C HP H A R M A C E U T I C A L SM E D I C A L D E V I C E S
G I L M A N P R O F E S S I O N A L G R O U P
V a l i d a t i o n | C o m m i s s i o n i n g E n g i n e e r i n g S u p p o r t
S i x S i g m a & P r o c e s s O p t i m i z a t i o n A u d i t | G a p A n a l y s i s
S t a t i s t i c a l D a t a A n a l y s i s
Pharmaceutical Canada | 31
Worst-Case Conditions
The worst-case selection is based on a combination of potency, toxicity, solubility, stability, and difficulty of cleaning. In any event, the criteria for the selection should be incorporated into a written scientific rationale that describes the selection process. This selection process is usually defined in the cleaning validation master plan. It is understood that the same cleaning process must be used for the products in the same group.
One approach for establishing the worst-case condi-tion is to use the most toxic clinical compound as a guide and develop a limit based upon the smallest batch or dose of the next product processed. This approach could be carried out for a range of worstcase condition equipment sizes, dosages, and batch sizes. The limits developed could then be applied conservatively for all products. It is also possible to develop a worst-case strategy within grouping of products. In this strategy, compounds with similar char-acteristics would be grouped together. Within each group a worst-case limit would be determined and applied to all compounds in a group. This strategy would use a scientific rationale to group compounds and set limits based upon a worst-case conditions compound in the group. This ap-proach allows the limit to be determined in the absence of a “no effect” dose and allows for variation in the processing of the drug (changes in dose, batch sizes, and equipment sizes).
There are many methods for establishing worstcase conditions. These include soiling surfaces for an extended period of time, equipment grouping, potency, toxicity, solubility, stability, and the cleaning process. Whatever methodology is used for assessing the worst-case condi-tion, a scientifically sound logic must be applied. This logic must be defensible to the FDA in order for the cleaning validation to be acceptable.
Validation of the Cleaning Process
After the cleaning cycle development phase has been successfully completed, validation of the cleaning process can be started. This involves developing a protocol, which can be easily defensible to the FDA. A protocol will be developed to demonstrate the effectiveness of the clean-ing procedures and associated cleaning agents employed to clean production equipment used regularly, and on a campaign basis (product changeover).
Specific SOPs will be developed for cleaning each piece of equipment utilized in production. Validated as-says will be developed with adequate sensitivity to test for
residuals (active ingredients and, if applicable, cleaning agents).
Once the equipment cleaning SOPs are written, the as-says developed and validated, and the acceptance criteria determined, the qualification studies would be conducted. During the qualification, final rinse and wipe/swab samples will be analyzed to confirm the effectiveness of the clean-ing procedures. Qualification will be performed for the first three batches of every product manufactured.
The data collected during the qualification will be evaluated and compared to the predetermined acceptable residual limits. The proper documentation of the cleaning activities should be performed at the early stages of de-velopment. A company can save a lot of time and money during the validation phase if the documentation of the development phases is accurately performed.
Part 4 of this continuation series will be published in our next issue (Protocol Development)
Mr. David Vincent can be reached at [email protected]
References1. Drug and Pharmaceutical Sciences, “Pharmaceutical
Process Validation,” Marcel Dekker, Second Edition, Revised and Expand, edited by Berry, I.R., and Nash, R.A.
2. Journal of Validation Technology, Technical Guide, “The Validation Life Cycle Approach to Biotechnology Derived Product,” Vincent, D. and Revie, D. October 1999.
3. PDA Conference, Philadelphia, PA, Application of Clean-In- Place ToThe Pharmaceutical Process, Sieberling, D.A., March 1993.
4. PDA Conference, Stockholm, Sweden, Cleaning Validation, Brewer, R. and Hall, W.E., January 1995.
5. FDA. “FDA Guide to Inspections of Validation of Cleaning Processes.” July, 1993.
6. Sieberling, D.A. 1993 “Application of Clean-In-Place To The Pharmaceutical Process.” PDA conference, Philadelphia, PA (March).
7. Brewer, R. and Hall, W.E. 1995. “Cleaning Validation.” PDA conference, Stockholm, Sweden (January).
8. Nash, R.A. 1998. “Don’t Make Cleaning Validation Your Life’s Work.” Cleaning Validation, An Exclusive Publication. pp. 71-3.
Cleaning Validation
32 | Pharmaceutical Canada
Insider’s Tips on
Global Clinical Research
By Vinka Ljubimir
Currently, there are nearly 50,000 clinical trials being conducted in 153 of 192 countries in the world. There are numerous reasons why pharmaceutical companies are becoming more and more global, and why clinical trials are following the same trend. Firstly, medicines are cre-ated for all humanity, so they have to be proven effective for all, which is also necessary for marketing and selling medicines in the global market. In spite of the fact that the current profit margins in some countries are insignificant, even in a huge country like China, companies are think-ing strategically and building relationships for a future in which even the least profitable markets of today will become more important.
The most frequently mentioned reasons for conduct-ing clinical studies globally are the following:
Faster enrollment Ethnic differences more easily detected Availability of treatment-naive subjects Potentially lower cost Market reasons (as mentioned above) Benefit to subjects by allowing populations access to new medicinesBenefit to countries by increasing experience and infrastructure in participating sites
Data gathered in clinical studies have to be homog-enous to enable strong conclusions. The degree of con-fidence in the conclusions is higher in very controlled environments; outside such conditions, the situation becomes much more complex. Such factors as investiga-tor and site differences in medical practices and selection of subjects, in site equipment and infrastructure, and in training—especially in new indications and in the capabili-ties and experience of research personnel—complicate study conduct.
Further differences pertain to the subjects, such as ethnicity, language, understanding of informed consent, and compliance. There are country-to-country differences in administrative demands regarding regulations and eth-ics committees, in setting up committees, and in managing various types of trials. The challenges facing the sponsor include managing the logistics of prepping and conduct-ing a trial, overcoming the hurdles of different nations’ approval processes for clinical trial materials, coordinating central labs, and capturing and utilizing data. Finally, there are challenges in statistical analysis and interpretation, as well as differences in epidemiology of the target diseases. Why, then, are clinical researchers not getting the data traditionally “at home,” but instead are expanding beyond their comfort zones into new countries in an attempt to achieve cost savings and market shares at much higher risks?
Country Selection
When researchers are choosing countries for clinical studies, the selection process is usually governed by:
Access to subject populations (taking into
Why are clinical researchers not getting the data traditionally “at home,” but instead are expanding beyond their comfort zones into new countries in an attempt to achieve cost savings and market shares at much higher risks?
Global Clinical Research
Pharmaceutical Canada | 33
ASTM International’s Committee E55 on Manufacture of Pharmaceutical ProductsIs a diverse group of stakeholders that develop the standards that infl uence innovations in pharmaceutical development and manufacturing. The scope of Committee E55’s involvement is relevant to the public and private sectors on a global basis.
Become a member of ASTM’s Committee E55 and you can cast your vote on key document revisions and draft proposals such as:
■ E2363 Standard Terminology Relating to Process Analytical Technology in the Pharmaceutical Industry
■ E2474 Standard Practice for Pharmaceutical Process Design Utilizing Process Analytical Technology
■ E2500 Standard Guide for Specifi cation, Design, and Verifi cation of Pharmaceutical and Biopharmaceutical Manufacturing Systems and Equipment
■ E2503 Standard Practice for Qualifi cation of Basket and Paddle Dissolution Apparatus
■ E2537 Standard Guide for Application of Continuous Quality Verifi cation to Pharmaceutical and Biopharmaceutical Manufacturing
ASTM International is a trusted source for technical standards throughout the world! Membership on Committee E55 has many rewards including:
■ Infl uence the outcome of standards proposals
■ Connect to valuable resources and networking opportunities
■ Learn ways to extend your global reach
■ Save 10% on all ASTM publication
■ Keep abreast of relevant issues
■ FREE volume of the standards you need
Log on www.astm.org/e55mail.htm or Contact Pat Picariello at +1 610-832 9720 Email: [email protected]
E55 Print Ad.indd 1 10/27/08 10:59:43 AM
consideration site quality and number of competing trials) Recruitment/approval timelines (speed) Cost Commercial considerations Regulatory mandates
In the process of identifying countries for a specific global study, it is advisable to combine some of the familiar, stable, and tested countries with those that are new or relatively new in the sponsor’s experience, so that any burden of approval delay or study recruitment failure in one country might be absorbed in another. Gaining the benefits of local expertise is especially valu-able during the study startup phase, especially in relation to regulatory and ethics submissions and site selection. Depending on preferences, sponsors without their own local staff in such cases usually rely either on large, multi-national contract research organizations (CROs) or small niche providers and independent consultants for this service.
Global clinical trials expose pharmaceutical companies to many logistical and resource challenges, including time differences and the far-flung distances between sites. Other hassles include hardware challenges, such as the loss of study equipment (most often laptops) and difficulties with installation of phone lines. Moreover, there are political challenges in terms of local rules and regulations and various customs issues. Such challenges could appear unex-pectedly; for example, the banning of export of biological samples in Russia on May 28, 2007, which, with the help of the industry pressure, was lifted within two weeks after it was imposed.
As global clinical trials use the language of global business—English— training of local investigators in local language for study purposes is especially important for those countries in which study teams are not comfortable with speaking in English. Investigative sites rarely admit to needing such help. At the same time, dividing site teams by country when it comes to investiga-tor meetings would not go well with most; so the best solution is to use the investigator meeting as a unique opportunity for team building, and either provide simultaneous translations at the meeting or have site initiation visits in local language afterward. In order to achieve maximum homogeneity of data, sponsors sometimes invest in quality translations of study materials into the local language.
In the process of identifying countries for a specific global study, it is advisable to combine some of the familiar, stable, and tested countries with those that are new or relatively new in the sponsor’s experience, so that any burden of approval delay or study recruitment failure in one country might be absorbed in another.
Global Clinical Research
34 | Pharmaceutical Canada
Global Study Recruitment
Failure to enroll adequate numbers of subjects is a primary reason why some clinical trials fail. Therefore, many pharmaceutical companies and CROs have devel-oped detailed processes related to recruitment planning, which could be especially fruitful for global trials. Usually, recruitment plans are developed prior to study start, and tailored to the indication and to the specifics of the country and the sites. Sometimes the study itself (study protocol) causes difficulties in recruiting subjects into the study; for example, by requiring treatment-naïve subjects where the treatment is in high use. Key opinion leaders in the chosen countries could prove invaluable to the study’s success when given opportunities to comment on matters related to specific country practices before the protocol is finalized.
Study teams must be involved and committed to the study recruitment targets, and they must develop study specific recruitment tools. Study sites have valuable experience in applying various subject recruitment meth-ods locally; so it is very useful to keep discussion going throughout the study and to adapt the recruitment plans
accordingly. There are many tools currently being used in the industry for addressing subject recruitment, ranging from inclusion/exclusion cards and “Dear Colleague” refer-ral letters to the use of professional advertising companies that are expensive, but usually effective.
Unexpected Risks
When managing a global trial, the only way to account for different levels of quality in different geographies is to insist that all sites follow standardized procedures. Besides being alert to cultural differences and proactive toward
Key opinion leaders in the chosen countries could prove invaluable to the study’s success when given opportunities to comment on matters related to specific country practices before the protocol is finalized.
CASE STUDY 1—Subject Recruitment Challenges on a Global Study
A Phase II pain study in irritable bowel syndrome calls for 330 subjects to be randomized in Australia, Belgium, Germany, France, Sweden, and United Kingdom (U.K.) at approximately 40 sites using phone diaries, IVRS, cen-tralized lab, and electrocardiogram.
Although the recruitment expectations were quite realistic and clear, based on prior sponsor experience in similar indication, recruitment targets fell behind from the beginning and reached only about 10% of the expected goal in the first few months following the first patient first visit (FPFV) threshold. The study recruitment plan detailed the first round of contingency measures, including encouraging countries to use locally produced advertising and increasing the numbers of sites. Implementation of the plan resulted in additional sites in the countries that had by that time obtained regulatory approval: Germany (two site-management organization sites), France (one site), and the U.K. (one site).
Six months into the study, recruitment was still significantly behind; so the second round of contingency measures was implemented: Every site individually explored local advertising possibilities, and the countries were again encouraged to find more sites, which resulted in four new sites (one each in the U.K., Australia, Germany, and France).
Eight months into the study, with the figures still very low, a clinical research associate (CRA) face-to-face meeting was organized in order to remotivate the team and revisit the recruitment strategies. Site-specific study advertising was discussed and related experience shared between the participating countries. Monitors were able to refresh their knowl-edge about the study, the protocol, and the processes, and the meeting included a workshop on recruitment barriers and opportunities.
Following the CRA meeting, recruitment plans were updated, and the third round of contingency measures was defined, which involved site visits by the sponsor’s global study team. This was aimed at investigator relationship man-agement and resolution of the operational issues. The compound had a priority position in the sponsor’s portfolio; since progress on it was falling significantly behind, a professional advertising agency was brought on board. The collaboration with them from the initiation of the vendor selection process to the finalization of the advertising campaign took three months, which left only three months for the campaign to bring results. In the meantime, all of the measures that were put in place earlier in the recruitment period picked up, and the study finally met its recruitment targets on time, without the professional advertising campaign even being implemented (it was instead utilized successfully by the sponsor for another protocol in the same indication).
The study was reported on time, but the compound failed to prove its efficacy, and never made it to the market.
Global Clinical Research
Pharmaceutical Canada | 35
logistical hurdles, there are still many risks that need to be successfully managed. Using a CRO with local expertise helps, although with the current level of outsourcing, it will be increasingly difficult to achieve the desired level of expertise. So using local niche providers might be the right solution. Industry leaders say that we will need both large and niche contract organizations in order to bring our portfolios through the coming challenges. The number of studies is likely to increase severalfold in the next few years. According to industry reports, at the same time the investigator’s pool will decrease, so nurturing investigator relationships should become a priority.
Developing and Nurturing Teams Lead to Success
For a successful global study, objectives must be achievable and must be communicated clearly to the team. Establishing effective communication across a global team involves facing such obstacles as different time zones and languages, hard-to-understand accents, and cultural idiosyncrasies. In order to achieve high-performing and happy teams, face-to-face meetings are necessary from
time to time to build trust and develop team cohesion. Videoconferencing is valuable only after team trust and communication have been established. Since e-mails are often misunderstood between cultures, it is much better to talk more often.
With the importance of team cohesion in mind for the success of a global study, changing team members during the study conduct is counterproductive. However, some changes are unavoidable, as team members may leave for various reasons that often are beyond the influence of study managers. In order to maintain team cohesion, using electronic photos is advisable to allow new and old team members to at least see each other’s photograph if they are unable to meet face-to-face. Some experts suggest that information be compiled on new team members and included on an information sheet, very much like a theater program, so that key facts about team members can be distributed and shared with the goal of reinforcing the “team spirit.”
Misuse of even such a powerful communication tool
When managing a global trial, the only way to account for different levels of quality in different geographies is to insist that all sites follow standardized procedures.
Establishing effective communication across a global team involves facing such obstacles as different time zones and languages, hard-to-understand accents, and cultural idiosyncrasies.
CASE STUDY 2—Investigator Relationships in Jeopardy
An oncology Phase II study in hepatic cancer needed to enroll subjects in three parts within 12 months: the first part to include 38 subjects, the second 63 subjects, and the third 160 subjects, following meaningful results from efficacy endpoints. Planning included at least 60 Chinese and 40 Korean subjects. The estimate at the time (sum-mer 2004) was that obtaining approval for a study in China would take at least 16 months; so the team decided to design another protocol specifically with this in mind and leave China out.
After protocol feasibility was completed, with the input of both scientific and commercial experts within the team, the final list of countries included Korea, Hong Kong, Taiwan, Thailand, France, and Greece. There were two separate investiga-tor meetings just prior to the expected study approval threshold—one in Hong Kong for the Asian countries and another in Lisbon for European—and the feedback from both was positive. The country-specific teams were well trained, motivat-ed, and ready to begin. The plan included some sites, in Greece, for example, that had never participated in a clinical trial and thus required significant support, both from local sponsor offices and from the global study manager.
After some delays in approval timelines, the initial 38 subjects were enrolled in France, Korea, and Thailand. Unfortu-nately, the approval delays were especially significant in countries with sites that were new to clinical trials and anxious to recruit subjects. Since the initial data did not meet the requirements for study continuation, the “new” sites never got the chance to enroll at all. Some damage control was applied for those sites, with a promise to be considered for the next op-portunity, although no guarantees could be made. However, the global manager was informed by the local team that the damage was done, and that the sponsor would hardly get the same dedication from those sites again.
In retrospect, there is not much that could have been done differently. The study was evaluated as a success; in reality, we have lost some good investigators’ enthusiasm and jeopardized their future collaboration.
Global Clinical Research
36 | Pharmaceutical Canada
as the telephone can hamper a team. Working globally means working in various time zones; so adapting to different time zones is essential for team success. Creating graphic images of team’s time zones can help. Also, in different time zones, Friday afternoons and Monday mornings are not the same as any other day of the week; so it is best to avoid conducting business between far-flung sites at these times. This is especially important when dialing into opposite hemispheres. Teams can show adaptability by making the calls at the inconvenient times on alternate weeks with other parts of the team, and by allowing business calls to be made from home by using phone cards. It is often useful to make separate (individual) calls and avoid teleconferences altogether, as well as to delegate the chairing of teleconferences to team members in different time zones.
It is a true challenge to create an efficient global team and to maintain its level of quality to the study’s end. By developing the skills mentioned in this article, however, and encouraging managers to think and act globally, such transnational efforts can benefit both your personnel and your profits.
BibliographyPharma 2020: The vision - which path will you take? Report by
PricewaterhouseCoopers. Bower DJ, Whittaker E. 1993. Global R&D networks: the case of the
pharmaceutical industry. Journal of Industry Studies 1: 50-64. Gray M, Parker E. 1997. Industrial change and regional development: the case
of the U.S. pharmaceutical industry. Economic Geography. Kearney AT. 2006. Make Your Move: Taking Clinical Trials to the Best Location. Kerzner H. 2006. Project Management Best Practices—Achieving Global
Excellence. John Wiley & Sons Inc. www.centerwatch.com/professional/profglst.html. www.clinicaltrials.gov. www.bbc.co.uk/worldservice/programmes/global
_business.shtm (accessed January 2008). www.economist.com/business/displaystory.cfm? story_id=10063865
(accessed January 2008). www.economist.com/finance/displaystory.cfm?s tory_id=10064744
(accessed January 2008). www.forbes.com/personalfinance/2007/11/20/e merging-mexico-brazil-pf-ii-
in_ms_1119 soapbox_inl.html (accessed January 2008). www.pharmafocusasia.com/currentedition/grow thinchina.ht (accessed
January 2008). www.pharmafocusasia.com/knowledge_bank/in dustryreports/pwcvision.ht
(accessed January 2008). www.ted.com/talks/view/id/17 (accessed January 2008). youtube.com/
watch?v=m2Vbc7ASr80&feature =relate (accessed January 2008). www.csmonitor.com (accessed January 2008). www.pharmainfo.net
(accessed January 2008). www.scidev.net (accessed January 2008). ACRP
Vinka Ljubimir has a degree in clinical psychology and extensive clinical trial experience in industry and academic research in Europe and the United States, including a complex field-based project in medical genetics for Columbia University coordinating with more than 200 psychiatrists. For the last five years, until September 2007, she had been managing global projects at Pfizer, where she worked with emerging markets like Asia, Latin America, and CEE in all phases of clinical research and specialized in recruitment. She can be reached at [email protected].
Order online at the DT website www.dissolutiontech.com
or -Tel: 302-235-0621 Fax: 443-946-1264
Credit Card payment available.Please allow 4-6 weeks for delivery. Prepayment for international required.
Hardcover, 310 pages
$175.00 US
$195.00 International
Basic theory including kinetics, dissolution from a pure solvent, dissolution from a matrix.
USP criteria, the necessity for compendial criteria, test apparatus, and acceptance criteria.
Testing equipment including lesser known methods and “unofficial” apparatus.
FutureFuture direction of international harmonization of dissolution criteria.
Effects of storage, processing, and physicochemical properties of tablets and capsules.
Dissolution of modified-release oral dosage forms, suppositories, and suspensions, including the apparatus modifications that are useful for these dosage forms.
AerosolAerosol particle dissolution with a review of respiratory tract drug delivery, pharmacokinetic implications, and the use of liposomes.
Bioequivalency and a thorough discussion of in vivo–in vitro correlations.
Dissolution as a science has matured over the last four decades. This text is the first to include all aspects of dissolution –— theory, methodology, and testing.
Extensively referenced, it is a definitive work on the topic, important to all pharmaceutical formulators and scientists.
Dissolution Theory, Methodology, and Testing
Global Clinical Research
New
s S
tan
d
Lille, France. (April, 27, 2009) – Thermo Fisher Scientific Inc., the world leader in serving science, today unveiled the new Thermo Scientific Orbitor RS at Society of Biomolecular Sciences 2009. Developed using proven technology from the well-known Thermo Scientific RapidStak and Thermo Scientific Dimension4 product lines, the Orbitor™ RS is a high-speed microplate mover offering proven, reliable performance with totally flexible plate handling. Extensive vertical reach allows multiple stacked or high density instruments to be loaded in a small footprint, and a bi-directional telescoping arm provides superior reach, improved user safety and unlimited base rotations within a 360° workspace.
For unmatched speed and throughput, the Thermo Scientific Orbitor RS accommodates any SBS plate format, from shallow to deep well, in addition to tip boxes and lids, tubes or racks. This flexibility is further supported by random or sequential plate access, and the ability to mix modes of storage as assay requirements change. Laboratory safety is maximized as the robotic arm is able to pass through the base and remain inside the rotating base while turning. With closed-loop motion control, collision detection and position recovery it is poised to become the most reliable microplate mover in its class. These combine to significantly improve speed and efficiency, enabling a compact, cost-effective solution suitable for smaller workspaces, with numerous storage options and operational flexibility for a multitude of set-ups and configurations.
The Thermo Scientific Orbitor RS expands the existing Thermo Scientific range of automated technologies for drug discovery and addresses
the demand for increased throughput, storage capacity, and operational flexibility.
Thermo Scientific is part of Thermo Fisher Scientific, the world leader in serving science.
About Thermo Fisher Scientific
Thermo Fisher Scientific Inc. (NYSE: TMO) is the world leader in serving science, enabling our customers to make the world healthier, cleaner and safer. With annual revenues of $10.5 billion, we have approximately 34,000 employees and serve over 350,000 customers within pharmaceutical and biotech companies, hospitals and clinical diagnostic labs, universities, research institutions and government agencies, as well as environmental and industrial process control settings. Serving customers through two premier brands, Thermo Scientific and Fisher Scientific, we help solve analytical challenges from routine testing to complex research and discovery. The Thermo Scientific brand represents a complete range of high-end analytical instruments as well as laboratory equipment, software, services, consumables and reagents to enable integrated laboratory workflow solutions. Fisher Scientific provides a complete portfolio of laboratory equipment, chemicals, supplies and services used in healthcare, scientific research, safety and education. Together, we offer the most convenient purchasing options to customers and continuously advance our technologies to accelerate the pace of scientific discovery, enhance value for customers and fuel growth for shareholders and employees alike. Visit www.thermofisher.com .
Thermo Fisher Scientific Introduces Unique Automated Microplate Mover at Society of Biomolecular Sciences 2009The Thermo Scientific Orbitor RS Provides Industrial Sized Performance within a Compact, Bench-Top Mover

38 | Pharmaceutical Canada
KAHR Medical and Cobra Partner to Develop Trans Signal Converter Protein ProductionKeele, UK and Jerusalem, Israel: 11 May, 2009, Cobra Biomanufacturing Plc (AIM: CBF), the international manufacturer of biopharmaceuticals, and KAHR Medical Ltd., a Hadasit-Bio-Holdings (HBL, TASE: HDST) portfolio company that develops novel drugs for the treatment of autoimmune diseases, announced today a partnership agreement.
Under the terms of the agreement, Cobra will advance KAHR Medical’s Trans Signal Converter Protein (“TSCP”) technology using Cobra’s maxXpress service and recombinant protein production expertise. More specifically, Cobra will develop and manufacture bulk quantities of KAHR’s TSCP proteins for preclinical and future clinical testing. Currently, two recombinant proteins, KAHR-101 and KAHR-102 are being tested in preclinical studies as potential treatments for rheumatoid arthritis (RA) and psoriasis. Cobra has already developed a purification process for KAHR-101 and batches have already been produced for preclinical testing.
Simon Saxby, CEO of Cobra Biomanufacturing Plc said, “We are delighted that KAHR has chosen Cobra to help develop its TSCP technology. Cobra’s maxXpress service and recombinant protein expertise enable it to provide the required tools and solutions necessary for companies looking to start on the road to clinical trials and market supply. Also, Israel has a rapidly expanding biotech industry and we are very pleased to be establishing a very good relationship there.”
Dr. Noam Shani, CEO of KAHR Medical said, “We have been working together with Cobra for about 18 months on KAHR-101 and KAHR-102 and they have done great work developing a production process for KAHR-101. We are looking forward to a long and successful association.”New
s S
tan
d


CCLASSIFIEDLASSIFIED
Subscribe towww.pharmaceuticalcanada.ca
RESERVEDFOR YOUR
BUSINESS CARD416.410.7486
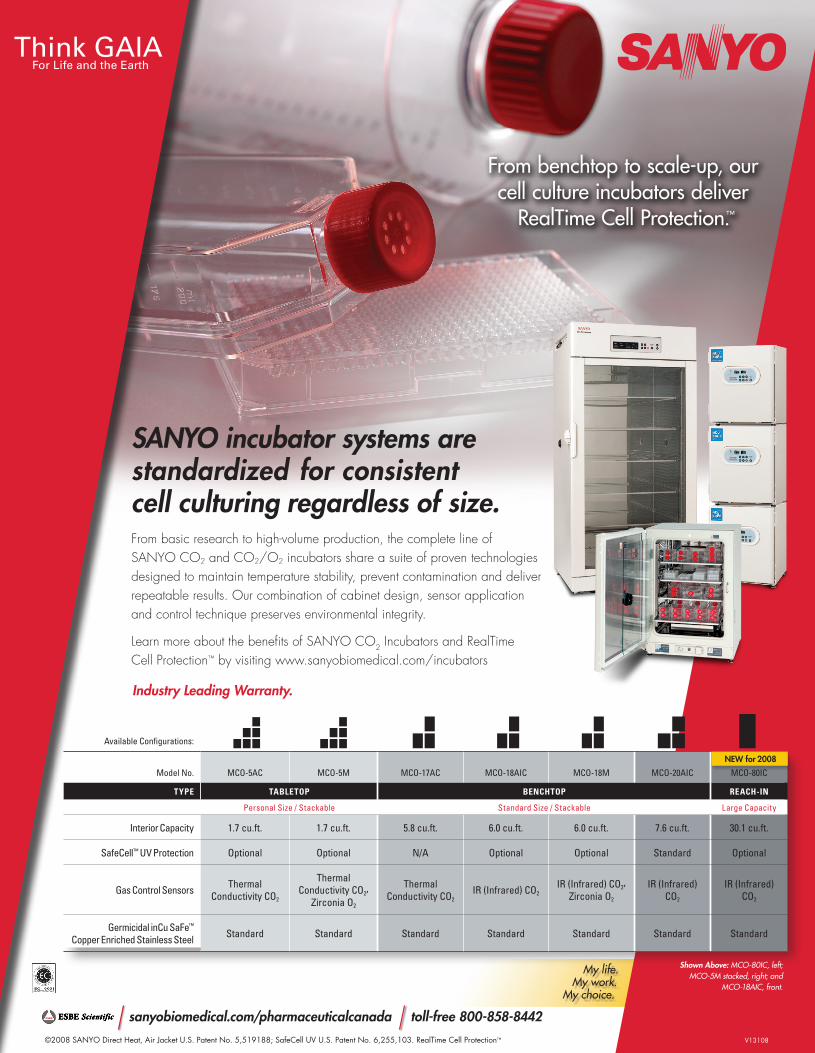
My life. My work.
My choice.
From benchtop to scale-up, our cell culture incubators deliver
RealTime Cell Protection.™
©2008 SANYO Direct Heat, Air Jacket U.S. Patent No. 5,519188; SafeCell UV U.S. Patent No. 6,255,103. RealTime Cell Protection™ V13108
From basic research to high-volume production, the complete line of SANYO CO2 and CO2/O2 incubators share a suite of proven technologies designed to maintain temperature stability, prevent contamination and deliver repeatable results. Our combination of cabinet design, sensor application and control technique preserves environmental integrity.
Learn more about the benefits of SANYO CO2 Incubators and RealTime Cell Protection™ by visiting www.sanyobiomedical.com/incubators
SANYO incubator systems are standardized for consistent cell culturing regardless of size.
Industry Leading Warranty.
Shown Above: MCO-80IC, left; MCO-5M stacked, right; and
MCO-18AIC, front.
Think GAIA For Life and the Earth
Available Configurations:
Model No. MCO-5AC MCO-5M MCO-17AC MCO-18AIC MCO-18M MCO-20AIC MCO-80IC
TYPE TABLETOP BENCHTOP REACH-IN
Personal Size / Stackable Standard Size / Stackable Large Capacity
Interior Capacity 1.7 cu.ft. 1.7 cu.ft. 5.8 cu.ft. 6.0 cu.ft. 6.0 cu.ft. 7.6 cu.ft. 30.1 cu.ft.
SafeCell™ UV Protection Optional Optional N/A Optional Optional Standard Optional
Gas Control Sensors Thermal Conductivity CO2
Thermal Conductivity CO2,
Zirconia O2
Thermal Conductivity CO2
IR (Infrared) CO2IR (Infrared) CO2,
Zirconia O2
IR (Infrared) CO2
IR (Infrared) CO2
Germicidal inCu SaFe™
Copper Enriched Stainless Steel Standard Standard Standard Standard Standard Standard Standard
NEW for 2008
sanyobiomedical.com/pharmaceuticalcanada toll-free 800-858-8442
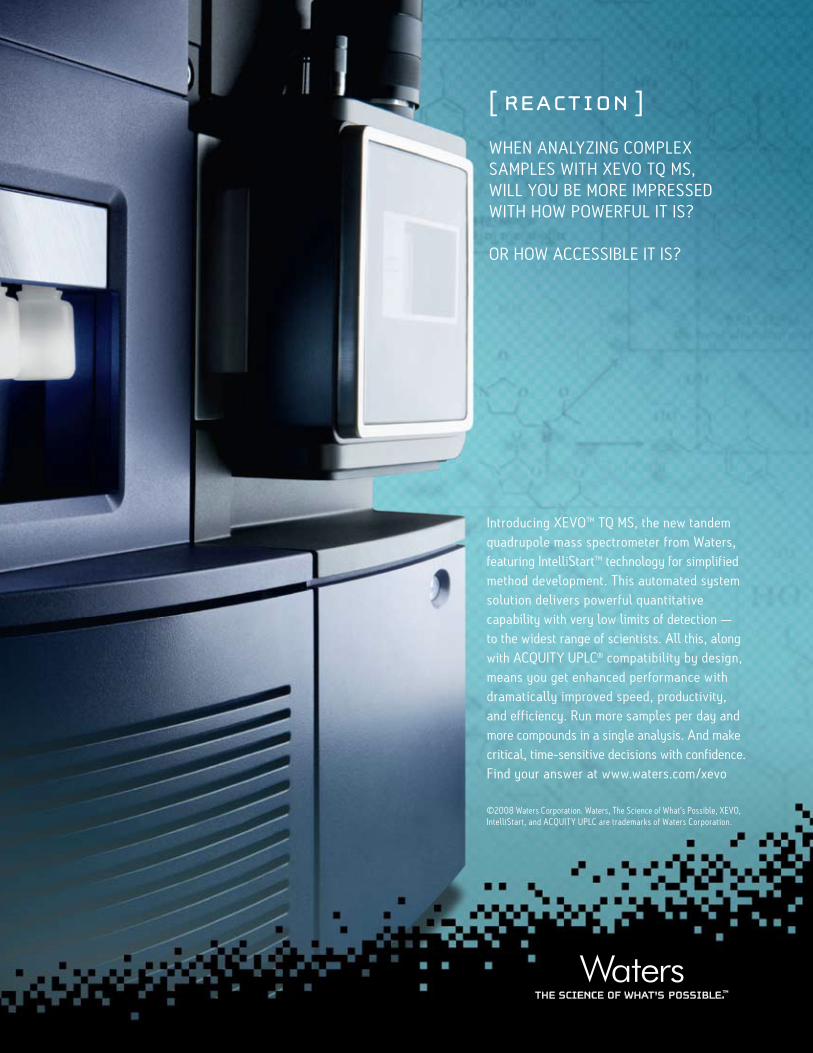
PUBS:
Pharmaceutical Canada
Job # & CC: WATR9752_I
Job Name: WATR9752_I_XevoNew_DBmec.indd Date: 08-18-08Live: 8"x10.5" Trim: 8.5"x11" Bleed: 9"x11.5" Page: 1 Rev: 1Stage: mech Release: 08-19-08 DB AD: PH CW: GK PM: DG Scale: 100%Color: 4c Gutter: — Other: ST: DB
APP
RO
VALS C-LO
MECH PROOF
MK: ______________________ PM: ______________________ AB: ______________________
AD: ______________________ CW: ______________________ RM:______________________
QC: ______________________ CD: ______________________
Initials / Date Initials / Date Initials / Date
Client / Date: ________________________________________________
©2008 Waters Corporation. Waters, The Science of What's Possible, XEVO, IntelliStart, and ACQUITY UPLC are trademarks of Waters Corporation.
Introducing XEVOTM TQ MS, the new tandem quadrupole mass spectrometer from Waters, featuring IntelliStartTM technology for simplified method development. This automated system solution delivers powerful quantitative capability with very low limits of detection —to the widest range of scientists. All this, along with ACQUITY UPLC® compatibility by design, means you get enhanced performance with dramatically improved speed, productivity, and efficiency. Run more samples per day and more compounds in a single analysis. And make critical, time-sensitive decisions with confidence. Find your answer at www.waters.com/xevo
[ REACTION ]
WHEN ANALYZING COMPLEXSAMPLES WITH XEVO TQ MS,WILL YOU BE MORE IMPRESSEDWITH HOW POWERFUL IT IS?
OR HOW ACCESSIBLE IT IS?


![Advances in Immunology, Volume 108 - The Eyethe-eye.eu/public/Books/BioMed/Advances in Immunology [Vol 108] - … · Advances in IMMUNOLOGY VOLUME 108 Edited by FREDERICK W. ALT Howard](https://img.pdfslide.net/doc/110x75/60339a24cee62008450ddd8c/advances-in-immunology-volume-108-the-eyethe-eyeeupublicbooksbiomedadvances.jpg)