Embed Size (px)
Citation preview
TVK a
nnual
reporT
20
09
annual report 2009economic, social and environmental performance
20
09
20
09
member of the mol group

content
TVK at a Glance 4 TVK at a Glance 7 Key financial and operating data 8 letter from the Chairman 10 overview of the environment
our Businesses 14 Major Strategic Goals 18 Consolidated Companies 20 our production 26 our Sales
Financial and operational performance 30 Management Discussion and analysis on the results 42 Independent auditor’s report 47 Consolidated Financial Statements 48 Supplement to the consolidated financial statement 106 Key Corporate Data
Sustainability report 112 Main results and goals 118 protecting the environment 122 Human Focus 129 our Quality Management 130 our Social Commitment 132 performance indicators
Corporate governance 138 Corporate Governance 146 Structure of organization of T VK plc. 147 Board of Directors 150 Top Management 152 Supervisory Board 154 report by the Supervisory Board 155 Corporate Information
158 Glossary of Terms 161 Shareholder Information 162 Statement of responsibility 163 questionnaire
TVK annual report 20092

Enhancing our competitive power, we can increasingly lean on the MOL Group integration synergies: the secured feedstock supply, the robust financial background and strong position in the regional markets, together with the competitive products from the optimized production capacities. We pay particular attention to the continuous improvement of our product quality and customer portfolio, which - along with the cost cutting actions - can guarantee the efficient operation for the forthcoming years.
In our sales and marketing activity we intend to strengthen our position in Central-Eastern Europe that is core region for MOL as well. Along the rapid growth potential anticipated in regional polyolefin demand, the attractiveness of proximate markets can be derived from the outstanding knowledge of specific economic and infrastructural characteristics in the region, from logistic advantages and the potential to build strategic customer relationships. Beyond the production of high quality products, our most relevant competitive advantages are sales and marketing services, customer care and support as well as production facilities that provide permanent supply.We lay particular emphasis on better understanding of customer requirements and building stable business relations in order to improve a sustainable business model and to mitigate commercial risks in addition.
The performance of well prepared and committed professional staff can guarantee the sustainability of business development. We continue development in the fields of environmental protection, social responsibility and attitude of business ethics, which can provide firm basis to our business operation. We take an active part in chemical industry associations and in professional preparatory works of regulations in the European Union.
Mission
Our company offers petrochemical products of excellent quality and high level services to its customers. Our products are fundamental for a wide range of industrial applications and for production of a vast number of consumer goods that are essential to everyday life and provide more comfort and plenitude in people life. Continuous improvement and quality management in the widest sense are the essential parts of our business philosophy.
In Hungary TVK plays important role in health promotion, talent management and education development. Our aim is to build long term relationship with organizations achieving outstanding result in culture development.As member of the MOL Group, we conduce to enhance competitiveness and profitability in the refining sector and as well we can mutually mitigate each other risk profile.
Core values
In the course of completing our mission we coherently apply our core values:• We committed to responsibly stand up for health,
safety and our natural environment protection.• Our operation is competitive and value creating.
Our business moves are based on mutually beneficial, long term and fair business relations, where we consistently keep our ethical norms.
• Quality consciousness, endeavor to operational excellence and the innovative approach are immersing our day-to-day operation. Accordingly our highly qualified, creative and motivated employees can participate in shaping the future of our company. This active contribution comes from open and cooperative atmosphere and corporate culture that respects for personal, local and national characteristics.
Our corporate vision, which also reflects the outlines of our core values, takes shape in an awareness of our business environment, resources and capabilities.
Vision
We are to retain our leadership in the regional petrochemical industry by continuously developing our operating efficiency and the competitiveness of our assets. As the leading regional polyolefin producer, we are committed to pursue our activities according to the business philosophies of continuous development and operational excellence. Optimized in line with customer requirements, our high quality portfolio of products provide a firm basis for exploiting the opportunities arising from the surge of demand for polyolefins in Central Europe, which we couple with building on the advantages, emanating from strategic partnerships based on mutual benefits. Our corporate social responsibility guarantees that we are creating value for all stakeholders of our operation.
our core lines of business
We supply mainly European plastic converter companies with polyolefin products. Beyond our main profile, we sell olefins and other petrochemical co-products to regional chemical and oil companies, so to MOL as well. Our core activity includes two major production lines:
• Olefin production: the production and wholesale distribution of ethylene, propylene and other co-products from olefin production. Our petrochemical feedstock is supplied by MOL Refining and we sell olefin co-products to MOL refineries to the amounts of approximately one third of feedstock.
• Polyolefin production: includes the production and wholesale distribution of low and high density polyethylenes (LDPE, unimodal and bimodal HDPE) and polypropylenes (PP copolymer and homogeneous polymer).
We supply our partners with polyolefin products via proprietary sales network. TVK operates 100% owned sales subsidiaries in five countries – Germany, Poland, Italy, France and Ukraine. Above all our sales activity is also conducted through MOL subsidiaries in Austria and Romania. Sales as well as customer support in technical issues to the key accounts and on other markets are managed from TVK and SPC. We supply feedstock especially to European small and medium sized plastic converters, although our sales are active in more than 50 countries of the World.
our major goals – competitiveness, efficiency, profitability
Our prime objective is the retention of our petrochemical leadership in the Central European polyolefin markets where we see demand growth perspectives are to exceed the European average.
TVK at a Glance
Tisza Chemical Group Public Limited Company (hereinafter TVK Plc. or TVK), located in Tiszaújváros - is the largest chemical company in Hungary and by sales revenue it is the 18th largest Hungarian enterprise.
Along with Slovnaft Petrochemicals, s.r.o. (hereinafter SPC) - fully owned by Slovnaft, a.s. in Bratislava - TVK is composing the Petrochemical Division in the MOL Group, which holds leading position in petrochemical sector in the Central-Eastern Europe and one of the ten largest polyolefin producers in Europe. TVK and its Slovakian partner, SPC are operated in integrated manner, benefiting from joint optimization of production and integrated polyolefin sales. TVK has more than four decade experience in producing commodity polyolefins in competitive quality for the plastics processing industry, which products are fundamental for a wide range of industrial application and for the production of a huge number of consumer goods that are essential to our everyday lives.
TVK shares are listed and traded on the Budapest Stock Exchange and on the International Order Book of the London Stock Exchange.
TVK annual report 20094 5TVK aT a GlanCe
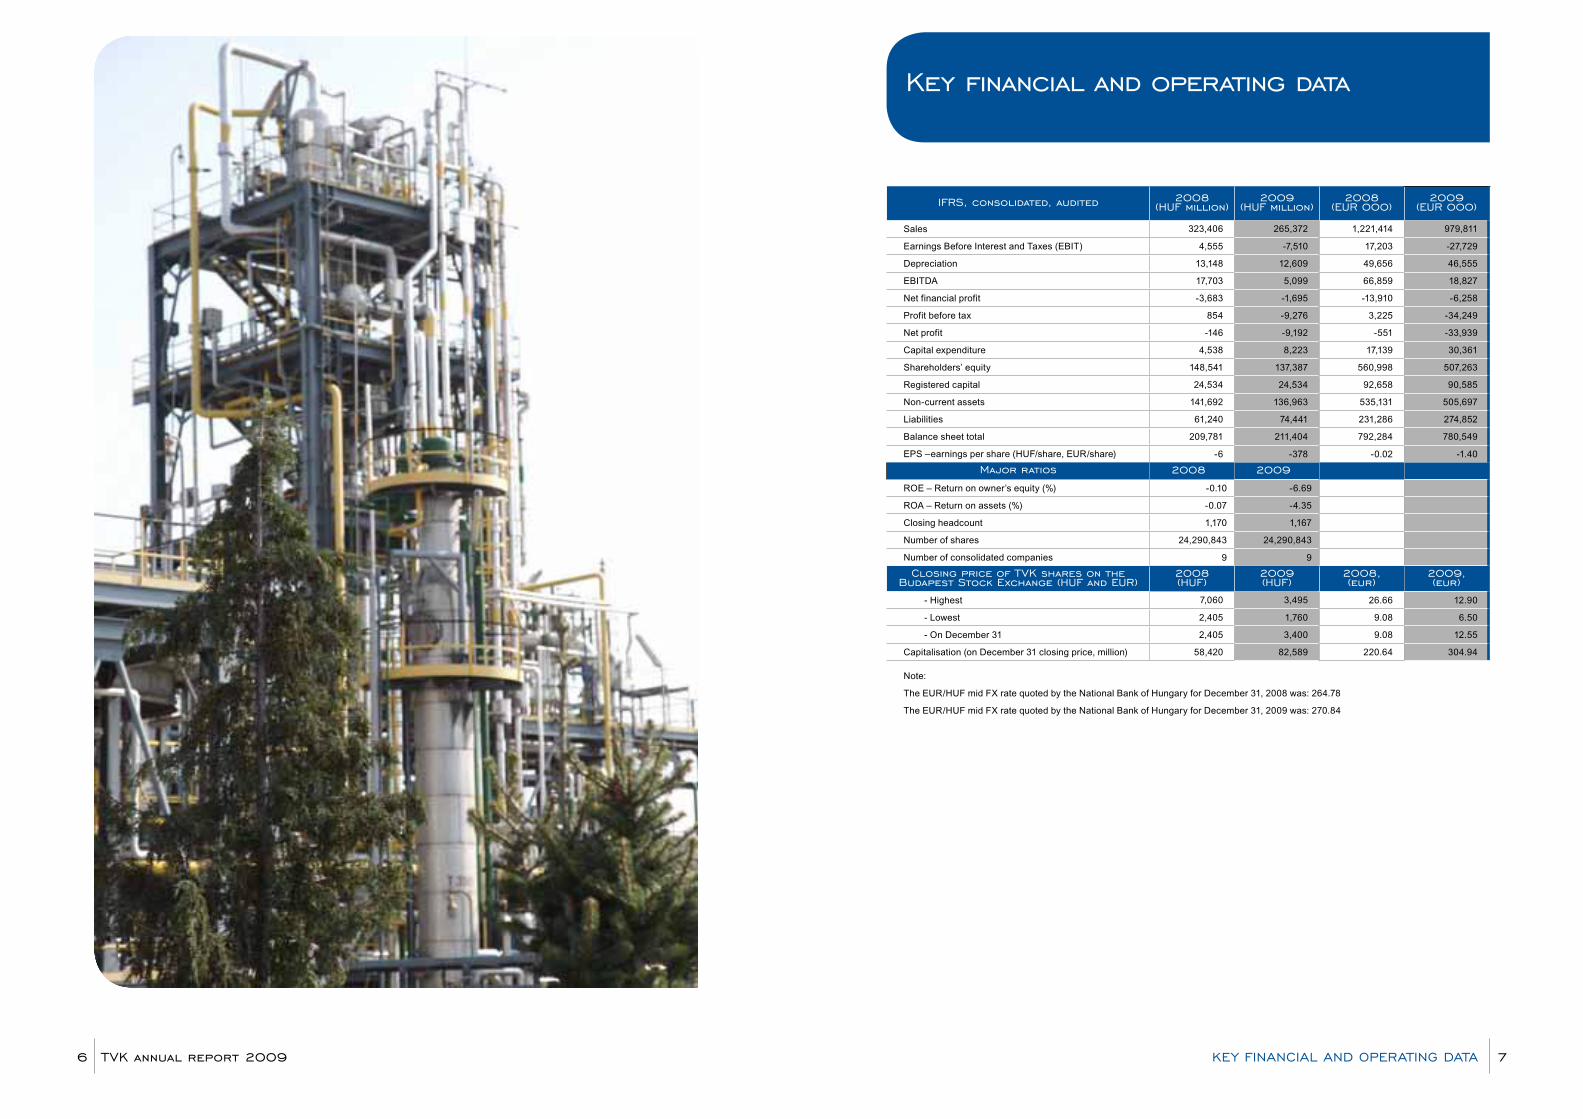
Key financial and operating data
IFrS, consolidated, audited 2008 (HuF million)
2009 (HuF million)
2008 (eur 000)
2009 (eur 000)
Sales 323,406 265,372 1,221,414 979,811
Earnings Before Interest and Taxes (EBIT) 4,555 -7,510 17,203 -27,729
Depreciation 13,148 12,609 49,656 46,555
EBITDA 17,703 5,099 66,859 18,827
Net financial profit -3,683 -1,695 -13,910 -6,258
Profit before tax 854 -9,276 3,225 -34,249
Net profit -146 -9,192 -551 -33,939
Capital expenditure 4,538 8,223 17,139 30,361
Shareholders’ equity 148,541 137,387 560,998 507,263
Registered capital 24,534 24,534 92,658 90,585
Non-current assets 141,692 136,963 535,131 505,697
Liabilities 61,240 74,441 231,286 274,852
Balance sheet total 209,781 211,404 792,284 780,549
EPS –earnings per share (HUF/share, EUR/share) -6 -378 -0.02 -1.40
Major ratios 2008 2009
ROE – Return on owner’s equity (%) -0.10 -6.69
ROA – Return on assets (%) -0.07 -4.35
Closing headcount 1,170 1,167
Number of shares 24,290,843 24,290,843
Number of consolidated companies 9 9
Closing price of TVK shares on the Budapest Stock exchange (HuF and eur)
2008 (HuF)
2009 (HuF)
2008,(eur)
2009,(eur)
- Highest 7,060 3,495 26.66 12.90
- Lowest 2,405 1,760 9.08 6.50
- On December 31 2,405 3,400 9.08 12.55
Capitalisation (on December 31 closing price, million) 58,420 82,589 220.64 304.94
Note:
The EUR/HUF mid FX rate quoted by the National Bank of Hungary for December 31, 2008 was: 264.78
The EUR/HUF mid FX rate quoted by the National Bank of Hungary for December 31, 2009 was: 270.84
TVK annual report 20096 7Key FInanCIal anD operaTInG DaTa
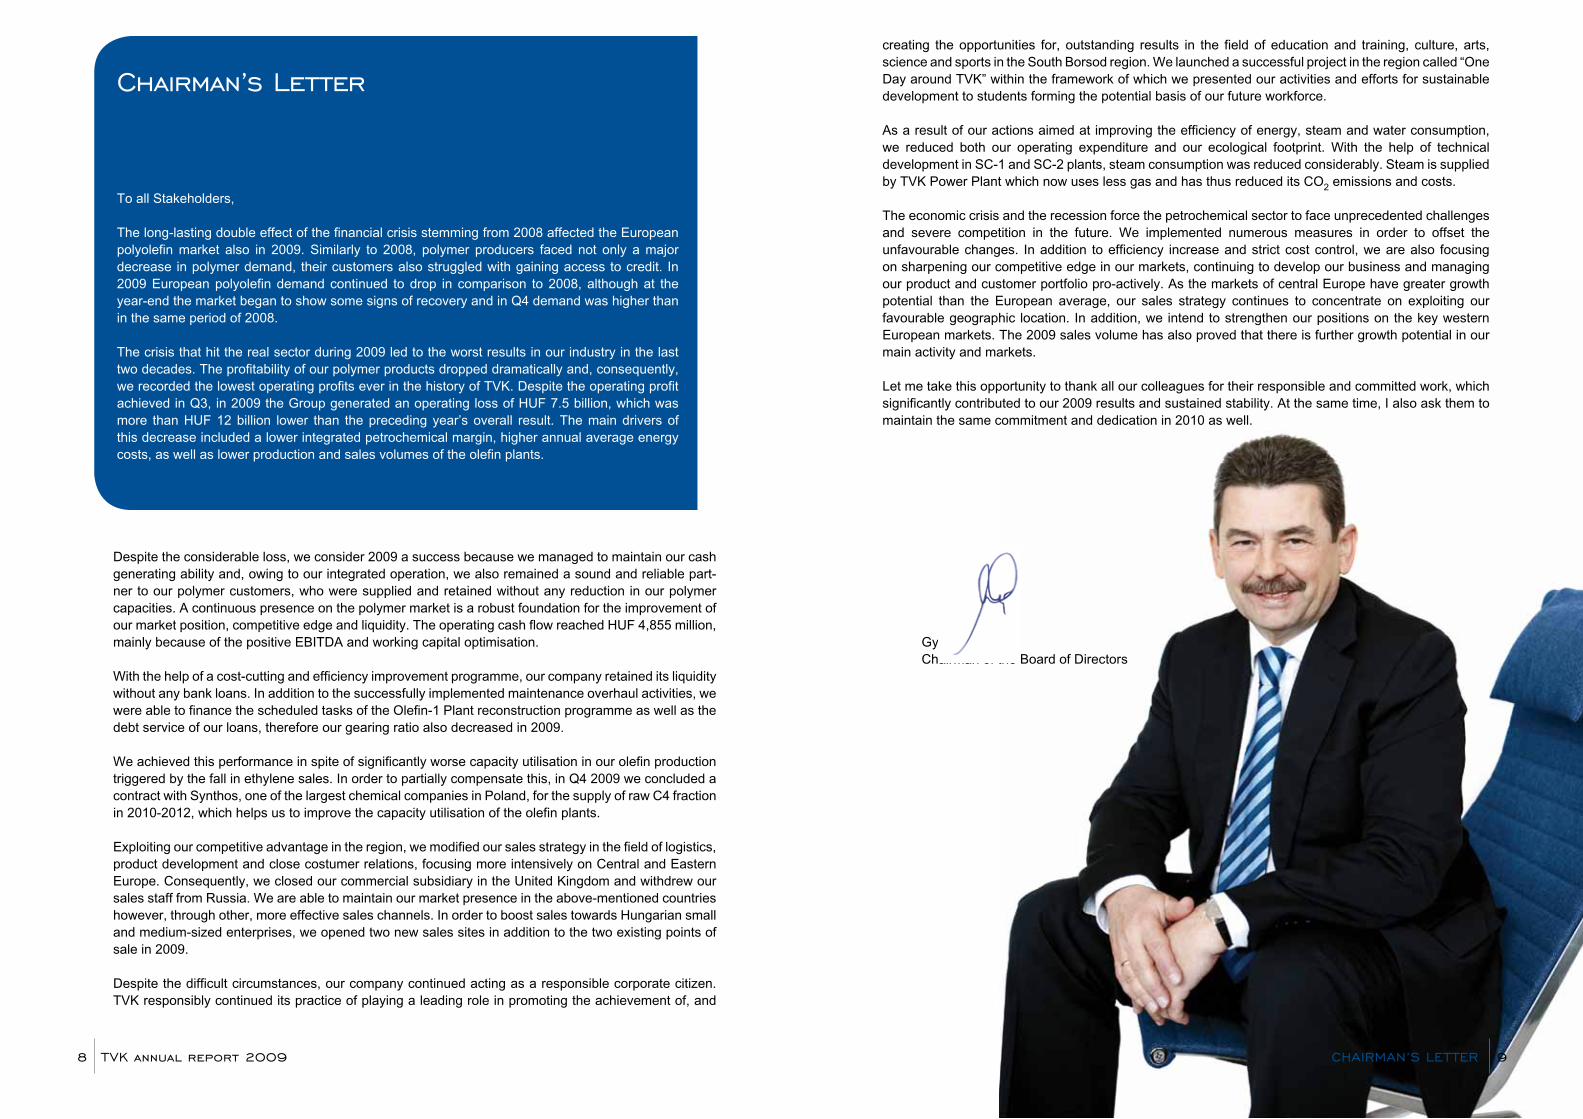
Chairman’s letter
To all Stakeholders,
The long-lasting double effect of the financial crisis stemming from 2008 affected the European polyolefin market also in 2009. Similarly to 2008, polymer producers faced not only a major decrease in polymer demand, their customers also struggled with gaining access to credit. In 2009 European polyolefin demand continued to drop in comparison to 2008, although at the year-end the market began to show some signs of recovery and in Q4 demand was higher than in the same period of 2008.
The crisis that hit the real sector during 2009 led to the worst results in our industry in the last two decades. The profitability of our polymer products dropped dramatically and, consequently, we recorded the lowest operating profits ever in the history of TVK. Despite the operating profit achieved in Q3, in 2009 the Group generated an operating loss of HUF 7.5 billion, which was more than HUF 12 billion lower than the preceding year’s overall result. The main drivers of this decrease included a lower integrated petrochemical margin, higher annual average energy costs, as well as lower production and sales volumes of the olefin plants.
Despite the considerable loss, we consider 2009 a success because we managed to maintain our cash generating ability and, owing to our integrated operation, we also remained a sound and reliable part-ner to our polymer customers, who were supplied and retained without any reduction in our polymer capacities. A continuous presence on the polymer market is a robust foundation for the improvement of our market position, competitive edge and liquidity. The operating cash flow reached HUF 4,855 million, mainly because of the positive EBITDA and working capital optimisation.
With the help of a cost-cutting and efficiency improvement programme, our company retained its liquidity without any bank loans. In addition to the successfully implemented maintenance overhaul activities, we were able to finance the scheduled tasks of the Olefin-1 Plant reconstruction programme as well as the debt service of our loans, therefore our gearing ratio also decreased in 2009.
We achieved this performance in spite of significantly worse capacity utilisation in our olefin production triggered by the fall in ethylene sales. In order to partially compensate this, in Q4 2009 we concluded a contract with Synthos, one of the largest chemical companies in Poland, for the supply of raw C4 fraction in 2010-2012, which helps us to improve the capacity utilisation of the olefin plants.
Exploiting our competitive advantage in the region, we modified our sales strategy in the field of logistics, product development and close costumer relations, focusing more intensively on Central and Eastern Europe. Consequently, we closed our commercial subsidiary in the United Kingdom and withdrew our sales staff from Russia. We are able to maintain our market presence in the above-mentioned countries however, through other, more effective sales channels. In order to boost sales towards Hungarian small and medium-sized enterprises, we opened two new sales sites in addition to the two existing points of sale in 2009.
Despite the difficult circumstances, our company continued acting as a responsible corporate citizen. TVK responsibly continued its practice of playing a leading role in promoting the achievement of, and
György MosonyiChairman of the Board of Directors
creating the opportunities for, outstanding results in the field of education and training, culture, arts, science and sports in the South Borsod region. We launched a successful project in the region called “One Day around TVK” within the framework of which we presented our activities and efforts for sustainable development to students forming the potential basis of our future workforce.
As a result of our actions aimed at improving the efficiency of energy, steam and water consumption, we reduced both our operating expenditure and our ecological footprint. With the help of technical development in SC-1 and SC-2 plants, steam consumption was reduced considerably. Steam is supplied by TVK Power Plant which now uses less gas and has thus reduced its CO2 emissions and costs.
The economic crisis and the recession force the petrochemical sector to face unprecedented challenges and severe competition in the future. We implemented numerous measures in order to offset the unfavourable changes. In addition to efficiency increase and strict cost control, we are also focusing on sharpening our competitive edge in our markets, continuing to develop our business and managing our product and customer portfolio pro-actively. As the markets of central Europe have greater growth potential than the European average, our sales strategy continues to concentrate on exploiting our favourable geographic location. In addition, we intend to strengthen our positions on the key western European markets. The 2009 sales volume has also proved that there is further growth potential in our main activity and markets.
Let me take this opportunity to thank all our colleagues for their responsible and committed work, which significantly contributed to our 2009 results and sustained stability. At the same time, I also ask them to maintain the same commitment and dedication in 2010 as well.
TVK annual report 20098 9CHaIrMan’S leTTer
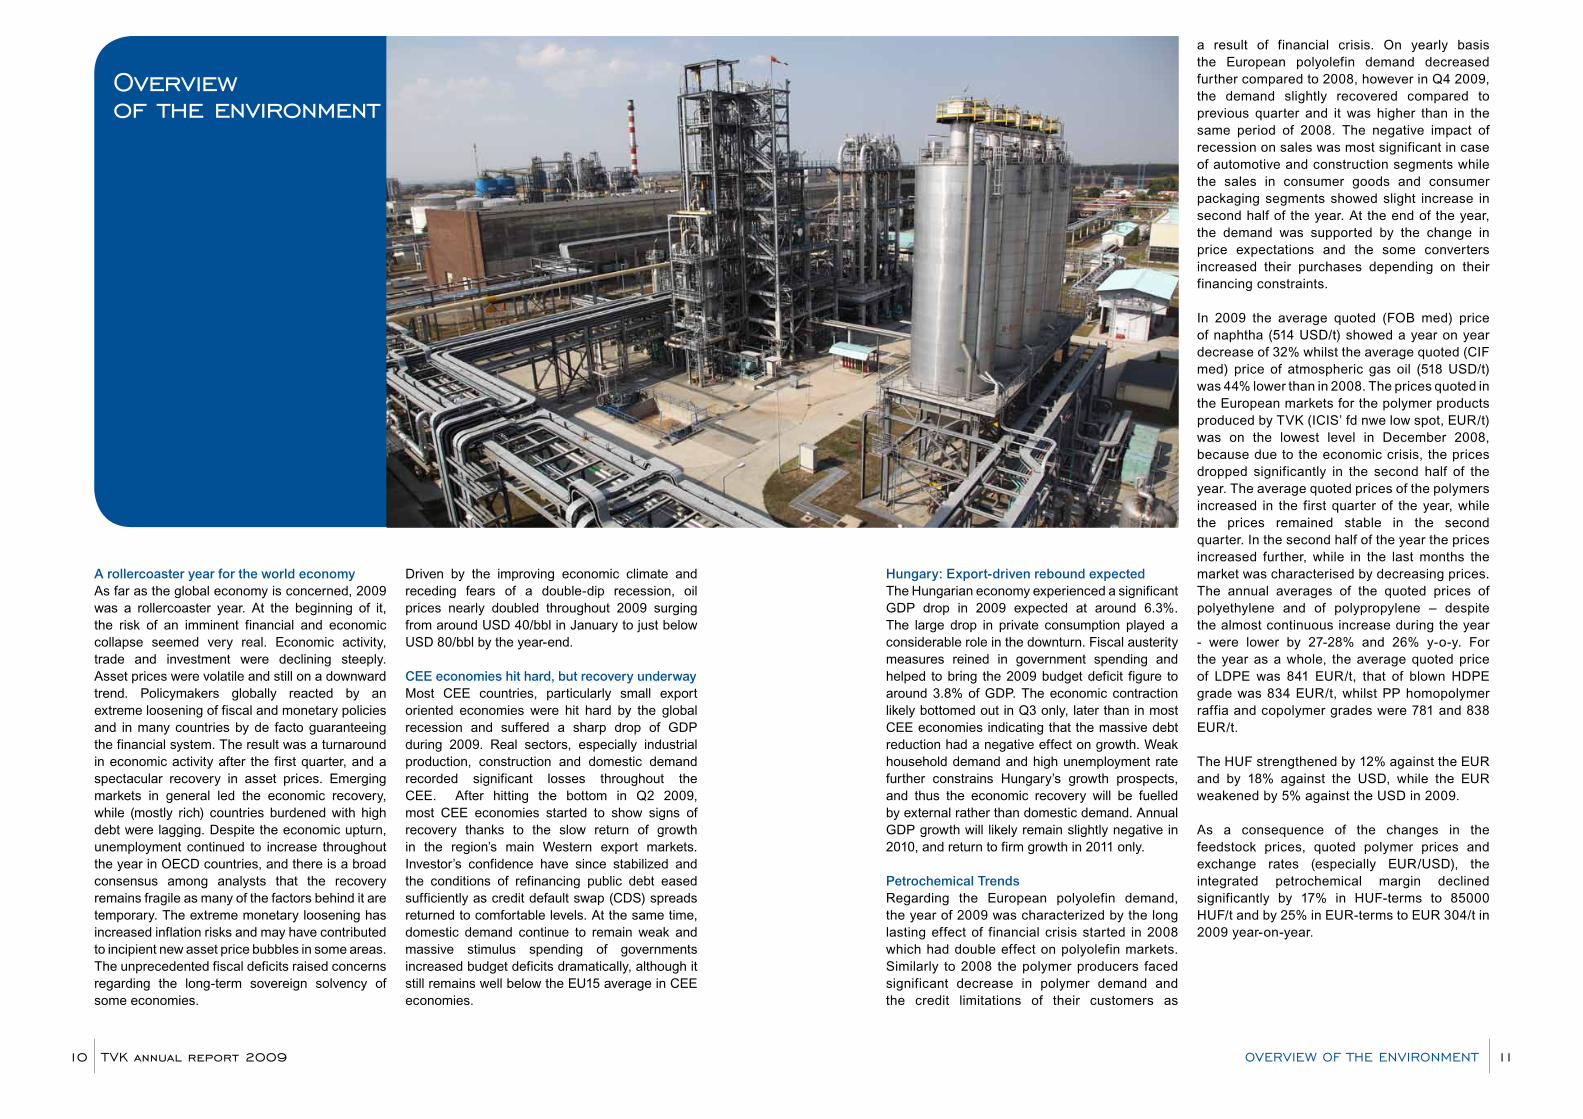
A rollercoaster year for the world economyAs far as the global economy is concerned, 2009 was a rollercoaster year. At the beginning of it, the risk of an imminent financial and economic collapse seemed very real. Economic activity, trade and investment were declining steeply. Asset prices were volatile and still on a downward trend. Policymakers globally reacted by an extreme loosening of fiscal and monetary policies and in many countries by de facto guaranteeing the financial system. The result was a turnaround in economic activity after the first quarter, and a spectacular recovery in asset prices. Emerging markets in general led the economic recovery, while (mostly rich) countries burdened with high debt were lagging. Despite the economic upturn, unemployment continued to increase throughout the year in OECD countries, and there is a broad consensus among analysts that the recovery remains fragile as many of the factors behind it are temporary. The extreme monetary loosening has increased inflation risks and may have contributed to incipient new asset price bubbles in some areas. The unprecedented fiscal deficits raised concerns regarding the long-term sovereign solvency of some economies.
Driven by the improving economic climate and receding fears of a double-dip recession, oil prices nearly doubled throughout 2009 surging from around USD 40/bbl in January to just below USD 80/bbl by the year-end.
CEE economies hit hard, but recovery underwayMost CEE countries, particularly small export oriented economies were hit hard by the global recession and suffered a sharp drop of GDP during 2009. Real sectors, especially industrial production, construction and domestic demand recorded significant losses throughout the CEE. After hitting the bottom in Q2 2009, most CEE economies started to show signs of recovery thanks to the slow return of growth in the region’s main Western export markets. Investor’s confidence have since stabilized and the conditions of refinancing public debt eased sufficiently as credit default swap (CDS) spreads returned to comfortable levels. At the same time, domestic demand continue to remain weak and massive stimulus spending of governments increased budget deficits dramatically, although it still remains well below the EU15 average in CEE economies.
overview of the environment
Hungary: Export-driven rebound expectedThe Hungarian economy experienced a significant GDP drop in 2009 expected at around 6.3%. The large drop in private consumption played a considerable role in the downturn. Fiscal austerity measures reined in government spending and helped to bring the 2009 budget deficit figure to around 3.8% of GDP. The economic contraction likely bottomed out in Q3 only, later than in most CEE economies indicating that the massive debt reduction had a negative effect on growth. Weak household demand and high unemployment rate further constrains Hungary’s growth prospects, and thus the economic recovery will be fuelled by external rather than domestic demand. Annual GDP growth will likely remain slightly negative in 2010, and return to firm growth in 2011 only.
Petrochemical TrendsRegarding the European polyolefin demand, the year of 2009 was characterized by the long lasting effect of financial crisis started in 2008 which had double effect on polyolefin markets. Similarly to 2008 the polymer producers faced significant decrease in polymer demand and the credit limitations of their customers as
a result of financial crisis. On yearly basis the European polyolefin demand decreased further compared to 2008, however in Q4 2009, the demand slightly recovered compared to previous quarter and it was higher than in the same period of 2008. The negative impact of recession on sales was most significant in case of automotive and construction segments while the sales in consumer goods and consumer packaging segments showed slight increase in second half of the year. At the end of the year, the demand was supported by the change in price expectations and the some converters increased their purchases depending on their financing constraints.
In 2009 the average quoted (FOB med) price of naphtha (514 USD/t) showed a year on year decrease of 32% whilst the average quoted (CIF med) price of atmospheric gas oil (518 USD/t) was 44% lower than in 2008. The prices quoted in the European markets for the polymer products produced by TVK (ICIS’ fd nwe low spot, EUR/t) was on the lowest level in December 2008, because due to the economic crisis, the prices dropped significantly in the second half of the year. The average quoted prices of the polymers increased in the first quarter of the year, while the prices remained stable in the second quarter. In the second half of the year the prices increased further, while in the last months the market was characterised by decreasing prices. The annual averages of the quoted prices of polyethylene and of polypropylene – despite the almost continuous increase during the year - were lower by 27-28% and 26% y-o-y. For the year as a whole, the average quoted price of LDPE was 841 EUR/t, that of blown HDPE grade was 834 EUR/t, whilst PP homopolymer raffia and copolymer grades were 781 and 838 EUR/t.
The HUF strengthened by 12% against the EUR and by 18% against the USD, while the EUR weakened by 5% against the USD in 2009.
As a consequence of the changes in the feedstock prices, quoted polymer prices and exchange rates (especially EUR/USD), the integrated petrochemical margin declined significantly by 17% in HUF-terms to 85000 HUF/t and by 25% in EUR-terms to EUR 304/t in 2009 year-on-year.
TVK annual report 200910 11oVerVIew oF THe enVIronMenT
“we could permanently supply our cus-tomers without relevant capacity cut and generating profit for the Group, while our european competitors cut capacities and shut down plants, due to poor prof-itability and weak demand”
our businesses TVK annual report 200912
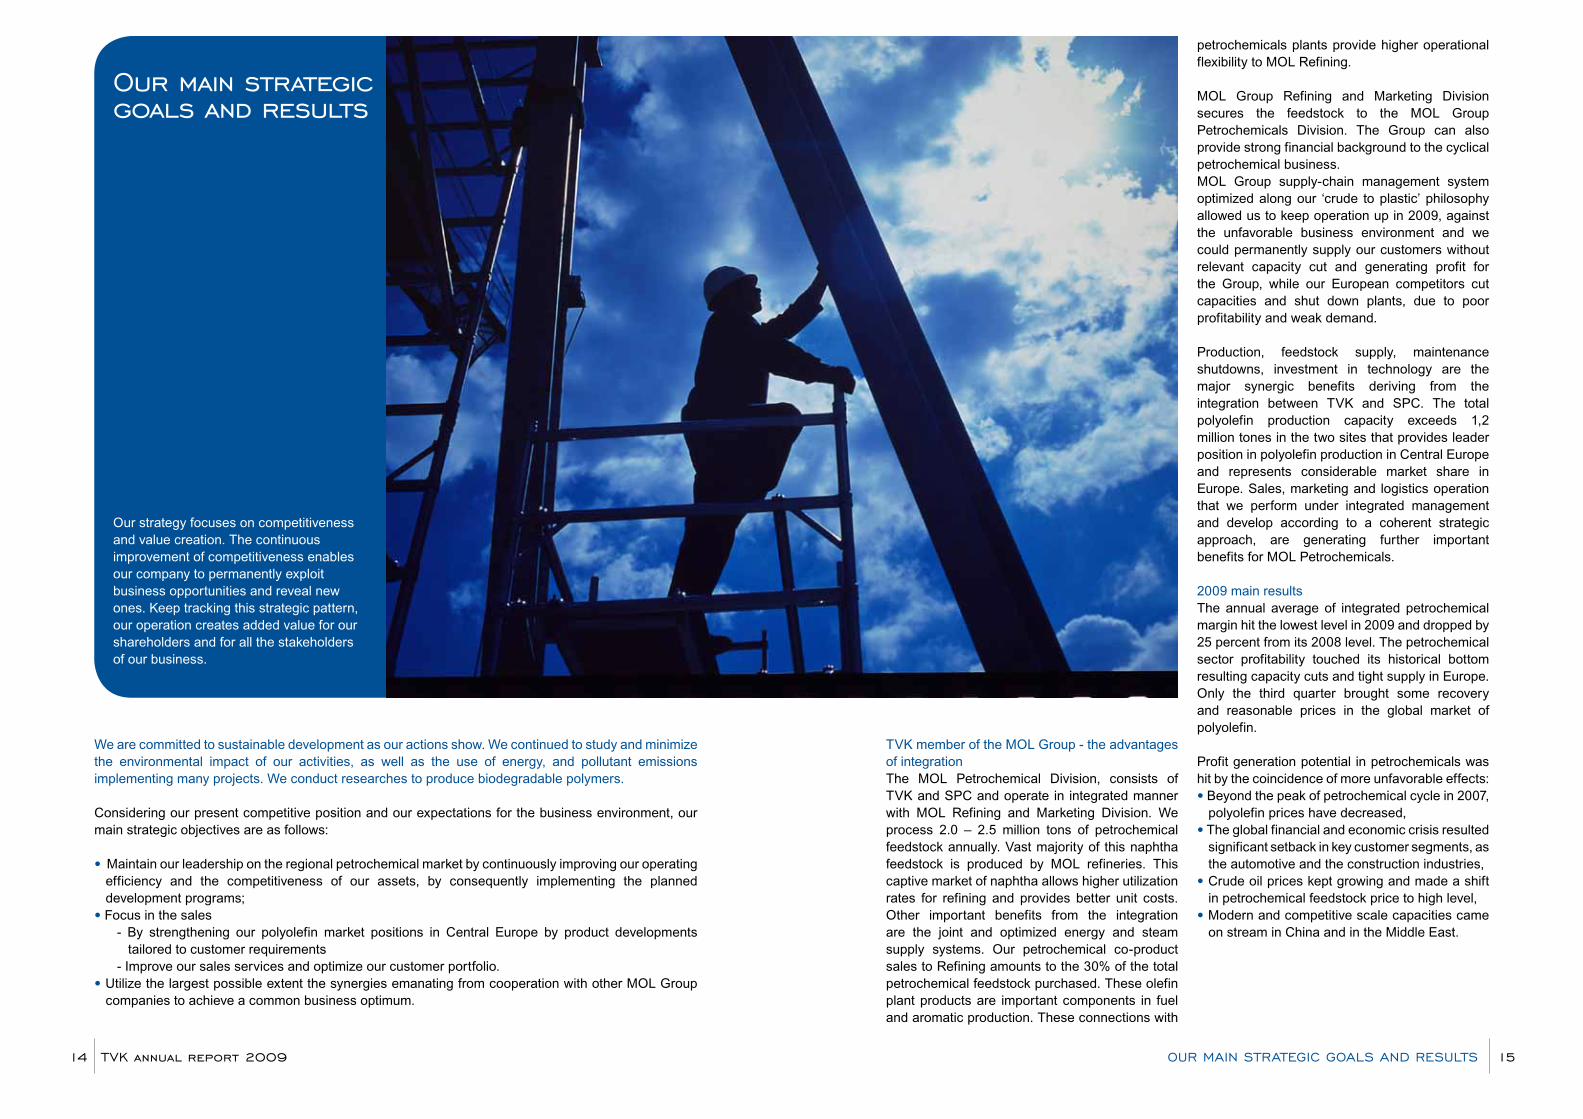
TVK member of the MOL Group - the advantages of integration The MOL Petrochemical Division, consists of TVK and SPC and operate in integrated manner with MOL Refining and Marketing Division. We process 2.0 – 2.5 million tons of petrochemical feedstock annually. Vast majority of this naphtha feedstock is produced by MOL refineries. This captive market of naphtha allows higher utilization rates for refining and provides better unit costs. Other important benefits from the integration are the joint and optimized energy and steam supply systems. Our petrochemical co-product sales to Refining amounts to the 30% of the total petrochemical feedstock purchased. These olefin plant products are important components in fuel and aromatic production. These connections with
petrochemicals plants provide higher operational flexibility to MOL Refining.
MOL Group Refining and Marketing Division secures the feedstock to the MOL Group Petrochemicals Division. The Group can also provide strong financial background to the cyclical petrochemical business.MOL Group supply-chain management system optimized along our ‘crude to plastic’ philosophy allowed us to keep operation up in 2009, against the unfavorable business environment and we could permanently supply our customers without relevant capacity cut and generating profit for the Group, while our European competitors cut capacities and shut down plants, due to poor profitability and weak demand.
Production, feedstock supply, maintenance shutdowns, investment in technology are the major synergic benefits deriving from the integration between TVK and SPC. The total polyolefin production capacity exceeds 1,2 million tones in the two sites that provides leader position in polyolefin production in Central Europe and represents considerable market share in Europe. Sales, marketing and logistics operation that we perform under integrated management and develop according to a coherent strategic approach, are generating further important benefits for MOL Petrochemicals.
2009 main resultsThe annual average of integrated petrochemical margin hit the lowest level in 2009 and dropped by 25 percent from its 2008 level. The petrochemical sector profitability touched its historical bottom resulting capacity cuts and tight supply in Europe. Only the third quarter brought some recovery and reasonable prices in the global market of polyolefin.
Profit generation potential in petrochemicals was hit by the coincidence of more unfavorable effects:• Beyond the peak of petrochemical cycle in 2007,
polyolefin prices have decreased,• The global financial and economic crisis resulted
significant setback in key customer segments, as the automotive and the construction industries,
• Crude oil prices kept growing and made a shift in petrochemical feedstock price to high level,
• Modern and competitive scale capacities came on stream in China and in the Middle East.
our main strategic goals and results
Our strategy focuses on competitiveness and value creation. The continuous improvement of competitiveness enables our company to permanently exploit business opportunities and reveal new ones. Keep tracking this strategic pattern, our operation creates added value for our shareholders and for all the stakeholders of our business.
We are committed to sustainable development as our actions show. We continued to study and minimize the environmental impact of our activities, as well as the use of energy, and pollutant emissions implementing many projects. We conduct researches to produce biodegradable polymers. Considering our present competitive position and our expectations for the business environment, our main strategic objectives are as follows:
• Maintain our leadership on the regional petrochemical market by continuously improving our operating efficiency and the competitiveness of our assets, by consequently implementing the planned development programs;
• Focus in the sales - By strengthening our polyolefin market positions in Central Europe by product developments
tailored to customer requirements - Improve our sales services and optimize our customer portfolio.• Utilize the largest possible extent the synergies emanating from cooperation with other MOL Group
companies to achieve a common business optimum.
TVK annual report 200914 15our MaIn STraTeGIC GoalS anD reSulTS
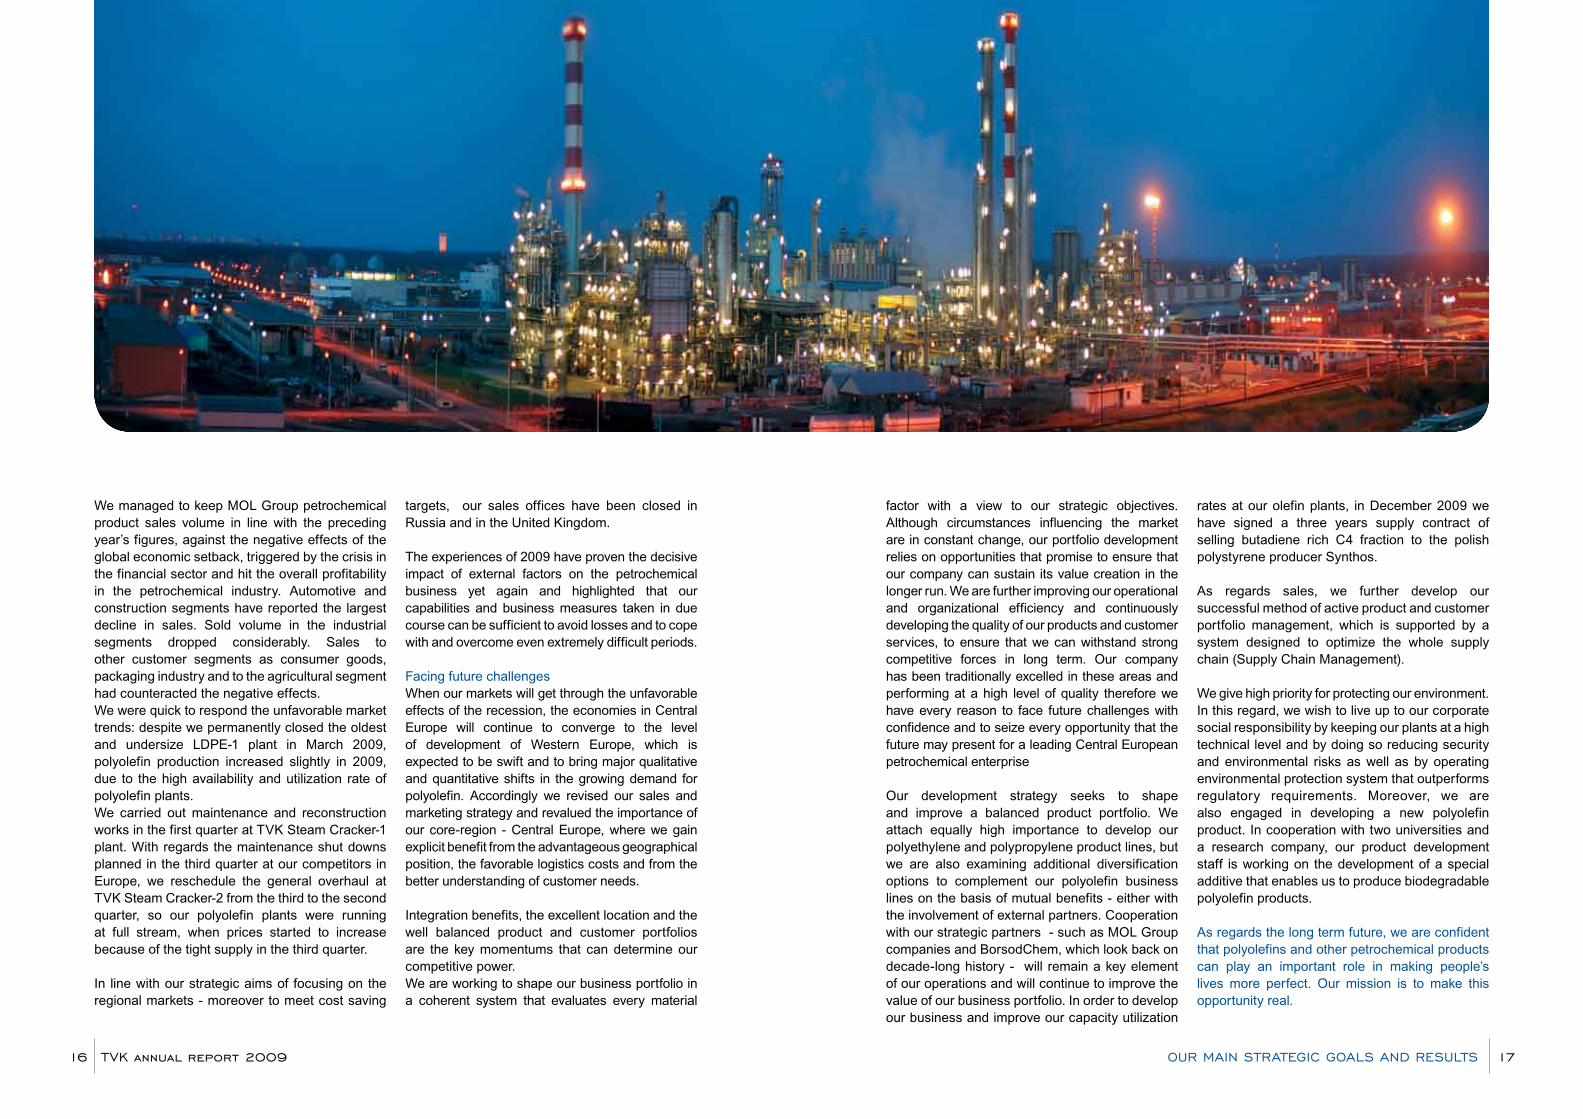
We managed to keep MOL Group petrochemical product sales volume in line with the preceding year’s figures, against the negative effects of the global economic setback, triggered by the crisis in the financial sector and hit the overall profitability in the petrochemical industry. Automotive and construction segments have reported the largest decline in sales. Sold volume in the industrial segments dropped considerably. Sales to other customer segments as consumer goods, packaging industry and to the agricultural segment had counteracted the negative effects.We were quick to respond the unfavorable market trends: despite we permanently closed the oldest and undersize LDPE-1 plant in March 2009, polyolefin production increased slightly in 2009, due to the high availability and utilization rate of polyolefin plants.We carried out maintenance and reconstruction works in the first quarter at TVK Steam Cracker-1 plant. With regards the maintenance shut downs planned in the third quarter at our competitors in Europe, we reschedule the general overhaul at TVK Steam Cracker-2 from the third to the second quarter, so our polyolefin plants were running at full stream, when prices started to increase because of the tight supply in the third quarter.
In line with our strategic aims of focusing on the regional markets - moreover to meet cost saving
targets, our sales offices have been closed in Russia and in the United Kingdom.
The experiences of 2009 have proven the decisive impact of external factors on the petrochemical business yet again and highlighted that our capabilities and business measures taken in due course can be sufficient to avoid losses and to cope with and overcome even extremely difficult periods.
Facing future challengesWhen our markets will get through the unfavorable effects of the recession, the economies in Central Europe will continue to converge to the level of development of Western Europe, which is expected to be swift and to bring major qualitative and quantitative shifts in the growing demand for polyolefin. Accordingly we revised our sales and marketing strategy and revalued the importance of our core-region - Central Europe, where we gain explicit benefit from the advantageous geographical position, the favorable logistics costs and from the better understanding of customer needs.
Integration benefits, the excellent location and the well balanced product and customer portfolios are the key momentums that can determine our competitive power.We are working to shape our business portfolio in a coherent system that evaluates every material
factor with a view to our strategic objectives. Although circumstances influencing the market are in constant change, our portfolio development relies on opportunities that promise to ensure that our company can sustain its value creation in the longer run. We are further improving our operational and organizational efficiency and continuously developing the quality of our products and customer services, to ensure that we can withstand strong competitive forces in long term. Our company has been traditionally excelled in these areas and performing at a high level of quality therefore we have every reason to face future challenges with confidence and to seize every opportunity that the future may present for a leading Central European petrochemical enterprise
Our development strategy seeks to shape and improve a balanced product portfolio. We attach equally high importance to develop our polyethylene and polypropylene product lines, but we are also examining additional diversification options to complement our polyolefin business lines on the basis of mutual benefits - either with the involvement of external partners. Cooperation with our strategic partners - such as MOL Group companies and BorsodChem, which look back on decade-long history - will remain a key element of our operations and will continue to improve the value of our business portfolio. In order to develop our business and improve our capacity utilization
rates at our olefin plants, in December 2009 we have signed a three years supply contract of selling butadiene rich C4 fraction to the polish polystyrene producer Synthos.
As regards sales, we further develop our successful method of active product and customer portfolio management, which is supported by a system designed to optimize the whole supply chain (Supply Chain Management).
We give high priority for protecting our environment. In this regard, we wish to live up to our corporate social responsibility by keeping our plants at a high technical level and by doing so reducing security and environmental risks as well as by operating environmental protection system that outperforms regulatory requirements. Moreover, we are also engaged in developing a new polyolefin product. In cooperation with two universities and a research company, our product development staff is working on the development of a special additive that enables us to produce biodegradable polyolefin products.
As regards the long term future, we are confident that polyolefins and other petrochemical products can play an important role in making people’s lives more perfect. Our mission is to make this opportunity real.
TVK annual report 200916 17our MaIn STraTeGIC GoalS anD reSulTS
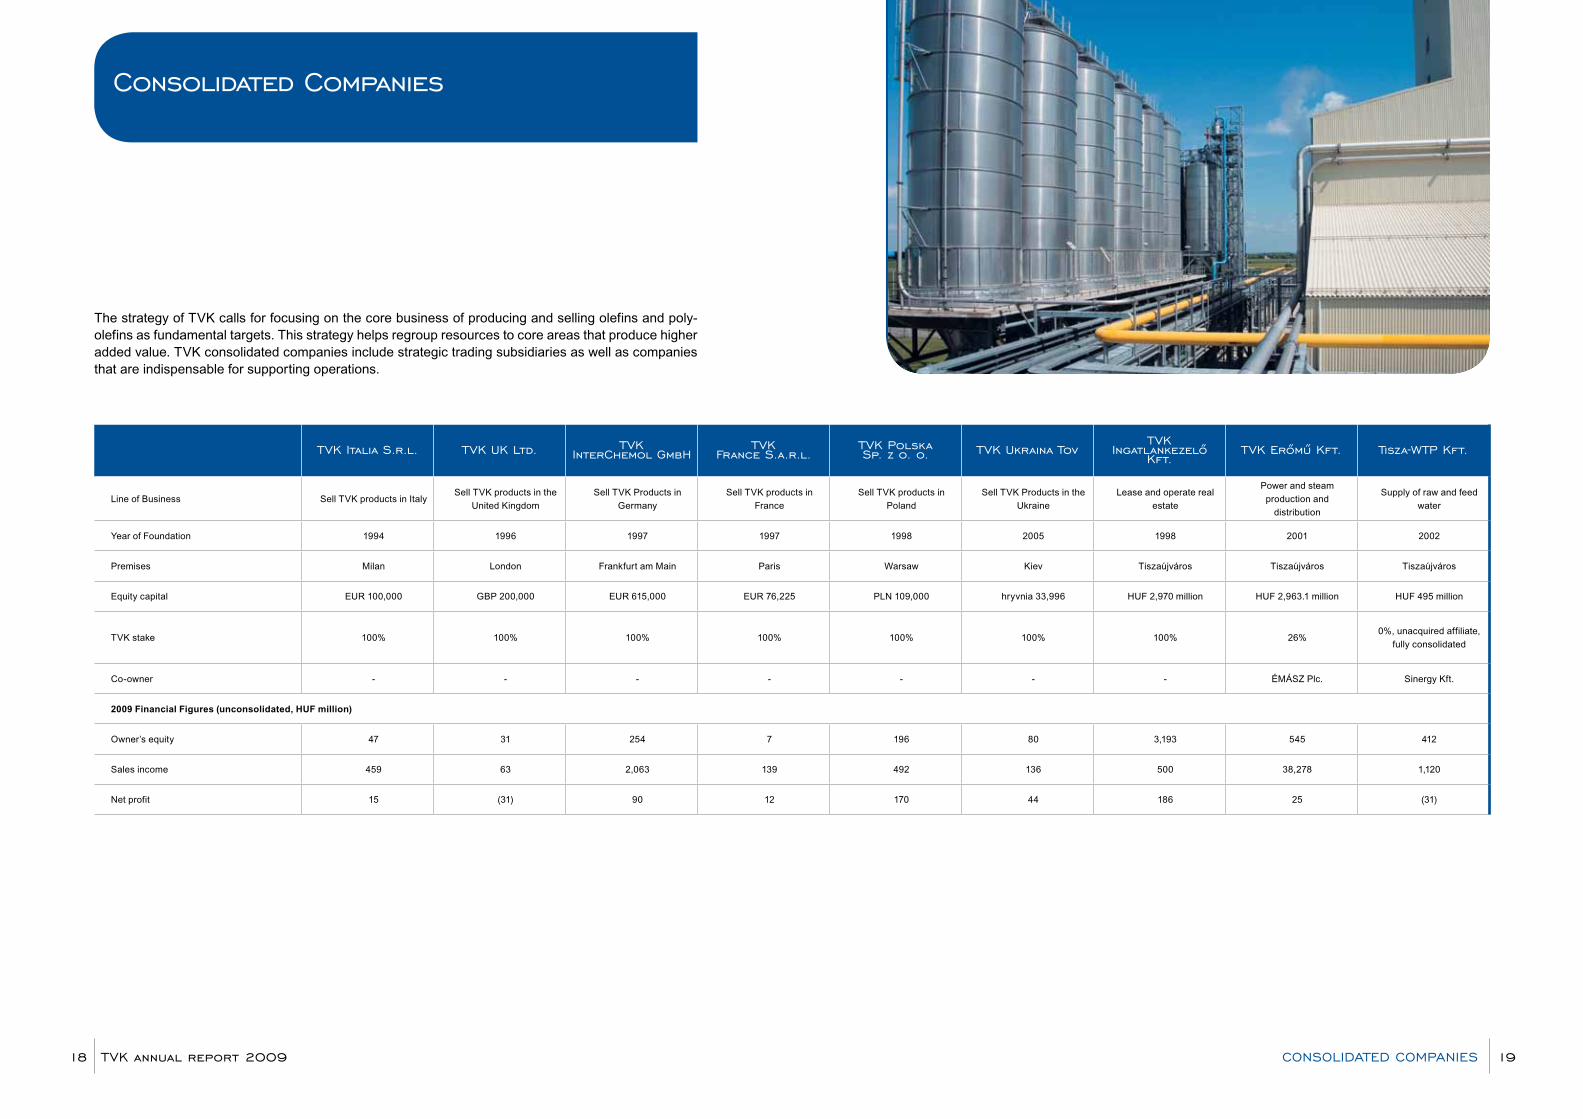
The strategy of TVK calls for focusing on the core business of producing and selling olefins and poly-olefins as fundamental targets. This strategy helps regroup resources to core areas that produce higher added value. TVK consolidated companies include strategic trading subsidiaries as well as companies that are indispensable for supporting operations.
Consolidated Companies
TVK Italia S.r.l. TVK uK ltd. TVK InterChemol GmbH
TVK France S.a.r.l.
TVK polska Sp. z o. o. TVK ukraina Tov
TVK Ingatlankezelő
Kft.TVK erőmű Kft. Tisza-wTp Kft.
Line of Business Sell TVK products in Italy Sell TVK products in the
United Kingdom
Sell TVK Products in
Germany
Sell TVK products in
France
Sell TVK products in
Poland
Sell TVK Products in the
Ukraine
Lease and operate real
estate
Power and steam
production and
distribution
Supply of raw and feed
water
Year of Foundation 1994 1996 1997 1997 1998 2005 1998 2001 2002
Premises Milan London Frankfurt am Main Paris Warsaw Kiev Tiszaújváros Tiszaújváros Tiszaújváros
Equity capital EUR 100,000 GBP 200,000 EUR 615,000 EUR 76,225 PLN 109,000 hryvnia 33,996 HUF 2,970 million HUF 2,963.1 million HUF 495 million
TVK stake 100% 100% 100% 100% 100% 100% 100% 26%0%, unacquired affiliate,
fully consolidated
Co-owner - - - - - - - ÉMÁSZ Plc. Sinergy Kft.
2009 Financial Figures (unconsolidated, HUF million)
Owner’s equity 47 31 254 7 196 80 3,193 545 412
Sales income 459 63 2,063 139 492 136 500 38,278 1,120
Net profit 15 (31) 90 12 170 44 186 25 (31)
TVK annual report 200918 19ConSolIDaTeD CoMpanIeS
TVK annual report 200920 21
our production
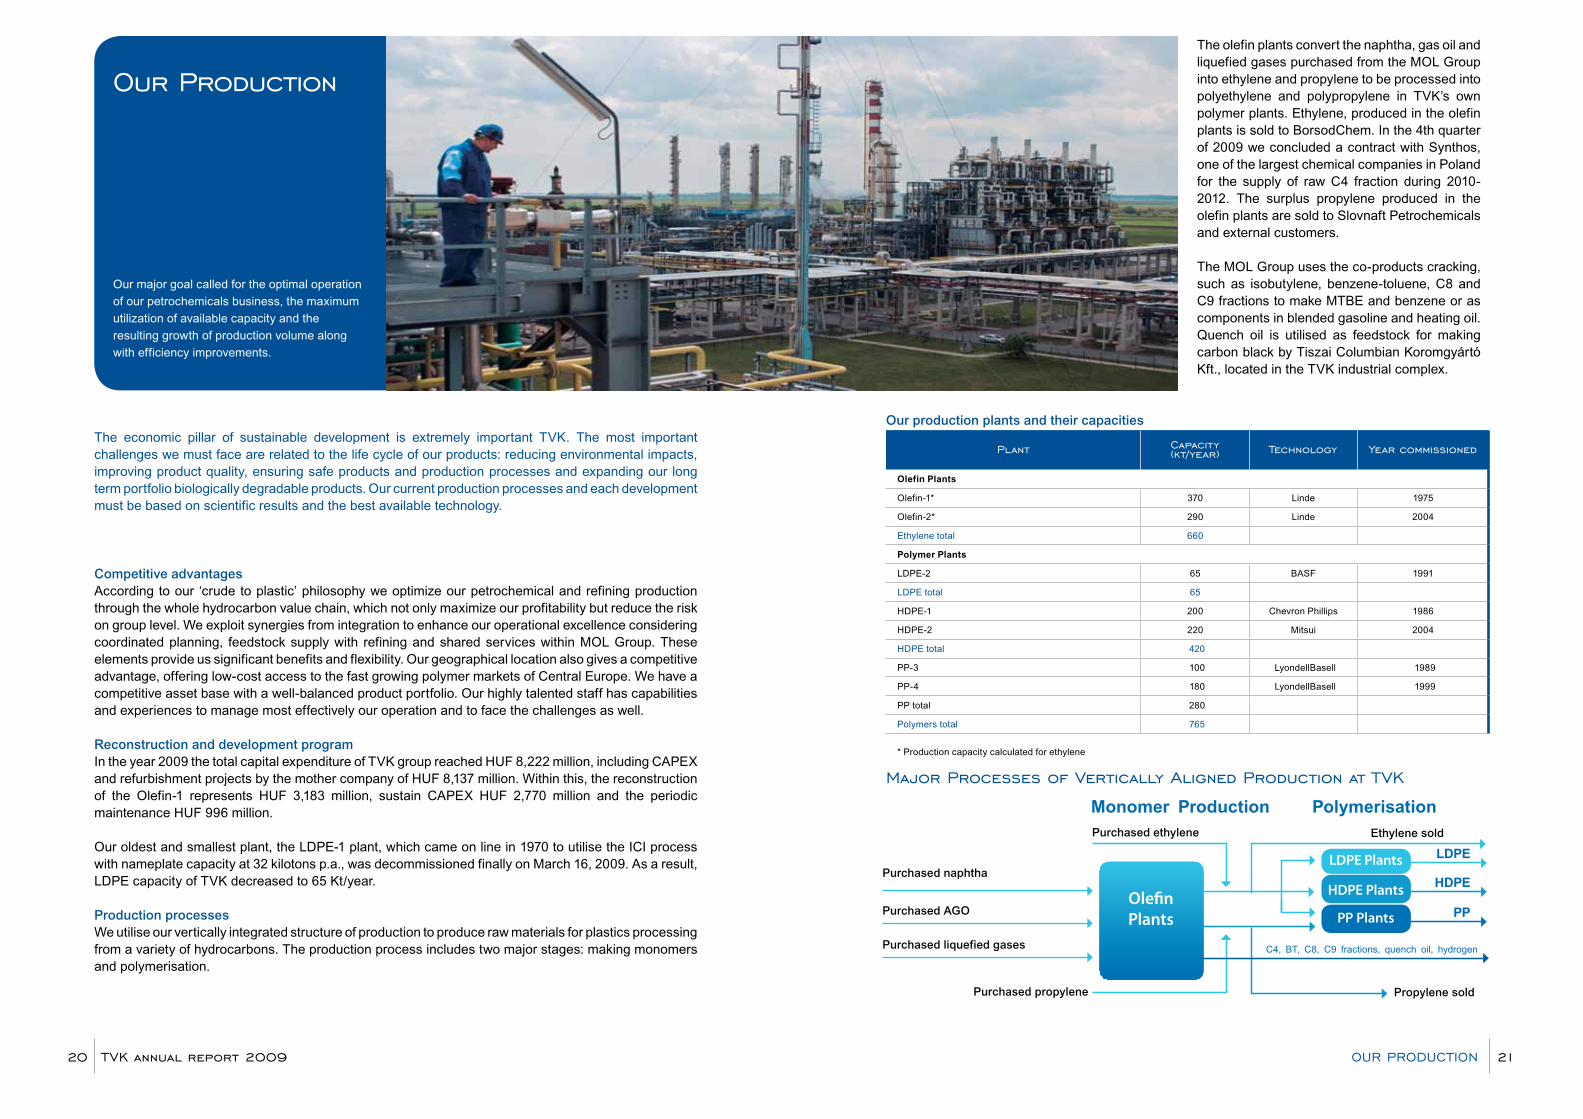
Our major goal called for the optimal operation
of our petrochemicals business, the maximum
utilization of available capacity and the
resulting growth of production volume along
with efficiency improvements.
The economic pillar of sustainable development is extremely important TVK. The most important challenges we must face are related to the life cycle of our products: reducing environmental impacts, improving product quality, ensuring safe products and production processes and expanding our long term portfolio biologically degradable products. Our current production processes and each development must be based on scientific results and the best available technology.
Competitive advantages According to our ‘crude to plastic’ philosophy we optimize our petrochemical and refining production through the whole hydrocarbon value chain, which not only maximize our profitability but reduce the risk on group level. We exploit synergies from integration to enhance our operational excellence considering coordinated planning, feedstock supply with refining and shared services within MOL Group. These elements provide us significant benefits and flexibility. Our geographical location also gives a competitive advantage, offering low-cost access to the fast growing polymer markets of Central Europe. We have a competitive asset base with a well-balanced product portfolio. Our highly talented staff has capabilities and experiences to manage most effectively our operation and to face the challenges as well.
Reconstruction and development program In the year 2009 the total capital expenditure of TVK group reached HUF 8,222 million, including CAPEX and refurbishment projects by the mother company of HUF 8,137 million. Within this, the reconstruction of the Olefin-1 represents HUF 3,183 million, sustain CAPEX HUF 2,770 million and the periodic maintenance HUF 996 million.
Our oldest and smallest plant, the LDPE-1 plant, which came on line in 1970 to utilise the ICI process with nameplate capacity at 32 kilotons p.a., was decommissioned finally on March 16, 2009. As a result, LDPE capacity of TVK decreased to 65 Kt/year.
Production processesWe utilise our vertically integrated structure of production to produce raw materials for plastics processing from a variety of hydrocarbons. The production process includes two major stages: making monomers and polymerisation.
our proDuCTIon
Our production plants and their capacities
plant Capacity (kt/year) Technology year commissioned
Olefin Plants
Olefin-1* 370 Linde 1975
Olefin-2* 290 Linde 2004
Ethylene total 660
Polymer Plants
LDPE-2 65 BASF 1991
LDPE total 65
HDPE-1 200 Chevron Phillips 1986
HDPE-2 220 Mitsui 2004
HDPE total 420
PP-3 100 LyondellBasell 1989
PP-4 180 LyondellBasell 1999
PP total 280
Polymers total 765
* Production capacity calculated for ethylene
Major processes of Vertically aligned production at TVK
Monomer Production PolymerisationPurchased ethylene Ethylene sold
Purchased propylene
Purchased naphtha
Purchased AGO
Purchased liquefied gases C4, BT, C8, C9 fractions, quench oil, hydrogen
Propylene sold
Olefin Plants PP Plants
HDPE Plants
LDPE Plants LDPE
HDPE
PP
The olefin plants convert the naphtha, gas oil and liquefied gases purchased from the MOL Group into ethylene and propylene to be processed into polyethylene and polypropylene in TVK’s own polymer plants. Ethylene, produced in the olefin plants is sold to BorsodChem. In the 4th quarter of 2009 we concluded a contract with Synthos, one of the largest chemical companies in Poland for the supply of raw C4 fraction during 2010-2012. The surplus propylene produced in the olefin plants are sold to Slovnaft Petrochemicals and external customers.
The MOL Group uses the co-products cracking, such as isobutylene, benzene-toluene, C8 and C9 fractions to make MTBE and benzene or as components in blended gasoline and heating oil. Quench oil is utilised as feedstock for making carbon black by Tiszai Columbian Koromgyártó Kft., located in the TVK industrial complex.
TVK annual report 200922 23
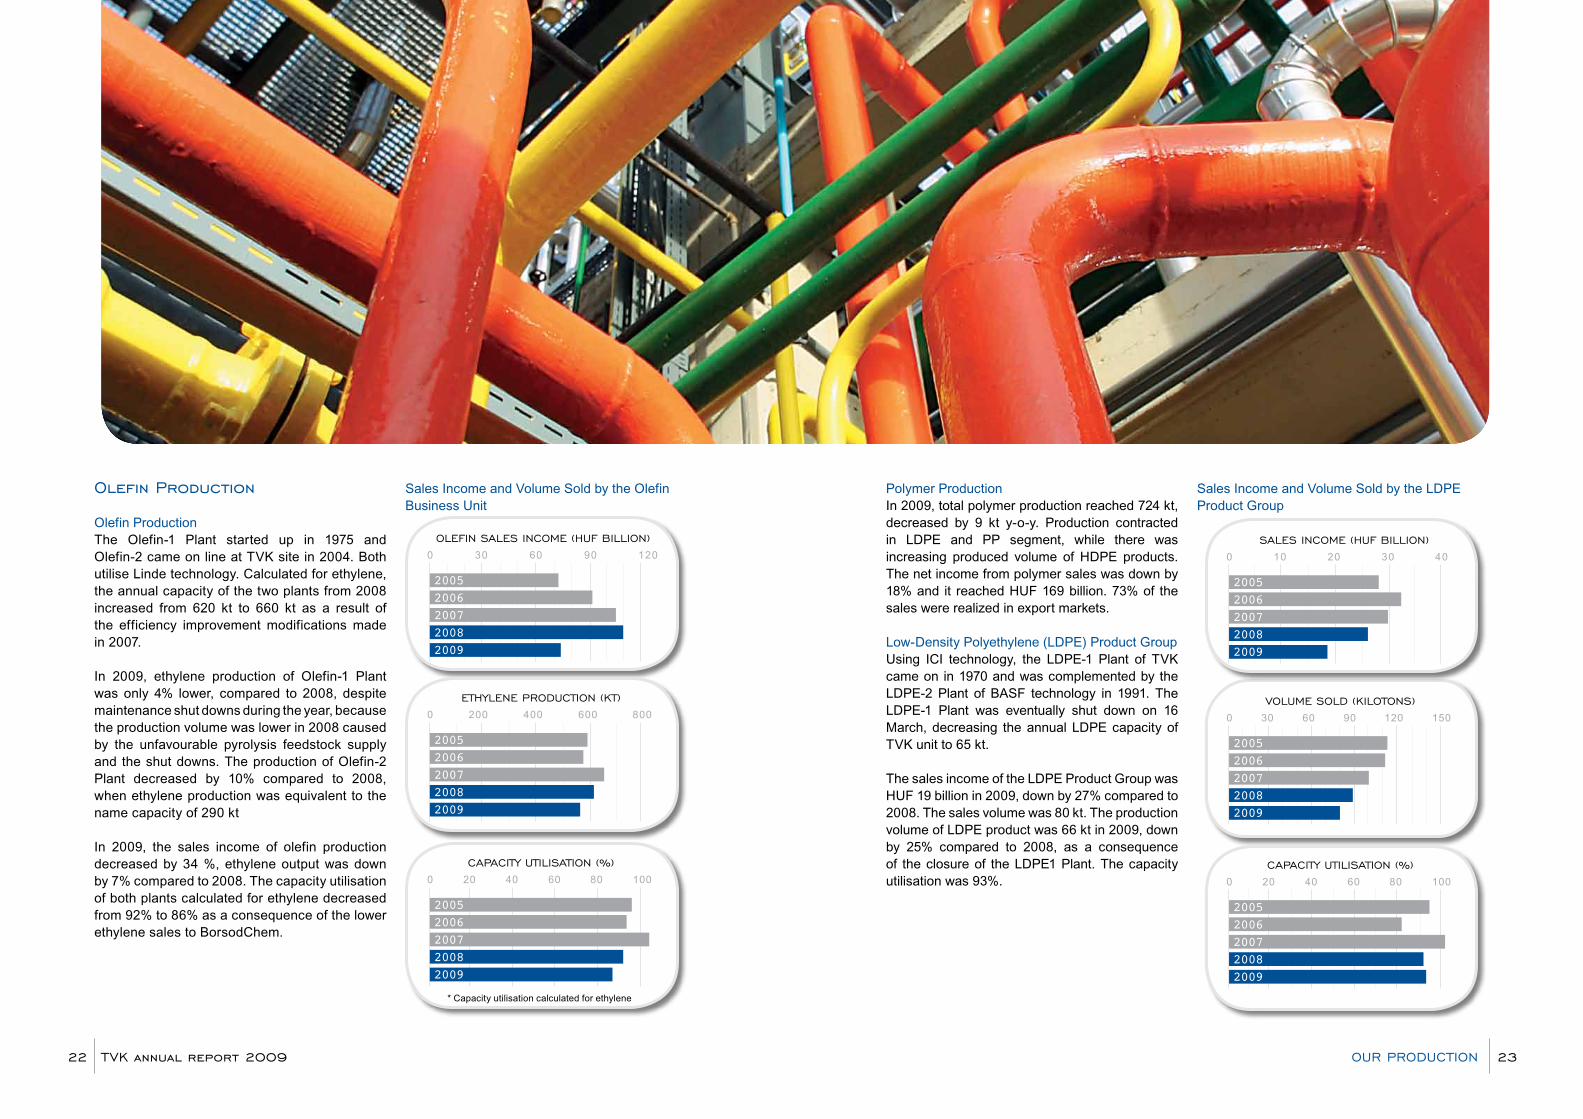
Polymer Production In 2009, total polymer production reached 724 kt, decreased by 9 kt y-o-y. Production contracted in LDPE and PP segment, while there was increasing produced volume of HDPE products. The net income from polymer sales was down by 18% and it reached HUF 169 billion. 73% of the sales were realized in export markets.
Low-Density Polyethylene (LDPE) Product GroupUsing ICI technology, the LDPE-1 Plant of TVK came on in 1970 and was complemented by the LDPE-2 Plant of BASF technology in 1991. The LDPE-1 Plant was eventually shut down on 16 March, decreasing the annual LDPE capacity of TVK unit to 65 kt.
The sales income of the LDPE Product Group was HUF 19 billion in 2009, down by 27% compared to 2008. The sales volume was 80 kt. The production volume of LDPE product was 66 kt in 2009, down by 25% compared to 2008, as a consequence of the closure of the LDPE1 Plant. The capacity utilisation was 93%.
Sales Income and Volume Sold by the LDPE Product Group
0 200 400 600 800
20052006200720082009
0 30 60 90 120 150
20052006200720082009
VoluMe SolD (KIloTonS)
our proDuCTIon
olefin production
Olefin Production The Olefin-1 Plant started up in 1975 and Olefin-2 came on line at TVK site in 2004. Both utilise Linde technology. Calculated for ethylene, the annual capacity of the two plants from 2008 increased from 620 kt to 660 kt as a result of the efficiency improvement modifications made in 2007.
In 2009, ethylene production of Olefin-1 Plant was only 4% lower, compared to 2008, despite maintenance shut downs during the year, because the production volume was lower in 2008 caused by the unfavourable pyrolysis feedstock supply and the shut downs. The production of Olefin-2 Plant decreased by 10% compared to 2008, when ethylene production was equivalent to the name capacity of 290 kt
In 2009, the sales income of olefin production decreased by 34 %, ethylene output was down by 7% compared to 2008. The capacity utilisation of both plants calculated for ethylene decreased from 92% to 86% as a consequence of the lower ethylene sales to BorsodChem.
Sales Income and Volume Sold by the Olefin Business Unit
oleFIn SaleS InCoMe (HuF BIllIon)0 30 60 90 120
20052006200720082009
SaleS InCoMe (HuF BIllIon)0 10 20 30 40
20052006200720082009
0 200 400 600 800
20052006200720082009
eTHylene proDuCTIon (KT)
CapaCITy uTIlISaTIon (%)0 20 40 60 80 100
20052006200720082009
* Capacity utilisation calculated for ethylene
CapaCITy uTIlISaTIon (%)0 20 40 60 80 100
20052006200720082009

TVK annual report 200924 25our proDuCTIon
Polypropylene (PP) Product GroupThe PP-3 Plant has operated since 1989 with Spheripol (Himont, currently LyondellBasell) technology, and has been complemented by the PP-4 Plant, which uses Spheripol (Montell, currently LyondellBasell) technology since 2000. The total annual capacity of the two plants is 280 kt.
The PP product sales income was HUF 59 billion, down only by 23%. The total 270 kt production volume was lower in 2009 y-o-y, while the capacity utilization was 96%.
Outlook The planned turnaround will determine the production in 2010. The Olefin-2 plant was designed with 5 years turnaround period. The first turnaround will be carried out during 2010, resulting one month production break. The turnarounds of the HDPE-2 and PP-4 plants with 3 years turnaround period will be harmonised to this determinative event with three and two weeks production break, respectively. The external economic environment compels us to maintain austerity in cost management while focusing first of all on the continuous improvement of operating efficiency, maintaining and ensuring secure operations, enhancing the energy efficiency of our systems of process technology in view of the substantial rise of energy prices and on identifying and immediately implementing any remaining opportunities presented by our technological systems besides considering the environmental aspects in full.
Sales Income and Volume Sold by the PP Product Group
SaleS InCoMe (HuF BIllIon)0 20 40 60 80
20052006200720082009
0 100 200 300 400
20052006200720082009
VoluMe SolD (KIloTonS)
CapaCITy uTIlISaTIon (%)0 20 40 60 80 100
20052006200720082009
0 200 400 600 800
20052006200720082009
0 100 200 300 400 500
20052006200720082009
VoluMe SolD (KIloTonS)CapaCITy uTIlISaTIon (%)
0 20 40 60 80 100
20052006200720082009
SaleS InCoMe (HuF BIllIon)0 30 60 90 120
20052006200720082009
High-Density Polyethylene (HDPE) Product GroupUtilising Chevron Phillips process technology, the HDPE-1 Plant was constructed in 1986. The HDPE-2 plant utilising the Mitsui Chemicals so-called CX-process came on line in 2004. The joint annual capacity of the two plants is 420 kt.
Sales income of the HDPE Product Group decreased by 12% and reached HUF 91 billion. The total production volume was 387 kt, up by 7 % compared to 2008, increasing the capacity utilization to 92%.
Sales Income and Volume Sold by the HDPE Product Group

Total polymer production amounted to 724 kt in 2009, representing a year-on-year downturn of 9 kt. Altogether 749 kt of polymer products were sold, which is 15.9 kt higher than in the previous year. Sales contracted in LDPE and PP segment, while there was increasing volume of sales for HDPE products. As a consequence of the shut-down of LDPE-1 plant the LDPE sales decreased, which was partly offset by the domestic sales of SPC-LDPE product.
The net income from polymer sales amounted to HUF 169 billion in 2009, which is HUF 37 billion below the sales income of the previous year, since the positive effect of the higher sales volume was offset by the reduction of quoted polymer prices.
Export destinations represent 73% (546.5 kt) of total polymer sales, whilst the share of the domestic market was 27% (202.5 kt). In 2009, polymer sales continued to focus on Central- and Eastern European markets (54%), while 44 % of revenues were realised in other European countries, and only 2% were originating outside of Europe. Our proprietary distribution network, which we have been operating successfully for several years covering several European countries, has been instrumental in achieving
these results. We have offices in Austria, France, Poland, Germany, Italy, the Ukraine and Romania. Our foreign trading subsidiaries are engaged in selling the products of both TVK and the MOL Group member Slovnaft Petrochemicals.
We continued to implement the tactical elements of our strategy successfully despite the hardships: we enhanced our market analyses methodology, we have developed a new portfolio of services to strengthen customer loyalty, we have revamped our sales concept with a view to improving the efficiency of our sales channels and we continued to modify our product portfolio flexible in response to the outcome of continuous analyses.
Direct customer communications were strengthened as part of our new services portfolio. In November, 2008 we launched a customer magazine called PROGRESS, strengthening the loyalty of our costumers through this new channel. Our magazine offers useful information to clients about product development projects, our production and business activities and can get an inside view of the life of TVK.
OutlookThe economic crisis and the recession force the petrochemical sector to face unprecedented future challenges and severe competition. We have made numerous arrangements in order to offset the unfavourable changes. In addition to increasing efficiencies and strict cost control, we are focusing to sharpen our competitive edge on our markets, continuing to develop our business and managing proactively our product and customer portfolio.
As the markets of Central Europe have greater growth potential than the European average, our sales strategy continues to focus on exploiting our favourable geographic location. Besides, we intend to strengthen our key Western European penetration. In 2009 the sales volume also proved, that there are further growth prospect regarding our main activity and markets.
Our future goals- Maintain regional leadership- Maintain the reliable and stable customer
base, serving new customers and further improve customer loyalty
- Manage customer portfolio actively- Maintain secure relation with our partners- Manage product portfolio according market
requirements
We develop our products by continuously examining customer requirements. We do our best to deliver high quality services and product information related to our products in order to satisfy customer needs completely by keeping product liability in mind, which we interpret to mean that it is our duty to manage, improve and communicate the health, safety and environmental (HSE) effects during the life cycle of our products and production processes. Tailor made products were launched and we are working on further product developments with higher added value. It is our aspiration to integrate product liability into each section of the life cycle, including sales.
The international financial crisis and the ensuing economic recession left their marks on our performance in 2009 as well. Quoted prices and currency rates, which have a particularly high impact on the petrochemical business, hit our profitability significantly. However the margins mended during the third quarter of the year, they were moving in an unfavourable lane at major part of the year. TVK has proved to be a reliable partner, at the time of the crisis, for its costumers, as we were able to continuously serve them during the year, further deepening our relationship.
Exploiting our favourable geographic location we have amended our sales strategic, at the field of logistics product development and tight costumer relations, giving bigger focus to the Central- and Eastern European region. Therefore we have closed our sales office in the United Kingdom and Russia. We are able to maintain our market presence in the above-mentioned countries however, through other sales channel. In order to enhance the selling towards middle- and smaller size companies we opened two new selling points, besides the already existing two, in 2009.
We concluded a contract with Synthos, one of the largest chemical companies in Poland for the supply of raw C4 fraction during 2010-2012. In this way we are in position to increase the sales of the by-products of the olefin plant and to improve the capacity utilisation of the olefin plants at the same time, which is a significant risk mitigating factor at the time of the financial crisis and hide further market opportunities in itself.
our Sales
Due to our integrated operation and actively
managed product- and customer portfolio we
were able to maintain our market presence and
reputation both in Hungary and in the countries
of Central and Eastern Europe despite
extremely adverse market circumstances went
on in 2009, following the year 2008.
TVK annual report 200926 27our SaleS
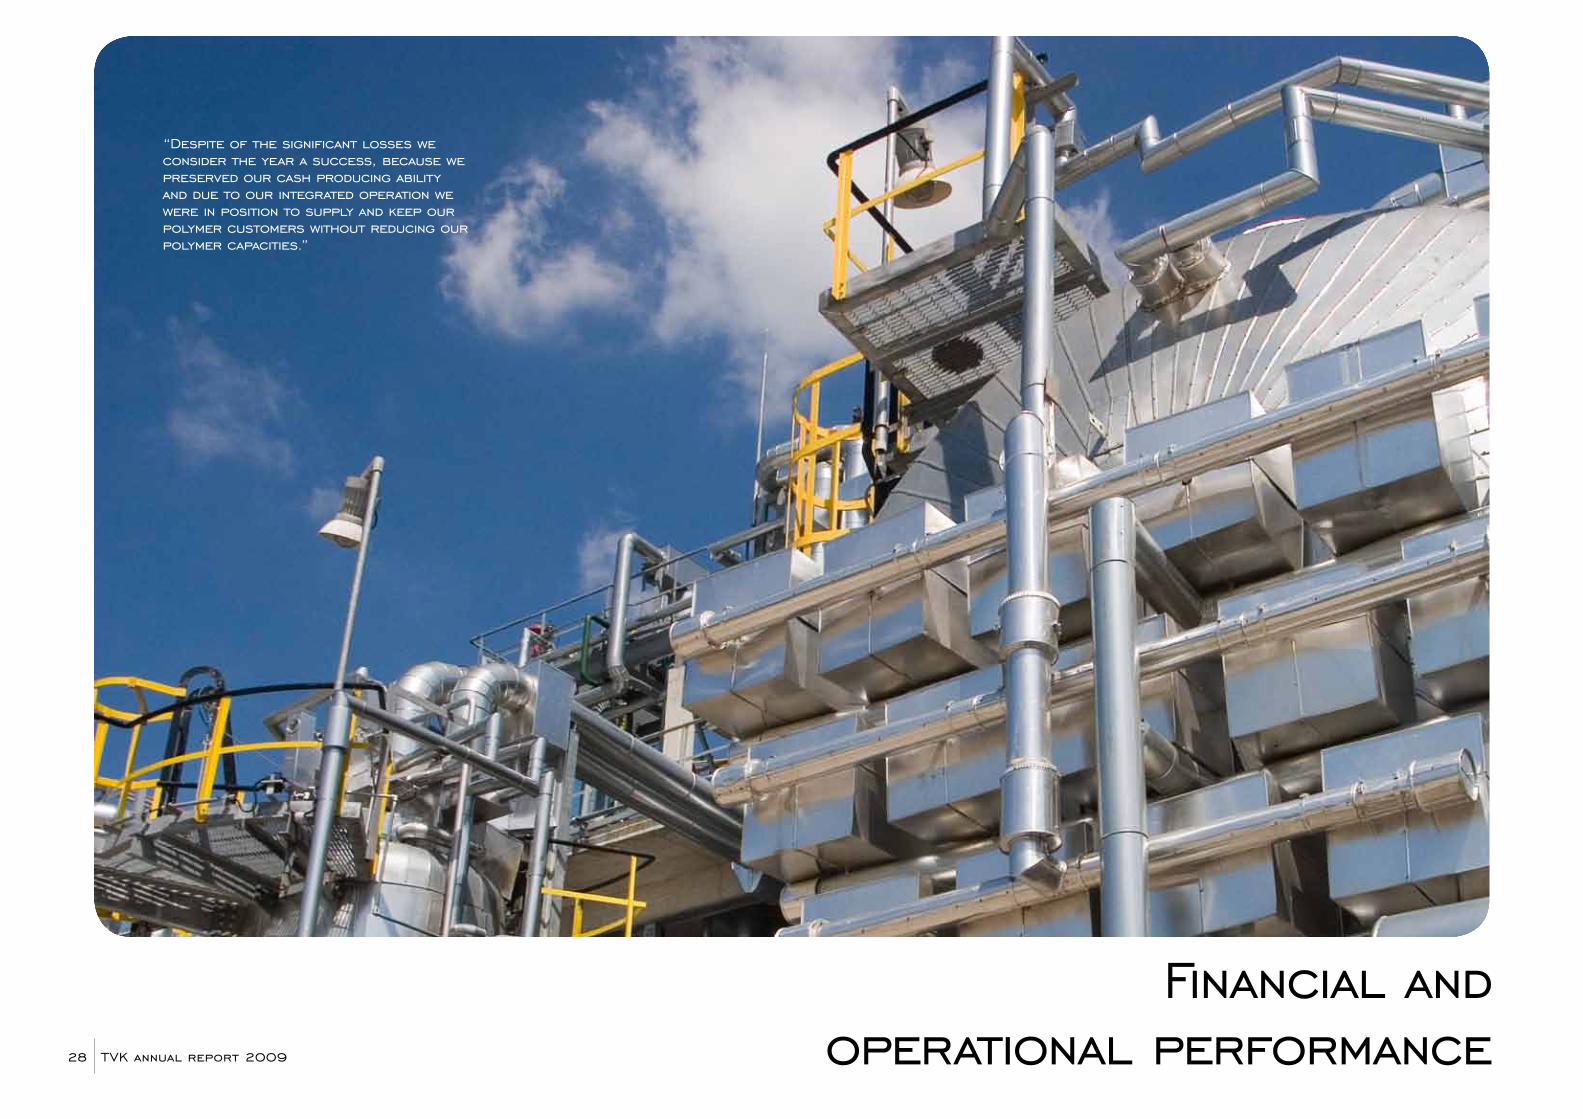
“Despite of the significant losses we consider the year a success, because we preserved our cash producing ability and due to our integrated operation we were in position to supply and keep our polymer customers without reducing our polymer capacities.”
Financial and operational performanceTVK annual report 200928

TVK annual report 200930 31ManaGeMenT DISCuSSIon anD analySIS oF THe reSulTS
Management Discussion and analysis of the results
eFFICIenT operaTIon DeSpITe unFaVouraBle MarKeT enVIronMenT
The crisis starting from the financial sector in the year 2008 that became fully-fledged in the real sector during 2009 produced the worst results of the last two decades in our industry. The profitability of our polymer products dropped dramatically and consequently we had the lowest operating profits ever in the history of TVK. Despite of the significant losses we consider the year a success, because we preserved our cash producing ability and due to our integrated operation we were in position to supply and keep our polymer customers without reducing our polymer capacities. We achieved all this in spite of the significant worsening of the capacity utilisation of our olefin production resulting from the ethylene sales decrease. In order to partially compensate this, in the 4th quarter of 2009 we concluded a contract with Synthos, one of the largest chemical companies in Poland for the supply of raw C4 fraction during 2010-2012. In this way we are in position to increase the sales of the by-products of the olefin plant and to improve the capacity utilisation of the olefin plants at the same time. Continuous presence on the polymer market is a stable foundation for the improvement of our market position and of our competitive edge. Resulting from the implementation of our program mitigating the impact of recession we maintained the liquidity of our Company. Consequently we were in position to finance, in addition to the successfully implemented maintenance and turnaround activities, the actual tasks of the reconstruction program of our Olefin-1 plant and also the repayment of our credits therefore our gearing index have been decreased during 2009.
The figures presented in the 2009 Annual Report of the business year of Tisza Chemical Group Public Limited Company are audited and final. For the purposes of the Annual Report, the term “TVK Group level data” refers to the data of TVK Plc. and the entities under its control consolidated in line with international financial reporting standards (IFRS). 7 subsidiaries, 1 affiliated business and 1 non-participating business were fully consolidated while 2 businesses were consolidated by the equity method. As required under law, the annual report presents true and fair figures and statements, and does not withhold any facts that the issuer – to its best knowledge – considers to be of material importance in terms of evaluating the issuer’s position. The issuer is liable for the
contents of this flash report. The issuer is also liable for damages arising from a failure to make regular and extraordinary disclosures and any misleading representation in its disclosures.
TVK annual report 200932 33ManaGeMenT DISCuSSIon anD analySIS oF THe reSulTS
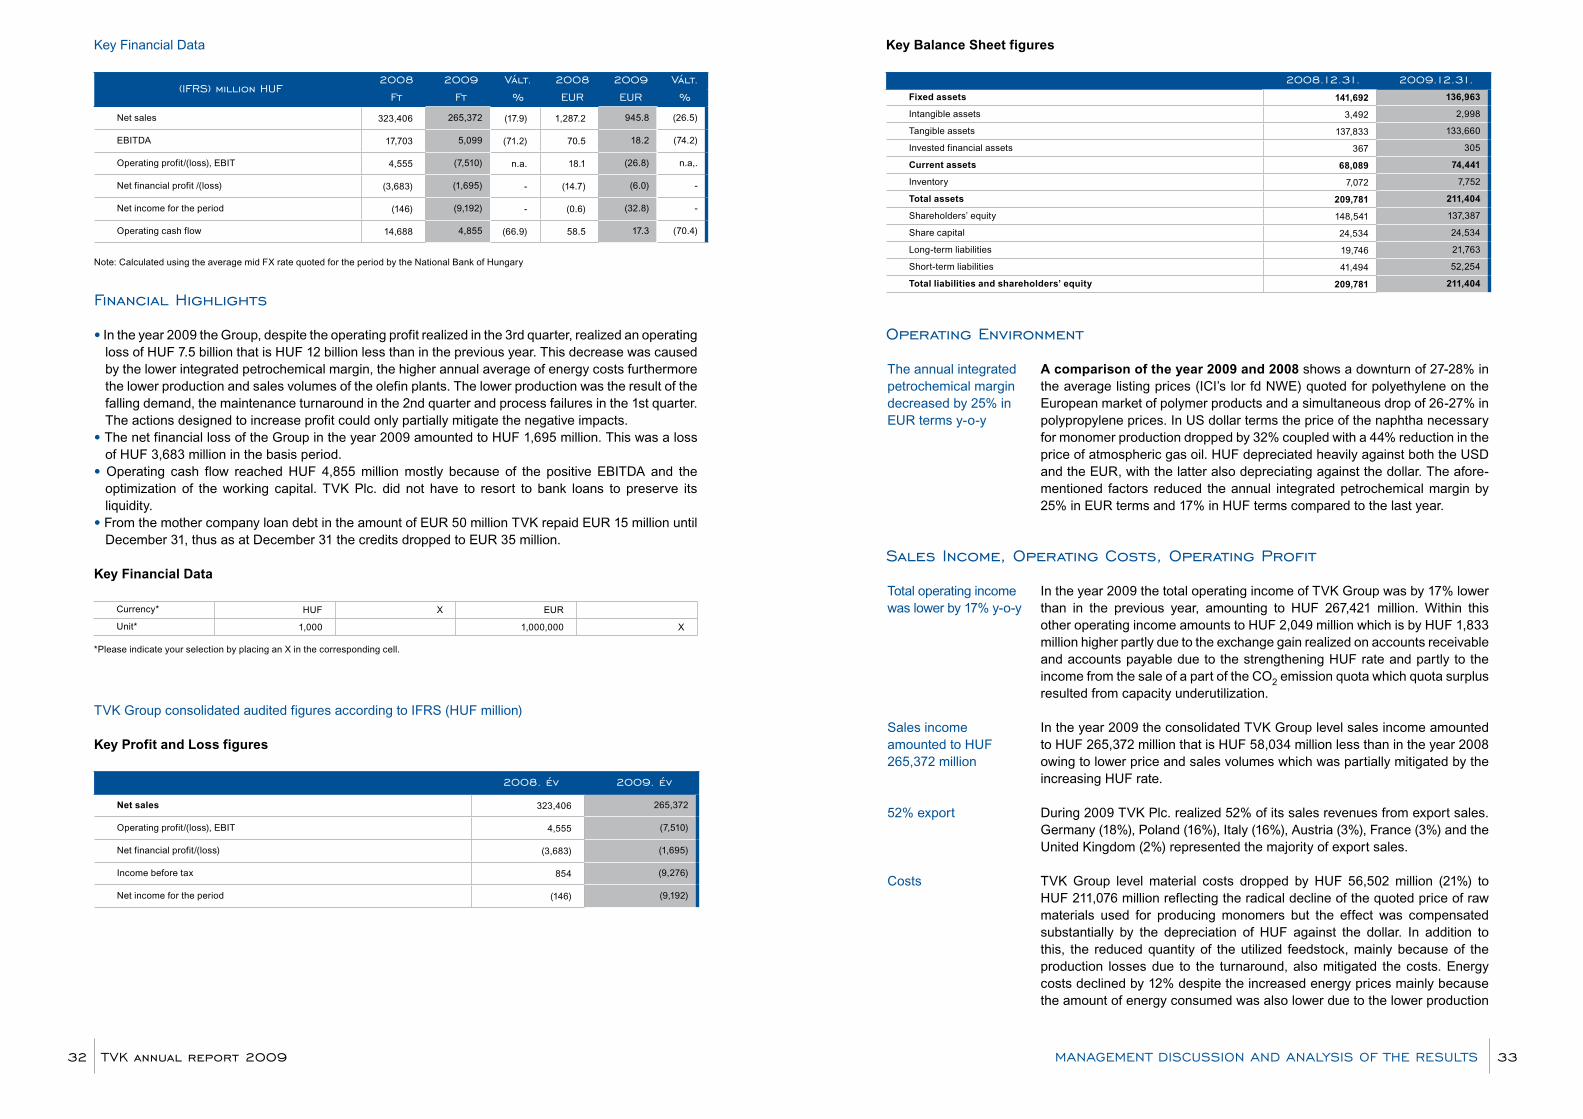
Key Financial Data
(IFrS) million HuF2008 2009 Vált. 2008 2009 Vált.
Ft Ft % eur eur %
Net sales 323,406 265,372 (17.9) 1,287.2 945.8 (26.5)
EBITDA 17,703 5,099 (71.2) 70.5 18.2 (74.2)
Operating profit/(loss), EBIT 4,555 (7,510) n.a. 18.1 (26.8) n.a,.
Net financial profit /(loss) (3,683) (1,695) - (14.7) (6.0) -
Net income for the period (146) (9,192) - (0.6) (32.8) -
Operating cash flow 14,688 4,855 (66.9) 58.5 17.3 (70.4)
Note: Calculated using the average mid FX rate quoted for the period by the National Bank of Hungary
Financial Highlights
• In the year 2009 the Group, despite the operating profit realized in the 3rd quarter, realized an operating loss of HUF 7.5 billion that is HUF 12 billion less than in the previous year. This decrease was caused by the lower integrated petrochemical margin, the higher annual average of energy costs furthermore the lower production and sales volumes of the olefin plants. The lower production was the result of the falling demand, the maintenance turnaround in the 2nd quarter and process failures in the 1st quarter. The actions designed to increase profit could only partially mitigate the negative impacts.
• The net financial loss of the Group in the year 2009 amounted to HUF 1,695 million. This was a loss of HUF 3,683 million in the basis period.
• Operating cash flow reached HUF 4,855 million mostly because of the positive EBITDA and the optimization of the working capital. TVK Plc. did not have to resort to bank loans to preserve its liquidity.
• From the mother company loan debt in the amount of EUR 50 million TVK repaid EUR 15 million until December 31, thus as at December 31 the credits dropped to EUR 35 million.
Key Financial Data
Currency* HUF X EUR
Unit* 1,000 1,000,000 X
*Please indicate your selection by placing an X in the corresponding cell.
TVK Group consolidated audited figures according to IFRS (HUF million)
Key Profit and Loss figures
2008. év 2009. év
Net sales 323,406 265,372
Operating profit/(loss), EBIT 4,555 (7,510)
Net financial profit/(loss) (3,683) (1,695)
Income before tax 854 (9,276)
Net income for the period (146) (9,192)
Key Balance Sheet figures
2008.12.31. 2009.12.31.Fixed assets 141,692 136,963
Intangible assets 3,492 2,998
Tangible assets 137,833 133,660
Invested financial assets 367 305
Current assets 68,089 74,441
Inventory 7,072 7,752
Total assets 209,781 211,404
Shareholders’ equity 148,541 137,387
Share capital 24,534 24,534
Long-term liabilities 19,746 21,763
Short-term liabilities 41,494 52,254
Total liabilities and shareholders’ equity 209,781 211,404
operating environment
A comparison of the year 2009 and 2008 shows a downturn of 27-28% in the average listing prices (ICI’s lor fd NWE) quoted for polyethylene on the European market of polymer products and a simultaneous drop of 26-27% in polypropylene prices. In US dollar terms the price of the naphtha necessary for monomer production dropped by 32% coupled with a 44% reduction in the price of atmospheric gas oil. HUF depreciated heavily against both the USD and the EUR, with the latter also depreciating against the dollar. The afore-mentioned factors reduced the annual integrated petrochemical margin by 25% in EUR terms and 17% in HUF terms compared to the last year.
Sales Income, operating Costs, operating profit
In the year 2009 the total operating income of TVK Group was by 17% lower than in the previous year, amounting to HUF 267,421 million. Within this other operating income amounts to HUF 2,049 million which is by HUF 1,833 million higher partly due to the exchange gain realized on accounts receivable and accounts payable due to the strengthening HUF rate and partly to the income from the sale of a part of the CO2 emission quota which quota surplus resulted from capacity underutilization.
In the year 2009 the consolidated TVK Group level sales income amounted to HUF 265,372 million that is HUF 58,034 million less than in the year 2008 owing to lower price and sales volumes which was partially mitigated by the increasing HUF rate.
During 2009 TVK Plc. realized 52% of its sales revenues from export sales. Germany (18%), Poland (16%), Italy (16%), Austria (3%), France (3%) and the United Kingdom (2%) represented the majority of export sales.
TVK Group level material costs dropped by HUF 56,502 million (21%) to HUF 211,076 million reflecting the radical decline of the quoted price of raw materials used for producing monomers but the effect was compensated substantially by the depreciation of HUF against the dollar. In addition to this, the reduced quantity of the utilized feedstock, mainly because of the production losses due to the turnaround, also mitigated the costs. Energy costs declined by 12% despite the increased energy prices mainly because the amount of energy consumed was also lower due to the lower production
Total operating income was lower by 17% y-o-y
Sales income amounted to HUF 265,372 million
52% export
Costs
The annual integrated petrochemical margin decreased by 25% in EUR terms y-o-y
TVK annual report 200934 35ManaGeMenT DISCuSSIon anD analySIS oF THe reSulTS
and energy optimization. The reconstruction and refurbishing work performed during the turnaround period incurred raw materials of HUF 1,073 million - this was offset in the self-manufactured assets line and was transferred to the investments
Material type services used dropped by HUF 626 million (-4%), and within this the amount of accounted agency fees dropped by HUF 175 million, of repair and maintenance costs by HUF 171 million, of the costs of recruiting workforce through temporary work agencies by HUF 127 million and of traveling and accommodation costs dropped by HUF 54 million. Transportation and warehousing costs are by HUF 86 million lower because of the lower sales volume and the modified tendering procedure of carriers.
The cost of the goods sold (COGS) is by HUF 1,521 million higher (25%) reflecting our cooperation with Slovnaft Petrochemicals s.r.o., where polymer products produced by Slovnaft Petrochemicals s.r.o. are sold by TVK. The purchasing costs of tar dropped by 21%. The positions appearing in the COGS are offset by sales.
Intermediated services increased significantly by the purchase of electricity for MOL Group through TVK Power Plant (TVK Erőmű Ltd.) in order to be able to optimize electricity purchase price. This cost was covered by revenue.TVK Group level Personnel type expenses are HUF 415 million (4%) higher mainly because of the changes in the value of raised and utilized provisions, implemented wage increase and accruals.
Other operating costs dropped by HUF 263 (6%). Within this it causes a reduction of HUF 632 million that the exchange loss on receivables and liabilities was reported among the costs in the basis period while it was included as profit among the other incomes in the reporting period. The expense of HUF 471 million booked when accounting the 2008 emission quota increases the costs incurred in the year 2009.
The change of self manufactured inventories in the reporting period shows a decrease of HUF 60 million, mainly because the quantity of self manufactured inventories has significantly dropped compared to the opening balance at the beginning of the year, at the same time this effect was significantly mitigated by the surging prime costs as the feedstock was more expensive than naphtha in December 2008 entailing the appreciation of inventories.
Capitalized own performances totaled at HUF 1,073 million in the year 2009 as the costs incurred because of the reconstruction and refurbishing works during the turnaround period were transferred to the investments.
The TVK Group level operating losses (EBIT) amounted to HUF 7,510 million in the year 2009, whereas in the same period of 2008 profits amounted to HUF 4,555 million.
profit/loss on Financial operations
The net financial loss of the Group in the year 2009 amounted to HUF 1,695 million. This was a loss of HUF 3,683 million in the basis period. Exchange loss of HUF 305 million was accounted on FX loans received and other assets denominated in foreign exchange, compared to the exchange loss in the amount of HUF 1,566 million in 2008. HUF 485 million less interest and HUF 97 million less discount was paid and interest income increased by HUF 158 million.
Taxation
In the year 2009 TVK Group income before taxes amounted to a loss of HUF 9,276 million with a tax liability of HUF 792 million. Deferred tax amounted to the negative figure of HUF 876 million and includes mainly the accrual of the negative tax base.
net profit
Consolidated net income (loss) for the period in totaled at HUF 9,192 million. Earnings per share (EPS) decreased to a HUF -378, compared to HUF -6 last year value.
net asset position
The value of the total assets of TVK Group stood at HUF 211,404 million as at December 31, 2009.
The consolidated value of non-current assets amounted to HUF 136,963 million as at December 31, 2009, 3% lower than on December 31, 2008 mainly due to the lower value - attributable to recognized depreciation - of tangible and intangible assets.
Current assets increased by 9% to HUF 74,441 million. Within the current assets inventories rose by 10% compared to the previous year. Self-manufactured inventories appreciated because of the purchase costs resulting from high feedstock prices, despite of the significant reduction of polymer finished product inventory, whereas olefin feedstock quantity increased slightly. The value of accounts receivable increased by 17% compared to the previous year due to the significant increase of polymer selling prices and of the polymer quantities sold, taking into consideration the last two months affecting the changes in the accounts receivable. The amount of other current assets dropped by 14% due to the reduction of the revolving loan extended to the mother company, which was slightly mitigated by the increase of VAT receivable.
Financial position
The portfolio of long term debts on December 31, 2009 was by about 8% lower than on December 31, 2008 and amounted to HUF 11,632 million and includes only the long term loans recorded in the books of the subsidiaries. The other long term liabilities at December 31, 2009 were HUF 4,288 million coming from forward transactions.
The value of short term liabilities rose by 26% to HUF 52,254 million between December 31, 2008 and December 31, 2009. The reason of the increase is the revolving credit concluded with the mother company and the higher accounts payable due to the increase of the price and quantity of the feedstock purchased for the olefin plant in December, compared to the lower price and quantity purchased in December of the previous year.
EBIT
Net financial loss was HUF 1,695 million
Tax liability
Earnings per share
Total assets
Non-current assets
Current assets
Long term debts on December 31, 2009 was lower by 8% y-o-y
Short term liabilities rose by 26% between December 31, 2008 and December 31, 2009

TVK annual report 200936 37ManaGeMenT DISCuSSIon anD analySIS oF THe reSulTS
A reducing element was that last December the installments of the long-term credits were not yet transferred within the year, which was terminated at the end of this year. From the mother company loan debt in the amount of EUR 50 million TVK repaid EUR 15 million until December 31, thus as at December 31 the credits dropped to EUR 35 million.
owner’s equity, registered Capital, Capital reserves and retained earnings
Shareholder’s equity amounted to HUF 137,387 million on December 31, 2009, by about 8% lower than on December 31, 2008. The decrease is attributable to the variance in the value of the profit/loss after taxation and the paid dividend. Share capital did not change, amounted to HUF 24,534 million.
Cash flow
Based on the group level cash flow statement of TVK dated December 31, 2009 liquid assets have increased by HUF 383 million since the beginning of the year.
The operating cash flow amounted to HUF 4,855 million increased by EBITDA by HUF 5,099 million, and changes in working capital (inventories, trade accounts receivable and payable, other receivables and short term liabilities altogether) increased it by HUF 3,489 million. Within the variance of the working capital, the cash flow deteriorating effect of the changes in the inventory originate from the substantial growth of the olefin plant feedstock prices - which determine the inventory prime cost - since December 2008 leading to inventory appreciation. The fact that the volume of polymer own produced inventories decreased considerably while olefin product inventories decreased modestly, could only mitigate this in part. The reason of the increase of accounts receivable was that during the year 2009 the sales prices and sales volumes in the last two months of the 4th quarter of 2009 were higher than in the last two months of the 4th quarter of 2008 (which determine the year-end accounts receivable). It led to the growth of accounts payable that the purchase price and the purchased quantity of olefin feedstock were both higher in December 2009 than in December 2008. As regards other receivables, mainly the increased amount of the refundable VAT, corporate tax and other taxes decreased the cash flow. Other short term liabilities decreased the operating cash flow due to the drop of the balance of accrued costs. The adjustment due to the non-cash effects included in the EBIT decreased the operating cash flow by HUF 2,023 million: within this the revaluation of inventories in January decreased the cash flow by HUF 394 million, the cancellation of the sale of CO2 quota from the operating cash flow decreased it by HUF 962 million, the changes in provisions decreased it by HUF 692 million and the non-realized loss on revaluation of accounts payable/accounts receivable decreased it by HUF 84 million. Taxes paid against the profit/loss further reduced the cash flow by HUF 1,710 million.
Investment activity increased the cash flow by HUF 7,074 million. An amount of HUF 8,639 million was used for the purchase of tangible and intangible assets, an income of HUF 1,582 million was realized on the sale of tangible assets and the interest received improved the cash position by HUF 584 million. The loan repaid by the mother company and the exchange rate
difference thereof increased the cash flow by HUF 9,262 million. Forward transactions generated HUF 4,283 million.
Net cash from financial operations decreased cash flow by HUF 11,546 million in the examined period reflecting the cash flow decreasing effect of the repayment of loans reclassified as short term loans, of the paid interests and financial expenses furthermore of the paid dividend.
Capital expenditure
In the year 2009 the total capital expenditure of TVK group reached HUF 8,223 million, including CAPEX and refurbishment projects by the mother company of HUF 8,137 million. Within this, the reconstruction of the Olefin-1 represents HUF 3,184 million, sustain CAPEX HUF 3,029 million and the periodic maintenance HUF 996 million.
The strict cost reduction program launched to compensate the negative impact of the general economic downturn protracting to the year of 2009 has basically determined the nature and content of our annual project development and project implementation activities.
Instead of a low number but high-value technology and production development projects (like the processing of olefin by-products) we deliberately concentrated on projects aimed at the efficiency improvement of petrochemical production, at the diversification of our product portfolio, at the management of operational safety and of the risks jeopardizing health and environment.
organizational and personnel Changes, employees
There was no major change occurring in the company structure in 2009.
During 2009 there was the following change in the senior management: from October 1, 2009 Krisztina Petrényi Szabó is the Polymer Marketing and Sales director, deputy CEO of TVK Plc. Mr László Piry has worked as Polymer Marketing and Sales director between 7 June 2004 and 30 September 2009. Mrs. Petrényi does not hold any TVK shares.
As at December 31, 2009 the total consolidated headcount of TVK-group included 1,167 full time employees, 3 persons less than the closing headcount on December 31, 2008. Within this, the headcount of the TVK-parent company did not change, while the number of employees at the subsidiaries decreased by 3 because TVK-UK Ltd. discontinued its activity as of the end of June.
Headcount
Full Time employees December 31, 2008 December 31, 2009Corporate level 1,139 1,139
Group level 1,170 1,167
Operating cash flow
TVK repaid EUR 15 million from the mother company loan until the year end
Total CAPEX reached to HUF 8,223 million
Strict cost reduction program
Projects aimed efficiency improvement, diversification of product portfolio and safety operation
Organization
Employment
Investment activity
Financial cash flow
TVK annual report 200938 39ManaGeMenT DISCuSSIon anD analySIS oF THe reSulTS
TVK Shares on the Budapest Stock exchange
On the stock exchanges, the first part of the year was determined by the decline of the share prices, caused by the financial crisis started from the United States of America. Majority of the markets, at a global level, reached the bottom line in February or rather in March. Nevertheless there was a significant raise in the share prices, starting form the second quarter of the year, therefore the strengthening prices reached the pre-crisis level.
The BUX index, the normative index of the Budapest Stock Exchange, reached the bottom line on 12 February (9,461 point), down by 25 % comparing to the beginning of the year. The closing value of the index was 21,227 point, which is 68% higher versus the opening value of the year (12,649 point). On the spot market the tendency of the previous years was continued, and the contribution of the equities section to the total turnover was significant (94.6%). Within the equity sector, in line with the tendency of the previous years, the share trade amounted to 99%. In 2009, the decline of the international trades was offset by the raising activity of domestic investors.
During the year of 2009 the share price of TVK raised by 40%. The opening value of the year was HUF 2,450, while the closing value was HUF 3,400. The yearly turnover of the TVK shares was HUF 6,031 mn and 2,333,282 pcs, while the average daily turnover was HUF 24.1 mn. The market capitalization of the TVK shares amounted to HUF 82.6 bn, up by 38% compared to the last year (HUF 60 bn). TVK kept its position in the rank and remained the eighth among the listed companies in terms of market capitalization. The TVK shares did not really belonged to the liquid papers, as a consequence of the small fraction of public shares.
ownership Structure
There was no significant change in the shareholder structure of the company during the year of 2009, since there was no change in the person and share of those shareholders having more than 5 % of shares.
According to the Shareholder Register MOL Plc. has 86.79 %, while Slovnaft a.s., a subsidiary of MOL Plc, has 8.07% shareholder stake. Therefore MOL Plc. has 94.86% direct and indirect influence on TVK Plc is.
During the year, the shareholder stake of the domestic institutional investors was 88.4%, while the stake of the foreign investors was near to 10%. The ownership share of private investors was not significant, reaching barely 1.7%. The company had no treasury shares in 2009 either.
According to the resolution of the Annual General Meeting held on 16th April 2009, the company paid HUF 1,991,849,126 as dividend, which amounted to HUF 82 per share. The payment of dividend commenced on June 03, 2009.
TVK-részvény
Shareholders with more than 5% stake
Shareholder structure
Dividend payment
BUX index
Global economy effects on stock exchanges
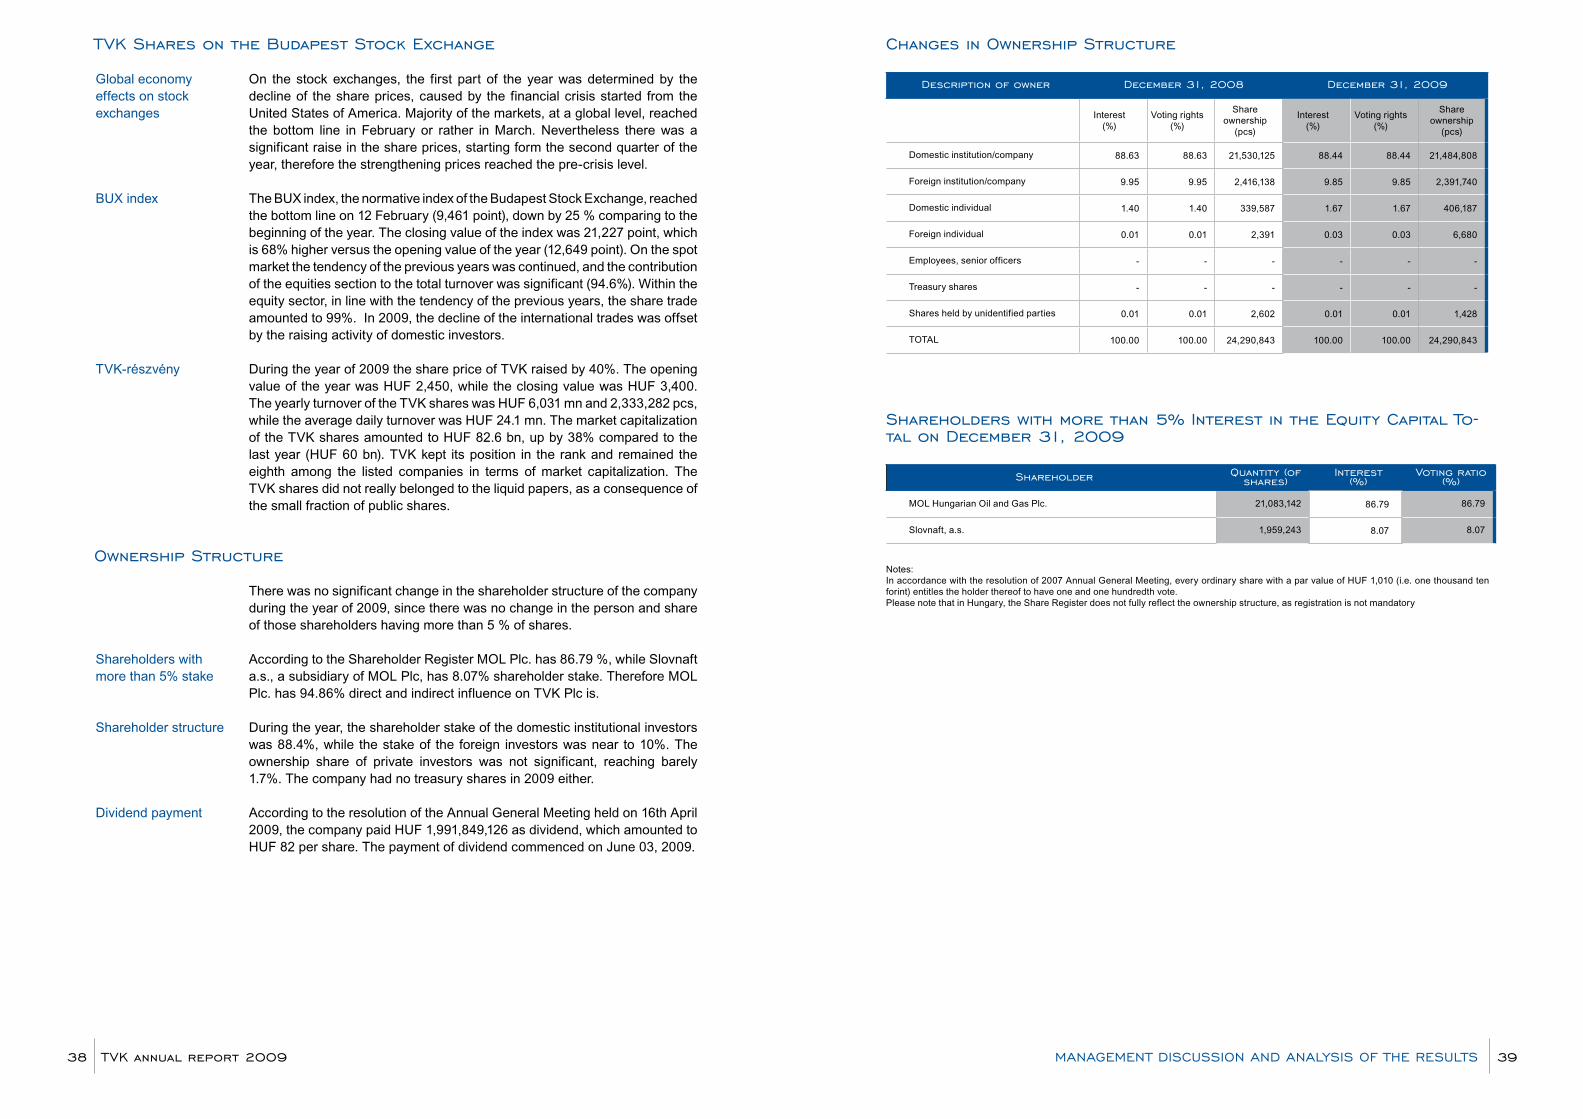
Changes in ownership Structure
Description of owner December 31, 2008 December 31, 2009
Interest (%)
Voting rights (%)
Share ownership
(pcs)
Interest (%)
Voting rights (%)
Share ownership
(pcs)
Domestic institution/company 88.63 88.63 21,530,125 88.44 88.44 21,484,808
Foreign institution/company 9.95 9.95 2,416,138 9.85 9.85 2,391,740
Domestic individual 1.40 1.40 339,587 1.67 1.67 406,187
Foreign individual 0.01 0.01 2,391 0.03 0.03 6,680
Employees, senior officers - - - - - -
Treasury shares - - - - - -
Shares held by unidentified parties 0.01 0.01 2,602 0.01 0.01 1,428
TOTAL 100.00 100.00 24,290,843 100.00 100.00 24,290,843
Shareholders with more than 5% Interest in the equity Capital To-tal on December 31, 2009
Shareholder Quantity (of shares)
Interest (%)
Voting ratio (%)
MOL Hungarian Oil and Gas Plc. 21,083,142 86.79 86.79
Slovnaft, a.s. 1,959,243 8.07 8.07
Notes: In accordance with the resolution of 2007 Annual General Meeting, every ordinary share with a par value of HUF 1,010 (i.e. one thousand ten forint) entitles the holder thereof to have one and one hundredth vote.Please note that in Hungary, the Share Register does not fully reflect the ownership structure, as registration is not mandatory
Tisza Chemical Group public limited Company and Subsidiaries
Consolidated financial statements pre-pared in accordance with International Financial reporting Standards together with the independent auditors’ report
31 december 2009
TVK annual report 200940 41ConSolIDaTeD FInanCIal STaTeMenTS
Opinion7.) We have audited the elements of and disclosures in the consolidated annual financial statements, along with underlying records and supporting documentation, of Tiszai Vegyi Kombinát Nyilvánosan Működő Részvénytársaság in accordance with Hungarian National Auditing Standards and have gained sufficient and appropriate evidence that the consolidated annual financial statements have been prepared in accordance with the International Financial Reporting Standards as adopted by EU. In our opinion the consolidated annual financial statements give a true and fair view of the equity and financial position of Tiszai Vegyi Kombinát Nyilvánosan Működő Részvénytársaság as at 31 December 2009 and of the results of its operations for the year then ended. The consolidated business report corresponds to the disclosures in the consolidated financial statements.
8.) Without qualifying our opinion we draw the attention to Note 26 to the consolidated financial statements that describe the environmental aspects of the Company’s operations and highlights the risk of additional significant decontamination expenses that might incur over the current amount of the provision in relation to past environmental damage as may be identified by future environmental surveys.
Budapest, 11 March 2010
Szilágyi JuditErnst & Young Kft. Registered AuditorRegistration No. 001165 Chamber membership No.: 001368
TVK annual report 200942 43
Független Könyvvizsgálói Jelentés
InDepenDenT auDITorS’ reporT
To the Shareholders of Tiszai Vegyi Kombinát Nyilvánosan Működő Részvénytársaság1.) We have audited the accompanying 2009 consolidated annual financial statements of Tiszai Vegyi Kombinát Nyilvánosan Működő Részvénytársaság (“the Company”), which comprises the consolidated balance sheet as at 31 December 2009 - showing a balance sheet total of HUF 211,404 million and a loss for the year of HUF 9,192 million -, the related consolidated income statement, consolidated statement of comprehensive income, consolidated statement of changes in equity, consolidated cash flows for the year then ended and the summary of significant accounting policies and other explanatory notes.
2.) We issued an unqualified opinion on the Company’s consolidated annual financial statements prepared in accordance with the International Financial Reporting Standards as adopted by EU as at 31 December 2008 on 20 March 2009.
Management’s Responsibility for the Consolidated Financial Statements3.) Management is responsible for the preparation and fair presentation of these consolidated financial statements in accordance with the International Financial Reporting Standards as adopted by EU. This responsibility includes: designing, implementing and maintaining internal control relevant to the preparation and fair presentation of consolidated financial statements that are free from material misstatement, whether due to fraud or error; selecting and applying appropriate accounting policies; and making accounting estimates that are reasonable in the circumstances.
Auditor’s Responsibility4.) Our responsibility is to express an opinion on these consolidated financial statements based on the audit and to assess whether the consolidated business report is consistent with the consolidated financial statements. We conducted our audit in accordance with Hungarian National Auditing Standards and with applicable laws and regulations in Hungary. Those standards require that we comply with ethical requirements and plan and perform the audit to obtain reasonable assurance whether the consolidated financial statements are free from material misstatement.
5.) An audit involves performing procedures to obtain audit evidence about the amounts and disclosures in the consolidated financial statements. The procedures selected depend on the auditor’s judgment, including the assessment of the risks of material misstatement of the consolidated financial statements, whether due to fraud or error. In making those risk assessments the auditor considers internal control relevant to the entity’s preparation and fair presentation of the consolidated financial statements in order to design audit procedures that are appropriate in the circumstances but not for the purpose of expressing an opinion on the effectiveness of the entity’s internal control. An audit also includes evaluating the appropriateness of accounting policies used and the reasonableness of accounting estimates made by management, as well as evaluating the overall presentation of the consolidated financial statements. Our work regarding the consolidated business report is restricted to assessing whether the consolidated business report is consistent with the consolidated financial statements and does not include reviewing other information originated from non-audited financial records.
6.) We believe that the audit evidence we have obtained is sufficient and appropriate to provide a basis for our audit opinion.
Independent auditors’ report
To the Shareholders of Tiszai Vegyi Kombinát Nyilvánosan Működő Részvénytársaság We have audited the consolidated financial statements of Tiszai Vegyi Kombinát Nyilvánosan Működő Részvénytársaság and its subsidiaries (“the Group”), which comprise the consolidated balance sheet as at 31 December 2009, and the consolidated income statement, consolidated statement of comprehensive income, consolidated statement of changes in equity, consolidated cash flowstatement for the year then ended and the summary of significant accounting policies and other explanatory notes on pages 10-83.
Management’s Responsibility for the Financial StatementsManagement is responsible for the preparation and fair presentation of these financial statements in accordance with International Financial Reporting Standards. This responsibility includes: designing, implementing and maintaining internal control relevant to the preparation and fair presentation of financial statements that are free from material misstatement, whether due to fraud or error; selecting and applying appropriate accounting policies; and making accounting estimates that are reasonable in the circumstances.
Auditor’s Responsibility and Basis of Audit OpinionOur responsibility is to express an opinion on these financial statements based on our audit. We conducted our audit in accordance with International Standards on Auditing. Those standards require that we comply with ethical requirements and plan and perform the audit to obtain reasonable assurance whether the financial statements are free from material misstatement.
An audit involves performing procedures to obtain audit evidence about the amounts and disclosures in the financial statements. The procedures selected depend on the auditor’s judgment, including the assessment of the risks of material misstatement of the financial statements, whether due to fraud or error. In making those risk assessments, the auditor considers internal control relevant to the entity’s preparation and fair presentation of the financial statements in order to design audit procedures that are appropriate in the circumstances, but not for the purpose of expressing an opinion on the effectiveness of the entity’s internal control. An audit also includes evaluating the appropriateness of accounting policies used and the reasonableness of accounting estimates made by management, as well as evaluating the overall presentation of the financial statements.
We believe that the audit evidence we have obtained is sufficient and appropriate to provide a basis for our audit opinion
OpinionIn our opinion, the consolidated financial statements give a true and fair view of the consolidated financial position of Tiszai Vegyi Kombinát Nyilvánosan Működő Részvénytársaság and its subsidiaries as of 31 December 2009, and of the consolidated results of their operations and their cash flows for the year then ended in accordance with International Financial Reporting Standards.
Without qualifying our opinion we draw attention to Note 26 to the consolidated financial statements that describe the environmental aspects of the Company’s operations and highlights the risk of additional
significant decontamination expenses that might incur over the current amount of the provision in relation to past environmental damage as may be identified by future environmental surveys.
Ernst & Young Kft.Budapest, Hungary
11 March 2010
TVK annual report 200944 45InDepenDenT auDITor’S reporT
Független Könyvvizsgálói JelentésIndependent auditor’s report
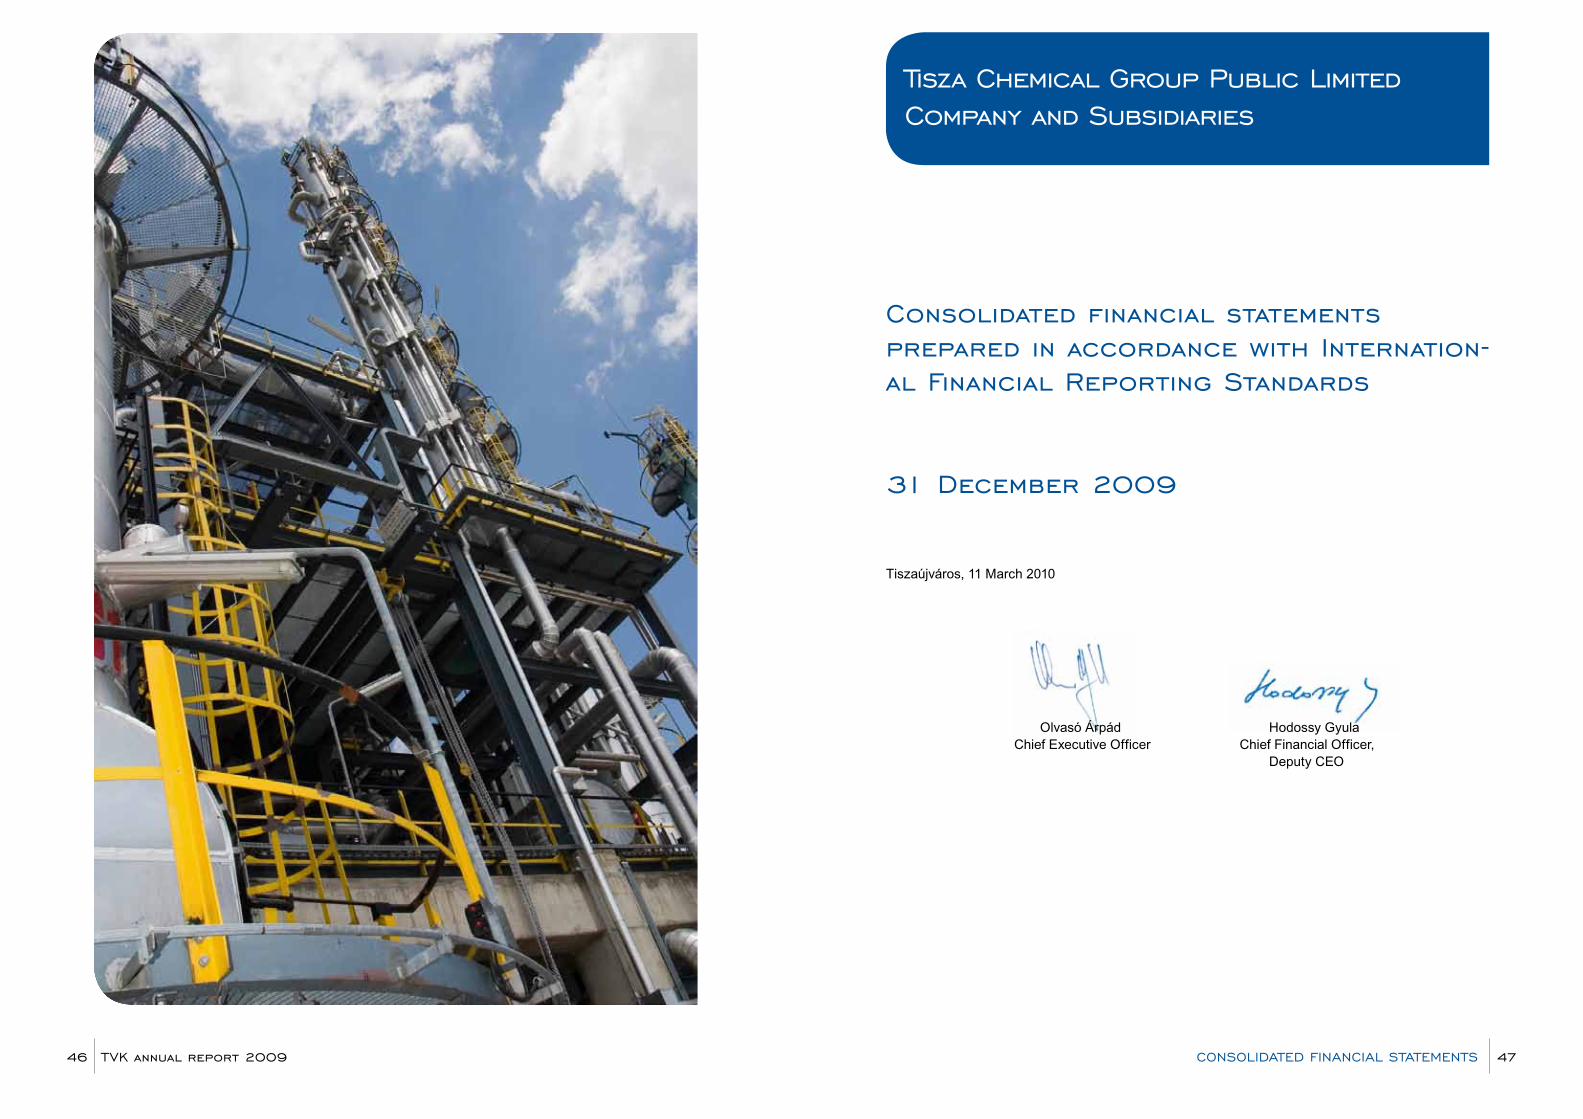
Tisza Chemical Group public limited Company and Subsidiaries
Consolidated financial statements prepared in accordance with Internation-al Financial reporting Standards
31 December 2009
Tiszaújváros, 11 March 2010
Olvasó Árpád Hodossy GyulaChief Executive Officer Chief Financial Officer, Deputy CEO
TVK annual report 200946 47ConSolIDaTeD FInanCIal STaTeMenTS

Consolidated balance sheet31 December 2009
notes 2009 2008
HUF million HUF million
ASSETS
Non-current assets
Intangible assets 3 2,998 3,492
Property, plant and equipment 4 133,660 137,833
Investments in associated companies 5 114 178
Other non-current assets 6 191 189
Total non-current assets 136,963 141,692
Current assets
Inventories 7 7,752 7,072
Trade receivables, net 8 43,456 37,009
Other current assets 9 13,343 15,433
Prepaid taxes 2,948 2,030
Cash and cash equivalents 10 6,942 6,545
Total current assets 74,441 68,089
TOTAL ASSETS 211,404 209,781
EQUITY AND LIABILITIES
Equity attributable to equity holders of the parent
Share capital 11 24,534 24,534
Reserves 12 122,045 124,153
Net income attributable to equity holders of the parent (9,192) (146)
Equity attributable to equity holders of the parent 137,387 148,541
Non-controlling interests - -
Total equity 137,387 148,541
Non-current liabilities
Long-term debt, net of current portion 13 11,632 12,586
Provisions for liabilities and charges 14 2,296 2,724
Deferred tax liabilities 23 3,547 4,423
Other non-current liabilities 15 4,288 13
Total non-current liabilities 21,763 19,746
Current liabilities
Trade and other payables 16 41,575 24,392
Provisions for liabilities and charges 14 308 393
Short-term debt 17 9,478 -
Current portion of long-term debt 13 893 16,709
Total current liabilities 52,254 41,494
TOTAL EQUITY AND LIABILITIES 211,404 209,781
The notes are an integral part of these consolidated financial statements
Consolidated income statement 31 December 2009
notes 2009 2008
HUF million HUF million
Net sales (revenue) 18 265,372 323,406
Other operating income 19 2,049 216
Total operating income 267,421 323,622
Raw materials and consumables used 249,614 288,817
Personnel expenses 20 9,743 9,328
Depreciation, amortization and impairment 3, 4 12,609 13,148
Other operating expenses 21 3,978 4,241
Change in inventories of finished goods and work in progress 60 4,205
Work performed by the enterprise and capitalized (1,073) (672)
Total operating expenses 274,931 319,067
Profit from operations (7,510) 4,555
Financial income 22 562 417
Financial expense 22 2,257 4,100
Net financial expense 22 1,695 3,683
Gain / (Loss) from associates (71) (18)
Profit before tax (9,276) 854
Income tax expense 23 (84) 1,000
Profit for the year (9,192) (146)
Attributable to: Equity holders of the parent (9,192) (146)
Non-controlling interests - -
Earnings per share attributable to ordinary equity holders of the parent (HUF) 24 (378) (6)
The notes are an integral part of these consolidated financial statements
TVK annual report 200948 49ConSolIDaTeD InCoMe STaTeMenT
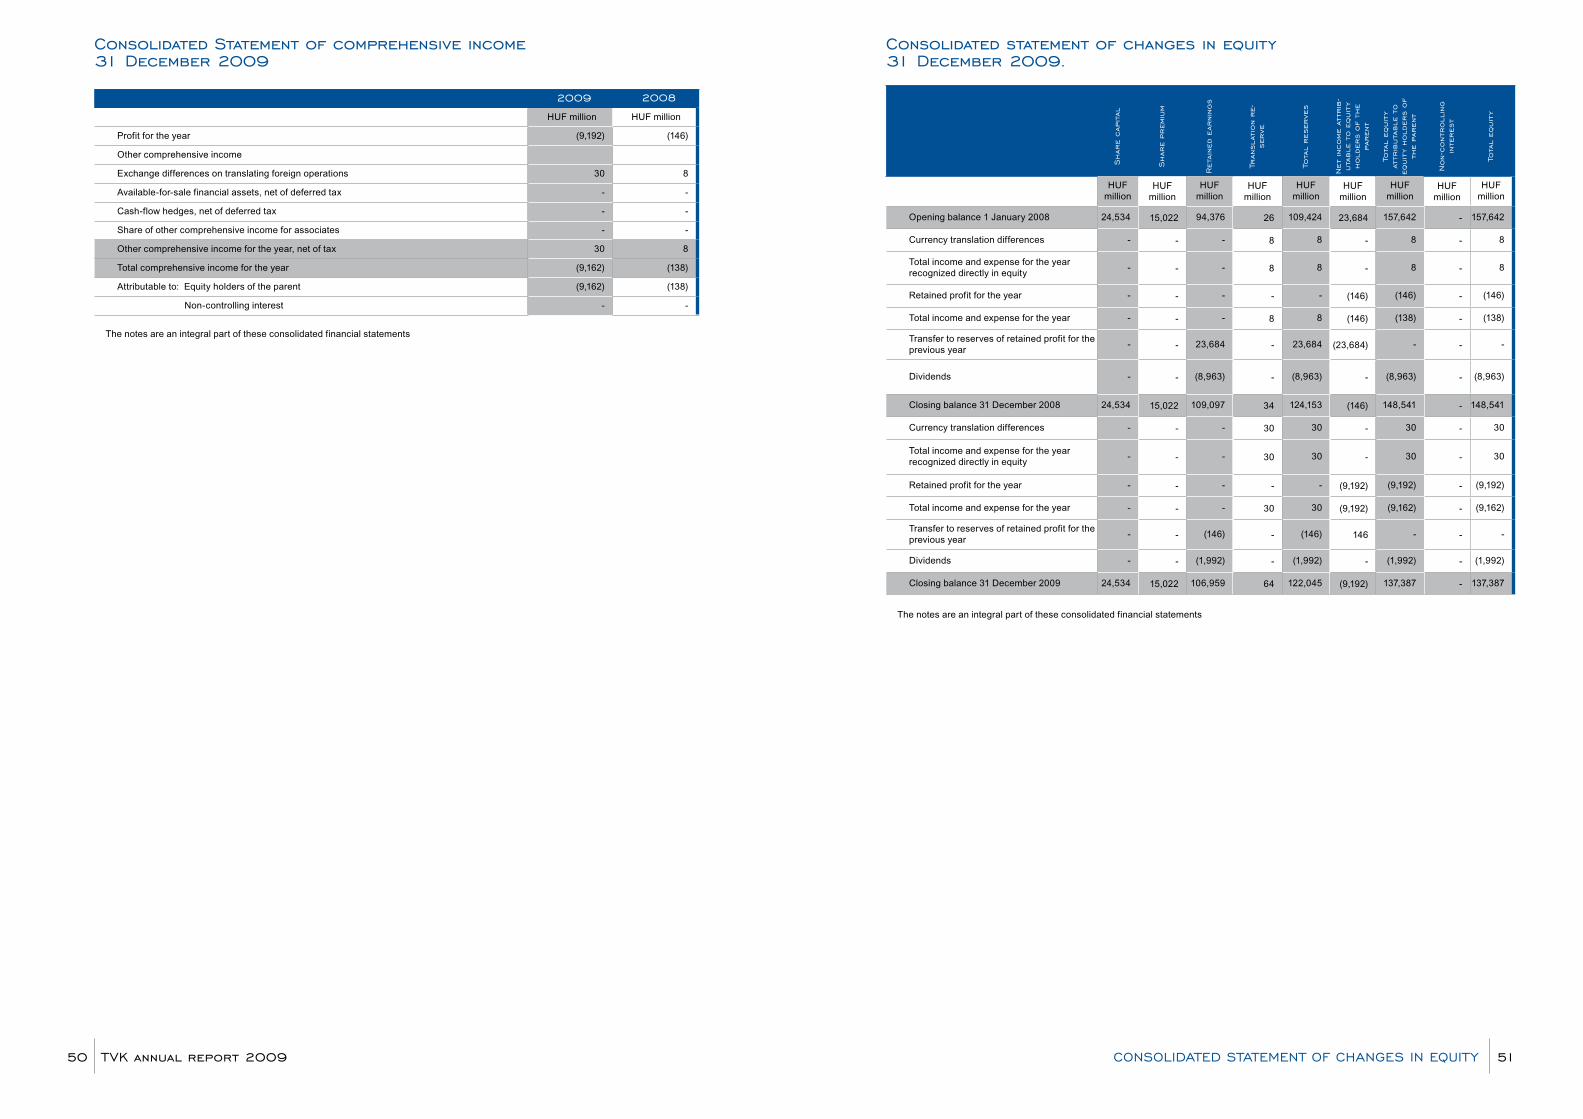
Consolidated Statement of comprehensive income 31 December 2009 2009 2008
HUF million HUF million
Profit for the year (9,192) (146)
Other comprehensive income
Exchange differences on translating foreign operations 30 8
Available-for-sale financial assets, net of deferred tax - -
Cash-flow hedges, net of deferred tax - -
Share of other comprehensive income for associates - -
Other comprehensive income for the year, net of tax 30 8
Total comprehensive income for the year (9,162) (138)
Attributable to: Equity holders of the parent (9,162) (138)
Non-controlling interest - -
The notes are an integral part of these consolidated financial statements
Consolidated statement of changes in equity 31 December 2009.
Shar
e cap
ital
Shar
e prem
ium
reta
ined
ear
ning
s
Tran
slat
ion
re-
serve
Tota
l res
erve
s
net
income
attr
ib-
uta
ble
to e
quit
y hold
ers
of
the
paren
t
Tota
l eq
uit
y at
trib
uta
ble
to
equit
y hold
ers
of
the
paren
t
non-
cont
roll
ing
inte
res
t
Tota
l eq
uit
y
HUFmillion
HUFmillion
HUFmillion
HUFmillion
HUFmillion
HUFmillion
HUFmillion
HUFmillion
HUFmillion
Opening balance 1 January 2008 24,534 15,022 94,376 26 109,424 23,684 157,642 - 157,642
Currency translation differences - - - 8 8 - 8 - 8
Total income and expense for the year recognized directly in equity
- - - 8 8 - 8 - 8
Retained profit for the year - - - - - (146) (146) - (146)
Total income and expense for the year - - - 8 8 (146) (138) - (138)
Transfer to reserves of retained profit for the previous year
- - 23,684 - 23,684 (23,684) - - -
Dividends - - (8,963) - (8,963) - (8,963) - (8,963)
Closing balance 31 December 2008 24,534 15,022 109,097 34 124,153 (146) 148,541 - 148,541
Currency translation differences - - - 30 30 - 30 - 30
Total income and expense for the year recognized directly in equity
- - - 30 30 - 30 - 30
Retained profit for the year - - - - - (9,192) (9,192) - (9,192)
Total income and expense for the year - - - 30 30 (9,192) (9,162) - (9,162)
Transfer to reserves of retained profit for the previous year
- - (146) - (146) 146 - - -
Dividends - - (1,992) - (1,992) - (1,992) - (1,992)
Closing balance 31 December 2009 24,534 15,022 106,959 64 122,045 (9,192) 137,387 - 137,387
The notes are an integral part of these consolidated financial statements
TVK annual report 200950 51ConSolIDaTeD STaTeMenT oF CHanGeS In eQuITy

Consolidated statement of cash-flows 31 December 2009
2009 2008
HUF million HUF million
Profit before tax (9,276) 854
Adjustments to reconcile profit before tax to net cash provided by operating activities
Depreciation and impairment 12,061 12,645
Amortization and impairment 548 503
Write-off of inventories, net (394) 403
Increase/(decrease) in environmental provisions (592) (446)
Increase/(decrease) in provisions 75 (44)
Net (gain) / loss on sale of tangible assets (965) (47)
Write-off of receivables 112 64
Unrealised foreign exchange (gain) / loss on receivables and payables (84) 138
Interest income (535) (377)
Interest on borrowings 1,486 1,971
Net foreign exchange (gain)/ loss excluding foreign exchange differences on receivables and payables
305 1,566
Other financial (gain) / loss, net 264 350
Share of net (profit)/loss of associates 71 18
Operating cash flow before changes in working capital 3,076 17,598
(Increase)/ decrease in inventory (286) 4,745
(Increase)/ decrease in debtors (6,447) 17,671
(Increase)/ decrease in other receivables (6,718) (629)
Increase/(decrease) in accounts payable 18,528 (21,801)
Increase in other current liabilities (1,588) (361)
Income taxes paid (1,710) (2,535)
Net cash provided by operating activities 4,855 14,688
Purchase of Property, Plant and Equipments (8,639) (6,257)
Proceeds from disposals of fixed assets 1,582 64
Loans and long-term bank deposits provided 9,271 (9,780)
Liabilities by CO2 emission quotas 4,283 -
Proceeds from liquidation of investments - -
Proceeds from disposal of other investments (7) 6
Interest received and other financial income 584 404
Dividends received - 16
Net cash used in investing activities 7,074 (15,547)
Proceeds from issue of new debts - 12,078
Repayments of long-term debt (333) (5,372)
Increase/(Decrease) in short-term debt (7,840) -
Increase/(Decrease) in other financial liabilities (3) (720)
Interest paid and other financial costs (1,379) (2,893)
Dividends paid to non-controlling interest and payment on liquidation (1,991) (8,960)
Net cash provided by financing activities (11,546) (5,867)
(Decrease)/increase in cash and cash equivalents 383 (6,726)
Cash and cash equivalents at the beginning of the year 6,545 13,241
Cash and cash equivalents at the end of the year 6,928 6,515
The notes are an integral part of these consolidated financial statements
1. presentation of The Group StructureBackground to the consolidated companies:
TVK Plc.Tiszavidéki Vegyi Kombinát, TVK’s legal predecessor was founded in 1953. In 1961 it was transformed into a state-owned company called Tiszai Vegyi Kombinát (the “state-owned company”). Prior to its privatisation, the state-owned company was incorporated as a public limited liability company on 31 December 1991 (the “Company”). In accordance with the law on the transformation of unincorporated state-owned enterprises, the assets and liabilities of TVK were revalued as at that date.
As at 31 December 1995, the Company was 99.92% owned by the Hungarian State Privatisation and Holding Company (“ÁPV Rt.”) and the remaining 0.08% was owned by local municipalities.
In 1996, the Company was privatised through an offering of shares owned by ÁPV Rt. to foreign and domestic institutional and private investors.
Following this privatisation, shares of the Company were listed on the Budapest Stock Exchange and Global Depository Receipts (“GDRs”) representing the shares were listed on the London Stock Exchange. As of 31 December 2009, MOL Plc. holds the majority of the shares.
The Company, with its registered seat in Tiszaújváros (H-3581 Tiszaújváros, TVK-Ipartelep TVK Központi Irodaház 2119/3. hrsz. 136. épület), produces chemical raw materials including ethylene, propylene and polymers of these products for both domestic and foreign markets.
The Group had 1,167 and 1,170 employees as at 31 December 2009 and 2008, respectively
Consolidated subsidiaries
Company name Country range of activity ownership 31 Dec 2009
ownership 31 Dec 2008
Consolidation Method 31 Dec 2009
TVK Ingatlankezelő Kft. HungaryProperty leasing, management 100% 100% Full consolidation
TVK Italia Srl. Italy Wholesale and retail trade 100% 100% Full consolidation
TVK UK Ltd.* United Kingdom Wholesale and retail trade 100% 100% Full consolidation
TVK Inter-Chemol GmbH Germany Wholesale and retail trade 100% 100% Full consolidation
TVK France S.a.r.l. France Wholesale and retail trade 100% 100% Full consolidation
TVK Erőmű Kft.** HungaryElectricity production and distribution 26% 26% Full consolidation
TVK Polska Spzoo Poland Wholesale and retail trade 100% 100% Full consolidation
TVK Ukraina tov Ukraine Wholesale and retail trade 100% 100% Full consolidation
Tisza WTP Kft*** Hungary Feed water and raw water 0% 0% Full consolidation
*Dissolution started on 1 July, 2009** The ownership of TVK Plc is 26%. The syndicated agreement between the owners, gives TVK Plc . operating policies of TVK Erőmű Kft., it is fully consolidated in 2009 and 2008.*** Tisza-Wtp Kft was formed in 2002 specifically for providing feed water and raw water to TVK Plc. and TVK Erőmű Kft under a long-term co-operation agreement. Tisza WTP Kft has been consolidated by the Company since 1 January 2006 in accordance with SIC 12. According to service agreement Tisza WTP Kft. provides services that is consistent with the Group’s ongoing major operations and TVK Group is the exclusive purchaser of services provided by Tisza WTP.
notes to the consolidated financial statements preparedin accordance with International Financial reporting Standards
TVK annual report 200952 53noTeS To THe ConSolIDaTeD FInanCIal STaTeMenTS
2. Basis of preparationTVK Plc. prepares its statutory unconsolidated financial statements in accordance with the requirements of the accounting regulations contained in Law C of 2000 on Accounting (HAS). Some of the accounting principles prescribed in this law differ from International Financial Reporting Standards (IFRS).
For the purposes of the application of the Historical Cost Convention, the consolidated financial statements treat the Company as having come into existence as of 31 December 1991, at the carrying values of assets and liabilities determined at that date, subject to the IFRS adjustments.
These consolidated financial statements have been approved and authorized for issue by the Board of Directors on 11 March 2010.
The financial year is the same as the calendar year.
i) Statement of compliance
These consolidated financial statements have been prepared in accordance with International Financial Reporting Standards (“IFRS”) and all applicable IFRSs that have been adopted by the EU. IFRS comprise standards and interpretations approved by the International Accounting Standards Board (“IASB”) and the International Financial Reporting Interpretations Committee (“IFRIC”).
Effective 1 January 2005, the change in the Hungarian Accounting Act allows the Group to prepare its consolidated financial statements in accordance with IFRS that have been adopted by the EU. Curently, due to the endorsement process of the EU, and the activities of the Group, there is no difference in the policies applied by the Group between IFRS and IFRS that have been adopted by the EU.
ii) principles of Consolidation
SubsidiariesThe consolidated financial statements include the accounts of TVK Plc. and the subsidiaries that it controls. This control is normally evidenced when the Group owns, either directly or indirectly, more than 50% of the voting rights of a company’s share capital and is able to govern the financial and operating policies of an enterprise so as to benefit from its activities. As required by IAS 27, immediately exercisable voting rights are taken into account when determining control. The acquisition method of accounting is used for acquired businesses by measuring assets and liabilities at their fair values upon acquisition, the date of which is determined with reference to the date of obtaining control. The cost of an acquisition is measured at the aggregate of the consideration transferred and the amount of any non-controlling interest (formerly known as minority interest) in the acquiree. The income and expenses of companies acquired or disposed of during the year are included in the consolidated financial statements from the date of acquisition or up to the date of disposal.
Intercompany balances and transactions, including intercompany profits and unrealised profits and losses are eliminated. The consolidated financial statements are prepared using uniform accounting policies for like transactions and other events in similar circumstances.
Non-controlling interests represent the profit or loss and net assets not held by the Group and are shown separately in the consolidated balance sheets and the consolidated income statement, respectively. For each business combination, non-controlling interest is stated either at fair value or at the non-controlling interests’ proportionate share of the acquiree’s fair values of net assets. The choice of measurement basis is made on an acquisition-by-acquisition basis. Subsequent to acquisition, the carrying amount of non-controlling interests is the initially recognised amount of those interests adjusted with the non-controlling interests’ share of consecutive changes in equity. Total comprehensive income is attributed to non-controlling interests even if this results in the non-controlling interests having a negative balance.
Changes in the Group’s interests in subsidiaries that do not result in a loss of control are accounted for as equity transactions. The carrying amounts of the Group’s interests and the non-controlling interests are adjusted to reflect the changes in their relative interests in the subsidiaries. Any difference between the amount by which the non-controlling interests are adjusted and the fair value of the consideration paid or received is recognized directly in equity and attributed to the owners of the company.
Joint venturesA joint venture is a contractual arrangement whereby two or more parties (ventures) undertake an economic activity that is subject to joint control. Joint control exists only when the strategic financial and operating decisions relating to the activity require the unanimous consent of the ventures. A jointly controlled entity is a joint venture that involves the establishment of a company, partnership or other entity to engage in economic activity that the group jointly controls with its fellow ventures.
The Company’s interests in its joint ventures are accounted for by the proportionate consolidation method, where a proportionate share of the joint venture’s assets, liabilities, income and expenses is combined with similar items in the consolidated financial statements on a line-by-line basis. The financial statements of the joint ventures are prepared for the same reporting year as the parent company, using consistent accounting policies. The joint venture is proportionately consolidated until the date on which the Group ceases to have joint control over the venture. When the Group contributes or sells assets to the joint venture, any portion of gain or loss from the transaction is recognized based on the substance of the transaction. When the Group purchases assets from the joint venture, the Group does not recognize its share of the profits of the joint venture from the transaction until it resells the assets to an independent party. Losses on intragroup transactions are recognised immediately if the loss provides evidence of reduced net realisable value of current assets or impairment loss.
When the joint control is lost, the Group measures and recognises its remaining investment at its fair value unless the joint control does not become a subsidiary or associate. The difference between the carrying amount of the joint entity and the fair value of the remaining investment together with any proceeds from disposal is recognised in profit or loss.
Investments in associatesAn associate is an entity over which the group is in a position to exercise significant influence through participation in the financial and operating policy decisions of the investee, but which is not a subsidiary or a jointly controlled entity.
The Group’s investments in its associates are accounted for using the equity method of accounting. Under the equity method, the investment in the associate is carried in the balance sheet at cost plus post acquisition changes in the Group’s share of net assets of the associate. Goodwill relating to an associate is included in the carrying amount of the investment and is not amortised. The income statement reflects the share of the results of operations of the associate. Where there has been a change recognized directly in the equity of the associate, the Group recognizes its share of any changes and discloses this, when applicable, in the statement of changes in equity. Profits and losses resulting from transactions between the Group and the associate are eliminated to the extent of the interest in the associate.
The reporting dates of the associate and the Group are identical and the associate’s accounting policies conform to those used by the Group for like transactions and events in similar circumstances.Investments in associates are assessed to determine whether there is any objective evidence of impairment. If there is evidence that the recoverable amount of the investment is lower than its carrying value, then the difference is recognised as impairment loss in the income statement. Where losses were made in previous years, an assessment of the factors is made to determine if any loss may be reversed.
When the significant influence over the associate is lost, the Group remeasures and recognises any retaining investment at its fair value. The difference between the carrying amount of the associate and the fair value of the retaining investment together with any proceeds from disposal is recognised in profit or loss.
TVK annual report 200954 55noTeS To THe ConSolIDaTeD FInanCIal STaTeMenTS
Other consolidated entities Special purpose entities are fully consolidated. Special purpose entities are companies which operate substantially in compliance with the Company business needs. It provides a supply of goods or services that is consistent with the Company’s ongoing major or central operations.
2.1 Changes in accounting policies
The accounting policies adopted are consistent with those applied in the previous financial years.
The Group has adopted the following new and amended IFRS and IFRIC interpretations during the year. Except as noted below, adoption of these standards and interpretations did not have any effect on the financial statements of the Group. They did however give rise to additional disclosures.
• IFRS1 – First-time Adoption of International Financial Reporting Standards• IFRS 2 – Share-based Payment • IFRS 3 – Business Combinations (Revised)• IFRS 7 – Financial Instruments: Disclosures• IFRS 8 – Operating Segments• IAS 1 – Presentation of Financial Statements• IAS 16 – Property, Plant and Equipment• IAS 19 – Employee Benefits• IAS 20 – Accounting for Government Grants and Disclosures of Government Assistance • IAS 23 – Borrowing costs• IAS 27 – Consolidated and Separate Financial Statements• IAS 28 – Investments in Associates• IAS 29 – Financial Reporting in Hyperinflationary Economies• IAS 31 – Investments in Joint Ventures• IAS 32 – Financial Instruments: Presentation• IAS 36 – Impairment of Assets• IAS 38 – Intangible Assets• IAS 39 – Financial Instruments: Recognition and Measurement• IAS 40 – Investment Property• IFRIC 15 – Agreements for the Construction of Real Estate
The Group has early adopted IFRS 3 Business Combinations (Revised) and IAS 27 Consolidated and Separate Financial Statements from 1 January 2009.
The principal effects of these changes are as follows:IFRS 1 First-time Adoption of International Financial Reporting Standards The new version of IFRS 1 retains the substance of the previous version, but with a changed structure. It replaces the old version of IFRS 1 and becomes effective for entities applying IFRS’s for the first time for annual periods beginning on or after 1 January 2009.
IFRS 2 Share-based PaymentThis amendment to IFRS 2 – Share-based Payment becomes effective for financial years beginning on or after 1 January 2009. It clarifies the definition of vesting and non-vesting conditions, as well as the accounting treatment of cancellations. The amendment did not have any material impact on the existing share-based scheme of the Group.
IFRS 3 Business Combinations (Revised)The revised standard comes into effect for business combinations for which the acquisition date is on or after the beginning of the first annual reporting period beginning on or after 1 July 2009. It introduces significant changes in the accounting for business combinations as outlined below:Business combinations are accounted for using the acquisition method and all acquisition costs incurred are expensed as opposed to the previous version of IFRS 3 where business combinations were accounted for using the purchase method and transaction costs directly attributable to the acquisition formed part of the acquisition costs. For business combination achieved in stages, the acquirer’s
previously held equity interest in the acquiree is remeasured to fair value as at the acquisition date through profit and loss. At acquisition the embedded derivatives separated from the host contract by the acquiree are reassessed; while previously those were only assessed, if the business combination resulted in a change in the terms of the contract that significantly modified the cash flows that otherwise would have been required under the contract.The IFRS 3 Revised allows a choice on the measurement of non-controlling interests either at fair value or at the non-controlling interests’ proportionate share of the acquiree’s net identifiable assets, where previously only the latter was permitted. Additional guidance is added on recognition and subsequent accounting requirements for contingent consideration. Under the previous version of the Standard, contingent consideration was recognised if, and only if, the Group had a present obligation that the economic outflow was more likely than not and a reliable estimate could be determined. Subsequent adjustments to the contingent consideration affected goodwill. The revised IFRS 3R measures contingent consideration at fair value at the acquisition date; subsequent adjustments to it are recognised against goodwill only to the extent that they arise from better information about the acquisition date fair value within a timeframe of 12 months from the acquisition date. All other subsequent adjustments are recognised in profit and loss.
IFRS 7 Financial Instruments: DisclosuresThe amendments to IFRS 7 seek to enhance disclosures about fair value measurements and liquidity risk. Fair value measurements related to items recorded at fair value are to be disclosed by source of inputs using a three level fair value hierarchy. In addition, reconciliation between the beginning and ending balance for level 3 fair value measurements is required, as well as significant transfers between levels in the fair value hierarchy. The amendments also clarify the requirements for liquidity risk disclosures with respect to derivative transactions and assets used for liquidity management. The changes are effective starting on or after 1 January 2009.
IFRS 8 Operating SegmentsIFRS was issued in November 2006 and becomes effective for financial years beginning on or after 1 January 2009. This standard requires disclosure of information about the Group’s operating segments and replaces the requirement to determine primary (business) and secondary (geographical) reporting segments of the Group. There are no changes in the current disclosures, as the primary business segments determined for reporting purposes qualify as operating segments under the new standard.
IAS 1 Presentation of Financial Statements The revised standard (effective from 1 January 2009) separates owner and non-owner changes in equity. Therefore, the statement of changes in equity includes only details of transactions with owners, with all non-owner changes in equity presented as a single line. In addition, the standard introduces the statement of comprehensive income which presents all items of recognised income and expense, either in one single statement, or in two linked statements. The Group applies IAS 1 (Revised) from 1 January 2009 electing the option to present separate income statement and statement of comprehensive income as performance statements.
IAS 16 Property, Plant and EquipmentIASB replaced the term “net selling price” with “fair values less costs to sell”. Items of property, plant and equipment held for rental that are routinely sold in the ordinary course of business after rental, are transferred to inventory when rental ceases and they are held for sale. IAS 19 Employee BenefitsThis improvement revised the definition of ‘past service costs’, ‘return on plan assets’ and ‘short-term’ and ‘other long–term’ employee benefits. Amendments to plans that result in a reduction in benefits related to future services should be accounted for as curtailment. The reference to the recognition of contingent liabilities has been deleted to ensure consistency with IAS 37.
IAS 20 Accounting for Government Grants and Disclosures of Government AssistanceAccording to this improvement loans granted in the future with no or low interest rates will not be exempt from the requirement to impute interest. The difference between the amount received and the discounted
TVK annual report 200956 57noTeS To THe ConSolIDaTeD FInanCIal STaTeMenTS
amount should be accounted for as government grant. Also various terms had been changed in order to be consistent with other IFRS.
IAS 23 Borrowing CostsThe revised standard requires capitalisation of borrowing costs when such costs relate to a qualifying asset. A qualifying asset is an asset that necessarily takes a substantial period of time to get ready for its intended use or sale. The Group currently follows this policy; therefore the change has no impact on the consolidated financial statements.
IAS 27 Consolidated and Separate Financial StatementsThe revised Standard became effective as of 1 July 2009. It requires that a change in the ownership interest of a subsidiary, which does not result in loss of control, is accounted for as a transaction with owners in their capacity as owners. Therefore, such transactions will no longer give rise to goodwill, nor it will they give rise to a gain or loss. In addition, the total comprehensive income is attributed to the owners of the parent and to the non-controlling interest even if this results in the non-controlling interest having a negative balance. The previous standard allocated such excess losses to the owners of the parent except for some rare circumstances. Furthermore, requirements have been added to treat changes in a parent’s ownership interest in a subsidiary which result in loss of control of a subsidiary specifying that any gain or loss arising on the loss of control of a subsidiary must be recognized in profit or loss.
Additionally, when a parent entity accounts for subsidiary at fair value in accordance with IAS 39 in its separate financial statements, this treatment should continue when the subsidiary is subsequently classified as held for sale.
The revised standard has been early adopted by the Group together with IFRS 3 for periods beginning on or after 1 January 2009. IAS 28 Investments in AssociatesIf an associate is accounted for at fair value in accordance with IAS 39, only the requirement of IAS 28 to disclose the nature and extent of any significant restrictions on the ability of the associate to transfer funds to the entity in the form of cash or repayment of loans applies. This amendment has no impact on the Group as it does not account for its associates at fair value in accordance with IAS 39.An investment in an associate is a single asset for the purpose of conducting the impairment test. Therefore, any impairment test is not separately allocated to the goodwill included in the investment balance. This amendment has no impact on the Group because this policy was already applied.
IAS 29 Financial Reporting in Hyperinflationary EconomiesThis amendment revised the reference to the exception to measure assets and liabilities at historical cost, such that it notes property, plant and equipment as being example, rather than implying that is a definitive list. Also various terms have been changed in order to be consistent with other IFRS.
IAS 31 Interests in Joint VenturesIf a joint venture is accounted for at fair value, in accordance with IAS 39, only the requirements of IAS 31 to disclose the commitments of the venturer and the joint venture, as well as summary financial information about the assets, liabilities, income and expense will apply. This amendment has no impact on the Group because it does not account for its joint ventures at fair value in accordance with IAS 39.
IAS 32 Financial Instruments: Presentation and IAS 1 Presentation of Financial Statements – Puttable Financial Instruments and obligations Arising on LiquidationThese revised standards become effective for financial years beginning on or after 1 January 2009. They require some puttable financial instruments and some financial instruments that impose on the entity an obligation to deliver to another party a pro rata share of the net assets of the entity only on liquidation to be classified as equity. The amendment has no impact on the existing financial instruments of the Group.
IAS 36 Impairment of AssetsWhen discounted cash flows are used to estimate ‘fair value less cost to sell’ additional disclosures required when the discounted cash flows are used to estimate ‘value in use’. This amendment has no immediate impact on the consolidated financial statements of the Group because the recoverable amount of its CGUs is currently estimated using ‘value in use’. IAS 38 Intangible AssetsExpenditure on advertising and promotional activities is recognised as an expense when the Group either has the right to access the goods or has received the service. This amendment has no impact on the Group because it does not enter into such promotional activities.Additionally, the revised standard determines that in a business combination an intangible asset must be recognised separately from goodwill even, if it is separable together with a related contract. Complimentary intangible assets with similar useful lives or intangible assets which are only separable together with another intangible asset can be recognised together as a single asset.
IAS 39 Financial Instruments: Recognition and MeasurementAccording to this improvement, changes in circumstances relating to derivatives are not reclassifications and therefore may be either removed from, or included in, the ‘fair value through profit or loss’ classification after initial recognition. The reference in IAS 39 to a ‘segment’, when determining whether an instrument qualifies as a hedge, has been removed. The use of the revised effective interest rate also is required when re-measuring a debt instrument on the cessation of fair value hedge accounting.
IAS 40 Investment PropertyThis amendment revised the scope such that property under construction or development for future use as an investment property is classified as investment property. If fair value cannot be reliably determined, the investment under construction should be measured at cost until such time as fair value can be determined or construction is complete. The amendment also revised the conditions for voluntary change in accounting policy to be consistent with IAS 8 and clarified that the carrying amount of investment property held under lease is the valuation obtained increased by any recognised liability.
IFRIC 15 Agreements for the Construction of Real EstateIFRIC 15 was issued in July 2008 and becomes effective for financial years beginning on or after 1 January 2009. The interpretation is to be applied retrospectively. It clarifies when and how revenue and related expenses from the sale of a real estate unit should be recognised if an agreement between a developer and a buyer is reached before the construction of the real estate is completed. Furthermore, the interpretation provides guidance on how to determine whether an agreement is within the scope of IAS 11 or IAS 18. IFRIC 15 has no an impact on the consolidated financial statement because the Group does not conduct such activity.
Issued but not yet effective International Financial reporting Stan-dardsAt the date of authorisation of these financial statements, the following Standards and Interpretations were in issue but not yet effective:
IFRS 1 (Revised) – First-time Adoption of International Financial Reporting Standards The revised standard (effective from 1 January 2010) aims at simplifying the retrospective application of IFRSs in two particular situations. First, entity using the full-cost method is exempt from retrospective application of IFRSs for oil and gas assets. The entity, choosing to apply this exemption, will use the carrying amount under its old GAAP as the costs of its oil and gas assets at the date of first-time adoption of IFRSs. Second, entity is exempt from having to apply IFRIC 4 Determining whether an Arrangement Contains a Lease when it adopts IFRSs, if the entity made the same type of determination of whether an arrangement contains a lease in accordance with its previous GAAP as that required by IFRIC 4. The group will apply IFRS 1 (Revised) from 1 January 2010. The revision will have no material impact on the currently reported financial position of the Group.
TVK annual report 200958 59noTeS To THe ConSolIDaTeD FInanCIal STaTeMenTS
IFRS 2 Share-based Payment (amendment) – Cash-settled Share-based Payment Transactions The amendments to IFRS 2 Share-based Payment become effective for financial years beginning on or after 1 January 2010 and must be applied retrospectively. They clarify how an individual subsidiary in a group should account for share-based payment arrangements in its own financial statements. The amendments to IFRS 2 also incorporate guidance previously included in IFRIC 8 Scope of IFRS 2 and IFRIC 11 IFRS 2 – Group and Treasury Share Transactions. As a result IFRIC 8 and IFRIC 11 have been withdrawn.
IFRS 9 Financial Instruments – Classification and measurementThe IFRS 9 was issued on 12 November 2009 and is intended to replace IAS 39 Financial Instruments: Recognition and measurement. The standard introduces new requirements for classifying and measuring financial assets that must be applied starting 1 January 2013. According to IFRS 9 all financial assets are initially recognised at fair value plus transaction costs. The standard also eliminates the currently existing in IAS 39: available-for-sale and held-to-maturity categories.
IAS 24 Related Party DisclosureThe amendments to IAS 24 Related Party Disclosures become effective for financial years beginning on or after 1 January 2010 and must be applied retrospectively. The revised standard simplifies the disclosure requirements for entities that are controlled, jointly controlled or significantly influenced by a government and clarifies the definition of a related party. As a result, such a reporting entity is exempt from the general disclosure requirements in relation to transactions and balances with the government and government-related entities.
IFRIC 17 Distributions of Non-cash Assets to OwnersIFRIC 17 was issued in November 2008 and becomes effective for financial years beginning on or after 1 July 2009. This interpretation provides guidance on the accounting treatment when an entity distributes assets other than cash as dividends to its shareholders. The dividend should be measured at the fair value of the assets distributed and the difference between this amount and the previous carrying amount of the assets distributed should be recognised in profit or loss when the entity settles the dividend payable. This interpretation has no impact on the Group because dividend is distributed in cash.
IFRIC 18 Transfers of Assets from CustomersIFRIC 18 was issued in January 2009 and becomes effective for financial years beginning on or after 1 July 2009. Entities in specific sectors often receive items of property, plant and equipment form their customers, or cash to acquire or construct specific assets. These assets are then used to connect customers to a network and/or provide them with ongoing access to a supply of goods and/or services. This interpretation provides guidance on when and how an entity should recognise such assets. When the item of property, plant and equipment transferred from a customer meets the definition of an asset under the IASB Framework from the perspective of the recipient, the recipient must recognise the asset in its financial statements. If the customer continues to control the transferred item, the asset definition would not be met even if ownership of the asset is transferred to the utility or other recipient entity. This interpretation is not expected to have no material effect on the Group’s financial statements.
Improvements to IFRSsIn April 2009 the Board issued its first collection of amendments to its standards, primarily view to remove inconsistencies and clarify wording. These amendments will be effective from 1 January 2010. The Group has not yet adopted the following amendments but it is anticipated that these changes will have no material effect on the Group’s financial statements.
IFRS 2 Share-based PaymentIFRS 2 excludes from its scope transactions that meet the definition of a business combination under IFRS 3 Business Combinations.
IFRS 5 Non-current assets Held for Sale and Discontinued OperationsThis amendment specifies the disclosures required in connection with non-current assets (or disposal groups) classified as held for sale or discontinued operations. Disclosures in other IFRSs do not apply
to such assets unless the particular standard requires a disclosure in respect of non-current assets classified as held for sale or discontinued operations.
IFRS 8 Operating SegmentsThis amendment clarifies that a measure of total assets shall be reported, if such a measure is reported to the management of the entity.
IAS 1 Presentation of Financial StatementsThe amendment clarifies the classification between current and non-current convertible instruments.
IAS 7 Statement of Cash FlowsThe amendment constitutes that only expenditure that results in asset recognition can be classified as “investing” in the statement of cash flows.
IAS 17 LeasesThe amendment determines that for those land leases for which retrospective information is available, a classification reassessment of unexpired leases based on conditions at inception date should be carried out. Additionally, an entity should retrospectively recognise land leases that are currently finance leases based on their fair values at the inception date of the lease.
IAS 32 Financial Instruments: Presentation The amendment is effective for annual periods beginning on or after 1 February 2010 and requires that rights, options and warrants to acquire a fixed number of an entity’s own equity instruments for a fixed price of any currency are equity instruments.
IAS 36 Impairment of AssetsThe amendment determines that the unit of allocation of goodwill when testing for impairment should not be larger than an operating segment as defined in IFRS 8.
IAS 39 Financial Instruments: Recognition and MeasurementThe amendment clarifies when gains or losses on hedging instruments should be reclassified from equity to profit or loss. In addition, forward contracts entered into as part of a business combination are exempt from the scope of IFRS 39.
TVK annual report 200960 61noTeS To THe ConSolIDaTeD FInanCIal STaTeMenTS
2.2 Summary of significant accounting policies
i) Presentation CurrencyBased on the economic substance of the underlying events and circumstances the functional currency of the parent company and the presentation currency of the Group has been determined to be the Hungarian Forint (HUF).
ii) Business CombinationsBusiness combinations are accounted for using the acquisition method. This involves assessing all assets and liabilities assumed for appropriate classification in accordance with the contractual terms and economic conditions and recognising identifiable assets (including previously unrecognized intangible assets) and liabilities (including contingent liabilities and excluding future restructuring) of the acquired business at fair value as at the acquisition date. Acquisition-related costs are recognised in profit or loss as incurred.
When a business combination is achieved in stages, the Group’s previously held equity interest in the acquiree is remeasured to fair value as at the acquisition date and the resulting gain or loss is recognised in profit or loss.
Contingent consideration to be transferred by the acquirer is recognised at fair value at the acquisition date. Subsequent changes to the fair value of the contingent consideration are adjusted against the cost of acquisition, only if they qualify as period measurement adjustments and occur within 12 months from the acquisition date. All other subsequent changes in the fair value of contingent consideration are accounted for either in profit or loss or as changes to other comprehensive income. Changes in the fair value of contingent consideration classified as equity are not recognised.
Goodwill acquired in a business combination is initially measured at cost being the excess of the cost of the business combination over the Group’s interest in the net fair value of the acquiree’s identifiable assets, liabilities and contingent liabilities. If the consideration transferred is lower than the fair value of the net assets of the acquiree, the difference is then recognised in profit or loss. Following initial recognition, goodwill is measured at cost less any accumulated impairment losses. For the purpose of impairment testing, goodwill acquired in a business combination is, from the acquisition date, allocated to each of the Group’s cash generating units, or groups of cash generating units, that are expected to benefit from the synergies of the combination, irrespective of whether other assets or liabilities of the Group are assigned to those units or groups of units. Each unit or group of units to which the goodwill is allocated represents the lowest level within the Group at which the goodwill is monitored for internal management purposes, and is not larger than a segment based on the Group’s reporting format determined in accordance with IFRS 8 Operating Segments.
Where goodwill forms part of a cash-generating unit (or group of cash generating units) and part of the operation within that unit (or group) is disposed of, the goodwill associated with the operation disposed of is included in the carrying amount of the operation when determining the gain or loss on disposal of the operation. Goodwill disposed of in this circumstance is measured based on the relative values of the operation disposed of and the portion of the cash-generating unit retained. When subsidiaries are sold, the difference between the selling price and the net assets plus cumulative translation differences and un-amortized goodwill is recognized in the income statement.
iii) Investments and Other Financial AssetsFinancial assets within the scope of IAS 39 are classified as either financial assets at fair value through profit or loss, loans and receivables, held to maturity investments, or available for sale financial assets, as appropriate. When financial assets are recognized initially, they are measured at fair value, plus, in the case of investments not at fair value through profit or loss, directly attributable transaction costs.
The Group considers whether a contract contains an embedded derivative when the entity first becomes a party to it.
Purchases and sales of investments are recognized on settlement date which is the date when the asset is delivered to the counterparty.
The Group’s financial assets are classified at the time of initial recognition depending on their nature and purpose. Financial assets include cash and short-term deposits, trade receivables, loans and other receivables, quoted and unquoted financial instruments and derivative financial instruments.
Financial assets at fair value through profit or lossFinancial assets at fair value through profit or loss includes financial assets held for trading and financial assets designated upon initial recognition as at fair value through profit and loss.
Financial assets are classified as held for trading if they are acquired for the purpose of selling in the near term. Derivatives, including separated embedded derivatives are also classified as held for trading unless they are designated as effective hedging instruments or a financial guarantee contract. Gains or losses on investments held for trading are recognized as finance income or finance expense in the income statement.
Financial assets may be designated at initial recognition as at fair value through profit or loss if the following criteria are met: (i) the designation eliminates or significantly reduces the inconsistent treatment that would otherwise arise from measuring the assets or recognising gains or losses on them on a different basis; or (ii) the assets are part of a group of financial assets which are managed and their performance evaluated on a fair value basis, in accordance with a documented risk management strategy; or (iii) the financial asset contains an embedded derivative that would need to be separately recorded. Such financial assets are recorded as current, except for those instruments which are not due for settlement within 12 months from the balance sheet date and are not held with the primary purpose of being traded. In this case all payments on such instruments are classified as non-current.
As at 31 December 2009 and 2008, no financial assets have been designated as at fair value through profit and loss.
Held-to-maturity investmentsHeld-to-maturity investments are non-derivative financial assets which carry fixed or determinable payments have fixed maturities and which the Group has the positive intention and ability to hold to maturity. After initial measurement held to maturity investments are measured at amortised cost. This cost is computed as the amount initially recognized minus principal repayments, plus or minus the cumulative amortisation using the effective interest method of any difference between the initially recognized amount and the maturity amount, less allowance for impairment. This calculation includes all fees and points paid or received between parties to the contract that are an integral part of the effective interest rate, transaction costs and all other premiums and discounts. Gains and losses are recognized in the income statement when the investments are derecognized or impaired, as well as through the amortisation process.
Loans and receivablesLoans and receivables are non-derivative financial assets with fixed or determinable payments that are not quoted in an active market. After initial measurement loans and receivables are subsequently carried at amortised cost using the effective interest method less any allowance for impairment. Amortised cost is calculated taking into account any discount or premium on acquisition and includes fees that are an integral part of the effective interest rate and transaction costs. Gains and losses are recognized in the income statement when the loans and receivables are derecognized or impaired, as well as through the amortisation process.
Available-for-sale financial investmentsAvailable-for-sale financial assets are those non-derivative financial assets that are designated as available-for-sale or are not classified in any of the three preceding categories. After initial measurement,
TVK annual report 200962 63noTeS To THe ConSolIDaTeD FInanCIal STaTeMenTS
available for sale financial assets are measured at fair value with unrealised gains or losses being recognized directly in equity in the fair valuation reserve. When the investment is disposed of, the cumulative gain or loss previously recorded in equity is recognized in the income statement.
After initial recognition available-for-sale financial assets are evaluated on the basis of existing market conditions and management intent to hold on to the investment in the foreseeable future. In rare circumstances when these conditions are no longer appropriate, the Group may choose to reclassify these financial assets to loans and receivables or held-to-maturity when this is in accordance with the applicable IFRS.
Fair ValueFor investments that are actively traded in organised financial markets, fair value is determined by reference to quoted market prices at the close of business on the balance sheet date without any deduction for transaction costs. For investments where there is no quoted market price, fair value is determined by reference to the current market value of another instrument which is substantially the same or is calculated based on the expected cash flows of the underlying net asset base of the investment.
iv) Classification and Derecognition of Financial Instruments
Financial assets and financial liabilities carried on the consolidated balance sheet include cash and cash equivalents marketable securities, trade and other accounts receivable and payable, long-term receivables, loans, borrowings, investments, and bonds receivable and payable. The accounting policies on recognition and measurement of these items are disclosed in the respective accounting policies found in this Note.
Financial instruments (including compound financial instruments) are classified as assets, liabilities or equity in accordance with the substance of the contractual arrangement. Interest, dividends, gains, and losses relating to a financial instrument classified as a liability, are reported as expense or income as incurred. Distributions to holders of financial instruments classified as equity are charged directly to equity. In case of compound financial instruments the liability component is valued first, with the equity component being determined as a residual value. Financial instruments are offset when the Company has a legally enforceable right to offset and intends to settle either on a net basis or to realise the asset and settle the liability simultaneously.
The derecognition of a financial asset takes place when the Group no longer controls the contractual rights that comprise the financial asset, which is normally the case when the instrument is sold, or all the cash flows attributable to the instrument are passed through to an independent third party. When the Group neither transfers nor retains all the risks and rewards of the financial asset and continues to control the transferred asset, it recognises its retained interest in the asset and a liability for the amounts it may have to pay.
v) Derivative Financial InstrumentsThe Group uses derivative financial instruments such as forward currency contracts and interest rate swaps to hedge its risks associated with interest rate and foreign currency fluctuations. Such derivative financial instruments are initially recognized at fair value on the date on which a derivative contract is entered into and are subsequently remeasured at fair value. Derivatives are carried as assets when the fair value is positive and as liabilities when the fair value is negative.
Any gains or losses arising from changes in fair value on derivatives that do not qualify for hedge accounting are taken directly to net profit or loss for the year as financial income or expense.
The fair value of forward currency contracts is calculated by reference to current forward exchange rates for contracts with similar maturity profiles. The fair value of interest rate swap contracts is determined by reference to market values for similar instruments.
An embedded derivative is separated from the host contract and accounted for as a derivative if all of the following conditions are met:
• the economic characteristics and the risks of the embedded derivative are not closely related to the economic characteristics of the host contract,
• a separate instrument with the same terms as the embedded derivative would meet the definition of a derivative, and
• a hybrid (combined) instrument is not measured at fair value with changes in fair value reported in current year net profit.
vi) HedgingFor the purpose of hedge accounting, hedges are classified as• fair value hedges• cash flow hedges or• hedges of a net investment in a foreign operation.
A hedge of the foreign currency risk of a firm commitment is accounted for as a cash flow hedge. At the inception of a hedge relationship, the Group formally designates and documents the hedge relationship to which the Group wishes to apply hedge accounting and the risk management objective and strategy for undertaking the hedge. The documentation includes identification of the hedging instrument, the hedged item or transaction, the nature of the risk being hedged and how the entity will assess the hedging instrument’s effectiveness in offsetting the exposure to changes in the hedged item’s fair value or cash flows attributable to the hedged risk. Such hedges are expected to be highly effective in achieving offsetting changes in fair value or cash flows and are assessed on an ongoing basis to determine that they actually have been highly effective throughout the financial reporting periods for which they were designated.
Hedges which meet the strict criteria for hedge accounting are accounted for as follows:
Fair value hedgesFair value hedges are hedges of the Group’s exposure to changes in the fair value of a recognized asset or liability or an unrecognized firm commitment, or an identified portion of such an asset, liability or firm commitment, that is attributable to a particular risk that could affect the income statement. For fair value hedges, the carrying amount of the hedged item is adjusted for gains and losses attributable to the risk being hedged, the derivative is remeasured at fair value and gains and losses from both are taken to the income statement. For fair value hedges relating to items carried at amortised cost, the adjustment to carrying value is amortised through the income statement over the remaining term to maturity. Any adjustment to the carrying amount of a hedged financial instrument for which the effective interest method is used is amortised to the income statement.
Amortisation may begin as soon as an adjustment exists and shall begin no later than when the hedged item ceases to be adjusted for changes in its fair value attributable to the risk being hedged.
When an unrecognized firm commitment is designated as a hedged item, the subsequent cumulative change in the fair value of the firm commitment attributable to the hedged risk is recognized as an asset or liability with a corresponding gain or loss recognized in profit or loss. The changes in the fair value of the hedging instrument are also recognized in the income statement.
The Group discontinues fair value hedge accounting if the hedging instrument expires or is sold, terminated or exercised, the hedge no longer meets the criteria for hedge accounting or the Group revokes the designation.
Cash-flow hedgesCash flow hedges are a hedge of the exposure to variability in cash flows that is attributable to a
TVK annual report 200964 65noTeS To THe ConSolIDaTeD FInanCIal STaTeMenTS

particular risk associated with a recognized asset or liability or a highly probable forecast transaction that could affect the income statement. The effective portion of the gain or loss on the hedging instrument is recognized directly as other comprehensive income, while the ineffective portion is recognized in the income statement.
Amounts taken to other comprehensive income are transferred to the income statement when the hedged transaction affects the income statement, such as when hedged financial income or financial expense is recognized or when a forecast sale or purchase occurs. Where the hedged item is the cost of a non-financial asset or liability, the amounts previously taken to equity are transferred to the initial carrying amount of the non-financial asset or liability.
If the forecast transaction is no longer expected to occur, amounts previously recognized in equity are transferred to the income statement. If the hedging instrument expires or is sold, terminated or exercised without replacement or rollover, or if its designation as a hedge is revoked, amounts previously recognized in other comprehensive income remain in other comprehensive income until the forecast transaction occurs. If the related transaction is not expected to occur, the amount is taken to the income statement.
Hedges of a net investmentHedges of a net investment in a foreign operation, including a hedge of a monetary item that is accounted for as part of the net investment, are accounted for in a way similar to cash flow hedges. Gains or losses on the hedging instrument relating to the effective portion of the hedge are recognized as other comprehensive income while any gains or losses relating to the ineffective portion are recognized in the income statement. On disposal of the foreign operation, the cumulative value of any such gains or losses recognized as other comprehensive income is transferred to the income statement. The Company had no derivative financial instrument and hedging transactions in 2008 and 2009.
vii) Impairment of financial assetsThe Group assesses at each balance sheet date whether a financial asset or group of financial assets is impaired. Impairment losses on a financial asset or group of financial assets are recognised only if there is an objective evidence of impairment due to a loss event and this loss event significantly impacts the estimated future cash flows of the financial asset or group of financial assets.
Assets carried at amortised costIf there is objective evidence that an impairment loss on loans and receivables carried at amortised cost has been incurred, the amount of the loss is measured as the difference between the asset’s carrying amount and the present value of estimated future cash flows (excluding future expected credit losses) discounted at the financial asset’s original effective interest rate (i.e. the effective interest rate computed at initial recognition). The amount of the loss is recognized in the income statement.
The Group first assesses whether objective evidence of impairment exists individually for financial assets that are individually significant, and individually or collectively for financial assets that are not individually significant. If it is determined that no objective evidence of impairment exists for financial assets, whether significant or not, the asset is included in a group of financial assets with similar credit risk characteristics and that group of financial assets is collectively assessed for impairment. Assets that are individually assessed for impairment and for which an impairment loss is or continues to be recognized are not included in a collective assessment of impairment.
If, in a subsequent period, the amount of the impairment loss decreases and the decrease can be related objectively to an event occurring after the impairment was recognized, the previously recognized impairment loss is reversed. Any subsequent reversal of an impairment loss is recognized in the income statement, to the extent that the carrying value of the asset does not exceed its amortised cost at the reversal date.
Available-for-sale financial investmentsIf an available-for-sale asset is impaired, an amount comprising the difference between its cost (net of
any principal payment and amortisation) and its current fair value, less any impairment loss previously recognized in the income statement, is transferred from other comprehensive income to the income statement. Impairment losses recognized on equity instruments classified as available for sale is not reversed, increases in their fair value after impairment are recognised directly in other comprehensive income. Impairment losses recognized on debt instruments classified as available-for-sale are reversed through income statement, if the increase in fair value of the instrument can be objectively related to an event occurring after the impairment loss was recognized in income statement.
viii) Cash and Cash EquivalentsCash includes cash on hand and cash with banks. Cash equivalents are short-term, highly liquid investments that are readily convertible to known amounts of cash with maturity less than three months from the date of acquisition and that are subject to an insignificant risk of change in value.For the purpose of the consolidated statement of cash flows, cash and cash equivalents are reported net of outstanding bank overdrafts.
ix) Trade ReceivablesReceivables are stated at face value less provision for doubtful amounts. Where the time value of money is material, receivables are carried at amortized cost. A provision for impairment is made when there is objective evidence (such as the probability of insolvency or significant financial difficulties of the debtor) that the Group will not be able to collect all of the amounts due under the original terms of the invoice. Impaired debts are derecognized when they are assessed as uncollectible.If collection of trade receivables is expected within the normal business cycle which is one year or less, they are classified as current assets. If not, they are presented as non-current assets.
x) InventoriesInventories, including work-in-process are valued at the lower of cost and net realisable value, after provision for slow-moving and obsolete items. Net realisable value is the selling price in the ordinary course of business, less the costs of making the sales. Cost of purchased goods, including naphtha and purchased gas oil inventory, is determined primarily on the basis of weighted average cost. The acquisition cost of own produced inventory consists of direct materials, direct wages and the appropriate portion of production overhead expenses including royalty. Unrealisable and unusable inventory is fully written off.
xi) Property, Plant and EquipmentProperty, plant and equipment are stated at historical cost (or the carrying value of the assets determined as of 31 December 1991) less accumulated depreciation, depletion and accumulated impairment loss. When assets are sold or retired, their cost and accumulated depreciation are eliminated from the accounts and any gain or loss resulting from their disposal is included in the consolidated income statement.
The initial cost of property, plant and equipment comprises its purchase price, including import duties and non-refundable purchase taxes and any directly attributable costs of bringing the asset to its working condition and location for its intended use, such as borrowing costs. Estimated decommissioning and site restoration costs are capitalized upon initial recognition or, if decision on decommissioning is made subsequently, at the time of the decision. Changes in estimates thereof adjust the carrying amount of assets. Expenditures incurred after the property, plant and equipment have been put into operation, such as repairs and maintenance and overhead costs (except form periodic maintenance costs), are normally charged to income in the period in which the costs are incurred. Periodic maintenance costs are capitalized as a separate component of the related assets.
Construction in progress represents plant and properties under construction and is stated at cost. This includes cost of construction, plant and equipment and other direct costs. Construction-in-progress is not depreciated until such time as the relevant asset is available for use.
TVK annual report 200966 67noTeS To THe ConSolIDaTeD FInanCIal STaTeMenTS
xii) Intangible AssetsIntangible assets acquired separately are capitalized at cost and from business acquisitions are capitalized at fair value as at the date of acquisitions. Intangible assets are recognized if it is probable that the future economic benefits that are attributable to the asset will flow to the enterprise; and the cost of the asset can be measured reliably.
Following initial recognition, the cost model is applied to the class of intangible assets. The useful lives of these intangible assets are assessed to be either finite or indefinite (during 2009 and 2008 the Company has no intangible asset with indefinite useful life). Amortization is charged on assets with a finite useful life over the best estimate of their useful lives using the straight line method. The amortization period and the amortization method are reviewed annually at each financial year-end. Intangible assets, excluding development costs, created within the business are not capitalized and expenditure is charged against income in the year in which the expenditure is incurred. Intangible assets are tested for impairment annually either individually or at the cash generating unit level.
Research costs are expensed as incurred. Development expenditure incurred on an individual project is carried forward when its future recoverability can reasonably be regarded as assured. Following the initial recognition of the development expenditure the cost model is applied requiring the asset to be carried at cost less any accumulated impairment losses. Costs in development stage can not be amortized. The carrying value of development costs is reviewed for impairment annually when the asset is not yet in use, or more frequently when an indicator of impairment arises during the reporting year indicating that the carrying value may not be recoverable.
xiii) Depreciation, AmortizationDepreciation of each component of an intangible asset and property, plant and equipment is computed on a straight-line basis using the following rates:
Software 20-33%
Buildings and infrastructure 2-10%
Production machinery and equipment 5-14,5%
Office and computer equipmentk 14,5-50%
Vehicles 10-20 %
Amortization of leasehold improvements is provided using the straight-line method over the term of the respective lease or the useful life of the asset, whichever period is less.
Periodic maintenance costs are depreciated until the next similar maintenance takes place.
The useful life and depreciation methods are reviewed at least annually to ensure that the method and period of depreciation are consistent with the expected pattern of economic benefits from items of property, plant and equipment and, if necessary, changes are accounted for in the current period.
The base of the depreciation of security and strategic spare parts is the average depreciation rate of technical equipments and vehicles relating to the production.
xiv) Impairment of AssetsProperty, plant and equipment and intangible assets are reviewed for impairment whenever events or changes in circumstances indicate that the carrying amount of an asset may not be recoverable. Whenever the carrying amount of an asset exceeds its recoverable amount, an impairment loss is recognized in the income statement for items of property, plant and equipment and intangibles carried at cost. The recoverable amount is the higher of an asset’s fair value less costs to sell and value in use. The fair value is the amount obtainable from the sale of an asset in an arm’s length transaction while value in use is the present value of estimated future cash flows expected to arise from the continuing use of an asset and from its disposal at the end of its useful life. Recoverable amounts are estimated for individual assets or, if this is not practicable, for the cash-generating unit.
The Group assesses at each reporting date whether there is any indication that previously recognised impairment losses may no longer exist or may have decreased. A previously recognised impairment loss is reversed only if there has been a change in the impairment assumptions considered when the last impairment loss was recognised. The reversal is limited so that the carrying amount of the asset neither exceeds its recoverable amount, nor is higher than its carrying amount net of depreciation, had no impairment loss been recognised in prior years. Goodwill is reviewed for impairment, annually or more frequently if events or changes in circumstances indicate that the carrying value may be impaired. Impairment is determined for goodwill by assessing the recoverable amount of the cash-generating unit (or group of cash-generating units), to which the goodwill relates. Where the recoverable amount of the cash-generating unit (or group of cash-generating units) is less than the carrying amount of the cash-generating unit (group of cash-generating units) to which goodwill has been allocated, an impairment loss is recognized. Impairment losses relating to Goodwill cannot be reversed in future periods. The Group performs its annual impairment test of goodwill as at 31 December.
Intangible assets with indefinite useful lives are monitored for impairment indicators throughout the year and are tested for impairment at least annually as of 31 December either individually or at the cash generating unit level, as appropriate.
Cash generating unitsThe Company identified two cash generating units (CGU) which are the ethylene production of Olefin 2 for sales and the production of Olefin plants for internal use for the production of polymers.The recoverable amount of each CGU has been determined based on a value in use calculation using cash flow projections based on financial budgets approved by senior management covering a 19-year period. The average pre-tax discount rate applied to cash flow projections is 10.19 % (2008: 5.21 %).
The calculation of value in use for cash generating units are most sensitive to the following assumptions:• Raw materials price;• Product price;• Exchange rate;• Material balance; and• Discount rates.With regard to the assessment of value in use of these cash-generating units, the management believes that no reasonably possible change in any of the above key assumptions would cause the carrying value of the units to materially exceed its recoverable amount.
xv) Interest-bearing loans and borrowingsAll loans and borrowings are initially recognized at the fair value of the consideration received net of issue costs associated with the borrowing. After initial recognition, interest-bearing loans and borrowings are subsequently measured at amortised cost using the effective interest method. Amortised cost is calculated by taking into account any issue costs, and any discount or premium on settlement. Gains and losses are recognized in net in the income statement when the liabilities are derecognized, as well as through the amortisation process, except to the extent they are capitalized as borrowing costs.
xvi) ProvisionsA provision is recognized when the Group has a present obligation (legal or constructive) as a result of a past event and it is probable (i.e. more likely than not) that an outflow of resources embodying economic benefits will be required to settle the obligation, and a reliable estimate can be made of the amount of the obligation. When the Group expects some or all of the provision to be reimbursed; the reimbursement is recognised as a separate asset but only when the reimbursement is actually certain. Provisions are reviewed at each balance sheet date and adjusted to reflect the current best estimate. The amount of the provision is the present value of the risk adjusted expenditures expected to be required to settle the obligation, determined using the estimated risk free interest rate as discount rate. Where discounting is used, the carrying amount of the provisions increases in each period to reflect the unwinding of the discount by the passage of time. This increase is recognized as interest expense.
TVK annual report 200968 69noTeS To THe ConSolIDaTeD FInanCIal STaTeMenTS
Provision for RedundancyThe employees of the Group are eligible, immediately upon termination, for redundancy payment pursuant to the Hungarian law and the terms of the Collective Agreement between TVK and its employees. The amount of such a liability is recorded as a provision in the consolidated balance sheet when the workforce reduction program is defined, announced and the conditions for its implementation are met.Provision for Environmental Expenditures Environmental expenditures that relate to current or future economic benefits are expensed or capitalized as appropriate. Expenditures that relate to an existing condition caused by past operations and do not contribute to current or future earnings are expensed. Liabilities for environmental costs are recognized when environmental assessments or clean-ups are probable and the associated costs can be reasonably estimated. Generally, the timing of these provisions coincides with the commitment to a formal plan of action or, if earlier, on divestment or on closure of inactive sites. The amount recognized is the best estimate of the expenditure required. Where the liability will not be settled for a number of years, the amount recognized is the present value of the estimated future expenditure.
Provision for Retirement Benefits The Group operates long term employee benefit program. None of these schemes requires contribution to be made to separately administered funds. The cost of providing benefits under those plans is determined separately for each plan using the projected unit credit actuarial valuation method. Actuarial gains and losses are recognized as income or expense immediately. Past service costs, resulting from the introduction of, or changes to the defined benefit scheme are recognized as an expense on a straight-line basis over the average period until the benefits become vested.
Provision for Old Team benefitsBased on the valid Collective Agreement , the Company pays Old Team benefits to its employees as follows:Every five years, the Company pays a fix set amount to all employees who had worked at least 10 years for the Company. Based on actuarial calculations, the Company made provision for Old Team benefits of current employees that reflects the expected payments based on their past service levels.
xvii) Greenhouse gas emissionsThe Group receives free emission rights in Hungary as a result of the European Emission Trading Schemes. The rights are received on an annual basis and in return the Group is required to remit rights equal to its actual emissions. The Group has adopted a policy of applying a net liability approach to the emission rights granted. A provision is only recognized when actual emissions exceed the emission rights granted and still held. Where emission rights are purchased from other parties, they are recorded at cost, and treated as a reimbursement right., whereby they are matched to the emission liabilities and remeasured to fair value.
xviii) Share-based payment transactionsCertain employees (including directors and managers) of the Group receive remuneration in the form of share-based payment transactions, whereby employees render services in exchange for shares or rights over shares (‘equity-settled transactions’).
Equity-settled transactionsThe cost of equity-settled transactions with employees is measured by reference to the fair value at the date at which they are granted. The fair value is determined by applying generally accepted option pricing models (usually by the binomial model). In valuing equity-settled transactions, no account is taken of any performance conditions, other than conditions linked to the price of the shares of the parent company (‘market conditions’). The cost of equity-settled transactions is recognized, together with a corresponding increase in equity, over the period in which the performance conditions are fulfilled, ending on the date on which the relevant employees become fully entitled to the award (‘vesting date’). The cumulative expense recognized for equity settled transactions at each reporting date until the vesting date reflects the extent to which the vesting period has expired and the number of awards that, in the opinion of the directors of the Group at that date, based on the best available estimate of the number of equity instruments that will ultimately
vest.No expense is recognized for awards that do not ultimately vest, except for awards where vesting is conditional upon a market condition, which are treated as vesting irrespective of whether or not the market condition is satisfied, provided that all other performance conditions are satisfied.
Where the terms of an equity-settled award are modified, as a minimum an expense is recognized as if the terms had not been modified. An additional expense is recognized for any increase in the value of the transaction as a result of the modification, as measured at the date of modification.
Where an equity-settled award is cancelled, it is treated as if it had vested on the date of cancellation, and any expense not yet recognized for the award is recognized immediately. However, if a new award is substituted for the cancelled award, and designated as a replacement award on the date that it is granted, the cancelled and new awards are treated as if they were a modification of the original award, as described in the previous paragraph.
The dilutive effect of outstanding options is reflected as additional share dilution in the computation of earnings per share.
Cash-settled transactions The cost of cash-settled transactions is measured initially at fair value at the grant date using the binomial model. This fair value is expensed over the vesting period with recognition of a corresponding liability. The liability is remeasured at each balance sheet date up to and including the settlement date to fair value with changes therein recognized in the income statement.
xix) LeasesThe determination whether an arrangement contains or is a lease depends on the substance of the arrangement at inception date. If fulfilment of the arrangement depends on the use of a specific asset or conveys the right to use the asset, it is deemed to contain a lease element and is recorded accordingly. Finance leases, which transfer to the Group substantially all the risks and benefits incidental to ownership of the leased item, are capitalized at the inception of the lease at the fair value of the leased property or, if lower, at the present value of the minimum lease payments. Lease payments are apportioned between the finance charges and reduction of the lease liability so as to achieve a constant rate of interest on the remaining balance of the liability. Finance charges are charged directly against income. Capitalized leased assets are depreciated over the shorter of the estimated useful life of the asset or the lease term. Initial direct costs incurred in negotiating a finance lease are added to the carrying amount of the leased asset and recognized over the lease term on the same bases as the lease income. Leases where the lessor retains substantially all the risks and benefits of ownership of the asset are classified as operating leases. Operating lease payments are recognized as an expense in the income statement on a straight-line basis over the lease term.
xx) Government grantsGovernment grants are recognized at their fair value where there is reasonable assurance that the grant will be received and all attaching conditions will be complied with. When the grant relates to an expense item, it is recognized as income over the years necessary to match the grant on a systematic basis to the costs that it is intended to compensate. Where the grant relates to an asset, the fair value is credited to a deferred income account and is released to the income statement over the expected useful life of the relevant asset by equal annual instalments.
xxi) ReservesReserves shown in the consolidated financial statements do not represent the distributable reserves for dividend purposes. Reserves for dividend purposes are determined based on the company-only statutory earnings of TVK Plc.
Translation reservesThe translation reserve represents translation differences arising on consolidation of financial statements of foreign entities. Exchange differences arising on a monetary item that, in substance, forms part of
TVK annual report 200970 71noTeS To THe ConSolIDaTeD FInanCIal STaTeMenTS
the company’s net investment in a foreign entity are classified as equity in the consolidated financial statements until the disposal of the net investment. Upon disposal of the corresponding assets, the cumulative revaluation or translation reserves are recognized as income or expenses in the same period in which the gain or loss on disposal is recognized.
Fair valuation reservesThe fair valuation reserve includes the cumulative net change in the fair value of effective cash flow hedges and available for sale financial instruments.Equity component of debt and difference in buy-back prices Equity component of compound debt instruments includes the residual amount of the proceeds from the issuance of the instrument above its liability component, which is determined as the present value of future cash payments associated with the instrument. The equity component of compound debt instruments is recognized when the Group becomes party to the instrument.
xxii) Treasury Shares The nominal value of treasury shares held is deducted from registered share capital. Any difference between the nominal value and the acquisition price of treasury shares is recorded directly to share premium.
xxiii) DividendsDividends are recorded in the year in which they are approved by the shareholders.
xxiv) Revenue RecognitionRevenue is recognized when it is probable that the economic benefits associated with a transaction will flow to the enterprise and the amount of the revenue can be measured reliably. Sales are recognized net of sales taxes and discounts when delivery of goods or rendering of the service has taken place and transfer of risks and rewards has been completed. Interest is recognized on a time-proportionate basis that reflects the effective yield on the related asset. Dividends due are recognized when the shareholder’s right to receive payment is established. Changes in the fair value of derivatives not qualifying for hedge accounting are reflected in income in the period the change occurs.
xxv) Borrowing CostsBorrowing costs that are directly attributable to the acquisition, construction or production of a qualifying asset are capitalized. Capitalization of borrowing costs commences when the activities to prepare the asset are in progress and expenditures and borrowing costs are being incurred. Borrowing costs are capitalized until the assets are ready for their intended use. Borrowing costs include interest charges and other costs incurred in connection with the borrowing of funds, including exchange differences arising from foreign currency borrowings used to finance these projects to the extent that they are regarded as an adjustment to interest costs.
xxvi) Income TaxesThe income tax charge consists of current and deferred taxes. The current income tax is based on taxable profit for the year. Taxable profit differs from profit as reported in the consolidated income statement because of items of income or expense that are never taxable or deductible or are taxable or deductible in other years. The Group’s current income tax is calculating using tax rates that have been enacted or substantively enacted by the end of the reporting year.
Deferred taxes are calculated using the balance sheet liability method. Deferred income taxes reflect the net tax effects of temporary differences between the carrying amounts of assets and liabilities for financial reporting purposes and the amounts used for income tax purposes. Deferred tax assets and liabilities are measured using the tax rates expected to apply to taxable income in the years in which those temporary differences are expected to be recovered or settled. The measurement of deferred tax liabilities and deferred tax assets reflects the tax consequences that would follow from the manner in which the enterprise expects, at the balance sheet date, to recover or settle the carrying amount of its assets and liabilities.
Deferred tax assets are recognized for all deductible temporary differences, carry forward of unused tax credits and tax losses when it is probable that sufficient taxable profits will be available against which the deferred tax assets can be utilized, except:
• where the deferred income tax asset relating to the deductible temporary difference arises from the initial recognition of an asset or liability in a transaction that is not a business combination and, at the time of the transaction, affects neither the accounting profit nor taxable profit or loss; and
• in respect of deductible temporary differences associated with investments in subsidiaries, associates and interests in joint ventures, deferred income tax assets are recognized only to the extent that it is probable that the temporary differences will reverse in the foreseeable future and taxable profit will be available against which the temporary differences can be utilised.
Deferred income tax liabilities are recognized for all taxable temporary differences, except:
• where the deferred income tax liability arises from the initial recognition of goodwill or of an asset or liability in a transaction that is not a business combination and, at the time of the transaction, affects neither the accounting profit nor taxable profit or loss; and
• in respect of taxable temporary differences associated with investments in subsidiaries, associates and interests in joint ventures, where the timing of the reversal of the temporary differences can be controlled and it is probable that the temporary differences will not reverse in the foreseeable future.
At each balance sheet date, the Company re-assesses unrecognized deferred tax assets and the carrying amount of deferred tax assets. The enterprise recognizes a previously unrecognized deferred tax asset to the extent that it has become probable that future taxable profit will allow the deferred tax asset to be recovered. The Company conversely reduces the carrying amount of a deferred tax asset to the extent that it is no longer probable that sufficient taxable profit will be available to allow the benefit of part or all of the deferred tax asset to be utilised.
Current tax and deferred tax are charged or credited directly to equity if the tax relates to items that are credited or charged, in the same or a different period, directly to equity, including an adjustment to the opening balance of reserves resulting from a change in accounting policy that is applied retrospectively.
Deferred tax assets and liabilities are offset when there is a legally enforceable right to set off current tax assets against current tax liabilities which relate to income taxes imposed by the same taxation authority and the Group intends to settle its current tax assets and liabilities on a net basis.
xxvii) Foreign Currency TransactionsForeign currency transactions are recorded in the reporting currency by applying to the foreign currency amount the exchange rate between the reporting currency and the foreign currency at the date of the transaction. Exchange rate differences arising on the settlement of monetary items at rates different from those at which they were initially recorded during the periods are recognized in the consolidated income statement in the period in which they arise. Monetary assets and liabilities denominated in foreign currencies are retranslated at the functional currency rate of exchange ruling at the balance sheet date. Items measured at fair value in a foreign currency are translated using the exchange rates at the date when the fair value was determined. Foreign exchange differences on trade receivables and payables are included in operating profit, while foreign exchange differences on borrowings are recorded as financial income or expense.
Financial statements of foreign entities are translated at year-end exchange rates with respect to the balance sheet, and at the weighted average exchange rates for the year with respect to the income statement. All resulting translation differences are included in the translation reserve in other comprehensive income. On disposal of a foreign entity, the deferred cumulative amount recognized in other comprehensive income relating to that particular foreign operation shall be recognized in the income statement. Any exchange differences that have previously been attributed to non-controlling interests are derecognised, but they are not reclassified to profit or loss.
TVK annual report 200972 73noTeS To THe ConSolIDaTeD FInanCIal STaTeMenTS
In case of a partial disposal of a subsidiary without any loss of control in the foreign operation, the proportionate share of accumulated exchange differences are re-attributed to non-controlling interests and are not recognised in profit or loss. For all other disposals such as associates or jointly controlled entities not involving a change of accounting basis, the proportionate share of accumulated exchange differences is reclassified to profit or loss.
Goodwill and fair value adjustments arising on the acquisition of a foreign operation are treated as assets and liabilities of the foreign operation and translated at the closing rate.
xxviii) Earnings Per Share The calculation of basic earnings per share is based on the profit attributable to ordinary shareholders using the weighted average number of shares outstanding during the year after deduction of the average number of treasury shares held over the period.
The calculation of diluted earnings per share is consistent with the calculation of basic earnings per share while giving effect to all dilutive potential ordinary shares that were outstanding during the period, that is:
• the net profit for the period attributable to ordinary shares is increased by the after-tax amount of dividends and interest recognised in the period in respect of the dilutive potential ordinary shares and adjusted for any other changes in income or expense that would result from the conversion of the dilutive potential ordinary shares.
• the weighted average number of ordinary shares outstanding is increased by the weighted average number of additional ordinary shares which would have been outstanding assuming the conversion of all dilutive potential ordinary shares.
xxix) Segmental DisclosureThe Group has four major divisions (Olefin, Polyethylene, Polypropylene and Other) that serve as the primary basis for the Company’s segment reporting purposes. These segments are vertically integrated, i.e. the output of one segment serves as raw material for the next one (a significant part of the end product of olefin production is used as raw material for polypropylene and polyethylene production).
xxx) ContingenciesContingent liabilities are not recognized in the consolidated financial statements unless they are acquired in a business combination. They are disclosed in the Notes unless the possibility of an outflow of resources embodying economic benefits is remote. A contingent asset is not recognized in the consolidated financial statements but disclosed when an inflow of economic benefits is probable.
2.3 Significant accounting judgments and estimates
A számviteli politika alkalmazása során használt kritikus feltételezések
Critical judgments in applying the accounting policiesIn the process of applying the accounting policies, which are described in note 2.2 above, management has made certain judgments that have a significant effect on the amounts recognized in the financial statements (apart from those involving estimates, which are dealt with below). These are detailed in the respective notes, however, the most significant judgments relate to:
• Outcome of certain litigations • assessment of control (over operation) of TVK Erőmű Kft. and Tisza WTP (Note 1)
Sources of estimate uncertaintyThe preparation of financial statements in conformity with IFRS requires the use of estimates and assumptions that affect the amounts reported in the financial statements and the Notes thereto. Although these estimates are based on the management’s best knowledge of current events and actions, actual results may defer from those estimates. These are detailed in the respective notes, however, the most significant estimates relate to the following:
• Scope of environmental provision and quantification and timing of environmental liabilities (Note 14, 26)
• The availability of taxable income against which deferred tax assets can be recognized (Note 23)• Actuarial estimate applied in the calculation of retirement benefit obligations (Note 14)• Determination of useful lives of property, plant and equipment and intangibles • Impairment of tangible assets and intangibles (Notes 3, 4)
TVK annual report 200974 75noTeS To THe ConSolIDaTeD FInanCIal STaTeMenTS

3. Intangible assets
The Group’s intangible assets as of 31 December 2009 and 2008 were as follows:
Goodwill property rights Software Total
HUF million HUF million HUF million HUF million
AT 1 JANUARY 2008
Gross book value 92 - 6,783 6,875
Accumulated amortization and impairment - - (3,068) (3,068)
Net book value 92 - 3,715 3,807
YEAR ENDED 31 DECEMBER 2008
- additions - - 180 180
- amortization for the year - - (503) (503)
- impairment - - - -
- transfers - - 8 8
CLOSING NET BOOK VALUE 92 - 3,400 3,492
AT 31 DECEMBER, 2008
Gross book value 92 - 6,969 7,061
Accumulated amortization and impairment - - (3,569) (3,569)
Net book value 92 - 3,400 3,492
YEAR ENDED 31 DECEMBER 2009
- additions - 473 52 525
- amortization for the year - - (548) (548)
- impairment - - - -
- transfers - (471) - (471)
CLOSING NET BOOK VALUE 92 2 2,904 2,998
AT 31 DECEMBER, 2009
Gross book value 92 2 7,020 7,114
Accumulated amortization and impairment - - (4,116) (4,116)
Net book value 92 2 2,904 2,998
Goodwill
Goodwill acquired in a business combination is allocated, at acquisition, to the cash generating units (CGUs) that are expected to benefit from that business combination. Before recognition of impairment losses, the carrying amount of goodwill had been allocated as follows:
31 December 2009 31 December 2008
net book value before
impairmentImpairment net book
valuenet book
value before impairment
Impairment net book value
HUF million HUF million HUF million HUF million HUF million HUF million
TVK Polska Spzoo 92 - 92 92 - 92
Total goodwill
92 - 92 92 - 92
The Company recognized goodwill of HUF 92 million relating to TVK Polska Spzoo, which is subject to annual impairment test according to the requirements of IAS 36 – Impairment of Assets.
TVK annual report 200976 77noTeS To THe ConSolIDaTeD FInanCIal STaTeMenTS
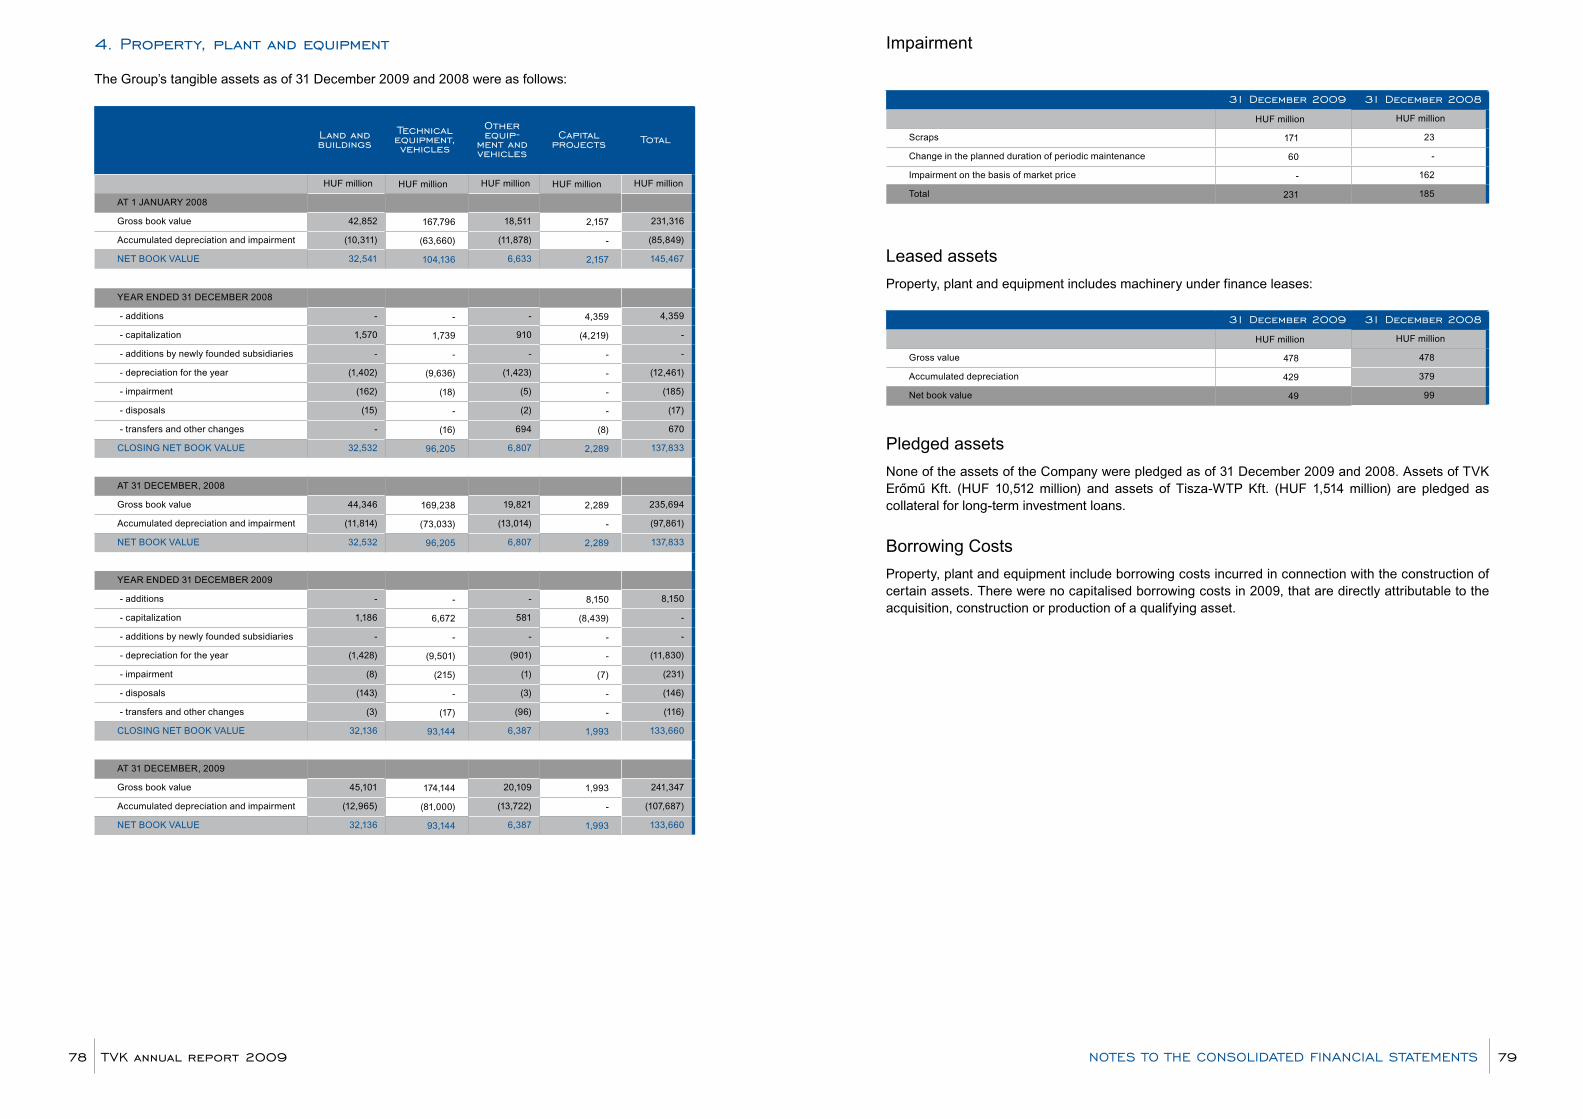
4. property, plant and equipment
The Group’s tangible assets as of 31 December 2009 and 2008 were as follows:
land and buildings
Technical equipment, vehicles
other equip-
ment and vehicles
Capital projects Total
HUF million HUF million HUF million HUF million HUF million
AT 1 JANUARY 2008
Gross book value 42,852 167,796 18,511 2,157 231,316
Accumulated depreciation and impairment (10,311) (63,660) (11,878) - (85,849)
NET BOOK VALUE 32,541 104,136 6,633 2,157 145,467
YEAR ENDED 31 DECEMBER 2008
- additions - - - 4,359 4,359
- capitalization 1,570 1,739 910 (4,219) -
- additions by newly founded subsidiaries - - - - -
- depreciation for the year (1,402) (9,636) (1,423) - (12,461)
- impairment (162) (18) (5) - (185)
- disposals (15) - (2) - (17)
- transfers and other changes - (16) 694 (8) 670
CLOSING NET BOOK VALUE 32,532 96,205 6,807 2,289 137,833
AT 31 DECEMBER, 2008
Gross book value 44,346 169,238 19,821 2,289 235,694
Accumulated depreciation and impairment (11,814) (73,033) (13,014) - (97,861)
NET BOOK VALUE 32,532 96,205 6,807 2,289 137,833
YEAR ENDED 31 DECEMBER 2009
- additions - - - 8,150 8,150
- capitalization 1,186 6,672 581 (8,439) -
- additions by newly founded subsidiaries - - - - -
- depreciation for the year (1,428) (9,501) (901) - (11,830)
- impairment (8) (215) (1) (7) (231)
- disposals (143) - (3) - (146)
- transfers and other changes (3) (17) (96) - (116)
CLOSING NET BOOK VALUE 32,136 93,144 6,387 1,993 133,660
AT 31 DECEMBER, 2009
Gross book value 45,101 174,144 20,109 1,993 241,347
Accumulated depreciation and impairment (12,965) (81,000) (13,722) - (107,687)
NET BOOK VALUE 32,136 93,144 6,387 1,993 133,660
Impairment
31 December 2009 31 December 2008
HUF million HUF million
Scraps 171 23
Change in the planned duration of periodic maintenance 60 -
Impairment on the basis of market price - 162
Total 231 185
Leased assetsProperty, plant and equipment includes machinery under finance leases:
31 December 2009 31 December 2008
HUF million HUF million
Gross value 478 478
Accumulated depreciation 429 379
Net book value 49 99
Pledged assetsNone of the assets of the Company were pledged as of 31 December 2009 and 2008. Assets of TVK Erőmű Kft. (HUF 10,512 million) and assets of Tisza-WTP Kft. (HUF 1,514 million) are pledged as collateral for long-term investment loans.
Borrowing CostsProperty, plant and equipment include borrowing costs incurred in connection with the construction of certain assets. There were no capitalised borrowing costs in 2009, that are directly attributable to the acquisition, construction or production of a qualifying asset.
TVK annual report 200978 79noTeS To THe ConSolIDaTeD FInanCIal STaTeMenTS

5. Investment in associated companies
The Group’s financial investments as of 31 December 2009 and 2008 were as follows:
Company name CountryDate of founda-
tionrange of activity
ownership 31 Dec 2009
ownershi 31 Dec 2008
net book value of
investment 31 Dec 2009
net book value of
investment 31 Dec 2008
HUF million
HUF million
Associates
TMM Tűzoltó és Műszaki Mentő Kft. Hungary 1995
Fire prevention, technical rescue,
technical supervision
30% 30% 114 114
VIBA-TVK Kft.* Hungary 1993Producing black
polymer dye40% 40% - 64
Total associates 114 178
Total 114 178
* Dissolution process finished on 8 February 2010..
Financial information on associatesMain financial data of the Group associates at 31 December 2009 (These amounts represent 100% of the values of the companies reported by those companies in accordance with IFRS):
Total assets liabilities Total operating revenues
profit and loss for the year
HUF million HUF million HUF million HUF million
TMM Tűzoltó és Műszaki Mentő Kft. 454 45 532 15
Main financial data of the Group associates at 31 December 2008 (These amounts represent 100% of the values of the companies reported by those companies in accordance with IFRS):
Total assets liabilities Total operating revenues
profit and loss for the year
HUF million HUF million HUF million HUF million
TMM Tűzoltó és Műszaki Mentő Kft. 439 45 544 9
VIBA-TVK Kft. 466 305 1,567 (53)
6. other non-current assets
The Group’s other non-current assets as of 31 December 2009 and 2008 were as follows:
31 December 2009 31 December 2008
HUF million HUF million
Government bonds** 185 175
Loan to Plastico S.A.* - -
Other*** 6 14
Total 191 189
*In 2002, TVK Plc. sold its investment in Plastico S.A. In 2006, based on a legal opinion, the Company reassessed the recoverability of its
outstanding loan receivable from Plastico S.A. and decided to fully write it off. Net of impairment of HUF 575 million as of 31 December 2009 and
2008, respectively (See Note 9.).
**Long-term securities include type 2013/C government bonds maturing in December 2013. Government bonds bear a floating interest rate
equivalent to the Treasury Bonds previous 6 month average interest rate. These bonds are accounted for as held to maturity instruments.
*** It contains loans given which are interest free in the amount of HUF 6 million in 2009 (HUF 13 million 2008).
7. Inventories
Inventories as of 31 December 2009 and 2008 were as follows:
at cost net book value at cost net book
value
31 December 2009 31 December 2008
HUF million
Work in progress and finished goods 5,071 5,071 5,532 5,132
Raw-material 1,837 1,837 1,127 1,127
Other materials 956 716 903 648
Purchased goods 128 128 165 165
Total 7,992 7,752 7,727 7,072
The Group believes that the level of provision as of 31 December 2009 is sufficient to cover potential future losses.As of 31 December 2009 and 2008, no inventory owned by TVK Plc. was pledged as collateral.
The total amount of impairment was 240 HUF million and HUF 655 million as of 31 December 2009 and 2008, respectively ( as cumulated figures).
Inventories are regularly reviewed for impairment.
TVK annual report 200980 81noTeS To THe ConSolIDaTeD FInanCIal STaTeMenTS

8. Trade receivables, net
Receivables as of 31 December 2009 and 2008 were as follows:
31 December 2009 31 December 2008
HUF million HUF million
Domestic debtors 20,416 17,123
- of which: MOL Group members 7,016 2,914
Associates - 92
Export debtors 23,238 19,982
- of which: MOL Group members 747 100
43,654 37,105
Less: provision for doubtful debts (198) (96)
Total 43,456 37,009
Movements in the provision for doubtful receivables were as follows:
31 December 2009 31 December 2008
HUF million HUF million
At 1 January 96 50
Additions 104 47
Reversal (2) (1)
At 31 December 198 96
As at 31 December 2009 and 2008 the analysis of trade receivables that were past due is as follows:
31 December 2009 31 December 2008
HUF million HUF million
Neither past due nor impaired 40,592 34,414
Past due but not impaired 2,864 2,595
Within 90 days 2,034 2,486
91 - 180 days 483 98
Over 180 days 347 11
Total 43,456 37,009
The Group recorded a write-off on doubtful debts of HUF 1 million and HUF 18 million in 2009 and 2008, respectively. Income from bad debts, written off receivables of HUF 10 million and HUF 30 million in 2009 and 2008, respectively.
To assess provision for doubtful debts, the Company estimated incurred losses that arise due to the liquidity problems of certain major debtors. The provision has been determined by reference to past default experience.
Export receivables are denominated primarily in EUR, USD and PLN and are recorded at the exchange rate as of 31 December 2009 and 2008. The resulting gain or loss is classified in a net amount either as other income or other expense, respectively (see notes 19 and 21) in the accompanying income statements.
9. other current assets
Other current assets as of 31 December 2009 and 2008 were as follows:
31 December 2009 31 December 2008
HUF million HUF million
Reclaimable VAT 11,055 4,535
Loan to MOL 1,860 10,627
Prepayments 90 112
Advances to suppliers 42 28
Loans to employees and other receivables 20 36
Accrued income 13 21
Interest receivables 8 39
Loan to Plastico S.A.* - -
Other 255 35
Total 13,343 15,433
*The long-term part of the loan receivable from Plastico S.A. reduced by the proportionate impairment loss has been recorded as other non-
current asset (See Note 6).
In 2006, based on a legal opinion, the Company reassessed the recoverability of its outstanding loan receivable from Plastico S.A. and decided
to fully write it off.
Analysis of loans receivable:
31 December 2009 31 December 2008
HUF million HUF million
Plastico S.A.-nak adott kölcsön bruttó értéke 323 323
Elszámolt értékvesztés 323 323
Total - -
Movements in the provision for doubtful loans receivable were as follows:
31 December 2009 31 December 2008
HUF million HUF million
At 1 January 323 323
Additions - -
Reversal - -
Amounts written off - -
Currency differences - -
At 31 December 323 323
TVK annual report 200982 83noTeS To THe ConSolIDaTeD FInanCIal STaTeMenTS
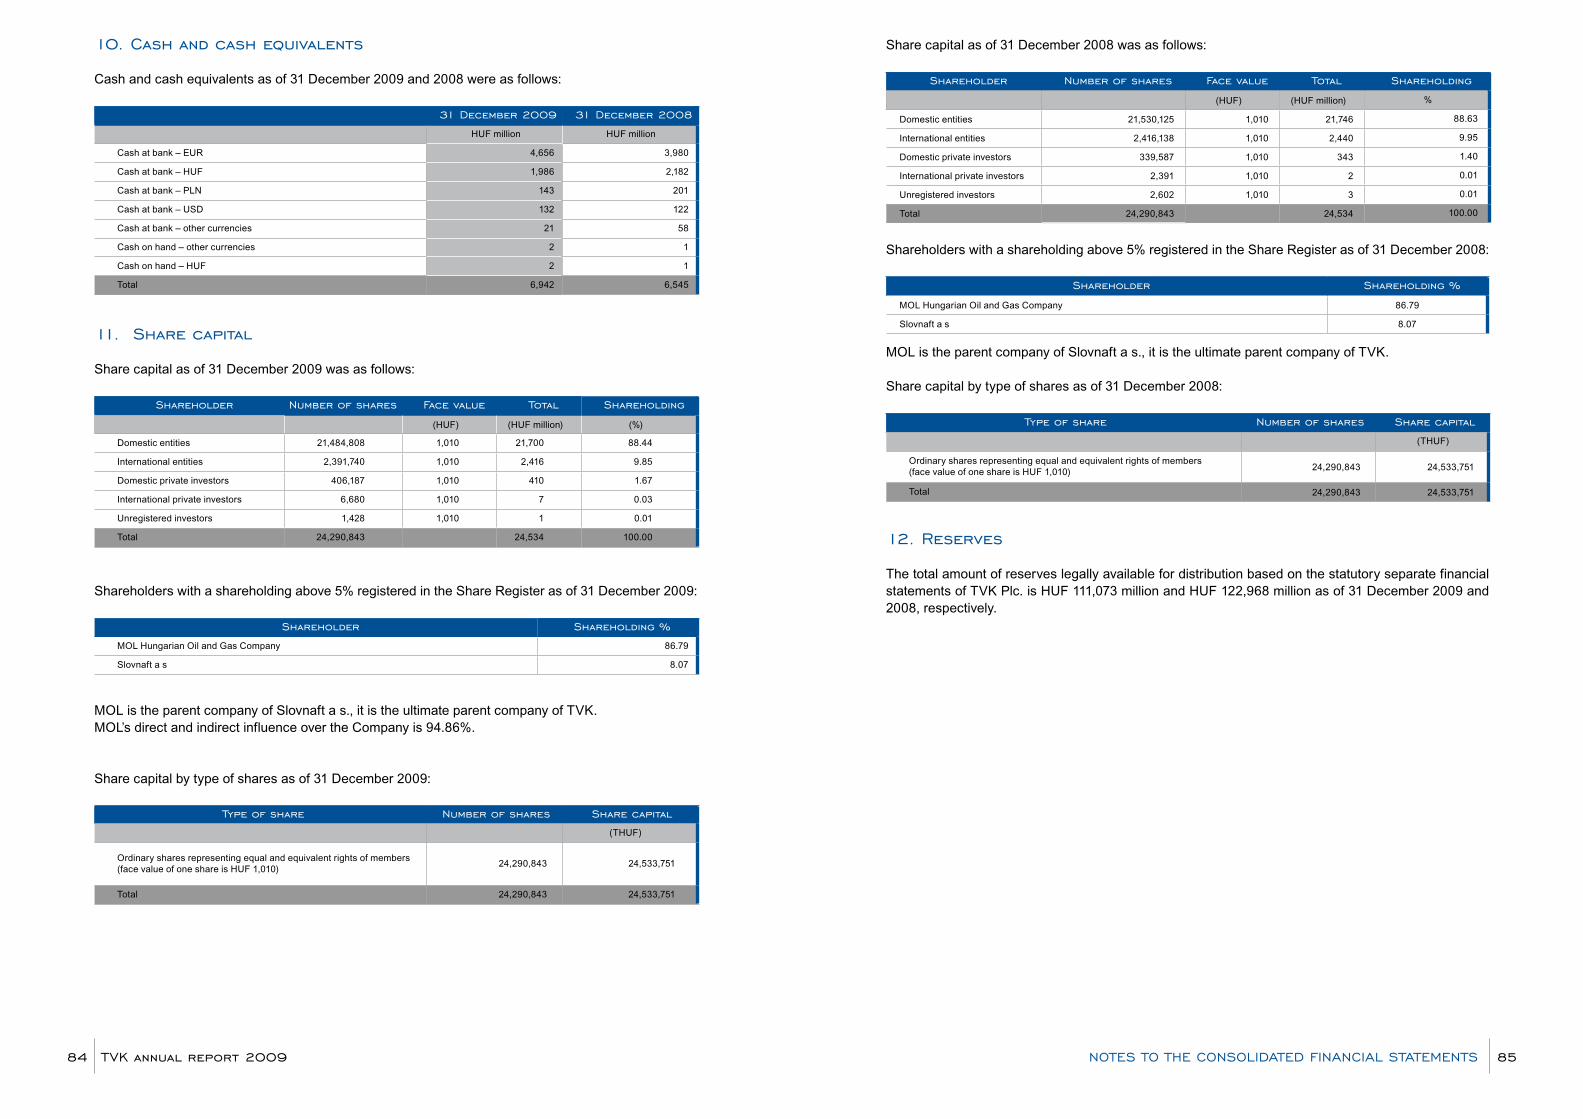
10. Cash and cash equivalents
Cash and cash equivalents as of 31 December 2009 and 2008 were as follows:
31 December 2009 31 December 2008
HUF million HUF million
Cash at bank – EUR 4,656 3,980
Cash at bank – HUF 1,986 2,182
Cash at bank – PLN 143 201
Cash at bank – USD 132 122
Cash at bank – other currencies 21 58
Cash on hand – other currencies 2 1
Cash on hand – HUF 2 1
Total 6,942 6,545
11. Share capital
Share capital as of 31 December 2009 was as follows:
Shareholder number of shares Face value Total Shareholding
(HUF) (HUF million) (%)
Domestic entities 21,484,808 1,010 21,700 88.44
International entities 2,391,740 1,010 2,416 9.85
Domestic private investors 406,187 1,010 410 1.67
International private investors 6,680 1,010 7 0.03
Unregistered investors 1,428 1,010 1 0.01
Total 24,290,843 24,534 100.00
Shareholders with a shareholding above 5% registered in the Share Register as of 31 December 2009:
Shareholder Shareholding %
MOL Hungarian Oil and Gas Company 86.79
Slovnaft a s 8.07
MOL is the parent company of Slovnaft a s., it is the ultimate parent company of TVK.MOL’s direct and indirect influence over the Company is 94.86%.
Share capital by type of shares as of 31 December 2009:
Type of share number of shares Share capital
(THUF)
Ordinary shares representing equal and equivalent rights of members (face value of one share is HUF 1,010)
24,290,843 24,533,751
Total 24,290,843 24,533,751
Share capital as of 31 December 2008 was as follows:
Shareholder number of shares Face value Total Shareholding
(HUF) (HUF million) %
Domestic entities 21,530,125 1,010 21,746 88.63
International entities 2,416,138 1,010 2,440 9.95
Domestic private investors 339,587 1,010 343 1.40
International private investors 2,391 1,010 2 0.01
Unregistered investors 2,602 1,010 3 0.01
Total 24,290,843 24,534 100.00
Shareholders with a shareholding above 5% registered in the Share Register as of 31 December 2008:
Shareholder Shareholding %
MOL Hungarian Oil and Gas Company 86.79
Slovnaft a s 8.07
MOL is the parent company of Slovnaft a s., it is the ultimate parent company of TVK.
Share capital by type of shares as of 31 December 2008:
Type of share number of shares Share capital
(THUF)
Ordinary shares representing equal and equivalent rights of members (face value of one share is HUF 1,010) 24,290,843 24,533,751
Total 24,290,843 24,533,751
12. reserves
The total amount of reserves legally available for distribution based on the statutory separate financial statements of TVK Plc. is HUF 111,073 million and HUF 122,968 million as of 31 December 2009 and 2008, respectively.
TVK annual report 200984 85noTeS To THe ConSolIDaTeD FInanCIal STaTeMenTS

13. long-term debt, net of current portion
Long-term debt, net of current portion as of 31 December 2009 and 2008 were as follows:
weighted average
interest rate
weighted average
interest rate
2009 200831
December 2009
31 December
2008% % HUF million HUF million
Secured bank loan of TVK Erőmű Kft. in EUR** 2.54% 5.71% 7,866 8,385
Secured bank loan of Tisza-WTP Kft. in EUR*** 3.10% 5.69% 1,335 1,431
Unsecured loan in EUR from MOL Plc. (majority stakeholder)* - 5.25% - 15,887
Other**** 3,324 3,592
Total long term debt 12,525 29,295
Current portion of long-term debt 893 16,709
Total long-term debt, net of current portion 11,632 12,586
*On 22 December 2004, the Company from a loan facility of EUR 280 million granted by MOL Hungarian Oil and Gas Company (MOL). EUR 60 million on 31 December, 2008 after year end revaluation, what was repaid in 2009.**On 26 July 2002, TVK Erőmű Kft. signed a project financing agreement with OTP Bank Rt., and the facility, that amounted to HUF 9,810 million (EUR 40 million), had been fully drawn by 31 December 2004. The loan is secured by a pledge on TVK Erőmű Kft’s assets. At the end of 2009 the short-term part of the loan amounts to HUF 763 million (EUR 2,816 thousand) reported as short-term loan payable.*** In order to implement a water treatment plant to be operated by Tisza WTP Kft., on 17 December 2002, the Kft. signed a long-term project and development loan agreement for HUF 1,883 million (EUR 8 million) with OTP Bank Rt. By the end of the availability period (29 December 2003), the Kft. had drawn down a total of EUR 7,340,000 from the facility. The project loan is secured by the Company’s assets. At the end of 2009, Tisza WTP Kft. reclassified an instalment of HUF 136 million (EUR 504 thousand) due in 12 months to current liabilities.**** According to service agreement the shareholding of the majority owners of the capital of TVK Erőmű Kft. and Tisza WTP Kft. is to be reimbursed during the lifetime of the project, and is recorded as other long-term debt in accordance with IAS 32, as it qualifies as a financial liability.
Secured loans were obtained for specific capital expenditure projects and are secured by the assets financed from the loan.
31 December 2009 31 December 2008
HUF million HUF million
Maturity two to five years 4,165 3,832
Maturity over five years 7,467 8,754
Total 11,632 12,586
14. provision for liabilities and charges
Provisions for expected liabilities and charges as of 31 December 2009 and 2008 were as follows:
env
iron-
men
tal
Sev
eran
ce
long
ter
m
empl
oye
e ret
irem
ent
ben
efits
old
Team
ben
efit
ear
lyret
irem
ent
ben
efits
Tota
l
HUF million
HUF million
HUF million
HUF million
HUF million
HUF million
BALANCE AS OF 1 JANUARY 2008 3,009 27 267 224 80 3,607
Provision made during the year and revision of previous estimate 170 20 39 (24) 33 238
Unwinding of the discount 154 - 9 10 - 173
Provision used during the year and revision of previous estimate (770) - (22) (31) (78) (901)
BALANCE AS OF 31 DECEMBER 2008 2,563 47 293 179 35 3,117
Provision made during the year and revision of previous estimate 135 15 29 51 65 295
Unwinding of the discount 163 - 6 6 - 175
Provision used during the year and revision of previous estimate (890) (6) (21) (30) (36) (983)
BALANCE AS OF 31 DECEMBER 2009 1,971 56 307 206 64 2,604
Current portion 31 December 2008 293 - 21 44 35 393
Non-current portion 31 December 2008 2,270 47 272 135 - 2,724
Current portion 31 December 2009 194 - 20 30 64 308
Non-current portion 31 December 2009 1,777 56 287 176 - 2,296
Environmental provisionThe amount of provision contains the discounted value of amounts estimated for 12 years. The environmental provision is expected to be further increased subject to the completion of an ongoing environmental survey. (See Note 26) The amount of the provision has been determined on the basis of existing technology at current prices by calculating risk-weighted cash flows discounted using estimated risk-free real interest rates.
Provision for severance The provision for severance pays equals the amount of severance pays due but not yet paid as at 31 December 2009.
Provision for long term employee retirement benefitsTVK operate benefit schemes that provide lump sum benefit to all employees at the time of their retirement. TVK employees are entitled for maximum of 2 months of final salary respectively, depending on the length of service period. None of these plans have separately administered funds. The value of provision has been determined using the projected unit credit method, based on financial and actuarial variables and assumptions that reflect relevant official statistical data and are in line with those incorporated in the business plan of TVK. Principal actuarial assumptions state an approximately 2% difference between the discount rate and the future salary increase. As of 31 December 2009 the Company has recognized a provision of HUF 307 million to cover its estimated obligation regarding future retirement benefits payable to current employees expected to retire from group entities.
Provision for Old Team benefitsEvery five years, TVK pays a fix set amount to all employees who had worked at least 10 years for the Company. On 31 December 2009, based on actuarial calculations, the Company made HUF 206 million provision for the future Old Team benefits of current employees.
TVK annual report 200986 87noTeS To THe ConSolIDaTeD FInanCIal STaTeMenTS

The following table summarises the main financial and actuarial variables and assumptions based on which the amount of retirement benefits were determined:
2009 2008
Discount rate in % 3.0-5.0 3.0-6.0
Average wage increase in % 1.0-3.0 1.0-4.0
Mortality index (male) 0.06-3.45 0.06-2.82
Mortality index (female) 0.02-1.50 0.02-1.15
15. other non-current liabilities
31 December 2009 31 December 2008
HUF million HUF million
Forward of CO2 emission quota 4,281 -
Other 7 13
Total 4,288 13
16. Trade and other payables
The Group’s payables and other current liabilities as of December 2009 and 2008 were as follows:
31 December 2009 31 December 2008
HUF million HUF million
Domestic trade creditors 32,258 14,277
- of which: MOL Group members 26,237 10,699
Associates 58 50
Import creditors 1,665 1,100
- of which: MOL Group members 516 80
Suppliers related to capital projects 1,586 1,619
- of which: MOL Group members 261 501
Discount payable to customers 3,195 3,863
Accrued expenses 1,591 2,641
Dividend payable to the majority owner of TVK Erőmű Kft. 655 357
Amounts due to employees and related contributions 297 303
Dividend payable to owner of Tisza-WTP Kft. 121 64
State budget taxes 59 65
Deferred other revenues 40 1
Dividends payable* 8 7
Other 100 95
Total 41,575 24,392
*Dividend payable in 2009 are related to 2005’s, 2007’s and 2008’s dividend which hasn’t been paid yet.
17. Short-term debt
31 December 2009 31 December 2008
HUF million HUF million
Revolving loan in EUR from MOL Plc. (majority stakeholder)* 9,469 -
Unsecured loans 9 -
Total short term debt 9,478 -
* On 21 December 2009, the Company utilized HUF 13,805 million (EUR 50 million) from the revolving loan of EUR 100 million granted by MOL
Hungarian Oil and Gas Company (MOL), and it repaid HUF 4,152 million (EUR 15 million). The amount of loan from MOL is HUF 9,469 million
(EUR 35 million) on December 31, 2009 after year end revaluation.
18. net sales by geographical area
Net sales by geographical area as of 31 December 2009 and 2008 were as follows:
2009 2008
HUF million HUF million
Hungary (reduced by quantity discount) 133,787 166,297
Germany 23,628 31,368
Italy 21,830 25,623
Poland 21,325 23,396
Slovakia 7,030 8,892
Romania 4,611 7,572
Austria 4,232 6,349
United Kingdom 3,106 5,829
France 3,911 4,929
Other European Countries 34,559 40,501
Non-European Countries 9,330 5,073
- Quantity discount of foreign sales (1,977) (2,423)
Total 265,372 323,406
19. other operating income
Other operating income as of 31 December 2009 and 2008 were as follows:
2009 2008
HUF million HUF million
Gain on sale of CO2 emission quota received free of charge 1,433 -
Foreign exchange gain on receivables and payables, net 441 -
Default interest received, indemnity, penalties 93 117
Retrospective discount 14 27
Donations received 9 1
Gain on the disposal of tangible assets 3 47
Other 56 24
Total 2,049 216
TVK annual report 200988 89noTeS To THe ConSolIDaTeD FInanCIal STaTeMenTS
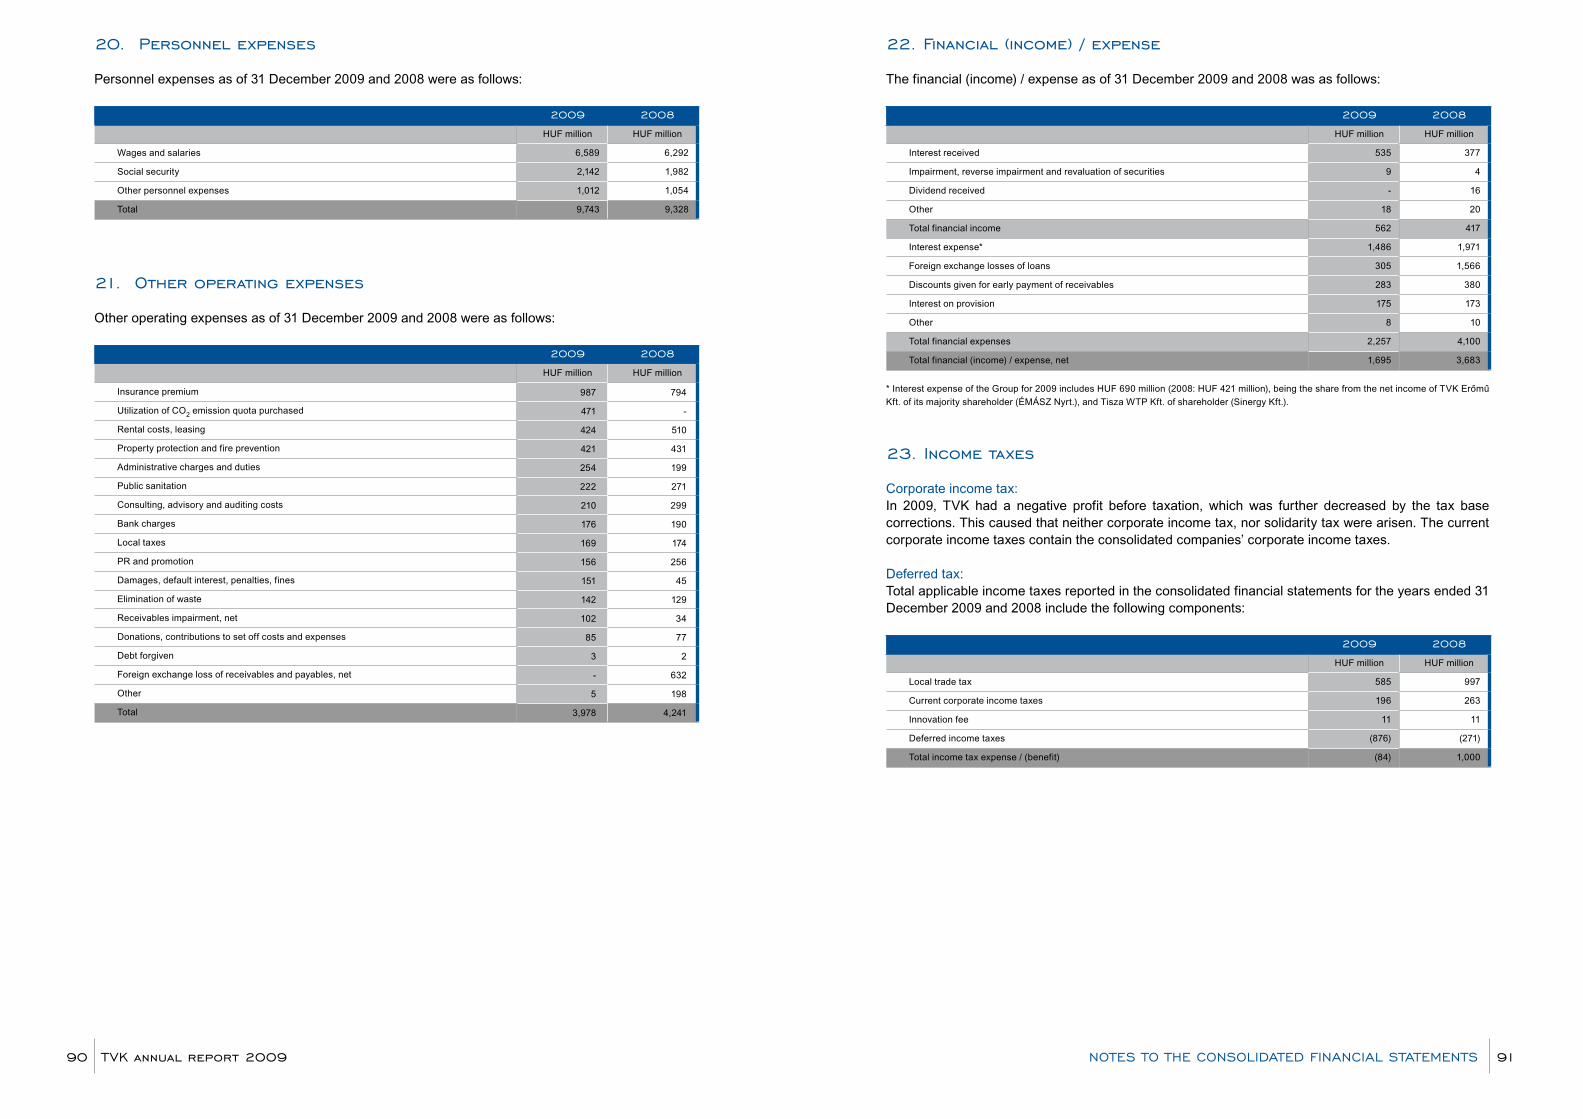
20. personnel expenses
Personnel expenses as of 31 December 2009 and 2008 were as follows:
2009 2008
HUF million HUF million
Wages and salaries 6,589 6,292
Social security 2,142 1,982
Other personnel expenses 1,012 1,054
Total 9,743 9,328
21. other operating expenses
Other operating expenses as of 31 December 2009 and 2008 were as follows:
2009 2008
HUF million HUF million
Insurance premium 987 794
Utilization of CO2 emission quota purchased 471 -
Rental costs, leasing 424 510
Property protection and fire prevention 421 431
Administrative charges and duties 254 199
Public sanitation 222 271
Consulting, advisory and auditing costs 210 299
Bank charges 176 190
Local taxes 169 174
PR and promotion 156 256
Damages, default interest, penalties, fines 151 45
Elimination of waste 142 129
Receivables impairment, net 102 34
Donations, contributions to set off costs and expenses 85 77
Debt forgiven 3 2
Foreign exchange loss of receivables and payables, net - 632
Other 5 198
Total 3,978 4,241
22. Financial (income) / expense
The financial (income) / expense as of 31 December 2009 and 2008 was as follows:
2009 2008
HUF million HUF million
Interest received 535 377
Impairment, reverse impairment and revaluation of securities 9 4
Dividend received - 16
Other 18 20
Total financial income 562 417
Interest expense* 1,486 1,971
Foreign exchange losses of loans 305 1,566
Discounts given for early payment of receivables 283 380
Interest on provision 175 173
Other 8 10
Total financial expenses 2,257 4,100
Total financial (income) / expense, net 1,695 3,683
* Interest expense of the Group for 2009 includes HUF 690 million (2008: HUF 421 million), being the share from the net income of TVK Erőmű
Kft. of its majority shareholder (ÉMÁSZ Nyrt.), and Tisza WTP Kft. of shareholder (Sinergy Kft.).
23. Income taxes
Corporate income tax:In 2009, TVK had a negative profit before taxation, which was further decreased by the tax base corrections. This caused that neither corporate income tax, nor solidarity tax were arisen. The current corporate income taxes contain the consolidated companies’ corporate income taxes.
Deferred tax: Total applicable income taxes reported in the consolidated financial statements for the years ended 31 December 2009 and 2008 include the following components:
2009 2008
HUF million HUF million
Local trade tax 585 997
Current corporate income taxes 196 263
Innovation fee 11 11
Deferred income taxes (876) (271)
Total income tax expense / (benefit) (84) 1,000
TVK annual report 200990 91noTeS To THe ConSolIDaTeD FInanCIal STaTeMenTS
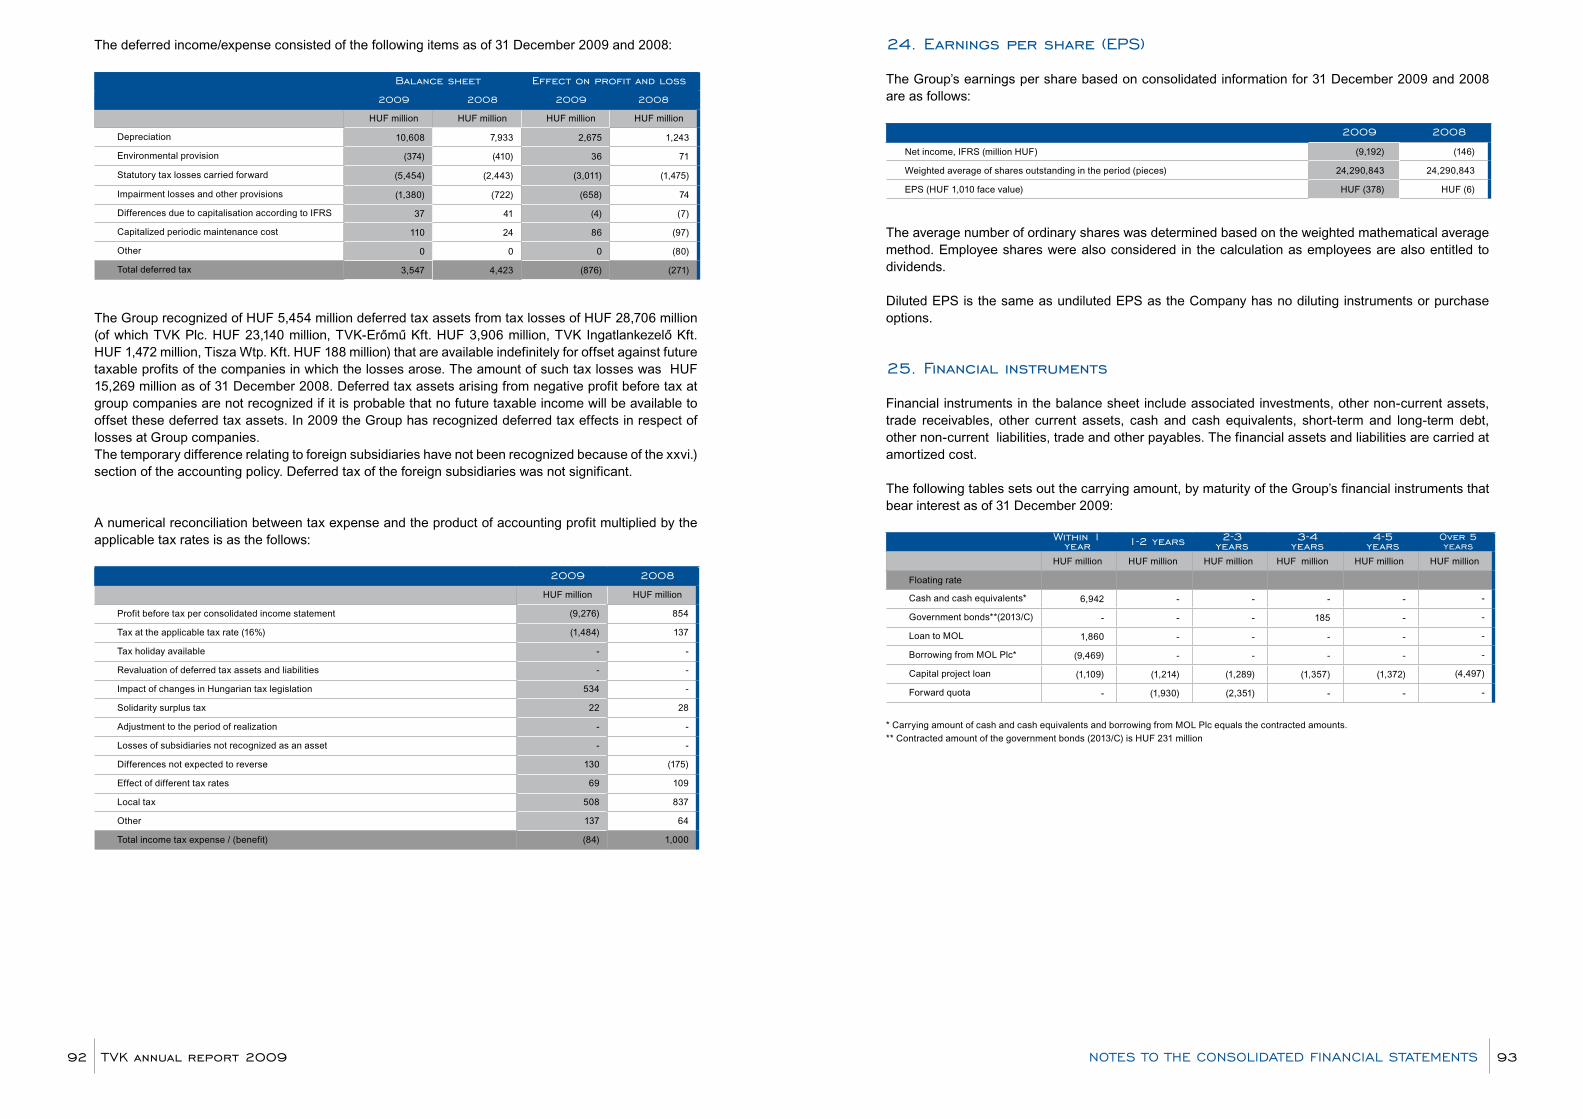
The deferred income/expense consisted of the following items as of 31 December 2009 and 2008:
Balance sheet effect on profit and loss
2009 2008 2009 2008
HUF million HUF million HUF million HUF million
Depreciation 10,608 7,933 2,675 1,243
Environmental provision (374) (410) 36 71
Statutory tax losses carried forward (5,454) (2,443) (3,011) (1,475)
Impairment losses and other provisions (1,380) (722) (658) 74
Differences due to capitalisation according to IFRS 37 41 (4) (7)
Capitalized periodic maintenance cost 110 24 86 (97)
Other 0 0 0 (80)
Total deferred tax 3,547 4,423 (876) (271)
The Group recognized of HUF 5,454 million deferred tax assets from tax losses of HUF 28,706 million (of which TVK Plc. HUF 23,140 million, TVK-Erőmű Kft. HUF 3,906 million, TVK Ingatlankezelő Kft. HUF 1,472 million, Tisza Wtp. Kft. HUF 188 million) that are available indefinitely for offset against future taxable profits of the companies in which the losses arose. The amount of such tax losses was HUF 15,269 million as of 31 December 2008. Deferred tax assets arising from negative profit before tax at group companies are not recognized if it is probable that no future taxable income will be available to offset these deferred tax assets. In 2009 the Group has recognized deferred tax effects in respect of losses at Group companies.The temporary difference relating to foreign subsidiaries have not been recognized because of the xxvi.) section of the accounting policy. Deferred tax of the foreign subsidiaries was not significant.
A numerical reconciliation between tax expense and the product of accounting profit multiplied by the applicable tax rates is as the follows:
2009 2008
HUF million HUF million
Profit before tax per consolidated income statement (9,276) 854
Tax at the applicable tax rate (16%) (1,484) 137
Tax holiday available - -
Revaluation of deferred tax assets and liabilities - -
Impact of changes in Hungarian tax legislation 534 -
Solidarity surplus tax 22 28
Adjustment to the period of realization - -
Losses of subsidiaries not recognized as an asset - -
Differences not expected to reverse 130 (175)
Effect of different tax rates 69 109
Local tax 508 837
Other 137 64
Total income tax expense / (benefit) (84) 1,000
24. earnings per share (epS)
The Group’s earnings per share based on consolidated information for 31 December 2009 and 2008 are as follows:
2009 2008
Net income, IFRS (million HUF) (9,192) (146)
Weighted average of shares outstanding in the period (pieces) 24,290,843 24,290,843
EPS (HUF 1,010 face value) HUF (378) HUF (6)
The average number of ordinary shares was determined based on the weighted mathematical average method. Employee shares were also considered in the calculation as employees are also entitled to dividends.
Diluted EPS is the same as undiluted EPS as the Company has no diluting instruments or purchase options.
25. Financial instruments
Financial instruments in the balance sheet include associated investments, other non-current assets, trade receivables, other current assets, cash and cash equivalents, short-term and long-term debt, other non-current liabilities, trade and other payables. The financial assets and liabilities are carried at amortized cost.
The following tables sets out the carrying amount, by maturity of the Group’s financial instruments that bear interest as of 31 December 2009:
within 1 year 1-2 years 2-3
years3-4
years4-5
yearsover 5 years
HUF million HUF million HUF million HUF million HUF million HUF million
Floating rate
Cash and cash equivalents* 6,942 - - - - -
Government bonds**(2013/C) - - - 185 - -
Loan to MOL 1,860 - - - - -
Borrowing from MOL Plc* (9,469) - - - - -
Capital project loan (1,109) (1,214) (1,289) (1,357) (1,372) (4,497)
Forward quota - (1,930) (2,351) - - -
* Carrying amount of cash and cash equivalents and borrowing from MOL Plc equals the contracted amounts.
** Contracted amount of the government bonds (2013/C) is HUF 231 million
TVK annual report 200992 93noTeS To THe ConSolIDaTeD FInanCIal STaTeMenTS
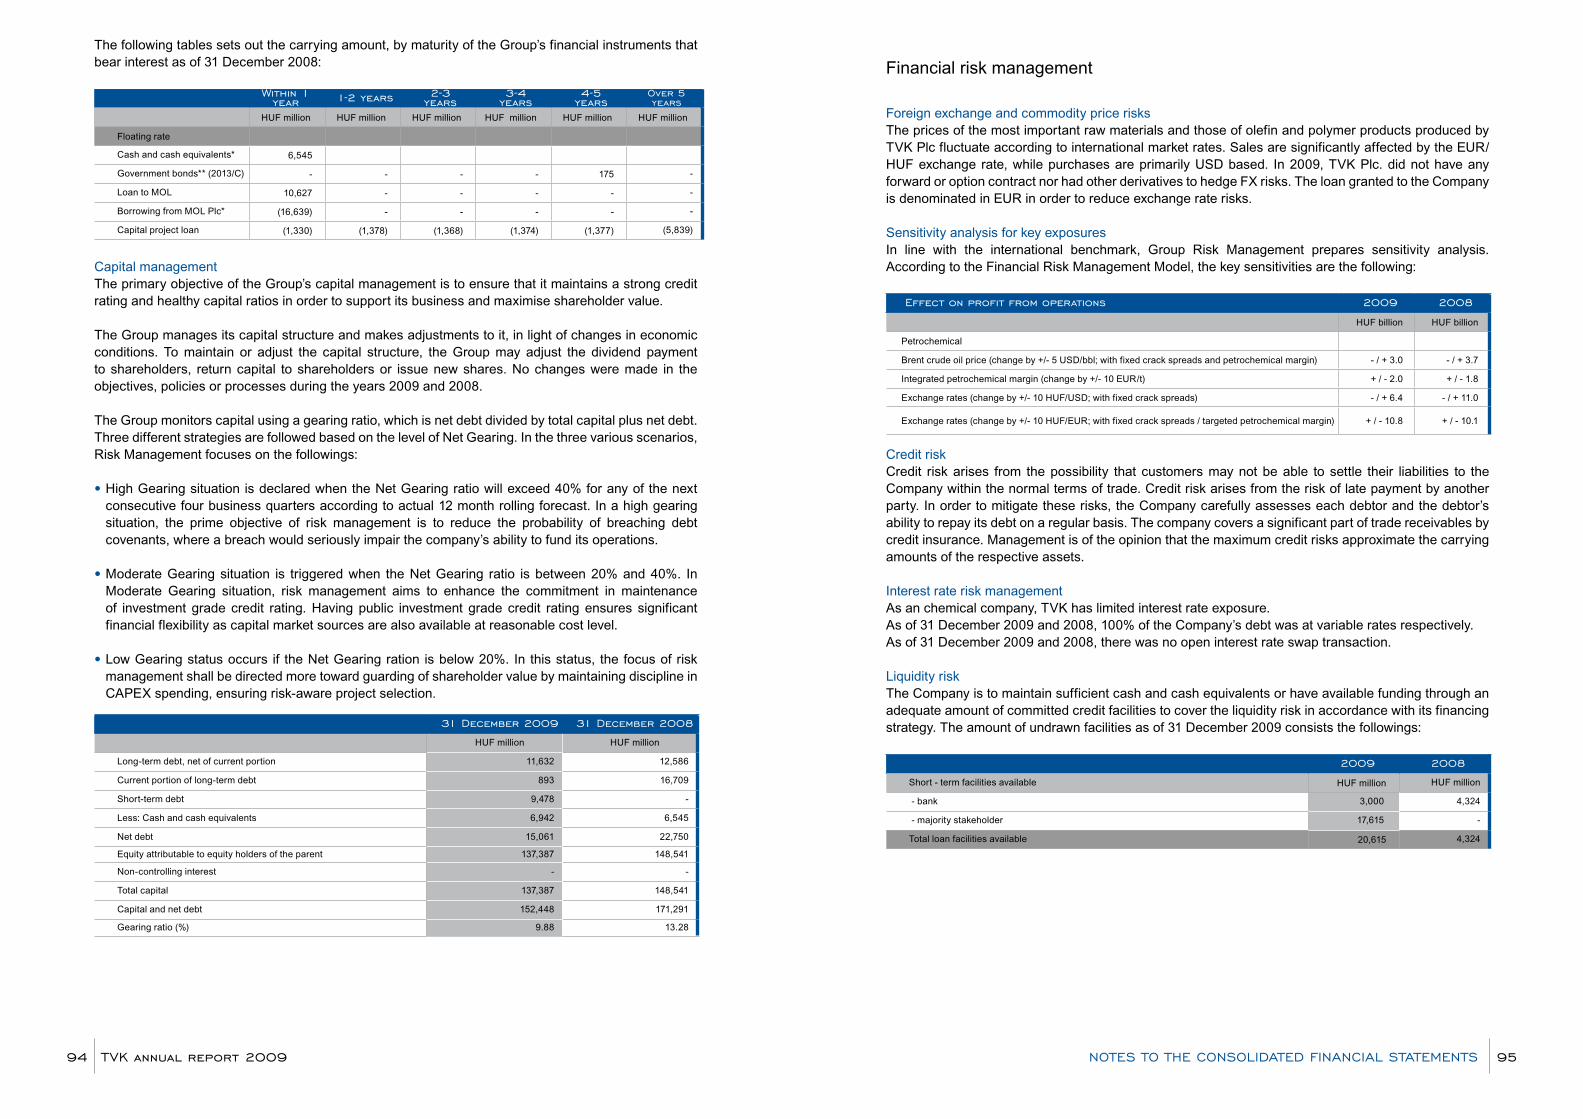
The following tables sets out the carrying amount, by maturity of the Group’s financial instruments that bear interest as of 31 December 2008:
within 1 year 1-2 years 2-3
years3-4
years4-5
yearsover 5 years
HUF million HUF million HUF million HUF million HUF million HUF million
Floating rate
Cash and cash equivalents* 6,545
Government bonds** (2013/C) - - - - 175 -
Loan to MOL 10,627 - - - - -
Borrowing from MOL Plc* (16,639) - - - - -
Capital project loan (1,330) (1,378) (1,368) (1,374) (1,377) (5,839)
Capital managementThe primary objective of the Group’s capital management is to ensure that it maintains a strong credit rating and healthy capital ratios in order to support its business and maximise shareholder value.
The Group manages its capital structure and makes adjustments to it, in light of changes in economic conditions. To maintain or adjust the capital structure, the Group may adjust the dividend payment to shareholders, return capital to shareholders or issue new shares. No changes were made in the objectives, policies or processes during the years 2009 and 2008.
The Group monitors capital using a gearing ratio, which is net debt divided by total capital plus net debt. Three different strategies are followed based on the level of Net Gearing. In the three various scenarios, Risk Management focuses on the followings:
• High Gearing situation is declared when the Net Gearing ratio will exceed 40% for any of the next consecutive four business quarters according to actual 12 month rolling forecast. In a high gearing situation, the prime objective of risk management is to reduce the probability of breaching debt covenants, where a breach would seriously impair the company’s ability to fund its operations.
• Moderate Gearing situation is triggered when the Net Gearing ratio is between 20% and 40%. In Moderate Gearing situation, risk management aims to enhance the commitment in maintenance of investment grade credit rating. Having public investment grade credit rating ensures significant financial flexibility as capital market sources are also available at reasonable cost level.
• Low Gearing status occurs if the Net Gearing ration is below 20%. In this status, the focus of risk management shall be directed more toward guarding of shareholder value by maintaining discipline in CAPEX spending, ensuring risk-aware project selection.
31 December 2009 31 December 2008
HUF million HUF million
Long-term debt, net of current portion 11,632 12,586
Current portion of long-term debt 893 16,709
Short-term debt 9,478 -
Less: Cash and cash equivalents 6,942 6,545
Net debt 15,061 22,750
Equity attributable to equity holders of the parent 137,387 148,541
Non-controlling interest - -
Total capital 137,387 148,541
Capital and net debt 152,448 171,291
Gearing ratio (%) 9.88 13.28
Financial risk management
Foreign exchange and commodity price risks The prices of the most important raw materials and those of olefin and polymer products produced by TVK Plc fluctuate according to international market rates. Sales are significantly affected by the EUR/HUF exchange rate, while purchases are primarily USD based. In 2009, TVK Plc. did not have any forward or option contract nor had other derivatives to hedge FX risks. The loan granted to the Company is denominated in EUR in order to reduce exchange rate risks.
Sensitivity analysis for key exposuresIn line with the international benchmark, Group Risk Management prepares sensitivity analysis. According to the Financial Risk Management Model, the key sensitivities are the following:
effect on profit from operations 2009 2008
HUF billion HUF billion
Petrochemical
Brent crude oil price (change by +/- 5 USD/bbl; with fixed crack spreads and petrochemical margin) - / + 3.0 - / + 3.7
Integrated petrochemical margin (change by +/- 10 EUR/t) + / - 2.0 + / - 1.8
Exchange rates (change by +/- 10 HUF/USD; with fixed crack spreads) - / + 6.4 - / + 11.0
Exchange rates (change by +/- 10 HUF/EUR; with fixed crack spreads / targeted petrochemical margin) + / - 10.8 + / - 10.1
Credit risk Credit risk arises from the possibility that customers may not be able to settle their liabilities to the Company within the normal terms of trade. Credit risk arises from the risk of late payment by another party. In order to mitigate these risks, the Company carefully assesses each debtor and the debtor’s ability to repay its debt on a regular basis. The company covers a significant part of trade receivables by credit insurance. Management is of the opinion that the maximum credit risks approximate the carrying amounts of the respective assets.
Interest rate risk managementAs an chemical company, TVK has limited interest rate exposure. As of 31 December 2009 and 2008, 100% of the Company’s debt was at variable rates respectively.As of 31 December 2009 and 2008, there was no open interest rate swap transaction.
Liquidity riskThe Company is to maintain sufficient cash and cash equivalents or have available funding through an adequate amount of committed credit facilities to cover the liquidity risk in accordance with its financing strategy. The amount of undrawn facilities as of 31 December 2009 consists the followings:
2009 2008
Short - term facilities available HUF million HUF million
- bank 3,000 4,324
- majority stakeholder 17,615 -
Total loan facilities available 20,615 4,324
TVK annual report 200994 95noTeS To THe ConSolIDaTeD FInanCIal STaTeMenTS
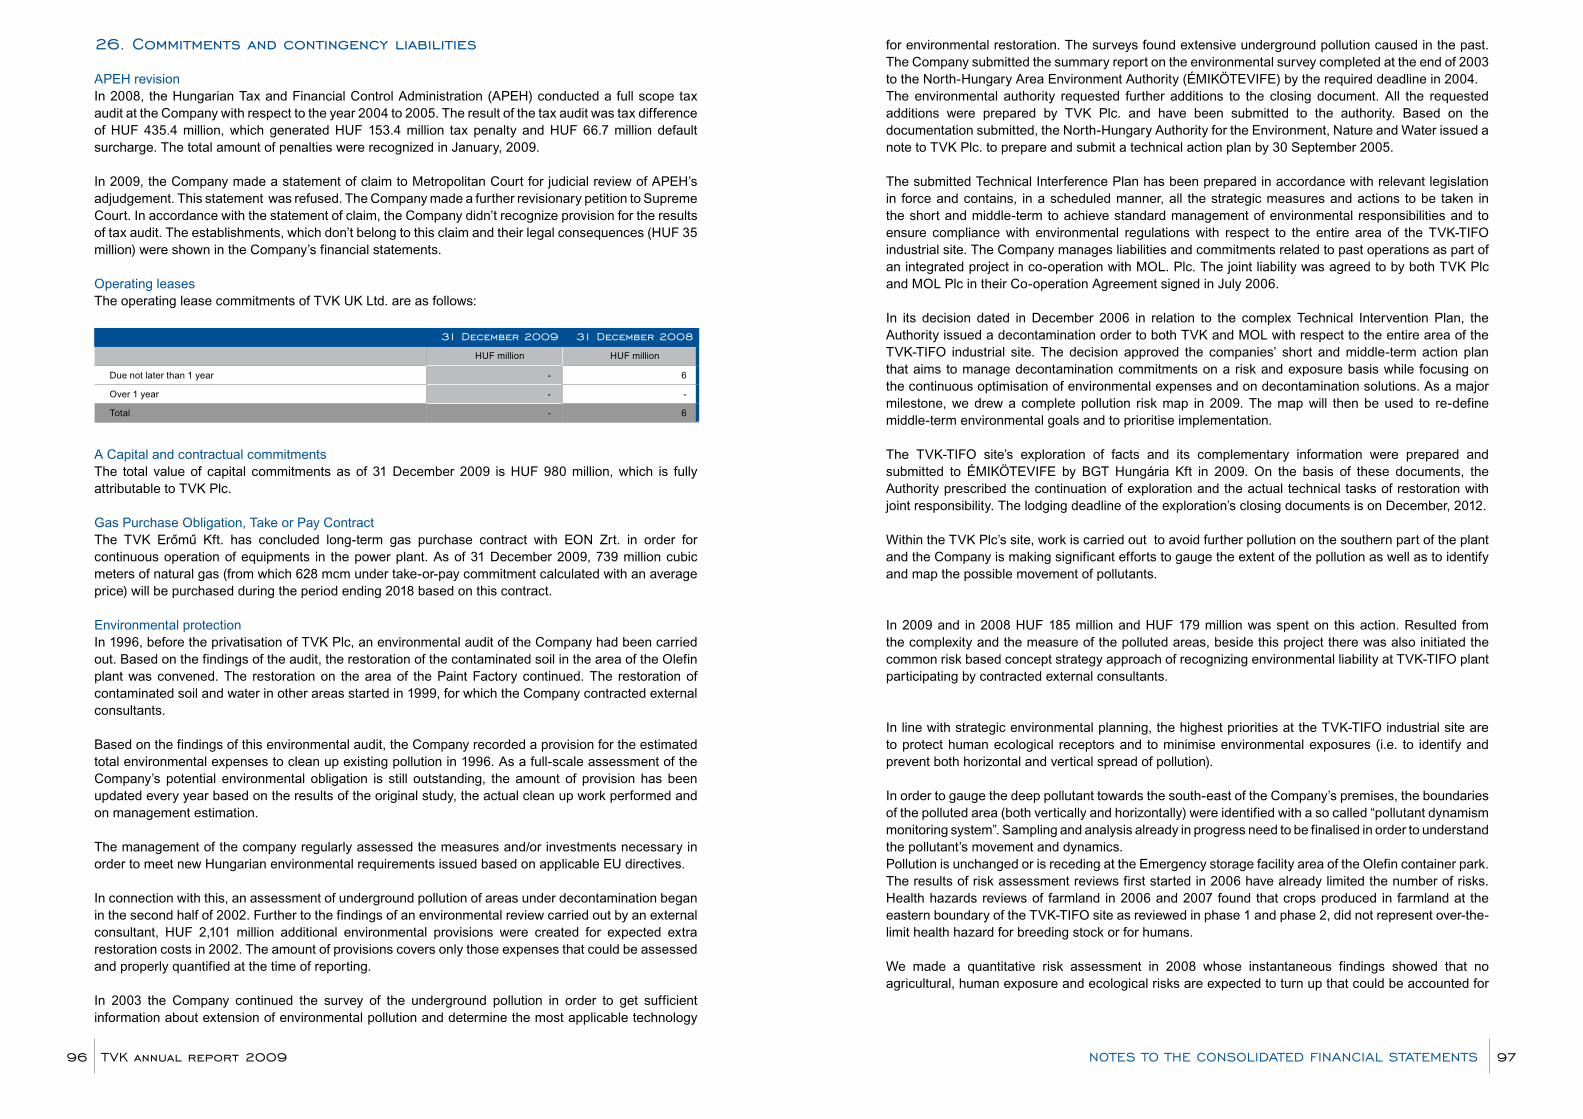
26. Commitments and contingency liabilities
APEH revisionIn 2008, the Hungarian Tax and Financial Control Administration (APEH) conducted a full scope tax audit at the Company with respect to the year 2004 to 2005. The result of the tax audit was tax difference of HUF 435.4 million, which generated HUF 153.4 million tax penalty and HUF 66.7 million default surcharge. The total amount of penalties were recognized in January, 2009.
In 2009, the Company made a statement of claim to Metropolitan Court for judicial review of APEH’s adjudgement. This statement was refused. The Company made a further revisionary petition to Supreme Court. In accordance with the statement of claim, the Company didn’t recognize provision for the results of tax audit. The establishments, which don’t belong to this claim and their legal consequences (HUF 35 million) were shown in the Company’s financial statements.
Operating leasesThe operating lease commitments of TVK UK Ltd. are as follows:
31 December 2009 31 December 2008
HUF million HUF million
Due not later than 1 year - 6
Over 1 year - -
Total - 6
A Capital and contractual commitmentsThe total value of capital commitments as of 31 December 2009 is HUF 980 million, which is fully attributable to TVK Plc.
Gas Purchase Obligation, Take or Pay ContractThe TVK Erőmű Kft. has concluded long-term gas purchase contract with EON Zrt. in order for continuous operation of equipments in the power plant. As of 31 December 2009, 739 million cubic meters of natural gas (from which 628 mcm under take-or-pay commitment calculated with an average price) will be purchased during the period ending 2018 based on this contract.
Environmental protectionIn 1996, before the privatisation of TVK Plc, an environmental audit of the Company had been carried out. Based on the findings of the audit, the restoration of the contaminated soil in the area of the Olefin plant was convened. The restoration on the area of the Paint Factory continued. The restoration of contaminated soil and water in other areas started in 1999, for which the Company contracted external consultants.
Based on the findings of this environmental audit, the Company recorded a provision for the estimated total environmental expenses to clean up existing pollution in 1996. As a full-scale assessment of the Company’s potential environmental obligation is still outstanding, the amount of provision has been updated every year based on the results of the original study, the actual clean up work performed and on management estimation.
The management of the company regularly assessed the measures and/or investments necessary in order to meet new Hungarian environmental requirements issued based on applicable EU directives.
In connection with this, an assessment of underground pollution of areas under decontamination began in the second half of 2002. Further to the findings of an environmental review carried out by an external consultant, HUF 2,101 million additional environmental provisions were created for expected extra restoration costs in 2002. The amount of provisions covers only those expenses that could be assessed and properly quantified at the time of reporting.
In 2003 the Company continued the survey of the underground pollution in order to get sufficient information about extension of environmental pollution and determine the most applicable technology
for environmental restoration. The surveys found extensive underground pollution caused in the past. The Company submitted the summary report on the environmental survey completed at the end of 2003 to the North-Hungary Area Environment Authority (ÉMIKÖTEVIFE) by the required deadline in 2004.The environmental authority requested further additions to the closing document. All the requested additions were prepared by TVK Plc. and have been submitted to the authority. Based on the documentation submitted, the North-Hungary Authority for the Environment, Nature and Water issued a note to TVK Plc. to prepare and submit a technical action plan by 30 September 2005.
The submitted Technical Interference Plan has been prepared in accordance with relevant legislation in force and contains, in a scheduled manner, all the strategic measures and actions to be taken in the short and middle-term to achieve standard management of environmental responsibilities and to ensure compliance with environmental regulations with respect to the entire area of the TVK-TIFO industrial site. The Company manages liabilities and commitments related to past operations as part of an integrated project in co-operation with MOL. Plc. The joint liability was agreed to by both TVK Plc and MOL Plc in their Co-operation Agreement signed in July 2006.
In its decision dated in December 2006 in relation to the complex Technical Intervention Plan, the Authority issued a decontamination order to both TVK and MOL with respect to the entire area of the TVK-TIFO industrial site. The decision approved the companies’ short and middle-term action plan that aims to manage decontamination commitments on a risk and exposure basis while focusing on the continuous optimisation of environmental expenses and on decontamination solutions. As a major milestone, we drew a complete pollution risk map in 2009. The map will then be used to re-define middle-term environmental goals and to prioritise implementation.
The TVK-TIFO site’s exploration of facts and its complementary information were prepared and submitted to ÉMIKÖTEVIFE by BGT Hungária Kft in 2009. On the basis of these documents, the Authority prescribed the continuation of exploration and the actual technical tasks of restoration with joint responsibility. The lodging deadline of the exploration’s closing documents is on December, 2012.
Within the TVK Plc’s site, work is carried out to avoid further pollution on the southern part of the plant and the Company is making significant efforts to gauge the extent of the pollution as well as to identify and map the possible movement of pollutants.
In 2009 and in 2008 HUF 185 million and HUF 179 million was spent on this action. Resulted from the complexity and the measure of the polluted areas, beside this project there was also initiated the common risk based concept strategy approach of recognizing environmental liability at TVK-TIFO plant participating by contracted external consultants.
In line with strategic environmental planning, the highest priorities at the TVK-TIFO industrial site are to protect human ecological receptors and to minimise environmental exposures (i.e. to identify and prevent both horizontal and vertical spread of pollution).
In order to gauge the deep pollutant towards the south-east of the Company’s premises, the boundaries of the polluted area (both vertically and horizontally) were identified with a so called “pollutant dynamism monitoring system”. Sampling and analysis already in progress need to be finalised in order to understand the pollutant’s movement and dynamics. Pollution is unchanged or is receding at the Emergency storage facility area of the Olefin container park. The results of risk assessment reviews first started in 2006 have already limited the number of risks. Health hazards reviews of farmland in 2006 and 2007 found that crops produced in farmland at the eastern boundary of the TVK-TIFO site as reviewed in phase 1 and phase 2, did not represent over-the-limit health hazard for breeding stock or for humans.
We made a quantitative risk assessment in 2008 whose instantaneous findings showed that no agricultural, human exposure and ecological risks are expected to turn up that could be accounted for
TVK annual report 200996 97noTeS To THe ConSolIDaTeD FInanCIal STaTeMenTS
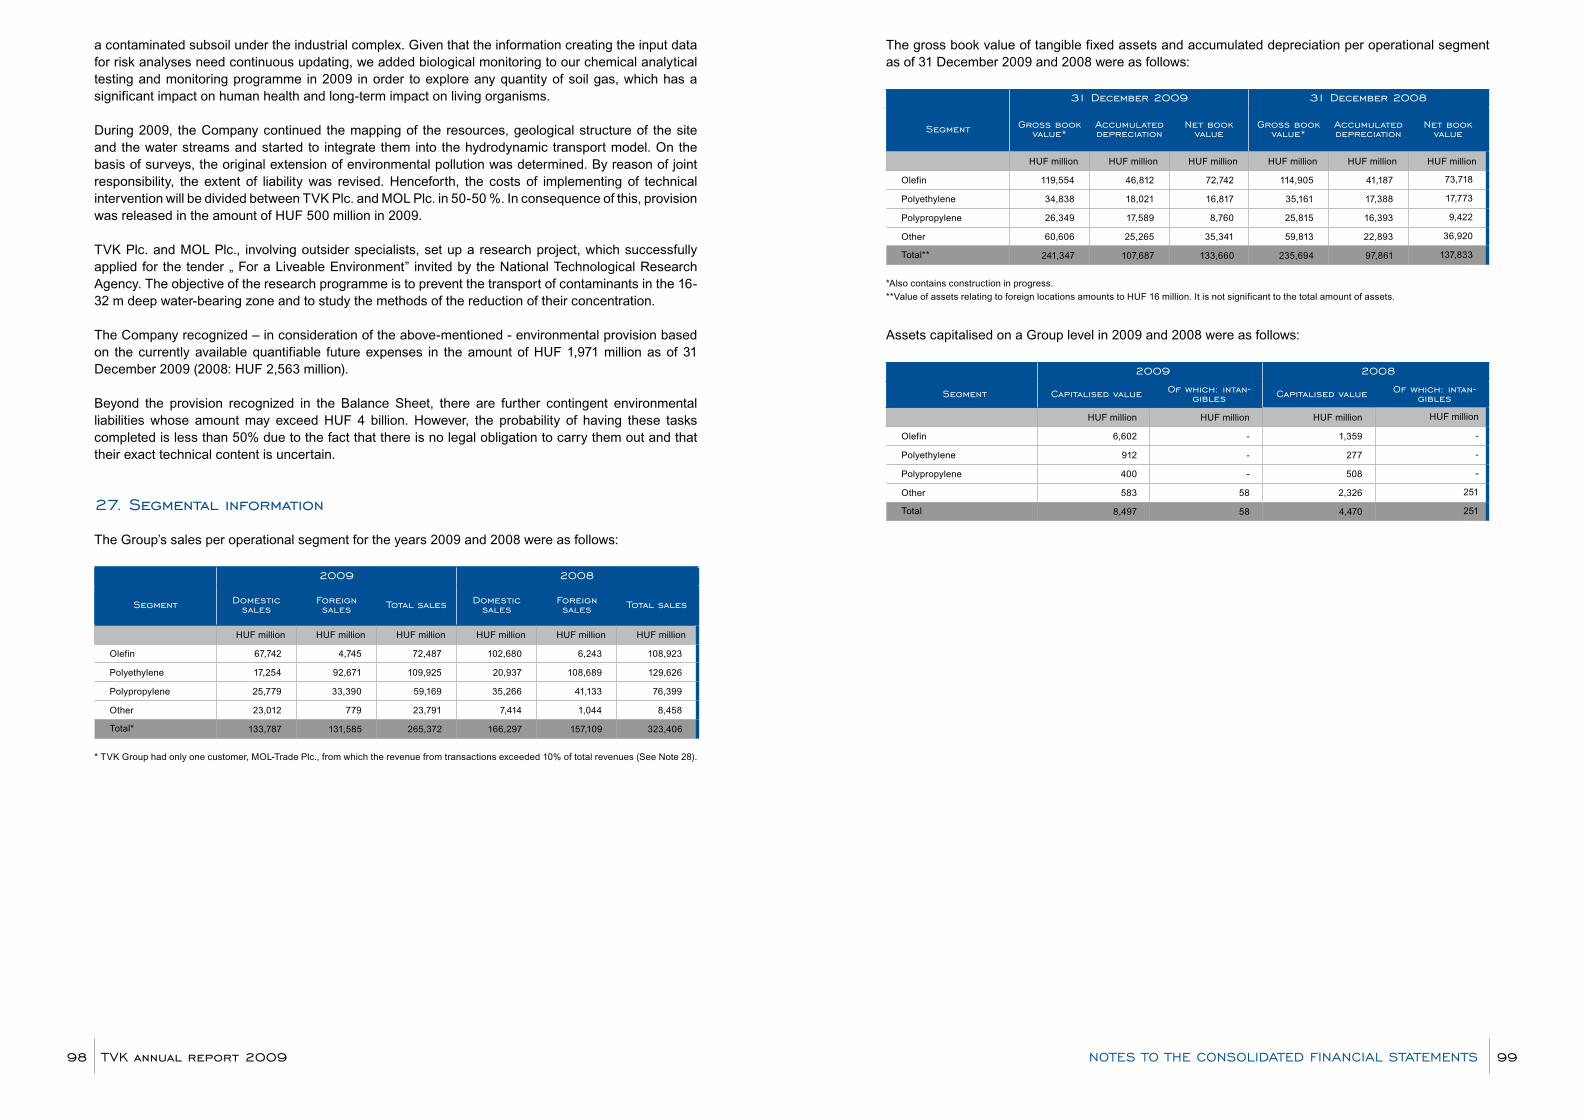
a contaminated subsoil under the industrial complex. Given that the information creating the input data for risk analyses need continuous updating, we added biological monitoring to our chemical analytical testing and monitoring programme in 2009 in order to explore any quantity of soil gas, which has a significant impact on human health and long-term impact on living organisms.
During 2009, the Company continued the mapping of the resources, geological structure of the site and the water streams and started to integrate them into the hydrodynamic transport model. On the basis of surveys, the original extension of environmental pollution was determined. By reason of joint responsibility, the extent of liability was revised. Henceforth, the costs of implementing of technical intervention will be divided between TVK Plc. and MOL Plc. in 50-50 %. In consequence of this, provision was released in the amount of HUF 500 million in 2009.
TVK Plc. and MOL Plc., involving outsider specialists, set up a research project, which successfully applied for the tender „ For a Liveable Environment” invited by the National Technological Research Agency. The objective of the research programme is to prevent the transport of contaminants in the 16-32 m deep water-bearing zone and to study the methods of the reduction of their concentration.
The Company recognized – in consideration of the above-mentioned - environmental provision based on the currently available quantifiable future expenses in the amount of HUF 1,971 million as of 31 December 2009 (2008: HUF 2,563 million).
Beyond the provision recognized in the Balance Sheet, there are further contingent environmental liabilities whose amount may exceed HUF 4 billion. However, the probability of having these tasks completed is less than 50% due to the fact that there is no legal obligation to carry them out and that their exact technical content is uncertain.
27. Segmental information
The Group’s sales per operational segment for the years 2009 and 2008 were as follows:
2009 2008
Segment Domestic sales
Foreign sales Total sales Domestic
salesForeign sales Total sales
HUF million HUF million HUF million HUF million HUF million HUF million
Olefin 67,742 4,745 72,487 102,680 6,243 108,923
Polyethylene 17,254 92,671 109,925 20,937 108,689 129,626
Polypropylene 25,779 33,390 59,169 35,266 41,133 76,399
Other 23,012 779 23,791 7,414 1,044 8,458
Total* 133,787 131,585 265,372 166,297 157,109 323,406
* TVK Group had only one customer, MOL-Trade Plc., from which the revenue from transactions exceeded 10% of total revenues (See Note 28).
The gross book value of tangible fixed assets and accumulated depreciation per operational segment as of 31 December 2009 and 2008 were as follows:
31 December 2009 31 December 2008
Segment Gross book value*
accumulated depreciation
net book value
Gross book value*
accumulated depreciation
net book value
HUF million HUF million HUF million HUF million HUF million HUF million
Olefin 119,554 46,812 72,742 114,905 41,187 73,718
Polyethylene 34,838 18,021 16,817 35,161 17,388 17,773
Polypropylene 26,349 17,589 8,760 25,815 16,393 9,422
Other 60,606 25,265 35,341 59,813 22,893 36,920
Total** 241,347 107,687 133,660 235,694 97,861 137,833
*Also contains construction in progress.
**Value of assets relating to foreign locations amounts to HUF 16 million. It is not significant to the total amount of assets.
Assets capitalised on a Group level in 2009 and 2008 were as follows:
2009 2008
Segment Capitalised value of which: intan-gibles Capitalised value of which: intan-
gibles
HUF million HUF million HUF million HUF million
Olefin 6,602 - 1,359 -
Polyethylene 912 - 277 -
Polypropylene 400 - 508 -
Other 583 58 2,326 251
Total 8,497 58 4,470 251
TVK annual report 200998 99noTeS To THe ConSolIDaTeD FInanCIal STaTeMenTS

28. related party transactions
Transactions with associated companies in the normal course of business
MOL Group has been TVK Plc’s main raw material supplier and buyer of TVK products ever since the Company was established. In 2001, the Company signed a long-term contract with MOLTRADE-Mineralimpex Zrt. on supplying raw materials for the period between 2004 and 2013.
2009 2008
HUF million HUF million
Sales
- of which: to MOL Group companies 65,875 60,209
of which Moltrade-Mineralimpex Zrt. 40,432 52,385
Slovnaft Pethrochemicals s.r.o. 6,165 5,954
MOL Plc. 19,167 1,218
Slovnaft a.s. - 540
To other related parties 12 613
of which VIBA-TVK Kft. (associate) 9 611
Purchases
- of which: from MOL Group companies 193,429 242,574
of which Moltrade-Mineralimpex Zrt. 174,758 226,085
MOL Energiakereskedő Kft. 4,176 6,251
Petroszolg Kft. 6,330 5,000
Slovnaft Pethrochemicals s.r.o. 3,035 1,029
Slovnaft a.s. - 1
from other related parties 272 633
of which VIBA-TVK Kft. (associate) 2 386
of which Tűzoltó és Műszaki Mentő Kft 270 247
29. Share-based payment plans
General Incentive Schemes for managementThe incentive scheme involves company and organizational level financial and operational targets, evaluation of the contribution to the strategic goals of the company and determined individual tasks in the System of Performance Management (TMR), and competencies. Expenses incurred by this scheme were HUF 255 million, and HUF 245 million in 2009 and 2008, respectively.
The liabilities related to incentive scheme as of 31 December 2009 and 2008 were as follows:
31 December 2009 31 December 2008
HUF million HUF million
Short term incentive 252 247
252 247
Share-option incentive from 2006
The incentive system based on stock options and launched in 2006 ensures the interest of the management of the MOL Group in the long-term increase of MOL stock price.
The incentive stock option is a material incentive disbursed in cash, calculated based on call options concerning MOL shares, with annual recurrence, with the following characteristics:
• covers a 5-year period starting annually, where periods split into - a 3-year waiting period and a 2-year redemption period in case of managers staying in the previous system for 2009, - a 2-year waiting period and a 3-year redemption period in case of managers choosing the new system already for Y2009, and it is valid for all of the entitled managers from Y2010.• its rate is defined by the quantity of units specified by MOL job category • the value of the units is set annually (in each year since the initiation of the scheme, 1 unit equals to
100 MOL shares).
According to the new system it is not possible to redeem the share option until the end of the second year (waiting period); the redemption period lasts from 1 January of the 3rd year until 31 December of the 5th year.
The incentive is paid in the redemption period according to the declaration of redemption. The paid amount of the incentive is determined as the product of the defined number and price increase (difference between the redemption price and the initial price) of shares.
Details of the share option rights granted during the year are as follows:
number of shares in conversion options
2009 2008 2007 2006
share share share share
Outstanding at the beginning of 2009 - 15,000 13,427 12,417
Granted during the year 14,500 - - -
Forfeited during the year - (600) - -
Outstanding at the end of 2009 14,500 14,400 13,427 12,417
As required by IFRS 2, this share-based compensation is accounted for as cash-settled payments, expensing the fair value of the benefit as determined at vesting date during the vesting period. Expense incurred by this scheme was HUF 180 million, and HUF (114) million in 2009 and 2008, respectively, recorded as personnel-type expenses with a corresponding increase in Trade and other payables.
Fair value as of the balance sheet date was calculated using the binomial option pricing model. The inputs to the model were as follows:
2009 2009 2008 2007 2006
(2 year waiting period)
(3 years waiting period)
Weighted average exercise price * 41.88 41.88 104.82 21,146 20,170
Weighted average share price * 63.7 63.7 63.7 17,247.4 17,247.4
Expected volatility based on historical data 44.25 % 44.25 % 47.39 % 54.46 % 48.96 %
Expected dividend yield 1.93 % 1.93 % 1.93 % 1.93 % 1.93 %
Expected life (years) 4.0 4.0 3.0 2.0 1.0
Risk free interest rate 2.08 % 2.08 % 1.63% 6.97 % 6.30 %
Weighted average fair value of the options 30.1 29.8 8.4 4,452.9 3,172.9
* The units of measurement of values are EUR/share in 2009 and 2008, HUF/share in 2007 and 2006.
TVK annual report 2009100 101noTeS To THe ConSolIDaTeD FInanCIal STaTeMenTS
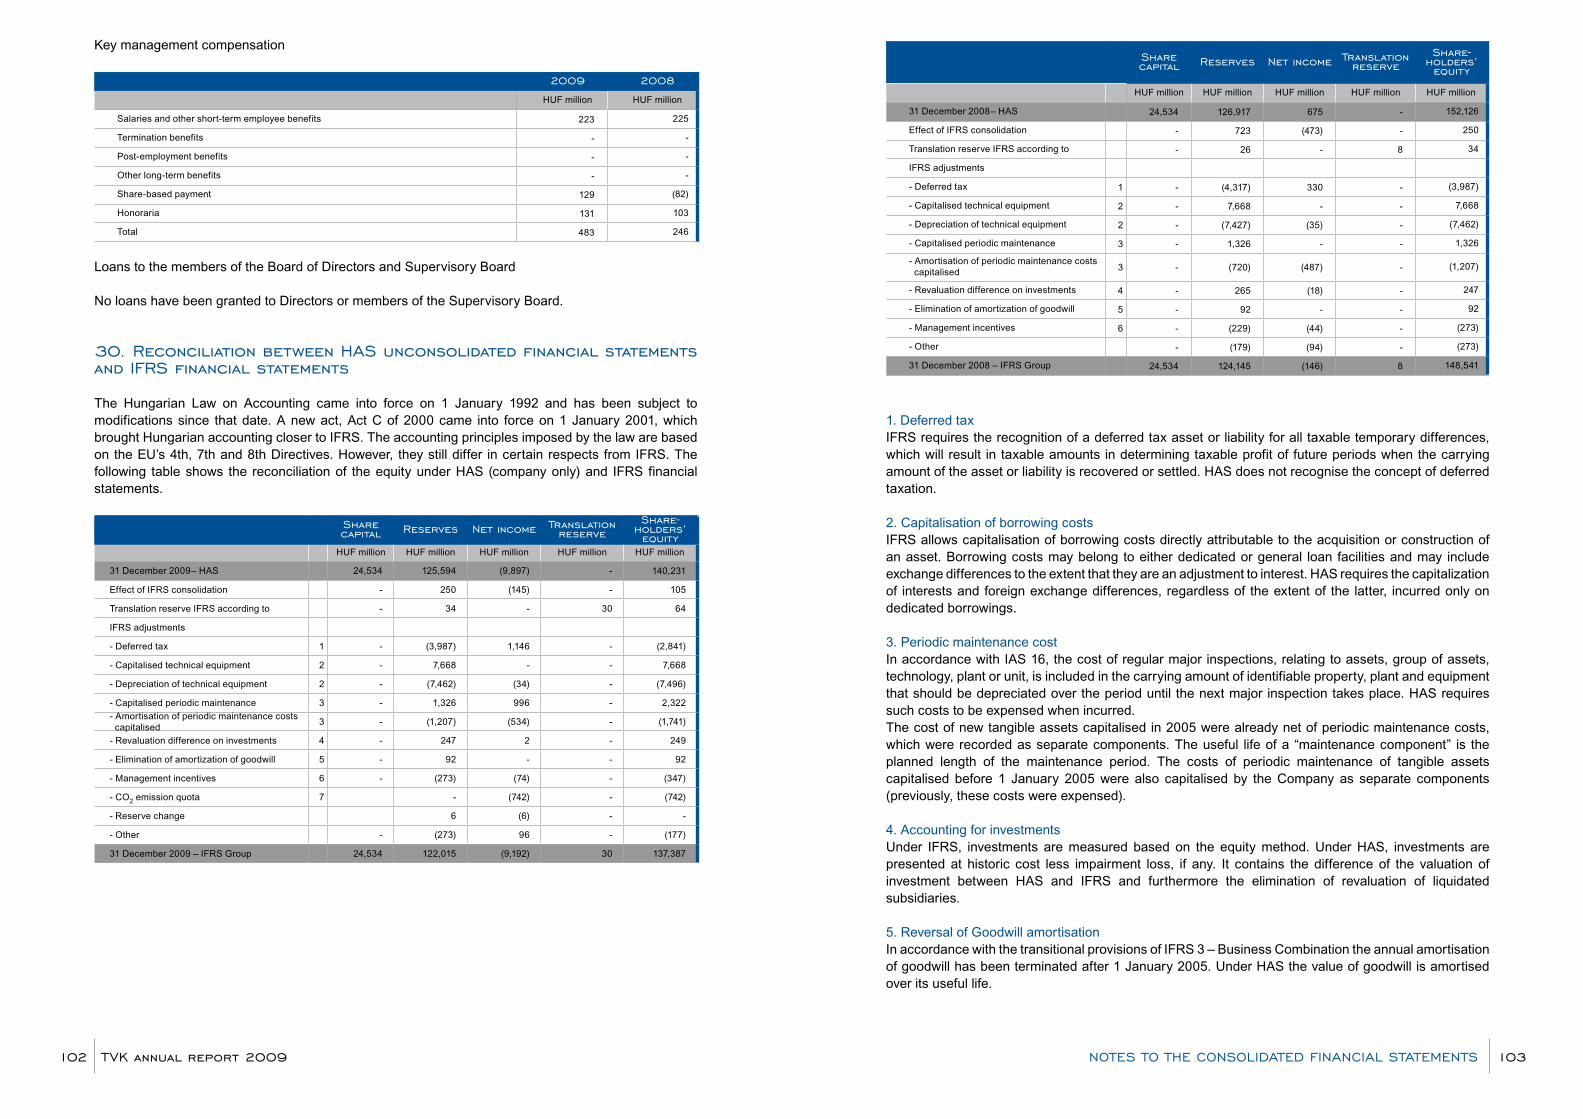
Key management compensation
2009 2008
HUF million HUF million
Salaries and other short-term employee benefits 223 225
Termination benefits - -
Post-employment benefits - -
Other long-term benefits - -
Share-based payment 129 (82)
Honoraria 131 103
Total 483 246
Loans to the members of the Board of Directors and Supervisory Board
No loans have been granted to Directors or members of the Supervisory Board.
30. reconciliation between HaS unconsolidated financial statements and IFrS financial statements
The Hungarian Law on Accounting came into force on 1 January 1992 and has been subject to modifications since that date. A new act, Act C of 2000 came into force on 1 January 2001, which brought Hungarian accounting closer to IFRS. The accounting principles imposed by the law are based on the EU’s 4th, 7th and 8th Directives. However, they still differ in certain respects from IFRS. The following table shows the reconciliation of the equity under HAS (company only) and IFRS financial statements.
Share capital reserves net income Translation
reserveShare-
holders’ equity
HUF million HUF million HUF million HUF million HUF million
31 December 2009– HAS 24,534 125,594 (9,897) - 140,231
Effect of IFRS consolidation - 250 (145) - 105
Translation reserve IFRS according to - 34 - 30 64
IFRS adjustments
- Deferred tax 1 - (3,987) 1,146 - (2,841)
- Capitalised technical equipment 2 - 7,668 - - 7,668
- Depreciation of technical equipment 2 - (7,462) (34) - (7,496)
- Capitalised periodic maintenance 3 - 1,326 996 - 2,322
- Amortisation of periodic maintenance costs capitalised
3 - (1,207) (534) - (1,741)
- Revaluation difference on investments 4 - 247 2 - 249
- Elimination of amortization of goodwill 5 - 92 - - 92
- Management incentives 6 - (273) (74) - (347)
- CO2 emission quota 7 - (742) - (742)
- Reserve change 6 (6) - -
- Other - (273) 96 - (177)
31 December 2009 – IFRS Group 24,534 122,015 (9,192) 30 137,387
Share capital reserves net income Translation
reserveShare-
holders’ equity
HUF million HUF million HUF million HUF million HUF million
31 December 2008– HAS 24,534 126,917 675 - 152,126
Effect of IFRS consolidation - 723 (473) - 250
Translation reserve IFRS according to - 26 - 8 34
IFRS adjustments
- Deferred tax 1 - (4,317) 330 - (3,987)
- Capitalised technical equipment 2 - 7,668 - - 7,668
- Depreciation of technical equipment 2 - (7,427) (35) - (7,462)
- Capitalised periodic maintenance 3 - 1,326 - - 1,326
- Amortisation of periodic maintenance costs capitalised 3 - (720) (487) - (1,207)
- Revaluation difference on investments 4 - 265 (18) - 247
- Elimination of amortization of goodwill 5 - 92 - - 92
- Management incentives 6 - (229) (44) - (273)
- Other - (179) (94) - (273)
31 December 2008 – IFRS Group 24,534 124,145 (146) 8 148,541
1. Deferred taxIFRS requires the recognition of a deferred tax asset or liability for all taxable temporary differences, which will result in taxable amounts in determining taxable profit of future periods when the carrying amount of the asset or liability is recovered or settled. HAS does not recognise the concept of deferred taxation.
2. Capitalisation of borrowing costsIFRS allows capitalisation of borrowing costs directly attributable to the acquisition or construction of an asset. Borrowing costs may belong to either dedicated or general loan facilities and may include exchange differences to the extent that they are an adjustment to interest. HAS requires the capitalization of interests and foreign exchange differences, regardless of the extent of the latter, incurred only on dedicated borrowings.
3. Periodic maintenance costIn accordance with IAS 16, the cost of regular major inspections, relating to assets, group of assets, technology, plant or unit, is included in the carrying amount of identifiable property, plant and equipment that should be depreciated over the period until the next major inspection takes place. HAS requires such costs to be expensed when incurred.The cost of new tangible assets capitalised in 2005 were already net of periodic maintenance costs, which were recorded as separate components. The useful life of a “maintenance component” is the planned length of the maintenance period. The costs of periodic maintenance of tangible assets capitalised before 1 January 2005 were also capitalised by the Company as separate components (previously, these costs were expensed).
4. Accounting for investments Under IFRS, investments are measured based on the equity method. Under HAS, investments are presented at historic cost less impairment loss, if any. It contains the difference of the valuation of investment between HAS and IFRS and furthermore the elimination of revaluation of liquidated subsidiaries.
5. Reversal of Goodwill amortisationIn accordance with the transitional provisions of IFRS 3 – Business Combination the annual amortisation of goodwill has been terminated after 1 January 2005. Under HAS the value of goodwill is amortised over its useful life.
TVK annual report 2009102 103noTeS To THe ConSolIDaTeD FInanCIal STaTeMenTS
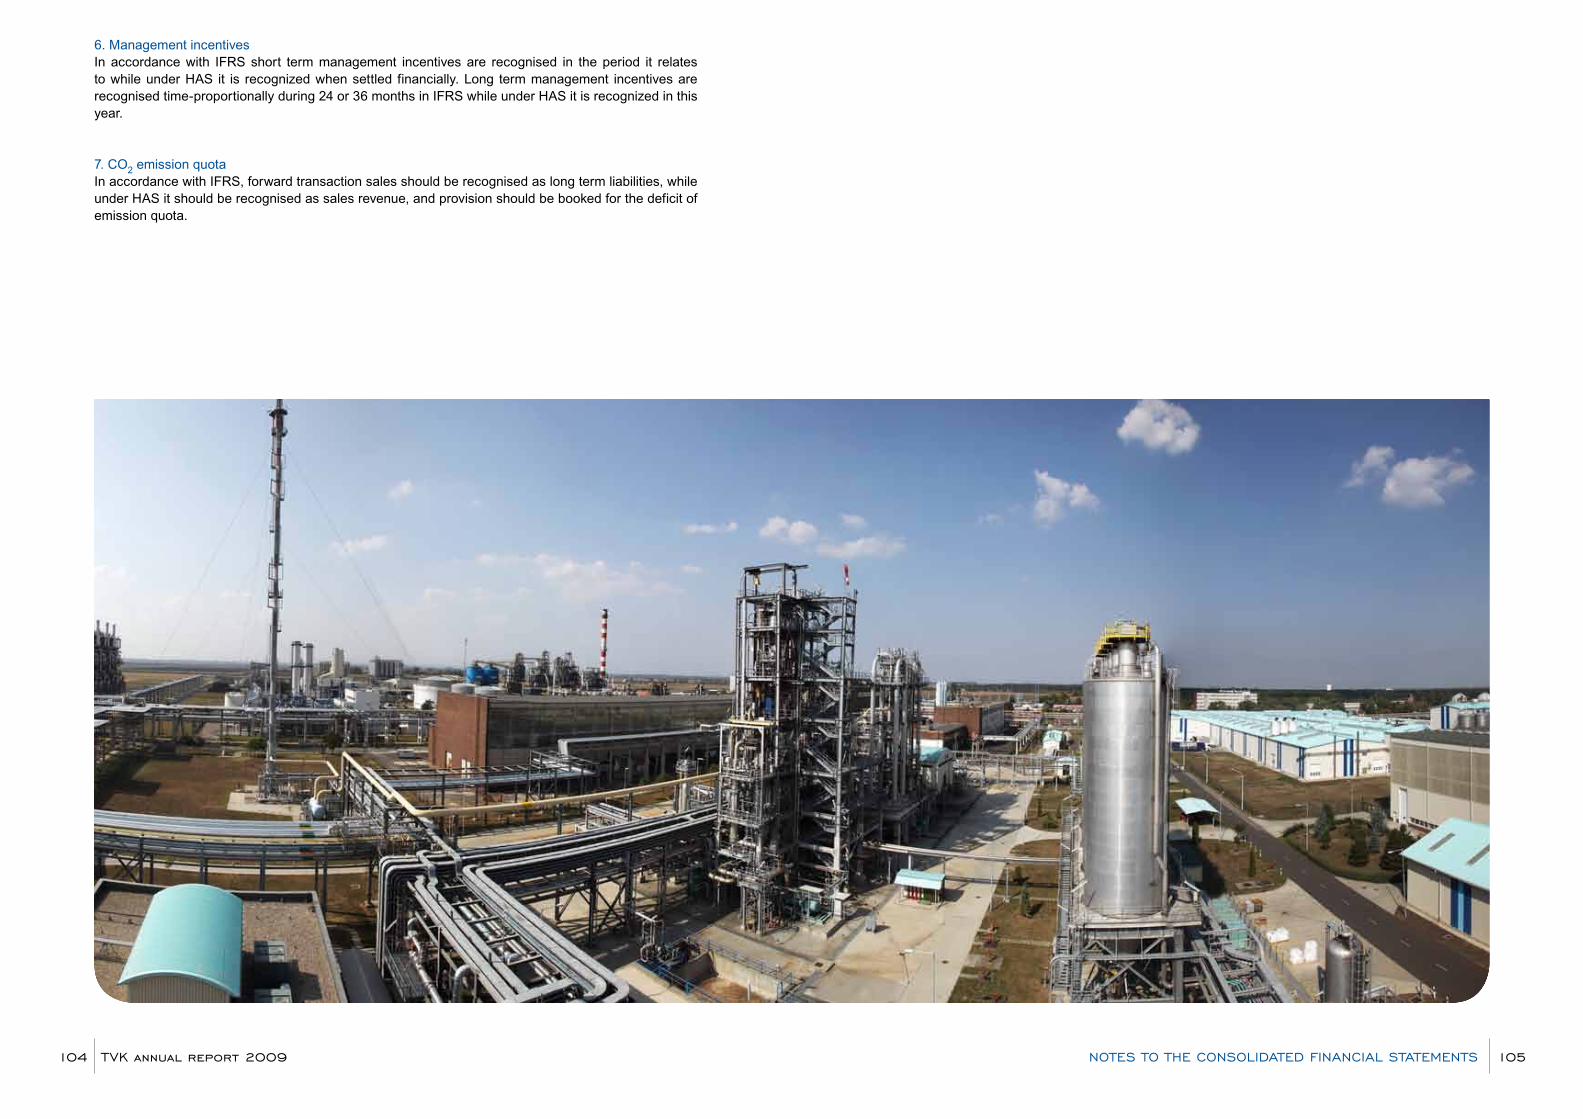
6. Management incentivesIn accordance with IFRS short term management incentives are recognised in the period it relates to while under HAS it is recognized when settled financially. Long term management incentives are recognised time-proportionally during 24 or 36 months in IFRS while under HAS it is recognized in this year.
7. CO2 emission quota In accordance with IFRS, forward transaction sales should be recognised as long term liabilities, while under HAS it should be recognised as sales revenue, and provision should be booked for the deficit of emission quota.
TVK annual report 2009104 105noTeS To THe ConSolIDaTeD FInanCIal STaTeMenTS
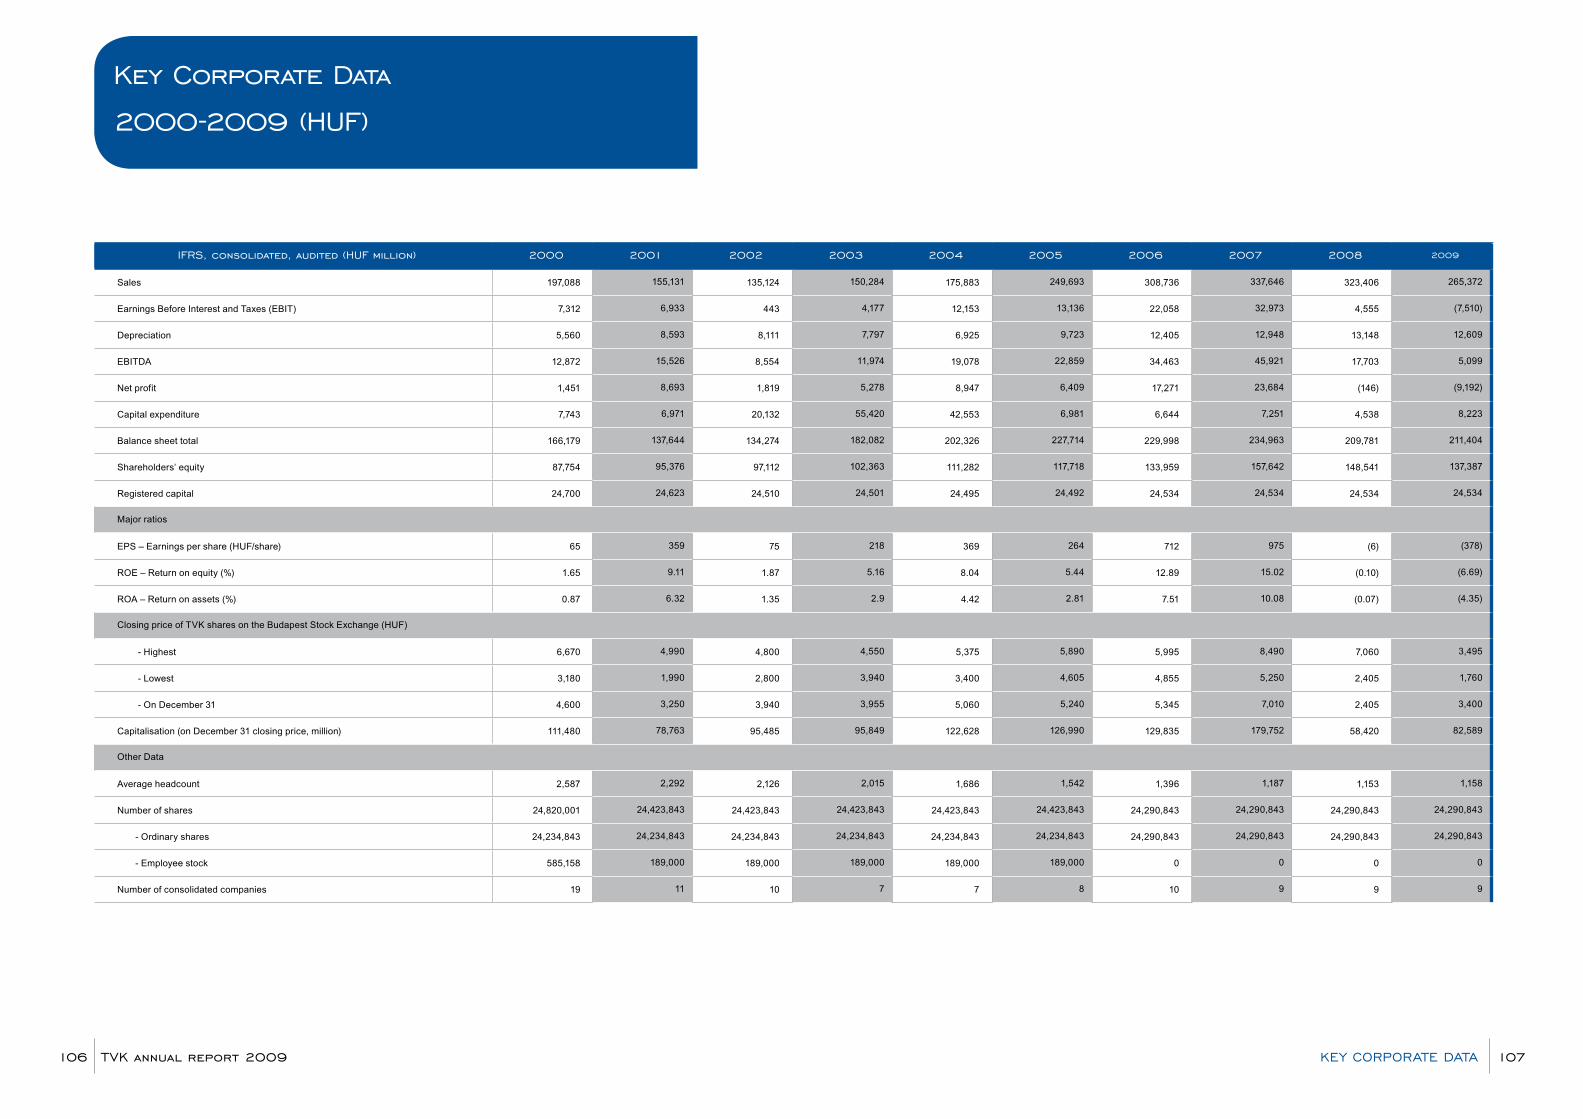
IFrS, consolidated, audited (HuF million) 2000 2001 2002 2003 2004 2005 2006 2007 2008 2009
Sales 197,088 155,131 135,124 150,284 175,883 249,693 308,736 337,646 323,406 265,372
Earnings Before Interest and Taxes (EBIT) 7,312 6,933 443 4,177 12,153 13,136 22,058 32,973 4,555 (7,510)
Depreciation 5,560 8,593 8,111 7,797 6,925 9,723 12,405 12,948 13,148 12,609
EBITDA 12,872 15,526 8,554 11,974 19,078 22,859 34,463 45,921 17,703 5,099
Net profit 1,451 8,693 1,819 5,278 8,947 6,409 17,271 23,684 (146) (9,192)
Capital expenditure 7,743 6,971 20,132 55,420 42,553 6,981 6,644 7,251 4,538 8,223
Balance sheet total 166,179 137,644 134,274 182,082 202,326 227,714 229,998 234,963 209,781 211,404
Shareholders’ equity 87,754 95,376 97,112 102,363 111,282 117,718 133,959 157,642 148,541 137,387
Registered capital 24,700 24,623 24,510 24,501 24,495 24,492 24,534 24,534 24,534 24,534
Major ratios
EPS – Earnings per share (HUF/share) 65 359 75 218 369 264 712 975 (6) (378)
ROE – Return on equity (%) 1.65 9.11 1.87 5.16 8.04 5.44 12.89 15.02 (0.10) (6.69)
ROA – Return on assets (%) 0.87 6.32 1.35 2.9 4.42 2.81 7.51 10.08 (0.07) (4.35)
Closing price of TVK shares on the Budapest Stock Exchange (HUF)
- Highest 6,670 4,990 4,800 4,550 5,375 5,890 5,995 8,490 7,060 3,495
- Lowest 3,180 1,990 2,800 3,940 3,400 4,605 4,855 5,250 2,405 1,760
- On December 31 4,600 3,250 3,940 3,955 5,060 5,240 5,345 7,010 2,405 3,400
Capitalisation (on December 31 closing price, million) 111,480 78,763 95,485 95,849 122,628 126,990 129,835 179,752 58,420 82,589
Other Data
Average headcount 2,587 2,292 2,126 2,015 1,686 1,542 1,396 1,187 1,153 1,158
Number of shares 24,820,001 24,423,843 24,423,843 24,423,843 24,423,843 24,423,843 24,290,843 24,290,843 24,290,843 24,290,843
- Ordinary shares 24,234,843 24,234,843 24,234,843 24,234,843 24,234,843 24,234,843 24,290,843 24,290,843 24,290,843 24,290,843
- Employee stock 585,158 189,000 189,000 189,000 189,000 189,000 0 0 0 0
Number of consolidated companies 19 11 10 7 7 8 10 9 9 9
TVK annual report 2009106 107Key CorporaTe DaTa
Key Corporate Data
2000-2009 (HuF)
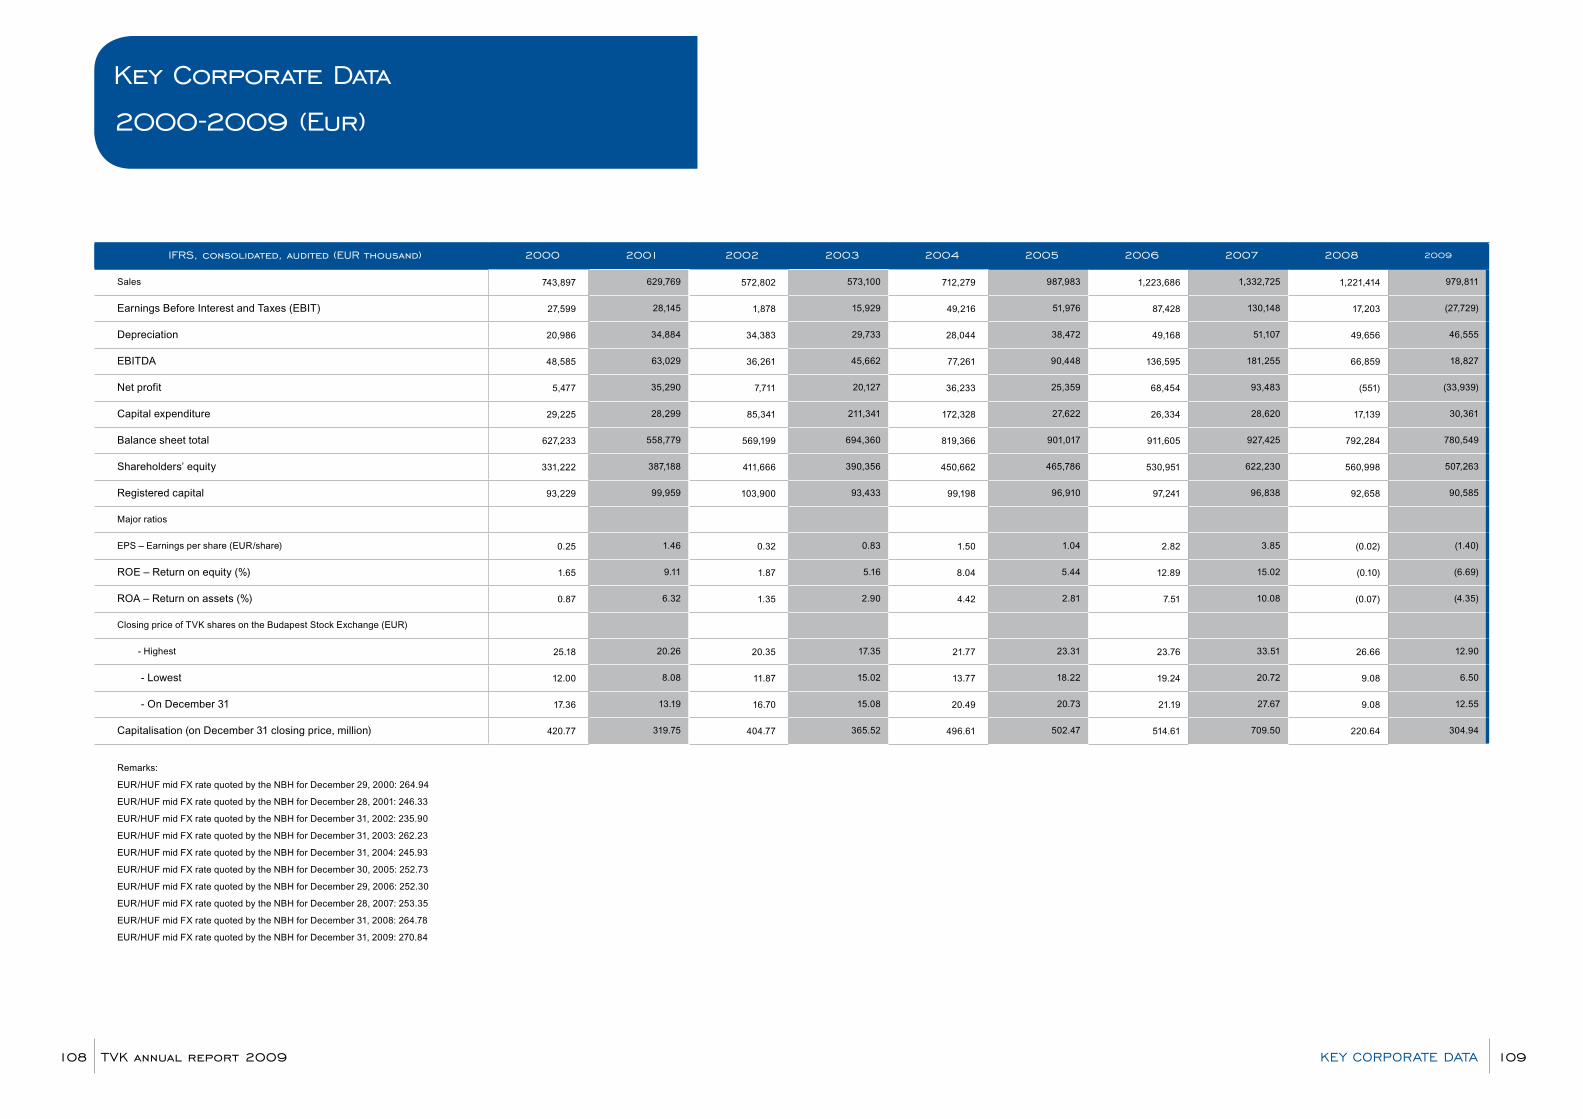
IFrS, consolidated, audited (eur thousand) 2000 2001 2002 2003 2004 2005 2006 2007 2008 2009
Sales 743,897 629,769 572,802 573,100 712,279 987,983 1,223,686 1,332,725 1,221,414 979,811
Earnings Before Interest and Taxes (EBIT) 27,599 28,145 1,878 15,929 49,216 51,976 87,428 130,148 17,203 (27,729)
Depreciation 20,986 34,884 34,383 29,733 28,044 38,472 49,168 51,107 49,656 46,555
EBITDA 48,585 63,029 36,261 45,662 77,261 90,448 136,595 181,255 66,859 18,827
Net profit 5,477 35,290 7,711 20,127 36,233 25,359 68,454 93,483 (551) (33,939)
Capital expenditure 29,225 28,299 85,341 211,341 172,328 27,622 26,334 28,620 17,139 30,361
Balance sheet total 627,233 558,779 569,199 694,360 819,366 901,017 911,605 927,425 792,284 780,549
Shareholders’ equity 331,222 387,188 411,666 390,356 450,662 465,786 530,951 622,230 560,998 507,263
Registered capital 93,229 99,959 103,900 93,433 99,198 96,910 97,241 96,838 92,658 90,585
Major ratios
EPS – Earnings per share (EUR/share) 0.25 1.46 0.32 0.83 1.50 1.04 2.82 3.85 (0.02) (1.40)
ROE – Return on equity (%) 1.65 9.11 1.87 5.16 8.04 5.44 12.89 15.02 (0.10) (6.69)
ROA – Return on assets (%) 0.87 6.32 1.35 2.90 4.42 2.81 7.51 10.08 (0.07) (4.35)
Closing price of TVK shares on the Budapest Stock Exchange (EUR)
- Highest 25.18 20.26 20.35 17.35 21.77 23.31 23.76 33.51 26.66 12.90
- Lowest 12.00 8.08 11.87 15.02 13.77 18.22 19.24 20.72 9.08 6.50
- On December 31 17.36 13.19 16.70 15.08 20.49 20.73 21.19 27.67 9.08 12.55
Capitalisation (on December 31 closing price, million) 420.77 319.75 404.77 365.52 496.61 502.47 514.61 709.50 220.64 304.94
Remarks:
EUR/HUF mid FX rate quoted by the NBH for December 29, 2000: 264.94
EUR/HUF mid FX rate quoted by the NBH for December 28, 2001: 246.33
EUR/HUF mid FX rate quoted by the NBH for December 31, 2002: 235.90
EUR/HUF mid FX rate quoted by the NBH for December 31, 2003: 262.23
EUR/HUF mid FX rate quoted by the NBH for December 31, 2004: 245.93
EUR/HUF mid FX rate quoted by the NBH for December 30, 2005: 252.73
EUR/HUF mid FX rate quoted by the NBH for December 29, 2006: 252.30
EUR/HUF mid FX rate quoted by the NBH for December 28, 2007: 253.35
EUR/HUF mid FX rate quoted by the NBH for December 31, 2008: 264.78
EUR/HUF mid FX rate quoted by the NBH for December 31, 2009: 270.84
Key Corporate Data
2000-2009 (eur)
TVK annual report 2009108 109Key CorporaTe DaTa
sustainability report
we understand that success and social accep-tance are not only measured and reflected by economic indicators in this day and age. our activities tend to be evaluated also in the light of how we perform in terms of our capacity to downsize our environmental footprint. TVK is committed to the sustainable development and communicates its achievements openly to stake-holders. we devote extra attention to creat-ing a cleaner and liveable environment, secure and healthy working conditions. To ensure the attainment of these objectives, we look upon prevention and thinking responsibly as basic principles. The core principles environmentally oriented thinking and sustainability have been integrated solidly into our long term strategy. our 2009 results are presented not separate-ly in annual financial and sustainability report, but in this integradet report. Visit our website (wwww.tvk.hu) to view detailed information of the below issues.
TVK annual report 2009110
2009 performance
Performance supporting economic sustainability• A In order to balance the negative effects of the general economical
recession, we started severe cost reduction and efficiency increasing programs in all our specific areas. Instead of focusing on high value growth projects aiming technology or production enlargement, we concentrated deliberately on smaller, but numerous themes aiming increase of production’s efficiency, diversification of the product portfolios. First of all we performed renewal works imposed by operational needs. In that frame we successfully closed general overhaul of our Olefin-1 plants and performed majority of its reconstruction works. Besides we focused on mitigation of the operational safety, health and environmental risks.
• Projects initiated in the olefin production area:- In our Olefin-1 plant we started the revamp and intensification
project of the F1009 ethane furnace, which implementation will be finished in 2010. Aim is technological processing of the whole ethane quantity developed in course of the olefin production, and as such not using of a part of it as fuel, like presently. By implementation of the projects the specific row material consumption of the plant will improve.
- We concluded contract with Linde Engineering for elaboration of an energy efficiency improvement study for our Olefin-1 and Olefin-2 plants.
- Reduction of the flaring losses was targeted by initiating interconnection of our two crackers through a cracked gas pipeline. By using this line we intend to recover a part of the CH gases inevitable flared during the start up procedures of either of the crackers and to use it in the other cracker being in operation.
• Licensor Chevron Phillips Chemical Co. of our HDPE-1 plant put in operation in 1986 has been contracted for preparation of the Basic Engineering design for revamp and intensification of the plant. Implementation of the project, together with updating its product portfolio, is scheduled in the 2011-2013 period.
• Improved reliability of the electrical energy supply will be ensured by installation in TVK’s electrical substations No. I and II. of supplementary transformers. In 2009 the related project preparation was entirely performed and the implementation started. Site preparations, as well as installation and commissioning of the first transformer at the Substation I. have been successfully performed.
• In 2009 was finished the revamp and capacity increasing project of the railway tank-cars unloading station. Hereby the quench oil unloading process is performed in a closed system (there is no CH gases emission in the atmosphere), and parallel a considerable steam saving is ensured.
• Undertaking of environmental authorities obligations demanded to apply a new deposition technology for the fluvial sludge separated in the industrial water cleaning process. The related project was launched and prepared in 2009, its implementation will be finished by end June, 2010.
• In 2009, additional filter facility was designed and installed in the water side stream of the common O-2 and HDPE-2 cooling water system. As a result, corrosion of the technological devices, their cleaning frequency, so as consumption of the water treatment chemicals were each reduced simultaneously.
Main results and goals
TVK annual report 2009112 113MaIn reSulTS anD GoalS
• Regarding development of new products, in 2009 we have focused mainly on renewal of our PP product portfolio. As a result of our development activities along the year the Tipplen H 659 F (for thin thermoformed and blow moulded products), R 789 (for foamed and thermoformed sheets), R 1059 A (for thin wall injection moulding), K 850 (for pipe extrusion and fittings) and the K 1150 A (for thin wall injection moulding) products widened the variety of our portfolio. Besides, several recipes of our existing products were modified to fulfil the new customer demands.
• In order to reduce environmental load, we continued the cooperation with foreign and domestic partners to modify our traditional plastic products, aiming to accelerate their biological degradation. Based on our research activities performed in 2009 and before, we were able to determine the most promising masterbatch types used in degradation processes, which are product of three suppliers.
Social performance Health and Safety• Creating of a closed system hydro-carbons sampling at the area of the Olefin-2 plant. • Making safe approach to change-valves installed at the top of powder silos and pellets homogenizing
silos and to other equipment that require maintenance, building of operating stages.• As part of measures taken with the aim of enhanced protection of the exposed equipment and places
the following has been done:- in the Olefin-1 plant glands of 23 pumps were converted onto the one with double closing- In the Olefin plants group started installation of active carbon filters into the air-conditioning system
of control rooms- Within the framework of the reconstruction of black-white changing rooms normative bathing
possibilities were created of employees of the Olefin plant group- we made extensive the personal sampling air space measurements at work posts subjected to the
exposition danger• Through the enhanced control of contractor’s work we managed to achieve that our partners perform
their job in a safer way.• Introduction of PSM has been completed; at the same time preparations started for operation.• During the process of preparing for the 2010 overhaul:
- we prepared a well-considered safety plan assisting the contractor’s work for the overhaul period- Meeting the expectations on safe work we updated our the agreements concluded with contractors- we specified the number of contractors to be audited by independent certifying organisation and
made proposal for including the TVK-specific issues in the question list.
Fire Protection• Our fire protection activity was carried out in accordance with the instructions in force. • There were no fire incidents in the year 2009, in the cause of authority inspections no failures were
revealed that would cause imposing of fines.• Connection to the TVK fire water network in order to support the safer O-2 and HD-2 fire water
network.• Revamp of the gascromatograph gas supply system in the pressure-bottle storage and in, preparaive
and cromatograph laboratories.
Human Resources• After the introduction, we have successfully operated of our Performance Evaluation System (PES),
which set the rate of incentives paid against performance in 2009 at 9% of annual basic wages.• We continued our STAFÉTA (RELAY) program with 11 participants.• 68 advisors and line managers are enrolled for a two-year competence development program.• We are running a training course for chemical engineering technicians in cooperation with Erdey-Grúz
Tibor Secondary Vocational School in Tiszaújváros. At present there are 40 MOL Group employees participating.
• 116 employees qualified in nationally listed training courses, and we have supported 15 colleagues taking part in higher education.
• 8 freshly graduated degree holders joined the company in 2008.• We spent HUF 87.6 million in 2009 on training and education courses with altogether more than 500
persons participating.
Environmental performance• We further increased the utilisation ratio achieved in the previous year (in the year 2008 the ration was
28%), and recycled 62% of wastes by the end of the year 2009. • The waste collection and storage method formed as a result of opening the Central Waste Collection
Yard is satisfactory both to the organisational units of the Company and to our partners under contract. • During the year 2009 long-term joining contracts were concluded with several new waste management
partners, ensuring the entire covering of cost-effective waste management .• By the cost-efficient performing of the tasks included in the Technical Intervention Plan we decreased
our environmental protection obligations known at the end of the year 2008, and having fully observed the authority instructions we spent HUF 185 milllion on fulfilling the tasks.
• Creating safer than existing storage conditions regarding the hypo and sulphuric acid containers in the Olefin-2 plant.
• Through launchng the flaring losses decreasing project we expect further decrease of the air pollution as well.
Attainment of targets set for 2009
TarGeTS eValuaTIonSOCIAL OBJECTIVES
Labour protection and fire protection
In accordance with the long-term tendencies Lost Time Injury Frequency (LTIF) shall not exceed 0,60.
0,61 (the number of hours spent by work did not reach the planned
one.)
✗
Total work incident frequency (TRIR) shall not exceed 2,41. 1,22 ✓By developing our defensive driving culture we try to keep the ratio of traffic accidents (RAR) under 1,87. 3,71 ✗Total number of fire cases shall not exceed 1. 0 ✓We investigated 100% of the extraordinary (work incidents, fire cases and quasy incidents) events. done ✓
In order to increase the labour safety , with the aim of decreasing the risks arising from personal factors we hold 539 so called behavioral audits at TVK level.
509 (the LDPE-1 plant was stopped from the middle of the year, the
default arises from that.)
✗
SOCIAL OBJECTIVE Health protection
Lethal work incidents shall occur neither among the employees, nor among the contractors. 0 ✓Total Reportable Occupational Ilness Frequency (TROIF) shall be only zero. 0 ✓The absence ratio is kept under 3,14. 2,86 ✓We intend to increase at least to 60% the participaton ratio of our employees in health protection programs organised at workplaces. 81% ✓
ENVIRONMENTAL PROTECTION OBJECTIVE Environmental protection
The volume of dangerous wastes arising from normal operational tasks and extraordinary situations shall not exceed 2200 tons.
2462,8 tons (As a result of the overhaul
carried out in the year 2009 the volume of wastes increased.)
✗
We further increase the utilisation ratio achieved in the previous year. (in the year 2008 – 28%) 62% ✓By operating the Central Waste Collection Yard we ensure concentration on one place all the processes associated with waste formaton at the Company.
By regulating central coordination ✓
Through the cost efficient fulfilling the tasks included in the Technical Intervention Plan we decrease our environmental protection obligations known at the end of the year 2007.
We spent HUF 185 million on performing the task,
simultaneously fully observing the authority instructions
✓
We further decreased VOC emissions caused by our activity. Modernisations are in progress ✓We will fulfil on the approved schedule our tasks included in GHG-strategy that relates to the second trading period . fulfilled ✓We continue fulfilling on the approved schedule our tasks needed for the REACH pre-registration. fulfilled ✓
TVK annual report 2009114 115MaIn reSulTS anD GoalS
Prizes and RecognitionOn the occasion of the National Holiday of the 20th of August Chief Executive Officer Árpád Olvasó was given a Pro Urbe award by the members of the Municipality of Tiszaújváros. With this award the outstanding work was acknowledged that Árpád Olvasó has done in the interest of building, improving and strengthening of Tiszaújváros in social and economic terms, among others through the operation of the Foundation for the Future of Tiszaújváros (TJA) established jointly by the TVK and the Municipality of Tiszaújváros, and through accomplishing the objectives thereof. The TJA assisted the city in organizing national and international cultural and sport events, and the work that is going on in the areas of public health, education and welfare.
The Ministry of Environment and Water and the Ministry for Transport in 2009 launched the „Cycling-friend Workplace 2009” title for small, medium and large corporations, public institutions, and non-profit organization categories. TVK Plc’s proposal, among the large companies acquired the right to use the title.
Future Challenges 2010
Economic sustainability objectives• The 2010 yearly targets are derived from our main goals and are connected to the themes and projects already started,
being under implementation. According to the expectations these targets should support: - the efficient operation, - the operation safety, - further improvement of the products quality, enlargement of their applicability, - fulfilment of external and authority liabilities, and all these with high efficiency and at low costs. While deciding about continuation or rescheduling of started
projects, we rigorously considered the above principles. Consequently our 2010 yearly CAPEX plan includes only projects meeting the settled targets (O-1 development; Implementation of cracked gas pipeline between O-1 and O-2; Installation of second block valves to O-2 pyrogas pipelines; Reliability improvement of electric power supply; Handling of mud from industrial water).
• Related to the olefin production area we will focus mainly on energy efficiency improvement and on reduction of the CO2 emissions.
• We continue preparation of the HDPE-2 revamp and intensification projects, by launching the EPC implementation and selection of contractors.
• We will do our best to further develop and fine tune the already implemented process modelling, simulating, monitoring and control systems, parallel with enlargement of their application areas.
• We will continue the efforts for introduction of our PE 100 pipe grade into the market.• We will continue as well, to change the additive recipe of some polymer products according to customers demands,
or economical interests, development of the K 250 A (for injection moulding) grade is already in progress.• In order to reduce the impact on the environment, we will continue the specific research for modification of traditional
plastic products, mainly in case of shopping bags, so that they become biodegradable. Our main aim is to be able to suggest our customers masterbatch types which are optimal with our grades, to be able to gain “Environmental friendly” certificates from authorities. Concretely in 2010, we will carry out degradation examinations in case of 6 chosen TVK grades. For that purpose we will cooperate with Széchenyi István University, who has accredited laboratories for such examinations. In connection with the theoretical base of the chemical mechanisms involved we will cooperate with Pannon University.
Environmental objectives• The cost of waste management (CoWM) will be reduced by 5%.• By cost-effectively executing the tasks determined in the Technical Intervention Plan, we will reduce
our environmental obligations known at the end of 2009 by HUF 199 million in 2010.• Improving energy efficiency and decreasing specific CO2 emission by implementing major technological
developments and optimising existing ES&DS and production assets both on the side of supply and demand.
• By utilising the opportunities of integrated water supply we will minimize fresh water consumption.• Seting up a biodiversity system.
Social objectives• We continue our successful education programme called “One day around TVK” what we’ve launched
last year in the region focusing on students who will be the basis of our future potential workforce. By means of this programme we presented our activity, our technical procedures and our environmental efforts.
Labour and fire safety objectives• No occupational accident resulting in death should occur among our employees, contractors and third
parties directly controlled by the TVK.• In line with the long term trend lost time injury frequency (LTIF) may not exceed 0.50.• Road Accident Rate (RAR) must not exceed 1.85.• Incident inquiry rate (IIR) reaches 100%.• HSE risk assessment will be prepared for PSM critical processes.• Based on self assessment the level of conformity of the HSE Management System exceeds 85 %.
This performance was confirmed by audit results. • Key suppliers operate a HSE system which is in line with the Group HSE MS. • Newly appointed line managers have a basic level of HSE awareness.
Health objectives• Total reportable occupational illness frequency (TROIF) equal to zero.• The absence rate (AR) of our employees due to non-work-related illnesses and injuries will not be
higher than 2.03.• The attendance rate of PETTVK employees at ‘Take a step for your health’ (STEP) program will reach 70%.
TVK annual report 2009116 117MaIn reSulTS anD GoalS
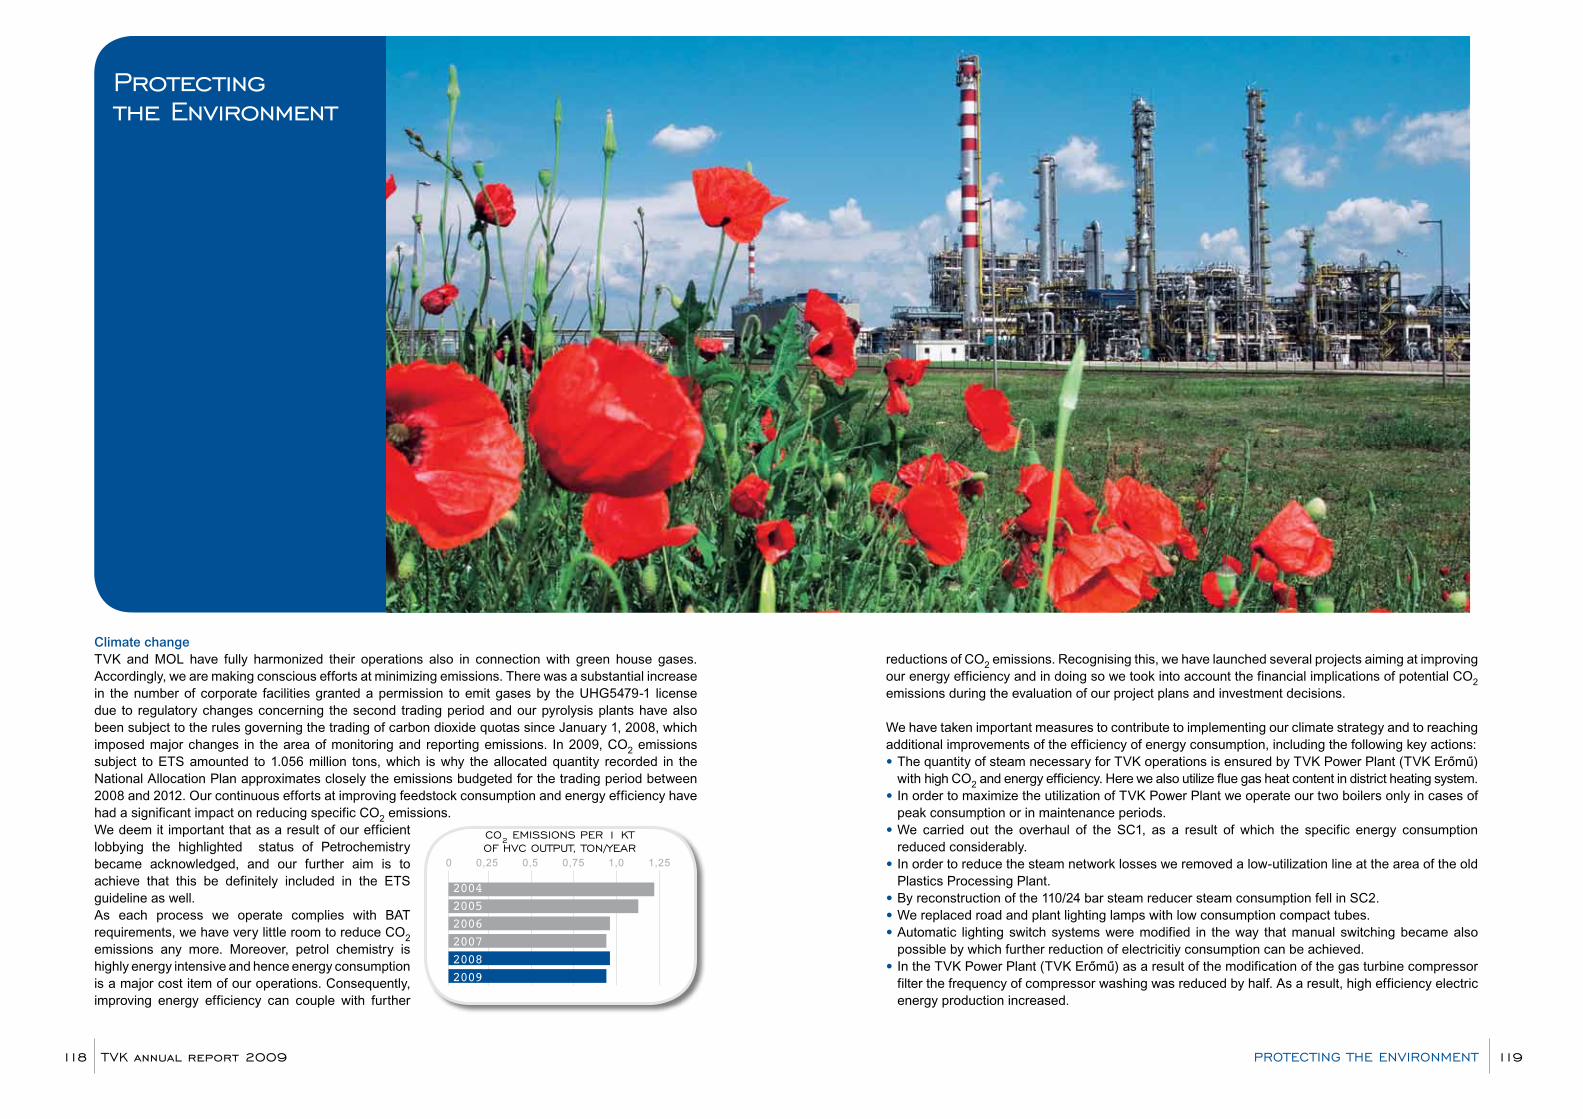
Co2 eMISSIonS per 1 KT oF HVC ouTpuT, Ton/year
0 0,25 0,5 0,75 1,0 1,25
200420052006200720082009
Climate changeTVK and MOL have fully harmonized their operations also in connection with green house gases. Accordingly, we are making conscious efforts at minimizing emissions. There was a substantial increase in the number of corporate facilities granted a permission to emit gases by the UHG5479-1 license due to regulatory changes concerning the second trading period and our pyrolysis plants have also been subject to the rules governing the trading of carbon dioxide quotas since January 1, 2008, which imposed major changes in the area of monitoring and reporting emissions. In 2009, CO2 emissions subject to ETS amounted to 1.056 million tons, which is why the allocated quantity recorded in the National Allocation Plan approximates closely the emissions budgeted for the trading period between 2008 and 2012. Our continuous efforts at improving feedstock consumption and energy efficiency have had a significant impact on reducing specific CO2 emissions.We deem it important that as a result of our efficient lobbying the highlighted status of Petrochemistry became acknowledged, and our further aim is to achieve that this be definitely included in the ETS guideline as well.As each process we operate complies with BAT requirements, we have very little room to reduce CO2 emissions any more. Moreover, petrol chemistry is highly energy intensive and hence energy consumption is a major cost item of our operations. Consequently, improving energy efficiency can couple with further
reductions of CO2 emissions. Recognising this, we have launched several projects aiming at improving our energy efficiency and in doing so we took into account the financial implications of potential CO2 emissions during the evaluation of our project plans and investment decisions.
We have taken important measures to contribute to implementing our climate strategy and to reaching additional improvements of the efficiency of energy consumption, including the following key actions:• The quantity of steam necessary for TVK operations is ensured by TVK Power Plant (TVK Erőmű)
with high CO2 and energy efficiency. Here we also utilize flue gas heat content in district heating system. • In order to maximize the utilization of TVK Power Plant we operate our two boilers only in cases of
peak consumption or in maintenance periods.• We carried out the overhaul of the SC1, as a result of which the specific energy consumption
reduced considerably. • In order to reduce the steam network losses we removed a low-utilization line at the area of the old
Plastics Processing Plant. • By reconstruction of the 110/24 bar steam reducer steam consumption fell in SC2. • We replaced road and plant lighting lamps with low consumption compact tubes.• Automatic lighting switch systems were modified in the way that manual switching became also
possible by which further reduction of electricitiy consumption can be achieved.• In the TVK Power Plant (TVK Erőmű) as a result of the modification of the gas turbine compressor
filter the frequency of compressor washing was reduced by half. As a result, high efficiency electric energy production increased.
protecting the environment
TVK annual report 2009118 119proTeCTInG THe enVIronMenT

0 2000 4000 6000 8000
20052006200720082009
VoluMe oF DISCHarGeD purIFIeD waSTe waTer per 1 KT oF eTHylene
ouTpuT, M3/year 0 100 200 300 400
20052006200720082009
SewaGe TreaTMenT, HuF MIllIon, year
HazarDouS waSTe per 1 KT oF eTHylene ouTpuT, T/year
0 2 4 6 8 10
200420052006200720082009
• We implemented a project as a result of which PP3 off gases can be utilized in SC2 during SC1 shutdown,and therefore flaring has been reduced as well.
• At HD2 shutdowns due to alteration of products were reduced by the development of a transitional shutdown method. With this action the amount of excess energy consumed at shutdowns was reduced.
• Within the framework of our site energy optimization program we developed and operate an energy model to analyse different operation modes of the TVK Power Plant (TVK Erőmű) in order to select the economically best one.
Clean airEmission monitoring data suggest that plant process emissions of pollutants complied with the effective control limits. We spent HUF 1,85 million on controlling compliance in 2009. We use the intermittent measurement method envisaged in legal provisions and regulatory requirements at the required frequency to control local point sources. The tests are performed by accredited laboratories.The National Air Pollutant Monitoring Network performs regular checks of the presence pollutants in the ambient air near TVK and evaluates air quality. Air pollution levels are recorded by the immission measurement stations located in neighbouring settlements and the recorded levels are read and checked by the Northern Hungarian Directorate of Environmental Protection, Nature Conservation and Water Management (the Directorate). We received no notice from the Directorate of pollutant concentrations above control limit and that any such instances were attributable to our activities.
Waste managementIn 2009 MOL Group issued a group level call for applications relating to both the hazardous and non-hazardous wastes for utilisation and neutralising these. Through involving the services of both active and passive partners cost-efficiency of all wastes and monitoring of wastes life time became ensured.As a result of concluding the long-term joining contracts we expect approximately 30% cost saving regarding the normal wastes.
We started to extend centralising of waste collection on wastes produced by our contractors during investment and maintenance processes as well.From full extension waste centralising we expect further cost saving and monitoring of the entire waste stream.
Waste management at our Company is properly regulated in accordance with the European Union’s norms. In the year 2009 our waste management activity met the instructions.
The updated recording of wastes (hazardous and non-hazardous) at TVK is carried out in the break-down as per unit line, in accordance with formation processes.In 2009 7,209 tons of waste formed at the Company, treatment cost of which amounted to HUF 32 million.In 2005 the following cost emerged in connection with hazardous waste treatment: HUF 124 million, in 2006 HUF 58 million, in 2007 HUF36 million, in 2008 HUF 56 million, while in 2009 it reached HUF 62,9 million.
Change of hazardous waste volume is detailed in the following diagram:
Quantitative increase in volume of hazardous waste occurred primarily in consequence of maintenance jobs – that produced high quantity of wastes - performed during the overhaul in the year 2009.In 2009 approximately 455 tons of hazardous waste were formed due to the maintenance and investment activity.
The sold, then recycled products and recycled packaging In order to meet its obligations on utilisation of packaging materials TVK Concluded contract with Öko-Pannon Kht for undertaking manufacturer’s obligations .The Öko-Pannon Kht. – as a coordinating organisation – performs its obligations instead of TVK, in order to reach exemption from the product fee payment – in such a way that it concludes conttracts with waste treating and waste recycling companies, and performs its obligations set in the legal rules relating to the proper ratio utilisation of packaging wastes using the services of the above companies.In order to implement the above TVK quarterly supplies the data on quantities of the released packaging materials and pays the utilisation fee to the coordinating organisation.The Öko-Pannon Kht. Ensures implementation of the required utilisation ratios against payment.
Water and soilNeither the regulatory audits nor the checks performed internally during the year subject to this report identified any pollutant emissions above the control limit in the purified waste water discharged into the River Tisza, and hence not penalties were imposed in respect of emissions in 2009.Potable water is provided by operating our own plant that produces, cleans and distributes drinking water. This plant also supplies potable water to MOL’s TIFO Refinery via our own drinking water network. As a result of a continuous downward trend in demand for potable water at the industrial compound, the amount of water produced falls short of half of the licensed amount, which justifies a reduction of the capacity we had reserved. With that in mind, we reviewed our production, purification and distribution system and applied to the authorities for a new unified and combined water right license and for reducing the current licensed production capacity of 1,350,000 m3 p.a. to 700,000 m3 p.a.No pollutant emissions in excess of control limit were identified in the waste water discharged into the recipient during the sewer inspections held by the supervisory authority; hence no penalty was imposed in respect of waste water discharged in 2009. No environmental spillage of chemical substances in volumes larger than 1 m3 occurred in 2009. We spent HUF 331 million on sewage treatment and kept water quality substantially above the level required under law.
TVK annual report 2009120 121proTeCTInG THe enVIronMenT

HealthProfessional medical control is especially important because of the large number of potential hazards of different nature employees may get exposed to and the severity of potential consequences. It is ascertained by job aptitude tests that cover checking general health status, heart, blood, urine, hearing, vision and respiratory functions.To ensure the provision of professional and rapid first aid, unit managers had to make sure that a person trained in providing first aid is available in each work area and in each shift: at present there are 240 trained first aid providers at 48 locations. At each first aid providing place there is a modern first aid box that contains even more facilities than it is prescribed in the legal rule, and additional equipment (tourniquet, alumínium-covered elastic patch, eye flusher, revivicating mask, first aid bandage) ensure providing efficient first aid.Employees receive basic training and professional upgrading from professional ambulance officers specialising in first aid. A round-the-clock emergency service ensures that injuries and impairments are treated professionally and swiftly (ambulance car with ambulance officer).
In 2009 definite steps were made in the area of health improvement. In addition to the measures required in the legal rule the following were introduced:• in order to survey the health status and to initiate the necessary treatment medical examinations and
screening test programs arteriographic, dermatological, locomotor, hynecological and tumor-marker screening tests were carried out, at which totally 546 persons took part.
• General health stattus examinations (blood pressure, blood sugar, body weight-body mass) were institutionally made to several hudred employees in three cases (May Day, June festivity and the autumn STEP day );
• Health plans supporting training on healthy way of living were compiled in 13 cases;• A relaxaton training decreasing psicho-social risks was attended by 32 persons in one round;• We joined the Smoking Abondonment Program launched at the MOL Group level, The initial
measurements of which were started on the AUTUMN STEP DAY and continued till December 13, 2009;
• We provided mobile office massage possibilities primarily for office workers. 170 persons took part in it.• 317 persons got immunization against H1N1.
The Health Improving Program (STEP) approved as part of the New Europe Program continued in the year 2009 as well. Health care is first of all a culture-changing program, aim of which is to provide assistance to our employees in revealing their health status and improving that.In May 2009 TVK measured active moving exercises of its employees in the campaign „Cycle to your Workplace by Bicycle” organised by BAM the Hungarian Cyclists Club (Magyar Kerékpáros Klub) and the Traffic, Information and Health Care Ministry (Közlekedési, Hírközlési és Egészségügyi Minisztérium) and Environmental Protection and Water Management Ministry (Környezetvédelmi és Vízügyi Minisztérium), the main goal of which is to make popular the active moving exercises and cycling in the whole country and to draw people’s attention to the importance of creating the sustainable urban traffic.TVK won the decent 10th place in the large company category among 113 participating large companies.
The Ministry of Environment and Water and the Ministry for Transport in 2009 launched the „Cycling-friend Workplace 2009” title for small, medium and large corporations, public institutions, and non-profit organization categories. TVK Plc’s proposal, among the large companies acquired the right to use the title.
Work safetyWe are committed to strengthening the culture of work safety and security continuously, which means in plain terms that we try to avoid any and all work related injuries. Our Company has records of work related accidents going back to 1961. In addition to the indicators used across the MOL Group for the analysis of accidents, we also use to a specific value calculated (for one thousand blue collar workers) from reportable incidents (injuries healing over three days) as a benchmark as it allows comparison with other employers and sectors. Our statistical record of accident has shown a positive trend since 2000 and only a single number of reportable accident occurred last year, which resulted in a negligible specific value. As both the number and severity of accidents shows a positive trend, the risk rating of our business fell substantially.
Human Focus
TVK annual report 2009122 123HuMan FoCuS
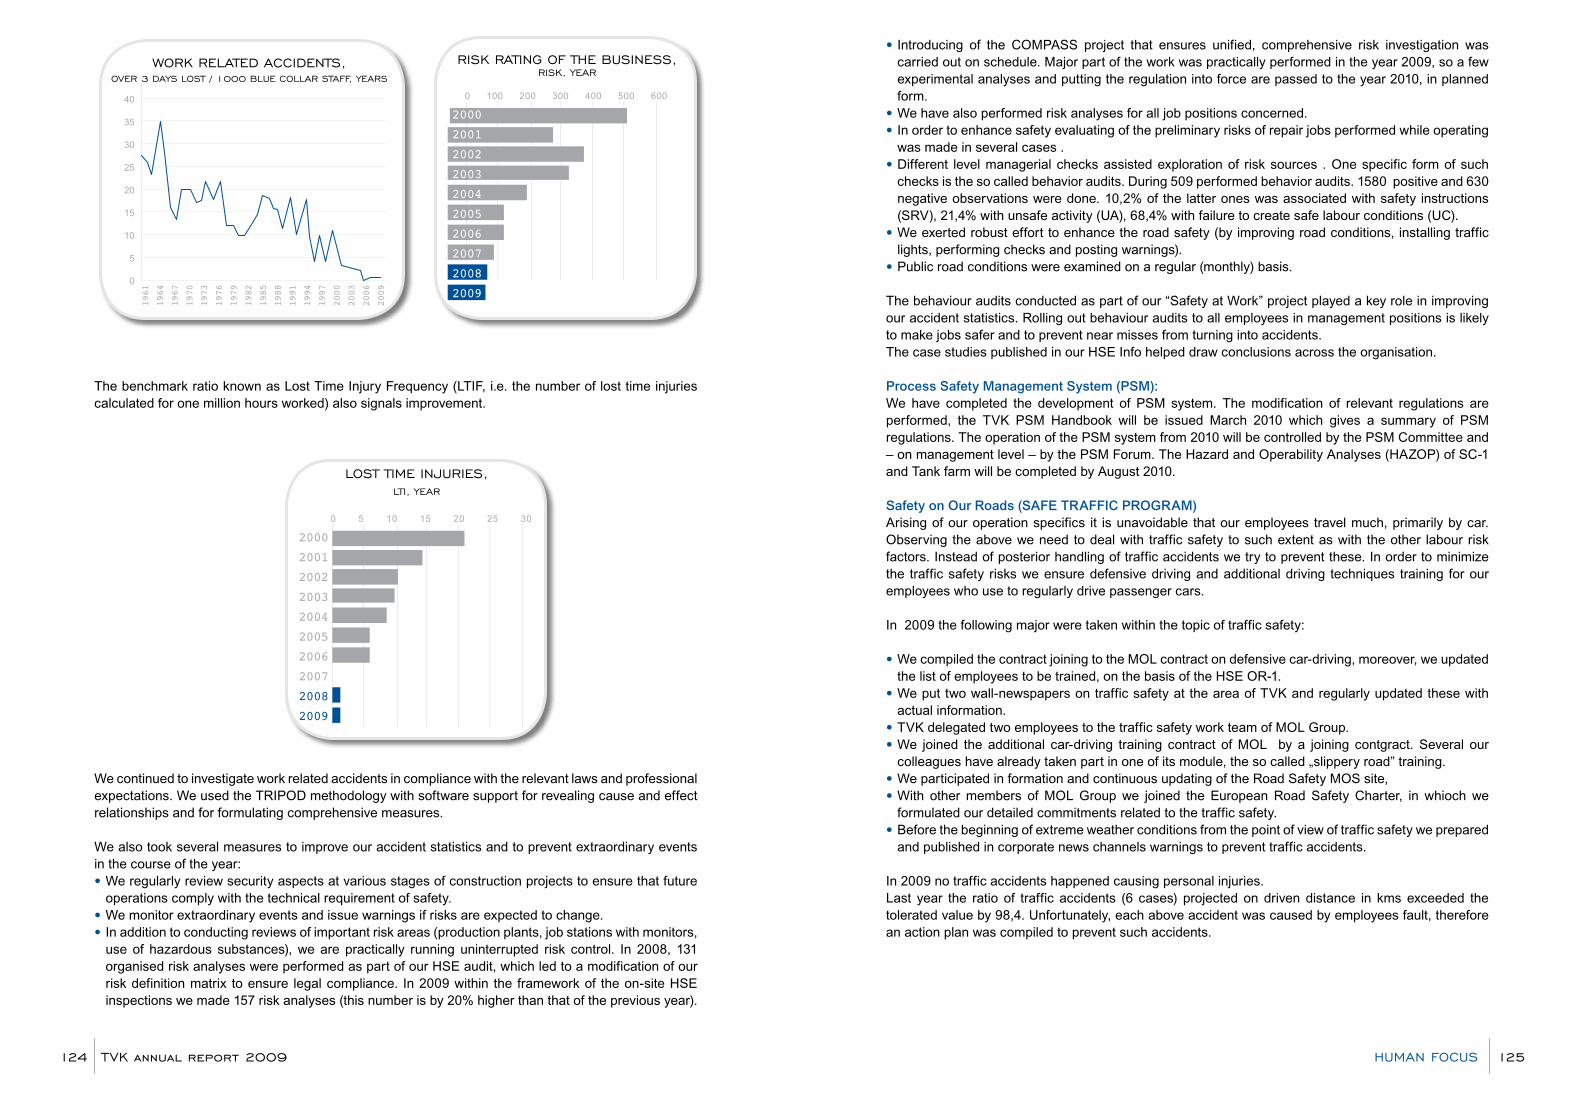
The benchmark ratio known as Lost Time Injury Frequency (LTIF, i.e. the number of lost time injuries calculated for one million hours worked) also signals improvement.
We continued to investigate work related accidents in compliance with the relevant laws and professional expectations. We used the TRIPOD methodology with software support for revealing cause and effect relationships and for formulating comprehensive measures.
We also took several measures to improve our accident statistics and to prevent extraordinary events in the course of the year:• We regularly review security aspects at various stages of construction projects to ensure that future
operations comply with the technical requirement of safety.• We monitor extraordinary events and issue warnings if risks are expected to change. • In addition to conducting reviews of important risk areas (production plants, job stations with monitors,
use of hazardous substances), we are practically running uninterrupted risk control. In 2008, 131 organised risk analyses were performed as part of our HSE audit, which led to a modification of our risk definition matrix to ensure legal compliance. In 2009 within the framework of the on-site HSE inspections we made 157 risk analyses (this number is by 20% higher than that of the previous year).
• Introducing of the COMPASS project that ensures unified, comprehensive risk investigation was carried out on schedule. Major part of the work was practically performed in the year 2009, so a few experimental analyses and putting the regulation into force are passed to the year 2010, in planned form.
• We have also performed risk analyses for all job positions concerned.• In order to enhance safety evaluating of the preliminary risks of repair jobs performed while operating
was made in several cases .• Different level managerial checks assisted exploration of risk sources . One specific form of such
checks is the so called behavior audits. During 509 performed behavior audits. 1580 positive and 630 negative observations were done. 10,2% of the latter ones was associated with safety instructions (SRV), 21,4% with unsafe activity (UA), 68,4% with failure to create safe labour conditions (UC).
• We exerted robust effort to enhance the road safety (by improving road conditions, installing traffic lights, performing checks and posting warnings).
• Public road conditions were examined on a regular (monthly) basis.
The behaviour audits conducted as part of our “Safety at Work” project played a key role in improving our accident statistics. Rolling out behaviour audits to all employees in management positions is likely to make jobs safer and to prevent near misses from turning into accidents.The case studies published in our HSE Info helped draw conclusions across the organisation.
Process Safety Management System (PSM):We have completed the development of PSM system. The modification of relevant regulations are performed, the TVK PSM Handbook will be issued March 2010 which gives a summary of PSM regulations. The operation of the PSM system from 2010 will be controlled by the PSM Committee and – on management level – by the PSM Forum. The Hazard and Operability Analyses (HAZOP) of SC-1 and Tank farm will be completed by August 2010.
Safety on Our Roads (SAFE TRAFFIC PROGRAM)Arising of our operation specifics it is unavoidable that our employees travel much, primarily by car. Observing the above we need to deal with traffic safety to such extent as with the other labour risk factors. Instead of posterior handling of traffic accidents we try to prevent these. In order to minimize the traffic safety risks we ensure defensive driving and additional driving techniques training for our employees who use to regularly drive passenger cars.
In 2009 the following major were taken within the topic of traffic safety:
• We compiled the contract joining to the MOL contract on defensive car-driving, moreover, we updated the list of employees to be trained, on the basis of the HSE OR-1.
• We put two wall-newspapers on traffic safety at the area of TVK and regularly updated these with actual information.
• TVK delegated two employees to the traffic safety work team of MOL Group.• We joined the additional car-driving training contract of MOL by a joining contgract. Several our
colleagues have already taken part in one of its module, the so called „slippery road” training.• We participated in formation and continuous updating of the Road Safety MOS site, • With other members of MOL Group we joined the European Road Safety Charter, in whioch we
formulated our detailed commitments related to the traffic safety.• Before the beginning of extreme weather conditions from the point of view of traffic safety we prepared
and published in corporate news channels warnings to prevent traffic accidents.
In 2009 no traffic accidents happened causing personal injuries. Last year the ratio of traffic accidents (6 cases) projected on driven distance in kms exceeded the tolerated value by 98,4. Unfortunately, each above accident was caused by employees fault, therefore an action plan was compiled to prevent such accidents.
40
35
30
25
20
15
10
5
0
1961
1964
1967
1970
1973
1976
1979
1982
1985
1988
1991
1994
1997
2000
2003
2006
2009
worK relaTeD aCCIDenTS, oVer 3 DayS loST / 1000 Blue Collar STaFF, yearS
rISK raTInG oF THe BuSIneSS, rISK, year
0 100 200 300 400 500 600
2000
2001
2002
2003
2004
2005
2006
2007
2008
2009
0 5 10 15 20 25 30
2000
2001
2002
2003
2004
2005
2006
2007
2008
2009
loST TIMe InJurIeS, lTI, year
TVK annual report 2009124 125HuMan FoCuS
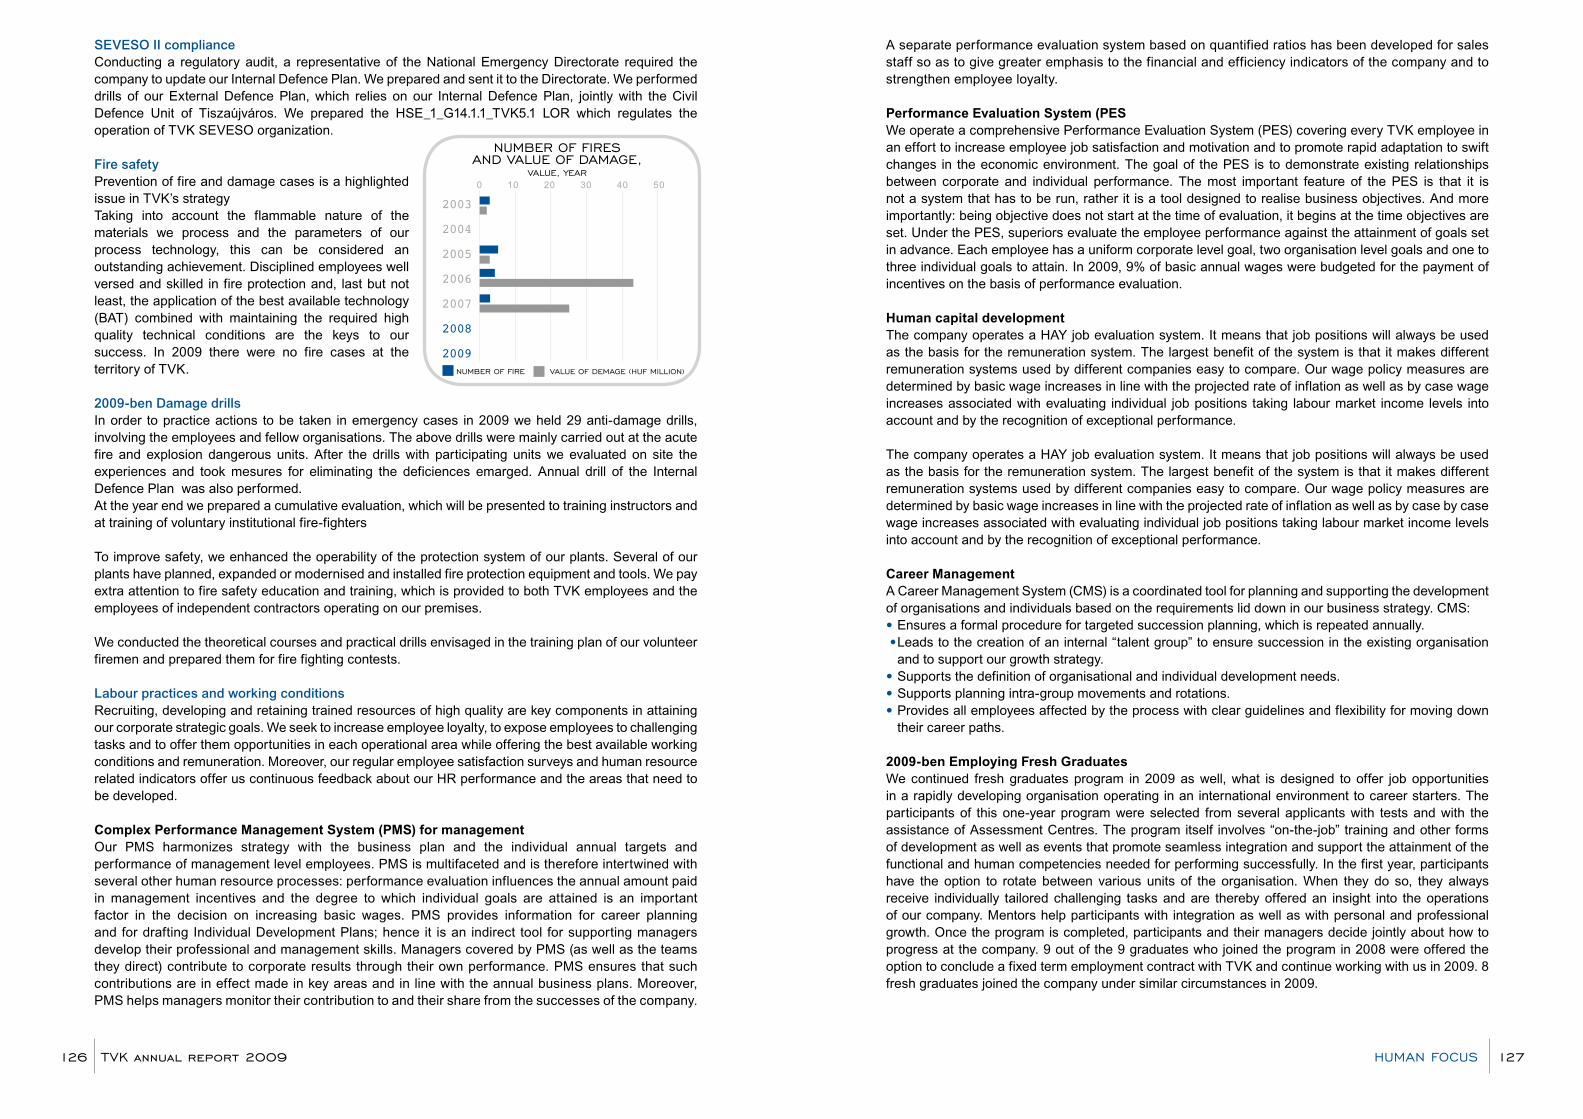
SEVESO II complianceConducting a regulatory audit, a representative of the National Emergency Directorate required the company to update our Internal Defence Plan. We prepared and sent it to the Directorate. We performed drills of our External Defence Plan, which relies on our Internal Defence Plan, jointly with the Civil Defence Unit of Tiszaújváros. We prepared the HSE_1_G14.1.1_TVK5.1 LOR which regulates the operation of TVK SEVESO organization.
Fire safetyPrevention of fire and damage cases is a highlighted issue in TVK’s strategyTaking into account the flammable nature of the materials we process and the parameters of our process technology, this can be considered an outstanding achievement. Disciplined employees well versed and skilled in fire protection and, last but not least, the application of the best available technology (BAT) combined with maintaining the required high quality technical conditions are the keys to our success. In 2009 there were no fire cases at the territory of TVK.
2009-ben Damage drillsIn order to practice actions to be taken in emergency cases in 2009 we held 29 anti-damage drills, involving the employees and fellow organisations. The above drills were mainly carried out at the acute fire and explosion dangerous units. After the drills with participating units we evaluated on site the experiences and took mesures for eliminating the deficiences emarged. Annual drill of the Internal Defence Plan was also performed.At the year end we prepared a cumulative evaluation, which will be presented to training instructors and at training of voluntary institutional fire-fighters
To improve safety, we enhanced the operability of the protection system of our plants. Several of our plants have planned, expanded or modernised and installed fire protection equipment and tools. We pay extra attention to fire safety education and training, which is provided to both TVK employees and the employees of independent contractors operating on our premises.
We conducted the theoretical courses and practical drills envisaged in the training plan of our volunteer firemen and prepared them for fire fighting contests.
Labour practices and working conditionsRecruiting, developing and retaining trained resources of high quality are key components in attaining our corporate strategic goals. We seek to increase employee loyalty, to expose employees to challenging tasks and to offer them opportunities in each operational area while offering the best available working conditions and remuneration. Moreover, our regular employee satisfaction surveys and human resource related indicators offer us continuous feedback about our HR performance and the areas that need to be developed.
Complex Performance Management System (PMS) for managementOur PMS harmonizes strategy with the business plan and the individual annual targets and performance of management level employees. PMS is multifaceted and is therefore intertwined with several other human resource processes: performance evaluation influences the annual amount paid in management incentives and the degree to which individual goals are attained is an important factor in the decision on increasing basic wages. PMS provides information for career planning and for drafting Individual Development Plans; hence it is an indirect tool for supporting managers develop their professional and management skills. Managers covered by PMS (as well as the teams they direct) contribute to corporate results through their own performance. PMS ensures that such contributions are in effect made in key areas and in line with the annual business plans. Moreover, PMS helps managers monitor their contribution to and their share from the successes of the company.
A separate performance evaluation system based on quantified ratios has been developed for sales staff so as to give greater emphasis to the financial and efficiency indicators of the company and to strengthen employee loyalty.
Performance Evaluation System (PESWe operate a comprehensive Performance Evaluation System (PES) covering every TVK employee in an effort to increase employee job satisfaction and motivation and to promote rapid adaptation to swift changes in the economic environment. The goal of the PES is to demonstrate existing relationships between corporate and individual performance. The most important feature of the PES is that it is not a system that has to be run, rather it is a tool designed to realise business objectives. And more importantly: being objective does not start at the time of evaluation, it begins at the time objectives are set. Under the PES, superiors evaluate the employee performance against the attainment of goals set in advance. Each employee has a uniform corporate level goal, two organisation level goals and one to three individual goals to attain. In 2009, 9% of basic annual wages were budgeted for the payment of incentives on the basis of performance evaluation.
Human capital developmentThe company operates a HAY job evaluation system. It means that job positions will always be used as the basis for the remuneration system. The largest benefit of the system is that it makes different remuneration systems used by different companies easy to compare. Our wage policy measures are determined by basic wage increases in line with the projected rate of inflation as well as by case wage increases associated with evaluating individual job positions taking labour market income levels into account and by the recognition of exceptional performance.
The company operates a HAY job evaluation system. It means that job positions will always be used as the basis for the remuneration system. The largest benefit of the system is that it makes different remuneration systems used by different companies easy to compare. Our wage policy measures are determined by basic wage increases in line with the projected rate of inflation as well as by case by case wage increases associated with evaluating individual job positions taking labour market income levels into account and by the recognition of exceptional performance.
Career ManagementA Career Management System (CMS) is a coordinated tool for planning and supporting the development of organisations and individuals based on the requirements lid down in our business strategy. CMS:• Ensures a formal procedure for targeted succession planning, which is repeated annually. • Leads to the creation of an internal “talent group” to ensure succession in the existing organisation
and to support our growth strategy.• Supports the definition of organisational and individual development needs.• Supports planning intra-group movements and rotations.• Provides all employees affected by the process with clear guidelines and flexibility for moving down
their career paths.
2009-ben Employing Fresh GraduatesWe continued fresh graduates program in 2009 as well, what is designed to offer job opportunities in a rapidly developing organisation operating in an international environment to career starters. The participants of this one-year program were selected from several applicants with tests and with the assistance of Assessment Centres. The program itself involves “on-the-job” training and other forms of development as well as events that promote seamless integration and support the attainment of the functional and human competencies needed for performing successfully. In the first year, participants have the option to rotate between various units of the organisation. When they do so, they always receive individually tailored challenging tasks and are thereby offered an insight into the operations of our company. Mentors help participants with integration as well as with personal and professional growth. Once the program is completed, participants and their managers decide jointly about how to progress at the company. 9 out of the 9 graduates who joined the program in 2008 were offered the option to conclude a fixed term employment contract with TVK and continue working with us in 2009. 8 fresh graduates joined the company under similar circumstances in 2009.
nuMBer oF FIreS anD Value oF DaMaGe,
Value, year
2003
2004
2005
2006
2007
2008
2009nuMBer oF FIre Value oF DeMaGe (HuF MIllIon)
0 10 20 30 40 50
TVK annual report 2009126 127HuMan FoCuS
Employing young talentsWe focussed sharply on university communities in 2009 in quite the same fashion as we ran our program for fresh graduates. Strategic recruitment and other activities performed at external partners, mostly training institutions, were connected to the education of students (as our colleagues ran training courses and held lectures). Several units of the company also received students for professional practice in the summer, several students contacted staff members to consult about their thesis and we also provided financial and professional support to students of outstanding talent as part of our fellowship program.In January 2009, we established TVK petrochemical departments at the University of Miskolc and University of Debrecen. The off-site petrochemical departments of the Universities at the TVK site will promote cooperation in research and education and to support the succession of professionals at TVK in the future.From the vocational training contribution we supported secondary schools and universities cooperating with us in the areas of education and research and providing assistance to train a second line of professionals for TVK.
Training and developmentIt is our basic philosophy that highly qualified and motivated labour fully committed to the company is one of the most factors contributing to the successful attainment of our strategic goals. The development of the company requires an increasing number of well-trained, well-informed and talented professional people. The rapid changes of technology and the constant modification of job responsibilities require employees to acquire new trade related knowledge and skills much faster now than at any time in the past. We have a stake in developing strategic human resources, i.e. in getting the right people with right training to be at the right place at the right time, which lends adaptability to and forms the basis of sustaining the efficiency and competitiveness of an organisation in the long run. Also, it leads to continuous personal growth and long term satisfaction.
We have maintained our strategic goal of ensuring the availability of highly trained staff. Accordingly, our employees participate in professional training and competence building courses for individuals and teams. We give priority to conscious development programs and individual competence training programs give way to team based training covering and connecting employees from several units of the organisation. Emphasis is given to case studies and dialogue evenings by members of senior management, which complement training courses.
We spent HUF 87.6 million in 2009 on training and education courses with altogether more than 500 persons participating.
Our RELAY program, which we launched in 2006 was continued successfully. The program is a conscious and orchestrated effort by the company to develop a second line of foremen and chief systems operators in our polymer and olefin plants. Program participants receive complex education, including training sessions and a rotation system. Rotation helps employees acquire several technologies operated outside their own plant and understand corporate level processes. Rotation is advantageous as it reduces monotony, creates wider opportunities for substitution, lends ease to organising work and increases the potential skills of the company and individuals. Rotation cycles last 5-10 days and a RELAY participant normally has to take part in 7-8 rotation cycles based on an individually tailored rotation plan.
New challenges, like changes caused by globalization, sustainable development request the quality management organization to live up to new requirements, therefore we worded the quality aspect as one of the most important core values in the management and operation and in the relationship of our Company with its societal and economic environment. In 2009 our regulation system was under modification according to a schedule.In March 2009, SGS Hungária Kft. successfully audited the integrated management system operating at our company (ISO 9001, ISO 14001, OHSAS 18001).
In case of our accredited laboratories the monitoring audit of the Testing Laboratory of the Technical Inspectorate and the monitoring audit of the Central Laboratory according to standard MSZ EN ISO/IEC 17025:2005 performed by NAT was successful.
The Standards’ requirements of the integrated management system, and accredited laboratories have been checked in the framework of internal audits. At these audits prevention and the propagation of “best practices” were emphasized. Actions in connection with the improvement of determined non-conformities were checked.Built on the remarks of our clients and suppliers we developed further our integrated management system. In the frame of measuring customer satisfaction nearly 500 partners were interviewed in 2009. The purpose of the survey was to identify the strong areas as well as the areas needing development and to monitor the effects of the corrective measures taken as the result of the survey. After the analysis of the information new action plans will be prepared.
Innovative atmosphere and involving colleagues into improvements have always high importance at our Company. Idea Supporting System (ISS) has been operating since more than 10 years, main purpose of which is to find out and to get to know colleagues’ ideas, proposals aiming more efficient and safer operation. Due to ISS significant saving was realized in 2009, too.
our Quality Management
TVK annual report 2009128 129our QualITy ManaGeMenT
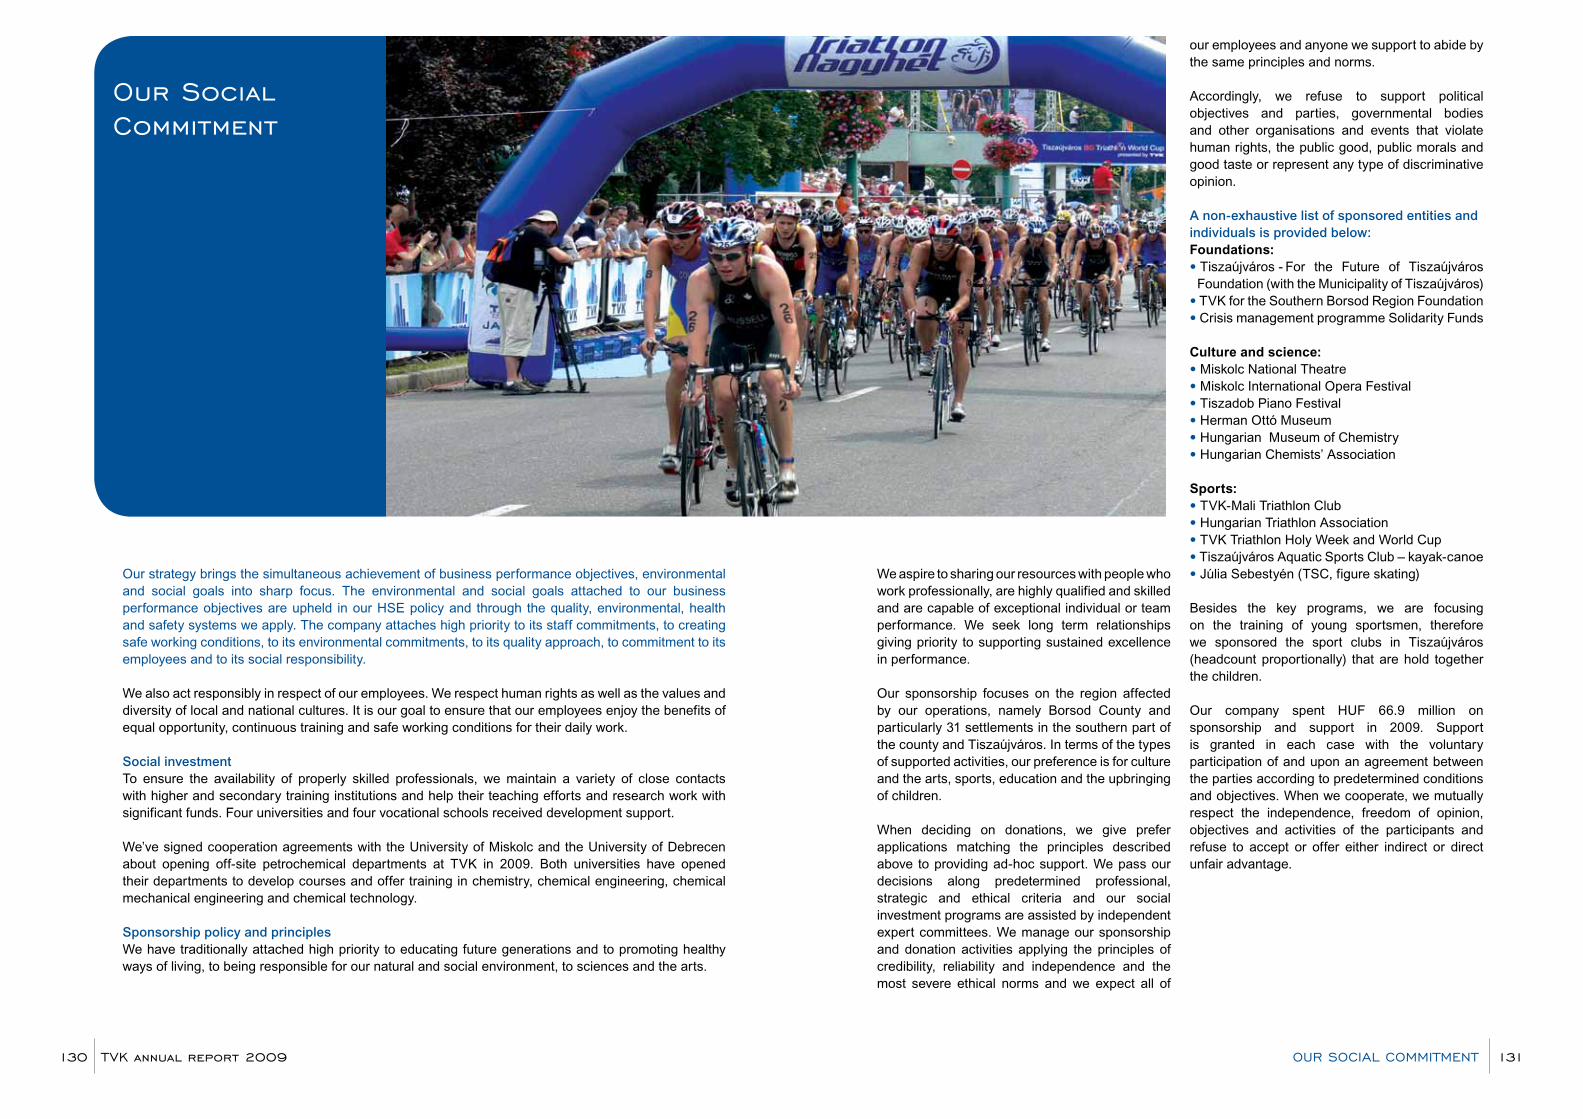
Our strategy brings the simultaneous achievement of business performance objectives, environmental and social goals into sharp focus. The environmental and social goals attached to our business performance objectives are upheld in our HSE policy and through the quality, environmental, health and safety systems we apply. The company attaches high priority to its staff commitments, to creating safe working conditions, to its environmental commitments, to its quality approach, to commitment to its employees and to its social responsibility.
We also act responsibly in respect of our employees. We respect human rights as well as the values and diversity of local and national cultures. It is our goal to ensure that our employees enjoy the benefits of equal opportunity, continuous training and safe working conditions for their daily work.
Social investmentTo ensure the availability of properly skilled professionals, we maintain a variety of close contacts with higher and secondary training institutions and help their teaching efforts and research work with significant funds. Four universities and four vocational schools received development support.
We’ve signed cooperation agreements with the University of Miskolc and the University of Debrecen about opening off-site petrochemical departments at TVK in 2009. Both universities have opened their departments to develop courses and offer training in chemistry, chemical engineering, chemical mechanical engineering and chemical technology.
Sponsorship policy and principlesWe have traditionally attached high priority to educating future generations and to promoting healthy ways of living, to being responsible for our natural and social environment, to sciences and the arts.
We aspire to sharing our resources with people who work professionally, are highly qualified and skilled and are capable of exceptional individual or team performance. We seek long term relationships giving priority to supporting sustained excellence in performance.
Our sponsorship focuses on the region affected by our operations, namely Borsod County and particularly 31 settlements in the southern part of the county and Tiszaújváros. In terms of the types of supported activities, our preference is for culture and the arts, sports, education and the upbringing of children.
When deciding on donations, we give prefer applications matching the principles described above to providing ad-hoc support. We pass our decisions along predetermined professional, strategic and ethical criteria and our social investment programs are assisted by independent expert committees. We manage our sponsorship and donation activities applying the principles of credibility, reliability and independence and the most severe ethical norms and we expect all of
our employees and anyone we support to abide by the same principles and norms.
Accordingly, we refuse to support political objectives and parties, governmental bodies and other organisations and events that violate human rights, the public good, public morals and good taste or represent any type of discriminative opinion.
A non-exhaustive list of sponsored entities and individuals is provided below:Foundations:• Tiszaújváros - For the Future of Tiszaújváros
Foundation (with the Municipality of Tiszaújváros)• TVK for the Southern Borsod Region Foundation• Crisis management programme Solidarity Funds
Culture and science:• Miskolc National Theatre• Miskolc International Opera Festival• Tiszadob Piano Festival• Herman Ottó Museum• Hungarian Museum of Chemistry• Hungarian Chemists’ Association
Sports:• TVK-Mali Triathlon Club • Hungarian Triathlon Association• TVK Triathlon Holy Week and World Cup• Tiszaújváros Aquatic Sports Club – kayak-canoe • Júlia Sebestyén (TSC, figure skating)
Besides the key programs, we are focusing on the training of young sportsmen, therefore we sponsored the sport clubs in Tiszaújváros (headcount proportionally) that are hold together the children.
Our company spent HUF 66.9 million on sponsorship and support in 2009. Support is granted in each case with the voluntary participation of and upon an agreement between the parties according to predetermined conditions and objectives. When we cooperate, we mutually respect the independence, freedom of opinion, objectives and activities of the participants and refuse to accept or offer either indirect or direct unfair advantage.
our Social Commitment
TVK annual report 2009130 131our SoCIal CoMMITMenT
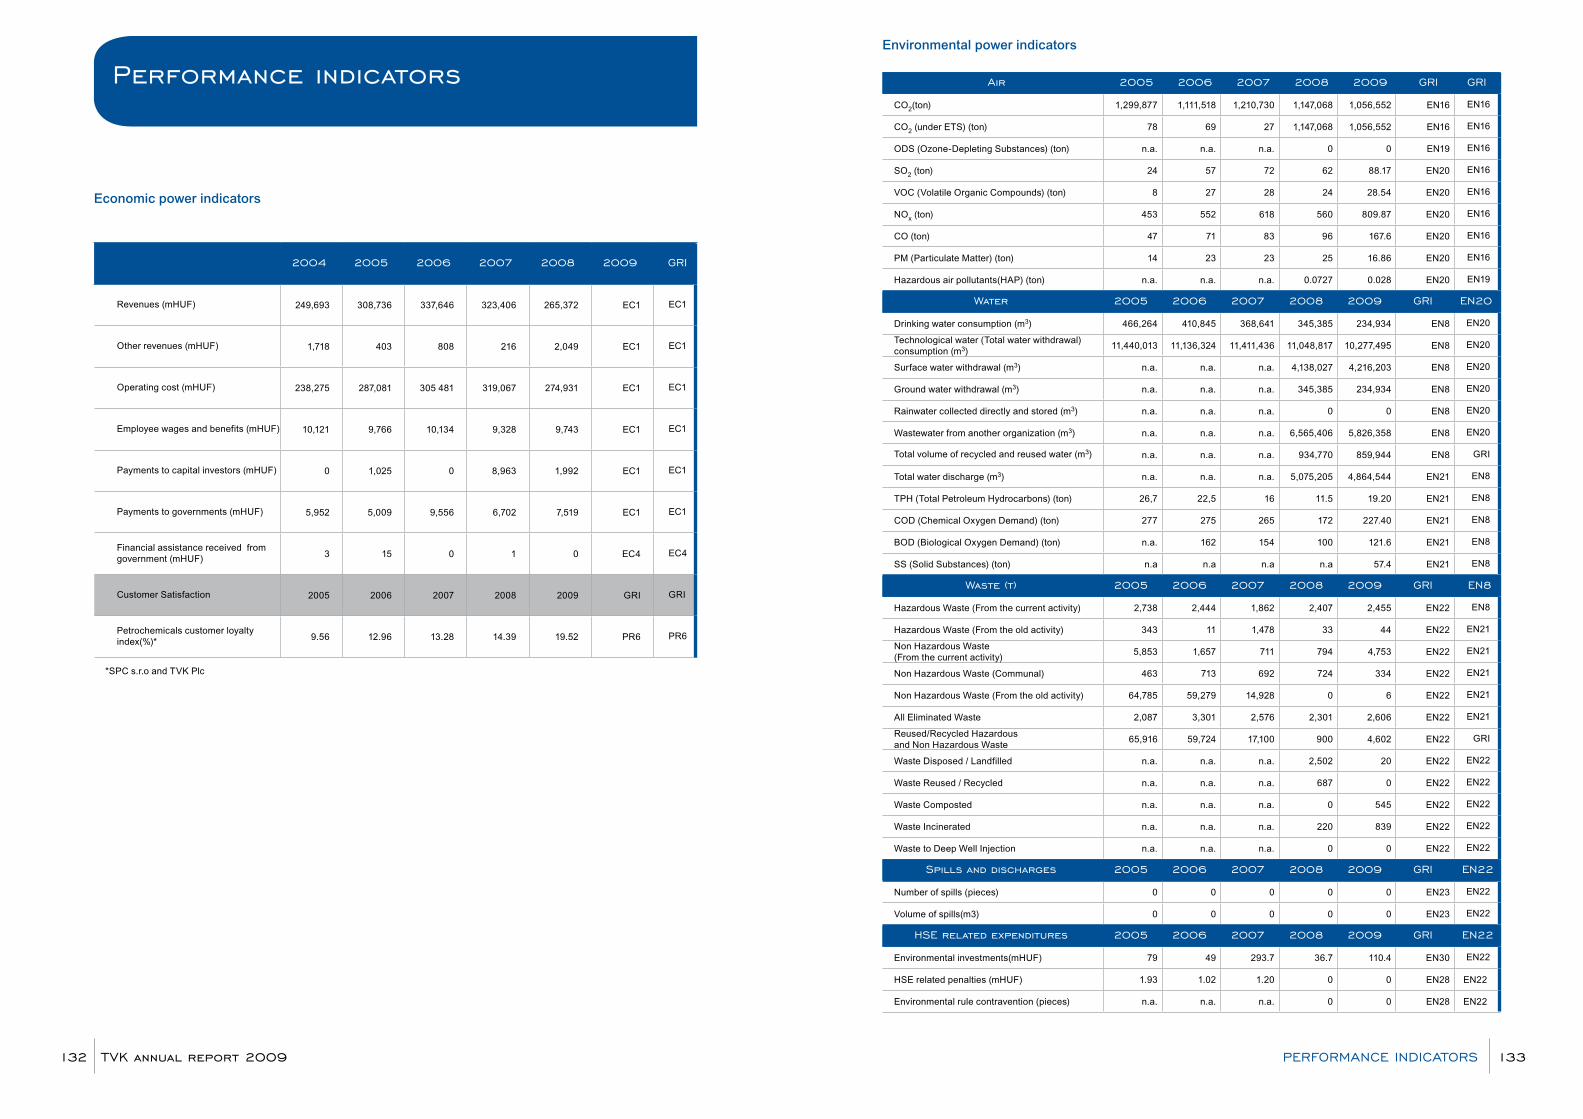
Economic power indicators
2004 2005 2006 2007 2008 2009 GrI
Revenues (mHUF) 249,693 308,736 337,646 323,406 265,372 EC1 EC1
Other revenues (mHUF) 1,718 403 808 216 2,049 EC1 EC1
Operating cost (mHUF) 238,275 287,081 305 481 319,067 274,931 EC1 EC1
Employee wages and benefits (mHUF) 10,121 9,766 10,134 9,328 9,743 EC1 EC1
Payments to capital investors (mHUF) 0 1,025 0 8,963 1,992 EC1 EC1
Payments to governments (mHUF) 5,952 5,009 9,556 6,702 7,519 EC1 EC1
Financial assistance received from government (mHUF) 3 15 0 1 0 EC4 EC4
Customer Satisfaction 2005 2006 2007 2008 2009 GRI GRI
Petrochemicals customer loyalty index(%)* 9.56 12.96 13.28 14.39 19.52 PR6 PR6
*SPC s.r.o and TVK Plc
Environmental power indicators
air 2005 2006 2007 2008 2009 GrI GrI
CO2(ton) 1,299,877 1,111,518 1,210,730 1,147,068 1,056,552 EN16 EN16
CO2 (under ETS) (ton) 78 69 27 1,147,068 1,056,552 EN16 EN16
ODS (Ozone-Depleting Substances) (ton) n.a. n.a. n.a. 0 0 EN19 EN16
SO2 (ton) 24 57 72 62 88.17 EN20 EN16
VOC (Volatile Organic Compounds) (ton) 8 27 28 24 28.54 EN20 EN16
NOx (ton) 453 552 618 560 809.87 EN20 EN16
CO (ton) 47 71 83 96 167.6 EN20 EN16
PM (Particulate Matter) (ton) 14 23 23 25 16.86 EN20 EN16
Hazardous air pollutants(HAP) (ton) n.a. n.a. n.a. 0.0727 0.028 EN20 EN19
water 2005 2006 2007 2008 2009 GrI en20
Drinking water consumption (m3) 466,264 410,845 368,641 345,385 234,934 EN8 EN20
Technological water (Total water withdrawal)consumption (m3)
11,440,013 11,136,324 11,411,436 11,048,817 10,277,495 EN8 EN20
Surface water withdrawal (m3) n.a. n.a. n.a. 4,138,027 4,216,203 EN8 EN20
Ground water withdrawal (m3) n.a. n.a. n.a. 345,385 234,934 EN8 EN20
Rainwater collected directly and stored (m3) n.a. n.a. n.a. 0 0 EN8 EN20
Wastewater from another organization (m3) n.a. n.a. n.a. 6,565,406 5,826,358 EN8 EN20
Total volume of recycled and reused water (m3) n.a. n.a. n.a. 934,770 859,944 EN8 GRI
Total water discharge (m3) n.a. n.a. n.a. 5,075,205 4,864,544 EN21 EN8
TPH (Total Petroleum Hydrocarbons) (ton) 26,7 22,5 16 11.5 19.20 EN21 EN8
COD (Chemical Oxygen Demand) (ton) 277 275 265 172 227.40 EN21 EN8
BOD (Biological Oxygen Demand) (ton) n.a. 162 154 100 121.6 EN21 EN8
SS (Solid Substances) (ton) n.a n.a n.a n.a 57.4 EN21 EN8
waste (t) 2005 2006 2007 2008 2009 GrI en8
Hazardous Waste (From the current activity) 2,738 2,444 1,862 2,407 2,455 EN22 EN8
Hazardous Waste (From the old activity) 343 11 1,478 33 44 EN22 EN21
Non Hazardous Waste (From the current activity)
5,853 1,657 711 794 4,753 EN22 EN21
Non Hazardous Waste (Communal) 463 713 692 724 334 EN22 EN21
Non Hazardous Waste (From the old activity) 64,785 59,279 14,928 0 6 EN22 EN21
All Eliminated Waste 2,087 3,301 2,576 2,301 2,606 EN22 EN21
Reused/Recycled Hazardous and Non Hazardous Waste
65,916 59,724 17,100 900 4,602 EN22 GRI
Waste Disposed / Landfilled n.a. n.a. n.a. 2,502 20 EN22 EN22
Waste Reused / Recycled n.a. n.a. n.a. 687 0 EN22 EN22
Waste Composted n.a. n.a. n.a. 0 545 EN22 EN22
Waste Incinerated n.a. n.a. n.a. 220 839 EN22 EN22
Waste to Deep Well Injection n.a. n.a. n.a. 0 0 EN22 EN22
Spills and discharges 2005 2006 2007 2008 2009 GrI en22
Number of spills (pieces) 0 0 0 0 0 EN23 EN22
Volume of spills(m3) 0 0 0 0 0 EN23 EN22
HSe related expenditures 2005 2006 2007 2008 2009 GrI en22
Environmental investments(mHUF) 79 49 293.7 36.7 110.4 EN30 EN22
HSE related penalties (mHUF) 1.93 1.02 1.20 0 0 EN28 EN22
Environmental rule contravention (pieces) n.a. n.a. n.a. 0 0 EN28 EN22
performance indicators
TVK annual report 2009132 133perForManCe InDICaTorS
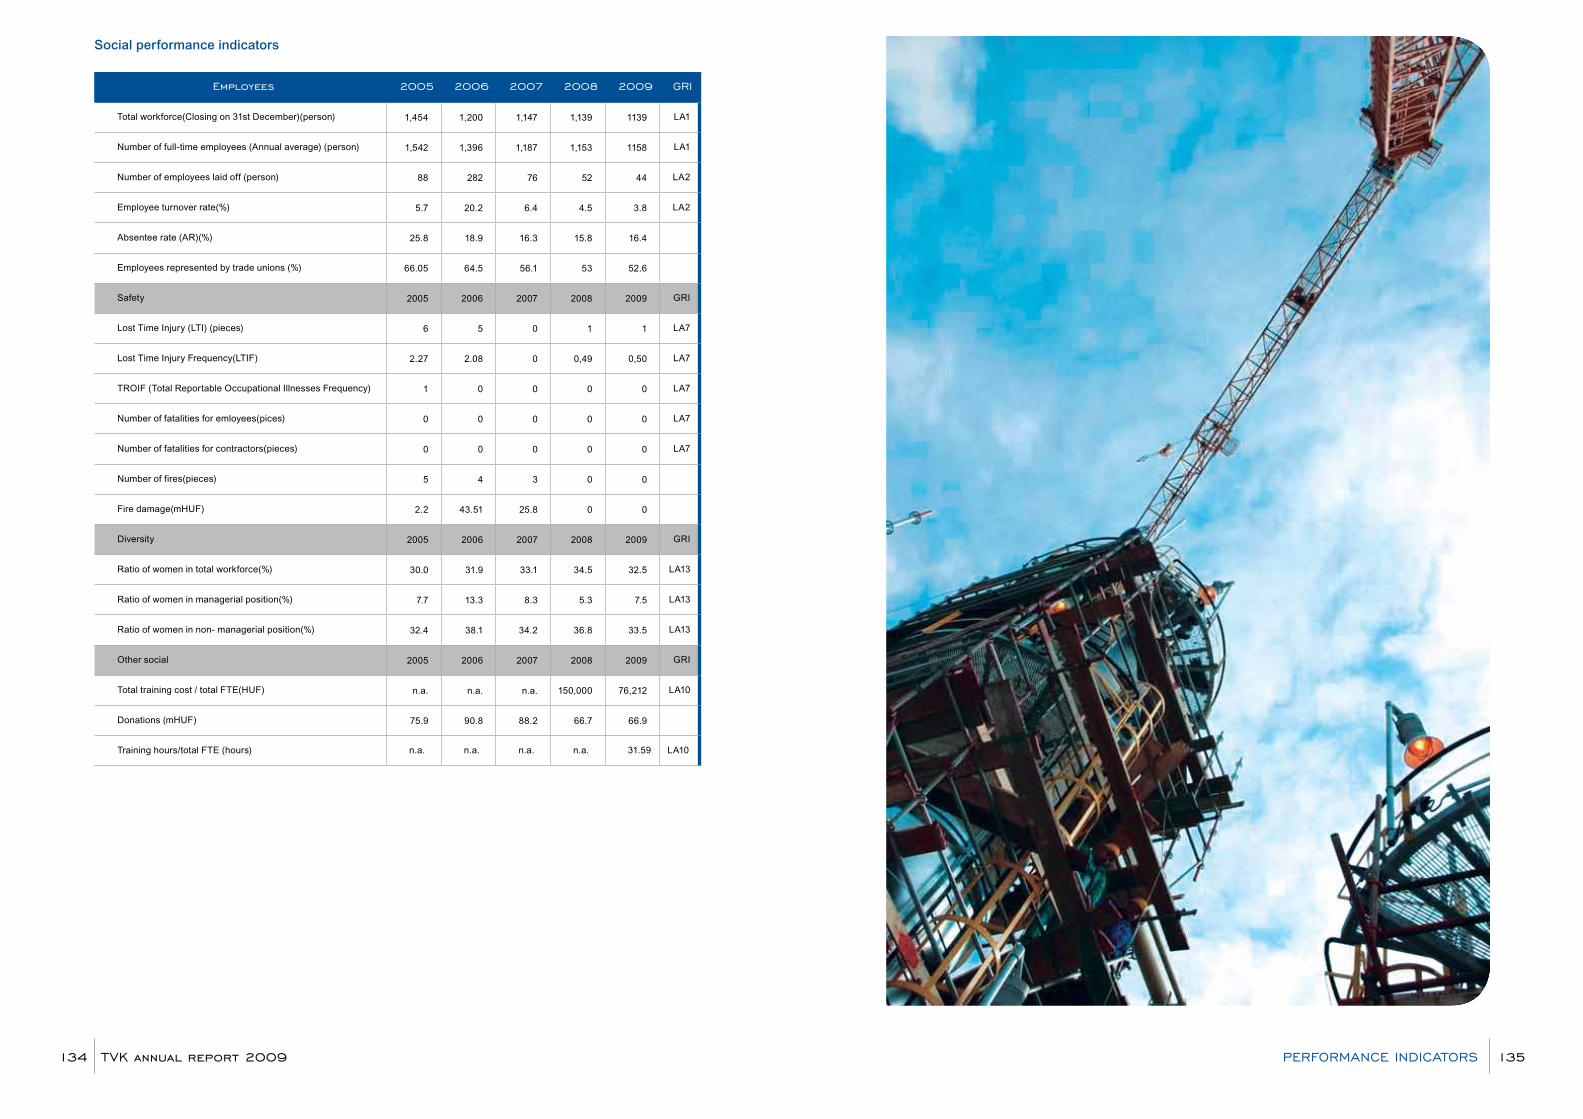
Social performance indicators
employees 2005 2006 2007 2008 2009 GrI
Total workforce(Closing on 31st December)(person) 1,454 1,200 1,147 1,139 1139 LA1
Number of full-time employees (Annual average) (person) 1,542 1,396 1,187 1,153 1158 LA1
Number of employees laid off (person) 88 282 76 52 44 LA2
Employee turnover rate(%) 5.7 20.2 6.4 4.5 3.8 LA2
Absentee rate (AR)(%) 25.8 18.9 16.3 15.8 16.4
Employees represented by trade unions (%) 66.05 64.5 56.1 53 52.6
Safety 2005 2006 2007 2008 2009 GRI
Lost Time Injury (LTI) (pieces) 6 5 0 1 1 LA7
Lost Time Injury Frequency(LTIF) 2.27 2.08 0 0,49 0,50 LA7
TROIF (Total Reportable Occupational Illnesses Frequency) 1 0 0 0 0 LA7
Number of fatalities for emloyees(pices) 0 0 0 0 0 LA7
Number of fatalities for contractors(pieces) 0 0 0 0 0 LA7
Number of fires(pieces) 5 4 3 0 0
Fire damage(mHUF) 2.2 43.51 25.8 0 0
Diversity 2005 2006 2007 2008 2009 GRI
Ratio of women in total workforce(%) 30.0 31.9 33.1 34.5 32.5 LA13
Ratio of women in managerial position(%) 7.7 13.3 8.3 5.3 7.5 LA13
Ratio of women in non- managerial position(%) 32.4 38.1 34.2 36.8 33.5 LA13
Other social 2005 2006 2007 2008 2009 GRI
Total training cost / total FTE(HUF) n.a. n.a. n.a. 150,000 76,212 LA10
Donations (mHUF) 75.9 90.8 88.2 66.7 66.9
Training hours/total FTE (hours) n.a. n.a. n.a. n.a. 31.59 LA10
TVK annual report 2009134 135perForManCe InDICaTorS
TVK annual report 2009136
corporate governance
Operation of the Board of DirectorsThe Board acts and makes resolutions as a collective body.
The Board adopted a set of rules (Charter) to govern its own activities when the company was founded (on December 31, 1991); these rules are regularly updated to ensure continued adherence to best practice standards.
The Board Charter covers• scope of the authority and responsibilities of the Board,• provision of information to the Board, the frequency of reports,• main responsibilities of the Chairman and the Deputy Chairman,• order and preparation of Board meetings and the permanent items of the agenda, and• decision-making mechanism, and the manner in which the implementation of resolutions is monitored.
Report of the Board of Directors on its 2009 activitiesIn 2009, the Board of Directors held 4 meetings with an average attendance rate of 82%. Alongside regular agenda items, such as reports by the Committees’ chairmen on the activities pursued since the last Board meeting, or an overview of capital market developments, the Board of Directors also individually evaluates the performance of each of the company’s business units.
Committees of the Board of Directors
Certain specific tasks are carried out by the Board’s Committees. These Committees have the right to approve preliminary resolutions concerning issues specified in the Decision-making and Authorities List, which sets out the division of authority and responsibility between the Board and the executive management.The responsibilities of the Committees are determined by the Board of Directors.The Chairman of the Board of Directors may also request the Committees to perform certain tasks.The members and chairs of the Committees are elected by the Board of Directors.
Currently, the Board allocates responsibilities to the following Committee:
Finance and Audit Committee:Members and dates of appointment (professional backgrounds of members are available on company homepage):
Name Position Beginning of assignmentJózsef Molnár Chairman 26.04.2002.
Michel-Marc Delcommune Member 26.04.2002.
Vratko Kassovic Member 28.04.2005.
Árpád Olvasó Member 26.04.2002.
Responsibilities: The committee is responsible for promoting the efficiency of the Board regarding issues related to finance, risk management and financial audit as well as for matters designated to it by the Board.
Report of the Audit Committee on its 2009 activities
In 2009, the Finance and Audit Committee held 3 meetings with a 83% average attendance rate. The regular agenda items included the audit of all public financial reports, providing assistance with the auditor’s work and the regular monitoring of internal audit.
Corporate Governance
TVK attaches high priority to applying a corporate governance system that meets even the most exacting expectations. Accordingly, in response to the Guidelines of Responsible Corporate Governance issued by the Budapest Stock Exchange, TVK has disclosed its corporate governance practices in a declaration each year since 2004. The Board of Directors accepts and does its best to observe the Guidelines in the course of running the Company and its operations.
The corporate governance of TVK Plc. complies with the requirements of the Budapest Stock Exchange, the guidelines of the Hungarian Financial Supervisory Authority and the capital market regulations in effect. Furthermore TVK regularly reviews the principles it applies in order to comply with international best practices in this area of the business as well. TVK has always recognised the importance of maintaining the highest standards of corporate governance. Among other things, the voluntary approval of the declaration on the Budapest Stock Exchange Corporate Governance Recommendations by the Annual General Meeting in 2006, before the official deadline, served as testament to the Company’s commitment to corporate governance. A separate section of the TVK website (www.tvk.hu) is devoted to corporate governance and is the page where the company publishes its corporate governance policy and Code of Ethics.
Board of Directors
TVK’s Board of Directors acts as the highest governance body of the Company and as such has collective responsibility for all corporate operations.
The Board’s key activities are focused on achieving increasing shareholder value, improving efficiency and profitability, and ensuring transparency in corporate activities. It also aims to ensure appropriate risk management, environmental protection, and conditions for safety at work.
Given that TVK and its subsidiaries effectively operate as a single unit, the Board is also responsible for enforcing its aims and policies, and for promoting the TVK culture throughout the entire Group.
The principles, policies and goals take account of the Board’s specific and unique relationship with TVK’s shareholders, the executive management and the Company.
The members of the Board of Directors and their independence status (professional CVs of the members are available on corporate homepage):
Name Position Beginning of assignment
Independence status
György Mosonyi Chairman of the Board 26.04.2002 non-independentÁrpád Olvasó Deputy Chairman
of the Board29.08.2000 non-independent
Michel-Marc Delcommune Board member 03.11.2000 non-independentGyula Gansperger Board member 20.04.2006 independentVratko Kassovic Board member 28.04.2005 independentDr. Péter Medgyessy Board member 20.04.2006 independentJózsef Molnár Board member 20.04.2001 non-independent
TVK annual report 2009138 139CorporaTe GoVernanCe
relationship between the Board and the executive Management:
The Matrix of Decision Making Competencies (MDMC) specifies the powers and competencies delegated by the Board to the Management in an attempt to ensure the most efficient enforcement of the business, HSEQ, ethics, risk management and internal control policies specified by the Board. The objective of the MDMC is to maximise the shareholder value of the Company and to capture unambiguously the decision-making powers and competencies so as to reach operational and financial excellence.
The role of the MDMC is to “translate” corporate governance rules by capturing the key decision making point in operating the business and the related competences in the organization. Hence the MDMC identifies the major control points required for efficient process development and operation
Senior managementMembers and dates of appointment (professional backgrounds of members are available on company homepage):
Name Position Beginning of assignment
Árpád Olvasó Chief Executive Officer 01.07.2003Gyula Hodossy Chief Financial Officer, Deputy CEO 01.07.2007Krisztina Petrényiné Szabó* Director of Polymer Marketing and Sales, Deputy
CEO01.10.2009
Tivadar Vályi Nagy Production Director 01.07.2007János Bóta Petrochemical Technology and Project Development
Manager01.08.2007
Tamás Pénzes Human Resources Manager 01.07.2004*László Piry has worked as the Polymer Marketing and Sales director, deputy CEO of TVK Plc. between 7 June, 2004 and 30 September, 2009.
Incentives provided for non-executive directorsIn addition to fixed remuneration, TVK operates an incentive scheme for non-executive directors, which allows the Company to motivate its directors, supporting the continued improvement in long-term Company performance, and value of the TVK shares. In addition, the aim of the scheme is to ensure that directors’ interests remain in line with the interests of the Company’s shareholders. The basis of the effective incentive scheme for non-executive directors was approved by the ordinary Annual General Meeting (AGM) in 2007
Fixed remuneration: A resolution of the Annual Ordinary General Meeting at April 19, 2007 provided that effective as of the day of the Annual General Meeting those Board members who are not employed by TVK Plc. or any other subsidiaries of MOL Group should receive the time proportionate net payment per year of their mandate as follows: • Board members 50,000 EUR/year• Chairman 75,000 EUR/year
Other benefits:Non resident Board members who are non – Hungarian citizens and have to travel to Hungary to attend the meetings shall receive EUR 1,500 for a maximum of fifteen meetings attended in person.
Incentive system for the top management The Board evaluates the performance of the management of the Company individually and at company level once a year and sets the responsibilities and the related targets of achievement for management for the given period according to the system of incentives.
Operating a system of compensation and adopting practical solutions in line with the strategy of the company is a guideline for developing the structure of performance evaluation and remuneration in a
way that it may be used efficiently for attaining the objectives of the Company whilst giving priority to motivating key employees in the organisation. In case of managers of the company, in all financial year, performance goals, relevant to the business strategy are determined, and these are evaluated by the one level higher manager, in case of the senior management it is done by the CEO. Detailed information on share-based payment plans can be found in the annual report of the company, at the financial statement part.
Other fringe benefits: These include company optional benefits (Cafeteria), cars (also used for private purposes), life insurance, accident insurance, travel insurance, liability insurance, and an annual medical check up.
Supervisory Board
The Supervisory Board is responsible for monitoring and supervising the Board of Directors on behalf of the shareholders. The Articles of Association of TVK provides that the Supervisory Board of the Company should have at least three, but no more than fifteen members. At present the Supervisory Board has five members. As provided in the Company Act, 1/3 of the members of this body include employee representatives, hence two members of the Supervisory Board of TVK represent employees and there are three non-executive members appointed by the shareholders.
The members of the Supervisory Board and their independence status (professional backgrounds of members are available on company homepage):
Name Position Beginning of assignment
Independence status
László Gyurovszky SB chairmanSB member
22.06.2007.19.04.2007
independent
Tamás Magyar SB deputy chair SB member
22.06.2007.13.03.1998.
non-independent (employee representative)
dr. Gyula Bakacsi SB member 19.04.2007. independentdr. György Bíró SB member 19.04.2007. independentIldikó Keményné Újvári SB member 10.10.1999. non-independent
(employee representative)In 2009, the Supervisory Board held 4 meetings with an average attendance rate of 90%.
Remuneration of the members of the Supervisory Board According to the resolution of the Annual General Meeting held on April 19, 2007, effective as of the day of the Annual General Meeting the Supervisory Board members should receive the net payment per month of their mandate as follows: • Board members 1,000 EUR/year• Chairman 1,500 EUR/year
Non resident Supervisory Board members who are non – Hungarian citizens and have to travel to Hungary to attend the meetings shall receive EUR 500 for a maximum of fifteen meetings attended in person.
Audit CommitteeIn 2007, the general meeting appointed the Audit Committee comprised of independent members of the Supervisory Board. The Audit Committee strengthens the independent control over the financial and accounting policy of the Company. The independent Audit Committee’s responsibilities include the following activities: • providing opinion on the report as prescribed by the Accounting Act,• auditor proposal and remuneration,• preparation of the agreement with the auditor,• monitoring the compliance of the conflict of interest rules and professional requirements applicable to
the auditor, co-operation with the auditor, and proposal to the Board of Directors or General Meeting
TVK annual report 2009140 141CorporaTe GoVernanCe
on necessary measures to be taken, if necessary,• evaluation of the operation of the financial reporting system, proposal on necessary measures to be
taken, and• providing assistance to the operation of the Supervisory Board for the sake of supervision of the
financial reporting system.
Members of the Audit Committee and dates of appointment (professional backgrounds of members are available on company homepage):
Name Position Beginning of assignmentLászló Gyurovszky AC chairman
AC member22.06.2007.19.04.2007..
dr. Gyula Bakacsi AC deputy cahirAC member
22.06.2007.19.04.2007.
dr. György Bíró AC member 19.04.2007.
Report of the Audit Committee on its 2009 activities In 2009, the Audit Committee held 4 meetings with a 92% average attendance rate. In addition to the regular items on the agenda, including the audit of all public financial reports, providing assistance with the auditor’s work and the regular monitoring of internal audit, the Committee also devoted a considerable amount of time to the following topics:• control of financial and relevant reports,• observation of the effectiveness of internal audit system,• ensuring the independency and objectivity of the external auditor.
Integrated risk Management
The goal for risk management in TVK calls for making corporate operations as secure as possible. The priorities of the risk management policy of the company involve all the risks associated with its business. The risk policy covers for instance the management of currency rate and world market price risk, as well as property, business interruption, business, liability, customer, technical, safety and environmental risks.
Since 2006, the Enterprise Risk Management (ERM) system has been used to manage risks at MOL Group level. The ERM is a modern risk management concept that also contributes to boosting corporate value. The central idea behind the concept is the need to apply a common method and a consolidated way to calculate, manage and disclose in the reports a variety of (financial, operating and strategic) risks. During the ERM process potential risks are identified and the risk benefit relationships of individual divisions, projects and decisions are rendered comparable, which contributes to developing a culture of risk awareness within the organization. The measurement of risks facilitates the identification of the root causes of risks and contributes to a greater awareness of different risk types. As a result, senior management can get a firmer grip on the risks that influence corporate profits the most and can determine the elements of risk to retain and the ones that require a variety of risk mitigation methods.
The ERM also sets the framework for developing business continuity plans, crisis management and other risk management activities. Preparing the framework of BCM - Business Continuity Management – besides the high operational risk branches – at MOL Petrochemical Division finished and came into force in 2009. Training and pro-activity to handle unexpected operational breakdown makes shorter not only the period between breakdown commencement and operational renewal but even point to issues and areas that should be developed.
Moreover, if risk appetite is well-defined, ERM helps set up a business portfolio with optimum risk benefit features by taking risk survey results into account in the decisions on capital allocation.
The prices of the most important feedstock used by the company and the olefin and polymer products produced by TVK are pegged to the global market prices of the same products. Sales income depends
heavily on the position of the HUF in the band of intervention, i.e. the EUR/HUF rate, whilst purchases are determined first of all by the USD rate.
In 2009, TVK did not conclude any forward, option or other derivative transactions to hedge against exchange rate risk. The loan taken out by the company was denominated in EUR to reduce the exchange rate risk. The company had no open foreign exchange futures positions on December 31, 2009.
The company covers most of its trade accounts receivable with credit insurance to mitigate liquidity risk and it carefully examines the conditions of the prospective customer and assesses whether or not the conditions for continuous payment are given before signing a new contract.
In summary, we can state, that TVK handles the basic, daily financial risks (for example goods market, exchange rates, interests) on MOL Group level.
external auditors
The auditor is elected by the General Meeting of TVK.
Ernst & Young Könyvvizsgáló Kft. acts as the auditor of TVK since 2003. The Ordinary Annual General Meeting held on April 16, 2009 elected Ernst & Young Könyvvizsgáló Kft. once again as auditor of the Company and an agreement was concluded for auditing the annual reports closing the business year of 2009. The engagement is in force until the conclusion of the Ordinary Annual General Meeting held in 2010 to decide on the approval of the 2009 annual reports.
The audit agreement provides that Ernst & Young Kft. should audit the consolidated and non-consolidated annual reports drawn up under the Accounting Act and the consolidated and non-consolidated annual reports drawn up under International Financial Reporting Standards (IFRS, formerly IAS). The aforementioned financial statements have been audited as required by National Audit Standards, International Standards of Auditing and the provisions of the Accounting Act and any other acts and laws on auditing. The auditors ensure the continuous nature of performing the audit assignment by working on site and by participating at the meetings of key TVK bodies as well as through other forms of consultation.
Furthermore, the auditor reviews the quarterly stock exchange flash report but issues no auditor’s statement, as flash reports are not fully audited.
In 2009, Ernst & Young Kft. also delivered other services to TVK Plc as follows:Supervised the data of TVK’s Hungarian and foreign subsidiaries supplied to the consolidation. This supervision was made only in case of the Hungarian subsidiaries as in case of the foreign subsidiaries the operational process became significantly simplified, therefore the control of the accounting process was made by the Accounting department of the company.
Fees Paid to Auditors, 2008-2009 (HUF million)
2008 2009Fee for the audit of TVK Plc. 39.0 35.1
Other audit related services 6.9 4.2
Tax advisory services 0.0 0.0
Supervision of company integrated system 4.7 0.0
Total 50.6 39.3
The Board of Directors do not think that any of the services rendered by Ernst & Young Kft. under the aforementioned titles jeopardise its independence as auditor.
TVK annual report 2009142 143CorporaTe GoVernanCe
relationship with the shareholders, insider trading
The Board is aware of its commitment to represent and promote shareholders’ interests, and recognises that it is fully accountable for the performance and activities of the TVK Group. To help ensure that the Company can meet shareholders’ expectations in all areas, the Board continually analyses and evaluates developments, both in the broader external environment as well as at an operational level.
Formal channels of communication with shareholders include the Annual Report and Accounts and the quarterly results reports, as well as other public announcements made through the Budapest Stock Exchange (primary exchange) and the London Stock Exchange. Regular and extraordinary announcements are published on PSZÁF (Hungarian Financial Supervisory Authority) publication site and on TVK’s homepage. In addition, presentations on the business, its performance and strategy are given to shareholders at the Annual General Meeting and extraordinary General Meetings. Furthermore, investors are able to raise questions or make proposals at any time during the year, including the Company’s General Meeting. Investor feedbacks are regularly reported to the Board of Directors.
TVK’s Investor Relation specialist is responsible for the organisation of the above activities as well as for the day-to-day management of TVK’s relationship with its shareholders (contact details are provided in the company’s homepage). Extensive information is also made available on TVK’s website (www.tvk.hu), which has a dedicated section for shareholders and the financial community.
TVK Group is committed to the fair marketing of publicly-traded securities. Insider dealing in securities is regarded as a criminal offence in most of the countries in which we carry out business. Therefore, we require not only full compliance with relevant laws, but also the avoidance of even the appearance of insider securities trading and consultancy.
TVK Group employees:• should not buy or sell shares in TVK or any other company while in possession of insider information,• should not disclose insider information to anyone outside the company, without prior approval,• should be careful, even with other TVK Group employees, should disclose insider information to a co-
worker when they have permission to do so and if it is necessary to do their job,• should protect insider information from accidental disclosure.
exercise of shareholders’ rights, general meeting participation
Voting rights on the general meeting can be exercised based on the voting rights attached to shares held by the shareholders. Every ordinary share entitles the holder thereof to have one and one hundredth vote. The actual voting power depends on how many shares are registered by the shareholders participating in the general meeting.
A condition of participation and voting at the general meeting for shareholders is that the holder of the share(s) shall be registered in the Share Register. The depositary shall be responsible for registering the shareholders in the Share Register pursuant to the instructions of such shareholders in line with the conditions set by the general meeting invitation.
The conditions to participate in the general meeting are published in the invitation to the general meeting. Invitations to the general meeting are published on company homepage. The ordinary general meeting is usually held in late April, in line with the current regulation.
The ordinary general meeting, based on the proposal of Board of Directors approved by the Supervisory Board, shall have the authority to determine profit distribution, i.e. the amount of the profit after taxation to be reinvested into the Company and the amount to be paid out as dividends.
The starting date for the payment of dividends shall be defined by the Board of Directors in such way as to ensure a period of at least 10 working days between the first publication date of such announcement and the initial date of dividend distribution. Only those shareholders are entitled to receive dividend, who are registered in the share register of the Company on the basis of shareholders identification executed on the date published by the Board of Directors in the announcement on the dividend payment. Such date relevant to the dividend payment determined by the Board of Directors may deviate from the date of general meeting deciding on the payment of dividend. However, the date of the shareholder identification made in compliance with the regulations of KELER in respect of the dividend payment shall not take place more than five working days after the general meeting passing a resolution on the payment of dividend.
TVK annual report 2009144 145CorporaTe GoVernanCe
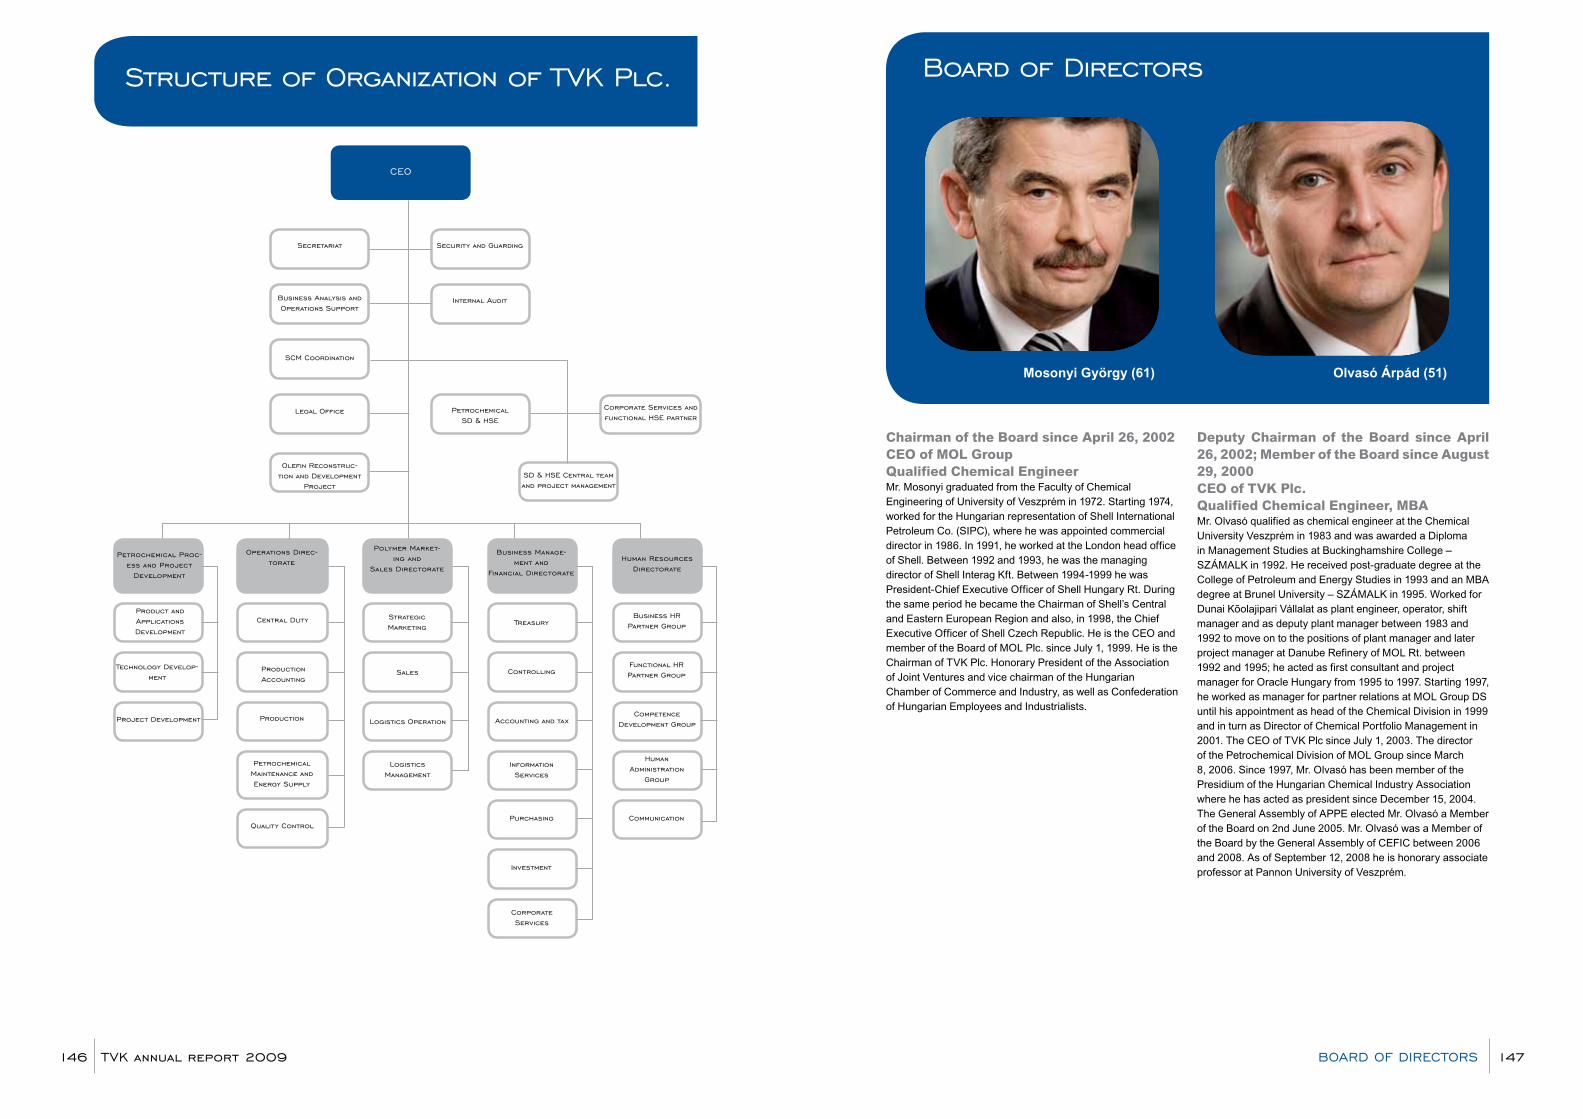
Structure of organization of TVK plc.
Secretariat
Business analysis and operations Support
SCM Coordination
legal office
olefin reconstruc-tion and Development
project
Security and Guarding
Internal audit
petrochemical SD & HSe
Corporate Services and functional HSe partner
SD & HSe Central team and project management
Business Manage-ment and
Financial Directorate
Treasury
Controlling
accounting and tax
Information Services
purchasing
Investment
Corporate Services
Human resources Directorate
Business Hr partner Group
Functional Hr partner Group
Competence Development Group
Human administration
Group
Communication
polymer Market-ing and
Sales Directorate
Strategic Marketing
Sales
logistics operation
logistics Management
operations Direc-torate
Central Duty
production accounting
production
petrochemical Maintenance and energy Supply
Quality Control
petrochemical proc-ess and project
Development
product and applications Development
Technology Develop-ment
project Development
Ceo
Mosonyi György (61) Olvasó Árpád (51)
Board of Directors
Chairman of the Board since April 26, 2002CEO of MOL Group Qualified Chemical EngineerMr. Mosonyi graduated from the Faculty of Chemical Engineering of University of Veszprém in 1972. Starting 1974, worked for the Hungarian representation of Shell International Petroleum Co. (SIPC), where he was appointed commercial director in 1986. In 1991, he worked at the London head office of Shell. Between 1992 and 1993, he was the managing director of Shell Interag Kft. Between 1994-1999 he was President-Chief Executive Officer of Shell Hungary Rt. During the same period he became the Chairman of Shell’s Central and Eastern European Region and also, in 1998, the Chief Executive Officer of Shell Czech Republic. He is the CEO and member of the Board of MOL Plc. since July 1, 1999. He is the Chairman of TVK Plc. Honorary President of the Association of Joint Ventures and vice chairman of the Hungarian Chamber of Commerce and Industry, as well as Confederation of Hungarian Employees and Industrialists.
Deputy Chairman of the Board since April 26, 2002; Member of the Board since August 29, 2000CEO of TVK Plc.Qualified Chemical Engineer, MBAMr. Olvasó qualified as chemical engineer at the Chemical University Veszprém in 1983 and was awarded a Diploma in Management Studies at Buckinghamshire College – SZÁMALK in 1992. He received post-graduate degree at the College of Petroleum and Energy Studies in 1993 and an MBA degree at Brunel University – SZÁMALK in 1995. Worked for Dunai Kõolajipari Vállalat as plant engineer, operator, shift manager and as deputy plant manager between 1983 and 1992 to move on to the positions of plant manager and later project manager at Danube Refinery of MOL Rt. between 1992 and 1995; he acted as first consultant and project manager for Oracle Hungary from 1995 to 1997. Starting 1997, he worked as manager for partner relations at MOL Group DS until his appointment as head of the Chemical Division in 1999 and in turn as Director of Chemical Portfolio Management in 2001. The CEO of TVK Plc since July 1, 2003. The director of the Petrochemical Division of MOL Group since March 8, 2006. Since 1997, Mr. Olvasó has been member of the Presidium of the Hungarian Chemical Industry Association where he has acted as president since December 15, 2004. The General Assembly of APPE elected Mr. Olvasó a Member of the Board on 2nd June 2005. Mr. Olvasó was a Member of the Board by the General Assembly of CEFIC between 2006 and 2008. As of September 12, 2008 he is honorary associate professor at Pannon University of Veszprém.
TVK annual report 2009146 147BoarD oF DIreCTorS

Member of the Board since April 20, 2006. Former prime ministerQualified economistMr. Medgyessy graduated from Budapest University of Technology and Economics, Department of Theoretical Politics and Economy in 1966. Between 1966-1982 he worked at the Ministry of Finance in different positions. Between 1982-1986 Deputy Minister of Finance. In 1987 Minister of Finance. Between 1988-1990 Deputy Prime Minister, responsible of economic affairs in the government at the time of the change of regime. Between 1990-1994 President and Director General of the French Paribas Bank Ltd. in Hungary. Between 1994-1996 President and Director General of the Hungarian Investment and Development Bank Ltd. Between 1996-1998. Minister of Finance. Between 1998-2001 Chairman of the Board of Directors of Inter Európa Bank and Vice President of Atlasz Insurance Ltd. Between 2002-2004 Prime Minister of the Hungarian Republic. On August 25, 2004 he resigns for the sake of maintaining the coalition. Extraordinary and Plenipotentiary Ambassador of the Republic of Hungary between October 14, 2004 and May 31, 2008.
Other professional and public activities:1973-1977 Member of the Board of the International Institute for State Finance1994-1996 Chairman of the Hungarian Society of Economics1994-1996 Member of the Counsellors’ Committee of the World Economic Forum in Davos1995-1996 Member of the Board of Directors of the Hungarian Banking Association1998-2000 Member of the Hungarian Atlantic Council1998-2000 Vice President of the Commercial, Industrial and Cultural Chamber of Central European and Gulf Countries 2006- Member of Comité Européen d’Orientation founded by Jacques Delors, 2008- Chairman of Hungarian- Hong Kong Partner Association, then2009. February Honorary President.
Member of the Board since April 20, 2001CFO, MOL GroupQualified EconomistMr Molnár graduated in 1978 and held various middle tier management positions at Borsodi Vegyi Kombinát, the legal predecessor of BorsodChem Zrt. Participated in the reorganisation of BorsodChem and the preparation for listing its shares in the capacity of CFO in 1991. He was responsible for finance, accounting, controlling, IT, acquisitions and divestment jobs as well as for controlling subsidiaries at the company and in turn at BorsodChem Group until April 18, 2001. He acted as CEO of TVK Rt. until April 23, 2001 until his appointment as Director of Planning and Controlling at MOL Group on July 1, 2003. He moved on to the position of CFO on September 2, 2004. He was the member of the Board of Slovnaft a.s. between 2004-2008.
Delcommune Michel-Marc (62) Gansperger Gyula (47) Kassovic Vratko (66) Dr. Medgyessy Péter (68) Molnár József (54)
Board of Directors
Member of the Board since November 3, 2000Chief Advisor to the President of MOL Group since July 1, 2006Qualified Chemical Engineer, MBAMOL Group Chief Financial Officer since 11 October 1999, Director of Strategy, MOL Group since September 2, 2004 until July 1, 2006. Member of the Board of Directors of MOL Group since 28 April 2000 until 24 April 2008. Took a degree in Chemical Engineering at the University of Liege, Belgium and holds an MBA from Cornell University, New York. Mr Delcommune joined the PetroFina Group in 1972. Since 1990 he has been CFO. From 1999 he served in addition as human resources director and handled the successful merger of Fina and Total. He is a member of the International Advisory Board of Cornell University Business School and also a member of the Board of Directors of TVK Plc., Slovnaft a. s. and JKX Oil and Gaz. He is a Belgian citizen.
Member of the Board since April 20, 2006.Managing Director of Constans Invest Ltd Qualified economist. Mr. Gansperger graduated in 1986 from University of Economics Budapest, Department of Finance. He obtain his professional expertises between 1986-1987. at Elektrocoop Company as Executive Officer, between 1987-1990. at CET Budapest Tervező Rt. as Chief accountant, between 1990-1998. at TAXORG Könyvelő és Adótanácsadó Kft. as Managing Director, between 1998-2001. at Hungarian Privatization and State Holding Company as Chairman and CEO, between 2001-2002. at Budapest Airport Pte. Ltd. as Chairman and CEO, between 2003-2005. at Wallis Plc. as CFO. He was the Chief Executive Officer of Wallis Ltd. between 2006-2007 and then, until December 2008 the Vice President of KÉSZ Holding Private Limited Company, member of the Board of Directors. At the present he is the managing director of Constans Invest Ltd. Main Titles: 2009 – MORANDO Zrt., member of the Board of Directors, 2008 - Constans Invest Ltd., Managing Director, 2006 - TVK Plc., member of the Board of Directors, 2005-2007 - Wallis Plc., member of the Board of Directors, 2005-2007 - Graboplast Plc., member of the Board of Directors, 2001-2003 -MATÁV Ltd., member of the Board of Directors, 1998-2000 - Hungarian Post Co. Ltd., member of the Board of Directors, 1995-1998 - Hungarian Privatization and State Holding Company, member of the Supervisory Board.
Member of the Board since April 28, 2005CEO, Slovnaft a.s. until March 6, 2006Qualified Chemical EngineerMr. Kassovic graduated as a chemical engineer from the technical university of Bratislava in 1967. He joined Slovnaft in 1969 and filled several positions until he was appointed as CEO in January 2002. Mr. Kassovic has been the director of the Petrochemical Division of the MOL Group since October 2003. On March 6, 2006, Mr. Kassovic has retired.
TVK annual report 2009148 149BoarD oF DIreCTorS
OLVASÓ Árpád (51)Deputy Chairman of the Board since April 26, 2002; Member of the Board since August 29, 2000, Chief Executive Officer, Qualified Chemical Engineer, MBA
See CV in the section on the Board of Directors
PIRY László (43)Deputy CEO, Polymer Marketing and Sales up to September 30, 2009Mechanical engineer, DMS
Mr. Piry graduated from the Budapest Technical University as a mechanical engineer in 1991 and obtained a diploma in management studies at Euro Contact Business School in 1998. Worked for Dow Chemicals as an engineer and sales executive to move on to regional sales and marketing positions after 1991. He was appointed as director responsible for sales of the Diversey Lever Division of Unilever in 1998. He acted as managing director at the same company starting 2001. In 2002 he took over the position of managing director at the Sloven subsidiary of Unilever and was in charge of the Croatian market starting 2003. Mr. Piry was appointed deputy CEO responsible for Polymer Marketing and Sales at TVK Plc. on June 7, 2004.
PETRÉNYINÉ SZABÓ KRISZTINA (32)Polimer marketing és értékesítési vezérigazgató-helyettes 2009. október 1-jétőlokleveles közgazdász
Mrs. Petrenyi graduated from the University of Economics Miskolc as a qualified economist in 2000 and obtained a professional economist diploma in Foreign Trade Management at Budapest Business School in 2003. She has started her carrier in 2000 at Sales Department of TVK. From 2002 she has acted as a senior sales executive of polyethylene export sales. She was appointed as a senior sales executive of polymer export sales starting 2003.In February 2006 she took over the position of head of Polymer Sales. Mrs. Petrenyi was appointed deputy CEO responsible for Polymer Marketing and Sales at TVK Plc. on October 1, 2009.
HODOSSY Gyula (39) Deputy CEO, Management and Finance since July 1, 2007Qualified economist
Mr Hodossy started his career in 1989 at TVK’s Customs and Material Acceptance. Graduated from the Budapest College of Finance and Accounting in 1995 and obtained a Diploma in Management studies at Euro Contact Business School in 2002. From 1995 continued his work as an analysing economist at the Controlling Office. He was appointed the group leader of Inventory Management in 1997. From January 2001, he acted as the economic manager at the Olefin Business Unit. In July 2002 he took over the position of the head of the Internal Audit, then from January 2004 he was appointed the head of Energy Supply and Maintenance Management. Since July 1, 2007 he has been acting as Deputy CEO, Chief Financial Officer of TVK Plc.
BÓTA János (48)Director of Petrochemical Technology and Product Development since August 1, 2007Chemical engineer
Mr. Bóta graduated as chemical engineer from the Process Control Faculty of the University of Veszprém in 1985. In 1994 he has received engineer-manager degree at the University of Miskolc. He worked at TVK since 1985. For ten years he worked in various positions at the Production Unit (HDPE-1 and PP-3 Plants), between 1989 and 1995 he was plant manager. From 1995 he was the sales manager of the HDPE Business Unit, from 1998 worked as PP business unit director. From 2000 he was in the position of marketing and sales manager, from 2002 he held the post of technology development manager. From August 1, 2006 for one year he worked at the Netherlands office of Fluor Company, as process engineering manager. Since August 1, 2007 he is the Director of Petrochemical Technology and Project Development.
PÉNZES Tamás (39)Human Resources ManagerPsychologist
Mr. Pénzes graduated from the faculty of psychology of the University of Debrecen as a psychologist specializing in labour and organization psychology and mathematical modelling. During his academic years, he researched corporate cultures, performed statistical analyses and worked for an HR consulting company as a specialist of recruitment and selection. He has been member of the TVK HR team since 2002 and was appointed HR manager in July, 2004. Mr. Pénzes teaches at the psychology department of the University of Debrecen. He received MBA degree at Durham University in 2008.
VÁLYI NAGY Tivadar (54) Director, Production since July 1, 2007Qualified Chemical Engineer
Mr. Vályi Nagy graduated as a chemical engineer at the Mineral Oil and Coal Technology faculty of the University of Chemical Engineering in Veszprém in 1982. He joined TVK in 1978 and worked as plant engineer in various polymerisation plants of the Company before 1994. He acted as project manager in the implementation jobs of the ERP application to move on to managing the economics of a business unit starting 1995. Later on was in charge of planning an analysis in the Petrochemical Division. Mr Vályi Nagy has been chief controller of the Company since 2000. He worked as Deputy CEO, Chief Financial Officer between January 1, 2005 and July 1, 2007. He was appointed TVK’s Production Director on July 1, 2007.
TVK annual report 2009150 151Top ManaGeMenT
Független Könyvvizsgálói JelentésTop Management
GYUROVSZKY László (51)Chairperson of the Supervisory Board since June 22, 2007Member of the Supervisory Board since April 19, 2007Financial consultant, crisis-manager,Engineer
He is graduated as an engineer from the Slovakian Technical University of Bratislava in 1983. Between 1983 and 1990 he worked as electrical engineer at Duslo Sala – Slovakian chemical company. Between 1990 and 1992, as a journalist he published political and economical articles. Between 1992 and 1998, as a businessman, he dealt with the sale of sport and mobile communication articles. Between 1998 and 2002 as a Member of the Parliament of the Slovak Republic, took part in implementing the reforms of the Slovakian Economy and in the work of the Budget and Finance Committee of the Parliament. From 2002 until 2006 he was a minister of the Regional Development and Construction of the Slovak Government. He is a member of TVK Plc’s Supervisory Board since April 19, 2007 and Chairman of it since June 22, 2007. He is the Chairman of TVK’s Audit Committee since June 22, 2007.
MAGYAR Tamás (41)Deputy Chair of the Supervisory Board since June 22, 2007Member of the Supervisory Board after March 13, 1998Chief Service Manager, TVK Plc. Energy SupplyElectric Product Engineer
Mr. Magyar graduated as electric product engineer from Kandó Kálmán Technical College for the Electric Industry in 1989. He worked for TVK at the Electricity Division and at the Electric Network Plant between 1989 and 1993 then move on to the post of product engineer at the Technical Department where he worked between 1993 and 1994 and to service manager at the High Voltage Unit between 1994 and May 1997. He acted as head of the Electric Maintenance Unit of the Energy Supply Division between 1997 and 2000. Mr. Magyar acted as service manager and service technologist at the Electricians Service Unit between 2000 and 2008, then from 2008 to 2009 as expert of Energy Mangement. He has been working as head of Energy Contract Management since January 1, 2010. Mr. Magyar is the member of TVK Plc’s Supervisory Board since March 13, 1998. He was the Deputy Chairman of TVK Plc’s Supervisory Board between August 29, 2000 and November 18, 2003.
dr. BAKACSI Gyula (51)Member of the Supervisory Board since April 19, 2007Head of department, professor, at the Corvinus University of BudapestHead of department, professor of the Sapientia Hungarian University of TransylvaniaEconomist, doctorate degree, candidate for Economics
Dr. Gyula Bakacsi is the head of department, professor, at the Corvinus University of Budapest, Faculty of Economics, Faculty of Organisational Theory. He is the head of department, professor of the Sapientia Hungarian University of Transylvania, the Faculty of Economics and Human Sciences, Business Sciences. He is graduated in 1983 at the Faculty of Industry of the Marx Károly University of Economics in Budapest. He got his doctorate degree in 1988, candidate for Economics degree in 1994. Between 1983 and 1985 he worked at the MTA-MKKE (Marx Károly University of Economics) as science associate at the Coordination Secretary of Faculty „Socialist Company” National Perspective Scientific Research. Between 1985 and 1990, he was assistant lecturer at the Faculty of Industrial Business Organisation
at MKKE. Between 1990 and 2004 he was adjunct, from 1994 docent at the Faculty of Organisation and Management Theory at the University of Economics, Budapest. Between 2000 and 2002 he was deputy rector of the Faculty of University Politics and Development at the University of Economics and State Administration, Budapest. From 2003 he is a head of department of the Business Sciences at the Csíkszereda Unit of the Sapientia Hungarian University of Transylvania. In 2004, he was the deputy rector of the University, between 2004 and 2008, he was the rector of the Faculty of Economics and Human Sciences. From 2005, he is the head of department, professor, at the Corvinus University of Budapest, Faculty of Organisational Theory, and deputy director of the Management Sciences Institution. From 2003, he is the chairman of the Economics Sciences Professional Committee of the National Scientific Student Association. Between 2004 and 2006, he was a corporate member of the Local Government of Martonvásár. From 2005, he is the Chairman of the Supervisory Board of the PEMŰ Zrt. He is the Deputy Chairman of TVK’s Audit Committee since June 22, 2007.
dr. BÍRÓ György (55)Member of the Supervisory Board since April 19, 2007Director of Civil Sciences Institution of the Faculty of Law, at the University of MiskolcLawyer
He graduated as lawyer at the Faculty of Law at the József Attila University of Sciences in 1978. From 1978 he worked at the Diósgyőri Gépgyár as legal advisor. Between 1982 and 1984 he was assistant and until 1993 adjunct. Between 1993-1999 he was professor, head of department. Since July 1, 1999, he is head of the Faculty of State and Law as well as head of department of the Faculty of Civil Law, at the University of Miskolc. Since 1989 he works as a lawyer, since 1997 he is the deputy chairman of the Bar of Borsod-Abaúj-Zemplén County.He is the member of TVK’s Audit Committee since April 19, 2007.
KEMÉNYNÉ ÚJVÁRI Ildikó (57)Member of the Supervisory Board since October 10, 1999Laboratory engineer in the Polymer Quality Control Department of of TVK PlcChemical engineer
Mrs. Kemény graduated as chemical engineer from the University of Light Industrial Technology in Kiev 1976. She joined the Pigment Plant of TVK in 1976. Worked at the LDPE plant between 1986 and 1995 and as senior quality controller in the QC department of the HDPE Business Unit starting 1995. She acted as engineer and unit manager at the PE laboratory of the Polymer Business Unit between 2001 and 2003. Mrs. Kemény has been working as laboratory engineer in the Quality Control Department of the Polymer Production since 2003
Supervisory Board
TVK annual report 2009152 153SuperVISory BoarD

Throughout the business year of 2009, TVK Plc’s Supervisory Board performed its activities in the form of regular board meetings. The Supervisory Board presents the General Assembly with its present business report, pertaining to the business year of 2009, based on the report of the Board of Directors (BOD), the independent auditor’s report and its continuous review of the operation of the cooperation.
According to the opinion of the Supervisory Board, the BOD’s 2009 operation and actions are in line with the laws, with TVK Plc’s statutes and bylaws. The Corporate information systems and bylaws ensure the transparency and continuous control of Corporate operations. During the operation of the Corporation each shareholder received equal treatment as required by law.
The Supervisory Board was kept informed by the BOD of the Corporation through the Chief Executive Officer and about the steps taken to implement its strategy. The crisis that became fully-fledged in the real sector during 2009 produced the worst results in the industry but the Company preserved its cash producing ability and maintained liquidity.
In the opinion of the Supervisory Board, the 2009 work of the BOD was successful.
The Supervisory Board recommends the General Assembly to accept TVK Plc’s 2009 annual report prepared according to the Hungarian Act on Bookkeeping with a balance sheet total of 195,310 million HUF and after-tax loss of 9,897 million HUF, as well as the TVK Group’s 2009 consolidated annual report with a balance sheet total of 211,404 million HUF and an after tax loss of 9,192 million HUF. The Supervisory Board approves the recommendation of the BOD regarding the utilisation of the 2009 results after tax.
The Supervisory Board supports the election of Ernst & Young Könyvvizsgáló Kft. as auditor for 2010 and the establishment of its remuneration.
The Supervisory Board supports the approval of discharge for the senior management.
The Supervisory Board approves the election of employee representative to the Supervisory Board and the establishment of its remuneration.
The Supervisory Board reviewed the recommendation of the Board of Directors concerning the amendment of the statutes, and recommends it for approval for the General Assembly.
The Supervisory Board recommends for approval the proposal on the policy and scheme of the long-term motivation system for the executives of the Company.
Gyurovszky László a felügyelő bizottság elnöke
Date of incorporation of TVK Plc.: December 31, 1991. Registered by the Borsod-Abaúj-Zemplén County Court of Justice acting as Court of Registration on 23 March 1992. with effect as of 31 December 1991. (Date of charter: December 31, 1991., initial date of operation: January 1, 1992)Legal predecessor: Tiszai Vegyi KombinátRegistration number: Cg. 05-10-000065
The Annual Ordinary General Meeting modified the effective Articles of Association on April 16, 2009. The Articles are available for inspection and may be ordered at the head office of the Company and is available for downloading at the Company web site (www.tvk.hu).
Capital issued: As of December 31, 2009 the capital of the Company included 24,290,843 ordinary shares with a face value of HUF 1,010, each. The capital of the Company upon foundation amounted to HUF 24,533,751,430.
The Registrar of the CompanyThe Board of Directors of the Company keeps the Share Register of registered shares and their holders. Issues related to TVK shares are handled by the Treasury Office of TVK, located at TVK’s registered office in Tiszaújváros: Tisza Chemical Group Public Limited Company Mailing Address: H-3581 Tiszaújváros, Pf. 20 Phone: +36 (1) 464-1163 Fax: +36 (1) 464-1335 E-mail: [email protected]
The Securities of the Company are Traded in the Following Foreign Markets
Market type City Date of listing Category
OTC organised London August, 1996 International Order Book
OTC not organised New York August, 1996 PORTAL
OTC not organised Frankfurt August, 1996 Freiverkehr
Ownership Structure as per the Share Register
Shareholder December 31, 2008 December 31, 2009
Interest (%)
Voting ratio (%)
Quantity (of shares)
Interest (%)
Voting ratio (%)
Quantity (of shares)
Domestic institution/company 88.63 88.63 21,530,125 88.44 88.44 21,484,808
Foreign institution/company 9.95 9.95 2,416,138 9.85 9.85 2,391,740
Domestic individual 1.40 1.40 339,587 1.67 1.67 406,187
Foreign individual 0.01 0.01 2,391 0.03 0.03 6,680
Employees, senior officers - - - - - -
Treasury shares - - - - - -
Shares held by unidentified parties 0.01 0.01 2,602 0.01 0.01 1,428
TOTAL 100 100 24,290,843 100.00 100.00 24,290,843
TVK Plc. has no treasury shares.
report by the Supervisory Boardon the regular annual General Meeting of TVK plc. of 15th april 2010
Corporate Information
TVK annual report 2009154 155CorporaTe InForMaTIon
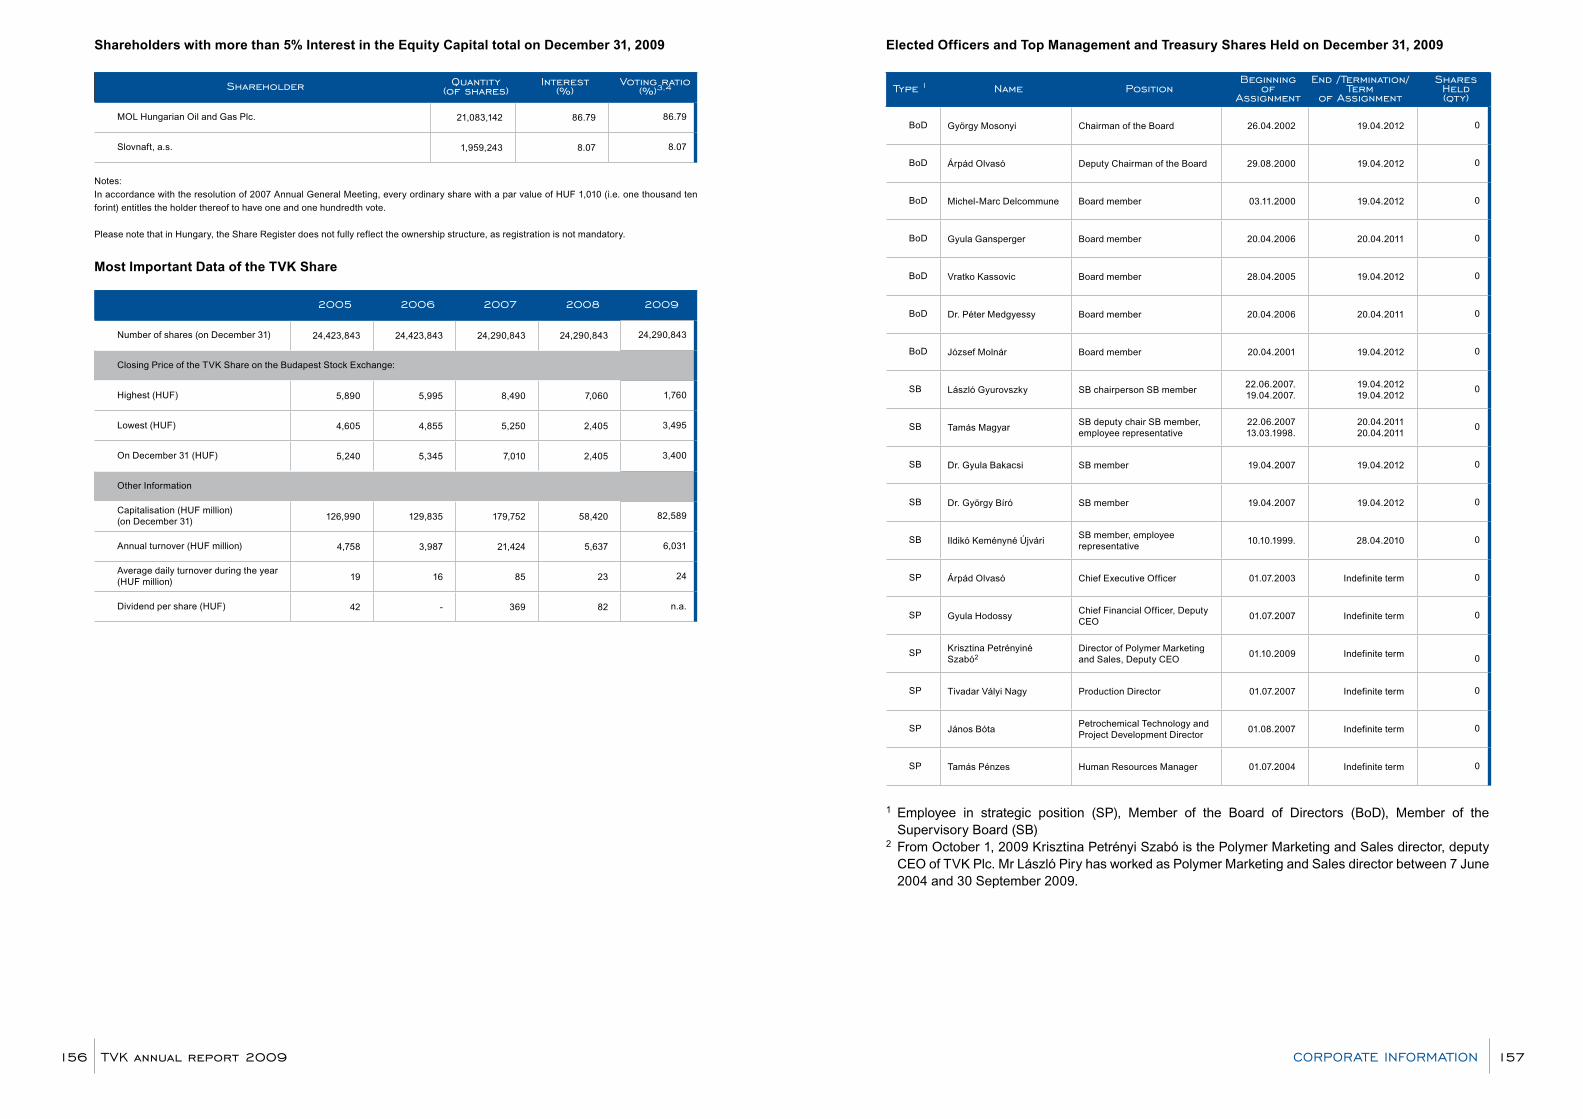
Shareholders with more than 5% Interest in the Equity Capital total on December 31, 2009
Shareholder Quantity (of shares)
Interest (%)
Voting ratio (%)3,4
MOL Hungarian Oil and Gas Plc. 21,083,142 86.79 86.79
Slovnaft, a.s. 1,959,243 8.07 8.07
Notes:
In accordance with the resolution of 2007 Annual General Meeting, every ordinary share with a par value of HUF 1,010 (i.e. one thousand ten
forint) entitles the holder thereof to have one and one hundredth vote.
Please note that in Hungary, the Share Register does not fully reflect the ownership structure, as registration is not mandatory.
Most Important Data of the TVK Share
2005 2006 2007 2008 2009
Number of shares (on December 31) 24,423,843 24,423,843 24,290,843 24,290,843 24,290,843
Closing Price of the TVK Share on the Budapest Stock Exchange:
Highest (HUF) 5,890 5,995 8,490 7,060 1,760
Lowest (HUF) 4,605 4,855 5,250 2,405 3,495
On December 31 (HUF) 5,240 5,345 7,010 2,405 3,400
Other Information
Capitalisation (HUF million) (on December 31) 126,990 129,835 179,752 58,420 82,589
Annual turnover (HUF million) 4,758 3,987 21,424 5,637 6,031
Average daily turnover during the year (HUF million) 19 16 85 23 24
Dividend per share (HUF) 42 - 369 82 n.a.
Elected Officers and Top Management and Treasury Shares Held on December 31, 2009
Type 1 name positionBeginning
of assignment
end /Termination/ Term
of assignment
Shares Held (qty)
BoD György Mosonyi Chairman of the Board 26.04.2002 19.04.2012 0
BoD Árpád Olvasó Deputy Chairman of the Board 29.08.2000 19.04.2012 0
BoD Michel-Marc Delcommune Board member 03.11.2000 19.04.2012 0
BoD Gyula Gansperger Board member 20.04.2006 20.04.2011 0
BoD Vratko Kassovic Board member 28.04.2005 19.04.2012 0
BoD Dr. Péter Medgyessy Board member 20.04.2006 20.04.2011 0
BoD József Molnár Board member 20.04.2001 19.04.2012 0
SB László Gyurovszky SB chairperson SB member22.06.2007. 19.04.2007.
19.04.201219.04.2012
0
SB Tamás Magyar SB deputy chair SB member, employee representative
22.06.2007 13.03.1998.
20.04.201120.04.2011
0
SB Dr. Gyula Bakacsi SB member 19.04.2007 19.04.2012 0
SB Dr. György Bíró SB member 19.04.2007 19.04.2012 0
SB Ildikó Keményné Újvári SB member, employee representative
10.10.1999. 28.04.2010 0
SP Árpád Olvasó Chief Executive Officer 01.07.2003 Indefinite term 0
SP Gyula Hodossy Chief Financial Officer, Deputy CEO
01.07.2007 Indefinite term 0
SP Krisztina Petrényiné Szabó2
Director of Polymer Marketing and Sales, Deputy CEO
01.10.2009 Indefinite term 0
SP Tivadar Vályi Nagy Production Director 01.07.2007 Indefinite term 0
SP János Bóta Petrochemical Technology and Project Development Director
01.08.2007 Indefinite term 0
SP Tamás Pénzes Human Resources Manager 01.07.2004 Indefinite term 0
1 Employee in strategic position (SP), Member of the Board of Directors (BoD), Member of the Supervisory Board (SB)
2 From October 1, 2009 Krisztina Petrényi Szabó is the Polymer Marketing and Sales director, deputy CEO of TVK Plc. Mr László Piry has worked as Polymer Marketing and Sales director between 7 June 2004 and 30 September 2009.
TVK annual report 2009156 157CorporaTe InForMaTIon

BAT (Best Available Techique)Application of the best practice in a certain area
HSEThe Health, Safety and Environmental Protection organization of TVK
EC number (European Chemical number: EINECS, ELINCS or NLP)An EU registration number assigned to chemical substances classified in the “European Inventory of Existing Commercial Chemical Substances Information System” (EINECS) before 1981 or in the “European List of Notified Chemical Substances” after 1981 or as “No Longer Polymers” (NLP, a special regulatory category of the EU
EBITDAEarnings before interest, taxes, depreciation and amortisation (the sum of operating profits and depreciation)
EMAS (Eco-Management and Audit Scheme)As a system of environmental management and certification in the European Union, EMAS offers voluntary participation.
EthyleneThe first member of the alkene homologous series, empirical formula: C2H4. There is double bond between the two carbon atoms.
ÉKÖVÍZIGNorthern Hungarian Environmental and Water Management Authority
ÉKTVFNorthern Hungarian Directorate of Environmental Protection, Nature Conservation and Water Management
Frequency of Intense ExposuresNumber of reported intense exposures per 1 million hours worked
GRIG (Global Reporting Initiative Guideline)A process that affects several stakeholders and an independent institution with the mission to develop and disseminate globally acceptable guidelines for sustainability reports.
HDPEHigh Density Polyethylene
HomopolymerPolymer constructed of identical monomers
IPPCIntegrated Pollution Prevention and Control
ISO 9001:2000A standard applicable to quality management systems. The part after the colon shows the date of publishing.
ISO 14001:2004The standard applicable to environmentally oriented management systems.
COD (chemical oxygen demand)A measure of the level of pollution in waste water, or the quantity of oxygen required for the chemical oxidation of the components of organic substances in a unit of waste water
CopolymerPolymer constructed of two or more different monomers
LDPELow Density Polyethylene
LTI (Lost Time Injury)Injuries leading to lost working hours
LTIF (Lost Time Injury Frequency)The number of incidents of lost time injury (LTI) per one million hours worked
MDPE (Medium Density Polyethylene)Medium Density Polyethylene
MonomerThe basic material of the process of polymerisation
TIPTechnical Intervention Plan
OlefinA member of the alkene homologous series with dual bond. Empirical formula CnH2n.
PE 100Bimodal HDPE pipe grade raw material. Gas and drinking water pipes made of bimodal HDPE have a useful life of minimum 50 years with circumferential stress at 10 MPa.
PolyethyleneA polymer made up of ethylene monomer, which may contain monomers other than ethylene known as comonomers.
PolymerA complexity of repeating units of organic or inorganic macromolecules
Glossary of Terms
TVK annual report 2009158 159GloSSary oF TerMS
PolypropyleneA polymer made up of propylene monomer, which may contain monomers other than propylene known as comonomers.
PropyleneThe second member of the alkene homologous series, empirical formula: C3H6. There is a single double bond between two carbon atoms.
PSMProcess Safety Management
REACH (Registration, Evaluation and Authorization of Chemicals))A new EU directive concerning the registration, evaluation and authorization of chemicals
SCMSupply chain management
TQM (Total Quality Management)Total Quality Management is a management method, philosophy and corporate practice, which uses available human and material resources at the highest level of efficiency to achieve corporate goals.
TRIPODA software based method of investigating the cause of accidents
TROIF (Total Reportable Occupational Illness Frequency)Total reportable occupational illness frequency per one million hours worked
Hazardous wastesWastes showing one or more of the features listed in Annex 2 of Act XLIII of 2000, or containing such substances or components and representing a health or environmental hazard because of origin, composition or concentration.
VOC Organic compounds volatile at room temperature, hydrocarbons
Head OfficeTisza Chemical Group Public Limited Company (TVK Plc.)Registered office: 3581 Tiszaújváros, TVK-Ipartelep, TVK Head Office, Lot number 2119/3 Building 136, HungaryMailing address: H-3581 Tiszaújváros, P.O.Box 20, HungaryCentral phone: +36 49/522-222Central fax: +36 49/521-322E-mail: [email protected]: www.tvk.hu
For Disclosures to Investors, Annual Reports, Flash Reports, Financial Figures ContactTisza Chemical Group Public Limited Company (TVK Plc.)H-3581 Tiszaújváros, P.O.Box 20, HungaryPhone: +36 1/464-1163Fax: +36 1/464-1335E-mail: [email protected]
For Information on Shares, Share Administration, Share Registration ContactTisza Chemical Group Public Limited Company (TVK Plc.)H-3581 Tiszaújváros, P.O.Box 20, HungaryPhone: +36 49/522-377Fax: +36 49/521-903E-mail: [email protected]
For Information on Trading the Shares, ContactBudapest Stock Exchange Ltd.H-1062 Budapest, Andrássy út 93.Phone: +36 1/429-6636Fax: +36 1/429-6654
GDR Information The Bank of New YorkDepositary Receipts Division101 Barclay Street, 22nd floorNew York, NY 10286, USATel: +1 212-815-2293Fax: +1 212-571-3050
Place of Publishing AnnouncementIn the context of the regulations on public limited companies, the Company shall publish its announcements at the places stipulated by the law and the stock exchange regulations, whereas the announcement stipulated by law in connection with the operation of the Company shall be published on the website of the Company (www.tvk.hu) on one occasion. Disclosure places:- the website of TVK at /www.tvk.hu/, - the website of the Budapest Stock Exchange at /www.bet.hu/ and- the website of the London Stock Exchange at /www.londonstockexchange.com/- the website of Capital Market Disclosures, operated by PSZÁF at /www.kozzetetelek.hu/.
Shareholder Information
TVK annual report 2009160 161SHareHolDer InForMaTIon
to be attached to the 2009 annual report of Tisza Chemical Group public limited Company
We the undersigned representatives of Tisza Chemical Group Public Limited Company (TVK Plc., Company), the issuer of TVK ordinary shares hereby declare that TVK Plc. takes full responsibility for the announced Annual Report of the Company for the year ended on 31 December 2009, which has been prepared to the best of our knowledge in accordance with International Financial Reporting Standards as endorsed by the European Union, and give a true and fair view of the assets, liabilities, financial position, and profit of TVK Plc. and its subsidiaries and presents a fair review of the position, development and performance of TVK Plc. and its subsidiaries together with a description of principal risks and uncertainties.
Tiszaújváros, April 15, 2010
Árpád Olvasó Gyula Hodossy Chief Executive Officer Deputy CEO Chief Financial Officer
Please print, fill in and return to our address the following questionnaire.
Thank you for helping us to improve the content and aesthetic quality of future reports with your observations and recommendations.
Attention: Gábor PálffyAddress: TVK Nyrt. 3581 Tiszaújváros, Pf. 20 Telephone: +36 49 522-917 • Fax: +36 49 521-018
From Company: Telephone: Fax: Date:
1. My ideas and recommendations concerning the report: 2. I think the report and the information it contains cover the issues related to sustainable development:
yes, completely yes, mostly yes, in general no, hardly no, no coverage at all
3. I think the content of the report is: excellent acceptable average poorer than average unacceptable
4. I think the layout and editing of the report is: excellent acceptable average poorer than average unacceptable
5. I found the following parts especially interesting: introduction of the company our business management system environmental ratios labour safety ratios fire safety ratios human relations other:
6. I think this report would be more valuable if it included the following topics:
7. Please let us know which stakeholder group you belong to: employee authority financial analyst scientific organisation NGO company business partner shareholder other:
Aláírás
Statement of responsibility Questionnaire
TVK annual report 2009162 163QueSTIonnaIre