Embed Size (px)
Citation preview

2009 A N N U A L R E P O R T
N o L i m i t s > >

NEtoP
CommunicationNetop Live GuideNetop Live Banner
NEtoP
EducationNetop SchoolNetop VisionNetop PointerNetop Learning Center
NEtoP
AdministrationNetop Remote ControlNetop OnDemandNetop Mobile and EmbeddedNetop ProtectOn ProNetop PrintLimit Pro
NETOP SOLUTiONS A/S AT A gLANcE
Netop develops and sells software solutions enabling swift, stable and secure transfer of video,
screen images, sound and data over the Internet. The company has three core business areas:
Administration, Education and Communication.
Netop’s unique and cost-effective Administration solutions make work easier for IT professionals
through Remote Control and IT Asset Management. Netop’s market-leading Education solutions
for classroom management and corporate e-learning help students and teachers achieve optimum
results through virtual teaching. Netop’s Communication solutions allow customers, business part-
ners and colleagues to meet easily and safely in virtual space through chat, video or voice over
the Internet.
At 31 December 2009, Netop had 142 employees and subsidiaries in the USA, the UK, Romania and
Switzerland. The company sells its solutions to public and private sector customers in more than
80 countries. Netop Solutions A/S is listed on NASDAQ OMX Copenhagen. Netop generated reve-
nue of DKK 85.3m in 2009. For more information, go to www.netop.com.
2 NETOP SOLUTiONS A/S – AT A gLANcE

Kurt Groth Bager, CEO
CONTENT
To our shareholders . . . . . . . . . . . . . . . . . . . . . . . . . . . . 4
Highlight . . . . . . . . . . . . . . . . . . . . . . . . . . . . . . . . . . . . . . . . 5
Financial highlights . . . . . . . . . . . . . . . . . . . . . . . . . . . . . . 7
Management’s report . . . . . . . . . . . . . . . . . . . . . . . . . . 8
Know-how and competencie . . . . . . . . . . . . . . . . . . . 16
CSR . . . . . . . . . . . . . . . . . . . . . . . . . . . . . . . . . . . . . . . . . . . . . 17
Shareholder information . . . . . . . . . . . . . . . . . . . . . . 18
Risk factors . . . . . . . . . . . . . . . . . . . . . . . . . . . . . . . . . . . . 20
Accounting policies . . . . . . . . . . . . . . . . . . . . . . . . . . . 24
Responsibility statements . . . . . . . . . . . . . . . . . . . . . 28
Board of Directors and Management . . . . . . . . . 30
Group overview . . . . . . . . . . . . . . . . . . . . . . . . . . . . . . . 32
Consolidated Accounts . . . . . . . . . . . . . . . . . . . . . . . 33
Notes to the Consolidated Accounts . . . . . . . . . 40
Annual Accounts for Netop Solutions A/S . . . . 83
Notes to the annual Accounts
for Netop Solutions A/S . . . . . . . . . . . . . . . . . . . . . . 89
Kurt Groth Bager,
CEO
Kent Madsen,
CTO
Claus Finderup Grove,
CFO
Translation: The English version is not audited. In the event of any inconsistency between this document and the Danish language version, the Danish language version shall be the governing version.
3cONTENT
The effects of the global economic crisis hit us full strength
in 2009. After we had performed in line with our expecta-
tions in the first quarter, the economic crisis took a severe
toll on our core markets in the USA and northern Europe.
The drop in IT investments in both the business and the
public sectors was worse than expected. In the USA, the
financial support expected for the educational sector did
not materialise, which had a negative impact on the Edu-
cation market.
The anticipated growth in our revenue, and in our earnings,
failed to materialise, forcing the Board to focus even more
on the company’s cash and working capital position.
The acquisition of Genevalogic in 2008 strengthened both
our Education business and Netop Solutions’ overall pro-
duct portfolio by a substantial margin and we consider this
to be a strategically correct and important move for Netop
Solutions. The timing was certainly not perfect given the
financial crisis that followed, but going forward, we have
very strong expectations for the Education market, and we
expect market conditions to improve during 2010 as the
crisis wears off.
We also see the distributor agreement signed with Media-
net Innovations in 2008 as strategically correct for Netop
Solutions, both then and now. This became a point of entry
to a strategically important business area that is a good
match for the Netop Solutions product portfolio, and this
is a market that is expected to grow substantially over the
next few years. We did not succeed in penetrating the mar-
ket at the speed we had originally intended, so in the se-
cond half of 2009, we decided to terminate the agreement
with Medianet. Going forward, we intend to market only
the product Live Guide, which is based on our proprietary
software in the Communication business area and ties in
very well with our strategy to focus more on online ser-
vices and Software-as-a-Service products. Accordingly, we
continue to regard this as a strategic business area that
offers a substantial potential.
Among the steps we took to address the challenges our
company is facing, we adapted our cost base in 2009, redu-
cing our budgeted costs for 2010 by 50% relative to 2008.
The changes implemented during 2009 have resulted in a
realignment of Netop Solutions’ Danish organisation. We
also consolidated the company’s development activities in
our R&D centre in Romania, thereby building a very flexible
and scalable development organisation that positions us
better relative to the competition.
Looking ahead, it is essential that we create a stable and
sustainable platform for Netop Solutions. One of the means
of achieving that will be to devote even more attention to
our core business. So far, we have made adjustments both
to our organisation and our product portfolio, so that we
can concentrate even more on the product areas that are
making money for our business and that will help Netop
Solutions turn a profit in 2010. Our hopes for a profit are
anchored in our dedication to our core business compe-
tencies and in our intention, as per our business strategy,
to refocus parts of the business during 2010 towards more
online sales, which we believe offer a substantial potential.
This will give us access to a larger market, our sales pro-
cesses will become more efficient and we can concentrate
our sales resources on Enterprise Customers (our largest
customers within the various regions) and major business
partners.
I would like to extend a sincere thank you to all employees
of Netop Solutions for their great efforts during 2009. Fi-
nally, I wish to thank our shareholders, business partners
and customers for their support and collaboration during
a challenging year.
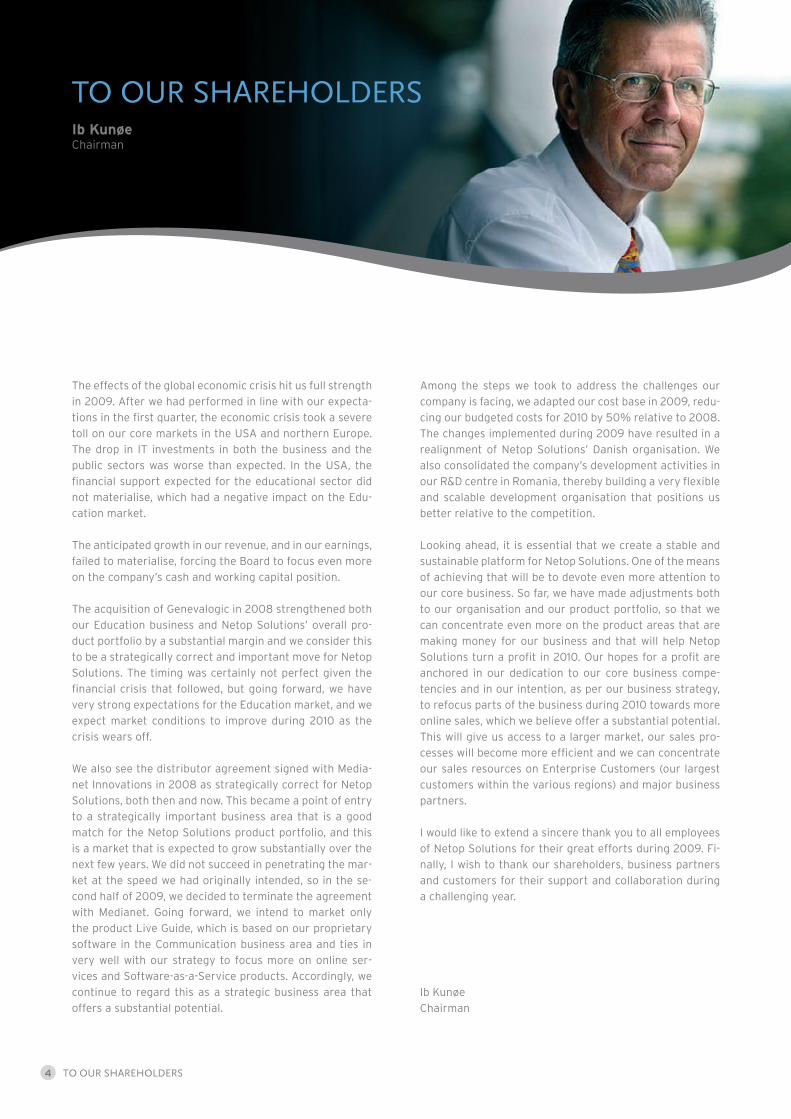
Ib Kunøe
Chairman
TO OUR ShAREhOLdERSIb KunøeChairman
4 TO OUR ShAREhOLdERS

highLighTS
The year 2009 was a difficult and challenging period
for Netop Solutions, as the company felt the effects of
the global economic crisis and management adjusted
operations during the year to reflect the changed mar-
ket conditions.
Netop Solutions A/S generated revenue of DKK 85.3m
in 2009, down 7% from DKK 91.4m in 2008. Revenue
was lower than anticipated at the beginning of 2009,
and the revenue decline was attributable to the general
slowdown experienced in all of the company’s markets
in 2009.
EBITDA was a loss of DKK 34.5m in 2009, which was
2% lower than the EBITDA loss of DKK 33.9m in 2008.
EBIT was a loss of DKK 67.4m in 2009 against a a loss
of DKK 45.1m in 2008.
Netop Solutions continued the efforts to optimise costs
and enhance cash flows in 2009. The company’s total
operating costs were DKK 119m, against DKK 125m in
2008. The actual cost reduction was greater than the
figure indicates, as costs relating to Medianet and Ge-
nevaLogic were only included for six months of 2008
but for 12 months of 2009.
Netop Solutions consolidated its development resourc-
es during the first half of 2009, merging and relocat-
ing a total of seven locations to two, one in Romania
and one in the Philippines. Through the consolidation,
the company has achieved much greater flexibility and
scalability in its development processes, as well as sig-
nificant cost savings.
In the second half of the year, the company worked on
developing a new, improved product strategy to focus
much more on profitable products and on products that
can be sold online or as a service on the Internet.
The partnership agreement between Netop Solutions
and Medianet was terminated with effect from the
end of 2009, and the companies withdrew from all
agreements existing between them. Netop Solutions
launched its proprietary communication solution, Ne-
top Live Guide, which facilitates personal communica-
tion via Internet sites with chat, audio and video. Going
forward, Live Guide will make up the core of the Com-
munication business area.
0
20
40
60
80
100
2004 2005 2006 2007 2008 2009
2004 2005 2006 2007 2008 2009-100
-75
-50
-25
0
25
50
0
20
40
60
80
100
2004 2005 2006 2007 2008 2009
2004 2005 2006 2007 2008 2009-100
-75
-50
-25
0
25
50
2004 2005 2006 2007 2008 2009-100
-75
-50
-25
0
25
50
2004 2005 2006 2007 2008 2009-100
-75
-50
-25
0
25
50
2004 2005 2006 2007 2008 2009-100
-75
-50
-25
0
25
50
Net revenue, DKKm
Profit before tax, DKKm
Operating profit, DKKm
Operating margin (EBIT-margin), %
5highLighTS


Financial highlights and ratios for the Netop group
DKK '000 2009 2008 2007 2006 2005
HIGHLIGHTSIncome statementRevenue 85,287 91,485 85,303 97,861 91,288
Gross profit 84,602 90,985 84,835 97,022 90,688 Operatin profit before depriciation and amortisering(EBITDA) (34,524) (33,896) (20,587) 7,086 21,553
Operating profit/(loss) (EBIT) (67,399) (45,084) (32,006) 1,101 18,288
Profit/(loss) of financial items (474) (8,032) 1,147 1,015 2,936
Profit/(loss) before tax (67,873) (53,116) (30,859) 2,116 21,224
Profit/(loss) for the year (82,539) (48,746) (31,734) 670 14,645
Balance sheetNon-current assets 75,902 108,653 68,650 78,772 51,902
Current assets 22,220 73,752 114,441 147,962 171,885
Balance sheet total 98,121 182,405 183,091 226,734 223,787
Assets excl. cash 93,274 134,259 98,977 113,560 70,026
Share capital 21,046 21,046 19,252 19,252 19,252
Equity 63,870 145,923 167,742 208,972 208,030
Non-current liabilities 6,017 15,259 0 2,163 3,497
Current liabilities 34,251 36,482 15,349 15,599 12,260
Cash flow statementCash flow from operating activities (29,348) (36,248) (16,968) (6,057) (17,476)
Cash flow from investing activities (5,499) 8,854 (2,569) (34,382) (8,838)
of which investments in property, plant an equipment (528) (1,004) (1,040) (3,406) (2,676)
Cash flows from financing activities (440) (4,141) (9,523) (148) (18,914)
Change in cash at bank and in hand (43,425) (35,968) (29,060) (40,587) (10,276)
RATIOS
Financial ratios1)
EBITDA margin (%) (40) (37) (24) 7 24
EBIT margin (%) (79) (49) (38) 1 20
Solvency ratio (%) 65 80 92 92 93
Return on equity (%) (79) (31) (17) 0 7
Share ratios1)
Earnings per share (20.2) (12.3) (8.4) 0.2 3.9
Diluted earnings per share, EPS-D (DKK) (20.2) (12.3) (8.4) 0.2 3.8
Net asset value per share (DKK) 15.2 34.7 43.8 54.3 54.0
Price earnings ratio 0.5 1.0 1.7 2.2 2.2
P / E-value (0.4) (2.8) (8.7) 587.5 30.8
Cash flow from operating activities per share (7.0) (8.6) (4.4) (1.6) (4.5)
Dividend per share 0.0 0.0 0.0 2.5 0.0
Payout ratio (%) 0.0 0.0 0.0 2.5 0.0
Share price 31 December 7.8 35.0 73.0 117.5 120.0
Average number of shares (1,000 of DKK 5 each) 4,209 4,209 3,850 3,850 3,850 Number of shares at the end of the year (1,000 of DKK 5 each) 4,209 4,030 3,850 3,850 3,850
Ratios relating to staffAverage no. of employees 150 138 84 72 55
Resultat og udvandet resultat pr. aktie er beregnet i overensstemmelse med IAS 33 (note 13). Øvrige nøgletal er beregnet efte r Finansanalytikerforeningens "Anbefalinger & Nøgletal 2005". Der henvises til nøgletalsdefinitioner i anvendt regnskabspraksis note 1.
7FiNANciAL highLighTS

2009 was a challenging and difficult year marked by the glo-
bal economic crisis. A number of our business partners and
customers suffered a negative impact, as many businesses,
schools, organisations and public authorities scaled down
their IT investments. Against this background, we failed to
achieve our original profit target for 2009 and as a result
Management found it necessary during the year to align the
organisation and our cost base to the prevailing financial si-
tuation.
Revenue and profit were in line with expectations after the
first three months of the year, but in the following quarters,
Netop Solutions encountered a reduced propensity to invest
among the company’s current and potential customers as
well as generally deteriorating market conditions. Some of
our key geographical markets, including the USA, the UK
and to some extent Germany, were among the countries that
were hit particularly hard by the crisis. However, Manage-
ment believes that the company did not lose market share
during 2009, but that market conditions have generally ren-
dered the sale of new licenses considerably more difficult
than previously anticipated.
A number of initiatives were implemented for the purpose
of enhancing our competitive strength. In late 2008 and
early 2009, we implemented a revised sales strategy of ma-
king direct sales to our largest corporate customers and this
approach has since yielded good results. Also, we have re-
mained focused on the very important distributor and busi-
ness partner channel that Netop Solutions has built up over
the last many years. Through this sales channel, our busi-
ness partners and distributors address the SMB (small and
medium-sized businesses) and Corporate markets and Netop
Solutions provides customer support through its sales and
technical know-how.
It is a key aspect of our future sales strategy that more and
more of our sales will consist of web-based Software as a Ser-
vice (SaaS). This will extend our sales contacts, especially to
the SMB and Corporate segments. Management expects that,
as products are primed for SaaS, the company will generate a
growing part of its revenue from these product segments from
2011 onwards. Most of the groundwork involving products and
procedures was completed in 2009, and in the fourth quarter
of the year Netop Solutions launched the product Netop My-
Vision, which is exclusively available on the Internet.
The relocation of Netop Solutions’ R&D departments to Ro-
mania was completed in 2009. The move has lifted our pro-
duct development capacity by a substantial margin, while
also reducing our costs considerably. Finally, consolidating
our product lines and optimising our processes and work
flows reduced our costs by almost 50%.
Based on the most recent changes made in terms of the or-
ganisation, business and products, which we expect to have
fully implemented during the first and second quarters of
2010, combined with a focused business plan and a go-to-
market strategy, Netop Solutions expects to generate reve-
nue in line with the 2009 figure, a small EBITDA profit and
positive cash flows for 2010.
Considering the loss and the substantial cash outflow of 2009,
the Board of Directors and the Management Board monitor
the company’s cash position very closely. In that connection,
it should be noted that Netop Solutions has no interest-bea-
ring debt, which is considered to be a very positive point for
the company. Capital resources, however, are at a level that
could jeopardise the company’s plans, and therefore, Netop
Solutions’ largest shareholder, Consolidated Holdings Group,
has stated that it will assist in the procurement, if additio-
nal capital to the company, should this become necessary in
2010.
HIGHLIGHTS AND NEW INITIATIVES IN 2009
Consolidating development and support resources
During the first and second quarters of 2009, Netop Solu-
tions consolidated the company’s R&D resources, merging
and relocating the former seven locations into a single unit
in Romania. Also, selected development activities in the
Philippines were outsourced to an overseas development
centre (ODC). Finally, the development resources that were
previously outsourced to an ODC in Russia were sourced in
to our development centre in Romania in 2009. The in- and
outsourcing of the company’s development activities pro-
gressed as planned, and Netop Solutions has now gained
greater flexibility and scalability in its development proces-
ses, reduced product time-to-market and cut the company’s
costs considerably.
MANAgEMENT’S REviEw
8 MANAgEMENT’S REviEw

In addition, the Netop Solution support function has been
centralised and adapted to the longer opening hours and
geographical changes, and a new web-based approach to
handling global telephone queues and integrated telephone
support has improved our customer service and reduced re-
lated costs substantially.
Integration of GenevaLogic continues
In 2008, Netop Solutions acquired GenevaLogic and that
company’s distribution channel, product portfolio and or-
ganisation. The process of integrating GenevaLogic and its
CRM and financial systems was completed in the first half of
2009. During 2009, Netop Solutions promoted the acquired
products under the GenevaLogic brand, while also working to
integrate the Education products into a single product suite.
We expect to launch the new integrated product at the end
of 2010.
Enhanced product strategy
During the second half of 2009, Netop Solutions worked on a
new, improved product strategy involving a smaller number
of products and weeding out minor, unprofitable products. As
a result, from the onset of 2010, Netop Solutions pursues a
more profitable product strategy and is maintaining a stron-
ger focus on selected quality products.
Adjusting the organisation and cost base
In order to put Netop Solutions in a position to generate a
profit in 2010 under what will presumably continue to be
difficult market conditions, the Board of Directors and the
Management Board resolved in 2009 to make further adjust-
ments to the company’s cost structure and organisation. The
resulting changes and cut-backs involved both the product
portfolio and geographical locations.
These initiatives have enabled Netop Solutions to cut its cost
base by an additional 25% relative to expectations and led
the company to reduce its overall headcount by about 20%
and close the office in China. The effects of these changes are
not expected to feed through until the second half of 2010.
Partnership with Medianet Innovations terminated
The partnership agreement between Netop Solutions and Me-
dianet Innovations was terminated with effect from the end
of 2009, and the companies withdrew from all agreements
existing between them. At the same time, Netop Solutions
launched its proprietary communication solution, Netop Live
Guide, which facilitates personal communication via the In-
ternet sites with chat, audio and video. Netop Live Guide will
come to be the core of the Communication business area, and
it remains a strategic focus area for Netop Solutions. Netop
Live Guide is believed to have a considerable sales potential,
as more and more sales and business is being conducted on
the Internet and as “click to chat” and “click to speak” ser-
vices on corporate websites are becoming increasingly po-
pular with the growing volumes of online visitors. When the
agreement was terminated, Medianet Innovations took over
the six employees based at the Danish office as well as the
company’s office facilities in Slagelse, Denmark.
SALES AND MARKETING
We made a dedicated effort in 2009 to place and position
Netop Solution products and solutions in the best possi-
ble way and to ensure that all products and solutions were
adapted to the various markets of the company’s geographi-
cal areas and segments. The intention was to ensure that we
will be better positioned than the competition once the glo-
bal recession begins to fade and investment in IT returns to
normal levels.
We moved closer to our end customers during 2009, making
geographical changes to the organisation and getting a bet-
ter knowledge of our markets, our customers and their needs.
This truly lifted our work of preparing the company’s business
plan, which, in 2010, is even more aligned to our customers’
needs than it has been in previous years. Key accounts have
had access to a local business partner in their respective
countries and they have increased their awareness of Netop
Solutions including our sales and support functions.
Going forward, we will mainly cover the SMB and Corporate
markets through our business partner channels and when
they serve our Corporate customers our business partners
will be able to draw on the expertise of Netop Solutions’
presales and channel sales staff, who will also be available
to attend customer meetings. The current strategy at En-
terprise level will continue. It involves that we identify and
serve the largest customers in selected geographical areas
and segments through our in-house sales organisation, with
due consideration for our valuable business partners and di-
stributors and with a view to providing coordinated services
to all customers.
One of the purposes of our forward-looking business strategy
is to steer the Netop Solutions business towards more online
sales in 2010. Netop Solutions products and the overall brand
are believed to have a very big potential in this respect. Ac-
cordingly, in addition to traditional sales through business
partners, Netop Solutions’ services and solutions will also be
sold through our online shop at www.netop.com, and Manage-
ment expects that within the next two years, Netop Solutions
will be generating a larger part of its revenue through online
sales. In 2009, Netop MyVision became the first product to
be sold via the company’s web site. Other products will follow
during 2010, one of them being Netop Live Guide, which is
expected to be available in the second quarter of the year.
9MANAgEMENT’S REviEw

ADMINISTRATION
Activities
Netop Solutions marketed the following three products in the
Administration business area in 2009: Netop Remote Con-
trol, Netop OnDemand and Netop ProtectOn Pro.
Netop Solutions’ Remote Control is an advanced solution
creating big value for our customers. Consequently, we try
to differentiate our products from the other remote control
products in the market by becoming better at communica-
ting how Netop Solutions products can create value for our
customers.
A number of Netop Solutions’ existing customers are large
local or global businesses which consider Netop Remote Con-
trol to an important tool for their business and mission. Many
of these customers benefit from Netop Solutions’ remote con-
trol modules, including Netop Security Server, Netop Name
Server and Netop Gateway, all providing a powerful, fast and
secure connection. The modules also include advanced sup-
port tools used to access all types of devices in a company’s
network and behind their firewalls. The flexibility provided
by Netop Solutions in the support for multiple platforms and
communication protocols makes our solutions even more at-
tractive and unique.
We are committed to retaining these competitive advantages
and aim to position Netop Solutions Remote Control as the
preferred solution among large corporations with multiple
locations, providing a high level of service (24/7 support) as
well as possible cost savings. That is why we have organised
our software development activities to achieve swift and effi-
cient implementation of new and improved functionality that
meets the Enterprise segment’s needs for reliable software
that supports our customers’ mission and business.
Netop OnDemand adds further value to companies by facili-
tating remote support to unknown devices. This can be used
by customers and employees not connected to a company’s
network and needing to install a temporary host to enable
the Support or the IT department to take over a device lo-
cated outside the company’s network.
Launched in May 2009, Netop ProtectOn Pro enables users
to protect data and achieve system security on network de-
vices. This tool helps to block out the use of CD-drives, USB
keys or wifi equipment and restrict access to certain Internet
sites. Also, it can fully or partly block specific users from ac-
cessing folders or hard disk content.
With many features for communication and collaboration Netop Remote Control is the ideal tool for support and Helpdesk environments.Pc MAgAziNE (gERMANy)
“
AdMiNiSTRATiON
10 MANAgEMENT’S REviEw

Markets and competition
According to IDC, the market for traditional remote control
products is stagnant and estimated at USD 225 million. Netop
Solutions holds less than a 5% share of this market. Netop
Remote Control is still considered to be the best and most
comprehensive remote control tool on the market, and Net-
op Solutions continues to win industry magazine technology
and “best choice” awards.
Their individual needs for maintaining in-house IT security
policies and for providing more competitive service level ag-
reements (SLAs) by way of faster trouble-shooting and pro-
blem solving drive companies to continue to look for efficient
and reliable remote control tools. Also, there is a growing
need for optimising costs, centralising IT, restructuring, out-
sourcing and global expansion, with remote control being a
key parameter for success in many cases.
The mobile labour force has grown substantially in recent ye-
ars. According to Forrester Consulting, businesses in North
America and Europe expect that 73% of their employees will
to some extent be mobile by 2012. These expectations sug-
gest future growth in clientless, Internet-based remote sup-
port.
(Sources: Forrester: Supporting mobile and remote workers, 2009, IDC:
Worldwide clientless remote support software, 2008)
Upcoming challenges
As the provider of the best remote control solution in the
market, Netop Solutions faces two challenges: One is to in-
crease the awareness of the Netop Remote Control solution
in the Enterprise segment. The other is to make Netop OnDe-
mand accessible, also online.
We successfully launched and sold Netop Remote Control
to a number of major companies in 2009, including in the
United States. It is essential for the success of our company
in 2010 that we continue to pursue our sales strategy and
allocate the resources and skills needed to sell technical pro-
ducts to major corporations, and to implement the necessary
sales programmes.
It is also important that Netop Solutions continues to provide
quality products on time and in tune with specific customer
needs. This is where we can create value and differentiate
our company from the competition. We aim for our marke-
ting efforts to increase the awareness of Netop Remote Con-
trol, although the major challenge to be addressed lies in the
sales channel and in our response time to specific requests
and demands for functionality.
NEtoP
Administration• Netop Remote Control• Netop OnDemand• Netop Mobile and Embedded• Netop ProtectOn Pro• Netop PrintLimit Pro
“Let me fix it.i’ll take over your
computer.”
IT InfrastructureMillions of problems solved remotely, Millions saved in time and money.
MobilityTake any device, Take it anywhere, Take full control.
Control & ComplianceTake stock of your it assets, Reduce cost, Improve productivity, Stay license compliant.
11MANAgEMENT’S REviEw
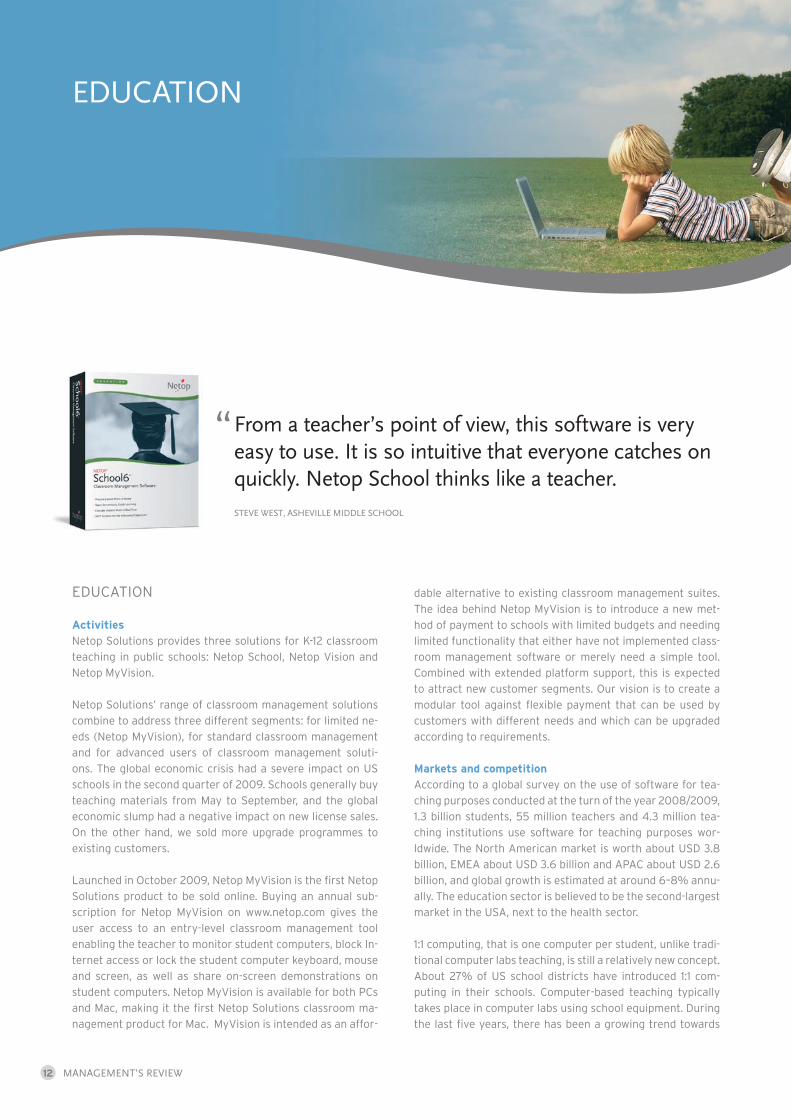
EDUCATION
Activities
Netop Solutions provides three solutions for K-12 classroom
teaching in public schools: Netop School, Netop Vision and
Netop MyVision.
Netop Solutions’ range of classroom management solutions
combine to address three different segments: for limited ne-
eds (Netop MyVision), for standard classroom management
and for advanced users of classroom management soluti-
ons. The global economic crisis had a severe impact on US
schools in the second quarter of 2009. Schools generally buy
teaching materials from May to September, and the global
economic slump had a negative impact on new license sales.
On the other hand, we sold more upgrade programmes to
existing customers.
Launched in October 2009, Netop MyVision is the first Netop
Solutions product to be sold online. Buying an annual sub-
scription for Netop MyVision on www.netop.com gives the
user access to an entry-level classroom management tool
enabling the teacher to monitor student computers, block In-
ternet access or lock the student computer keyboard, mouse
and screen, as well as share on-screen demonstrations on
student computers. Netop MyVision is available for both PCs
and Mac, making it the first Netop Solutions classroom ma-
nagement product for Mac. MyVision is intended as an affor-
dable alternative to existing classroom management suites.
The idea behind Netop MyVision is to introduce a new met-
hod of payment to schools with limited budgets and needing
limited functionality that either have not implemented class-
room management software or merely need a simple tool.
Combined with extended platform support, this is expected
to attract new customer segments. Our vision is to create a
modular tool against flexible payment that can be used by
customers with different needs and which can be upgraded
according to requirements.
Markets and competition
According to a global survey on the use of software for tea-
ching purposes conducted at the turn of the year 2008/2009,
1.3 billion students, 55 million teachers and 4.3 million tea-
ching institutions use software for teaching purposes wor-
ldwide. The North American market is worth about USD 3.8
billion, EMEA about USD 3.6 billion and APAC about USD 2.6
billion, and global growth is estimated at around 6–8% annu-
ally. The education sector is believed to be the second-largest
market in the USA, next to the health sector.
1:1 computing, that is one computer per student, unlike tradi-
tional computer labs teaching, is still a relatively new concept.
About 27% of US school districts have introduced 1:1 com-
puting in their schools. Computer-based teaching typically
takes place in computer labs using school equipment. During
the last five years, there has been a growing trend towards
From a teacher’s point of view, this software is very easy to use. it is so intuitive that everyone catches on quickly. Netop school thinks like a teacher.STEvE wEST, AShEviLLE MiddLE SchOOL
“
EdUcATiON
12 MANAgEMENT’S REviEw

installing interactive whiteboards in classrooms. Interactive
whiteboards and substantially greater bandwidth at schools
will make computer-based teaching even more common.
The global market for classroom management software is
estimated at around USD 100 million, and we estimate that
Netop Solutions has about a 10% market share. This market
is expected to continue to grow as interactive whiteboards
become standard equipment in schools and as 1:1 computing
becomes more and more widespread.
Upcoming challenges
Netop Solutions aims to provide unrivalled classroom manage-
ment products that enable teachers to provide the required
computer-based teaching and support student learning. We
must also monitor developments within new platforms and
devices, such as laptops, mobile devices and interactive
whiteboards, as they gain popularity in classrooms. Finally,
we must ensure that our products interact with such devices
and that their pre-installed software does not replace Netop
Solutions products. In order to generate growth, we intend
to develop market-leading classroom management software
offering full functionality to today’s teachers already using
IT in their everyday teaching. At the same time, we will be
focused on Internet-based classroom management that can
be provided as Software-as-a-Service with the emphasis on
both control and interaction between computers and other
devices not necessarily hooked up to the same network.
We also want to dedicate the development of Netop MyVision
towards fulfilling several of the unmet needs currently found
in the market. That would differentiate our product from the
competition. Accordingly, time to market is a very essential
factor that will enable us to target our sales to the European
markets, institutions of higher education in the USA as well
as businesses. Differentiation will give Netop Solutions the
opportunity to expand in the global market.
NEtoP
Education• Netop School• Netop Vision• Netop Pointer• Netop Learning Center
“Let me help you.i’ll share
my screen.”
Classroom Management SolutionsWith more than 20 years of international, educational software expertise.
Deliver Training and Education AnywhereVirtual learning environments, It administration for educational Institutions.
Corporate TrainingBest in class e-learning system, train your employees effectively with Netop education solutions.
13MANAgEMENT’S REviEw
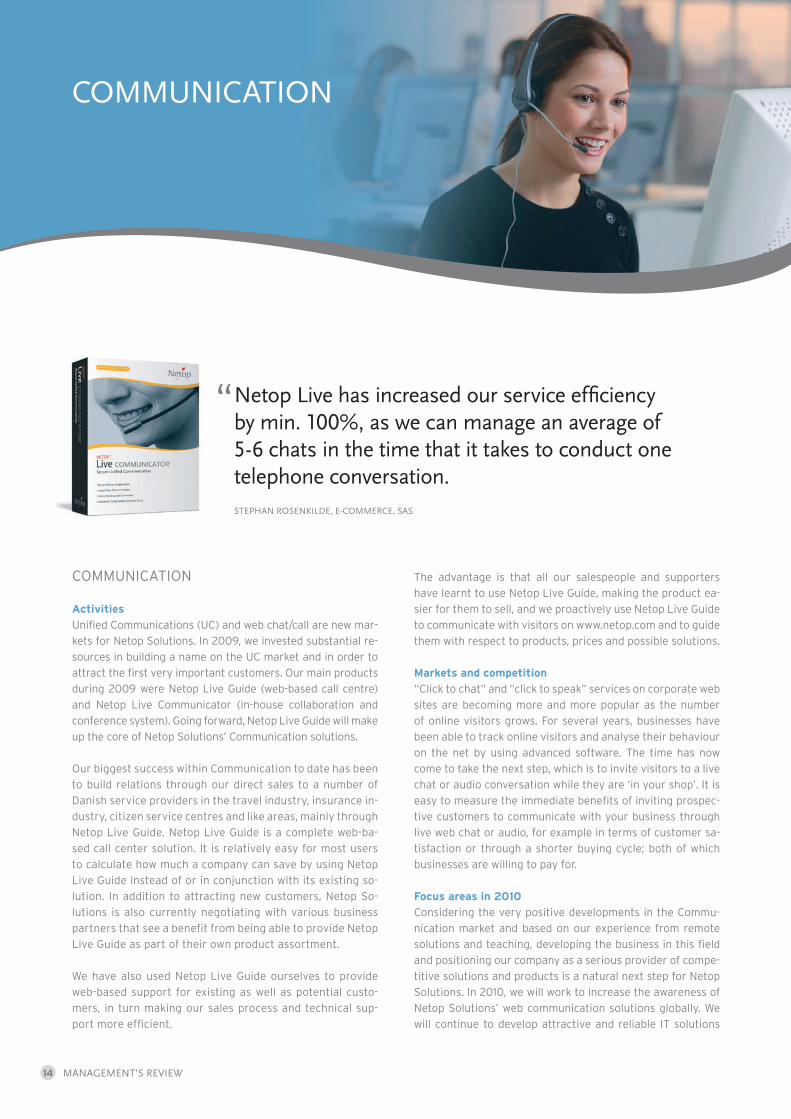
COMMUNICATION
Activities
Unified Communications (UC) and web chat/call are new mar-
kets for Netop Solutions. In 2009, we invested substantial re-
sources in building a name on the UC market and in order to
attract the first very important customers. Our main products
during 2009 were Netop Live Guide (web-based call centre)
and Netop Live Communicator (in-house collaboration and
conference system). Going forward, Netop Live Guide will make
up the core of Netop Solutions’ Communication solutions.
Our biggest success within Communication to date has been
to build relations through our direct sales to a number of
Danish service providers in the travel industry, insurance in-
dustry, citizen service centres and like areas, mainly through
Netop Live Guide. Netop Live Guide is a complete web-ba-
sed call center solution. It is relatively easy for most users
to calculate how much a company can save by using Netop
Live Guide instead of or in conjunction with its existing so-
lution. In addition to attracting new customers, Netop So-
lutions is also currently negotiating with various business
partners that see a benefit from being able to provide Netop
Live Guide as part of their own product assortment.
We have also used Netop Live Guide ourselves to provide
web-based support for existing as well as potential custo-
mers, in turn making our sales process and technical sup-
port more efficient.
The advantage is that all our salespeople and supporters
have learnt to use Netop Live Guide, making the product ea-
sier for them to sell, and we proactively use Netop Live Guide
to communicate with visitors on www.netop.com and to guide
them with respect to products, prices and possible solutions.
Markets and competition
“Click to chat” and “click to speak” services on corporate web
sites are becoming more and more popular as the number
of online visitors grows. For several years, businesses have
been able to track online visitors and analyse their behaviour
on the net by using advanced software. The time has now
come to take the next step, which is to invite visitors to a live
chat or audio conversation while they are ‘in your shop’. It is
easy to measure the immediate benefits of inviting prospec-
tive customers to communicate with your business through
live web chat or audio, for example in terms of customer sa-
tisfaction or through a shorter buying cycle; both of which
businesses are willing to pay for.
Focus areas in 2010
Considering the very positive developments in the Commu-
nication market and based on our experience from remote
solutions and teaching, developing the business in this field
and positioning our company as a serious provider of compe-
titive solutions and products is a natural next step for Netop
Solutions. In 2010, we will work to increase the awareness of
Netop Solutions’ web communication solutions globally. We
will continue to develop attractive and reliable IT solutions
Netop Live has increased our service efficiency by min. 100%, as we can manage an average of 5-6 chats in the time that it takes to conduct one telephone conversation.STEPhAN ROSENkiLdE, E-cOMMERcE, SAS
“
cOMMUNicATiON
14 MANAgEMENT’S REviEw

that can be accessed online, and we will provide hosted so-
lutions developed by either Netop Solutions or one of our
business partners.
Netop Solutions will continue to invest in marketing program-
mes and in building sales channels targeting the customer
segment we aim to sell our products to and in making our
products available to potential buyers. We will continue to
develop solutions that satisfy customer requirements for re-
liability, user friendliness and cost-saving functionality. Our
Communication solutions will be available online from www.
netop.com later in 2010.
We will also focus on optimising our hosting services in terms
of uptime, geographical accessibility and service provision
adapted to customer needs. Netop Solutions’ hosting service
will be based on cloud computing.
MANAGEMENTFollowing employee elections for board representation, Char-
lotte Brøbeck and Ole Haag both resigned from the board at
the Annual General Meeting held on 28 April 2009 and were
replaced by the new employee representatives Max Møller
and Hanne Jespersen Hansen.
BOARD DECISIONS AND PROPOSED RESOLUTIONS FOR CONSIDERATION By THE ANNUAL GENERAL MEETING
Allocation of loss
The Board of Directors assesses at regular intervals and at
least once a year the size and composition of Netop Solu-
tions’ capital base, including, in particular, expectations for
financial results and cash flows as well as any relevant uncer-
tainty and risk factors. The dividend for the year is then de-
termined on the basis of this assessment.
Based on the performance in 2009, the Board of Directors re-
commends that no dividend be distributed in 2010. Also, the
Board recommends that the parent company’s loss for the
year of minus DKK 137,271,000 be carried forward to 2010.
Other resolutions
The Board of Directors intends to submit the following pro-
posals:
- that it be authorised to acquire own shares up to a holding
of 10% of the company’s share capital.
OUTLOOKOur primary goal for 2010 is to generate profitable operati-
ons and positive cash flows while remaining focused on buil-
ding the platform from which Netop Solutions will generate
growth going forward. Management expects that we will con-
tinue to feel the effects of the economic crisis well into 2010,
but that the market has stabilised at the current level. We do
not expect to see any improvements in our market segments
until in the second half of 2010, but we anticipate a lot of
businesses with substantial pent-up demand and that could
have a positive effect on the market.
We adapted our operations and our organisation to the mar-
ket situation during 2009, and with the new development
organisation set up in Romania, an adapted sales and marke-
ting strategy of bringing Netop Solutions much closer to the
market and giving greater priority to selling services online in
order to create a much greater interface to the market, Ma-
nagement is confident that the objective of profitable opera-
tions is within reach.
Netop Solutions’ cash resources came under pressure during
2009 and the Board of Directors and the Management Board
are monitoring the situation very closely. We believe that ba-
sed on the company’s conservative budgets for 2010 coupled
with the cost-cutting initiatives implemented in the fourth
quarter of 2009, Netop Solutions will generate a cash inflow
from operations in 2010. However, our capital resources are
at a level that could come to jeopardise the company’s plans
and on that background Netop Solutions’ largest shareholder,
Consolidated Holdings A/S, has stated that it will assist in the
procurement, if additional capital to the company, should this
become necessary in 2010.
Given the difficult market conditions that will continue to pre-
vail into 2010, Netop Solutions is expected to generate reve-
nue of DKK 80–90 million in 2010. Through a cost-conscious
approach throughout 2009 and with the most recent cost
cuts implemented in the fourth quarter of 2009 taking full
effect early in the second quarter of 2010, Netop Solutions’
cost base will be about 35% lower in 2010 than it was in 2009.
Against this background, Netop Solutions expects to restore
profitable operations and to generate EBITDA in the region of
DKK 0–5 million in the 2010 financial year.
FORWARD-LOOKING STATEMENTSThe above forward-looking statements, including in particular
the forecasts of future revenue and financial results, reflect
management’s current expectations for future events and
are subject to risk. A number of factors, some of which will be
beyond Netop Solutions’ control, may cause actual develop-
ments and results to differ materially from the expectations
expressed by the company. Such factors include general eco-
nomic developments, developments in the financial markets,
technology innovation, changes and amendments to legis-
lation and regulations governing Netop Solutions’ markets,
changes in the demand for Netop Solutions’ products, com-
petition, and the integration of company acquisitions.
See “Risk factors” on page 20 of this annual report.
NEtoP
Communication• Netop Live Guide• Netop Live Banner
15MANAgEMENT’S REviEw

At Netop Solutions, we develop concepts and software solu-
tions that we regularly conceptualise and customise in or-
der to ensure that they satisfy the needs of our customers
and markets. In order to do that successfully, it goes wit-
hout saying that we rely on having skilled employees. Skills,
know-how and high professional standards are the building
blocks of any business. In a knowledge-based business like
Netop Solutions, they are the key to getting new ideas, in-
novation, products and results.
Development
2009 was an eventful year for our development organisation.
Lean processes have taken root and after constantly imple-
menting process enhancements throughout 2009, we have
built the foundation for a learning organisation. We have
achieved regular product deliveries and implemented pro-
duct management tools enabling the entire organisation to
monitor what is being developed, learn about development
priorities and get the current status on customer issues.
We have set up dedicated QA resources in all product teams
and have established a Quality Control Center in coopera-
tion with Fortess in Russia and the Technical University of
Bucharest. Also during 2009, we consolidated our develop-
ment resources, so we only have development teams in the
Philippines and in Romania, the latter now being the largest
Netop Solutions office outside Denmark.
Global coverage and network
Netop Solutions has established a global network of sales
subsidiaries and distribution partners, enabling us to move
quickly to deliver new solutions to new markets and/or
existing solutions to new markets. Customer growth and in-
novation in one part of the world can quickly be shared on
other continents for everybody’s mutual benefit, inspiration
and for experience-exchange purposes.
Customer solutions
The only way to develop innovative customer solutions that
make a difference in the everyday lives of our customers
anywhere in the world is to maintain close business rela-
tions with our customers and business partners. We ende-
avour to exchange experience not only across the globe,
but also across our own business areas of Administration,
Education and Communication.
Human resources
Our vision is “Netop wants to position itself as leading the
revolution of remote solutions”. In order to achieve that, it
goes without saying that we rely on our skilled employees.
Their skills and knowledge are crucial for us when develo-
ping value-creating solutions for our customers.
High professional standards and professionalism are the
characteristics of Netop Solutions employees at different
locations around the world. Combining this with an eager-
ness to learn and an ability for innovative thinking across
business areas in order to develop optimum solutions for
our customers, partners and Netop Solutions are essential
if we are to remain competitive.
At the end of 2009, Netop Solutions had 142 full-time emplo-
yees working in six different countries.
Working in a multi-cultural organisation places big demands
on our employees’ ability to work across cultural and lin-
guistic barriers. Accordingly, cultural skills are an important
everyday component in our work with colleagues and in our
ongoing endeavour to fortify our relations with business
partners and customers.
2009 was a year of organisational initiatives. Among the
changes made during the year, we closed down our two of-
fices in Germany. In spite of the various steps taken and the
after effects of the cutbacks in late 2008, it has been a plea-
sure for management to note that our employees still pos-
sess an incredible commitment and fighting spirit to work
with the management to turn Netop Solutions around and
make it a profitable business going forward.
In terms of human resources, Netop Solutions plans to step
up our employee retention and development efforts in 2010.
However, the most important source of skills development
remains our day-to-day project work, through which our
employees perfect their ability to further develop their
skills and create the best and most long-term solutions for
our customers.
kNOw-hOw ANd cOMPETENciES
16 kNOw-hOw ANd cOMPETENciES
Netop Solutions has no current policy on corporate social
responsibility (CSR). Instead, we have concentrated on se-
lected activities within the areas of the environment, cli-
mate and human resources.
Environment and climate
Given the climate changes facing the world today, we take
pleasure in being able to provide products and solutions that
indirectly incorporate environmental and climate-related
considerations. Our software supports lower carbon emis-
sions, in that our solutions enable businesses and organisa-
tions to reduce their travel budgets and provide a climate-
friendly alternative saving both time and money by meeting
online. Taking an online meeting instead of a journey from,
say Aalborg to Copenhagen, produces the following savings
for the environment:
Train 12 kg CO2/person
Air 66 kg CO2/person
Car 88 kg CO2/person
*Source: Danish Energy Authority
In addition, our remote solutions can help businesses re-
duce technical or support staff mileage while still providing
support to users.
Naturally, we also use online meetings and remote sup-
port in-house at Netop Solutions, at all our locations and
externally when communicating with customers or business
partners. This approach contributes to reducing our travel
activity.
At Netop Solutions, we are also very conscious of protecting
the environment. For example, we collect bottles and paper
for recycling.
Human resources
Our employees, their knowledge and skills are our most va-
luable resource, and we aim to support their everyday well-
being and commitment by providing a sound and stimula-
ting working environment.
Healthy people live longer and are less prone to illness. In
order to support health-promoting activities that will sup-
port our employees’ health and physical well-being, we
make fitness facilities available to all members of our staff
association free of charge. We also offer canteen services
at several locations, bringing focus to a healthy and varied
diet, which includes a fruit service. Also, our management
has made a health insurance scheme available, enabling
the staff to get psychological assistance for example if they
need help to handle a situation of crisis or grief.
Having a good psychological and physical working environ-
ment is not the only important platform we provide for our
employees. A large degree of flexibility and a sense of re-
sponsibility also contribute to giving each employee a good
working environment and helping them to strike a balance
between work and leisure. For this purpose, employees at
Netop Solutions are given the opportunities for teleworking
and have flexible working hours. Also, in order to promote
good relations between employees and managers, each
team leader conducts employee performance reviews once
a year to support their professional and personal develop-
ment.
cSR
17cSR

Netop Solutions shares
Netop Solutions’ shares are listed on NASDAQ OMX Copen-
hagen under securities identification code DK0010288125
and the symbol NETOP. Netop Solutions’ shares are a com-
ponent of the SmallCap index. Netop Solutions has one
freely negotiable share class, which at 31 December 2009
consisted of a total of 4,209,108 shares.
At 31 December 2009, Netop Solutions shares were quoted
at a price of DKK 7.80 compared with DKK 35.00 at 1 Janu-
ary 2009, a fall of 77.7%. As a result of the declining share
price over the course of the financial year, Netop Solutions’
market capitalisation dropped from DKK 147m at the begin-
ning of the year to approximately DKK 32.8m at year-end
2009.
Danske Bank and Gudme Raaschou provided analyst co-
verage of Netop Solutions shares during the reporting pe-
riod.
Ownership
At 31 December 2009, Netop Solutions had just over 1,100
registered shareholders, who represented approximately
94% of the share capital. The following shareholders have
notified Netop Solutions that they hold more than 5% of the
company’s share capital:
Peter Grøndahl Nielsen,
Øverødvej 38, DK-2840 Holte (14.74%)
Consolidated Holdings A/S
Fredheimsvej 9, DK-2950 Vedbæk (13.72%)
PROFESSIONEL FORENING LD HF (LD Pensions),
Vendersgade 28, DK-1363 Copenhagen K (11.19%)
CHV IV A/S,
Fredheimsvej 9, DK-2950 Vedbæk (9.15%)
Ole Bjørn Setnes,
Øverødvej 72 B, DK-2840 Holte (7.39%)
Søren Peter Andersen,
Helsingevej 40, DK-2830 Virum (7.39%)
Netop Solutions held 138,669 treasury shares at 31 Decem-
ber 2009, equivalent to 3.42% of the share capital. Netop
Solutions acquired treasury shares in 2009 in order to
hedge possible future share option programmes and for the
purpose of using them as a means of payment in connection
with potential future acquisitions. Netop Solutions acquired
13,409 own shares in 2009 at a total value of tDKK 440.
Dividend
Dividends are adopted by the shareholders in general meet-
ing. The Board of Directors proposes that no dividends be
paid in respect of 2009.
Annual general meeting
The company’s annual general meeting will be held at 2.00
pm on April 27, 2010 at the address of Netop Solutions,
Bregnerødvej 127, DK-3460 Birkerød.
Investor Relations
Netop Solutions’ ambition is to provide strong and reliable
information. By pursuing open and active communications
with investors, analysts, the press and other stakeholders,
the company aims to provide the equity market with the op-
timum foundation from which to price Netop Solutions sha-
res. The company communicates with investors through re-
gular announcements, investor presentations and individual
investor meetings. Netop Solutions’ website, www.netop.
com, the primary source of information for the company’s
stakeholders, regularly provides new and relevant infor-
mation about Netop Solutions’ performance, activities and
strategy. The website also contains a separate section on
the 2009 annual general meeting, from which it is possible
to see or download the annual report or to register for the
annual general meeting. Moreover, the articles of associati-
on and the notice convening the annual general meeting are
available on the website. Shareholders, analysts, investors,
securities companies and other interested parties should
direct any questions about Netop Solutions to:
Netop Solutions A/S
Bregnerødvej 127
DK-3460 Birkerød
Contact: Claus Finderup Grove, CFO
Tel: +45 4590 2525
E-mail: [email protected]
ShAREhOLdER iNFORMATiON
18 ShAREhOLdER iNFORMATiON

Corporate governance
As a listed company, Netop Solutions is under an obligation
to comply with the rules applying to companies listed on
NASDAQ OMX Copenhagen as well as the code of corporate
governance applying in Denmark.
Pursuant to clause 4.3 of the “Rules for issuers of Shares –
NASDAQ OMX Copenhagen”, listed companies must report
on how they address the “Recommendations for corporate
governance” based on the “comply or explain” principle.
The main purpose of this requirement is to create transpa-
rency in corporate governance matters.
In accordance with the new rules, the information specific
to Netop Solutions can be found at www.netop.com/inve-
stors, including Netop Solutions’ position on each individual
recommendation.
FINANCIAL CALENDAR 2010
27 April 2010 Quarterly report, Q1 2010
27 April 2010 Annual general meeting
17 August 2010 Quarterly report, Q2 2010
16 November 2010 Quarterly report, Q3 2010
ANNOUNCEMENTS IN 2009
19 January Despite generating top-line growth, Netop Solutions A/S issues profit warning for FY 2008
10 March Netop Solutions A/S releasing Annual Report 2008
7 April Notice to convene the annual general meeting of Netop Solutions A/S
27 April Annual general meeting – blank proxies issued to the Board of Directors of Netop Solutions
28 April Profit announcement for the first quarter of 2009
30 April Proceedings at the annual general meeting of Netop Solutions A/S held on 30 April 2009
6 May Major shareholder announcement
18 August Profit announcement for the second quarter and first half-year of 2009
7 October Netop and Medianet terminate partnership
17 November Netop Solutions A/S – Profit announcement for the third quarter of 2009
10 December Netop Solutions adapts organisation, aiming for profitability in 2010
11 December Financial calendar 2010
19ShAREhOLdER iNFORMATiON

Netop Solutions seeks to counter and reduce risks that the
company can influence through its own actions. Netop Solu-
tions’ business involves a number of commercial and finan-
cial risks, including the impact of current economic trends.
The global economic downturn impacted the overall risk
factors affecting Netop Solutions throughout 2009, as we
encountered substantially greater sales challenges than we
had expected, especially during the last three quarters of
the year. We expect the company to continue to feel the ef-
fects of the global downturn into 2010, further aggravating
the current uncertainty.
Current developments in the global foreign exchange mar-
kets present a point of interest for the company, as a strong
USD and a weak RON (Romanian Lei) have positive effects
on the profits from our US operations and on the costs in
our Romanian development company.
Netop Solutions’ cash resources came under pressure du-
ring 2009, reaching a level at the end of the year at which
the company may require an injection of additional capital
in order to achieve its strategic goals.
At 31 December 2009, Netop Solutions had no interest-bea-
ring debt and trade payables were at a relatively low level
and have been reduced further in early 2010.
Risks deemed to possibly have an adverse effect on the
company’s future growth, operations, financial position and
results are described in the sections below. The description
is not exhaustive, nor are the risk factors described pre-
sented in any order or priority.
COMMERCIAL RISKS
Product development, technologies and compatibility
Netop Solutions’ business platform is primarily based on the
proprietary technology, the NetOp technology, used in most
of the software applications of the two business areas Admi-
nistration and Education. By acquiring GenevaLogic in 2008
and Medianet’s development company in Romania, Netop
Solutions has expanded its business areas and technologi-
cal platforms. The transactions have given Netop Solutions
added flexibility and scalability in development processes,
reducing the risk of costly bottleneck situations as well as
reducing the time to market. We completed the transfer
of key elements of our development skills from Denmark
and Switzerland to Romania in the first quarter of 2009.
The relocation process was completed as planned and with
no complications for the company’s development process,
nor did it cause inconvenience to our business partners or
customers.
The company’s future success, including its potential for fu-
ture growth, depends on its ability to continue to improve
existing products as well as to develop and launch new pro-
ducts adapted to cutting-edge technology.
The growing use of the Internet raises new demands and
presents new opportunities in the business areas in which
Netop Solutions operates. The demand for Internet-based
solutions in Netop Solutions’ business areas is increasing,
whereas growth in the demand for conventional applicati-
on-based solutions is slowing. Netop Solutions has develo-
ped an Internet-based version of NetOp Remote Control
called Netop Remote Control OnDemand, and is developing
Internet-based versions of several of the other products on
an ongoing basis. Netop Solutions is rapidly building a po-
sition from which to provide part of its product portfolio as
services or web-based solutions. Succeeding in this tran-
sition will be crucial for Netop Solutions’ market position
going forward.
In the fourth quarter of 2009, we launched MyVision, our
first SaaS (Software as a Service) product in the Education
segment. The launch demonstrates the Netop Solutions
technology edge, as no one from the competition has intro-
duced anything similar. The MyVision launch will give Netop
Solutions valuable experience from web-based services
that can be applied in the future roll-out of this strategy
approach.
In the Education segment, the company is focused on inte-
grating the products acquired from GenevaLogic into Netop
Solutions’ software product Netop School. This integration
work will be ongoing in 2010. It is considered critical from
an earnings point of view, but cost synergies from develop-
ment activities will only be fully achieved when the integra-
tion has been completed.
RiSk FAcTORS
20 RiSk FAcTORS

The software market is dependent on developments in the
market for operating systems and software platforms, in
which Microsoft Corporation continues to set the standard,
as these products generally determine how software is de-
veloped. However, other operating systems are increasingly
being used, and several major players have announced their
intentions of penetrating this market. This could mean that
development companies like Netop Solutions will have to
prepare to support multiple platforms. We would welcome
such a situation, as this has been one of our strong points
for several years.
Also, when new versions of operating systems are launched,
software manufacturers, including Netop Solutions, have to
adapt their products to possible new standards. The launch
of new versions of existing operating systems and new ty-
pes of operating systems could adversely affect Netop So-
lutions if such launches result in a need for comprehensive
programming changes to existing products. With the new
development unit consolidated at a single location, Netop
Solutions will increasingly be able to reduce not only costs
related to product upgrades, but also time to market, by a
substantial margin.
Protection of technology
Netop Solutions’ software products and underlying techno-
logy are proprietary and form the basis for the company’s
business, and Netop Solutions actively seeks to protect its
rights primarily through trademark registration. However,
these activities only offer limited protection against copy-
ing and unauthorized use which may lead to a reduction of
the sales of Netop Solutions’ products. During 2009, Netop
Solutions worked on a new licensing system that is expected
to result in a number of improvements in end-user applica-
tion control, which would make it much more complicated
to copy or use the company’s software in an unauthorized
manner. The project has been postponed due to the global
economic crisis, but we expect to launch the new system at
the end of 2010.
Competition
Netop Solutions operates in three markets – Administra-
tion, in which our main products are Remote Control-soft-
ware and Asset Management for IT-related administrative
tasks; Education, which is the market for software enabling
and supporting computer-based classroom teaching and
Communication, the market for unified communication,
which includes web-based communication and conferen-
cing solutions. These are markets characterized by fierce
competition, rapid technological innovation and changes in
customer needs and preferences.
Remote control software is sold by small company software
specialists, who manufacture stand-alone software, by ma-
jor software providers, who manufacture complete software
suites and to various extents by manufacturers of opera-
ting systems. In recent years, remote control functionality,
in particular, integrated as a general feature of software
product suites or operating systems have been improved
considerably, and a number of software suites feature soft-
ware from our competitors. Despite the mounting competi-
tion from freeware providers and the fact that the overall
market for remote control products is becoming stagnant,
we continue to see good opportunities for generating posi-
tive earnings in this market over the next few years. Many
companies continue to focus strongly on security and stabi-
lity, which is precisely a key strength of Netop Remote Con-
trol, and the product enjoys a good market position. In addi-
tion, the transition to web-based access to PCs, laptops and
other mobile units will represent a market in which Netop
Solutions wants to be seen as a serious provider.
Netop Solutions has become a major player in the Education
market, especially in the classroom management segment,
following the acquisition of GenevaLogic. The Education
market consists of a number of small players and is very
competitive. However, Netop Solutions is strongly positio-
ned, in terms of both technology and distribution, and the
company will make a strong effort to expand this position in
the future. In addition, Netop Solutions intends to monitor
developments in this segment with respect to synchronous
and asynchronous teaching solutions as well as web-based
solutions.
Unified communications is a high-growth market attracting
new players. In particular, providers of conferencing soluti-
ons hold a large part of the market. Netop Solutions’ pro-
duct Live Guide addresses a part of this market by offering
Communication products as a service to users. The solution
is hosted and serviced by Netop Solutions, giving the user
the necessary flexibility. It is essential for Netop Solutions
to establish a positive position in this growth market, and
we are making every effort to achieve that. In order to re-
tain this focus, we have concentrated our sales operations
in the Scandinavian and US markets, appointing dedicated
salespersons for these regions. When sales in these regi-
ons have reached satisfactory levels, we intend to expand
our sales operations to the rest of Europe and the Asian
markets.
Establishment of subsidiaries
In 2006, Netop Solutions established subsidiaries in the US,
the UK and Germany and recruited local employees with
extensive experience from the IT business and in-depth
knowledge of the individual local markets. In connection
with establishing the subsidiaries, Netop Solutions focused
on organising the operations in the companies according to
local conditions, legislation and regulations. On establishing
the subsidiaries, Netop Solutions assumed increased com-
mercial and financial risk. In connection with the acquisiti-
ons made during the summer of 2008 and the realignment
of the organization in 2009, management closed down the
company’s offices in Frankfurt, Berlin and China, reduced
the staff at the London and Langenthal (Switzerland) offices
and expanded operations at the two US offices in Chicago
and Portland, which have merged into a single subsidiary.
This has helped to reduce costs, creating a more transpa-
rent organization.
21RiSk FAcTORS

Business partner agreements
In 2008, Netop Solutions signed an exclusive global distri-
bution agreement with Medianet, gaining the right to distri-
bute Medianet’s unified communication products. As part
of the agreement, Netop Solutions took over Medianet’s
customer base and its Romanian development company.
The parties agreed to terminate the partnership effective
at the end of 2009. Accordingly, Netop Solutions does
not distribute Medianet’s Live Communicator product, but
instead retained its proprietary products Live Guide, which
the company intends to continue to market. The reversal
was completed without complications or legal proceedings.
Human resources
Having skilled and motivated employees is a prerequisite
for Netop Solutions to uphold growth and satisfactory ear-
nings. Netop Solutions’ future success depends, among
other things, on its ability to strengthen the product portfo-
lio by developing new products and product upgrades. The
transformation of ideas into viable products that customers
demand requires that Netop Solutions is capable of attrac-
ting and retaining skilled and qualified employees and that
the company successfully ensures an optimum flow of infor-
mation from the end customer to the software developer.
Previously, this flow of information has not run in an opti-
mum way, because Netop Solutions has traditionally been
a development-driven rather than a customer- or market-
driven business. This process has been changed, as we have
created a new product management organization forging a
new relationship between sales and R&D. The new organiza-
tion will ensure that only products demanded by the market
on a short- or a long-term basis are being developed.
Customers and markets
The company sells its products through its subsidiaries in
the USA, the UK, Switzerland and Romania and through busi-
ness partners in more than 80 countries. In order to achieve
our goal of profitable operations, Netop Solutions needs to
successfully develop the necessary skills in the subsidiaries
within its business segments, expand the business partner
channels and increase the awareness of the company’s pro-
ducts. Going forward, the objective is to generate an ever
growing proportion of Netop Solution revenue from the
sale and distribution of products and Software-as-a-Service
products through web shops. In future, a part of the Netop
Solutions product portfolio will address this rapidly growing
market, and we plan to launch a number of products for
this market in order to build the necessary experience. In
the fourth quarter of 2009, we launched MyVision, the first
product specifically directed at this market segment. It is
still too early to estimate the future earnings potential, but
it is expected to be substantial. Management believes that
the transition will not have a negative, but rather a comple-
mentary effect on the existing distribution channel.
Netop Solutions invoices some 400 distributors, business
partners and distributors in many parts of the world. In
2009, the 10 largest customers accounted for about 54%
of revenue and no single customer accounted for more than
10% of revenue. Netop Solutions is therefore not believed to
be dependent on any single customer.
Acquisitions
Company and technology acquisitions form an integral part
of Netop Solutions’ expansion strategy. Such acquisitions
are associated with both risks and challenges – for instance
in connection with the integration of the activities acquired,
including integration of products and technologies, sales
channels and employees.
Insurance
It is Netop Solutions’ policy to insure against risks which
could potentially threaten the company’s financial position.
In the license terms which customers must accept before
they are technically able to install Netop Solution products,
the company has to the maximum extent possible included
clauses to limit liability. The purpose of these clauses is to
limit the company’s liability attributable to potential defects
that may occur in the products sold.
Netop Solutions has taken out such insurance policies as
are usual for companies of a similar nature. The company
has also taken out insurance for property and operating
equipment. Management believes that the company main-
tains adequate and appropriate insurance coverage. Netop
Solutions’ policy on insurance cover is reviewed annually in
consultation with the Board of Directors.
FINANCIAL RISKS
Due to the international nature of Netop Solutions’ ope-
rations, a number of financial risks have an impact on the
company’s results of operations. It is the company’s policy
to identify and hedge such risks according to the guideli-
nes defined by the Board of Directors and the Management
Board.
Foreign exchange risk
Netop Solutions is incorporated in Denmark and prepa-
res its financial statements in Danish kroner. In 2009, the
company invoiced approximately 25% of its sales in Danish
kroner, 25% in euros, 45% in US dollars and the remaining
5% in British pound sterling. The company’s foreign ex-
change exposure is thus primarily in euro and US dollars in
terms of revenue and in US dollars and Romanian Lei (RON)
in terms of costs. Management does not believe that the
euro exposure involves particular risk. As regards US dol-
lars, the company’s exposure has been reduced following
the establishment of a subsidiary in Chicago and the acqui-
sition in Portland. Management monitors the situation and
the company enters into hedging contracts for up to 50% of
the USD-denominated cash flows from operations from time
to time. No contracts were entered into in 2009, as Netop
Solutions had a net surplus of US dollars. Going forward, a
part of the future costs will be RON-denominated and ma-
nagement will consider whether hedging future payments
22 RiSk FAcTORS

to Romania would be appropriate, either by way of currency
options or forward contracts. No option or forward contracts
were entered into in 2009. The average DKK/RON exchange
rate in 2009 was 1.76, while the budgeted rate was 1.85.
Interest rate exposure
Netop Solutions is exposed to limited interest rate risk, which
primarily involves the interest income on the company’s
cash holdings. The return on the cash holdings is calculated
on the basis of the money market rate. In January 2010,
Netop Solutions signed a factoring agreement regarding
sales in the Nordic region, which adds a CIBOR-based rate
of interest for a percentage of outstanding amounts. This
involves a minute interest exposure.
Liquidity risk
Netop Solutions pursues a policy of consistently ensuring
the existence of adequate financial resources. Cash reser-
ves, which are deemed to be sufficient to implement Net-
op Solutions’ current strategy, consist of prior-year cash
flows and proceeds from the IPO in 2001. Cash resources
amounted to DKK 48m at year-end 2008, but due to the
global recession, revenue fell short of expectations causing
the loss and the necessary drawings on our liquid reserves
to be greater than anticipated. The large cash deficit Netop
Solutions experienced in 2009 is expected to be reversed
in 2010 through profitable operations and substantially lo-
wer costs. A factor of uncertainty relating to the company’s
cash position in 2010 involved a guarantee commitment
made in connection with the acquisition of GenevaLogic
in 2008. The acquisition agreement included an obligation
worth up to DKK 10m, which is expected to crystallize in the
fourth quarter of 2010. We project net cash inflows in all
quarters of the year, and expect to base operations during
the year on existing credit facilities. The work to strengthen
the company’s capital resources continues, and Netop Solu-
tions’ main shareholder, Consolidated Holdings Group, has
stated that it is willing to assist in the procurement, if ad-
ditional to the Company, should become necessary in 2010.
The annual report is presented on a going-concern basis.
Credit risk
The company minimizes credit risk related to cash and cash
equivalents, money market deposits as well as derivatives
by exclusively cooperating with financial institutions with a
high creditworthiness.
Debtor risk
The company’s sales are primarily made on open account.
Most of Netop Solutions’ sales are to business partners
with whom we have maintained a business relationship
for several years. The company operates fixed terms of
payment and has defined policies on how to follow up on
non-payment. For sales to new customers, we often require
a down payment for initial shipments. The practice pursued
so far for the handling of debtors has proven to be very
effective. Due to the global economic slump and the more
difficult access to financing, the company has tightened its
debtor follow-up procedures to involve a weekly review of
all debtors. This approach has been successful, as the deb-
tor portfolio was steadily reduced during the year and it has
continued to fall in early 2010.
ENVIRONMENTAL ISSUES
Netop Solutions seeks to estimate and limit the environ-
mental impact of its business operations. The company gi-
ves priority to making direct and indirect contributions to
a sustainable environment. Encompassing the development
and selling of software products, Netop Solutions’ operati-
ons have a very limited direct environmental impact.
Netop Solutions’ impact on the external environment thus
mainly derives from heating and cooling of the company’s
premises as well as electricity and water consumption. It is
important to us that environmentally-friendly solutions are
applied in these areas. During the last two years, Netop So-
lutions has reduced its annual water consumption by 40%
and its power consumption by 10%. In addition to reducing
our costs, this has strongly reduced our environmental foot-
print.
The company is not involved in environmental claims, and
Netop Solutions is not comprised by the rules on environ-
mental approval or the act on presentation of ”green ac-
counts” (environmental report).
23RiSk FAcTORS

FiNANciAL REviEw
INCOME STATEMENT
Revenue
Revenue totalled DKK 85.3m in 2009, down 7% from DKK
91.5m in 2008. The revenue decline was attributable to the
general slowdown experienced in all of the company’s mar-
kets in 2009.
Revenue for Q4 2009 was DKK 21.2m, a fall of 22% from
DKK 27.1m in Q4 2008. The decline was mainly due to the
difficult market conditions that prevailed during the final
three quarters of 2009.
Revenue performance by business area
Revenue from the Administration segment was DKK 40.8m
against DKK 54.5m last year. Administration thus accounted
for 48% of total revenue, as compared with 60% in 2007.
The lower contribution to revenue by the Administration
segment, which has historically been Netop Solutions’ lar-
gest business, was consistent with expectations, because
the acquisition of GenevaLogic, which exclusively sells Edu-
cation products, was only recognised with six months’ re-
venue in 2008 due to the timing of the acquisition. Netop
Solutions has experienced a general slowdown in all geo-
graphical markets, but the set-back was substantial in the
European markets.
Revenue from the Education segment totalled DKK 36.2m
in 2009, up 12% from DKK 32.2m in 2008. Accordingly, the
Education segment accounted for 42% of Netop Solutions’
total revenue in 2009 against 35% in 2008. The relative
contribution to revenue was in line with expectations. The
revenue increase was mainly due to the fact that GenevaLo-
gic revenue was only included for six months in 2008, but
it was also driven by the much greater attention given in
our sales channel to Netop’s original product, Netop School,
which generated growth in an otherwise difficult market.
Communication revenue was DKK 3.4m in 2009, as compa-
red with DKK 1.4 million in 2008. The 142% improvement
was due to the fact that the 2008 figure included only six
months’ revenue from GenevaLogic, but was also driven by
the growing sales in the European markets towards the end
of 2009. However, overall revenue still fell short of expec-
tations, as especially revenue from the USA was disappoin-
ting.
Revenue from Other products related to income generated
by the Romanian development company.
Revenue by business area:
DKK million 2009 % 2008 %
Administration 40.8 48 54.5 59
Education 36.2 42 32.2 35
Communication 3.4 4 1.4 2
Other 4.9 6 3.4 4
Total 85.3 100 91.5 100
Revenue performance by market
Revenue from the Americas, covering North, Central and
South America climbed 10% to DKK 34.9m, mainly driven
by revenue from the acquisition of GenevaLogic, whose pri-
mary market is the USA. This revenue was recognised for
the full year of 2009, but only for six months of 2008. Also,
the US dollar appreciated by 7% against Danish kroner in
2009 relative to 2008.
In the UK, revenue fell by 25% to DKK 5.2m, partly due to a
13% depreciation of the pound sterling against Danish kro-
ner relative to 2008.
In the Germany region, revenue was down by 24% to DKK
8.8m, mainly because of the transition from operating a
Netop subsidiary in Germany to using a distributor.
Other countries covers Scandinavia, the Asia/Pacific re-
gion, the rest of Eastern and Western Europe, Africa and
the Middle East, recorded a revenue decline of 12% to DKK
36.4m.
Revenue by geographical market:
Geographical regions 2009 % 2008 %
USA 34.9 41 31.8 35
United Kingdom 5.2 6 6.9 7
Germany 8.8 10 11.5 13
Other 36.4 43 41.3 45
Total 85.3 100 91.5 100
24 FiNANciAL REviEw

Costs
Total production costs (direct costs), other operating in-
come, external costs, depreciation/amortisation, staff costs
and other operating costs totalled DKK 152.7m in 2009, a
12% increase from DKK 136.6m in 2008. Costs on 2008 in-
cluded a DKK 12.5 million gain from the divestment of a land
and buildings. Net of this gain, costs rose by 2%. The entire
cost increase was attributable to the acquisition of Geneva-
logic and the conclusion of the agreement with Medianet,
which were included for six months of 2008 and for the full
year of 2009.
Other operating income of DKK 0.3m reflects the DKK 12.5m
sale of the product Netfilter in 2008, when Netop Solutions
sold its domicile property.
External costs (54% of revenue) amounted to DKK 45.9m in
2009, down 25% from DKK 60.5m in 2008. The fall was due
to general cost adjustments in all areas and the fact that
staff-related costs such as travel activity and telecommuni-
cation costs have dropped with the reduction of the emplo-
yee headcount. In addition, the termination of the Media-
net agreement led to the costs of this discontinued activity
being reclassified from external costs. The reclassification
also applied to six months of the 2008 financial year, as the
agreement took effect from 1 July 2008.
See note 31 to the financial statements for further details
on the calculation of discontinued activities in 2009 and the
resulting accounting consequences for 2008 and 2009.
Depreciation/amortisation and impairment losses (39% of
revenue) totalled DKK 32.9m in 2009 against DKK 12.2m in
2008. The DKK 20.9m write-down of M-Net/NAC was the
main reason for the increase. In addition, development pro-
jects that were not previously capitalised to the same ex-
tent were amortised by DKK 2.5m and acquired customer
relations were amortised over 12 months in 2009 compared
to over six months in 2008.
Staff costs (86% of revenue) fell to DKK 73.3m in 2009
from DKK 76.8m in 2008 even though the activities ac-
quired from GenevaLogic and Medianet were only included
for six months of 2008. The fall was due to the relocation of
development resources from Denmark and Switzerland to
Romania and to the additional staff reductions at all offices.
In addition, the termination of the Medianet agreement re-
sulted in costs of transferred employees being reclassified
from external costs. See note 31 to the financial statements
for further details on the calculation of discontinued activi-
ties in 2009 and the resulting accounting consequences for
2008 and 2009.
EBITDA
Netop Solutions generated an operating loss before inte-
rest, tax, depreciation and amortisation (EBITDA) of DKK
34.5m in 2009 against a DKK 33.9m loss in 2008.
EBITDA for Q4 was a DKK 0.6m profit against a loss of DKK
1.4m in Q4 2008.
EBIT
The company recorded an operating loss (EBIT) of DKK
67.4m in 2009 against a DKK 45.1m loss last year.
In Q4 2009, the company incurred an operating loss (EBIT)
of DKK 22.8m against a loss of DKK 7.2m in Q4 2008.
Net financials
Net financial items amounted to an expense of DKK 0.5 mil-
lion in 2009 as against an expense of DKK 8.0 million in
2008. The main factor of the net expense was the deprecia-
tion during the year of US dollars against Danish kroner.
Tax on loss for the year
A drop in Netop Solutions’ tax asset reduced the accounting
tax value by DKK 5.8m, compared with DKK 8.0m in 2008.
Profit/loss of discontinued operations
Due to the termination of the Medianet agreement, reve-
nue from the product Live Communicator and the costs
of employees transferred to Medianet and the distributor
agreement is no longer recognised. The net cost of these
activities amounted to DKK 8.9m in 2009 against DKK 3.6m
for the corresponding activities in 2008. See note 31 to the
financial statements for further details on the calculation of
discontinued activities in 2009 and the resulting accounting
consequences for 2008 and 2009.
Loss before and after tax
Netop Solutions incurred a loss from ordinary activities be-
fore tax of DKK 82.5m (2008: DKK 48.7m), equal to minus
87% (2007: minus 63%) of revenue.
This equals a negative EPS of DKK 20.2 (2008: negative
EPS of 12.3).
25FiNANciAL REviEw

BALANCE SHEET
Netop Solutions had total assets of DKK 99.4m at 31 Decem-
ber 2009 compared with DKK 182.4m at 31 December 2008.
The fall of DKK 83.0m was mainly due to impairment as well
as depreciation/amortisation charges on the Group’s non-
current assets of DKK 27.8m and the negative cash flows for
the year of DKK 43.3m.
Intangible assets
The carrying amount of intangible assets was reduced sub-
stantially, by DKK 26.0m, relative to 2008. Part of the rea-
son was the addition of development costs of approximately
DKK 7m, but the main factor was the complete write-off
of the M-Net product from a value of approximately DKK
20.9m. The rest of the amount was attributable to ordinary
write-downs.
Other non-current assets
The carrying amount of other non-current assets was DKK
16.7m at 31 December 2009 compared with DKK 21.7m at 31
December 2008. The fall was mainly due to capitalised de-
ferred tax being recognised at an expense of approximately
DKK 6m compared with capitalised deferred tax of DKK 8.1m
at 31 December 2008.
Current assets
Current assets totalled DKK 22.2m at 31 December 2009
compared with DKK 73.8m at 31 December 2008. The de-
cline in current assets was primarily driven by a reduction
of cash holdings resulting from the loss for the year and a
reduction of trade receivables of DKK 5.0m.
Equity
Equity was DKK 63.9m at 31 December 2009, against DKK
145.9m at 31 December 2008. The large fall was due almost
exclusively to the Group’s loss for 2009, and the equity ratio
is now at 65% compared with 80% at the end of 2008.
Non-current liabilities
Non-current liabilities fell by approximately DKK 9m relative
to 31 December, 2008, because the guarantee commitment
of DKK 10m that Netop Solutions provided in connection
with the acquisition of GenevaLogic in 2008 will crystallise
within the next 12 months and has therefore been reclas-
sified to current liabilities.
Current liabilities
Current liabilities rose by DKK 7.0m from 31 December 2008
to 31 December 2009. The increase was due to the above-
mentioned guarantee commitment of DKK 10m, while on
the other hand trade creditors fell by DKK 3.5m.
CASH FLOWS
The company recorded a cash outflow from operating ac-
tivities of DKK 37.5m, which was less than the outflow of
2008 in spite of the greater loss incurred in 2009 and was
mainly due to the smaller working capital tie-up.
Cash flows from investing activities was an outflow of DKK
5.5m, against an inflow of DKK 8.9m in 2008. The cash po-
sition was adversely affected by costs of both proprietary
and acquired development activities of approximately DKK
7m incurred in 2009.
The Group’s cash resources at 31 December 2009 amounted
to DKK 4.8m and constituted cash only, as was also the case
at 31 December 2008 when cash resources amounted to
DKK 48.1m.
jan feb mar apr may jun jul aug sep oct nov dec4,75
5,00
5,25
5,50
5,75
6,00
1,7
1,8
1,9
USD USD RONRON
USD & RON exchange rate 2009
26 FiNANciAL REviEw


STATEMENT By MANAGEMENT ON THE ANNUAL REPORT
We have today presented the annual report of Netop So-
lutions A/S for the financial year 1 January – 31 December
2009.
The annual report is prepared in accordance with Interna-
tional Financial Reporting Standards as adopted by the EU
and additional Danish disclosure requirements for annual
reports of listed companies.
In our opinion, the consolidated financial statements and
the parent financial statements give a true and fair view of
the Group’s and the Parent’s financial position at 31 Decem-
ber 2009 as well as of their financial performance and their
cash flows for the financial year 1 January - 31 December
2009.
We also believe that the management commentary contains
a fair review of the development and performance of the
Group’s and the Parent’s business and of their financial po-
sition as a whole, together with a description of the princi-
pal risks and uncertainties that they face.
We recommend the annual report for adoption at the An-
nual General Meeting.
STATEMENT by ThE bOARd OF diREcTORS ANd ThE MANAgEMENT bOARdANd iNdEPENdENT AUdiTORS’ REPORT
Birkeroed, 16 March 2010
MANAGEMENT
Kurt Groth Bager Claus Finderup Grove
CEO CFO
BOARD OF DIRECTORS
Ib Kunøe Henning Hansen Jan Elbæk
Chairman
Max Møller Per Egon Rank Peter Schübach
Søren Bach
28 RESPONSibiLiTy STATEMENTS

INDEPENDENT AUDITOR’S REPORT
To the shareholders of Netop Solutions A/S
We have audited the consolidated financial statements and
parent financial statements of Netop Solutions A/S for the
financial year 1 January - 31 December 2009, which com-
prise the income statement, comprehensive income state-
ment, balance sheet, statement of changes in equity, cash
flow statement and notes, including the accounting policies,
for the Group as well as the Parent and the management
commentary. The consolidated financial statements and
parent financial statements have been prepared in accor-
dance with International Financial Reporting Standards as
adopted by the EU and additional Danish disclosure require-
ments for listed companies. The management commentary
has been prepared in accordance with the Danish Financial
Statements Act.
Management’s responsibility for the consolidated
financial statements, parent financial statements and
management commentary
Management is responsible for the preparation and fair pre-
sentation of consolidated financial statements and parent
financial statements in accordance with International Fi-
nancial Reporting Standards as adopted by the EU and addi-
tional Danish disclosure requirements for listed companies
and for the preparation of a management commentary that
contains a fair review in accordance with the Danish Finan-
cial Statements Act. This responsibility includes: designing,
implementing and maintaining internal control relevant to
the preparation and presentation of consolidated financial
statements, parent financial statements and a management
commentary that are free from material misstatement,
whether due to fraud or error, selecting and applying ap-
propriate accounting policies, and making accounting esti-
mates that are reasonable in the circumstances.
Auditor’s responsibility and basis of opinion
Our responsibility is to express an opinion on these consoli-
dated financial statements and parent financial statements
and this management commentary based on our audit. We
conducted our audit in accordance with Danish and Interna-
tional Standards on Auditing. Those Standards require that
we comply with ethical requirements and plan and perform
the audit to obtain reasonable assurance whether the con-
solidated financial statements, parent financial statements
and management commentary are free from material mis-
statement.
An audit involves performing procedures to obtain audit
evidence about the amounts and disclosures in the consoli-
dated financial statements, parent financial statements and
management commentary. The procedures selected depend
on the auditor’s judgement, including the assessment of the
risks of material misstatement of the consolidated financial
statements, parent financial statements and management
commentary, whether due to fraud or error. In making those
risk assessments, the auditor considers internal control re-
levant to the entity’s preparation and fair presentation of
consolidated financial statements and parent financial state-
ments and to the fair review of a management commentary
in order to design audit procedures that are appropriate in
the circumstances, but not for the purpose of expressing
an opinion on the effectiveness of the entity’s internal con-
trol. An audit also includes evaluating the appropriateness
of accounting policies used and the reasonableness of ac-
counting estimates made by Management, as well as evalu-
ating the overall presentation of the consolidated financial
statements, parent financial statements and management
commentary.
We believe that the audit evidence we have obtained is suf-
ficient and appropriate to provide a basis for our audit opi-
nion.
Our audit has not resulted in any qualification.
Opinion
In our opinion, the consolidated financial statements and
parent financial statements give a true and fair view of the
Group’s and the Parent’s financial position at 31 December
2009, and of their financial performance and their cash
flows for the financial year 1 January - 31 December 2009
in accordance with International Financial Reporting Stan-
dards as adopted by the EU and additional Danish disclosu-
re requirements for listed companies and the management
commentary contains are a fair review in accordance with
the Danish Financial Statements Act.
Emphasis of matter
Without qualifying our opinion, we refer to the information
in the section on “Risk factors” in the management commen-
tary under the section Liquidity risk, page 23 from which
it follows that Management expects to have met the capital
requirement for the going concern of the Company. Ma-
nagement based its assessment thereof on the assumption
that expected positive developments in company activities
and liquidity are realized. For this reason, Management has
presented the annual report on a going concern basis. In
our view, the Company’s expectations for positive develop-
ments in activities and liquidity are subject to uncertainty,
and therefore capital requirements which have not been
met may arise.
Birkerød, 16-03-2010
Deloitte
Statsautoriseret Revisionsaktieselskab
Peter Skov Hansen Christian Sanderhage
State Authorised State Authorised
Public Accountant Public Accountant
29RESPONSibiLiTy STATEMENTS

BOARD OF DIRECTORS
Ib Kunøe, 66Chairman of Netop Solutions A/S and
Netop Business Solutions A/S since
July 2005.
Chairman of the boards of directors
of: Atea ASA, CDrator A/S, Columbus
IT A/S, Consolidated Holdings A/S,
Core Workers A/S, DAN-Palletiser A/S,
DAN-Palletiser Holding A/S, Morsing
PR ApS and Thrust IT A/S.
Member of the boards of directors
of: Atrium Partners A/S and Primare
Systems AB.
Special qualifications: General cor-
porate management, including ma-
nagement of IT businesses, mergers
and acquisitions.
Henning Hansen, 60Board member of Netop Solutions
A/S and Netop Business Solutions A/S
since February 2001. Attorney-at-law.
Partner with Philip law firm.
Chairman of the board of directors
of: Fondshuset A/S
Member of the boards of directors
of: Casino Ejendomsselskab A/S, Non
Nobis Fonden, Enecto ApS, Chris-Wine
A/S as well as the board of represen-
tatives of Realdania.
Special qualifications: General ma-
nagement, general and corporate law
issues.
Jan Elbæk, 49Executive VP, member of the execu-
tive board of Atea A/S.
Member of the boards
of directors of:
Westergaard CSM A/S, Intranote A/S.
Special qualifications:
International sales and management
of IT businesses.
bOARd OF diREcTORS ANd MANAgEMENT
The Group consists of the following companies: Netop Solutions A/S (parent company), Netop Business
Solutions A/S (wholly owned), and which wholly own the subsidiaries: Netop Tech Inc.(USA), Netop Tech Ltd.
(UK)., Netop Tech GmbH (Germany), Netop Tech AG (Switzerland), Netop S.l.r. (Romania).
The members of the Board of Directors of Netop Solutions A/S are listed below. The Board of Directors of
Netop Business Solutions A/S consists of Ib Kunøe (Chairman), Henning Hansen and Jan Elbæk. The Manage-
ment Board consists of Kurt Groth Bager and Claus Finderup Grove.
30 bOARd OF diREcTORS ANd MANAgEMENT

Peter Schüpbach, 47
Member of the boards of directors
of: Kyte Inc., USA, FashionFriends AG,
Switzerland, NewBorn Ventures AG,
Switzerland, ABILITA AG, Switzerland,
Quevita AG, Switzerland, Restorm AG,
Switzerland, Plazes AG, Switzerland,
SpeedLingua SA, Luxembourg, Ede-
light GmbH, Germany.
Special qualifications:
Development and management of IT
businesses.
Per Rank, 56Sales Manager
Board member of Netop Solutions A/S
since April 2005.
Elected by the company’s employees.
Max Møller, 35Product Quality Manager
Board member of Netop Solutions A/S
since April 2009.
Elected by the company’s employees.
Søren Bach, 33Facility Manager
Board member of Netop Solutions A/S
since 22 February 2010.
Elected by the company’s employees.
Kurt Groth Bager, 45Appointed Chief Executive Of-
ficer of Netop Solutions A/S
with effect from 21 February
2008.
Claus Grove Finderup, 41Chief Financial Officer since
November 2007.
Kent F. Madsen, 45Chief Technical Officer since 1
June 2008.
Newlyelected
MANAGEMENT BOARD
31bOARd OF diREcTORS ANd MANAgEMENT

gROUP OvERviEw
Netop Solutions A/S
Netop Business Solutions A/S
Netop Tech Inc.United States
Netop Tech GmbHGermany
Netop Tech SLRRomania
Netop Tech Ltd.United Kingdom
Netop Tech AGSwitzerland
32 gROUP OvERviEw
CONSOLIDATED ACCOUNTS
Income statement 34Statement of comprehensive income 35Balance sheet 36Statement of changes in equity 38Cash flow statement 39Notes to the consolidated accounts 40
Page
33cONSOLidATEd AccOUNTS

CONSOLIDATED INCOME STATEMENT 1 JANUARY – 31 DECEMBER
DKK '000 2009 2008
Revenue 3.4 85,287 91,485 Direct costs (685) (500) Gross profit 84,602 90,985
Other operating income 6 322 12,502 External costs 9 (45,756) (60,545) Amortisation, depreciation and impairment losses 5 (32,875) (11,188) Staff costs 8 (73,500) (76,838) Other operating costs 7 (192) - Operating profit (EBIT) (67,399) (45,084)
Income form investments in associates 16 - - Financial income 10 471 3,935 Financial expenses 11 (946) (11,967) Profit before tax af continuing business (67,873) (53,116)
Corporation tax of continuing business 12 (5,776) 7,971 Profit for the year of continuing business (73,649) (45,145)
Profit for the year of discontinuing business 31 (8,891) (3,601) Profit for the year (82,539) (48,746)
Earning per share (EPS)Earning per share (EPS) 13 (20.24) (12.34) Earnings per share, diluted (EPS-D) 13 (20.24) (12.34) Earning per share of continuing business (EPS) 13 (18.06) (11.43) Earning per share of continuing business, diluted (EPS-D) 13 (18.06) (11.43)
Distributed as follows:Shareholders in Netop Solutions A/S (82,539) (48,746) Minority shareholders - -
(82,539) (48,746)
34 iNcOME STATEMENT

CONSOLIDATED STATEMENT OF COMPREHENSIVE INCOME 31 DECEMBER
DKK '000 2009 2008
Profit for the year (82,539) (48,746)
Other comprehensive incomeExchange rate adjustments relating to foreign entities 794 6,033 Tax of other comprehensive income 12 - - Other comprehensive income after tax 794 6,033
Total comprehensive income (81,746) (42,713)
Distributed as follows:Shareholders in Netop Solutions A/S (81,746) (42,713) Minority shareholders - -
(81,746) (42,713)
35STATEMENT OF cOMPREhENSivE iNcOME
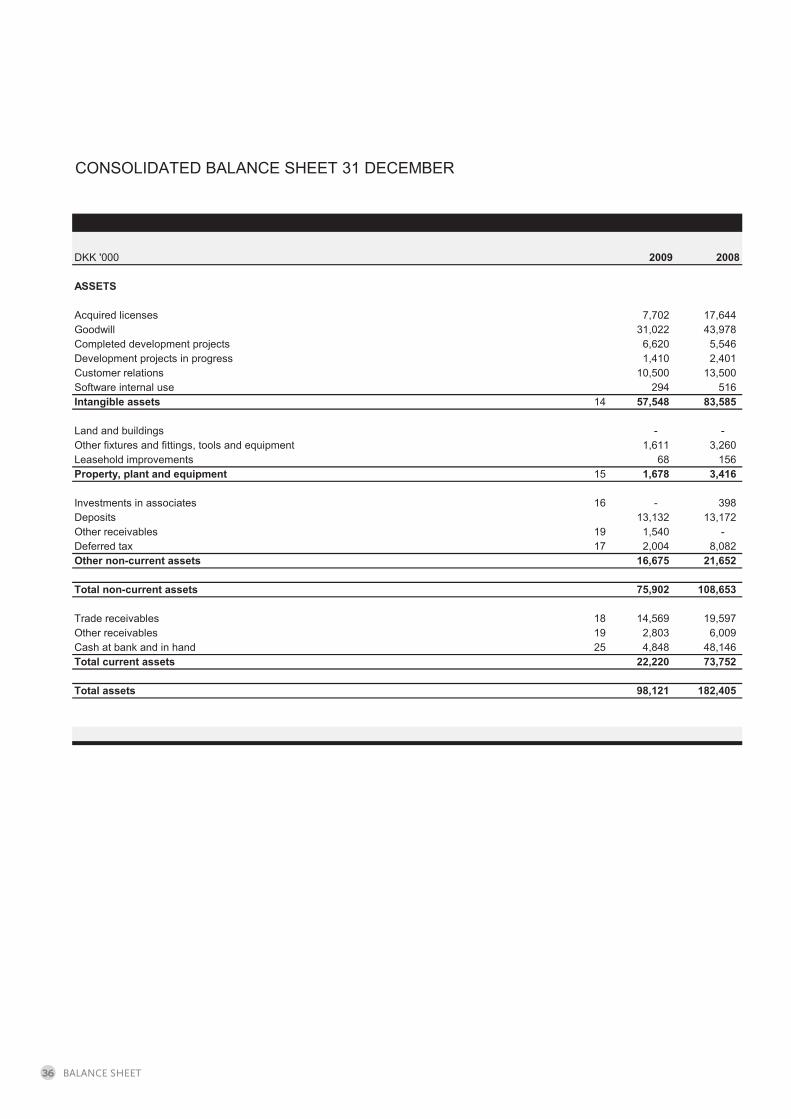
CONSOLIDATED BALANCE SHEET 31 DECEMBER
DKK '000 2009 2008
ASSETS
Acquired licenses 7,702 17,644 Goodwill 31,022 43,978 Completed development projects 6,620 5,546 Development projects in progress 1,410 2,401 Customer relations 10,500 13,500 Software internal use 294 516 Intangible assets 14 57,548 83,585
Land and buildings - - Other fixtures and fittings, tools and equipment 1,611 3,260 Leasehold improvements 68 156 Property, plant and equipment 15 1,678 3,416
Investments in associates 16 - 398 Deposits 13,132 13,172 Other receivables 19 1,540 - Deferred tax 17 2,004 8,082 Other non-current assets 16,675 21,652
Total non-current assets 75,902 108,653
Trade receivables 18 14,569 19,597 Other receivables 19 2,803 6,009 Cash at bank and in hand 25 4,848 48,146 Total current assets 22,220 73,752
Total assets 98,121 182,405
36 bALANcE ShEET
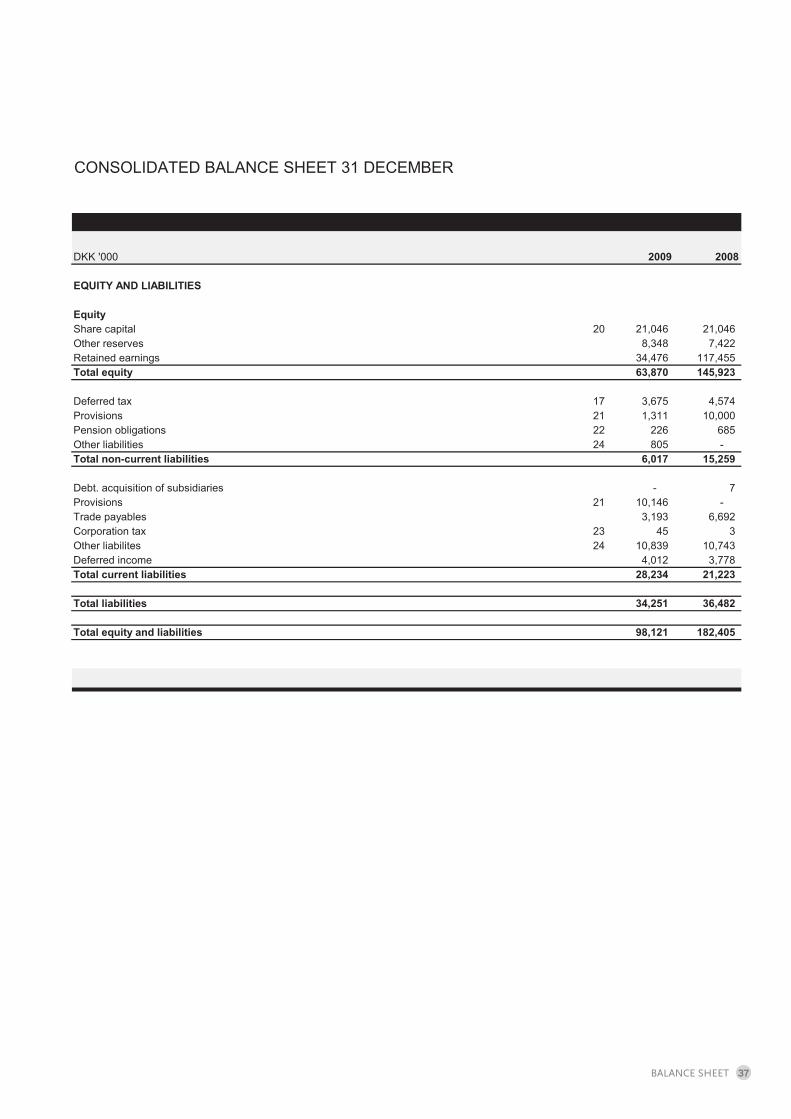
CONSOLIDATED BALANCE SHEET 31 DECEMBER
DKK '000 2009 2008
EQUITY AND LIABILITIES
EquityShare capital 20 21,046 21,046 Other reserves 8,348 7,422 Retained earnings 34,476 117,455 Total equity 63,870 145,923
Deferred tax 17 3,675 4,574 Provisions 21 1,311 10,000 Pension obligations 22 226 685 Other liabilities 24 805 - Total non-current liabilities 6,017 15,259
Debt. acquisition of subsidiaries - 7 Provisions 21 10,146 - Trade payables 3,193 6,692 Corporation tax 23 45 3 Other liabilites 24 10,839 10,743 Deferred income 4,012 3,778 Total current liabilities 28,234 21,223
Total liabilities 34,251 36,482
Total equity and liabilities 98,121 182,405
37bALANcE ShEET
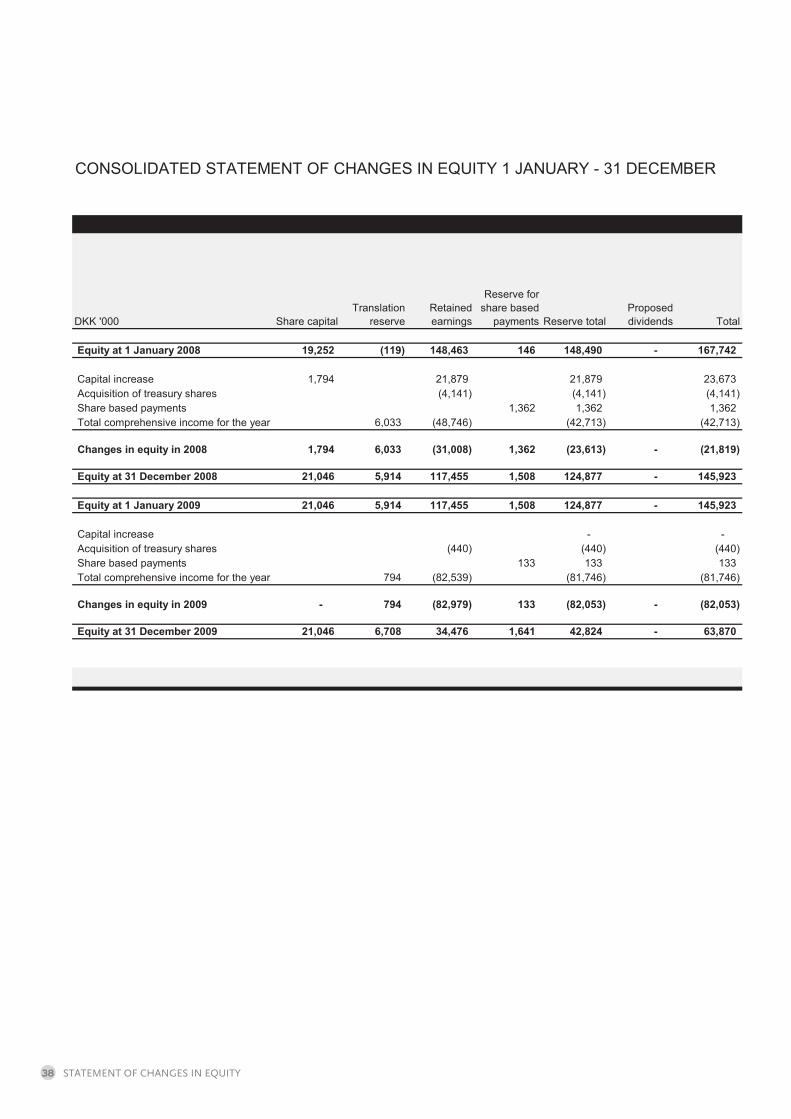
CONSOLIDATED STATEMENT OF CHANGES IN EQUITY 1 JANUARY - 31 DECEMBER
DKK '000
Equity at 1 January 2008 19,252 (119) 148,463 146 148,490 - 167,742
Capital increase 1,794 21,879 21,879 23,673 Acquisition of treasury shares (4,141) (4,141) (4,141) Share based payments 1,362 1,362 1,362 Total comprehensive income for the year 6,033 (48,746) (42,713) (42,713)
Changes in equity in 2008 1,794 6,033 (31,008) 1,362 (23,613) - (21,819)
Equity at 31 December 2008 21,046 5,914 117,455 1,508 124,877 - 145,923
Equity at 1 January 2009 21,046 5,914 117,455 1,508 124,877 - 145,923
Capital increase - - Acquisition of treasury shares (440) (440) (440) Share based payments 133 133 133 Total comprehensive income for the year 794 (82,539) (81,746) (81,746)
Changes in equity in 2009 - 794 (82,979) 133 (82,053) - (82,053)
Equity at 31 December 2009 21,046 6,708 34,476 1,641 42,824 - 63,870
Share capitalTranslation
reserveRetained earnings
Reserve for share based
payments Reserve totalProposed dividends Total
38 STATEMENT OF chANgES iN EqUiTy
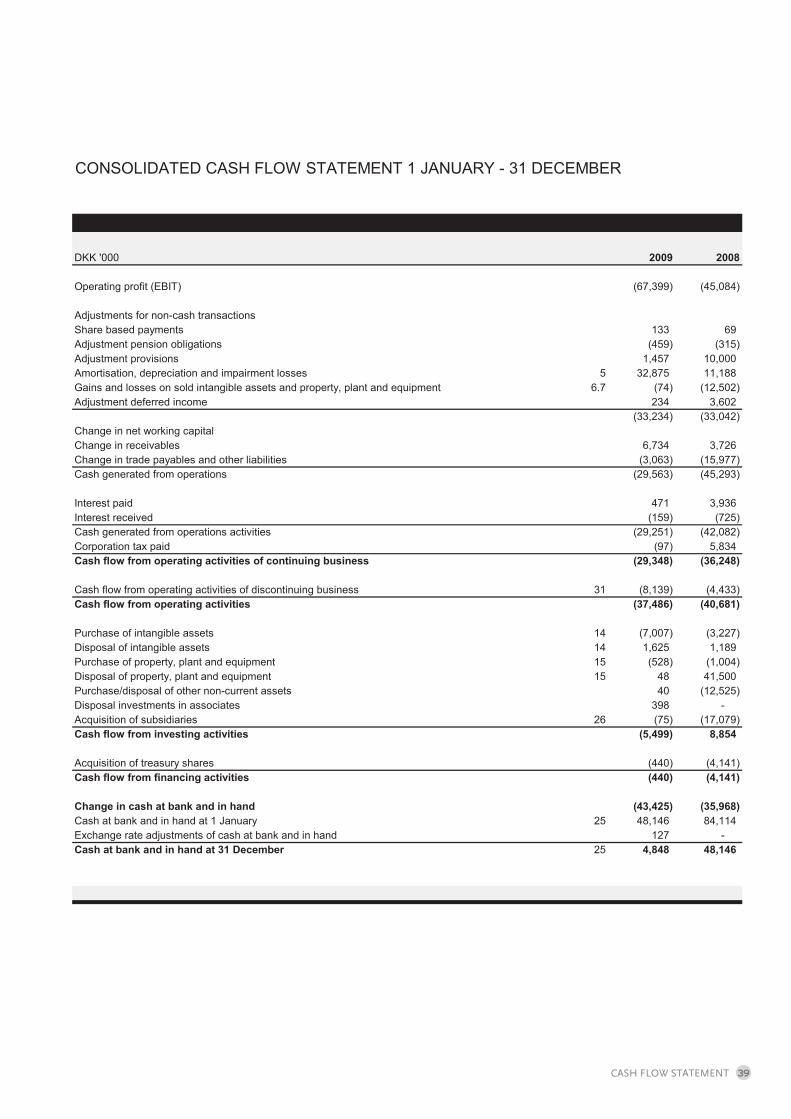
CONSOLIDATED CASH FLOW STATEMENT 1 JANUARY - 31 DECEMBER
DKK '000 2009 2008
Operating profit (EBIT) (67,399) (45,084)
Adjustments for non-cash transactionsShare based payments 133 69 Adjustment pension obligations (459) (315) Adjustment provisions 1,457 10,000 Amortisation, depreciation and impairment losses 5 32,875 11,188 Gains and losses on sold intangible assets and property, plant and equipment 6.7 (74) (12,502) Adjustment deferred income 234 3,602
(33,234) (33,042) Change in net working capitalChange in receivables 6,734 3,726 Change in trade payables and other liabilities (3,063) (15,977) Cash generated from operations (29,563) (45,293)
Interest paid 471 3,936 Interest received (159) (725) Cash generated from operations activities (29,251) (42,082) Corporation tax paid (97) 5,834 Cash flow from operating activities of continuing business (29,348) (36,248)
Cash flow from operating activities of discontinuing business 31 (8,139) (4,433) Cash flow from operating activities (37,486) (40,681)
Purchase of intangible assets 14 (7,007) (3,227) Disposal of intangible assets 14 1,625 1,189 Purchase of property, plant and equipment 15 (528) (1,004) Disposal of property, plant and equipment 15 48 41,500 Purchase/disposal of other non-current assets 40 (12,525) Disposal investments in associates 398 - Acquisition of subsidiaries 26 (75) (17,079) Cash flow from investing activities (5,499) 8,854
Acquisition of treasury shares (440) (4,141) Cash flow from financing activities (440) (4,141)
Change in cash at bank and in hand (43,425) (35,968) Cash at bank and in hand at 1 January 25 48,146 84,114 Exchange rate adjustments of cash at bank and in hand 127 - Cash at bank and in hand at 31 December 25 4,848 48,146
39cASh FLOw STATEMENT
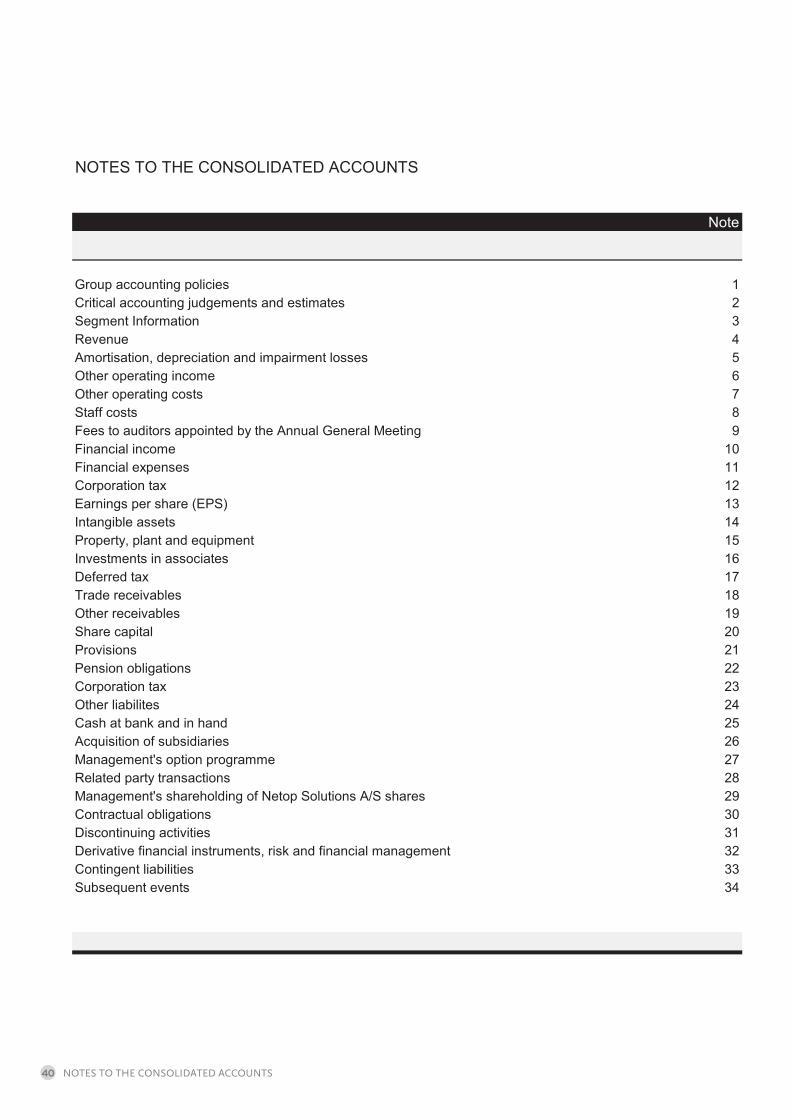
NOTES TO THE CONSOLIDATED ACCOUNTS
Group accounting policies 1Critical accounting judgements and estimates 2Segment Information 3Revenue 4Amortisation, depreciation and impairment losses 5Other operating income 6Other operating costs 7Staff costs 8Fees to auditors appointed by the Annual General Meeting 9Financial income 10Financial expenses 11Corporation tax 12Earnings per share (EPS) 13Intangible assets 14Property, plant and equipment 15Investments in associates 16Deferred tax 17Trade receivables 18Other receivables 19Share capital 20Provisions 21Pension obligations 22Corporation tax 23Other liabilites 24Cash at bank and in hand 25Acquisition of subsidiaries 26Management's option programme 27Related party transactions 28Management's shareholding of Netop Solutions A/S shares 29Contractual obligations 30Discontinuing activities 31Derivative financial instruments, risk and financial management 32Contingent liabilities 33Subsequent events 34
Note
NOTES TO ThE cONSOLidATEd AccOUNTS40
NOTES TO THE CONSOLIDATED ACCOUNTS
NOTE 1 GROUP ACCOUNTING POLICIES
Accounting policies for the Group Netop Solutions A/S is a public limited liability company incorporated in Denmark. The annual report for the year ended 31 December 2009 includes both the consolidated financial statements of Netop Solutions A/S and its subsidiaries (the Group) and the separate financial statements of the parent company. The consolidated financial statements are presented in accordance with the International Financial Reporting Standards as adopted by the EU and additional Danish disclosure requirements for annual reports of listed companies, cf. the disclosure requirements imposed by NASDAQ OMX Copenhagen on financial statements of listed companies, the Danish Financial Statements Act and the Danish Statutory Order on Adoption of IFRS issued in pursuance of the Danish Financial Statements Act. The annual report also complies with the International Financial Reporting Standards issued by the IASB. Basis of preparation Theannual report has been prepared under the historical cost convention, with the exception of derivative financial instruments used for hedging purposes. Non-current assets and disposal groups held for sale are measured at the lower of the carrying amount before the reclassification and the fair value less costs to sell. The accounting policies set out below have been consistently applied in the financial year and to the comparative figures. The annual report is presented in DKK rounded to the nearest thousand kroner. Changes in accounting policies Apart from as set out below, the accounting policies are unchanged from the policies applied in the Annual Report 2008. The 2009 income statement is classified by type of expenditure, unlike the income statements of 2008 and prior years in which
costs relating to ordinary operations were classified by function. The change has the sole effect of changing the presentation of costs related to ordinary operations and has no effect on the operating profit or the profit for the year. The change was made because the Group manages its costs by type more than by the function they are incurred for, making the change a logical step that is consistent with the Group‟s other reporting.
Implementation of new accounting standards Netop Solutions A/S implemented the following new or amended standards and interpretations as adopted by the EU, which have taken effect as from accounting periods commencing on 1 January 2009. IAS 1 (revised 2007), Presentation of financial statements
Implementation only entails a change in the presentation of the statement of changes to equity and, in turn, the implementation of the statement of comprehensive income. The statement of comprehensive income reflects all of the Group‟s income and costs in accordance with the income statement. Accordingly, the statement of changes in equity exclusively shows transactions with Netop shareholders. IAS 23 (revised 2007), Borrowing costs
The new standard requires that borrowing costs incurred for loans raised for the construction or development of intangible assets or property, plant and equipment are attributed to those assets. As Netop did not have such loans in 2009, the company is not affected by the change. IFRS 8, Operating segments.
This standard only affects the Group‟s segment information and requires that segment reporting is based on operating segments. This eliminates a previous requirement for business and geographical segment reporting. Implementation has led to changes in the note disclosures provided in note 3. The comparative figures for 2008 have been restated accordingly. The new standards and interpretations did not affect earnings per share or the diluted earnings per share. IASB has issued the following new financial reporting standards and interpretations that have not yet come into force. The standards and interpretations are not mandatory in the preparation of Netop‟s annual report for 2009: IFRS 3 Business combinations
NOTES TO ThE cONSOLidATEd AccOUNTS 41

NOTES TO THE CONSOLIDATED ACCOUNTS NOTE 1 GROUP ACCOUNTING POLICIES
Revised (IAS 24) IAS 27 “Consolidated and separate financial statements” Amendment of IAS 39 “Financial instruments: Recognition and measurement” IFRIC 12, Service concession arrangements Amendment to IFRIC 14, “The limit on a defined benefit asset, minimum funding requirements and their interaction” IFRIC 19 ”Extinguishing financial liabilities with equity instruments” Amendment of IAS 1, First-time adoption of IFRS Amendment of IFRS 2: “Share-based payment” IFRS 9 “Measurement and classification of financial assets” Amendment to IAS 32 “Financial Instruments: Presentation” Improvements to IFRSs (May 2008) Improvements to IFRSs (April 2009) The above-listed amendments and new standards and interpretations IAS 24, amendments to IFRS 1 and 2, IFRS 9, ”Improvements to IFRSs (April 2009)”, IFRIC 19 and amendments to IFRIC 14 have not yet adopted by the EU. The Netop Group expects to implement the new financial reporting standards in connection with its financial reporting in respect of 2010 and 2011, when they become mandatory. The amendments and interpretations are not expected to affect the amounts of the Netop Group‟s profit/loss, assets or liabilities and equity when taking effect. Consolidation The consolidated financial statements consolidate the financial statements of the parent company, Netop Solutions A/S, and subsidiaries in which Netop Solutions A/S directly or indirectly holds more than 50% of the voting rights or in any other way exercises a controlling interest. Companies in which the Group holds between 20% and 50% of the voting rights and exercises a significant influence but not control are considered associates. An assessment of whether Netop Solutions A/S exercises control or a significant influence takes potential voting rights into consideration. See the Group overview on page 32. The consolidated financial statements are prepared by adding the audited financial statements of the parent company and the individual subsidiaries, all of which are prepared in accordance with the Group‟s accounting policies. In the consolidation, intra-group income and expenses, shareholdings, balances, dividends and realised and unrealised intra-group gains and losses are eliminated. Investments in subsidiaries are eliminated by the proportionate share of the subsidiaries‟ fair value of identifiable net assets and recognised contingent liabilities at the date of acquisition. Business combinations Newly acquired or newly established companies are recognised in the consolidated financial statements from the date of acquisition. Companies divested or wound up are included in the consolidated income statement until the date of disposal. Comparative figures are not restated to reflect acquisitions. Discontinued operations are presented as a separate item. See below. The purchase method is applied on acquisitions if the parent company gains control of the company acquired. Identifiable assets, liabilities and contingent liabilities in companies acquired are measured at the fair value at the date of acquisition. Identifiable intangible assets are recognised if they can be separated or arise from a contractual right and the fair value can be reliably measured. Deferred tax on revaluations made is recognised.
NOTES TO ThE cONSOLidATEd AccOUNTS42
NOTES TO THE CONSOLIDATED ACCOUNTS NOTE 1 GROUP ACCOUNTING POLICIES
For business combinations effected on or after 1 January 2004, any excess of the cost of acquisition over the fair value of the acquired identifiable assets, liabilities and contingent liabilities is recognised as goodwill under intangible assets. Goodwill is not amortised, but is tested for impairment annually. The first impairment test is performed before the end of the year of acquisition. On acquisition, goodwill is transferred to the cash-generating units which will subsequently form the basis for future impairment tests. Any goodwill arising and any fair value adjustments made on the acquisition of a foreign entity whose functional currency is not the same as the Group‟s presentation currency are treated as assets and liabilities of the foreign entity and translated to the foreign entity‟s functional currency at the exchange rate at the transaction date. Any excess of the fair value over the cost of acquisition (negative goodwill) is recognised in the income statement at the acquisition date. For business combinations made before 1 January 2004, the classification under the previous accounting policy is maintained. Goodwill is recognised based on the cost recognised under the previous accounting policy (Danish Financial Statements Act and Danish accounting standards) less amortisation and impairment up to 31 December 2003. Goodwill is not amortised after 1 January 2004. The cost of a company is the fair value of the agreed consideration paid plus costs directly attributable to the acquisition. If parts of the consideration are conditional on future events, such parts of the consideration are recognised in cost to the extent the events are likely and the consideration can be reliably measured. If the measurement of acquired identifiable assets, liabilities and contingent liabilities is subject to uncertainty at the time of acquisition, initial recognition will be made on the basis of a preliminary calculation of fair values. If it later turns out that the identifiable assets, liabilities and contingent liabilities had a different fair value at the time of acquisition than that originally assumed, goodwill will be adjusted until 12 months after the acquisition. The effect of the adjustments will be recognised in the opening equity, and comparative figures will be restated accordingly. Henceforth, goodwill will be adjusted only to reflect changes in estimates of contingent consideration, apart from material errors. However, where the acquired company‟s deferred tax assets not recognised at the date of acquisition are subsequently realised, the tax benefit is recognised in the income statement and the carrying amount of goodwill will concurrently be written down to such amount as would have been recognised had the deferred tax asset been recognised as an identifiable asset at the date of acquisition. Any gains or losses on the disposal of subsidiaries and associates are stated as the difference between the sales sum or the proceeds from the winding-up and the carrying amount of net assets, including goodwill, at the date of disposal net of expenses for selling or winding-up. Foreign currency translation Functional currency A functional currency is determined for each of the group‟s companies. The functional currency is the currency used in the pr imary financial environment in which the individual enterprise operates. Transactions in currencies other than the functional currency are transactions in foreign currencies. Translation of transactions and amounts The presentation currency of the consolidated financial statements is Danish kroner (DKK), which is the functional and presentation currency of the parent company. On initial recognition, transactions denominated in foreign currency are translated at the exchange rate ruling on the transaction date. Exchange differences arising between the exchange rate at the transaction date and the date of payment are recognised in the income statement as financial income or expenses. Receivables, payables and other monetary items denominated in foreign currency are translated at the exchange rates ruling at the balance sheet date. The difference between the exchange rate ruling on the balance sheet date and the exchange rate at the date when the receivable or payable arose or was recorded in the most recent annual financial statements is recognised in the income statement under financial income or expenses. Translation of subsidiaries On consolidation of companies with functional currencies other than DKK, the income statements are translated at the exchange rate ruling at the transaction date and the balance sheets at the exchange rate ruling at the balance sheet date. The average exchange rate for each individual month is used as the rate at the transaction date, provided this does not give a much different view. Exchange differences arising on the translation of the opening equity of such companies at the exchange rates ruling at the balance sheet date and on the translation of the income statement from the exchange rates ruling at the transaction date to the exchange rates ruling at the balance sheet date are taken directly to equity in a separate reserve for currency translation. INCOME STATEMENT Revenue Sales of software are recognised at the time when software licenses are configured for the end user or when delivery and transfer of risk to the distributor have taken place, and when the income can be measured reliably and is expected to be received.
NOTES TO ThE cONSOLidATEd AccOUNTS 43

NOTES TO THE CONSOLIDATED ACCOUNTS
NOTE 1 GROUP ACCOUNTING POLICIES
Income from license agreements according to which the purchaser is entitled to implement some of the group‟s products for a group of end users is recognised at the invoice date. Income from subscription agreements is recognised according to the straight-line amortisation method over the term of the subscription period. Other income is recognised in the income statement when delivery of services has taken place. Revenue is recognised excluding VAT, taxes and discounts related to sales. Direct costs Direct costs comprise costs directly attributable to consumables and royalty costs for the use of software to which the Netop Group does not hold the rights to the software. Other operating income and expenses This item contains income and expenses not related to revenue or to any other income statement items. Most often, this comprises items of a secondary nature relative to the companies‟ activities, including gains and losses on regular sales and replacement of intangible assets and property, plant and equipment. Gains and losses on the disposal of intangible assets and property, plant and equipment are computed as the difference between the selling price and the carrying amount at the date of disposal. External costs External costs include costs incurred during the year for office premises, losses on trade receivables, marketing expenses, consultants‟ fees, including external audit fees and legal assistance, communication costs, minor acquisitions, hardware and software leasing expenses as well as general administrative expenses. Depreciation, amortisation and impairment Depreciation, amortisation and impairment covers ordinary straight-line amortisation of intangible assets and depreciation of property, plant and equipment during the financial year as well as write-downs made on the basis of impairment tests and general assessments by management. Staff costs Staff costs include all staff costs incurred during the year, including all wages and salaries to staff in Denmark and abroad, pension costs, social security costs and other staff-related costs. Results of investments in associates in the consolidated financial statements The proportionate share of the profit or loss of associates after tax and minorities and elimination of the proportionate share of intra-group gains or losses is recognised in the consolidated income statement. Financial income and expenses Financial income and expenses include interest receivable and payable, capital gains and losses on securities, payables and transactions in foreign currency, amortisation of financial assets and liabilities, as well as additions and reimbursements under the on-account tax scheme, etc. Financial income and expenses are recognised in the amounts relating to the financial year. Tax on profit/loss for the year Netop Solutions A/S is taxed jointly with all Danish group companies. The current income tax liability is allocated among the companies of the tax pool in proportion to their taxable income (full allocation subject to reimbursement in respect of tax losses). The jointly taxed companies pay tax under the Danish on-account tax scheme. Tax for the year, consisting of the year‟s current tax and movements in deferred tax, is recognised in the income statement as regards the amount that can be attributed to the profit/loss for the year and posted directly in equity as regards the amount that can be attributed to movements taken directly to equity. Tax recognised in the income statement is classified under tax on profit from ordinary activities or tax on profit from extraordinary activities. BALANCE SHEET Intangible assets Goodwill On initial recognition, goodwill is recognised in the balance sheet at cost as described under “Business combinations”. Subsequently, goodwill is measured at cost less accumulated impairment. Goodwill is not amortised. The carrying amount of goodwill is allocated to the Group‟s cash-generating units at the date of acquisition. The determination of cash-generating units is based on the management structure and the in-house financial management.
NOTES TO ThE cONSOLidATEd AccOUNTS44

NOTES TO THE CONSOLIDATED ACCOUNTS
NOTE 1 GROUP ACCOUNTING POLICIES
The carrying amount of goodwill is tested at least once a year for impairment together with the other non-current assets of the cash-generating unit to which the goodwill has been allocated, and is written down to the recoverable amount through the income statement if this is lower than the carrying amount. The recoverable amount is generally calculated as the present value of the future net cash flows expected to be derived from the business or activity (cash-generating unit) to which the goodwill relates. Goodwill impairment write-downs are recognised under depreciation, amortisation and impairment in the income statement. Development projects and acquired licenses Development costs comprise salaries, depreciation and amortisation and other costs directly or indirectly attributable to the company's development activities. Development projects which are clearly defined and identifiable, where the level of technical utilisation, sufficient resources and a potential future market or business opportunity for the company can be demonstrated and where the intention is to manufacture, market or utilise the project are recognised as intangible assets if the cost can be reliably measured and there is sufficient certainty that the future earnings can cover production and selling costs, administrative expenses and the specific product development costs. Other development costs are recognised in the income statement when incurred. Recognised development costs are measured at the lower of cost less accumulated depreciation/amortisation and write-downs and the recoverable amount. On completion of a development project, the development costs are amortised on a straight-line basis over the estimated useful life. The usual amortisation period is from one to five years. The basis of amortisation is reduced by any impairment write-downs. . Acquired licenses are measured at cost less accumulated amortisation. Licenses are amortised over the term of the agreement, up to a maximum of five years. Intangible assets are written down to the lower of the recoverable amount and the carrying amount. Each year, the individual assets or groups of assets are tested for impairment. Gains and losses on the disposal of development projects, patents and licenses are stated as the difference between the selling price less selling expenses and the carrying amount at the date of sale. Gains and losses are recognised in the income statement under Other operating income and expenses. Software is measured at cost less accumulated depreciation and impairment. Software is amortised on a straight-line basis, generally over five years. The basis of amortisation is reduced by any impairment write-downs. Intangible assets with indefinable useful lives are not amortised, but tested annually for impairment. Property, plant and equipment Land and buildings, leasehold improvements and other facilities, plant and machinery are measured at cost less accumulated depreciation. Cost encompasses the acquisition price and costs directly associated with the purchase until the time when the asset is ready to be brought into use. The depreciation base is cost less the estimated residual value at the end of the expected useful life. Assets are depreciated on a straight-line basis over their estimated useful lives based on the following assessment of the expected use lives of the assets: Buildings: 20 – 50 years Other plant, fixtures and fittings, tools and equipment 3 – 5 years Leasehold improvements 5 years Depreciation is recognised in the income statement under depreciation, amortisation and impairment. Property, plant and equipment are written down to the lower of the recoverable amount and the carrying amount. Impairment of long-term assets Goodwill and intangible assets with indefinable useful lives are tested annually for impairment, the first time before the end of the year of acquisition. Similarly, development projects in progress are tested for impairment annually. Deferred tax assets relating to tax-loss carryforwards are reviewed annually and recognised only to the extent that it is probable that they will be utilised. The carrying amounts of other non-current assets are tested annually to determine whether there is any indication of impairment. If such an indication exists, the recoverable amount of the asset is calculated. The recoverable amount is the higher of the fair value of the asset less costs to sell and the value in use. The value in use is determined as the present value of expected future cash flows of the asset or the cash-generating unit, which the asset is a part of.
NOTES TO ThE cONSOLidATEd AccOUNTS 45

NOTES TO THE CONSOLIDATED ACCOUNTS NOTE 1 GROUP ACCOUNTING POLICIES
An impairment loss is recognised when the carrying amount of an asset or a cash-generating unit exceeds the recoverable amount of the asset or the cash-generating unit. Impairment losses are recognised in the income statement under the items Other operating income or Other operating expenses. Impairment write-downs of goodwill are not reversed. Impairment losses on other assets are reversed to the extent changes have occurred to the assumptions and estimates on which the impairment loss was based. Write-downs are only reversed to the extent the new carrying amount of an asset does not exceed the carrying amount the asset would have had net of depreciation, had the asset not been written down. Gains and losses on disposal of property, plant and equipment are computed as the difference between the selling price less costs to sell and the carrying amount at the date of disposal. Gains and losses are recognised in the income statement under other the item Other operating income and expenses. Investments in associates in the consolidated financial statements Investments in associates are measured using the equity method. Investments in associates are measured in the balance sheet at the proportionate share of the companies‟ net asset value calculated in accordance with the Group‟s accounting policies with deduction or addition of the proportionate share of unrealised intra-group gains and losses and with addition of the carrying amount of goodwill. Associates with negative equity value are measured at zero value. If the Group has a legal or constructive obligation to cover the associate‟s negative balance, such obligation is recognised under liabilities. Receivables from associates are written down to the extent they are deemed to be irrecoverable. Investments in subsidiaries and associates in the parent company’s financial statements Investments in subsidiaries and associates are measured at cost. Where the recoverable amount is lower than cost, the investments are written down to this lower value. The cost is reduced to the extent that dividend distributed exceeds the accumulated earnings after the takeover date. Receivables Receivables are measured at amortised cost. Receivables are written down for anticipated losses. Prepayments Prepayments recognised under Other receivables comprise costs incurred relating to the following financial year and are measured at cost. EQUITY Dividend Proposed dividends are recognised as a liability at the time of approval by the shareholders in general meeting (the date of declaration). Dividends expected to be paid in respect of the financial year are stated as a separate line item under equity. Interim dividend is recognised as a liability at the date of resolution. Treasury shares The purchase and sale of treasury shares and dividends thereon are taken directly to retained earnings under equity. Gains and losses on the sale of treasury shares are thus not recognised in the income statement. Exchange adjustment reserve The exchange adjustment reserve in the consolidated financial statements comprises foreign exchange differences arising on the translation of the financial statements of foreign enterprises from their functional currencies to the parent company‟s presentation currency. On full or partial realisation of a net investment, foreign exchange adjustments are recognised in the income statement. Incentive plans Netop Business Solutions A/S‟s incentive plans comprise share option programmes and warrant programmes. Share option programmes The value of services received as consideration for options granted is measured at the fair value of the options at the date of grant using the Black & Scholes formula, with due consideration for the individual employee‟s own payment once the incentives are exercised at a later point in time. For equity-settled share options, the fair value is measured at the grant date and recognised in the income statement under staff costs over the vesting period. The balancing item is recognised directly in equity. On initial recognition of share options, the number of options expected to vest is estimated. See the condition of service described in note 27.
NOTES TO ThE cONSOLidATEd AccOUNTS46

NOTES TO THE CONSOLIDATED ACCOUNTS NOTE 1 GROUP ACCOUNTING POLICIES
Subsequently, changes in the estimated number of vested options are adjusted to the effect that the total amount recognised is based on the actual number of vested options. At the time of exercise – i.e. when an option is exercised by way of subscription of new contributed capital – payments and any share premiums are recognised directly in equity. Warrant programmes Netop Solutions has established equity-settled share-based payment plans (warrant programs). The employee services received in exchange for the grant of the warrants or shares are recognised as an expense and allocated over the vesting period. The amount is determined as the fair value of the equity instruments granted. The total amount recognised over the vesting period corresponds to the fair value of the warrants or shares that actually vest. In addition, a warrant program has been established as part of the purchase price in a company acquisition. This program is recognised as a direct equity-based scheme and is not subject to ongoing adjustment, because the acquisition date represents the vesting period. At each balance sheet date, Netop reassesses its estimates of the number of warrants expected to be exercised and recognises the effect in the income statement through a corresponding adjustment of equity. Income tax and deferred tax Current tax liabilities and current tax receivables are recognised in the balance sheet as calculated tax on the taxable income for the year, adjusted for tax on prior years‟ taxable income and for tax paid under the on-account tax scheme. Deferred tax is measured in accordance with the balance sheet liability method on all temporary differences between the carrying amount and tax base of assets and liabilities. However, no deferred tax is recognised on temporary differences regarding non-deductible goodwill, office property or other items for which temporary differences – with the exception of acquisitions – have arisen at the acquisition date without either profit/loss for the year or taxable income being affected. When the tax value can be calculated according to alternative taxation rules, deferred tax is measured on the basis of the planned usage of the tax asset or settlement of the tax liability, as the case may be. Deferred tax assets, including the tax value of tax losses carried forward, are recognised under other non-current assets at the value at which they are expected to be used, either by setting off tax on future earnings or by setting off deferred tax liabilities within the same legal tax entity and jurisdiction. Deferred tax adjustments are made regarding eliminations of unrealised intercompany gains and losses. Deferred tax is measured based on the tax rules and rates in the respective countries that will apply under the legislation in force on the balance sheet date when the deferred tax asset is expected to crystallise as current tax. Changes in deferred tax resulting from changes in tax rates are recognised in the income statement. Provisions Provisions are recognised when, as a consequence of an event that has occurred before or on the balance sheet date, the Group has a legal or constructive obligation, and it is likely that economic benefits must be given up to meet the obligation. In the measurement of provisions, the costs necessary to settle the liability are discounted if such discounting would have a material effect on the measurement of the liability. The changes in present values for the financial year are recognised in financial expense. Provisions are measured as Management‟s best estimate of the amount which is expected to be required to settle the liability. Pension obligations In most of its countries of operation, the Group operates defined contribution plans. Obligations imposed on the Group in relation to such plans and under which the Group regularly pays fixed contributions into an independent pension fund, are recognised in the income statement in the period to which they relate, and outstanding payments are recognised in the balance sheet under other payables. In one country, the Group still has defined benefit plans. Costs related to this plan are calculated annually on the basis of actuarial estimates. Costs reflect the present value of future benefits payable under the pension plan. The calculation of the present value builds upon assumptions such as the future developments of factors such as wages and salaries, interest rates, inflation and mortality rates. The present value is calculated solely for those benefits that have been earned by the employees in return for past service rendered to the Group. The actuarial calculation of the net present value less the fair value of any assets related to the plan is included in the balance sheet as pension obligations.
NOTES TO ThE cONSOLidATEd AccOUNTS 47

NOTES TO THE CONSOLIDATED ACCOUNTS
NOTE 1 GROUP ACCOUNTING POLICIES
The actuarial gains and losses are recognised as an income or an expense if the accumulated unrealised gains and losses exceed the higher numerical value of 10% of the defined benefit compared with prior reporting and the value of the underlying asset plan at the reporting date. A defined benefit plan that constitutes a net asset is recognised only to the extent future economic benefits will flow to the Group through reimbursements from the pension plan or a reduction of future benefits. Financial liabilities Other creditors, which comprise trade creditors and affiliated and associated companies and other creditors, are measured at amortised cost. Prepayments Accruals and deferred income comprises payments received relating to income in subsequent financial years, measured at cost. Assets held for sale Assets held for sale comprise non-current assets and disposal groups held for sale. A disposal group is a group of assets to be disposed of, by sale or otherwise, together as a group in a single transaction. Liabilities regarding assets held for sale are liabilities directly associated with those assets that will be transferred in the transaction. Assets are classified as “held for sale” if their carrying amount will be recovered principally through a sale transaction within 12 months in accordance with a formal plan rather than through continuing use. Assets or disposal groups held for sale are measured at the lower of the carrying amount at the date when the assets were classified as held for sale and fair value less costs to sell. Assets are not depreciated or amortised as from the date they are classified as “held for sale”. Impairment losses occurring in connection with the initial classification as “assets held for sale”, and gains or losses in relation to subsequent measurement at the lower of the carrying amount and fair value less costs to sell are recognised in the income statement under the items to which they relate. Gains and losses are disclosed in the notes to the financial statements. Assets and related liabilities are recognised separately in the balance sheet, and the main items are specified in the notes to the financial statements. Comparative figures in the balance sheet are not restated. Presentation of discontinued operations Discontinued operations form a substantial part of a business if its activities and cash flows can be clearly distinguished, operationally or for financial reporting purposes, from the rest of the entity. In addition, the entity must have either been divested or classified as held for sale and such sale pursuant to a formal plan is expected to take place within 12 months. Profit on discontinued operations after tax and value adjustments of related assets and liabilities after tax and gains/losses from a sale are reported under a separate line item with comparable figures in the income statement. Revenue, costs, revaluations and tax for discontinued operations are disclosed in the notes to the financial statements. Assets and related liabilities for discontinued operations are recognised separately in the balance sheet and the comparative figures are not restated, cf. the section „assets held for sale‟, and the main items are disclosed in the notes to the financial statements. Cash flows from operating, investing and financing activities of discontinued operations are disclosed in a note to the financial statements. CASH FLOW STATEMENT The cash flow statement shows the cash flows for the year, broken down by operating, investing and financing activities, and the year's changes in cash and cash equivalents as well as the Group‟s cash and cash equivalents at the beginning and end of the year. The cash effect of acquisitions and divestments is shown separately under cash flows from investing activities. In the cash flow statement, cash flows relating to acquired undertakings are recognised from the date of acquisition, while cash flows relating to divested undertakings are recognised up until the date of divestment. Cash flows in currencies other than the functional currency are translated at average exchange rates unless these differ materially from the exchange rate ruling at the transaction day. Cash flow from operating activities Cash flows from operating activities are calculated using the indirect method as the profit for the year before tax adjusted for non-cash operating items, changes in working capital, interest received and interest paid, dividends received and income taxes paid. Cash flows from investing activities Cash flows from investing activities comprise payments made in connection with the acquisition and disposal of companies and activities and of intangibles, property, plant and equipment and investments. The cash effect of acquisitions and disposals of entities is disclosed separately.
NOTES TO ThE cONSOLidATEd AccOUNTS48
NOTES TO THE CONSOLIDATED ACCOUNTS NOTE 1 GROUP ACCOUNTING POLICIES
Cash flows from financing activities Cash flows from financing activities comprise changes in the size or composition of the group‟s share capital and associated costs and the raising of loans, repayment of interest-bearing debt and dividend payments to shareholders. Cash and cash equivalents Cash includes cash at bank and in hand as well as short-term securities with a maturity of less than three months that can readily be converted into cash and that involve insignificant risk of value fluctuations. SEGMENT INFORMATION The Group develops and sells standard software. Segment reporting reflects the three main product lines used in the internal management reporting for performance follow-up and resource allocation. This information is disclosed in note 3 to the financial statements. FINANCIAL RATIOS Earnings per share (EPS) and diluted earnings per share (EPS-D) are calculated in accordance with IAS 33. Other key ratios are calculated in accordance with "Recommendations and Ratios 2005" issued by the Danish Society of Financial Analysts. The ratios provided in the financial highlights are calculated in the following manner: EBITDA margin EBITDA / revenue * 100 EBIT margin Operating profit / revenue * 100 Equity ratio Equity at year end / total assets at year end * 100 Equity ratio Equity at year end / total equity and liabilities at year end * 100 Return on equity Profit/(Loss) for the year / average equity * 100 Earnings per share (EPS) Profit/(Loss) for the year / average number of shares Diluted earnings per share (EPS-D) Profit/(Loss) for the year / average number of diluted shares Net asset value per share Equity at year-end / number of shares at year-end Price/net asset value (P/BV) Market price/net asset value P/E Share price / earnings per share (EPS) Cash flows from operating activities per share Cash flows from operating activities / average number of shares EBITDA Operating profit/loss before depreciation and amortisation EBIT Operating profit/loss
NOTES TO ThE cONSOLidATEd AccOUNTS 49

NOTES TO THE CONSOLIDATED ACCOUNTS
NOTE 2 CRITICAL ACCOUNTING JUDGEMENTS AND ESTIMATES
Uncertainty relating to estimates The calculation of the carrying amounts of certain assets and liabilities relies on judgments, estimates and assumptions about future events. The estimates and assumptions applied are based on historical experience and other factors that Management considers reasonable under the circumstances, but which are inherently uncertain and unpredictable. Such assumptions may be incomplete or inaccurate, and unexpected events or circumstances may occur. In addition, the company is subject to risks and uncertainties that may cause actual outcomes to deviate from these estimates. Risk factors specific to the Netop Solutions Group are described in “Risk factors” on page 29 and in note 27. It may be necessary to change previous estimates as a result of changes to the assumptions on which the estimates were based or due to new information or subsequent events. Due to developments in the global economy and the crisis that has devastated the financial markets, some assumptions about the future have changed relative to prior years. This applies to, for instance, credit risks, sales volumes and other areas. Estimates material to the financial reporting are made in the calculation of, inter alia, impairment losses, provisions as well as contingent liabilities and assets. Goodwill impairment test In the annual goodwill impairment test or in case of any indication of impairment, an assessment is made as to whether the parts of the business (cash-generating units) to which the goodwill relates will be able to generate sufficient cash flows in future to support the value of goodwill and other net assets in the relevant part of the business. As a result of the nature of the company‟s business, expected cash flows must be estimated over a period of a number of years , which inherently produces some degree of uncertainty. This uncertainty is reflected in the discount rate applied. The impairment test and the associated particularly sensitive factors are described in note 2 to the consolidated financial statements. Impairment testing of development projects Ongoing development projects are tested annually for impairment. All ongoing development projects are progressing to plan, and we have no information from customers or the competition that would indicate that the new products will not be sold in the expected volumes. Based on the above, management has estimated the recoverable amounts of the development projects by way of expected future net cash flows including costs of completion. In addition, management has not found evidence of impairment in the completed development projects amortised on a straight-line basis over a useful life of from one to three years. Accordingly, completed development projects have not been tested for impairment. Receivables Receivables are measured at cost less impairment losses due to failure to pay. Management estimates losses in connection with an assessment of the likelihood that receivables at the balance sheet date will be received. Such assessment also considers the international economic situation, as it may strongly influence the risk of losses of doubtful debts. See note 18. Deferred tax Deferred tax assets are recognised for all unutilised tax losses if management considers it likely that they can be utilised within a foreseeable future by offsetting against future positive taxable income. Management performs such assessment annually using budgets and business plans as a decision-making basis for estimating the size of the deferred tax assets. Note 17 provide further information about assumptions applied and the amounts of deferred tax assets.
NOTES TO ThE cONSOLidATEd AccOUNTS50

NOTES TO THE CONSOLIDATED ACCOUNTS
NOTE 3 SEGMENT INFORMATION
DKK '000
2009Admini-stration Education
Communi-cation Total
Segment income statementExternal revenue 40,826 36,163 3,423 80,412 Financial items (net) - - - - Depreciation and amortisation (3,771) (5,794) (531) (10,096) Income form investments in associates - - - - Reportable segment's result before tax (18,368) (1,990) (89) (20,447)
Other segment itemsSegmentaktiver 4,222 51,191 1,593 57,005 Additions to property, plant and equipment and intangible assets 2,175 3,482 343 6,000 Impairment losses (recognised in the income statement) 20,068 865 - 20,933 Investments in associates - - - - Segment liabilities - 10,000 - 10,000
2008Admini-stration Education
Communi-cation Total
Segment income statementExternal revenue 54,516 32,172 2,034 88,722 Financial items (net) - - - - Depreciation and amortisation (2,930) (3,167) (258) (6,355) Distributed as follows: - - - - Reportable segment's result before tax 15,486 7,701 429 23,616
Other segment itemsSegmentaktiver 27,248 52,498 1,750 81,495 Additions to property, plant and equipment and intangible assets 777 - 2,050 2,827 Impairment losses (recognised in the income statement) 2,000 - - 2,000 Investments in associates 398 - - 398 Segment liabilities - 10,000 - 10,000
NOTES TO ThE cONSOLidATEd AccOUNTS 51

NOTES TO THE CONSOLIDATED ACCOUNTS
NOTE 3 SEGMENT INFORMATION
DKK '000 2009 2008
Products and services
Administration 40,826 54,516Education 36,163 32,172Communication 3,423 1,442Others 4,875 3,355
85,287 91,485
Geographic information
RevenueNon-current
assets RevenueNon-current
assets
USA 34,865 3,409 31,785 1,870 Denmark 15,803 71,695 17,428 105,042 Germany 8,774 - 11,507 521 Great Britain 5,207 62 6,905 569 Romania 4,875 501 3,355 173 Other countries 17,318 234 21,097 478 Discontinued business (primary Denmark) (1,555) - (592) -
85,287 75,902 91,485 108,653
Important customers
2009 2008
As mentioned under ‘Accounting policies’, Netop implemented IFRS 8 in 2009. The implementation does not affect the recognition of amounts within the segments, but it does change the composition of reporting segments. In the 2008 annual report, the primary segments were broken down by geography and the secondary segments by product groups. In 2009, Netop’s primary reporting segments are i ts three core product areas of Administration, Education and Communication.
It is relatively easy to identify these segments, even though all of the Group’s legal entities have operations within all th ree segments. The segments have different customers and end users, and the products are very different from segment to segment and are based ondifferent technologies.
The three core product groups account for nearly all of our consolidated revenue. There is also a fourth revenue category, ‘O ther’, but given its very limited and varied extent, it is not considered a separate reporting segment. Income and costs contained in the segment results are, when they can be reliably measured, directly or indirectly distributed to each segment. Indirect costs are broken down by each segment’s share of total revenue.
Both current and non-current assets of a segment are distributed when they are used directly in the operations of a segment.
External revenue is distributed on individual countries when the Group generates more than 5% of consolidated revenue in that country. Other revenue is shown under ‘Other countries’. Revenue is broken down geographically on the basis of customers’ geographical location. Non-current assets are broken down on the basis of physical location. If less than 10% of total non-current assets are located in a single country, they are shown under ‘Other countries’.
No single end-customer accounted for more than 10% of consolidated revenue in 2009. This was also the case in 2008.
NOTES TO ThE cONSOLidATEd AccOUNTS52

NOTES TO THE CONSOLIDATED ACCOUNTS
NOTE 3 SEGMENT INFORMATION
DKK '000 2009 2008
RevenueReportable segments' revenue 80,412 88,722 All other segments' revenue 8,188 3,355 Elimination of internal revenue between segments (1,758) - Revenue for discontinuing business (1,555) (592) Consolidated revenue 85,287 91,485
ResultatReportable segment's result before tax (20,447) 23,616 All other segments' revenue 4,875 3,355 Result of discontinuing business 8,891 4,801 Non-allocated group costs, central functions (61,192) (84,888) Profit before tax af continuing business (67,873) (53,116)
AssetsReportable segments' assets 57,005 81,495 All other segments' assets - - Other non-allocated assets 41,116 100,910 Consolidated total assets 98,121 182,405
LiabilitiesReportable segments' liabilites 10,000 10,000 All other segments' liabilities - - Other non-allocated liabilites 24,251 26,482 Consolidated total liabilites 34,251 36,482
Other important items - financial items, (net)Total for reportable segments - - Reconciliation items (474) (8,032) Other important items - consolidated financial items, (net) (474) (8,032)
Andre væsentlige poster - depreciation and amortisationTotal for reportable segments 10,096 6,355 Reconciliation items 2,571 3,201 Other important items - consolidated depreciation and amortisation 12,666 9,556
Reconciliation of reportable segment's revenue, results, assets, liabilities and other important items
Reconciling items under ‘Other material items’ mainly consist of non-allocated items for head office functions and items relating to the other operating segments that are not reporting segments.
NOTES TO THE CONSOLIDATED ACCOUNTS
NOTE 3 SEGMENT INFORMATION
DKK '000 2009 2008
Products and services
Administration 40,826 54,516Education 36,163 32,172Communication 3,423 1,442Others 4,875 3,355
85,287 91,485
Geographic information
RevenueNon-current
assets RevenueNon-current
assets
USA 34,865 3,409 31,785 1,870 Denmark 15,803 71,695 17,428 105,042 Germany 8,774 - 11,507 521 Great Britain 5,207 62 6,905 569 Romania 4,875 501 3,355 173 Other countries 17,318 234 21,097 478 Discontinued business (primary Denmark) (1,555) - (592) -
85,287 75,902 91,485 108,653
Important customers
2009 2008
As mentioned under ‘Accounting policies’, Netop implemented IFRS 8 in 2009. The implementation does not affect the recognition of amounts within the segments, but it does change the composition of reporting segments. In the 2008 annual report, the primary segments were broken down by geography and the secondary segments by product groups. In 2009, Netop’s primary reporting segments are i ts three core product areas of Administration, Education and Communication.
It is relatively easy to identify these segments, even though all of the Group’s legal entities have operations within all th ree segments. The segments have different customers and end users, and the products are very different from segment to segment and are based ondifferent technologies.
The three core product groups account for nearly all of our consolidated revenue. There is also a fourth revenue category, ‘O ther’, but given its very limited and varied extent, it is not considered a separate reporting segment. Income and costs contained in the segment results are, when they can be reliably measured, directly or indirectly distributed to each segment. Indirect costs are broken down by each segment’s share of total revenue.
Both current and non-current assets of a segment are distributed when they are used directly in the operations of a segment.
External revenue is distributed on individual countries when the Group generates more than 5% of consolidated revenue in that country. Other revenue is shown under ‘Other countries’. Revenue is broken down geographically on the basis of customers’ geographical location. Non-current assets are broken down on the basis of physical location. If less than 10% of total non-current assets are located in a single country, they are shown under ‘Other countries’.
No single end-customer accounted for more than 10% of consolidated revenue in 2009. This was also the case in 2008.
NOTES TO ThE cONSOLidATEd AccOUNTS 53

NOTES TO THE CONSOLIDATED ACCOUNTS
NOTE 4 REVENUE
DKK '000 2009 2008
Sale of software 56,232 76,659 Sale of service 29,055 15,418
85,287 92,077
NOTE 5 AMORTISATION, DEPRECIATION AND IMPAIRMENT LOSSES
DKK '000 2009 2008
Amortisation, depreciation and impairment losses of non-current assets are specified as follows:Amortisation, intangible assets 10,727 7,072 Impairment losses, intangible assets 20,933 2,000 Depreciation, property, plant and equipment 1,940 2,484 Impairment losses, property, plant and equipment 27 -
33,627 11,556
Amortisation, depreciation and impairment losses of non-current assets are specified as follows in the income statement:
Amortisation, depreciation and impairment losses 32,875 11,188 Profit for the year of discontinuing business 752 368
33,627 11,556
NOTE 6 OTHER OPERATING INCOME
DKK '000 2009 2008
Gains on sold intangible assets and property, plant and equipment 267 12,502 Others 56 -
322 12,502
NOTE 7 OTHER OPERATING COSTS
DKK '000 2009 2008
Losses on sold intangible assets and property, plant and equipment 192 - 192 -
NOTES TO ThE cONSOLidATEd AccOUNTS54

NOTES TO THE CONSOLIDATED ACCOUNTS
NOTE 8 STAFF COSTS
DKK '000 2009 2008
Staff costs are specified as follows:Wages and salaries, etc. 62,149 69,651 Defined contribution plans 2,176 1,428 Defined benefit plans (265) 184 Other social security expenses 5,178 820 Share-based payment 133 69 Other staff costs 4,128 4,686
73,500 76,838
Average number of employees 150 138
Attributable to:Board of DirectorsBoard remuneration 533 825
533 825
Executive ManagementWages and salaries, etc. 4,797 4,333 Pension schemes 498 271 Share-based payment 133 69
5,428 4,673
Other executivesWages and salaries, etc. - - Pension schemes - - Share-based payment - -
- -
The Management Board had three members in 2009, as in 2008 where two members were employed in February and June.
Performance-based bonus schemes have been set up for members of the Management Board. Members of the Management Board also participate in multi-year share option schemes and incentive plans.
The service contracts for members of the Management Board contain terms, including notice of termination, which are customaryfor members of the management boards inlisted companies.
Members of the Board of Directors of Netop Solutions A/S received total remuneration of DKK 449 thousand in 2009 (2008: DKK 825 thousand) for services rendered to the company and other companies of the Netop Group. Members of the Board of Directors receive a fixed remuneration that is not driven by the Group’s financial results or other performance. The remuneration of the Board of Directors was reduced substantially in 2009 relative to 2008, because the general wage reductions the Group implemented in 2009 also applied to the Board of Directors. Board members do not participate in share option schemes, incentive plans, pension plans or other Group schemes. No arrangements have been made in respect of severance payments to Board members, nor have any such payments been made.
NOTES TO ThE cONSOLidATEd AccOUNTS 55

NOTES TO THE CONSOLIDATED ACCOUNTS
NOTE 9 FEES TO AUDITORS APPOINTED BY THE ANNUAL GENERAL MEETING
DKK '000 2009 2008
Total fee to Deloitte are specified as follows:
Audit 586 800 Other assurance statements 12 105 Tax assistance 45 58 Other services 8 310
651 1,273
Total fee to other auditors (not appointed byt the annual general meeting) are specified as follows:
Audit 256 294 Other assurance statements - - Tax assistance 254 123 Other services 25 20
535 437
Total fee 1,186 1,710
NOTE 10 FINANCIAL INCOME
DKK '000 2009 2008
Interest income, banks etc. 282 3,935 Interest income securities 189 -
471 3,935
NOTE 11 FINANCIAL EXPENSES
DKK '000 2009 2008
Interest expenses, banks etc. 103 1,234 Interest expenses securities 56 - Exchange rate adjustments 709 5,524 Fair value adjustment of securities 77 - Value adjustment in respect of guaranteed share price - 5,209
946 11,967
NOTES TO ThE cONSOLidATEd AccOUNTS56

NOTES TO THE CONSOLIDATED ACCOUNTS
NOTE 12 CORPORATION TAX
DKK '000 2009 2008
Corporation tax is specified as follows:
Current tax on profit for the year of continuing business 5,776 (7,971) Tax on changes in equity - - Tax of discontinuing business - (1,200)
5,776 (9,171)
Corporation tax of continuing business is specified as follows:
Current tax on profit for the year 142 22 Deferred tax on profit for the year 5,863 (7,922) Adjustments relating to previous years (net) (229) (71)
5,776 (7,971)
Analysis of tax on profit from ordinary activities of continuing business:25% tax of profit from ordinary activities of continuing business before tax (16,968) (13,279) Non-capitalised deferred tax 23,655 6,027 Change in corporation tax rate - -
Computation of effective tax rate:Non-taxable income (545) (28) Non-tax deductible expenses (136) (620) Adjustment relating to previous years (229) (71)
5,776 (7,971)
Effective tax rate -8.5% 15.0%
Tax of comprehensive income
Before tax
Taxable income/-expenses After tax Before tax
Taxable income/-expenses After tax
794 - 794 6,033 - 6,033
794 - 794 6,033 - 6,033
2009 2008
Exchange rate adjustments relating to foreign entities
NOTES TO ThE cONSOLidATEd AccOUNTS 57

NOTES TO THE CONSOLIDATED ACCOUNTS
NOTE 13 EARNING PER SHARE (EPS)
DKK '000 2009 2008
Profit for the year (82,539) (48,746) Minority's share of consolidated profit for the year - - Netop group's share of profit for the year (82,539) (48,746)
Weighted average number of ordinary shares (1,000) 4,209 4,030 Weighted average number of treasury shares (1,000) (132) (81) Weighted average number of ordinary shares outstanding 4,077 3,949
Dilutive effect of outstanding options - - Average number of shares outstanding including dilutive effect of options (1,000) 4,077 3,949
Earnings per share (EPS) of DKK 5 (20.24) (12.34) Earnings per share (EPS-D) of DKK 5, diluted (20.24) (12.34)
Profit for the year of discontinuing business (8,891) (3,601) Profit for the year of continuing business (73,649) (45,145) Netop group's share of profit for the year (82,539) (48,746)
A total of 9,000 share options (2008: 32,100) that are out-of-the-money were not included in the calculation of diluted earnings per share, but they may potentially dilute earnings per share in the future.
In February 2010, Netop Solutions granted an additional 98,135 share options to a member of the Management Board, which may alsopotentially dilute future earnings per share.
Calculations for 2009 of earnings per share for continuing business and discontinuing business are based on same figures as earnings per share:
NOTES TO ThE cONSOLidATEd AccOUNTS58

NOTES TO THE CONSOLIDATED ACCOUNTS
NOTE 14 INTANGIBLE ASSETS
DKK '000Acquired licenses Goodwill
Completed develop-
ment projects
Develop-ment
projects in progress
Customer relations
Software internal
use Total2009Cost at 1 January 28,161 45,978 7,163 2,401 15,000 1,012 99,715 Exchange rate adjustments (20) - - - - (15) (35) Additions - - 4,922 2,049 - 36 7,007 Disposals (4,075) - - - - - (4,075) Transfer 1,441 - 3,040 (3,040) - - 1,441
25,507 45,978 15,125 1,410 15,000 1,033 104,053
10,517 2,000 1,617 - 1,500 496 16,130 Exchange rate adjustments 2 - - - - (11) (9) Amortisation for the year 5,003 - 2,471 - 3,000 253 10,727 Impairment losses for the year 3,559 12,956 4,418 - - - 20,933 Reversal of amortisation of disposals in the year (2,717) - - - - - (2,717)
1,441 - - - - - 1,441
17,805 14,956 8,505 - 4,500 739 46,505
7,702 31,022 6,620 1,410 10,500 294 57,548 - - 3,935 1,410 - - 5,345
4-5 yrs 1-5 yrs 5 yrs 3-5 yrs
DKK '000Acquired licenses Goodwill
Completed develop-
ment projects
Develop-ment
projects in progress
Customer relations
Software internal
use Total
2008Cost at 1 January 22,278 20,667 1,142 7,264 - - 51,351
(1,286) (5,711) - - (6,997) 10,193 31,022 - - 15,000 430 56,645
Additions 2,000 - - 776 278 3,054 Disposals - - - - (5,131) (5,131) Transfer (5,024) - 6,021 (5,639) 5,435 793
28,161 45,978 7,163 2,401 15,000 1,012 99,715
10,286 5,711 990 - - - 16,987 (1,286) (5,711) - - - - (6,997)
Amortisation for the year 4,380 - 246 - 1,500 946 7,072 Impairment losses for the year - 2,000 - - - - 2,000 Reversal of amortisation of disposals in the year - - - - - (3,754) (3,754) Transfer (2,863) 381 - - 3,304 822
10,517 2,000 1,617 - 1,500 496 16,130
17,644 43,978 5,546 2,401 13,500 516 83,585 - - - - - - -
4-5 yrs 1-5 yrs 5 yrs 3-5 yrs
Amortisation period
Internally generated assets included aboveAmortisation period
Cost at 31 December
Amortisation and impairment losses at 1 January
TransferAmortisation and impairment losses at 31 December
Carrying amount at 31 December
Carrying amount at 31 December
Correction cost/amortisation and impairmentAdditions (acquisition of subsidiary)
Cost at 31 December
Amortisation and impairment losses at 1 JanuaryCorrection cost/amortisation and impairment
Amortisation and impairment losses at 31 December
Internally generated assets included above
NOTES TO ThE cONSOLidATEd AccOUNTS 59

NOTES TO THE CONSOLIDATED ACCOUNTS
NOTE 14 INTANGIBLE ASSETS
Acquired licensesAcquired licenses comprise costs incurred for acquiring licenses and licensing rights. The licenses form part of production a nd development of new products as well as of products already on the market.
The value of recognised licenses and rights has been compared with the recoverable amount (value in use). Recoverable amounts are based on the value in use as determined through the application of projected net cash flows on the basis of management’s budgets and business plans for 2010-14.
The recoverable amounts of the rights relating to M-Net products and the related platform acquired in 2006 indicate that these rights no longer represent any accounting value. Accordingly, Netop has written down these assets by a total of DKK 3,559 thousand.
No other capitalised licenses show indications of impairment and therefore no other impairment losses have been recognised.
GoodwillAs at 31 December 2009, management performed an impairment test of the carrying amount of goodwill.
For the purposes of the impairment test, the carrying amount of goodwill at 31 December 2009 was determined as relating to the cash-generating unit Education in the amounts of DKK 31,022 thousand and DKK 12,956 thousand in respect of goodwill relating to M-Net, for total goodwill of DKK 43,978 thousand before any effects of an impairment test.
The impairment test performed on the above-mentioned cash-generating units is conducted by comparing the recoverable amount (value in use) with the carrying amounts of the cash-generating unit. Recoverable amounts are based on the value in use as determined through the application of projected net cash flows on the basis of management’s budgets and business plans for 2010 -14.
For all cash-generating units, the most important parameters are revenue, operating expenses, applied working capital, expected investment in property, plant and equipment as well as growth assumptions.
To determine indication of impairment, a discounting rate of 11.60% (2008: 11.32%) was applied for the calculation of the recoverable amount. The rate is applied on a after-tax basis and reflects the risk-free rate of interest for the entire company plus a company-specific risk premium. The risk-free interest rate was 4% (2008: 4%), the company-specific premium was 7.25% (2008: 7.25%) and the beta value was 1.49 (2008: 1.35). Finally, we have applied a growth rate of 2.5% during the terminal period, corresponding to a market asses sment for a similar company. The discouting rate before tax is calculated to 13.6%.
Management believes that changes to the discount rate and other basic assumptions applied will not result in any further writ e-downs in the Education segment in respect of the 2009 financial year, and the carrying amount of the related goodwill of DKK 31,022 thousand is therefore unchanged. On the other hand, the goodwill relating to the M-Net products has been written down by DKK 12,956 thousand and the carrying amount is now nil. As stated under ‘Acquired licences’, these products are no longer believed to have any accoun ting value for the company.
Completed development projectsDevelopment costs in respect of completed products that have been brought to market are recognised in the financial statement s. These products are tested annually for impairment, but unless there are indications of impairment, development costs in respect of completed projects are amortised on a straight-line basis over periods of from one to five years. The amortisation period is determined by the economic lives of the individual product versions.
The recognised development costs of DKK 6,620 thousand relate to internally developed assets from capitalised payroll costs o f DKK 3,935 thousand and to development costs incurred for external consultants of DKK 2,685 thousand.
NOTES TO ThE cONSOLidATEd AccOUNTS60

NOTER TIL KONCERNREGNSKABET
NOTE 14 INTANGIBLE ASSETS
Development projects in progressThe category of development projects in progress comprises development and testing of new software expected to be launched in 2010. Recognised in the 2009 figure were payroll costs, assets accumulated in-house and costs of external suppliers. Some of these projects were completed in 2009 and were thus reclassified as ‘Completed development projects’, which is subject to amortisation.
As a result, the total capitalised amount at 31 December 2009 was DKK 1,410 thousand, which related to projects expected to b e finalised and brought to market in 2010. The full sum of DKK 1,410 thousand relates to internally generated assets through staff cost.
Customer relationsCustomer relations were recognised at DKK 15,000 thousand related to the acquisition of GenevaLogic Holding AG in 2008. Because they were unrecognised assets in the takeover balance sheet, customer relations had to be identified and recognised at their fair value at the takeover date in order to be calculated and measured at a value according to the income approach.
Management tested customer relations for impairment at 31 December 2009 as part of the same impairment test applied to the ca sh-generating unit Education. See ‘Goodwill’ above.
The customer relations are expected to add value to the Group for a minimum of five years and are amortised on a straight -line basis over five years.
The overall impairment test for the cash-generating unit Education indicated that the recoverable amount is higher than the capitalised carrying amounts. Accordingly, management believes that the valuation of customer relations is fair and that there is no need for a write-down.
Software for internal useSoftware applications acquired for internal use are generally administrative applications and are thus not part of the Group’s production and products ready for sale. Software for internal use is amortised on a straight-line basis over three to five years, but is subject to an annual impairment test to determine if the value in use is greater than the carrying amount.
NOTES TO ThE cONSOLidATEd AccOUNTS 61

NOTES TO THE CONSOLIDATED ACCOUNTS
NOTE 15 PROPERTY, PLANT AND EQUIPMENT
DKK '000Land and buildings
Other fixtures
and fittings,
tools and equipment
Leasehold improve-
ments Total
2009Cost at 1 January - 12,498 283 12,781 Exchange rate adjustments - 8 41 49 Additions - 447 81 528 Disposals - (1,017) (324) (1,340) Transfer - (132) - (132)
- 11,804 81 11,885
- 9,238 127 9,365 - 17 30 47
Amortisation for the year - 1,876 64 1,940 Impairment losses for the year - 27 - 27 Reversal of amortisation of disposals in the year - (833) (207) (1,040) Transfer - (132) - (132)
- 10,193 14 10,207
- 1,611 68 1,678 3-5 yrs 5 yrs
DKK '000Land and buildings
Other fixtures
and fittings,
tools and equipment
Leasehold improve-
ments Total
2008Cost at 1 January 36,194 12,416 355 48,965
- 1,279 12 1,291 Additions - 1,007 - 1,007 Disposals (36,194) (1,412) (84) (37,690) Transfer - (792) - (792)
- 12,498 283 12,781
6,374 9,424 76 15,874 Amortisation for the year 824 1,600 60 2,484 Impairment losses for the year - - - - Reversal of amortisation of disposals in the year (7,198) (964) (9) (8,171) Transfer - (822) - (822)
- 9,238 127 9,365
- 3,260 156 3,416 3-5 yrs 5 yrs
Cost at 1 January
Amortisation and impairment losses at 1 January
Amortisation period
Amortisation period
Amortisation and impairment losses at 31 December
Carrying amount at 31 December
Carrying amount at 31 December
Additions (acquisition of subsidiary)
Cost at 1 January
Amortisation and impairment losses at 1 January
Amortisation and impairment losses at 31 December
Exchange rate adjustments
NOTES TO ThE cONSOLidATEd AccOUNTS62

NOTES TO THE CONSOLIDATED ACCOUNTS
NOTE 16 INVESTMENTS IN ASSOCIATES
DKK '000 2009 2008
Cost at 1 January 1,580 1,580 Additions 519 - Disposals, disposals of companies (2,099) -
- 1,580
(1,182) (1,182) Disposals, transferred to investment in subsidiaries 1,182 -
- (1,182)
- 398
2008
Name and registered address Interest held RevenueNet
profit/(loss) Assets Liabilities EquityNet
profit/(loss)
Enologic A/S, Aalborg 50% 25 - 810 13 398 -
Carrying amount at 31 December
Netop Solutions group share
Value adjustments at 1 January
Value adjustments at 31 December
Cost at 31 December
Netop acquired the outstanding 50% of the shares in the company Enologic A/S. See note 26. Accordingly, this company has beenconsolidated on the same terms as the company’s other wholly owned subsidiaries.
NOTES TO ThE cONSOLidATEd AccOUNTS 63

NOTES TO THE CONSOLIDATED ACCOUNTS
NOTE 17 DEFERRED TAX
DKK '000 2009 2008
Deferred tax at 1 January (net) 3,508 357 Deferred tax, acquisition of subsidiary 939 (5,030) Adjustment relating to previous years (255) (941) Changes in corporation tax rate - - Deferred tax on profit for the year (5,863) 9,122 Deferred tax at 31 December (net) (1,671) 3,508
Deferred tax is recognized in the balance as follows:Deferred tax assets 2,004 8,082 Provision for deferred tax (3,675) (4,574) Deferred tax at 31 December (net) (1,671) 3,508
Deferred tax concerns:
Intangible assets 2,203 (5,471) Property, plant and equipment 118 104 Trade receivables 1,337 694 Other liabilities 673 - Share-based payments 33 17 Tax loss 26,923 14,191 Write down (32,958) (6,027)
(1,671) 3,508
The temporary differences on intangible assets mainly arose in connection with the acquisition of GenevaLogic Holding AG in 2 008. See note 26. The recognised value of the tax loss derives from the aggregate financial results of 2007, 2008 and 2009 from the Da nish companies that are taxed jointly with Netop Solutions A/S. However, as management does not find it likely that the full value of the deferred tax assets consisting of tax-loss carryforwards will be realised within a three-year horizon, the value of the tax loss has been written down to DKK 2,004 thousand. This value is expected to be realisable on the basis of current, updated budgets for the period 2010–2012.
Tax losses in foreign subsidiaries are not included in the estimated deferred tax asset. It is considered less likely that th e losses can be offset against expected future income within the limitation period applying in the countries where the losses were incurred. The tax value of the non-capitalised deferred taxes in foreign tax jurisdictions amounts to approximately DKK 8.7 million (2008: DKK 11.6 mill ion).
NOTES TO ThE cONSOLidATEd AccOUNTS64

NOTES TO THE CONSOLIDATED ACCOUNTS
NOTE 18 TRADE RECEIVABLES
DKK '000 2009 2008
Trade receivables 14,569 19,597
Yearly write-downs recognized in profit/loss (net) 566 1,935
Write-downs included in trade receivables, developed as follows:Not overdue 7,728 9,753 0-30 days overdue 1,982 3,597 31 og 90 days overdue 591 1,003 More than 90 days overdue 366 2,400
10,667 16,753
Write-downs at 1 January 4,782 3,022 Realised in the year (1,276) (212) Reversals (162) (572) Write-downs in the year 2,004 2,544 Write-downs at 31 December 5,348 4,782
Impairment losses are recognised for trade receivables if the value is found to be impaired based on an individual assessmentof each debtor’s ability to pay, for example in case of suspension of payment, bankruptcy, etc. Write-downs are recognised at estimated net realisable value. The carrying amount of receivables before write-down to net realisable value based on an individual assessmentamounted to DKK 19,917 thousand (31 December 2008: 24,379 thousand).
The Group’s currency and credit risks relating to receivables are described in note 32.
We have not been given collateral for our trade receivables, but we are in close contact with the relatively few business par tners with overdue balances and have received reasonable assurance that these amounts will be settled.
Write-downs are registered in a summary account used to reduce the carrying amount of trade receivables, the values of which areimpaired due to risk of loss. Based on historical experience, amounts are recognized in the summary write-down account when a receivable has been overdue for more than three months and no plan for payment has been entered into with the debtor.
NOTES TO ThE cONSOLidATEd AccOUNTS 65

NOTES TO THE CONSOLIDATED ACCOUNTS
NOTE 19 OTHER RECEIVABLES
DKK '000 2009 2008
Prepayments 1,451 2,266 Other receivables 2,892 3,743
4,343 6,009
– specified as follows:0 - 1 year 2,803 6,009 > 1 year 1,540 -
4,343 6,009
Other receivables consist mainly of an outstanding settlement from a former landlord in the UK, receivable VAT, etc. The non-current portion of other receivables relates to receivables from the sale of the product Netfilter, which amount will be paid by the buyers as earn-out payments as Netop sells the product.
Prepayments covers prepaid costs such as rent, insurance, software licenses, etc.
NOTES TO ThE cONSOLidATEd AccOUNTS66

NOTES TO THE CONSOLIDATED ACCOUNTS
NOTE 20 SHARE CAPITAL
DKK '000 2009 2008
Share capital
2009 2008 2009 2008Number of shares at 1 January 4,209,108 3,850,428 21,046 19,252 Capital increase - 358,680 - 1,794 Number of shares at 31 December 4,209,108 4,209,108 21,046 21,046
Treasury shares
2009 2008 2009 2008 2009 2008Number of shares at 1 January 125,260 50,636 628 255 3.10% 1.32%Acquisition of treasury shares 13,409 74,624 67 373 0.32% 1.77%Number of shares at 31 December 138,669 125,260 695 628 3.42% 3.10%
Shares issuedNumber of shares Nominel value
Number of shares Nominel value % of share capital
The share capital consists of 4,209,108 shares with a nominal value of DKK 5 each. All shares rank equally. No shares are subject to restrictions on transferability or voting rights.
The share capital is fully paid up.
Netop Solutions A/S has been authorised by the shareholders in general meeting to acquire own shares for a nominal value of up to DKK 2,105 thousand, equal to 10% of the share capital. The company has acquired own shares to partially cover incentive programmes.
In 2009, Netop Solutions A/S acquired own shares for a total nominal value of DKK 67 thousand (2008: DKK 373 thousand) in several transactions at an average price of DKK 32,80 (2008: DKK 55.50 per share), for an aggregate purchase price of DKK 440 thousand (2008: DKK 4,142 thousand).
No dividend was declared in 2009 or in 2008 in respect of the 2008 and 2007 financial years.
NOTES TO ThE cONSOLidATEd AccOUNTS 67

NOTES TO THE CONSOLIDATED ACCOUNTS
NOTE 21 PROVISIONS
DKK '000 2009 2008
Price guaranteePrice guarantee 1 Januar 10,000 - Adjustments - 10,000 Price guarantee 31 December 10,000 10,000
The price guarantee is expected to be payable as follows:Current liabilites 10,000 - Non-current liabilities - 10,000 Price guarantee 31 December 10,000 10,000
Other provisionsOther provisions 1 Januar - - Adjustments 1,457 - Other provisions 31 December 1,457 -
Other provisions is expected to be payable as follows:Current liabilites 146 - Non-current liabilities 1,311 - Other provisions 31 December 1,457 -
Provisions total are expected to be payable as follows:Current liabilites 10,146 - Non-current liabilities 1,311 10,000 Provisions 31 December 11,457 10,000
When acquiring GenevaLogic Holding AG, Netop undertook to pay a price guarantee of up to DKK 10,000 thousand in the event theshares issued as part of the purchase price lost a corresponding amount or more of their official market value. At the balance sheet date, the shares have lost more than DKK 10,000 thousand in value and, accordingly, full provision has been made for the price guarantee. The price guarantee falls due for payment on or after 30 September 2010.
Netop signed a 10-year support agreement with Atea effective 31 December 2009.
NOTES TO ThE cONSOLidATEd AccOUNTS68

NOTES TO THE CONSOLIDATED ACCOUNTS
NOTE 22 PENSION OBLIGATIONS
The companies of the Netop Group have a number of pension and severance plans, which comply with the various requirements and the labour market legislation in force in the different countries where Netop’s employees are based. As only about three per cent of the Group’s employees (2008: about five per cent) are covered by defined benefit plans, the part of the overall pension plans for which the company has an obligation other than the contributions made, is not significant.
The remaining 97% of the pension plans are defined contribution plans, under which Netop has no obligation in excess of the a greed contributions.
For defined contribution plans, the employer undertakes to pay a defined contribution (e.g. a fixed amount or a fixed percent age of the pay). For a defined contribution plan, the Group runs no risk in respect of future developments in interest rates, inflation, mortality or disability.
For defined benefit plans, the employer undertakes to pay a defined benefit (e.g. a retirement pension at a fixed amount or a fixed percentage of the employee’s final salary). Under a defined benefit plan, the Group carries the risk in respect of future dev elopments in interest rates, inflation, mortality or disability. Defined benefit plans typically provide the covered employees with a pens ion based on their final earnings.
The pension commitments of the Group’s Danish businesses are funded. Certain foreign businesses are also funded. Foreign comp anies whose pension obligations are not or only partly funded (defined benefit plans) recognise their commitments on an actuarial b asis at the present value at the balance sheet date. Such pension plans are funded in full or in part in employee pension funds. In the c onsolidated financial statements, an amount of DKK 226 thousand (2008: DKK 685 thousand) has been recognised under liabilities in relatio n to the Group’s obligations towards current and former employees after deduction of plan assets.
The only defined benefit plan for which Netop has an obligation involves the company’s employees in Switzerland. It was only in 2008, after the acquisition of GenevaLogic Holding AG (see note 26) was effected, that Netop was initially required to recognise th is type of obligation in the consolidated financial statements.
NOTES TO ThE cONSOLidATEd AccOUNTS 69

NOTER TIL KONCERNREGNSKABET
NOTE 22 PENSION OBLIGATIONS
DKK '000 2009 2008
The following has been recognised in the consolidated income statement:Defined contribution plans - 1,428 Defined benefit plans - 184
- 1,612
Present value of funded defined benefit obligations - 5,169 Fair value of plan assets - (4,484) Net obligation recognised in the balance sheet - 685
Developments in the present value of defined benefit obligationObligation at 1 January - - Addition on business acquisitions - 5,169
- 5,169
Developments in the fair value of pension assets:Pension assets at 1 January - - Addition on business acquisitions - 4,484
- 4,484
In the consolidated income statement actuarial calculation of gains/losses has been recognised:
Accumulated actuarial calculated gains/losses - (315)
Calculation of defined benefit obligation at 31 December 2009The company decided to calculate the 2009 provision for defined benefit obligations without actuarial assistance, in consideration of the quite substantial costs of such services in proportion to the amount of the provision.
As the provision in 2009 is insignificant according to IFRS the 2009 numbers in the note have been elided.
Actuarial calculation and assumptions at 31 December 2008The pension assets are under the management of pension company PKG Pensionskasse (Switzerland). Under the pension company’s policy, the assets cannot represent more than 42% of total investments. The remaining pension funds are invested in bonds, ca sh and cash equivalents and property.
The average assumptions for the actuarial calculations at the balance sheet date were: discount rate at 3.25%, expected return on plan assets of 3.25% and expected rate of salary increase of 1.50%.
The expected return on plan assets was determined by PensionRisk AG (Switzerland) on the basis of the composition of the plan assets and expectations for the general economic outlook.
NOTES TO ThE cONSOLidATEd AccOUNTS70
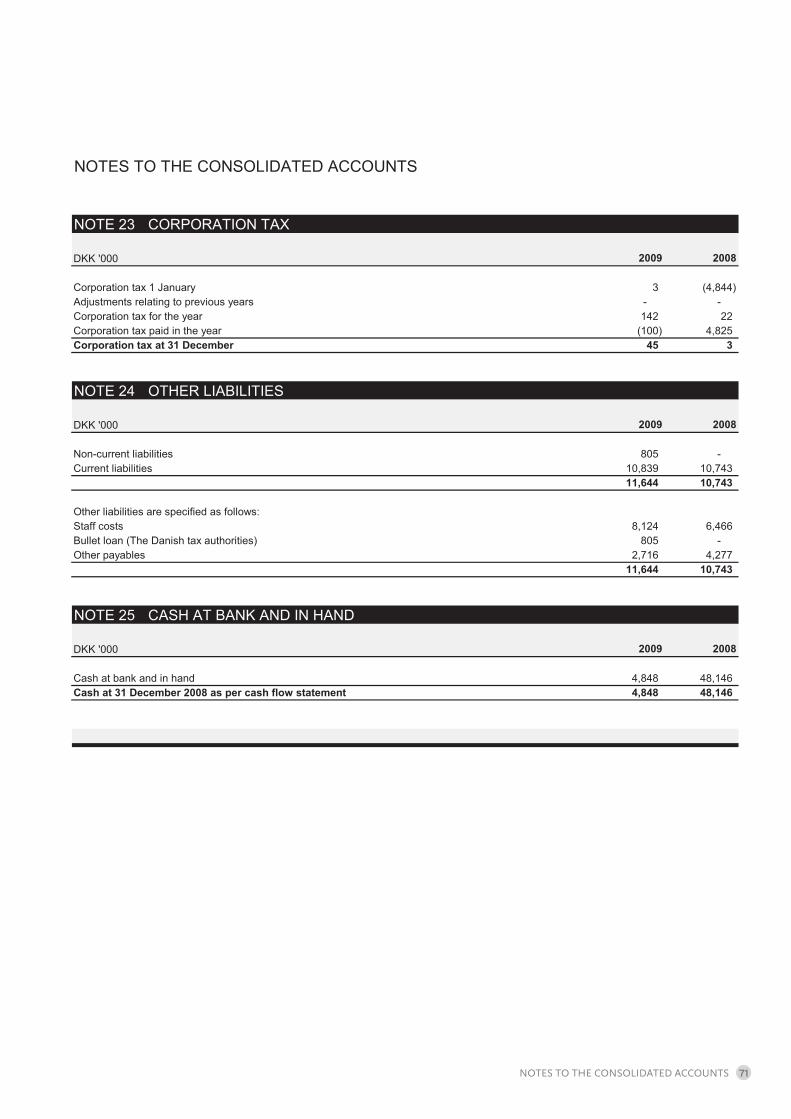
NOTES TO THE CONSOLIDATED ACCOUNTS
NOTE 23 CORPORATION TAX
DKK '000 2009 2008
Corporation tax 1 January 3 (4,844) Adjustments relating to previous years - - Corporation tax for the year 142 22 Corporation tax paid in the year (100) 4,825 Corporation tax at 31 December 45 3
NOTE 24 OTHER LIABILITIES
DKK '000 2009 2008
Non-current liabilities 805 - Current liabilities 10,839 10,743
11,644 10,743
Other liabilities are specified as follows:Staff costs 8,124 6,466 Bullet loan (The Danish tax authorities) 805 - Other payables 2,716 4,277
11,644 10,743
NOTE 25 CASH AT BANK AND IN HAND
DKK '000 2009 2008
Cash at bank and in hand 4,848 48,146 Cash at 31 December 2008 as per cash flow statement 4,848 48,146
NOTES TO ThE cONSOLidATEd AccOUNTS 71

NOTES TO THE CONSOLIDATED ACCOUNTS
NOTE 26 ACQUISITION OF SUBSIDIARIES
DKK '000
Carrying amount prior to acquisition
Fair value adjustment
Fair value at date of
acquisition
Acquisitions in 2009
Acquisition of Netop Netfilter A/S (former named Enologic A/S)
Deferred tax - 939 939 Trade receivables 16 - 16 Cash at bank and in hand 794 - 794 Current liabilities (12) - (12) Net assets acquired 798 939 1,737
Calculated goodwill - Total cost for 100% of the shares 1,737
Fee for 50% of the shares (869) Cash acquired 794 Net cash flow impact (75)
Acquisitions in 2008
Acquisition of Medianet Innovations SRL
Intangible assets 145 - 145 Property, plant and equipment 162 - 162 Trade receivables 1,161 - 1,161 Cash at bank and in hand 11 - 11 Kortfristede forpligtelser (1,462) - (1,462) Net assets acquired 17 - 17
Calculated goodwill - Total cost for 100% of the shares 17
Cash acquired (11) Net cash flow impact 6
With effect from 1 September 2009, Netop Solutions A/S acquired 50% of the shares of Enologic A/S. Netop Solutions A/S already held 50% of the shares and is now the company’s sole shareholder.
Opgørelsen af dagsværdier på de overtagne aktiver, forpligtelser og eventualforpligtelser er afsluttet pr. 31 december 2009.
With effect from 1 July 2008, Netop Solutions A/S acquired the entire share capital of a small Romanian company, Medianet InnovationsSRL. The company was acquired in connection with the conclusion of a distributor agreement between Netop Solutions and Medianet International Inc. and Medianet Innovations A/S.
NOTES TO ThE cONSOLidATEd AccOUNTS72

NOTES TO THE CONSOLIDATED ACCOUNTS
NOTE 26 ACQUISITION OF SUBSIDIARIES
DKK '000
Carrying amount prior to acquisition
Fair value adjustment
Fair value at date of
acquisition
Acquisitions in 2008
Acquisition of GenevaLogic Holding AG
Intangible assets 1,125 23,862 24,987 Property, plant and equipment 1,046 - 1,046 Inventories 46 - 46 Trade receivables 3,245 - 3,245 Prepayments 764 - 764 Cash at bank and in hand 1,466 - 1,466 Non-current liabilities - (1,000) (1,000) Current liabilities (8,251) - (8,251) Deferred tax - (5,030) (5,030) Net assets acquired (559) 17,832 17,273
Calculated goodwill 31,022 Total cost for 100% of the shares 48,295
Payment by way of new shares issued and warrants (29,756) Cash payment 18,539
Cash acquired (1,466) Net cash flow impact 17,073
Components of total acquisition costsCash 17,443Direct acquisition costs 1,096
18,539
In June 2008, Netop Solutions A/S signed an agreement to acquire the entire share capital of GenevaLogic Holding AG. The acqu isitionbecame effective on 1 July 2008, and the GenevaLogic Group is consolidated in Netop Solutions’ accounts from this date.
The stated amounts were translated into Danish kroner at the exchange rate at the time of recognition.
The statement of fair values of the taken over assets, liabilities and contingent liabilieties have been completed at 31 December 2008 for both companies.
The calculation of goodwill represents the value of the expected earnings capacity of the acquired companies that cannotbe reliably attributed to individual assets, including the value of staff know-how. Moreover, the company expects to achieve substantialsynergies from increased sales and better utilisation of employees and their know-how. Netop Solutions A/S has not made any acqusitionsin 2007.
NOTES TO ThE cONSOLidATEd AccOUNTS 73

NOTER TIL KONCERNREGNSKABET
NOTE 27 SHARE OPTIONS - AND WARRANTS PROGRAM PLANS
Share option plansIn 2003 and 2004, Danware granted share options to executive officers (1 person) and other employees (17 persons).
The share option plan at 31 December 2009 comprises 51,853 options. Each option entitles the holder to purchase one existing Netop share worth DKK 5 nominal value.
The options are issued at an exercise price, which is equal to the average of the share as quoted by the Copenhagen Stock Exchange during the ten-day period prior to the date of grant. Options are earned for as long as the holder is employed in the company, but there is no requirement that the holder must still be in employment at the exercise date.
Options granted cannot be exercised until three years after the date of grant and not later than seven years after the date o f grant and only in two-week periods after the release of interim profit announcements.
The options can be settled in cash, but the company’s intention is that they are to be settled in shares. The company is expected to acquire additional treasury shares so that the portfolio can be used for purposes of settling options granted.
Option Program 2003All options granted under the 2003 Program vested 36 months after the date of grant (27 June 2003). Exercise of these options is to take place not later than 84 months after the date of grant. The share options continued to vest as long as the option holder was employed with the company, but there is no requirement that the option holder must be in continuing employment at the date of exercise.
Under the 2003 Program, a total of 52,000 options were granted, of which 36,375 have lapsed and 11,125 have been exercised. Accordingly, 4,500 options were still outstanding at 31 December 2009. Lapse is only due to the reason that the employees att ached to the program is no longer employed in the Netop group.
Options under Option Program 2003 may be settled in cash, but the intention is for the options to be settled by way ofshares. When the plan was set up, the exercise price was fixed at DKK 108 per share.
Option Program 2004The date of grant for all options under Option Program 2004 was 17 August 2004. These options cannot be exercised earlier than 36 months after the date of grant and not later than 84 months after the date of grant. The share options only vested as long as the option holder was employed with the company, but, as with Option Program 2003, there is no requirement that the option holder must be in continuing employment at the date of exercise.
Under the 2004 Program, a total of 43,200 options were granted. None of these options have been exercised, but 38,700 options have lapsed. At 31 December 2009, 4,500 options were outstanding under the program.
The Option Program 2004 does not apply cash settlement, and options can only be exercised by the purchase of shares atthe agreed exercise price of DKK 99 per share.
Warrantprogram 2008In 2008, Netop Solutions A/S established a warrant program for the company’s Management Board. A total of 20,562 warrants were granted for an aggregate value of DKK 1,500,000. When vested, each warrant gives the holder the right to subscribe one share of DKK 5 nominal value in the company.
The date of grant was 26 June 2008 at which date the shares were subscribed at the average opening price (on NASDAQOMX Copenhagen) during the 10 days immediately preceding the date of grant. The exercise price was fixed at DKK 72.95per share.
The warrants vest over a period of two years beginning on 1 July 2008 at 1/24 for each month the warrant holder isemployed by Netop Solutions A/S. The value of these calculated to DKK 264 thousand, which will be accrued in vestedperiod. The warrants can be exercised after expiry of the vesting period on 30 June 2010, but not later than on 26 June2013.
Warrantprogram 2008 – part of purchase price Genevalogic Holding AGWhen acquiring GenevaLogic Holding AG, Netop Solutions A/S paid a part of the purchase price by a grant of warrants. The warrantprogram gives the seller the right to subscribe 71,736 shares with a nominal value of DKK 5 each in Netop Solutions A/S.
The date of grant was equal to the date of acquisition, 1 July 2008, and the price was fixed at DKK 69.70 per share. The price was determined on the basis of the average market price of the ten trading days immediately before 30 June 2008 as quoted on Nasdaq OMX Copenhagen.
NOTES TO ThE cONSOLidATEd AccOUNTS74
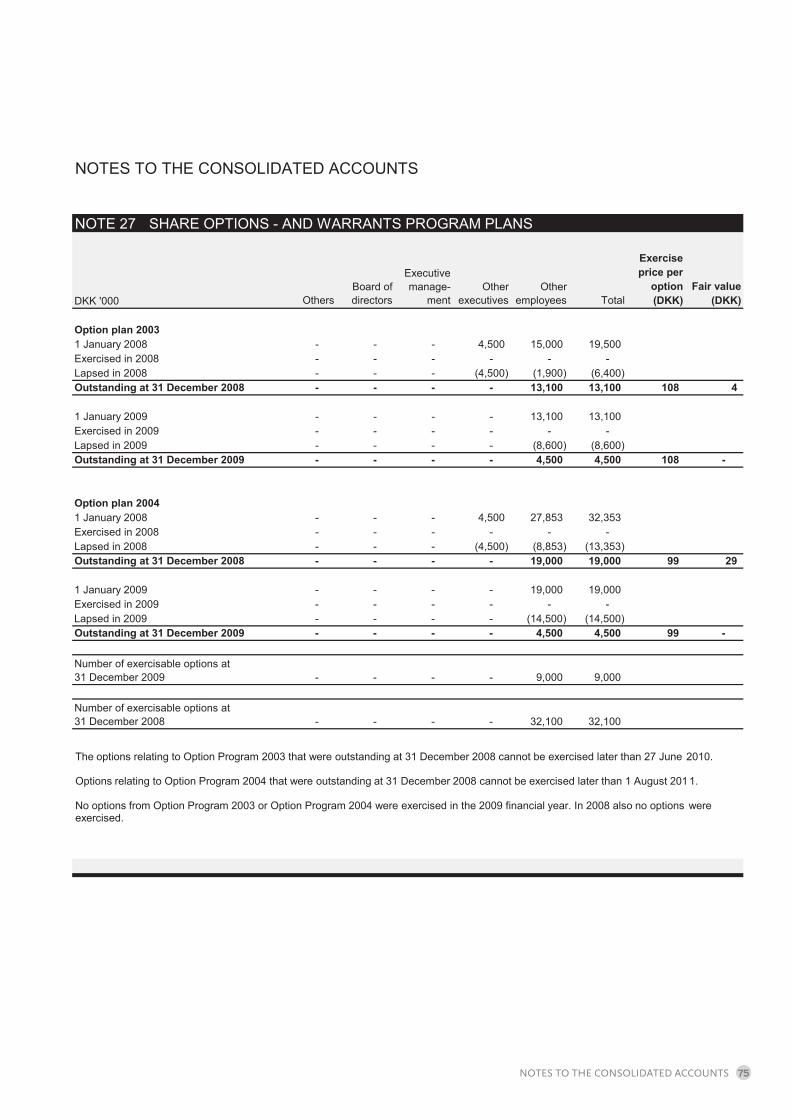
NOTES TO THE CONSOLIDATED ACCOUNTS
NOTE 27 SHARE OPTIONS - AND WARRANTS PROGRAM PLANS
DKK '000 OthersBoard of directors
Executive manage-
mentOther
executivesOther
employees Total
Exercise price per
option (DKK)
Fair value (DKK)
Option plan 20031 January 2008 - - - 4,500 15,000 19,500 Exercised in 2008 - - - - - - Lapsed in 2008 - - - (4,500) (1,900) (6,400)
- - - - 13,100 13,100 108 4
1 January 2009 - - - - 13,100 13,100 Exercised in 2009 - - - - - - Lapsed in 2009 - - - - (8,600) (8,600)
- - - - 4,500 4,500 108 -
Option plan 20041 January 2008 - - - 4,500 27,853 32,353 Exercised in 2008 - - - - - - Lapsed in 2008 - - - (4,500) (8,853) (13,353)
- - - - 19,000 19,000 99 29
1 January 2009 - - - - 19,000 19,000 Exercised in 2009 - - - - - - Lapsed in 2009 - - - - (14,500) (14,500)
- - - - 4,500 4,500 99 -
- - - - 9,000 9,000
- - - - 32,100 32,100
Outstanding at 31 December 2008
Outstanding at 31 December 2008
Outstanding at 31 December 2009
Outstanding at 31 December 2009
Number of exercisable options at31 December 2009
Number of exercisable options at31 December 2008
The options relating to Option Program 2003 that were outstanding at 31 December 2008 cannot be exercised later than 27 June 2010.
Options relating to Option Program 2004 that were outstanding at 31 December 2008 cannot be exercised later than 1 August 2011.
No options from Option Program 2003 or Option Program 2004 were exercised in the 2009 financial year. In 2008 also no options were exercised.
NOTES TO ThE cONSOLidATEd AccOUNTS 75

NOTER TIL KONCERNREGNSKABET
NOTE 27 SHARE OPTIONS - AND WARRANTS PROGRAM PLANS
DKK '000 OthersBoard of directors
Executive manage-
mentOther
executivesOther
employees Total
Exercise price per
option (DKK)
Fair value (DKK)
Warrant program 200826 June 2008 - - 20,562 - - 20,562 Exercised warrants in 2008 - - - - - - Lapsed 2008 - - - - - -
- - 20,562 - - 20,562 73 25
1 January 2009 - - 20,562 - - 20,562 Exercised warrants in 2009 - - - - - - Lapsed 2009 - - - - - -
- - 20,562 - - 20,562 73 -
1 July 2008 71,736 - - - - 71,736 Exercised warrants in 2008 - - - - - - Lapsed 2008 - - - - - -
71,736 - - - - 71,736 70 102
1 January 2009 71,736 - - - - 71,736 Exercised warrants in 2009 - - - - - - Lapsed 2009 - - - - - -
71,736 - - - - 71,736 70 -
71,736 - 20,562 - - 92,298
- - - - - -
- - - - - - Total warrants which can be exercised 31 December 2008
Warrant programs, total
Total warrants which can be exercised 31 December 2009
Outstanding at 31 December 2009
Outstanding at 31 December 2008
Outstanding at 31 December 2009
Warrant program 2008 - part of purchase price Genevalogic Holding AG
Outstanding at 31 December 2008
The right ot exercise applies for a period of 12 months from 1 July 2008 and will lapse on 30 June 2011.
The market value of the warrants is made up on the basis of Black-Scholes’ option valuation model. For 2009, the computation at 31 December 2009 was based on a dividend per share of 0% (2008: 0%) of the share price, a volatility of 71,8% (2008: 44,3%) and a risk-free interest rate of 2.2% (2008:2,2%).
The expected volatility is derived from the historical volatility of the Netop Solutions A/S share for the past two years.
The average price for the Netop share in 2009 was DKK 22,42 (2008: DKK 63,27)
The risk-free interest rate is determined on the basis of the Danish benchmark government bond yield for the expected maturity o f the warrants.
NOTES TO ThE cONSOLidATEd AccOUNTS76

NOTES TO THE CONSOLIDATED ACCOUNTS
NOTE 28 RELATED PARY TRANSACTIONS
DKK '000 2009 2008
Transactions between Netops group of companies and related parties amounts to:
ATEA A/S (Chairman of the board Ib Kunøe)Purchase of IT equipment from Atea A/S 724 584 Sale of software to Atea A/S 4,303 9,001 Receivables from Atea A/S 1,590 3,444 Payable to Atea A/S 201 11
Columbus IT Partner A/S (Chairman of the board Ib Kunøe)Purchase of software and consultancy services from Columbus IT Partner A/S 119 553 Payable to Columbus IT Partner A/S - 55
Philip & Partnere (Board member Henning Hansen)Legal assistance from Philip and Partners Law Firm 372 880 Payable to Philip and Partners Law Firm 15 28
DTM International A/S (former board member Peter Grøndahl)
4 875Payable to DTM International A/S - 225
Expansion and maintenance of CRM system and consultancy services from DTM International A/S
Netop Solutions A/S has no related parties exercising control. Netop Solutions A/S’s related parties exercising a significant influence comprises of subsidiaries in which members of Netop SolutionsA/S’s Board of Directors, Management Board and senior managemen t as well as relatives of these persons have material interests. Trading with related parties is conducted exclusively on an arm’s length basis, in
There were no other transactions with members of the Board of Directors or the Management Board, or with other senior employe es of the Group.
In 2009 no members of the board of directors - apart from elected by the employees - have had employment in the group.
Associated companies:Related parties also include associates over which Netop Solutions A/S has control or exerts significant influence.
Netop Solutions A/S held a 50% ownership interest in the associate Enologic A/S until Netop Solutions A/S bought the remainin g part of 50% and took over the company completely, see note 26.
Transactions with Enologic A/S during the 2009 financial year involved only royalty payments of DKK 6 thousand (2008: DKK 102thousand).
Regarding the parent company; Netop Solutions A/S then there have been related party transactions with Philip & Partnere of t otal DKK 284 thousand (2008: DKK 638 thousands)
NOTES TO ThE cONSOLidATEd AccOUNTS 77

NOTES TO THE CONSOLIDATED ACCOUNTS
NOTE 29 MANAGEMENT'S SHAREHOLDING OF NETOP SOLUTIONS A/S SHARES
DKK '000
Number of shares held at
1 January 2009
Number of shares
acquired in 2009
Number of shares sold in
2009
Number of shares at
year end 2009
Market value at 31
December 2009
Bestyrelse:Ib Kunøe - - - - - Peter Schüpbach - - - - - Henning Hansen - - - - - Jan Elbæk - - - - - Per Egon Rank 594 - - 594 5 Hanne Jespersen Hansen - - - - - Max Møller - - - - - I alt 594 - - 594 5
Direktion:Kurt Groth Bager - - - - Claus Finderup Grove - - - - I alt - - - -
NOTE 30 CONTRACTUAL ACTIVITIES
DKK '000 2009 2008
The minimum lease obligations relating to operating leases fall due:
Land and buildings – falling due within one year 4,282 5,045 Other plant – falling due within one year 1,972 1,578
6,254 6,623
Land and buildings – falling due within five years 10,505 12,167 Other plant – falling due within five years 1,555 2,145
12,060 14,312
Land and buildings – falling due after five years 19,439 22,873 Other plant – falling due after five years - -
19,439 22,873
37,753 43,808
Costs of operating leases included in the income statement 8,531 4,017
The main liability comprises a lease for domicile offices at Birkerød, Denmark. The annual lease payments amount to DKK 2.3m and are subject to a 3% increase per annum. The agreement is non-terminable until 2023, but the company has an option to buy back the property at a price of DKK 36.7 million on 1 October 2016. The company also has permission to rent out parts of the building. As this was not relevant in 2009, no rental income was generated in respect of the office building at Birkerød.
NOTES TO ThE cONSOLidATEd AccOUNTS78

NOTES TO THE CONSOLIDATED ACCOUNTS
NOTE 31 DISCONTINUED BUSINESS
DKK '000 2009 2008
Revenue 1,555 592 External costs (5,255) (2,614) Amortisation, depreciation and impairment losses (752) (368) Staff costs (4,439) (2,411) Result before tax (8,891) (4,801) Corporation tax - 1,200 Profit for the year of discontinuing business (8,891) (3,601)
Cash flow from operating activities of continuing business (8,139) (4,433) Cash flow from investing activities - - Cash flow from financing activities - - Change in cash at bank and in hand (8,139) (4,433)
Property, plants and equipment - - Assets held for sale - -
Earning per share of discontinuing business (EPS) (2.18) (0.91) Earning per share of discontinuing business, diluted (EPS-D) (2.18) (0.91)
The partnership agreement between Netop and Medianet was terminated with effect from the end of 2009. As a result, the related activities have been identified and the related revenue and costs have been determined for all of 2009. At the expiry of the agreement, Netop had a contractual commitment to return all of the assets, including employees, transferred to Netop when the agreement was signed in 2008.
NOTES TO ThE cONSOLidATEd AccOUNTS 79

NOTES TO THE CONSOLIDATED ACCOUNTS
NOTE 32 DERIVATIVE FINANCIAL INSTRUMENTS, RISK AND FINANCIAL MANAGEMENT
Currency risk 31 December 2009DKK '000
CurrencyPayment /
maturity ReceivableCash at bank
and in hand Debt
Hedged through forward
exchange contracts Net position
USD < 1 år 5,632 1,810 3,481 - 3,960
Currency risk 31 December 2008DKK '000
CurrencyPayment /
maturity ReceivableCash at bank
and in hand Debt
Hedged through forward
exchange contracts Net position
USD < 1 år 1,570 829 428 - 1,971
Due to the nature of its operations, investments and financing activities, the Netop Group is exposed to a number of financia lrisks. These risks relate to market risk, which for Netop consists of foreign exchange and interest rate risk, as well as cre ditrisk and liquidity risk. Group policy is not to actively conduct speculation in financial risks. The sole purpose of the Group’sfinancial management is to manage and reduce financial risk. Management monitor the risks the Group is exposed to andalign policies to hedge such risk. The group has authority to enter hedging instrument but as of 31. December 2009 the group does not particiapte in any financial contracts.
Currency riskThe Group is exposed to currency fluctuations, because individual group companies conduct purchase or sales transactionsand have receivables and debt in currencies other than their own functional currency.As Netop is incorporated in Denmark, a large part of the Group’s costs are incurred in Danish kroner. In 2009, the companyinvoiced approximately 25% of its sales in Danish kroner, 25% in euros, 45% in US dollars, and the remaining 5% in pound ster ling . The company’s main commercial currency exposure is thus primarily to sales in US dollars. The group has expenses in danish kroner, US Dollar, Rumanian Lei (RON) and British pounds.
The groups major exposure is hence EUR and USD on revenue and USD and RON on the costside. The management do not calculate with major risk on the EUR exposure. With regards to USD, where the exposure has been reduced with the establishment of the Chicago office and the purchase of the Portland office in connection with the Genevalogic acquisition, the management monitor the development and enter hedging contracts with up-to 50% of the running operating cash flow. The group did not enter any contracts in 2009. A part of the groups future cost will be in RON and the management will judge whether its prudent to enter RON contracts through opt ions or forward contracts but the group did not enter any contracts in 2009. The average RON exchange rate in 2009 was DKK1,76 against a budget exchange rate of DKK 1,85
Revaluation of investments in affiliated companies abroad with a different functional currency than danish kroner is recognized directly in equity as well as apparent in the total comprehensive income statement. The risks related thereto are not hedged. The Group hasconsidered that ongoing hedging of such long-term investments will not be optimal from an overall risk and cost considerations.
A sensitivity analysis shows that had the USD been on the 2008 level, which was 7% lower at 5,03 , revenue would been lower with DKK 3,1 mio. and EBIT and the equity would have been DKK 0,4 mio. lower. Had the USD been 10% higher at 5,92, it would have a positive effect with DKK2,5 mio. kr on revenue and EBIT and equity with DKK0,6 mio. kr.
Recognised transactionsHedging of recognised transactions primarily concerns receivables, cash and debt items.
NOTES TO ThE cONSOLidATEd AccOUNTS80

NOTES TO THE CONSOLIDATED ACCOUNTS
NOTE 32 DERIVATIVE FINANCIAL INSTRUMENTS, RISK AND FINANCIAL MANAGEMENT
Categories of Financial instruments31.12.2009 31.12.2008 01.01.2008DKK 1.000 DKK 1.000 DKK 1.000
Trade receivables 14,569 19,597 23,889
Other receivables 2,892 3,743 1,594
Cash at bank and in hand 4,848 48,146 84,114
Measured at amortised cost (receivables and deposits) 22,309 71,486 109,597
Trade payables 3,193 6,692 7,277
Other liabilities 11,644 10,743 6,701
Measured at amortised cost (loans and other debt) 14,838 17,435 13,978
Interest rate riskConsidering its positive cash holdings, the Group does not have a large risk exposure to interest rate fluctuations. The riskis mainly limited to the interest return on the Group’s positive cash holdings. The Group’s cash holdings are mainly placed indemand deposits at variable rates of interest.
In 2008, the company was not a contractual party to derivative financial instruments for which interest rate fluctuations cancause changes in their fair values, and it thus does not have any interest rate exposure.
The Group established a factoring arrangement in January 2010 for sales in the Nordic, where an interest rate based on CIBOR is applied to the outstanding amount. This interest exposure is considered as minimal.
Liquidity riskNetop Solutions pursues a policy of consistently ensuring the existence of adequate financial resources. Cash reserves,which are deemed to be sufficient to implement Netop Solutions’ current strategy, consist of prior-year cash flows and proceeds from the IPO in 2001. Cash resources amounted to DKK 48m at year-end 2008, but due to the global recession, revenue fell short of expectations causing the loss and the necessary drawings on our liquid reserves to be greater than anticipated. The large cash deficit NetopSolutions experienced in 2009 is expected to be reversed in 2010 through profitable operations and substantially lower costs. A factor of uncertainty relating to the company’s cash position in 2010 involved a guarantee commitment made in connection with the acquisition of GenevaLogic in 2008. The acquisition agreement included an obligation worth up to DKK 10m, which is expected to crystallize in the fourth quarter of 2010. We project cash inflows in all quarters of the year, and expect to base operations during the year on existing credit facilities. The work to strengthen the company’s capital resources continues, and Netop Solutions’ main shareholder, Consolidated Holdings Group, has stated that it is willing to assist in the procurement if additional capital to the Company,should becom e necessary in 2010.
Credit riskThe Group’s credit risks are mainly related to receivables and bank deposits. The Group’s sales are primarily made on open account.Most of Netop’s sales are to customers with whom the Group has maintained a business relationship for several years. The Group operates fixed terms of payment and has defined policies on how to follow up on non-payment. For customers not assessed to be sufficiently creditworthy, the Group changes the terms of payment or requires a down payment.
The Group manages its credit exposure risk through monthly monitoring and follow-up procedures. Historically, the Group has incurred relatively small losses as a result of non-payment by customers.
The maximum credit risk corresponds to the values recognised in the balance sheet. For more information on this, see note18.
The Group is not exposed to significant risks concerning individual customers or business partners.
NOTES TO ThE cONSOLidATEd AccOUNTS 81

NOTES TO THE CONSOLIDATED ACCOUNTS
NOTE 33 CONTINGENT LIABILITIES
NOTE 34 SUBSEQUENT EVENTS
In February 2010, Netop Solutions granted an additional 98,135 share options to a member of the Management Board.
Netop Solutions has sold the rights to Netop Solutions Mobile Embedded product. The sale is one of the steps taken to adjust the product portfolio. The agreed selling price is DKK 5.0m. DKK 2.0m of the amount was paid in cash when the contract was signed, while theremaining amount will be paid over a five-year period through a discount arrangement provided in the distributor agreement. The agreement was concluded with effect from 1 February 2010.
Beyond the above no material events have occurred after 31 December 2009.
Netop is not involved in any litigation proceedings or other situations that will have a material effect on the financial pos ition of the Netop Group.
NOTES TO ThE cONSOLidATEd AccOUNTS82
ANNUAL ACCOUNTS FOR NETOP SOLUTIONS A/S
Income statement 84Statement of comprehensive income 84Balance sheet 85Statement of changes in equity 87Cash flow statement 88Notes to the annual accounts 89
Page
83ANNUAL AccOUNTS FOR NETOP SOLUTiONS A/S

INCOME STATEMENT 1 JANUARY – 31 DECEMBER FOR NETOP SOLUTIONS A/S
DKK '000 2009 2008
Revenue 3 2,583 2,508
External costs 6 (3,691) 9,640 Amortisation, depreciation and impairment losses 4 - - Staff costs 5 (533) (825) Operating profit (EBIT) (1,642) 11,323
Profit/losses sale of investments 1,915 Write-down of receivables from subsidiaries 13 (110,361) - Write-down of investments 9 (34,904) - Financial income 7 10,317 9,305 Financial expenses 8 (521) 5,894 Profit before tax (135,196) 26,522
Corporation tax 10 (2,075) (3,789) Profit for the year (137,271) 22,733
Distributed as follows:Shareholders in Netop Solutions A/S (137,271) 22,733 Minority shareholders - -
(137,271) 22,733
DKK '000 2009 2008
Profit for the year (137,271) 22,733 Other comprehensive income after tax - - Total comprehensive income (137,271) 22,733
STATEMENT OF COMPREHENSIVE INCOME 31 DECEMBER FOR NETOP SOLUTIONS A/S
84 iNcOME STATEMENT FOR NETOP SOLUTiONS A/S
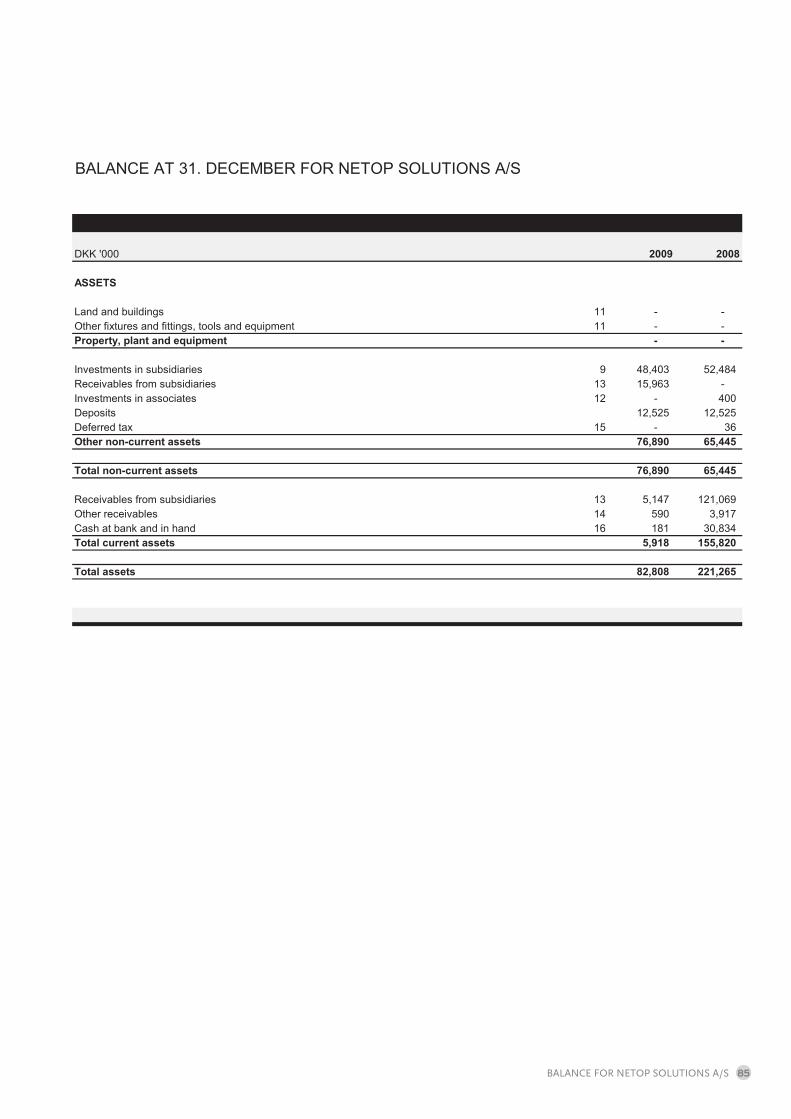
BALANCE AT 31. DECEMBER FOR NETOP SOLUTIONS A/S
DKK '000 2009 2008
ASSETS
Land and buildings 11 - - Other fixtures and fittings, tools and equipment 11 - - Property, plant and equipment - -
Investments in subsidiaries 9 48,403 52,484 Receivables from subsidiaries 13 15,963 - Investments in associates 12 - 400 Deposits 12,525 12,525 Deferred tax 15 - 36 Other non-current assets 76,890 65,445
Total non-current assets 76,890 65,445
Receivables from subsidiaries 13 5,147 121,069 Other receivables 14 590 3,917 Cash at bank and in hand 16 181 30,834 Total current assets 5,918 155,820
Total assets 82,808 221,265
85bALANcE FOR NETOP SOLUTiONS A/S

BALANCE AT 31. DECEMBER FOR NETOP SOLUTIONS A/S
DKK '000 2009 2008
EQUITY AND LIABILITIES
Equity 17Share capital 21,046 21,046 Other reserves 1,495 Retained earnings 41,022 180,094 Total equity 63,563 201,140
Provisions 18 - 10,000 Total non-current liabilities - 10,000
Debt. acquisition of subsidiaries 6,006 8,154 Provisions 18 10,000 - Trade payables 744 711 Corporation tax 2,038 Other liabilities 16 456 1,260 Total current liabilities 19,245 10,125
Total liabilities 19,245 20,125
Total equity and liabilities 82,808 221,265
86 bALANcE FOR NETOP SOLUTiONS A/S

STATEMENT OF CHANGES IN EQUITY 1 JANUARY - 31 DECEMBER FOR NETOP SOLUTIONS A/S
DKK '000
Equity at 1 January 2008 19,252 - 150,050 - 150,050 - 169,302
Capital increase 1,794 - 21,879 - 21,879 - 23,673 Acquisition of treasury shares - - (4,141) - (4,141) - (4,141) Share based payments - - - 1,362 1,362 - 1,362 Total comprehensive income for the year - - 10,945 - 10,945 - 10,945
Changes in equity in 2008 1,794 - 28,683 1,362 30,045 - 31,839
Equity at 31 December 2008 21,046 - 178,733 1,362 180,095 - 201,141
Equity at 1 January 2009 21,046 - 178,733 1,362 180,095 - 201,141
Acquisition of treasury shares - (440) - (440) - (440) Share based payments - 133 133 - 133 Total comprehensive income for the year - (137,271) - (137,271) - (137,271)
Changes in equity in 2009 - - (137,711) 133 (137,578) - (137,578)
Equity at 31 December 2009 21,046 - 41,022 1,495 42,517 - 63,563
Share capitalTranslation
reserveRetained earnings
Reserve for share based
payments Reserve totalProposed dividends Total
87chANgES iN EqUiTy FOR NETOP SOLUTiONS A/S

CASH FLOW STATEMENT 1 JANUARY - 31 DECEMBER FOR NETOP SOLUTIONS A/S
DKK '000 2009 2008
Operating profit (EBIT) (1,642) 11,323
Adjustments for non-cash transactionsShare based payments - 69 Gains and losses on sold property, plant and equipment - (12,502)
(1,642) (1,110) Change in net working capitalChange in receivables 3,327 (3,364) Change in trade payables and other liabilities (770) 73 Cash generated from operations, operating profit 915 (4,401)
Interest paid 418 2,618 Interest received (56) (387) Cash generated from operations, profit from ordinary activities 1,278 (2,170) Corporation tax paid - 4,844 Cash flow from operating activities 1,278 2,674
Disposal of property, plant and equipment - 41,500 Purchase/disposal of other non-current assets - (12,525) Acquisition of subsidiaries (75) (18,539) Change in balances with subsidiaries (excluding the joint taxation contribution) (31,416) (51,412) Cash flow from investing activities (31,491) (40,976)
Acquisition of treasury shares (440) (4,141) Cash flow from financing activities (440) (4,141)
Change in cash at bank and in hand (30,653) (42,443) Cash at bank and in hand at 1 January 16 30,834 73,277 Cash at bank and in hand at 31 December 16 181 30,834
88 cASh FLOw STATEMENT FOR NETOP SOLUTiONS A/S

NOTES TO THE ANNUAL ACCOUNTS FOR NETOP SOLUTIONS A/S
Accounting policies 1Critical accounting judgements and estimates 2Revenue 3Amortisation, depreciation and impairment losses 4Other operating income 5Fees to auditors appointed by the Annual General Meeting 6Financial income 7Financial expenses 8Investments in subsidiaries 9Corporation tax 10Property, plant and equipment 11Investments in associates 12Receivables from subsidiaries 13Other receivables 14Deferred tax 15Cash at bank and in hand 16Share capital 17Provisions 18Other liabilities 19
Note
NOTES TO ThE ANNUAL AccOUNTS FOR NETOP SOLUTiONS A/S 89

NOTES TO THE ANNUAL ACCOUNTS FOR NETOP SOLUTIONS A/S
NOTE 1 ACCOUNTING POLICIES
Accounting policies for the parent company The separate financial statements for the parent company have been incorporated into the annual report in compliance with the provisions of the Danish Financial Statements Act requiring separate parent company financial statements for companies having adopted IFRS. The financial statements of the parent company, Netop Solutions A/S, are presented in accordance with the provisions of the Danish Financial Statements Act. Accounting policy changes The accounting policies are unchanged from last year. Implementation of new accounting standards As from 1 January 2009, the parent company implemented the amended IAS 27 “Consolidated and separate financial statements”. This amended standard requires that dividends received from subsidiaries and associates are recognised in the parent company and not in the cost even if a distribution is related to a period prior to the date of acquisition. As the parent company did not receive such dividends in 2009, the amendment has no effect on the profit or on equity. See note 1 to the consolidated financial statements. Basis of presentation The parent company’s accounting policies differ from the accounting policies applied in the consolidated financial statements (see note 1 to the consolidated financial statements) in the following respects: Revenue The parent company’s revenue relates to rental income from renting out office premises to a subsidiary. This income is recognised in the income statement on a straight-line basis during the year at the fair value of the contractual consideration. Investments in subsidiaries and associates in the parent company’s financial statements Investments in subsidiaries and associates are measured at cost. Where the recoverable amount is lower than cost, the investments are written down to this lower value. On the acquisition of subsidiaries, the difference between the purchase price and the net asset value of the acquired enterprise is calculated at the time of the acquisition, after assets and liabilities have been revalued at fair value (the purchase method). Positive differences are recognised under Share of profit/loss in subsidiaries. In the income statement, the proportionate share of the profit after tax for the year less amortisation of goodwill is recognised under the line item Profit from investments in subsidiaries after tax. Gains or losses from the divestment or winding up of subsidiaries are stated as the difference between the selling price or the winding up sum and the carrying amount of net assets at the date of disposal, including goodwill, and anticipated divestment or winding-up costs. Gains or losses are recognised in the income statement. Tax Netop Solutions A/S is subject to the Danish rules on compulsory joint taxation of the Group’s Danish subsidiaries. Netop Solutions A/S is the management company for the joint taxation and consequently settles all payments of income tax with the tax authorities. Joint taxation contributions to/from subsidiaries are recognised under tax on the profit/loss for the year. Tax payable and tax receivable is recognised under current assets/liabilities. Joint taxation contributions payable and receivable are recognised in the balance sheet under receivables from or debt to subsidiaries.
NOTES TO ThE ANNUAL AccOUNTS FOR NETOP SOLUTiONS A/S90
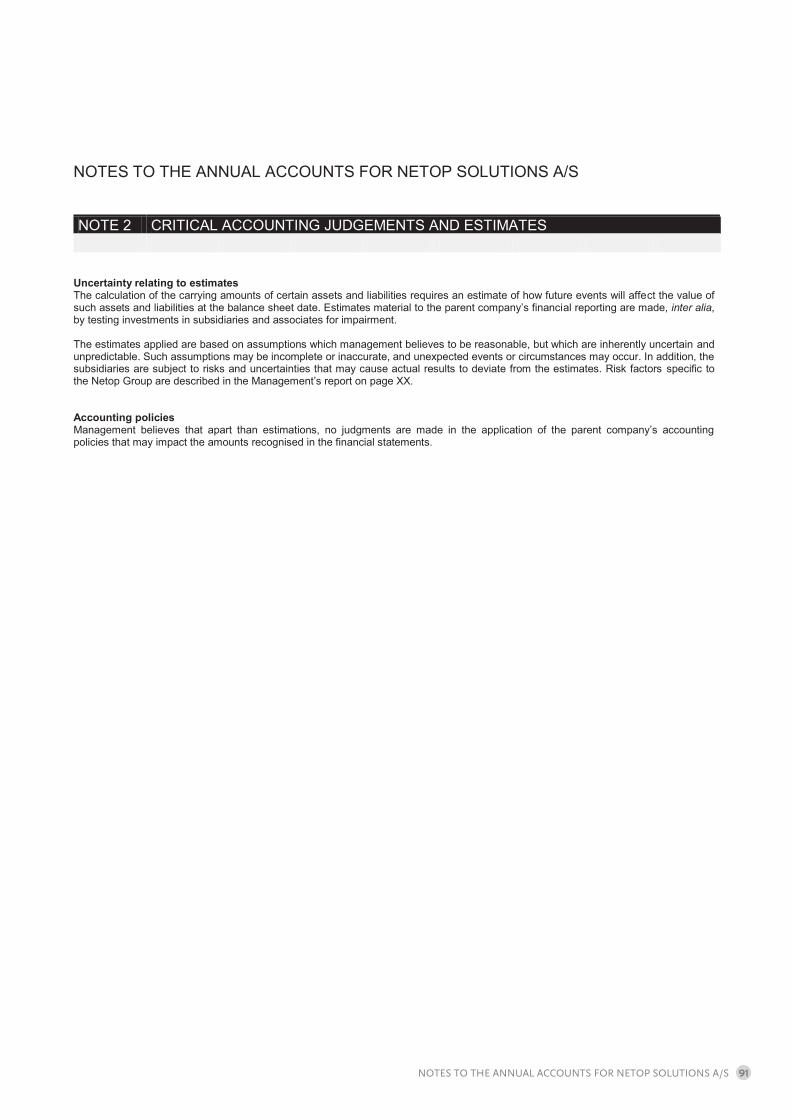
NOTES TO THE ANNUAL ACCOUNTS FOR NETOP SOLUTIONS A/S
NOTE 2 CRITICAL ACCOUNTING JUDGEMENTS AND ESTIMATES
Uncertainty relating to estimates The calculation of the carrying amounts of certain assets and liabilities requires an estimate of how future events will affect the value of such assets and liabilities at the balance sheet date. Estimates material to the parent company’s financial reporting are made, inter alia, by testing investments in subsidiaries and associates for impairment. The estimates applied are based on assumptions which management believes to be reasonable, but which are inherently uncertain and unpredictable. Such assumptions may be incomplete or inaccurate, and unexpected events or circumstances may occur. In addition, the subsidiaries are subject to risks and uncertainties that may cause actual results to deviate from the estimates. Risk factors specific to the Netop Group are described in the Management’s report on page XX. Accounting policies Management believes that apart than estimations, no judgments are made in the application of the parent company’s accounting policies that may impact the amounts recognised in the financial statements.
NOTES TO ThE ANNUAL AccOUNTS FOR NETOP SOLUTiONS A/S 91

NOTES TO THE ANNUAL ACCOUNTS FOR NETOP SOLUTIONS A/S
NOTE 3 REVENUE
DKK '000 2009 2008
Rental income 2,583 2,508 2,583 2,508
NOTE 4 AMORTISATION, DEPRECIATION AND IMPAIRMENT LOSSES
DKK '000 2009 2008
Amortisation, depreciation and impairment losses are specified as follows:Depreciation, property, plant and equipment - 824
- 824
NOTE 5 STAFF COSTS
DKK '000 2009 2008
Staff costs are specified as follows:Remuneration to Board of directors 533 825
533 825
The Management Board had three members in 2009, as was also the case in 2008. The parent company had no employees in 2009 (2008: 0 employees).
Members of the Board of Directors of Netop Solutions A/S received total remuneration of DKK xxx thousand in 2009 (2008: DKK 8 25 thousand) for services rendered to the company and other companies of the Netop Group. The Board of Directors receive a fixedremuneration and Board members do not participate in share option schemes, incentive plans, pension plans or other Group sche mes. No arrangements have been made in respect of severance payments to Board members, nor have any such payments been made.
NOTES TO ThE ANNUAL AccOUNTS FOR NETOP SOLUTiONS A/S92

NOTES TO THE ANNUAL ACCOUNTS FOR NETOP SOLUTIONS A/S
NOTE 6 FEES TO AUDITORS APPOINTED BY THE ANNUAL GENERAL MEETING
DKK '000 2009 2008
Total fee to Deloitte are specified as follows:
Audit 152 300 Other assurance statements - - Tax assistance 23 - Other services - 401
174 701
Total fee to other auditors (not appointed byt the annual general meeting) are specified as follows:
Audit - 239 Other assurance statements - - Tax assistance - - Other services - -
- 239
Total fee 174 940
NOTE 7 FINANCIAL INCOME
DKK '000 2009 2008
Financial income from subsidiaries 9,777 6,687 Other interest income 418 2,404 Exchange rate income 121 214
10,317 9,305
NOTE 8 FINANCIAL EXPENSES
DKK '000 2009 2008
Financial expenses to subsidiaries 286 297 Other interest costs 56 366 Exchange rate loss 101 22 Price adjustments securities 77 - Value adjustment in respect of guaranteed share price - 5,209
521 5,894
NOTES TO ThE ANNUAL AccOUNTS FOR NETOP SOLUTiONS A/S 93

NOTES TO THE ANNUAL ACCOUNTS FOR NETOP SOLUTIONS A/S
NOTE 9 INVESTMENTS IN SUBSIDIARIES
DKK '000 2009 2008
Cost at 1 January 77,818 29,522 Acquisition of subsidiary 869 48,296 Capital increase 32,212 - Disposals (2,258) -
108,641 77,818
Value adjustments at 1 January 25,334 25,334 Amortisation 34,904 -
60,238 25,334
48,403 52,484
NameRegistered address
Interest held 2009
Interest held 2008
Danware Security A/S Birkerød, Danmark 100% 100%Danware Cursum ApS (liquidated in 2009) Birkerød, Danmark 0% 100%Danware Education ApS (liquidated in 2009) Birkerød, Danmark 0% 100%Genevalogic AG Langenthal, Schweiz 100% 100%Genevalogic Holding AG Langenthal, Schweiz 100% 100%Genevalogic Ltd. Herts, England 100% 100%Genevalogic Inc. (merged with Netop Tech Inc. in 2009) Portland, USA 0% 100%Netop Tech Inc. Chicago, USA 100% 100%Netop Tech Ltd. Reading, England 100% 100%Netop Tech GmbH Neu-Isenburg, Tyskland 100% 100%Netop Tech SRL Bukarest, Rumænien 100% 100%Netop Tech Development Center SRL Bukarest, Rumænien 100% 0%Netop Business Solutions A/S Birkerød, Danmark 100% 100%Netop Netfilter A/S (former Enologic A/S) Birkerød, Danmark 100% 50%
Cost at 31 December
Value adjustments at 31 December
Carrying amount at 31 December
The increase related to the acquisition of the outstanding 50% of the shares in Netop Netfilter. See note 26 to the consolida ted financial statements.
The write-down relates to the investment in GenevaLogic Holding AG. The present value of the expected future cash flows from theoperation of the company (and underlying companies) is not estimated to match the carrying amount of the investments at 31 December 2009 of DKK 48,295 thousand before write-downs. Accordingly, the investment has been written down to the value in use of DKK 13,391 thousand.
See note 14 to the consolidated financial statements for a further description of assumptions for the impairment test applied to the value taken over on the acquisition of the investment in GenevaLogic Holding AG.
NOTES TO ThE ANNUAL AccOUNTS FOR NETOP SOLUTiONS A/S94

NOTES TO THE ANNUAL ACCOUNTS FOR NETOP SOLUTIONS A/S
NOTE 10 CORPORATION TAX
DKK '000 2009 2008
Current tax on profit for the year 2,038 4,149 Deferred tax on profit for the year 37 (369) Adjustments relating to previous years (net) - 9
2,075 3,789
Corporatio tax is specified as follows:Tax on profit for the year 2,075 3,789 Tax on changes in equity - -
2,075 3,789
Analysis of tax on profit from ordinary activities of continuing business:25% tax of profit from ordinary activities of continuing business before tax (33,799) 3,684 Non-capitalised deferred tax 36 - Change in corporation tax rate - -
Computation of effective tax rate:Non-taxable income (479) (28) Non-tax deductible write-downs 36,316 - Non-tax deductible expenses - 123 Tax depreciation 1 - Adjustment relating to previous years - 10
2,075 3,789
Effective tax rate -1.5% 25.7%
NOTES TO ThE ANNUAL AccOUNTS FOR NETOP SOLUTiONS A/S 95

NOTES TO THE ANNUAL ACCOUNTS FOR NETOP SOLUTIONS A/S
NOTE 11 PROPERTY, PLANT AND EQUIPMENT
DKK '000Land and buildings
Other fixtures
and fittings,
tools and equipment Total
2009Cost at 1 January - 68 68 Additions - - - Disposals - - -
- 68 68
- 68 68 Amortisation for the year - - - Impairment losses for the year - - - Reversal of amortisation of disposals in the year - - -
- 68 68
- - - 20-50 yrs 3-5 yrs
DKK '000Land and buildings
Other fixtures
and fittings,
tools and equipment Total
2008Cost at 1 January 36,194 126 36,320 Additions - - - Disposals (36,194) (58) (36,252)
- 68 68
6,374 126 6,500 Amortisation for the year 824 - 824 Impairment losses for the year - - - Reversal of amortisation of disposals in the year (7,198) (58) (7,256)
- 68 68
- - - 20-50 yrs 3-5 yrsAmortisation period
Cost at 31 December
Amortisation and impairment losses at 31 December
Carrying amount at 31 December
Amortisation and impairment losses at 1 January
Amortisation period
Cost at 31 December
Amortisation and impairment losses at 1 January
Carrying amount at 31 December
Amortisation and impairment losses at 31 December
NOTES TO ThE ANNUAL AccOUNTS FOR NETOP SOLUTiONS A/S96

NOTES TO THE ANNUAL ACCOUNTS FOR NETOP SOLUTIONS A/S
NOTE 12 INVESTMENTS IN ASSOCIATES
DKK '000 2009 2008
Cost at 1 January 2,355 2,355 Additions 519 - Disposals, disposals of companies (2,874) - Cost at 31 December - 2,355
(1,955) (1,955) Disposals, transferred to investment in subsidiaries 1,955 -
- (1,955)
- 400
2008
Name and registered address Interest held RevenueNet
profit/(loss) Assets Liabilities EquityNet
profit/(loss)
Enologic A/S, Aalborg 50% 25 - 810 13 398 -
NOTE 13 RECEIVABLES FROM SUBSIDIARIES
DKK 1.000 2009 2008
Receivables 1 January 121,069 62,896 Additions 10,401 58,173
131,470 121,069
- - 110,361 - 110,361 -
21,109 121,069
Receivables from subsidiaries total are expected to be payable as follows:Current assets 5,147 121,069 Non-current assets 15,963 -
21,109 121,069
Carrying amount at 31 December
Value adjustments in 2009
Carrying amount at 31 December
Netop Solutions group share
Value adjustments at 1 January
Value adjustments at 31 December
Receivables 31 December
Value adjustments at 1 January
Value adjustments at 31 December
Netop acquired the outstanding 50% of the shares in the company Enologic A/S. See note 26. Accordingly, this company has beenconsolidated on the same terms ad the company’s other wholly owned subsidiaries.
NOTES TO ThE ANNUAL AccOUNTS FOR NETOP SOLUTiONS A/S 97

NOTES TO THE ANNUAL ACCOUNTS FOR NETOP SOLUTIONS A/S
NOTE 14 OTHER RECEIVABLES
DKK '000 2009 2008
Prepayments 570 553 Other receivables 20 3,364
590 3,917
– specified as follows:0 - 1 year 590 3,917 > 1 year - -
590 3,917
NOTE 15 DEFERRED TAX
DKK '000 2009 2008
Deferred tax at 1 January (net) 36 (333) Deferred tax, acquisition of subsidiary - - Adjustment relating to previous years (36) - Changes in corporation tax rate - - Deferred tax on profit for the year - 369 Deferred tax at 31 December (net) - 36
Deferred tax is recognized in the balance as follows:Deferred tax assets - 36 Provision for deferred tax - - Deferred tax at 31 December (net) - 36
Deferred tax concerns:
Intangible assets - - Property, plant and equipment - 36 Trade receivables - - Other liabilities - - Share-based payments - - Tax loss - - Write down - -
- 36
NOTE 16 CASH AT BANK AND IN HAND
DKK '000 2009 2008
Cash at bank and in hand 181 30,834Cash at 31 December 2008 as per cash flow statement 181 30,834
NOTE 17 SHARE CAPITAL
Prepayments covers prepaid costs such as rent, insurance, software licenses, etc.
Other receivables consist mainly of receivable VAT.
Equity mix, treasury shares shares and dividends are shown in note 20 to the consolidated financial statements
NOTES TO ThE ANNUAL AccOUNTS FOR NETOP SOLUTiONS A/S98
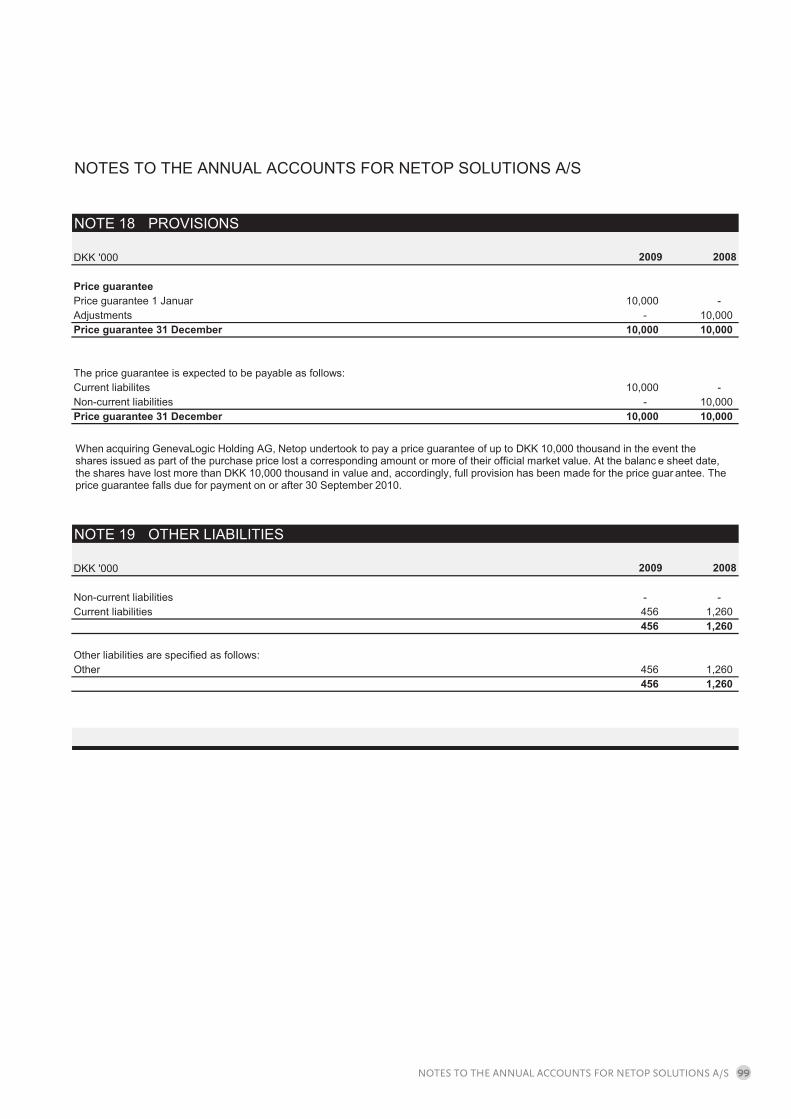
NOTES TO THE ANNUAL ACCOUNTS FOR NETOP SOLUTIONS A/S
NOTE 18 PROVISIONS
DKK '000 2009 2008
Price guaranteePrice guarantee 1 Januar 10,000 - Adjustments - 10,000 Price guarantee 31 December 10,000 10,000
The price guarantee is expected to be payable as follows:Current liabilites 10,000 - Non-current liabilities - 10,000 Price guarantee 31 December 10,000 10,000
NOTE 19 OTHER LIABILITIES
DKK '000 2009 2008
Non-current liabilities - - Current liabilities 456 1,260
456 1,260
Other liabilities are specified as follows:Other 456 1,260
456 1,260
When acquiring GenevaLogic Holding AG, Netop undertook to pay a price guarantee of up to DKK 10,000 thousand in the event theshares issued as part of the purchase price lost a corresponding amount or more of their official market value. At the balanc e sheet date, the shares have lost more than DKK 10,000 thousand in value and, accordingly, full provision has been made for the price guar antee. The price guarantee falls due for payment on or after 30 September 2010.
NOTES TO ThE ANNUAL AccOUNTS FOR NETOP SOLUTiONS A/S 99

DENMARK
Bregnerodvej 127
3460 Birkerod - DK
T: +45 4590 25 25
Support: +45 4590 25 10
Fax: +45 4590 2526
UNITED STATES
15725 SW Greystone Ct. Suite 105
Beaverton, Oregon 97006
T: +1 503 352 3599
737 N. Michigan Ave Suite 1510
Chicago, IL 60611 USA
T: 1 866 907 2971
UNITED KINGDOM
308-314 Kings Road
Reading
Berkshire RG1 4HP
United Kingdom
T: +44 (0) 845 466 9000
SWITZERLAND
Chasseralstrasse 1-9
CH-4900 Langenthal
Switzerland
T: +41 (0)62 957 70 40