Embed Size (px)
Citation preview

2009 NATURAL CATASTROPHE YEAR IN REVIEW WEBINAR
JANUARY 21, 2010

© 2010 Munich Re 2Source: Geo Risks Research, NatCatSERVICE As at January 2010
Welcome/IntroductionTerese Rosenthal
U.S. Natural Catastrophe UpdateCarl Hedde
Global Catastrophe UpdateAngelika Wirtz
Financing Catastrophic Losses in the Midst of Financial Catastrophe Dr. Robert Hartwig
Questions and Answers
Agenda

© 2010 Munich Re 3Source: Geo Risks Research, NatCatSERVICE As at January 2010
At the conclusion of the presentation, you will have an opportunity to ask questions.
To ask a question, please dial 1 4 on your phone.
An operator will facilitate your participation.
Question and Answer Process

© 2010 Munich Re 4
U.S. Natural Catastrophe Update
Carl HeddeHead of Risk AccumulationMunich Reinsurance America

© 2010 Munich Re 5
MR NatCatSERVICEOne of the world‘s largest databases on natural catastrophes
The database today:
From 1980 until today all loss events; for USA and selected countries in Europe all loss events since 1970
Retrospectively all great disasters since 1950
In addition, all major historical events starting from 79 AD – eruption of Mt. Vesuvio (3,000 historical data sets)
Currently more than 27,000 events
© 2010 Munich Re 5

© 2010 Munich Re 6
2009 Headlines
Insured losses in the United States in 2009 totaled $11.1 billion – much lower than the 1999 to 2008 average loss of $24.5 billion (in 2009 Dollars)
Near-record insured losses due to thunderstorms
Two tropical storms, but no hurricanes, made landfall in the U.S.: Claudette and Ida
Large wildfires in Southern California, but damages were limited
Winter storm insured losses lowest in eight years
Spring floods in the Northern Plains break historical river level records
U.S. Natural Catastrophe Update
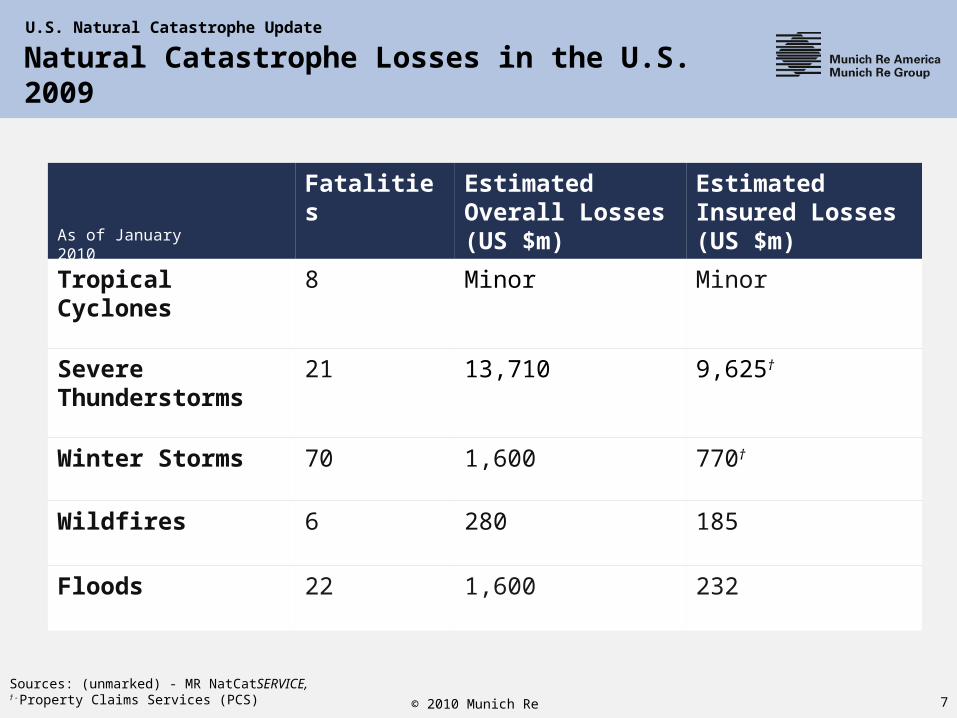
© 2010 Munich Re 7Sources: (unmarked) - MR NatCatSERVICE, † - Property Claims Services (PCS)
Fatalities Estimated Overall Losses (US $m)
Estimated Insured Losses (US $m)
Tropical Cyclones 8 Minor Minor
Severe Thunderstorms
21 13,710 9,625†
Winter Storms 70 1,600 770†
Wildfires 6 280 185
Floods 22 1,600 232
As of January 2010
Natural Catastrophe Losses in the U.S. 2009U.S. Natural Catastrophe Update

© 2010 Munich Re 8
U.S. Significant Natural Catastrophes in 2009
Date Event Est. Economic Losses (US $m)
Estimated Insured Losses (US $m)
January 26 - 28 Winter Storm 1,100 565†
February 10 - 13 Thunderstorms 2,500 1,350†
March 25 - 26 Thunderstorms 1,500 995†
March – April Flood 1,000 75
April 9 -11 Thunderstorms 1,700 1,150†
June 10 -18 Thunderstorms 2,000 1,100†
July 20 -21 Thunderstorms 1,000 800†
$1 billion economic loss and/or 50 fatalities
Sources: (unmarked) - MR NatCatSERVICE, † - Property Claims Services (PCS)
As of January 2010
U.S. Natural Catastrophe Update

© 2010 Munich Re 9
There were 7 Significant Natural Catastrophes in the United States in 2009.
Sources: MR NatCatSERVICE
U.S. Significant Natural Catastrophes, 1950 – 2009Number of Events ($1 billion economic loss and/or 50 fatalities)
U.S. Natural Catastrophe Update
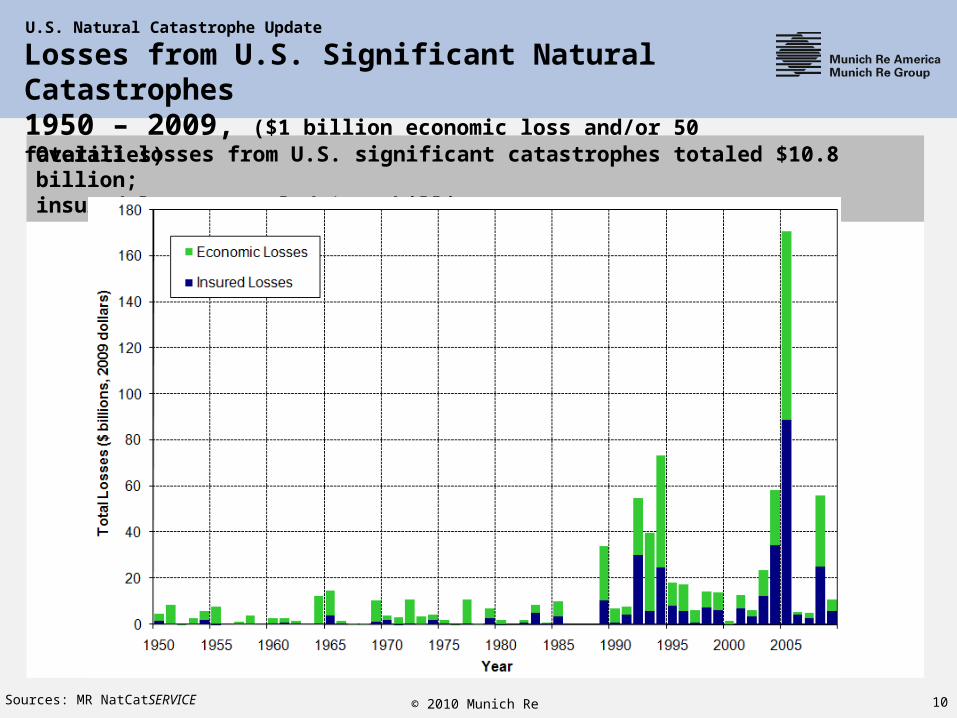
© 2010 Munich Re 10
Overall losses from U.S. significant catastrophes totaled $10.8 billion; insured losses totaled $5.9 billion
Losses from U.S. Significant Natural Catastrophes 1950 – 2009, ($1 billion economic loss and/or 50 fatalities)
U.S. Natural Catastrophe Update
Sources: MR NatCatSERVICE

© 2010 Munich Re 11
Insured losses due to weather perils in the U.S. in 2009 were the highest on record for a year without a hurricane landfall.
Insured Losses due to Weather Perils in the U.S.1980 – 2009 (Tropical Cyclone, Thunderstorm, and Winter Storm only)
U.S. Natural Catastrophe Update
Sources: MR NatCatSERVICE, Property Claims Services

© 2010 Munich Re 12Photo: NOAA
U.S. Tropical Cyclones 2009

© 2010 Munich Re 13
U.S. Tropical Cyclone Landfalls in 2009
Source: NOAA
Ida
Claudette
© 2010 Munich Re 14
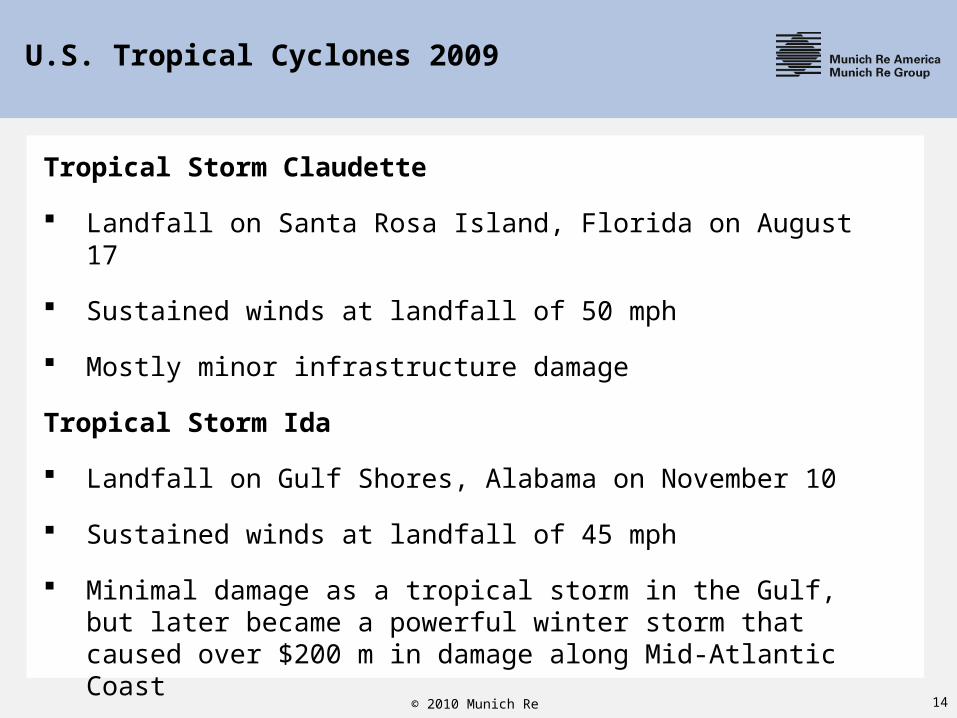
U.S. Tropical Cyclones 2009
Tropical Storm Claudette
Landfall on Santa Rosa Island, Florida on August 17
Sustained winds at landfall of 50 mph
Mostly minor infrastructure damage
Tropical Storm Ida
Landfall on Gulf Shores, Alabama on November 10
Sustained winds at landfall of 45 mph
Minimal damage as a tropical storm in the Gulf, but later became a powerful winter storm that caused over $200 m in damage along Mid-Atlantic Coast

© 2010 Munich Re 15
Two tropical cyclones made landfall in the U.S. in 2009, neither at hurricane intensity.
Number of U.S. Landfalling Tropical Cyclones1900 - 2009
Source: NOAA
U.S. Tropical Cyclones 2009

© 2010 Munich Re 16
The current 5-year average (2005-2009) insured tropical cyclone loss is $23.7 bn.
Insured U.S. Tropical Cyclone Losses, 1980 - 2009
Sources: Property Claims Service, MR NatCatSERVICE, NFIP
U.S. Tropical Cyclones 2009

© 2010 Munich Re 17
Other U.S. Natural Catastrophes in 2009
Source: FEMA

© 2010 Munich Re 18
Five-year average losses now stand at a record $7.2 billion a year.
Insured U.S. Thunderstorm Losses, 1980 – 2009
Sources: Property Claims Service, MR NatCatSERVICE
Other U.S. Natural Catastrophes in 2009
Thunderstorm losses in 2009 were only $900m short of 2008’s record loss.

© 2010 Munich Re 19
U.S. Tornado Count, 2009 compared to 2004 - 2008
Sources: NOAA, SPC
Other U.S. Natural Catastrophes in 2009

© 2010 Munich Re 20
Winter storm losses in 2008 were the lowest in 8 years, and $600 million below average.
Sources: Property Claims Service, MR NatCatSERVICE
Insured U.S. Winter Storm Losses, 1980 - 2009 Other U.S. Natural Catastrophes in 2009
2009 Total: $770 million

© 2010 Munich Re 21
California has averaged $500 million in Wildfire losses per year since 1990.
Insured California Wildfire Losses, 1980 - 2009Other U.S. Natural Catastrophes in 2009
2009 Total: $140 million
Sources: Property Claims Service, MR NatCatSERVICE

© 2010 Munich Re 22
2 fatalities - 200 people injured
8,000 properties flooded
2,000,000 acres of agricultural land flooded. 90,000 head of livestock killed
Estimated economic and insured losses of $1 billion and $75 million, respectively
Affected States: Minnesota, North Dakota, South Dakota
City of Fargo experienced record water levels and floods beyond the 500 year floodplain
Red River Flood of Spring 2009Other U.S. Natural Catastrophes in 2009
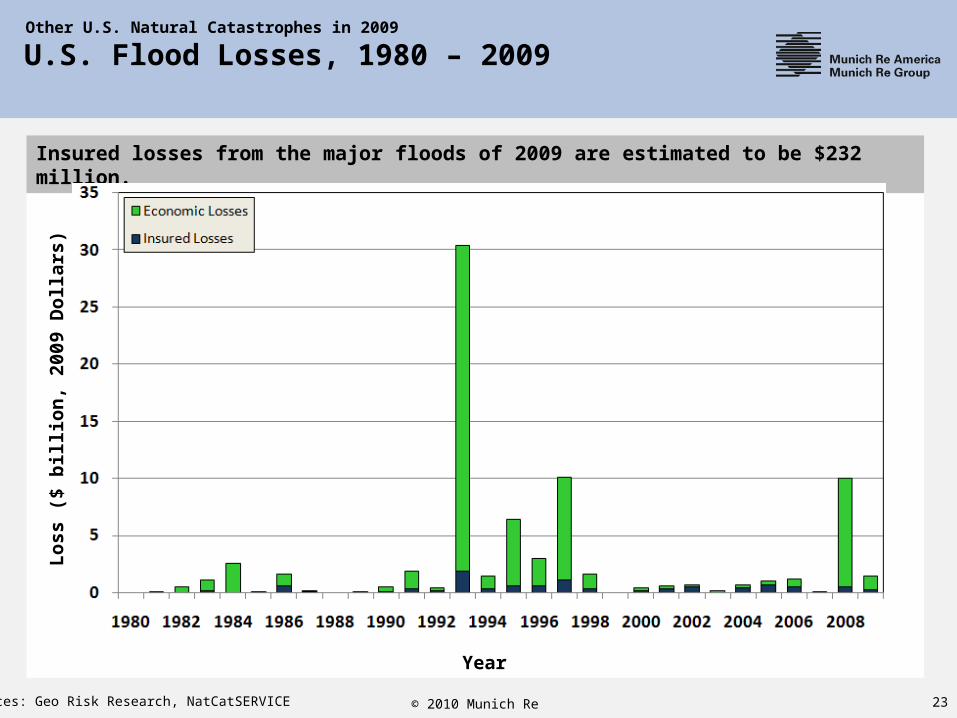
© 2010 Munich Re 23
Insured losses from the major floods of 2009 are estimated to be $232 million.
U.S. Flood Losses, 1980 – 2009
Year
Sources: Geo Risk Research, NatCatSERVICE
Lo
ss (
$ b
illi
on
, 20
09
Do
llar
s)
Other U.S. Natural Catastrophes in 2009

© 2010 Munich Re 24Source: Geo Risks Research, NatCatSERVICE As at January 2010
GLOBAL NATURAL CATASTROPHE UPDATE
ANGELIKA WIRTZHEAD OF MUNICH RE NATCAT SERVICE
© 2010 Munich Re 25Source: Geo Risks Research, NatCatSERVICE As at January 2010
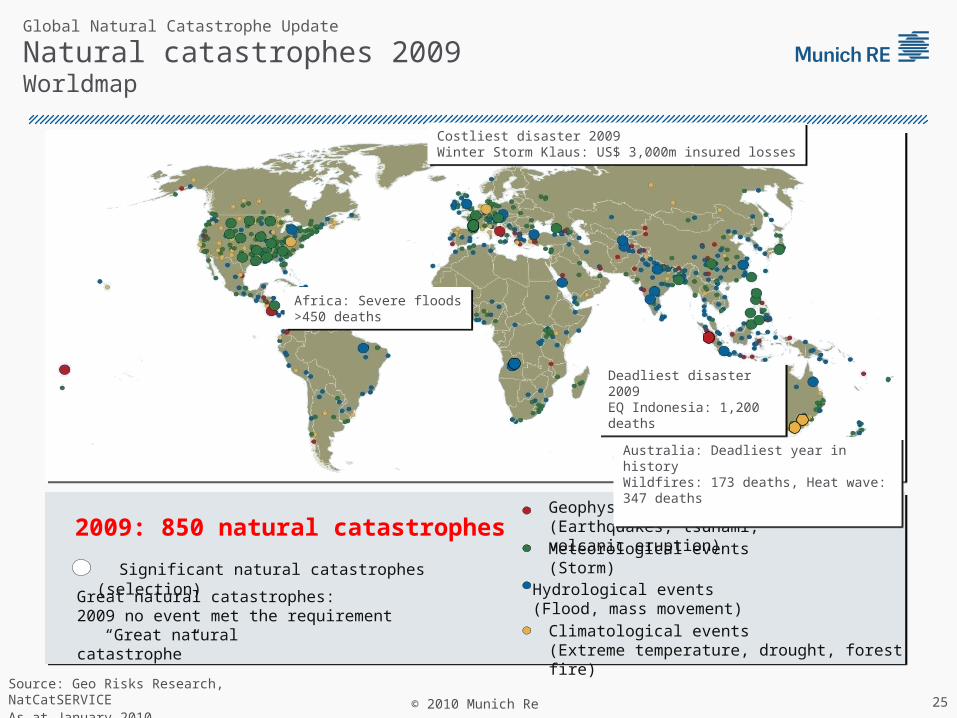
Natural catastrophes 2009Worldmap
Significant natural catastrophes (selection)
Great natural catastrophes: 2009 no event met the requirement “Great
naturalcatastrophe”
2009: 850 natural catastrophesGeophysical events(Earthquakes, tsunami, volcanic eruption)
Meteorological events(Storm)Hydrological events(Flood, mass movement)
Climatological events(Extreme temperature, drought, forest fire)
Global Natural Catastrophe Update
Costliest disaster 2009Winter Storm Klaus: US$ 3,000m insured losses
Costliest disaster 2009Winter Storm Klaus: US$ 3,000m insured losses
Africa: Severe floods>450 deaths
Africa: Severe floods>450 deaths
Australia: Deadliest year in historyWildfires: 173 deaths, Heat wave: 347 deaths
Australia: Deadliest year in historyWildfires: 173 deaths, Heat wave: 347 deaths
Deadliest disaster 2009EQ Indonesia: 1,200 deaths
Deadliest disaster 2009EQ Indonesia: 1,200 deaths

© 2010 Munich Re 26Source: Geo Risks Research, NatCatSERVICE As at January 2010
Global Natural Catastrophe Update
Global natural disastersThe figures of the year 2009
The figures of the year 2009 10-year average in the period 1999-2008
Number of events 850 770
Overall losses (US$m, 2009 values)
50,000 115,000
Insured losses (US$m, 2009 values)
22,000 36,000
Fatalities 10,500 76,000

© 2010 Munich Re 27Source: Geo Risks Research, NatCatSERVICE As at January 2010
Global Natural Catastrophe Update
Global natural disasters The five largest natural catastrophes of 2009 - Ranking by insured losses
Date Country/Region Event Fatalities Overall losses US$m
Insured lossesUS$m
23−25.1.2009 Europe Winter Storm Klaus 26 5,100 3,000
10−13.2.2009 USA Severe storms, tornadoes 15 2,500 1,350
23−27.7.2009 East and West Europe
Severe storms, hailstorms
11 1,800 1,200
9−11.4.2009 USA Severe storms, tornadoes 9 1,700 1,150
10−18.6.2009 USA Severe storms, tornadoes 1 2,000 1,100
© 2010 Munich Re 28Source: Geo Risks Research, NatCatSERVICE As at January 2010
Global Natural Catastrophe Update
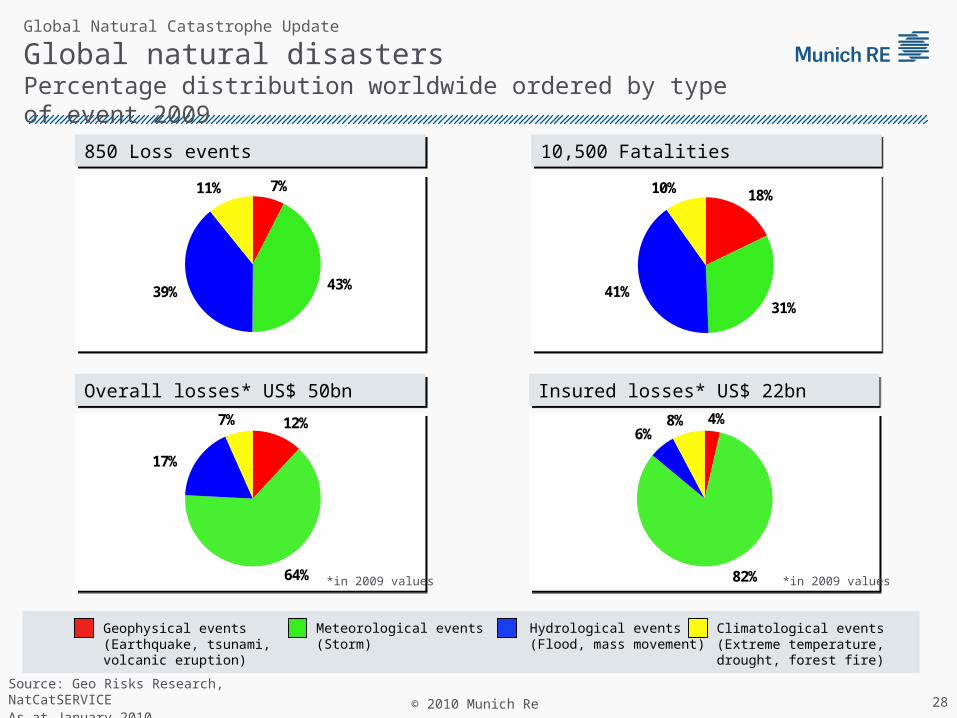
Global natural disasters Percentage distribution worldwide ordered by type of event 2009
850 Loss events850 Loss events 10,500 Fatalities10,500 Fatalities
Overall losses* US$ 50bn Overall losses* US$ 50bn Insured losses* US$ 22bnInsured losses* US$ 22bn
*in 2009 values
7%
43%39%
11% 18%
31%41%
10%
12%
64%
17%
7% 4%
82%
6%8%
*in 2009 values
Climatological events(Extreme temperature, drought, forest fire)
Hydrological events(Flood, mass movement)
Meteorological events(Storm)
Geophysical events(Earthquake, tsunami, volcanic eruption)

© 2010 Munich Re 29Source: Geo Risks Research, NatCatSERVICE As at January 2010
Global Natural Catastrophe Update
Global natural catastrophes 2009 Percentage distribution per continent
5%
7%
<1%
<1%
60%28%
Insured losses:US$ 22bn

© 2010 Munich Re 30Source: Geo Risks Research, NatCatSERVICE As at January 2010
50
100
150
200
250
300
1980 1982 1984 1986 1988 1990 1992 1994 1996 1998 2000 2002 2004 2006 2008
Global Natural Catastrophe Update
Global natural catastrophes 1980 – 2009Overall and insured losses with trend
US
$bn
Overall losses (in 2009 values) Insured losses (in 2009 values)
Trend insured lossesTrend overall losses

© 2010 Munich Re 31Source: Geo Risks Research, NatCatSERVICE As at January 2010
Global Natural Catastrophe Update
Natural catastrophes 2009-2010Worldmap

© 2010 Munich Re 32Source: Geo Risks Research, NatCatSERVICE As at January 2010
Global Natural Catastrophe Update
Haiti Earthquake
As insurance penetration is far below 1% in Haiti, insured loss is likely to be small.
However, some facultative risks with high insured values have been hit and could influence the overall market loss significantly.
The Caribbean Catastrophe Risk Insurance facility (CCRIF) will certainly be activated, resulting in a maximum payout of 7.7 mil. USD.
The CCRIF made two payouts in its first year, both as a result of the magnitude 7.4 earthquake which shook the eastern Caribbean on 29th November. The St. Lucian government received US$418,976 while the Dominican government received US$528,021. The monies will go towards post-earthquake recovery efforts in both these nations.

© 2010 Munich Re 33Source: Geo Risks Research, NatCatSERVICE As at January 2010
At the conclusion of the presentation, you will have an opportunity to ask questions.
To ask a question, please dial 1 4 on your phone.
An operator will facilitate your participation.
Question and Answer Process
Economic Implications of Catastrophe Losses in 2009: Financing Catastrophic Loss Amid Financial Catastrophe
2009 Natural Catastrophe ReviewJanuary 21, 2010
Robert P. Hartwig, Ph.D., CPCU, President & EconomistInsurance Information Institute 110 William Street New York, NY 10038
Tel: 212.346.5520 Cell: 917.453.1885 [email protected] www.iii.org

35
Decade of Disaster: Relative Quiet of 2009 Belies the Truth of the Past Decade

36
$8.3
$7.4
$2.6 $10.1
$8.3
$4.6
$26.5
$5.9 $12.9 $
27.5
$61.9
$9.2
$6.7
$26.0
$11.1
$100.0
$7.5
$2.7
$4.7
$22.9
$5.5 $
16.9
$0
$20
$40
$60
$80
$100
$120
89 90 91 92 93 94 95 96 97 98 99 00 01 02 03 04 05 06 07 08 09*20??
US Insured Catastrophe Losses
* 2009 figure is Munich Re estimate.Note: 2001 figure includes $20.3B for 9/11 losses reported through 12/31/01. Includes only business and personal property claims, business interruption and auto claims. Non-prop/BI losses = $12.2B.Sources: Property Claims Service/ISO; Insurance Information Institute.
2009 CAT Losses Were Less than Half of 2008. 2005 Was by Far the Worst Year Ever for Insured Catastrophe
Losses in the Decade of the 2000s Were More than Double the 1990s, But the Worst Has Yet to Come
$100 Billion CAT Year is Coming Eventually
2009 CAT Losses
Were Down 48% though
Q3 from $21.1B 2008
($ Billions)
2000s: A Decade of Disaster
2000s: $193B (up 117%)
1990s: $89B

37
Top 12 Most Costly Disastersin US History
(Insured Losses, 2009, $ Billions)
* PCS estimate as of August 1, 2009.Sources: PCS; Insurance Information Institute inflation adjustments.
$11.3 $11.3 $12.5
$22.8 $23.8
$45.3
$8.5$8.1$7.3$6.2$5.2$4.2
$0$5
$10$15$20$25$30$35$40$45$50
Jeanne(2004)
Frances(2004)
Rita (2005)
Hugo(1989)
Ivan (2004)
Charley(2004)
Wilma(2005)
Northridge(1994)
Ike(2008)*
9/11Attacks(2001)
Andrew(1992)
Katrina(2005)
8 of the 12 Most Expensive Disasters in US History Have Occurred Since 2004;
8 of the Top 12 Disasters Affected FL
In 2008, Ike Became the 4th Most Expensive Insurance Event and 3rd Most Expensive
Hurricane in US History Arising from About 1.35MM Claims

Financial Performance
38
Lower Catastrophe Losses, Easing of Crisis Bolstered Results

P/C Net Income After Taxes1991–2009:Q3 ($ Millions)
$1
4,1
78
$5
,84
0
$1
9,3
16
$1
0,8
70
$2
0,5
98
$2
4,4
04 $3
6,8
19
$3
0,7
73
$2
1,8
65
$3
,04
6
$3
0,0
29
$6
2,4
96
$2
,37
9
$1
6,1
64
-$6,970
$6
5,7
77
$4
4,1
55
$2
0,5
59
$3
8,5
01
-$10,000
$0
$10,000
$20,000
$30,000
$40,000
$50,000
$60,000
$70,000
$80,000
91 92 93 94 95 96 97 98 99 00 01 02 03 04 05 06 07 08 09:Q3
2005 ROE*= 9.4% 2006 ROE = 12.2% 2007 ROE = 10.9% 2008 ROE = 0.3% 2009:Q3 ROAS1 = 4.5%
* ROE figures are GAAP; 1Return on avg. surplus. Excluding Mortgage & Financial Guaranty insurers yields a 4.5% ROAS for 2008 and 5.9% for the first 9 months of 2009. 2009:Q3 net income was $20.5 billion excluding M&FG.Sources: A.M. Best, ISO, Insurance Information Institute
Improved financial market conditions, lower
catastrophe losses improved profitability in 2009
39

40
ROE: P/C vs. AllIndustries1987–2009:Q3*
* Excludes Mortgage & Financial Guarantee in 2008 and 2009 through Q3.Sources: ISO, Fortune; Insurance Information Institute.
-5%
0%
5%
10%
15%
20%
87 88 89 90 91 92 93 94 95 96 97 98 99 00 01 02 03 04 05 06 07 08 09:Q3
US P/C Insurers All US Industries
P/C Profitability isCyclical and Volatile
Hugo
Andrew
Northridge
Lowest CAT Losses in 15 Years
Sept. 11
Katrina, Rita, Wilma
4 Hurricanes
Financial Crisis*, High
CATs
(Percent)
Easing of Crisis, Lower
CATs

41
-10%
-5%
0%
5%
10%
15%
20%
25%
71 73 75 77 79 81 83 85 87 89 91 93 95 97 99 01 03 05 07 09:Q3
Strength of Recent HardMarkets by NWP Growth
(Percent)1975-78 1984-87 2000-03
Shaded areas denote “hard market” periodsSources: A.M. Best (historical and forecast), ISO, Insurance Information Institute
Net Written Premiums Fell 1.0% in 2007 (First Decline Since 1943) by 1.4% in 2008, and 4.5%
through 2009:Q3, the First 3-Year Decline Since 1930-33 During the Great Depression

Property/Casualty Insurance Industry Investment Gain: 1994–2009:Q31
$35.4
$42.8$47.2
$52.3
$44.4
$36.0
$45.3$48.9
$59.4$55.7
$64.0
$31.4$26.2
$58.0
$51.9$56.9
$0
$10
$20
$30
$40
$50
$60
$70
94 95 96 97 98 99 00 01 02 03 04 05* 06 07 08 09:Q3
Investment Gains Fell by 51% In 2008 Due to Lower Yields,Poor Equity Market Conditions. Through Three Quarters in 2009,
Write-downs Were Offset by Unrealized Capital Gains
1 Investment gains consist primarily of interest, stock dividends and realized capital gains and losses.* 2005 figure includes special one-time dividend of $3.2B.Sources: ISO; Insurance Information Institute.
($ Billions)
42

Financial Strength & Ratings
43
Industry Remained Strong in 2009 Despite Crisis
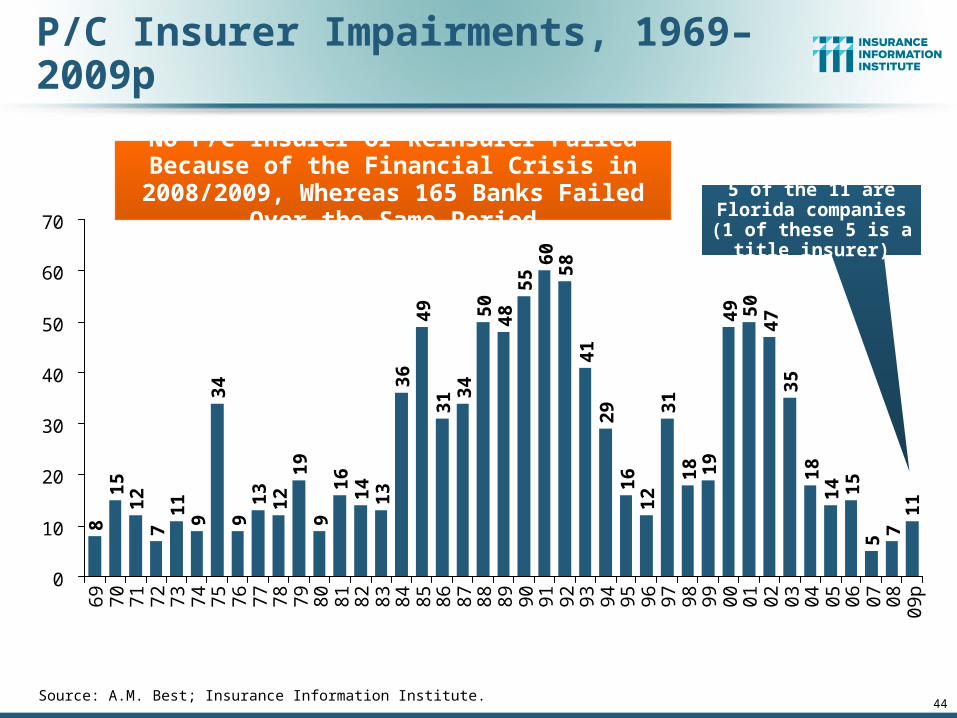
P/C Insurer Impairments, 1969–2009p8
15
12
71
19
34
91
31
21
99
16
14
13
36
49
31 3
45
04
85
56
05
84
12
91
61
23
11
8 19
49 50
47
35
18
14 15
71
1
5
0
10
20
30
40
50
60
70
69
70
71
72
73
74
75
76
77
78
79
80
81
82
83
84
85
86
87
88
89
90
91
92
93
94
95
96
97
98
99
00
01
02
03
04
05
06
07
08
09
p
Source: A.M. Best; Insurance Information Institute.
No P/C Insurer or Reinsurer Failed Because of the Financial Crisis in 2008/2009, Whereas 165
Banks Failed Over the Same Period 5 of the 11 are Florida companies (1 of these
5 is a title insurer)
44
45
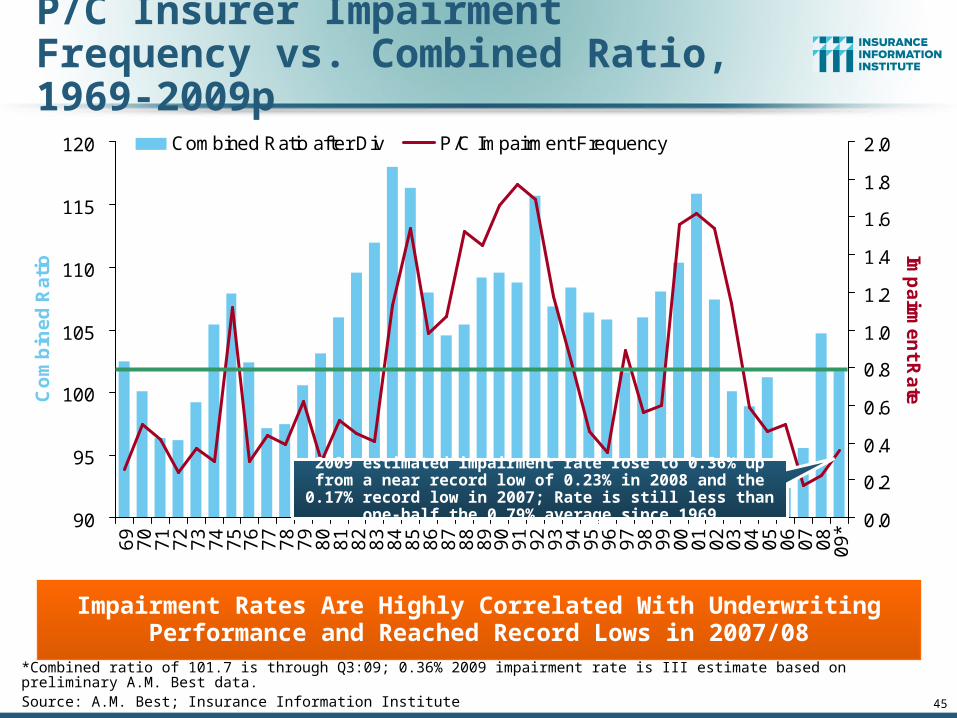
P/C Insurer Impairment Frequency vs. Combined Ratio, 1969-2009p
90
95
100
105
110
115
1206
97
07
17
27
37
47
57
67
77
87
98
08
18
28
38
48
58
68
78
88
99
09
19
29
39
49
59
69
79
89
90
00
10
20
30
40
50
60
70
80
9*
Co
mb
ine
d R
ati
o
0.0
0.2
0.4
0.6
0.8
1.0
1.2
1.4
1.6
1.8
2.0
Imp
airm
en
t Ra
te
Combined Ratio after Div P/C Impairment Frequency
*Combined ratio of 101.7 is through Q3:09; 0.36% 2009 impairment rate is III estimate based on preliminary A.M. Best data.Source: A.M. Best; Insurance Information Institute
2009 estimated impairment rate rose to 0.36% up from a near record low of 0.23% in 2008 and the 0.17% record low in 2007; Rate is still less than one-half the 0.79% average since 1969
Impairment Rates Are Highly Correlated With Underwriting Performance and Reached Record Lows in 2007/08

46
Summary of A.M. Best’s P/C Insurer Ratings Actions in 2009
3.8%
2.9%3.2%
2.4%
11.9%75.7%
.Source: A.M. Best.
P/C Insurance is by Design a Resilient Business. The Dual Threat of Financial Disasters and Catastrophic Losses
Are Anticipated in the Industry’s Risk Management Strategy
Despite financial market turmoil and a soft market in 2009, 76% of ratings actions
by A.M. Best were affirmations;
just 2.9% were downgrades and 3.2% were upgrades
Affirm – 1,375
Downgraded – 53
Upgraded – 59Initial – 44
Under Review – 69
Other – 216

47
Reasons for US P/C Insurer Impairments, 1969–2008
3.7%4.2%
9.1%
7.0%
7.9%
7.6%
8.1% 14.3%
38.1%
Source: A.M. Best: 1969-2008 Impairment Review, Special Report, Apr. 6, 2008
Deficient Loss Reserves and Inadequate Pricing Are the Leading Cause of Insurer Impairments, Underscoring the Importance of Discipline.
Investment Catastrophe Losses Play a Much Smaller Role
Deficient Loss Reserves/In-adequate Pricing
Reinsurance Failure
Rapid GrowthAlleged Fraud
Catastrophe Losses
Affiliate Impairment
Investment Problems
Misc.
Sig. Change in Business

Capital/PolicyholderSurplus (US)
48
Improving Financial Markets, Lower CAT Losses are Restoring Capacity

49
Policyholder Surplus, 2006:Q4–2009:Q3
Source: ISO, AM Best.
($ Billions)
$487.1$496.6
$512.8$521.8
$478.5
$455.6
$437.1
$463.0
$490.8$505.0
$515.6$517.9
$380
$400
$420
$440
$460
$480
$500
$520
$540
06:Q4 07:Q1 07:Q2 07:Q3 07:Q4 08:Q1 08:Q2 08:Q3 08:Q4 09:Q1 09:Q2 09:Q3
Capacity Peaked at $521.8 as of 9/30/07
Declines Since 2007:Q3 Peak
08:Q2: -$16.6B (-3.2%) 08:Q3: -$43.3B (-8.3%) 08:Q4: -$66.2B (-12.9%)
09:Q1: -$84.7B (-16.2%) 09:Q2: -$58.8B (-11.2%)09:Q3: -$31.8B (-5.9%)
Capacity as of 9/30/09 was just 5.9% below the 2007 peak and will likely
fully recover in 2010
50
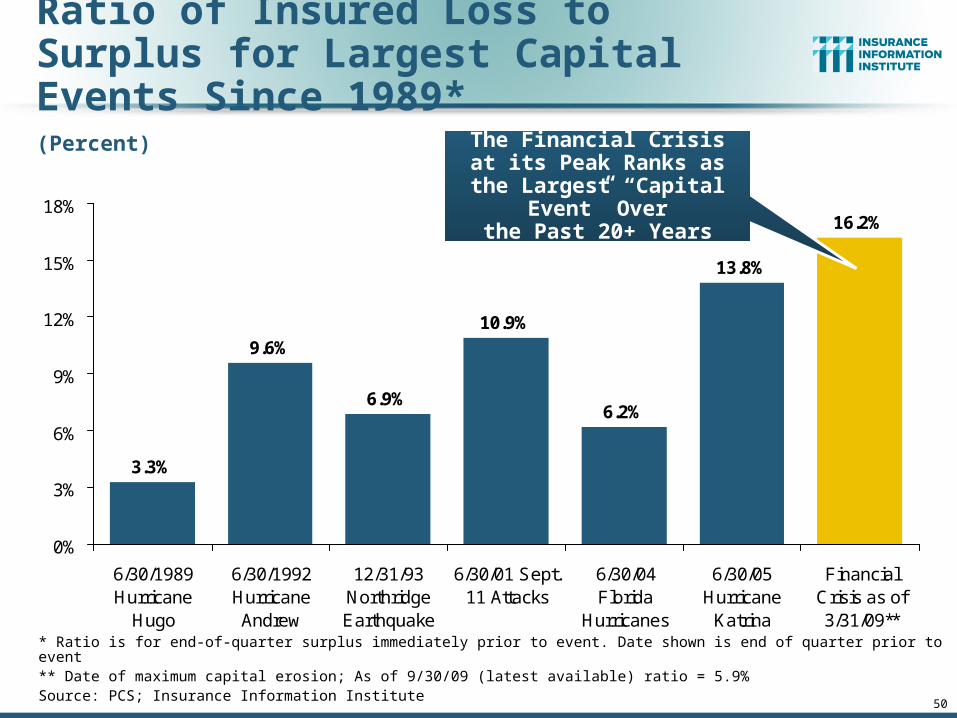
Ratio of Insured Loss to Surplus for Largest Capital Events Since 1989*
* Ratio is for end-of-quarter surplus immediately prior to event. Date shown is end of quarter prior to event** Date of maximum capital erosion; As of 9/30/09 (latest available) ratio = 5.9%Source: PCS; Insurance Information Institute
3.3%
9.6%
6.9%
10.9%
6.2%
13.8%
16.2%
0%
3%
6%
9%
12%
15%
18%
6/30/1989Hurricane
Hugo
6/30/1992HurricaneAndrew
12/31/93NorthridgeEarthquake
6/30/01 Sept.11 Attacks
6/30/04Florida
Hurricanes
6/30/05Hurricane
Katrina
FinancialCrisis as of3/31/09**
The Financial Crisis at its Peak Ranks as the Largest
“Capital Event” Overthe Past 20+ Years
(Percent)

51
Catastrophe Bonds: Risk Capital Issuance
Source: Buy Carpenter; Insurance Information Institute.
$633 $846 $985 $1,139 $1,143
$1,991
$4,693
$6,996
$2,686
$3,392
$1,730$1,220
$967
$0
$1,000
$2,000
$3,000
$4,000
$5,000
$6,000
$7,000
$8,000
97 98 99 00 01 02 03 04 05 06 07 08* 09*
Catastrophe bond risk capital issuance plunged by 62% when credit market turmoil spread in 2008 but was up 26% in 2009 as markets improved

Terrorism
52
Terrorism Is an Issue that Will Be More in the News in 2010 and in the Minds of Insurance Buyers,
Policymakers, Regulators

53
Terrorism: Insurance Concerns Resurface
Reasons Why Concerns Are Mounting in 2010
Perception of U.S. vulnerability is rising Thwarted Christmas Day attack by “underwear bomber” Increased anti-terror efforts, including full-body scans Effort by government to appear more vigilant, prepared Trials of Guantanamo 9/11 suspects in Manhattan Court
NYC says it will need $200+ million each year for security Rise of groups such al Qaeda in the Arabian Peninsula U.S. military surge in Afghanistan operations Most buyers, producers have not thought about coverage
issues recently Many may have questions about nature, adequacy of coverage

www.iii.org
Thank you for your timeand your attention!
Insurance Information Institute Online:
54

© 2010 Munich Re 55Source: Geo Risks Research, NatCatSERVICE As at January 2010
To ask a question, please dial 1 4 on your phone.
An operator will facilitate your participation.
Question and Answer Process

© 2010 Munich Re 56Source: Geo Risks Research, NatCatSERVICE As at January 2010
More Information
Press InquiriesTerese RosenthalPhone: 609-243-4339E-mail: [email protected]

THANK YOU FOR PARTICIPATING IN TODAY’S WEBINAR.

2009 NATURAL CATASTROPHE YEAR IN REVIEW WEBINAR
© 2010Munich Reinsurance America, Inc. All rights reserved. The Munich Re America name is a mark owned by Munich Reinsurance America, Inc. The Munich Re name and mark is owned by The Munich Re name and mark is owned by Münchener Rückversicherungs
The material in this presentation is provided for your information only, and is not permitted to be further distributed without the express written permission of Munich Reinsurance America, Inc or Munich Re. This material is not intended to be legal, underwriting, financial, or any other type of professional advice. Examples given are for illustrative purposes only. Each reader should consult an attorney and other appropriate advisors to determine the applicability of any particular contract language to the reader's specific circumstances.