Embed Size (px)
Citation preview
| 1 |

| 2 |
Fedele ConfalonieriChairman

| 3 |
4,199.5
983.6
459.0
0.38
94%
MEDIASET GROUP | P&L Consolidated Results
Net Consolidated Revenues
Operating Profit
Net Profit
Dividend per Share (Euro)
Payout
3,882.9
601.5
272.4
0.22
92%
2008 2009(Euro ml.)

| 4 |
3,218.8
596.8
378.1
MEDIASET ITALIAN BUSINESS | P&L Results
Net Consolidated Revenues
Operating Profit
Net Profit
3,228.8
478.7
269.0
2008 2009(Euro ml.)

| 5 |
981.9
386.9
211.3
TELECINCO | P&L Results
Net Consolidated Revenues
Operating Profit
Net Profit
656.3
122.8
48.4
2008 2009(Euro ml.)
| 6 |
Pier Silvio BerlusconiExecutive Vice Chairman

| 7 |
CHALLENGES FOR BROADCASTERS
1. Few generalist channels
2. Revenues mainly from advertising
3. Broadcasting (no content)
4. Linear offer only
5. Analogue transmission only
1. Audience fragmentation
2. Advertising market maturity
3. Dependence on content providers
4. Technology enabling non-linear offers
5. Digital platforms multiplication
Traditional FTA Challenges

| 8 |
1. Audience fragmentation
2. Advertising market maturity
3. Dependence on content providers
4. Technology enabling non-linear offers
5. Digital platforms development
Challenges
1. Generalist + thematic channels
2. Advertising + Pay TV revenues
3. Broadcasting + vertical integration in content
4. Linear + non linear offer (“On Demand”)
5. Presence on all digital platforms + analogue
MEDIASET STRATEGIC REACTION
Mediaset way to broadcasting

| 9 |
GENERALIST FTA TV

| 10 |
Source: Auditel, 24h, (% audience share)
*2006: Spring 29/1-3/6 excluding 26/2-4/3+Autumn 3/9-2/12 2007: Spring 14/1-2/6 excluding 25/2-3/3+Autumn 9/9-1/12 2008: Spring 13/1-31/5 excluding 24/2-1/3+Autumn 7/9-29/11 2009: Spring 11/1-30/5 excluding 15/2-21/2+Autumn 6/9-5/12 2010 Spring 10/1-13/3 excluding 14-20/2
C5+I1+R4 R1+R2+R3
43.1 43.5 42.9 42.1
39.6
37.636.6
34.9
2006 2007 2008 2009
AUDIENCE SHARE | 2006-2009 Evolution15-64 years, audience guarantee*
| 11 |
MULTICHANNEL FTA TV
| 12 |
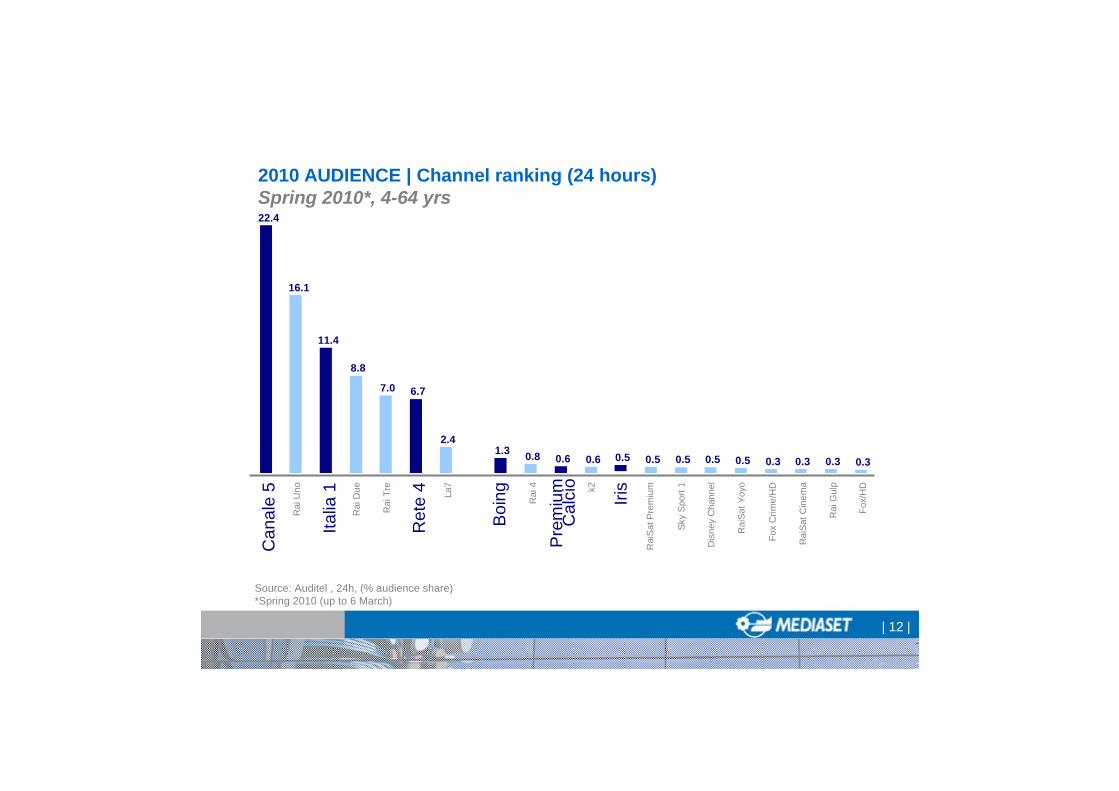
2010 AUDIENCE | Channel ranking (24 hours)Spring 2010*, 4-64 yrs
k2
22.4
16.1
11.4
8.8
7.0 6.7
2.41.3 0.8 0.6 0.6 0.5 0.5 0.5 0.5 0.5 0.3 0.3 0.3 0.3
Can
ale
5R
ai U
no
Italia
1R
ai D
ue
Rai
Tre
Ret
e 4 La7
Boi
ng Rai
4
Iris
Sky
Spo
rt 1
Dis
ney
Cha
nnel
Rai
SatY
oyo
Rai
Sat
Pre
miu
m
Fox
Crim
e/H
D
Rai
Sat
Cin
ema
Rai
Gul
p
Fox/
HD
Source: Auditel , 24h, (% audience share)*Spring 2010 (up to 6 March)
Pre
miu
mC
alci
o

| 13 |
+10.5%
+1.8%
-1.1%
-0.7%
13.1%
83.4%
8.4%
8.2%
Multichannel (RAI+MS)
Total (RAI+MS)
Satellite
Other
-8.7%Generalist (RAI+MS) 70.3%
Spring 2010* Δ vs. 2009*
2010 AUDIENCE | Switch-off impact in “All Digital” areas
“All Digital” Areas: Sardegna, Piemonte, Lazio, Campania, Trentino Alto Adige, Valle D’Aosta*Spring 2010 (up to 6 March)
Spring 2010*, Individuals

| 14 |
1.4%
2.2%
InflationMEDIASET
2001-2009 CAGR
-1.8%
0%
Initial Guidance
MEDIASET
2009
+1%
MEDIASET
2010
Guidance
FTA TV Costs = Personnel costs+operating costs+TV rights amortisations+other D&A+intra-company itemsSource: Istat
FTA TV COSTS | 2001-2009 evolution and 2010 budget

| 15 |
PAY TV
| 16 |
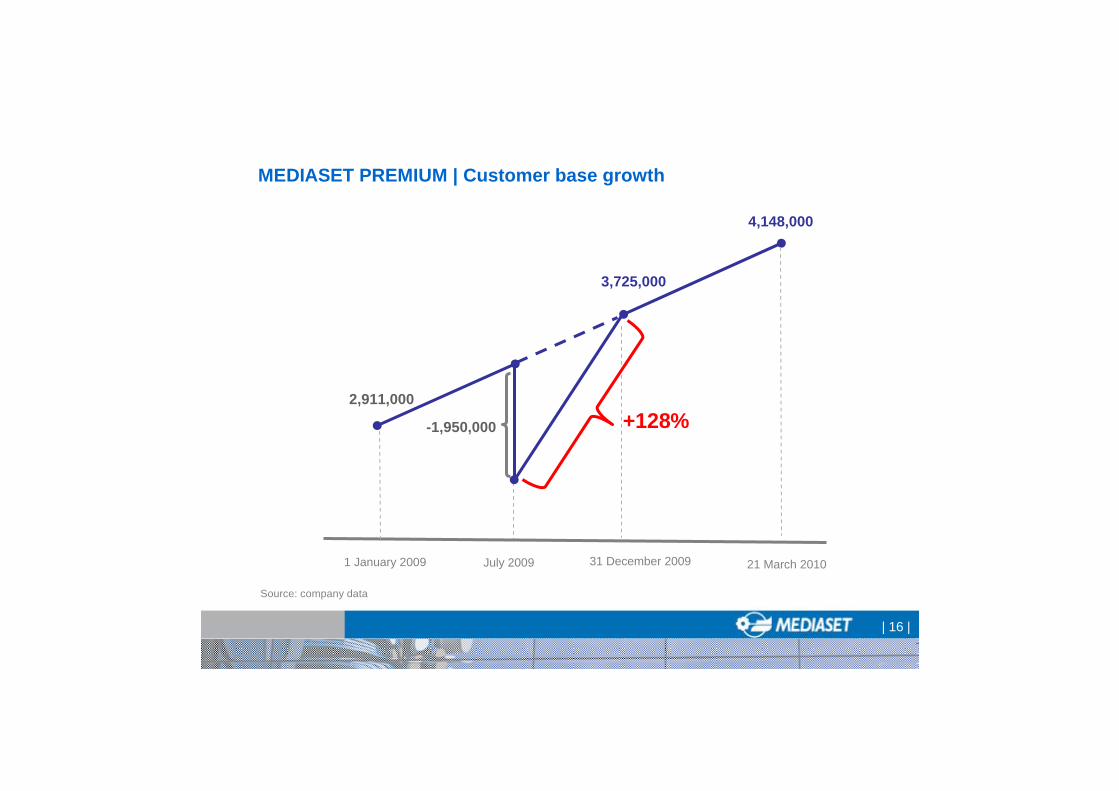
1 January 2009
MEDIASET PREMIUM | Customer base growth
3,725,000
Source: company data
31 December 2009 21 March 2010
4,148,000
July 2009
-1,950,000 +128%2,911,000

| 17 |
2007
MEDIASET PREMIUM | Commercial offer and revenues developmentMio Euro
226 ml €
2008 2009
404 ml €
561 ml €
ARPU 60€ ARPU 80€ ARPU 94€
+38.9%vs. 2008
Pay TV revenues+56.5% vs. 2008

| 18 |
Total Revenues: 3,228.8 ml Euro
Advertising Revenues
97%
2004 - 2009 | Mediaset Italian business revenues evolution
2004
Other Revenues3%
2009
Advertising Revenues
70.5%
OtherRevenues
29.5%
* Source: AC Nielsen
200832.9%
200934.7%
951.4 ml Euro
Publitalia Adv. market share

| 19 |
SPAIN

| 20 |
Telecinco in Spain faced a difficult market situation, characterized by several factors:
• Launch of 2 new generalist FTA channels • Unusual inventory exploitation for TVE• Severe macroeconomic downturn
SPAIN | Market environment called for reaction
We decided to react promptly in order to achieve the best deal available
1. Best fit between Telecinco and Cuatro (editorial + advertising)2. Opportunity to replicate the Italian strategy (free + pay)

| 21 |
Reinforce the leadership in the Spanish FTA market
45.1% of TV advertising market
28.1% audience in the commercial target (24 hours)
Development of significant revenues synergies
Achieve relevant cost synergies
Reinforce the multichannel strategy on DTT
Benefit from the coming advertising market upturn, in a leading market position
The right deal at the right time
SPAIN | Strategic rationale

| 22 |
Pay TV
Non linear TV
NUOVICANALI
Con
tenu
ti
Multichannel
Generalist FTA
Multichannel
Pay TV(*) minority
stake of 22%
Cuatro.com
(*)
NUOVICANALI
Non linear TV
Content
TV Generalista
MEDIASET WAY TO BROADCASTING

| 23 |
Giuliano AdreaniCEO
| 24 |
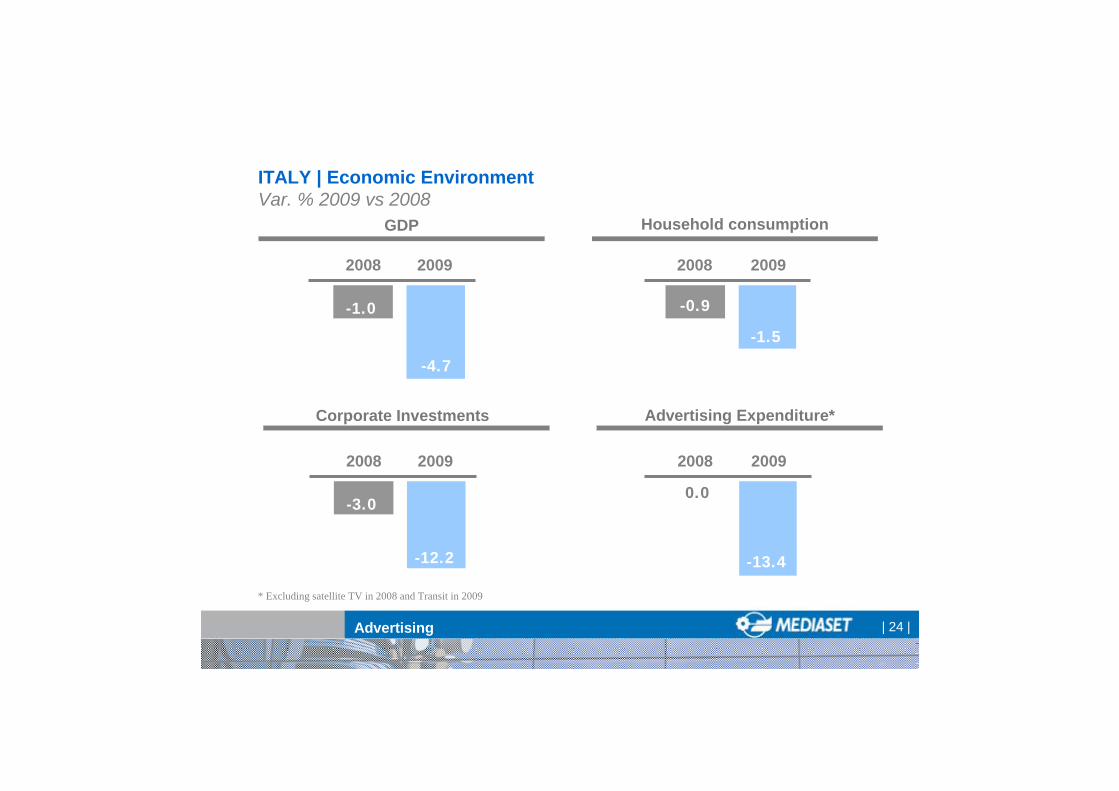
-4.7
2008
-1.5
-0.9
2009
GDP Household consumption
Corporate Investments Advertising Expenditure*
2008 2009
-1.0
ITALY | Economic EnvironmentVar. % 2009 vs 2008
-12.2
2008
-13.4
2009 2008 2009
-3.00.0
* Excluding satellite TV in 2008 and Transit in 2009
Advertising

| 25 | Advertising
-13.4% Italy
UK
France -13.3%
-8.9%
Spain-20.9%
EUROPE | Advertising market trendVar % 2009 vs. 2008
| 26 |
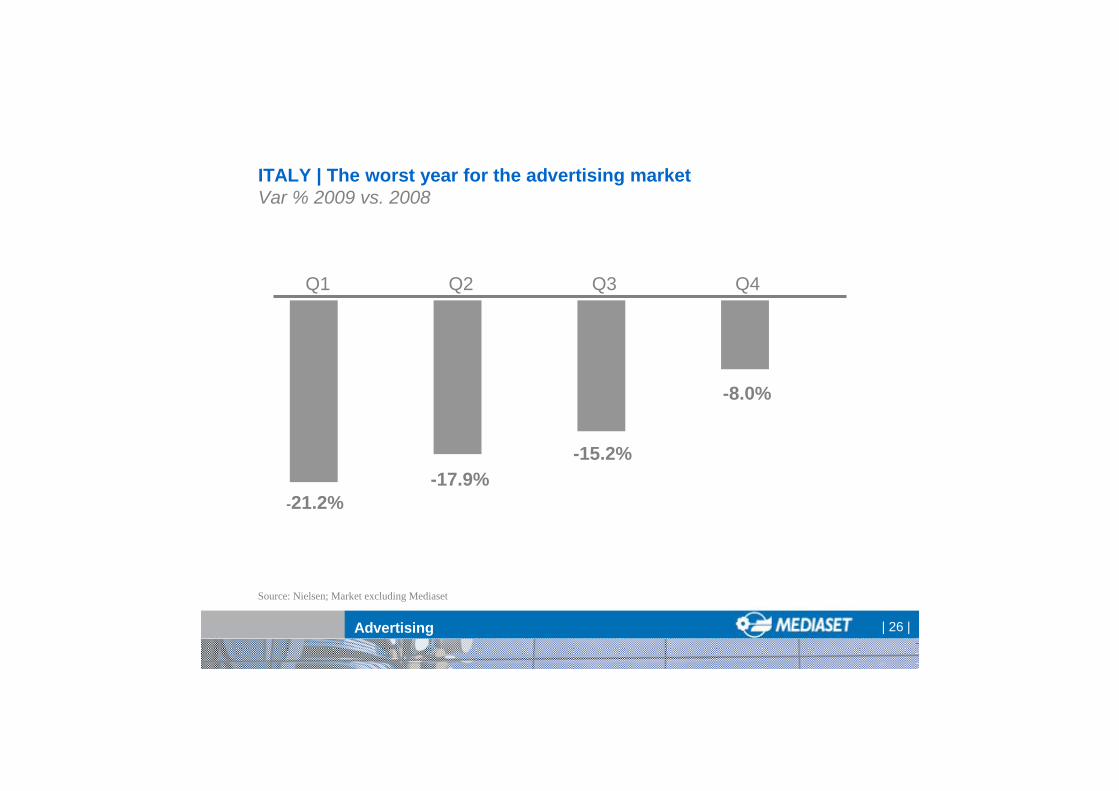
Source: Nielsen; Market excluding Mediaset
Q1 Q2 Q3 Q4
Advertising
ITALY | The worst year for the advertising marketVar % 2009 vs. 2008
-21.2%-17.9%
-15.2%
-8.0%
| 27 | Advertising
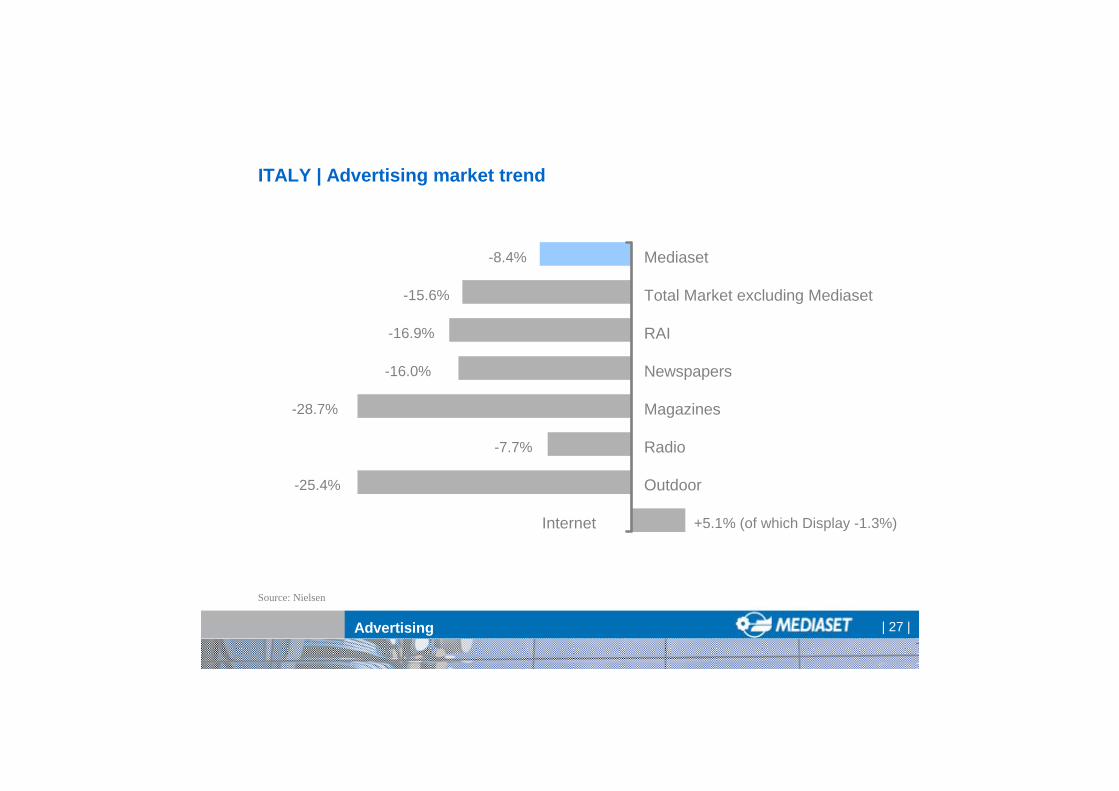
-8.4% Mediaset
RAI
Total Market excluding Mediaset -15.6%
-16.0% Newspapers
-28.7% Magazines
+5.1% (of which Display -1.3%)
ITALY | Advertising market trend
Radio
Outdoor
Internet
-16.9%
-7.7%
-25.4%
Source: Nielsen
| 28 | Advertising
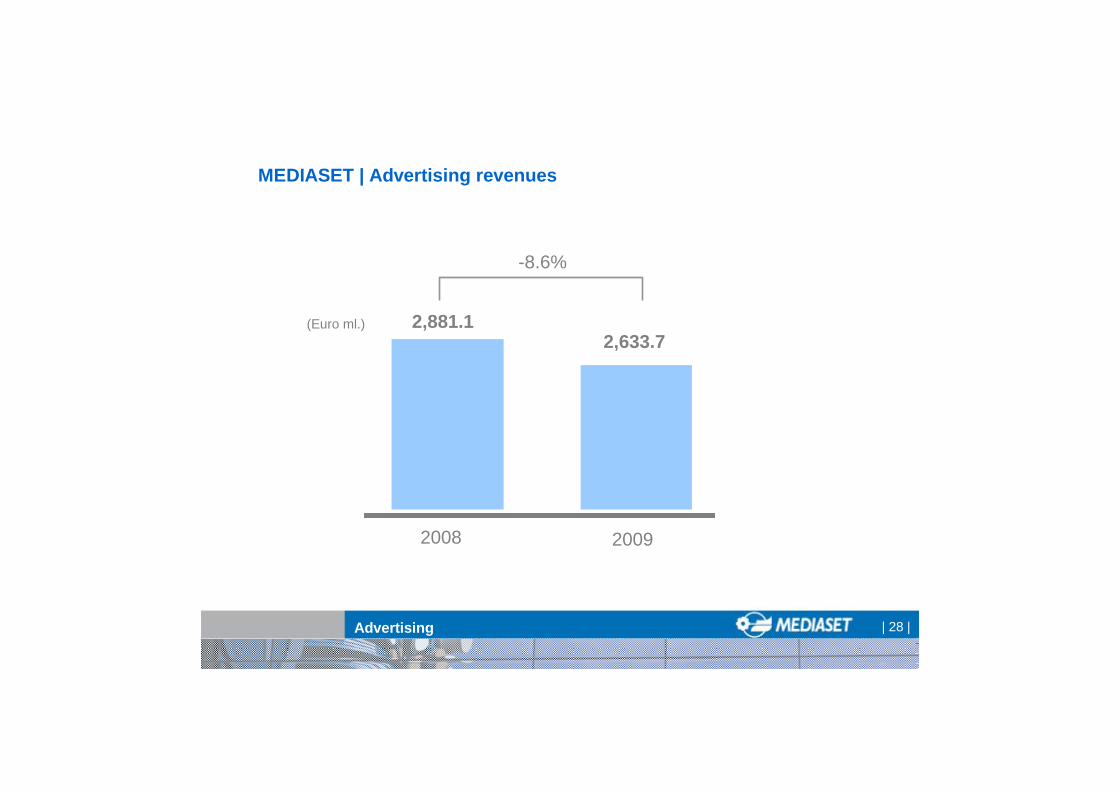
MEDIASET | Advertising revenues
(Euro ml.)
2008 2009
2,881.12,633.7
-8.6%

| 29 | Advertising
(Euro ml.)
2008 2009
2,937.5
2,704.9
-8.0% (including Digitalia)
MEDIASET | Advertising revenues

| 30 | Advertising
Q1 Q2 Q3 Q4
-21.2%
-12.8%
-17.9%
-11.1%
-15.2%
-6.2%-8.0%
-2.7%
Market excluding Mediaset Mediaset
ITALY | Publitalia outperforming the marketVar % 2009 vs. 2008
Source: Nielsen (excluding Direct Mail and Transit)
| 31 | Advertising
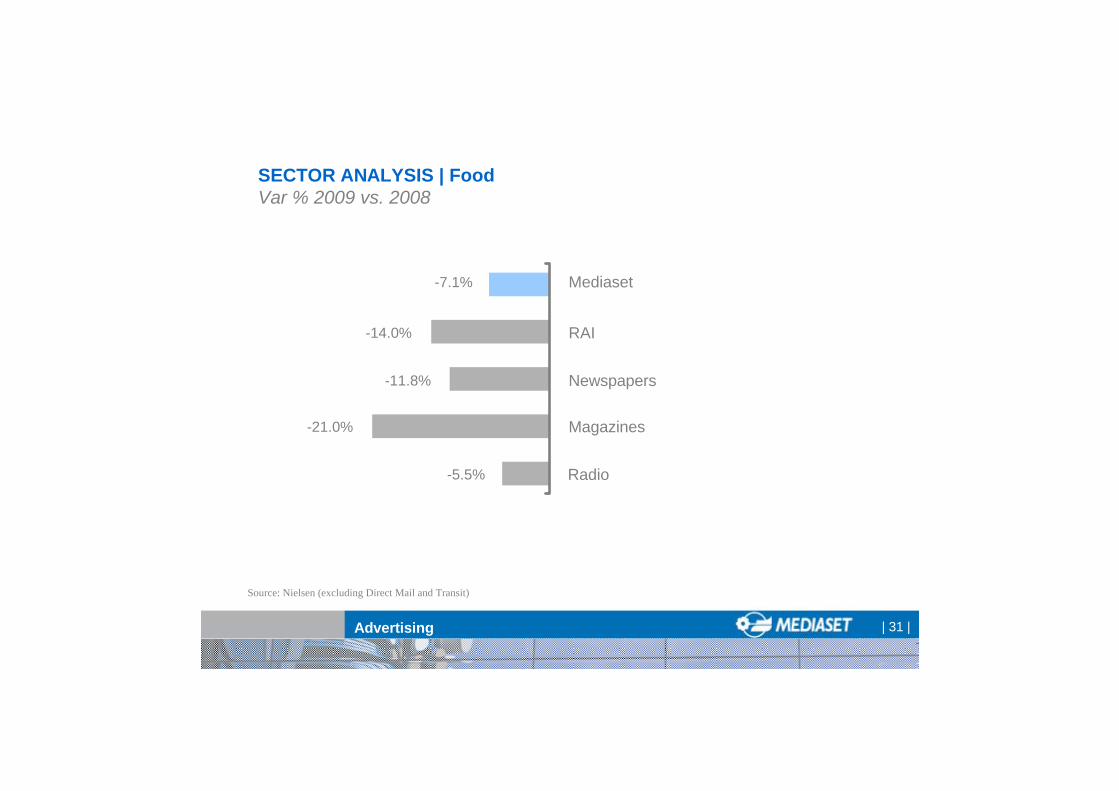
SECTOR ANALYSIS | FoodVar % 2009 vs. 2008
Source: Nielsen (excluding Direct Mail and Transit)
-7.1% Mediaset
Newspapers
RAI -14.0%
-11.8%
Magazines-21.0%
Radio-5.5%
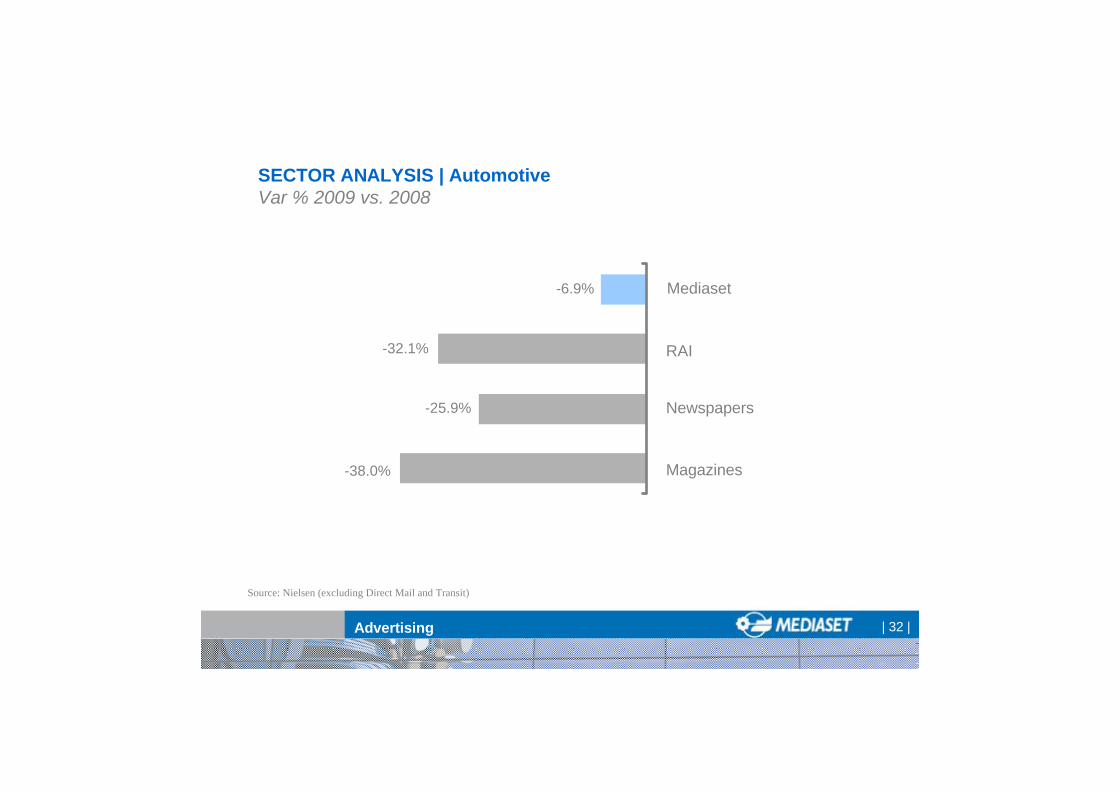
| 32 | Advertising
Mediaset
Newspapers
RAI -32.1%
-25.9%
Magazines-38.0%
-6.9%
SECTOR ANALYSIS | AutomotiveVar % 2009 vs. 2008
Source: Nielsen (excluding Direct Mail and Transit)
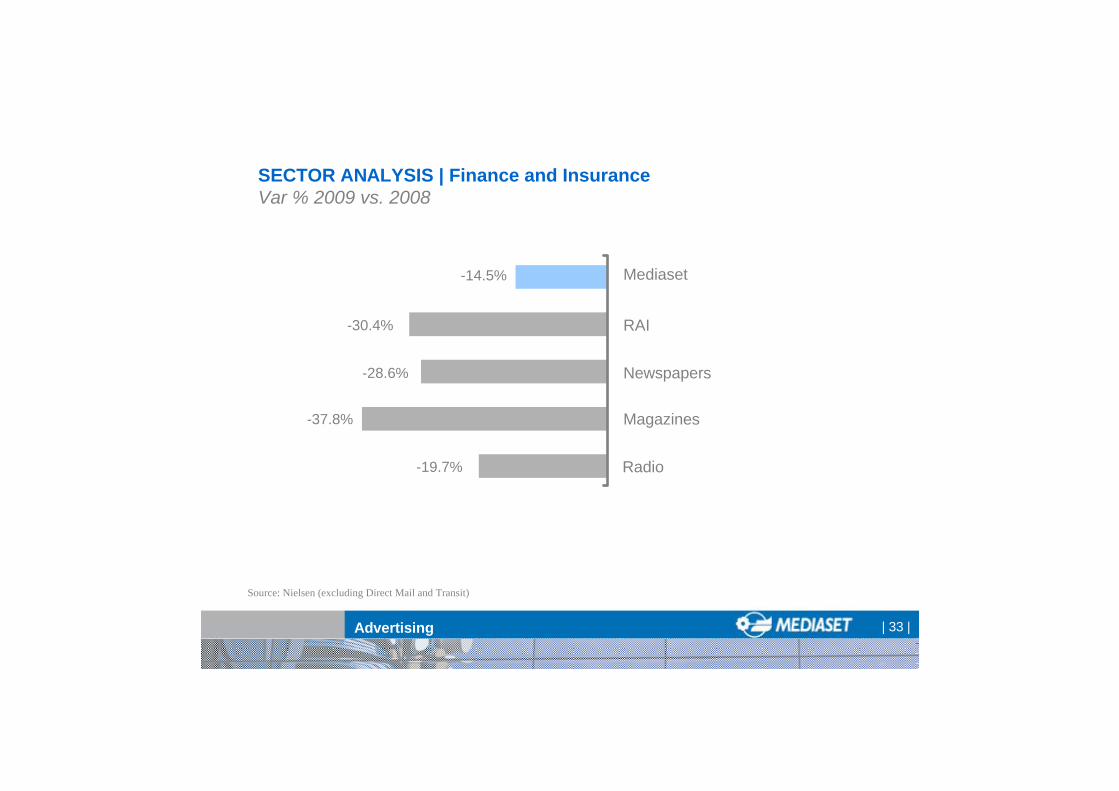
| 33 | Advertising
-14.5% Mediaset
Newspapers
RAI -30.4%
-28.6%
Magazines-37.8%
Radio-19.7%
SECTOR ANALYSIS | Finance and InsuranceVar % 2009 vs. 2008
Source: Nielsen (excluding Direct Mail and Transit)

| 34 | Advertising
+2.3%Mediaset
Newspapers
RAI -14.0%
-21.4%
Magazines-46.1%
-27.4%
Radio
Internet
+1.6%
SECTOR ANALYSIS | TelecomVar % 2009 vs. 2008
Source: Nielsen (excluding Direct Mail and Transit)

| 35 |
Why Mediaset outperformed the Market?
- Focus on core business and top clients
- Acquisition of new clients even in a difficult year
- Ability to maintain the same level of prices

| 36 | Advertising
Top 10 clients
Top 20 clients
Clients >101
2009 vs. 2008
-1.4%
-3.9%
-1.4%
MEDIASET | Focus on top clients*
(*) Holding clients – 2008 client ranking

| 37 | Advertising
1,018
254
Active clients
New clients
79.5 Euro ml.Revenues from new clients
MEDIASET | New business activity
| 38 |
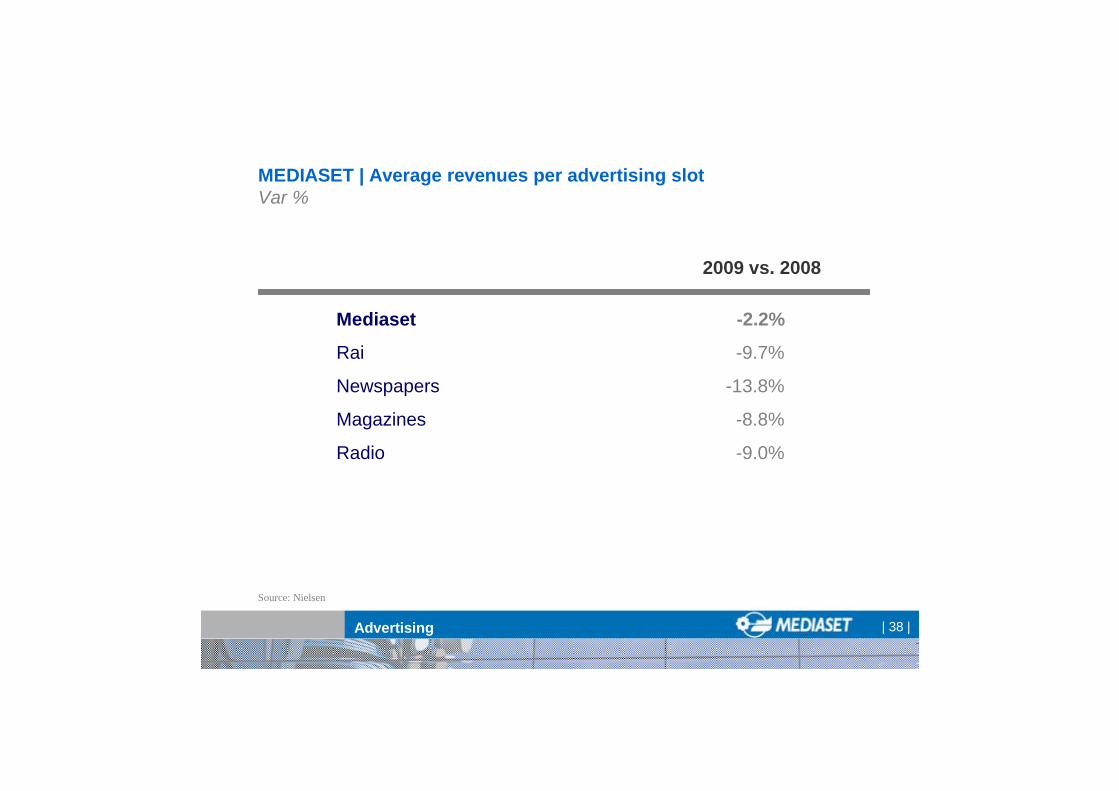
Mediaset
Rai
Newspapers
Magazines
Radio
Advertising
-2.2%
-9.7%
-13.8%
-8.8%
-9.0%
Source: Nielsen
2009 vs. 2008
MEDIASET | Average revenues per advertising slotVar %

| 39 |
First hints on 2010
| 40 |
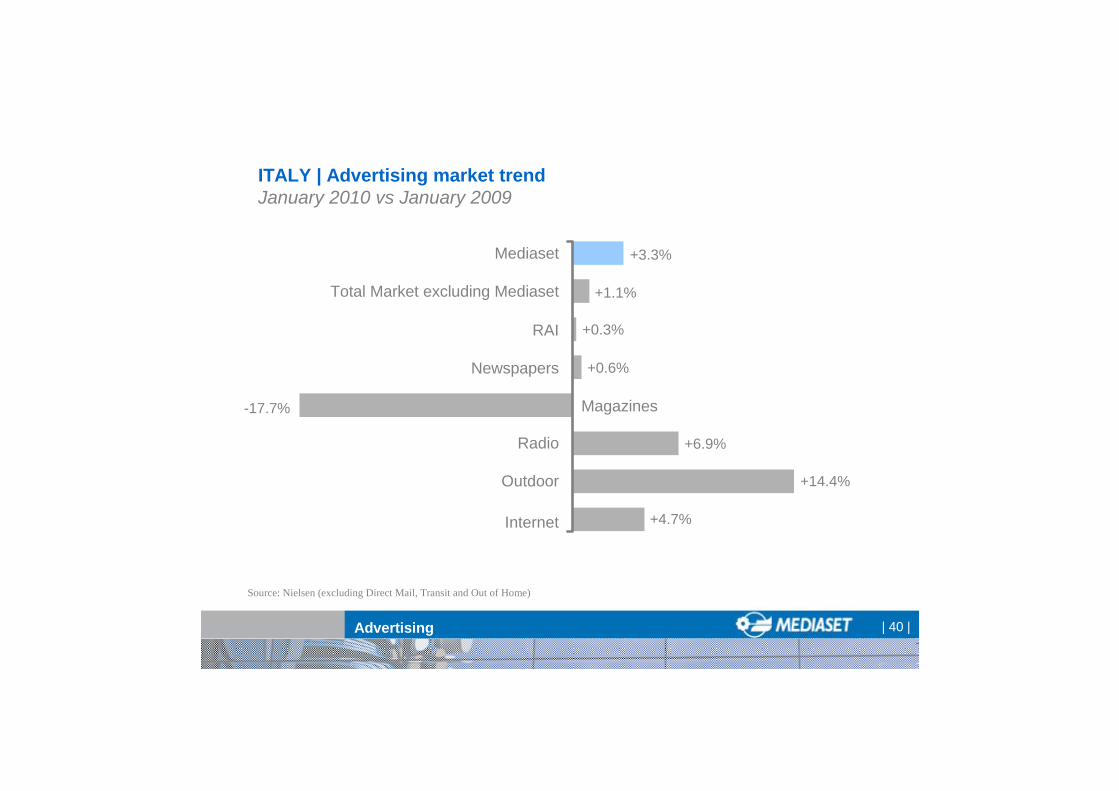
ITALY | Advertising market trendJanuary 2010 vs January 2009
Advertising
+3.3%Mediaset
RAI
Total Market excluding Mediaset +1.1%
+0.6%Newspapers
-17.7% Magazines
+4.7%
Radio
Outdoor
Internet
+0.3%
+6.9%
+14.4%
Source: Nielsen (excluding Direct Mail, Transit and Out of Home)
| 41 |
Marco GiordaniCFO
| 42 |
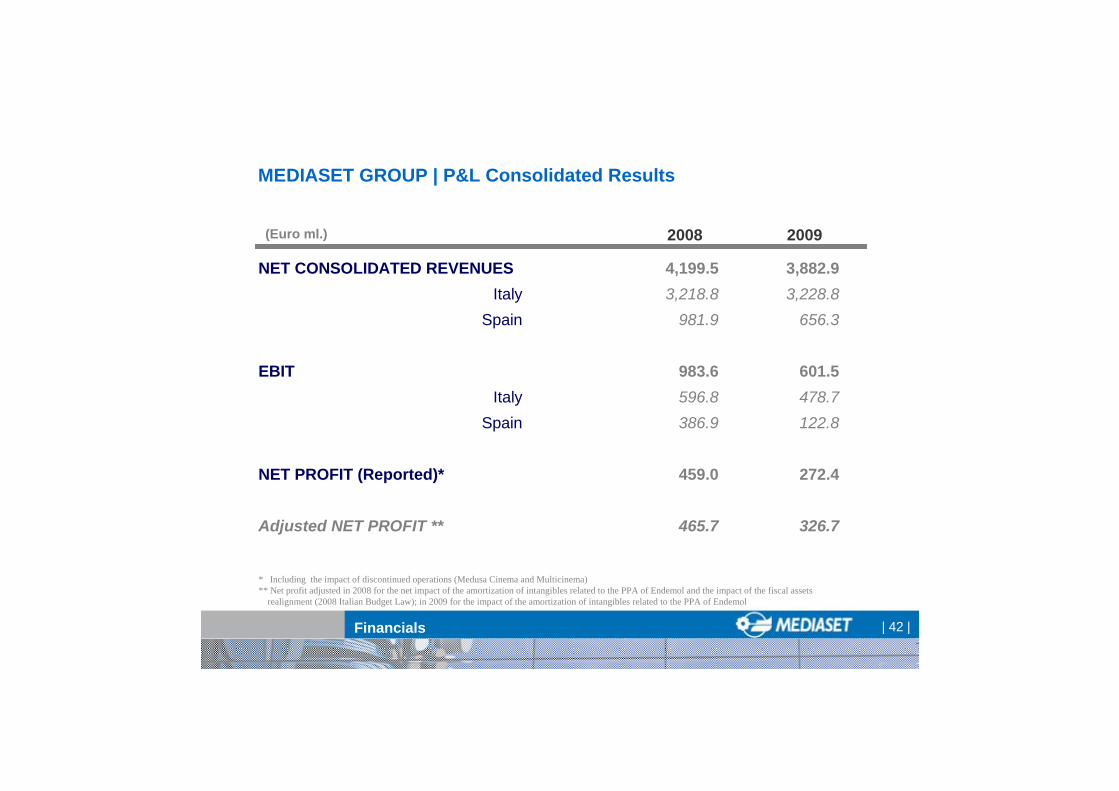
MEDIASET GROUP | P&L Consolidated Results
NET CONSOLIDATED REVENUESItaly
Spain
EBITItaly
Spain
NET PROFIT (Reported)*
Adjusted NET PROFIT **
2008 2009(Euro ml.)
Financials
* Including the impact of discontinued operations (Medusa Cinema and Multicinema)** Net profit adjusted in 2008 for the net impact of the amortization of intangibles related to the PPA of Endemol and the impact of the fiscal assets
realignment (2008 Italian Budget Law); in 2009 for the impact of the amortization of intangibles related to the PPA of Endemol
4,199.53,218.8
981.9
983.6596.8386.9
459.0
465.7
3,882.93,228.8
656.3
601.5478.7122.8
272.4
326.7

| 43 |
2009 RESULTS | Italian Business

| 44 |
3,218.8(418.7)
(1,234.9)
1,565.2(803.7)
(164.7)
596.8(77.0)
(33.3)
486.6(108.9)
22.4%
378.1
3,228.8(426.7)
(1,311.9)
1,490.2(865.3)
(146.2)
478.7(32.0)
(1.2)
445.5(166.7)
37.4%
269.0
Net Consolidated RevenuesPersonnel Costs
Other Operating Costs
EBITDARights Amortisation
Other Amortisation & Depreciation
Operating ProfitFinancial Income (Losses)
Associates
Pre-Tax ProfitTaxes
Tax rate
NET PROFIT
2008 2009(Euro ml.)
Financials
MEDIASET ITALIAN BUSINESS | P&L Results
+0.3%
(4.8%)
(19.8%)
(8.4%)
(28.9%)
% Var
| 45 |
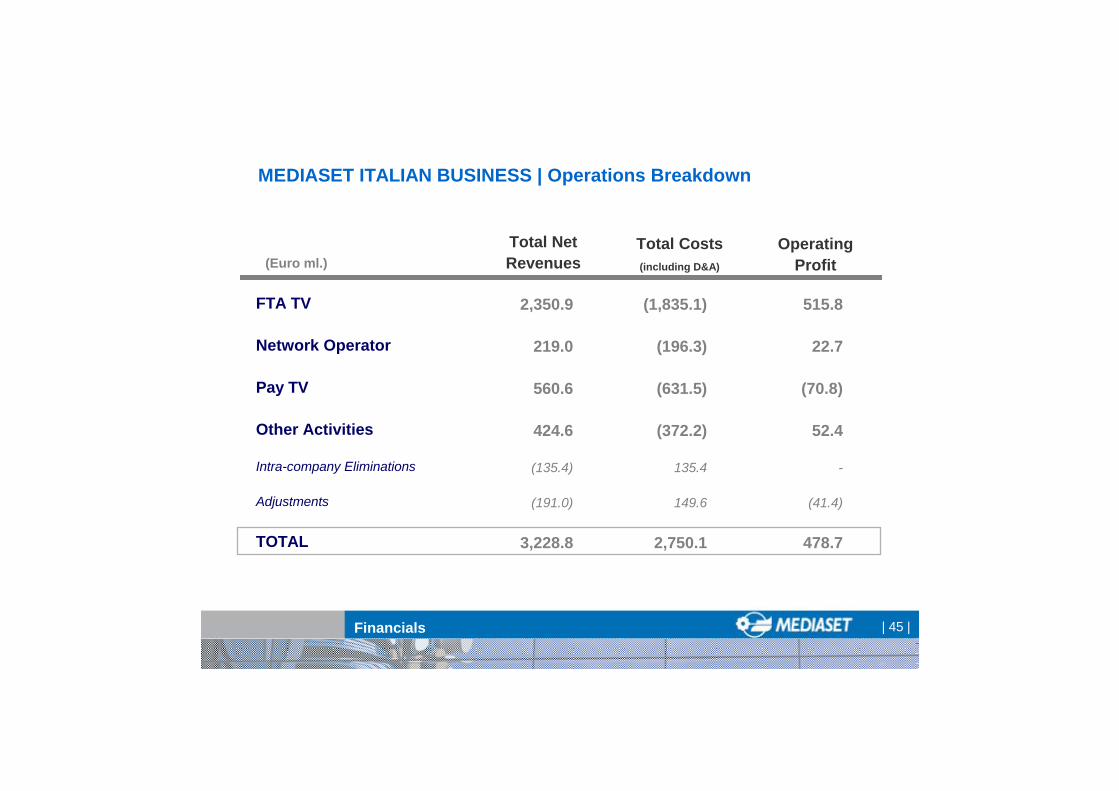
FTA TV
Network Operator
Pay TV
Other Activities
Intra-company Eliminations
Adjustments
TOTAL
Total NetRevenues
2,350.9
219.0
560.6
424.6
(135.4)
(191.0)
3,228.8
OperatingProfit
515.8
22.7
(70.8)
52.4
-
(41.4)
478.7
(Euro ml.)
Financials
Total Costs(including D&A)
(1,835.1)
(196.3)
(631.5)
(372.2)
135.4
149.6
2,750.1
MEDIASET ITALIAN BUSINESS | Operations Breakdown
| 46 |
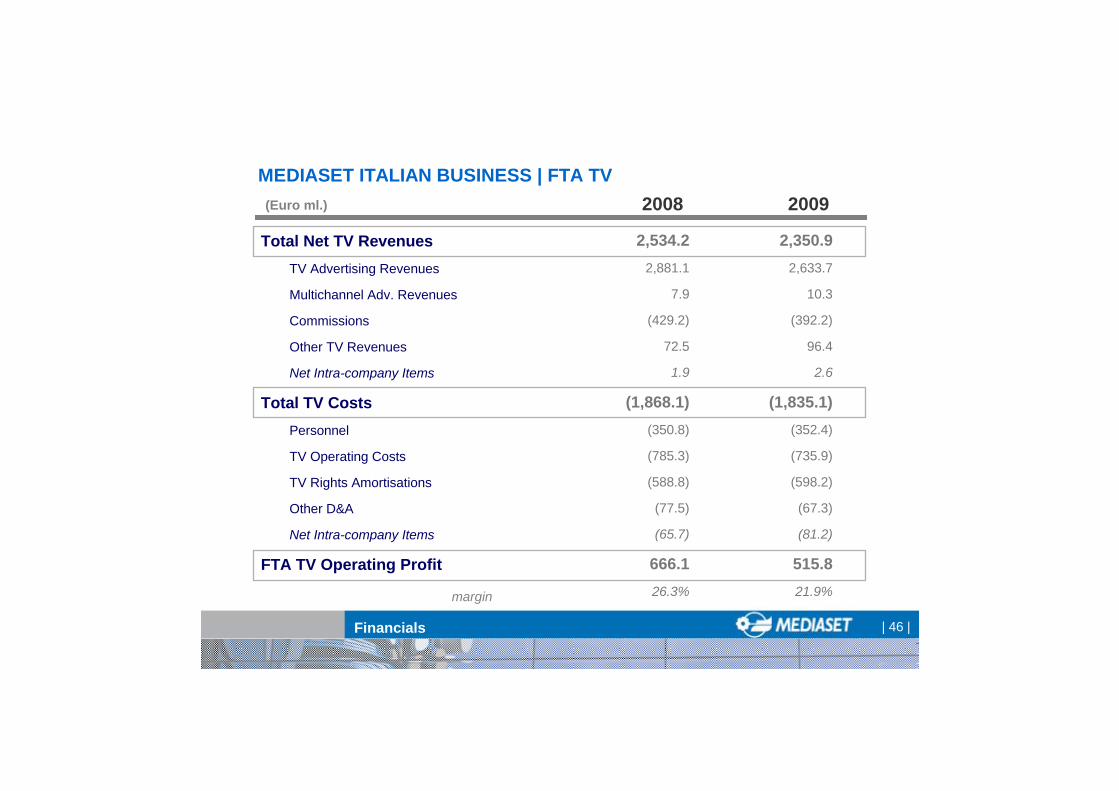
2,534.22,881.1
7.9
(429.2)
72.5
1.9
(1,868.1)(350.8)
(785.3)
(588.8)
(77.5)
(65.7)
666.126.3%
(Euro ml.)
Total Net TV RevenuesTV Advertising Revenues
Multichannel Adv. Revenues
Commissions
Other TV Revenues
Net Intra-company Items
Total TV CostsPersonnel
TV Operating Costs
TV Rights Amortisations
Other D&A
Net Intra-company Items
FTA TV Operating Profit
margin
20092008
2,350.92,633.7
10.3
(392.2)
96.4
2.6
(1,835.1)(352.4)
(735.9)
(598.2)
(67.3)
(81.2)
515.821.9%
Financials
MEDIASET ITALIAN BUSINESS | FTA TV

| 47 |
190.874.4
5.3
111.1
(180.1)(34.8)
(94.2)
(51.1)
10.85.7%
Total Net Revenues3° Party Revenues
Other Revenues
Net intra-company Items
Total CostsPersonnel
Other Operating Costs
Other Amortisation & Depreciation
Network Operator Operating Profit
margin
20092008(Euro ml.)
219.087.4
6.2
125.4
(196.3)(35.9)
(102.2)
(58.3)
22.710.4%
Financials
MEDIASET ITALIAN BUSINESS | Network Operator

| 48 |
403.7
199.1
13.1
192.9
(1.5)
(464.6)(8.8)
(196.7)
(217.3)
(41.7)
(60.9)
Total Net Pay TV Revenues
Pay TV Revenues
Advertising Revenues
Other Revenues
Commissions
Total Pay TV CostsPersonnel
Other Operating Costs
Rights Amortisations and Other D&A
Net intra-company items
Pay TV Operating Profit
20092008(Euro ml.)
560.6
311.5
29.8
223.5
(4.2)
(631.5)(14.6)
(302.6)
(267.0)
(47.3)
(70.8)
Financials
MEDIASET ITALIAN BUSINESS | Pay TV

| 49 |
371.5106.4
167.8
21.0
35.7
41.6
2.5
(355.6)(24.4)
(199.3)
(96.1)
(27.7)
(8.1)
15.94.3%
Total Net RevenuesMedusa/Taodue 3° Party revenues
Medusa/Taodue intra-company revenues
Multimedia
Mediashopping
Other Non-TV Revenues
Net Intra-company Items
Total CostsPersonnel
Other Operating Cost
Right Amortisations
Other Amortisations & Depreciations
Intra-company Items
Other Activities Operating Profitmargin
20092008(Euro ml.)
424.6104.6
191.0
20.5
61.2
39.8
7.4
(372.2)(24.0)
(212.3)
(120.9)
(8.1)
(6.9)
52.412.3%
Financials
MEDIASET ITALIAN BUSINESS | Other Activities
| 50 |
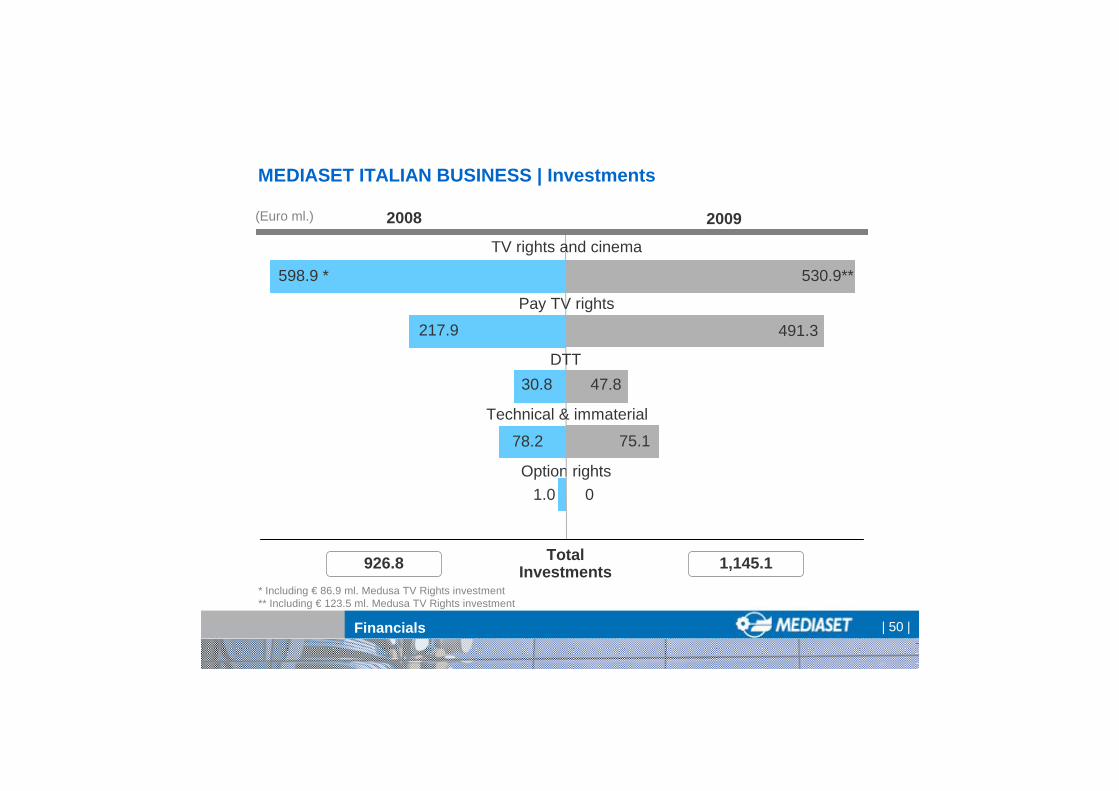
Option rights
20092008
78.2 75.1
217.9 491.3
30.8 47.8
530.9**598.9 *
1.0 0
926.8 1,145.1
(Euro ml.)
TV rights and cinema
Pay TV rights
DTT
Technical & immaterial
Total Investments
* Including € 86.9 ml. Medusa TV Rights investment** Including € 123.5 ml. Medusa TV Rights investment
Financials
MEDIASET ITALIAN BUSINESS | Investments
| 51 |
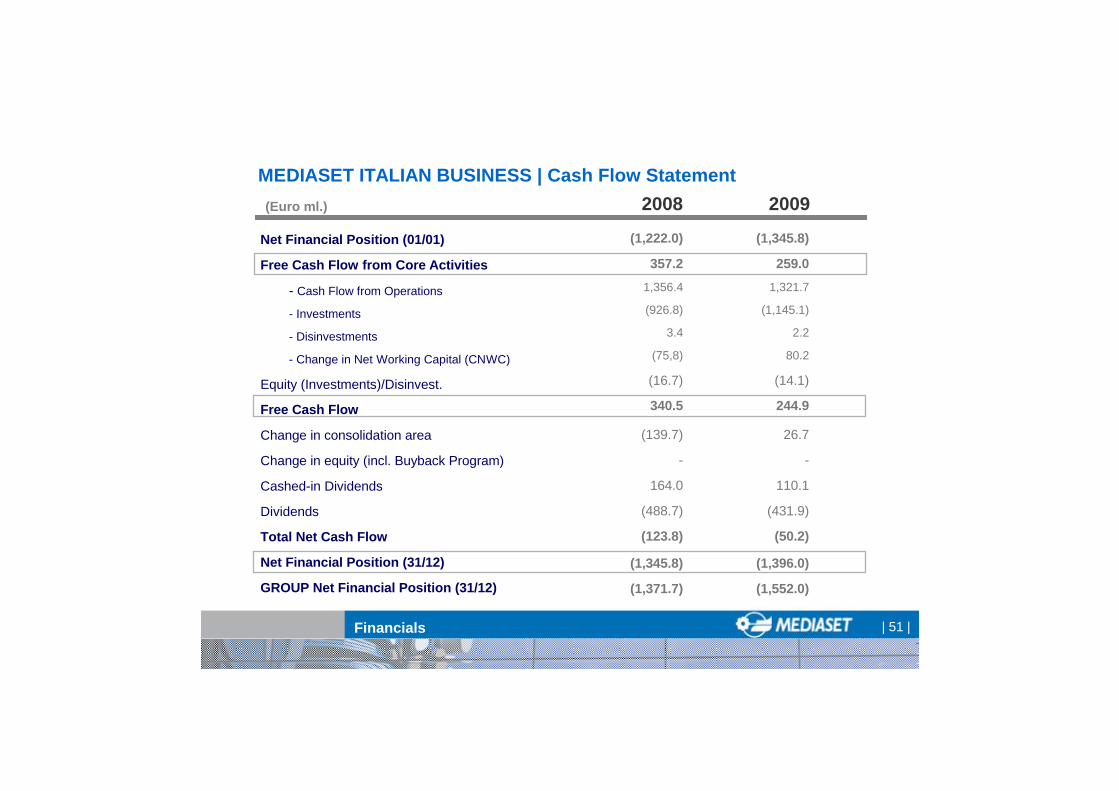
(1,222.0)
357.21,356.4
(926.8)
3.4
(75,8)
(16.7)
340.5
(139.7)
-
164.0
(488.7)
(123.8)
(1,345.8)
(1,371.7)
Net Financial Position (01/01)
Free Cash Flow from Core Activities
- Cash Flow from Operations
- Investments
- Disinvestments
- Change in Net Working Capital (CNWC)
Equity (Investments)/Disinvest.
Free Cash Flow
Change in consolidation area
Change in equity (incl. Buyback Program)
Cashed-in Dividends
Dividends
Total Net Cash Flow
Net Financial Position (31/12)
GROUP Net Financial Position (31/12)
20092008(Euro ml.)
(1,345.8)
259.01,321.7
(1,145.1)
2.2
80.2
(14.1)
244.9
26.7
-
110.1
(431.9)
(50.2)
(1,396.0)
(1,552.0)
Financials
MEDIASET ITALIAN BUSINESS | Cash Flow Statement
| 52 |
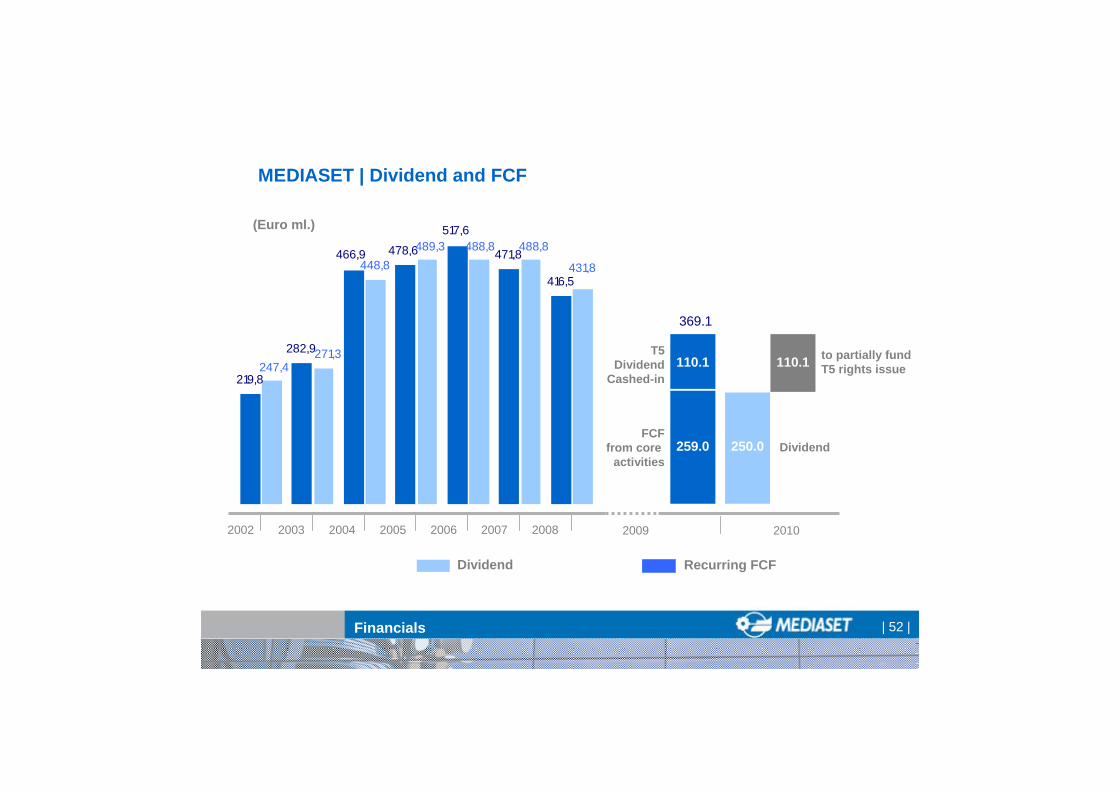
219,8
282,9
471,8
416,5448,8
466,9 478,6
517,6
431,8
488,8
271,3247,4
489,3 488,8
200420032002 2005
(Euro ml.)
Dividend Recurring FCF
2006 2007 2008
Financials
MEDIASET | Dividend and FCF
2009
369.1
2010
259.0
110.1T5
DividendCashed-in
FCFfrom core
activities250.0
110.1
Dividend
to partially fundT5 rights issue

| 53 |
* To be approved by AGM, 20th/21st April 2010; treasury shares are not eligible to receive dividends
Financials
MEDIASET GROUP | Dividend policy
2003 2004 2005 2006 2007 2008
Net Profit (Euro ml.) 369.7 549.6 603.4 505.5 506.8 459.0
Earnings per Share (Euro) 0.31 0.47 0.53 0.44 0.45 0.40
Recurring FCF (Euro ml.) 282.9 466.9 478.6 517.6 471.8 416.5
Dividends 271.3 448.8 489.3 488.8 489.5 431.8
Dividend per Share (Euro) 0.23 0.38 0.43 0.43 0.43 0.38
Dividend/Recurring FCF 96% 96% 102% 94% 104% 104%
Pay-out Ratio 73% 82% 81% 97% 97% 94%
(Euro ml.)
2009
272.4
0.24
259.0 (1)
*250.0
0.22
97%
92%
*
(1) Excluding 2009 Tele5 dividend cashed-in

| 54 |
MEDIASET GROUP | Back up Slides

| 55 |
(1,208.8)
672.2
1,865.0
(1,122.6)
4.5
(74.7)
(1.3)
(53.6)
(640.7)
(139.5)
(162.9)
(1,371.7)
Net Financial Position (01/01)
Free Cash Flow
- Cash Flow from Operations
- Investments
- Disinvestments
- Change in Net Working Capital (CNWC)
Change in equity (incl. Buyback Program)
Equity (Investments)/Disinvest.
Dividends (paid and received)
Change in consolidation area
Total Net Cash Flow
Net Financial Position (31/12)
20092008(Euro ml.)
(1,371.7)
354.1
1,627.2
(1,319.4)
6.5
39.8
(2.9)
(28.0)
(538.9)
26.7
(180.3)
(1,552.0)
Financials
MEDIASET GROUP | Consolidated Cash Flow

| 56 |
2,396,1
513.4
1,051.9
361.6
(195.5)
4,127.5
2,482.4
273.4
2,755.8
(1,371.7)
Television Rights
Goodwill and consolidation differences
Other tangible and intangible assets
Financial assets
Net working capital & other assets/liabilities
Net Invested Capital
Group shareholders’ equity
Minority interests
Net assets
Net financial position
2008(Euro ml.)
Financials
MEDIASET GROUP | Consolidated Balance Sheet
2,598.0
512.1
957.1
233.8
(210.7)
4,090.3
2,331.8
206.5
2,538.3
(1,552.0)
2009

| 57 |
2,266.6
150.2
931.6
746.5
(168.5)
3,926.4
2,527.2
53.4
2,580.6
(1,345.8)
Television Rights
Goodwill and consolidation differences
Other tangible and intangible assets
Financial assets
Net working capital & other assets/liabilities
Net Invested Capital
Group shareholders’ equity
Minority interests
Net assets
Net financial position
2008(Euro ml.)
Financials
MEDIASET ITALIAN BUSINESS | Balance Sheet
2,419.1
149.3
888.6
714.6
(242.6)
3,929.0
2,471.2
61.8
2,533.0
(1,396.0)
2009

| 58 |
MEDIASET GROUP | Net Profit Adjustment
NET PROFIT (Reported)
Edam Adjustments from Telecinco
Telecinco Minorities
Net Edam PPA Adjustment
Net Edam Goodwill Adjustment
Fiscal Assets realignment
Adjusted NET PROFIT
272.4
64.2
(31.3)
5.5
15.9
-
326.7
(Euro ml.)
Financials
2009
459.0
71.3
(34.8)
6.1
17.7
(53.5)
465.7
2008

| 59 |
MEDIASET SPANISH BUSINESS | Back up Slides
| 60 |
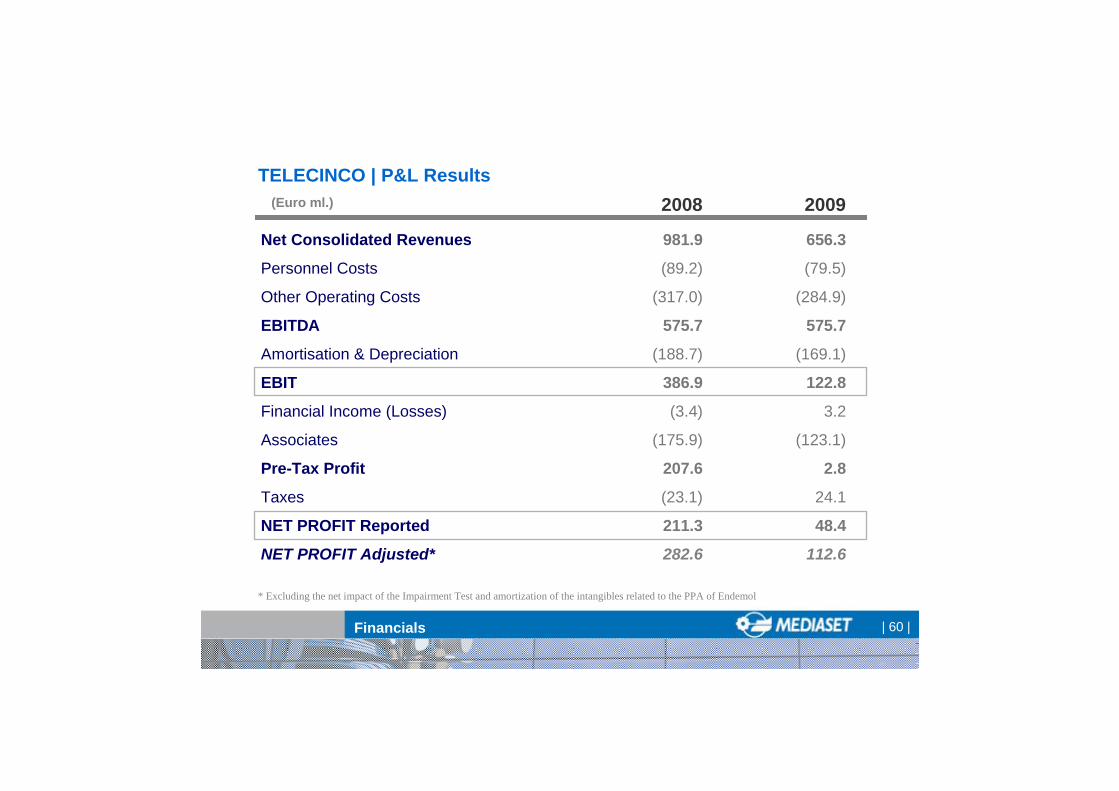
981.9
(89.2)
(317.0)
575.7
(188.7)
386.9
(3.4)
(175.9)
207.6
(23.1)
211.3
282.6
656.3
(79.5)
(284.9)
575.7
(169.1)
122.8
3.2
(123.1)
2.8
24.1
48.4
112.6
TELECINCO | P&L Results
Net Consolidated Revenues
Personnel Costs
Other Operating Costs
EBITDA
Amortisation & Depreciation
EBIT
Financial Income (Losses)
Associates
Pre-Tax Profit
Taxes
NET PROFIT Reported
NET PROFIT Adjusted*
2008 2009(Euro ml.)
Financials
* Excluding the net impact of the Impairment Test and amortization of the intangibles related to the PPA of Endemol

| 61 |
20092008
148.1 159.3
9.0 5.2
TV rights
Tangible & Intangible Fixed Assets
Total Investments
TELECINCO | Investments
Financials
195.8 174.2
(Euro ml.)
38.7 9.8Co-production & Distribution
| 62 |
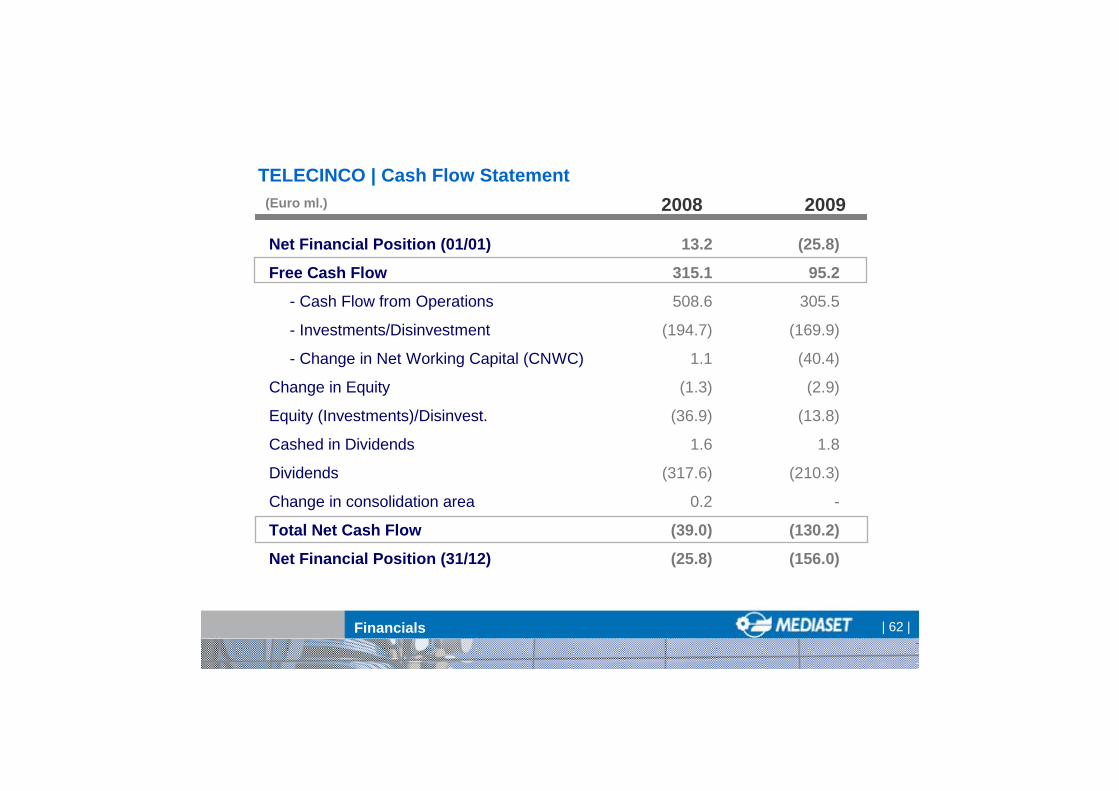
13.2
315.1
508.6
(194.7)
1.1
(1.3)
(36.9)
1.6
(317.6)
0.2
(39.0)
(25.8)
TELECINCO | Cash Flow Statement
Net Financial Position (01/01)
Free Cash Flow
- Cash Flow from Operations
- Investments/Disinvestment
- Change in Net Working Capital (CNWC)
Change in Equity
Equity (Investments)/Disinvest.
Cashed in Dividends
Dividends
Change in consolidation area
Total Net Cash Flow
Net Financial Position (31/12)
(25.8)
95.2
305.5
(169.9)
(40.4)
(2.9)
(13.8)
1.8
(210.3)
-
(130.2)
(156.0)
(Euro ml.)
Financials
2008 2009

| 63 |
Forward-looking StatementsStatements contained in this document, particularly the ones regarding any Mediaset Group possible or assumed future performance, are or may be forward looking statements and in thisrespect they involve some risks and uncertainties.
Mediaset Group actual results and developments may differ materially from the onesexpressed or implied by the above statements depending on a variety of factors.
Any reference to past performance of Mediaset Group shall not be taken as an indication of future performance.
This announcement does not constitute an offer to sell or the solicitation of an offer to buy the securities discussed herein.
The executive responsible for the preparation of the Mediaset S.p.A. accounts, Andrea Goretti, declares that, as per para. 2 art. 154-bis, of the “Testo Unico della Finanza”, that the accounting information contained in this document corresponds to that contained in the company’s books.
Investor Relations Department:
Tel: +39 02 2514.7008Fax: +39 02 2514.6719Email: [email protected]: www.mediaset.it/investor/