Embed Size (px)
Citation preview

American Society of Civil Engineers


American Society of Civil EngineersMarch 25, 2009www.asce.org/reportcard

American Society of Civil Engineers1801 Alexander Bell DriveReston, Virginia, 20191-4400World Headquarters
101 Constitution Ave, NWSuite 375 EastWashington, D.C., 20001Washington Offi ce
202-789-7850
ASCE and American Society of Civil Engineers—Registered in U.S. Patent and Trademark Offi ce.
Copyright © 2009 by the American Society of Civil Engineers.All Rights Reserved.ISBN: 978-0-7844-1037-0Manufactured in the United States of America.

www.asce.org/reportcard �
Founded in 1852, the American Society of Civil Engineers is the country’s oldest national civil engineering organization. It represents more than 146,000 civil engineers in private practice, government, industry, and academia who are dedicated to advancing the science and profession of civil engineering. ASCE is a 501(c)(3) tax exempt educational and professional society.
D. Wayne Klotz, p.e., d.wre, f.ascePresident, American Society of Civil Engineers 2008–2009Klotz AssociatesHouston, Texas
Patrick J. Natale, p.e., f.asce, caeExecutive DirectorAmerican Society of Civil EngineersReston, Virginia
The grades and recommendations of the 2009 Report Card for America’s Infrastruc-ture are determined by a committee made up of 28 ASCE members, all experts in their areas of practice. Biographies of each member are available in the appendix.
2009 RepoRt CaRd foR ameRiCa’s infRastRuCtuRe advisoRy CounCil
Andrew Herrmann, p.e., secb, f.asceAdvisory Council ChairmanHardesty & Hanover, LLPNew York, New YorkBridges
Donald L. Basham, p.e., m.asceStantec ConsultingLouisville, KentuckyInland Waterways, Levees
John Bennett, p.e., m.asceAmtrakWashington, D.C.Rail
Jeanette Brown, p.e., bcee, f.asce, d.wreStamford Water Pollution Control AuthorityStamford, ConnecticutDrinking Water, Wastewater
Charles C. Calhoun, jr., p.e., f.asceConsultantVicksburg, MississippiInland Waterways
J. Richard Capka, p.e, m.asceDawson & AssociatesWashington, D.C.Bridges, Roads
Tony Dalrymple, ph.d., p.e., f.asceJohns Hopkins UniversityBaltimore, MarylandInland Waterways
Michael DeVoy, p.e., m.asceRW ArmstrongIndianapolis, IndianaAviation
Advisory Council
advisoRy CounCil

�� 2009 Report Card for America’s Infrastructure www.asce.org/reportcard
David Gehr, m.asceParsons Brinckerhoff Inc.Leesburg, VirginiaRoads
Henry J. Hatch, p.e., dist.m.asceOakton, VirginiaStrategic Plan
Brad Iarossi, p.e., m.asceAssociation of State Dam Safety OfficialsUpper Marlboro, MarylandDams
Dale Jacobson, p.e., bcee, f.asceJacobson Satchell Consultants, Inc.Omaha, NebraskaDrinking Water, Hazardous Waste, Wastewater
Leon Kempner, jr., ph.d., p.e., m.asceBonneville Power AdministrationPortland, OregonEnergy
Otto J. Lynch, p.e., m.ascePower Line Systems, Inc.Nixa, MissouriEnergy
Roger M. Millar, jr., p.e., f.asceMissoula Office of Planning and GrantsMissoula, MontanaRail, Transit
Paul F. Mlakar, ph.d., p.e., f.asceU.S. Army Corps of EngineersVicksburg, MississippiDams, Inland Waterways, Levees, Resilience
James K. Murphy, p.e., cfm, m.asceURS CorporationHerndon, VirginiaDams, Levees
Peter G. Nicholson, ph.d., p.e., f.asceUniversity of HawaiiHonolulu, HawaiiDams, Levees
Robert E. Nickerson, p.e., m.asceConsulting EngineerFort Worth, TexasEnergy
Thomas M. Rachford, ph.d., p.e, f.asceGannett Fleming, Inc.Mechanicsburg, PennsylvaniaDrinking Water, Wastewater
Debra R. Reinhart, ph.d., p.e., bcee, f.asceUniversity of Central FloridaOrlando, FloridaHazardous Waste, Solid Waste
Thomas S. Slater, p.e., m.asceReynolds, Smith and Hills, Inc.Raleigh, North CarolinaAviation
Paul C. Taylor, p.e., m.asceOrange County Transportation AuthorityOrange, CaliforniaRail, Roads, Transit
Paulo Valerio, p.e., a.m.asceMaryland National Capital Park and Planning CommissionKensington, MarylandParks
C. Michael Walton, ph.d., p.e., dist.m.asceUniversity of Texas at AustinAustin, TexasRoads, Transit
Thomas R. Warne, p.e., m.asceTom Warne and Associates, LLCSouth Jordan, UtahRoads
David L. Westerling, ph.d., p.e., f.asceMerrimack CollegeNorth Andover, MassachusettsDrinking Water, Inland Waterways
Kevin Womack, ph.d., p.e., m.asceUtah State UniversityLogan, UtahBridges
Brian T. Pallasch, cae, aff.m.asceStaff ContactAmerican Society of Civil EngineersWashington, D.C.

www.asce.org/reportcard ���Preface
pRefaCe
These challenges are great, but they can be met. It will take government and industry leadership, sound technology, wise community planning, and involved citizens to make real changes.
A healthy infrastructure will enable us to remain a strong and prosperous nation, but only if we move forward with vision, leadership, and community involvement and support. We must work together to develop a path forward and begin the first crucial steps. With perseverance and a common goal, we can work together to rebuild our once great infrastructure. ★
D. Wayne Klotz, p.e., d.wre, f.ascePresidentAmerican Society of Civil Engineers2008–2009
The 2009 Report Card for America’s Infra-structure finds not much has changed since the last edition four years ago. Years of delayed maintenance and lack of mod-ernization have left Americans with an outdated and failing infrastructure that cannot meet our needs.
Infrastructure has a direct impact on our personal and economic health, and the infrastructure crisis is endangering our nation’s future prosperity. For the safety and security of our families, we can no longer afford to ignore the congested roads, aging dams, broken water mains, and deficient bridges we face every day. As a society, we must become better stewards of the environment through the use of sustainable infrastructure practices. The quality of life for this and future genera-tions depends on our willingness to rise to the challenge.
Civil engineers are stewards of the nation’s infra-structure, charged with the design, construction, operation, and maintenance of our vital public works. Inherent in that responsibility is the obligation to periodically assess the state of the infrastructure, report on its condition and performance, and advise on the steps necessary for its improvement.

�v 2009 Report Card for America’s Infrastructure www.asce.org/reportcard
ASCE Description and Advisory Council Roster i
Preface iii
Lists of Figures and Tables vi
Executive Summary 1
Introduction 9
5 Key Solutions 11
Category Factsheets
Water and Env�ronment
Dams 15
DrinkingWater 25
HazardousWaste 33
Levees 41
SolidWaste 49
Wastewater 57
Transportat�on
Aviation 65
Bridges 75
InlandWaterways 83
Rail 91
Roads 99
Transit 107
table of Contents

www.asce.org/reportcard v
Publ�c Fac�l�t�es
ParksandRecreation 117
Schools 125
Energy
Energy 133
Appendices
PreviousReportCards 141
TakeActionNow 142
AdvisoryCouncilBios 143
Methodology 148
SourcesforEstimated5-YearInvestmentNeeds 150
PhotographyCredits 151
Acknowledgements 153
Table of Contents

FIGURE 1.1 NumberofHighHazardDamsintheUnitedStates 18
FIGURE 3.1 TaxRevenuefromBrownfieldsRedevelopment
inBillionsofDollars 36
FIGURE 4.1 LikelihoodofLeveeFailure/Flooding
Overa30-YearResidentialMortgage 44
FIGURE 5.1 PercentofMunicipalSolidWastethatisRecycled:1960–2007 51
FIGURE 5.2 ComponentsofMunicipalSolidWaste
(254milliontonsgeneratedin2007) 52
FIGURE 7.1 CauseofNationalAviationSystemDelays 70
FIGURE 8.1 PercentofDeficientBridgesintheUnitedStates 78
FIGURE 9.1 CommoditiesShippedViaInlandWaterway(bytons) 86
FIGURE 10.1 NumberofAmtrakPassengers(inthousands):1995–2006 93
FIGURE 11.1 HighwayVehicleMilesTraveled:1995–2005 102
FIGURE 13.1 VisitstoNationalParks 121
FIGURE 14.1 SchoolConstructioninBillionsofDollars:1998–2007 127
FIGURE 15.1 ConstructionExpendituresforTransmission
inMillionsof2006Dollars:1977–2006 136
v� 2009 Report Card for America’s Infrastructure www.asce.org/reportcard
figuRes and tables

TABLE A 2009ReportCardforAmerica’sInfrastructure 2
TABLE B Estimated5-YearInvestmentNeedsinBillionsofDollars 7
TABLE 1.1 NumberofDeficientDamsinUnitedStatesbyRepairStatus 17
TABLE 2.1 DesignLifeofDrinkingWaterSystems 28
TABLE 2.2 WaterUsage:1950and2000 28
TABLE 4.1 DamagesfromFloodinginLevee-RelatedAreas 43
TABLE 6.1 DesignLifeofWaterSystems 60
TABLE 7.1 Top10U.S.PassengerAirports,2006–2007 67
TABLE 7.2 Top10U.S.CargoAirports,2006–2007 69
TABLE 8.1 U.S.BridgeStatistics 77
TABLE 9.1 TheNation’sBusiestInlandPorts 85
TABLE 11.1 Top10MostCongestedCitiesintheU.S. 101
TABLE 12.1 TrafficDelayReductionDuetoPublicTransportation 109
TABLE 12.2 RevenueSourcesforTransitFinancing
inMillionsofDollars:2004 110
TABLE 13.1 AcresofProtectedLand 119
www.asce.org/reportcard v��Figures and Tables

ExEcutivE Summary
The 2009 Report Card for America’s Infrastructure grades 15 categories of infra-structure, including a new category: levees. For the second time, America’s infrastruc-ture rates a cumulative grade of D. While not all categories fare as badly or are plagued by the same problems, delayed maintenance and chronic underfunding are contributors to the low grades in nearly every category.

www.asce.org/reportcard 1Executive Summary
exeCutive summaRy
tRends in the gRades
Grades ranged from a high of C+ for solid waste to a low of D- for drinking water, inland waterways, levees, roads, and wastewater. U.S. surface transportation and aviation systems declined over the past four years, with aviation and transit dropping from a D+ to D, and roads drop-ping from a D to a nearly failing D-.
Showing no significant improvement since the last report, the nation’s bridges, public parks and recreation, and rail remained at a grade of C, while dams, haz-ardous waste, and schools remained at a grade of D, and drinking water and waste-water remained at a grade of D-. Levees, the newest category, debuted on the 2009 Report Card at a barely passing grade of D-.
Just one category—energy—improved since 2005, raised its grade from D to D+.
Water and environmentDAMS: As dams age and downstream development increases, the number of deficient dams has risen to more than 4,000, including 1,819 high hazard dams. Over the past six years, for every defi-cient, high hazard potential dam repaired, nearly two more were declared deficient. There are more than 85,000 dams in the U.S., and the average age is just over 51 years old. Because of the lack of progress made in repairing and rehabilitating the
nation’s dams, this category again earned a grade of D.
DRINKING WATER: Drinking water again earned a D-. America’s drinking water systems face an annual shortfall of at least $11 billion to replace aging facili-ties that are near the end of their useful life and to comply with existing and future federal water regulations. This does not account for growth in the demand for drinking water over the next 20 years. Leaking pipes lose an estimated seven billion gallons of clean drinking water a day. Although Americans still enjoy some of the best tap water in the world, the costs of treating and delivering that water where it is needed continue to outpace the funds available to sustain the system.
HAzARDOUS WASTE: Hundreds of thousands of contaminated sites exist across the country, representing millions of dollars of untapped economic potential. Redevelopment of brownfield sites over the past five years generated an estimated 191,338 new jobs and $408 million annu-ally in extra revenues for localities. In 2008, however, there were 188 U.S. cities with brownfield sites awaiting cleanup and redevelopment. Additionally, federal funding for “Superfund” cleanup of the nation’s worst toxic waste sites has declined steadily, dropping to $1.08 billion

2 2009 Report Card for America’s Infrastructure www.asce.org/reportcard
in 2008, its lowest level since 1986. Since little has been done to clean up these sites since the last Report Card, hazardous waste again earned a grade of D.
LEVEES: The Report Card’s new cate-gory, levees, earned a D-. More than 85% of the nation’s estimated 100,000 miles of levees are locally owned and maintained. The reliability of many of these levees is unknown. Many are more than 50 years old and were originally built to protect crops from flooding. With an increase in development behind these levees, the risk to public health and safety from failure has increased. Rough estimates put the cost at more than $100 billion to repair and rehabilitate the nation’s levees.
SOLID WASTE: The category that has consistently had the highest grade on the Report Card for America’s Infrastructure is solid waste, again earning the highest grade of C+. In 2007, the U.S. produced 254 million tons of municipal solid waste. More than a third was recycled or recov-ered, representing a 7% increase since 2000. Per capita generation of waste has remained relatively constant over the last 20 years. Despite those successes, the increasing volume of electronic waste and lack of uniform regulations for its disposal creates the potential for high levels of hazardous materials and heavy metals in the nation’s landfills, posing a significant threat to public safety.
WASTEWATER: Aging systems dis-charge billions of gallons of untreated wastewater into U.S. surface waters each
TABLE A ★ 2009 Report Card for Amer�ca’s Infrastructure
Aviation D
Bridges C
Dams D
DrinkingWater D-
Energy D+
HazardousWaste D
InlandWaterways D-
Levees D-
PublicParksandRecreation C-
Rail C-
Roads D-
Schools D
SolidWaste C+
Transit D
Wastewater D-
notes Each category was evaluated on the basis of capacity, condition, funding, future need, operation and maintenance, public safety and resilience
D$2.2 trillion
AMERICA’SINFRASTRUCTUREG.P.A.
ESTIMATED5YEARINVESTMENTNEED
A = ExceptionalB = GoodC = MediocreD = PoorF = Failing

Executive Summary 3www.asce.org/reportcard
year. The U.S. Environmental Protec-tion Agency estimates that the nation must invest $390 billion over the next 20 years to update or replace existing sys-tems and build new ones to meet increas-ing demand. Wastewater continues to be among the lowest grades on the Report Card, again earning a D- in 2009.
transportationAVIATION: Despite surging oil prices, volatile credit markets, and a lagging economy, the Federal Aviation Adminis-tration projects a 3% annual growth in air travel. Travelers will be faced with increasing delays and inadequate condi-tions as a result of the long overdue need to modernize the outdated air traffic con-trol system and the failure to enact a fed-eral aviation program. The increasing delays and the lack of new authorization for federal aviation programs have caused aviation’s grade to slip to a D in 2009.
BRIDGES: More than 26%—more than one in four—of the nation’s bridges are either structurally deficient or function-ally obsolete. While some progress has been made in recent years to reduce the number of deficient and obsolete bridges in rural areas, the number in urban areas is rising. A $17 billion annual investment is needed to substantially improve current bridge conditions. Currently, only $10.5 billion is spent annually on the construc-tion and maintenance of bridges. There have been no substantial improvements in bridge condition since the last Report Card, keeping the grade at a C for 2009.
INLAND WATERWAyS: The nation’s waterways offer an efficient and envi-ronmentally friendly way to move goods across the country. The average tow barge can carry the equivalent of 870 trac-tor trailer loads. Of the 257 locks still in use on the nation’s inland waterways, 30 were built in the 1800s and another 92 are more than 60 years old. The average age of all federally owned or operated locks is nearly 60 years, well past their planned design life of 50 years. The cost to replace the present system of locks is estimated at more than $125 billion. Despite the eco-nomic savings waterways can offer, little has been done to improve their condition since 2005, leaving this category at a grade of D-.
RAIL: A freight train is three times as fuel efficient as a truck, and traveling by pas-senger rail uses 20% less energy per mile than traveling by car. However, growth and changes in demand create bottlenecks that constrain traffic in critical areas. Freight and passenger rail generally share the same network, and a significant poten-tial increase in passenger rail demand will add to the freight railroad capacity chal-lenges. More than $200 billion is needed through 2035 to accommodate anticipated growth. Similar to the nation’s inland waterways, rail offers enormous economic and environmental potential, but few improvements have been made since 2005. This category again rates at a C-.
ROADS: Congestion on the nation’s roads is increasing and the cost to improve is ever rising, causing the roads grade to

4 2009 Report Card for America’s Infrastructure www.asce.org/reportcard
decrease to a D- in 2009. Americans spend 4.2 billion hours a year stuck in traffic at a cost to the economy of $78.2 billion, or $710 per motorist. Poor conditions cost motorists $67 billion a year in repairs and operating costs. One-third of America’s major roads are in poor or mediocre condi-tion and 45% of major urban highways are congested. Current spending of $70.3 bil-lion per year for highway capital improve-ments is well below the estimated $186 billion needed annually to substantially improve conditions.
TRANSIT: Transit use increased 25% between 1995 and 2005, faster than any other mode of transportation. However, nearly half of American households do not have access to bus or rail transit, and only 25% have what they consider to be a good alternative. The Federal Transit Admin-istration estimates that $15.8 billion is needed annually to maintain conditions and $21.6 billion is needed to improve to good conditions. In 2008, federal capital outlays for transit were only $9.8 billion. Since investment in transit has not kept pace with its growing needs, the 2009 grade has dropped to a D.
public facilitiesPUBLIC PARKS AND RECREATION: Parks, beaches, and other recreational facilities contribute $730 billion per year to the U.S. economy, support nearly 6.5 million jobs, and contribute to cleaner air and water and higher property values. Despite record spending on parks at the state and local level, the acreage of park-
land per resident in urban areas is declin-ing. While significant investments are being made in the National Park Service for its 2016 centennial, the agency’s facili-ties still face a $7-billion maintenance backlog. Even though some progress has been made since 2005 to improve the nation’s parkland, lagging public invest-ment means that public parks and recre-ation still earns a grade of C- in 2009.
SCHOOLS: Spending on the nation’s schools grew from $17 billion in 1998 to a peak of $29 billion in 2004. However, by 2007 spending fell to $20.28 billion. No comprehensive, authoritative nationwide data on the condition of America’s school buildings have been collected in a decade. The National Education Association’s best estimate to bring the nation’s schools into good repair is $322 billion. Without up-to-date data, the true extent of the prob-lems facing the nation’s schools cannot be known, and therefore schools once again receive a grade of D.
energyENERGy: Progress has been made in grid reinforcement since 2005, and substantial investment in generation, transmission, and distribution is expected over the next two decades. Demand for electricity has grown by 25% since 1990. Public and gov-ernment opposition and difficulty in the permitting processes are restricting much needed modernization. Projected electric utility investment needs could be as much as $1.5 trillion by 2030. The increase to a grade of D+ is largely due to anticipated

Executive Summary 5www.asce.org/reportcard
investments in improvements over the next two decades, which began in 2005.
Raising the gRades: solutions
The nation’s infrastructure faces some very real problems that threaten our way of life if they are not addressed. These problems are solvable if we have the needed vision and leadership. Raising the grades on our infrastructure will require that we seek and adopt a wide range of structural and non-structural solu-tions in every category, including tech-nical advances, funding and regulatory changes, and changes in public behavior and support.
ASCE has developed five key solutions to begin raising the grades. They are:
INCREASE federal leadership in infra-structure to address the crisis;PROMOTE sustainability and resil-ience in infrastructure to protect the natural environment and withstand natural and man-made hazards;DEVELOP national, state, and regional infrastructure plans that complement a national vision and focus on system-wide results;ADDRESS life-cycle costs and ongoing maintenance to meet the needs of cur-rent and future users;INCREASE and improve infrastruc-ture investment from all stakeholders.
★
★
★
★
★
Raising the gRades: Case studies
While the conditions listed in the Report Card mean low grades for all categories, there are positive examples from across the country that demonstrate some prog-ress is being made. Throughout the report, case studies of how public and private organizations have addressed specific problems are included to demonstrate how these innovative solutions can be applied on a larger scale. The case studies for each category may not contribute to an overall improvement of the grade, but they illus-trate that the problems facing the nation’s infrastructure are solvable with some creativity and determination.
histoRy
The concept for a report card to grade the nation’s infrastructure originated in 1988 with a congressionally chartered commis-sion, the National Council on Public Works Improvement. Titled Fragile Foun-dations: A Report on America’s Public Works, the council’s report issued recommenda-tions on how to improve the nation’s infra-structure. As a way to guide the study, the authors used the report card concept to establish a baseline evaluation of the infra-structure. This first report card included eight categories of infrastructure and assigned letter grades on the basis of perfor-mance and capacity of existing public works.
In 1988, when the report was released, the nation’s infrastructure earned a “C,” representing an average grade. Among the problems identified within Fragile Foun-dations were increasing congestion and

6 2009 Report Card for America’s Infrastructure www.asce.org/reportcard
included capacity, condition, operations and maintenance, current and future funding, public safety, and resilience. The grade determination was based on both publicly available data and the subjective judgments of the engineers serving on the advisory council.
The 2005 Report Card featured a cat-egory called “Security” that sought to rate the ability of infrastructure to meet man-made threats. In the four years since that report, engineers have begun to look at security in the context of infrastructure’s overall resilience—or the ability to with-stand and recover from both natural and man-made hazards. Since the likelihood of natural disaster is sometimes much higher than that of a man-made threat, and resil-ience must be determined on a system by system basis, the 2009 Report Card now incorporates resilience as a grading factor in each category.
the need foR investment
In 2009, ASCE estimates that $2.2 trillion needs to be invested over five years to bring the condition of the nation’s infra-structure up to a good condition—an increase of more than half a trillion dol-lars since the 2005 Report Card’s estimate of $1.6 trillion. This number, adjusted for a 3% rate of inflation, represents capital spending at all levels of government and includes what is already being spent. Current spending amounts to only about half of the needed investment, which means the U.S. must invest an additional $1.1 billion over the next five years. ★
deferred maintenance and age of the system; the authors of the report worried that fiscal investment was inadequate to meet the current operations costs and future demands on the system. Since 1998 ASCE has released four Report Cards and found each time that these same problems persist.
methodology
The Report Card advisory council com-prises 28 engineers with expertise in the disciplines represented in the report. For nearly a year the council worked to ana-lyze current data and conditions within the 15 categories, consult with additional technical and industry experts, and assess and assign grades.
In assigning grades, the council consid-ered several fundamental criteria. These
above: Crews work to rescue stranded drivers after a major water main broke in Montgomery County, Maryland on December 23, 2008. Photo courtesy of The Gazette / Gazette.Net.

Executive Summary 7www.asce.org/reportcard
TABLE B ★ Est�mated 5-Year Investment Needs �n B�ll�ons of Dollars
EstimatEd amEricanrEcovEry FivE-yEar 5-yEarnEEd actual andrEinvEstmEnt invEstmEntcatEgory (billions) spEnding* act(p.l.111-005) shortFall
Aviation 87 45 1.3 (40.7)
Dams 12.5 5 0.05 (7.45)
DrinkingWaterandWastewater 255 140 6.4 (108.6)
Energy 75 34.5 11 (29.5)
HazardousWasteandSolidWaste 77 32.5 1.1 (43.4)
InlandWaterways 50 25 4.475 (20.5)
Levees 50 1.13 0 (1.13)
PublicParksandRecreation 85 36 0.835 (48.17)
Rail 63 42 9.3 (11.7)
RoadsandBridges 930 351.5 27.5 (549.5)Discretionarygrantsfor
surfacetransportation 1.5
Schools 160 125 0** (35)
Transit 265 66.5 8.4 (190.1)
2.122 tr�ll�on*** 903 b�ll�on 71.76 b�ll�on (1.176 tr�ll�on)
Total Need**** $2.2 trillion
* 5 year spending estimate based on the most recent available spending at all levels of government and not indexed for inflation
** The American Recovery and Reinvestment Act included $53.6 billion for a State Fiscal Stabilization Fund for education, as of press time, it was not known how much would be spent on school infrastructure.
*** Not adjusted for inflation **** Assumes 3% annual inflation
souRCes For source information see page 150.

intRoduCtion
The American Society of Civil Engineers and its members are committed to protecting the health, safety, and welfare of the public, and as such, are equally committed to improving the nation’s public infrastructure. To achieve that goal, the Report Card depicts the condition and performance of the nation’s infrastructure in the familiar form of a school report card—assigning letter grades that are based on physical condition and needed fiscal investments for improvement.
www.asce.org/reportcard 9
intRoduCtion
Since 1998, ASCE has issued three infra-structure report cards and numerous status updates that depict the current state of the infrastructure and provide potential solutions for improvement. The Report Card has been cited in numerous articles and academic studies, and the nation’s political leaders rely on the Report Card to provide them with clear informa-tion which they can use as a guide for policy decisions.
To develop the quadrennial Report Card for America’s Infrastructure, ASCE assem-bles an advisory panel of the nation’s lead-ing civil engineers to determine the scope of the inquiry and establish a methodology for assigning grades. They then analyze hundreds of studies, reports, and other sources, and ASCE surveys thousands of engineers to determine what is happening in the field.
The concept for a report card to grade the nation’s infrastructure originated in 1988 with a congressionally chartered commission, the National Council on Pub-lic Works Improvement. Titled Fragile Foundations: A Report on America’s Pub-lic Works, the council’s report issued rec-ommendations on how to improve the nation’s infrastructure. As a way to guide the study, the authors used the report card concept to establish a baseline evaluation of the infrastructure. This first report card included eight categories of infrastructure
and assigned letter grades based on performance and capacity of existing public works.
When the report was released in 1988, the nation’s infrastructure earned a “C,” representing an average grade. Among the problems identified within Fragile Foun-dations were increasing congestion and deferred maintenance and age of the sys-tem; the authors of the report worried that fiscal investment was inadequate to meet the current operations costs and future demands on the system.
In 1998, ASCE found that in the decade since the Fragile Foundations report was released, the overall grade had dropped a whole letter grade to a D. Moreover, a fail-ing grade was assigned to the nation’s pub-lic school infrastructure, with near failing grades in such crucial areas as drinking water, roads, and dams. The grades sur-prised even the authors and generated widespread public attention.
The Report Card issued in 2001 showed a slight upturn to a D+ in the overall grade, but by 2005 it sank back to a D. What is most telling, however, is the fact that the concerns in the 1988 report are the same concerns found subsequently, such as inadequate capacity and deferred maintenance.
The grades for the previous report cards can be found in Appendix A of this report. ★
Introduction

ASCE’s Report Card for America’s Infrastruc-ture seeks to inform the public and policy makers about the condition of the nation’s infrastructure and how best to improve it. Americans owe their economic prosperity, public safety, and high quality of life to the infrastructure that serves them every day.
Five Key SolutionS
raising the grades

www.asce.org/reportcard 11Five Key Solutions
five Key solutions
While the Report Card points out seri-ous deficiencies in the nation’s infrastruc-ture as well as the need for focused and visionary leadership and adequate fund-ing, these can be addressed. The key solu-tions offered by ASCE are ambitious and will not be implemented overnight, but Americans are capable of real and positive change. ASCE urges all of those who want to continue our tradition of a strong and prosperous nation to begin by maintain-ing and improving the infrastructure that makes us great.
The five key solutions are:INCREASE federal leadership in infrastructure;PROMOTE sustainability and resilience;DEVELOP federal, regional, and state infrastructure plans;ADDRESS life cycle costs and ongoing maintenance;INCREASE and improve infrastruc-ture investment from all stakeholders.
★
★
★
★
★
inCRease fedeRal leadeRship in 1.infRastRuCtuRe
America’s infrastructure needs bold lead-ership and a compelling national vision. During the 20th century, the federal government led the way in building our nation’s greatest infrastructure systems by means ranging from the New Deal programs to the interstate highway sys-tem and the Clean Water Act. Since that time, federal leadership has diminished and the condition of the nation’s infra-structure has suffered. Currently most infrastructure investment decisions are made without the benefit of a national vision. That strong national vision must originate with strong federal leadership and be shared by all levels of government and the private sector. Without a strong national vision, infrastructure will con-tinue to deteriorate.
pRomote sustainability 2.and ResilienCe
America’s infrastructure must meet ongoing needs for natural resources, industrial products, energy, food, trans-portation, shelter, and effective waste
raising the grades

12 2009 Report Card for America’s Infrastructure www.asce.org/reportcard
management, and at the same time pro-tect and improve environmental quality. Sustainability and resiliency must be an integral part of improving the nation’s infrastructure. Today’s transporta-tion systems, water treatment systems, and flood control systems must be able to withstand both current and future challenges. Both structural and non-structural methods must be applied to meet challenges. Infrastructure systems must be designed to protect the natural environment and withstand both natu-ral and man-made hazards, using sus-tainable practices, to ensure that future generations can use and enjoy what we build today, as we have benefitted from past generations. Additionally, research and development should be funded at the federal level to develop new, more efficient methods and materials for building and maintaining the nation’s infrastructure. Sustainable development will not only preserve our high quality of life and environment we enjoy today, but improve conditions in the future.
develop fedeRal, Regional, and state 3.infRastRuCtuRe plans
Infrastructure investment at all lev-els must be prioritized and executed according to well conceived plans that both complement the national vision and focus on systemwide outputs. Goals of the plan should center on freight and passenger mobility, intermodality,
water use, environmental stewardship, and encouraging resiliency and sustain-ability. The plans must reflect a better defined set of federal, state, local, and private sector roles and responsibilities and instill better discipline for setting priorities and focusing funding to solve the most pressing problems. The plans should also complement our broad national goals of economic growth and leadership, resource conservation, energy independence, and environmen-tal stewardship. Infrastructure plans should be synchronized with regional land use planning and related regulation and incentives to promote nonstructural as well as structural solutions to miti-gate the growing demand for increased infrastructure capacity.
addRess life CyCle Costs and 4.ongoing maintenanCe
As infrastructure is built or rehabili-tated, life cycle cost analysis should be performed for all infrastructure sys-tems to account for initial construction, operation, maintenance, environmental, safety and other costs reasonably antici-pated during the life of the project, such as recovery after disruption from natu-ral or manmade hazards. Additionally, owners of the infrastructure should be required to perform ongoing evaluations and maintenance to keep the system functioning at a safe and satisfactory level. Life cycle cost analysis, ongoing
Five Key Solutions 13www.asce.org/reportcard
maintenance, and planned renewal will result in more sustainable and resilient infrastructure systems and ensure they can meet the needs of future users.
inCRease and impRove infRastRuCtuRe investment 5.fRom all staKeholdeRs
All levels of government, owners, and users must renew their commitment to infrastructure investments in all catego-ries. All available financing options must be explored and debated. While great strides can be made with sustainable development and ongoing maintenance, if we are to make the necessary long-term improvements, significant funds must be invested. The longer critical investments to improve the operability, safety, and resilience of the nation’s infrastructure are withheld, the greater the future cost and risk of failure. We must develop and authorize innovative financing programs that not only make resources readily available, but also encourage the most effective and efficient use of those resources. Federal investment must be used to complement, encourage, and leverage investment from the state and local government levels as well as from the private sector. In addition, users of infrastructure must be willing to pay the appropriate price for their use. ★
These five key solutions are holistic recommendations to improve the planning, building, and maintenance of the nation’s infrastructure, but they must be applied in a way that meets the unique needs of each category. Along with detailed conditions descriptions, the individual chapters of this book contain specific solutions for raising the grade in each infrastructure category.

DAMS
As dams age and downstream development increases, the number of deficient dams has risen to more than 4,000, including 1,819 high hazard potential dams. Over the past six years, for every deficient, high hazard potential dam repaired, nearly two more were declared deficient. There are more than 85,000 dams in the U.S., and the average age is just over 51 years old.
Water and environment

www.asce.org/reportcard
Water and environment
15
A = ExceptionalB = GoodC = MediocreD = PoorF = Failing
AMERICA’SINFRASTRUCTURE G.P.A.
15
EncouragE or require effective state dam safety programs that provide adequate funding, staff, and statutory authorities;
DEvElop emergency action plans for every high hazard dam by 2011;
Establish a national funding program and parallel state programs to repair nonfederally owned dams;
incluDE dam failure inundation mapping as part of the National Flood Insurance Program;
EDucatE the public about dam safety risks;
EncouragE individuals to educate themselves on the location and condition of dams in their area.
Facts About DAMS www.asce.org/reportcard
DDAMS
ESTIMATED 5-YEAR FUNDING REQUIREMENTS FOR Dams
Total investment needs $12.5 billion
Estimated spending$5.05 billion
Projected shortfall$7.45 billion

16 2009 Report Card for America’s Infrastructure www.asce.org/reportcard
ConDition
Dams provide essential benefits, includ-ing drinking water, power generation, flood protection, irrigation, and recre-ation. They may be publicly owned and operated by federal agencies, states, cities and municipalities or privately owned and operated by businesses and corporations. Typically earth embankments or concrete structures, dams can reach heights of up to 770 feet and store billions of gallons of water. A dam’s “hazard potential” is clas-sified on the basis of the anticipated con-sequences of failure, not the condition of the dam. The classifications include “high hazard potential” (anticipated loss of life in the case of failure), “significant hazard potential” (anticipated damage to build-ings and important infrastructure), and “low hazard potential” (anticipated loss of the dam or damage to the floodplain, but no expected loss of life).
The National Inventory of Dams (NID), which is maintained by the U.S. Army Corps of Engineers (USACE), shows that the number of dams in the U.S. has increased to more than 85,000, but the federal government owns or regulates only 11% of those dams.3,5 Responsibility for ensuring the safety of the rest of the nation’s dams falls to state dam safety pro-grams. Many state dam safety programs do not have sufficient resources, fund-ing, or staff to conduct dam safety inspec-tions, to take appropriate enforcement actions, or to ensure proper construction by reviewing plans and performing con-struction inspections. For example, Texas has only 7 engineers and an annual bud-
get of $435,000 to regulate more than 7,400 dams.3 That means each inspector is responsible for more than 1,050 dams. Worse still, Alabama does not have a dam safety program despite the fact that there are more than 2,000 dams in the state. And in some states many dams are specifi-cally exempted from inspection by state law. In Missouri there are 740 high hazard potential dams that are exempted because they are less than 35 feet in height. The task for the states is an enormous chal-lenge. (See Table 1.1)
While the total number of dams is increasing, the number of high hazard potential dams is also increasing at an alarming rate, now totaling 15,237.3 That represents an increase of more than 3,300 new high hazard potential dams since 2007. This increase is a result of new development below dams, which is dra-matically increasing the consequences of failure and resulting in the reclassifica-tion of dams. This change in classification requires that significantly greater safety standards be met given the greater conse-quences of dam failure.
The number of dams determined to be unsafe or deficient has risen from 3,500 in 2005 to 4,095 in 2007.3 Of that num-ber, high hazard potential dams that are also classified as deficient has risen from 1,367 in 2005 to 1,819 in 2007.3 The greatest indicator of the condition of the nation’s dams can be seen in Table 1.1 that demonstrates the increase in the num-ber of high hazard dams that need to be repaired compared to the number of com-pleted repairs to high hazard dams, which remains flat.3 The rate of dam repairs is

Facts About DAMS 17www.asce.org/reportcard
not keeping pace with the increase in the number of high hazard dams that need rehabilitation. The gap between dams needing repair and those actually repaired is growing significantly.
Many dams are determined to be defi-cient as a result of aging, deterioration, and a lack of maintenance. Often dams are deemed unsafe or deficient as a result of increased scientific and engineering knowledge about large flood events and earthquakes, and the ability to predict a dam’s structural response to such extreme events, which pose a significant safety threat. Many dams were constructed 30 or 40 years ago using the best science and engineering at the time. But as a result of the additional 40 years of historical records and greater abilities to predict increases in loads on dams and the dams’
Many state dam safety programs do not have sufficient resources, funding, or staff to conduct dam safety inspections, to take appropriate enforcement actions, or to ensure proper construction by reviewing plans and performing construction inspections.
TABLE 1.1 ★ Number of Deficient Dams in United States by Repair Status
#of #ofHigHHazard #ofHigHHazard #ofHigHHazardyear deficientdams deficientdams repaireddams damsneedingrepair
2001 1,348 488 124 364
2002 1,536 646 163 483
2003 2,004 648 120 528
2004 3,000 979 100 879
2005 3,271 1,367 138 1,229
2006 3,346 1,308 139 1,169
2007 4,095 1,826 83 1,743
SoURCE Association of State Dam Safety Officials

18 2009 Report Card for America’s Infrastructure www.asce.org/reportcard
of a failure to identify and notify people residing below a dam, and to coordinate their evacuation—has also increased.9 However, the number of high hazard potential dams nationwide that have EAPs remains at a lackluster 50%. Even worse is the fact that many high hazard potential dams are unregulated and uninspected. Approximately 30% of the high hazard potential dams have not been inspected within the last five years (see Figure 1.1).
Federal agencies own or regulate a very small percentage of the 85,000 dams in the U.S. but they face significant chal-lenges in terms of oversight.8 As the coun-try’s dams age, downstream development increases, and better engineering methods are developed, more significant rehabilita-tion will be needed. Examples include the
responses to those events, more dams are being identified as unsafe or deficient.
The National Dam Safety Program (NDSP), which was established by the Water Resource Development Act of 1996, created a national dam safety program administered by the Federal Emergency Management Agency that is designed to provide incentive grants to states and training to encourage research.12 While there have been successes and improve-ments as a result of the NDSP and stronger state programs, the safety and condition of the nation’s dams have not improved overall. Successes have included modest increases in staffing, budgets, and dam safety inspections in some state programs. The number of Emergency Action Plans (EAPs)—essential plans used in the event
FIGURE 1.1 ★ Number of High Hazard Dams in the United States
8,000
10,000
12,000
8,000
9,000
10,000
11,000
SoURCE Association of State Dam Safety Officials

The U.S. Department of Agriculture, Natural Resources Conservation Ser-vice (NRCS) has provided technical and funding assistance to local water-shed sponsors to construct 11,000 project dams (primary purposes being flood control, water supply, and grade stabilization) since 1948—most of these dams were installed under the Watershed Protection and Flood Prevention Act (PL 83-566).13 While these watershed project dams provide significant annual benefits, thousands of these dams need to be rehabilitated: 1,065 watershed dams have already exceeded their design life and by 2015 an additional 4,300 dams will have exceeded their design life; 1,000 dams need to be rehabilitated due to stricter dam safety standards as a result of downstream development greatly increasing the consequences of a dam failure.
The NRCS has implemented a very successful program to provide assess-ments, planning, designs, and construction funding to begin the enormous task of repairing watershed dams throughout the U.S. The success of the program has been a result of partnerships between the NRCS, local spon-sors, and state dam safety officials—leadership and funding provided by Congress. The design and construction funding is cost-shared—65% is provided by the NRCS and 35% is provided through local participation. To date, 77 dams have been rehabilitated, an additional 55 have been autho-rized for construction, and another 31 are in the planning phase.
Congress has continued its leadership role by providing $100 million in the 2008 Farm Bill (mandatory funding) and has authorized $85 million to be appropriated for fiscal years 2008 through 2012 (discretionary funding) to support the Watershed Rehabilitation Program. Over the next four years (FY 2009–2012), the NRCS anticipates performing 400 dam assessments, processing 250 local sponsor requests for assistance, developing 200 rehabili-tation plans, completing 170 designs, and rehabilitating 120 watershed dams.
Facts About DAMS 19www.asce.org/reportcard
U.S. NATURAL RESoURcES coNSERvATIoN SERvIcE ★ Watershed Rehabilitation Program

20 2009 Report Card for America’s Infrastructure www.asce.org/reportcard
$317 million rehabilitation of Wolf Creek Dam, which is owned by the USACE, and the major improvements to Folsom Dam, which were jointly undertaken by the USACE and the U.S. Bureau of Reclama-tion at an estimated cost of $1.5 billion through 2019.
In 2009, the Association of State Dam Safety Officials (ASDSO) estimated that the total cost to repair the nation’s dams totaled $50 billion and the needed invest-ment to repair high hazard potential dams totaled $16 billion. These estimates have increased significantly since ASDSO’s 2003 report, when the needed invest-ment for all dams was $36 billion and the needed investment for high hazard poten-tial dams was $10.1 billion.4
The 2009 report noted an additional investment of $12 billion over 10 years will be needed to eliminate the existing back-log of 4,095 deficient dams. That means the number of high hazard potential dams repaired must be increased by 270 dams per year above the number now being repaired, at an additional annual cost of $850 million a year. To address the additional 2,276 deficient—but not high hazard—dams, an additional $335 million per year is required, totaling $3.4 billion over the next 10 years.4
While much progress in identifying the condition of the nation’s dams has been made since the implementation of the NID, the 2008 failure of a dam retain-ing coal ash from a power plant in Ten-nessee points out significant gaps in the regulation of dams associated with the power and mining industry at both the federal and state levels. Many states do
not have the authority to regulate min-ing dams, other states only regulate min-ing dams after the mining operation has stopped, and some states regulate mining dams through departments other than those that administer the dam safety pro-gram. At the federal level there are signifi-cant differences in regulatory standards between the coal mining industry and the metal/nonmetal industries regarding standards for design, inspection, and the requirements to provide EAPs for high hazard dams.
RESiliEnCE
Dams are generally not very resilient because few have redundant structures, many have regional impacts, and only 50% of high hazard dams have EAPs.
The U.S. Department of Homeland Security, through the Office of Infrastruc-ture Protection, has started addressing this important issue in collaboration with the dam safety and dam security com-munities, federal and state agencies, and the entire spectrum of owners and opera-tors. Given the large number of dams and their broad range of resiliency levels, efforts are being made to develop a ratio-nal prioritization approach for coordinat-ing protection programs and resiliency enhancements. Important physical and functional characteristics of dams—such as the consequence of failure and loss of critical benefits—are considered the basis for identifying which dams would have the most severe and long lasting impact if service was lost (drinking water, hydro-power, flood damage reduction, inland

Facts About DAMS 21www.asce.org/reportcard
When it was constructed in 1964, the Martinez Creek Dam was designed to protect agricultural lands. Since that time, development in the area has increased and the lake formed by the dam is an integral part of the city of Live Oak’s park system. County officials applied to the NRCS Small Watershed Rehabilitation Program for grants to rehabilitate the dam since its hazard level had increased from low to high. Since the dam was raised and the spillway upgraded, engineers now
expect the dam to last another 100 years. Photo courtesy of the San Antonio River Authority.
BExAR coUNTy, Tx ★ Martinez creek Dam No. 5
Following several devastating flood events that resulted in more than 35 dam failures, the state of New Jersey developed funding programs for the rehabilitation of dams. Two state bond acts have provided the New Jersey Department of Envi-ronmental Protection, Bureau of Dam Safety and Flood Con-trol, with $110 million to administer low interest loans for dam rehabilitation projects. Twenty-four dams, including 19 high hazard dams, have been completed so far; 29 more, including 10 high hazard dams, are under construction; and 45, includ-ing 11 high hazard dams, are in some stage of planning and design. Owners of the Skyline Lake Dam applied to this state program and received $900,000 to reconstruct the concrete spillway and stabilize the earth embankment to allow for over-topping during a storm. Overall, approximately $32.8 million has been disbursed from the program to date. Photo courtesy of New Jersey Department of Environmental Protection, Office of Engineering and Construction.
RINGWooD, NJ ★ Skyline Lake Dam

22 2009 Report Card for America’s Infrastructure www.asce.org/reportcard
Just outside of Albuquerque, New Mexico, the Piedra Liza Dam today protects seven times as many people as when it was built in the early 1950s. Analyses in the early 2000s showed deficiencies within the dam and should it fail, as many as 1,700 residents in the area and 43,000 commuters on Interstate 25 could be adversely affected. Sandoval County applied to the NRCS Small Watershed Rehabilitation Program for assistance in 2005 and by 2007 repairs had been completed. Photo courtesy of the U.S. Natural Resources Conservation Service.
SANDovAL coUNTy, NM ★ NRcS Rehabilitated Dam

Facts About DAMS 23www.asce.org/reportcard
navigation, etc.). By considering the impact on all sectors—public safety, local commerce, service suppliers, etc.—in the risk evaluation process, strategies that target increased resilience and improved security can be effectively identified.
ConClUSion
Despite some successes, the overall condition of the nation’s dams has not improved in recent years. This is evi-denced by the rising numbers of dams—especially high hazard dams—that are deficient and in need of repair as well as by the limited number of dams that are actu-ally repaired each year. In order to make significant improvements in the nation’s dams—a matter of critical importance to public health, safety and welfare— Congress, the administration, state dam safety programs, and dam owners will have to develop an effective inspection, enforcement and funding strategy to reverse the trend of increasingly deterio-rating dam infrastructure. ★
SoURCES1 Association of State Dam Safety Officials. National Dam Safety Program Successes and Chal-lenges (2003)
2 Association of State Dam Safety Officials. State and Federal Oversight of Dam Safety Must Be Improved (2007)
3 Association of State Dam Safety Officials. Sta-tistics on Dams and State Safety Regulation (2007)
4 Association of State Dam Safety Officials. The Cost of Rehabilitating Our Nation’s Dams: A Methodology, Estimate and Funding Mechanisms (2002; rev. ed., 2008)
5 Association of State Dam Safety Officials. News Archives. 21 October 2008 www.damsafety.org
6 Federal Emergency Management Agency. Availability of Dam Insurance, A Report to Con-gress (1999)
7 Federal Emergency Management Agency. Federal Guidelines for Dam Safety (2004)
8 Federal Emergency Management Agency. Draft Report: Dam Safety in the United States, Progress Report on the National Dam Safety Program Fiscal Year 2006 and 2007 (2008)
9 Federal Emergency Management Agency. Emergency Action Planning for State Regulated High-Hazard Dams; Findings, Recommendations and Strategies (2007)
10 Federal Emergency Management Agency. Dam Safety and Security in the United States: A Progress Report on the National Dam Safety Program Fiscal Years 2004 and 2005
11 Federal Emergency Management Agency. Interagency Committee on Dam Safety Agency Report on the Implementation of the Federal Guidelines for Dam Safety
12 Federal Emergency Management Agency. The National Dam Safety Program: 25 Years of Excellence (2005)
13 United States Department of Agriculture, Natural Resources Conservation Service (NRCS) Watershed Rehabilitation Program www.nrcs.usda.gov/programs/WSRehab/
other Resources:
National Research Council of the National Academies, Washington, D.C., Assessment of the Bureau of Reclamation’s Security program, (2008)
U.S. Army Corps of Engineers. National Inven-tory of Dams Overview (2007)

DRINKING WATER
America’s drinking water systems face an annual shortfall of at least $11 billion to replace aging facilities that are near the end of their useful lives and to comply with existing and future federal water regula-tions. This does not account for growth in the demand for drinking water over the next 20 years. Leaking pipes lose an estimated 7 billion gallons of clean drinking water a day.
Water and environment

www.asce.org/reportcard
Water and environment
25
A = ExceptionalB = GoodC = MediocreD = PoorF = Failing
AMERICA’SINFRASTRUCTURE G.P.A.
25
incrEasE funding for water infrastructure system improvements and associated operations through a comprehensive federal program;
crEatE a Water Infrastructure Trust Fund to finance the national shortfall in funding of infrastructure systems under the Clean Water Act and the Safe Drinking Water Act, including storm-water management and other projects designed to improve the nation’s water quality;
Employ a range of financing mechanisms, such as appropriations from general treasury funds, issuance of revenue bonds and tax exempt financing at state and local levels, public-private partnerships, state infrastructure banks, and user fees on certain consumer products as well as innovative financing mechanisms, including broad-based environmental restoration taxes to address problems associated with water pollution, wastewater management and treatment, and storm-water management.
Facts About DRINKING WATER www.asce.org/reportcard
D-DRinKinG WAtER
ESTIMATED 5-YEAR FUNDING REQUIREMENTS FOR Drinking water anD wastewater
Total investment needs $255 billion
Estimated spending$146.4 billion
Projected shortfall$108.6 billion

26 2009 Report Card for America’s Infrastructure www.asce.org/reportcard
ConDitionS
The nation’s drinking-water systems face staggering public investment needs over the next 20 years. Although America spends billions on infrastructure each year, drinking water systems face an annual shortfall of at least $11 billion in funding needed to replace aging facilities that are near the end of their useful life and to comply with existing and future federal water regulations. The shortfall does not account for any growth in the demand for drinking water over the next 20 years.2
Of the nearly 53,000 community water systems, approximately 83% serve 3,300 or fewer people. These systems provide water to just 9% of the total U.S. popula-tion served by all community systems. In contrast, 8% of community water systems serve more than 10,000 people and pro-vide water to 81% of the population served. Eighty-five percent (16,348) of nontran-sient, noncommunity water systems and 97% (83,351) of transient noncommunity water systems serve 500 or fewer people. These smaller systems face huge financial, technological, and managerial challenges in meeting a growing number of federal drinking-water regulations.
In 2002, the U.S. Environmental Pro-tection Agency (EPA) issued The Clean Water and Drinking Water Infrastructure Gap Analysis, which identified potential funding gaps between projected needs and spending from 2000 through 2019. This analysis estimated a potential 20-year funding gap for drinking water capi-tal expenditures as well as operations and
maintenance, ranging from $45 billion to $263 billion, depending on spending levels. Capital needs alone were pegged at $161 billion.2
The Congressional Budget Office (CBO) concluded in 2003 that “current funding from all levels of government and cur-rent revenues generated from ratepayers will not be sufficient to meet the nation’s future demand for water infrastructure.” The CBO estimated the nation’s needs for drinking water investments at between $10 billion and $20 billion over the next 20 years.3
In 1996, Congress enacted the drinking-water state revolving loan fund (SRF) pro-gram. The program authorizes the EPA to award annual capitalization grants to states. States then use their grants (plus a 20% state match) to provide loans and other assistance to public water systems. Communities repay loans into the fund, thus replenishing the fund and making resources available for projects in other communities. Eligible projects include installation and replacement of treat-ment facilities, distribution systems, and some storage facilities. Projects to replace aging infrastructure are eligible if they are needed to maintain compliance or to fur-ther public health protection goals.
Federal assistance has not kept pace with demand, however. Between FY 1997 and FY 2008, Congress appropriated approximately $9.5 billion for the SRF. This 11-year total is only slightly more than the annual capital investment gap for each of those years as calculated by the EPA in 2002.

Facts About DRINKING WATER 27www.asce.org/reportcard
The California Department of Water Resources predicts that by 2020, the entire state will experience water shortages equal to the needs of 4 to 12 million fami-lies of four for one year. To meet growing demand and reduce reliance on water imported from northern California and the Colorado River, the Orange County Water District developed the Groundwater Replenishment (GWR) System that takes highly treated sewer water and purifies it to levels that meet state and federal drinking water standards. GWR System water will be between 35% to 75% cheaper than water produced by seawater desalination and the purification process will consume about half the energy. Photos courtesy of Orange County Water District.
oRANGE coUNTy, �cA�★�Groundwater Replenishment System

28 2009 Report Card for America’s Infrastructure www.asce.org/reportcard
TABLE 2.1�★��Design Life of Drinking Water Systems
components yearsofdesignlife
Reservoirs and Dams 50–80
Treatment Plants—Concrete Structures 60–70
Treatment Plants—Mechanical and Electrical 15–25
Trunk Mains 65–95
Pumping Stations—Concrete Structures 60–70
Pumping Stations—Mechanical and Electrical 25
Distribution 60–95
SoURCE US EPA Clean Water and Drinking Water Infrastructure Gap Analysis Report, September 2002
TABLE 2.2�★��Water Usage: 1950 and 2000
percent 1950 2000 cHange
Population (Millions) 93.4 242 159%
Usage (Billions of Gallons per Day) 14 43 207%
Per Capita Usage (Gallons per Person per Day) 149 179 20%
SoURCE US EPA Clean Water and Drinking Water Infrastructure Gap Analysis Report, September 2002

Facts About DRINKING WATER 29www.asce.org/reportcard
RESiliEnCE
Drinking water systems provide a critical public health function and are essential to life, economic development, and growth. Disruptions in service can hinder disaster response and recovery efforts, expose the public to water-borne contaminants, and cause damage to roadways, structures, and other infrastructure, endangering lives and resulting in billions of dollars in losses.
The nation’s drinking-water systems are not highly resilient; present capa-bilities to prevent failure and properly maintain or reconstitute services are inad-equate. Additionally, the lack of invest-ment and the interdependence on the energy sector contribute to the lack of overall system resilience. These short-comings are currently being addressed through the construction of dedicated emergency power generation at key drink-ing water utility facilities, increased connections with adjacent utilities for emergency supply, and the develop-ment of security and criticality crite-ria. Investment prioritization must take into consideration system vulnerabilities, interdependencies, improved efficiencies in water usage via market incentives, sys-tem robustness, redundancy, failure con-sequences, and ease and cost of recovery.
The question is not whether the federal government should take more responsibility for drinking water improvements but how it should take more responsibility.

30 2009 Report Card for America’s Infrastructure www.asce.org/reportcard
The Louisville Water Company has proposed $11 million in projects that could be funded as part of the 2009 American Recovery and Reinvestment Act (P.L. 111-005). The projects would rehabilitate 75 miles of water main to extend the useful life of the system and reduce water main breaks. In addition, 9.5 miles of water main would be replaced to improve water quality, fire hydrant flow and reduce maintenance. Together, the projects would support 101 jobs.
LoUISvILLE, Ky ★ American Recovery and Reinvestment Act Funding
PoRT ANGELES,� WA ★ Downtown Water Main Project
In 2008, the City of Port Angeles com-pleted a project to replace the water mains and sidewalks in the downtown area. The replacement water mains bring the city’s downtown area to a service level that meets current fire flow standards, reduces seismic risks and helps prevent water main fail-ures due to age. The original water mains were installed in 1914. In con-junction with the water main replace-ment, many sidewalks were replaced with pavers that enhance the down-town appearance. Also, new conduit and wiring was installed for street and pedestrian lighting. Photos courtesy of the City of Port Angeles.
Facts About DRINKING WATER 31www.asce.org/reportcard
ConClUSion
New solutions are needed for what amounts to nearly $1 trillion in critical drinking water and wastewater invest-ments over the next two decades. Not meeting the investment needs of the next 20 years risks reversing public health, environmental, and economic gains of the past three decades.
Without a significantly enhanced federal role in providing assistance to drinking water infrastructure, critical investments will not occur. Possible solu-tions include grants, trust funds, loans and incentives for private investment. The question is not whether the federal gov-ernment should take more responsibility for drinking water improvements but how it should take more responsibility.
The case for federal investment is compelling. Needs are large and unprec-edented; in many locations, local sources cannot be expected to meet this challenge alone, and because waters are shared across local and state boundaries, the benefits of federal help will accrue to the entire nation. Clean and safe water is no less a national priority than are national defense, an adequate system of interstate highways, and a safe and efficient aviation system. These latter infrastructure programs enjoy sustainable, long-term federal grant programs; under current policy, water and wastewater infrastruc-ture do not. ★
SoURCES1 Congressional Research Service, Safe Drink-ing Water Act: Selected Regulatory and Legislative Issues, April 2008.
2 U.S. Environmental Protection Agency, The Clean Water and Drinking Water Infrastructure Gap Analysis, September 2002.
3 U.S. Congressional Budget Office, Future Investment in Drinking Water and Wastewater Infrastructure, May 2002.
4 G. Tracy Mehan, Testimony before the Subcommittee on Water Resources and Environment, U.S. House Transportation and Infrastructure Committee, February 2009. http://transportation.house.gov/hearings/ hearing.aspx.

Hazardous Waste
Redevelopment of brownfields sites over the past five years generated an estimated 191,338 new jobs and $408 million annually in extra revenues for localities. In 2008, however, there were 188 U.S. cities with brownfields sites awaiting cleanup and redevelopment. Additionally, federal funding for “Superfund” cleanup of the nation’s worst toxic waste sites has declined steadily, dropping to $1.08 billion in 2008, its lowest level since 1986.
Water and environment

www.asce.org/reportcard
Water and environment
33
A = ExceptionalB = GoodC = MediocreD = PoorF = Failing
AMERICA’SINFRASTRUCTURE G.P.A.
33
rEauthorizE federal Superfund taxes on chemicals, petroleum, and corporations or create another federal funding mechanism to revive the Hazardous Substance Superfund cleanup program and remove the cost of cleanup from the general fund;
implEmEnt legislation—incentive programs, for example—that considers environmental costs and encourages the reduction of hazardous waste at the source and the design of reuse programs;
Enact the Brownfields Revitalization and Environmental Restoration Act to help localities redevelop brownfield sites;
continuE to fund existing federal programs to finance the revitalization of America’s brownfields;
crEatE a Brownfields Redevelopment Action Grant program within the Environmental Protection Agency to provide investment funds for local governments that would allow private investments to be leveraged in order to help preserve farmland and open spaces.
Facts About HAzARDouS WASTE www.asce.org/reportcard
DHAzARDoUS WAStE
ESTIMATED 5-YEAR FUNDING REQUIREMENTS FOR HazarDous waste anD soliD waste
Total investment needs $77 billion
Estimated spending$33.6 billion
Projected shortfall$43.4 billion
34 2009 Report Card for America’s Infrastructure www.asce.org/reportcard
ConDitionS
SuperfundSince Congress enacted the Compre-hensive Environmental Response, Com-pensation and Liability Act (CERCLA or Superfund) in December 1980, correc-tive action has been taken at thousands of contaminated sites across the country. However, nearly 30 years of federal atten-tion to cleaning up contaminated sites has done little to reduce the problem. As of November 2008, 1,255 sites were listed on the National Priorities List (NPL), down only slightly from 1,273 sites in 2004, and another 9,957 sites were awaiting evalua-tion for possible listing.3
While the number of sites remains relatively constant, federal funding dur-ing the last 20 years has systematically decreased. When it was enacted, CERCLA established the Superfund Trust Fund, which was funded by a corporate envi-ronmental income tax and excise taxes on petroleum and specified chemicals. The trust fund received approximately $1.5 billion per year before the legisla-tive authority authorized to collect the taxes expired on December 31, 1995. While there has been some interest in reinstat-ing the taxes, there has been little legisla-tive action. Superfund cleanup is currently funded through the ongoing appropria-tions process.4
Between fiscal years 1981 and 2005 Congress appropriated $29.3 billion to aid in the cleanup of hazardous waste sites under Superfund. Billions more were
appropriated to clean up leaking under-ground storage tanks and brownfields sites. The states have also contributed bil-lions to hazardous-waste cleanups. Even as the need has grown, annual congres-sional appropriations for Superfund have steadily declined in recent years after topping $2 billion in fiscal year 1998. The appropriation for both fiscal years 2007 and 2008 was $1.08 billion, the low-est level since fiscal year 1986.2 Higher funding levels have been proposed in the last two years but have not been enacted because of incomplete congressional appropriations processes, which result in the same level of funding being carried on from the previous year.
The Environmental Protection Agen-cy’s (EPA) 2004 report Cleaning up the Nation’s Wastes Sites estimated that as many as 350,000 contaminated sites will require cleanup during the next 25 years. Assuming that current regulations and practices remain the same, it could cost as much as $250 billion to clean up those sites.5 No updated data have been released, but current cleanup costs could be much higher when inflation is taken into account.
Meanwhile, the pace of cleanups is slowing. For much of the 1990s the EPA averaged more than 70 construction-complete sites per year. However, since 2000 the number of newly completed sites has decreased dramatically. In fiscal year 2003 there were just 40 NPL sites deemed to be complete, and in 2007 and 2008 the EPA reported that only 24 and 30 sites were completed, respectively.6

Facts About HAzARDouS WASTE 35www.asce.org/reportcard
AUSTIN, Tx ★� Grove Landfill
In 2004, the Rhizome Collective received a $200,000 Brownfields Cleanup Grant from the EPA to remediate and restore the 9.8-acre Grove Landfill site. The site included a former landfill, which was open from 1967 to 1970 and then subjected to illegal dumping for approximately 15 years following its closure. Subsequent tests revealed the presence of harmful chemicals and other materi-als. Of Austin’s 656,562 residents at the time, 39,105 lived in the area surrounding the Grove Landfill site. The collective implemented a green remediation strategy for the cleanup, which included salvaging wood scraps and concrete to be used for erosion control, chipping wood to create mulch for recreational trails, recy-cling 31.6 tons of metal, salvaging concrete to be used as fill for building infra-structure, and powering equipment with biofuel generators and photovoltaic panels. Following the cleanup, the site was turned into an environmental educa-tion park that promotes sustainable concepts.
BrownfieldsAcross the country, hundreds of thou-sands of former industrial and commer-cial sites potentially containing hazardous waste sit idle awaiting remediation. Most of these abandoned or underutilized facili-ties are in urban areas. Shifts in resources, industries, technical expertise, and wealth are the primary cause for environmental degradation and loss of economic viability. Remediated brownfield sites, however, can provide improvements in health and public safety, environmental benefits, and economic development.
According to a survey by the U.S. Con-ference of Mayors, there were 24,896 brownfield sites awaiting redevelopment in 2008 in 188 cities nationwide. In addi-tion, more than 150 cities had successfully redeveloped 1,578 brownfield sites, return-
More than 150 cities had successfully redeveloped 1,578 brownfield sites, returning more than 10,000 acres to economic productivity in 2007. These actions resulted in $408 million in new municipal revenues in 62 cities and more than 191,338 jobs—a dramatic increase from $90 million and 83,000 jobs in 2004.

FIGURE 3.1 ★ Tax Revenue from Brownfields Redevelopment in Billions of Dollars
SoURCE US Conference of Mayors, Recycling America’s Land: 2008 Brownfields Redevelopment Report
C
B
A
2007
2006
2005
0.0% 0.5% 1.0% 1.5% 2.0% 2.5% 3.0%
n Actual revenue n Conservative estimate n Optimistic estimateThe nation’s mayors estimate that with additional funding for brownfieldsredevelopment, far more tax revenues could be realized.
36 2009 Report Card for America’s Infrastructure www.asce.org/reportcard
ing more than 10,000 acres to economic productivity. These actions resulted in $408 million in new municipal revenues in 62 cities and more than 191,338 jobs—a dramatic increase from $90 million and 83,000 jobs in 2004.1
Of the 188 cities with idle brownfields, 148 reported that a total of 576,373 new jobs and as much as $1.9 billion annually could be generated if the sites were redeveloped.1
The country’s mayors identified insuffi-cient funding, environmental assessment, lack of money for demolition and liability concerns as the leading obstacles to rede-velopment. Currently, 3,282 sites in 150 cities have been “mothballed”—designated by developers or owners as having no chance of redevelopment.1
The pace of cleanups is slowing. For much of the 1990s the EPA averaged more than 70 construction-complete sites per year. However, since 2000 the number of newly completed sites has decreased dramatically.

Facts About HAzARDouS WASTE 37www.asce.org/reportcard
After a century of sitting at the hub of the area’s timber industry, the Sequim Bay Estuary in northwest Washington State suffered from sediment pollu-tion and habitat degradation. After receiving a Brownfields Cleanup Grant from the EPA and partnering with state, local, and private stakeholders, the Jamestown S’Klallam Tribe began restoring the estuary’s natural features as part of its plan to clean up the entire Sequim Bay. The project removed 99 creosote pilings that were used to store timber waiting to be shipped out to sea as well as contaminated soil and solid waste, restoring an 82-acre area to its natural ecosystem. Since the cleanup’s completion in 2005, the area is experiencing increased economic benefits from tourism and fishing.7 Photo courtesy of the Jamestown S’Klallam Tribe.
SEqUIM BAy, WA ★ Sequim Bay Estuary Restoration

38 2009 Report Card for America’s Infrastructure www.asce.org/reportcard
RESiliEnCE
In order to be resilient, brownfield sites must be sustainable, ensuring that needs of both current and future generations are met. Future investments must address innovative technologies, security, and life-cycle maintenance of the sites. A resilience strategy that addresses both disposal and cleanup of existing sites can help improve public perception in accepting the cre-ation and location of new waste disposal facilities.
Decades of industrial activity in a downtown area of Providence contam-inated a seven-acre site with lead, arse-nic, and other hazardous substances. In 2006, the nonprofit educational corporation Meeting Street secured a $200,000 Brownfields Cleanup Grant from the EPA, which paid for site remediation. The group also secured funding from government and private sources to build a new educational facility. The center, built to Leadership in Energy and Envi-ronmental Design (LEED) standards,
includes an elementary school and a middle school as well as special ser-vices for disabled and low-income stu-dents and other amenities available for community use.7 Photo courtesy of the U.S. Environmental Protection Agency.
PRovIDENcE, RI ★� Brownfield cleanup
ConClUSion
Hazardous waste sites across the coun-try hold enormous potential for economic growth and community redevelopment. However, we risk losing access to those benefits if funding is not increased and the pace of remediation is not accelerated. To restore these sites to a safe and usable con-dition, both public and private organiza-tions must work together. ★

Facts About HAzARDouS WASTE 39www.asce.org/reportcard
SoURCES1 U.S. Conference of Mayors, Recycling Ameri-ca’s Land: A National Report on Brownfields Redevelopment Volume VII, January 2008.
2 Budget of the United States Government, Government Printing Office Access: www.gpoaccess.gov/usbudget/browse.html.
3 U.S. Environmental Protection Agency, National Priorities List, U.S.: www.epa.gov/superfund/sites/npl/index.htm.
4 U.S. Congressional Research Service, Superfund Taxes or General Revenues: Future Funding Issues for the Superfund Program, February, 2008.
5 U.S. Environmental Protection Agency, Cleaning up the Nation’s Waste Sites, 2004: www.clu-in.org/download/market/ 2004market.pdf.
6 U.S. Environmental Protection Agency, Superfund National Accomplishments Summary, 2008: www.epa.gov/superfund/accomp/ numbers08.htm.
7 U.S. Environmental Protection Agency, Clean-up Success Story Pages: www.epa.gov/brownfields/success/success_cleanupss.htm.

LEVEES
More than 85% of the nation’s estimated 100,000 miles of levees are locally owned and maintained. The reliability of many of these levees is unknown. Many are more than 50 years old and were originally built to protect crops from flooding. With an increase in development behind these levees, the risk to public health and safety from failure has increased. Rough estimates put the cost at more than $100 billion to repair and rehabili-tate the nation’s levees.
Water and environment

ESTIMATED 5-YEAR FUNDING REQUIREMENTS FOR levees
Total investment needs $50 billion
Estimated spending$1.13 billion
Projected shortfall$48.87 billion
www.asce.org/reportcard
Water and environment
41
A = ExceptionalB = GoodC = MediocreD = PoorF = Failing
AMERICA’SINFRASTRUCTURE G.P.A.
41
aDopt the following recommendations from the 2009 National Committee on Levee Safety:Establish a National Levee Safety Commission;complEtE the National Levee Inventory for both federal and nonfederal levees. The inventory must be regularly updated and maintained; aDopt a hazard potential classification system; crEatE a strong education and outreach program to inform local leaders and residents about the level of protection they can expect from a nearby levee;5
phasE in mandatory purchase of flood insurance with risk-based premiums for structures in areas protected by levees;
incrEasE funding at all levels of government to address structural and nonstructural solutions that reduce risk to people and property. Additionally, investments should be targeted to address life-cycle costs and research;
rEquirE the development and exercising of emergency action plans for levee-protected areas;
EnsurE that operation and maintenance plans cover all elements of the system, recognizing that levees are part of complex systems that also include pumps, interior drainage systems, closures, penetrations, and transitions;
assEss levees using updated hydrology and hydraulic analyses that incorporate the impact of urbanization and climate change, particularly for coastal levees.
Facts About LEVEES www.asce.org/reportcard
D-lEVEES

42 2009 Report Card for America’s Infrastructure www.asce.org/reportcard
ConDition
The state of the nation’s levees has a sig-nificant impact on public safety. Levees are man-made barriers (embankment, floodwall, structure) along a water course constructed for the primary purpose of providing hurricane, storm and flood pro-tection. Levees are often part of complex systems that include not only levees and floodwalls, but also pumps, interior drain-age systems, closures, penetrations, and transitions. Many levees are integral to economic development in the protected community.
Federal levee systems currently provide a six-to-one return on flood damages pre-vented compared to initial building cost.1 Despite this, baseline information has not been systematically gathered through inspections and post-flood performance observations and measurements to iden-tify the most critical levee safety issues, quantify the true costs of levee safety, prioritize future funding, and provide data for risk-based assessments in an efficient or cost-effective manner.
There is no definitive record of how many levees there are in the U.S., nor is there an assessment of the current con-dition and performance of those levees. Recent surveys by the Association of State Dam Safety Officials and the Association of State Floodplain Managers found that only 10 states keep any listing of levees within their borders and only 23 states have an agency with some responsibility for levee safety. The Federal Emergency Management Agency (FEMA) estimates that levees are found in approximately
22% of the nation’s 3,147 counties. Forty-three percent of the U.S. population lives in counties with levees.4 Many of those levees were designed decades ago to pro-tect agricultural and rural areas, not the homes and businesses that are now located behind them.4
In the aftermath of hurricanes Katrina and Rita in 2005, Congress passed the Water Resources Development Act (WRDA) of 2007. The Act required the establishment and maintenance of an inventory of all federal levees, as well as those non-federal levees for which infor-mation is voluntarily provided by state and local government agencies. The inventory is intended to be a comprehensive, geospa-tial database that is shared between the U.S. Army Corps of Engineers (USACE), FEMA, the Department of Homeland Security (DHS), and the states.
While the USACE has begun the inven-tory of all federal levees, to date few states or local agencies have provided any for-mal information, leaving the inventory far from complete. In addition, there is still much to be determined about the con-dition and performance of the nation’s levees, both federal and nonfederal. As of February 2009, initial results from USACE’s inventory show that while more than half of all federally inspected levees do not have any deficiencies, 177, or about 9%, are expected to fail in a flood event. The inventory data collection process is ongoing and these preliminary findings are expected to change as the process con-tinues.1, 6
WRDA 2007 also created a commit-tee to develop for the first time recom-

Facts About LEVEES 43www.asce.org/reportcard
TABLE 4.1 ★ Damages from Flooding in Levee-Related Areas
SoURCE National Committee on Levee Safety
location/year damagesindollars
Midwest 1993 $272,872,070
North Dakota/Minnesota 1997 $152,039,604
Hurricane Katrina 2005 $16,467,524,782
Midwest 2008 $583,596,400
mendations for a national levee safety program. The National Committee on Levee Safety completed its work in Janu-ary 2009 and the panel recommended that improvements in levee safety be addressed through comprehensive and consistent national leadership, new and sustained state levee safety programs, and an align-ment of existing federal programs.1
Often, the risk of living behind levees is not well-known, and the likelihood of flooding is misunderstood. For this rea-son, little focus is placed on measures that the public can take to mitigate their risks. Though the 1% annual chance flood event (“100-year flood”) is believed by many to be an infrequent event, in reality there is at least a 26% chance that it will occur during the life of a 30-year mort-gage. The likely impacts of climate change are expected to increase the intensity and frequency of coastal storms and thereby increase the chance of flooding.5
In 1968, Congress enacted the National Flood Insurance Program (NIFP). One
of the primary purposes of the NFIP was to address the inability of the public to secure privately backed insurance for eco-nomic losses from flooding. The NFIP designated the 1% annual chance event (“100-year flood”) as a special flood haz-ard area in which those holding federally backed mortgages would be required to purchase flood insurance.
Never intended to be a safety stan-dard, the 1% annual chance event became the target design level for many levees because it allowed development to con-
There is no definitive record of how many levees there are in the U.S., nor is there an assessment of the current condition and performance of those levees.

FIGURE 4.1 ★ Likelihood of Levee Failure/Flooding over a 30-year Residential Mortgage
SoURCE National Committee on Levee Safety
0 5 10 15 20
25
26
27
28
29
30
31
32
100 year
200 year
300 year
400 year
500 yearlevel
offl
oodprote
ction
44 2009 Report Card for America’s Infrastructure www.asce.org/reportcard
tinue while providing relief from man-datory flood insurance purchase for homeowners living behind accredited levees. Allowing levees to simply meet the minimum requirements of the NFIP has created an unintentional—and potentially dangerous—flood insurance standard that is now used as a safety standard.
During the past 50 years there has been tremendous development on lands pro-tected by levees. Coupled with the fact that many levees have not been well main-tained, this burgeoning growth has put people and infrastructure at risk—the perceived safety provided by levees has inadvertently increased flood risks by attracting development to the floodplain. Continued population growth and eco-nomic development behind levees is con-sidered by many to be the dominant factor in the national flood risk equation, outpac-ing the effects of increased chance of flood
occurrence and the degradation of levee condition. Unfortunately, lands protected by levees have not always been developed in a manner that recognizes the benefits of the rivers and manages the risk of flooding.
Additionally, in the absence of a com-prehensive levee inventory, there are many uncertainties regarding location, performance, and condition of levees. There has been a lack of formal govern-ment oversight, sufficient technical stan-dards, and effective communication of the risks of living behind a levee, further plac-ing people and property in danger of floods.
Finally, FEMA’s Flood Map Moderniza-tion Program, which remaps floodplains using modern technologies, is resulting in a reexamination of levees throughout the United States to determine if they can still be accredited. Before accrediting a levee, FEMA is requiring many communities to certify that their levees meet the 1% criteria.

Facts About LEVEES 45www.asce.org/reportcard
UNITED STATES ★ National Levee Safety commission
After decades of ignoring the safety and condition of the nation’s levees, the U.S. Congress in 2007 recognized the dangers that a lack of a federal levee safety program posed to the nation. As part of the Water Resources Devel-opment Act, the USACE was charged with developing guidelines for a pro-gram and released its report in January 2009. This, in conjunction with the national levee inventory, is an important first step to protecting lives and property behind the nation’s levees.
cALIFoRNIA ★ Investment in Levees
There are more levees in California than in any other state. The levee systems in California are fragile and subject to the risk of failure. Estimates put the cost of bringing the state’s levees and flood control system up to good condition at $42.2 billion. In February 2006, Governor Arnold Schwarzenegger proclaimed a state of emergency for the California levee system to address the problems. Voters in the state agreed with the need for comprehensive repairs and modernization and approved a multibillion-dollar bond issue to begin the funding process in 2006. Photo courtesy of the California Department of Water Resources, Division of Safety of Dams.

46 2009 Report Card for America’s Infrastructure www.asce.org/reportcard
MISSISSIPPI RIvER ★ Levee Protection
Since 1885, the USACE has been armoring more than 1,000 miles of levees on the Mississippi River to prevent scour and protect the population behind the levee. Over the years, the Corps has developed a process of plating the levees with con-crete mats that prevent erosion. To date, about 95% of the levees under the New Orleans District jurisdiction, which reaches as far north as Cairo, Illinois, have been armored and the bulk of work performed today is maintenance on the work completed in the last century.7 BEloW: USACE mat sinking unit, placing concrete revetment mattresses along the Mississippi in Poydras, Louisiana. Photo courtesy of Angelle Bergeron, New Orleans Correspondent, Engineering News-Record.

Facts About LEVEES 47www.asce.org/reportcard
Flood insurance is one of the most effective ways to limit financial damages in the case of flooding and speed recov-ery of flood damaged communities. Cur-rently, many people who live behind levees do not believe that they need flood insur-ance, believing that they are protected by a levee structure. Requiring the purchase of mandatory flood insurance is intended to increase the understanding that living behind even well-engineered levees has some risk. This may encourage commu-nities to build levees to exceed the 1% annual-chance protection standard that has mistakenly become a target minimum.
RESiliEnCE
Levees serve to protect the public and crit-ical infrastructure and to prevent flood-ing. With increasing development behind existing levees, the risk to public health and safety from failure has increased. To address the current lack of resil-ience in the nation’s levee system, DHS has included levees within the critical infrastructure protection program in an attempt to identify those levees that pres-ent the greatest risk to the nation. DHS has also funded research to increase the robustness of levees—for example, armor-ing the slopes to resist erosion should floodwaters exceed the design elevation—and technologies are currently under study to rapidly repair any breaches that may occur in a levee. To ensure system integrity, future investments must also focus on life-cycle maintenance, research, development of emergency action plans for levee-protected areas, and security.
ConClUSion
Much is still unknown about the condi-tion of the nation’s tens of thousands of miles of levees. The residual risk to life and property behind such structures can-not be ignored. Due to their impact on life and safety issues, and the significant consequences of failure, as well as the financial burden of falling property val-ues behind levees that are not safe and are being decertified, the nation must not delay addressing levee issues. ★
SoURCES1 U.S. Army Corps of Engineers, Summary Information from U.S. Levee Inventory.
2 Lee Bowman and Thomas Hargrove, Scripps Howard News Service, “America’s Neglected Levees Put Millions in Danger,” July, 2008.
3 U.S. Senate Testimony by Gerald Galloway, October 2, 2007.
4 Federal Emergency Management Agency, “The National Levee Challenge: Report of the Interagency Levee Policy Review Committee,” September 2006.
5 National Committee on Levee Safety “Recommendations for a National Levee Safety Program,” January 2009.
6 Peter Eisler, “Army Corps Cracks Down on Flunking Levees,” USA Today, February 24, 2008.
7 Angelle Bergeron “Technique Conquers All as Long-Running Job Nears End,” Engineering News-Record, January 19, 2009.

SOLID WaSte
In 2007, the U.S. produced 254 million tons of municipal solid waste. More than a third was recycled or recovered, representing a 7% increase since 2000. Per capita generation of waste has remained relatively constant over the last 20 years. Despite those successes, the increasing volume of electronic waste and lack of uniform regulations for disposal creates the potential for high levels of hazardous materials and heavy metals in the nation’s landfills, posing a significant threat to public safety.
Water and environment

www.asce.org/reportcard
Water and environment
49
A = ExceptionalB = GoodC = MediocreD = PoorF = Failing
AMERICA’SINFRASTRUCTURE G.P.A.
49
implEmEnt a holistic approach to waste management that reduces the volume of waste landfilled, increases the amount of materials recovered and recycled, and reduces the emissions of greenhouse gasses from landfills;
EncouragE greater use of landfill gas to energy conversion to reduce greenhouse gas emissions and create new energy resources;
opposE legislation that restricts the interstate movement of municipal solid wastes to new regional landfills that meet all federal requirements;
promotE the use of alternative covers and the introduction of non-indigenous liquids and other operational changes to increase the effectiveness of solid-waste landfills;
implEmEnt source reduction policies that call for better design, packaging, and life span of commercial products;
DEvElop national standards to promote proper, effective, and efficient collection and recycling of waste electronics.
Facts About SoLID WASTE www.asce.org/reportcard
c+SoliD WAStE
ESTIMATED 5-YEAR FUNDING REQUIREMENTS FOR HazarDous waste anD soliD waste
Total investment needs $77 billion
Estimated spending$33.6 billion
Projected shortfall$43.4 billion

50 2009 Report Card for America’s Infrastructure www.asce.org/reportcard
ConDitionS
According to the U.S. Environmental Pro-tection Agency (EPA), municipal solid waste (MSW), commonly known as trash or garbage, consists of everyday items from households and businesses that are deposited in landfills. Some landfills, how-ever, do accept such non-MSW as con-struction by-products, wastewater sludge, or other hazardous materials.
Per capita solid waste generation in 2007 was 4.62 pounds per person per day, a slight decline from 4.65 pounds in 2000.1 While per capita waste production has been fairly constant, MSW continues to increase with population growth. In 2007, the U.S. produced 254 million tons of municipal solid waste of all types—an increase from 239 million tons in 2000,
according to the EPA. This included MSW that was generated by households, busi-nesses, construction sites and other sources.1
In 1986, there were 7,683 municipal solid waste landfills in the U.S. In Octo-ber 1991, the EPA adopted stringent new federal regulations for landfill design and operation to reduce groundwater contami-nation from hazardous materials disposed of in landfills. By 1992, the number of U.S. landfills had dropped to 5,345. By 1995, the EPA landfill census recorded only 3,581 facilities. In 2007, the agency counted 1,754 landfills—a decline of 79% within two decades.1 According to the EPA, the nation’s disposal capacity has remained relatively constant because new landfills are much larger than in the past. In 2006, the National Solid Wastes Management
San Francisco’s food scrap diversion program—the first program of its kind in a large city—annually diverts more than 100,000 tons of primarily food scrap source-separated compostable material from the landfill for a variety of beneficial programs. The food scrap diversion program’s commercial and agricultural uses include edible food redistribution, animal feed, on-site and centralized composting, conversion to energy, and grease to biodiesel.
Photo courtesy of Norcal Waste.
SAN FRANcISco, cA ★ Food Scraps Diversion Program

Facts About SoLID WASTE 51www.asce.org/reportcard
Association estimated that states have dis-posal capacity for another 20 years.2
Of the 254 million tons of solid waste generated in 2007, 85 million tons, or 33%, were recycled or composted compared to 30.1% in 2000; 32 million tons, or 13%, were burned in waste-to-energy (WTE) plants; and 137 million tons, or 54%, went into landfills compared to 55.3% in 2000.1
While the improvement in recycling rates is encouraging news, such issues as the improper disposal of electronic equipment and the emission of green-house gasses from landfills pose continued challenges.
The EPA estimates that in 2005 waste electrical and electronic equipment (WEEE) amounted to approximately two
FIGURE 5.1 ★ Percent of Municipal Solid Waste that is Recycled: 1960–2007
5%
10%
15%
20%
25%
30%
35%
SoURCE EPA Facts and Figures about Municipal Solid Waste, 2008
million tons, most of which was discarded in landfills. Only between 345,000 and 379,000 tons were recycled.3 End-of-life electronics may contain such materials as lead that are hazardous to the envi-ronment when not handled and disposed of properly. No national standard on the recycling of WEEE exists, and uncoor-dinated state regulations can discourage consumers from recycling.4
In 2006, 23% of human-related meth-ane gas emissions came from MSW land-fills, making landfills the second largest producer of methane.5 The methane gas emitted from landfills can be captured and transformed into usable energy. Despite this opportunity, at the end of 2007 only 457 landfill gas (LFG) energy projects

52 2009 Report Card for America’s Infrastructure www.asce.org/reportcard
were operational. These LFG programs produce approximately 11 billion kilowatt hours of electricity per year and deliver 236 million cubic feet per day of gas to direct-use applications. The EPA esti-mates that more than 500 additional sites are good candidates for energy conversion projects, but high start-up costs inhibit expansion of this process.5
RESiliEnCE
Although landfills are dependent on energy and road infrastructure, as a sys-
FIGURE 5.2 ★� components of Municipal Solid Waste (254 million tons generated in 2007)
%ofmsW
Paper, paper board 32.7
Yard trimmings 12.8
Food scraps 12.5
Plastics 12.1
Metals 9.2
Rubber, leather, textiles 7.6
Wood 5.8
Glass 5.3
Other 3.2
Paper, paper board
Rubber, leather, textiles
GlassOther Plastics
MetalsWood
Yard trimmings
Food scraps
tem, solid waste disposal facilities remain resilient. However, the impacts of such landfill failures as air and groundwater pollution on surrounding neighborhoods are apparent but not well quantified, and the time required for restoration is often lengthy and costly. Additionally, landfills can play an important role during recov-ery operations, but without adequate dis-posal options cleanup and recovery efforts may be hindered.
Future investments must consider new technologies and behavioral changes focused on energy conversion, recycling, waste reduction, and increased efficiency.
SoURCE EPA Facts and Figures About Municipal Solid Waste, 2008

Facts About SoLID WASTE 53www.asce.org/reportcard
oRANGE coUNTy, FL ★ orange county Landfill
The Orange County Landfill, the third largest landfill in Florida, initiated design activities for a landfill gas-to-energy project in 1998. The electricity generated from the plant powers an estimated 13,000 homes and reduces methane emissions by nearly 31,000 tons per year at full capacity. Orange County stands to make $400,000 per year for rights to the landfill gas.5 Photos courtesy of Debra R. Reinhart, Ph.D., P.E., BCEE, F.ASCE.

54 2009 Report Card for America’s Infrastructure www.asce.org/reportcard
ConClUSion
Innovative technologies and recycling efforts have been successful in improving the safety, sustainability, and efficiency of the nation’s waste disposal systems. The lack of long term strategies to deal with increased amounts of electronic waste and under-use of waste to energy practices, however, indicates the need for continued research and development of new policies and management practices. ★
SoURCES1 U.S. Environmental Protection Agency, Municipal Solid Waste Generation, Recycling, and Disposal in the United States: Facts and Figures for 2006, November 2008.
2 National Solid Wastes Management Associa-tion, What is a Solid Waste Landfill, November 2006. http://wastec.isproductions.net/ webmodules/webarticles/anmviewer.asp?a=1127
3 U.S. Environmental Protection Agency, Statis-tics on the Management of Used and End-of-Life Electronics. www.epa.gov/epawaste/conserve/materials/ecycling/manage.htm
4 Government Accountability Office, Electronic Waste: EPA Needs to Better Control Harmful U.S. Exports through Stronger Enforcement and More Comprehensive Regulation, August, 2008.
5 U.S. Environmental Protection Agency, Landfill Methane Outreach Program, Basic Information. www.epa.gov/outreach/lmop/ overview.htm#methane
Of the 254 million tons of solid waste generated in 2007, 85 million tons, or 33%, were recycled or composted compared to 30.1% in 2000; 32 million tons, or 13%, were burned in waste-to-energy (WTE) plants; and 137 million tons, or 54%, went into landfills compared to 55.3% in 2000.

Facts About SoLID WASTE 55www.asce.org/reportcard
DETRoIT, MI ★ Greater Detroit Resource Recovery Facility
Detroit’s Resource Recovery Plant began operating in July 1989 and is currently one of the largest waste-to-energy facilities in the country in terms of capacity—the facility is per-mitted to process 4,000 tons of munic-ipal solid waste per day. Everyday waste is processed into refuse-derived fuel (RDF), which is burned in stoker-fired boilers to yield steam for heating, cooling, and electricity. Approximately 3,300 tons of municipal solid waste is processed each day, yielding 3,100 tons of RDF. The facility produces 720,000 pounds of steam per hour, which is used to generate up to 68 megawatts of electricity. The resulting energy prod-ucts are then sold to Detroit Edison Corporation.
Between July 1, 1989, and June 30, 1999, the facility processed 7,572,000 tons of municipal solid waste—enough waste to fill the interior of the Detroit Tigers’ baseball stadium approxi-mately 40 times. Photos courtesy of the Greater Detroit Resource Recovery Authority.

WAsTEWATER
Aging systems discharge billions of gallons of untreated wastewater into U.S. surface waters each year. The Environmental Protection Agency estimates that the nation must invest $390 billion over the next 20 years to update or replace existing systems and build new ones to meet increasing demand.
Water and environment

www.asce.org/reportcard
Water and environment
57
A = ExceptionalB = GoodC = MediocreD = PoorF = Failing
AMERICA’SINFRASTRUCTURE G.P.A.
57
incrEasE funding for water infrastructure system improvements and associated operations through a comprehensive program;
crEatE a Water Infrastructure Trust Fund to finance the national shortfall in funding of infrastructure systems under the Clean Water Act and the Safe Drinking Water Act, including stormwater management and other projects designed to improve the nation’s water quality;
rEtain traditional financing mechanisms, such as appropriations from general treasury funds, issuance of revenue bonds and tax exempt financing at state and local levels, public-private partnerships, state infrastructure banks, and user fees on certain consumer products;
ExpanD innovative financing mechanisms, including broad-based environmental restoration taxes.
Facts About WASTEWATER www.asce.org/reportcard
D-WAStEWAtER
ESTIMATED 5-YEAR FUNDING REQUIREMENTS FOR Drinking water anD wastewater
Total investment needs $255 billion
Estimated spending$146.4 billion
Projected shortfall$108.6 billion
58 2009 Report Card for America’s Infrastructure www.asce.org/reportcard
ConDitionS
Since 1972, Congress has directly invested more than $77 billion in the construc-tion of publicly owned treatment works and their related facilities. State and local governments have spent billions more over the years. Total nonfederal spend-ing on sewer and water between 1991 and 2005 was $841 billion. Nevertheless, the physical condition of many of the nation’s 16,000 wastewater treatment systems is poor due to a lack of investment in plants, equipment, and other capital improve-ments over the years.
In 2008, the U.S. Environmental Pro-tection Agency (EPA) reported that the total investment needs of America’s pub-licly owned treatment works as of January 1, 2004, were $202.5 billion. This reflects an increase of $16.1 billion (8.6%) since the previous analysis was published in Janu-ary 2004.2
In 2002, the Congressional Budget Office (CBO) estimated that for the years 2000 to 2019, annual costs for investment would need to be between $13 billion and $20.9 billion for wastewater systems.4
Many systems have reached the end of their useful design lives. Older systems are plagued by chronic overflows during major rainstorms and heavy snowmelt and are bringing about the discharge of raw sewage into U.S. surface waters. The EPA estimated in August 2004 that the volume of combined sewer overflows dis-charged nationwide is 850 billion gallons per year. Sanitary sewer overflows, caused by blocked or broken pipes, result in the
release of as much as 10 billion gallons of raw sewage yearly, according to the EPA.2
Federal funding under the Clean Water Act State Revolving Loan Fund (SRF) pro-gram has remained flat for more than a decade. Federal assistance has not kept pace with the needs, yet virtually every authority agrees that funding needs remain very high. The U.S. must invest an additional $181 billion for all types of sew-age treatment projects eligible for fund-ing under the Act, according to the most recent needs survey estimate by the EPA and the states, completed in August 2003.4
In September 2002, the EPA released a detailed gap analysis, which assessed the difference between current spending for wastewater infrastructure and total funding needs. The EPA Gap Analysis estimated that over the next two decades the U.S. must spend nearly $390 billion to replace existing wastewater infrastruc-ture systems and build new ones. The total includes money for some projects not currently eligible for federal funds, such as system replacement, which are not reflected in the EPA State Needs Survey.5
According to the Gap Analysis, if there is no increase in investment, there will be a roughly $6-billion gap between current annual capital expenditures for waste-water treatment ($13 billion annually) and projected spending needs. The study also estimated that if wastewater spend-ing increases by only 3% per year, the gap would shrink by nearly 90% (to about $1 billion annually).
The CBO released its own gap analysis in 2002, in which it determined that the gap for wastewater ranges from $23 billion

Facts About WASTEWATER 59www.asce.org/reportcard
to $37 billion annually, depending on vari-ous financial and accounting variables.4
RESiliEnCE
Construction, operation and maintenance, and reconstitution of service of waste-water infrastructure is expensive, and the monetary and societal costs incurred when this infrastructure fails are high. Aging, underdesigned, or inadequately maintained systems discharge billions of gallons of untreated wastewater into U.S. surface waters each year.
The nation’s wastewater systems are not resilient in terms of current ability to properly fund and maintain, prevent fail-ure, or reconstitute services. Additionally,
Sanitary sewer overflows, caused by blocked or broken pipes, result in the release of as much as 10 billion gallons of raw sewage yearly, according to the EPA.
The City of San Diego imports approx-imately 90% of its water supply. To meet future water demands and decrease dependence on imported water, the city constructed the North City Water Reclamation Plant to pro-vide reclaimed water for irrigation, landscaping and industrial use. This state-of-the-art facility can treat up to 30 million gallons of wastewater per day, and distribute the reclaimed water to customers through 79 miles of distribution pipelines. Reclaimed pipelines, sprinkler heads, meter boxes and other irrigation equipment
are color-coded purple to distinguish reclaimed water pipes from drinking water systems. The treatment facility is powered by methane piped from the Miramar Landfill and MBC digesters. Photo courtesy of the City of San Diego.
SAN DIEGo, cA ★ North city Water Reclamation Plant

60 2009 Report Card for America’s Infrastructure www.asce.org/reportcard
the interdependence on the energy sec-tor contributes to the lack of system resil-ience that is increasingly being addressed through the construction of dedicated emergency power generation at key waste-water utility facilities.
Future investments must focus on updating or replacing existing systems as well as building new ones to meet increasing demand; on improved opera-tions processes, including ongoing over-sight, evaluation, and asset management on a system wide basis; and watershed approaches to look more broadly at water resources in a coordinated systematic way.
ConClUSion
If the nation fails to meet the investment needs of the next 20 years, it risks revers-
ing public health, environmental, and eco-nomic gains of the past three decades.
The case for increased federal invest-ment is compelling. Needs are large and unprecedented; in many locations, local sources cannot be expected to meet this challenge alone and, because waters are shared across local and state boundaries, the benefits of federal help will be dis-seminated throughout the nation. Clean and safe water is no less a national prior-ity than are national defense, an adequate system of interstate highways, and a safe and efficient aviation system. Many other highly important infrastructure programs enjoy sustainable, long-term sources of federal backing, often through the use of dedicated trust funds; under current pol-icy, water and wastewater infrastructure do not. ★
TABLE 6.1 ★ Design Life of Water Systems
components yearsofdesignlife
Collections 80–100
Treatment Plants—Concrete Structures 50
Treatment Plants—Mechanical and Electrical 15–25
Force Mains 25
Pumping Stations—Concrete Structures 50
Pumping Stations—Mechanical and Electrical 15
Interceptors 90–100
SoURCE Clean Water and Drinking Water Infrastructure Gap Analysis Report, p. 11, EPA 816-R-02-020, September 2002

Facts About WASTEWATER 61www.asce.org/reportcard
MARySvILLE, WA ★ Pervious Paving
The City of Marysville, Washington, installed pervious pav-ing stones instead of traditional asphalt at its Ash Avenue park-and-ride facility. Besides making the stop a much more attractive place to catch the bus, the paving stones allow stormwater to pass through and soak into the ground. The project also allowed for more parking spaces to be built because a stormwater pond was no longer needed. Photo courtesy of Mutual Materials and UNI-GROUP U.S.A.

62 2009 Report Card for America’s Infrastructure www.asce.org/reportcard
About a third of the District of Colum-bia is served by a single pipe that car-ries both wastewater and stormwater runoff. During dry weather, wastewa-ter flows to the Blue Plains treatment plant. But during rain events, both the stormwater and wastewater from the Anacostia area flow in the same pipe, which is not big enough to handle the flows of very large storms. To pre-vent the combined water from backing up into homes and streets, the com-bined sewer system dumps the mix-ture into the Anacostia River. Though the untreated wastewater is diluted by stormwater, allowing this mixture to enter the river is no longer considered an acceptable solution.
To improve the health of the Ana-costia River, the Washington Area Sewer Authority (WASA) is working with homeowners and businesses to separate their combined pipe into two separate pipes. DC WASA performs the separation at no charge to custom-ers. Photo courtesy of Washington Area Sewer Authority.
WASHINGToN, D.c. ★ Sewer Separation Project
SoURCES1 U.S. Conference of Mayors, Who Pays for the Water Pipes, Pumps and Treatment Works? —Local Government Expenditures on Sewer and Water (1991–2005), 2007, www.usmayors.org/urbanwater/07expenditures.pdf.
2 U.S. Environmental Protection Agency, Clean Watersheds Needs Survey 2004 Report to Con-gress, January 2008, www.epa.gov/owm/mtb/cwns/2004rtc/toc.htm.
3 U.S. Environmental Protection Agency, Clean Watersheds Needs Survey 2000 Report to Congress, January 2004, www.epa.gov/owm/mtb/cwns/2000rtc/toc.htm.
4 Congressional Budget Office, Future Investment in Drinking Water and Wastewater Infrastructure, May 2002, www.cbo.gov/ftpdocs/34xx/doc3472/Water.pdf.
5 U.S. Environmental Protection Agency, The Clean Water and Drinking Water Infrastructure Gap Analysis, September 2002, www.epa.gov/OWM/gapreport.pdf.
6 G. Tracy Mehan, Testimony before the Subcommittee on Water Resources and Envi-ronment, U.S. House Transportation and Infrastructure Committee, February 2009, http://transportation.house.gov/hearings/ hearing.aspx.

Facts About WASTEWATER 63www.asce.org/reportcard
In Philadelphia; Chicago; Portland, Oregon; and Milwaukee, water man-agers are trying to implement green infrastructure solutions or low-impact development practices. A number of these techniques are in use, including green roofs, rain barrels, rain gardens, vegetated curb extensions, porous pavement, urban reforestation, and even constructed or restored wetlands or wet meadows. The aim of these practices is to retain water on site, allowing for infiltration and evapo-transpiration, thereby reducing runoff and allowing for removal of unwanted pollutants.4
Increasingly, communities are rely-ing on the “natural infrastructure” as a least-cost approach to protecting surface water quality, which can gen-
erate multiple benefits such as habitat preservation, carbon sequestration, and aesthetics. Utilizing such green or natural infrastructure means less hard or gray infrastructure and reduced energy intensity, too. This trend is spreading with respect to wastewa-ter and stormwater management in more and more utilities and communi-ties across the country. This is espe-cially true with respect to “urban wet weather” issues, which involve CSOs, stormwater runoff, and conventional point-source or end-of-the-pipe discharges. Increasingly, communities are meeting these challenges through a watershed approach which employs green or nonstructural approaches in tandem with traditional hard or gray infrastructure.
UNITED STATES ★ Natural Infrastructure
The WARN system created a network of water and wastewater utilities to respond to and recover from emergencies. The purpose of a WARN is to pro-vide a response method for water and wastewater utilities that have sustained or anticipate damages from natural or human-caused incidents. WARN helps utili-ties communicate so they can provide and receive emergency aid and assistance in the form of personnel, equipment, materials, and other associated services as necessary from other water and wastewater utilities. The program began in early 2006 and by September 2008, 31 states were participating in WARN.
UNITED STATES ★ Water and Wastewater Agency Response Networks (WARN)

AviAtion
Despite surging oil prices, volatile credit markets, and a lagging economy, the Federal Aviation Administration predicts 3% annual growth in air travel. Travelers are faced with increasing delays and inadequate conditions as a result of the long overdue need to modernize the outdated air traffic control system and the failure to enact a federal aviation program.
tranSPortation
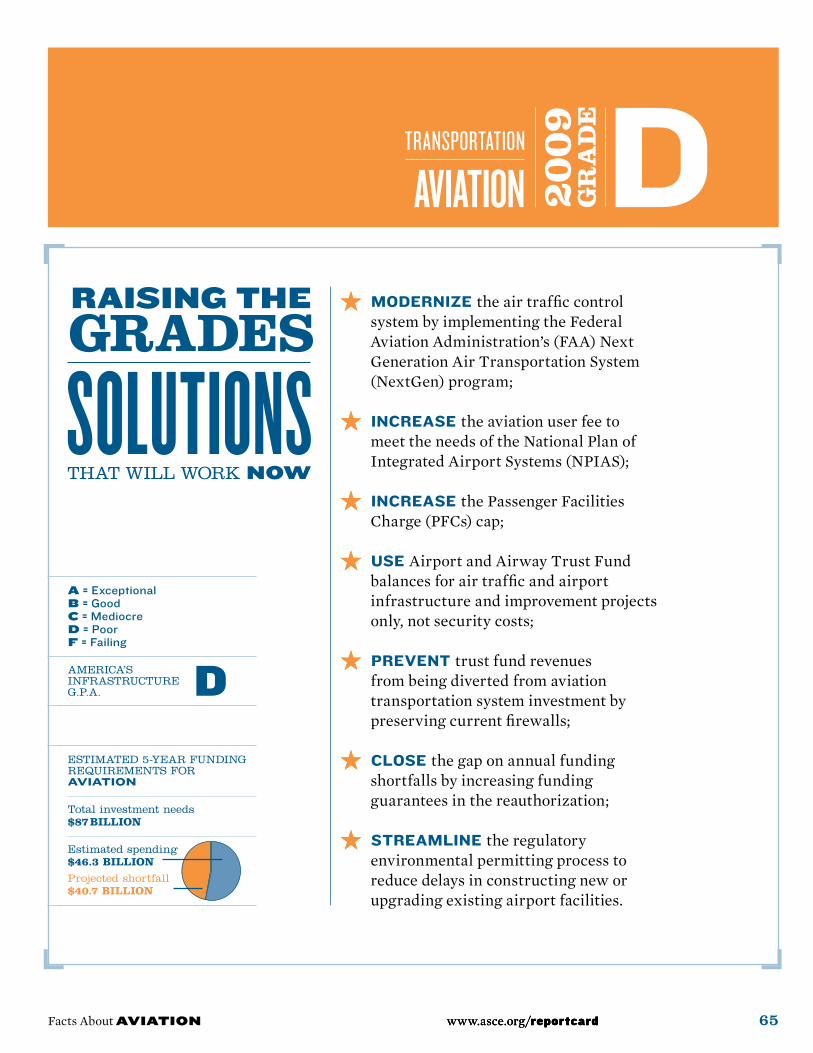
A = ExceptionalB = GoodC = MediocreD = PoorF = Failing
AMERICA’SINFRASTRUCTURE G.P.A.
www.asce.org/reportcard
tranSPortation
65www.asce.org/reportcard
moDErnizE the air traffic control system by implementing the Federal Aviation Administration’s (FAA) Next Generation Air Transportation System (NextGen) program;
incrEasE the aviation user fee to meet the needs of the National Plan of Integrated Airport Systems (NPIAS);
incrEasE the Passenger Facilities Charge (PFCs) cap;
usE Airport and Airway Trust Fund balances for air traffic and airport infrastructure and improvement projects only, not security costs;
prEvEnt trust fund revenues from being diverted from aviation transportation system investment by preserving current firewalls;
closE the gap on annual funding shortfalls by increasing funding guarantees in the reauthorization;
strEamlinE the regulatory environmental permitting process to reduce delays in constructing new or upgrading existing airport facilities.
Facts About AVIATIoN www.asce.org/reportcard
DAViAtion
ESTIMATED 5-YEAR FUNDING REQUIREMENTS FOR aviation
Total investment needs $87 billion
Estimated spending$46.3 billion
Projected shortfall$40.7 billion

66 2009 Report Card for America’s Infrastructure www.asce.org/reportcard
ConDitionS
Air travel in the U.S. rebounded from its post-September 11, 2001, downturn and reached new highs in both domestic and international travel. Enplanements on U.S. carriers for both domestic and inter-national flights totaled 669.2 million in 2000. By 2006, that number had risen to 744.7 million; in 2007 alone, the number increased an additional 25 million to 769.6 million. A sharp increase in the cost of aviation fuel, followed by the recent eco-nomic downturn, however, has slowed the demand for air travel. The number of domestic and international passen-gers on U.S. airlines in October 2008 was 7.1% lower than in October 2007. From January to October of 2008 there were 630.1 million enplanements, a decrease of 2.6% from the same 10-month period in 2007.4 It is estimated that air travel will increase in 2009 though, the latest fore-cast (March 2008) projecting an annual increase of 2.9% in domestic U.S. com-mercial enplanements and 4.8% in inter-
national enplanements—a system increase total of 3%.2
The Federal Aviation Administration (FAA) has a goal of ensuring that no less than 93% of the runways at National Plan of Integrated Airport Systems (NPIAS) airports are maintained in good or fair condition. That goal was exceeded in 2007: 79% were rated good, 18% were rated fair, and only 3% were rated poor. However, there were 370 runway incur-sions in 2007—up from 330 in 2006.1 Due to the FAA’s 2008 change in definition for a runway incursion, this number is likely to increase further. A runway incursion is defined as an incident involving the incor-rect presence of an aircraft, vehicle, per-son, or object on the ground that creates a collision hazard for an aircraft taking off, intending to take off, landing, or intending to land.
Every year the industry incurs avoid-able air traffic control delays that, while beyond the immediate control of air traffic control personnel, waste hundreds of mil-lions of dollars. In 2007, airlines reported
WASHINGToN, D.c. ★ Washington-Dulles International Airport
Washington-Dulles International Airport is the nation’s 16th busiest airport, with more than 419,127 takeoffs and landings per year and more than 12 million passengers. The new runway, which opened in 2008, is equipped with a high-speed exit taxiway and can handle larger planes, such as the Airbus A380, will see more than 100,000 takeoffs and landings per year. This marks Dulles’s first new runway since 1962, when the airport opened for business.

Facts About AVIATIoN 67www.asce.org/reportcard
TABLE 7.1 ★� Top 10 U.S. Passenger Airports, 2006–2007
rank location airport
1 Atlanta, GA Hartsfield–Jackson Atlanta International
2 chicago, IL Chicago O’Hare International
3 Los Angeles, cA Los Angeles International
4 Fort Worth, Tx Dallas/Fort Worth International
5 Denver, co Denver International
6 New york, Ny John F. Kennedy International
7 Las vegas, Nv McCarran International
8 Phoenix, AZ Phoenix Sky Harbor International
9 Houston, Tx George Bush Intercontinental/Houston
10 Newark, NJ Newark Liberty International
SoURCE U.S. Department of Transportation, Bureau of Transportation Statistics, 2008
an on-time arrival record of 73.3%, the second worst in history; the worst record—72.6%—was recorded in 2000.1 The air traffic control system remains outdated and inefficient, and modernization efforts continue to meet with delay. The FAA is seeking to implement its NextGen sys-tem; however, drawn-out congressio-nal reauthorization of the FAA funding mechanism is causing delay and confusion among airport sponsors across the nation.
The old airline business model is being replaced by a newer low-fare, low-cost model. Between 2000 and 2006, U.S. air-lines’ domestic operations reported com-bined operating and net losses of $27.9 and $36.2 billion, respectively. However, in 2007—for the first time since 2000—the
airline industry posted a $5.8-billion net profit. And, cargo carriers continue to report strong results with net profits of $1.4 billion.1 While the new airline oper-ating model along with more fuel and operationally efficient aircraft are being introduced into the National Airspace System (NAS), commercial and corpo-rate aircraft operators cannot take advan-tage until the FAA and other sponsoring agencies implement policies that reduce delays and invest in emerging technolo-gies and infrastructure that increase capacity and safety. In order to meet these challenges, the NAS must find ways to become more flexible and ensure that the capital required to meet these infrastruc-ture needs is available. There is general

68 2009 Report Card for America’s Infrastructure www.asce.org/reportcard
SEATTLE / TAcoMA, WA ★ Sea-Tac International Airport
Sea-Tac Airport, in the top 10% of the nation’s busiest airports, experiences delays due to low visibility conditions approximately 44% of the year. How-ever, its two existing runways were too close to allow for two streams of traffic to land in such conditions. The new, $1.1-billion runway, which does allow for two streams of traffic, was designed to reduce arrival delays by as much as 80%, save millions of dollars in wasted fuel, and prevent the release of thousands of tons of greenhouse gases. Photo courtesy of Sea-Tac Airport.
cHIcAGo, IL ★ chicago-o’Hare International Airport
In 2004, the FAA imposed flight caps on Chicago O’Hare International Air-port due to extreme delays that were affecting the airport’s operations. The new runway—the airport’s sev-enth and its first since 1971—is part of a larger, $15-billion expansion project. Designed to handle planes as large as the Boeing 747, the runway will pri-marily be used for arrivals in inclem-ent weather. The new runway, which has prompted the flight cap to be lifted, will reduce delays by as much
as 40% and allow for an additional 52,000 flights per year, according to the FAA. Photo courtesy of the City of Chicago.

consensus that maintaining the integrity of the NAS requires continuous updates and a steady and predictable flow of capi-tal. The FAA estimates a five-year need of $49.7 billion for the years 2009–2013.1 The most recent estimates from the Airports Council International’s Airport Capital Development Costs 2007–2011 noted total U.S. airport capital development costs as $87.4 billion over five years, or $17.5 billion per year (adjusted for inflation of 4%).7
Generally, there are four sources of funding used to finance airport infrastruc-ture and development: airport cash flow; revenue and general obligation bonds;
federal/state/local grants, including the Airport Improvement Program (AIP) grants; and passenger facility charges (PFCs). Access to these funding sources varies widely among airports. Since fis-cal year 2001, AIP grants have exceeded $3 billion annually, and for the past five years, PFC collections have exceeded $2 billion annually. Together, AIP grants and PFC collections account for 40% of annual U.S. airport capital spending. Since 1990, annual funding for airport capital needs has been in the range of $5.5 to $7.3 bil-lion.1 Since congressional authorization for the AIP expired in September of 2007,
Facts About AVIATIoN 69www.asce.org/reportcard
TABLE 7.2 ★� Top 10 U.S. cargo Airports, 2006–2007
rank location airport
1 Anchorage, AK Ted Stevens Anchorage International
2 Memphis, TN Memphis International
3 Louisville, Ky Louisville International
4 Miami, FL Miami International
5 Los Angeles, cA Los Angeles International
6 Indianapolis, IN Indianapolis International
7 New york, Ny John F. Kennedy International
8 chicago, IL Chicago O’Hare International
9 Newark, NJ Newark Liberty International
10 oakland, cA Metropolitan Oakland International
SoURCE U.S. Department of Transportation, Bureau of Transportation Statistics, 2008

the program has operated under a series of continuing resolutions, making long-term planning difficult.
An additional challenge to airport capacity-building is the fragmented nature of airport ownership. Local gov-ernments and the private sector repre-sent the majority of owners and investors in air transportation infrastructure, and they tend to focus primarily on their own needs, and only secondarily on national, systemwide concerns. According to the NPIAS, there are 3,356 existing publicly owned, public-use airports in the United States, with an additional 55 proposed. There are also 522 commercial service air-ports, and of these, 383 have more than 10,000 annual enplanements and are classified as primary airports.1
RESiliEnCE
Aviation’s rapid movement of goods and services, as well as its support of tourism, is critical to the economic vitality of the nation, and air travel is often chosen over other modes of transportation on the basis of convenience, time, and cost. Thus, the consequence of failure is severe. Additionally, shifts in demand corre-sponding to threats, delays, and fuel pric-ing contribute to the volatility of the industry. In a highly complex system like aviation, resilience is not simply a matter of technical or facility upgrades. Future investments must consider dynamic sys-tem changes, security, capacity, life-cycle facility maintenance, technology innova-tions, and redundancy.
70 2009 Report Card for America’s Infrastructure www.asce.org/reportcard
FIGURE 7.1 ★� cause of National Aviation System Delays
%ofdelays
Weather 67.98
Volume 22.74
Equipment 0.95
Closed Runway 5.81
Other 2.52
Weather
Volume
Equipment
Closed Runway
Other
SoURCE U.S. Department of Transportation, Bureau of Transportation Statistics, 2008

Facts About AVIATIoN 71www.asce.org/reportcard
LoS ANGELES, cA ★ center Taxiway, Los Angeles International Airport
In 1991, Los Angeles International Airport (LAX) experienced one of the worst runway accidents in the nation’s history—between a US Airways 737 and a Sky-West Metroliner. Since then, LAX has consistently held some of the nation’s high-est annual runway incursion rates, several of which have been classified by the FAA as having had serious potential to cause an accident. Completed on budget and four days ahead of schedule, the new center taxiway was designed to improve safety and reduce the number of runway incursions by acting as a buffer between the two southern runways. After landing, pilots will hold planes on the taxiway for clearance to cross the inner runway. Photo courtesy of LAWA-LAX (Los Angeles World Airports/Los Angeles International Airport).

72 2009 Report Card for America’s Infrastructure www.asce.org/reportcard
NEWARK, NJ ★� Next Generation Ground Based Augmentation System, Newark Liberty International Airport
In December 2008, Newark Liberty International Airport, in collabora-tion with the Port Authority of New York and New Jersey, the FAA, Continental Airlines, and Honeywell International, announced that it would be the nation’s first major hub to test a new satellite navigation technology designed to reduce flight delays. Replacing existing radar technology, the Ground Based Augmentation System (GBAS) uses data from ground-based antennas and satellites, which prevents the signal from being blocked by mountains, buildings, and other obstacles. This eliminates the need for planes to take a straight-line approach to landing, thus increasing efficiency and navigational precision. The new GBAS system will be installed at the airport and Continental will outfit 15 of its planes with the new equipment and train pilots in using the new system. The program is expected to be operational by the end of 2009. Photo courtesy of the Port Authority of New York and New Jersey.

ConClUSion
Just as the industry was recovering from the events of September 11, 2001, it was dealt another blow from the impact of surging oil prices, volatile credit mar-kets, and a lagging economy. In the face of recent FAA estimates that predict an annual 3% growth in air travel, the continuing delays in reauthorization of federal programs and updating of the out-dated air traffic control system threaten the system’s ability to meet the needs of the American people and economy. To remain successful, the nation’s aviation systems need robust and flexible federal leadership, a strong commitment to air-port infrastructure, and the rapid deploy-ment of NexGen. ★
SoURCES1 Federal Aviation Administration, U.S. Depart-ment of Transportation, Report to Congress National Plan of Integrated Airport Systems (NPIAS) 2009–2013, September 30, 2008
2 Federal Aviation Administration, U.S. Depart-ment of Transportation, FAA Aerospace Forecast, Fiscal Years 2008–2025, March, 2008
3 Federal Aviation Administration, U.S. Depart-ment of Transportation, Capacity Needs in the National Airspace System 2007–2025: An Analysis of Airports and Metropolitan Area Demand and Operational Capacity in the Future, May, 2007
4 Research and Innovative Technology Admin-istration, Bureau of Transportation Statistics, U.S. Department of Transportation, October, 2008 Airline Traffic Data, December 11, 2008.
Facts About AVIATIoN 73www.asce.org/reportcard
5 U.S. Government Accountability Office, Next Generation Air Transportation System: Status of Systems Acquisition and the Transition to the Next Generation Air Transportation System, GAO-08-1078, September, 2008.
6 Statement of Gerald L. Dillingham, Ph.D., Director of Physical Infrastructure Issues, U.S. Government Accountability Office, Before the Committee on Science and Technology, U.S. House of Representatives, Next General Air Transportation System: Status of Key Issues with the Transition to NextGen, GAO-08-1154T, Sep-tember 11, 2008
7 Airports Council International, Airport Capi-tal Development Costs 2007–2011, May, 2007.
ABoVE: Airport congestion at Philadelphia International Airport. Photo courtesy of Matthew Johnson, skyscrapersunset.com

bridges
More than 26%, or one in four, of the nation’s bridges are either structurally deficient or functionally obsolete. While some progress has been made in recent years to reduce the number of deficient and obsolete bridges in rural areas, the number in urban areas is rising. A $17 billion annual investment is needed to substantially improve current bridge conditions. Currently, only $10.5 billion is spent annually on the construction and maintenance of bridges.
tranSPortation

A = ExceptionalB = GoodC = MediocreD = PoorF = Failing
AMERICA’SINFRASTRUCTURE G.P.A.
www.asce.org/reportcard
tranSPortation
75www.asce.org/reportcard
sEt a national goal that less than 15% of the nation’s bridges be classified as structurally deficient or functionally obsolete by 2013;
incrEasE transportation investment significantly at all levels of government to fund the needed repair, renovation, or reconstruction of the nation’s deficient bridges;
implEmEnt an asset-management approach to maintaining bridges to achieve an appropriate balance between correcting immediate problems, conducting preventive maintenance, rehabilitating deficient bridges, and periodically replacing older bridges;
upDatE bridge-inspection standards and implement risk-based prioritization for the repair or reconstruction of the nation’s bridges;
incrEasE funding for long-term transportation research at the national level to ensure better performing and more resilient bridges.
Facts About BRIDGES
cBRiDGES
ESTIMATED 5-YEAR FUNDING REQUIREMENTS FOR briDges anD roaDs
Total investment needs $930 billion
Estimated spending$380.5 billion
Projected shortfall$549.5 billion

76 2009 Report Card for America’s Infrastructure www.asce.org/reportcard
ConDition
Usually built to last 50 years, the aver-age bridge in our country is now 43 years old.1 According to the U.S. Department of Transportation, of the 600,905 bridges across the country as of December 2008, 72,868 (12.1%) were categorized as struc-turally deficient and 89,024 (14.8%) were categorized as functionally obsolete. From 2005–2008, the number of deficient (structurally deficient plus functionally obsolete) bridges in rural areas declined by 8,596. However, in urban areas dur-ing the same time frame, there was an increase of 2,817 deficient bridges.2 Put another way, in 2008 approximately one in four rural bridges were deficient, while one in three urban bridges were deficient. The urban impact is quite significant given the higher level of passenger and freight traffic.
A structurally deficient bridge may be closed or restrict traffic in accordance with weight limits because of limited structural capacity. These bridges are not unsafe, but must post limits for speed and weight. A functionally obsolete bridge
has older design features and geometrics, and though not unsafe, cannot accommo-date current traffic volumes, vehicle sizes, and weights. These restrictions not only contribute to traffic congestion, they also cause such major inconveniences as forc-ing emergency vehicles to take lengthy detours and lengthening the routes of school buses.
With truck miles nearly doubling over the past 20 years and many trucks carry-ing heavier loads, the spike in traffic is a significant factor in the deterioration of America’s bridges. Of the more than 3 tril-lion vehicle miles of travel over bridges each year, 223 billion miles come from trucks.1
To address bridge needs, states use federal as well as state and local funds. According to the American Association of State Highway and Transportation Offi-cials (AASHTO), a total of $10.5 billion was spent on bridge improvements by all levels of government in 2004. Nearly half, or $5.1 billion, was funded by the Federal Highway Bridge Program—$3.9 billion from state and local budgets and an addi-tional $1.5 billion in other federal high-way aid.1 AASHTO estimated in 2008 that it would cost roughly $140 billion to repair every deficient bridge in the coun-try—about $48 billion to repair structur-ally deficient bridges and $91 billion to improve functionally obsolete bridges.1
Simply maintaining the current over-all level of bridge conditions—that is, not allowing the backlog of deficient bridges to grow—would require a combined invest-ment from the public and private sectors of $650 billion over 50 years, according to
In 2008, approximately one in four rural bridges were deficient, while one in three urban bridges were deficient. The urban impact is quite significant given the higher level of passenger and freight traffic.

Facts About BRIDGES 77www.asce.org/reportcard
AASHTO, for an average annual invest-ment level of $13 billion. The cost of elimi-nating all existing bridge deficiencies as they arise over the next 50 years is esti-mated at $850 billion in 2006 dollars, equating to an average annual investment of $17 billion.3
RESiliEnCy
The reliable and efficient flow of people, commodities, and emergency services within our roadway system relies on the nation’s bridge system, which overall is highly resilient. The keys involve three components: system redundancy and
TABLE 8.1 ★ U.S. Bridge Statistics
1998 1999 2000 2001 2002 2003 2004 2005 2006 2007
All Bridges 582,976 585,542 589,674 589,685 590,887 591,940 593,813 595,363 597,340 599,766
Urban 128,312 130,339 133,384 133,401 135,339 135,415 137,598 142,408 146,041 151,171
Rural 454,664 455,203 456,290 456,284 455,548 456,525 456,215 452,955 451,299 448,595
Structurally Deficient Bridges, Total 93,072 88,150 86,692 83,595 81,261 79,775 77,752 75,923 73,784 72,520
Urban 14,073 12,967 NA 12,705 12,503 12,316 12,175 12,600 12,585 12,951
Rural 78,999 75,183 NA 70,890 68,758 67,459 65,577 63,323 61,199 59,569
Functionally obsolete Bridges, Total 79,500 81,900 81,510 81,439 81,537 80,990 80,567 80,412 80,317 79,804
Urban 27,588 26,095 29,398 29,383 29,675 29,886 30,298 31,391 32,292 33,139
Rural 51,912 52,835 52,112 52,056 51,862 51,104 50,269 49,021 48,025 46,665
NA = Not Available
SoURCE Transportation Statistics Annual Report, U.S. Department of Transportation, Bureau of Transportation Statistics, 2008
workarounds; recovery measures, includ-ing rapid restoration ability, security, and robustness against hazards—both natural and man-made; and individual bridges’ structural redundancy. Interstate bridges are usually built in pairs so that if one is taken out of service, the companion bridge can carry traffic in both directions tem-porarily. Also, in most urban areas, there are a number of bridges that can provide suitable alternate routes for traffic. Those key bridges that lack redundancy make it extremely difficult to establish convenient workarounds should the bridge be closed. Increasing congestion means that any

78 2009 Report Card for America’s Infrastructure www.asce.org/reportcard
rerouting caused by a significant bridge closure could result in major traffic delays.
Bridges are designed to account for the likely loads and forces that the span could expect to encounter during its ser-vice life. Structurally, today’s bridges are highly redundant, and incorporate multi-ple girder systems that can compensate for the failure of a single member. There are exceptions for example, fracture-critical bridges, which require more frequent monitoring to ensure that they remain capable of handling their designed traf-fic loads. Resiliency should be part of the evaluation criteria in a risk-analysis to jus-tify and prioritize bridge investment. That investment includes activities that range from nonstructural measures to the struc-
tural and from the design of new bridges to the rehabilitation and replacement of old bridges.
ConClUSion
While some progress has been made recently in improving the condition of the nation’s rural bridges, there has been an increase in the number of deficient urban bridges. At the same time, truck traffic over the nation’s bridges is on the rise—a matter of great concern as trucks carry significantly heavier loads than automobiles and exact more wear and tear on bridges. The investment gap is accelerating and the failure to invest adequately in the nation’s bridges will
FIGURE 8.1 ★ Percent of Deficient Bridges in the United States
25%
26%
27%
28%
29%
30%
31%
32%
* 2000 data not available
SoURCE State Transportation Statistics: 2007, U.S. Department of Transportation, Bureau of Transportation Statistics, 2008
� Urban bridges
25%
26%
27%
28%
29%
30%
31%
32%
25%
26%
27%
28%
29%
30%
31%
32%� All bridges
25%
26%
27%
28%
29%
30%
31%
32%
25%
26%
27%
28%
29%
30%
31%
32%

Facts About BRIDGES 79www.asce.org/reportcard
The Utah Department of Transportation (UDOT) has used some form of the accelerated bridge construction (ABC) method on 19 projects that have included 77 bridges. The majority of these projects entailed the use of precast decks cast off-site and lifted into place over a short period of time—often overnight. The benefits of the ABC method include not only reduced road closure time and a compressed schedule, but enhanced quality and increased safety for drivers and construction workers as well. The concept of fabricating entire bridge spans off-site and moving them into place with self-propelled modular transports (SPMTs) was used in four projects that replaced a total of 13 bridges. The use of off-site fabrication and SPMTs usually allows for the replacement of bridge spans over a weekend. In one case—the 4500 South crossing of I-215 in Salt Lake City—construction time was reduced by 120 days, saving drivers an estimated $4.2 million in terms of construction delays. Photos courtesy of Utah Department of Transportation.
UTAH ★ Accelerated Bridge construction

80 2009 Report Card for America’s Infrastructure www.asce.org/reportcard
I-495 / 95, NoRTHERN vA / MD ★ Woodrow Wilson Bridge
Solving one of the worst bottlenecks on the East Coast, the $2.4 billion Woodrow Wilson Bridge Project in northern Virginia and Maryland replaced nearly 12% of the Capital Beltway (Interstate 495/95) and created four new interchanges. Opened in 1961, the original bridge was designed for 75,000 trips per day, but over the years traffic swelled to nearly 200,000 trips daily—11% of them by large trucks. With eight highway lanes squeezing into the original bridge’s six lanes, the lack of shoulders and merge lanes resulted in accident rates twice those of other segments of the Beltway, and emergency crews were delayed in reaching those in need. Peak period stop-and-go conditions also contributed to decreased air quality. As one of nine bridges within the interstate highway system with a movable span, the 260 bridge openings per year created additional delays and congestion. These issues rendered the old bridge functionally obsolete.
The new drawbridges are 20 feet higher than the original, and the number of openings is expected to be reduced to about 65 per year, down about 75%. Shoulders on the new bridge will reduce the rate of accidents and improve accident man-agement, and new merge lanes will increase safety. The new bridge has 12 lanes, including two express-type through lanes on each span to accommodate High Occupancy Vehicle (HOV) traffic. The new bridge was named the 2008 Outstanding Civil Engineering Achievement by ASCE. Photo courtesy of the Wilson Bridge Project.

Facts About BRIDGES 81www.asce.org/reportcard
oAKLAND, cA ★ The MacArthur Maze Repairs
When a gasoline tanker rig flipped over on an elevated interstate highway connector ramp on April 29, 2007, the massive explosion and burning fuel warped and collapsed a critical sec-tion of the San Francisco Bay Area’s MacArthur Maze. To allow traffic and commerce to flow through this vital artery quickly, the state undertook extreme measures to complete repairs in record-breaking time. The twisted steel and crumbled concrete that was the I-580 overpass also damaged the I-880 elevated ramp below. Such extensive damage could have been expected to take months to repair, but with the connectors so vital to com-muters, the California Department of Transportation went to work around the clock under an emergency decla-
ration. Only one week after the acci-dent, the lower I-880 connector had been repaired and was reopened. The I-580 overpass was completed in just 26 days, due in part to a bonus of $200,000 paid for each day the work was completed sooner than two months after the accident. Photo courtesy of California Department of Transportation, photographed by John Huseby.
lead to increased congestion and delays for motorists, wasted fuel, the further deterioration of bridge conditions, and increased safety concerns. Once Congress works to address these problems in the 2009 authorization of the Surface Trans-portation Program, it should establish a goal that less than 15% of the nation’s bridges be classified as structurally defi-cient or functionally obsolete by 2013 and should provide the funding needed to accomplish that. ★
SoURCES1 American Association of State Highway and Transportation Officials (AASHTO). Bridging the Gap. July 2008
2 Data provided by Federal Highway Adminis-tration, U.S. Department of Transportation
3 Report of the National Surface Transporta-tion Policy and Revenue Study Commission, Transportation for Tomorrow, December 2007 final report. Volume II, Chapter 4, p. 6

Inland WaterWays
The average tow barge can carry the equiv-alent of 870 tractor trailer loads. Of the 257 locks still in use on the nation’s inland water-ways, 30 were built in the 1800s and another 92 are more than 60 years old. The average age of all federally owned or operated locks is nearly 60 years, well past their planned design life of 50 years. The cost to replace the present system of locks is estimated at more than $125 billion.
tranSPortation
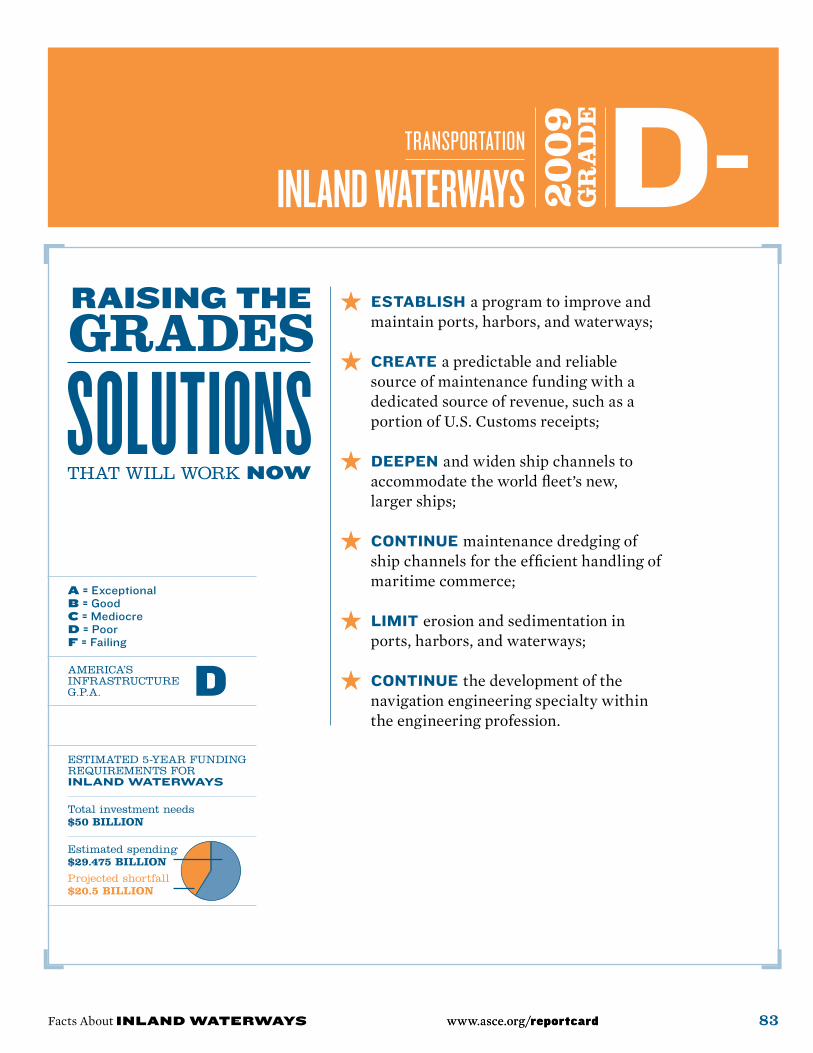
A = ExceptionalB = GoodC = MediocreD = PoorF = Failing
AMERICA’SINFRASTRUCTURE G.P.A.
www.asce.org/reportcard
tranSPortation
83www.asce.org/reportcard
ESTIMATED 5-YEAR FUNDING REQUIREMENTS FOR inlanD waterways
Total investment needs $50 billion
Estimated spending$29.475 billion
Projected shortfall$20.5 billion
Establish a program to improve and maintain ports, harbors, and waterways;
crEatE a predictable and reliable source of maintenance funding with a dedicated source of revenue, such as a portion of U.S. Customs receipts;
DEEpEn and widen ship channels to accommodate the world fleet’s new, larger ships;
continuE maintenance dredging of ship channels for the efficient handling of maritime commerce;
limit erosion and sedimentation in ports, harbors, and waterways;
continuE the development of the navigation engineering specialty within the engineering profession.
Facts About INLAND WATERWAyS
D-inlAnD WAtERWAyS

84 2009 Report Card for America’s Infrastructure www.asce.org/reportcard
ConDitionS
Because of their ability to move large amounts of cargo, the nation’s inland waterways are a strategic economic and military resource. A recent analysis by the U.S. Army War College concluded that “the strategic contributions of these inland waterways are not well under-stood. The lack of adequate understanding impacts decisions contributing to effi-cient management, adequate funding, and effective integration with other modes of transportation at the national level. Rec-ommendations demonstrate that lever-aging the strategic value of U.S. inland waterways will contribute to building an effective and reliable national transporta-tion network for the 21st century.”1
Forty-one states, including all states east of the Mississippi River and 16 state capitals, are served by commercially navi-gable waterways. The U.S. inland water-way system consists of 12,000 miles of navigable waterways in four systems—the Mississippi River, the Ohio River Basin, the Gulf Intercoastal Waterway, and the Pacific Coast systems—that connect with most states in the U.S. The system com-prises 257 locks, which raise and lower
river traffic between stretches of water of different levels.
Three-quarters of the nation’s inland waterways, or approximately 9,000 miles, are within the Mississippi River system. The next largest segment is the Ohio River system with 2,800 miles. The Gulf Coast Intercoastal Waterway system comprises 1,109 miles and the Columbia River sys-tem, the shortest of the four major sys-tems, is only 596 miles long.
The nationwide network includes nearly 11,000 miles of waterways funded by federal user fees through an excise tax on fuel. Commercial waterway operators on these designated waterways pay a fuel tax of 20 cents per gallon, which is depos-ited in the Inland Waterways Trust Fund (IWTF). The IWTF, which was created in 1978, funds half the cost of new construc-tion and major rehabilitation of the inland waterway infrastructure.
Forty-seven percent of all locks main-tained by the U.S. Army Corps of Engi-neers were classified as functionally obsolete in 2006. Assuming that no new locks are built within the next 20 years, by 2020, another 93 existing locks will be obsolete—rendering more than 8 out of every 10 locks now in service outdated.2
Currently, the Corps has $180 million per year available for lock repairs—half comes from the IWTF revenues and half comes from congressional appropriations. With an average rehabilitation cost of $50 million per lock, the current level allows the Corps to fully fund only two or three lock projects each year.
There is no recognized engineering specialty to comprehensively address the
The U.S. inland waterway system consists of 12,000 miles of navigable waterways in four systems—the Mississippi River, the Ohio River Basin, the Gulf Intercoastal Waterway, and the Pacific Coast systems.

Facts About INLAND WATERWAyS 85www.asce.org/reportcard
current and future waterways systems challenges. In the past, systems were basi-cally designed and maintained by the Corps and therefore most of the engineer-ing knowledge and experience has been self-contained. Now much of that mission is contracted and other related functions are privatized. These factors and the loss of experienced engineers in and outside
TABLE 9.1 ★ The Nation’s Busiest Inland Ports
domestic Foreign totalinlandport tons* %increase** tons* %increase** tons* %increase**
Huntington-Tristate, WV 76.5 -0.9 0 0 76.5 -0.9
Duluth-Superior, MN & WI 31.4 -3.5 15.1 4.7 46.5 -1.0
Pittsburgh, PA 38.1 -9.3 0 0 38.1 -9.3
St. Louis, MO & IL 32.1 2.6 0 0 32.1 2.6
Chicago, IL 21.1 -6.3 3.4 6 24.5 -4.8
Memphis, TN 18.8 -1.4 0 0 18.8 -1.4
Indiana Harbor, IN 14.5 -7.5 0.5 6 15 -7.0
Detroit, MI 11.4 -12 3.5 -19.4 14.9 -13.9
Two Harbors, MN 13.1 -2.2 0.6 942.7 13.7 1.9
Cincinnati, OH 13.2 -0.9 0 0 13.2 -0.9
Cleveland, OH 10.4 -9.5 2.4 -35 12.8 -15.8
Toledo, OH 4.5 95.3 8 -9.9 12.5 11.7
Presque Isle, MI 7 0.8 1.8 -15.7 8.8 -3.1
Gary, IN 7.9 -6.4 0.2 -73.6 8.1 -11.5
Louisville, KY 7.8 6.4 0 0 7.8 6.4
* Short Tons in Millions ** Percent Increase 2006–2007
SoURCE Leading U.S. Ports—Inland Waterways (Including Great Lakes), USACE, 2007
the Corps result in the urgent need to for-mally educate a new audience in the devel-oping specialty of navigation engineering.
Due to a lack of adequate data, ASCE was unable to assess the condition of, or assign a grade to, the infrastructure of the nation’s more than 300 ports and harbors. Ports, which are owned and operated largely by state, local, and private entities,

FIGURE 9.1 ★ commodities Shipped via Inland Waterway (by tons*)
* Short Tons in Millions ** Tonnage less than 50,000 tons or extreme percent change
SoURCE U.S. Waterborne Traffic by Commodity, 2007, USACE
2007
2006
2005
Pulp andWaste Paper**
Waste andScrap, NEC
Coal Coke
Non-FerrousOres and Scrap
Sulphur, Clayand Salt
Forest Products,Wood and Chips
All Manuf.Equipment
PrimaryManuf. Goods
Iron Ore and Scrap
Chemical andRelated Products
CrudePetroleum
Food and FarmProducts
Sand, Gravel,and Stone
Coal
PetroleumProducts
86 2009 Report Card for America’s Infrastructure www.asce.org/reportcard

Facts About INLAND WATERWAyS 87www.asce.org/reportcard
UNITED STATES ★ Real-Time current velocity System
The Corps is bringing new technology online to make waterways navigation safer. The latest innovation is called the real-time current velocity system. This system alerts waterways users to the real-time speed of wind and currents on inland waterways. The additional current information, which will be transmit-ted automatically to tows on approach, will allow tow pilots to improve safety and prevent collisions when tows are approaching locks. A total of six systems are expected to be implemented by the end of 2009.
LoUISvILLE, Ky ★ McAlpine Lock, ohio River
In March 2009, the Corps will open a new 1,200-foot lock on the Ohio River to replace a single, shorter lock built in 1921. The new lock chamber at Lou-isville, Ky.—originally built to trans-port commodities over the Falls of Ohio—will enable the facility to meet projected increases in commercial barge traffic during the next 30 years.8 According to the Corps’ Louisville District, in calendar year 2006, 55 million tons of freight passed through McAlpine, 39% of which was coal. Photo courtesy of the U.S. Army Corps of Engineers, Louisville District.

88 2009 Report Card for America’s Infrastructure www.asce.org/reportcard
are not required to report on the condi-tion of their infrastructure to the federal government. Nevertheless, U.S. ports con-nect to 1,000 federally maintained harbor channels and 12,000 miles of taxpayer-funded inland waterways, and their land-side port infrastructure facilities include terminals, wharves, rail yards, and road-ways within the harbor districts.6 In 2007, the American Association of Port Authori-ties (AAPA), which represents ports in the U.S., Canada and Mexico, reported that public ports in the U.S. must invest $1.7 billion annually to update and mod-ernize their facilities. The AAPA report contained no assessment of the physical condition of individual ports or of port infrastructure generally.4
RESiliEnCE
The current system of inland waterways lacks resilience. Waterway usage is increas-ing, but facilities are aging and many are well past their design life of 50 years. Recov-ery from any event of significance would be negatively impacted by the age and dete-riorating condition of the system, posing a direct threat to the American economy.
ConClUSion
Inland and intracoastal waterways directly serve 38 states including the states on the Atlantic seaboard, the Gulf Coast, and the Pacific Northwest. Ship-pers and consumers in these states depend on the inland waterways to move approxi-mately 630 million tons of cargo valued at more than $73 billion annually. States on
the Gulf Coast and throughout the Mid-west and Ohio Valley especially depend on the inland and intracoastal waterways. Texas and Louisiana each ship more than $10 billion worth of cargo annually, while Illinois, Pennsylvania, West Virginia, Ken-tucky, Mississippi, Alabama, and Wash-ington State each ship between $2 billion and $10 billion annually. Another 8 states ship at least $1 billion annually.
This system provides an average trans-portation savings of $10.67 per ton over the cost of shipping by alternative modes. This translates into more than $7 billion annually in transportation savings to the U.S. econ-omy. Future investment must focus on life-cycle maintenance, system interdepen-dencies, redundancy, security, and recovery from natural and man-made hazards. ★
SoURCES1 Donald E. Jackson Jr., Leveraging the Strategic Value of the U.S. Inland Waterway System, Army War College research paper, March 2007.
2 U.S. Army Corps of Engineers, The U.S. Waterway System—Transportation Facts, Decem-ber 2007.
3 U.S. Army Corps of Engineers, An Overview of the U.S. Inland Waterway System, November 2005.
4 American Association of Port Authorities, America’s Ports Today, 2007.
5 U.S. Maritime Administration, Annual Report to Congress, 2007.
6 U.S. Maritime Administration, U.S. Water Transportation Statistical Snapshot, 2008.
7 U.S. Army Corps of Engineers, Institute for Water Resources, at www.vtn.iwr.usace.army.mil/navigation/navrecentprojects.htm.
8 Hale, Tom. “McAlpine Lock Replacement Update,” Construction Digest, April 10, 2006.

Facts About INLAND WATERWAyS 89www.asce.org/reportcard
PHILADELPHIA, PA ★� Delaware River channel Deepening Project
In June 2008, an agreement was signed between the U.S. Army Corps of Engineers and the Philadelphia Regional Port Authority to begin a five-year, $379-million project to deepen the Delaware River’s shipping channel. The deeper channel, which is being increased from 40 to 45 feet, will allow ports on the Delaware River to compete more effectively for cargo, provide safe passage for vessels and increase jobs in the region. Approxi-mately 26 million cubic yards of dredg-ing material will be removed, 7.4 million cubic yards of which will be used for wetland creation and beach nourishment. Photos courtesy of the U.S. Army Corps of Engineers, Philadelphia District.
SAvERToN, Mo ★� Lock 22, Upper Mississippi River System
The U.S. Army Corps of Engineers’ new 1,200-foot Lock 22 will allow a tow with a full accompany of barges to move through the lock without having to break the tow’s load into two pieces. Keeping a tow’s load in one piece minimizes environmental impact, increases worker safety and reduces transit times. The lock’s design is largely transferable to four other lock sites, saving both time and money. The existing 600-foot lock will remain in place and will become an auxiliary lock serving primarily recre-ational traffic. Photo courtesy of the U.S. Army Corps of Engineers, Rock Island District.

RAIL
A freight train is three times as fuel effi-cient as a truck, and traveling by passenger rail uses 20% less energy per mile than trav-eling by car. However, growth and changes in demand create bottlenecks that constrain traffic in critical areas. Freight and passenger rail generally share the same network, and a significant potential increase in passenger rail demand will add to the freight railroad capacity challenges. More than $200 billion is needed through 2035 to accommodate anticipated growth.
tranSPortation

A = ExceptionalB = GoodC = MediocreD = PoorF = Failing
AMERICA’SINFRASTRUCTURE G.P.A.
www.asce.org/reportcard
tranSPortation
91www.asce.org/reportcard
intEgratE rail into a national multimodal transportation policy that recognizes and takes advantage of efficiencies;
improvE passenger rail as an alternative to air and automobile travel;
incrEasE and expand Amtrak’s corridor services linking major cities less than 500 miles apart.
Facts About RAIL
c-RAil
ESTIMATED 5-YEAR FUNDING REQUIREMENTS FOR rail
Total investment needs $63 billion
Estimated spending$51.3 billion
Projected shortfall$11.7 billion

92 2009 Report Card for America’s Infrastructure www.asce.org/reportcard
ConDition
Freight RailThe U.S. freight rail system is comprised of three classes of railroad companies based on annual operating revenues: 8 Class I freight railroad systems; 30 Class II regional or short-line railroads; and 320 Class III or local line-haul carriers.1
Approximately 42% of all intercity freight in the United States travels via rail, including 70% of domestically manufac-tured automobiles and 70% of coal deliv-ered to power plants.2 As of 2006, Class I railroads owned and operated 140,249 miles of track.3 However, most traffic trav-els on approximately one-third of the total network, which totals 52,340 miles.
After years of shedding excess capac-ity, railroads have been increasing infra-structure investment and spending in recent years. In 2006, overall spending on rail infrastructure was $8 billion, a 21% increase from 2005.2 More specifically, spending on construction of new roadway and structures increased from $1.5 billion in 2005 to $1.9 billion in 2007.4 Increased spending on maintenance of railroad net-works and systems has become necessary as investments are made in more costly signaling technology, heavier rail, and the improved substructure necessary to accommodate heavier trains.3
Demand for freight transportation is projected to nearly double by 2035—from 19.3 billion tons in 2007 to 37.2 billion tons in 2035.4 If current market shares are maintained, railroads will be expected to handle an 88% increase in tonnage
by 2035.4 However, as many look to rail as a more efficient and environmentally friendly freight shipper, rail’s market share could increase and lead to additional increases in freight rail tonnage.
An estimated $148 billion in improve-ments will be needed to accommodate the projected rail freight demand in 2035.4 Class I freight railroads’ share of this cost is estimated at $135 billion.4 Through pro-ductivity and efficiency gains, railroads hope to reduce the required investment from $148 billion to $121 billion over the period 2007 through 2035.4
Passenger RailAmtrak, the nation’s only intercity passen-ger rail provider, carried 28.7 million riders in fiscal year 2008, an 11.1% increase from fiscal year 2007.5 Further, the 2007 ridership represented a 20% increase from the previous five years.5 Corridor services linking major cities less than 500 miles apart, such as Milwaukee-Chicago, Sacramento-San Francisco-San Jose and the Northeast Corridor, are experiencing the fastest growth.5
Increased ridership has led to increased revenue, and Amtrak received $1.355 bil-lion in federal investment in fiscal year 2008. However, an additional $410 mil-lion in immediate capital needs have been identified, including acquiring new cars to add capacity. In addition, upgrades to comply with the Americans with Disabili-ties Act (ADA) and improve overall condi-tions of the 481 stations in its network are estimated at $1.5 billion.6
While electrical power in the Northeast Corridor cushioned some of the blow of

Facts About RAIL 93www.asce.org/reportcard
increased fuel prices in 2008, it also represents a major infrastructure chal-lenge for Amtrak. Upgrading the elec-trical system in the Northeast Corridor, parts of which were installed in the 1930s, is among the immediate needs identified. Failure of these critical systems could bring the entire line to a halt, which would impact not only Amtrak, but also the 8 commuter railroads that share the North-east Corridor.6
Amtrak anticipates reaching and exceeding capacity in the near future on some routes. For example, approximately half of trains traveling on one northeast regional line were 85% full and 62% were at least 75% full during one week in July 2008. Even though the current economic downturn has dampened growth, trains will soon reach capacity as the economy
FIGURE 10.1 ★ Number of Amtrak Passengers (in thousands): 1995–2006
19,000
20,000
21,000
22,000
23,000
24,000
25,000
26,000
SoURCE Transportation Statistics Annual Report: 2007, U.S. Department of Transportation, Bureau of Transportation Statistics, 2008
Corridor services linking major cities less than 500 miles apart, such as Milwaukee-Chicago, Sacramento-San Francisco-San Jose and the Northeast Corridor, are experiencing the fastest growth.

94 2009 Report Card for America’s Infrastructure www.asce.org/reportcard
rebounds and the growth patterns of recent years are reestablished, and the fleet of cars and locomotives continues to age.6
In the long term, the Passenger Rail Working Group (PRWG), which was formed as part of the National Surface Transportation Policy and Revenue Study Commission, determined that an annual investment of $7.4 billion through 2016, totaling $66.3 billion, is needed to address the total capital cost of a proposed inter-city rail network. It is further estimated that an additional $158.6 billion is needed between 2016 and 2030 and an additional $132.3 billion must be invested between 2031 and 2050 to achieve the ideal inter-city network proposed by the PRWG.5 These costs do not include the mandated safety upgrades for freight rail lines that carry both passenger as well as freight traffic and for those routes that carry toxic chemicals as required by the Rail Safety Improvement Act of 2008.7
While the investments set forth by the PRWG are significant, the benefits would be significant as well. The PRWG esti-mated a net fuel savings of nearly $4 bil-lion per year by diverting passengers to rail if the proposed vision was adopted.5 In addition, the investments would reduce the need for even greater capacity invest-ments in other modes.
Intercity passenger rail faces particu-lar concerns not faced by other modes of transportation, such as the lack of a dedicated revenue source. Amtrak owns and/or operates 656 miles of track that are maintained and upgraded using funds from its general operating budget, impact-ing its ability to fund other projects. The
annual congressional appropriations process has provided minimal funding in recent years, leading to a major back-log of deferred track maintenance on the track that Amtrak owns and operates, more than half of which is shared with commuter and freight railroads. For the remainder of its 21,095-mile network, Amtrak relies on freight rail lines that make maintenance and upgrade decisions on the basis of their own business models and shareholders’ interests while preserv-ing Amtrak’s statutory rights for access. Freight and passenger rail interests are becoming more aligned as both require increases in rail network capacity, but suc-cessful alignment of interests will require both a public and private investment.1
RESiliEnCE
Because of its efficiency and reduced energy consumption, rail is an impor-tant component of the nation’s transpor-tation network, supporting the economy through both commerce and tourism. But due to a lack of adequate investment, lim-ited redundancy, intermodal constraints, and energy system interdependencies, the rail system is not resilient. Current rail security strategies are risk-based as deter-mined by corridor assessments, corporate security reviews, intelligence analyses, and objectively measured risk metrics. To improve resilience, future investments must address life-cycle maintenance, rapid recovery, multihazard threats and vulner-abilities, and technological innovations.

Facts About RAIL 95www.asce.org/reportcard
cHIcAGo, IL ★ chicago Region Environmental and Transportation Efficiency Program
The Chicago Region Environmental and Transportation Efficiency Program (CREATE) is a joint effort between freight and passenger railroads and city and state governments to improve the movement of goods and people through the area. Chicago’s role not only as a population center but also as a major freight processing area—approximately one-fourth of U.S. freight rail traffic originates in, terminates in, or travels through the Chicago area—means that improvements will impact shipments to the entire country. Billions of dollars will be invested in critical capital improvement projects to increase the efficiency of the region’s railroads.9
It is estimated that new overpasses and underpasses at railroad crossings will save motorists 3,000 hours per day.9 Additional funding is required to complete this plan, which will provide both public and private benefits to the economy, environmental benefits, and significant congestion relief. CREATE projects will free up needed capacity, reduce pollution from both locomotives and highway vehicles, increase reliability and reduce conflicts between passenger and freight rail. Photos courtesy of the CREATE partners.

96 2009 Report Card for America’s Infrastructure www.asce.org/reportcard
BoSToN, MA / WASHINGToN, D.c. ★� Amtrak’s Northeast corridor
Amtrak’s Northeast Corridor continues to set the standard for providing a viable intercity transportation alternative to congested highways and airways. In addition to Amtrak passenger service, 8 transportation or commuter agencies use the Corridor through contract agreements with Amtrak.10
Ridership on the Acela Express grew 20% from fiscal year 2006 to fiscal year 2007.10, 12 In addition, Amtrak’s share of the New York–Washington air and rail travel market was 56% in fiscal year 2007.11 Photo courtesy of Amtrak.
LoS ANGELES / LoNG BEAcH, cA ★� Alameda corridor
Completed in 2002, the Alameda Corridor is a 20-mile-long rail cargo express-way that links the ports of Long Beach and Los Angeles—the two busiest container ports in the country—to the transcontinental rail network near downtown Los Angeles.8 A series of bridges, underpasses, overpasses, and street improvements separates freight trains from passenger rail and automobile traffic, facilitating a more efficient transportation network.8 In addition, the elimination of at-grade crossings reduces traffic congestion, time lost by local drivers and air and noise pollution created by idling trains and automobiles. Photo courtesy of AECOM.

Facts About RAIL 97www.asce.org/reportcard
ConClUSion
Rail is increasingly seen as a way to alle-viate growing freight and passenger con-gestion experienced by other modes of transportation. In addition, rail is a fuel efficient alternative for moving freight long distances.
Anticipated growth over the coming decades, as well as demographic shifts, will tax a rail system that is already reach-ing capacity in some critical bottlenecks. A substantial investment in rail infrastruc-ture will maximize efficiencies and ulti-mately reap broad benefits for passengers, shippers, and the general public. ★
SoURCES1 House Transportation and Infrastructure Subcommittee on Railroads, Pipelines and Haz-ardous Materials, Staff Report for Subcommittee Hearing, January 28, 2009.
2 “Freight Railroads: Industry Health Has Improved, but Concerns about Competition & Capacity Should Be Addressed,” Government Accountability Office, October 2006.
3 Weatherford, Brian A., Henry H. Willis, David S. Ortiz, The State of U.S. Railroads: A Review of Capacity and Performance Data, Rand Supply Chain Policy Center, 2007.
4 National Rail Freight Infrastructure Capacity & Investment Study, Cambridge Systematics, Inc., September 2007.
5 Vision for the Future: U.S. Intercity Passenger Rail Networking Through 2050, Passenger Rail Working Group, December 2007.
6 Crosbie, William L., “Testimony before House Transportation and Infrastructure Committee,” October 29, 2008.
7 “The Rail Safety Improvement Act of 2008,” P.L. 110-432.
8 Alameda Corridor Transportation Authority, Alameda Corridor Project Fact Sheet.
9 “About CREATE,” Chicago Region Environ-mental and Transportation Efficiency Program Web site.
10 Amtrak Government Affairs, “Amtrak FY 2007 State-by-State Fact Sheets,” February 2008.
11 National Railroad Passenger Corporation, 2007 Annual Report.
12 Kummant, Alex, President and CEO of Amtrak, “Statement Before the Subcommittee on Railroads of the House Transportation and Infrastructure Committee,” June 12, 2007.
other Resources:
“Approaches to Mitigate Freight Congestion,” Government Accountability Office, November 2008.
“Principles on Federal Funding of Freight Rail,” American Association of Railroads, August 2008.
Intercity Passenger Rail Transportation: 2008 Update, American Association of State Highway and Transportation Officials, Standing Commit-tee on Railroad Transportation, 2008.
American Association of Railroads, Freight Rail Works series, www.freightrailworks.org.
U.S. Department of Transportation, Fiscal Year 2009 Budget in Brief.
Congressional Budget Office, The Past and Future of U.S. Passenger Rail Service: Amtrak’s Intercon-nections with Freight and Commuter Railroads, September 2003.

roaDs
Americans spend 4.2 billion hours a year stuck in traffic at a cost to the economy of $78.2 billion, or $710 per motorist. Poor conditions cost motorists $67 billion a year in repairs and operating costs. One-third of America’s major roads are in poor or mediocre condition and 45% of major urban highways are congested. Current spending of $70.3 billion per year for highway capital improvements is well below the estimated $186 billion needed annually to substantially improve conditions.
tranSPortation

A = ExceptionalB = GoodC = MediocreD = PoorF = Failing
AMERICA’SINFRASTRUCTURE G.P.A.
www.asce.org/reportcard
tranSPortation
99www.asce.org/reportcard
rEform the federal highway program to emphasize performance management, cost-benefit analysis, and accountability;
DirEct federal transportation policies, programs, and resources to enhance U.S. global competitiveness, interstate commerce, passenger travel, and emergency preparedness;
incrEasE spending significantly at all levels of government to repair, improve, and expand the nation’s surface transportation system;
incrEasE funding for long-term, advanced highway research;
aDDrEss the long-term viability of fuel taxes for transportation funding, and explore the viability of the most promising options to strengthen this funding;
Establish a national policy goal of achieving zero deaths on America’s roadways and incrEasE funding in the Highway Safety Improvement Program by 10%.
Facts About RoADS
D-RoADS
ESTIMATED 5-YEAR FUNDING REQUIREMENTS FOR briDges anD roaDs
Total investment needs $930 billion
Estimated spending$380.5 billion
Projected shortfall$549.5 billion

100 2009 Report Card for America’s Infrastructure www.asce.org/reportcard
ConDition
Our nation’s economy and our quality of life require a highway and roadway sys-tem that provides a safe, reliable, efficient, and comfortable driving environment. Although highway fatalities and traffic- related injuries declined in 2007, the drop is most likely attributable to people driving less. Still, in 2007, 41,059 people were killed in motor vehicle crashes and 2,491,000 were injured.4 Motor vehicle crashes cost the U.S. $230 billion per year—$819 for each resident in medi-cal costs, lost productivity, travel delays, workplace costs, insurance costs, and legal costs.1
Next to safety, congestion has become the most critical challenge facing our highway system. Congestion continues to worsen to the point at which Ameri-cans spend 4.2 billion hours a year stuck in traffic at a cost of $78.2 billion a year in wasted time and fuel costs—$710 per motorist.1 The average daily percentage of vehicle miles traveled (VMT) under congested conditions rose from 25.9% in 1995 to 31.6% in 2004, congestion in large urban areas exceeding 40%.2 And as a result of increased congestion, total fuel wasted climbed from 1.7 billion gallons in 1995 to 2.9 billion gallons in 2005.5
Poor road conditions lead to excessive wear and tear on motor vehicles and can also lead to increased numbers of crashes and delays. According to the Federal High-way Administration, while the percent-age of VMT occurring on roads classified as having “good” ride quality has steadily improved, the percentage of “acceptable”
ride quality steadily declined from 86.6% in 1995 to 84.9% in 2004, with the low-est acceptable ride quality found among urbanized roads at 72.4%.2 These figures represent a failure to achieve significant increases in good and acceptable ride quality, particularly in heavily trafficked urbanized areas.
Compounding the problem are steadily increasing demands on the system. From 1980–2005, while automobile VMT increased 94% and truck VMT increased 105%, highway lane-miles grew by only 3.5%. From 1994–2004, ton miles of freight moved by truck grew 33%.6 The increase in freight traffic is of particular concern because of the increased depen-dency of commerce upon the efficiency of the roadways and the added wear and tear caused by trucks. Without adequate investment and attention, the negative trends will continue, as will the adverse consequences.
It is clear that significant improvements and system maintenance will require sig-nificant investments.
The National Surface Transportation Policy and Revenue Commission studied the impact of varying investment levels (medium and high) and produced the fol-lowing ranges of average annual capital investment needs (in 2006 dollars):
$130 billion–$240 billion for the 15-year period 2005–2020;$133 billion–$250 billion for the 30-year period 2005–2035;$146 billion–$276 billion for the 50-year period 2005–2055.
★
★
★

Facts About RoADS 101www.asce.org/reportcard
The lower end of the ranges reflect the estimated costs of maintaining key condi-tions and performance measures at cur-rent levels, while the higher end ranges would allow for an aggressive expan-sion of the highway system, which would provide improved conditions and per-formance in light of increasing travel demand.3 Even at the lower range of esti-mates, an enormous gap exists between the current level of capital investment and the investment needed to improve the nation’s highways and roads.
TABLE 11.1 ★� Top 10 Most congested cities in the U.S.
rank city Hoursofdelaypertraveler
1 Los Angeles/Long Beach-Santa Ana, cA 72
2 San Francisco-oakland, cA 60
2 Washington, Dc-vA-MD 60
2 Atlanta, GA 60
5 Dallas-Fort Worth-Arlington, Tx 58
6 Houston, Tx 56
7 Detroit, MI 54
8 Miami, FL 50
9 Phoenix, AZ 48
10 chicago, IL-IN 46
SoURCE Urban Mobility Report, Texas Transportation Institute, 2007
The average daily percentage of vehicle miles traveled (VMT) under congested conditions rose from 25.9% in 1995 to 31.6% in 2004, congestion in large urban areas exceeding 40%.

102 2009 Report Card for America’s Infrastructure www.asce.org/reportcard
RESiliEnCy
The Interstate Highway System was con-structed as part of the nation’s strategic homeland defense, illustrating the impor-tant role of transportation in mitigation, defense and recovery.
The ability of our transportation sys-tem to withstand threats from hazards of all types, both natural and human-caused, and to restore service promptly following such events, is known as resilience.
Building disaster-resistant roads and highways reduces hazard mitigation costs, limits exposure, and maintains opera-tional continuity. A multihazard approach utilizing next-generation codes, standards, and practices is necessary to minimize the extent of a disaster.
ConClUSion
The challenges imposed by our highway infrastructure require a large increase in capital investment on the part of all levels of government and other sources as well. The failure to adequately invest in the nation’s highways and roads will lead to increased congestion and delays for motorists and the further deterio-ration of pavement conditions and will pose increased safety concerns. An over-stressed infrastructure will also slow freight delivery, create unpredictability in supply chains, diminish the competi-tiveness of U.S. businesses, and increase the cost of consumer goods. There must also be a significant change in the way we manage the system, which should include
FIGURE 11.1 ★ Highway vehicle Miles Traveled: 1995–2005
2,400,000
2,500,000
2,600,000
2,700,000
2,800,000
2,900,000
3,000,000
SoURCE Transportation Statistics Annual Report: 2007, U.S. Department of Transportation, Bureau of Transportation Statistics, 2008

Facts About RoADS 103www.asce.org/reportcard
FAIRFAx coUNTy, vA ★ I-495 virginia HoT Lanes Project
Designed to help alleviate conges-tion on Virginia’s busiest highway in the third worst congested region in the country, the I-495 High Occu-pancy Toll (HOT) lanes project will add 4 lanes to a 12-mile stretch of the Capital Beltway. The estimated $1.7-billion project will employ electronic tolling and dynamic pricing to manage traffic flow and will replace more than $260 million in aging infrastructure, including more than 50 bridges, over-
passes, and major interchanges. ABoVE: Conceptual renderings of the future Capital Beltway HOT Lanes Project. Photo courtesy of Transurban.
MISSoURI ★� Median crash Barriers
Through an analysis of the state’s crash data, MoDoT recognized an emerging problem of severe cross-median crashes on its most heavily traveled roadways. To address this safety concern, Mis-souri began an effort to install median cable bar-riers system-wide on its major interstates. Simple cable barriers lining all highway medians offered a low cost solution to this problem. The cable bar-riers have performed successfully in Missouri, catching over 95% of vehicles entering the median. Most importantly, the barriers are saving lives. As an example, Interstate 70 suffered 24 cross-median fatalities in 2002. The installation of system-wide cable barriers since then has virtually eliminated this crash type, as only two cross-median fatalities occurred in 2006. Photo courtesy of the Roadway Safety Foundation.

104 2009 Report Card for America’s Infrastructure www.asce.org/reportcard
the use of emerging technologies and innovative operational strategies.
Legislation to replace SAFETEA-LU, which expires on September 30, 2009, must address the following issues if it is to set the stage for the major reforms needed to ensure the viability of our surface transportation system. First, it must more clearly define the federal role and respon-sibilities, and from that definition, the framework for a performance-based and fully accountable system can emerge.
Second, it is clear that the current fund-ing model for the Highway Trust Fund (HTF) is failing. The latest projections by the U.S. Department of Treasury and Con-gressional Budget Office indicate that by the end of FY 2009, the HTF will have a negative balance of $4–5 billion if no cor-rective action is taken. While acknowledg-ing the need to move to a new, sustainable funding system in the long term, the National Surface Transportation Policy and Revenue Study Commission has rec-ommended an increase of 5–8 cents per gallon in the gas tax per year over the next 5 years to address the current projected shortfall.3 We cannot continue to rely upon gasoline and diesel taxes to generate the HTF revenues, when national policy demands a reduction in both our reliance
upon foreign sources of energy and our nation’s carbon footprint. An increase in the gas tax is necessary in the short term, but our national policy must move toward a system that more directly aligns fees that a user is charged with the benefits that the user derives.
Finally, the legislation must encourage innovative thinking and solutions from all sectors: public, private, and academia. ★
SoURCES1 The Road Information Project (TRIP), Key Facts About America’s Road and Bridge Condi-tions and Federal Funding, August 2008.
2 U.S. Department of Transportation, Status of the Nation’s Highways, Bridges and Transit: Con-ditions and Performance, 2006.
3 Report of the National Surface Transpor-tation Policy and Revenue Study Commis-sion—Transportation for Tomorrow, Volume II, December 2007.
4 National Highway Traffic Safety Administra-tion, Motor Vehicle Traffic Crash Fatality Counts and Estimates of People Injured for 2007—DOT HS 811 034, September 2008, p. 7.
5 Texas Transportation Institute, The 2007 Urban Mobility Report.
6 The Path Forward—Interim Report of the National Surface Transportation Infrastructure Financing Commission, February 2008.

Facts About RoADS 105www.asce.org/reportcard
MILWAUKEE, WI ★ The Marquette Interchange Renovation
By the early 2000s, the Marquette Interchange, which provides access to 37% of the state’s jobs and links to one-third of the state’s freeways, carried 300,000 vehicles per day and averaged three crashes daily. The $810-million improvement project—which is ahead of schedule and under budget—pro-vides additional ramp lanes, increases ramp and merge distances, straightens curves, and places entrances and exits on the right-hand side of the highway to improve safety. The interchange’s bridges have been built for a 75-year design life. Photos courtesy of the Wis-consin Department of Transportation.

transit
Transit use increased 25% between 1995 and 2005, faster than any other mode of transportation. However, nearly half of Amer-ican households do not have access to bus or rail transit, and only 25% have what they consider to be a “good option.” The Federal Transit Administration estimates $15.8 billion is needed annually to maintain conditions and $21.6 billion is needed to improve to good conditions. In 2008, federal capital outlays for transit were only $9.8 billion.
tranSPortation

A = ExceptionalB = GoodC = MediocreD = PoorF = Failing
AMERICA’SINFRASTRUCTURE G.P.A.
www.asce.org/reportcard
tranSPortation
107www.asce.org/reportcard
authorizE a new federal surface transportation policy using a needs-based approach to determine funding;
incrEasE access to public transit services to reduce congestion in urban areas and connect to suburban and rural areas;
implEmEnt a “mode-neutral” planning process that examines the specific needs of metropolitan areas and regions and implements the most effective transportation mode to meet those needs.
Facts About TRANSIT
DtRAnSit
ESTIMATED 5-YEAR FUNDING REQUIREMENTS FOR transit
Total investment needs $265 billion
Estimated spending$74.9 billion
Projected shortfall$190.1 billion

108 2009 Report Card for America’s Infrastructure www.asce.org/reportcard
ConDitionS
In recent years, transit use has increased more rapidly than any other mode of transportation. Ridership increased by 25% from 1995 to 2005—to 10.3 billion trips a year, the highest number of trips in 50 years. An estimated 34 million trips are taken on public transportation each week-day and of those trips, 59% are taken by individuals commuting to and from work, 11% by individuals traveling to and from school, and 9% by individuals traveling to and from leisure activities.1 By moving workers and shoppers, transit is increas-ingly becoming a major economic factor.
In 2004, there were 640 local public transit operators serving 408 large and small urbanized areas and 1,215 opera-tors serving rural areas. In addition, there were 4,836 specialized services for the elderly and disabled in both urban and rural areas, representing a total increase in these types of services since 2002. These systems operate more than 120,659 vehicles. Transit rail operators controlled 10,892 miles of track and served 2,961 sta-tions. Between 2000 and 2004, the num-ber of urban transit vehicles increased by
13.4%, track mileage grew by 3%, and the number of stations grew by 4.8%. Also during that time, the number of pas-senger miles traveled by all transit pas-sengers increased at an annual rate of 1.3% between 2002 and 2004. Passenger growth on transit rail lines grew at an even greater rate, 4.3%.2
SAFETEA-LU, which will expire on September 30, 2009, authorized more than $45 billion in transit investments. How-ever, the increased popularity of transit—as evidenced by robust increases in transit ridership and strong support for local funding initiatives—has led to growth in both the number and size of transit sys-tems in the U.S. While new investment brings badly needed transit service to more Americans, existing systems con-tinue to require investments to replace aging infrastructure; thus, the revenue that is available must be spread further than ever before. At the same time, dwin-dling revenues in the Highway Trust Fund impact the transit sector’s financial health at a time when more Americans are rely-ing on it for travel.
While mass transit can be an afford-able and environmentally friendly travel alternative to automobiles, the Ameri-can Public Transportation Association (APTA) estimates that approximately half of Americans do not have access to reli-able transit systems. A 2005 survey con-ducted by the U.S. Department of Housing and Urban Development and the U.S. Cen-sus Bureau found that only 54% of Ameri-can households have access to bus and rail transit and only 25% have what they con-sider a good alternative to such transit.
Indicating an increase in service demand, 23 of 32 (72%) of local ballot initiatives for public transportation—or initiatives with a public transit component—were passed in 2008, authorizing nearly $75 billion in expenditures.

Facts About TRANSIT 109www.asce.org/reportcard
The Federal Transit Administration (FTA) rates system conditions on a five-point scale—one being poor and five being excellent. FTA’s 2006 Conditions and Per-formance Report indicates that the condi-tion of the nation’s transit infrastructure remained largely unchanged during the past four years. The estimated average condition of the urban bus fleet was 3.08 in 2004, a minor improvement from 3.07 in 2000. The average bus age was reported to be 6.1 years, down slightly from 6.8 years in 2000. The estimated average con-dition of rail vehicles was 3.5 in 2004, down from 3.55 in 2000.2
While bus and rail fleet conditions have remained essentially the same, rail transit station conditions have worsened. Only 49% of stations are in adequate or good repair and 51% are in substandard or worse condition. In 2000, 84% of stations
TABLE 12.1 ★ Traffic Delay Reduction Due to Public Transportation
averageannualpopulationgroup passenger-miles Hoursofdelay percentof dollarssavedandnumberofareas oftravelinmillions inmillions basedelay inmillions
Very Large 37,691 430 1,700% $8,091
Large 5,459 64 700% $1,193
Medium 1,665 15 400% $270
Small 287 1 300% $26
Other 6,324 31 500% $574
National Urban Total 51,426 541 1,300% $10,154
SoURCE Urban Mobility Report, Texas Transportation Institute, 2007
were rated as adequate or better. The Fed-eral Highway Administration notes that differences in ratings are due to a change in the methodology used to evaluate sta-tion conditions since the last report.2 The condition of such other structures as tun-nels and elevated structures has improved: 84% were in adequate or better condition in 2004 compared to 77% in 2000.2
Funding increased modestly between 2000 and 2004. Indicating an increase in service demand, 23 of 32 (72%) of local ballot initiatives for public transporta-tion—or initiatives with a public transit component—were passed in 2008, autho-rizing nearly $75 billion in expenditures.1 Much of this local revenue is intended to match federal investments. Total capital spending from all sources was $12.6 bil-lion in 2004, up from $12.3 billion in 2002, and up more than 140% during the past 15

110 2009 Report Card for America’s Infrastructure www.asce.org/reportcard
physical condition of the nation’s transit systems will improve.3 With a “medium” level of funding—between $14 and $18 bil-lion a year—the Commission estimates that between 26,000 and 51,000 new vehi-cles could be added to the system and that between 1,100 and 1,500 additional miles of rail track could be laid. In addition, average condition will increase to 4.0 and the system will be able to accommodate between 12 and 14 billion trips annually by 2020. During that same time period, with a “high” level of funding—between $21 and $32 billion annually—between 51,000 and 96,000 new vehicles could be added to the fleet and between 3,000 and 4,400
TABLE 12.2 ★� Revenue Sources for Transit Financing in Millions of Dollars: 2004
federal state local total %
General Fund 1,391 2,043 2,692 6,126 16%
Fuel Tax 5,564 505 148 6,217 16%
Income Tax 187 98 285 1%
Sales Tax 2,106 4,765 6,871 17%
Property Tax 63 490 553 1%
Other Taxes 1,044 784 1,828 5%
Other Public Funds 1,844 4,682 6,526 17%
Total Public Funds 6,955 7,792 13,659 28,406 72%
Passenger Fares 9,114 9,114 23%
Other Revenue 1,979 1,979 5%
System-General Revenue 11,093 11,093 28%
Totals 6,955 7,792 24,752 39,499 100%
years. Federal contributions totaled $9.8 billion in 2008.2
The FTA estimates that an additional $6 billion should be spent annually to maintain current conditions; however to improve conditions, a total of $21.6 billion needs to be spent annually.2 These esti-mates are supported by the recent find-ings of the Federal Surface Transportation Study and Revenue Commission. Assum-ing a constant level of investment relative to 2006 dollars, transit ridership will con-tinue to increase unimpeded to between 18 and 20 billion trips annually. If funding is increased, however, transit ridership will be able to increase more rapidly and the

Facts About TRANSIT 111www.asce.org/reportcard
SALT LAKE cITy, UT ★ Utah Transit Authority Transit Express (TRAx)
Since its inception as a way to move spec-tators during the 2002 Olympic Winter Games, the Salt Lake City transit sys-tem, Transit Express (TRAX), has served the city and its surrounding suburbs as a quick and affordable way to travel. When the first line opened in 1999, estimates predicted that the system would move approximately 15,000 people a day. How-ever, current statistics from APTA show that ridership has increased exponentially, to approximately 53,000 customers a day in the last quarter of 2008. There are now plans to add at least 3 new lines to the 19-mile system, extending it to the airport and farther into the growing suburbs. Photos courtesy of Utah Transit Authority Transit Express.

112 2009 Report Card for America’s Infrastructure www.asce.org/reportcard
The Denver-area Regional Transporta-tion District operates a complex transit system that includes bus and light-rail service from the suburbs to the city center. The development of six light-rail lines has eliminated the need for many bus lines and other special ser-vices, including bus service to the air-port and sporting events, which helps alleviate congestion on the region’s roadways. During the first quarter of 2008, ridership on light rail increased
7.19% from the same period in 2007, according to APTA. Photo courtesy of LightRailNow, photo by Dave Dobbs.
DENvER, co ★� Regional Transportation District Transit System
MISSoULA, MT ★ Missoula Urban Transportation District (Mountain Line)
The Missoula Urban Transportation District, or Mountain Line, began operating in 1977 with three used buses on four routes. Since then the agency has grown to operating 6 days per week and now boasts 30 buses, 12 routes, and 55 employees. In 2008, the
Mountain Line provided more than 800,000 rides to customers in this community of approximately 90,000 residents. In July 2008—typically a slower time of year for the agency—the Mountain Line experienced its highest summer ridership levels ever, show-ing a 30% increase over the previous year. Customer service calls indicated a swell of first-time riders seeking to decrease the cost of commuting to work. Despite decreasing gas prices, ridership remains high. Photo courtesy of Missoula, Montana Office of Planning and Grants.

Facts About TRANSIT 113www.asce.org/reportcard
miles of track could be laid. The number of annual trips could increase to between 13 and 17 billion.3
The 2008 State and National Public Transportation Needs Analysis, commis-sioned by APTA and the American Associa-tion of State Highway and Transportation Officials, estimated the total funding requirements for various growth per-centages. Assuming a moderate annual passenger growth rate of 3.52%, $59.2 bil-lion must be spent annually by all levels of government in order to improve both infrastructure condition and service perfor-mance. Total expenditures by all levels of government in 2007 were $47.05 billion.4
RESiliEnCE
Transit systems are key contributors to a region’s economic vitality and emer-gency preparedness. And when properly implemented, transit systems offer signifi-cant environmental benefits. The current U.S. transit system is not highly resilient because of a lack of integrated systematic planning, security mitigations, and ade-quate funding. While underground tran-sit systems typically perform well during natural hazards, they remain vulnerable to terrorist attacks. Despite these vulner-abilities, transit systems are often called upon to move people in times of disaster. Those vulnerabilities must be overcome to ensure that transit systems will perform well when needed.
While mass transit can be an affordable and environmentally friendly travel alternative to automobiles, the American Public Transportation Association (APTA) estimates that approximately half of Americans do not have access to reliable transit systems.

114 2009 Report Card for America’s Infrastructure www.asce.org/reportcard
ConClUSion
The increased ridership on transit sys-tems across the country and local support for new and expanding systems is a clear sign that Americans want transit to take a larger role in the country’s surface trans-portation system. Yet years of underfund-ing and unreliable service threaten the economic and environmental benefits that transit can provide.
Transit systems must become an inte-grated part of any community’s trans-portation planning process and receive adequate funding to encourage further growth. Greater emphasis must be placed on connecting rural and suburban areas through transit to ease congestion, pro-vide assistance to Americans with limited mobility, and develop local economies.
Current conditions, coupled with an uncertain economic climate, raise con-cerns for transit. Future investments must focus on additional, systemwide travel options; technological innovations; life-cycle funding; modernization to support future growth; increased network redun-dancy and connectivity; and improved design and construction standards to withstand both natural and man-made extreme conditions. ★
SoURCES1 American Public Transportation Association, 2008 Public Transportation Factbook, June 2008.
2 U.S. Department of Transportation, Status of the Nation’s Highways, Bridges, and Transit: 2006 Conditions and Performance, 2007.
3 National Surface Transportation Policy and Revenue Study Commission, Final Report, 2008.
4 American Public Transportation Association and the American Association of State Highway and Transportation Officials, State and National Public Transportation Needs Analysis, September 2008.

Facts About TRANSIT 115www.asce.org/reportcard
Even in the car-dominant culture of Southern California, the Orange County Transporta-tion Authority (OCTA) ranks as one of the busiest transportation authorities in the nation, oper-ating a 650-vehicle bus system with approximately 65.5 mil-lion customer boardings annu-ally. APTA recognized OCTA as the number one transportation agency in 2005 for achievement in safety and paratransit ser-vice, as well as record ridership growth. The system also works to protect the environment by operating a large fleet of clean-burning vehicles. OCTA contin-ues to experience exceptional ridership growth, reaching 6.3 million boardings in Octo-ber 2008—the highest in the agency’s 36-year history. Pho-tos courtesy of Orange County Transportation Authority.
oRANGE coUNTy, cA ★ orange county Transportation Authority

PUBLIC PARKS AND RECREATION
Parks, beaches, and other recreational facilities contribute $730 billion per year to the U.S. economy, support nearly 6.5 million jobs, and contribute to cleaner air and water and higher property values. Despite record spending on parks at the state and local level, the acreage of parkland per resident in urban areas is declining. While significant investments are being made in the National Park Service for its 2016 centennial, the agency’s facilities still face a $7 billion maintenance backlog.
Public facilitieS
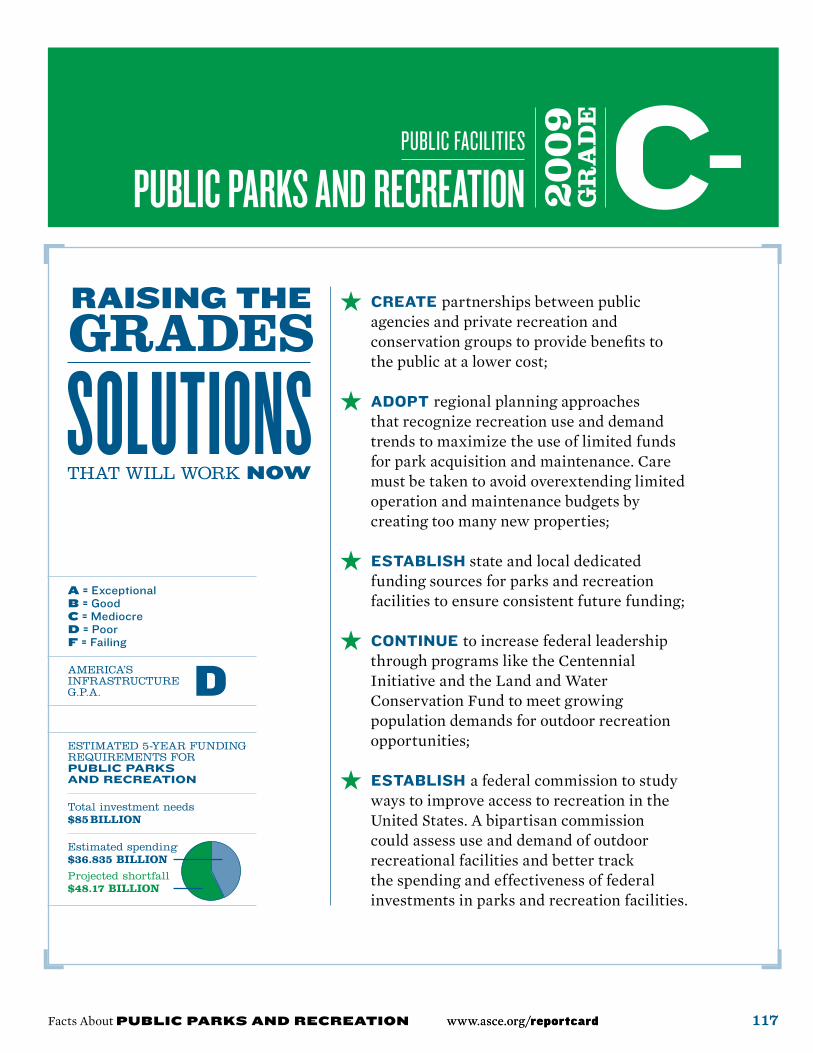
A = ExceptionalB = GoodC = MediocreD = PoorF = Failing
AMERICA’SINFRASTRUCTURE G.P.A.
www.asce.org/reportcard
Public facilitieS
117www.asce.org/reportcard
crEatE partnerships between public agencies and private recreation and conservation groups to provide benefits to the public at a lower cost;
aDopt regional planning approaches that recognize recreation use and demand trends to maximize the use of limited funds for park acquisition and maintenance. Care must be taken to avoid overextending limited operation and maintenance budgets by creating too many new properties;
Establish state and local dedicated funding sources for parks and recreation facilities to ensure consistent future funding;
continuE to increase federal leadership through programs like the Centennial Initiative and the Land and Water Conservation Fund to meet growing population demands for outdoor recreation opportunities;
Establish a federal commission to study ways to improve access to recreation in the United States. A bipartisan commission could assess use and demand of outdoor recreational facilities and better track the spending and effectiveness of federal investments in parks and recreation facilities.
Facts About PuBLIC PARKS AND RECREATIoN
c-PUBliC PARKS AnD RECREAtion
ESTIMATED 5-YEAR FUNDING REQUIREMENTS FOR public parks anD recreation
Total investment needs $85 billion
Estimated spending$36.835 billion
Projected shortfall$48.17 billion

118 2009 Report Card for America’s Infrastructure www.asce.org/reportcard
ConDition
State/local ParksAmericans frequent their state and local parks more often than national parks. State parks entertained more than 730 million visitors during the period July 2006 through June 2007, and the vast majority (90.9%) were day visitors. Dur-ing this time, states acquired 56,681 acres of parkland and spent more than $463 million on new construction of state park improvements to accommodate growing populations.1
States and territories received nearly $28 million in federal funds in 2007 through the Land and Water Conservation Fund Program. However, they reported more than $15 billion in unmet needs, a significant increase over the amount reported in 2006.2
The 75 largest cities in the U.S., home to more than 51 million Americans, reported spending just under $5 billion in fiscal year 2006 on urban park and recreation facilities and programming, adding more than 5,000 acres of green space. Despite such record spending, the amount of park-land per resident has declined due to rapid
increases in population. In 2006, the 60 largest cities averaged 18.88 acres of park-land per 1,000 residents. In 2007, that number fell to 16.72 acres per 1,000 resi-dents.3 As suburban areas become more densely populated with infill develop-ments, parkland will become more impor-tant in maintaining residents’ health, safety, and stable property values.
Parks enjoy broad public support. Even in the current troubling economic environment, voters in November 2008 approved a record amount of new fund-ing measures for parks and open space. Voters supported 62 of 87 (71%) conserva-tion finance ballot measures, represent-ing a commitment to spend $7.3 billion on parks and open space. The $8.4 billion total approved by ballot measures in all of 2008 is the highest single-year amount in 10 years.4
Parks spending may be an easy tar-get for budget hawks, but in reality state spending on parks represents a miniscule part of overall expenditures—0.231% on average. California’s percentage was the highest in the country, but is still less than 1% of the overall state budget (0.979%).1 A lack of consistent data to track usage of state and local parks makes it difficult to determine unmet needs and to benchmark against other states and communities.
national ParksDuring the second half of the 20th cen-tury, the National Park Service (NPS) suffered from stagnant budget appropria-tions, even as popularity and use skyrock-eted. The result was an estimated $6.1
Parks spending may be an easy target for budget hawks, but in reality state spending on parks represents a miniscule part of overall expenditures—0.231% on average.

Facts About PuBLIC PARKS AND RECREATIoN 119www.asce.org/reportcard
billion maintenance backlog by the begin-ning of the 21st century. The NPS consists of 391 units covering 84 million acres in 49 states, the District of Columbia, and 5 ter-ritories. National parks entertained more than 274 million visitors in fiscal year 2007, up from 266 million in 2003.
To address the staggering mainte-nance backlog, the Bush administration first undertook a comprehensive effort to inventory its assets and better manage improvements. It also committed $4.9 bil-lion over 5 years to directly address park facilities and maintenance beginning in fiscal year 2002. The NPS received $2.39 billion in 2008.
In 2006, the Bush administration estab-lished the Centennial Initiative, aimed at
TABLE 13.1 ★ Acres of Protected Land
totalacres protectedacres %ofregionregion protected percapita protected
Mid-Atlantic 10,304,151.6 0.18 9.2%
Midwest 30,139,330.5 0.45 6.3%
New England 4,839,352.7 0.34 12.0%
Rocky Mountain 95,015,799.3 9.06 29.0%
Southeast 28,960,508.7 0.44 9.7%
Southwest 37,250,994.8 1.04 10.3%
West 267,143,832.8 5.21 41.5%
Total 473,653,970.5 1.57 20.5%
SoURCE National Trust for Public Land, Conservation Almanac
preparing for the 100th anniversary of the founding of the NPS. The Centennial Ini-tiative provides federal matching funds to supplement private donations to enhance parks across the country according to the NPS strategic goals.5
BeachesThe United States has more than 84,000 miles of coastline that includes invalu-able economic, environmental, and rec-reational resources. Coastal areas receive about 85% of tourist-related revenues in the U.S., contributing an estimated $322 billion annually to the economy.6 Nearly one quarter of our coastline is suf-fering from erosion and yet the federal government has no policy to assess and

120 2009 Report Card for America’s Infrastructure www.asce.org/reportcard
address the most critically eroded shore-lines.7 As the rate of coastal erosion has increased, federal expenditures to repair erosion have actually decreased, exposing lives, infrastructure, and environmental resources to the hazards associated with increasingly strong storms.
U.S. Army Corps of Engineers FacilitiesThe U.S. Army Corps of Engineers is the largest federal provider of outdoor recreational services. More than 4,200 recreation areas are located on Corps-managed lands in 42 states. About 1,800 of these areas are operated and main-tained by other entities, such as state and local governments, under leases or license agreements.
The vast majority (70%) of Corps sites are located within 50 miles of a major metropolitan area, making recreation opportunities easily accessible to many Americans. Corps facilities entertained 372 million visits in 2007, resulting in $13 billion in total trip expenses and $5 bil-lion in durable goods, including $8 billion spent by visitors in communities around Corps lakes. This recreation contributes approximately $22.4 billion to the national economy and supports around 350,000 jobs.
The condition of Corps-managed rec-reation areas as well as those of its part-ners is a growing concern. More than 90% of Corps lake projects were constructed before 1980 and more than 30% are at least 50 years old. Flat budgets in recent years have led to the partial or full clo-sure of 74 recreational areas in five states. This has led to a $4.25 million loss in eco-
nomic benefits to the local communities. Further, Corps recreational areas have not kept pace with changes in equipment and use patterns of today’s diverse popu-lation. New uses for Corps lakes, such as sailboarding, were never anticipated when most Corps facilities were designed.8
RESiliEnCE
Parks are an important asset to the nation’s economy and environment. With limited funds available, little or no atten-tion is currently paid to the resilience of the national park system. Balancing site security with access is taxing and often unsuccessful. A failure to protect these national treasures will strongly affect the heritage and identity of future genera-tions. Future investments must address life-cycle maintenance, security, risk man-agement, and system robustness.
ConClUSion
Parks serve many roles in the lives of Americans, providing recreation oppor-tunities, jobs, and economic development as well as increased property values for adjacent private properties. Yet funding sources are inconsistent, and park facili-ties in many areas suffer from neglect—especially in times of tight budgets—even as their popularity and demand soars. Our federally funded national parks are not immune to these problems, suffering from deferred maintenance despite the rising numbers of visitors. At the state and local level, dedicated sources of revenue for parks and open spaces need to be identi-

Facts About PuBLIC PARKS AND RECREATIoN 121www.asce.org/reportcard
FIGURE 13.1 ★ visits to National Parks
260,000,000
265,000,000
270,000,000
275,000,000
280,000,000
285,000,000
290,000,000
SoURCE National Park Service
UNITED STATES ★ The Trust for Public Land
The Trust for Public Land has part-nered with state and local governments across the country to set aside and restore parkland, both in urban and rural areas. From schoolyards in New York City to clean water initiatives in Minnesota and urban trails in Atlanta, they have worked to raise funds from private sources and pass bond referenda to support creation and rehabilitation of open spaces.9 RiGHt: The Trust for Public Land formed an ongoing partner-ship with the New York City Depart-ment of Education and several other
public and private donors to reha-bilitate schoolyards across the city, including this one in the Red Hook section of Brooklyn. Photo courtesy of Julieth Rivera, Trust for Public Land.

122 2009 Report Card for America’s Infrastructure www.asce.org/reportcard
UNITED STATES ★� The National Park Service
At the close of the 20th century our treasured national parks were suffering from years of flat budgets and deferred maintenance. Administrators in Washington, D.C., and other regions could not even estimate accurately the total maintenance backlog, which the Government Accountability Office estimated at $5 billion in 1998, but has been reported as high as $9 billion. In 2001, the National Park Service embarked on developing an asset management program to inventory and assess the conditions of its structures, roads and other facilities, and then establish a program of rehabilitation and maintenance. Since then, significant strides have been made in reducing the maintenance backlog, and the National Park Service has set goals to quantify its success in this area.5
PoRTLAND, oR ★�State-Local Government Partnerships
Partnerships between state and local govern-ment entities that share common recreation goals can help maximize limited funds, espe-cially in concentrated urban environments. For example, Portland’s Parks and Recreation Department shares facilities with school dis-tricts, coordinates land and water resource management and use with other regional agencies and raises money for equipment and facilities by partnering with corporations and other nonprofit groups.10 PHotoS, toP to BottoM: Stu-dents in Portland, Oregon help clean up the Elk Rock Island Natural Area. Created from an outmoded road that separated the water-front area from the rest of the city, Portland, Oregon’s Waterfront Park exemplifies the city’s success in creating multi-purpose recreation areas. Photos courtesy of Portland Department of Parks and Recreation.

Facts About PuBLIC PARKS AND RECREATIoN 123www.asce.org/reportcard
fied to ensure quality facilities for future generations. The National Park System should continue its Centennial Initiative to increase investment in park improve-ments leading up to the 100th anniversary in 2016. In addition, parks at all levels will benefit from a comprehensive assessment of usage and needs by an independent commission. ★
SoURCES1 National Association of State Park Directors, 2008 Annual Information Exchange: for the period covering 1 July 2006–30 June 2007, July 2008
2 National Park Service, Land and Water Conservation Fund, 2007 Annual Report
3 The Trust for Public Land, Center for City Park Excellence, “Cities Getting Greener, But Not Fast Enough to Keep Up,” July 2008
4 The Trust for Public Land, “Conservation Funding Wins Big at the Ballot” press release, November 5, 2008
5 Department of Interior, National Park Service, “Bureau Highlights, FY 2009 Budget Justifications”
6 Houston, James R., “The Economic Value of Beaches—A 2008 Update,” Shore & Beach: Journal of the American Shore & Beach Preser-vation Association
7 American Shore & Beach Preservation Association
8 U.S. Army Corps of Engineers, Natural Resources Management
9 The Trust for Public Land website, “Success Stories” series, www.tpl.org
10 Center for City Park Excellence, The Trust for Public Land, “How Much Value Does the City of Philadelphia Receive from its Park and Recre-ation System?”, June 2008
other Resources:
Resources for the Future, The Policy Path to the Great Outdoors: A History of the Outdoor Recre-ation Review Commissions, October 2008
Outdoor Industry Foundation, “The Active Out-door Recreation Economy,” Fall 2006
U.S. Census Bureau, Special District Governments by Function and State: 2002
Department of Agriculture, “FY 2009 Budget Request,” Natural Resources and Environment, Forest Service
National Park Service, Summary of Park Centen-nial Strategies, August 2007
National Park Service, The Future of America’s National Parks, May 2007
Department of Commerce, National Oceanic and Atmospheric Administration, National Ocean Service, Coastal Trends Report Series, Population Trends Along the Coastal United States: 1980–2008, September 2004
Natural Resources Management Division, U.S. Army Corps of Engineers, Washington, D.C.
Chris Walker, “The Public Value of Urban Parks,” part of the Beyond Recreation: A Broader View of Urban Parks series by the Urban Institute, June 2004

schools
Spending on the nation’s schools grew from $17 billion in 1998 to a peak of $29 billion in 2004. However, by 2007 spending fell to $20.28 billion. No comprehensive, authori-tative nationwide data on the condition of America’s school buildings has been collected in a decade. The National Education Asso-ciation’s best estimate to bring the nation’s schools into good repair is $322 billion.
Public facilitieS

A = ExceptionalB = GoodC = MediocreD = PoorF = Failing
AMERICA’SINFRASTRUCTURE G.P.A.
www.asce.org/reportcard
Public facilitieS
125www.asce.org/reportcard
publish regular updates of the Department of Education report Condition of America’s Public School Facilities: 1999 to ensure a clear view of conditions nationwide;
ExpanD federal tax credits to support increased use of school construction bonds;
continuE and incrEasE federal grants for high-poverty, high-need school districts;
EncouragE school districts to explore alternative financing, including lease financing and financing/ownership/use arrangements, to facilitate construction;
EncouragE school districts to adopt regular, comprehensive construction and maintenance programs;
incrEasE the emphasis on research and development for design and construction to meet the rapidly changing teaching environment;
Establish a federal, multiyear capital budget for public works infrastructure construction and rehabilitation similar to those used by state and local governments;
EncouragE the use of life-cycle cost analysis principles to evaluate the total costs of projects;
consiDEr direct federal funding for school construction.
Facts About SCHooLS
DSCHoolS
ESTIMATED 5-YEAR FUNDING REQUIREMENTS FOR scHools
Total investment needs $160 billion
Estimated spending$125 billion
Projected shortfall$35 billion

126 2009 Report Card for America’s Infrastructure www.asce.org/reportcard
ConDitionS
Assessing the conditions of the nation’s public school facilities remains a difficult process. There have been no comprehen-sive federal reports since the Department of Education report Condition of America’s Public School Facilities: 1999.4 That report provided a detailed snapshot of conditions across the nation and concluded that a substantial number of schools are in poor condition. The report concluded that $127 billion was needed to bring the nation’s schools into good operating condition. An earlier report by the General Accounting Office (February 1995) concluded that one-third of the nation’s schools needed exten-sive repair or replacement and that $112 billion was needed to bring the nation’s public schools into an overall good condition.13
Some effort has been made. In 2005, the National Center for Education Statistics
surveyed public school principals to deter-mine the extent to which various environ-mental factors interfered with classroom instruction. A majority of respondents—44%—reported at least some interfer-ence: 33% reported minor interference; 9% reported moderate interference, and 1% reported major interference. The sur-vey also found that while 15% of schools are overcrowded, 30% of students attend schools that are overcrowded. The report also noted that 37% of schools use portable buildings. However, this report lacks the detail of the earlier report and does not include estimates of needs or costs.12
The lack of adequate information has been noted at several levels. At a hearing of the House Education and Labor Com-mittee in February of 2008, Representa-tive Bob Etheridge (D) of North Carolina noted that “part of the problem we have had grappling with this problem from the federal level is a lack of reliable numbers
PoRTLAND, oR ★ Seismic Retrofits
Nearly half of Oregon’s schools—most built prior to 1960, 10 years before statewide seismic build-ing codes were adopted—are at risk of collapse if the state experiences a major earthquake along the Cascadia Fault. In 2005, voters approved a $1-billion bond measure to seismically retrofit schools and other high-risk facilities by 2032.14 Photo courtesy of Portland Public Schools.

FIGURE 14.1 ★ School construction in Billions of Dollars: 1998–2007
SoURCE 34th Annual Official Education Construction Report
A
2007
2006
2005
2004
2003
2002
2001
2000
1999
1998
2007
2006
2005
Facts About SCHooLS 127www.asce.org/reportcard
in real time.”16 Even at the state level ade-quate numbers are hard to find.
The following facts illustrate the scope of the nation’s K–12 public school enter-prise. In the 2008–2009 school year:
49.8 million students are enrolled in public elementary and secondary schools;Public schools employ about 3.3 million teachers;There are 14,200 public school districts containing about 97,000 public schools;Expenditures for public elementary and secondary schools are about $519 billion;The national average spending per student in the 2005–2006 school year is about $10,418, up from $9,154 per student.6
Despite increasing federal mandates on school performance, school facilities
★
★
★
★
★
in the United States are primarily a local responsibility and there is ample evidence that local communities are struggling to meet this responsibility. In 31 states, lawsuits have challenged the adequacy or equity of public education and have included facilities as elements of their cases.7
While detailed conditions and needs numbers do not exist, we do have up-to-date numbers on spending levels. According to the American School and University’s 34th Annual Official Education Construction Report, school construction completed in 2007 (which included both new construction and renovations) totaled more than $20.2 billion. That is down from a peak of $29 billion in 2004. The downward trend is expected to continue: with $52.7 billion in funding is projected between 2008 and 2010. This represents a

128 2009 Report Card for America’s Infrastructure www.asce.org/reportcard
cINcINNATI, oH ★ School Modernization Program
Cincinnati Public Schools, Ohio’s third-largest public school district, has approximately 70 schools spread across a 90-square-mile area. Beginning in 2002, it embarked on a major, 10-year long initiative to upgrade its educational facilities, turning them into modern 21st century learn-ing environments. In addition to tearing down schools that were outmoded and/or underutilized, ongoing con-struction projects include both new buildings and exten-sive renovations of often architecturally significant older buildings, all carried out under the district’s $985 million Facilities Master Plan. Photo courtesy of Cincinnati Public Schools, photo by Robert Flischel.
significant decrease from the $68.4 billion spent between 2005 and 2007.1
Engineering News-Record reports that despite the record breaking demands of student population growth, market conditions threaten to delay or kill proj-ects and programs that until very recently seemed economically feasible. The cause is problems in the financial sector and declining revenues for states and local governments. Examples cited included delays on 12 major school construction projects in Maine, and the decision not to build an elementary school in Cumberland County, North Carolina, because of the failure to find buyers for the county’s construction bonds.9
Examples of the coming slowdown include the recently released budget in New York City, which contained a reduc-
tion in construction of new schools from the 76 announced in 2003 to 42 following the latest round of budget cuts.
Other estimates include $9 billion needed for new construction and $3.5 bil-lion needed for modernization of public school facilities in California8 and $9.7 billion needed statewide between 2008 and 2012 for school facilities in North Carolina.18
While spending is decreasing, the trend in school enrollment continues to rise. There were 48.9 million public school stu-dents in school year 2005–2006, up from 48.1 million in the 2002–2003 school year. According to the National Center for Education Statistics, public and private school enrollments will grow 7% from 2007–2016.6

Facts About SCHooLS 129www.asce.org/reportcard
cAMDEN, NJ ★ Improvements to camden High School
Scaffolding surrounding the 90-year-old Camden High School protects students and teachers from debris falling from the crumbling façade.15 To combat the dangers of deteriorating school buildings, a new agency, the New Jersey Schools Development Authority (NJSDA), was created in 2000 and is responsible for implementing an overhaul of the educational infrastructure of hundreds of schools in districts throughout all 21 counties of the State of New Jersey. The New Jersey Educational Facilities Construction and Financing Act, which created the NJSDA, authorized $3.9 billion for school improvements.17 Photo courtesy of Camden City Public Schools.

FIGURE 14.2 ★ School construction vs. Enrollment: 1990–2007
SoURCE 34th Annual Official Education Construction Report
25
26
27
28
29
30
31
32
$9.0
$12.5
$16.0
$19.5
$23.0
$26.5
$30.0
0
10
20
30
40
50
60
20001999199819971996199519941993199219911990
25
26
27
28
29
30
31
32
45
48
51
54
57
60
0
10
20
30
40
50
60
20001999199819971996199519941993199219911990
130 2009 Report Card for America’s Infrastructure www.asce.org/reportcard
Another major concern is that despite increases in spending for school facili-ties earlier in this decade, the money has disproportionately gone to the nation’s wealthiest school districts while the neediest students continue to endure the most decrepit facilities. A report by Build-ing Education Success Together noted that over the decade of 1995 to 2004 public school districts built more than 12,000 new schools and managed more than 130,000 renovation and improve-ment projects. However, the least affluent school districts made the lowest invest-ment ($4,800 per student) while the most
affluent districts made the highest invest-ment ($9,361 per student).3
RESiliEnCE
The nation’s schools serve as pillars of local communities and often serve a dual purpose as disaster-relief shelters. As local govern-ments hold the prime responsibility for funding schools, the economic downturn has had a negative impact on rehabilitation, modernization, and security improvements.
School facilities are not currently consid-ered resilient because of decreased funding and increased capacity, the failure of designs
� Construction in billions
25%
26%
27%
28%
29%
30%
31%
32%� Enrollment in millions
25%
26%
27%
28%
29%
30%
31%
32%

Facts About SCHooLS 131www.asce.org/reportcard
to adapt to the ever changing learning envi-ronment, and the lack of system redundancy.
In order to achieve continuous assur-ance of service, future investments should consider life-cycle maintenance, rapid recovery, alternative services, security, and condition and risk assessment.
ConClUSion
A significant problem in determining the condition of the nation’s schools is the lack of reliable information. No comprehensive, authoritative data have been collected in 10 years. Spending on school construction and modernization, for which data do exist, has trended positive for much of the last 10 years, increasing from $17 billion in 1998 to a peak of $29 billion in 2004. The trend since 2004, however, has reversed and was down to $20.7 billion in 2007. Barring dra-matic change in economic conditions, this downward trend will likely continue, cou-pled with the known needs of 10 years ago and increasing student enrollments, gives little hope for improvement. ★
SoURCES1 Argon, Joe, 34th Annual Official Education Construction Report, American Schools and Uni-
versities, May 15, 2008.
2 Abramson, Paul, The 2008 Annual School Con-struction Report, School Planning & Management, February 2008.
3 American Federation of Teachers, Building Minds, Minding Buildings: Turning Crumbling Schools into Environments for Learning, 48-0165, December 2006.
4 U.S. Department of Education, Center For Edu-cation Statistics, NCES 2000-032, Condition of America’s Public School Facilities: 1999, June 2000.
5 Education: Everybody’s Business Coalition to Hold Public Forums on School Facility Needs, www.ncpublicschools.org, January 8, 2007
6 National Center for Education Statistics, Fast Facts: http://nces.ed.gov/fastfacts.
7 BEST—Building Educations Success Together, Growth and Disparity: A Decade of U.S. Public School Construction, October 2006.
8 Moore, Kathleen, California Department of Education, testimony before the Committee on Education and Labor, U.S. House of Representa-tives, February 13, 2008.
9 Nicholson, Tom, “Education”, Engineering News-Record, November 24, 2008.
10 NJ.com, Local NJ News, www.nj.com Decem-ber 11, 2008.
11 U.S. Department of Education, Institute of Educational Sciences, Numbers and Types of Pub-lic Elementary and Secondary Schools from the Common Core of Data: School Year 2005–2006.
12 U.S. Department of Education, National Cen-ter for Education Statistics, Public School Princi-pals Report on Their School Facilities: Fall 2005, NCES 2007-007.
13 General Accounting Office, School Facilities: Condition of America’s School, GAO/HEHS-95-61, February 1995.
14 Wang, Yumei and Burns, Bill, “Oregon’s Pub-lic School and Emergency Facilities,” AEG News, Association of Environmental & Engineering Geologists, March 2006.
15 Katz, Matt, Teachers: Camden High Is In Shambles: www.Matt-Katz.com.
16 Etheridge, Bob, Statement before the Com-mittee on Education and Labor, U.S. Congress, February 13, 2008.
17 New Jersey Schools Development Authority (SDA), About SDA: www.njsda.gov.
other Resources:
Filardo, Mary, Good Buildings, Better Schools, An economic stimulus with long-term benefits, Economic Policy Institute, April 29, 2008.
Medina, Jennifer, “With Budget Shrinking, Schools will get Fewer New Buildings,” New York Times, November 5, 2008.

energY
Progress has been made in grid reinforcement since 2005 and substantial investment in generation, transmission, and distribution is expected over the next two decades. Demand for electricity has grown by 25% since 1990. Public and government opposition and difficulty in the permitting processes are restricting much needed modernization. Projected electric utility investment needs could be as much as $1.5 trillion by 2030.

A = ExceptionalB = GoodC = MediocreD = PoorF = Failing
AMERICA’SINFRASTRUCTURE G.P.A.
www.asce.org/reportcard 133www.asce.org/reportcard
maintain and ExpanD power generation and transmission infrastructure to meet increased demand projections and maintain the nation’s energy security;
improvE the electricity infrastructure system to support an integrated operation and control scheme that provides reliable and safe electricity;
DEsign and construct adequate transmission infrastructure to provide reserve margins and operating capacity;
crEatE incentives to promote energy conservation and the development and installation of highly efficient fossil and nuclear generation and renewable technologies;
Establish a long-term generation research and development plan to extend current energy supplies through new and potential energy sources;
continuE research in areas related to improving and enhancing the nation’s transmission and generation infrastructure;
EDucatE the public and government officials of the function that the transmission infrastructure plays in the role of our society and the need for new transmission lines to support those expectations.
Facts About ENERGy
D+EnERGy
ESTIMATED 5-YEAR FUNDING REQUIREMENTS FOR energy
Total investment needs $75 billion
Estimated spending$45.5 billion
Projected shortfall$29.5 billion

134 2009 Report Card for America’s Infrastructure www.asce.org/reportcard
ConDitionS
There are more than 3,100 electric utili-ties in the United States. Among them are 213 stockholder-owned utilities that pro-vide power to about 73% of the customers; 2,000 public utilities run by state and local government agencies that provide power to about 15% of the customers; and 930 electric cooperatives providing power to about 12% of the customers. Additionally, there are nearly 2,100 nonutility power producers, including both independent power companies and customer-owned distributed energy facilities. The bulk of the power system consists of three inde-pendent networks: the Eastern Intercon-nection, the Western Interconnection, and the Texas Interconnection. These networks incorporate international con-nections with Canada and Mexico. Over-all reliability planning and coordination is provided by the North American Electric Reliability Council, a voluntary organi-zation formed in 1968 in response to the Northeast blackout of 1965. America oper-ates about 157,000 miles of high-voltage (greater than 230 kilovolts) electric trans-mission lines.1
The U.S. generation and transmis-sion system is at a critical point requiring substantial investment in new genera-tion, investment to improve efficiencies in existing generation, and investment in transmission and distribution systems. The transmission and distribution system has become congested because growth in electricity demand and investment in new generation facilities have not been matched by investment in new transmis-sion facilities. This congestion virtually prohibits outages required for proper maintenance and can lead to system wide failures in the event of unplanned out-ages. Electricity demand has increased by about 25% since 1990 while construc-tion of transmission facilities decreased by about 30%. While annual investment in new transmission facilities has gener-ally declined or been stagnant during the last 30 years, there has been an increase in investment during the past 5 years. Sub-stantial investment in generation, trans-mission, and distribution are expected over the next two decades and it has been projected that electric utility investment needs could be as much as $1.5 to $2 tril-lion by 2030. Some progress in grid rein-forcement has been made since 2005, but public and government opposition, dif-ficult permitting processes, and environ-mental requirements are often restricting the much-needed modernization.6
Congested transmission paths, or “bot-tlenecks,” now affect many parts of the grid across the country. One recent esti-mate concludes that power outages and power quality disturbances cost the econ-omy between $25 billion and $180 billion
While annual investment in new transmission facilities has generally declined or been stagnant during the last 30 years, there has been an increase in investment during the past 5 years.

Facts About ENERGy 135www.asce.org/reportcard
East Kentucky Power Cooperative has constructed one 345 kV line and another is under construction in central Kentucky. The 19-mile Smith to North Clark 345 kV transmission line was completed in 2006 and the 36-mile Smith to West Garrard 345 kV transmission line is currently under construc-tion and due to be completed in 2009. These EHV lines were constructed to complete a second EHV path across Kentucky to accom-modate the high level of north-south transfers that are common for the region. Photo cour-tesy of East Kentucky Power Cooperative.
vA / Wv�★��American Electric Power’s (AEP) Jacksons Ferry- Wyoming 765 kv Transmission Line
AEP’s Jacksons Ferry to Wyoming 765 kV line stretches across 90 miles of mountainous terrain from southern West Virginia to southwest Virginia. The project was built to reinforce sys-tem reliability and meet the need of increasing load in an area that had not had a major reinforcement in more than 35 years. It was energized in June 2006 and is one of the most techno-logically advanced transmission lines in the United States. The line is North America’s first utilization of a six-con-ductor bundle, which greatly reduces line losses and audible noise. Permit-
ting for the line began in 1990 and the final permit was obtained in 2002. The project’s construction required approval from two states and three federal agencies. Photo courtesy of American Electric Power.
KENTUcKy ★ Smith to North clark 345 kv Transmission Line

FIGURE 15.1 ★ construction Expenditures for Transmission in Millions of 2006 Dollars: 1977–2006
$2,000
$2,500
$3,000
$3,500
$4,000
$4,500
$5,000
$5,500
$6,000
$6,500
$7,000
$2,000
$2,500
$3,000
$3,500
$4,000
$4,500
$5,000
$5,500
$6,000
$6,500
$7,000A
SoURCE Edison Electric Institute Statistical Yearbook 2006
136 2009 Report Card for America’s Infrastructure www.asce.org/reportcard
annually. These costs could soar if outages or disturbances become more frequent or longer in duration. There are also opera-tional problems in maintaining voltage levels. Transmission problems have been compounded by the incomplete transition to fair and efficient competitive wholesale electricity markets. Because the existing transmission system was not designed to meet present demand, daily transmission constraints or “bottlenecks” increase elec-tricity costs to consumers and increase the risk of blackouts.3
Many new transmission lines have been proposed to either alleviate these con-gested paths or to provide redundancy so that existing portions of the transmis-sion system can be temporarily taken out of service for proper maintenance and modernization. In many cases funding is not the primary reason why these critical lines are not being built. Overly stringent permitting requirements, lawsuits, and other regulatory issues often inhibit con-struction of transmission lines.

Facts About ENERGy 137www.asce.org/reportcard
ARIZoNA ★�Palo verde to Pinal West 500 kv Project
On October 15, 2008, the Palo Verde-Pinal West Project went into commer-cial operation. The PV-PW Project will serve Pinal and Maricopa counties in Arizona and consists of a new 55-mile single circuit 500kV transmission line that connects the Palo Verde area to the new Pinal West Switchyard. The PV-PW Project has 6 Participants: Electrical District 2, Electrical District 3, Electrical District 4, Salt River Project, Southwest Transmission Coopera-tive and Tucson Electric Power Company. The capacity of the line is 1,400 MW and will increase the Arizona transmission system capacity in Pinal and Maricopa Counties. Photo courtesy of Black & Veatch.

138 2009 Report Card for America’s Infrastructure www.asce.org/reportcard
The distribution side of the grid system includes substations, wires, poles, meter-ing, billing, and related support systems involved in the retail side of electricity delivery. The need to expand the distribu-tion infrastructure and install new dis-tribution equipment to meet population and demand growth will require contin-ued investment. Electric companies are estimated to spend $14 billion per year on average over the next 10 years on distri-bution investment. Over the next decade, distribution investment is likely to exceed capital spending on generation capacity as well.
There is also a need to design our dis-tribution systems for a higher reliability. During Hurricane Wilma, a Category 2 hurricane, the winds were substantially below the design wind loads required by the National Electric Safety Code (NESC). The NESC excludes facilities less than 60 feet high from these wind load require-ments in the belief that most of these facilities are taken down by flying debris. But 75% of the distribution poles failed because of wind loads only. If these struc-tures had been designed for the 90 mph winds required by NESC on transmission structures, distribution outages would have been reduced. The NESC and utili-ties need to address the design of these structures to meet the current transmis-sion loading criteria. Utilities that make an investment to “harden” their distribution system should also be guaranteed a rate of return on their investment.
RESiliEnCE
The national electric grid currently lacks a significant degree of resilience. Utili-ties are generally prepared for local and regional responses; however, the national electric grid as a whole lacks a signifi-cant degree of resilience should a much broader response be required. Future investments in the system must improve system robustness, redundancy, and rapid recovery. Additionally, new technologies and behavioral changes focused on reduc-tion and increased efficiency are neces-sary. True system resilience will require a national effort to modernize the electric grid to enhance security and the reliabil-ity of the energy infrastructure and facili-tate recovery from disruptions to energy supply, from both natural and man-made hazards.
ConClUSion
The “information economy” requires a reliable, secure, and affordable electric system to grow and prosper. Unless sub-stantial amounts of capital are invested over the next several decades in new gen-eration, transmission, and distribution facilities, service quality will degrade and costs will go up. These investments will involve new technologies that improve the existing electric system and possibly advanced technologies that could revo-lutionize the electric grid. While much is still left to be accomplished, recent efforts have raised the grade to a “D+” in the 2009 Report Card. ★

Facts About ENERGy 139www.asce.org/reportcard
WIScoNSIN ★ Arrowhead to Weston 345 kv Transmission Line
The American Transmission Com-pany completed the 220-mile Arrow-head to Weston 345 kV transmission line in 2008. This project recently earned the ASCE State of Wisconsin Category D (over $20 million) Engi-neering Achievement Award. Origi-nally proposed by Wisconsin Public Service Corporation and Minnesota Power in 1998, the American Trans-mission Company (ATC) took over the Arrowhead to Weston project in 2002. In January 2008, 10 years after the project was first proposed and 4 years after the start of construction, crews completed the line, marking the first high-voltage infrastructure addition to the system in nearly 30 years.
At a total cost of $435 million, the Arrowhead to Weston project offered several major challenges in the devel-
opment, design, and construction phases. Now that the line is in ser-vice, it offers a significant benefit to the local and regional grid. Arrowhead Weston provides a reliable interstate connection to cheaper western genera-tion, as well as the opportunity to per-form much needed maintenance on the other lines that could not be accessed before. Photo courtesy of the American Transmission Company.
SoURCES1 U.S. Energy Department, Office of Electricity Delivery and Energy Reliability, Overview of the Electric Grid: www.energetics.com/ gridworks/grid.html.
2 U.S. Energy Department, Office of Electricity Delivery and Energy Reliability, 2006 Congestion Study: http://nietc.anl.gov/congestionstudy/.
3 U.S. Energy Department, Office of Electricity Delivery and Energy Reliability, 2009 Congestion Study: www.congestion09.anl.gov/ and com-ments at www.congestion09.anl.gov/involve/searchcomment/index.cfm.
4 Edison Electric Institute, Industry Issues, 2008.
5 Edison Electric Institute, EEI Principles on Transmission Investment, 2005.
6 KEMA, Inc. for Florida Power & Light Company, Technical Report: Post Hurricane Wilma Engineering Analysis, January 12, 2006: www.psc.state.fl.us/ utilities/electricgas/EIProject/docs/FPL_Pre_ Workshop_Responses-Wilma.doc.
7 U.S. Energy Department, Office of Electricity Delivery and Energy Reliability, Gridworks, 2008: www.energetics.com/gridworks/grid.html.
8 U.S. Energy Department, National Trans-mission Grid Study, 2002.

appendices
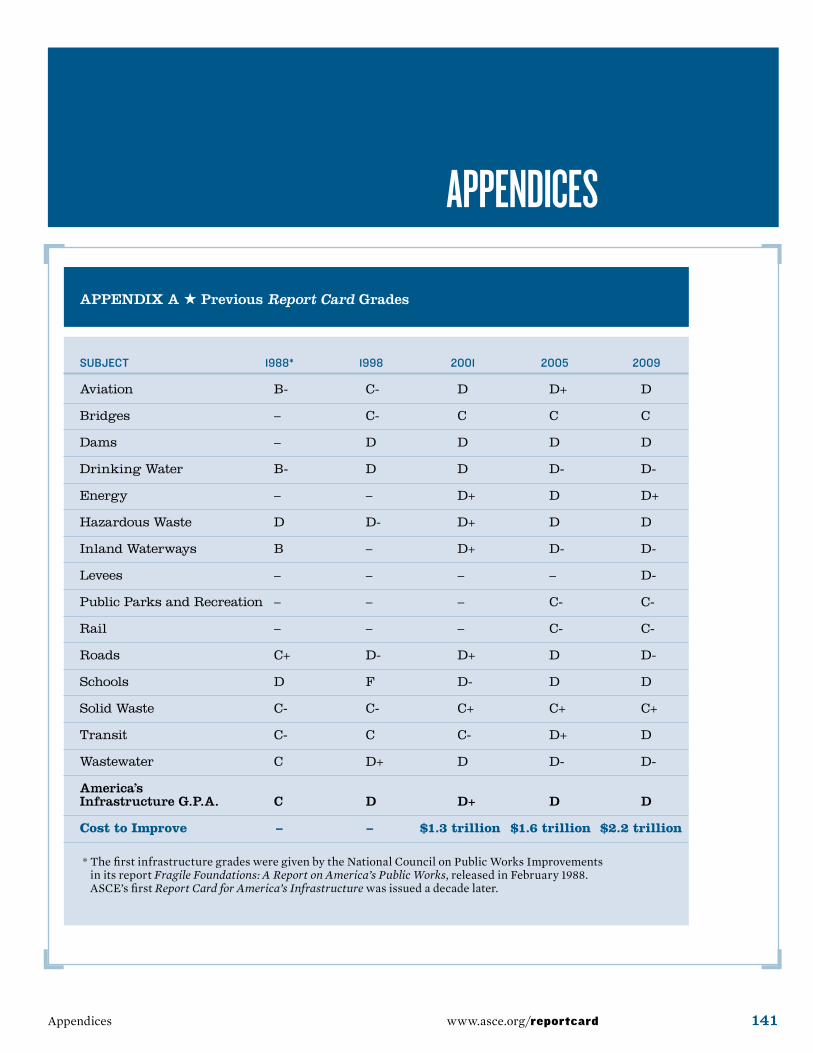
www.asce.org/reportcard 141
appendices
Appendices
APPENDIX A ★ Previous Report Card Grades
Subject 1988* 1998 2001 2005 2009
Aviation B- C- D D+ D
Bridges – C- C C C
Dams – D D D D
DrinkingWater B- D D D- D-
Energy – – D+ D D+
HazardousWaste D D- D+ D D
InlandWaterways B – D+ D- D-
Levees – – – – D-
PublicParksandRecreation – – – C- C-
Rail – – – C- C-
Roads C+ D- D+ D D-
Schools D F D- D D
SolidWaste C- C- C+ C+ C+
Transit C- C C- D+ D
Wastewater C D+ D D- D-
America’s Infrastructure G.P.A. C D D+ D D
Cost to Improve – – $1.3 trillion $1.6 trillion $2.2 trillion
� * The first infrastructure grades were given by the National Council on Public Works Improvements in its report Fragile Foundations: A Report on America’s Public Works, released in February 1988. ASCE’s first Report Card for America’s Infrastructure was issued a decade later.

142 2009 Report Card for America’s Infrastructure www.asce.org/reportcard
appendix�B�
Take�action�nowThe problems facing our nation’s infra-structure may seem daunting and their solutions beyond the ability of the average person to devise, but these problems are in fact solvable. It is true that improving the quality of infrastructure means that we have to make changes in technology, plan-ning, and the political process, but it all begins with you.
Americans must demand that their leaders support a first-class infrastruc-ture that can meet the challenges of today and tomorrow. Public involvement in solv-ing the nation’s infrastructure problems is critical to our future success. Two of the most important things you can do are to become educated about the problems we face and to speak out about this criti-
cal issue to your community and political leaders, friends, and neighbors.
Web�siteYou can learn more about the state of the nation’s infrastructure on the Report Card for America’s Infrastructure web site (www.asce.org/reportcard), where you will find detailed information on the condition of America’s various pub-lic works systems and what must be done to restore them, as well as ideas for how you as an individual can help. You will be able to participate in discussions on vari-ous aspects of the nation’s infrastructure, including the issues in your own region, and share what you have learned with oth-ers. Perhaps most importantly, you will be able to send letters directly to your elected officials informing them of your support for this critical issue and requesting their attention and action.
Online�communityYou can also keep up on day-to-day infra-structure news on ASCE’s Our Failing Infrastructure blog (www.asce.org/govrel/blog). In addition, you can join the online community of infrastructure supporters on Facebook by searching for the group “Save America’s Infrastructure” and invit-ing your friends to join. ★

Appendices 143www.asce.org/reportcard
appendix�c
2009�Report�card�for�america’s� �infrastructure�advisory�councilAndrew Herrmann, p.e., secb, f.asce, Chairman, is a partner of Hardesty & Hanover, LLP, Consulting Engineers, headquartered in New York City, and serves as partner-in-charge of many of the firm’s bridge projects. During his 35 years with the firm, Herrmann has been respon-sible for the design, inspection, rehabilita-tion, construction support, analysis, and rating of fixed and movable bridges, high-ways, railroads, and major transportation projects. He is ASCE’s Assistant Trea-surer and a past member of the Board of Direction.
Donald L. Basham, p.e., m.asce, is the former Chief of Engineering and Con-struction for the U.S. Army Corps of Engineers. His career in engineering, construction, and program and project management spans more than 40 years. He was most recently a member of the National Commission on Levee Safety.
John Bennett, p.e., m.asce, leads pol-icy development with Amtrak’s Strategic Partnerships unit. He has more than three decades of experience in rail and public transportation strategy, policy, planning, and management, including extensive experience in capital program develop-ment and management. His collaborative planning experience includes multi-year investment programs for the $100-million New York Penn Station Central Control
project, infrastructure investment requirements to add capacity and upgrade deferred investments for Amtrak’s North-east Corridor, and the definition of capac-ity enhancement projects for the I-95 Corridor Coalition’s Mid-Atlantic Rail Operations study.
Jeanette A. Brown, p.e., bcee, f.asce, d.wre, is the Executive Director of the Stamford Water Pollution Control Author-ity. She is also an adjunct professor of environmental engineering at Manhattan College. Brown has 30 years of experience in wastewater treatment. She is consid-ered an authority on operations of biologi-cal nitrogen removal processes and sludge management. She is currently the Vice President of the ASCE Environmental and Water Resources Institute.
Charles C. Calhoun, jr., p.e., f.asce, is a consultant in private practice. He retired as the Deputy Director of the U.S. Army Corps of Engineers’ Research and Devel-opment Center, Coastal and Hydraulics Laboratory, after more than 35 years of distinguished service. Calhoun is a past president of the Board of Governors of the ASCE Coasts, Oceans, Ports, and Riv-ers Institute and has served as the chair-man of ASCE’s Waterway Committee. He is also a past commissioner and a past vice president of the U.S. Section of the Inter-national Navigation Association.
J. Richard Capka, p.e., m.asce, is Chief Operating Officer for Dawson & Asso-ciates. He served as Federal Highway Administrator and Acting Administrator

144 2009 Report Card for America’s Infrastructure www.asce.org/reportcard
for the U.S. Department of Transportation from 2005 to 2008 and as CEO / Execu-tive Director of the Massachusetts Turn-pike Authority from 2001 to 2002. Capka retired from a 30-year career in the U.S. Army Corps of Engineers in 2001 as a Brigadier General. Among his posts, he served as Commander of the Corps’ South Atlantic Division, South Pacific Division and the Baltimore District.
Robert A. Dalrymple, ph.d., p.e., f.asce, is the Willard and Lillian Hackerman Pro-fessor of Civil Engineering at Johns Hop-kins University, specializing in coastal engineering. He is a past chair of ASCE’s Coasts, Oceans, Ports, and Rivers Insti-tute; the chair of ASCE’s Coastal Engi-neering Research Council; and a member of the Transportation Research Board of the National Academy of Science’s Marine Board. He was elected to the National Academy of Engineering in 2006.
Michael DeVoy, p.e., m.asce, is the Direc-tor of Airports and Navaids for RW Arm-strong. His specialty is developing and overseeing the design process from the concept stages to construction documents. He is the immediate past chairman of the Airport Consultants Council (ACC) Board of Governors.
David Gehr, m.asce, is the Senior Vice President for the Americas Highway Mar-ket of Parsons Brinckerhoff. Previously, he served in several senior management positions with the Virginia Department of Transportation, including six years as the Chief Administrative Officer of the
agency. Gehr has 40 years of professional experience in transportation engineering and policy and is active in several profes-sional organizations.
Henry J. Hatch, p.e., dist.m.asce, retired from the U.S. Army as a lieuten-ant general, the Chief of Engineers, and Commander of the U.S. Army Corps of Engineers. He is a past chair of the NRC Board on Infrastructure and the Con-structed Environment and the Federal Facilities Council. He is a past national president of the Society of American Mili-tary Engineers and currently chairs the Natural Sciences and Engineering Com-mittee of the U.S. National Commission for UNESCO. He is a registered profes-sional engineer in the District of Colum-bia, a Distinguished Member of ASCE, and a member of the National Academy of Engineering.
Brad Iarossi, p.e., m.asce, is the Chief of the Dam, Bridge, and Safety Branch of the U.S. Fish and Wildlife Service. Previously, he served as the Chief of the Dam Safety Program for Maryland’s Department of the Environment for more than 16 years. With expertise in environmental regula-tion and water projects, Iarossi served as the chair of ASCE’s National Water Policy Committee and served on the Committee on Government Affairs. He is also a past president of the Association of State Dam Safety Officials (ASDSO) and has been the chairman of ASDSO’s Legislative Commit-tee since 1992.
Appendices 145www.asce.org/reportcard
Dale Jacobson, p.e., bcee, f.asce, is the President of Jacobson Satchell Consul-tants, a consulting engineering firm. He is a professional engineer with 40 years of experience in municipal and industrial wastewater, drinking water, groundwater, solid waste, hazardous waste, and low-level radioactive waste. He has served as the project principal, project manager, or project engineer on numerous projects. He is the President of the ASCE Environ-mental & Water Resources Institute and serves on the Board of Civil Engineering Certification, Inc.
Leon Kempner, jr., ph.d., p.e., m.asce, has more than three decades of experience as a structural engineer for the Bonneville Power Administration. His career assign-ments have included structural engineer-ing analysis and the design and research of transmission line facilities. Dr. Kempner is active in many national and interna-tional electrical transmission engineering professional organizations and has con-tributed to many technical publications addressing transmission line structural engineering issues.
Otto J. Lynch, p.e., m.asce, is the Vice President of Power Line Systems, Inc., the industry standard provider of over-head transmission line design software. For more than 20 years he has designed and built high-voltage transmission lines around the world and is a highly sought-after instructor for transmission line design seminars to share his worldwide perspective. Lynch is currently the chair of several ASCE standards committees,
an active member of multiple ASCE and IEEE committees, and is a member of the National Electric Safety Code.
Roger M. Millar, jr., p.e., f.asce, aicp, cfm, is the Director of the Missoula City-County Office of Planning and Grants. He has more than 25 years of professional experience in the public and private sec-tors. Projects in which he played a leader-ship role—in particular, the Portland River District Development Plan and the Port-land Streetcar—are seen as national models for urban livability. Millar is a member of ASCE’s Transportation Policy Commit-tee, a past chair of ASCE’s National Infra-structure and Research Policy Committee, and past chair of the Pacific Northwest Council of ASCE.
Paul F. Mlakar, ph.d., p.e., f.asce, is the Senior Research Scientist in the U. S. Army Corps of Engineers’ Research and Development Center at Vicksburg, Mis-sissippi. Dr. Mlakar has 43 years of expe-rience in protective construction and the application of this military technology to civilian practice, including in U. S. embas-sies and other prominent buildings. He is a past chair of ASCE’s Committee on Critical Infrastructure. He also led the ASCE study of the Pentagon building per-formance during and immediately follow-ing the September 11, 2001 terrorist attack and participated in ASCE’s investigation of the April 19, 1995 bombing of the Alfred P. Murrah Federal Building in Oklahoma City, Oklahoma.

146 2009 Report Card for America’s Infrastructure www.asce.org/reportcard
James K. Murphy, p.e., cfm, m.asce, has more than 30 years of experience consult-ing with the Federal Emergency Manage-ment Agency and more recently with the Department of Homeland Security (DHS), including providing levee policy recom-mendations. He currently represents the Association of State Floodplain Managers as Vice Chairman on the DHS, Office of Infrastructure Protection, Levee Sector Coordinating Subcouncil, and as a project director for the URS Corporation.
Peter G. Nicholson, ph.d., p.e., f.asce, is a professor of civil engineering and the graduate chair of the Department of Civil and Environmental Engineering at the University of Hawaii at Manoa. He is a past chair of the Embankments, Dams & Slopes Committee for ASCE’s Geo-Institute and a member of ASCE’s Inspection of Dam Standards Committee. Dr. Nicholson has been consulting on dam safety, design, and rehabilitation for more than 20 years in Hawaii and California.
Robert E. Nickerson, p.e., m.asce, who has more than 30 years of experience in the electrical utility industry, is an inde-pendent consulting structural engineer specializing in the design, analysis, and upgrading of electrical transmission sys-tems. This experience includes three key areas: analysis and design of transmission structures; research and full-scale testing of transmission structures; and currently, in development of transmission models for system analyses and upgrades.
Thomas M. Rachford, ph.d., p.e, f.asce, is a Vice President of Gannett Fleming, Inc., an engineering and planning firm headquartered in Harrisburg, Pennsyl-vania. He has been with Gannett Flem-ing since 1973. He is a past president of the ASCE Environmental and Water Resources Institute and is a current mem-ber of the ASCE Board of Direction.
Debra R. Reinhart, ph.d., p.e., bcee, f.asce, is a professor and the interim Director of the NanoScience Technol-ogy Center at the University of Central Florida. Dr. Reinhart is the President of the American Academy of Environmen-tal Engineers and a member of 7 national professional and technical organizations and many national committees. She is the author of more than 100 books, papers, and presentations.
Thomas S. Slater, p.e., m.asce, is a lead-ing expert, author and lecturer in aviation engineering and management for Reyn-olds, Smith and Hills, a national airport planning and consulting firm in Raleigh, North Carolina. He is a past member of ASCE’s Transportation Policy Committee and chairman of the Annual Air Trans-port Conference in 2004. Slater has more than 25 years of experience serving the airport and aviation community.
Paul C. Taylor, p.e., m.asce, has served as the Deputy Chief Executive Officer of the Orange County Transportation Authority (OCTA) since March 2007. In the previous three years at the OCTA, he had respon-sibility for planning, engineering, and

Appendices 147www.asce.org/reportcard
constructing all transportation programs and projects in Orange County, including highways, commuter rail, and multimodal corridor improvements. A licensed civil engineer, Taylor has spent more than 30 years managing major public sector capital and operational improvement programs in Southern California.
Paulo Valerio, p.e., a.m.asce, is the Engineering Designer for the Maryland National Capital Park and Planning Commission in Prince George’s County, Maryland. He oversees design and con-struction management for park and recre-ation facilities.
C. Michael Walton, ph.d., p.e., dist.m.asce, is a professor of civil engineering and holds the Ernest H. Cockrell Centen-nial Chair in Engineering at the University of Texas at Austin. Walton’s distinguished career in transportation policy and engi-neering analysis spans more than 30 years and is highlighted by his contributions to many transportation professional societies and technical publications.
Thomas R. Warne, p.e., m.asce, is the president of Tom Warne and Associates, LLC, a consulting firm assisting public agencies in becoming more effective and private companies in becoming more prof-itable in the 21st century. Projects and engagements have included large design-build efforts, strategic planning, succes-sion management, legislative initiatives, market analysis, process improvement ini-tiatives, and client interventions. In addi-tion, Warne served as president of the
American Association of State Highway and Transportation Officials in 2000.
David L. Westerling, ph.d., p.e., f.asce, is a professor of civil engineering at Mer-rimack College in North Andover, Massa-chusetts. Dr. Westerling is a former ASCE Congressional Fellow and a past president of the Boston Society of Civil Engineers. He has more than 35 years of engineer-ing experience in the public and private sectors. Dr. Westerling was elected town moderator in Harvard, Massachusetts.
Kevin Womack, ph.d., p.e., m.asce, is a professor of Civil and Environmental Engineering at Utah State University and the Director of the Utah Transportation Center, specializing in transportation infrastructure and policy. Womack is a past ASCE Congressional Fellow, working for the Senate Environment and Public Works Committee during the drafting of SAFETEA-LU, and has just completed a term as the chair of the ASCE National Transportation Policy Committee. ★

148 2009 Report Card for America’s Infrastructure www.asce.org/reportcard
appendix�d
MethodologyIn the development of the Report Card grades, 7 fundamental components of the infrastructure were considered. The fundamental components were not weighted. The grade for each category was allocated at the discretion of the 2009 Report Card for America’s Infra-structure Advisory Council on the basis of their review and analysis of the data. These experts in the subject areas may have determined grades on the basis of a particular plus or minus in any of the components.
The fundamental components assessed were:
CAPACITy: Evaluate the infrastruc-ture’s capacity to meet current and future demands.CONDITION: Evaluate the infrastruc-ture’s existing or near future physical condition.FuNDING: Identify the current level of funding (from all levels of govern-ment) for the infrastructure category and compare it to the estimated fund-ing need.FuTuRE NEED: Evaluate the cost to improve the infrastructure and deter-mine if future funding prospects will be able to meet the need.OPERATION AND MAINTENANCE: Evaluate the owners’ ability to operate and maintain the infrastructure prop-erly and determine that the infrastruc-ture is in compliance with government regulations.
★
★
★
★
★
PuBLIC SAFETy: Evaluate to what extent the public’s safety is jeopardized by the condition of the infrastructure and what the consequences of failure may be.RESILIENCE: Evaluate the infrastruc-ture system’s capability to prevent or protect against significant multihazard threats and incidents and the ability to expeditiously recover and reconstitute critical services with minimum damage to public safety and health, the econ-omy, and national security. (For more information on resilience, see below.)
GRADING CRITERIAThe 2009 Report Card for America’s Infrastructure followed a traditional letter grade scale.A = 90–100%B = 80–89%C = 70–79%D = 51–69%F = 50% or lower
RESEARCH AND GRADING PROCESS1. Review available data or surveys for each category. Data collected will be used as follows:
Assess infrastructure using existing reported grades;Identify current amount being spent and dollars needed to replace existing infrastructure, in 2009 dollars;Identify dollars needed to upgrade infrastructure to meet future needs;Identify percent capacity of problem;
★
★
★
★
★
★

Appendices 149www.asce.org/reportcard
Identify quantity of infrastructure, number of bridges, miles of road, pipe, etc.;Assess consequences of doing nothing.
2. Compile and analyze the data, resulting in the development of a summary report. The following criteria will be used in pre-senting the data:
Total need defined by dollars needed;Existing and future needs and current funding levels;Percent of capacity represented by the problem;Quantity that the problem represents;Progress made in category from previ-ous report card, including condition, funding, etc.;Consequences of doing nothing.
3. Determine an initial grade.
4. Analyze, validate, and determine final grade.
RESILIENCEInfrastructure resilience is the capabil-ity of systems to prevent or protect against significant multihazard threats and the ability to recover rapidly and ensure con-tinuity of critical services, with mini-mal negative impact to public health and safety. In evaluating resiliency for each of the 15 categories, the following criteria were considered:
Risk and consequence management (both within each sector and across sectors);
★
★
★
★
★
★
★
★
★
Life-cycle maintenance;Sector and system interdependencies;Time, ease and cost of recovery.
As the metrics for evaluating resilience are in their infancy, the 2009 Report Card for America’s Infrastructure includes brief qualitative comments for each category. There is an overarching need to develop multihazard risk assessments for each sec-tor and use them to inform public percep-tions and priorities.
As applied to infrastructure, the con-cept of evaluating resilience embodies a shift from a strategy based on pure protec-tion to one that ensures the continuity of operations in the face of aging as well as man-made and natural hazards. The scope of resilience includes security, disaster preparedness and mitigation, and response and recovery activities. A strong, prosperous, and competitive nation must develop and maintain a resil-ient infrastructure. ★
★
★
★

150 2009 Report Card for America’s Infrastructure www.asce.org/reportcard
appendix�e
sources�for�estimated�5-Year� �investment�needsAirports Council International, Airport Capital Development Costs 2007–2011, 2007.
American Association of State Highway and Transportation Officials, Bridging the Gap: Restoring and Rebuilding the Nation’s Bridges, 2008.
American Public Transportation Associa-tion and the American Association of State Highway and Transportation Officials, State and National Public Transportation Needs Analysis, 2008.
Association of State Dam Safety Officials. The Cost of Rehabilitating Our Nation’s Dams: A Methodology, Estimate and Fund-ing Mechanisms, 2008.
Cambridge Systematics, Inc, National Rail Freight Infrastructure Capacity & Invest-ment Study, 2007.
Congressional Budget Office, Trends in Public Spending on Transportation and Water Infrastructure, 1956 to 2004, August 2007.
Congressional Budget Office, “Investing in Infrastructure”, Congressional Testimony, Senate Finance Committee, July 10, 2008.
The Edison Foundation, Transforming America’s Power Industry: the Investment Challenge, 2008.
Government Accountability Office, Freight Railroads: Industry Health Has Improved, but Concerns about Competition & Capac-ity Should Be Addressed, October 2006.
National Association of State Park Direc-tors, 2008 Annual Information Exchange: for the period covering 1 July 2006–30 June 2007, 2008.
National Education Association, Modern-izing our Nation’s Schools: What Will it Cost?, 2000.
National Surface Transportation Policy and Revenue Study Commission, Trans-portation for Tomorrow, 2007.
National Surface Transportation Policy and Revenue Study Commission, Passen-ger Rail Working Group, Vision for the Future: U.S. Intercity Passenger Rail Net-work Through 2050, 2007.
Trust for Public Land, Center for City Park Excellence, Cities Getting Greener, But Not Fast Enough to Keep Up, 2008.
U.S. Department of Agriculture, FY 2009 Budget Request, Natural Resources and Environment, Forest Service.
U.S. Department of Interior, National Park Service, Bureau Highlights, FY 2009 Budget Justifications.
U.S. Department of Transportation, Status of the Nation’s Highways, Bridges and Transit: Conditions and Performance, 2006.
U.S. Environmental Protection Agency, Cleaning up the Nation’s Wastes Sites 2004.
U.S. Environmental Protection Agency, The Clean Water and Drinking Water Infra-structure Gap Analysis, 2002. ★

Appendices 151www.asce.org/reportcard
appendix�F
photography�creditsASCE would like to thank the following organizations for providing the photos contained in this report.
ExECuTIVE SuMMARyMontgomery County, Maryland photo courtesy of The Gazette / Gazette.Net.
WATER AND ENVIRONMENT
dams Martinez Creek Dam No. 5 photo courtesy of the San Antonio River Author-ity. Skyline Lake Dam photo courtesy of New Jersey Department of Environmental Protection, Office of Engineering and Construction. NRCS Rehabilitated Dam photo courtesy of the U.S. Natural Resources Conservation Service.
drinking water Groundwater Replen-ishment System photos courtesy of Orange County Water District. Downtown Water Main Project photos courtesy of the City of Port Angeles.
hazardous waste Sequim Bay Estuary Restoration photo courtesy of the James-town S’Klallam Tribe. Brownfield Cleanup photo courtesy of the U.S. Environmental Protection Agency.
levees Investment in Levees photo courtesy of the California Department of Water Resources, Division of Safety of Dams. Levee Protection photo courtesy of Angelle Bergeron, New Orleans Corre-spondent, Engineering News-Record.
solid waste Food Scraps Diversion Program photo courtesy of Norcal Waste. Orange County Landfill photos courtesy of Debra R. Reinhart, Ph.D., P.E., BCEE, F.ASCE. Greater Detroit Resource Recov-ery Facility photos courtesy of the Greater Detroit Resource Recovery Authority.
wastewater North City Water Reclamation Plant photo courtesy of the City of San Diego. Pervious Paving photo courtesy of Mutual Materials and UNI-GROUP U.S.A. Sewer Separa-tion Project photo courtesy of Washington Area Sewer Authority.
TRANSPORTATION
aviation Sea-Tac International Airport photo courtesy of Sea-Tac Airport. Chicago-O’Hare International Airport photo courtesy of the City of Chicago. Center Taxiway, Los Angeles Interna-tional Airport photo courtesy of LAWA-LAX (Los Angeles World Airports/Los Angeles International Airport). Next Generation Ground Based Augmentation System, Newark Liberty International Airport photo courtesy of the Port Authority of New York and New Jersey. Philadelphia International Airport photo courtesy of Matthew Johnson, skyscrapersunset.com

152 2009 Report Card for America’s Infrastructure www.asce.org/reportcard
bridges Accelerated Bridge Construction photos courtesy of Utah Department of Transportation. Woodrow Wilson Bridge photo courtesy of the Wilson Bridge Project. The MacArthur Maze Repairs photo courtesy of California Department of Transportation, photographed by John Huseby.
inland waterways McAlpine Lock, Ohio River, photo Courtesy of the U.S. Army Corps of Engineers, Louisville Dis-trict. Delaware River Channel Deepening Project photos courtesy of the U.S. Army Corps of Engineers, Philadelphia District.Lock 22, Upper Mississippi River System photo courtesy of the U.S. Army Corps of Engineers, Rock Island District.
rail Chicago Region Environmental and Transportation Efficiency Program photos courtesy of the CREATE partners. Alam-eda Corridor photo courtesy of AECOM. Amtrak’s Northeast Corridor photo cour-tesy of Amtrak.
roads I-495 Virginia HOT Lanes Proj-ect photo courtesy of Transurban. Median Crash Barriers photo courtesy of the Roadway Safety Foundation. The Mar-quette Interchange Renovation photos courtesy of the Wisconsin Department of Transportation.
transit Utah Transit Authority Tran-sit Express (TRAX) photos courtesy of Utah Transit Authority Transit Express. Regional Transportation District Transit
System photo courtesy of LightRailNow, photo by Dave Dobbs. Missoula Urban Transportation District (Mountain Line) photo courtesy of Missoula, Montana Office of Planning and Grants. Orange County Transportation Authority photos courtesy of Orange County Transporta-tion Authority.
PuBLIC FACILITIES
parks and recreation The Trust for Public Land photo courtesy of Julieth Rivera, Trust for Public Land. State- Local Government Partnerships photos courtesy of Portland Department of Parks and Recreation.
schools Seismic Retrofits photo courtesy of Portland Public Schools. School Modernization Program photo courtesy of Cincinnati Public Schools, photo by Robert Flischel. Improvements to Camden High School photo courtesy of Camden City Public Schools.
ENERGy
energy American Electric Power’s (AEP) Jacksons Ferry-Wyoming 765 kV Transmission Line photo courtesy of American Electric Power. Smith to North Clark 345 kV Transmission Line photo courtesy of East Kentucky Power Coop-erative. Palo Verde to Pinal West 500 kV Project photo courtesy of Black & Veatch. Arrowhead to Weston 345 kV Transmis-sion Line photo courtesy of the American Transmission Company. ★

www.asce.org/reportcard 153
The 2009 Report Card for America’s Infrastructure is a collaboration of ASCE members and staff. Thanks to the following staff members for their outstanding work on this project:Karen AlbersThomas AllenSusan BlodgettJoan BuhrmanMichael CharlesAyinde Clarke Marla DaltonAllison DickertCasey DingesSteve FierAdam GagnonLauren GranthamJoey GuptaCamille HaleyMartin HightJane Howell LombardiLaura HumphreyCaroline MacheskaJohn MarstonLeslie NolenBrian PallaschAnne PowellAnthony ReedAndrea RobitailleCatherine Tehan
acknOWledgeMenTs
Acknowledgements
Additionally, ASCE would like to thank the following organizations for their assistance during the research process:Airport Consultants CouncilAmerican Association of State Highway
and Transportation OfficialsAssociation of State Dam Safety OfficialsAmerican Public Transportation AssociationAmerican Public Works AssociationAmerican Road and Transportation BuildersBrookings InstitutionBuilding America’s Future Coalition Laborers’ International UnionNACE InternationalNational Association of Clean Water
AgenciesNational Association of County EngineersNational League of CitiesNational Recreation and Park AssociationNational Utility Contractors AssociationRegional Plan AssociationTrust for Public LandUrban Land InstituteU.S. Army Corps of EngineersU.S. Chamber of CommerceU.S. Conference of MayorsU.S. Department of Agriculture,
Forest ServiceU.S. Department of Agriculture, Natural
Resources Conservation ServiceU.S. Department of TransportationU.S. Environmental Protection AgencyU.S. Transportation Security
AdministrationWater Environment Federation ★


American Society of Civil Engineers
World Headquarters1801 Alexander Bell DriveReston, VA 20191
800/548-2723703/295-6491 FAX
Washington Office101 Constitution Avenue, NWSuite 375 EastWashington, DC 20001
202/789-7850202/789-7859 FAX
www.asce.org/[email protected]