Embed Size (px)
Citation preview

Dr. Donald Halseth, Coordinator
Department of Horticulture Cornell University
Ithaca, New York 14853
_________________________________________________
2009 USPB/SFA Chip Variety Trials
Sponsored by
The United States Potato Board &
The Snack Food Association
____________________________________________________
Cooperators: Dr. Nick David, North Dakota State University, Fargo, ND Dr. Chad Hutchinson, University of Florida, Hastings, FL Mr. Chuck Kostichka, University of Wisconsin, Hancock, WI Dr. William Lamont, Pennsylvania State University, University Park, PA Mr. Chris Long, Michigan State University, East Lansing, MI Mr. Roy Morrow, Black Gold Farms, Charleston, MO Mr. Joe Nunez, University of California Coop. Extension, Bakersfield, CA Dr. Greg Porter, University of Maine, Orno, ME Dr. Jeff Stark, University of Idaho, Aberdeen, ID Dr. Craig Yencho, North Carolina State University, Raleigh, NC
1

…
…
…
…
…………
…
…
…
.
….
…
TABLE OF CONTENTS
PageIntroduction …………………………………………………….…...……..................... 3
Table 1. Seed Acreage of Current Chipping Varieties ……………...…….………… 3
Procedure …………………………………………………...……………..…………… 4
Overview ………………………………………………..………………..…………… 4
Table 2. Characteristics of the 2009 USPB-SFA Chip Trial Entries ………….…… 6
Regional Trial Reports: California ………………………………….…….....….…...……….…...… 9Florida ……………………………………………………………………..... 12Idaho ……………………………………………………………………….... 16Maine ……………………………………….……………………………… 19Michigan ……………………………………………….…………………… 26Missouri ………………………………………………………...…………… 33North Carolina ………………………………………..…………………… 35Pennsylvania ………………………………………………………………… 40Red River Valley ……………………………………………………………. 42Wisconsin …………………………………………………………………… 46
Table 3. Summary of performance of eleven lines in 2009 trials ………………..… 48
Table 4. Three-year averages for CO96141-4W (2007-2009) ……………………... 54
Table 5. Two-year averages for Kalkaska (MSJ036-A) (2008-2009) ……………… 57
Table 6. Four year summary for W2324-1 (2006-2009) ……………..….………....... 58
Out-of-Storage Evaluations from 2008 and 2009 trials:Idaho ………………………………………………………………………… 59Maine …………………………………………..……………………………. 60Michigan ……………………………………………………………………... 61Pennsylvania ……………………………………………………………..….. 83Red River Valley ……………………………………………………...…… 84Wisconsin ……………………………………………………………….…… 85
Table 7. Chip trial entry summary (1985-2009) ……………………………...…… 86
2

2009 USPB/SFA Potato Chip Trial Results
Dr. Donald Halseth - Coordinator Cornell University, Ithaca, NY
INTRODUCTION The search for new and improved potato varieties is an ongoing and challenging task. During 2002 the United States Potato Board joined with the Snack Food Association in sponsorship of these chip variety trials, which were initiated by the SFA in 1985. The ten trial locations in 2009 were California, Florida, Idaho, Maine, Michigan, Missouri, North Carolina, Pennsylvania, the Red River Valley, and Wisconsin. This annual report is divided into two sections. The first section presents the clonal and variety yield performance data for the 2009 growing and harvest season at each of ten state trial locations. Six states also report out-of-field chipping data. The second section consists of the chipping data obtained on short and long term storage of 2008 trial samples from six states. This storage section includes extensive chip color and sugar data from large long-term, multiple temperature cold storage research conducted by Chris Long of Michigan State University, Nick David, UMN/NDSU, and Chuck Kostichka, University of Wisconsin. The USPB-SFA Potato Technology Committee has thoroughly discussed the need and value of storage data and this report represents the sixth annual report to include this data. Starting next year this annual report will be divided into two reports: (1) Yield trial data and field performance (including out of field chipping) notes available in January of each year; and (2) a storage report with chip color and tuber sugar data in June of each year to allow for inclusion of all storage data into one report. Table 1. TRENDS IN THE SEED ACREAGE OF CURRENT CHIPPING VARIETIES
(Plus Breeding Lines in USPB/SFA Chip Trials) Variety Year
Released 2004 2005 2006 2007 2008 2009
1. Atlantic 1976 3635 2592 2693 2806 2604 2824 2. Snowden 1990 1627 1664 1847 1794 1477 1640 3. Dakota Pearl 1999 1868 1348 1388 1194 992 1344 4. Reba 1992 898 808 764 828 853 759 5. Pike 1995 883 878 730 669 613 647 6. Ivory Crisp 2001 187 207 272 326 331 555 7. Megachip 2008 19 50 134 279 361 385 8. Dakota Crisp 2005 89 102 161 218 316 376 9. Chipeta 1993 356 260 390 348 323 37110. Marcy 2003 187 262 320 319 314 33911. Andover 1995 393 399 382 364 282 30012. Monona 1964 586 333 518 243 256 27713. NorValley 1996 475 455 453 361 255 16414. Norchip 1968 52 50 33 11 102 77
3

Variety Year Released
2004 2005 2006 2007 2008 2009
15. Beacon Chipper 2005 n/a n/a 10 25 62 7616. Monticello 2004 12 20 43 59 78 7217. Harley Blackwell 2003 71 160 174 105 87 7018. Dakota Diamond 2005 0.5 5.9 31 232 84 3119. NY138 n/a n/a n/a n/a 4.0 2320. CO95051-7W n/a n/a n/a 0.7 2.3 1321. CO96141-4W n/a n/a n/a 1.2 6.4 1022. MSJ147-1 n/a/ n/a/ n/a 4.2 1.9 8.123. Kalkaska 2008 n/a n/a 1.1 10.5 21 7.424. NY139 n/a n/a n/a n/a 0.5 5.525. W2133-1 n/a n/a n/a n/a 1.3 5.226. MSJ126-9Y n/a n/a n/a n/a 2.0 5.027. CO97065-7W n/a n/a n/a 1.0 0.5 0.228. CO97043-14W n/a n/a n/a n/a 0.2 0.229. W2324-1 n/a n/a n/a n/a n/a 0.1
Acreage data obtained from the PAA seed certification section. PROCEDURE Trial entries are selected for three years of USPB-SFA sponsored chip trials from candidates suggested by University and USDA potato breeders who have been strong collaborators in this project. The eleven advanced breeding lines and newly released varieties evaluated in 2009 were AF2291-10, CO96141-4W, CO97043-14W, CO97065-7W, Kalkaska (recently named from MSJ036-A), MSJ126-9Y, ND7519-1, NY138, NY139, W2324-1, and W2717-5 (see Table 2 for descriptions), which were compared with the chip industry standards Atlantic and Snowden. Trial coordinators established trials in ten states with grower or research farm plots where entries were grown using standard cultural practices. Note that while nine entries were tested in all ten states, ND7519-1 was only trialed in ND and MI and W2324-1 was only trialed in CA, FL, MO and NC. Observation on emergence, growth characteristics and maturity are made during the growing season. Yield, tuber size distribution, external and internal defects, specific gravity and other plant and tuber characteristics were evaluated. Storage samples were held in grower storages and university facilities and chip processors participated in chipping evaluations from various temperature and storage durations. OVERVIEW
It is important to look at the performance of the individual entries at each location because of the variations in soil types, weather, growing conditions and crop management. This project hopes to identify entries with wide adaptation and also to identify the most suitable sites where an entry may have superior performance. State reports in pages 9-47 show the yield, percent size distribution, and specific gravity data obtained at each of the ten regional locations. Table 3 (pages 48-53) summarizes the overall average yield, percent size distribution and specific gravity for each of eleven clones grown in two to ten regional trial sites in 2009. The Colorado State
4

breeding line CO94141-4W completed three years of trials from 2007 through 2009 and will be replaced with a new entry in 2010. A three year summary of performance data is presented in Table 4a for CO94141-4W, including both annual and three-year averages for each regional location and reflect the stable or variable performance of this line over eleven locations (TX dropped out after 2007, and CA and MO were added in 2008). Kalkaska (MSJ036-A) will be finished testing in USPB-SFA chip trials after two seasons (2008-2009) and summary data are presented in Table 5. While W2324-1 completed its three years of trials (2006-2008) over all USPB-SFA trial sites, it has been kept in southern sites (CA, FL, MO and NC) in 2009 and summary data are presented in Table 6. CO96141-4W – was developed by Colorado State University. In 29 trial sites during 2007-09 (see Table 4a), this clone averaged a marketable yield of 301 cwt/acre (95% of Atlantic’s marketable yield) and a total yield of 346 cwt/acre (93% of Atlantic). CO96141-4W had its highest marketable yield of 428 cwt/acre in the Wisconsin trial in 2008. At only four locations were yields significantly lower (MO in 2009, PA2008, RRV-NI 2009 and TX 2007). These four locations were either very hot or had very low moisture (note: RRV-NI and PA trials were not irrigated), indicating the importance of maintain good soil moisture to get optimal yields with this line. It had an average specific gravity of 1.076, which is .012 units below Atlantic. Specific gravity was above 1.080 in 7 of 29 trials. CO96141-4W averaged an Agtron chip color value of 64.1 (out of the field), 3.2 units above Atlantic. In long-term storage trials in 2008 this clone had slightly better color than Snowden in the 40F ID trial, better than Snowden in the PA trial, better or equal to Snowden from 45F and 50F trials in the RRV, but darker than Snowden in WI trials at 42F, 45F and 48F. Kalkaska (MSJ036-A) – was developed by Michigan State University. In 21 trial sites during 2008-09 (see Table 5), this clone averaged a marketable yield of 304 cwt/acre (93% of Atlantic’s marketable yield) and a total yield of 357 cwt/acre (92% of Atlantic). Kalkaska had its highest marketable yield of 481 cwt/acre in the Wisconsin trial in 2008, and had its next best two yields in Michigan (454 cwt/acre in 2009 and 465 cwt/acre in 2008). The lowest yielding trial was in MO in 2008 that was flooded by rainfall, but that was the highest yielding entry in that trial. It had an average specific gravity of 1.083, which is .006 units below Atlantic. Specific gravity was above 1.080 in 12 of 21 trials. Kalkaska averaged an Agtron chip color value of 62 (out of the field), 0.6 units above Atlantic. In long-term storage trials in 2008 it had better chip color than Snowden in the ID trial, was one of the best in the ME trial, about equal to Snowden in PA, but significantly darker than Snowden in WI trials held at 42F, 45F and 48F. MI and RRV researchers did not place it into long-term trials due to early color problems.
5

Table 2. Characteristics of the 2009 USPB - SFA Chip Trials Entries
Advanced Seedlings
Characteristics
Seed Provided By
AF2291-10 Year 2
Parentage: SA8211-6 x EB8109-1. Mid-season maturity, round tubers, some misshapen tubers, with medium yield potential. Moderate to good resistance to internal heat necrosis, early blight and common scab. Chips from field and warm storage (50F), not a cold storage chipper. In two years of trials it averaged 279 cwt/acre marketable yield (85% of Atlantic) and had an average specific gravity of 1.089 (0.002 below Atlantic). Had second best chip color from 54F storage in Dec and Mar for 2008 MI trials but poor color in the RRV and WI trials in 2008.
Dr. Greg Porter University of Maine Orono, ME
CO96141-4W Year 3
A selection made in 1996 from a cross between BC0894-2W and AC87340-2W. Mid-season maturity, blocky tuber shape, good tuber size, resistant to hollow heart and blackspot bruise. In three years of trials (30 sites) it averaged 301 cwt/acre marketable yield (95% of Atlantic) with an average specific gravity of 1.076 (0.012 below Atlantic). It has chipped well from the field in seven states where tested and has chipped well from 48F or 50F storage in several states but had darker color in colder storages.
Dr. David Holm Colorado State Univ. Center, CO
CO97043-14W Year 2
Parentage: AC91817-5W x AC87340-2W. Mid-season maturity, round tubers, medium-long tuber dormancy, blackspot resistant, and low levels of external and internal defects. In two years of trials it has averaged 297 cwt/acre marketable yield (91% of Atlantic) with an average specific gravity of 1.080 (0.009 below Atlantic). Good out of field chip color, had good color from 50F to 54F storages in ME, MI, PA, and RRV, poor color from 42, 45 & 48F in WI.
Dr. David Holm Colorado State Univ. Center, CO
CO97065-7W Year 2
Parentage: AC92513-3 x Chipeta. Early to mid-season maturity, round tubers, long tuber dormancy, blackspot resistant, and low levels of external and internal defects. In two years of trials averaged 261 cwt/acre marketable yield (80% of Atlantic) and had an average specific gravity of 1.084 (.005 units below Atlantic). Had chip color as good or better than Snowden in ID, ME, MI, PA, RRV and WI trials held between 40F and 54F from the 2008 season.
Dr. David Holm Colorado State Univ. Center, CO
6

MSJ036-A Kalkaska Year 2
Parentage: B1254-1 x S440. Breeding line MSJ036-A has been named Kalkaska. Late maturity, excellent round tuber shape, good scab resistance, moderate specific gravity (averaged 1.083, 0.006 below Atlantic), but relatively good yield potential (averaged 298 cwt/a marketable yield, 91% of Atlantic). Had good chipping out of field scores in 9 of 11 sites. Reconditioned well from ID trial at 40F, very good color at 55F in ME, average color in PA and significantly darker color than Snowden from 42F, 45F and 48F storage in WI. (chip data on 2008 crop)
Dr. Dave Douches Michigan State Univ. East Lansing, MI
MSJ126-9Y Year 1
Parentage: Penta OP. Has mid-season maturity, smooth round tuber shape and yellow flesh. Strengths are scab resistance, low reducing sugars and the ability to store below 50F. Weaknesses are lower specific gravity and small vines. In first year of trials it averaged 230 cwt/acre marketable yield (72% of Atlantic) with an average specific gravity of 1.077 (0.012 below Atlantic).
Dr. Dave Douches Michigan State Univ. East Lansing, MI
ND7519-1 Year 2 (only MI & ND)
Mid-season maturity, good specific gravity (similar to Atlantic), moderate yield potential, and prone to hollow heart and brown center. In the first year of USPB-SFA chip trials (10 states) it averaged 288 cwt/acre marketable yield (81% of Atlantic) and a specific gravity of 1.089 (.001 below Atlantic). Was only planted to MI and RRV sites in 2009 and averaged 286 cwt/acre (82% of Atlantic) and a specific gravity of 1.096 (0.001 below Atlantic). Had second best color from 40F in Idaho and best or second best color from 42F, 45F, 48F and 52F in WI trials. (chip data in 2008 crop)
Dr. Susie Thompson ND StateUniv. Fargo, ND
NY138 Year 2
Parentage: Marcy x NY115. Late maturity, round tubers, few external defects, less blackspot than Snowden, moderate scab resistance, resistant to race Ro1 of golden nematode, and long tuber dormancy. In two years of trials it averaged 313 cwt/acre marketable yield (95% of Atlantic) and had an average specific gravity of 1.077 (0.012 below Atlantic). In 2008 storage trials it had chip color better than Snowden in ID, PA, RRV and WI locations.
Dr. Walter De Jong Cornell University Ithaca, NY
NY139
Parentage: NY120 x NY115. Medium-late maturity, round tubers, few external defects, some internal necrosis, good resistance to
Dr. Walter De Jong Cornell University
7

Year 2
common scab, resistant to race Ro1 of golden nematode, and medium tuber dormancy. In two years of trials it averaged 307 cwt/acre marketable yield (94% of Atlantic) and had an average specific gravity of 1.085 (0.004 below Atlantic). In 2008 storage trials it had chip color equal or better than Snowden in ID, MI, PA, and the RRV locations.
Ithaca, NY
W2324-1 Year 4 (only CA, FL, MO and NC)
A selection from a cross between Snowden and RHL166. Late maturity, round uniform tubers, and relatively high specific gravity. In three years of full trials (2006-2008) it had an average specific gravity of 1.085, which is 0.003 units below Atlantic. This clone had the highest average marketable yield in all three seasons of USPB-SFA testing. In 2009 in four southern states W23234-1 averaged 287 cwt/acre marketable yield (92% of Atlantic) and averaged a 1.077 specific gravity (0.004 below Atlantic). Chip color variable, ranging from poor to excellent, depending upon the trial site.
Dr. Jiwan Palta, Felix Navarro and Bryan Bowen University of Wisconsin Rhinelander, WI
W2717-5 Year 2
Parentage: S440 x ND3828-15. Late maturity, round tubers of medium size, medium yield potential, medium to high specific gravity. Good internal quality, low sugars, medium term storability, good chipping ability. Moderate scab susceptibility. In two years of trials it averaged 232 cwt/acre marketable yield (71% of Atlantic) and had an average specific gravity of 1.091 (0.002 above Atlantic). In 2008 storage trials it had the best or second best chip color in IDA, RRV and WI trials. It had the lowest color in PA.
Dr. Jiwan Palta, Felix Navarro and Bryan Bowen University of Wisconsin Rhinelander, WI
8

California Regional Trial
Project Leader: Joe Nunez UC Cooperative Extension 1031 So. Mount Vernon Ave. Bakersfield, CA 93307 Cooperators: Kevin Johnston Dennis Johnston Jed DuBose Johnston Farms Johnston Farms UC Cooperative Extension P.O. Box 65 P. O. Box 65 1031 So. Mount Vernon Ave Edison, CA 93220 Edison, CA 93220 Bakersfield, CA 93307 Trial Information: Previous Crop: Potatoes have been grown in this field for at least the past 5 years. Trial Location: Johnston Farms, Edison, CA. Soil Type: Cajon Sand
Planting Date: 2/15/08 Vine Kill Date: 5/31/08 Harvest Date: 6/9/08 Plant Spacing: Hand Planted at 9 inch spacing Plot Size: 20 ft row x 32 inch bed width, 4 replications Irrigation: Solid set sprinkler, 40ft x 30 ft Pest Management: Standard grower’s practice
Procedure Approximately 20 pound seed potato samples of the Snack Food Association chip trial were received by FedEx during the months of January and February from the chip trial breeders. The seed was held in a warehouse until seed was cut by hand. Twenty seven seed pieces were placed into a small paper bag and held until planted on 2/19/09. The Snack Food Association trial was hosted by Johnston Farms of Edison CA on one of their field sites. Plots were marked off every 23 feet and the beds were opened up in the middle with a 2 row potato planter. The 27 seed pieces were dropped by hand into the opened beds with a 3 foot buffer between each plot. Once planted, the seed was cover with soil and the beds were reformed with a cultivator. The experimental design was a randomized complete block design. The field trial received all standard growing practices for fertilization and pest management. There was no significant insect or disease pressure at the field site but it did receive regular
9

preventive fungicide treatments. Weeds were controlled with early season cultivation and use of Eptam herbicide. The tops were beaten off on 5/29/09 and the plots were harvested on 6/8/09. A single row digger lifted the tubers and dropped them on the ground. The tubers were then picked up by a hand crew and placed into burlap sacks and transported to a nearby shop for grading. The tubers were graded the following day and a 12-15 lb sub-sample taken from each plot. From the sub-samples taken an 8 lb sample from each variety was taken to White Wolf Potato packing shed and specific gravity tests were performed. All data was analyzed using MSTAT-C.
2009 SFA Chip Trial Vigor Rating
ID# Rep 1 Rep 2 Rep 3 Rep 4 AVG. Vigor 1 4 3 3 3 3.3 2 3 3 3 3 3.0 Vigor Scale: 3 3 3 3 2 2.8 1 = Very poor 4 4 3 3 3 3.3 2 = Below average 5 4 3 3 3 3.3 3 = Average 6 4 3 3 3 3.3 4 = Above average 7 3 3 4 4 3.5 8 4 4 4 3 3.8 9 4 3 4 3 3.5 10 1 3 2 2 2.0 11 3 3 2 3 2.8 12 3 3 3 2 2.8 13 3 2 3 n/a 2.7
2009 SFA Chip Trial Specific Gravity
Rep1 Rep2 Rep3 Rep 4 Average 1. Kalkaska 1.080 1.081 1.075 1.080 1.079 2. MSJ126-9Y 1.078 1.078 1.075 --- 1.077 3. W22324-1 1.084 1.083 1.080 1.084 1.083 4. W2717-5 1.092 1.078 1.088 1.090 1.087 5. Atlantic 1.086 1.089 1.088 1.087 1.088 6. Snowden 1.080 1.082 1.080 1.080 1.081 7. AF2291-10 1.089 1.089 1.088 1.086 1.088 8. NY138 1.079 1.080 1.074 --- 1.078 9. NY139 1.079 1.082 1.084 1.085 1.083 10. CO96141-4W 1.059 1.078 1.073 1.075 1.071 11. CO97065-7W 1.085 1.088 1.090 1.086 1.087 12. CO97043-14W 1.087 1.083 1.082 1.085 1.084 13. W2310-3 1.081 1.095 1.089 --- 1.088
10

Table 1. California Trial 2009, Total and Marketable Yield, Culls, Specific Gravity, and Vigor.
(ounces tuber weight)ENTRY US#1 TOTAL US#1 0 - 4 4 - 6 6 - 10 over 11 CULLS SP GR VIGOR
Atlantic 383 499 77 7 22 55 14 1.6 1.088 3.3
Snowden 401 468 86 9 31 55 4 1.1 1.081 3.3
AF2291-10 287 324 89 9 36 53 2 0.7 1.088 3.5
CO96141-4W 288 338 85 12 23 63 2 1.3 1.071 2.0
CO97043-14W 342 385 89 8 32 56 3 0.4 1.084 2.8
CO97065-7W 303 380 80 12 28 52 8 0.4 1.087 2.8
Kalkaska 341 421 81 17 42 39 1 1.5 1.079 3.3
MSJ126-9Y 277 330 84 11 32 53 3 2.0 1.077 3.0
NY138 354 426 83 6 22 61 11 0.5 1.078 3.8
NY139 379 437 87 5 25 61 8 0.3 1.083 3.5
W2324-1 384 458 84 7 28 56 7 1.8 1.083 2.8
W2717-5 264 321 82 12 31 51 3 1.7 1.087 3.3
average: 334 399 84 10 29 55 6 1.1 1.082 3.1
Vigor rating scale: 1 = very poor, 2 =below avg., 3 = avg. and 4 = above avg.
Yield (cwt/acre) Percent Size Distribution
11

FLORIDA REGIONAL LOCATION Local Coordinator: Cooperating Grower: Cooperating Chip Processor: Mr. Doug Gergela University of Florida/IFAS, Florida n/a, potatoes were fried on site. Research Coordinator Partnership for Water, Agricultural and University of Florida/IFAS Community Sustainability at Hastings Horticultural Sciences Dept. Hastings, FL 32145-0728 Trial Data: Planting Site: University of Florida/IFAS, Florida Partnership for Water, Agricultural and
Community Sustainability at Hastings Research and Demonstration Farm Planting Date: February 4, 2009 Harvest Date: May 28, 2009 (113 days) Growing Conditions: Overall, weather conditions for the 2009 growing season were rated as fair.
Six mornings had temperature readings at or below freezing from the planting date forward. February and March were mostly dry. April saw about normal precipitation. Seepage irrigation was started earlier than normal and ran almost constantly from about mid-late February until just prior to harvest. A significant rainfall event of 17 inches over a 12 day span in the 2 weeks prior to harvest greatly reduced total and marketable yields of most entries. Marketable yields are considered to be mostly below average. The higher percentage of total culls compared to more normal years was influenced by a large increase in the amount of rotten and sunburned tubers, which was caused by the increased soil moisture and eroded rows from the heavy rains. Specific gravities of most selections were also considerably lower compared to previous seasons.
Experimental Design: Each variety/clone was planted in a single 250 ft row as directed by the SFA protocol. Four 20 ft sections of each row were harvested and graded. This was not a randomized and replicated experiment. Only means were calculated.
Row Spacing: Machine planted. Approx. 8 inches in-row, 40 inches between-rows. Fertilizer: preplant:100-43-86/A; sidedress: 2 applications of 50-0-43/A (lb N-P-K/A) Pest Control: Pic-Clor 60 11 gpa, pre-plant Temik 15G, 20 lb/A, at planting Sencor DF, 16 oz/A and Dual Magnum,16 fl oz/A at hilling Fungicides and Insecticides as needed. IPM program used. Chip Ratings: Potato sub-samples were fried directly from the field. Chips were prepared and rated following the procedures outlined in the Snack Food Association Chipping Potato Handbook (1995).
Chip scores are presented in Table 2.
12

Table 1. Production statistics for SFA clones.
Tuber Yield Size Class Distribution3, 4 (%) Size Class Range4 (%)
No.11 Total % % Specific Clone cwt/A cwt/A No.12 Culls 1 2 3 4 5 2 to 4 3 to 4 Gravity
Atlantic 226 350 93 30 7 52 28 13 0 93 41 1.066 Snowden 224 280 88 10 11 73 12 3 0 88 15 1.069 AF2291-10 205 262 91 14 10 64 21 6 0 91 27 1.073 CO96141-4W 339 390 90 4 9 72 16 2 0 90 18 1.063 CO97043-14W 301 346 91 4 8 62 18 11 0 91 29 1.066 CO97065-7W 288 325 92 5 7 77 14 1 0 92 15 1.075 Kalkaska 113 204 72 24 26 66 5 1 0 72 6 1.064 MSJ126-9Y 212 263 90 10 8 59 24 7 0 90 31 1.063 NY138 331 395 94 10 5 36 28 30 1 94 58 1.062 NY139 246 314 92 15 7 59 23 10 0 92 33 1.065 W2324-1 132 203 81 19 17 73 6 2 0 81 8 1.065 W2717-5 154 235 81 19 18 75 5 1 0 81 6 1.071 Average 231 297 1.067 1No.1 Yield: marketable yield, size classes 2 to 4 2Percent No. 1: calculated based on weight using the formula, No. 1 Wt / Total Yield Wt 3Size Class Distribution: calculated based on weight using the formula, Class Wt / (Total Yield Wt – Cull Wt). 4Size Classes: 1 = 1.5 to 1 7/8", 2 = 1 7/8 to 2.5", 3 = 2.5 to 3.25", 4 = 3.25 to 4", 5 = > 4"; Class size C (<1.5”) was recorded and is included in Total Yield but is not shown as a separate size category.
13
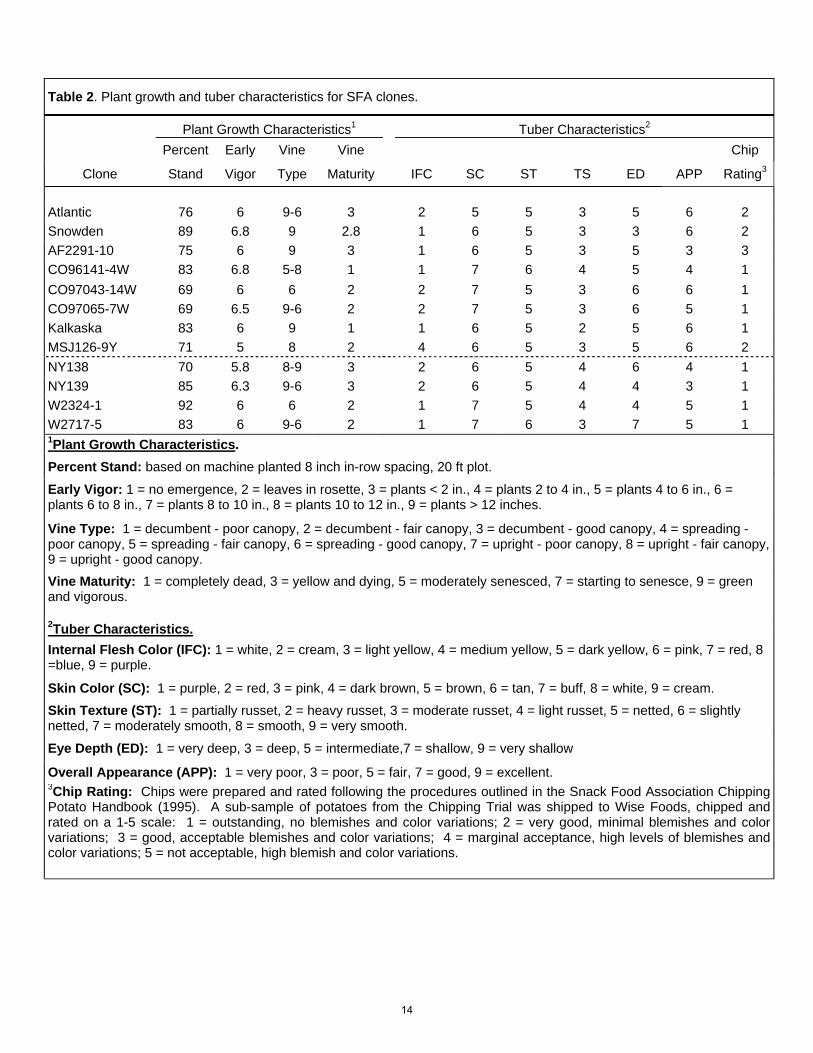
Table 2. Plant growth and tuber characteristics for SFA clones.
Plant Growth Characteristics1 Tuber Characteristics2 Percent Early Vine Vine Chip
Clone Stand Vigor Type Maturity IFC SC ST TS ED APP Rating3
Atlantic 76 6 9-6 3 2 5 5 3 5 6 2 Snowden 89 6.8 9 2.8 1 6 5 3 3 6 2 AF2291-10 75 6 9 3 1 6 5 3 5 3 3 CO96141-4W 83 6.8 5-8 1 1 7 6 4 5 4 1 CO97043-14W 69 6 6 2 2 7 5 3 6 6 1 CO97065-7W 69 6.5 9-6 2 2 7 5 3 6 5 1 Kalkaska 83 6 9 1 1 6 5 2 5 6 1 MSJ126-9Y 71 5 8 2 4 6 5 3 5 6 2 NY138 70 5.8 8-9 3 2 6 5 4 6 4 1 NY139 85 6.3 9-6 3 2 6 5 4 4 3 1 W2324-1 92 6 6 2 1 7 5 4 4 5 1 W2717-5 83 6 9-6 2 1 7 6 3 7 5 1 1Plant Growth Characteristics. Percent Stand: based on machine planted 8 inch in-row spacing, 20 ft plot. Early Vigor: 1 = no emergence, 2 = leaves in rosette, 3 = plants < 2 in., 4 = plants 2 to 4 in., 5 = plants 4 to 6 in., 6 = plants 6 to 8 in., 7 = plants 8 to 10 in., 8 = plants 10 to 12 in., 9 = plants > 12 inches.
Vine Type: 1 = decumbent - poor canopy, 2 = decumbent - fair canopy, 3 = decumbent - good canopy, 4 = spreading - poor canopy, 5 = spreading - fair canopy, 6 = spreading - good canopy, 7 = upright - poor canopy, 8 = upright - fair canopy, 9 = upright - good canopy. Vine Maturity: 1 = completely dead, 3 = yellow and dying, 5 = moderately senesced, 7 = starting to senesce, 9 = green and vigorous. 2Tuber Characteristics. Internal Flesh Color (IFC): 1 = white, 2 = cream, 3 = light yellow, 4 = medium yellow, 5 = dark yellow, 6 = pink, 7 = red, 8 =blue, 9 = purple.
Skin Color (SC): 1 = purple, 2 = red, 3 = pink, 4 = dark brown, 5 = brown, 6 = tan, 7 = buff, 8 = white, 9 = cream.
Skin Texture (ST): 1 = partially russet, 2 = heavy russet, 3 = moderate russet, 4 = light russet, 5 = netted, 6 = slightly netted, 7 = moderately smooth, 8 = smooth, 9 = very smooth.
Eye Depth (ED): 1 = very deep, 3 = deep, 5 = intermediate,7 = shallow, 9 = very shallow
Overall Appearance (APP): 1 = very poor, 3 = poor, 5 = fair, 7 = good, 9 = excellent. 3Chip Rating: Chips were prepared and rated following the procedures outlined in the Snack Food Association Chipping Potato Handbook (1995). A sub-sample of potatoes from the Chipping Trial was shipped to Wise Foods, chipped and rated on a 1-5 scale: 1 = outstanding, no blemishes and color variations; 2 = very good, minimal blemishes and color variations; 3 = good, acceptable blemishes and color variations; 4 = marginal acceptance, high levels of blemishes and color variations; 5 = not acceptable, high blemish and color variations.
14

Table 3. External and internal defects for SFA clones.
% External Tuber Defects1 % Internal Tuber Defects2
Growth Mis- Sun- Rotten Total
Clone Cracks shapen burned & misc. Culls HH BR CRS IHN Atlantic 0 0 12 18 30 6 0 0 0 Snowden 0 0 3 7 10 0 0 0 0 AF2291-10 0 0 3 11 14 0 0 0 0 CO96141-4W 0 0 1 3 4 0 0 0 0 CO97043-14W 0 0 2 2 4 0 0 0 0 CO97065-7W 0 0 3 2 5 0 0 0 1 Kalkaska 0 0 14 10 24 0 0 0 0 MSJ126-9Y 0 0 9 1 10 0 0 0 0 NY138 0 0 6 4 10 0 0 0 0 NY139 0 0 4 11 15 0 0 0 0 W2342-1 0 0 3 16 19 0 0 0 0 W2717-5 1 0 12 6 19 1 0 0 0 1External Tuber Defects: Total Culls is sum of growth cracks, misshapen, sunburned and rotten/miscellaneous. 2Percent Internal Tuber Defects: percent of tubers showing defects; HH = hollow heart, BR = brown rot, CRS = corky ringspot, IHN = internal heat necrosis.
15

Local Coordinator:Jeff Stark
Peggy BainMelvin Chappell
Trial DataPLANTED 7-May-09VINE KILLED 3-Sep-09VINE KILLER (Reglone @ 2 pts/A)HARVESTED 24-Sep-09
PLOT LENGTH 18' HARVEST LENGTH 18'HILL SPACING 10” ROW SPACING 36”HILLS PER PLOT 20 ROWS/ PLOT 1REPS 4
METHOD OF HARVEST Grimme Machine
IRRIGATION 16.59 inches sprinkler applied 4.55 inches rain23 inches total water
FERTILIZER
Idaho Regional Trial
University of IdahoAberdeen R&E Center
Aberdeen, Idaho
FERTILIZER115 N - 115 P - 0 K - 5 lb zinc– pre-plant 135 units injected through water
INSECTICIDES APPLIED/HILLINGAdmire Pro (8 oz/A) - Shanked May 21
FUNGICIDES APPLIEDDithane F-45 1.5 gts/Acre July 14Equus 8 pints/A July 27
HERBICIDES APPLIEDEptam 6.5 Pints/A; Matrix 1.5 oz/A; Metri DF 0.45 lb/acreSpray Coupe- May 21
ENVIRONMENTAL FACTORSRainfall of 4.55 inches from June 1-June 22.
16

Table 1. IDAHO TRIAL 2009, Yield, Size Distribution, Specific Gravity
% Specific Clone US No1 Total <1 7/8 " 17/8-2.5" 2.5-4" >4" Unusable Gravity
CO96141-4W 404 484 16 31 48 4 1 1.085NY139 372 488 23 34 39 3 1 1.094NY138 362 438 17 24 54 4 1 1.083ATLANTIC 329 427 19 27 36 14 4 1.094CO97043-14W 316 409 23 32 43 2 0 1.088AF2291-10 283 327 9 20 49 17 5 1.093W2717-5 275 388 27 32 33 6 2 1.094SNOWDEN 270 385 26 26 32 12 4 1.092MSJ036-A 257 368 29 33 36 1 1 1.094CO97065-7W 213 393 46 44 10 0 0 1.089MSJ126-9Y 185 332 44 39 16 0 1 1.089
Mean 297 404 25 31 36 6 2 1.090LSD (.05) 59 65 0.004LSD (.01) 78 87 0.006
Table 2. IDAHO TRIAL 2009, Vine and tuber characteristics.Fresh Avg.
Vine Vine Stems/ Merit Tuber TuberClone Size 1 Maturity2 Plant Score 3 Size (oz.) Shape4
CO96141-4W 1.5 1.5 2.3 4.3 5.3 2.8NY139 2.5 3.0 2.5 3.5 4.8 1.8NY138 2.0 3.0 1.4 3.3 5.3 2.3ATLANTIC 2.0 2.0 2.8 2.5 5.3 2.0CO97043-14W 1.0 2.0 2.1 2.5 4.8 1.0AF2291-10 1.5 2.5 1.7 2.0 6.7 2.3W2717-5 2.5 2.0 2.2 2.8 4.6 2.0SNOWDEN 1.5 2.0 2.7 1.5 4.8 1.5MSJ036-A 2.5 2.5 1.8 3.3 4.3 1.3CO97065-7W 1.0 1.0 3.6 3.3 3.7 1.0MSJ126-9Y 1.0 2.0 2.4 3.0 3.7 1.0
Mean 1.7 2.1 2.3 2.9 4.8 1.71 (1-5) 5=Large2 (1-5) 5=Late3 (1-5) 5=Best Preference Score4 (1-5) 1=Round
Yield (cwt/A) Percent Size Distribution
17

Table 3. IDAHO TRIAL 2009, External and Internal Defects.
Growth Eye % % % %Clone Scab Cracks Knobs Depth 5 HH BC IBS VD
CO96141-4W 3.3 5.0 5.0 4.3 0 0 0 0NY139 2.5 5.0 5.0 3.3 0 0 0 0NY138 2.3 5.0 5.0 3.8 0 0 0 0ATLANTIC 3.0 4.5 5.0 3.0 5 5 0 0CO97043-14W 2.8 5.0 5.0 3.3 0 0 0 0AF2291-10 4.5 5.0 4.8 2.8 3 3 0 0W2717-5 3.5 5.0 4.8 4.3 8 0 0 0SNOWDEN 3.5 5.0 4.8 2.0 0 0 0 13MSJ036-A 3.5 5.0 5.0 3.3 3 0 0 0CO97065-7W 3.0 5.0 5.0 3.5 0 0 0 0MSJ126-9Y 4.5 5.0 5.0 3.5 0 0 0 0
Mean 3.3 5.0 4.9 3.4 1.7 0.7 0.0 1.2 4 (1-5) 5=None 5 (1-5) 1=deep, 5=shallow. 6 Percent of defects on 10 large tubersHH=hollow heart, BC=brown center, IBS=internal brown spot, VD=vascular discoloration
Table 4. IDAHO TRIAL 2009, Harvest Quality Report and Field Diseases
Early VerticilliumClone Chip color Blight7 Wilt7
CO96141-4W not available 1.5 1.5NY139 2.0 3.0NY138 2.5 3.0ATLANTIC 2.0 2.0
CO97043-14W 1.5 2.5
AF2291-10 2.0 2.5
W2717-5 2.0 2.5
SNOWDEN 2.0 2.0
MSJ036-A 2.0 2.5
CO97065-7W 1.0 1.0MSJ126-9Y 1.5 2.0
Mean 1.8 2.2 7 (1-5) 1=severe.
small, round, buff, scabvery small, round, scab
oval, white, nice, but scab
External defects4
oval, buff, non uniform, deep ends
oval, white, scab, varied sizes, flatoval, lt buff, scab, deep ends
round (almost Compressed), white, rot, ad stolons
lumpy, knobs, ugly, green
Internal Defects6
medium round, buff, ad stolons, deep ends
Appearance comments
round, buff, flat, nonuniform, rot, shattered
round, scaley buff, scab
18

Maine Regional Trial Cooperators: Local Coordinator: Cooperating Grower(s): Greg Porter Aroostook Research Farm 5722 Deering Hall, Room 114 University of Maine University of Maine 59 Houlton Road Orono, ME 04469-5722 Presque Isle, ME 04769 (207) 581-2943 [email protected] Aroostook Produce Distributors Gerry Miller Houlton, ME 04730 Cooperating Processor: SFA Coodinator: Frito-Lay, Inc Donald E. Halseth Dennis Deary, Process Mgr. Cornell University 1886 Upper Maple Street 150 Plant Science Building Dayville, CT 06241 Ithaca, NY 14853 (860)779-0200x2304 (607)255-5460 [email protected] [email protected] Variety Entries: Atlantic (Field Std.) Snowden (Storage Std.) AF2291-10 ME, University of Maine, Greg Porter CO96141-4W CO, San Luis Valley Res. Ctr., David Holm CO97065-7W CO, San Luis Valley Res. Ctr., David Holm CO97043-14W CO, San Luis Valley Res. Ctr., David Holm Kalkaska (MSJ036-A) MI, Michigan State Univ., David Douches MSJ126-9Y MI, Michigan State Univ., David Douches NY138 NY, Cornell University, Walter DeJong NY139 NY, Cornell University, Walter DeJong W2717-5 WI, University of Wisconsin, Jiwan Palta Trial Information: Location: Aroostook Research Farm, Presque Isle, ME Soil Type: Caribou loam Soil Test: pH 5.0 Avail P (MH), K (MH), Ca (L), Mg (M) 3.5% organic matter Previous Crop: clover (2008), peas (2007) Planting Date: May 22, 2009 Plot size/design: 36” row spacing, plots 2 rows x 30’
Randomized (RCBD), four replicates per variety
19

Trial Information (continued): Fertilization: 168-168-168 at planting Foliar boron applied June 30 In-row Spacing: 10” except Snowden (14”), AF2291-10 (8”), NY138 (8”) Crop Management: Typical of commercial production in the area Sprout Inhibitor: Maleic Hydrazide, August 13 Vinekill Date: September 8, 2009 (109 DAP) Harvest Date: September 23, 2009 Processing Date: September 30, 2009 Procedures: Seed potatoes were received from the cooperating programs listed above and held under controlled storage conditions at Aroostook Research Farm, Presque Isle, ME. The seed potatoes were warmed and hand-cut about two weeks prior to planting. They were suberized in controlled storage and hand-planted without a commercial seed treatment. The trial was managed using practices typical of the production area. Weeds were controlled with a standard herbicide program followed by normal cultivation and hilling. Insect pests were controlled with an in-furrow insecticide. Subsequent foliar insecticides were applied based on insect pressure determined by regular scouting for pests. Foliar diseases were controlled using a conventional spray program based on the University of Maine’s IPM program. Late blight was not observed in this trial during 2009. Vine desiccation was accomplished using a standard chemical desiccant. Natural rainfall was abundant during the majority of the season, but became somewhat limiting late in August (Table 1). No supplemental irrigation was applied. The plots were harvested with a hand crew following lifting with a one-row, research-scale potato digger. All tubers were weighed and a 50-lb sample was graded for external defects and sized using a spool-type sizer. Ten tubers per size class were examined for hollow heart. Specific gravity was determined on a 5-kg sample using the weight-in-air/weight-in-water method. A 50-lb sample was collected at harvest and shipped to Frito-Lay’s Dayville plant for evaluation of chip quality. Additional tuber samples were placed in controlled storage for evaluation of chip color during the storage season. Table 1. Rainfall and temperature, 2009 Aroostook Research Farm, Presque Isle, ME Month Week (inches) Total Average (oF) 1 2 3 4 (inches) High Low May 1.07 1.60 0.83 0.96 4.46 69.6 44.7 June 0.94 0.84 1.41 1.41 4.60 71.8 51.3 July 1.16 0.27 0.80 2.72 4.95 74.1 55.9 August 0.31 0.52 0.94 0.47 2.24 78.3 56.7 September 0.00 0.06 0.05 1.24 1.35 69.6 44.7 Grand total 17.60
20

Results: There was ample early rainfall at the trial site followed by a relatively dry August (Table 1). Early crop growth was good and most of the clones were still growing quite vigorously at vinekill (Table 2). There were no significant problems with foliar diseases or early dying in this trial. Table 2. Plant characteristics, UPSB/SFA Chip Variety Trial, Maine, 2009. % Variety/Clone Plant Vigor Vine Foliar Disease Stand Early Late Mat. Foliage Color Problems AF2291-10 78 F VG Late Med. green None CO96141-4W 92 F G Med. late Dark green None Snowden 100 G G Med. late Med. green None Kalkaska 78 F-P VG Late Med. green None MSJ126-9Y 95 F G Med. late Dark green None Atlantic 91 VG G Med. late Med. green None CO97065-7W 97 VG G Med. late Med. green None NY139 93 G VG Late Light green None CO97043-14W 99 VG F Medium Med. green None W2717-5 84 F VG Late Med. green None NY138 82 F-P G Med. late Med. green None AF2291-10, CO96141-4W, Snowden, and Kalkaska had the highest US#1 yields in the experiment (Table 3). CO97043-14W, W2717-5, and NY138 were relatively low yielding. W2717-5, Atlantic, Snowden, and AF2291-10 had particularly high specific gravity. All clones had acceptable tuber size profiles. AF2291-10, CO96141-4W, Snowden, Kalkaska, and MSJ126-9Y had relatively low incidence of external tuber defects (Table 4). Atlantic, W2717-5, and NY138 had greater than 20% external tuber defects. Sunburn was the most prevalent external defect; however, off shapes (AF2291-10), growth cracks (W2717-5, Atlantic), and scab (W2717-5) were prevalent in several clones. Hollow incidence was low for all clones/varieties except Atlantic. Tuber characteristics are summarized in Table 5. Chip color evaluations were conducted at the Frito-Lay plant in Dayville, CT (Table 6). Atlantic had a relatively high incidence of chip defects otherwise the chip samples were good (AF2291-10) to very good (all others). Only CO97043-14W and NY138 had total solids values below 18%. Susceptibility to bruising was evaluated by tumbling tuber samples in a drum. Based on this evaluation NY138, NY139, and CO96141-4W were relatively resistant to bruise damage, while Atlantic and W2717-5 were quite susceptible (Table 7). AF2291-10, Snowden, Kalkaska, MSJ126-9Y, CO97065-7W, CO97043-14W fell into the intermediate ranges.
21

Table 3. Yield, size distribution, and specific gravity, UPSB/SFA Chip Variety Trial, Maine, 2009. Yield (cwt/A)1 Size Distribution (% by weight)2 Spec. Variety/Clone Tot. US#1 %Std 1 2 3 4 5 1-7/8 2-1/2 Grav. to 4” to 4” AF2291-10 365 314 116 5 54 37 4 0 95 41 1.092 CO96141-4W 346 305 113 4 57 38 1 0 96 39 1.079 Snowden 359 299 111 7 64 28 1 0 93 29 1.093 Kalkaska 359 298 110 8 71 20 1 0 92 22 1.089 MSJ126-9Y 329 277 103 5 56 36 3 0 95 40 1.083 Atlantic 367 270 100 5 60 30 5 0 95 35 1.093 CO97065-7W 322 258 96 5 67 26 2 0 95 29 1.090 NY139 318 251 93 7 63 27 3 0 93 30 1.090 CO97043-14W 295 236 87 5 54 36 5 0 95 41 1.081 W2717-5 348 227 84 5 60 32 3 0 95 35 1.097 NY138 297 214 79 4 37 50 9 0 96 59 1.083 Mean 337 268 94 36 1.088 CV(%) 6.8 13.7 1.9 23.4 0.33 LSD(k=100) 33 58 3 12 0.005 1US#1 yield was calculated as yield from 1⅞ to 4” diameter, minus tubers with external defects. 2Size Classes: 1=1½ to 1⅞”; 2=1⅞ to 2½”; 3=2½ to 3¼”; 4=3¼ to 4”; 5= over 4” Table 4. External tuber defects and hollow heart incidence, UPSB/SFA Chip Variety Trial, Maine, 2009. Hollow Heart Variety/Clone External Defects (% by weight) by Size Class1(%) Total Sunb Mshp Grck Scab Rot 3 4 5 AF2291-10 9.8 2.6 5.7 0.3 1.2 0.0 0.0 0.0 11.1 CO96141-4W 7.9 4.3 1.7 0.0 1.8 0.1 0.0 0.0 0.0 Snowden 10.2 7.4 2.3 0.4 0.1 0.0 0.0 0.0 0.0 Kalkaska 9.6 6.3 1.3 1.4 0.0 0.5 5.0 2.5 0.0 MSJ126-9Y 11.9 6.9 1.9 1.5 0.9 0.8 0.0 0.0 0.0 Atlantic 23.2 15.0 2.5 3.3 2.4 0.0 0.0 0.0 38.5 CO97065-7W 16.1 10.8 1.8 2.0 1.2 0.2 0.0 0.0 0.0 NY139 14.6 11.9 0.5 0.2 1.9 0.2 0.0 0.0 0.0 CO97043-14W 16.2 11.7 2.8 0.8 0.9 0.0 0.0 0.0 0.0 W2717-5 31.5 11.4 3.7 4.8 11.4 0.3 0.0 0.0 0.0 NY138 25.2 22.4 0.0 1.3 1.5 0.0 0.0 0.0 0.0 Mean 16.0 CV(%) 51.9 LSD(k=100) 13.2 1Size Classes: 1=1½ to 1⅞”; 2=1⅞ to 2½”; 3=2½ to 3¼”; 4=3¼ to 4”; 5= over 4”
22

Table 5. Tuber characteristics, UPSB/SFA Chip Variety Trial, Maine, 2009. Variety/Clone Shape Skin Eye Gen. Flesh Tex- Depth Appear. Col. Comments ture AF2291-10 R-O M-S M-S F Wh bright, some mshp, lenticels CO96141-4W O-R M-S M-S F-G Wh bright, trace russet scab Snowden R Net M-D F OW dull, deep stem end Kalkaska R Net M-S F-G OW ok, deep stem end MSJ126-9Y R Net M-D F YF1 some mshp, deep stem and
apical ends, eye depth Atlantic R-O Net M-D F OW dull, deep stem end CO97065-7W R Sln. M-D F-G OW some mshp, deep stem end NY139 R-O M-S M-S F-G OW bright, trace lenticels and
russet scab CO97043-14W R S M-D F OW some mshp, deep stem and
apical ends, lenticels, bright, compressed shape
W2717-5 O-R M-S M-S F-G Wh bright, lenticels, some mshp
NY138 R-O S M-S G OW bright, lenticels Shape: R=mostly round; R-O=round to oblong; O-R=oblong to round; O=oblong Skin Texture: S=smooth; M-S=moderately smooth; Sln.=slight net; Net=strongly netted Eye Depth: S=shallow; M-S=moderate to shallow; M-D=moderate to deep; D=deep Flesh Color: Wh=white; OW=off white; YF=yellow fleshed, higher numbers indicate brighter yellow. Table 6. Chip quality one week after harvest, UPSB/SFA Chip Variety Trial, Maine, 2009. Frito-Lay Plant Data, Dayville, CT (September 30, 2009) Variety/Clone Total Color1 Defects (%) Comments Solids Ext. Int. Tot. AF2291-10 19.8 >70 6.5 0.0 6.5 Nice, some sugar CO96141-4W 18.1 >70 0.7 0.0 0.7 Very nice Snowden 20.7 >70 0.6 0.0 0.6 Very nice Kalkaska 19.5 >70 0.7 0.0 0.7 Very nice MSJ126-9Y 18.2 >70 1.5 0.0 1.5 Very nice Atlantic 21.1 >70 14.9 5.1 20.0 CO97065-7W 18.9 >70 0.0 0.0 0.0 Very nice NY139 19.2 >70 0.0 0.0 0.0 Very nice CO97043-14W 17.6 >70 0.0 0.0 0.0 Very nice W2717-5 20.7 >70 0.0 0.0 0.0 Very nice NY138 17.8 >70 0.0 0.0 0.0 Very nice
23

1Higher L-values indicate lighter color. All were very good at this sample date. All A-values were negative. Actual L- and a-values were not provided). Table 7. Bruise susceptibility scores, UPSB/SFA Chip Variety Trial, Maine, 2009. Variety/Clone Skinning & Bruise (tumble method)1 Comments on
Index % Incidence % Surface peeled tubers AF2291-10 2.10 62.3 4.5 CO96141-4W 1.80 50.0 2.8 Snowden 1.27 72.3 5.3 Kalkaska 1.63 77.1 5.6 MSJ126-9Y 1.16 68.4 4.4 yellow fleshed Atlantic 1.25 88.3 9.1 CO97065-7W 2.57 66.7 5.8 NY139 2.40 33.3 1.7 CO97043-14W 2.22 59.0 3.2 stays rel. white W2717-5 2.30 80.0 9.3 NY138 1.75 33.3 1.8 speckled surface2 Mean 1.86 62.8 4.8 CV(%) 10.5 25.3 46.3 LSD(k=100) 0.26 23.2 3.3 1Sixty tubers were evaluated per variety/clone. Fifteen tubers per plot were tumbled on October 15 (22 days after harvest) in a paddled drum for 1 minute at 15 rpm. Index scores indicate combined severity of skinning plus fresh bruise (higher values indicate more severe bruising) rated on October 15. Percent incidence (% of tubers with visible bruise) and surface area values are combined scores for shatter and blackspot rated on peeled tubers (October 27, 2009) 2Peeled tubers have many dark spots on surface, possible insect damage or physiological problem. Variety/Clone Summary 2009: AF2291-10: Late vine maturity, round to oblong tubers with moderately smooth skin, moderately-shallow eyes, and white flesh. Good yield, high specific gravity, good chip color, relatively low external defects incidence (predominant defect type was off shapes), low level of hollow heart observed in large tubers, intermediate bruise susceptibility. CO96141-4W: Medium-late vine maturity, oblong to round tubers with moderately smooth skin, moderately-shallow eyes, and white flesh. Good yield, moderate specific gravity, very good chip color, relatively low external defects incidence (predominant defect type was sunburn), no hollow heart observed, relatively low bruise susceptibility.
24

Snowden: Medium-late vine maturity, mostly round, relatively small tubers with netted skin, moderately-deep eyes, deep stem end, and off-white flesh. Good yield, high specific gravity, very good chip color, relatively low external defects incidence (predominant defect type was sunburn), no hollow heart observed, intermediate bruise susceptibility. Kalkaska: Late vine maturity, mostly round, relatively small tubers with netted skin, moderately-shallow eyes, deep stem end, and off-white flesh. Good yield, high specific gravity, very good chip color, relatively low external defects incidence (predominant defect type was sunburn), hollow heart observed in smaller size classes, moderately-high bruise susceptibility. MSJ126-9Y: Medium-late vine maturity, mostly round tubers with netted skin, moderately-deep eyes, deep stem and apical ends, and pale yellow flesh. Moderate to high yield, moderate specific gravity, very good chip color, relatively low external defects incidence (predominant defect type was sunburn), no hollow heart observed, intermediate bruise susceptibility. Atlantic: Medium-late vine maturity, round to oblong tubers with netted skin, moderately-deep eyes, deep stem end, and off-white flesh. Moderate to high yield, high specific gravity, defects incidence detracted from chip color, high external defects incidence (predominant defect type was sunburn), high hollow heart incidence observed in large tubers, relatively high bruise susceptibility. CO97065-7W: Medium-late vine maturity, mostly round tubers with slightly netted skin, moderately-deep eyes, deep stem, and off-white flesh. Moderate to high yield, high specific gravity, very good chip color, intermediate external defects incidence (predominant defect type was sunburn), no hollow heart observed, intermediate bruise susceptibility. NY139: Late vine maturity, round to oblong, relatively small tubers with moderately smooth skin, moderately-shallow eyes, and off-white flesh. Moderate to high yield, high specific gravity, very good chip color, intermediate external defects incidence (predominant defect type was sunburn), no hollow heart observed, relatively low bruise susceptibility. CO97043-14W: Medium vine maturity, mostly round, compressed tubers with smooth skin, moderately-deep eyes, deep apical and stem ends, and off-white flesh. Moderate yield, moderate specific gravity, very good chip color, intermediate external defects incidence (predominant defect type was sunburn), no hollow heart observed, moderate to low bruise susceptibility. W2717-5: Late vine maturity, oblong to round tubers with moderately-smooth skin, moderately-shallow eyes, and white flesh. Moderate yield, high specific gravity, very good chip color, high external defects incidence (predominant defect types were sunburn, growth cracks, and scab), no hollow heart observed, relatively high bruise susceptibility. NY138: Medium-late vine maturity, round to oblong, relatively large tubers with smooth skin, moderately-shallow eyes, and off-white flesh. Moderate to low yield, moderate specific gravity, very good chip color, relatively high external defects incidence (predominant defect type was sunburn), no hollow heart observed, low bruise susceptibility.
25

Michigan Regional Location
Local Coordinators: Cooperating Grower: Cooperating Chip Processor: Chris Long Tim & Todd Young Herr Foods, Inc. Dave Douches Sandyland Farms LLC Nottingham, PA Greg Steere Howard City, MI Michigan State University East Lansing, MI Trial Data: Planting Date: May 22, 2009 Vine Kill Date: September 8, 2009 Harvest Date: September 30, 2009 (131 Days) Row & Plant Spacing: 34″ x 10″; irrigated Plots: Single rows for each entry approximately 300′ long GDD, Base 40 2660 Trial Procedure: Seed was mechanically cut on May 4, 2009 and delivered to the grower’s seed storage three days later. No seed treatments were applied at the time of seed cutting. One pre-harvest sugar profile was taken for each variety just prior to vine kill on August 24th. The pre-harvest sugar profile protocol was as follows: obtained a minimum of 40 tubers from each variety, took all the tubers from each hill even if that required collecting more than 40 tubers. A canopy rating was taken for each variety as a percent rating of green foliage. Canopy uniformity was noted as a percentage of how uniform the foliage health appeared. The number of hills required to obtain 40 tubers was recorded, along with the total number of stems harvested. From the tubers harvested, specific gravity, a glucose value (a percent by fresh weight), a sucrose rating (a percent by fresh weight X10) and an average tuber weight (in ounces) was established. At harvest, three plot areas of 23 feet were harvested from each entry and were used to determine yield, size distribution, specific gravity and internal defects. Two, 40 lb. storage samples were collected from each entry and were placed in the grower’s commercial storage for evaluation. One set of samples will be evaluated in the winter of 2009 and the other in the spring of 2010. Sixteen, 40 tuber samples were also collected for each variety at harvest. All sixteen samples were stored at the Michigan Potato Industry Commission’s Cargill Demonstration Storage Facility at approximately 48ºF or 55ºF for a monthly sugar profile evaluation at Techmark, Inc. Eight, 40 tuber samples were stored at each temperature and
26

evaluated October 2009 through June 2010. The storage sugar profiles began the day of harvest. Two out-of-the-field chip samples were taken for each variety at harvest. One was sent to Herr Foods, Inc. for processing and the additional sample was processed at Michigan State University. A plant growth and vigor observation was made on June 29th. MSJ126-9Y appeared to have the slowest rate of vine growth where as ND 7519-1 was the most vigorous and was in flower at this date. Growing Season Weather: Weather conditions during the 2009 growing season were cooler than average. Growing degree days base 40 recorded for this time period was the lowest in six years at 2660. Total rainfall from May 22nd through September 8th was approximately 9.9”. The daytime temperatures during this growing period exceeded 90ºF on three consecutive days in late June. The Nighttime temperatures during this period, May through September, were below average recording no nights with temperatures over 70 ºF during this growing period. The average specific gravity in Michigan was above average as a result of the reduced heat stress. Results: Table 1 summarizes the yield, size distribution, and specific gravity data at harvest. Atlantic and Snowden topped the yield chart in 2009 followed by a group of lines that yielded very similarly. These lines are: AF2291-10, NY139, CO97043-14W, Kalkaska and NY138. NY139 had a large percentage of recorded oversize tubers. The CO97043-14W, NY138, CO96141-4W and MSJ126-9Y had very low specific gravities. Table 1. Yield ,Size Distribution*, Specific Gravity
SpecificUS#1 TOTAL US#1 Small Mid-Size Large Culls Gravity
Atlantic 498 523 96 2 80 16 2 1.087Snowden 488 512 95 5 89 6 0 1.088AF2291-10 466 480 97 3 86 11 0 1.089NY139 455 462 99 1 73 26 0 1.087CO97043-14W 455 472 96 3 85 11 1 1.073Kalkaska 454 486 93 6 89 4 1 1.082NY138 444 458 97 3 78 19 0 1.073CO96141-4W 423 444 96 3 83 13 1 1.070CO97065-7W 404 420 96 3 81 15 1 1.078ND7519-1 387 414 93 5 90 3 2 1.092W2717-5 361 395 91 4 82 9 5 1.085MSJ126-9Y 342 370 92 3 81 11 5 1.071
MEAN 432 453 95 3 83 12 1.500 1.081*small <1 7/8"; mid-size 1 7/8"-3 1/4"; large >3 1/4"
Yield (cwt/A) Percent Size Distribution
Entry
27

Table 2 summarizes the at-harvest tuber quality. Internal quality across the trial was generally acceptable. Hollow heart was prevalent in Atlantic and to a lesser degree in W2717-5. W2717-5 also recorded nine brown centers in addition to the hollow heart. MSJ126-9Y had 11 tubers with vascular discoloration possibly due to this variety not being fully mature at vine desiccation. Table 2. At-Harvest Tuber Quality. Sandyland Farms, Howard City, Michigan.
Entry HH VD IBS BC Total CutAtlantic 11 0 0 1 30Snowden 1 7 0 0 30AF2291-10 0 7 0 0 30NY139 0 4 3 0 30CO97043-14W 0 5 0 0 30Kalkaska 0 5 0 2 30NY138 0 0 0 0 30CO96141-4W 1 3 0 0 30CO97065-7W 1 0 0 6 30ND7519-1 1 2 0 0 30W2717-5 7 3 0 9 30MSJ126-9Y 2 11 0 0 30
1Internal Defects. HH = hollow heart, VD = vascular discoloration, IBS = internal brown spot, BC = brown center.
Internal Defects1
28
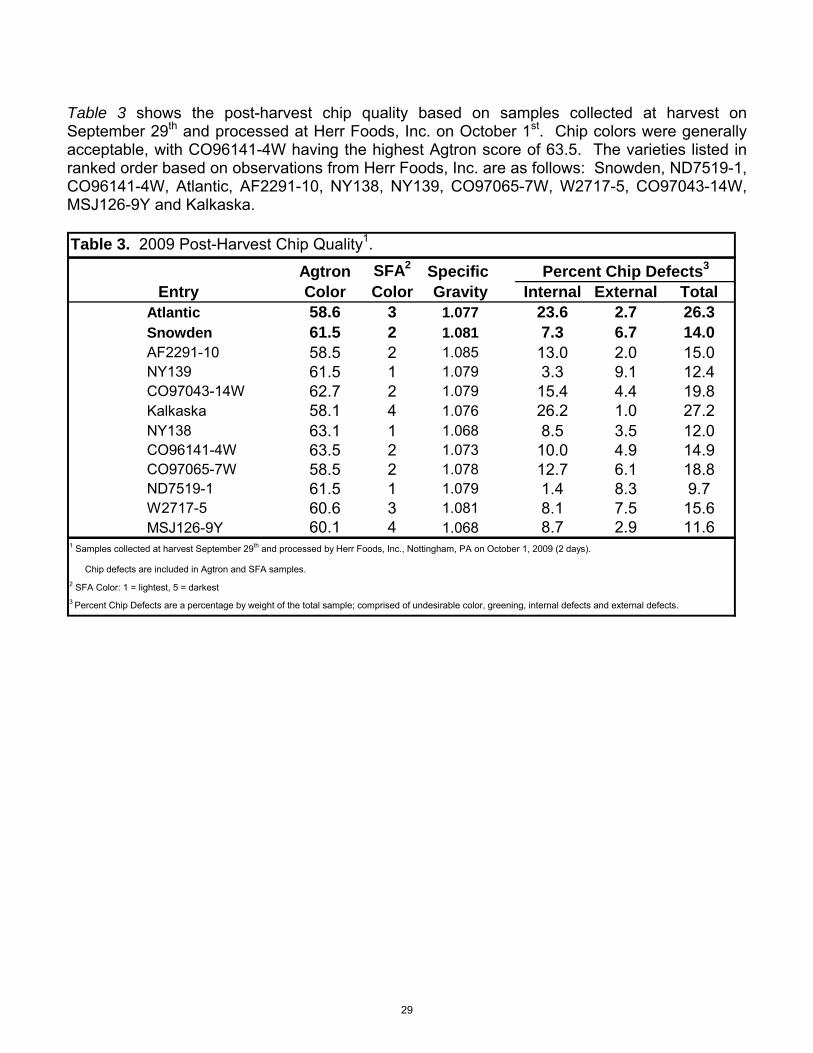
Table 3 shows the post-harvest chip quality based on samples collected at harvest on September 29th and processed at Herr Foods, Inc. on October 1st. Chip colors were generally acceptable, with CO96141-4W having the highest Agtron score of 63.5. The varieties listed in ranked order based on observations from Herr Foods, Inc. are as follows: Snowden, ND7519-1, CO96141-4W, Atlantic, AF2291-10, NY138, NY139, CO97065-7W, W2717-5, CO97043-14W, MSJ126-9Y and Kalkaska. Table 3. 2009 Post-Harvest Chip Quality1.
Agtron SFA2 Specific Entry Color Color Gravity Internal External Total
Atlantic 58.6 3 1.077 23.6 2.7 26.3Snowden 61.5 2 1.081 7.3 6.7 14.0AF2291-10 58.5 2 1.085 13.0 2.0 15.0NY139 61.5 1 1.079 3.3 9.1 12.4CO97043-14W 62.7 2 1.079 15.4 4.4 19.8Kalkaska 58.1 4 1.076 26.2 1.0 27.2NY138 63.1 1 1.068 8.5 3.5 12.0CO96141-4W 63.5 2 1.073 10.0 4.9 14.9CO97065-7W 58.5 2 1.078 12.7 6.1 18.8ND7519-1 61.5 1 1.079 1.4 8.3 9.7W2717-5 60.6 3 1.081 8.1 7.5 15.6MSJ126-9Y 60.1 4 1.068 8.7 2.9 11.6
1 Samples collected at harvest September 29th and processed by Herr Foods, Inc., Nottingham, PA on October 1, 2009 (2 days).
Chip defects are included in Agtron and SFA samples.2 SFA Color: 1 = lightest, 5 = darkest 3 Percent Chip Defects are a percentage by weight of the total sample; comprised of undesirable color, greening, internal defects and external defects.
Percent Chip Defects3
29

Table 4 summarizes the results of the samples collected for black spot bruise. Two, 25 tuber samples were collected at harvest. One sample served as a check and the second sample was stored for at least 12 hours at 50ºF, then placed in a 6 sided plywood drum and rotated 10 times to produce a simulated bruise. Two to three weeks later, all samples were abrasively peeled and scored for the presence of black spot bruise. Among the “Simulated Bruise” samples, the best entries were NY138, CO97065-7W and CO96141-4W. Snowden, NY139 and AF2291-10 showed the lowest percent bruise free. Table 4. Black Spot Bruise Test
Percent Average Percent AverageTotal Bruise Bruises Per Total Bruise Bruises Per
Entry 0 1 2 3 4 5 Tubers Free Tuber 0 1 2 3 4 5 Tubers Free TuberAtlantic 8 8 6 3 25 32 1.16 5 6 4 5 3 2 25 20 2.0Snowden 9 7 5 1 2 1 25 36 1.32 0 3 5 8 3 6 25 0 3.2AF2291-10 8 11 4 1 1 25 32 1.08 2 7 6 6 1 3 25 8 2.2NY139 16 7 1 1 25 64 0.48 1 13 4 5 2 25 4 1.8CO97043-14W 7 7 6 4 1 25 28 1.40 4 6 7 3 2 3 25 16 2.1Kalkaska 10 10 4 1 25 40 0.84 9 9 4 2 1 25 36 1.1NY138 15 8 2 25 60 0.48 17 5 1 1 1 25 68 0.6CO96141-4W 16 9 25 64 0.36 11 11 2 1 25 44 0.7CO97065-7W 8 13 3 1 25 32 0.88 13 3 4 4 1 25 52 1.1ND7519-1 12 10 2 1 25 48 0.76 6 5 8 5 1 25 24 1.6W2717-5 12 6 3 2 2 25 48 1.12 9 8 4 4 25 36 1.1MSJ126-9Y 9 7 4 3 1 1 25 36 1.32 10 8 1 4 1 1 25 40 1.2
1Tuber samples collected at harvest and held at room temperature for later abrasive peeling and scoring.2Tuber samples collected at harvest, held at 50ºF for at least 12 hours, then placed in a 6 sided plywood drum and rotated 10 times to produce simulated bruising. They were then held at room temperature for later abrasive peeling and scoring.
A. Check Samples1 B. Simulated Bruise Samples2
# of Bruises Per Tuber # of Bruises Per Tuber
30

Table 5 summarizes the results of the pre-harvest panel data. Kalkaska was found to be immature on August 24th with a 1.077 specific gravity and a sucrose rating of 1.892. CO96141-4W and Atlantic were the earliest maturing varieties. Snowden, AF2291-10, NY139 and NY138, based on canopy rating, appeared to be late maturing lines. NY138 had the largest average tuber weight of 7.60 oz. Table 5. Pre-Harvest Panels, 08/24/09
Average5
Specific Glucose1 Sucrose2 TuberEntry Gravity % Rating Rating3 Uniform.4 Hills Stems Weight
Atlantic 1.080 0.001 0.381 85 90 3 17 5.50Snowden 1.084 0.002 0.391 90 95 5 21 4.56AF2291-10 1.086 0.005 0.748 90 95 5 16 5.92NY139 1.079 0.003 0.613 90 90 4 11 6.01CO97043-14W 1.076 0.005 0.559 80 90 4 15 5.62Kalkaska 1.077 0.015 1.892 60 80 4 7 4.41NY138 1.068 0.003 0.598 90 90 5 10 7.60CO96141-4W 1.071 0.001 0.202 80 90 5 14 5.23CO97065-7W 1.078 0.002 0.454 65 80 5 23 4.61ND7519-1 1.091 0.002 0.686 75 50 3 15 4.26W2717-5 1.082 0.004 0.735 70 90 4 10 4.31MSJ126-9Y 1.067 0.002 0.716 60 90 6 15 5.42
1Percent Glucose is the percent of glucose by weight in a given amount of fresh tuber tissue. 2Sucrose Rating is the percent of sucrose by weight in a given amount of fresh tuber tissue X10. 3 The Canopy Rating is a percent rating of green foliage (0 is all brown, dead foliage, 100 is green, vigorous foliage).4 The Canopy Uniformity is a percentage of how uniform the foliage health is at the date of observation. 5 The Average Tuber Weight is the total tuber weight collected, divided by the number of tubers reported in ounces.
Canopy Number of
Variety Comments: Atlantic: This was the top yielding variety in the 2009 variety trial with a 498 cwt./A US#1 yield and an above average specific gravity at 1.087. This variety had a good percent of oversize tubers, but 33 percent of them were hollow. Chip quality at Herr Foods on October 1st ranked above average. Atlantic showed black spot bruise susceptibility with only 20 percent of the tubers being bruise free. Snowden: Snowden was the second highest yielding variety in the 2009 variety trial with a 488 cwt./A US#1 yield and an above average specific gravity at 1.088. This variety had the best overall chip performance at Herr Foods at the out-of-the-field fry test. Snowden was the most susceptible line to black spot bruise in the trial. AF2291-10: This variety yielded 466 cwt./A US#1 with a 1.089 specific gravity. The variety performed in the middle of the group at Herr Foods. AF2291-10 exhibited a very high level of bruise susceptibility with only 8 percent of the tubers being bruise free. It also appears to be a full season variety.
31

NY139: NY139 had a nice yield of US#1 tubers and a tuber size distribution that consisted of 26 percent oversize tubers. The specific gravity was above the trial average. The internal defects were good, but the at-harvest chip fry ranked this variety 7th out of the 12 varieties for overall appearance. This variety had the second greatest black spot bruise susceptibility in the 2009 trial. CO97043-14W: The US#1 yield for this line was 455 cwt./A with below average specific gravity. Internal defects were low but the out-of-the-field chip quality was below average ranking 10th at Herr’s. The variety appeared to be moderately susceptible to black spot bruise. This variety was mature at the time of vine kill and seems to have a mid season maturity. Kalkaska: Kalkaska was above average in yield at 454 cwt./A US#1. The specific gravity for this variety was slightly above the trial average at 1.082. This variety exhibited slight brown centers in 2 out of thirty cut tubers. This variety ranked last at Herr’s out-of-the-field chip evaluation. Kalkaska was moderately susceptible to black spot bruise and ranked near the trial average. This variety appeared to be the most immature based on the pre-harvest panel data from August 24th where the sucrose rating was 1.892 and glucose level was 0.015. NY138: NY138 yielded slightly higher than the trial average at 444 cwt./A US#1. Specific gravity was just above average at 1.082. Tuber quality at harvest was excellent. No internal defects were observed. Herr’s ranked this variety 6 of 12 in chip performance out-of-the-field. NY138 showed the lowest susceptibility to black spot bruising with 68 percent of the tubers being bruise free after simulated bruise testing. CO96141-4W: This variety had a 423 cwt./A US#1 yield with the lowest recorded specific gravity in the trial at 1.070. Internal tuber defects were low at harvest. CO96141-4W ranked 3rd at Herr’s for chip quality. The variety does not appear to be black spot bruise susceptible, receiving a 44 percent bruise free rating in the simulated bruise testing. The specific gravity of this line is out of tolerance for chip processing. This variety appeared to be very mature in the August 24th pre-harvest panel indicating that this variety is an early maturing line. CO97065-7W: This variety had a 404 cwt./A US#1 yield with a below average specific gravity of 1.078. Six brown centers were observed in thirty cut tubers at harvest. Herr’s ranked this variety 8th for overall chip quality. CO97065-7W had the second highest bruise free rating of 52 percent. The vine maturity appears to be mid season. ND7519-1: The yield on ND7519-1 was below average at 387 cwt./A US#1. The specific gravity was excellent at 1.092. This was the highest specific gravity in the trial for 2009. Internal defects were low and the ranking at Herr’s was excellent, ranking second of 16 varieties in out-of-the-field chip performance. Black spot bruise tolerance was average. W2717-5: W2717-5 yielded 361 cwt./A US#1 with a specific gravity of 1.085. The variety had seven hollow, three vascular discoloration and nine brown centers in thirty cut tubers. Herr’s ranked this variety 9th in the overall chip quality evaluation. The line appears to have an average tolerance of black spot bruise and was mature at the time of vine kill. MSJ126-9Y: This variety recorded the lowest yield in this year’s trial. MSJ126-9Y had the second to lowest specific gravity in the trial at 1.071. Internal tuber quality recorded 11 vascular discolorations out of thirty cut tubers. The clone ranked 11th place at Herr’s in the chip quality. The bruise free rating was 40 percent which is above average.
32

Missouri Regional Trial
Black Gold Farms, Charleston, MO
Field Name: Stallings South Soil Type: Malden Loamy Fine Sand Soil Test: pH: 6.3 P: 29 ppm K: 83 ppm OM: 0.6 % B: 0.63 ppm Mg: 114 ppm Ca: 552 ppm CEC: 3.8 meq Tillage: Date__________Tool________________Function_______________________________ 11/28/08 Disk Pre‐plant tillage 11/29/08 DMI Bedder Pre‐plant hilling 04/01/09 Cultivator Rehilling/fert. Fertilizer: Date______Method________Actual lbs/ac applied_________Product Applied________ 03/08/09 Preplant Broadcast 49‐39‐199‐1B‐2Zn Dry Granular 03/14/09 Planter 18‐60‐0 10‐34‐0 Liquid 04/01/09 Cultivator 106‐0‐0 32‐0‐0 Liquid 04/27‐09 Post Emergent 43‐0‐0‐49S AMS 05/10/09 Pivot 10‐0‐0 32‐0‐0 Liquid 05/14/09 Plane 0‐0‐0‐1Zn Zn Citrix 05/15/09 Pivot 18‐0‐0 32‐0‐0 Liquid 05/17/09 Pivot 20‐0‐0 32‐0‐0 Liquid Date_________Method__________Rate_________________Product Applied________ Herbicide: 03/19/09 Ground 1 Qt/ac Roundup 03/31/09 Ground 1 Pt/ac Dual Magnum Ground 1.5 Pt/ac Prowl 3.3 EC 05/07/09 Ground 0.5 Oz/ac Matrix Fungicide: 03/14/09 Planter 6.1 Oz/ac Quadris 05/06/09 Air 2 lbs/ac Manzate DF 05/14/09 Air 2lbs/ac Manzate DF 6 Oz/ac Tanos 05/21/09 Air 2 lbs/ac Manzate DF 05/29/09 Air 2 lbs/ac Manzate DF 06/09/09 Air 2 lbs/ac Manzate DF Insecticide/ Nematicide: 11/29/08 Bedder 6.7 gal/ac Telone II 05/21/09 Air 3.8 OZ/ac Leverage 2.7 Weather: Planting‐cool and wet Emergence‐cool and wet Tuber Initiation‐cool and wet Tuber Bulking‐hot and dry Harvest‐hot and dry Cultural notes: ‐cool, cloudy, and wet first half of season ‐very hot week of June 20th, sand went extremely hot ‐moderate pressure from pigweed
33

DAP: 121
TotalYield
tubers/ plant Cwt/ac tubers/
plant Cwt/ac tubers/ plant Cwt/ac Cwt/ac CLR % UC % GRN % ID % ED % Total
Atlantic 2.0 0.9 17 0.0 0.0 4.4 270 287 1.0916 64 23.3% 0.0% 0.0% 10.9% 34.2%W2717-5 2.0 1.0 19 0.0 0.0 3.4 168 187 1.0884 64 21.3% 0.0% 4.6% 2.2% 28.1%Kalkaska 2.0 1.7 33 0.0 0.0 5.4 281 314 1.0764 64 26.3% 0.0% 0.0% 8.1% 34.4%
MSJ126-9Y 2.0 0.7 13 0.0 0.0 2.4 110 123 1.0742 65 10.2% 0.0% 2.1% 2.1% 14.4%NY138 2.0 0.6 26 0.0 0.0 3.6 226 252 1.0751 64 7.7% 0.0% 0.0% 5.1% 12.8%NY139 2.0 0.6 8 0.0 0.0 3.9 204 212 1.0884 64 20.3% 0.0% 0.0% 8.5% 28.8%
CO96141-4W 2.0 1.0 22 0.0 0.0 3.1 158 180 1.0787 64 8.4% 0.0% 0.0% 13.8% 22.2%CO97065-7W 2.0 0.7 11 0.0 0.0 2.8 136 147 1.0845 64 17.4% 0.0% 0.0% 2.1% 19.5%CO97043-14W 2.0 1.7 38 0.0 0.0 4.5 201 239 1.0828 64 4.8% 0.0% 2.3% 7.2% 14.3%
AF2291-10 2.0 0.5 7 0.0 0.0 3.1 187 194 1.0868 64 17.1% 0.0% 9.0% 5.1% 31.2%W2324-1 2.0 1.1 19 0.0 0.0 4.8 269 288 1.0828 64 14.0% 0.0% 5.1% 0.0% 19.1%
Vine & Vigor 1 = 100 % dead vines 6 = Green, no new growth, some lower leaves yellowing.Rating: 2 = 90% defoliated, 80‐90% dead vines 7 = Green, no flowering
3 = 75% defoliated, 25‐50% dead vines 8 = Green, vigorous, 0‐10% flowering4 = 25% defoliated, 10% dead vines 9 = Green, vigorous, 25% flowering5 = 0‐10% defoliated, yellowing leaves com10 = Green extremely vigorous vines, at least 50% flowering
Quality Assurance Key: GRN = Greening CLR = ColorUC = Undesirable Color ID = Internal Defects
ED = External Defects
Cook Sample DefectsVariety Vine
Vigor
1 - 2" > 4" 2 - 4"
Gravity
Marketable Yield Quality Assurance
Missouri Regional TrialCharleston, Missouri 2009
Black Gold Farms
Planting Date: 3/11/09 Harvest Date: 7/10/09
34

North Carolina Regional Trial
Local Coordinators: Cooperating Grower: Cooperating Chip Processor: Dr. Craig Yencho Chris Hopkins Utz Quality Foods North Carolina State University Black Gold Farms Hanover, PA 214A Kilgore Hall 2815 N Gum Neck Road Raleigh NC, 27695 Columbia, NC 27925 Mr. Mark Clough North Carolina State University 207 Research Station Rd. Plymouth NC 27962 Trial Data: Planting Site: Black Gold Farms, Gum Neck, Tyrrell County, NC Planting Date: March 10, 2009 Harvest Date: June 22, 2009 (104 days) Growing Conditions: Planting was on time. Temperatures and rainfall were favorable for plant growth and tuber
development for the majority of the season. In late May and early June, during bulking, conditions were slightly dryer than optimal. In mid to late June conditions became more wet overall.
Soil Type: Cape Fear silt loam Experimental Design: Randomized complete block design with 5 replications. Row Spacing: 28 hills, spaced 9 inches apart, 34” row width. Fertilizer: 216 lbs N, 74 lbs P, 61 lbs K, 1lb Zn Weed Control: Metribuzin 1.1 lbs/A Intensity One 16 fl oz/A Insect Control: Spintor 2SC 5 fl oz/A Actara 2 oz/A Disease Control: Quadris 6.3oz/A Manzate Pro-stick 7.0 lb/A Curzate 60 DF 3.2 oz/A Revus Top 6 fl oz/A
35
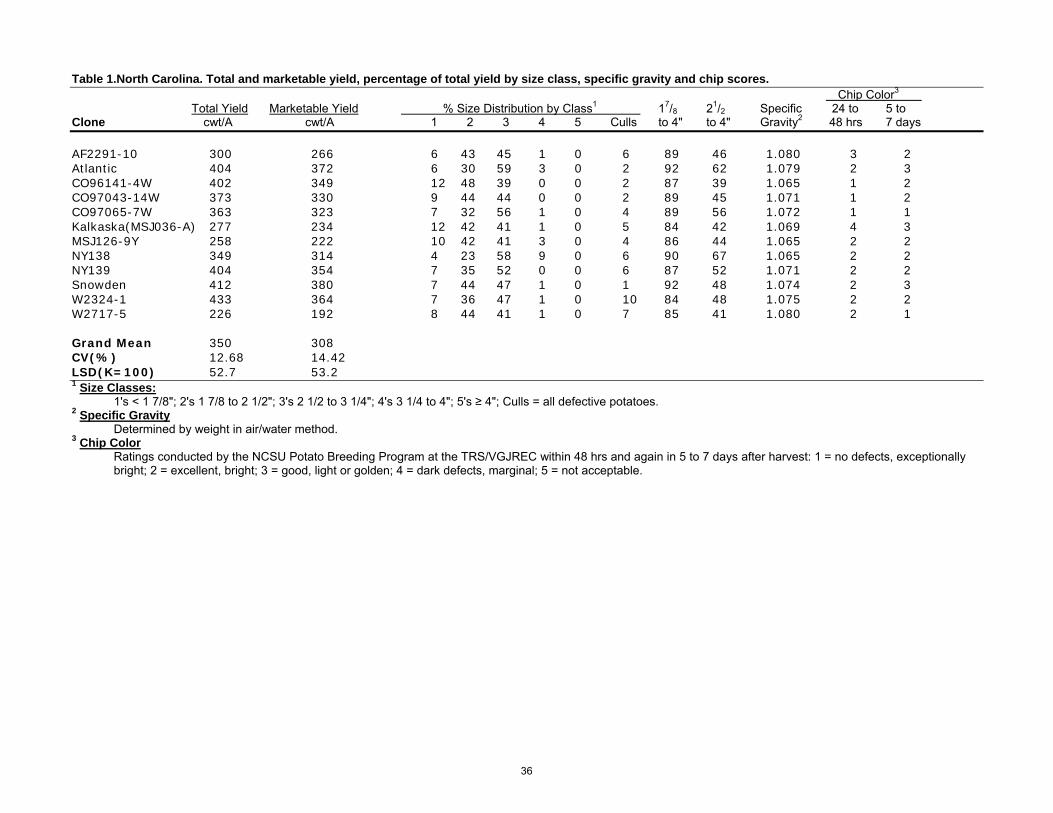
Table 1.North Carolina. Total and marketable yield, percentage of total yield by size class, specific gravity and chip scores. Chip Color3 Total Yield Marketable Yield % Size Distribution by Class1 17/8 21/2 Specific 24 to 5 to
Clone cwt/A cwt/A 1 2 3 4 5 Culls to 4" to 4" Gravity2 48 hrs 7 days AF2291-10 300 266 6 43 45 1 0 6 89 46 1.080 3 2 Atlantic 404 372 6 30 59 3 0 2 92 62 1.079 2 3 CO96141-4W 402 349 12 48 39 0 0 2 87 39 1.065 1 2 CO97043-14W 373 330 9 44 44 0 0 2 89 45 1.071 1 2 CO97065-7W 363 323 7 32 56 1 0 4 89 56 1.072 1 1 Kalkaska(MSJ036-A) 277 234 12 42 41 1 0 5 84 42 1.069 4 3 MSJ126-9Y 258 222 10 42 41 3 0 4 86 44 1.065 2 2 NY138 349 314 4 23 58 9 0 6 90 67 1.065 2 2 NY139 404 354 7 35 52 0 0 6 87 52 1.071 2 2 Snowden 412 380 7 44 47 1 0 1 92 48 1.074 2 3 W2324-1 433 364 7 36 47 1 0 10 84 48 1.075 2 2 W2717-5 226 192 8 44 41 1 0 7 85 41 1.080 2 1
Grand Mean 350 308 CV(%) 12.68 14.42 LSD(K=100) 52.7 53.2 1 Size Classes:
1's < 1 7/8"; 2's 1 7/8 to 2 1/2"; 3's 2 1/2 to 3 1/4"; 4's 3 1/4 to 4"; 5's ≥ 4"; Culls = all defective potatoes. 2 Specific Gravity
Determined by weight in air/water method. 3 Chip Color
Ratings conducted by the NCSU Potato Breeding Program at the TRS/VGJREC within 48 hrs and again in 5 to 7 days after harvest: 1 = no defects, exceptionally bright; 2 = excellent, bright; 3 = good, light or golden; 4 = dark defects, marginal; 5 = not acceptable.
36
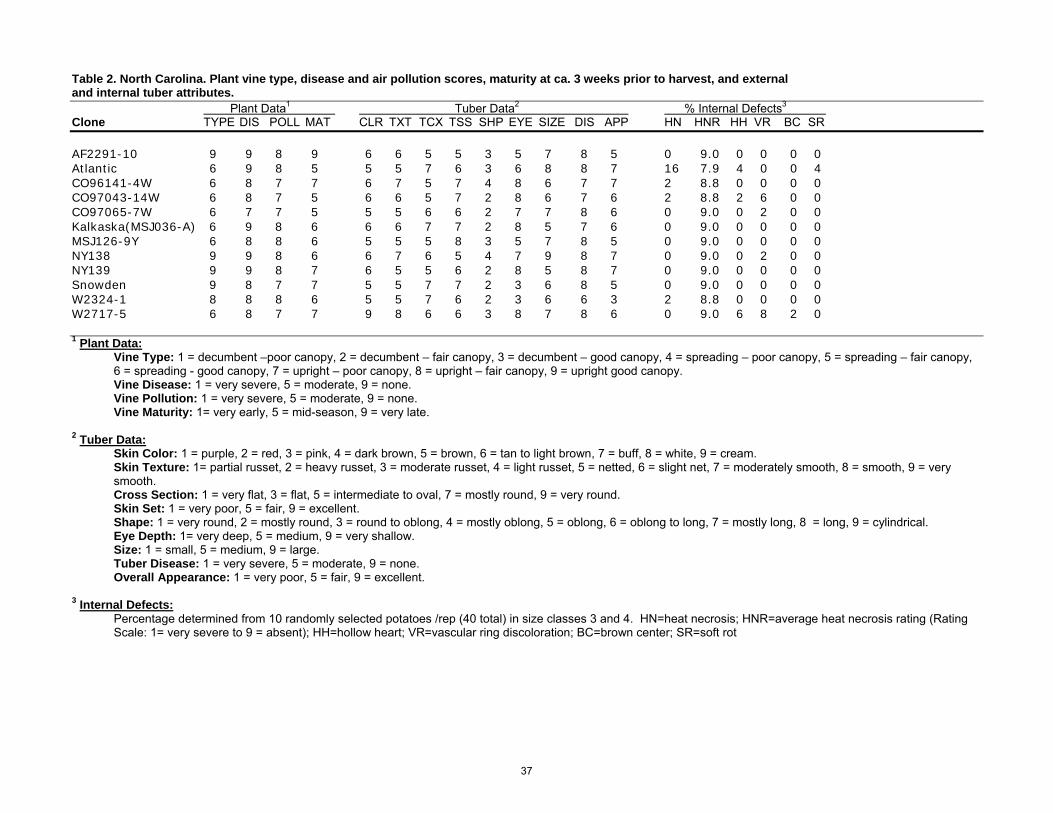
Table 2. North Carolina. Plant vine type, disease and air pollution scores, maturity at ca. 3 weeks prior to harvest, and external and internal tuber attributes. Plant Data1 Tuber Data2 % Internal Defects3 Clone TYPE DIS POLL MAT CLR TXT TCX TSS SHP EYE SIZE DIS APP HN HNR HH VR BC SR AF2291-10 9 9 8 9 6 6 5 5 3 5 7 8 5 0 9.0 0 0 0 0 Atlantic 6 9 8 5 5 5 7 6 3 6 8 8 7 16 7.9 4 0 0 4
CO96141-4W 6 8 7 7 6 7 5 7 4 8 6 7 7 2 8.8 0 0 0 0 CO97043-14W 6 8 7 5 6 6 5 7 2 8 6 7 6 2 8.8 2 6 0 0 CO97065-7W 6 7 7 5 5 5 6 6 2 7 7 8 6 0 9.0 0 2 0 0 Kalkaska(MSJ036-A) 6 9 8 6 6 6 7 7 2 8 5 7 6 0 9.0 0 0 0 0 MSJ126-9Y 6 8 8 6 5 5 5 8 3 5 7 8 5 0 9.0 0 0 0 0 NY138 9 9 8 6 6 7 6 5 4 7 9 8 7 0 9.0 0 2 0 0 NY139 9 9 8 7 6 5 5 6 2 8 5 8 7 0 9.0 0 0 0 0 Snowden 9 8 7 7 5 5 7 7 2 3 6 8 5 0 9.0 0 0 0 0 W2324-1 8 8 8 6 5 5 7 6 2 3 6 6 3 2 8.8 0 0 0 0 W2717-5 6 8 7 7 9 8 6 6 3 8 7 8 6 0 9.0 6 8 2 0 1 Plant Data:
Vine Type: 1 = decumbent –poor canopy, 2 = decumbent – fair canopy, 3 = decumbent – good canopy, 4 = spreading – poor canopy, 5 = spreading – fair canopy, 6 = spreading - good canopy, 7 = upright – poor canopy, 8 = upright – fair canopy, 9 = upright good canopy. Vine Disease: 1 = very severe, 5 = moderate, 9 = none. Vine Pollution: 1 = very severe, 5 = moderate, 9 = none. Vine Maturity: 1= very early, 5 = mid-season, 9 = very late.
2 Tuber Data:
Skin Color: 1 = purple, 2 = red, 3 = pink, 4 = dark brown, 5 = brown, 6 = tan to light brown, 7 = buff, 8 = white, 9 = cream. Skin Texture: 1= partial russet, 2 = heavy russet, 3 = moderate russet, 4 = light russet, 5 = netted, 6 = slight net, 7 = moderately smooth, 8 = smooth, 9 = very smooth. Cross Section: 1 = very flat, 3 = flat, 5 = intermediate to oval, 7 = mostly round, 9 = very round. Skin Set: 1 = very poor, 5 = fair, 9 = excellent. Shape: 1 = very round, 2 = mostly round, 3 = round to oblong, 4 = mostly oblong, 5 = oblong, 6 = oblong to long, 7 = mostly long, 8 = long, 9 = cylindrical. Eye Depth: 1= very deep, 5 = medium, 9 = very shallow. Size: 1 = small, 5 = medium, 9 = large. Tuber Disease: 1 = very severe, 5 = moderate, 9 = none. Overall Appearance: 1 = very poor, 5 = fair, 9 = excellent.
3 Internal Defects:
Percentage determined from 10 randomly selected potatoes /rep (40 total) in size classes 3 and 4. HN=heat necrosis; HNR=average heat necrosis rating (Rating Scale: 1= very severe to 9 = absent); HH=hollow heart; VR=vascular ring discoloration; BC=brown center; SR=soft rot
37

Table 3. UTZ Quality Foods Chip Data. % Defects %Total Specific Defect Descriptions1 Chip Color2 Clone Internal External Defects Gravity Internal External Hunter Lab Agtron Visual AF2291-10 1% 0% 1% 1.091 HH . 63.9 69.2 . Atlantic 6% 0% 6% 1.089 HH,IHN,SB . 62.4 64.5 . CO96141-4W 1% 0% 1% 1.075 SB . 62.4 64.5 . CO97043-14W 0% 0% 0% 1.076 . . 64.4 69.8 . CO97065-7W 6% 0% 6% 1.088 ID . 64.2 69.7 . Kalkaska(MSJ036-A) 43% 0% 43% 1.077 VB,ID . 60.6 60.1 . MSJ126-9Y 0% 0% 0% 1.076 . . 62.8 65.0 . NY138 3% 0% 3% 1.074 HH,ID . 62.9 65.3 . NY139 0% 0% 0% 1.081 . . 63.1 66.0 . Snowden 0% 0% 0% 1.082 . . 64.6 69.8 . W2324-1 19% 0% 19% 1.082 VB,ID . 61.2 61.0 . W2717-5 3% 0% 3% 1.091 VB . 61.5 62.1 .
1 Defect Descriptions:
BR = Bruising; ED = External Discoloration; HH = Hollow Heart; ID = Internal Discoloration; IHN = Internal Heat Necrosis; SB = Stem End Browning; VB = Vascular Browning; WW = Wire Worm.
2 Chip Color: Hunter Lab Scores Taken with defective chips included in sample Visual Scores Ratings conducted by the UTZ Quality Foods Inc. in Hanover PA with in 24 hrs of harvest. Visual Rating Score: 1 = no defects, exceptionally bright; 2 = excellent, bright; 3 = good, light or golden; 4 = dark defects, marginal; 5 = not acceptable. *= brightest chip in visual observation
38

Clone Summaries AF2291-10: Maturity for this clone was late and emergence was delayed causing poor stands initially and very poor vigor. A late stand count averaged 95%. Shapes were round to oblong, size was medium to large and overall appearance was fair. Marketable yields were 72% of Atlantic, gravity was 1.080 and chip color was excellent in the 24 to 48 hour and good in the 5 to 7 day chip tests. No internal defects were recorded. External defects included misshapes, growth cracks, and sunscald. CO96141-4W: Maturity for this clone was mid to late season with 93% stands. Plant vigor was better than fair. Shapes were oblong, size was medium, and overall appearance was better than fair. Marketable yields were 94% of Atlantic, gravity was 1.065, and chip color was exceptional in the 24 to 48 hour test and excellent in the 5 to 7 day chip test. External defects included sunscald, soft rot and common scab. CO97043-14W: Maturity for this clone was slightly later than mid-season with 96% stands and good plant vigor. Shapes were mostly round, size was larger than medium and overall appearance was better than fair. Marketable yields were 90% of Atlantic, gravity was 1.071 and chip scores were exceptional for the 24 to 48 hour test and excellent in the 5 to 7 day chip tests. External defects included common scab, soft rot, misshapes, and sunscald. CO97065-7W: This clone was mid-maturing and had 95% stands with better than fair plant vigor. Shapes were mostly round, size was medium to large, and overall appearance was better than fair. Marketable yields were 87% of Atlantic, gravity was 1.072 and chip scores were exceptional for both the 24 to 48 hour and 5 to 7 day chip tests. External defects were sunscald misshapes, common scab, and soft rot. Kalkaska (MSJ036-A): This was a mid to late maturing clone with 87% stands and less than fair plant vigor. Shapes were mostly round, size was medium, and overall appearance was better than fair. Marketable yields were 64% of Atlantic, gravity was 1.069 and chip scores were acceptable in the 24 to 48 hour test and good in the 5 to 7 day chip test. External defects were sunscald and soft rot. MSJ126-9Y: Maturity for this clone was later than mid-season, stands were 79% and plant vigor was less than fair. Shapes were round to oblong, size was medium-large and overall appearance was fair. Marketable yields were 60% of Atlantic, gravity was 1.065, and chip test scores for both the 24 to 48 hour and 5 to 7 day tests were excellent. External defects included high numbers of misshapes, sunscald, and skin blemishes due to Rhizoctonia. NY138: This slightly later than mid-maturing clone had poor stands of 42% at six weeks with poor plant vigor. Shapes were mostly oblong, size was very large, and overall appearance was good. Marketable yields were 84% of Atlantic, gravity was 1.065, the chip scores were excellent for both the 24 to 48 hour and the 5 to 7 day chip tests. External defects included soft rot, misshapes, sunscald, growth cracks, and skin blemishes due to Rhizoctonia. NY139: Maturity for this clone was late season, stands were 96% and vigor was fair. Shapes were mostly round, size was medium, and overall appearance was good. Marketable yields were 97% of Atlantic, gravity was 1.071, the chip scores were excellent for both the 24 to 48 hour and the 5 to 7 day tests. External defects included sunscald and misshapes. W2324-1: This clone had stands of 96%, and was slightly later than mid-maturing with good vigor. Shapes were mostly round, size was slightly larger than medium and overall appearance was poor. Marketable yields were 99% Atlantic, gravity was 1.075, and chip scores were excellent in both the 24 to 48 hour and the 5 to 7 day tests. External defects included soft rot, common scab, and misshapes. W2717-5: This clone was mid to late maturing with 42% stands and poor vigor at six weeks. Shapes were round to oblong, medium to large size, and better than fair for overall appearance. Marketable yields were 52% of Atlantic, gravity was 1.080, and chip scores were excellent in the 24 to 48 hour and exceptional in the 5 to 7 day tests. External defects included growth cracks, air cracks, misshapes, sunscald, soft rot, and skin blemishes due to Rhizoctonia.
39

Local Coordinator: Cooperative Grower: Cooperating Chip Processor:Dr. Bill Lamont James Hite Snyder of BerlinPenn State Univ. Patton, PA 16668 John BloughDepartment of Horticulture Berlin, PA 15530University Park, PA 16802 Report Preparation:
B. Dye and I. HuertaTrial Data:Planting Date: 19-May-09 Soil Temperature: 66ºFVine Kill Date: 25-Aug-09 (98 days growing days)Harvest Date: 05-Oct-09 Soil Temperature: 55ºF
Row and plant spacing: 34 inches between rows, 10.5 inches between plants within rows.Plot length 25 feet, 4 replications.
*Avg. High ºF *Avg. Low ºF *Rain (inches) Grow Deg DaysMay 69 44 2.85 227June 75 51 5.28 401July 77 53 3.88 455August 81 57 2.82 463Total Rainfall (May through August) 14.83 1546
Temperatures, Rainfall and Growing Degree Days as reported at Prince Gallitizin State Park,
Growing Season Weather: The growing season was cool and moist with warmer, sunny in August.
Pennsylvania Regional Trial
A total of 14.83 inches of rain fell from May 1 through August 31, 2009.
Patton, PA by Weather Warehouse®.
Trial Procedure:Previous crop: Wheat Soil Type: shaley loam
Fertilizer: 13-13-13 1,300 pounds
Irrigation: No irrigation, Rainfall 14.83 inches
Herbicides: Before planting: Round-up (0.67 quart)Sencor (2/3 pound) / Medal (1 pint)
Insecticides: Baythroid (2 ounces) / Thionex (1.3 quarts)Admire, Coragen (label rates)
Fungicides: Manzate®, Curzate, Previcur (all at label rates)
Vine Kill: Reglone (1 pint)
40

Table 1. Yield, size distribution, and characterisitics of the 2009 USPB-SFA chip trial varieties.Yield (cwt/A) Percent Size Distribution Characteristics
Entry No. 1 Total No. 1 SmallMid-Size Large Culls
Agtron Scorea
Specific Gravitya
% Internal Defects
Major External Defects
Kalkaska 314 352 89 5 89 1 4 60 1.078 1 SB MS SG GCAF2291-10 306 335 91 2 91 2 4 56 1.082 1 SB MS WWSnowden 304 355 86 2 86 2 11 57 1.090 0 SB MS NY139 296 346 86 2 86 6 6 60 1.075 0 SB MS
CO96141-4W 251 311 81 5 81 0 14 57 1.068 2 SBNY138 250 357 70 3 70 7 21 58 1.074 0 SBMSJ126-9Y 227 266 86 5 86 3 7 56 1.070 0 SB WWW2717-5 214 285 75 5 75 1 18 58 1.087 4 SB MS SG GC
CO97065-7W 200 218 92 3 92 0 5 57 1.086 0 SB SG GC
Pennsylvania Regional TrialChest Springs, PA
CO97065-7W 200 218 92 3 92 0 5 57 1.086 0 SB SG GCAtlantic 151 222 68 1 68 4 26 58 1.083 5 SB MS GCCO97043-14W 144 169 85 3 85 0 11 59 1.074 0 SB PS
Mean 242 292 58 1.079lsd 0.05 54 48CV% 16 11
Defects:SB = Sunburn PC = Pressure Crack GC = Growth Cracks SG = Secondary GrowthMS = Mis-shapen ST = Stone Damage FR = Fusarium Rot RH = RhizoctoniaPS = Pitted Scab WW = Wire worm damage
Internal Defects include Hollow Heart and internal Heat Necrosis; percentages calculated in Cwt/A
a Samples processed 7-Sep-09 by Snyder of Berlin
41
2009 Red River Valley Regional Trial
Dr. Nick David, Extension Potato Agronomist Department of Plant Sciences, North Dakota State University
Phone: (701) 231‐8732
Technical Support Mr. Duane Preston – Extension Potato Agronomist, University of Minnesota Mr. Marty Glynn – USDA Potato Research Facility, East Grand Forks, MN Mr. Dennis Olson – USDA Potato Research Facility, East Grand Forks, MN Mrs. Becky Sayre – USDA Potato Research Facility, East Grand Forks, MN Mr. Todd Schultz – USDA Potato Research Facility, East Grand Forks, MN Site Locations Non‐irrigated site: Oberg Farms, Hoople, ND Irrigated site: Forest River Colony (Northern Plains Potato Growers Assoc. Research Site), Inkster, ND Procedures Seed handling Seed was stored at 50°F until it was hand cut into 2.0 – 2.5 oz pieces on May 12, 2009. Following cutting, seed was immediately treated with Maxim MZ and then suberized at 55°F and 95% RH until planting. Planting and Harvest Operations Irrigated Site: Potato seed pieces were planted with an in‐row spacing of 9 inches and a between‐row spacing of 36” on May 22 using a two‐row assist‐feed Harriston potato planter. Varieties were arranged in a randomized complete block design and replicated four times. A Dark Red Norland seed piece was planted at the beginning and end of each plot as a guard plant to minimize border effects. On October 2, a 1‐row Grimme harvester was used to harvest the trial area. Yield and grade was determined immediately following harvest and subsamples for the long‐term storage trial were placed in 50°F storage facilities. Non‐irrigated Site: Potato seed pieces were planted with an in‐row spacing of 12 inches and a between‐row spacing of 38” on June 3 using a two‐row assist‐feed Harriston potato planter. Varieties were arranged in a randomized complete block design and replicated four times. A Dark Red Norland seed piece was planted at the beginning and end of each plot as a guard plant to minimize border effects. On September 24, a 1‐row Grimme harvester was used to harvest the trial area. Yield and grade was determined immediately following harvest and subsamples for the long‐term storage trial were placed in 45 and 50°F storage facilities.
42

Total Yield and Rank of 2009 USPB/SFA entries grown near Hoople, ND (Non‐irrigated) and Inkster, ND (Irrigated)
Irrigated Site Non‐Irrigated Site
Variety/Clone Total Yield (cwt/acre) Rank
Percent Atlantic
Percent Snowden
Total Yield (cwt/acre) Rank
Percent Atlantic
Percent Snowden
AF2291‐10 351 13 88 83 211 7 113 94
Atlantic 398 7 100 95 187 9 100 83
CO96141‐4W 420 3 106 100 125 16 67 56
CO97043‐14W 390 10 98 93 222 5 119 99
CO97065‐7W 396 8 99 94 112 17 60 50
Dakota Crisp 452 1 114 107 170 11 91 76
Dakota Diamond 421 2 106 100 283 2 151 126
Dakota Pearl 394 9 99 94 144 15 77 64
Ivory Crisp 406 6 102 96 296 1 158 132
MN99380‐1 356 11 89 85 167 12 89 75
MSJ036‐A 300 16 75 71 230 3 123 103
MSJ126‐9Y 277 17 70 66 155 14 83 69
ND7519‐1 330 15 83 78 196 8 105 88
NY138 420 3 106 100 200 7 107 89
NY139 340 14 85 81 185 10 99 83
Snowden 421 2 106 100 224 4 120 100
W2717‐5 354 12 89 84 155 13 83 69
LSD α = 0.10 NS 56
43

Total yield and size profile distribution of chipping varieties grown under irrigation near Inkster, ND. 2009
Size profile distribution
(Percent of Total Yield in different size classes)
Variety/Clone Total Yield (cwt/acre) < 1 7/8” 1 7/8 – 2 1/4” 2 1/4 – 3 1/2” 3 1/2 – 4” > 4”
AF2291‐10 351 4 17 71 9 0
Atlantic 398 7 25 52 16 0
CO96141‐4W 420 7 30 55 8 0
CO97043‐14W 390 8 21 56 15 0
CO97065‐7W 396 7 22 66 5 0
Dakota Crisp 452 6 25 63 6 0
Dakota Diamond 421 6 38 48 8 0
Dakota Pearl 394 16 45 39 0 0
Ivory Crisp 406 8 30 59 3 0
MN99380‐1 356 10 34 54 2 0
MSJ036‐A 300 7 33 58 2 0
MSJ126‐9Y 277 10 41 49 0 0
ND7519‐1 330 10 38 52 0 0
NY138 420 6 13 61 18 2
NY139 340 12 38 47 4 0
Snowden 421 9 38 52 2 0
W2717‐5 354 6 24 65 4 0
LSD α = 0.10 NS 4 10 10 7 NS
44

Total yield and size profile distribution of non‐irrigated
chipping varieties grown near Hoople, ND. 2009
Size profile distribution
(Percent of Total Yield in different size classes)
Variety/Clone Total Yield (cwt/acre) < 1 7/8” 1 7/8 – 2 1/4” 2 1/4 – 3 1/2” 3 1/2 – 4” > 4”
AF2291‐10 211 9 28 50 14 0
Atlantic 187 7 20 54 17 1
CO96141‐4W 125 20 27 52 1 0
CO97043‐14W 222 15 28 48 10 0
CO97065‐7W 112 25 29 42 5 0
Dakota Crisp 170 12 21 54 14 0
Dakota Diamond 283 10 18 51 16 1
Dakota Pearl 144 25 38 36 1 0
Ivory Crisp 296 12 22 45 17 3
MN99380‐1 167 17 25 51 7 0
MSJ036‐A 230 7 22 49 21 0
MSJ126‐9Y 155 18 35 46 2 0
ND7519‐1 196 11 34 49 6 0
NY138 200 7 26 66 2 0
NY139 185 12 23 60 5 0
Snowden 224 16 30 47 6 0
W2717‐5 155 18 38 38 4 0
LSD α = 0.10 56 7 9 12 6 NS
45

Table 1 Internal defects 2009
Wisconsin Regional Trial
Charles J. Kostichka and Mary LeMere
Hancock Agricultural Research Station, Hancock, WI 54943College of Agriculture and Life SciencesUniversity of Wisconsin - Madison
Fertility: 0-0-60; 6-24-24; 0-0-0-17S-21Ca, 21-0-0-24S
Weed Control: Matrix, Sencor, Parallel
Insect Control: Coragen, Abba
Disease Control: Bravo ZN; Headline; Endura, Manzate, Tanos
Vine Kill: Reglone
Rainfall: 16.2 in
Irrigation: 26.1 in
Table 1 Internal defects 2009 . , .
Variety No. Tubers Sampled Internal Defects (%)1
BC HH IBS VD SEDAtlantic 30 6.6 3.3 0 0 0Snowden 30 3.3 0 0 0 0CO96141-4W 30 0 0 0 0 0CO97065-7W 30 0 0 0 0 0W2717-5 30 0 0 0 0 0CO97043-14W 30 0 0 0 0 0MSJ036A 30 0 0 0 0 0MSJ126-9Y 30 0 0 0 0 0NY138 30 0 0 0 0 0NY139 30 0 0 0 0 0AF2291-10 30 0 0 0 0 0
1. Internal defects: BC = brown center VD = vascular discolorationHH = hollow heart SED = stem end discolorationIBS = internal brown spot
46
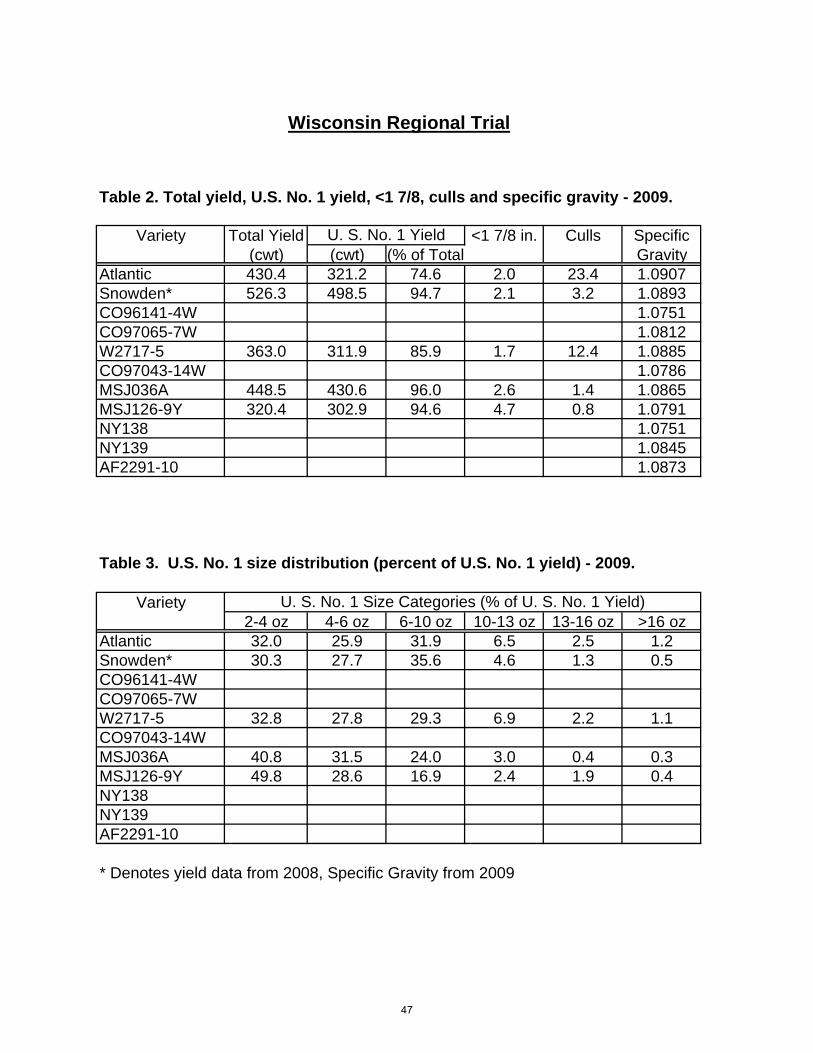
Wisconsin Regional Trial
Table 2. Total yield, U.S. No. 1 yield, <1 7/8, culls and specific gravity - 2009.
Variety Total Yield U. S. No. 1 Yield <1 7/8 in. Culls Specific(cwt) (cwt) (% of Total Gravity
Atlantic 430.4 321.2 74.6 2.0 23.4 1.0907Snowden* 526.3 498.5 94.7 2.1 3.2 1.0893CO96141-4W 1.0751CO97065-7W 1.0812W2717-5 363.0 311.9 85.9 1.7 12.4 1.0885CO97043-14W 1.0786MSJ036A 448.5 430.6 96.0 2.6 1.4 1.0865MSJ126-9Y 320.4 302.9 94.6 4.7 0.8 1.0791NY138 1.0751NY139 1.0845AF2291-10 1.0873
Table 3. U.S. No. 1 size distribution (percent of U.S. No. 1 yield) - 2009.
Variety U. S. No. 1 Size Categories (% of U. S. No. 1 Yield)2-4 oz 4-6 oz 6-10 oz 10-13 oz 13-16 oz >16 oz
Atlantic 32.0 25.9 31.9 6.5 2.5 1.2Snowden* 30.3 27.7 35.6 4.6 1.3 0.5CO96141-4WCO97065-7WW2717-5 32.8 27.8 29.3 6.9 2.2 1.1CO97043-14WMSJ036A 40.8 31.5 24.0 3.0 0.4 0.3MSJ126-9Y 49.8 28.6 16.9 2.4 1.9 0.4NY138NY139AF2291-10
* Denotes yield data from 2008, Specific Gravity from 2009
47

Table 3. Overall average yield, percent size distribution and culls, specific gravity and out of field chip color for eleven lines and two standards grown in CA, FL, ID, ME, MI, MO, NC, PA, RRV and WI in 2009.
Clone or SpecificState Variety No.1 Total No. 1 Small Mid-Size Large Culls Gravity Agtron SFA
CA AF2291-10 287 324 89 9 89 2 0.7 1.088FL AF2291-10 205 262 78 10 85 6 14 1.073 3ID AF2291-10 283 327 87 9 69 17 5 1.093ME AF2291-10 314 365 86 5 91 4 9.8 1.092 70MI AF2291-10 466 480 97 3 86 11 0 1.089 59 2MO AF2291-10 187 194 96 4 96 0 na 1.087 64NC AF2291-10 266 300 89 6 88 1 6 1.080 3PA AF2291-10 306 335 91 2 91 2 4 1.082 56
RRV-I AF2291-10 337 351 96 4 88 9 na 1.094 73RRV-NI AF2291-10 192 211 91 9 78 14 na 1.108
WI AF2291-10 na na na na na na na 1.087
average: 284 315 90 6 86 7 5.6 1.088 64.4 2.7
CA ATLANTIC 383 499 77 7 77 14 1.6 1.088FL ATLANTIC 226 350 65 7 80 13 30 1.066 2ID ATLANTIC 329 427 77 19 63 14 4 1.094ME ATLANTIC 270 376 72 5 90 5 23.2 1.093 70MI ATLANTIC 498 523 96 2 80 16 2 1.087 59 3MO ATLANTIC 270 287 94 6 94 0 na 1.092 64NC ATLANTIC 372 404 92 6 89 3 2 1.079 2PA ATLANTIC 151 222 68 1 68 4 26 1.083 58
RRV-I ATLANTIC 370 398 93 7 77 16 na 1.093 73RRV-NI ATLANTIC 172 187 92 7 74 17 na 1.110
WI ATLANTIC 321 430 75 2 72 3 23 1.091
average: 306 373 82 6 79 10 14.0 1.089 64.8 2.3
Percent of Categories Field Chip ColorYield (cwt/acre)
48

Table 3. Continued: Overall average yield, percent size distribution and culls, specific gravity and out of field chip color for eleven lines and two standards grown in CA, FL, ID, ME, MI, MO, NC, PA, RRV and WI in 2009.
Clone or SpecificState Variety No.1 Total No. 1 Small Mid-Size Large Culls Gravity Agtron SFA
CA CO96141-4W 288 338 85 12 85 2 1.3 1.071FL CO96141-4W 339 390 87 9 88 2 4 1.063 1ID CO96141-4W 404 484 83 16 79 4 1 1.085ME CO96141-4W 305 346 88 4 95 1 7.9 1.079 70MI CO96141-4W 423 444 96 3 83 13 1 1.070 64 2MO CO96141-4W 158 180 88 12 88 0 na 1.079 64NC CO96141-4W 349 402 87 12 87 0 2 1.065 1PA CO96141-4W 251 311 81 5 81 0 14 1.068 57
RRV-I CO96141-4W 391 420 93 7 85 8 na 1.076 73RRV-NI CO96141-4W 100 125 80 20 79 1 na 1.099
WI CO96141-4W na na na na na na na 1.075
average: 301 344 87 10 85 3 4.5 1.075 65.6 1.3
CA CO97043-14W 342 385 89 8 89 3 0.4 1.084FL CO97043-14W 301 346 87 8 80 11 4 1.066 1ID CO97043-14W 316 409 77 23 75 2 0 1.088ME CO97043-14W 236 295 80 5 90 5 16.2 1.081 70MI CO97043-14W 455 472 96 3 85 11 1 1.073 63 2MO CO97043-14W 201 239 84 16 84 0 na 1.083 64NC CO97043-14W 330 373 88 9 88 0 2 1.071 1PA CO97043-14W 144 169 85 3 85 0 11 1.074 59
RRV-I CO97043-14W 359 390 92 8 77 15 na 1.084 73RRV-NI CO97043-14W 189 222 85 15 76 10 na 1.096
WI CO97043-14W na na na na na na na 1.079
average: 287 330 86 10 83 6 4.9 1.080 65.8 1.3
Yield (cwt/acre) Percent of Categories Field Chip Color
49

Table 3. Continued: Overall average yield, percent size distribution and culls, specific gravity and out of field chip color for eleven lines and two standards grown in CA, FL, ID, ME, MI, MO, NC, PA, RRV and WI in 2009.
Clone or SpecificState Variety No.1 Total No. 1 Small Mid-Size Large Culls Gravity Agtron SFA
CA CO97065-7W 303 380 80 12 80 8 0.4 1.087FL CO97065-7W 288 325 89 7 91 1 5 1.075 1ID CO97065-7W 213 393 54 46 54 0 0 1.089ME CO97065-7W 258 322 80 5 93 2 16.1 1.090 70MI CO97065-7W 404 420 96 3 81 15 1 1.078 59 2MO CO97065-7W 136 147 93 7 93 0 na 1.085 64NC CO97065-7W 323 363 89 7 88 1 4 1.072 1PA CO97065-7W 200 218 92 3 92 0 5 1.086 57
RRV-I CO97065-7W 368 396 93 7 88 5 na 1.056 73RRV-NI CO97065-7W 84 112 75 25 71 5 na 1.113
WI CO97065-7W na na na na na na na 1.081
average: 258 308 84 12 83 4 4.5 1.083 64.6 1.3
CA KALKASKA 341 421 81 17 81 1 1.5 1.079FL KALKASKA 113 204 55 26 71 1 24 1.064 1ID KALKASKA 257 368 70 29 69 1 1 1.094ME KALKASKA 298 359 83 8 91 1 9.6 1.089 70MI KALKASKA 454 486 93 6 89 4 1 1.082 58 4MO KALKASKA 281 314 89 11 89 0 na 1.076 64NC KALKASKA 234 277 84 12 83 1 5 1.069 4PA KALKASKA 314 352 89 5 89 1 4 1.078 60
RRV-I KALKASKA 279 300 93 7 91 2 na 1.099 68RRV-NI KALKASKA 214 230 93 7 71 21 na 1.088
WI KALKASKA 431 449 96 3 95 1 1 1.087
average: 292 342 84 12 84 3 5.9 1.082 64.0 3.0
Yield (cwt/acre) Percent of Categories Field Chip Color
50

Table 3. Continued: Overall average yield, percent size distribution and culls, specific gravity and out of field chip color for eleven lines and two standards grown in CA, FL, ID, ME, MI, MO, NC, PA, RRV and WI in 2009.
Clone or SpecificState Variety No.1 Total No. 1 Small Mid-Size Large Culls Gravity Agtron SFA
CA MSJ126-9Y 277 330 84 11 84 3 2.0 1.077FL MSJ126-9Y 212 263 81 8 83 7 10 1.063 2ID MSJ126-9Y 185 332 56 44 55 0 1 1.089ME MSJ126-9Y 277 329 84 5 92 3 11.9 1.083 70MI MSJ126-9Y 342 370 92 3 81 11 5 1.071 60 4MO MSJ126-9Y 110 123 89 11 89 0 na 1.074 65NC MSJ126-9Y 222 258 86 10 83 3 4 1.065 2PA MSJ126-9Y 227 266 86 5 86 3 7 1.070 56
RRV-I MSJ126-9Y 249 277 90 10 90 0 na 1.084 71RRV-NI MSJ126-9Y 127 155 82 18 81 2 na 1.093
WI MSJ126-9Y 303 320 95 5 92 2 1 1.079average: 230 275 84 12 83 3 5.2 1.077 64.4 2.7
MI ND7519-1 387 414 93 5 90 3 2 1.092 62 1RRV-I ND7519-1 297 330 90 10 90 0 na 1.092 73
RRV-NI ND7519-1 174 196 89 11 83 6 na 1.105average: 286 313 91 9 88 3 2.0 1.096 67.5 1
CA NY138 354 426 83 6 83 11 0.5 1.078FL NY138 331 395 84 5 64 30 10 1.062 1ID NY138 362 438 83 17 78 4 1 1.083ME NY138 214 297 72 4 87 9 25.2 1.083 70MI NY138 444 458 97 3 78 19 0 1.073 63 1MO NY138 226 252 90 10 90 0 na 1.075 64NC NY138 314 349 90 4 81 9 6 1.065 2PA NY138 250 357 70 3 70 7 21 1.074 58
RRV-I NY138 386 420 92 6 74 18 na 1.063 75RRV-NI NY138 186 200 93 7 92 2 na 1.096
WI NY138 na na na na na na na 1.075average: 307 359 85 7 80 11 9.1 1.075 66.0 1.3
Yield (cwt/acre) Percent of Categories Field Chip Color
51

Table 3. Continued: Overall average yield, percent size distribution and culls, specific gravity and out of field chip color for eleven lines and two standards grown in CA, FL, ID, ME, MI, MO, NC, PA, RRV and WI in 2009.
Clone or SpecificState Variety No.1 Total No. 1 Small Mid-Size Large Culls Gravity Agtron SFA
CA NY139 379 437 87 5 87 8 0.3 1.083FL NY139 246 314 78 7 82 10 15 1.065 1ID NY139 372 488 76 23 73 3 1 1.094ME NY139 251 318 79 7 90 3 14.6 1.090 70MI NY139 455 462 99 1 73 26 0 1.087 62 1MO NY139 204 212 96 4 96 0 na 1.088 64NC NY139 354 404 88 7 87 0 6 1.071 2PA NY139 296 346 86 2 86 6 6 1.075 60
RRV-I NY139 299 340 88 12 85 4 na 1.095 73RRV-NI NY139 163 185 88 12 83 5 na 1.106
WI NY139 na na na na na na na 1.085
average: 302 351 87 8 84 7 6.1 1.085 65.8 1.3
CA SNOWDEN 401 468 86 9 86 4 1.1 1.081FL SNOWDEN 224 280 80 11 85 3 10 1.069 2ID SNOWDEN 270 385 70 26 58 12 4 1.092ME SNOWDEN 299 359 83 7 92 1 10.2 1.093 70MI SNOWDEN 488 512 95 5 89 6 0 1.088 62 2MO SNOWDEN na na na na na na na na na naNC SNOWDEN 380 412 92 7 91 1 1 1.074 2PA SNOWDEN 304 355 86 2 86 2 11 1.090 57
RRV-I SNOWDEN 383 421 91 9 90 2 NA 1.093 72RRV-NI SNOWDEN 188 224 84 16 77 6 NA 1.114
WI SNOWDEN 499 526 95 2 93 2 3 1.089
average: 344 394 86 9 85 4 5.0 1.088 65.3 2.0
Yield (cwt/acre) Percent of Categories Field Chip Color
52

Table 3. Continued: Overall average yield, percent size distribution and culls, specific gravity and out of field chip color for eleven lines and two standards grown in CA, FL, ID, ME, MI, MO, NC, PA, RRV and WI in 2009.
Clone or SpecificState Variety No.1 Total No. 1 Small Mid-Size Large Culls Gravity Agtron SFA
CA W2324-1 384 458 84 7 84 7 1.8 1.083FL W2324-1 132 203 65 17 79 2 19 1.065 1MO W2324-1 269 288 93 7 93 0 NA 1.083 64NC W2324-1 364 433 84 7 83 1 10 1.075 2
average: 287 346 82 10 85 3 10.3 1.077 64.0 1.5
CA W2717-5 264 321 82 12 82 3 1.7 1.087FL W2717-5 154 235 66 18 80 1 19 1.071 1ID W2717-5 275 388 71 27 65 6 2 1.094ME W2717-5 227 348 65 5 92 3 31.5 1.097 70MI W2717-5 361 395 91 4 82 9 5 1.085 61 3MO W2717-5 168 187 90 10 90 0 NA 1.088 64NC W2717-5 192 226 85 8 85 1 7 1.080 2PA W2717-5 214 285 75 5 75 1 18 1.087 58
RRV-I W2717-5 333 354 94 6 89 4 NA 1.096 73RRV-NI W2717-5 127 155 82 18 76 4 NA 1.114
WI W2717-5 312 363 86 2 83 3 12 1.089
average: 239 296 81 10 82 3 12.0 1.090 65.2 2.0
Yield (cwt/acre) Percent of Categories Field Chip Color
53
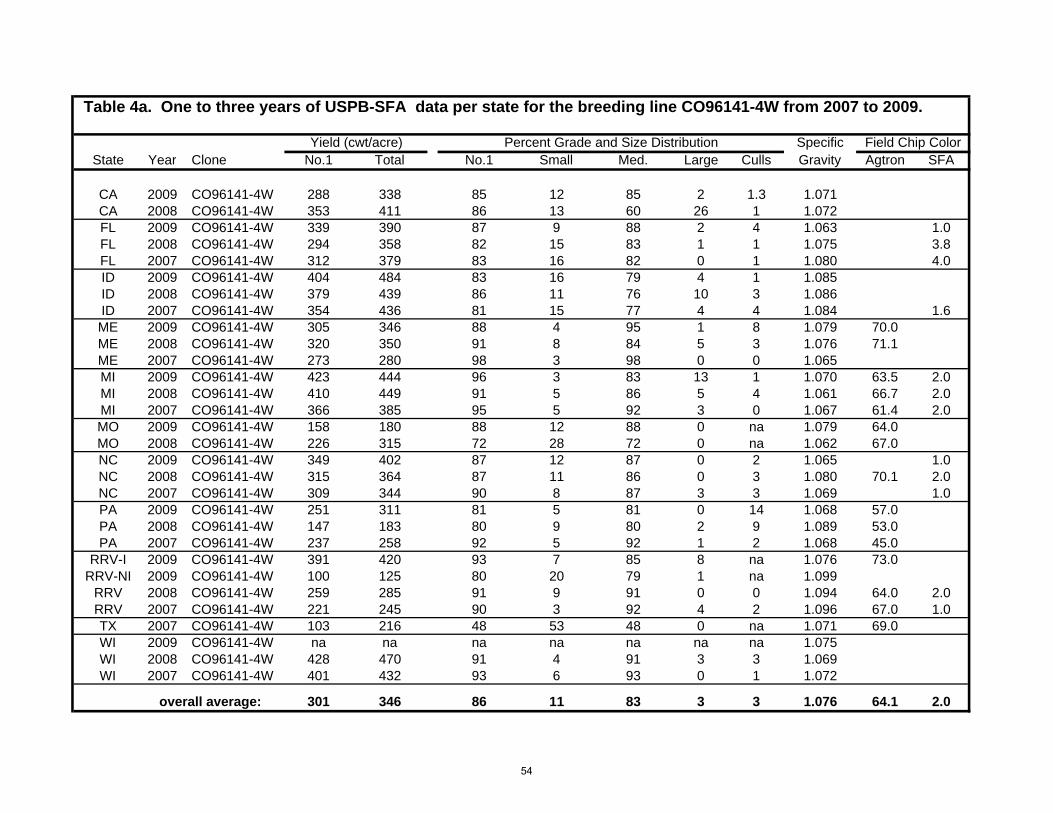
Field Chip Color/a
Table 4a. One to three years of USPB-SFA data per state for the breeding line CO96141-4W from 2007 to 2009.
Yield (cwt cre) Percent Grade and Size Distribution SpecificState Year Clone No.1 Total No.1 Small Med. Large Culls Gravity Agtron SFA
CA 2009 CO96141-4W 288 338 85 12 85 2 1.3 1.071CA 2008 CO96141-4W 353 411 86 13 60 26 1 1.072FL 2009 CO96141-4W 339 390 87 9 88 2 4 1.063 1.0FL 2008 CO96141-4W 294 358 82 15 83 1 1 1.075 3.8FL 2007 CO96141-4W 312 379 83 16 82 0 1 1.080 4.0ID 2009 CO96141-4W 404 484 83 16 79 4 1 1.085ID 2008 CO96141-4W 379 439 86 11 76 10 3 1.086ID 2007 CO96141-4W 354 436 81 15 77 4 4 1.084 1.6ME 2009 CO96141-4W 305 346 88 4 95 1 8 1.079 70.0ME 2008 CO96141-4W 320 350 91 8 84 5 3 1.076 71.1ME 2007 CO96141-4W 273 280 98 3 98 0 0 1.065MI 2009 CO96141-4W 423 444 96 3 83 13 1 1.070 63.5 2.0MI 2008 CO96141-4W 410 449 91 5 86 5 4 1.061 66.7 2.0MI 2007 CO96141-4W 366 385 95 5 92 3 0 1.067 61.4 2.0MO 2009 CO96141-4W 158 180 88 12 88 0 na 1.079 64.0MO 2008 CO96141-4W 226 315 72 28 72 0 na 1.062 67.0NC 2009 CO96141-4W 349 402 87 12 87 0 2 1.065 1.0NC 2008 CO96141-4W 315 364 87 11 86 0 3 1.080 70.1 2.0NC 2007 CO96141-4W 309 344 90 8 87 3 3 1.069 1.0PA 2009 CO96141-4W 251 311 81 5 81 0 14 1.068 57.0PA 2008 CO96141-4W 147 183 80 9 80 2 9 1.089 53.0PA 2007 CO96141-4W 237 258 92 5 92 1 2 1.068 45.0
RRV-I 2009 CO96141-4W 391 420 93 7 85 8 na 1.076 73.0RRV-NI 2009 CO96141-4W 100 125 80 20 79 1 na 1.099
RRV 2008 CO96141-4W 259 285 91 9 91 0 0 1.094 64.0 2.0RRV 2007 CO96141-4W 221 245 90 3 92 4 2 1.096 67.0 1.0TX 2007 CO96141-4W 103 216 48 53 48 0 na 1.071 69.0WI 2009 CO96141-4W na na na na na na na 1.075WI 2008 CO96141-4W 428 470 91 4 91 3 3 1.069WI 2007 CO96141-4W 401 432 93 6 93 0 1 1.072
overall average: 301 346 86 11 83 3 3 1.076 64.1 2.0
54

Field Chip Color/a
Table 4b. One to three years of USPB-SFA data per state for the standard variety Atlantic from 2007 to 2009.
Yield (cwt cre) Percent Grade and Size Distribution SpecificState Year Clone No.1 Total No.1 Small Med. Large Culls Gravity Agtron SFA
CA 2009 ATLANTIC 383 499 77 7 77 14 1.6 1.088CA 2008 ATLANTIC na na na na na na na naFL 2009 ATLANTIC 226 350 65 7 80 13 30 1.066 2FL 2008 ATLANTIC 285 343 83 12 84 2 3 1.088 3.9FL 2007 ATLANTIC 298 337 93 7 88 4 5 1.086 2ID 2009 ATLANTIC 329 427 77 19 63 14 4 1.094ID 2008 ATLANTIC 489 559 87 4 62 26 9 1.096ID 2007 ATLANTIC 428 527 81 15 75 6 4 1.095 1.6ME 2009 ATLANTIC 270 376 72 5 90 5 23 1.093 70.0ME 2008 ATLANTIC 361 389 93 10 81 7 3 1.080 69.1ME 2007 ATLANTIC 147 157 94 4 94 2 0 1.083MI 2009 ATLANTIC 498 523 96 2 80 16 2 1.087 58.6 3MI 2008 ATLANTIC 414 443 93 5 80 13 1 1.077 64.9 3MI 2007 ATLANTIC 404 434 93 4 79 14 3 1.079 63.9 2MO 2009 ATLANTIC 270 287 94 6 94 0 na 1.092 64.0MO 2008 ATLANTIC 248 308 80 20 80 0 na 1.082 67.0NC 2009 ATLANTIC 372 404 92 6 89 3 2 1.079 2NC 2008 ATLANTIC 324 375 86 10 85 2 4 1.097 65.3 1NC 2007 ATLANTIC 314 339 93 4 89 3 4 1.081 1PA 2009 ATLANTIC 151 222 68 1 68 4 26 1.083 58.0PA 2008 ATLANTIC 287 336 85 6 85 3 7 1.096 44.0PA 2007 ATLANTIC 178 242 74 5 74 17 6 1.083 42.0
RRV-I 2009 ATLANTIC 370 398 93 7 77 16 na 1.093 73.0RRV-NI 2009 ATLANTIC 172 187 92 7 74 17 na 1.110
RRV 2008 ATLANTIC 339 355 96 5 96 0 0 1.104 42.0 4RRV 2007 ATLANTIC 280 319 88 4 89 6 1 1.104 61.0 2TX 2007 ATLANTIC 164 235 70 31 70 0 na 1.085 70.0WI 2009 ATLANTIC 321 430 75 2 72 3 23 1.091WI 2008 ATLANTIC 447 508 88 3 88 8 1 1.086WI 2007 ATLANTIC 459 488 94 3 94 0 3 1.087
overall average: 318 372 85 8 81 8 7 1.088 60.9 2.3
55

/a Field Chip Color
Table 4c. One to three years of USPB-SFA data per state for the standard variety Snowden from 2007 to 2009.
Yield (cwt cre) Percent Grade and Size Distribution SpecificState Year Clone No.1 Total No.1 Small Med. Large Culls Gravity Agtron SFA
CA 2009 SNOWDEN 401 468 86 9 86 4 1.1 1.081CA 2008 SNOWDEN na na na na na na na naFL 2009 SNOWDEN 224 280 80 11 85 3 10 1.069 2.0FL 2008 SNOWDEN 333 402 83 14 85 0 3 1.086 3.4FL 2007 SNOWDEN 337 364 94 6 93 0 1 1.078 3.0ID 2009 SNOWDEN 270 385 70 26 58 12 4 1.092ID 2008 SNOWDEN 333 449 74 25 71 4 1 1.092ID 2007 SNOWDEN 394 506 78 20 75 3 2 1.089 1.7ME 2009 SNOWDEN 299 359 83 7 92 1 10 1.093 70.0ME 2008 SNOWDEN 390 406 94 10 89 0 1 1.085 70.8ME 2007 SNOWDEN 174 189 92 8 92 0 0 1.072MI 2009 SNOWDEN 488 512 95 5 89 6 0 1.088 61.5 2.0MI 2008 SNOWDEN 569 598 95 4 85 10 1 1.081 61.3 2.0MI 2007 SNOWDEN 487 501 97 3 81 16 0 1.078 61.8 2.0MO 2009 SNOWDEN na na na na na na na na 64.0MO 2008 SNOWDEN 180 249 72 28 72 0 1.077 68.0NC 2009 SNOWDEN 380 412 92 7 91 1 1 1.074 2.0NC 2008 SNOWDEN 261 315 83 17 83 0 0 1.094 64.5 2.0NC 2007 SNOWDEN 309 342 90 8 90 0 1 1.082 1.0PA 2009 SNOWDEN 304 355 86 2 86 2 11 1.090 57.0PA 2008 SNOWDEN 291 362 80 16 80 1 3 1.099 50.0PA 2007 SNOWDEN 283 326 87 8 87 1 4 1.077 44.0
RRV-I 2009 SNOWDEN 383 421 91 9 90 2 na 1.093 72.0RRV-NI 2009 SNOWDEN 188 224 84 16 77 6 na 1.114
RRV 2008 SNOWDEN 290 307 95 6 94 0 0 1.094 48.0 2.0RRV 2007 SNOWDEN 270 298 91 5 92 3 1 1.097 64.0 2.0TX 2007 SNOWDEN 119 218 55 46 55 0 na 1.082 70.0WI 2009 SNOWDEN 499 526 95 2 93 2 3 1.089WI 2008 SNOWDEN 493 526 94 2 94 1 3 1.080WI 2007 SNOWDEN 456 487 94 4 94 0 2 1.077
overall average: 336 385 86 12 84 3 3 1.086 61.8 2.1
56

Field Chip Colorre
Table 5. Two years of USPB-SFA data per state for the variety Kalkaska (MSJ036-A) from 2008 to 2009.
Yield (cwt/ac Percent Grade and Size Distri) bution SpecificState Year No.1 Total No.1 Small Med. Large Culls Gravity Agtron SFA
CA 2009 341 421 81 17 81 1 1.5 1.079CA 2008 208 313 66 32 59 7 2 1.085FL 2009 113 204 55 26 71 1 24 1.064FL 2008 302 361 84 14 84 1 2 1.087ID 2009 257 368 70 29 69 1 1 1.094ID 2008 413 495 83 14 80 4 3 1.096ME 2009 298 359 83 8 91 1 10 1.089 70ME 2008 381 412 93 11 86 2 0.4 1.075 69MI 2009 454 486 93 6 89 4 1 1.082 58MI 2008 465 512 91 9 90 1 0 1.078 61MO 2009 281 314 89 11 89 0 na 1.076 64MO 2008 58 124 47 53 47 0 na 1.068 63NC 2009 234 277 84 12 83 1 5 1.069NC 2008 306 355 86 12 86 0 2 1.086 70PA 2009 314 352 89 5 89 1 4 1.078 60PA 2008 228 266 86 12 86 0 2 1.093 47
RRV-I 2009 279 300 93 7 91 2 na 1.099 68RRV-NI 2009 214 230 93 7 71 21 na 1.088
RRV 2008 327 372 88 12 88 0 0 1.093 51WI 2009 431 449 96 3 95 1 1 1.087WI 2008 481 520 93 4 93 0 4 1.081
overall average: 304 357 83 14 82 2 4 1.083 62
Note: see Table 4b for Atlantic and Table 4c for Snowden performance for these trial sites listed above for Kalkaska.
57
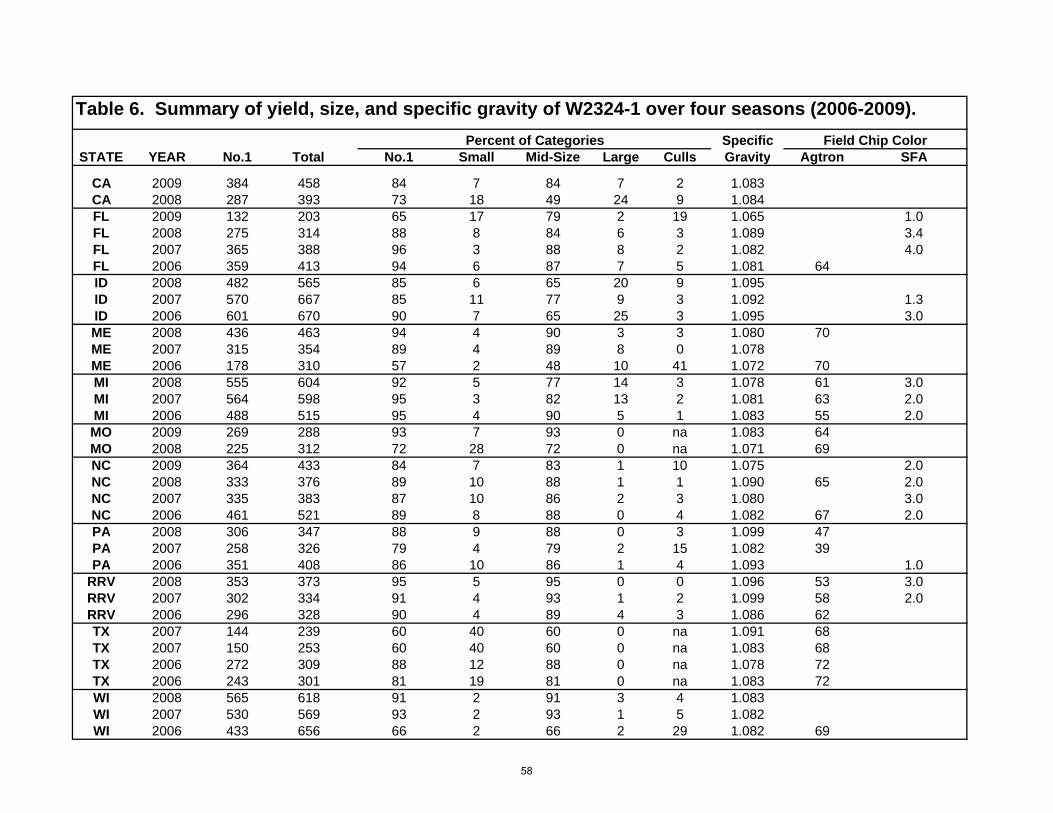
Table 6. Summary of yield, size, and specific gravity of W2324-1 over four seasons (2006-2009).Specific
STATE YEAR No.1 Total No.1 Small Mid-Size Large Culls Gravity Agtron SFA
CA 2009 384 458 84 7 84 7 2 1.083CA 2008 287 393 73 18 49 24 9 1.084FL 2009 132 203 65 17 79 2 19 1.065 1.0FL 2008 275 314 88 8 84 6 3 1.089 3.4FL 2007 365 388 96 3 88 8 2 1.082 4.0FL 2006 359 413 94 6 87 7 5 1.081 64ID 2008 482 565 85 6 65 20 9 1.095ID 2007 570 667 85 11 77 9 3 1.092 1.3ID 2006 601 670 90 7 65 25 3 1.095 3.0ME 2008 436 463 94 4 90 3 3 1.080 70ME 2007 315 354 89 4 89 8 0 1.078ME 2006 178 310 57 2 48 10 41 1.072 70MI 2008 555 604 92 5 77 14 3 1.078 61 3.0MI 2007 564 598 95 3 82 13 2 1.081 63 2.0MI 2006 488 515 95 4 90 5 1 1.083 55 2.0MO 2009 269 288 93 7 93 0 na 1.083 64MO 2008 225 312 72 28 72 0 na 1.071 69NC 2009 364 433 84 7 83 1 10 1.075 2.0NC 2008 333 376 89 10 88 1 1 1.090 65 2.0NC 2007 335 383 87 10 86 2 3 1.080 3.0NC 2006 461 521 89 8 88 0 4 1.082 67 2.0PA 2008 306 347 88 9 88 0 3 1.099 47PA 2007 258 326 79 4 79 2 15 1.082 39PA 2006 351 408 86 10 86 1 4 1.093 1.0
RRV 2008 353 373 95 5 95 0 0 1.096 53 3.0RRV 2007 302 334 91 4 93 1 2 1.099 58 2.0RRV 2006 296 328 90 4 89 4 3 1.086 62TX 2007 144 239 60 40 60 0 na 1.091 68TX 2007 150 253 60 40 60 0 na 1.083 68TX 2006 272 309 88 12 88 0 na 1.078 72TX 2006 243 301 81 19 81 0 na 1.083 72WI 2008 565 618 91 2 91 3 4 1.083WI 2007 530 569 93 2 93 1 5 1.082WI 2006 433 656 66 2 66 2 29 1.082 69
Percent of Categories Field Chip Color
58

3 week recondition
Chip Chip Chip Percent ProcessingCLONE 40 F 50 F 40 F Sugar Ends Defects
ATLANTIC 4.0 1.1 1.8 14 bruiseW2324-1 4.0 1.1 2.0 6 greenW2310-3 2.6 1.0 1.1 11CO97043-14W 2.7 1.0 1.3 0MSJ036-A 2.8 1.0 1.0 0NY138 3.0 1.0 1.2 3NY139 2.8 1.0 1.1 8CO96141-4W 3.6 1.0 1.0 3BEACON CHIPPER 4.0 1.0 1.6 18 dark vascularCO95051-7W 2.8 1.0 1.1 0 bruiseSNOWDEN 4.4 1.0 1.0 3ND7519-1 2.3 1.0 1.0 0AF2291-10 3.6 1.0 2.0 17 greenMSJ147-1 2.6 1.0 1.0 0 rotCO97065-7W 4.7 1.0 2.9 11 dark vascularW2717-5 2.2 1.0 1.1 6
Samples harvested September 24, 2008, and gradually cooled to 50o.Samples stored at 40 and 50o for 6 weeks.Samples reconditioned at 60o for 3 weeks.
OUT-OF-STORAGE CHIPPING EVALUATIONS
Red River ValleyWisconsin
Maine
DATA FROM 2008 AND 2009 TRIALS
Idaho
Michigan
Out of Storage Quality Report
6 week cool down 6 weeks storage
2008 USPB-SFA Chip Trial Grown at Aberdeen, Idaho.
Pennsylvania
59

OUT OF STORAGE CHIP FRY TEST RESULTS
2008 USPB-SFA CHIP VARIETY TRIAL MAINE
Overview: Potato varieties were harvested and stored at the Dale Turner Farm in Washburn, Maine on September 13, 2008. The Samples were placed in Jute bags and co-mingled into a bin of Russet Burbank variety potatoes being held for French fry manufacture. Samples were held in storage at 48 to 50 degree F. and 90 percent RH until February when the bin was emptied for French fry processing. Samples were transferred to 55 degree storage at Aroostook Research Farm in Presque Isle and held until April 12, 2009. Samples were transferred to Bio-Ag Research Laboratory and were fried on April 22, 2009 following two weeks conditioning at room temperature. Tuber samples were washed, sliced and fried in 100 percent corn oil for 3 minutes at 375 degrees F. Chip slices were evaluated for color using the SFA Chip Fry Chart and the USDA color chart as published in the USDA Agricultural Handbook, “Commercial Potato Production”. RESULTS: 2008 SFA/NPPB OUT-OF-STORAGE CHIP VARIETY TRIAL FRY TEST SFA U.S.D.A. Chip Defects VARIETY Chip Fry Chart 1-10 Fry Chart External Internal 1. Atlantic 2 4 0 3 dp 2. Snowden 2+ 3 1 3 vr 3. AF2291-10 1 6 1 10 dao 4. MSJ147-1 2+ 4 2 bs 1 5. MSJ036-A 1 7 1 15 dao 6. Beacon Chip 1 6 1 8 vr 7. NY138 3 2 0 3 vr 8. NY139 3++ 2 0 0 9. ND7519-1 3 2 0 0 10. W2324-1 2 5 2 8 dao 11. W2310-3 3++ 1 1 0 12. CO97043-14 3 2 0 0 13. CO95051-7W 3 2 0 0 14. CO96141-4W sample lost in storage 15. CO97065-7W 1 6 2 bs 8 dao Defect Code: dao = dark all over vr = Vascular Ring dp = Dark Pith bs = Black spot Prepared by: Ed Plissey, Bio Ag Research Machiasport, ME 04655 [email protected]
60

OUT-OF-STORAGE CHIP QUALITY 2008-2009 MICHIGAN REGIONAL REPORT
Chris Long and Greg Steere, Michigan State University
Procedure: The 2008 USPB / SFA Chip Trial was harvested on October 1, 2008 at Sandyland Farms LLC, Howard City, MI. Several chip storage samples were collected from each variety at harvest. Two, 40 pound samples were collected from each entry and placed in the cooperating grower’s commercial storage for evaluation in December 2008 and March of 2009 at Herr Foods, Nottingham PA. The 40 pound tuber samples placed in the grower’s commercial storage were removed from storage in late December 2008 with a pile temperature of 54 ºF and in March 2009 with a pile temperature of 48 ºF. For sprout control, CIPC was applied in the storage in November 2008. Eighteen, 30 tuber samples were also collected from each trial entry at harvest and stored in two bulk storages at the Michigan Potato Industry Commission’s (MPIC), Cargill Potato Demonstration Storage Facility. One set of nine samples were stored at approximately 54ºF for monthly evaluation from October through June. The remaining nine, 30 tuber samples were stored at approximately 50ºF and evaluated from October 2008 to January 2009. These samples from the MPIC storage were processed at Techmark, Inc. for a glucose value (a percent by fresh weight), a sucrose rating (a percent by fresh weight X10), an SFA color score and an undesirable chip color score. The undesirable chip color score is reported as a percentage, by weight, of the total chips that were evaluated. For sprout control, CIPC was applied in the MPIC storages in November 17, 2008. Six varieties were dropped from the storage evaluation process due to the fact that they did not appear to have long term storage potential in Michigan. They are Atlantic, Beacon Chipper, Kalkaska and CO96141-4W. The specific gravity of NY138 was very low and further evaluation was not prudent. Also, the internal chip quality of W2324-1 was so poor that further investment in evaluation was not advantageous. Results: Tables 1 and 2 summarize the chip quality of the 40 pound samples after being processed at Herr Foods, Inc. on December 29th, 2008 and March 24th, 2009. The varieties are listed in yield order, high to low, top to bottom, based on the 2008 field trial data. As seen in Table 1, Beacon Chipper exhibited the least amount of tuber defects. MSJ147-1 and W2717-5 had the highest specific gravity of any lines in the group.
61
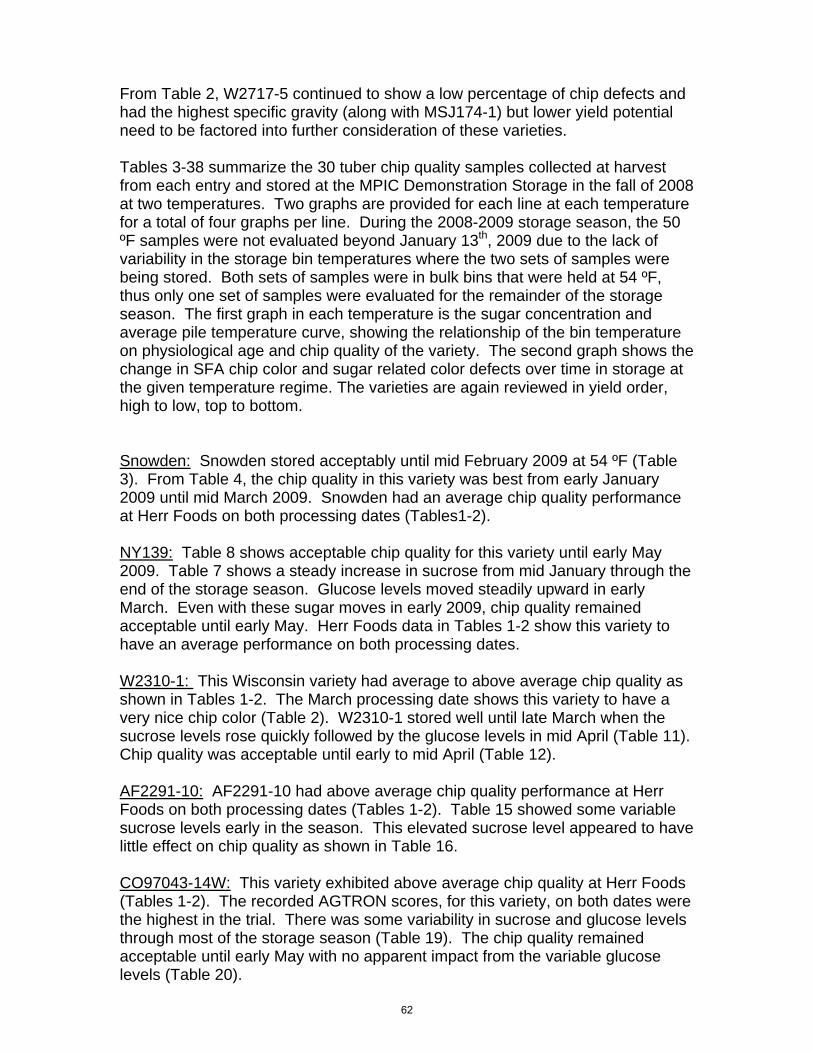
From Table 2, W2717-5 continued to show a low percentage of chip defects and had the highest specific gravity (along with MSJ174-1) but lower yield potential need to be factored into further consideration of these varieties. Tables 3-38 summarize the 30 tuber chip quality samples collected at harvest from each entry and stored at the MPIC Demonstration Storage in the fall of 2008 at two temperatures. Two graphs are provided for each line at each temperature for a total of four graphs per line. During the 2008-2009 storage season, the 50 ºF samples were not evaluated beyond January 13th, 2009 due to the lack of variability in the storage bin temperatures where the two sets of samples were being stored. Both sets of samples were in bulk bins that were held at 54 ºF, thus only one set of samples were evaluated for the remainder of the storage season. The first graph in each temperature is the sugar concentration and average pile temperature curve, showing the relationship of the bin temperature on physiological age and chip quality of the variety. The second graph shows the change in SFA chip color and sugar related color defects over time in storage at the given temperature regime. The varieties are again reviewed in yield order, high to low, top to bottom. Snowden: Snowden stored acceptably until mid February 2009 at 54 ºF (Table 3). From Table 4, the chip quality in this variety was best from early January 2009 until mid March 2009. Snowden had an average chip quality performance at Herr Foods on both processing dates (Tables1-2). NY139: Table 8 shows acceptable chip quality for this variety until early May 2009. Table 7 shows a steady increase in sucrose from mid January through the end of the storage season. Glucose levels moved steadily upward in early March. Even with these sugar moves in early 2009, chip quality remained acceptable until early May. Herr Foods data in Tables 1-2 show this variety to have an average performance on both processing dates. W2310-1: This Wisconsin variety had average to above average chip quality as shown in Tables 1-2. The March processing date shows this variety to have a very nice chip color (Table 2). W2310-1 stored well until late March when the sucrose levels rose quickly followed by the glucose levels in mid April (Table 11). Chip quality was acceptable until early to mid April (Table 12). AF2291-10: AF2291-10 had above average chip quality performance at Herr Foods on both processing dates (Tables 1-2). Table 15 showed some variable sucrose levels early in the season. This elevated sucrose level appeared to have little effect on chip quality as shown in Table 16. CO97043-14W: This variety exhibited above average chip quality at Herr Foods (Tables 1-2). The recorded AGTRON scores, for this variety, on both dates were the highest in the trial. There was some variability in sucrose and glucose levels through most of the storage season (Table 19). The chip quality remained acceptable until early May with no apparent impact from the variable glucose levels (Table 20).
62

ND7519-1: ND7519-1 appeared to have very good early season chip quality. This was confirmed by Herr Foods (Table 1) and the MPIC storage data (Tables 23-24). In January, the sucrose level rose quickly followed by the glucose level in mid February (Table 23). In mid February, the chip quality of this line declined quickly. Tuber rot was reported in this line during the March evaluation at Herr Foods. The warm storage temperature and the tuber rot may have played a major role in this variety not performing well late in the storage season. W2717-5: W2717-5 had an average to above average chip quality at Herr Foods (Tables 1-2). The specific gravity was good and chip defects were below average on both dates. The sucrose level shown in Table 27 declined steadily October through mid February. The sugar stability and dormancy of this variety appear to be good when exposed to warm storage temperatures. Upon dormancy break in mid April, the chip quality declined quickly with rapid increases in sucrose and glucose levels (Table 28). MSJ147-1: MSJ147-1 was an average performer at Herrs on both processing dates (Tables 1-2). The specific gravity was good with a below average size profile. A larger percentage of the tuber size profile of MSJ147-1 was below 2.5 inches. Some sucrose variability was evident October through February in Table 31, while glucose remained flat. Sucrose and glucose levels rose quickly in February and March resulting in poor chip quality in early April (Table 32).
CO95051-7W: This variety had average to above average chip quality at Herr Foods (Tables 1-2). Its yield was the lowest in the 2008 trial. The tuber size profile was smaller than average with most tubers being under 3 inches. In general, the variety had a low percentage of chip defects at Herrs. Sucrose levels were stable until mid February with a steady increase in concentration through the remainder of the season (Table 35). Glucose levels followed sucrose a month later, but overall, chip quality remained good into June (Table 36).
63
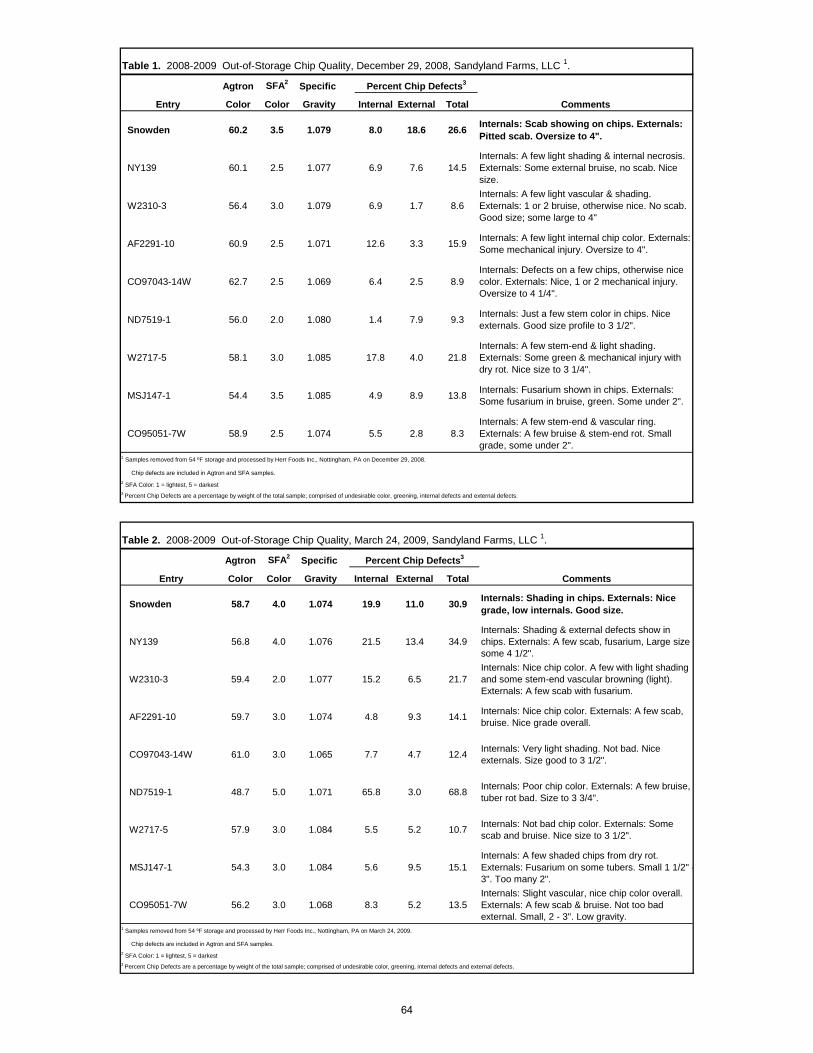
Table 1. 2008-2009 Out-of-Storage Chip Quality, December 29, 2008, Sandyland Farms, LLC 1.
Agtron SFA2 Specific
Entry Color Color Gravity Internal External Total Comments
Snowden 60.2 3.5 1.079 8.0 18.6 26.6 Internals: Scab showing on chips. Externals: Pitted scab. Oversize to 4".
NY139 60.1 2.5 1.077 6.9 7.6 14.5Internals: A few light shading & internal necrosis. Externals: Some external bruise, no scab. Nice size.
W2310-3 56.4 3.0 1.079 6.9 1.7 8.6Internals: A few light vascular & shading. Externals: 1 or 2 bruise, otherwise nice. No scab. Good size; some large to 4"
AF2291-10 60.9 2.5 1.071 12.6 3.3 15.9 Internals: A few light internal chip color. Externals: Some mechanical injury. Oversize to 4".
CO97043-14W 62.7 2.5 1.069 6.4 2.5 8.9Internals: Defects on a few chips, otherwise nice color. Externals: Nice, 1 or 2 mechanical injury. Oversize to 4 1/4".
ND7519-1 56.0 2.0 1.080 1.4 7.9 9.3 Internals: Just a few stem color in chips. Nice externals. Good size profile to 3 1/2".
W2717-5 58.1 3.0 1.085 17.8 4.0 21.8Internals: A few stem-end & light shading. Externals: Some green & mechanical injury with dry rot. Nice size to 3 1/4".
MSJ147-1 54.4 3.5 1.085 4.9 8.9 13.8 Internals: Fusarium shown in chips. Externals: Some fusarium in bruise, green. Some under 2".
CO95051-7W 58.9 2.5 1.074 5.5 2.8 8.3Internals: A few stem-end & vascular ring. Externals: A few bruise & stem-end rot. Small grade, some under 2".
1 Samples removed from 54 ºF storage and processed by Herr Foods Inc., Nottingham, PA on December 29, 2008.
Chip defects are included in Agtron and SFA samples.2 SFA Color: 1 = lightest, 5 = darkest 3 Percent Chip Defects are a percentage by weight of the total sample; comprised of undesirable color, greening, internal defects and external defects.
Percent Chip Defects3
Table 2. 2008-2009 Out-of-Storage Chip Quality, March 24, 2009, Sandyland Farms, LLC 1.
Agtron SFA2 Specific
Entry Color Color Gravity Internal External Total Comments
Snowden 58.7 4.0 1.074 19.9 11.0 30.9 Internals: Shading in chips. Externals: Nice grade, low internals. Good size.
NY139 56.8 4.0 1.076 21.5 13.4 34.9Internals: Shading & external defects show in chips. Externals: A few scab, fusarium, Large size some 4 1/2".
W2310-3 59.4 2.0 1.077 15.2 6.5 21.7Internals: Nice chip color. A few with light shading and some stem-end vascular browning (light). Externals: A few scab with fusarium.
AF2291-10 59.7 3.0 1.074 4.8 9.3 14.1 Internals: Nice chip color. Externals: A few scab, bruise. Nice grade overall.
CO97043-14W 61.0 3.0 1.065 7.7 4.7 12.4 Internals: Very light shading. Not bad. Nice externals. Size good to 3 1/2".
ND7519-1 48.7 5.0 1.071 65.8 3.0 68.8 Internals: Poor chip color. Externals: A few bruise, tuber rot bad. Size to 3 3/4".
W2717-5 57.9 3.0 1.084 5.5 5.2 10.7 Internals: Not bad chip color. Externals: Some scab and bruise. Nice size to 3 1/2".
MSJ147-1 54.3 3.0 1.084 5.6 9.5 15.1Internals: A few shaded chips from dry rot. Externals: Fusarium on some tubers. Small 1 1/2" -3". Too many 2".
CO95051-7W 56.2 3.0 1.068 8.3 5.2 13.5Internals: Slight vascular, nice chip color overall. Externals: A few scab & bruise. Not too bad external. Small, 2 - 3". Low gravity.
1 Samples removed from 54 ºF storage and processed by Herr Foods Inc., Nottingham, PA on March 24, 2009.
Chip defects are included in Agtron and SFA samples.2 SFA Color: 1 = lightest, 5 = darkest 3 Percent Chip Defects are a percentage by weight of the total sample; comprised of undesirable color, greening, internal defects and external defects.
Percent Chip Defects3
64

Table 3.
SUGAR CONCENTRATION CURVES AT 54° F PILE TEMPERATUREFOR THE 2008 - 2009 USPB/SFA MICHIGAN REGIONAL TRIAL
Snowden
0.00
0.02
0.04
0.06
0.08
0.10
0.12
0.14
0.16
0.18
0.20
0.22
0.24
10/2/08 10/21/08 11/18/08 12/16/08 1/13/09 2/10/09 3/10/09 4/7/09 5/6/09 6/2/09
SAMPLE DATE
SUG
AR
CO
NC
ENTR
ATI
ON
44
46
48
50
52
54
56
58
60
AVE
RA
GE
PILE
TE
MPE
RA
TUR
E (F
)
Glucose Sucrose Average Pile Temperature
Table 4.
54° F, CHIP COLOR AND COLOR DEFECT CURVES FOR THE 2008 - 2009 USPB/SFA MICHIGAN REGIONAL TRIAL
Snowden
0.00
0.50
1.00
1.50
2.00
2.50
3.00
3.50
10/2/2008
10/21/2008
11/18/2008
12/16/2008
1/13/2009
2/10/2009
3/10/2009
4/7/2009
5/6/2009
6/2/2009
SAMPLE DATE
SFA
CH
IP C
OLO
R
0102030405060708090100
CO
LOR
DEF
ECTS
(%)
SFA Color Color Defects %
65

Table 5.
SUGAR CONCENTRATION CURVES AT 50° F PILE TEMPERATUREFOR THE 2008 - 2009 USPB/SFA MICHIGAN REGIONAL TRIAL
Snowden
0.00
0.02
0.04
0.06
0.08
0.10
0.12
0.14
0.16
0.18
0.20
0.22
0.24
10/2/08 10/21/08 11/18/08 12/17/08 1/13/09
SAMPLE DATE
SUG
AR
CO
NC
ENTR
ATI
ON
44
46
48
50
52
54
56
58
60
AVE
RA
GE
PILE
TE
MPE
RA
TUR
E (F
)
Glucose Sucrose Average Pile Temperature
Table 6.
50° F, CHIP COLOR AND COLOR DEFECT CURVES FOR THE 2008 - 2009 USPB/SFA MICHIGAN REGIONAL TRIAL
Snowden
0.00
0.50
1.00
1.50
2.00
2.50
3.00
3.50
10/2/2008
10/21/2008
11/18/2008
12/17/2008
1/13/2009
SAMPLE DATE
SFA
CH
IP C
OLO
R
0102030405060708090100
CO
LOR
DEF
ECTS
(%)
SFA Color Color Defects %
66

Table 7.
SUGAR CONCENTRATION CURVES AT 54° F PILE TEMPERATUREFOR THE 2008 - 2009 USPB/SFA MICHIGAN REGIONAL TRIAL
NY139
0.00
0.02
0.04
0.06
0.08
0.10
0.12
0.14
0.16
0.18
0.20
0.22
0.24
10/2/08 10/21/08 11/18/08 12/16/08 1/13/09 2/10/09 3/10/09 4/7/09 5/6/09 6/2/09
SAMPLE DATE
SUG
AR
CO
NC
ENTR
ATI
ON
44
46
48
50
52
54
56
58
60
AVE
RA
GE
PILE
TE
MPE
RA
TUR
E (F
)
Glucose Sucrose Average Pile Temperature
Table 8.
54° F, CHIP COLOR AND COLOR DEFECT CURVES FOR THE 2008 - 2009 USPB/SFA MICHIGAN REGIONAL TRIAL
NY139
0.00
0.50
1.00
1.50
2.00
2.50
3.00
3.50
10/21/2008
11/18/2008
12/16/2008
1/13/2009
2/10/2009
3/10/2009
4/7/2009
5/6/2009
6/2/2009
SAMPLE DATE
SFA
CH
IP C
OLO
R
0102030405060708090100
CO
LOR
DEF
ECTS
(%)
SFA Color Color Defects %
67

Table 9.
SUGAR CONCENTRATION CURVES AT 50° F PILE TEMPERATUREFOR THE 2008 - 2009 USPB/SFA MICHIGAN REGIONAL TRIAL
NY139
0.00
0.02
0.04
0.06
0.08
0.10
0.12
0.14
0.16
0.18
0.20
0.22
0.24
10/2/08 10/21/08 11/18/08 12/17/08 1/13/09
SAMPLE DATE
SUG
AR
CO
NC
ENTR
ATI
ON
44
46
48
50
52
54
56
58
60
AVE
RA
GE
PILE
TE
MPE
RA
TUR
E (F
)
Glucose Sucrose Average Pile Temperature
Table 10.
50° F, CHIP COLOR AND COLOR DEFECT CURVES FOR THE 2008 - 2009 USPB/SFA MICHIGAN REGIONAL TRIAL
NY139
0.00
0.50
1.00
1.50
2.00
2.50
3.00
3.50
10/2/2008
10/21/2008
11/18/2008
12/17/2008
1/13/2009
SAMPLE DATE
SFA
CH
IP C
OLO
R
0102030405060708090100
CO
LOR
DEF
ECTS
(%)
SFA Color Color Defects %
68

Table 11.
SUGAR CONCENTRATION CURVES AT 54° F PILE TEMPERATUREFOR THE 2008 - 2009 USPB/SFA MICHIGAN REGIONAL TRIAL
W2310-3
0.00
0.02
0.04
0.06
0.08
0.10
0.12
0.14
0.16
0.18
0.20
0.22
0.24
10/2/08 10/21/08 11/18/08 12/16/08 1/13/09 2/10/09 3/10/09 4/7/09 5/6/09 6/2/09
SAMPLE DATE
SUG
AR
CO
NC
ENTR
ATI
ON
44
46
48
50
52
54
56
58
60
AVE
RA
GE
PILE
TE
MPE
RA
TUR
E (F
)
Glucose Sucrose Average Pile Temperature
Table 12.
54° F, CHIP COLOR AND COLOR DEFECT CURVES FOR THE 2008 - 2009 USPB/SFA MICHIGAN REGIONAL TRIAL
W2310-3
0.00
0.50
1.00
1.50
2.00
2.50
3.00
3.50
10/2/2008
10/21/2008
11/18/2008
12/16/2008
1/13/2009
2/10/2009
3/10/2009
4/7/2009
5/6/2009
6/2/2009
SAMPLE DATE
SFA
CH
IP C
OLO
R
0102030405060708090100
CO
LOR
DEF
ECTS
(%)
SFA Color Color Defects %
69

Table 13.
SUGAR CONCENTRATION CURVES AT 50° F PILE TEMPERATUREFOR THE 2008 - 2009 USPB/SFA MICHIGAN REGIONAL TRIAL
W2310-3
0.00
0.02
0.04
0.06
0.08
0.10
0.12
0.14
0.16
0.18
0.20
0.22
0.24
10/2/08 10/21/08 11/18/08 12/17/08 1/13/09
SAMPLE DATE
SUG
AR
CO
NC
ENTR
ATI
ON
44
46
48
50
52
54
56
58
60
AVE
RA
GE
PILE
TE
MPE
RA
TUR
E (F
)
Glucose Sucrose Average Pile Temperature
Table 14.
50° F, CHIP COLOR AND COLOR DEFECT CURVES FOR THE 2008 - 2009 USPB/SFA MICHIGAN REGIONAL TRIAL
W2310-3
0.00
0.50
1.00
1.50
2.00
2.50
3.00
3.50
10/2/2008
10/21/2008
11/18/2008
12/17/2008
1/13/2009
SAMPLE DATE
SFA
CH
IP C
OLO
R
0102030405060708090100
CO
LOR
DEF
ECTS
(%)
SFA Color Color Defects %
70

Table 15.
SUGAR CONCENTRATION CURVES AT 54° F PILE TEMPERATUREFOR THE 2008 - 2009 USPB/SFA MICHIGAN REGIONAL TRIAL
AF2291-10
0.000.020.040.060.080.10
0.120.140.160.180.200.220.24
10/2/08 10/21/08 11/18/08 12/16/08 1/13/09 2/10/09 3/10/09 4/7/09 5/6/09 6/2/09
SAMPLE DATE
SUG
AR
CO
NC
ENTR
ATI
ON
44
46
48
50
52
54
56
58
60
AVE
RA
GE
PILE
TE
MPE
RA
TUR
E (F
)
Glucose Sucrose Average Pile Temperature
Table 16.
54° F, CHIP COLOR AND COLOR DEFECT CURVES FOR THE 2008 - 2009 USPB/SFA MICHIGAN REGIONAL TRIAL
AF2291-10
0.00
0.50
1.00
1.50
2.00
2.50
3.00
3.50
10/2/2008
10/21/2008
11/18/2008
12/16/2008
1/13/2009
2/10/2009
3/10/2009
4/7/2009
5/6/2009
6/2/2009
SAMPLE DATE
SFA
CH
IP C
OLO
R
0102030405060708090100
CO
LOR
DEF
ECTS
(%)
SFA Color Color Defects %
71

Table 17.
SUGAR CONCENTRATION CURVES AT 50° F PILE TEMPERATUREFOR THE 2008 - 2009 USPB/SFA MICHIGAN REGIONAL TRIAL
AF2291-10
0.00
0.02
0.04
0.06
0.08
0.10
0.12
0.14
0.16
0.18
0.20
0.22
0.24
10/2/08 10/21/08 11/18/08 12/17/08 1/13/09
SAMPLE DATE
SUG
AR
CO
NC
ENTR
ATI
ON
44
46
48
50
52
54
56
58
60
AVE
RA
GE
PILE
TE
MPE
RA
TUR
E (F
)
Glucose Sucrose Average Pile Temperature
Table 18.
50° F, CHIP COLOR AND COLOR DEFECT CURVES FOR THE 2008 - 2009 USPB/SFA MICHIGAN REGIONAL TRIAL
AF2291-10
0.00
0.50
1.00
1.50
2.00
2.50
3.00
3.50
10/2/2008 10/21/2008 11/18/2008 12/17/2008 1/13/2009
SAMPLE DATE
SFA
CH
IP C
OLO
R
0
10
20
30
40
50
60
70
80
90
100
CO
LOR
DEF
ECTS
(%)
SFA Color Color Defects %
72
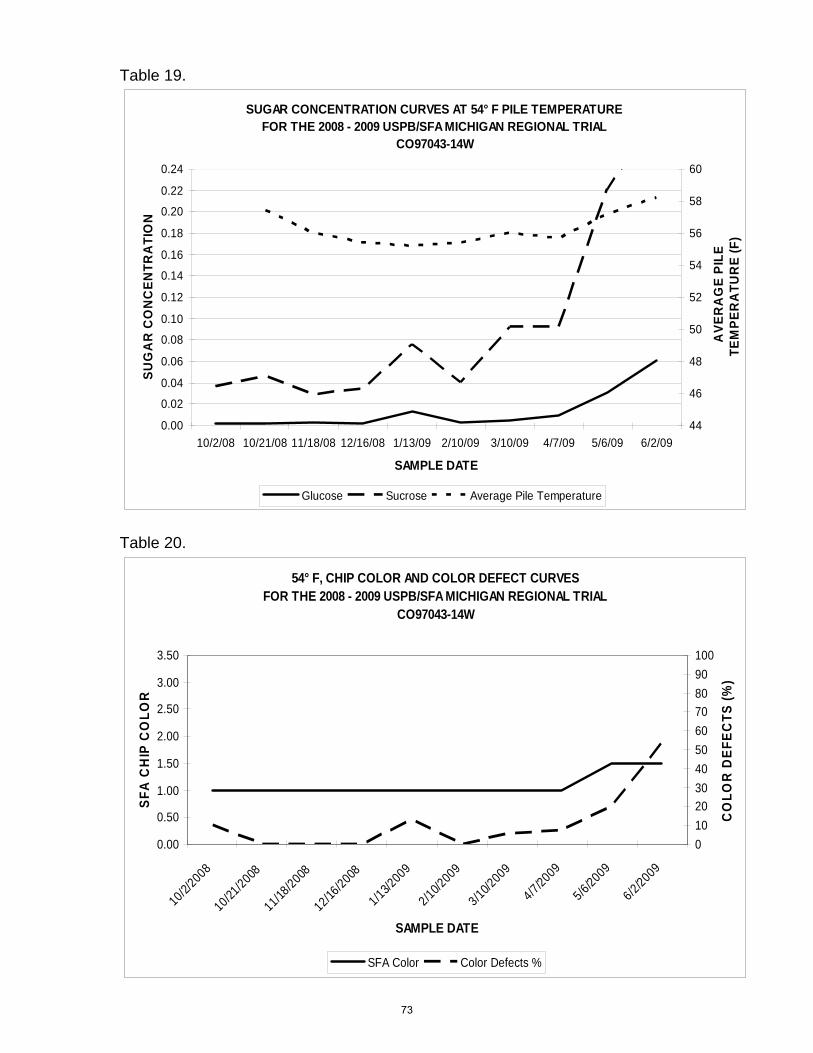
Table 19.
SUGAR CONCENTRATION CURVES AT 54° F PILE TEMPERATUREFOR THE 2008 - 2009 USPB/SFA MICHIGAN REGIONAL TRIAL
CO97043-14W
0.00
0.02
0.04
0.06
0.08
0.10
0.12
0.14
0.16
0.18
0.20
0.22
0.24
10/2/08 10/21/08 11/18/08 12/16/08 1/13/09 2/10/09 3/10/09 4/7/09 5/6/09 6/2/09
SAMPLE DATE
SUG
AR
CO
NC
ENTR
ATI
ON
44
46
48
50
52
54
56
58
60
AVE
RA
GE
PILE
TE
MPE
RA
TUR
E (F
)
Glucose Sucrose Average Pile Temperature
Table 20.
54° F, CHIP COLOR AND COLOR DEFECT CURVES FOR THE 2008 - 2009 USPB/SFA MICHIGAN REGIONAL TRIAL
CO97043-14W
0.00
0.50
1.00
1.50
2.00
2.50
3.00
3.50
10/2/2008
10/21/2008
11/18/2008
12/16/2008
1/13/2009
2/10/2009
3/10/2009
4/7/2009
5/6/2009
6/2/2009
SAMPLE DATE
SFA
CH
IP C
OLO
R
0102030405060708090100
CO
LOR
DEF
ECTS
(%)
SFA Color Color Defects %
73

Table 21.
SUGAR CONCENTRATION CURVES AT 50° F PILE TEMPERATUREFOR THE 2008 - 2009 USPB/SFA MICHIGAN REGIONAL TRIAL
CO97043-14W
0.00
0.02
0.04
0.06
0.08
0.10
0.12
0.14
0.16
0.18
0.20
0.22
0.24
10/2/08 10/21/08 11/18/08 12/16/08 1/13/09
SAMPLE DATE
SUG
AR
CO
NC
ENTR
ATI
ON
44
46
48
50
52
54
56
58
60
AVE
RA
GE
PILE
TE
MPE
RA
TUR
E (F
)
Glucose Sucrose Average Pile Temperature
Table 22.
50° F, CHIP COLOR AND COLOR DEFECT CURVES FOR THE 2008 - 2009 USPB/SFA MICHIGAN REGIONAL TRIAL
CO97043-14W
0.00
0.50
1.00
1.50
2.00
2.50
3.00
3.50
10/2/2008
10/21/2008
11/18/2008
12/16/2008
1/13/2009
SAMPLE DATE
SFA
CH
IP C
OLO
R
0102030405060708090100
CO
LOR
DEF
ECTS
(%)
SFA Color Color Defects %
74

Table 23.
SUGAR CONCENTRATION CURVES AT 54° F PILE TEMPERATUREFOR THE 2008 - 2009 USPB/SFA MICHIGAN REGIONAL TRIAL
ND7519-1
0.00
0.02
0.04
0.06
0.08
0.10
0.12
0.14
0.16
0.18
0.20
0.22
0.24
10/2/08 10/21/08 11/18/08 12/16/08 1/13/09 2/10/09 3/10/09 4/7/09 5/6/09 6/2/09
SAMPLE DATE
SUG
AR
CO
NC
ENTR
ATI
ON
44
46
48
50
52
54
56
58
60
AVE
RA
GE
PILE
TE
MPE
RA
TUR
E (F
)
Glucose Sucrose Average Pile Temperature
Table 24.
54° F, CHIP COLOR AND COLOR DEFECT CURVES FOR THE 2008 - 2009 USPB/SFA MICHIGAN REGIONAL TRIAL
ND7519-1
0.00
0.50
1.00
1.50
2.00
2.50
3.00
3.50
10/2/2008
10/21/2008
11/18/2008
12/16/2008
1/13/2009
2/10/2009
3/10/2009
4/7/2009
5/6/2009
6/2/2009
SAMPLE DATE
SFA
CH
IP C
OLO
R
0102030405060708090100
CO
LOR
DEF
ECTS
(%)
SFA Color Color Defects %
75

Table 25.
SUGAR CONCENTRATION CURVES AT 50° F PILE TEMPERATUREFOR THE 2008 - 2009 USPB/SFA MICHIGAN REGIONAL TRIAL
ND7519-1
0.00
0.02
0.04
0.06
0.08
0.10
0.12
0.14
0.16
0.18
0.20
0.22
0.24
10/2/08 10/21/08 11/18/08 12/16/08 1/13/09
SAMPLE DATE
SUG
AR
CO
NC
ENTR
ATI
ON
44
46
48
50
52
54
56
58
60
AVE
RA
GE
PILE
TE
MPE
RA
TUR
E (F
)
Glucose Sucrose Average Pile Temperature
Table 26.
50° F, CHIP COLOR AND COLOR DEFECT CURVES FOR THE 2008 - 2009 USPB/SFA MICHIGAN REGIONAL TRIAL
ND7519-1
0.00
0.50
1.00
1.50
2.00
2.50
3.00
3.50
10/2/2008
10/21/2008
11/18/2008
12/16/2008
1/13/2009
SAMPLE DATE
SFA
CH
IP C
OLO
R
0102030405060708090100
CO
LOR
DEF
ECTS
(%)
SFA Color Color Defects %
76

Table 27.
SUGAR CONCENTRATION CURVES AT 54° F PILE TEMPERATUREFOR THE 2008 - 2009 USPB/SFA MICHIGAN REGIONAL TRIAL
W2717-5
0.00
0.02
0.04
0.06
0.08
0.10
0.12
0.14
0.16
0.18
0.20
0.22
0.24
10/2/08 10/21/08 11/18/08 12/17/08 1/13/09 2/10/09 3/10/09 4/7/09 5/6/09 6/2/09
SAMPLE DATE
SUG
AR
CO
NC
ENTR
ATI
ON
44
46
48
50
52
54
56
58
60
AVE
RA
GE
PILE
TE
MPE
RA
TUR
E (F
)
Glucose Sucrose Average Pile Temperature
Table 28.
54° F, CHIP COLOR AND COLOR DEFECT CURVES FOR THE 2008 - 2009 USPB/SFA MICHIGAN REGIONAL TRIAL
W2717-5
0.00
0.50
1.00
1.50
2.00
2.50
3.00
3.50
10/2/2008
10/21/2008
11/18/2008
12/17/2008
1/13/2009
2/10/2009
3/10/2009
4/7/2009
5/6/2009
6/2/2009
SAMPLE DATE
SFA
CH
IP C
OLO
R
0102030405060708090100
CO
LOR
DEF
ECTS
(%)
SFA Color Color Defects %
77
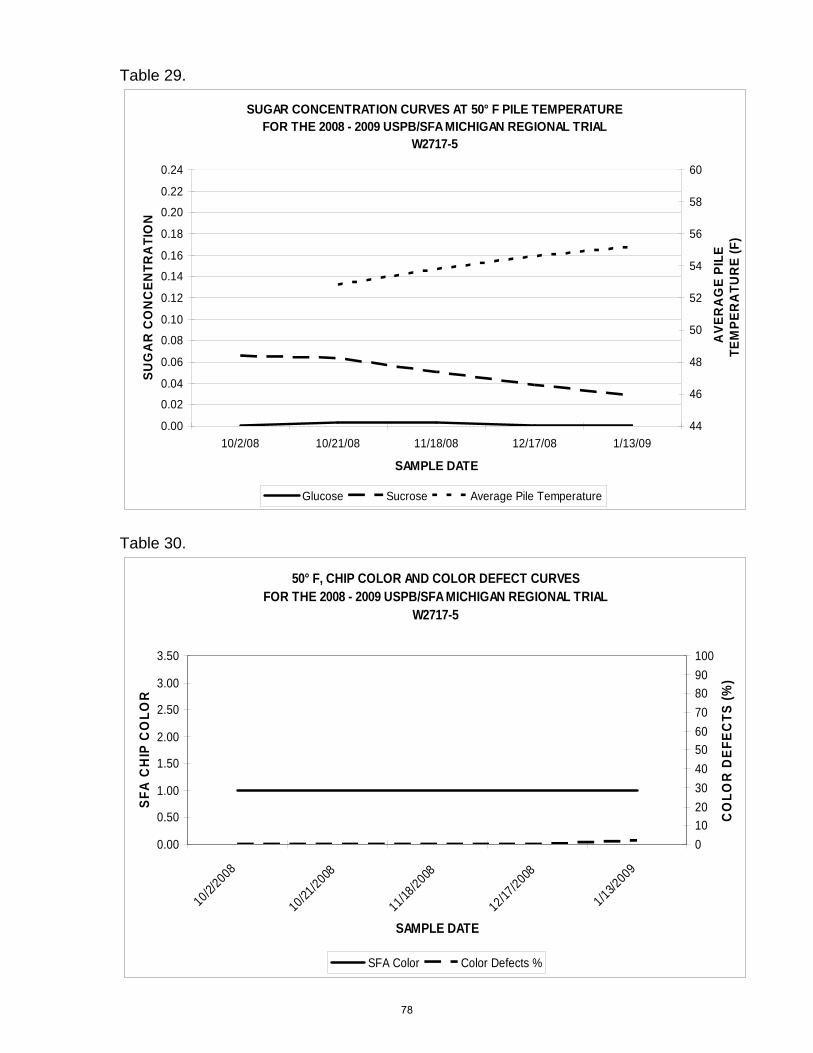
Table 29.
SUGAR CONCENTRATION CURVES AT 50° F PILE TEMPERATUREFOR THE 2008 - 2009 USPB/SFA MICHIGAN REGIONAL TRIAL
W2717-5
0.00
0.02
0.04
0.06
0.08
0.10
0.12
0.14
0.16
0.18
0.20
0.22
0.24
10/2/08 10/21/08 11/18/08 12/17/08 1/13/09
SAMPLE DATE
SUG
AR
CO
NC
ENTR
ATI
ON
44
46
48
50
52
54
56
58
60
AVE
RA
GE
PILE
TE
MPE
RA
TUR
E (F
)
Glucose Sucrose Average Pile Temperature
Table 30.
50° F, CHIP COLOR AND COLOR DEFECT CURVES FOR THE 2008 - 2009 USPB/SFA MICHIGAN REGIONAL TRIAL
W2717-5
0.00
0.50
1.00
1.50
2.00
2.50
3.00
3.50
10/2/2008
10/21/2008
11/18/2008
12/17/2008
1/13/2009
SAMPLE DATE
SFA
CH
IP C
OLO
R
0102030405060708090100
CO
LOR
DEF
ECTS
(%)
SFA Color Color Defects %
78

Table 31.
SUGAR CONCENTRATION CURVES AT 54° F PILE TEMPERATUREFOR THE 2008 - 2009 USPB/SFA MICHIGAN REGIONAL TRIAL
MSJ147-1
0.00
0.02
0.04
0.06
0.08
0.10
0.12
0.14
0.16
0.18
0.20
0.22
0.24
10/2/08 10/21/08 11/18/08 12/16/08 1/13/09 2/10/09 3/10/09 4/7/09 5/6/09 6/2/09
SAMPLE DATE
SUG
AR
CO
NC
ENTR
ATI
ON
44
46
48
50
52
54
56
58
60
AVE
RA
GE
PILE
TE
MPE
RA
TUR
E (F
)
Glucose Sucrose Average Pile Temperature
Table 32.
54° F, CHIP COLOR AND COLOR DEFECT CURVES FOR THE 2008 - 2009 USPB/SFA MICHIGAN REGIONAL TRIAL
MSJ147-1
0.00
0.50
1.00
1.50
2.00
2.50
3.00
3.50
10/2/2008
10/21/2008
11/18/2008
12/16/2008
1/13/2009
2/10/2009
3/10/2009
4/7/2009
5/6/2009
6/2/2009
SAMPLE DATE
SFA
CH
IP C
OLO
R
0102030405060708090100
CO
LOR
DEF
ECTS
(%)
SFA Color Color Defects %
79

Table 33.
SUGAR CONCENTRATION CURVES AT 50° F PILE TEMPERATUREFOR THE 2008 - 2009 USPB/SFA MICHIGAN REGIONAL TRIAL
MSJ147-1
0.00
0.02
0.04
0.06
0.08
0.10
0.12
0.14
0.16
0.18
0.20
0.22
0.24
10/2/08 10/21/08 11/18/08 12/17/08 1/13/09
SAMPLE DATE
SUG
AR
C
ON
CEN
TRA
TIO
N
44
46
48
50
52
54
56
58
60
AVE
RA
GE
PILE
TE
MPE
RA
TUR
E (F
)
Glucose Sucrose Average Pile Temperature
Table 34.
50° F, CHIP COLOR AND COLOR DEFECT CURVES FOR THE 2008 - 2009 USPB/SFA MICHIGAN REGIONAL TRIAL
MSJ147-1
0.00
0.50
1.00
1.50
2.00
2.50
3.00
3.50
10/2/2008
10/21/2008
11/18/2008
12/17/2008
1/13/2009
SAMPLE DATE
SFA
CH
IP C
OLO
R
0102030405060708090100
CO
LOR
DEF
ECTS
(%)
SFA Color Color Defects %
80

Table 35.
SUGAR CONCENTRATION CURVES AT 54° F PILE TEMPERATUREFOR THE 2008 - 2009 USPB/SFA MICHIGAN REGIONAL TRIAL
CO95051-7W
0.00
0.02
0.04
0.06
0.08
0.10
0.12
0.14
0.16
0.18
0.20
0.22
0.24
10/2/08 10/21/08 11/18/08 12/17/08 1/13/09 2/10/09 3/10/09 4/7/09 5/6/09 6/2/09
SAMPLE DATE
SUG
AR
CO
NC
ENTR
ATI
ON
44
46
48
50
52
54
56
58
60
AVE
RA
GE
PILE
TE
MPE
RA
TUR
E (F
)
Glucose Sucrose Average Pile Temperature
Table 36.
54° F, CHIP COLOR AND COLOR DEFECT CURVES FOR THE 2008 - 2009 USPB/SFA MICHIGAN REGIONAL TRIAL
CO95051-7W
0.00
0.50
1.00
1.50
2.00
2.50
3.00
3.50
10/2/2008
10/21/2008
11/18/2008
12/17/2008
1/13/2009
2/10/2009
3/10/2009
4/7/2009
5/6/2009
6/2/2009
SAMPLE DATE
SFA
CH
IP C
OLO
R
0102030405060708090100
CO
LOR
DEF
ECTS
(%)
SFA Color Color Defects %
81
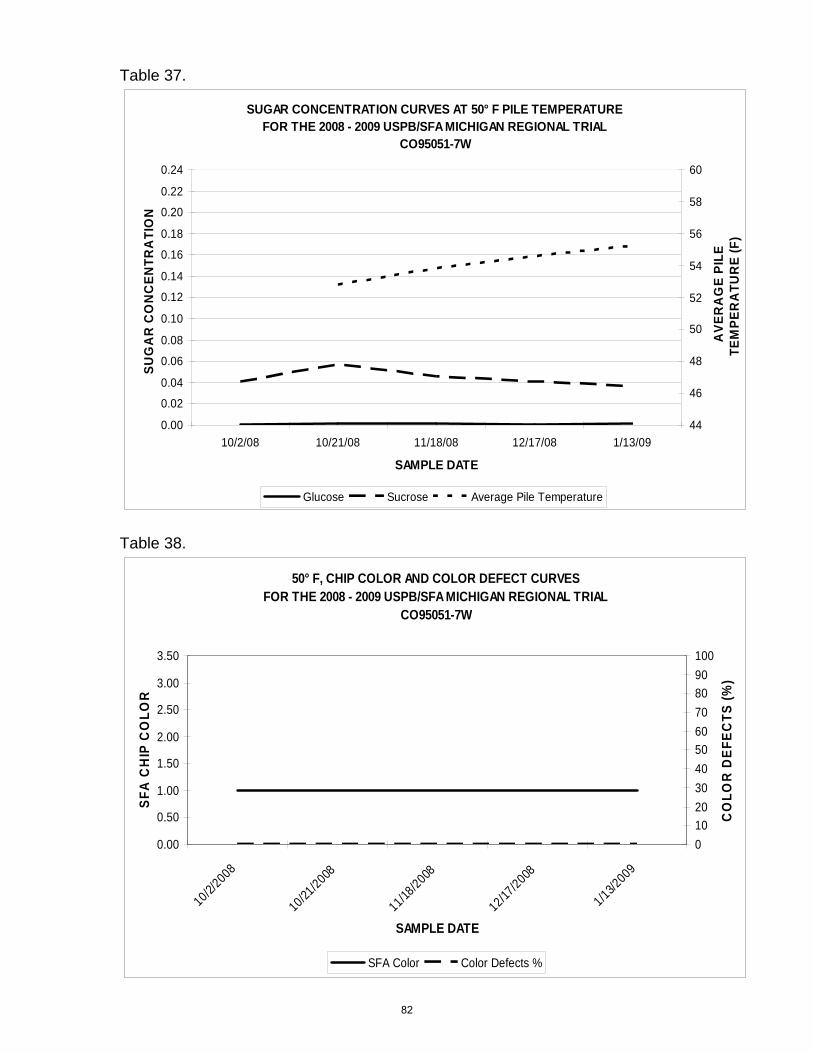
Table 37.
SUGAR CONCENTRATION CURVES AT 50° F PILE TEMPERATUREFOR THE 2008 - 2009 USPB/SFA MICHIGAN REGIONAL TRIAL
CO95051-7W
0.00
0.02
0.04
0.06
0.08
0.10
0.12
0.14
0.16
0.18
0.20
0.22
0.24
10/2/08 10/21/08 11/18/08 12/17/08 1/13/09
SAMPLE DATE
SUG
AR
CO
NC
ENTR
ATI
ON
44
46
48
50
52
54
56
58
60
AVE
RA
GE
PILE
TE
MPE
RA
TUR
E (F
)
Glucose Sucrose Average Pile Temperature
Table 38.
50° F, CHIP COLOR AND COLOR DEFECT CURVES FOR THE 2008 - 2009 USPB/SFA MICHIGAN REGIONAL TRIAL
CO95051-7W
0.00
0.50
1.00
1.50
2.00
2.50
3.00
3.50
10/2/2008
10/21/2008
11/18/2008
12/17/2008
1/13/2009
SAMPLE DATE
SFA
CH
IP C
OLO
R
0102030405060708090100
CO
LOR
DEF
ECTS
(%)
SFA Color Color Defects %
82

Table 1. 2008 USPB-SFA chip trial storage information on fourteen entries and two standards.Average sprout length in inches.
13-Jan 12-Feb 23-Mar Storage Chips*
Entry 45oF notes 55ºF notes 45oF notes 55ºF notes 45oF notes 55ºF notes AgtronSpecificGravity
CO97065-7W 0.0 0.3 0.0 1.3 1.4 2.2 c 53 1.089NY138 0.0 0.0 0.0 1.4 b 0.4 7.5 c 56 1.079CO96141-4W 0.4 3.7 1.3 2.5 b 2.7 b 3.2 c 58 1.089MSJ147-1 0.5 1.4 0.8 2.1 b 1.2 4.6 c 59 1.092
CO97043-14W 0.0 1.7 0.2 2.5 b 2.8 b 6.7 c 61 1.090W2310-3 0.0 0.7 0.0 3.0 b 1.0 b 11.7 c 55 1.098Snowden 0.0 1.7 0.7 3.3 c 4.0 b 14.0 c 53 1.093CO95051-7W 0.0 1.0 0.0 1.3 c 1.1 b 2.3 c 52 1.089
W2717-5 0.0 0.5 0.7 0.8 0.8 4.8 b 49 1.097Beacon Chipper 0.0 0.8 0.7 1.8 b 1.5 11.3 c 56 1.085MSJ036-A 0.0 0.9 0.2 0.8 1.0 2.7 c 54 1.086AF2291-10 0.0 0.2 0.2 0.5 0.9 0.5 b 55 1.097
W2324-1 0.8 9.3 2.2 11.8 c 3.0 b 18.7 c 54 1.096ND7519-1 1.1 0.8 1.2 1.0 b 1.0 b 1.0 c 53 1.094Atlantic 0.0 1.2 0.5 2.6 b 1.2 b 6.8 c 52 1.092NY139 0.0 2.2 0.2 7.5 b 1.1 13.2 c 56 1.095
a = samples less than 0.5" were reported as 0.5"b = minor tuber shrinkage c = major tuber shrinkage * Out - Of - Storage Chips processed February 25, 2009
Pennsylvania Regional Trial
83

Variety Oct 08 Nov 08 Dec 08 Jan 09 Feb 09 Mar 09 Apr 0950F 50F 50F 50F 50F 50F 50F
ATLANTIC 45 46 52 52 53 63 57
SNOWDEN 55 61 63 61 59 69 62
AF2291-10 53 50 54 55 58 62 63
CO96141-4W 64 63 65 63 62 69 62
CO97043-14W 67 67 70 68 64 72 66
CO97065-7W 66 59 65 66 62 70 61
NY138 63 63 68 64 62 70 68
NY139 64 63 66 66 60 68 61
W2324-1 57 54 59 59 56 66 63
W2717-5 62 67 67 65 59 72 64
Variety Oct 08 Nov 08 Dec 08 Jan 09 Feb 09 Mar 09 Apr 0945F 45F 45F 45F 45F 45F 45F
2008-09 Red River Valley USPB-SFA Storage TrialAgtron ratings from 45F and 50F Storage for October 2008 through April 2009
ATLANTIC 45 41 47 46 48 50 50
SNOWDEN 48 41 47 50 54 59 60
AF2291-10 47 44 46 47 47 49 56
CO96141-4W 58 54 60 56 54 58 57
CO97043-14W 65 52 60 53 55 53 57
CO97065-7W 57 43 53 50 55 56 57
NY138 57 49 57 57 58 65 63
NY139 52 46 62 58 62 60 62
W2324-1 43 40 44 46 50 49 56
W2717-5 64 61 64 61 61 64 60
84
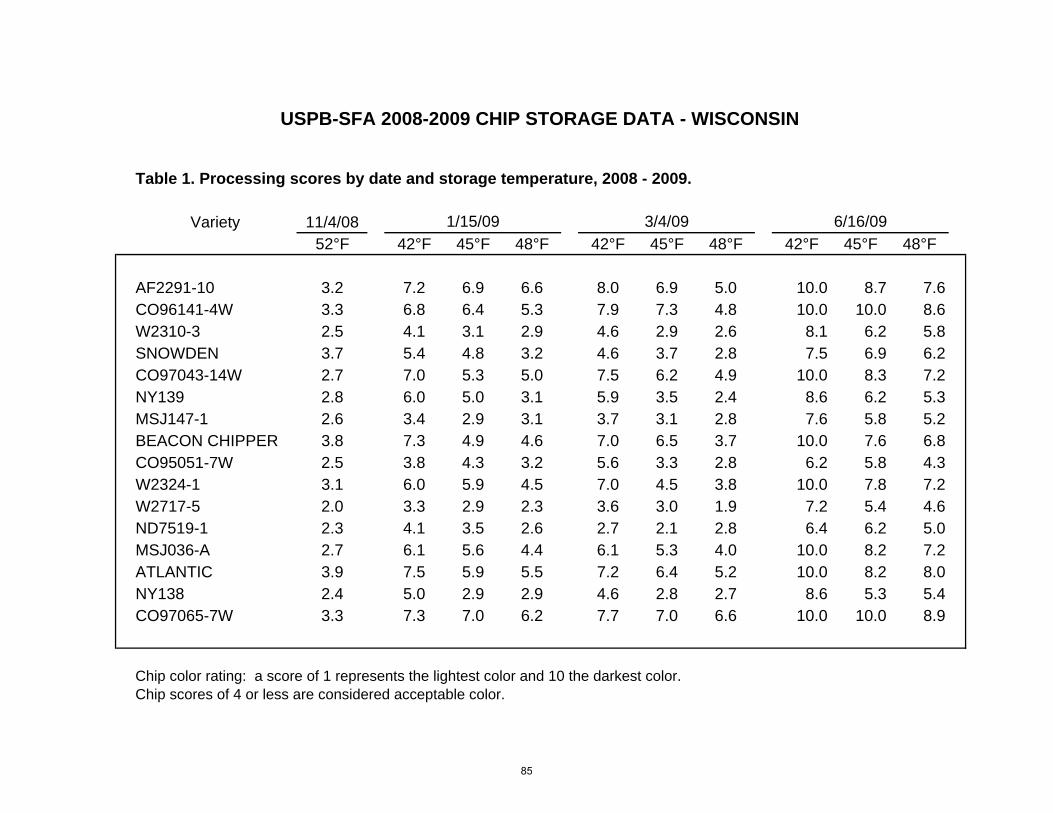
Table 1. Processing scores by date and storage temperature, 2008 - 2009.
Variety 11/4/0852°F 42°F 45°F 48°F 42°F 45°F 48°F 42°F 45°F 48°F
AF2291-10 3.2 7.2 6.9 6.6 8.0 6.9 5.0 10.0 8.7 7.6CO96141-4W 3.3 6.8 6.4 5.3 7.9 7.3 4.8 10.0 10.0 8.6W2310-3 2.5 4.1 3.1 2.9 4.6 2.9 2.6 8.1 6.2 5.8SNOWDEN 3.7 5.4 4.8 3.2 4.6 3.7 2.8 7.5 6.9 6.2CO97043-14W 2.7 7.0 5.3 5.0 7.5 6.2 4.9 10.0 8.3 7.2NY139 2.8 6.0 5.0 3.1 5.9 3.5 2.4 8.6 6.2 5.3MSJ147-1 2.6 3.4 2.9 3.1 3.7 3.1 2.8 7.6 5.8 5.2BEACON CHIPPER 3.8 7.3 4.9 4.6 7.0 6.5 3.7 10.0 7.6 6.8CO95051-7W 2.5 3.8 4.3 3.2 5.6 3.3 2.8 6.2 5.8 4.3W2324-1 3.1 6.0 5.9 4.5 7.0 4.5 3.8 10.0 7.8 7.2W2717-5 2.0 3.3 2.9 2.3 3.6 3.0 1.9 7.2 5.4 4.6ND7519-1 2.3 4.1 3.5 2.6 2.7 2.1 2.8 6.4 6.2 5.0MSJ036-A 2.7 6.1 5.6 4.4 6.1 5.3 4.0 10.0 8.2 7.2ATLANTIC 3.9 7.5 5.9 5.5 7.2 6.4 5.2 10.0 8.2 8.0NY138 2.4 5.0 2.9 2.9 4.6 2.8 2.7 8.6 5.3 5.4CO97065-7W 3.3 7.3 7.0 6.2 7.7 7.0 6.6 10.0 10.0 8.9
Chip color rating: a score of 1 represents the lightest color and 10 the darkest color.Chip scores of 4 or less are considered acceptable color.
USPB-SFA 2008-2009 CHIP STORAGE DATA - WISCONSIN
3/4/09 6/16/091/15/09
85

WNC672-2, 1985-1987 NY102 (Monticello), 1994-1995WNC521-12, 1985-1986 NY103 (Eva), 1995-1997W879, 1985-1986 BCO894-2, 1995-1997W833, 1985 ATX85404-8, 1996-1998TXA17-1, 1985-1986 AF1433-4, 1996-1998A70369-2, 1985-1986 ND2676-10 (Dakota Pearl), 1997-1999ND860-2, 1985-1986 B0564-8 (Harley Blackwell), 1997-1999G670-11, 1985 B0564-9, 1997-1999BR7093-24 (Gemchip), 1986-1988 NY115, 1997-1999W848 (Niska), 1986-1987 W1313, 1999NY71 (Kanona), 1986-1988 NY112 (Marcy), 1998-2000NY81 (Steuben), 1986-1988 AF1668-60, 1998-2000NY72 (Allegany), 1987-1989 MSNT-1, 1998-2000AF236-1 (Somerset), 1987-1989 MSA091-1 (Liberator), 1999-2001MS700-70, 1987-1989 B0766-3, 2000-2002AC80545-1 (Chipeta), 1987-1989 AF1775-2, 2000-2002LA01-38 (LaBelle), 1988-1990 W1431, 2000-2002MS716-15, 1988-1990 NY120, 2000-2002MS700-83 (Spartan Pearl), 1988-1990 AF1424-7, 2001-2003W855 (Snowden), 1988-1990 MSG227-2, 2001-2003Saginaw Gold, 1988-1990 W1355-1 (White Pearl), 2001-2003AF875-16 (Mainechip), 1989-1991 NDTX4930-5W, 2001-2003D195-24, 1989 ND2470-27 (Dakota Crisp), 1999, 2003-2004ND2008-2, 1990 A91790-13, 2002-2004Coastal Chip, 1990 MSF099-3, 2002-2004CS7232-4, 1990-1992 B1240-1, 2004Andover, 1991-1993 W1773-7, 2004Pike, 1991-1993 ND5822C-7 (Dakota Diamond), 2003-2005NY87 (Reba), 1991 W1201( Megachip), 2003-2005W887, 1991-1993 AF2211-9, 2004-2006W870, 1991-1993 MSJ461-1, 2004-2006A80559-2, 1991-1993 NY132, 2004-2006NDA2031-2, 1992-1994 MSJ316-A, 2005-2007Suncrisp, 1992-1994 W2133-1, 2005-2007B0178-34, 1992-1994 BEACON CHIPPER, 2006-2008NDO1496-1 (Ivory Crisp), 1993-1995 CO95051-7W, 2006-2008NY95, 1993 MSJ147-1, 2006-2008AF875-15, 1994-1996 W2324-1, 2006-2008 (4 Southern trials 2009)ND2417-6 (NorValley), 1994-1996 CO96141-4W, 2007-2009ND2471-8, 1994-1996 MSJ036-A (Kalkaska), 2008-2009
Table 7. USPB-SFA Chip Trial Entry Summary: 1985 - 2009Atlantic (1985-2009) and Snowden (1988-2009) as Standards
86