Embed Size (px)
Citation preview

Energy Efficiency & Renewable Energy eere.energy.gov
1
Program Name or Ancillary Text eere.energy.gov
WIND AND WATER POWER PROGRAM
1
2009 Wind Technologies Market Report
Ryan Wiser and Mark Bolinger
Lawrence Berkeley
National Laboratory
Report Summary
August 2010

WIND AND WATER POWER PROGRAM
2
Presentation Overview• Introduction to 2009 edition of
U.S. wind energy market report
• Wind installation trends
• Wind industry trends
• Price, cost, and performance trends
– Power sales prices
– Installed wind project costs
– Wind turbine transaction prices
– Wind project performance
– O&M cost trends
• Policy and market drivers
• Future outlook

WIND AND WATER POWER PROGRAM
3
2009 Wind Technologies Market Report
Purpose, Scope, and Data:
• With a focus on 2009, summarize trends in the U.S. wind power market,
including information on wind installations, industry developments, power
sales prices, project costs, performance, O&M costs, policy/market trends
• Scope primarily includes wind turbines and projects over 100 kW in size
• Data sources include AWEA, EIA, FERC, SEC, etc. (see full report)
Report Authors:
• Primary authors: Ryan Wiser and Mark Bolinger, Berkeley Lab
• Contributions from others at Berkeley Lab, Exeter Associates, NREL
Available at: http://windandwater.energy.gov/

WIND AND WATER POWER PROGRAM
4
New to the 2009 Edition of the Report
• Turbine and component imports into the U.S., and import share
• Trends in hub height and rotor diameter of installed projects
• Expanded discussion of the offshore wind energy sector
• Data on wind power curtailment in Texas and the Midwest
• Impact of the Recovery Act on the U.S. wind power industry

WIND AND WATER POWER PROGRAM
5
Installation Trends

WIND AND WATER POWER PROGRAM
0
2
4
6
8
10
12
19
81
19
82
19
83
19
84
19
85
19
86
19
87
19
88
19
89
19
90
19
91
19
92
19
93
19
94
19
95
19
96
19
97
19
98
19
99
20
00
20
01
20
02
20
03
20
04
20
05
20
06
20
07
20
08
20
09
0
6
12
18
24
30
36
Annual US Capacity (left scale)
Cumulative US Capacity (right scale)
Cu
mu
lative
Ca
pa
city (
GW
)
An
nu
al C
ap
acity (
GW
)
6
Record year for new U.S. wind power capacity:
• 10 GW of wind power added in 2009, bringing total to ~35 GW
• Nearly $21 billion in 2009 project investment
U.S. Wind Power Capacity Up >40% in 2009

WIND AND WATER POWER PROGRAM
7
Wind Power Contributed 39% of All New Generating Capacity in the U.S. in 2009
Wind was the 2nd-largest resource added for the 5th-straight year
0
10
20
30
40
50
60
70
80
2000 2001 2002 2003 2004 2005 2006 2007 2008 2009
To
tal A
nnual
Cap
acity A
dd
itio
ns (G
W)
Other non-Renewable
Coal
Gas (non-CCGT)
Gas (CCGT)
Other Renewable
Wind
Source: EIA, Ventyx, AWEA, IREC, Berkeley Lab
44% wind
39% wind
42% wind42% wind
42% wind42% wind
35% wind18% wind
12% wind
2% wind
3% wind
1% wind
4% wind
0% wind

WIND AND WATER POWER PROGRAM
8
U.S. Led World in Cumulative Capacity, But Fell to 2nd in Annual Capacity Growth
Annual Capacity
(2009, MW)
Cumulative Capacity
(end of 2009, MW)
China 13,750 U.S. 35,155
U.S. 9,994 China 25,853
Spain 2,331 Germany 25,813
Germany 1,917 Spain 18,784
India 1,172 India 10,827
Italy 1,114 Italy 4,845
France 1,104 France 4,775
U.K. 1,077 U.K. 4,340
Canada 950 Portugal 3,474
Portugal 645 Denmark 3,408
Rest of World 4,121 Rest of World 22,806
TOTAL 38,175 TOTAL 160,080
Source: BTM Consult; AWEA project database for U.S. capacity

WIND AND WATER POWER PROGRAM
9
U.S. Share of Global Wind Power Capacity: 26% of 2009 Additions, 22% of Cumulative
0
20
40
60
80
100
120
140
160
180
200
0%
10%
20%
30%
40%
50%
60%
70%
80%
90%
100%
1982
1983
1984
1985
1986
1987
1988
1989
1990
1991
1992
1993
1994
1995
1996
1997
1998
1999
2000
2001
2002
2003
2004
2005
2006
2007
2008
2009
U.S
. P
rop
ort
ion
of W
orl
dw
ide A
nn
ual G
row
th
Cumulative Non-US Capacity (right scale)
Cumulative US Capacity (right scale)
US Proportion of Annual Growth (left scale)
Cum
ula
tive C
ap
acity (G
W)

WIND AND WATER POWER PROGRAM
10
0%
2%
4%
6%
8%
10%
12%
14%
16%
18%
20%
22%
De
nm
ark
Po
rtu
ga
l
Sp
ain
Ire
lan
d
Ge
rma
ny
Gre
ece
Ne
the
rla
nd
s
UK
Ita
ly
Ind
ia
Au
str
ia
U.S
.
Sw
ed
en
Fra
nce
Au
str
alia
Ca
na
da
Tu
rke
y
Ch
ina
Bra
zil
Ja
pa
n
TO
TA
L
Approximate Wind Penetration, end of 2009
Approximate Wind Penetration, end of 2008
Approximate Wind Penetration, end of 2007
Approximate Wind Penetration, end of 2006
Pro
jecte
d W
ind
Ele
ctr
icity a
s a
Pro
po
rtio
n o
f E
lectr
icity C
on
su
mp
tio
n
U.S Lagging Other Countries in Wind As a Percentage of Electricity Consumption
Note: Figure only includes the 20 countries with the most installed
wind power capacity at the end of 2009

WIND AND WATER POWER PROGRAM
11
Geographic Spread of Wind Power Projects in the United States Is Reasonably Broad

WIND AND WATER POWER PROGRAM
12
Texas Easily Led Other States in Both Annual and Cumulative Capacity
• 14 states had >1000 MW of wind capacity at the end of 2009 (3 had >2000 MW)
• 4 states have in-state wind generation that exceeds 10% of total in-state generation (10 states exceed 5%)
Annual Capacity
(2009, MW)
Cumulative Capacity
(end of 2009, MW)
Estimated Percentage of
In-State Generation
Texas 2,292 Texas 9,410 Iowa 19.7%
Indiana 905 Iowa 3,670 South Dakota 13.3%
Iowa 879 California 2,798 North Dakota 11.9%
Oregon 754 Washington 1,908 Minnesota 10.7%
Illinois 632 Oregon 1,821 Oregon 9.0%
New York 568 Minnesota 1,810 Colorado 7.7%
Washington 542 Illinois 1,547 Kansas 7.4%
North Dakota 488 New York 1,274 Texas 6.8%
Wyoming 425 Colorado 1,246 Wyoming 6.7%
Pennsylvania 388 North Dakota 1,203 Oklahoma 5.0%
Oklahoma 299 Oklahoma 1,130 Montana 4.9%
California 281 Wyoming 1,101 Washington 4.9%
Utah 204 Indiana 1,036 New Mexico 4.6%
Kansas 199 Kansas 1,014 California 3.4%
Colorado 178 Pennsylvania 748 Maine 3.1%
Missouri 146 New Mexico 597 Idaho 3.0%
Maine 128 Wisconsin 449 Indiana 2.7%
South Dakota 126 Montana 375 New York 2.2%
Montana 104 West Virginia 330 Hawaii 2.2%
New Mexico 100 South Dakota 313 Illinois 2.1%
Rest of U.S. 358 Rest of U.S. 1,376 Rest of U.S. 0.3%
TOTAL 9,994 TOTAL 35,155 TOTAL 2.5% Source: AWEA project database, EIA, Berkeley Lab estimates

WIND AND WATER POWER PROGRAM
13
Wind Now >10% of Nine Utilities’ Sales
See full report for
the many
assumptions used
to generate the
data in this table
Total Wind Capacity
(end of 2009, MW)
Estimated Percentage of Retail Sales
(for utilities with > 100 MW of wind)
Xcel Energy 3,176 Minnkota Power Cooperative 38.0%
MidAmerican Energy 2,923 Empire District Electric Company 18.1%
Southern California Edison 1,772 Turlock Irrigation District 18.0%
American Electric Power 1,196 Otter Tail Power 14.0%
Pacific Gas & Electric 1,131 Sunflower Electric Power Corp. 13.2%
Luminant 913 Xcel Energy 11.1%
Alliant Energy 645 Austin Energy 10.3%
City Public Service of San Antonio 579 Great River Energy 10.1%
Puget Sound Energy 479 Westar 10.1%
Austin Energy 439 Western Farmers' Electric Cooperative 9.8%
First Energy 376 MidAmerican Energy 9.6%
Portland General Electric 375 Snohomish PUD 8.5%
Minnkota Power Cooperative 357 MSR Public Power Agency 8.4%
Basin Electric 352 City Public Service of San Antonio 8.4%
SDG&E 342 Public Service New Mexico 6.8%
Great River Energy 319 Cowlitz PUD 6.5%
Westar 295 WPPI Energy 6.4%
Oklahoma Gas & Electric 272 Alliant Energy 5.9%
Empire District Electric Company 255 Puget Sound Energy 5.4%
SCPPA (not including LADWP) 233 Northwestern Energy 5.3% Source: AWEA, EIA, Berkeley Lab estimates

WIND AND WATER POWER PROGRAM
14
No Offshore Projects Have Been Built in the U.S., But 13 Projects Are At a More-Advanced Permitting/Development Stage
• Three projects have signed or proposed power purchase agreements
• Cape Wind granted approval by Department of Interior in April 2010

WIND AND WATER POWER PROGRAM
15
0
50
100
150
200
250
300
350
Wind Natural Gas Coal Nuclear Solar Other
Nam
epla
te C
apacity (
GW
)
Entered Queue in 2009 Total in queue at end of 2009
Roughly 300 GW of Wind Power Capacity in Transmission Interconnection Queues
Not all of this capacity will be built….
Nearly three times as much wind power as
next-largest resource (natural gas) in queues

WIND AND WATER POWER PROGRAM
16
0
10
20
30
40
50
60
70
80
90
MISO /
Midwest
Mountain ERCOT PJM SPP Northwest California
ISO
New York
ISO
ISO-New
England
Southeast
Nam
epla
te W
ind P
ow
er
Capacity (
GW
)
Entered queue in 2009 Total in queue at end of 2009
>90% Planned for Midwest, Mountain, ERCOT, PJM, SPP, and Northwest Regions
Not all of this capacity will be built….

WIND AND WATER POWER PROGRAM
17
Market for Small Wind Turbines Continued to Grow in 2009
• Sales of small wind turbines (turbine size to 100 kW) in the U.S. equaled
20.3 MW in 2009, or $82 million
• Roughly 15% growth in annual sales (in capacity terms), relative to 2008,
yielding cumulative capacity of roughly 100 MW
Year Annual Sales of Small Wind Turbines into the United States
Number of Turbines Capacity Additions Sales Revenue
2005 4,324 3.3 MW $10 million
2006 8,329 8.6 MW $33 million
2007 9,092 9.7 MW $42 million
2008 10,386 17.4 MW $73 million
2009 9,800 20.3 MW $82 million
Source: AWEA (2010b)

WIND AND WATER POWER PROGRAM
18
Industry Trends

WIND AND WATER POWER PROGRAM
19
GE Remained the Top Turbine Vendor in the U.S. Market, But a Growing Number of Other Manufacturers Are Capturing Market Share
0%
10%
20%
30%
40%
50%
60%
70%
80%
90%
100%
2005 2006 2007 2008 2009
Tu
rbin
e M
an
ufa
ctu
rer
U.S
. M
ark
et
Sh
are
Other
Nordex
Acciona
REpower
Gamesa
Clipper
Suzlon
Mitsubishi
Siemens
Vestas
GE Wind
WIND AND WATER POWER PROGRAM
20
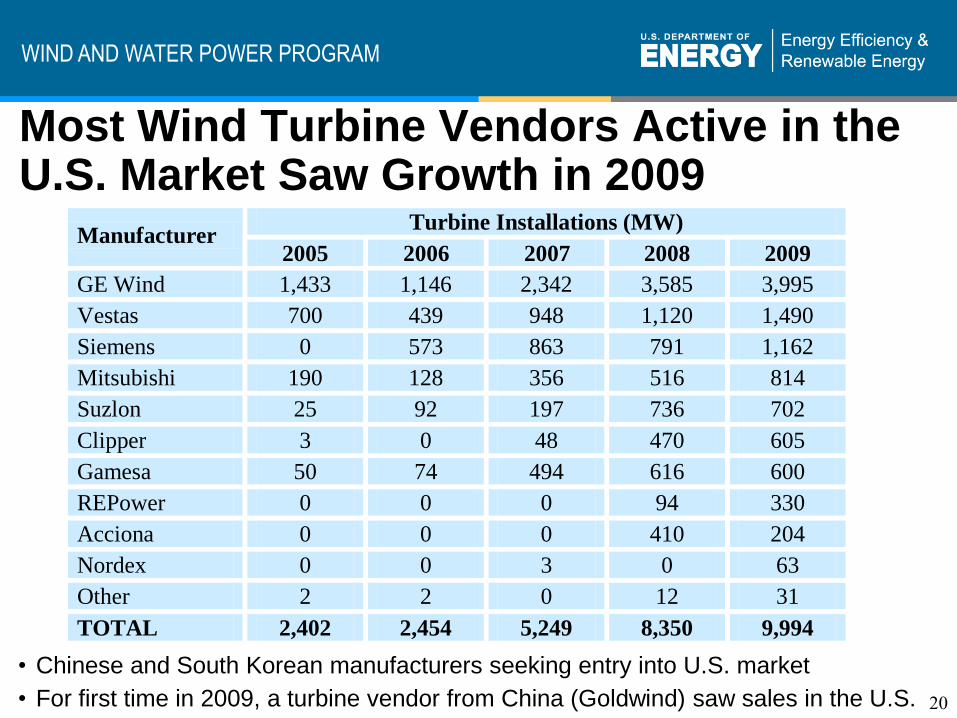
Most Wind Turbine Vendors Active in the U.S. Market Saw Growth in 2009
Turbine Installations (MW) Manufacturer
2005 2006 2007 2008 2009
GE Wind 1,433 1,146 2,342 3,585 3,995
Vestas 700 439 948 1,120 1,490
Siemens 0 573 863 791 1,162
Mitsubishi 190 128 356 516 814
Suzlon 25 92 197 736 702
Clipper 3 0 48 470 605
Gamesa 50 74 494 616 600
REPower 0 0 0 94 330
Acciona 0 0 0 410 204
Nordex 0 0 3 0 63
Other 2 2 0 12 31
TOTAL 2,402 2,454 5,249 8,350 9,994
• Chinese and South Korean manufacturers seeking entry into U.S. market
• For first time in 2009, a turbine vendor from China (Goldwind) saw sales in the U.S.

WIND AND WATER POWER PROGRAM
21
U.S. Wind Turbine Manufacturing Strong, But With Slower Growth
Note: map is not intended to be exhaustive
• AWEA estimates that the wind power sector provided roughly 85,000 full-time jobs in the U.S. at the end of 2009 (18,500 of which were in manufacturing)
• 7 of the 10 wind turbine vendors with the largest share of the U.S. market in 2009 have one or more manufacturing facilities operating in the U.S., while 2 of the remaining 3 have announced specific plans to open facilities in the future

WIND AND WATER POWER PROGRAM
0
2
4
6
8
10
12
14
16
2006 2007 2008 2009
Billio
n 2
009$
Total Turbine Equipment Cost
(Calendar Year)
Value of Selected Imports
(Customs Value, 4 month lag,
Sept - Aug)
85% of turbine cost
73% of turbine cost
48% of turbine cost
39% of turbine costImport Fraction
22
A Growing % of Equipment Used in U.S.
Projects Has Been Sourced Domestically
• U.S. is largest importer of wind equipment; 7th largest exporter
• Wind power capacity growth has outpaced import growth
See full report for the
many assumptions
used to generate the
data in this figure

WIND AND WATER POWER PROGRAM
23
Average Turbine Size Higher in 2009
25% of turbines installed in 2009 were larger than 2.0 MW, up from
19% in 2008, 16% in 2006 & 2007, and just 0.1% in 2004-05
0.71 MW
0.88 MW
1.21 MW
1.43 MW
1.60 MW1.65 MW 1.66 MW
1.74 MW
0.0
0.2
0.4
0.6
0.8
1.0
1.2
1.4
1.6
1.8
2.0
1998-99 2000-01 2002-03 2004-05 2006 2007 2008 2009
1,425 turbines 1,987 turbines 1,757 turbines 1,960 turbines 1,536 turbines 3,190 turbines 5,029 turbines 5,734 turbines
1,016 MW 1,758 MW 2,125 MW 2,803 MW 2,454 MW 5,249 MW 8,350 MW 9,994 MW
Avera
ge T
urb
ine S
ize (
MW
)

WIND AND WATER POWER PROGRAM
24
0
10
20
30
40
50
60
70
80
90
1998-99 1283 turbines
935 MW
2000-011500 turbines
1,446 MW
2002-03 2004 turbines
2,227 MW
2004-05 1807 turbines
2,680 MW
20061500 turbines
2,394 MW
2007 2922 turbines
5,001 MW
20085047 turbines
8,376 MW
20095734 turbines
9,994 MW
Ave
rag
e R
oto
r D
iam
ete
r an
d H
ub
He
igh
t (m
)
Rotor Diameter
Hub Height
Average Hub Heights and Rotor Diameters Have Increased Over Time
On average, since 1998-99, hub heights are 22 meters (39%)
higher and rotor diameters are 33 meters (69%) larger
WIND AND WATER POWER PROGRAM
25
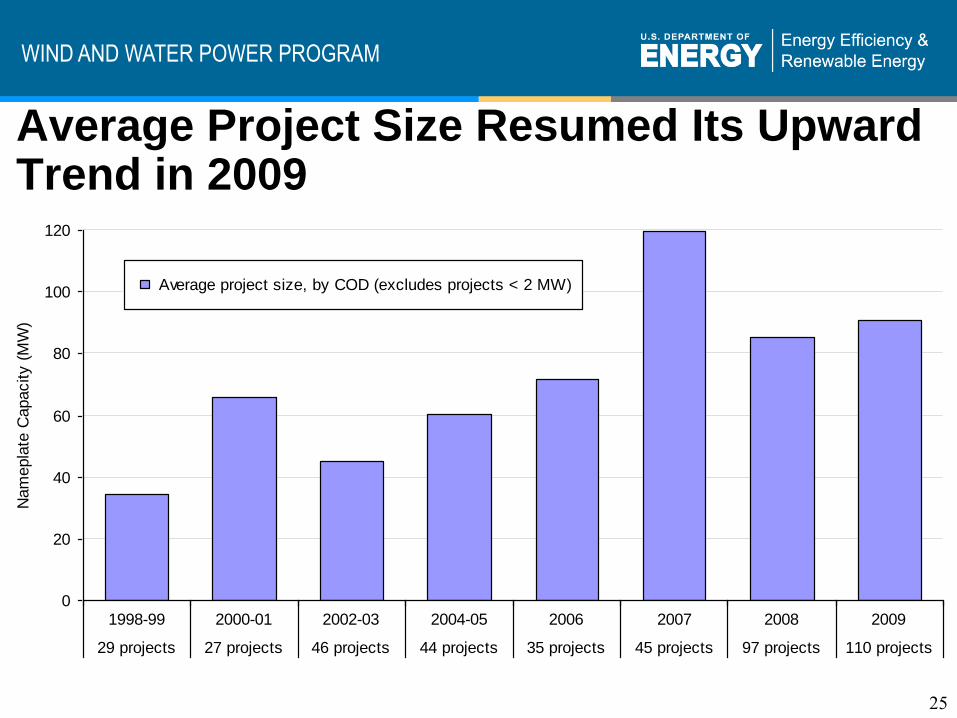
Average Project Size Resumed Its Upward Trend in 2009
0
20
40
60
80
100
120
1998-99 2000-01 2002-03 2004-05 2006 2007 2008 2009
29 projects 27 projects 46 projects 44 projects 35 projects 45 projects 97 projects 110 projects
Nam
epla
te C
apacity (
MW
)
Average project size, by COD (excludes projects < 2 MW)

WIND AND WATER POWER PROGRAM
26
Investor Transaction Type Developer Announcement Date EDF (SIIF Energies) Acquisition enXco May-02
Gamesa Investment Navitas Oct-02
AES Investment U.S. Wind Force Sep-04
PPM (Scottish Power) Acquisition Atlantic Renewable Energy Corp. Dec-04
AES Acquisition SeaWest Jan-05
Goldman Sachs Acquisition Zilkha (Horizon) Mar-05
JP Morgan Partners Investment Noble Power Mar-05
Arclight Capital Investment CPV Wind Jul-05
Diamond Castle Acquisition Catamount Oct-05
Pacific Hydro Investment Western Wind Energy Oct-05
EIF U.S. Power Fund II Investment Tierra Energy, LLC Dec-05
Airtricity Acquisition Renewable Generation Inc. Dec-05
Babcock & Brown Acquisition G3 Energy LLC Jan-06
Iberdrola Acquisition Community Energy Inc. Apr-06
Shaw/Madison Dearborn Investment UPC Wind May-06
NRG Acquisition Padoma Jun-06
CPV Wind Acquisition Disgen Jul-06
BP Investment Clipper Jul-06
BP Acquisition Greenlight Aug-06
Babcock & Brown Acquisition Superior Aug-06
Enel Investment TradeWind Sep-06
Iberdrola Acquisition Midwest Renewable Energy Corp. Oct-06
Iberdrola Acquisition PPM (Scottish Power) Dec-06
BP Acquisition Orion Energy Dec-06
Naturener Acquisition Great Plains Wind & Energy, LLC Feb-07
HSH Nordbank Investment Ridgeline Energy Feb-07
Energias de Portugal Acquisition Horizon Mar-07
Iberdrola Acquisition CPV Wind Apr-07
Duke Energy Acquisition Tierra Energy, LLC May-07
Acciona Acquisition EcoEnergy, LLC Jun-07
Babcock & Brown Acquisition Bluewater Wind Sep-07
Good Energies Investment EverPower Sep-07
E.ON AG Acquisition Airtricity North America Oct-07
Wind Energy America Acquisition Boreal Oct-07
Marubeni Investment Oak Creek Energy Systems Dec-07
NTR Investment Wind Capital Group Apr-08
Canadian Pension Plan Investment Noble Power Apr-08
ArcLight and Terra-Gen Acquisition Allco Wind Energy Jun-08
Duke Energy Acquisition Catamount Jun-08
Veolia Acquisition Ridgeline Energy Oct-08
Riverstone Holdings Acquisition Babcock & Brown Jun-09
Terra Firma Acquisition Everpower Wind Aug-09
APEX Wind Energy Acquisition BQ Energy, LLC Jun-09
Global Infrastructure Partners Investment Terra-Gen Power Holdings Nov-09
NRG Energy Acquisition Bluewater Wind Nov-09
Enel Investment Geronimo Wind Nov-09
* Select list of announced transactions; excludes joint development activity
Source: Berkeley Lab
Developer Consolidation Continued in 2009• But acquisitions and investments
still below 2006-2007 pace:
2009: 6 deals = 18 GW of wind development pipeline
2008: 5 deals = 19 GW
2007: 11 deals = 37 GW
2006: 12 deals = 34 GW
2005: 8 deals = 11 GW
2002-04: 4 deals = 4 GW
• Slackening might reflect the financial crisis, and that many of the prime targets for investment and/or acquisition had already been acquired in previous years

WIND AND WATER POWER PROGRAM
27
Treasury Cash Grant Expanded Financing Options, Buoyed the Wind Sector• Section 1603 of Recovery Act allows choice of a cash grant in lieu
of the PTC or ITC
– Reduces dependence on tax equity investors
– Enables greater use of project-level term debt instead of tax equity
• 6400 MW (>64%) of wind power capacity built in 2009 used grant
– As much as 2400 MW may not have been built in 2009 absent the grant
– Only about 7 of >60 projects that chose grant used third-party tax equity
• Efforts to extend the grant program focus on continued shortage of tax equity in the market
• Lenders (both banks and insurance companies) now back in the market, and with improving terms
• Relatively weak demand for federal loan guarantees

WIND AND WATER POWER PROGRAM
28
IPP Project Ownership Remained Dominant
• Utility ownership held steady in 2009
• Community wind market share stagnant since 2004
0
5
10
15
20
25
30
35
40
1998 1999 2000 2001 2002 2003 2004 2005 2006 2007 2008 2009
Cum
ula
tive I
nsta
lled C
apacity (
GW
)
Community
Publicly Owned Utility (POU)
Investor-Owned Utility (IOU)
Independent Power Producer (IPP)
Community:
180 MW (2%)
IPP: 8,247 MW
(83%)
IOU:
1,057 MW
(11%)
POU:
510 MW (5%)
2009 Capacity by
Owner Type

WIND AND WATER POWER PROGRAM
29
Contracted Sales to Utilities Remained the Most Common Sales Arrangement
But “merchant” plants were surprisingly (due to tight credit and
sharply lower wholesale power prices) popular in 2009
0
5
10
15
20
25
30
35
40
1998 1999 2000 2001 2002 2003 2004 2005 2006 2007 2008 2009
Cum
ula
tive I
nsta
lled C
apacity (
GW
)
On-Site
Power Marketer
Publicly Owned Utility (POU)
Merchant/Quasi-Merchant
Investor-Owned Utility (IOU)
Merchant:
3,779 MW
(38%)
IOU:
3,578 MW
(36%)
POU:
2,189 MW
(22%)
2009 Capacity by
Off-Take Category
Marketer:
399 MW (4%)
On-Site:
50 MW (0.5%)

WIND AND WATER POWER PROGRAM
30
Price, Cost, and
Performance Trends

WIND AND WATER POWER PROGRAM
31
Upward Pressure on Wind Power Prices Continued in 2009
• Berkeley Lab maintains a database of wind power sales prices; next few slides present data from that database
• Sample includes 180 projects built from 1998-2009, totaling 12,813 MW (38% of all wind capacity added in that period)
• Prices reflect the bundled price of electricity and RECs as sold by the project owner under a power purchase agreement
– Dataset excludes merchant plants and projects that sell renewable energy certificates (RECs) separately
– Prices reflect receipt of state and federal incentives (e.g., the PTC or Treasury grant); as a result, prices do not reflect wind energy generation costs -- prices would be higher were state/federal incentives not available
WIND AND WATER POWER PROGRAM
32
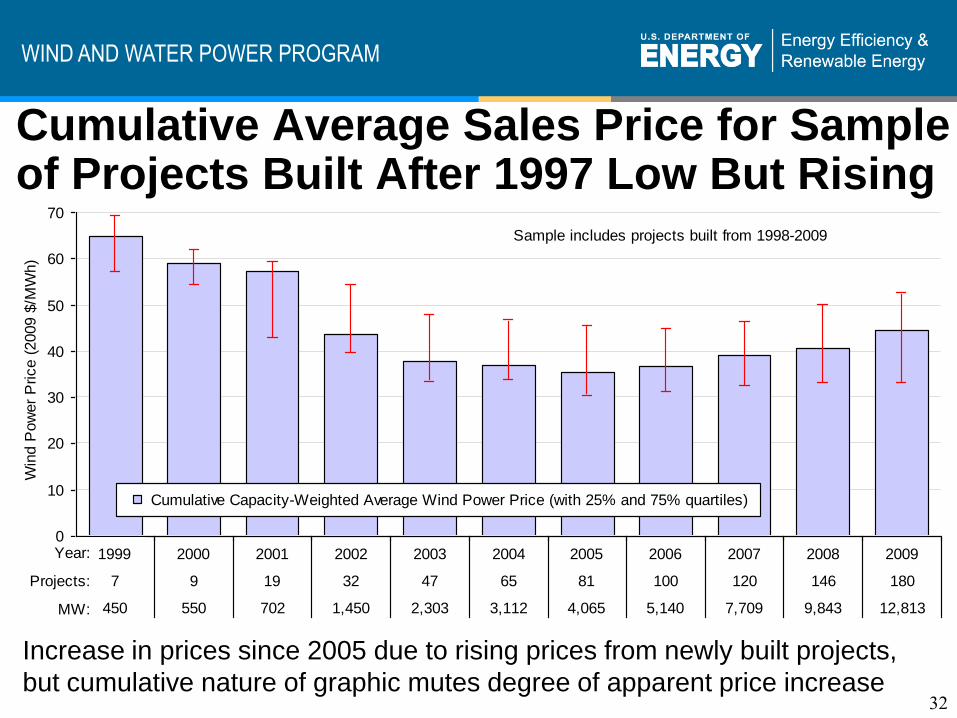
Cumulative Average Sales Price for Sample of Projects Built After 1997 Low But Rising
Increase in prices since 2005 due to rising prices from newly built projects,
but cumulative nature of graphic mutes degree of apparent price increase
0
10
20
30
40
50
60
70
1999 2000 2001 2002 2003 2004 2005 2006 2007 2008 2009
7 9 19 32 47 65 81 100 120 146 180
450 550 702 1,450 2,303 3,112 4,065 5,140 7,709 9,843 12,813
Cumulative Capacity-Weighted Average Wind Power Price (with 25% and 75% quartiles)
Win
d P
ow
er
Price (
2009 $
/MW
h)
Year:
Projects:
MW:
Sample includes projects built from 1998-2009

WIND AND WATER POWER PROGRAM
33
Binning by Commercial Operation Date Shows that Prices Have Increased Recently
Graphic shows prices in 2009 from projects built from 1998-2009
0
10
20
30
40
50
60
70
80
90
1998-99 2000-01 2002-03 2004-05 2006 2007 2008 2009
13 projects 20 projects 32 projects 21 projects 14 projects 22 projects 28 projects 30 projects
612 MW 853 MW 1,655 MW 1,269 MW 751 MW 2,938 MW 2,106 MW 2,629 MW
Capacity-Weighted Average 2009 Wind Power Price (by project vintage)
Individual Project 2009 Wind Power Price (by project vintage)
2009 W
ind P
ow
er
Price (
2009 $
/MW
h)

WIND AND WATER POWER PROGRAM
34
Regional Differences Explain Some of the Underlying Variability in Wind Sales Prices
Texas and the Heartland are lower-price regions, while the East and California
are higher-price (note: sample size is problematic in many regions)
0
10
20
30
40
50
60
70
80
90
Texas Heartland Mountain Great Lakes Northwest New England California East
3 projects 44 projects 13 projects 11 projects 11 projects 2 projects 4 projects 6 projects
320 MW 3,171 MW 1,452 MW 1,485 MW 1,281 MW 29 MW 383 MW 302 MW
Capacity-Weighted Average 2009 Wind Power Price (by region)
Individual Project 2009 Wind Power Price (by region)
Capacity-Weighted Average 2009 Wind Power Price (total U.S.)
2009 W
ind P
ow
er
Price (
2009 $
/MW
h)
Sample includes projects built from 2006-2009

WIND AND WATER POWER PROGRAM
35
Regions and Wholesale Price Hubs Used in Analysis
Mid-C
SP-15
NP-15
COB
Mead
Palo Verde
Four Corners
ERCOT West •
• •
• •
•
•
•
Cinergy Hub
•
PJM West
•
• Mass Hub
NYISO A
NYISO G
• • •
Minnesota Hub
Michigan Hub
•
Illinois Hub •
Entergy •
• NI Hub
Missouri Zone
Iowa Zone °
WAUE Interface
°
°
° DOM Zone
° Maine Zone
Northwest California Mountain Texas Heartland Great Lakes East New England Southeast

WIND AND WATER POWER PROGRAM
36
Sharp Drop in Wholesale Power Prices Challenges the Competitiveness of Wind
• Wholesale price range reflects flat block of power across 23 pricing nodes (see previous map)
• Wholesale price drop reflects lower natural gas prices, driven by weak economy and shale gas
0
10
20
30
40
50
60
70
80
90
2003 2004 2005 2006 2007 2008 2009
47 projects 65 projects 81 projects 100 projects 120 projects 146 projects 180 projects
2,303 MW 3,112 MW 4,065 MW 5,140 MW 7,709 MW 9,843 MW 12,813 MW
2009 $
/MW
h
Nationwide Wholesale Power Price Range (for a flat block of power)
Cumulative Capacity-Weighted Average Wind Power Price (with 25% and 75% quartiles)
Wind project sample includes
projects built from 1998-2009

WIND AND WATER POWER PROGRAM
37
Wind’s Struggle to Compete in 2009 Spans All Regions of the U.S.
Note: Within a region there are a range of wholesale power prices because
multiple wholesale price hubs exist in each area (see earlier map)
0
10
20
30
40
50
60
70
80
90
Texas Heartland Mountain Great Lakes Northwest New England California East Total US
3 projects 44 projects 13 projects 11 projects 11 projects 2 projects 4 projects 6 projects 94 projects
320 MW 3,171 MW 1,452 MW 1,485 MW 1,281 MW 29 MW 383 MW 302 MW 8,424 MW
Average 2009 Wholesale Power Price Range (by region)
2009 Capacity-Weighted Average Wind Power Price (by region)
Individual Project 2009 Wind Power Price (by region)
Wind project sample includes projects built from 2006-2009
2009 $
/MW
h

WIND AND WATER POWER PROGRAM
38
Renewable Energy Certificate (REC) Markets Remain Fragmented and Volatile
REC prices vary by:• market type: compliance vs. voluntary
• geographic region
• specific design of state RPS policies
$0
$20
$40
$60
$80
Ja
n-0
5
Ju
l-0
5
Ja
n-0
6
Ju
l-0
6
Ja
n-0
7
Ju
l-0
7
Ja
n-0
8
Ju
l-0
8
Ja
n-0
9
Ju
l-0
9
Ja
n-1
0
High-Price REC Markets
CT Class I DE Class I IL Wind
MA Class I ME New NH Class I
NJ Class I RI New
20
09
$/M
Wh
$0
$5
$10
$15
$20
Ja
n-0
5
Ju
l-0
5
Ja
n-0
6
Ju
l-0
6
Ja
n-0
7
Ju
l-0
7
Ja
n-0
8
Ju
l-0
8
Ja
n-0
9
Ju
l-0
9
Ja
n-1
0
Low-Price REC Markets
DC Tier 1 MD Tier 1
PA Tier 1 TX
National (Voluntary) West (Voluntary)

WIND AND WATER POWER PROGRAM
39
Wind Power Sales Prices Are Affected by Installed Project Costs...
0
10
20
30
40
50
60
70
80
90
900 1100 1300 1500 1700 1900 2100 2300 2500 2700
Installed Cost (2009 $/kW)
200
9 W
ind P
ow
er
Price (
20
09
$/M
Wh)
Sample includes 120 projects built from 1998-2009, totaling 10,519 MW
WIND AND WATER POWER PROGRAM
40
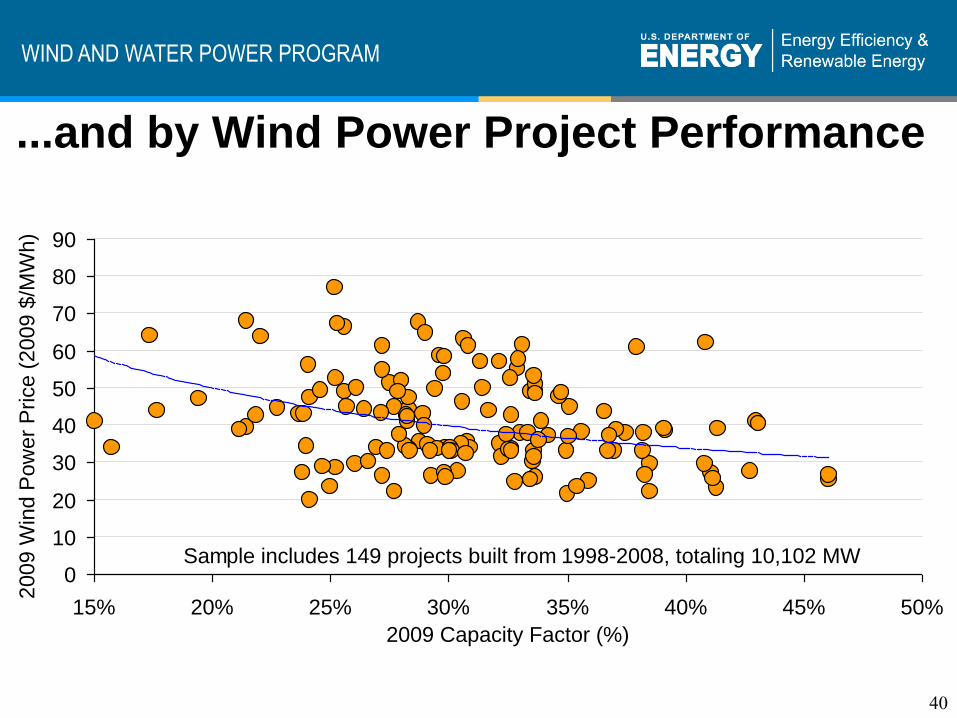
...and by Wind Power Project Performance
0
10
20
30
40
50
60
70
80
90
15% 20% 25% 30% 35% 40% 45% 50%
2009 Capacity Factor (%)
200
9 W
ind P
ow
er
Price (
20
09
$/M
Wh)
Sample includes 149 projects built from 1998-2008, totaling 10,102 MW

WIND AND WATER POWER PROGRAM
41
0
500
1,000
1,500
2,000
2,500
3,000
3,500
4,000
4,500
5,000
19
82
19
83
19
84
19
85
19
86
19
87
19
88
19
89
19
90
19
91
19
92
19
93
19
94
19
95
19
96
19
97
19
98
19
99
20
00
20
01
20
02
20
03
20
04
20
05
20
06
20
07
20
08
20
09
Insta
lled
Pro
ject
Co
st
(20
09
$/k
W)
Individual Project Cost (405 online projects totaling 28,522 MW)
Capacity-Weighted Average Project Cost
Polynomial Trend Line
Installed Project Costs Continued to Rise in 2009, After a Long Period of Decline
Rumors of cost declines abound, but have not yet been substantiated
by the data
Increase of ~$800/kW

WIND AND WATER POWER PROGRAM
42
Economies of Scale Evident At Low End of Project Size Range
0
500
1,000
1,500
2,000
2,500
3,000
3,500
4,000
4,500
≤ 5 MW 5-20 MW 20-50 MW 50-100 MW 100-200 MW >200 MW
48 MW 222 MW 888 MW 4,576 MW 10,518 MW 3,310 MW
23 projects 18 projects 24 projects 59 projects 75 projects 13 projects
Insta
lled P
roje
ct
Cost
(2009 $
/kW
)
Average Project Cost
Individual Project Cost
Sample includes projects built in 2007, 2008, and 2009
Cost trend essentially flat above 5-20 MW project size range

WIND AND WATER POWER PROGRAM
43
Some Regional Differences in Wind Power Project Costs Are Apparent
No clear low-cost leaders, but California & New England highest-cost
0
500
1,000
1,500
2,000
2,500
3,000
3,500
Texas Mountain Heartland Great Lakes Northwest East California New England
43 projects 19 projects 60 projects 21 projects 28 projects 19 projects 6 projects 16 projects
5,361 MW 2,052 MW 5,169 MW 2,575 MW 2,371 MW 1,539 MW 326 MW 169 MW
Insta
lled P
roje
ct
Cost
(2009 $
/kW
)
Capacity-Weighted Average Project Cost
Individual Project Cost
Capacity-Weighted Average Cost, Total U.S.
Sample includes projects built in 2007, 2008, and 2009

WIND AND WATER POWER PROGRAM
44
0
200
400
600
800
1,000
1,200
1,400
1,600
1,800
2,000
Jan-97 Jan-98 Jan-99 Jan-00 Jan-01 Jan-02 Jan-03 Jan-04 Jan-05 Jan-06 Jan-07 Jan-08 Jan-09 Jan-10
Announcement Date
Orders <100 MW
Orders from 100 - 300 MW
Orders >300 MW
Polynomial Trend Line
Tu
rbin
e T
ran
sa
ctio
n P
rice
(2
00
9 $
/kW
)
Project Cost Increases Are a Function of Wind Turbine Prices
Relative dearth of data since 2008 makes it hard to discern any recent trend, though turbine prices are rumored to be lower
Figure depicts reported transaction prices from 69 U.S. wind turbine orders totaling 22.9 GW

WIND AND WATER POWER PROGRAM
45
Average Capacity Factors Have Improved Over Time, But Leveled Off in Recent Years
• General improvement reflects increase in hub height and rotor diameter (see slide 24)
• Inter-annual wind resource variation also plays a role: 2009 was a bad wind year
• Curtailment was another major factor in lower 2009 capacity factor (see slide 47)
0%
5%
10%
15%
20%
25%
30%
35%
1999 2000 2001 2002 2003 2004 2005 2006 2007 2008 2009
11 17 77 124 137 163 190 217 258 299 242
701 1,158 2,199 3,955 4,458 5,784 6,467 9,289 11,253 16,068 22,346
Capacity
Facto
r
Year:
Projects:
MW:

WIND AND WATER POWER PROGRAM
46
Binning by Project Vintage and Focusing on 2009 Performance Tells A Similar Story
Projects installed since 2005 have bucked the trend of generally
increasing capacity factors among more-recently built projects
0%
5%
10%
15%
20%
25%
30%
35%
40%
45%
50%
Pre-1998 1998-99 2000-01 2002-03 2004-05 2006 2007 2008
10 projects 21 projects 28 projects 36 projects 32 projects 24 projects 36 projects 73 projects
674 MW 746 MW 1,571 MW 1,872 MW 2,691 MW 2,180 MW 4,505 MW 8,127 MW
Capacity-Weighted Average 2009 Capacity Factor (by project vintage)
Individual Project 2009 Capacity Factor (by project vintage)
2009 C
apacity F
acto
r (b
y p
roje
ct
vin
tage) Sample includes 260 projects totaling 22.37 GW

WIND AND WATER POWER PROGRAM
47
Curtailment a Major Issue in Texas (ERCOT)
If there had been no curtailment in 2009, ERCOT’s fleet-wide wind power project capacity factor would have been 31.1% (rather than 25.8%), raising the national average from 30% to 32%
0
500
1,000
1,500
2,000
2,500
3,000
Jan
Feb
Mar
Apr
May
Jun
Jul
Aug
Sep
Oct
Nov
Dec
Jan
Feb
Mar
Apr
May
Jun
Jul
Aug
Sep
Oct
Nov
Dec
Jan
Feb
Mar
Apr
May
Jun
Jul
Aug
Sep
Oct
Nov
Dec
2007 2008 2009
GW
h
Curtailed Wind Generation
Actual Wind Generation
17% of Potential
Wind Generation
Curtailed in 20098% of Potential
Wind Generation
Curtailed in 2008
1% of Potential
Wind Generation
Curtailed in 2007

WIND AND WATER POWER PROGRAM
48
Regional Performance Differences Are Apparent
Average capacity factors highest in Hawaii and the Mountain region, lowest in Texas (again, due largely to curtailment) and the East
0%
5%
10%
15%
20%
25%
30%
35%
40%
45%
50%
Texas East Great Lakes Northwest New England California Heartland Mountain Hawaii
30 projects 13 projects 13 projects 16 projects 6 projects 7 projects 65 projects 14 projects 1 project
5,398 MW 1,057 MW 1,446 MW 1,930 MW 73 MW 387 MW 5,650 MW 1,533 MW 30 MW
Capacity-Weighted Average 2009 Capacity Factor (by region)
Individual Project 2009 Capacity Factor (by region)
Capacity-Weighted Average 2009 Capacity Factor (total U.S.)
2009 C
apacity F
acto
r (b
y r
egio
n)
Sample includes 165 projects built from 2004-2008 and totaling 17.5 GW

WIND AND WATER POWER PROGRAM
49
Average O&M Costs from 2000-2009 Are Affected By Year of Installation
Capacity-weighted average 2000-09 O&M costs for projects built in 1980s equal $32/MWh, dropping to $22/MWh for projects built in 1990s, and to $9/MWh for projects built in 2000s
Note: Sample is limited, and consists of 115 wind power projects totaling 6,097 MW; few projects in sample have complete records of O&M costs from 2000-09
0
10
20
30
40
50
60
70
19
80
19
81
19
82
19
83
19
84
19
85
19
86
19
87
19
88
19
89
19
90
19
91
19
92
19
93
19
94
19
95
19
96
19
97
19
98
19
99
20
00
20
01
20
02
20
03
20
04
20
05
20
06
20
07
20
08
Last Year of Equipment Installation
Projects with no 2009 O&M data
Projects with 2009 O&M data
Polynomial Trend Line (all projects)
Ave
rag
e A
nn
ua
l O&
M C
ost 2
00
0-2
00
9
(20
09
$/M
Wh
)

WIND AND WATER POWER PROGRAM
0
10
20
30
40
50
60
<5 MW 5-20 MW 20-50 MW >50 MW
Project Size (MW)
Pre-2000 (Average +/- Std. Dev.)
2000-2002 (Average +/- Std. Dev.)
2003-2005 (Average +/- Std. Dev.)
2006-2008 (Average +/- Std. Dev.)
Last Year of Equipment Installation:
n=11n=9n=22 n=6 n=27 n=7n=3 n=14n=4Ave
rag
e A
nn
ua
l O&
M C
ost 2
00
0-2
00
9
(20
09
$/M
Wh
)
n=2 n=4
50
0
5
10
15
20
25
30
35
40
1 2 3 4 5 6 7 8
Number of Years Since the Last Year of Equipment Installation
Pre-2000
2000-2002
2003-2005
2006-2008
Last Year of Equipment Installation (projects >5 MW only):
n=
15
Ave
rag
e A
nn
ua
l O&
M C
ost 2
00
0-2
00
9(2
00
9 $
/MW
h)
n=
3
n=
20
n=
18
n=
6
n=
4
n=
7
n=
8
n=
13
n=
15
n=
4
n=
6
n=
15
n=
6
n=
3
n=
3
n=
4
n=
2
O&M Costs Appear to Increase with Project Age, Decrease with Project Size
Note: Sample size is extremely limited

WIND AND WATER POWER PROGRAM
51
Policy and Market Drivers

WIND AND WATER POWER PROGRAM
52
Federal Policy Is Now More Favorable Than At Any Other Time in the Past Decade
• The Recovery Act established a number of federal policies to support wind
• Federal PTC currently in place through 2012 (longest extension in history)
• Projects can elect a 30% ITC or a 30% cash grant in lieu of the PTC
• Subsidized financing double-dipping penalty removed for ITC / cash grant
• $2.2 billion of new Clean Renewable Energy Bonds allocated
• Expansion and enhancement of Federal loan guarantee program
• $2.3 billion in advanced energy manufacturing tax credits awarded
• Increased R&D funding
• Increased funding for USDA’s Rural Energy for America Program (REAP)
• Efforts to pass an RPS and carbon regulation at the Federal level continue
• But… major policies expire after 2012, leaving uncertainty for future years

WIND AND WATER POWER PROGRAM
53
State Policies Help Direct the Location and Amount of Wind Power Development
• One new state (KS) established a mandatory RPS in 2009 (total is now 29 states and Washington, D.C.)
• State renewable funds, tax incentives, utility resource planning, voluntary green power, and growing interest in carbon regulation all also played a role in 2009
Non-Binding Goal
Source: Berkeley Lab
WI: 10% by 2015
NV: 25% by 2025
TX: 5,880 MW by 2015
PA: 8.5% by 2020
NJ: 22.5% by 2021CT: 23% by 2020
MA: 11.1% by 2009 +1%/yr
ME: 40% by 2017
NM: 20% by 2020 (IOUs)
10% by 2020 (co-ops)
CA: 20% by 2010
MN: 25% by 2025
Xcel: 30% by 2020
IA: 105 MW by 1999
MD: 20% by 2022
RI: 16% by 2019
HI: 40% by 2030
AZ: 15% by 2025
NY: 30% by 2015
CO: 30% by 2020 (IOUs)
10% by 2020 (co-ops and munis)
MT: 15% by 2015
DE: 20% by 2019
DC: 20% by 2020
WA: 15% by 2020
NH: 23.8% by 2025
OR: 25% by 2025 (large utilities)
5-10% by 2025 (smaller utilities)
NC: 12.5% by 2021 (IOUs)
10% by 2018 (co-ops and munis)
IL: 25% by 2025
Mandatory RPS
VT: 20% by 2017ND: 10% by 2015
VA: 15% by 2025MO: 15% by 2021
OH: 12.5% by 2024
SD: 10% by 2015
UT: 20% by 2025
MI: 10% by 2015
KS: 20% of peak
demand by 2020
OK: 15% by 2015
AK: 50% by 2025

WIND AND WATER POWER PROGRAM
54
Despite Progress on Overcoming Transmission Barriers, Constraints Remain
• Cost allocation continues to be a major issue at FERC and among
the ISOs/RTOs
• The DOE, states, grid operators, and regional organizations
continue to take proactive steps to encourage transmission
investment to improve access to renewable resources
• A variety of efforts to proactively plan for transmission, often through
analyses of state and regional renewable energy zones, also
continued in 2009
• Progress was made in 2009 on some transmission projects that are
designed, in part, to support wind power – e.g., Tehachapi in
California, and NextEra’s 200-mile line in Texas

WIND AND WATER POWER PROGRAM
55
Integration Cost ($/MWh)
Year Study
Wind
Capacity
Penetration Regulation Load
Following Unit
Commit. Gas
Supply TOTAL
2003 Xcel-UWIG 3.5% 0 0.41 1.44 - 1.85
2003 We Energies 29% 1.02 0.15 1.75 - 2.92
2004 Xcel-MNDOC 15% 0.23 - 4.37 - 4.60
2005 PacifiCorp-2004 11% 0 1.48 3.16 - 4.64
2006 Calif. (multi-year)* 4% 0.45 trace trace - 0.45
2006 Xcel-PSCo 15% 0.20 - 3.32 1.45 4.97
2006 MN-MISO** 31% - - - - 4.41
2007 Puget Sound Energy 12% - - - - 6.94
2007 Arizona Pub. Service 15% 0.37 2.65 1.06 - 4.08
2007 Avista Utilities 30% 1.43 4.40 3.00 - 8.84
2007 Idaho Power 20% - - - - 7.92
2007 PacifiCorp-2007 18% - 1.10 4.00 - 5.10
2008 Xcel-PSCo*** 20% - - - - 8.56
2009 Bonneville (BPA)+
36% 0.22 1.14 - - 5.70
2010 EWITS++ 48% - - 1.61 - 4.54
2010 Nebraska+++
63% - - - - 1.75
* Regulation costs represent 3-year average.
** Highest over 3-year evaluation period.
*** This integration cost reflects a $10/MMBtu natural gas price scenario. This cost is much higher than the
integration cost calculated for Xcel-PSCo in 2006, in large measure due to the higher natural gas price: had the gas
price from the 2006 study been used in the 2008 study, the integration cost would drop to $5.13/MWh.
+ Costs in $/MWh assume 31% capacity factor. Aside from regulation and following reserves, the costs of BPA’s
imbalance reserves are $4.33/MWh.
++ The unit commitment costs listed in EWITS are the cost of day-ahead wind forecast error; the remaining
integration costs included in the total are for shorter term variable reserves that account for regulation and short-term
forecast errors (energy imbalance).
+++ These integration costs only capture regulating reserves and day-ahead forecast error. A sensitivity case in this
study shows that integration costs increase if the differences between the actual hourly deliveries of wind energy are
compared to daily flat block of power. The increased costs are shown in Figure 39.
Sources: Brooks et al. (2003) [Xcel-UWIG]; Electrotek Concepts, Inc. (2003) [We Energies]; EnerNex Corp. and
Wind Logics, Inc. (2004) [Xcel-MNDOC]; PacifiCorp (2005) [Pacificorp-2004]; Shiu et al. (2006) [Calif. (multi-
year)]; EnerNex Corp. (2006) [Xcel-PSCo]; EnerNex Corp. and Windlogics Inc. (2006) [MN-MISO]; Puget Sound
Energy (2007) [Puget Sound Energy]; Acker (2007) [Arizona Pub. Service]; EnerNex Corp. (2007) [Avista
Utilities]; EnerNex Corp. and Idaho Power Co. (2007) [Idaho Power]; PacifiCorp (2007) [PacifiCorp-2007];
EnerNex Corp. (2008) [Xcel-PSCo]; BPA (2009) [Bonneville]; EnerNex Corp (2010) [EWITS]; EnerNex et al.
(2010) [Nebraska]
Studies Find that the Cost of Integrating Wind into Power Systems Is Manageable
• Wind integration costs are < $10/MWh for capacity penetrations of up to or exceeding 40%
• Regulation impacts are small, load-following and unit commitment larger
• Larger balancing areas, intra-hour scheduling and use of wind energy forecasts can ease integration challenges, and grid operators are increasingly relying on these strategies

WIND AND WATER POWER PROGRAM
56
Studies Find that the Cost of Integrating Wind Rises with Greater Wind Penetration
$0
$1
$2
$3
$4
$5
$6
$7
$8
$9
$10
0% 10% 20% 30% 40% 50% 60% 70%
Inte
gra
tio
n C
ost ($
/MW
h)
Wind Penetration (Capacity Basis)
Arizona Public Service
Avista Utilities
BPA
California RPS
EWITS
Idaho Power
MN-MISO
Nebraska
Pacificorp-2004
Pacificorp-2007
Puget Sound Energy
We Energies
Xcel-MNDOC
Xcel-PSCo-2006
Xcel-PSCo-2008
Xcel-UWIG
Nebraska with Additional Cost of Hourly Wind to Energy-equivalent
Daily Flat Block of Power
Xcel-PSCo-2008 at 2006 Gas Prices

WIND AND WATER POWER PROGRAM
57
Future Outlook

WIND AND WATER POWER PROGRAM
58
Forecasts Predict Slower 2010, with Resurgence in 2011 and 2012• 2010 expected to be a slower year, due to reduced demand for wind (driven
by weak economy and low wholesale prices); 2009 buoyed by projects planned for completion in 2008 but carried over as result of PTC extension
• Predictions for 2010 range from 5,500 MW to 8,000 MW; forecasts predict a market resurgence in 2011-2012
• U.S. expected to retain 2nd-largest market status, after China, from 2010-12
• Beyond 2012, federal policy is uncertain, complicating projections
Source 2010 2011 2012 Cumulative Additions
2010-2012
EIA 7,310 10,200 10,330 27,840
BTM 8,000 10,000 15,000 33,000
IHS EER 7,130 9,830 9,340 26,300
Bloomberg NEF 7,390 8,535 8,610 24,535
Macquarie 7,500 8,100 8,700 24,300
UBS 6,950 9,380 10,780 27,110
AWEA 5,500-7,500 -- -- --

WIND AND WATER POWER PROGRAM
59
Uncertainties in Near-Term Market Growth Reflect Conflicting Trends
Stronger Growth
• Stronger federal and state policy support than at any point in last decade
• Possible further federal policy support through extension of Recovery Act programs, RPS, climate, and/or transmission policy
• Falling wind turbine prices may improve comparative economics of wind energy
Weaker Growth
• Treasury grant eligibility expires at end of 2010, but tax equity market not fully recovered
• Natural gas and wholesale power prices / expectations have plummeted
• Softer demand from state RPS markets in near term
• Inadequate transmission infrastructure beginning to constrain new builds
• Increased competition from other renewable energy sources

WIND AND WATER POWER PROGRAM
60
U.S. Is on a Trajectory that May Lead to 20% of Electricity Coming from WindBut ramping up further to ~16 GW/year and maintaining that pace for a decade is an enormous challenge, and is far from pre-determined
0
2
4
6
8
10
12
14
16
18
2006
2007
2008
2009
2010
2011
2012
2013
2014
2015
2016
2017
2018
2019
2020
2021
2022
2023
2024
2025
2026
2027
2028
2029
2030
0
35
70
105
140
175
210
245
280
315
Deployment Path in 20% Wind Report (annual)
Actual Wind Installations (annual)
Deployment Path in 20% Wind Report (cumulative)
Annual C
apacity (
GW
)
range of annual projections
Cum
ula
tive C
apacity (
GW
)

WIND AND WATER POWER PROGRAM
61
For More Information...
See full report for additional findings, a discussion of the sources of data used, etc.
• http://windandwater.energy.gov/
To contact the primary authors• Ryan Wiser, Lawrence Berkeley National Laboratory
510-486-5474, [email protected]
• Mark Bolinger, Lawrence Berkeley National Laboratory 603-795-4937, [email protected]
To contact the U.S. Department of Energy’s Wind Program• Jacques Beaudry-Losique, [email protected]
• Jim Ahlgrimm, [email protected]