Embed Size (px)
Citation preview
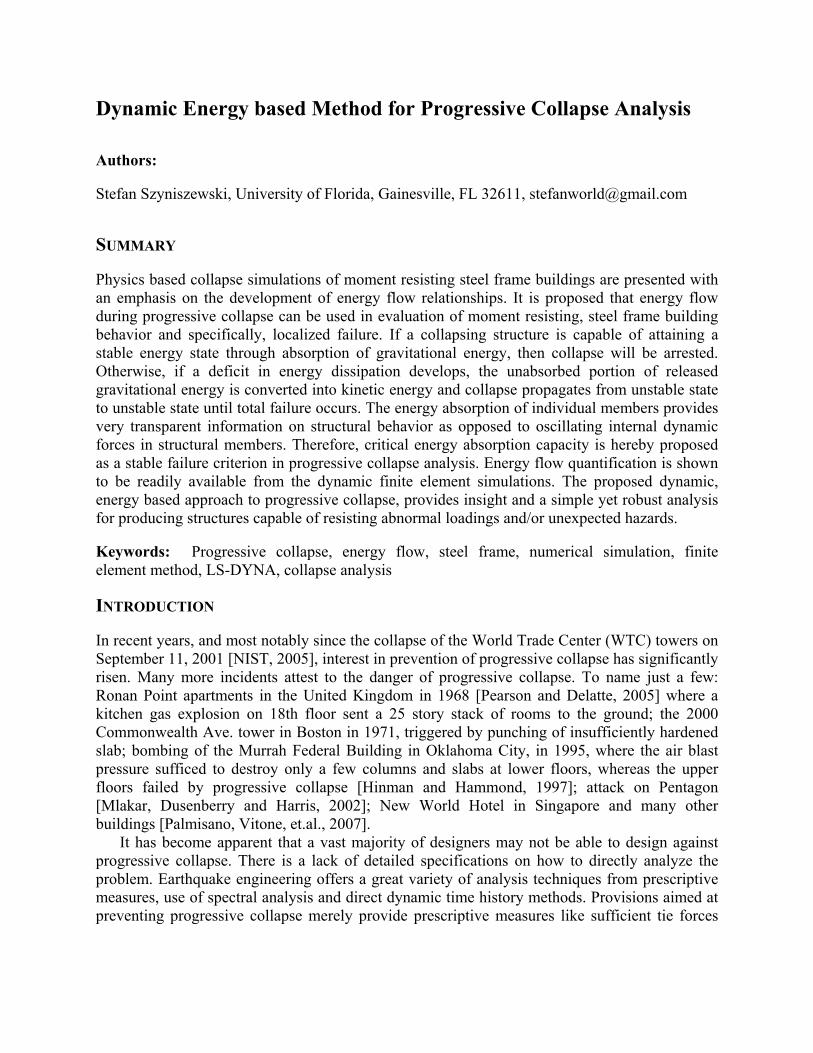
Dynamic Energy based Method for Progressive Collapse Analysis Authors: Stefan Szyniszewski, University of Florida, Gainesville, FL 32611, [email protected] SUMMARY Physics based collapse simulations of moment resisting steel frame buildings are presented with an emphasis on the development of energy flow relationships. It is proposed that energy flow during progressive collapse can be used in evaluation of moment resisting, steel frame building behavior and specifically, localized failure. If a collapsing structure is capable of attaining a stable energy state through absorption of gravitational energy, then collapse will be arrested. Otherwise, if a deficit in energy dissipation develops, the unabsorbed portion of released gravitational energy is converted into kinetic energy and collapse propagates from unstable state to unstable state until total failure occurs. The energy absorption of individual members provides very transparent information on structural behavior as opposed to oscillating internal dynamic forces in structural members. Therefore, critical energy absorption capacity is hereby proposed as a stable failure criterion in progressive collapse analysis. Energy flow quantification is shown to be readily available from the dynamic finite element simulations. The proposed dynamic, energy based approach to progressive collapse, provides insight and a simple yet robust analysis for producing structures capable of resisting abnormal loadings and/or unexpected hazards. Keywords: Progressive collapse, energy flow, steel frame, numerical simulation, finite element method, LS-DYNA, collapse analysis INTRODUCTION In recent years, and most notably since the collapse of the World Trade Center (WTC) towers on September 11, 2001 [NIST, 2005], interest in prevention of progressive collapse has significantly risen. Many more incidents attest to the danger of progressive collapse. To name just a few: Ronan Point apartments in the United Kingdom in 1968 [Pearson and Delatte, 2005] where a kitchen gas explosion on 18th floor sent a 25 story stack of rooms to the ground; the 2000 Commonwealth Ave. tower in Boston in 1971, triggered by punching of insufficiently hardened slab; bombing of the Murrah Federal Building in Oklahoma City, in 1995, where the air blast pressure sufficed to destroy only a few columns and slabs at lower floors, whereas the upper floors failed by progressive collapse [Hinman and Hammond, 1997]; attack on Pentagon [Mlakar, Dusenberry and Harris, 2002]; New World Hotel in Singapore and many other buildings [Palmisano, Vitone, et.al., 2007].
It has become apparent that a vast majority of designers may not be able to design against progressive collapse. There is a lack of detailed specifications on how to directly analyze the problem. Earthquake engineering offers a great variety of analysis techniques from prescriptive measures, use of spectral analysis and direct dynamic time history methods. Provisions aimed at preventing progressive collapse merely provide prescriptive measures like sufficient tie forces

and urge for maximum continuity and ductility, giving different level of details depending on a country [Elingwood and Dusenberry, 2005].
Designers, who recourse to direct analysis of progressive collapse potential, need to use basic engineering principles to propose solutions beyond the current recommendation levels. This study explored the energy flow in a building during collapse propagation. Internal energy flow and energy based demand capacity ratios enabled rational analysis of a building safety. SELECTED STRUCTURE A typical three story Modified Boston Building Frame presented by Gupta and Krawinkler [2000] was selected for the analysis. Since the objective was to explore the role of energy flow and not to focus on behavior of a specific building, a uniform selection of steel sections was used to produce a realistic yet simple, generic building. The framing plan of the analyzed structures is shown in Figure 1. Dead and live loads from slabs were transferred to W18x35 beams placed on W21x68 girders. Girders in turn were attached to W14x74 columns (designation of steel beams according to [AISC, 2002]). Steel section W14x74 was used through three stories without splices and variation in shape selection. Design dimensions were converted and rounded up from the US customary units to the SI units. Each story was 4 [m] high. Composite slabs of 150 [mm] thicknesses were proposed. This deck system serves both as the temporary support to concrete placed on it, and as a composite element to resist imposed loads. The composite slab consisted of steel re-entrant profiles of 50 [mm] depth and concrete layer reinforced with steel mesh.
FIGURE 1 - SELECTED STRUCTURE MODELING The finite element code, LS-DYNA [Hallquist, 2006], was employed to model structural response to abnormal loading. A typical stress-strain relation of A-36 steel, as reported by [Salmon and Johnson, 1990], was employed in the models (Figure 2). Columns were modeled as
9.2
[m]
w18
x35
w18
x35
w21x68w21x68
9.2 [m]
1
2
3
4
A B C D E
w18
x35
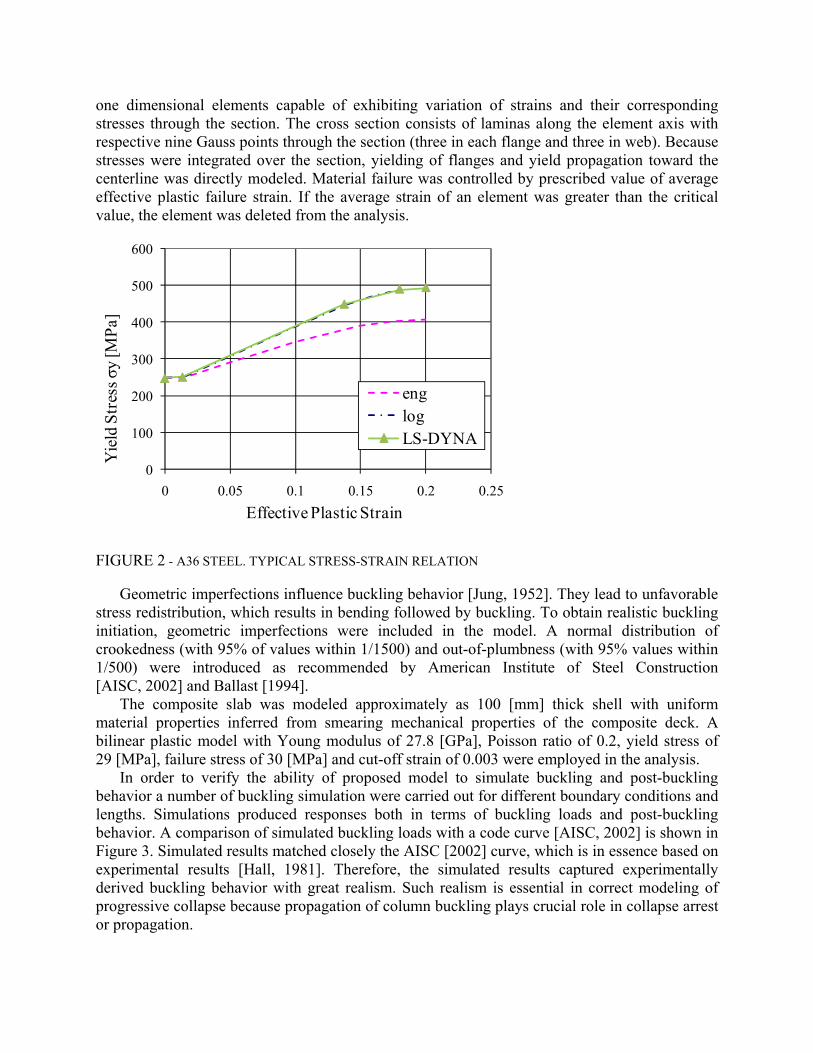
one dimensional elements capable of exhibiting variation of strains and their corresponding stresses through the section. The cross section consists of laminas along the element axis with respective nine Gauss points through the section (three in each flange and three in web). Because stresses were integrated over the section, yielding of flanges and yield propagation toward the centerline was directly modeled. Material failure was controlled by prescribed value of average effective plastic failure strain. If the average strain of an element was greater than the critical value, the element was deleted from the analysis.
FIGURE 2 - A36 STEEL. TYPICAL STRESS-STRAIN RELATION
Geometric imperfections influence buckling behavior [Jung, 1952]. They lead to unfavorable stress redistribution, which results in bending followed by buckling. To obtain realistic buckling initiation, geometric imperfections were included in the model. A normal distribution of crookedness (with 95% of values within 1/1500) and out-of-plumbness (with 95% values within 1/500) were introduced as recommended by American Institute of Steel Construction [AISC, 2002] and Ballast [1994].
The composite slab was modeled approximately as 100 [mm] thick shell with uniform material properties inferred from smearing mechanical properties of the composite deck. A bilinear plastic model with Young modulus of 27.8 [GPa], Poisson ratio of 0.2, yield stress of 29 [MPa], failure stress of 30 [MPa] and cut-off strain of 0.003 were employed in the analysis.
In order to verify the ability of proposed model to simulate buckling and post-buckling behavior a number of buckling simulation were carried out for different boundary conditions and lengths. Simulations produced responses both in terms of buckling loads and post-buckling behavior. A comparison of simulated buckling loads with a code curve [AISC, 2002] is shown in Figure 3. Simulated results matched closely the AISC [2002] curve, which is in essence based on experimental results [Hall, 1981]. Therefore, the simulated results captured experimentally derived buckling behavior with great realism. Such realism is essential in correct modeling of progressive collapse because propagation of column buckling plays crucial role in collapse arrest or propagation.
0
100
200
300
400
500
600
0 0.05 0.1 0.15 0.2 0.25
Yie
ld S
tres
s σy
[MPa
]
Effective Plastic Strain
englogLS-DYNA
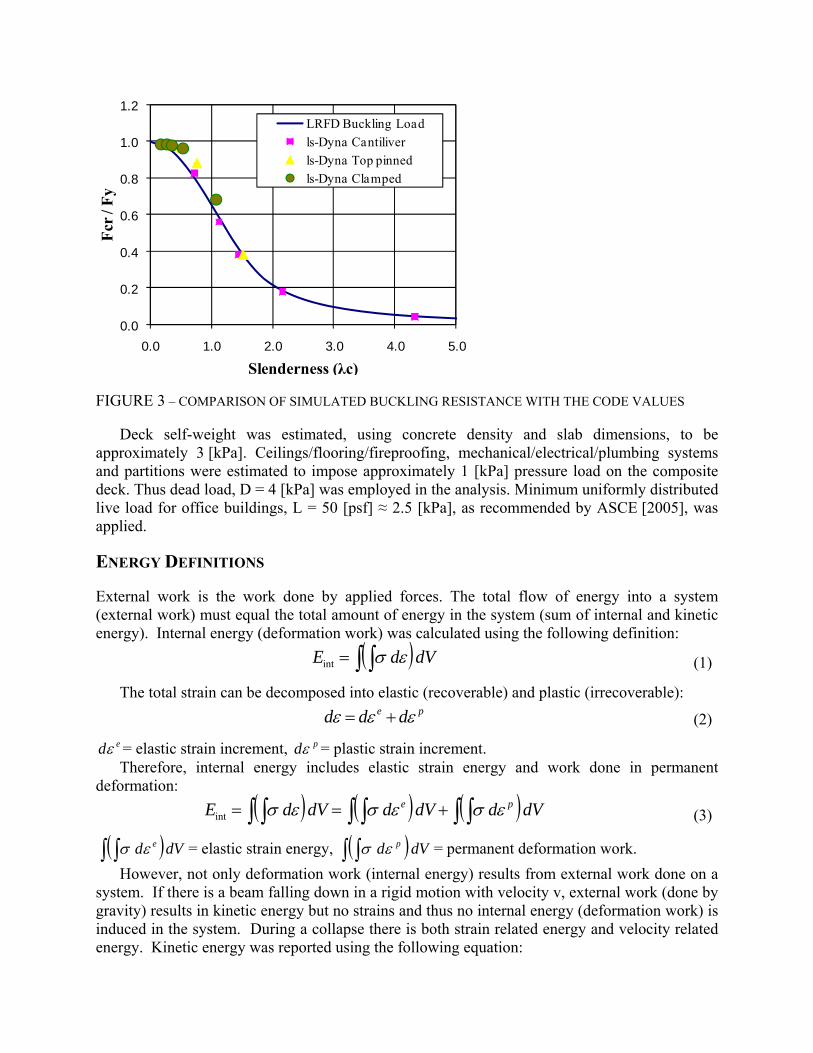
FIGURE 3 – COMPARISON OF SIMULATED BUCKLING RESISTANCE WITH THE CODE VALUES
Deck self-weight was estimated, using concrete density and slab dimensions, to be approximately 3 [kPa]. Ceilings/flooring/fireproofing, mechanical/electrical/plumbing systems and partitions were estimated to impose approximately 1 [kPa] pressure load on the composite deck. Thus dead load, D = 4 [kPa] was employed in the analysis. Minimum uniformly distributed live load for office buildings, L = 50 [psf] ≈ 2.5 [kPa], as recommended by ASCE [2005], was applied. ENERGY DEFINITIONS External work is the work done by applied forces. The total flow of energy into a system (external work) must equal the total amount of energy in the system (sum of internal and kinetic energy). Internal energy (deformation work) was calculated using the following definition:
( )dVdE ∫ ∫= εσint (1)
The total strain can be decomposed into elastic (recoverable) and plastic (irrecoverable): pe ddd εεε += (2)
edε = elastic strain increment, pdε = plastic strain increment. Therefore, internal energy includes elastic strain energy and work done in permanent
deformation: ( ) ( ) ( )dVddVddVdE pe ∫ ∫∫ ∫∫ ∫ +== εσεσεσint (3)
( )dVd e∫ ∫ εσ = elastic strain energy, ( )dVd p∫ ∫ εσ = permanent deformation work. However, not only deformation work (internal energy) results from external work done on a
system. If there is a beam falling down in a rigid motion with velocity v, external work (done by gravity) results in kinetic energy but no strains and thus no internal energy (deformation work) is induced in the system. During a collapse there is both strain related energy and velocity related energy. Kinetic energy was reported using the following equation:
0.0
0.2
0.4
0.6
0.8
1.0
1.2
0.0 1.0 2.0 3.0 4.0 5.0
Fcr /
Fy
Slenderness (λc)
LRFD Buckling Loadls-Dyna Cantiliverls-Dyna Top pinnedls-Dyna Clamped
dVvEkin ∫= 2
21 ρ (4)
ρ = mass density, v = particle velocity SINGLE COLUMN ENERGY CHARACTERISTICS An energy based global stability criterion is established in this section. Column buckling does not always lead to column failure and collapse propagation. The internal energy (deformation work) in the post-buckling phase can reach significant values because columns retain residual resistance after buckling. Although buckling of a single column reduces internal load carrying capacity, it does not automatically indicate the onset of building collapse. Buckling is a necessary, but not sufficient, condition to trigger the progressive collapse.
A sufficient, energetic collapse trigger criterion is proposed and verified herein. Figure 4 depicts the parallel between post-buckling, residual column resistance in the displacement controlled experiment and the internal energy of the column. Since displacements were controlled, no kinetic energy was induced.
Should the permanent column load be at e.g. 80% of its buckling load, significantly more than buckling work has to be done on the column before it irreversibly loses capacity to carry the unending load. In other words, transient dynamic effects can cause temporary overloading and result in internal energy (deformation work) increase of the column. After certain work (failure limit) is done on the column, there is not enough residual capacity to support the permanent load. In the post buckling phase, loss of load carrying capacity is irreversible to the point that no possibility remains for the column to ever support the permanent load. Such an energetic state has to trigger localized column failure.
If for the given load, critical energy is exceeded, the column has irreversibly lost the capacity necessary to support the sustained load and will certainly fail. It should be noted that permanent load can exceed the tributary area load from the preloading phase, as the excess load from the removed columns has to be supported by the adjacent columns, if collapse is to be arrested. Thus the column load used for the critical energy estimate shall be increased to account for the loss of the columns.
The energy buckling limit was proposed as a necessary condition to initiate the collapse (but it is not a sufficient). The column failure energy was introduced and verified as the sufficient collapse criterion. A buckled column must be able to carry permanent load (slab weight, etc.) after the transient effects pass. However, should an extensive amount of work be done on the column, its load carrying capacity will be irreversibly reduced below the value of the permanent load. Exceeding this energy threshold for the axial forces caused by permanent loads means that the column will fail. Therefore, in the case of an arrested collapse, comparison of the energy absorbed by the buckled column to the respective column failure energy enables one to evaluate the building safety. Buckling energies are characteristic values of columns, and failure energy limits are fundamental properties of a structure (dependent both on column properties and on a value of permanent load). Both buckling energy and column failure energy can be conveniently computed beforehand, using the numerical (LS-DYNA) and/or analytical (closed-form) calculation procedures proposed in this study.

FIGURE 4 – BUCKLING AND FAILURE ENERGY COLUMN STATES DEFORMATION WORK (INTERNAL ENERGY) FLOW A quantitative energy based approach was used to analyze the response of the simplified steel framed building (Figure 1) to sudden column(s) removal. Special emphasis was put on column behavior because the corresponding crucial role in the collapse propagation or arrest [Krauthammer et. al, 2004]. Two columns were instantenously removed after application of static preloading to triger progressive collapse. Building columns were designated using A through E and 1 through 4 plane grid (see Figure 1). Planar designation was followed by the
0 20 40 60 80 1000
500
1000
1500
2000
2500
3000y
Displacement [mm]
Forc
e [k
N]
0 20 40 60 80 1000
2
4
6
8
10
12
14
16
18x 10
4 Internal Energy - Stefan Szyniszewski
Displacement [mm]
Inte
rnal
ene
rgy
[J]
Permanent Load
Buckling Energy
Post-buckling unloading
Initial State
Failure Energy
story number (e.g. A2.1 means A = vertical line, 2 = horizontal line, .1 = 1st story). Columns A1.1 and A2.1 were removed after application of static preloading.
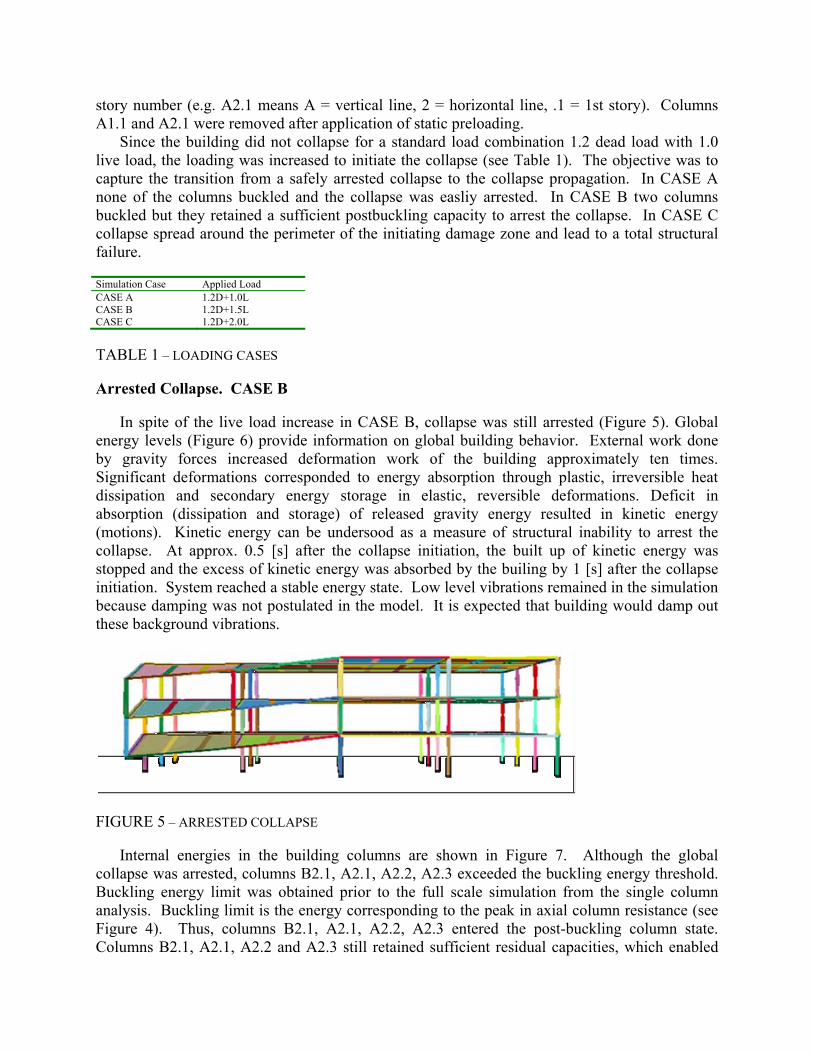
Since the building did not collapse for a standard load combination 1.2 dead load with 1.0 live load, the loading was increased to initiate the collapse (see Table 1). The objective was to capture the transition from a safely arrested collapse to the collapse propagation. In CASE A none of the columns buckled and the collapse was easliy arrested. In CASE B two columns buckled but they retained a sufficient postbuckling capacity to arrest the collapse. In CASE C collapse spread around the perimeter of the initiating damage zone and lead to a total structural failure. Simulation Case Applied Load CASE A CASE B CASE C
1.2D+1.0L 1.2D+1.5L 1.2D+2.0L
TABLE 1 – LOADING CASES Arrested Collapse. CASE B
In spite of the live load increase in CASE B, collapse was still arrested (Figure 5). Global energy levels (Figure 6) provide information on global building behavior. External work done by gravity forces increased deformation work of the building approximately ten times. Significant deformations corresponded to energy absorption through plastic, irreversible heat dissipation and secondary energy storage in elastic, reversible deformations. Deficit in absorption (dissipation and storage) of released gravity energy resulted in kinetic energy (motions). Kinetic energy can be undersood as a measure of structural inability to arrest the collapse. At approx. 0.5 [s] after the collapse initiation, the built up of kinetic energy was stopped and the excess of kinetic energy was absorbed by the builing by 1 [s] after the collapse initiation. System reached a stable energy state. Low level vibrations remained in the simulation because damping was not postulated in the model. It is expected that building would damp out these background vibrations.
FIGURE 5 – ARRESTED COLLAPSE
Internal energies in the building columns are shown in Figure 7. Although the global collapse was arrested, columns B2.1, A2.1, A2.2, A2.3 exceeded the buckling energy threshold. Buckling energy limit was obtained prior to the full scale simulation from the single column analysis. Buckling limit is the energy corresponding to the peak in axial column resistance (see Figure 4). Thus, columns B2.1, A2.1, A2.2, A2.3 entered the post-buckling column state. Columns B2.1, A2.1, A2.2 and A2.3 still retained sufficient residual capacities, which enabled
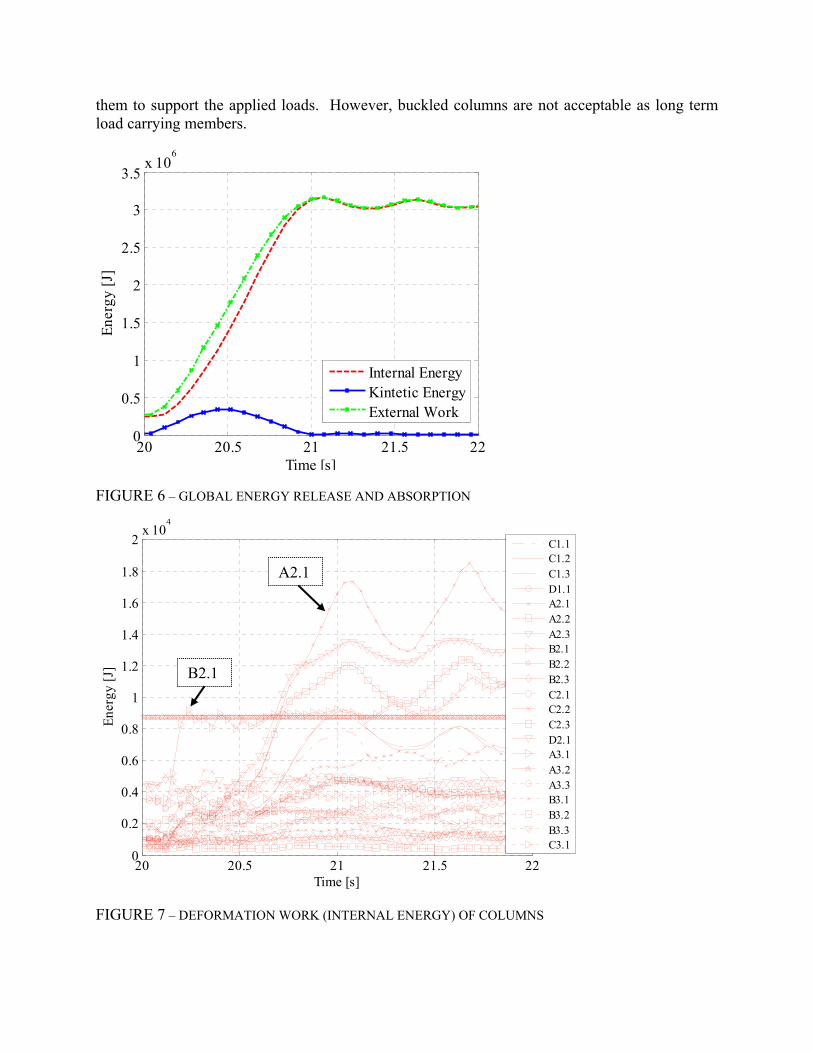
them to support the applied loads. However, buckled columns are not acceptable as long term load carrying members.
FIGURE 6 – GLOBAL ENERGY RELEASE AND ABSORPTION
FIGURE 7 – DEFORMATION WORK (INTERNAL ENERGY) OF COLUMNS
20 20.5 21 21.5 220
0.5
1
1.5
2
2.5
3
3.5x 10
6
Time [s]
Ener
gy [J
]
Internal EnergyKintetic EnergyExternal Work
20 20.5 21 21.5 220
0.2
0.4
0.6
0.8
1
1.2
1.4
1.6
1.8
2x 10
4
Time [s]
Ener
gy [J
]
C1.1C1.2C1.3D1.1A2.1A2.2A2.3B2.1B2.2B2.3C2.1C2.2C2.3D2.1A3.1A3.2A3.3B3.1B3.2B3.3C3.1
B2.1
A2.1
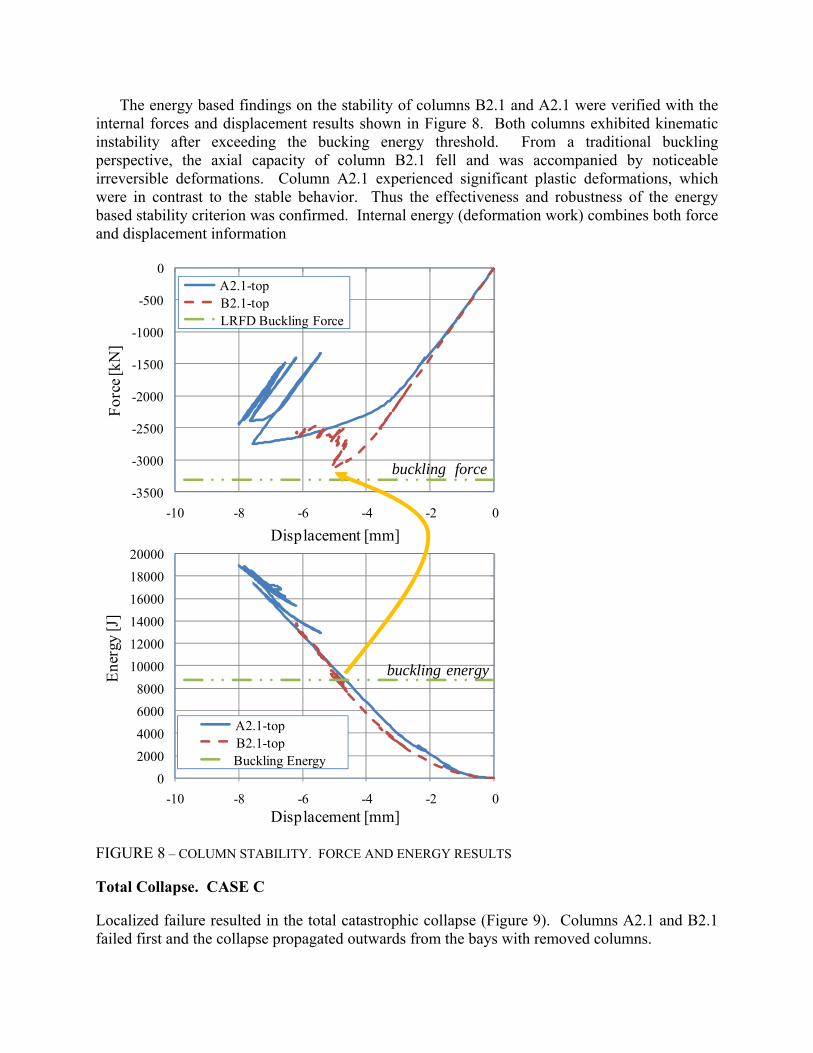
The energy based findings on the stability of columns B2.1 and A2.1 were verified with the internal forces and displacement results shown in Figure 8. Both columns exhibited kinematic instability after exceeding the bucking energy threshold. From a traditional buckling perspective, the axial capacity of column B2.1 fell and was accompanied by noticeable irreversible deformations. Column A2.1 experienced significant plastic deformations, which were in contrast to the stable behavior. Thus the effectiveness and robustness of the energy based stability criterion was confirmed. Internal energy (deformation work) combines both force and displacement information
FIGURE 8 – COLUMN STABILITY. FORCE AND ENERGY RESULTS Total Collapse. CASE C Localized failure resulted in the total catastrophic collapse (Figure 9). Columns A2.1 and B2.1 failed first and the collapse propagated outwards from the bays with removed columns.
-3500
-3000
-2500
-2000
-1500
-1000
-500
0
-10 -8 -6 -4 -2 0
Forc
e [kN
]
Displacement [mm]
y
A2.1-topB2.1-topLRFD Buckling Force
020004000
60008000
10000
1200014000
160001800020000
-10 -8 -6 -4 -2 0
Ener
gy [J
]
Displacement [mm]
A2.1-topB2.1-topBuckling Energy
energybuckling
forcebuckling
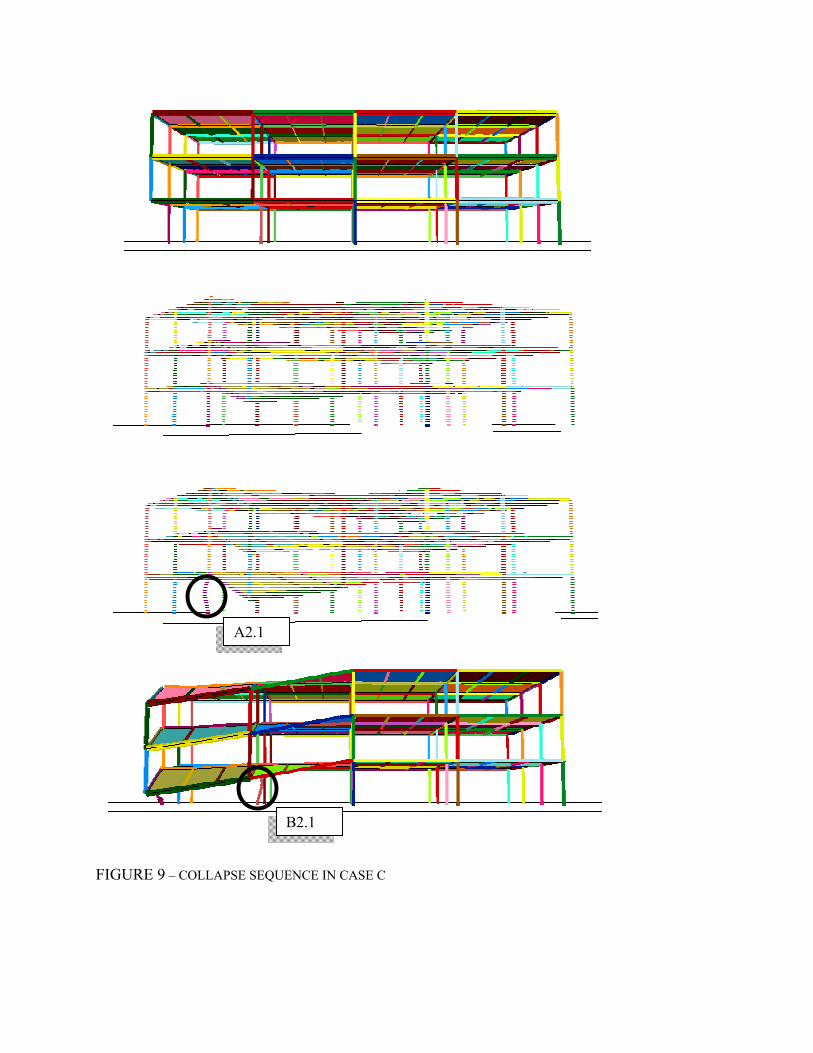
FIGURE 9 – COLLAPSE SEQUENCE IN CASE C
A2.1
B2.1
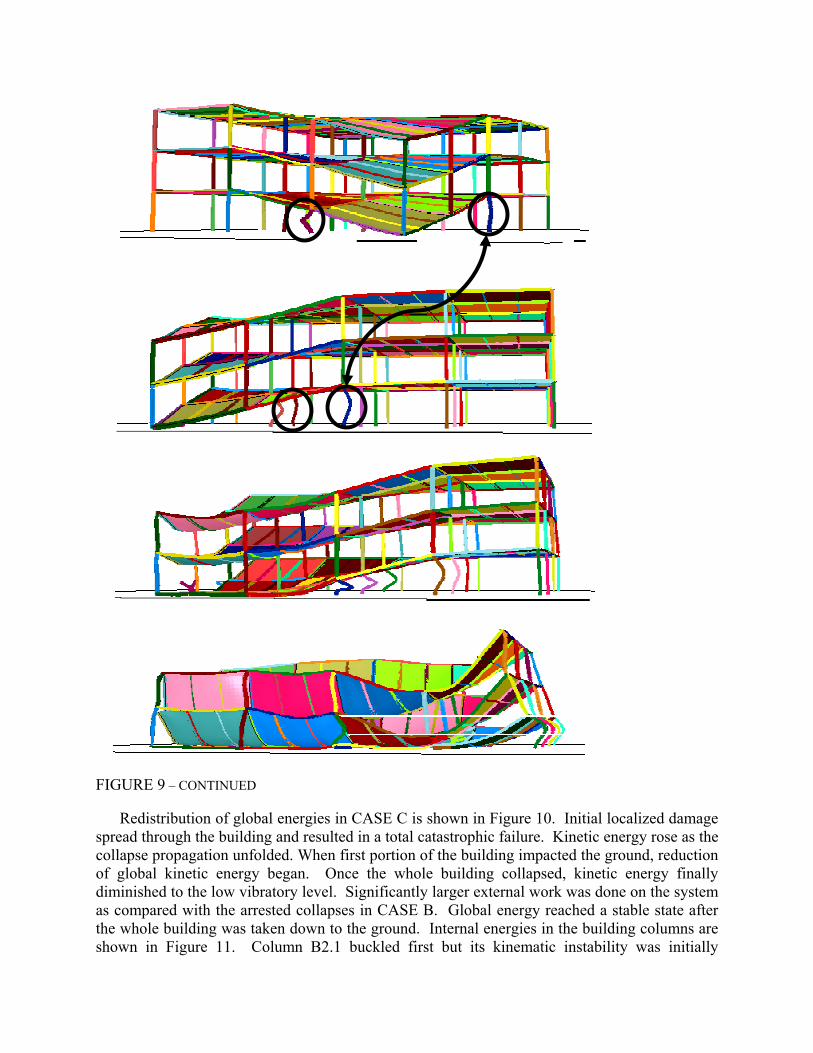
FIGURE 9 – CONTINUED
Redistribution of global energies in CASE C is shown in Figure 10. Initial localized damage spread through the building and resulted in a total catastrophic failure. Kinetic energy rose as the collapse propagation unfolded. When first portion of the building impacted the ground, reduction of global kinetic energy began. Once the whole building collapsed, kinetic energy finally diminished to the low vibratory level. Significantly larger external work was done on the system as compared with the arrested collapses in CASE B. Global energy reached a stable state after the whole building was taken down to the ground. Internal energies in the building columns are shown in Figure 11. Column B2.1 buckled first but its kinematic instability was initially
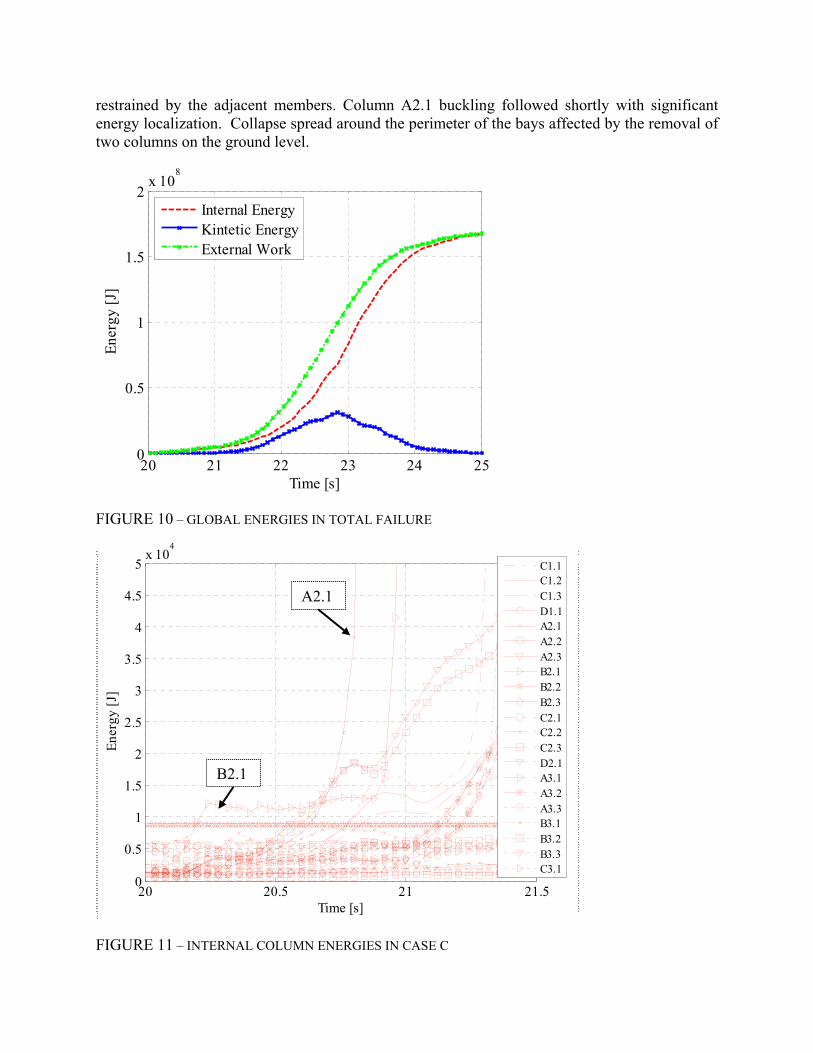
restrained by the adjacent members. Column A2.1 buckling followed shortly with significant energy localization. Collapse spread around the perimeter of the bays affected by the removal of two columns on the ground level.
FIGURE 10 – GLOBAL ENERGIES IN TOTAL FAILURE
FIGURE 11 – INTERNAL COLUMN ENERGIES IN CASE C
20 21 22 23 24 250
0.5
1
1.5
2x 10
8
Time [s]
Ener
gy [J
]
Internal EnergyKintetic EnergyExternal Work
20 20.5 21 21.50
0.5
1
1.5
2
2.5
3
3.5
4
4.5
5x 10
4
Time [s]
Ener
gy [J
]
C1.1C1.2C1.3D1.1A2.1A2.2A2.3B2.1B2.2B2.3C2.1C2.2C2.3D2.1A3.1A3.2A3.3B3.1B3.2B3.3C3.1
B2.1
A2.1
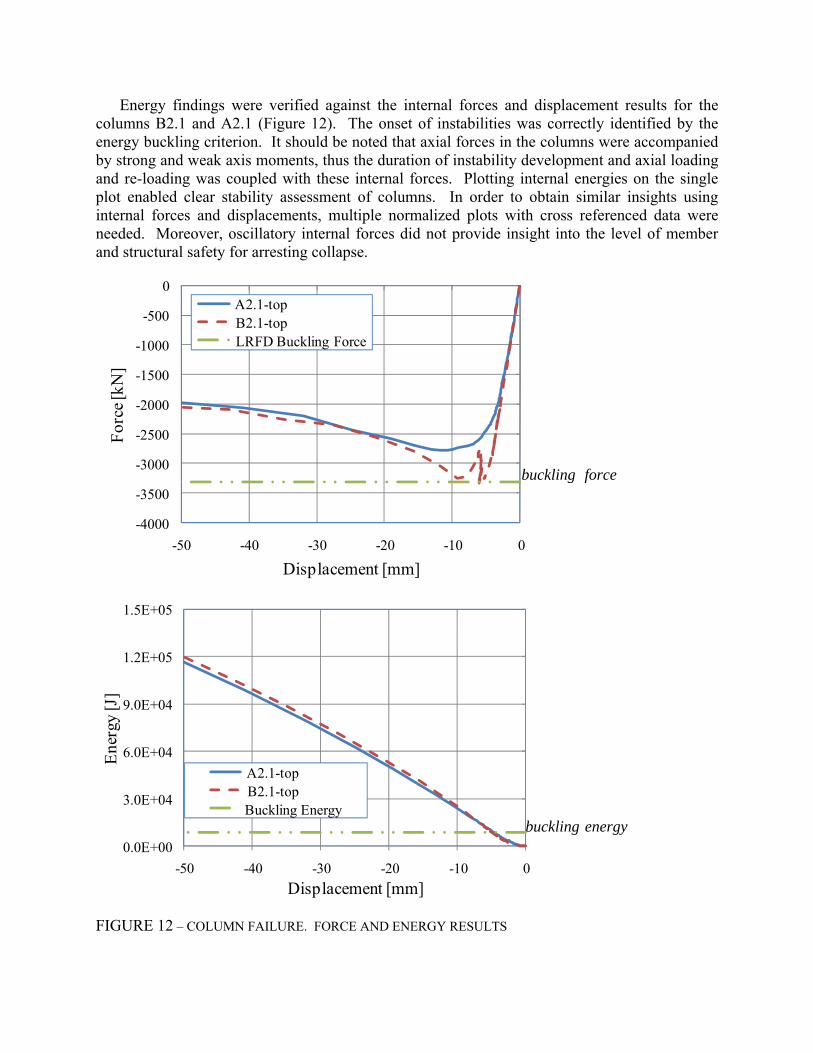
Energy findings were verified against the internal forces and displacement results for the columns B2.1 and A2.1 (Figure 12). The onset of instabilities was correctly identified by the energy buckling criterion. It should be noted that axial forces in the columns were accompanied by strong and weak axis moments, thus the duration of instability development and axial loading and re-loading was coupled with these internal forces. Plotting internal energies on the single plot enabled clear stability assessment of columns. In order to obtain similar insights using internal forces and displacements, multiple normalized plots with cross referenced data were needed. Moreover, oscillatory internal forces did not provide insight into the level of member and structural safety for arresting collapse.
FIGURE 12 – COLUMN FAILURE. FORCE AND ENERGY RESULTS
-4000
-3500
-3000
-2500
-2000
-1500
-1000
-500
0
-50 -40 -30 -20 -10 0
Forc
e [kN
]
Displacement [mm]
y
A2.1-topB2.1-topLRFD Buckling Force
0.0E+00
3.0E+04
6.0E+04
9.0E+04
1.2E+05
1.5E+05
-50 -40 -30 -20 -10 0
Ener
gy [J
]
Displacement [mm]
A2.1-topB2.1-topBuckling Energy
energybuckling
forcebuckling

TRADITIONAL APPROACH. INTERNAL FORCES Figure 13 compares internal forces in columns A2.1 and B2.1 in the case of total failure. Significant interaction between moments and axial force in column A2.1 resulted in reduction of this column axial capacity. Column A2.1 failure was initiated for axial load 16% lower than axial buckling resistance.
1)
2) FIGURE 13 – INTERNAL FORCES IN COLUMNS (CASE C, TOTAL COLLAPSE): 1) A2.1, 2) B2.1
-1-0.8-0.6-0.4-0.2
00.2
0.40.60.8
1
20 20.5 21 21.5
Nor
mal
ized
Mom
ent a
nd F
orce
Time [s]
yAxial ForceMoment SMoment T
-1
-0.8
-0.6
-0.4
-0.2
00.2
0.4
0.6
0.8
1
20 20.5 21 21.5
Mom
ent o
r For
ce [
kip-
in o
r kip
]
Time [s]
Axial ForceMoment SMoment T
T
S
T
S
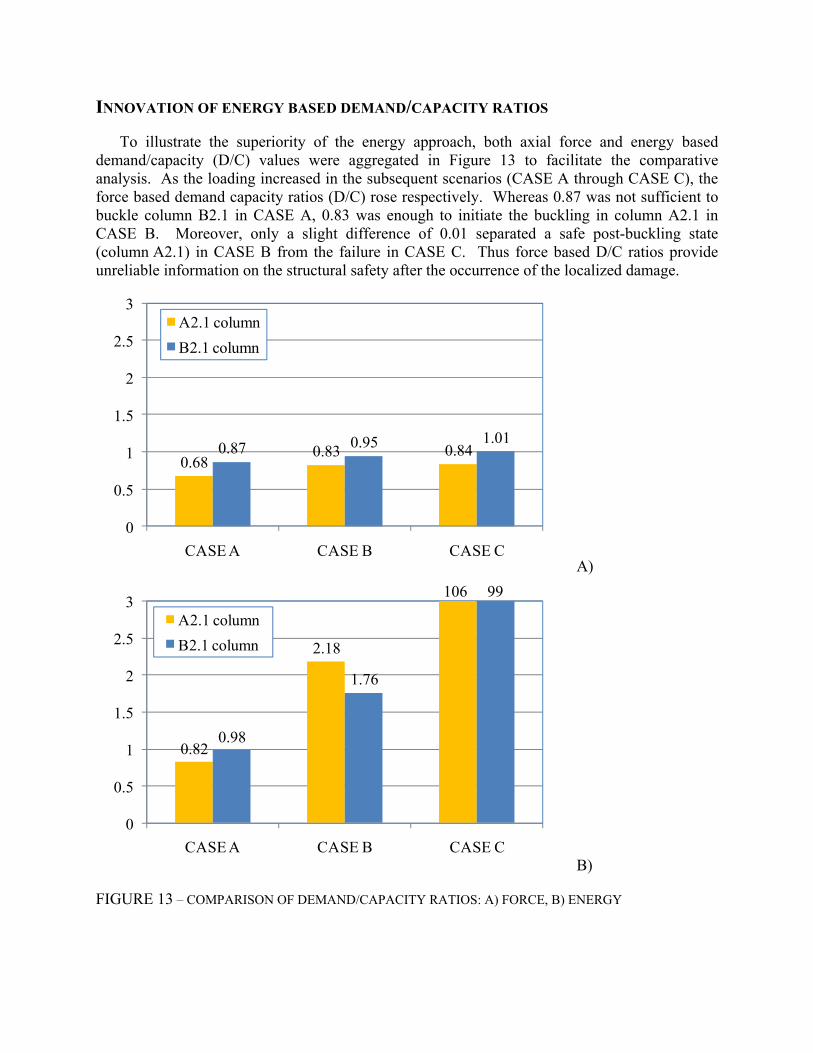
INNOVATION OF ENERGY BASED DEMAND/CAPACITY RATIOS
To illustrate the superiority of the energy approach, both axial force and energy based demand/capacity (D/C) values were aggregated in Figure 13 to facilitate the comparative analysis. As the loading increased in the subsequent scenarios (CASE A through CASE C), the force based demand capacity ratios (D/C) rose respectively. Whereas 0.87 was not sufficient to buckle column B2.1 in CASE A, 0.83 was enough to initiate the buckling in column A2.1 in CASE B. Moreover, only a slight difference of 0.01 separated a safe post-buckling state (column A2.1) in CASE B from the failure in CASE C. Thus force based D/C ratios provide unreliable information on the structural safety after the occurrence of the localized damage.
A)
B) FIGURE 13 – COMPARISON OF DEMAND/CAPACITY RATIOS: A) FORCE, B) ENERGY
0.680.83 0.840.87 0.95 1.01
0
0.5
1
1.5
2
2.5
3
CASE A CASE B CASE C
A2.1 columnB2.1 column
0.82
2.18
0.98
1.76
0
0.5
1
1.5
2
2.5
3
CASE A CASE B CASE C
A2.1 columnB2.1 column
106 99
Energy based D/C ratios were very sensitive to the buckling initiation. Internal energies significantly rose, and the violation of the energy buckling criterion directly corresponded to the onset of buckling. The decrease of the residual column capacity in the post buckling phase was characterized by significant increase in the energy absorption (mainly irreversible, plastic energy dissipated as heat). Pre-buckling, post-buckling and failure states resulted in very distinctive energy states. CONCLUSIONS The main objective of this study was to develop and implement a rational, energy-based approach to progressive collapse of steel framed buildings by assessing individual members and full structural behavior focusing on the role of energy flow in these phenomena.
Buckling energies are characteristic values of columns, and failure energy limits are fundamental properties of a structure (dependent both on column properties and on a value of permanent load). Both buckling energy and column failure energy can be conveniently computed beforehand, using the numerical (LS-DYNA) calculation procedures.
A comparison of the force demand to the member capacity is traditionally employed to evaluate a member’s safety. It has been shown in this study that force based demand capacity (D/C) is not very sensitive to the fundamental changes in structural behavior. Conversely, buckling energy D/C values correctly identified buckling in all analyzed cases in spite of complex interactions between axial forces and bending moments. Moreover, the energy failure D/C criterion was violated only by failed columns. In the case of arrested collapse, comparing the energy absorbed (deformation work) in a given column to the failure limit enabled direct evaluation of the column safety. ACKNOWLEDGEMENTS This study was conducted at the University of Florida under contract with the US Army Corps of Engineers, Engineer Research and Development Center (ERDC), Vicksburg, MS. The author wishes to acknowledge the generous support provided by the sponsor. I also would like to thank my teachers at the University of Florida: Dr. Theodor Krauthammer, Dr. Joseph Tedesco, Dr. Gary Consolazio, Dr. Rafael Haftka and Dr. Hyun Chang Yim for their insights throughout the different stages of this study. REFERENCES [1] AISC (American Institute of Steel Construction), Steel Construction Manual, 2002 [2] ASCE (American Society of Civil Engineers), ASCE Standard 7-05, Minimum Design Loads for Buildings and
Other Structures, 2005, pp. 12 and pp. 258 [3] Ballast, D, K, Handbook of Construction Tolerances, McGraw-Hill, New York, 1994 [4] Elingwood, B, R, Dusenberry, D, O, “Building Design for Abnormal Loads and Progressive Collapse”,
Computer-Aided Civil and Infrastructure Engineering, Vol. 20, 2005, pp. 194-205 [5] Gupta, A, Krawinkler, H, “Behavior of ductile SMRFs at various seismic hazard levels”, Journal of Structural
Engineering, Vol. 126, No. 1, 2000, pp. 98-107 [6] Hall, D, “Proposed Steel Column Strength Criteria”, ASCE Journal of Structural Division, Vol. 107, No. 4,
1981, pp. 649-670 [7] Hallquist, J, LS-DYNA: Theory Manual, Lawrence Software Technology Corporation; Livermore, Calif., 2006 [8] Hinman, E, E, Hammond, D, J, Lessons from the Oklahoma City Bombing: Defensive Design Techniques.
ASCE Press, New York, NY, 1997
[9] Jung, L, “Shortening of column with initial curvature and eccentricity and its influence on the stress distribution in indeterminate structures”, Proceedings of the First U.S. National Congress of Applied Mechanics, The American Society of Mechanical Engineers (ASME), New York, 1952, pp. 449-452
[10] Krauthammer, T, Lim, J, Choi, H, and Elfahal, M, Evaluation of Computational Approaches for Progressive Collapse and Integrated Munitions Effects Assessment, PTC-TR-002-2004, Protective Technology Center (Civil Engineering), Pennsylvania State University, Submitted to: Defense Threat Reduction Agency, Ft. Belvoir, VA and U.S. Army Engineer Research and Developmnet Center, Vicksburg, MS
[11] Mlakar, P, Dusenberry, D, Harris, J, The Pentagon Building Performance Report, ASCE Press, New York, NY 2002
[12] NIST (National Institute of Standards and Technology), S. Shyam Sunder, Lead Investigator, Final report on the collapse of the World Trade Center towers, Gaithersburg, Md, 2005
[13] Palmisano, F, Vitone, A, Vitone, C, Vitone, V, “Collapse of the Giotto Avenue Building in Foggia”, Structural Engineering International, Vol. 17, No. 2, 2007, pp. 166-171
[14] Pearson C, D, Delatte, N, “Ronan Point Apartment Tower Collapse and its Effect on Building Codes”, Journal of Performance of Constructed Facilities, Vol. 19, No. 2, 2005, pp. 172-177
[15] Salmon, C, Johnson, J, Steel Structures: Design and Behavior: Emphasizing Load and Resistance Factor Design, Harper and Row, New York, 1990