Embed Size (px)
Citation preview

8/9/2019 2010-11 Budget Draft #2_Final_Unabridged
http://slidepdf.com/reader/full/2010-11-budget-draft-2finalunabridged 1/38
2010-11 BUDGET DRAFT #2(UNABRIDGED)
M A R C H 2 2 , 2 0 1 0
Grosse Pointe Public School System
Financial Transparency Series

8/9/2019 2010-11 Budget Draft #2_Final_Unabridged
http://slidepdf.com/reader/full/2010-11-budget-draft-2finalunabridged 2/38
2
Budget Development - Completed Activities(all discussions, presentations were televised sessions)
Date
Board agreed on Staff Utilization and Allocation process for 2010-11 September
Board discussed Administration’s completed Distribution and FundingSources tabs of current year (2009-10) Staff Utilization Utility October
Board discussed Administration’s recommendations for how toincrease density in electives/specials at all levels and completedUtilization tab of Staff Utilization Utility
November
Board discussed Administration’s evaluation of current utilization rates
of all job functions and propose utilization rates for 2010-11
November
Board discussed Administration’s recommendation for class sizeguidelines and any special program designations for 2010-11
November
Board discussed Administration’s first 2010-11 budget projectionusing the Budget Modeling Utility
December
Board Work Session on Budget Development Parameters January
Board discussed and approved Budget Development Parameters atRegular Meeting
January
Presentation, Discussion of Budget Draft #1 at Regular Board Meeting February
Presentation, Discussion of Budget Draft #2 at Regular Board Meeting March

8/9/2019 2010-11 Budget Draft #2_Final_Unabridged
http://slidepdf.com/reader/full/2010-11-budget-draft-2finalunabridged 3/38
3
Budget Development - Pending Activities(all will be televised sessions)
Date
Board of Education Work Session, review of Budget Draft #2 April
If necessary and pending Board, Community, Staff feedback,deliver Revised Balanced Budgets at Regular Board Meeting
April
Administration proposes Staff Layoff lists for Board approval(agreement on staff call back procedure)
April
If necessary and pending Board, Community, Staff feedback,deliver Revised Balanced Budgets at Regular Board Meeting
May
If necessary and pending Board, Community, Staff feedback,deliver Revised Balanced Budgets at Regular Board Meeting
June
Budget Hearing and Board of Education Budget approval June
Update on enrollment and funding against projections July
Recommendation for approval of any staff call backs August

8/9/2019 2010-11 Budget Draft #2_Final_Unabridged
http://slidepdf.com/reader/full/2010-11-budget-draft-2finalunabridged 4/38
4
Budget Draft #2
What It Is
•A Draft
•Work In Process
What It Is Not
•A Proposal
•In a Final State

8/9/2019 2010-11 Budget Draft #2_Final_Unabridged
http://slidepdf.com/reader/full/2010-11-budget-draft-2finalunabridged 5/38

8/9/2019 2010-11 Budget Draft #2_Final_Unabridged
http://slidepdf.com/reader/full/2010-11-budget-draft-2finalunabridged 6/38
6
Most Significant Changes from Draft #1 to Draft #2
Restores 3 Reading Specialists at Elementary for a total of 8.0 ( areduction of 1.0 from 2009-10)
Restores 4.5 Middle School teachers which reduces proposedClass Size from 27.5 to 26
Restores 12.8 Hall Monitors (Middle and High School) as directemployees as opposed to outsourcing them
Restores 7.0 Special Education Resource Room teachers for atotal of 27.0 (down 2 from 2009-10)
Restores 1.4 Speech Pathologists for a total of 16.9 for 2010-11(down 2.6 from 2009-10)
Restores 2.2 Social Workers for a total of 8.7 for 2010-11 (down0.8 from 2009-10)
Restorations offset by Draft #1’s surplus, health plan efficiencies,moderate revenue increases and expense reductions, and abroad range of smaller efficiencies

8/9/2019 2010-11 Budget Draft #2_Final_Unabridged
http://slidepdf.com/reader/full/2010-11-budget-draft-2finalunabridged 7/38

8/9/2019 2010-11 Budget Draft #2_Final_Unabridged
http://slidepdf.com/reader/full/2010-11-budget-draft-2finalunabridged 8/38

8/9/2019 2010-11 Budget Draft #2_Final_Unabridged
http://slidepdf.com/reader/full/2010-11-budget-draft-2finalunabridged 9/38
Evidence of an Unsustainable Financial Modelfor the Grosse Pointe Public School System
9
2007-8 2010-11 Impact/Observation
Foundation Allowanceand 20J Revenue/Pupil
$10,326 $9,995 $2,600,000 revenue loss(3.2% reduction)
Student Enrollment 8,589 8,077 $5,117,000 revenue loss
General Fund Equity $20,355,960 $17,831,689 Decrease of 12.4%
Average TotalCompensation/Teacher
$109,380 $120,058 $5,883,638 premium(9.8% increase/teacher)
Total Teachers 602 551 51 teachers fewer
Pupil:Teacher Ratio 14.27 14.66 Class Size, 6 period day
Total Employees 951 836 64 non-teachers fewer
Total Health Care,Retirement, FICA
$25,314,818 $25,586,290 For 115 fewer employees(15% increase/employee)

8/9/2019 2010-11 Budget Draft #2_Final_Unabridged
http://slidepdf.com/reader/full/2010-11-budget-draft-2finalunabridged 10/38

8/9/2019 2010-11 Budget Draft #2_Final_Unabridged
http://slidepdf.com/reader/full/2010-11-budget-draft-2finalunabridged 11/38
Enrollment Projections: No Change from Draft #1Enrollment by Grade, Level, and Building Drive Staffing Levels
11
Year Fall EnrollmentGeneral Fund and School
Services Fund Revenue (000’s)
2007-8 8,585 $108.4
2008-9 8,305 $107.2
2009-10 8,172 $102.52010-11 8,052 $101.0 (Projected)
2010-11 Enrollment By Level
Elem. Middle High Total
3,163 1,904 2,985 8,052
Class Size Guideline Applied Against Enrollment Derives Staffing

8/9/2019 2010-11 Budget Draft #2_Final_Unabridged
http://slidepdf.com/reader/full/2010-11-budget-draft-2finalunabridged 12/38

8/9/2019 2010-11 Budget Draft #2_Final_Unabridged
http://slidepdf.com/reader/full/2010-11-budget-draft-2finalunabridged 13/38
Elementary Class Sizes – 2009-10 School Year13
1 2 3 4 5Magnet;
1-2-3
Defer 17.3 20.3 20.0 22.7 24.3 20.0
Ferry 19.0 23.5 19.0 19.0 22.0 20.5
Kerby 18.7 22.7 22.0 22.0 25.0
Maire 19.3 21.0 25.5 20.0 19.0
Mason 21.5 24.0 20.0 22.0 23.0
Monteith 19.5 26.0 25.3 26.3 21.8
Poupard 18.3 19.3 23.3 23.0 18.7
Richard21.0 23.0 24.3 22.0 24.0
Trombly 21.5 18.5 17.5 22.0 18.3 21.0
Traditional Teachers 135.0 1st-3rd Avg. Class 21.2
“Specials” Teachers 26.8 4th-5th Avg. Class 21.9
8/9/2019 2010-11 Budget Draft #2_Final_Unabridged
http://slidepdf.com/reader/full/2010-11-budget-draft-2finalunabridged 14/38
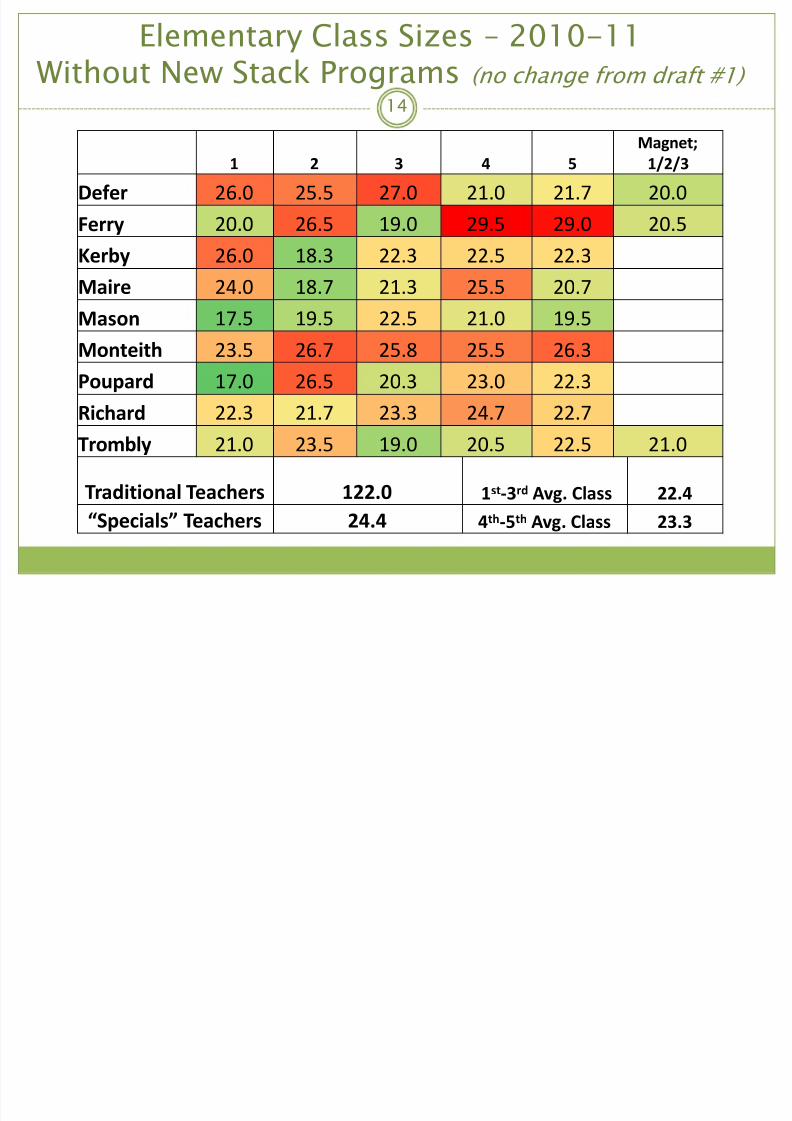
Elementary Class Sizes – 2010-11Without New Stack Programs (no change from draft #1)
14
1 2 3 4 5Magnet;
1/2/3
Defer 26.0 25.5 27.0 21.0 21.7 20.0
Ferry 20.0 26.5 19.0 29.5 29.0 20.5
Kerby 26.0 18.3 22.3 22.5 22.3
Maire 24.0 18.7 21.3 25.5 20.7
Mason 17.5 19.5 22.5 21.0 19.5
Monteith 23.5 26.7 25.8 25.5 26.3
Poupard 17.0 26.5 20.3 23.0 22.3
Richard 22.3 21.7 23.3 24.7 22.7
Trombly 21.0 23.5 19.0 20.5 22.5 21.0
Traditional Teachers 122.0 1st-3rd Avg. Class 22.4
“Specials” Teachers 24.4 4th-5th Avg. Class 23.3

8/9/2019 2010-11 Budget Draft #2_Final_Unabridged
http://slidepdf.com/reader/full/2010-11-budget-draft-2finalunabridged 15/38

8/9/2019 2010-11 Budget Draft #2_Final_Unabridged
http://slidepdf.com/reader/full/2010-11-budget-draft-2finalunabridged 16/38
Elementary Class Sizes – 2010-11With New Stack Programs (no change from Draft #1)
16
1 2 3 4 5Magnet;
1/2/3New Stack(examples)
Defer 23.5 23.0 24.5 21.0 21.7 20.0 15.0
Ferry 20.0 26.5 19.0 26.0 25.0 20.5 15.0
Kerby 26.0 18.3 22.3 22.5 22.3
Maire 24.0 18.7 21.3 25.5 20.7
Mason 17.5 19.5 22.5 21.0 19.5
Monteith 22.3 25.0 24.5 25.5 26.3 15.0
Poupard 17.0 26.5 20.3 23.0 22.3
Richard 22.3 21.7 23.3 24.7 22.7
Trombly 21.0 23.5 19.0 20.5 22.5 21.0
Traditional Teachers 125.0 1st-3rd Avg. Class 22.0
“Specials” Teachers 25.0 4th-5th Avg. Class 22.9

8/9/2019 2010-11 Budget Draft #2_Final_Unabridged
http://slidepdf.com/reader/full/2010-11-budget-draft-2finalunabridged 17/38
Other Elementary ResourcesSignificant Change from Draft #1: Restores 3.0 Reading Specialists
17
2009-10 2010-11
Principals 9.0 9.0
Teacher – Title 1 2.9 2.9
Teacher – Reading Specialist 9.0 8.0Classroom Asst – Computer/Lib. 18.0 9.0
Classroom Asst – Title 1 7.0 7.0
Classroom Asst – Magnet 1.0 0.0
Classroom Asst – Class Size 1.0 0.0
Classroom Asst – Extended Day K 7.0 0.0
Secretaries and Clerks 16.0 13.5

8/9/2019 2010-11 Budget Draft #2_Final_Unabridged
http://slidepdf.com/reader/full/2010-11-budget-draft-2finalunabridged 18/38
Middle School General Education2009-10 Budget Had Anticipated 27.5 Average
18
2009-10 Middle School Staffing Levels
School Schedule
Type Total
Students
Student Credits Per Year
Annual Course Seats
Avg. # Students / Class
Sections Needed
Total Teachers
Brownell
Teachersteach 5
of 6
periods
632 6.00 7,584 24.6 308 30.8
Parcells 691 6.00 8,292 24.8 334 33.4
Pierce 601 6.00 7,212 24.3 297 29.7
TOTAL 1,924 6.00 23,088 24.6 939 93.9
Special Education and Resource Center sections are NOT factored into calculations.
8/9/2019 2010-11 Budget Draft #2_Final_Unabridged
http://slidepdf.com/reader/full/2010-11-budget-draft-2finalunabridged 19/38
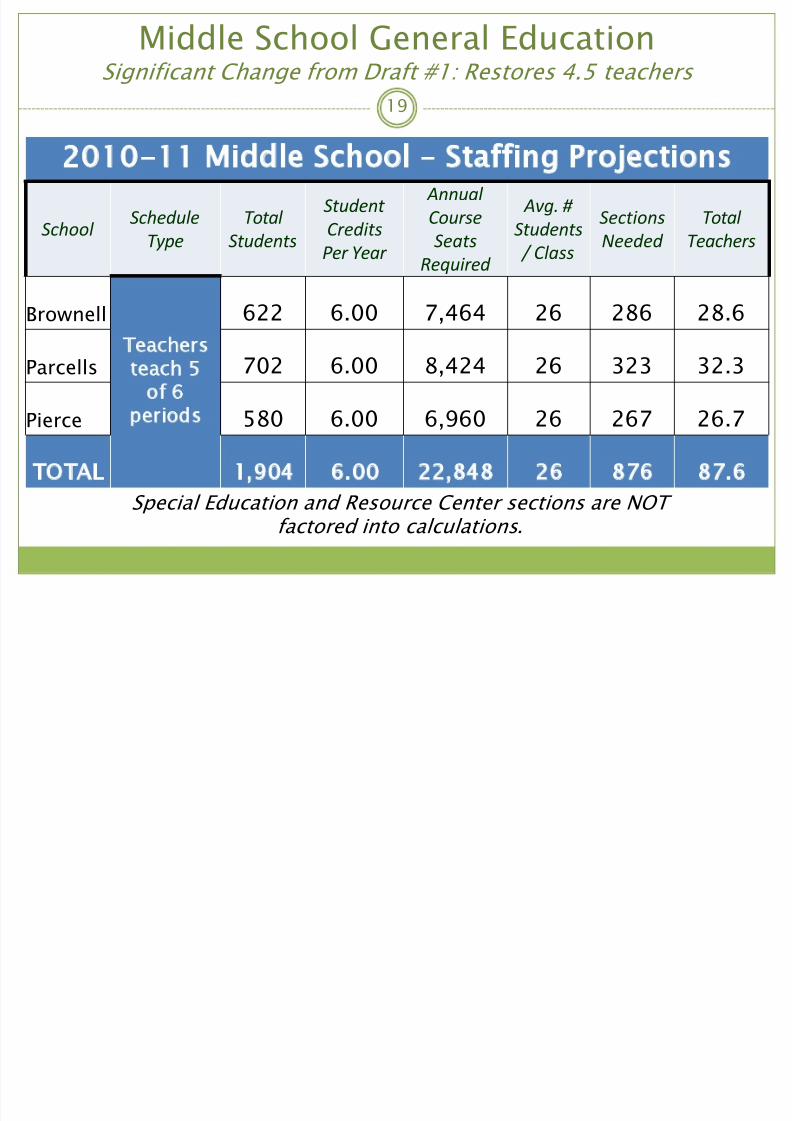
Middle School General EducationSignificant Change from Draft #1: Restores 4.5 teachers
19
2010-11 Middle School – Staffing Projections
School Schedule
Type
Total
Students
Student
Credits
Per Year
Annual
Course
Seats
Required
Avg. #
Students
/ Class
Sections
Needed
Total
Teachers
Brownell
Teachersteach 5
of 6
periods
622 6.00 7,464 26 286 28.6
Parcells 702 6.00 8,424 26 323 32.3
Pierce 580 6.00 6,960 26 267 26.7
TOTAL 1,904 6.00 22,848 26 876 87.6
Special Education and Resource Center sections are NOT factored into calculations.

8/9/2019 2010-11 Budget Draft #2_Final_Unabridged
http://slidepdf.com/reader/full/2010-11-budget-draft-2finalunabridged 20/38
High School General Education2009-10 Budget Had Anticipated 27.5 Average
20
2009-10 High School Staffing Levels
School Schedule
Type Total
Students
Student Credits Per Year
Annual Course Seats
Required
Avg. # Students / Class
Sections Needed
Total Teachers
North
Teachersteach 5 of7 periods
1,380 6.57 18,133 26.5 684 68.4
South1,580 6.67 21,077 27.1 778 77.8
TOTAL 2,960 39,210 26.8 1,462 146.2
Tutorials, Special Education or Resource Center sections are NOT factored into class size calculations.

8/9/2019 2010-11 Budget Draft #2_Final_Unabridged
http://slidepdf.com/reader/full/2010-11-budget-draft-2finalunabridged 21/38
High School General EducationChange from Draft #1: Reduction of 0.5 Teachers
21
2010-11 High School – Staffing Projections
School Schedule
Type Total
Students
Student Credits Per Year
Annual Course Seats
Required
Avg. # Students / Class
Sections Needed
Total Teachers
NorthTeachersteach 5 of7 periods
1,391 6.57 18,278 27.6 662 66.2
South 1,594 6.67 21,264 27.6 770 77.0
TOTAL 2,985 39,542 27.6 1,432 143.3
Tutorials, Special Education or Resource Center sections are NOT factored into class size calculations.
8/9/2019 2010-11 Budget Draft #2_Final_Unabridged
http://slidepdf.com/reader/full/2010-11-budget-draft-2finalunabridged 22/38
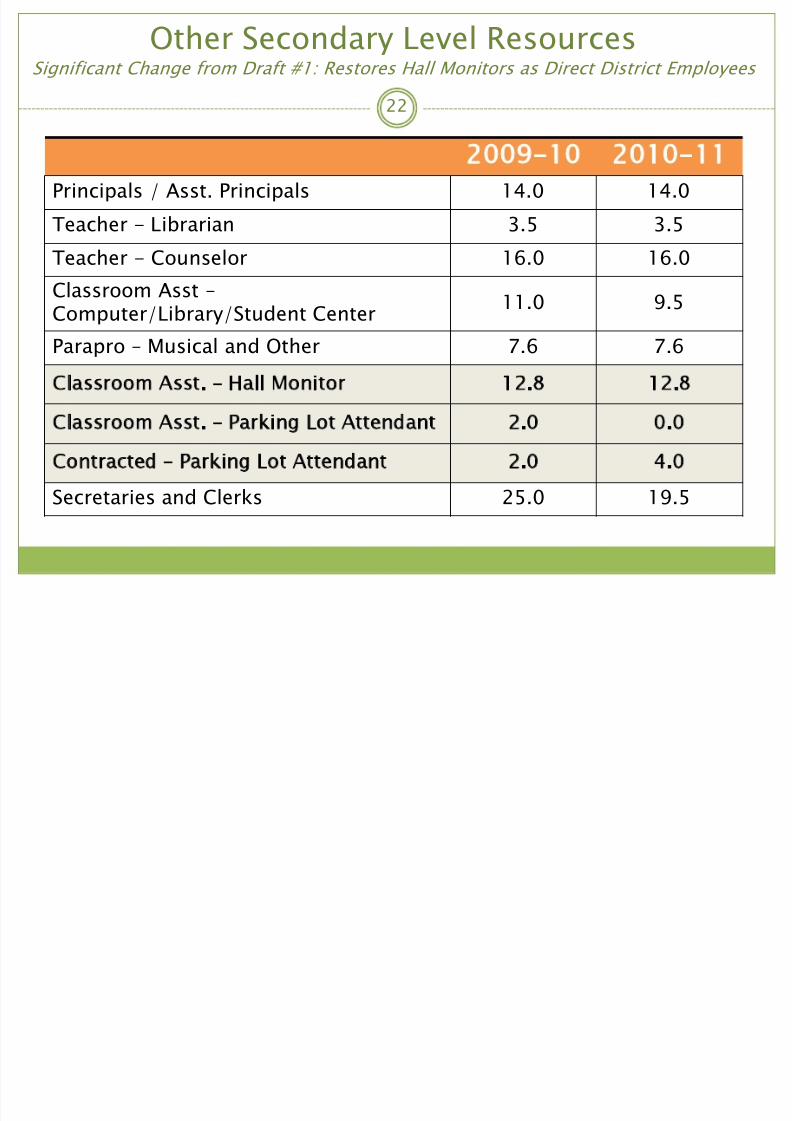
Other Secondary Level ResourcesSignificant Change from Draft #1: Restores Hall Monitors as Direct District Employees
22
2009-10 2010-11
Principals / Asst. Principals 14.0 14.0
Teacher - Librarian 3.5 3.5
Teacher - Counselor 16.0 16.0
Classroom Asst –Computer/Library/Student Center
11.0 9.5
Parapro – Musical and Other 7.6 7.6
Classroom Asst. – Hall Monitor 12.8 12.8
Classroom Asst. – Parking Lot Attendant 2.0 0.0
Contracted – Parking Lot Attendant 2.0 4.0
Secretaries and Clerks 25.0 19.5

8/9/2019 2010-11 Budget Draft #2_Final_Unabridged
http://slidepdf.com/reader/full/2010-11-budget-draft-2finalunabridged 23/38
Special Education TeachersYear Over Year Comparison - 2009-10 to 2010-11
23
2009-10 FTE’s 2010-11 FTE’s
Resource Center – Elementary 9.0 8.0
Resource Center – Secondary 20.0 19.0
Teachers - Speech Therapist 18.9 16.3
Teachers - Cognitive Impaired 7.4 7.0
Teachers - Emotional Impaired 5.0 4.0
Teachers - Early Childhood Developmental Delay 4.0 3.5
School Psychologists 10.8 10.0
School Social Workers 9.5 8.7
High School Math Support 0.2 0

8/9/2019 2010-11 Budget Draft #2_Final_Unabridged
http://slidepdf.com/reader/full/2010-11-budget-draft-2finalunabridged 24/38

8/9/2019 2010-11 Budget Draft #2_Final_Unabridged
http://slidepdf.com/reader/full/2010-11-budget-draft-2finalunabridged 25/38
Special Education Classroom Assistants25
2009-10 2010-11
Class. Asst - Mod. Cognitive Imp. 9.0 7.0
Class. Asst - Mild Cognitive Imp. 3.0 3.0
Class. Asst - Autism Spectrum 45.5 45.5
Class. Asst - Emotion. Imp. 7.0 7.0
Class. Asst - Resource Room 7.0 7.0
Class. Asst - Early Child Dev 3.0 3.0Class. Asst - Work Study/Vocation. 3.0 3.0

8/9/2019 2010-11 Budget Draft #2_Final_Unabridged
http://slidepdf.com/reader/full/2010-11-budget-draft-2finalunabridged 26/38
Special Education Administration and Support
26
2009-10 2010-11
Director 1.0
Associate Director 2.0 1.0
Secretaries and Clerks 4.6 4.6

8/9/2019 2010-11 Budget Draft #2_Final_Unabridged
http://slidepdf.com/reader/full/2010-11-budget-draft-2finalunabridged 27/38
Central Administration and Services27
2009-10 2010-11
Executive Administration 5.0 5.0
Secretaries 6.6 3.9
Clerical Staff 6.0 4.6
Teachers - Specialists 4.4 2.7
Non-Instructional Supervisor 18.0 11.7
Contracted - Non-Instructional 0.0 3.6
Paraprofessional - Other 0.5 0.5
Technology Support 7.0 7.0
Plant - Custodians/Engineers 76.0 68.0
Community Relations 1.0 1.0

8/9/2019 2010-11 Budget Draft #2_Final_Unabridged
http://slidepdf.com/reader/full/2010-11-budget-draft-2finalunabridged 28/38
28
Staffing Level Changes 2009-10 2010-11
Teachers - Elementary 192.5 181.9
Teachers – Middle School 101.4 95.1
Teachers – High School 157.8 155.3Teachers – Special Education 123.4 116.0
Teachers – Specialists 3.9 2.7
Classroom Asst. – General Ed. 58.1 38.3
Classroom Asst. – Special Ed. 77.5 75.5
Building Administrators 25.0 25.0
Clerical Staff 58.2 46.1
Non-Instructional Supervisor 17.9 11.7
Paraprofessionals 11.7 8.0
Plant Engineers / Custodians 76.0 68.0
Technology Staff 7.0 7.0
Executive Administration 5.0 5.0
TOTALS 915.4 835.7

8/9/2019 2010-11 Budget Draft #2_Final_Unabridged
http://slidepdf.com/reader/full/2010-11-budget-draft-2finalunabridged 29/38
Purchased ServicesIncrease in Contracted Staff as Some Direct Employees Shifted
29
2009-10 2010-11
Contracted Staff and Substitutes (Non-Coach) $1,555,929 $1,611,835
Transportation (Non-Athletic) $590,412 $610,000
Water $200,000 $210,000
WAN and Telecommunications $274,000 $265,104
Property Insurance $273,000 $273,000
Audit/Student Legal $54,000 $54,000
Legal $256,000 $256,000
Repairs and Maintenance $1,840,902 $1,740,030
Wayne RESA Fees $209,500 $209,500Software Licenses $343,210 $460,000
Other (includes Fast Math/Reading) $60,952 $60,592
School Services Fund - Food $1,167,733 $1,167,733
TOTAL PURCHASED SERVICES $6,825,638 $6,917,794

8/9/2019 2010-11 Budget Draft #2_Final_Unabridged
http://slidepdf.com/reader/full/2010-11-budget-draft-2finalunabridged 30/38
Supplies Expenses30
2009-10 2010-11
Gas $1,013,000 $1,013,000
Electricity $1,140,000 $1,140,000
Textbooks $325,000 $325,000
Custodial Supplies $586,000 $586,000
Teaching Supplies $803,000 $760,230
Office Supplies $224,661 $224,661
Athletics - Non-Coach Expenses $475,793 $474,135
Other (including Library Books) $51,000 $47,500
Other (School Services Fund) $17,285 $17,285
Supplies Total $4,635,739 $4,583,140

8/9/2019 2010-11 Budget Draft #2_Final_Unabridged
http://slidepdf.com/reader/full/2010-11-budget-draft-2finalunabridged 31/38

8/9/2019 2010-11 Budget Draft #2_Final_Unabridged
http://slidepdf.com/reader/full/2010-11-budget-draft-2finalunabridged 32/38
High School Athletics Budget32
2009-10 2010-11Coaches $702,469 $696,200
Transportation $125,033 $117,555
Other Athletic EPED $29,500 $62,000
Trainers $60,000 $60,000
Officials $85,297 $84,467
Capital Outlay $19,325 $0
Consumable Expenses $77,485 $82,250
Contract Services $13,300 $8,500
Uniforms $42,500 $26,300
State Tournament Expenses $17,513 $16,546
Dues, Fees and Ice Time $130,873 $134,072
TOTAL $1,303,295 $1,287,890
% of General / School Services Fund Revenue 1.42% 1.42%
N A hl i E P f E D

8/9/2019 2010-11 Budget Draft #2_Final_Unabridged
http://slidepdf.com/reader/full/2010-11-budget-draft-2finalunabridged 33/38
Non-Athletic Extra Pay for Extra DutyAlternative to Building Administrator Reduction
33
2009-10 2010-11
Department Chair EPED $220,094 $0
All Other EPED $553,788 $553,788
TOTAL $773,882 $553,788
Shifts workload from teaching staff to building administration and
reduces cost by $220,094 – equivalent to 1.35 Asst. Principals.
No Student clubs or organizations would be affected or reduced.

8/9/2019 2010-11 Budget Draft #2_Final_Unabridged
http://slidepdf.com/reader/full/2010-11-budget-draft-2finalunabridged 34/38
Human Resources vs. Non-HR Costs as % of Total BudgetThe “Roll Forward” is if no changes would be made from 2009 -10
34
82.6% 84.0% 85.1% 85.7% 84.4%
16.4% 15.3% 15.2% 13.6% 14.9%
0%
20%
40%
60%
80%
100%
2007-8 2008-9 2009-10 2010-11 2010-11
Human Resources Non-Human ResourcesDraft #2Roll Fwd.”

8/9/2019 2010-11 Budget Draft #2_Final_Unabridged
http://slidepdf.com/reader/full/2010-11-budget-draft-2finalunabridged 35/38
Variability of Budget Assumptions
$100MM
Budget100
students
1.5%change in
MPSERS
rate
10% in
health care
costs
$123 in
per pupil
funding
1.8% in
employee
salaries
Each of these variables individually would amount
to roughly 1% of the Budget:
Financial Transparency Series - Fund Equity
35

8/9/2019 2010-11 Budget Draft #2_Final_Unabridged
http://slidepdf.com/reader/full/2010-11-budget-draft-2finalunabridged 36/38
Variability of Budget Assumptions
$100MM
Budget20
students
0.5%change in
MPSERS
rate
2% in health
care costs
$25 in per
pupil
funding
0.25% in
employee
salaries
This combination of variables would amount to
roughly 1% of the Budget:
Financial Transparency Series - Fund Equity
36
U d S ifi A f F Id ifi d i

8/9/2019 2010-11 Budget Draft #2_Final_Unabridged
http://slidepdf.com/reader/full/2010-11-budget-draft-2finalunabridged 37/38
Updates on Specific Areas of Focus Identified inBudget Draft #1
37
• Identified significant reductionSupplies, Purchased
Services, and Other HR
•Restored 3.0 for a total of 8.0
Elementary Reading
Specialists
•Restored 9.0 positions (27 total)Resource Center
• In bargaining process with allBargaining Unit
Contracts
8/9/2019 2010-11 Budget Draft #2_Final_Unabridged
http://slidepdf.com/reader/full/2010-11-budget-draft-2finalunabridged 38/38
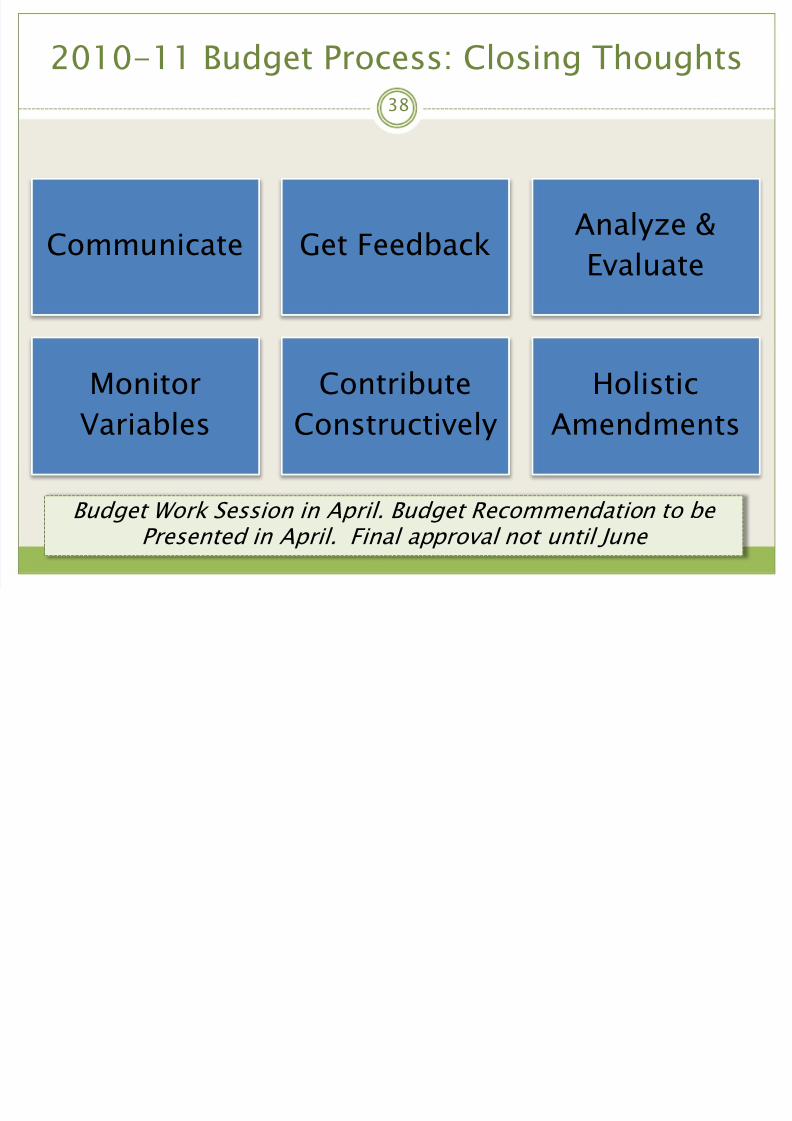
2010-11 Budget Process: Closing Thoughts
38
Communicate Get FeedbackAnalyze &
Evaluate
Monitor
Variables
Contribute
Constructively
Holistic
Amendments
Budget Work Session in April. Budget Recommendation to be Presented in April. Final approval not until June