Embed Size (px)
Citation preview
2010 Achievement Report
International Project for the Development of Infrastructure for Rationalizing Energy Use
Project on Human Resources Development
for Energy Conservation
(Project for the Promotion of Energy Conservation in Major Industries in ASEAN Countries)
Achievement Report
March 2011
The Energy Conservation Center, Japan
Preface In recent years, the need to achieve sustainable economic development has emerged as efforts to prevent global warming are becoming a common issue for humankind. In order to overcome the difficult conditions posed by the state of complete incompatibility between these two positions, technological innovations - including technologies that can promote efficient use of energy and prevent an expansion of the environmental burden of energy use and technologies for developing energy sources that place no burden at all on the environment - are required. To contribute the balanced development of economies and the environment in developing countries, it will be necessary to ascertain the current status of energy use and environmental conservation measures in the countries, as well as to provide acceptable, appropriate support to them. Under these circumstances, we conducted energy conservation audits (Hereinafter refer to as “Audit”) on a single industry in each of the ten ASEAN member countries and carried out transfers of Audit technologies during phase 1 in the years between 2000 and 2003. During phase 2 in the years between 2004 and 2008, we endeavored to conduct Audits and establish a foundation for the promotion of energy conservation in order to implement and disseminate improvement measures. The goal of phase 3 was to utilize the foundation for the promotion of energy conservation including technologies which are transferred up to now through the self-efforts of each ASEAN member country, and then disseminate and distribute widely throughout each ASEAN member country. In accordance with this goal, we provided support in 2010 for conducting autonomous Audits by each ASEAN member country as we had first put forth in 2009 and promoted the implementation and dissemination of improvement measures. In terms of specific activities, we carried out on-the-job training (OJT) for Audits at new factories in order to ensure the regional dissemination of Audit technologies. Furthermore, we compiled technical directory (TD) and produced an in-house database (IHD) for each industrial sector. This year, we carried out OJT for Audits at beer factories in Cambodia and Lao PDR, and an apparel manufacturing factory in Thailand. At the same time, we focused our efforts on dissemination activities by holding seminars and workshops in each of these countries, inviting governmental and factory-related officials belonging to other industrial sectors from non-host countries, presenting successful case studies in energy

conservation, and promoting information sharing within the ASEAN region. We hope that this project will contribute to energy and environmental conservation in industrial sectors in each ASEAN country and that these countries will achieve sustainable economic development in harmony with the environment. We also expect that this project will serve as a bridge of technological exchanges and friendship between Japan and the various countries in question.
March 2011
The Energy Conservation Center, Japan
Contents
Abbreviations Overview ········································································································1 I. Purpose and background of this project····································································5 II. Cambodia (food manufacture industry) ···································································7
1. Overview of activities ····················································································7 2. OJT of Audits on Factory A··············································································7 3. Seminar and workshop ················································································· 22
III. Lao PDR (food manufacture industry) ································································· 27 1. Overview of activities ·················································································· 27 2. OJT of Audits on Factory B············································································ 27 3. OJT for simplified Audit of building (Hotel C)······················································ 36 4. Seminar and workshop ················································································· 37
IV. Thailand (textile industry) ··············································································· 41 1. Overview of activities ·················································································· 41 2. OJT of Audits on Factory D ··········································································· 41 3. Seminar and workshop ················································································· 45
V. Developing TD and IHD·················································································· 47 1. Overview of the activities ·············································································· 47 2. Developing TD system ················································································· 47 3. Developing an IHD system ············································································ 48 4. Current state of building sector IHD and revisions as implemented······························· 48
i
Abbreviations as used in this report are as follows: General AHU Air Handling Unit AVR Automatic Voltage Regulator BMS Building Management System CFL Compact Fluorescent Lamp COP Coefficient of Performance CSR Corporate Social Responsibility DCS Distributed Control System DB/BM Database / Benchmark DHCR Direct Hot Charge Rolling DO Dissolved Oxygen DSM Demand Side Management EE&C Energy Efficiency and Conservation EEI Energy Efficiency Indicator EM H/B Energy Management Handbook EMS Energy Management System ESCO Energy Service Company FP Focal Point FRL Fluorescent Lamp GDP Gross Domestic Product GMP Good Manufacturing Practice GTG Gas Turbine Generator HACCP Hazard Analysis and Critical Control Point HVAC Heating, Ventilation & Air Conditioning IDF Induced Draft Fan IHD In-House Database ISO International Organization for Standardization JBIC Japan Bank for International Cooperation KPP Key Process Parameter LED Light Emitting Diode OJT On the job training PCB Printed Circuit Board PROMEEC Promotion on Energy Efficiency and Conservation SEC Specific Energy Consumption SCADA Supervisory Control and Data Acquisition SH Sensible heat TD Technical Directory TOD Total Oxygen Demand
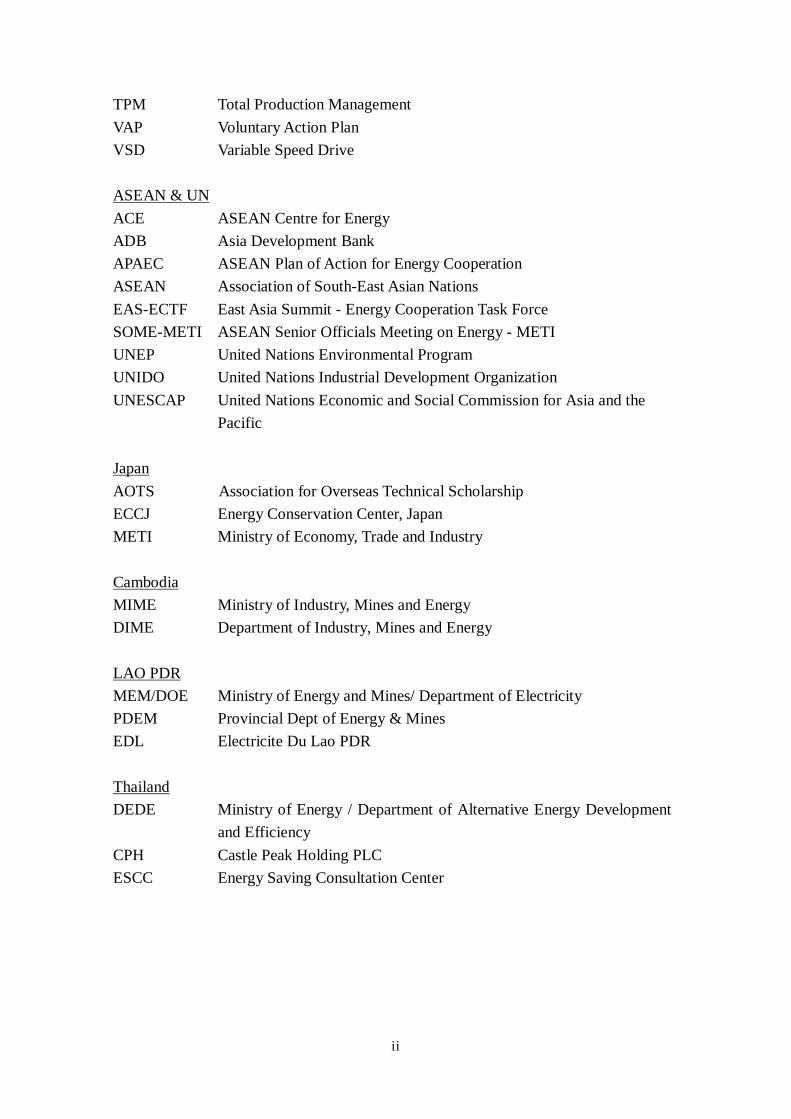
ii
TPM Total Production Management VAP Voluntary Action Plan VSD Variable Speed Drive ASEAN & UN ACE ASEAN Centre for Energy ADB Asia Development Bank APAEC ASEAN Plan of Action for Energy Cooperation ASEAN Association of South-East Asian Nations EAS-ECTF East Asia Summit - Energy Cooperation Task Force SOME-METI ASEAN Senior Officials Meeting on Energy - METI UNEP United Nations Environmental Program UNIDO United Nations Industrial Development Organization UNESCAP United Nations Economic and Social Commission for Asia and the
Pacific Japan AOTS Association for Overseas Technical Scholarship ECCJ Energy Conservation Center, Japan METI Ministry of Economy, Trade and Industry Cambodia MIME Ministry of Industry, Mines and Energy DIME Department of Industry, Mines and Energy LAO PDR MEM/DOE Ministry of Energy and Mines/ Department of Electricity PDEM Provincial Dept of Energy & Mines EDL Electricite Du Lao PDR Thailand DEDE Ministry of Energy / Department of Alternative Energy Development
and Efficiency CPH Castle Peak Holding PLC ESCC Energy Saving Consultation Center
1
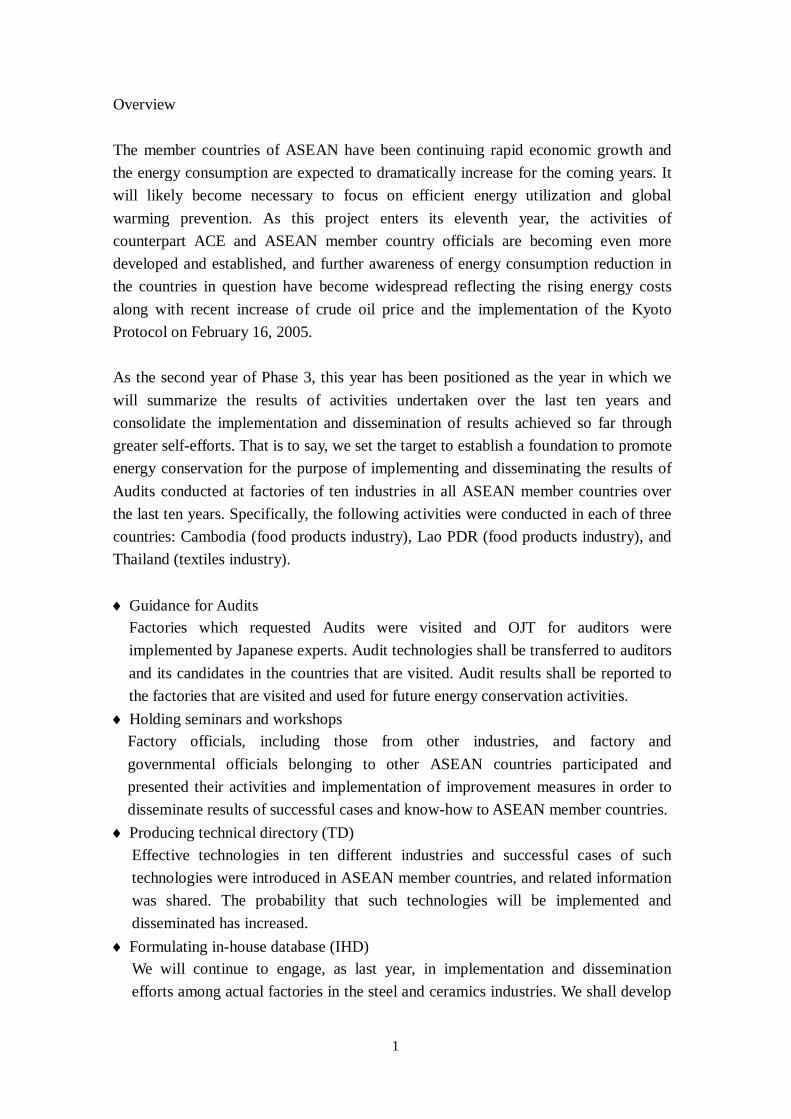
Overview The member countries of ASEAN have been continuing rapid economic growth and the energy consumption are expected to dramatically increase for the coming years. It will likely become necessary to focus on efficient energy utilization and global warming prevention. As this project enters its eleventh year, the activities of counterpart ACE and ASEAN member country officials are becoming even more developed and established, and further awareness of energy consumption reduction in the countries in question have become widespread reflecting the rising energy costs along with recent increase of crude oil price and the implementation of the Kyoto Protocol on February 16, 2005. As the second year of Phase 3, this year has been positioned as the year in which we will summarize the results of activities undertaken over the last ten years and consolidate the implementation and dissemination of results achieved so far through greater self-efforts. That is to say, we set the target to establish a foundation to promote energy conservation for the purpose of implementing and disseminating the results of Audits conducted at factories of ten industries in all ASEAN member countries over the last ten years. Specifically, the following activities were conducted in each of three countries: Cambodia (food products industry), Lao PDR (food products industry), and Thailand (textiles industry).
Guidance for Audits Factories which requested Audits were visited and OJT for auditors were
implemented by Japanese experts. Audit technologies shall be transferred to auditors and its candidates in the countries that are visited. Audit results shall be reported to the factories that are visited and used for future energy conservation activities. Holding seminars and workshops Factory officials, including those from other industries, and factory and governmental officials belonging to other ASEAN countries participated and presented their activities and implementation of improvement measures in order to disseminate results of successful cases and know-how to ASEAN member countries. Producing technical directory (TD) Effective technologies in ten different industries and successful cases of such technologies were introduced in ASEAN member countries, and related information was shared. The probability that such technologies will be implemented and disseminated has increased.
Formulating in-house database (IHD) We will continue to engage, as last year, in implementation and dissemination efforts among actual factories in the steel and ceramics industries. We shall develop

2
new IHDs for the automotive, oil refining, and pharmaceutical industries and utilize these IHDs on a trial basis at actual factories and investigate the effectiveness thereof.
Seminars and workshops held in each country have attracted numerous participants from factories and government. These seminars and workshops have fulfilled their significant roles in terms of the sharing and dissemination of information.
3
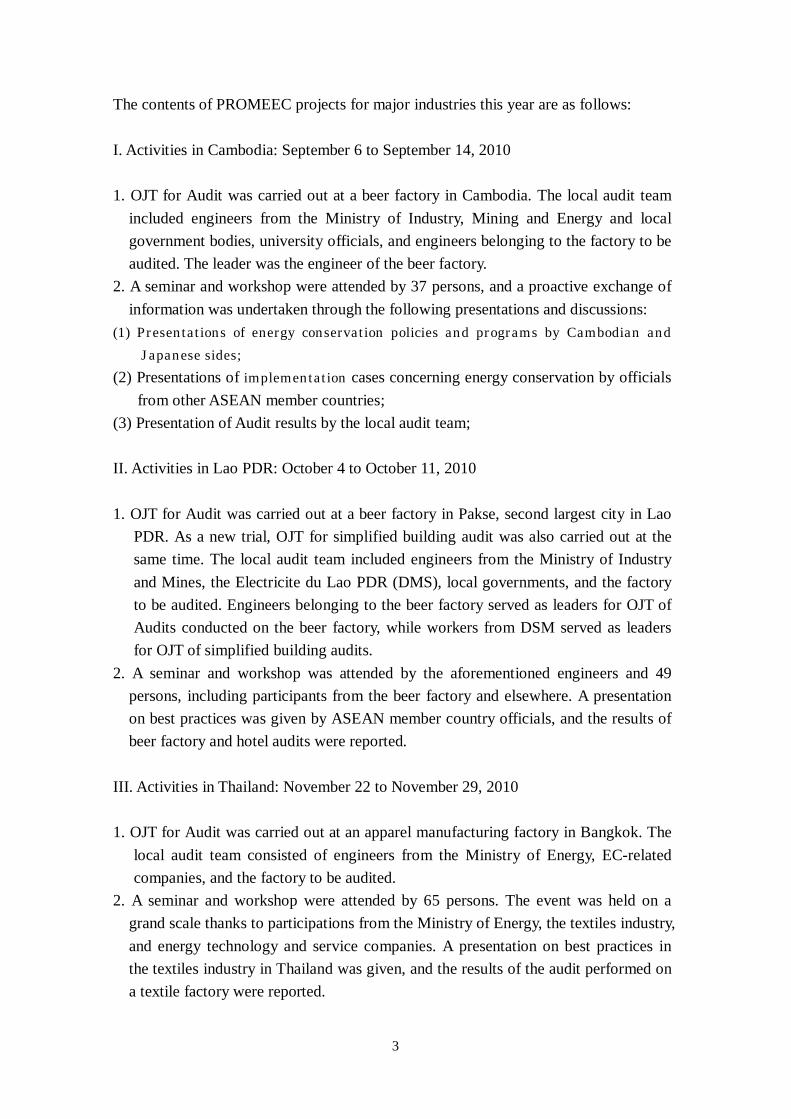
The contents of PROMEEC projects for major industries this year are as follows: I. Activities in Cambodia: September 6 to September 14, 2010 1. OJT for Audit was carried out at a beer factory in Cambodia. The local audit team
included engineers from the Ministry of Industry, Mining and Energy and local government bodies, university officials, and engineers belonging to the factory to be audited. The leader was the engineer of the beer factory.
2. A seminar and workshop were attended by 37 persons, and a proactive exchange of information was undertaken through the following presentations and discussions:
(1) Presentations of energy conservation policies and programs by Cambodian and Japanese sides;
(2) Presentations of implementation cases concerning energy conservation by officials from other ASEAN member countries;
(3) Presentation of Audit results by the local audit team; II. Activities in Lao PDR: October 4 to October 11, 2010 1. OJT for Audit was carried out at a beer factory in Pakse, second largest city in Lao
PDR. As a new trial, OJT for simplified building audit was also carried out at the same time. The local audit team included engineers from the Ministry of Industry and Mines, the Electricite du Lao PDR (DMS), local governments, and the factory to be audited. Engineers belonging to the beer factory served as leaders for OJT of Audits conducted on the beer factory, while workers from DSM served as leaders for OJT of simplified building audits.
2. A seminar and workshop was attended by the aforementioned engineers and 49 persons, including participants from the beer factory and elsewhere. A presentation on best practices was given by ASEAN member country officials, and the results of beer factory and hotel audits were reported.
III. Activities in Thailand: November 22 to November 29, 2010 1. OJT for Audit was carried out at an apparel manufacturing factory in Bangkok. The
local audit team consisted of engineers from the Ministry of Energy, EC-related companies, and the factory to be audited.
2. A seminar and workshop were attended by 65 persons. The event was held on a grand scale thanks to participations from the Ministry of Energy, the textiles industry, and energy technology and service companies. A presentation on best practices in the textiles industry in Thailand was given, and the results of the audit performed on a textile factory were reported.

4
Finally, in implementing this project, we were able to obtain the full cooperation of persons in charge from ACE, relevant organizations and companies from each country. We hereby take this opportunity to express our sincere appreciation for their efforts.
5
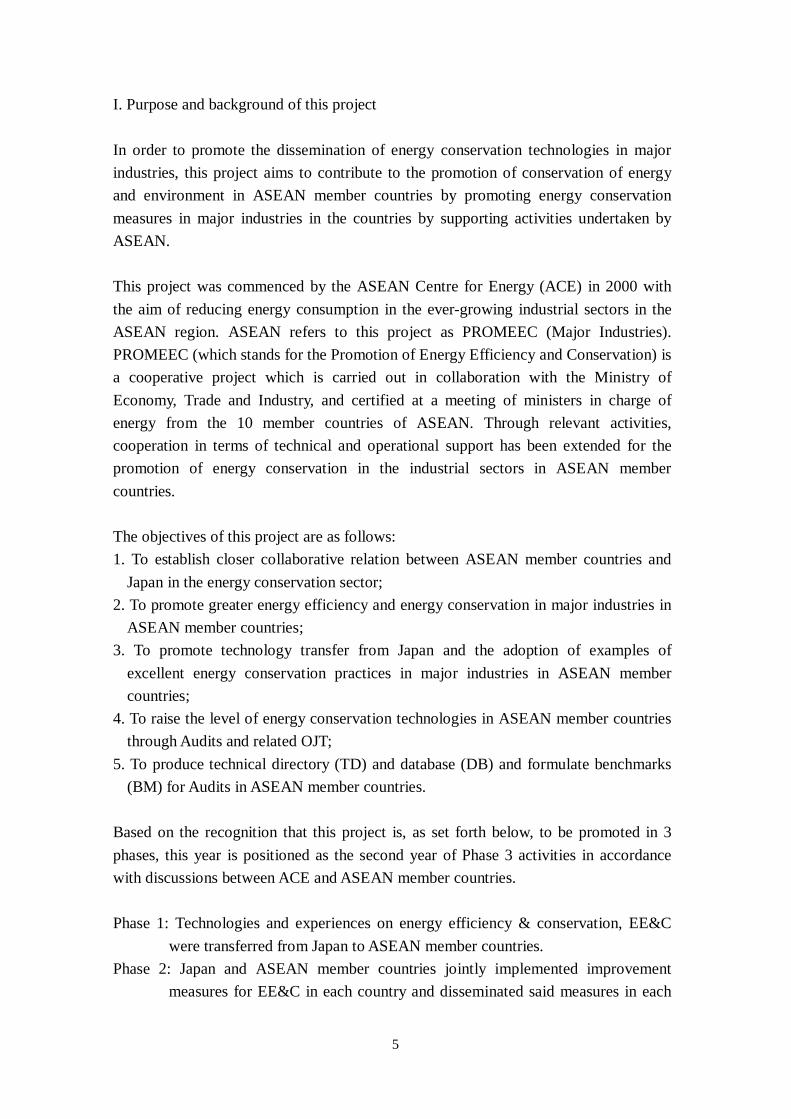
I. Purpose and background of this project In order to promote the dissemination of energy conservation technologies in major industries, this project aims to contribute to the promotion of conservation of energy and environment in ASEAN member countries by promoting energy conservation measures in major industries in the countries by supporting activities undertaken by ASEAN. This project was commenced by the ASEAN Centre for Energy (ACE) in 2000 with the aim of reducing energy consumption in the ever-growing industrial sectors in the ASEAN region. ASEAN refers to this project as PROMEEC (Major Industries). PROMEEC (which stands for the Promotion of Energy Efficiency and Conservation) is a cooperative project which is carried out in collaboration with the Ministry of Economy, Trade and Industry, and certified at a meeting of ministers in charge of energy from the 10 member countries of ASEAN. Through relevant activities, cooperation in terms of technical and operational support has been extended for the promotion of energy conservation in the industrial sectors in ASEAN member countries. The objectives of this project are as follows: 1. To establish closer collaborative relation between ASEAN member countries and
Japan in the energy conservation sector; 2. To promote greater energy efficiency and energy conservation in major industries in
ASEAN member countries; 3. To promote technology transfer from Japan and the adoption of examples of
excellent energy conservation practices in major industries in ASEAN member countries;
4. To raise the level of energy conservation technologies in ASEAN member countries through Audits and related OJT;
5. To produce technical directory (TD) and database (DB) and formulate benchmarks (BM) for Audits in ASEAN member countries.
Based on the recognition that this project is, as set forth below, to be promoted in 3 phases, this year is positioned as the second year of Phase 3 activities in accordance with discussions between ACE and ASEAN member countries. Phase 1: Technologies and experiences on energy efficiency & conservation, EE&C
were transferred from Japan to ASEAN member countries. Phase 2: Japan and ASEAN member countries jointly implemented improvement
measures for EE&C in each country and disseminated said measures in each

6
country as well as in other countries. Phase 3: Energy conservation is promoted through the self-help efforts of ASEAN
member countries. In Phase 1, Audits and audit technology transfer were carried out on a single industry in each of the ten ASEAN member countries (completed in 2003). In Phase 2, establishment of a foundation to promote energy conservation for the purpose of implementing and disseminating improvement measures were being conducted, along with Audits (completed in 2008). In Phase 3, the goal was to utilize the base for energy conservation promotion, including technology which is transferred, through the self-help efforts of each ASEAN member country, and disseminate and distribute it widely throughout each ASEAN member country (commenced in 2009). In accordance with the background and aims above, autonomous Audits by each ASEAN member country was supported, and the implementation and dissemination of improvement measures was promoted in 2010. Specifically, Audits to ensure the regional dissemination of Audit technologies were conducted at new factories. In addition, we compiled technical directories (TD) and produced an in-house database (IHD) for each industrial sector. Audits were conducted at beer factories in Cambodia and Lao PDR and an apparel manufacturing factory in Thailand. At the same time, we held seminars and workshops, invited governmental and factory-related officials belonging to other industrial sectors from non-host countries, presented successful case studies in energy conservation, and promoted the information sharing within the ASEAN region.
7
II. Cambodia (food manufacture industry) 1. Overview of activities In order to implement the Project for the Promotion of Energy Conservation in Major Industries in ASEAN Countries (of the International Project for the Development of Infrastructure for Rationalizing Energy Use, a METI-outsourced project), we visited Cambodia from September 5 to 16, and carried out an OJT of Audit at a beer factory situated in Sihanoukville, a seminar and workshop for the purpose of exchanging information with officials from Cambodian industry and ASEAN member countries. 23 persons, including engineers from the Ministry of Industry, Mining and Energy and concerned local government bodies, university officials, and engineers belonging to the factory to be audited as well as engineers from ECCJ and ACE, participated in the OJT of Audit that was conducted on the beer factory. A seminar and workshop were attended by a total of 37 persons, including the persons referred above and were concluded on a successful note. Dispatched officials: Hiroshi Shibuya, Taichiro Kawase (Technical Cooperation
Department); Tsutomu Kawasaki (Mayekawa Mfg. Co., Ltd., dispatched instructor) Schedule of activities:
Sept. 6 to 13: OJT of Audit (Factory A) Sept. 14: Seminar and workshop (in Sihanoukville)
2. OJT of Audits on Factory A (1) Participants: 23 persons
Ministry of Industry, Mines and Energy (MIME): 4 participants/ Mr. Lien Vuthy (local team leader), Mr. Khlaing Amradararith, Mr. Khlaut Ousa, Mr. Chhon Chhim
Department of Industry, Mines and Energy (DIME): 3 participants/ Mr. Chan Chourn, Mr. Som Savath, Mr. Koeut RA
Factory A: 3 participants/ Mr. TY Puthy, Mr. Chor Sambath, Mr. Nop Chanra ACE: 2 participants/ Mr. Christopher Zamora, Mr. Junianto ECCJ: 3 participants/ Hiroshi Shibuya, Taichiro Kawase, Tsutomu Kawasaki interpreter (one person), others (seven persons)
(2) Overview of factory: Factory A The factory started its operation under the current framework in 1992, working for 18 years. The factory is currently in a state of full operation, with the capacity for beer
8
production at 480 kiloliters per day. The factory has three smoke tube boilers with a steam generation capacity of 10 tons per hour and steam pressure of 7 bars. Heavy fuel oil and diesel fuel are used for fuel and a forced-draft system based on the use of combustion air fans is utilized. An ammonia refrigerant-based mechanical compression-type refrigeration system has been adopted, with compressors consisting of three reciprocal-type units and six screw-type units. Ammonia condensation is achieved with the use of five evaporative condensers while ammonia evaporation is achieved with the use of plate-type heat exchangers; glycol (PG) cooling and chilled water production is thereby undertaken. As air compressors, three 75 kW screw compressors are installed. Their discharge pressure is rated at 7.5 bars and their flow rate is rated at 11.6 m3/min. The installation works of ammonia compressors, evaporative condensers, ammonia receivers, and other equipment units is presently underway in order to improve the capacity to produce beer.
(3) Audit overview 1) Composition of audit team The overall audit team was divided into 2 groups: the utility audit team and the process audit team. The utility audit team consisted of a total of 10 persons: one engineer belonging to the factory, 4 officials from related government agencies, engineers belonging to other factories in the vicinity, and 2 officials from ECCJ and ACE. The factory engineer served as the team leader. The process audit team consisted of a total of 15 persons: 2 engineers belonging to the factory, 5 officials from related government agencies, engineers belonging to other factories in the vicinity, and 3 officials from ECCJ and ACE. A factory engineer served as the team leader. 2) Steps of the audit work The audit was performed according to the following sequence: interview concerning energy conservation activities at the factory; inspections of the equipments, data collection, and analyses based on measurements using measuring instruments, operational logs, and other sources; the formulation of energy conservation measures; and the reporting of audit results to factory officials. At each step of the audit, explanations of the significance of the work performed was given to participants, intermediate data analysis was conducted, and explanations and instructions were given in regards to the data analysis process. In order to thoroughly engage in explanations and instructions on an interactive basis, explanations were given by gathering the participants together in front of a white board, and participants themselves measured and took records.
9
3) Measurements and data collection As many participants of OJT have not experienced measurements before, guidance was given in advance on the purpose of measurement work, measurement items, measurement sites, and the measuring instruments to be used. In carrying out measurement work, persons in charge of each measuring instrument were assigned, and data were collected under the assumption that such work would be performed in the presence of factory supervisors. With respect to data for which measuring instruments could not be prepared, readings of gauges attached to equipment were taken, and data from operational logs were gleaned. 4) Audit of utility equipments (i) State of the boiler equipment - Three boilers with a steam generation capacity of 10 tons per hour and steam pressure
of 7 bars have been installed. Under normal operations, the number 2 boiler is running and the number 3 boiler is on standby. Where steam pressure in the factory is insufficient, the number 3 boiler starts operation.
- For fuel, the number 2 boiler operates by a heavy fuel oil firing process and has a heavy fuel oil heater attached while the number 3 boiler operates by a diesel fuel oil firing process and no fuel oil heater is attached. Fuel flow is read hourly with an integrating meter and recorded in the daily log.
- Steam flow are ascertained with an integrating meter installed on each boiler’s water supply line and recorded in the daily log every hour; blow downs are undertaken manually on an intermittent basis. The blow down volume is not ascertained.
- Water supply to the boilers is done by degassing mixture of process-generated return condensate and soft water processed only with brine-softening equipment.
- The ventilation system is a forced draft system by combustion air fans. - The volume of combustion air is automatically adjusted according to mechanically
with the fuel flow. The valve position indicator corresponding to the volume of combustion air was set to approximately 50%. At this time, the boiler load was low at a little over 4 tons per hour compared to the rated load of 10 tons per hour.
- No air pre-heater or economizer has been installed. No gas exhaust duct damper could be confirmed.
(ii) Boiler audit - Exhaust gas temperatures and oxygen concentration of exhaust gas
The loss of exhaust gas represents the largest source of energy loss of boilers. In this connection, the temperature of the exhaust gas and the oxygen concentration of the exhaust gas were measured in order to ascertain the extent of the loss of exhaust gas. The temperature of the exhaust gas was 170˚C by checking the exhaust gas thermometer installed onto these boilers. The oxygen concentration ranged between 0.9 % and 1.2% based on measurements taken with an oxygen
10
analyzer. If the oxygen concentration is 1 vol. %, the air ratio will be 1.05. As the temperature of the exhaust gas is 170˚C, the amount of exhaust gas that would be lost is approximately 7%. According to the energy conservation standards of the Energy Conservation Law in Japan, the temperature of exhaust gas should be between 180 and 220˚C and the oxygen content should be between 3.5 and 5.0% in the case of small-sized boilers. Accordingly, boiler number 2 at the factory satisfies these standards, such that it can be said that there are no outstanding issues from the standpoint of energy conservation. These boilers have no air pre-heaters or economizers installed. In this fact, what accounts for these boilers’ high level of efficiency? A low-load operation is the most important factor in this case. As indicated earlier, the boiler load is low at a little over 4.4 tons per hour compared to the rated capacity of 10 tons per hour. Thus, there is considerable space in the heat transfer area of the steam generating tubes, resulting in the decline of exhaust gas temperature. A low air ratio operation is the second most important factor that can be identified in this case. Consequently, highly efficient operations that satisfy the standards of the Energy Conservation Law in Japan are undertaken. Nevertheless, where heavy fuel oil is burned and operations with an air ratio of 1.05 are undertaken, the possibility of incomplete combustion of fuel is high. In other words, unburned fuel loss is generated. Upon visually examining the exhaust gas from the stack of the boiler, black smoke - albeit a small amount - was observed. However, to estimate the actual combustion efficiency, it will be necessary to measure the concentration of carbon monoxide in the exhaust gas and quantitatively study the extent of the incomplete combustion.
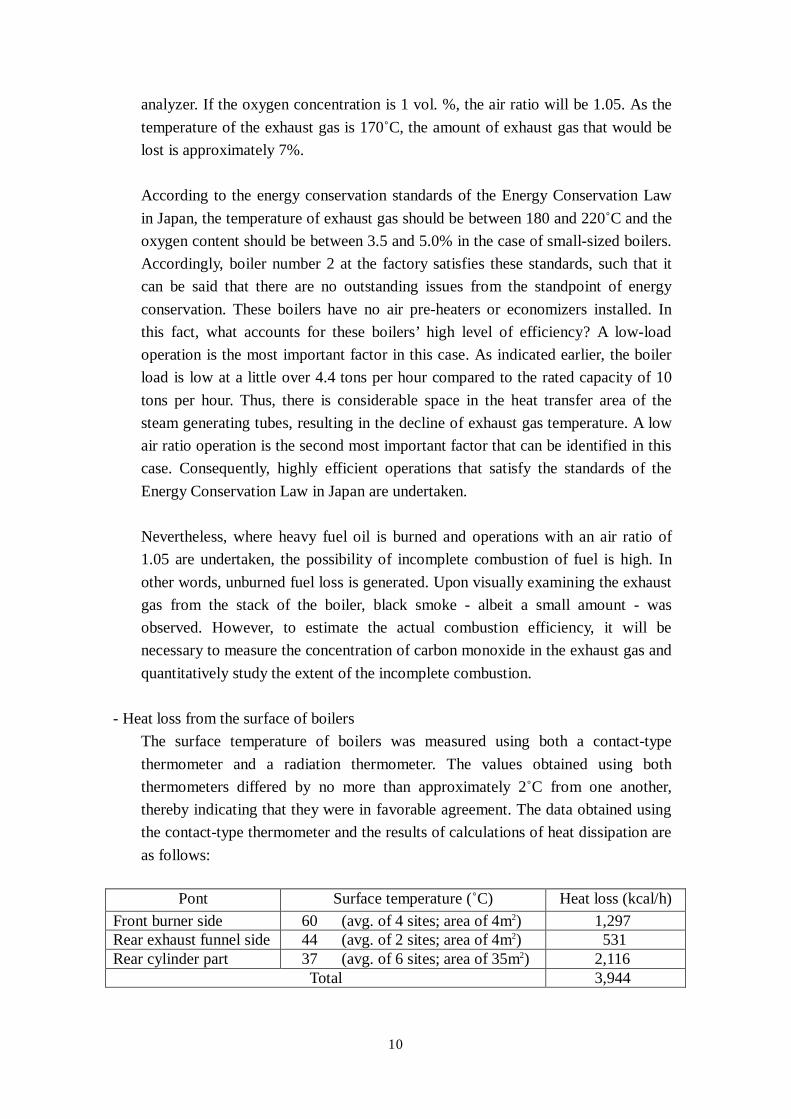
- Heat loss from the surface of boilers The surface temperature of boilers was measured using both a contact-type thermometer and a radiation thermometer. The values obtained using both thermometers differed by no more than approximately 2˚C from one another, thereby indicating that they were in favorable agreement. The data obtained using the contact-type thermometer and the results of calculations of heat dissipation are as follows:
Pont Surface temperature (˚C) Heat loss (kcal/h) Front burner side 60 (avg. of 4 sites; area of 4m2) 1,297 Rear exhaust funnel side 44 (avg. of 2 sites; area of 4m2) 531 Rear cylinder part 37 (avg. of 6 sites; area of 35m2) 2,116
Total 3,944
11
Total heat loss was equivalent to approximately 0.5% of the heat generated by the combustion of the fuel. Heat loss for regular boilers range between 1 and 2%, which is a relatively low level. This is because the average surface temperature for these boilers at 40˚C is low compared to normal boilers, whose average surface temperature is 60˚C. At the same time, these boilers satisfy the standards of the Energy Conservation Law in Japan with respect to surface temperature, which the surface temperature should be no higher than between 70 and 80˚C. Based on the above data, it can be determined that there is no need to augment the existing thermal insulation with new thermal insulation.
- Measuring the condensate recovery rate
A quantitative estimate was made to which extent clean condensate is returned to the boiler house. By the heat balance of the water that enters and leaves the boiler feed tank, the condensate recovery rate was estimated to be 16%. The recovery rate at Japanese beer factories is approximately 60%, which suggests that there is significant room for improvement. For the time being, we recommend to start from focusing on recovering condensate in steam traps and steam heaters.
- Boiler efficiency According to the estimation of boiler efficiency by indirect method, the calculation result of 91.9%. Such a high level of efficiency is unrealistic, and it is highly possible that the unburned fuel loss has attributed to incomplete combustion or blow down loss has actually been underestimated.
- Evaporation ratio Based on data obtained from the number 2 boiler’s cumulative flow meter, the evaporation ratio was estimated 14.6. Compared to the evaporation ratio at Japanese factories which is between 14 and 15, this boiler can be described quite highly efficient.
- Guidance of combustion control Combustion control should be undertaken by measuring the temperature of exhaust gas or the concentration of oxygen or by otherwise using measuring instruments. However, many small to medium-sized enterprise do not possess such measuring instruments. In this connection, we inspected the number 2 boiler as example with participants, the color and form of the burner flame, the smoke in the exhaust gas from stack, and let them understand that combustion control can be undertaken without the use of measuring instruments. As it happened that black smoke was seen in the exhaust gas from stack, we provided instructions through the use of a white board on such matters with respect to the cause of this black smoke as the state of the mixture of heavy oil and air in the burner, the meaning of the diameter of atomized heavy oil droplets, and the relationship between the
12
viscosity of heavy oil and the diameter of oil droplets. In addition, a visual inspection of the flame revealed that the flame was a dark-red color on this day. We explained that, with proper combustion, the flame should be a red-orange color and that a dark-red flame is an indication of insufficient air.
(iii) Reinforcing thermal insulation of the steam piping system
Lack and damage of thermal insulation could be seen at various points of the steam piping system. Prompt repairs are required. In addition, valves, flanges, and many other piping attachments lack thermal insulation.
(iv) Audit of the refrigeration system
In order to ferment raw material and store products at low temperatures at a beer factory, significant amounts of law temperature energy from refrigeration are required. Much of this energy is supplied as electrical energy used to power ammonia compressors. Energy conservation measures for a refrigeration system can be generally divided into refrigeration supply-side measures, refrigeration demand-side measures, and common measures. For this audit, we investigated matters concerning the lowering of the ammonia condensation temperature and the lowering of the refrigeration load.
- State of refrigeration equipment At this factory, an ammonia refrigerant-based mechanical compression-type refrigeration system has been adopted, with compressors consisting of three reciprocal-type units and six screw-type units. Ammonia condensation is composed with the five evaporative condensers while ammonia evaporation is consisting of the plate-type heat exchangers. Glycol (PG) cooling and chilled water production are thereby undertaken.
- Energy conservation effects by lowering the ammonia condensation temperature In general, the efficiency of a refrigeration system is evaluated by coefficient of performance (COP). COP is defined, in simple terms, as an indicator of the number of kilowatts of refrigeration that can be obtained by consuming one kilowatt of electrical power. With a chiller which is designed at condensation temperature of 38˚C and evaporation temperature of -9˚C, the COP will improve by 2.2% if the condensation temperature is lowered by 1˚C. In the case of a chiller with 132 kW of shaft power, 132 x 0.022 = 2.9 kW of energy can be conserved. This formula is also valid for any rise in the evaporation temperature. If too much cooling was taken place on the process side, approximately 2.2% of power consumption savings could be expected by raising the cooling temperature by 1˚C.
- Lowering the refrigeration load While measurements were taken of the surface temperature of low-temperature pipes and the heat inflow and power-saving effects were calculated, it was determined that
13
the amount of electrical power saved was low and that the recovery of the construction costs with thermal insulation would be difficult.
(v) Audit of compressed air system - State of the operations of air compressors
Three 75 kW screw compressors have been installed. Their discharge pressure is rated at 7.5 bars and their flow rate is rated at 11.6 m3/min. For the control of pressure, set values have been determined for the on-loading pressure and the unloading pressure for each compressor. When the compressor reaches on-loading pressure it starts compression, and goes into an unloading state when it reaches unloading pressure. The actual discharge pressure averages approximately 7 bars. While we skipped measurements of the time of unload status due to time constraints, there was no unload state period, judging from the sounds of compressors. It could be assumed that these compressors are operating at full capacity all the time.
- Investigation of the compressed air consumption process The number of employees who are aware of the purpose of using compressed air and the required pressure level is unexpectedly low. For example, compressed air is often used for the purpose of water drainage. Up to 1 bar of pressure is normally sufficient to drain water, and an air compressor can be converted into an air blower. In this connection, we conducted interviews concerning the purpose of using compressed air and the required pressure levels, and obtained the following investigation results:
Purpose of using compressed air Required pressure/ bar Remote-controlled valve drive 4 (Fermentation tank sequence, CIP sequence) Remote opening/closing of grain screw conveyer 6 Lifting drive of packaging machinery (barrels) 5 Lifting drive of packaging machinery (bottles and cans) 3 Supplying instrument air to pneumatic control valves 6
At this factory, we ascertained that compressed air is used for mechanical drivers and control valves, and their maximum required pressures are 6 bars. Generally speaking, a reduction of discharge pressure from 7 bars to 6 bars will result in a 7 to 8 % decrease in power consumption. Accordingly, we advised the factory to inquire with driver machine manufacturers and control valve manufacturers to determine whether required pressure levels can be reduced and to investigate machinery that can be run at lower levels of pressure.
- With respect to the energy conservation effects of lowering the temperature of intake
air, the temperature of compressed intake air at this factory was 31.7˚C. The
14
temperature of outdoor air in the shade at this time was 30˚C. Given such a difference in temperatures, the power saving rate will only be approximately 0.5% and the recovery of duct construction costs to intake the outside air will be difficult.
- Location of the air compressor room
The air compressors room at this factory is located near the center of a rectangular factory building. It is estimated that the piping that extends from the air compressors room to the terminal process is no more than 200 meters in length. At this distance, the pressure drop from the air compressors to the terminal process should be under 0.5 bars. However, there is an actual drop in pressure of at least 1 bar. It is highly possible that the diameter of the compressed air pipes is too small.
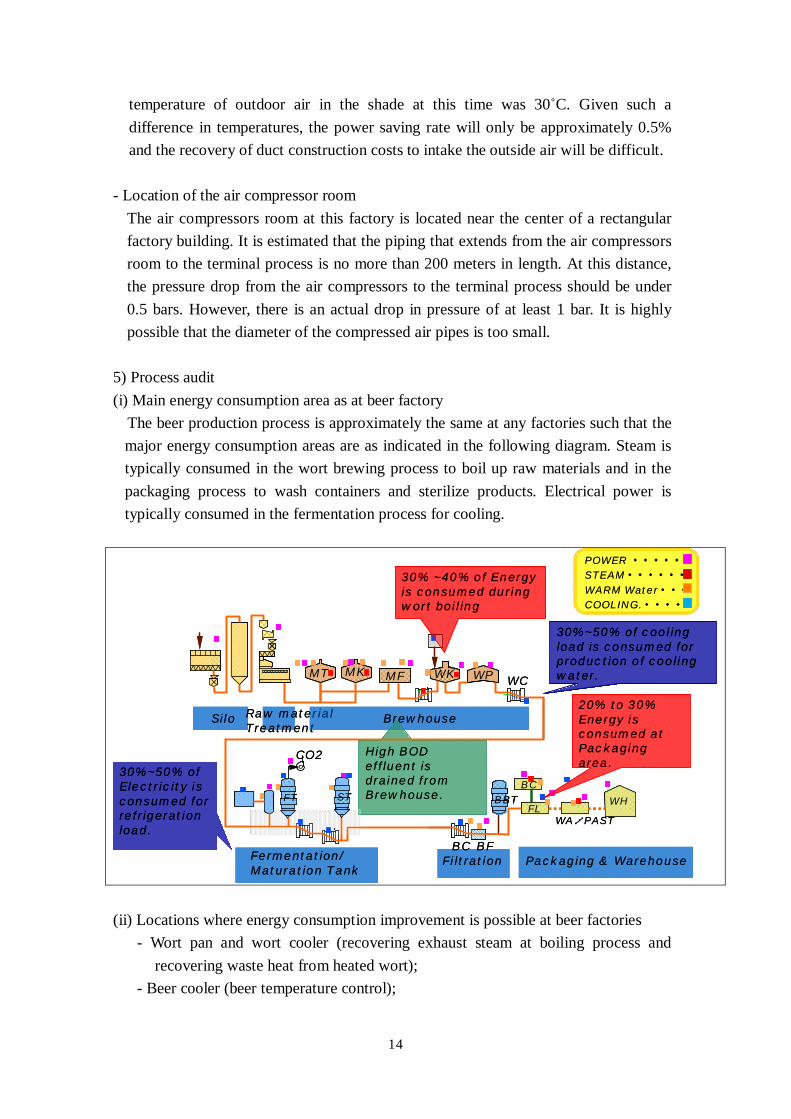
5) Process audit (i) Main energy consumption area as at beer factory
The beer production process is approximately the same at any factories such that the major energy consumption areas are as indicated in the following diagram. Steam is typically consumed in the wort brewing process to boil up raw materials and in the packaging process to wash containers and sterilize products. Electrical power is typically consumed in the fermentation process for cooling.
Silo Raw material Treatment
Brewhouse
MT MK WK WP WCMF
Filtration Packaging & WarehouseBC
BC
FLWA/PAST
WH
BFFermentation/Maturation Tank
FT
CO2
POWER ・・・・・STEAM・・・・・・WARM Water・・・COOLING.・・・・
30% ~40% of Energy is consumed during wort boiling
30%~50% of Electricity is consumed for refrigeration load.
30%~50% of cooling load is consumed for production of cooling water.
20% to 30% Energy is consumed at Packaging area.
High BOD effluent is drained from Brewhouse. BBTST
Silo Raw material Treatment
Brewhouse
MT MK WK WP WCMF
Filtration Packaging & WarehouseBC
BC
FLWA/PAST
WH
BFFermentation/Maturation Tank
FT
CO2
POWER ・・・・・STEAM・・・・・・WARM Water・・・COOLING.・・・・
30% ~40% of Energy is consumed during wort boiling
30%~50% of Electricity is consumed for refrigeration load.
30%~50% of cooling load is consumed for production of cooling water.
20% to 30% Energy is consumed at Packaging area.
High BOD effluent is drained from Brewhouse. BBTBBTSTST
(ii) Locations where energy consumption improvement is possible at beer factories
- Wort pan and wort cooler (recovering exhaust steam at boiling process and recovering waste heat from heated wort);
- Beer cooler (beer temperature control);
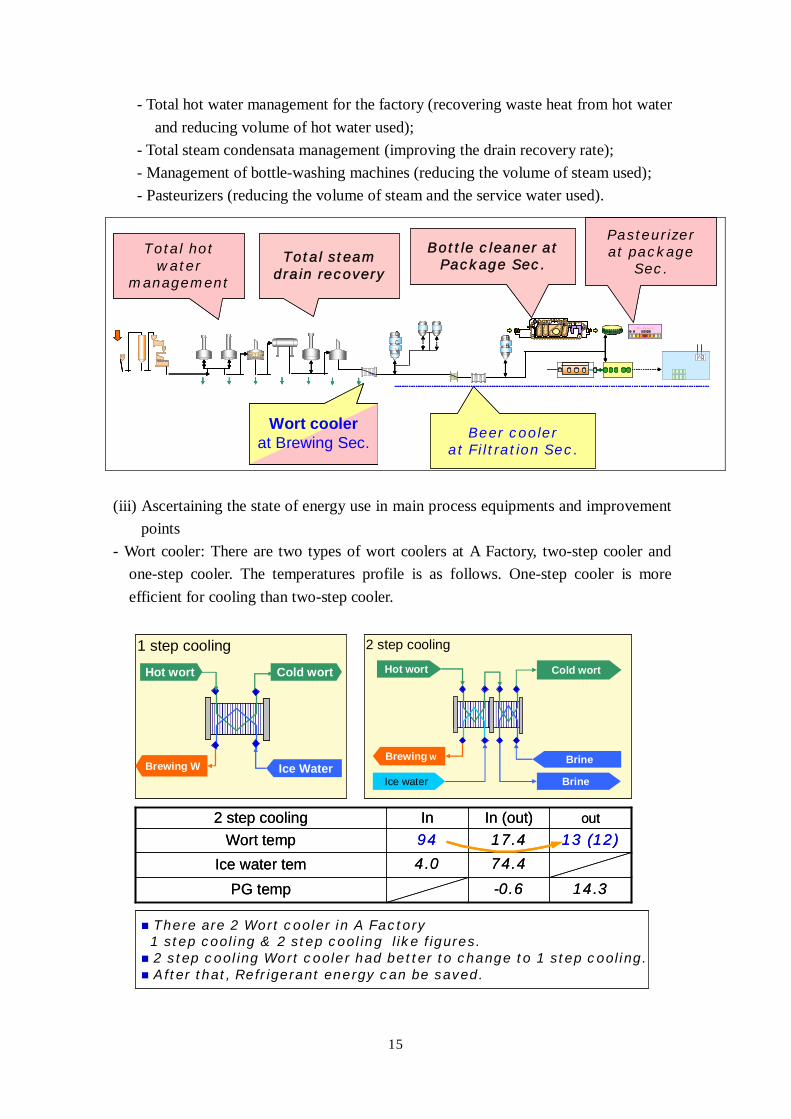
15
- Total hot water management for the factory (recovering waste heat from hot water and reducing volume of hot water used);
- Total steam condensata management (improving the drain recovery rate); - Management of bottle-washing machines (reducing the volume of steam used); - Pasteurizers (reducing the volume of steam and the service water used).
(iii) Ascertaining the state of energy use in main process equipments and improvement
points - Wort cooler: There are two types of wort coolers at A Factory, two-step cooler and
one-step cooler. The temperatures profile is as follows. One-step cooler is more efficient for cooling than two-step cooler.
1 step cooling
Hot wort Cold wort
Ice WaterBrewing W
-0.6
74.4
17.4In (out)
4.0Ice water tem14.3PG temp
13 (12)94Wort tempoutIn 2 step cooling
2 step cooling
Hot wort Cold wort
Brine
Brine
Brewing W
Ice water
There are 2 Wort cooler in A Factory1 step cooling & 2 step cooling like figures.2 step cooling Wort cooler had better to change to 1 step cooling.After that, Refrigerant energy can be saved.
Total hot water
management
Beer cooler at Filtration Sec.
Bottle cleaner at Package Sec.
Pasteurizerat package
Sec.
BBT
CCV
Wort coolerat Brewing Sec.
Total steam drain recovery
Total hot water
management
Beer cooler at Filtration Sec.
Bottle cleaner at Package Sec.
Pasteurizerat package
Sec.
BBT
CCV
BBT
CCV
BBT
CCV
Wort coolerat Brewing Sec.
Wort coolerat Brewing Sec.
Total steam drain recovery
16
<Improvement points> Replacing the two-step cooler to one-step cooler will be more efficient for cooling. And it is possible to increase cooling capacity by increasing the number of plates in a plate-type heat exchanger.
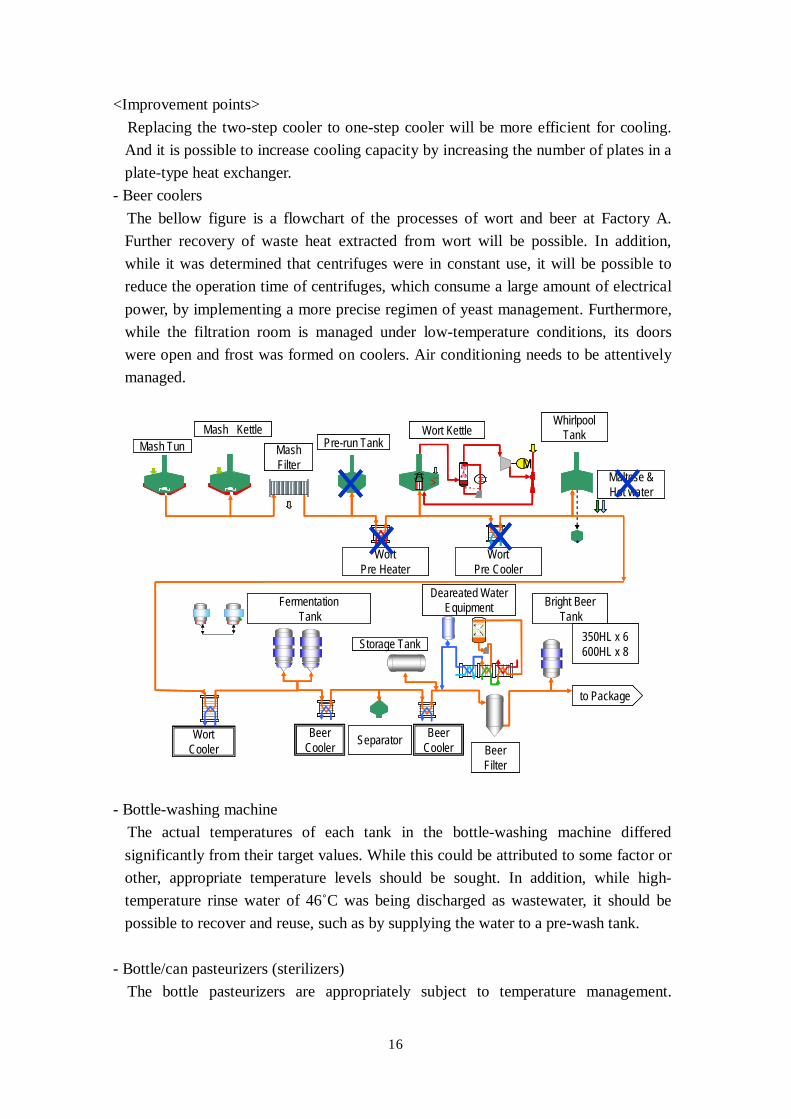
- Beer coolers The bellow figure is a flowchart of the processes of wort and beer at Factory A. Further recovery of waste heat extracted from wort will be possible. In addition, while it was determined that centrifuges were in constant use, it will be possible to reduce the operation time of centrifuges, which consume a large amount of electrical power, by implementing a more precise regimen of yeast management. Furthermore, while the filtration room is managed under low-temperature conditions, its doors were open and frost was formed on coolers. Air conditioning needs to be attentively managed.
MMash Filter
Mash KettleMash Tun
Wort KettlePre-run Tank
Whirlpool Tank
Wort Pre Heater
FermentationTank
Bright BeerTank
Wort Cooler
Beer Cooler
to Package
Deareated Water Equipment
Maltose &Hot water
Wort Pre Cooler
Separator
350HL x 6600HL x 8
Beer Cooler Beer
Filter
Storage Tank
MMash Filter
Mash KettleMash Tun
Wort KettlePre-run Tank
Whirlpool Tank
Wort Pre Heater
FermentationTank
Bright BeerTank
Wort Cooler
Beer Cooler
to Package
Deareated Water Equipment
Maltose &Hot water
Wort Pre Cooler
Separator
350HL x 6600HL x 8
Beer Cooler Beer
Filter
Storage Tank
- Bottle-washing machine The actual temperatures of each tank in the bottle-washing machine differed significantly from their target values. While this could be attributed to some factor or other, appropriate temperature levels should be sought. In addition, while high- temperature rinse water of 46˚C was being discharged as wastewater, it should be possible to recover and reuse, such as by supplying the water to a pre-wash tank.
- Bottle/can pasteurizers (sterilizers)
The bottle pasteurizers are appropriately subject to temperature management.
17
However, as for the can pasteurizer, the circulating hot water temperatures of the heating tank and the hold tank were reversed, and a change to settings is necessary from the standpoint of energy conservation.
(iii) Improvement points of thermal insulation - Feed cooker: The upper part of the feed cooker is not insulated. By applying thermal
insulation, heat loss can be reduced. - Thermal insulation of beer pipes from the BBT (bright beer tank) to fillers: Dew
formation is occurring on the outer surface of the thermal insulation. Since the insulation performance is poor, an upgrading of the thermal insulation to an appropriate grade will be necessary.
- High-temperature parts of the bottle-washing machine and the pasteurizers: By applying the same thermal insulation to these high-temperature parts as used for the hot-water tank, heat loss can be reduced.
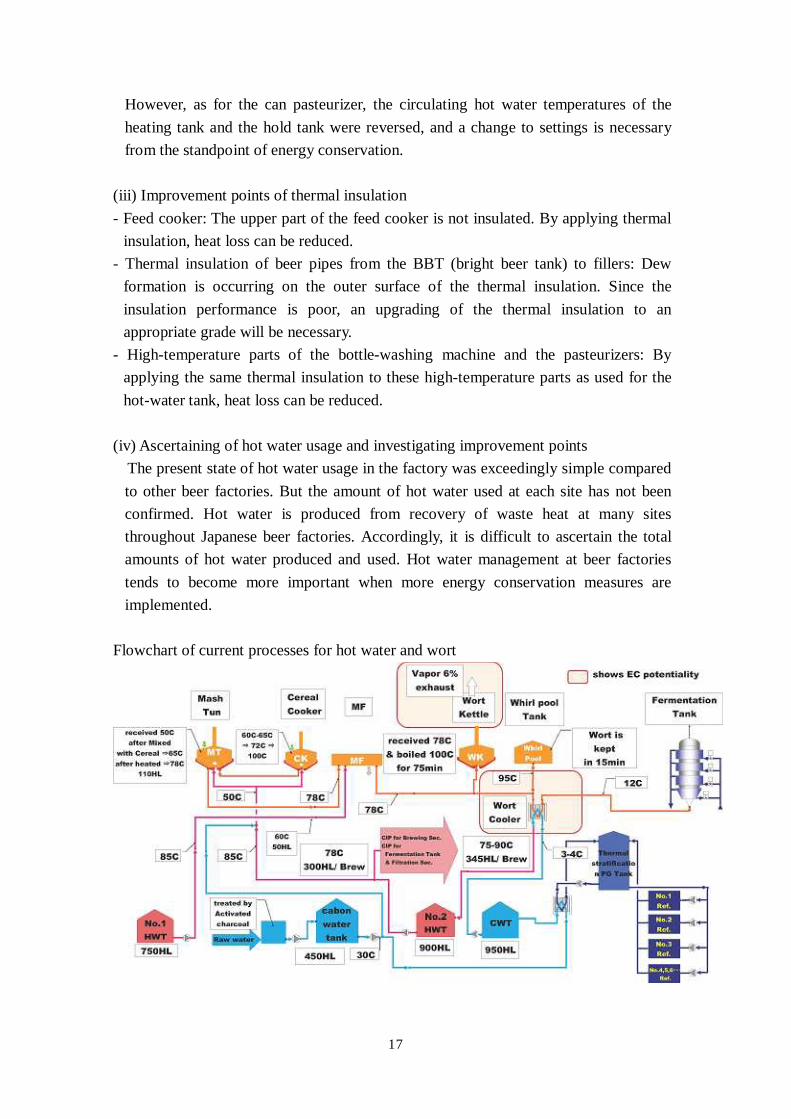
(iv) Ascertaining of hot water usage and investigating improvement points
The present state of hot water usage in the factory was exceedingly simple compared to other beer factories. But the amount of hot water used at each site has not been confirmed. Hot water is produced from recovery of waste heat at many sites throughout Japanese beer factories. Accordingly, it is difficult to ascertain the total amounts of hot water produced and used. Hot water management at beer factories tends to become more important when more energy conservation measures are implemented.
Flowchart of current processes for hot water and wort
18
Waste heat recovery sites
Process Equipment/system name Comment
Feed Wort kettle Recovery of exhaust steam from boiling Same as above Wort pre-cooler Recovery of waste heat from pre-whirlpool tank wort Same as above Wort cooler Recovery of waste heat from post-whirlpool tank wort Cooling system Chiller
compressor Recovery of waste heat from chiller refrigerant compressor
Air-compression system
Air compressor Recovery of waste heat from compressed air
Carbon dioxide purification system
Carbon dioxide compressor
Recovery of waste heat from compressed carbon dioxide
Packaging system Barrel-filling machine
Recovery of waste heat from high-temperature waste water generated by the barrel interior washing process
Boiler system Boiler Recovery of waste heat from exhaust gas If Factory A pursues the production of hot water recovery from waste heat, it is believed that it will become more important to ascertain the volume of hot water produced and used, as like Japanese beer factories. A flowchart outlining current processes at Factory A and a table of sites at which waste heat is typically recovered are presented above: (v) Energy consumption analysis for the factory by energy intensity
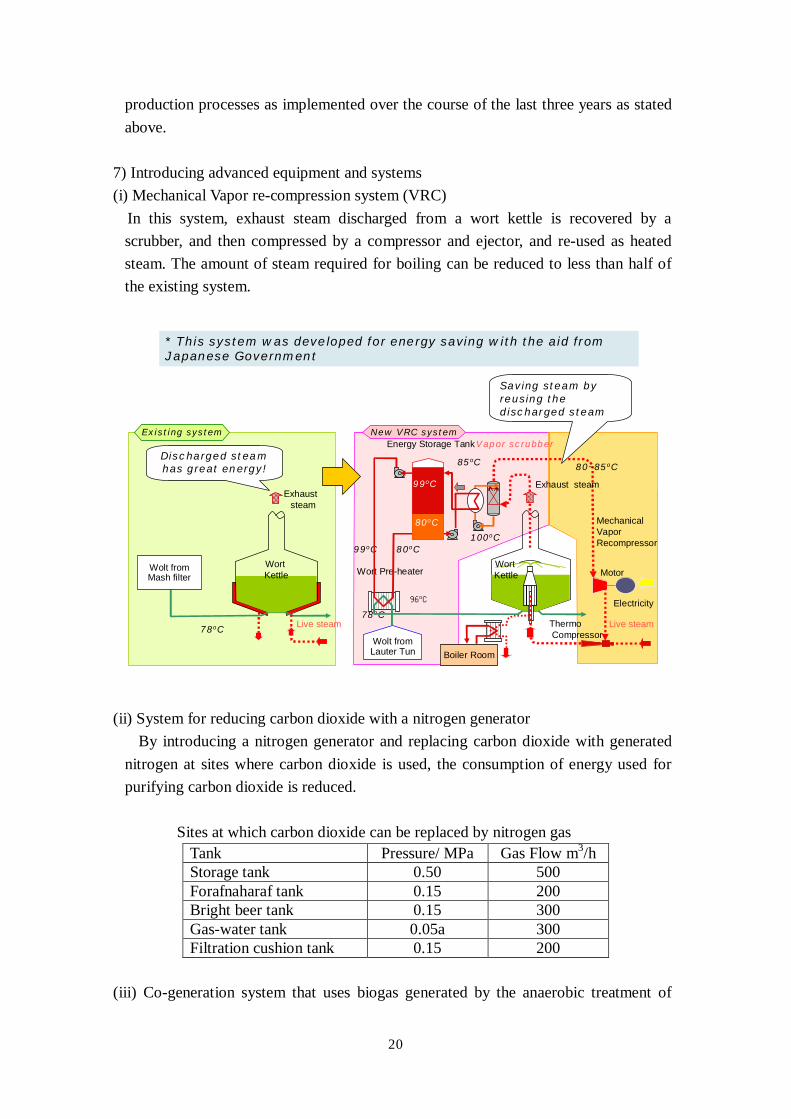
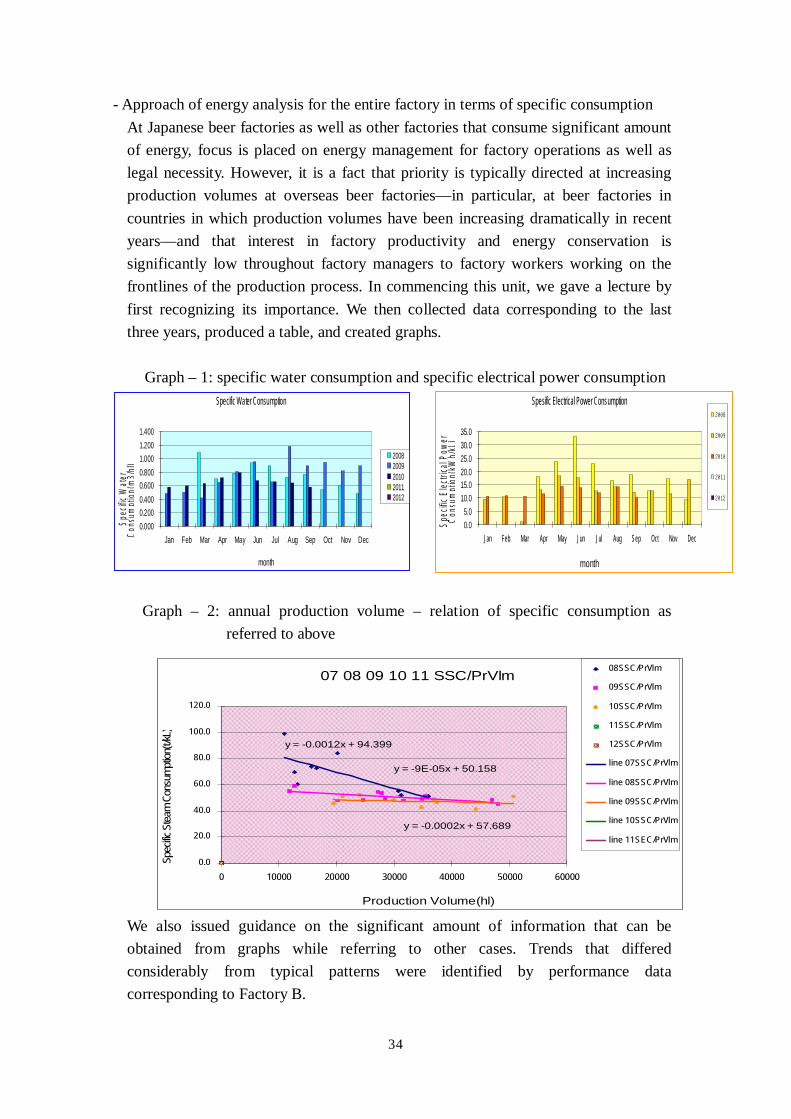
At beer factories as well as other factories that use large amounts of energy in Japan, focus is placed on energy management in the context of factory operations. However, it is a fact that priority is typically directed at increasing production volumes at overseas beer factories - in particular, at beer factories in countries in which production volumes have been increasing dramatically in recent years - and that interest in factory productivity and energy conservation is significantly low on the part of factory managers to factory workers working on the frontlines of the production. In commencing this section, we started the lecture by first confirming its importance. We then collected data corresponding to the last three years, produced a table, and created graphs. We also lectured that significant amount of information can be acquired from graphs by referring to other cases. Trends of performance data of Factory A differed considerably from typical patterns. While the causes of these differences were not ascertained, it was clear that many points should be improved. We explained that useful information for improving the efficiency of energy usage can be derived from the following: the bellow graph of the relationship between annual production volume and specific steam consumption in Factory A indicates that the linear lines for three recent years - 2007, 2008, and 2009 - are drawn as if they can be reconciled into a single line; a highly precise figure for the expected
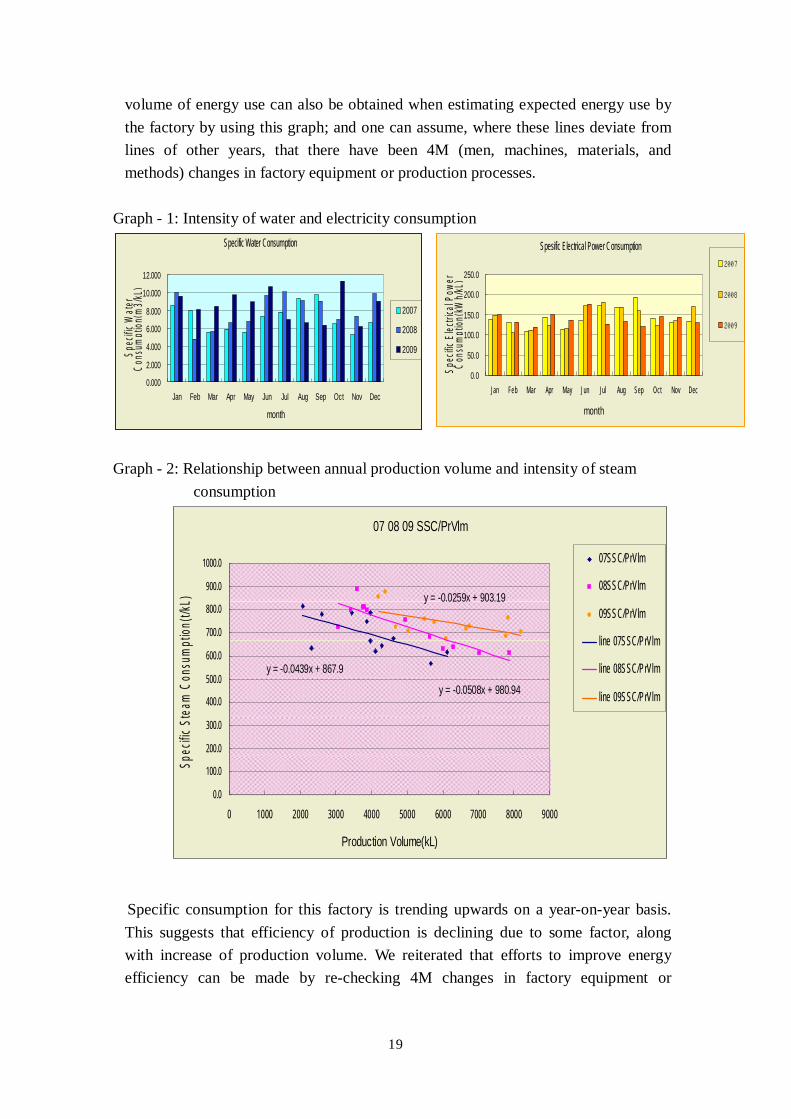
19
volume of energy use can also be obtained when estimating expected energy use by the factory by using this graph; and one can assume, where these lines deviate from lines of other years, that there have been 4M (men, machines, materials, and methods) changes in factory equipment or production processes.
Graph - 1: Intensity of water and electricity consumption
Graph - 2: Relationship between annual production volume and intensity of steam
consumption
Specific consumption for this factory is trending upwards on a year-on-year basis. This suggests that efficiency of production is declining due to some factor, along with increase of production volume. We reiterated that efforts to improve energy efficiency can be made by re-checking 4M changes in factory equipment or
07 08 09 SSC/PrVlm
y = -0.0439x + 867.9
y = -0.0508x + 980.94
y = -0.0259x + 903.19
0.0
100.0
200.0
300.0
400.0
500.0
600.0
700.0
800.0
900.0
1000.0
0 1000 2000 3000 4000 5000 6000 7000 8000 9000
Production Volume(kL)
Spec
ific S
team
Con
sum
ption
(t/kL
)
07SSC/PrVlm
08SSC/PrVlm
09SSC/PrVlm
line 07SSC/PrVlm
line 08SSC/PrVlm
line 09SSC/PrVlm
Spesific Electrical Power Consumption
0.0
50.0
100.0
150.0
200.0
250.0
Jan Feb Mar Apr May Jun Jul Aug Sep Oct Nov Dec
month
Spec
ific E
lectric
al Po
wer
Cons
umpti
on(kW
h/kL)
2007
2008
2009
Specific Water Consumption
0.000
2.000
4.000
6.000
8.000
10.000
12.000
Jan Feb Mar Apr May Jun Jul Aug Sep Oct Nov Dec
month
Spec
ific W
ater
Cons
umpti
on(m
3/kL)
2007
2008
2009
20
production processes as implemented over the course of the last three years as stated above.
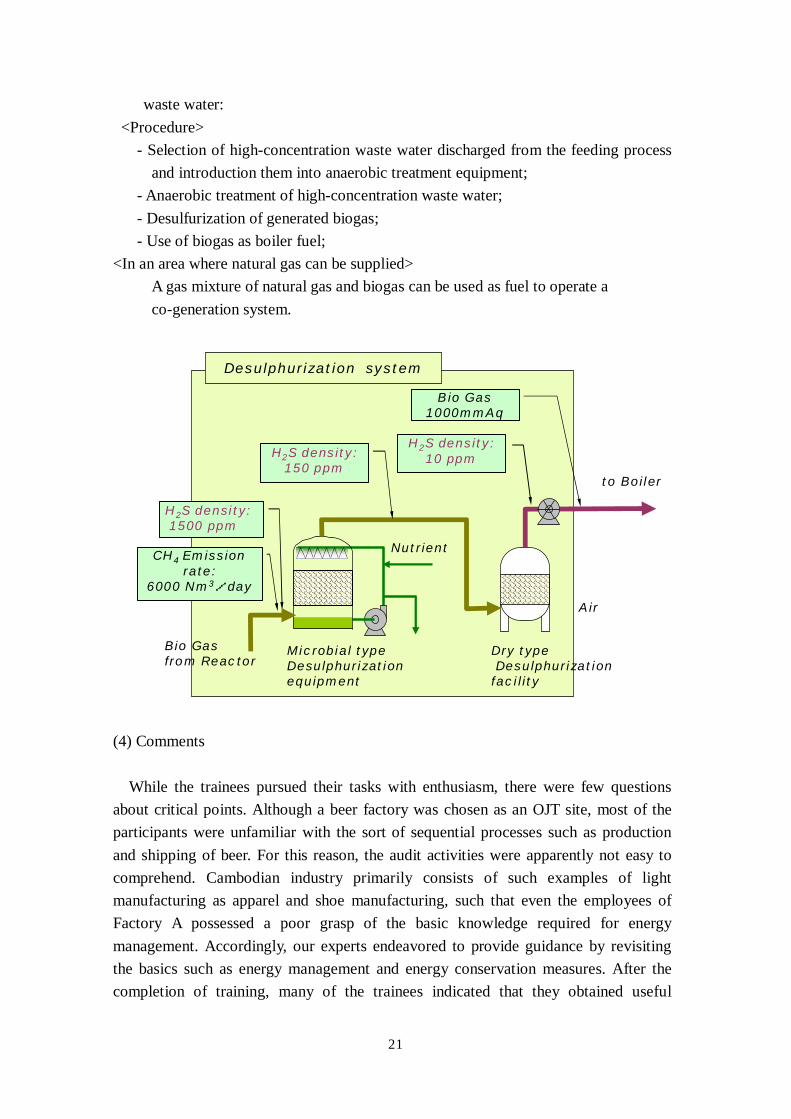
7) Introducing advanced equipment and systems (i) Mechanical Vapor re-compression system (VRC)
In this system, exhaust steam discharged from a wort kettle is recovered by a scrubber, and then compressed by a compressor and ejector, and re-used as heated steam. The amount of steam required for boiling can be reduced to less than half of the existing system.
Live steam
MechanicalVaporRecompressor
WK
Exhaust steam
Energy Storage Tank
Wort Pre-heater
ThermoCompressor
99oC 80oC
78oC
96oC
100oC
85oC 80~85oC
Vapor scrubber
Wolt fromLauter Tun
New VRC system
99oC
80oC
Live steam
WK
Exhauststeam
78oC
Wolt fromMash filter
Existing system
WortKettle
Wort Kettle
Boiler Room
* This system was developed for energy saving with the aid from Japanese Government
Saving steam by reusing the discharged steam
Motor
Electricity
Discharged steam has great energy!
(ii) System for reducing carbon dioxide with a nitrogen generator
By introducing a nitrogen generator and replacing carbon dioxide with generated nitrogen at sites where carbon dioxide is used, the consumption of energy used for purifying carbon dioxide is reduced.
Sites at which carbon dioxide can be replaced by nitrogen gas
Tank Pressure/ MPa Gas Flow m3/h Storage tank 0.50 500 Forafnaharaf tank 0.15 200 Bright beer tank 0.15 300 Gas-water tank 0.05a 300 Filtration cushion tank 0.15 200
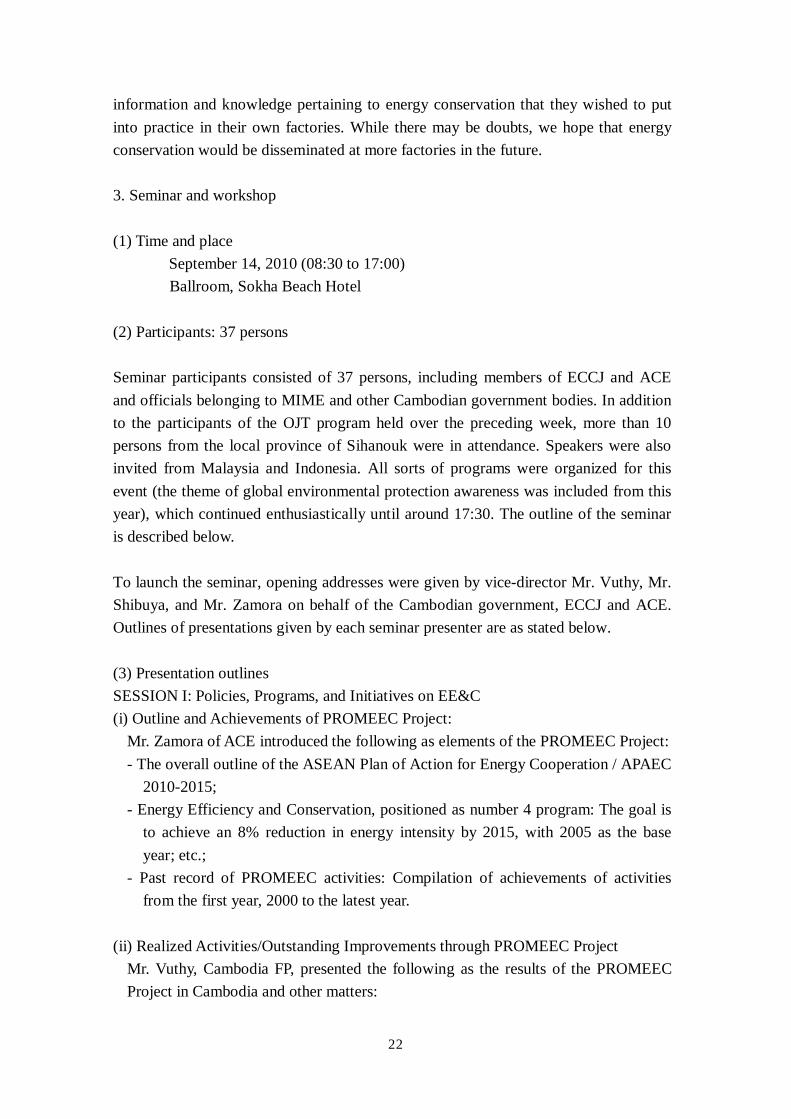
(iii) Co-generation system that uses biogas generated by the anaerobic treatment of
21
waste water: <Procedure>
- Selection of high-concentration waste water discharged from the feeding process and introduction them into anaerobic treatment equipment;
- Anaerobic treatment of high-concentration waste water; - Desulfurization of generated biogas; - Use of biogas as boiler fuel;
<In an area where natural gas can be supplied> A gas mixture of natural gas and biogas can be used as fuel to operate a co-generation system.
Dry type Desulphurization
facility
Microbial typeDesulphurization equipment
Nutrient
H2S density:1500 ppm
H2S density:150 ppm
H2S density:10 ppm
Bio Gas1000mmAq
CH4 Emission rate:
6000 Nm3/day
Air
Desulphurization system
Bio Gasfrom Reactor
to Boiler
(4) Comments
While the trainees pursued their tasks with enthusiasm, there were few questions about critical points. Although a beer factory was chosen as an OJT site, most of the participants were unfamiliar with the sort of sequential processes such as production and shipping of beer. For this reason, the audit activities were apparently not easy to comprehend. Cambodian industry primarily consists of such examples of light manufacturing as apparel and shoe manufacturing, such that even the employees of Factory A possessed a poor grasp of the basic knowledge required for energy management. Accordingly, our experts endeavored to provide guidance by revisiting the basics such as energy management and energy conservation measures. After the completion of training, many of the trainees indicated that they obtained useful
22
information and knowledge pertaining to energy conservation that they wished to put into practice in their own factories. While there may be doubts, we hope that energy conservation would be disseminated at more factories in the future. 3. Seminar and workshop (1) Time and place
September 14, 2010 (08:30 to 17:00) Ballroom, Sokha Beach Hotel (2) Participants: 37 persons Seminar participants consisted of 37 persons, including members of ECCJ and ACE and officials belonging to MIME and other Cambodian government bodies. In addition to the participants of the OJT program held over the preceding week, more than 10 persons from the local province of Sihanouk were in attendance. Speakers were also invited from Malaysia and Indonesia. All sorts of programs were organized for this event (the theme of global environmental protection awareness was included from this year), which continued enthusiastically until around 17:30. The outline of the seminar is described below. To launch the seminar, opening addresses were given by vice-director Mr. Vuthy, Mr. Shibuya, and Mr. Zamora on behalf of the Cambodian government, ECCJ and ACE. Outlines of presentations given by each seminar presenter are as stated below. (3) Presentation outlines SESSION I: Policies, Programs, and Initiatives on EE&C (i) Outline and Achievements of PROMEEC Project:
Mr. Zamora of ACE introduced the following as elements of the PROMEEC Project: - The overall outline of the ASEAN Plan of Action for Energy Cooperation / APAEC
2010-2015; - Energy Efficiency and Conservation, positioned as number 4 program: The goal is
to achieve an 8% reduction in energy intensity by 2015, with 2005 as the base year; etc.;
- Past record of PROMEEC activities: Compilation of achievements of activities from the first year, 2000 to the latest year.
(ii) Realized Activities/Outstanding Improvements through PROMEEC Project
Mr. Vuthy, Cambodia FP, presented the following as the results of the PROMEEC Project in Cambodia and other matters:
23
- Outline of electrical power in Cambodia: Power generation capacity of EDC/ Electricity of Cambodia in 2008 was 210 MW; estimated to reach 3,045 MW in 2024. EDC electricity charges range from 9 to 25 US cents (between 40 and 80 US cents in the provinces);
- Demand for electrical power in Cambodia: if electrical power demand is forecasted highly, demand in 2024 would be six times as great as in 2010;
- Outline of Cambodia’s energy policies; - Support for energy conservation initiatives by countries and institutions; - Past record of PROMEEC activities in Cambodia
(iii) Japan’s EC Policy and Measures and EE&C Experiences in Industries ECCJ’s Mr. Shibuya presented Japanese energy conservation policies, measures and experiences in industry as follows: - Energy use performance trends in Japan and comparisons with other countries by
each sector; - Background of energy conservation policies of Japan; - Approach and case studies of Japanese companies regarding energy conservation; - Introduction of JASE-World, etc.;
SESSION II: EE&C Best Practices in Industries (iv) EE&C of unequal Compressors in DX - Active Heat-pipe and Intertwined Coil in
Air Conditioning Unit Mr. John Budi H. Listijono from Indonesia presented the following as part of a 2007 ASEAN Energy Award for “Energy conservation achieved by way of the installation of large and small compressors for heat pipe-using air-conditioning units”: - System using heat pipes designed for DX (an abbreviation for “direct expansion”)
air-conditioning units; - Adjustments carried out using two large and small air compressors.
(v) EE&C of Chiller Energy Management System Malaysia’s Mr. Thirumalaichelvam Subramaniam presented the following as part of a 2009 ASEAN Energy Award for “Energy conservation achieved by energy management for chillers”: - A centrally regulated air-conditioning system consisting of various types of sensors,
data collection at 10-second intervals, software for control, and more; - Savings achieved through the introduction of this system.
(vi) EE&C Best Practices in Japanese Brewery
Dispatched instructor Mr. Kawasaki introduced energy conservation case studies of Japanese beer industry as follows:

24
- Business environment of the beer sector; - Changes in specific consumption at Japanese beer factories; - Energy conservation and utility consumption ratios at beer factories; - Application of VRC and other new technologies to beer factories.
(vii) Audit Results and Recommendations Local team leader Mr. TY Puthy of Factory A presented a report on the results of the Audits performed on utility and process equipments.
SESSION III: The Way Forward (viii) EE&C Measures for Industries
Dispatched instructor Mr. Kawasaki briefed energy conservation measures on the food products industry in general: - Specifically, heat recovery from dry exhaust gas at milk factories, heat recovery
from tunnel-drying exhaust gas at candy- manufacturing factories, adjusting room temperature at meat factories, and more.
(ix) Development of Technical Directory, In-house Database and Online Energy
Information System: ACE’s Mr. Junianto introduced matters relating to ASEAN’s technical directories (TD), in-house databases (IHD), and online energy information system.
SESSION IV: Environmental Awareness and Financing (x) Situation of Environmental Awareness in Cambodia
Mr. Vuthy briefed the following terms of environmental awareness in Cambodia: - While it is possible to generate 10,000MW electricity by hydraulic power as
recyclable energy, no more than 20MW of electricity is currently generated; - Education and training for environmental issues and increase in awareness of
general public are necessary; - Environmental issues in Cambodia are affected by impediments for awareness,
finance and systems.
(xi) Situation of Environmental Awareness and Financial Support System in Japan ECCJ’s Mr. Shibuya presented about environmental awareness and financial support systems in Japan.
(xii) Financing Opportunities and Schemes in the ASEAN region ACE’s Mr. Junianto introduced financial support systems in the ASEAN region
25
(4) Comments With a large number of presentations given and not enough time to properly explain
their contents, some participants were likely not able to adequately comprehend these presentations. For this reason perhaps, there were no questions about energy conservation during the Q&A session; a professor from BB University asked two environment-related questions: (i) regarding the ozone hole and the ban on the use of refrigerants (such as R-22) and (ii) regarding the global warming issue. It seems necessary to decrease the number of presentations or lessen the contents of presentations.
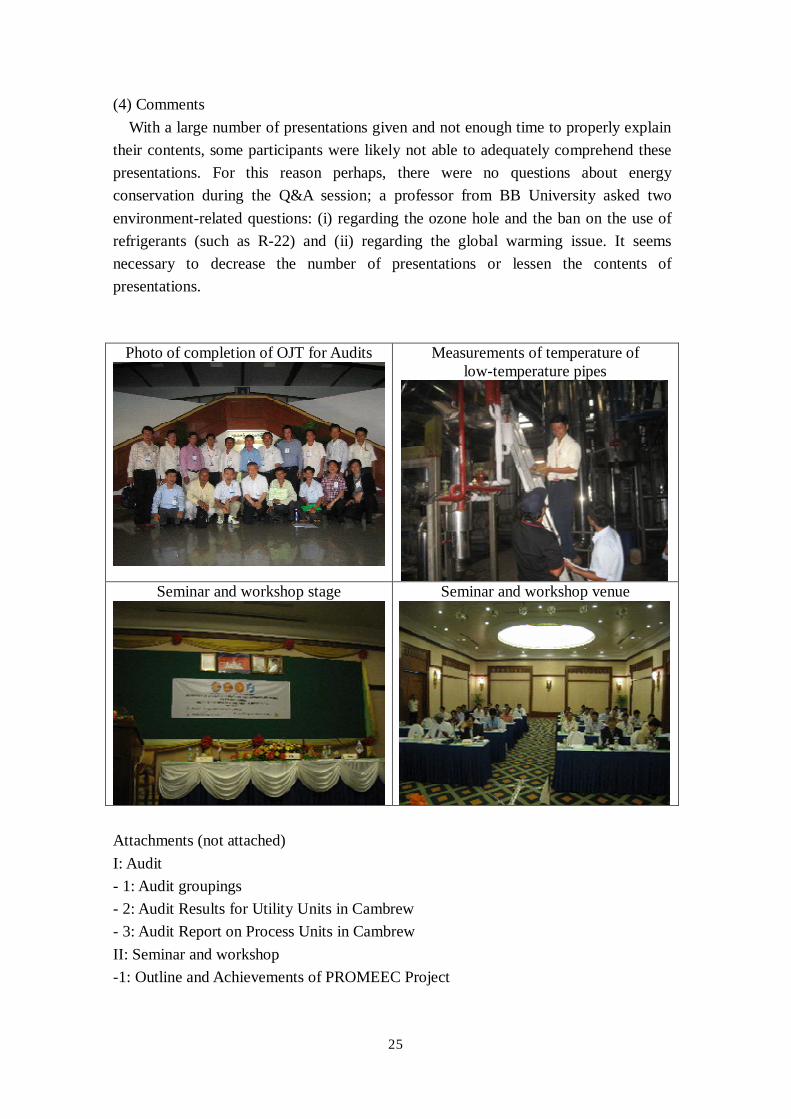
Photo of completion of OJT for Audits
Measurements of temperature of low-temperature pipes
Seminar and workshop stage
Seminar and workshop venue
Attachments (not attached) I: Audit - 1: Audit groupings - 2: Audit Results for Utility Units in Cambrew - 3: Audit Report on Process Units in Cambrew II: Seminar and workshop -1: Outline and Achievements of PROMEEC Project
26
- 2: Realized Activities/Outstanding Improvements through PROMEEC Project - 3 : Japan’s EC Policy and Measures and EE&C Experiences in Industries - 4: Using unequal Compressors in DX - Active heat-pipe system and Intertwined coil
can maintain the comfort condition during full load and partial load and save up to 40% of operation cost
- 5: Chiller Energy Management System - 6: Best Practices at Japanese Breweries - 7: Audit Results and Recommendations - 8: Overview of Energy Saving Technologies in Food Industry (General) - 9: Technical Directory for Major Industries and Buildings PROMEEC 2010-2011 - 10: In-house Database for Building and Industry PROMEEC 2010-2011 - 11: Online Energy Information System PROMEEC 2010-2011 - 12: Situation of Environmental Awareness in Cambodia - 13: Environmental Awareness and Financial Support System in Japan - 14: Financing Support System in ASEAN III: Materials of lecture - 1: Energy Conservation Technologies in Utility Factories - 2: Energy Conservation in Industrial Refrigeration
27
III. Lao PDR (food manufacture industry) 1. Overview of activities In order to implement promotion of energy conservation in major industries of the PROMEEC Project, we visited Pakse, Lao PDR from October 2 to 13, and carried out OJT for Audits at a beer factory in the food manufacture industry and OJT for simplified building audits, and held a seminar and workshop to exchange information with officials from Laotian industry and ASEAN member countries. A total of 24 persons - officials from the central government, 10 officials with regional governments, 5 industry officials, 4 experts from ECCJ, and 2 engineers from ACE - participated in OJT for audits. The seminar and workshop was attended by a total of 43 persons, including officials from ACE and ECCJ; these participants consisted of the persons referred above and 19 additional persons representing local industries and other interests. Dispatched experts:
Tsutomu Okamoto (Technical Cooperation Department); Taichiro Kawase, Yukimitsu Sano (technical experts); Tsutomu Kawasaki (Mayekawa Mfg. Co., Ltd., dispatched instructor)
Schedule of activities:
Oct. 4 to 8: OJT – OJT of Audit and audit results report Oct. 11: Seminar and workshop
At starting local activities, we paid a courtesy call on Mr. Bounthong Dyvixay, Ph.D., head of the Energy and Mine Department of Champasack Province (PDEM). The purpose of this visit was stated by ECCJ’s Mr. Okamoto and a request was made for cooperation for PROMEEC industrial activities. The department head indicated that electrical transmission losses of 10% are sustained in Lao PDR and that he is aware that energy conservation is important given the increasing demand for electrical power in his country. In addition, ECCJ advised him to approach the Japanese embassy if the support of Japan is required. We exchanged opinions, and suggested him to visit Japan and observe energy conservation activities and the highly efficient state of the country on a firsthand basis. 2. OJT of Audits on Factory B (1) Participants: 24 persons (8 persons transferred to OJT for building-focused Audits
from the third day)
28
Ministry of Energy and Mines / Department of Electricity (MEM/DOE): Three participants (Mr. Bouathep Malaykham (local team leader), Mr. Thammanonne Nakhavit, Mr. Viengsay Chantha)
Provincial Dept of Energy & Mines (PDEM): 4 participants (Mr. Khampasong Keobandid, Mr. Paseuth keokhounmeung, Mr. Thouy Phetsavanh, Mr. Amkha Sakhamdi)
Electricite Du Lao PDR (EDL): 6 participants (Mr. Khoonakhone Khinphoonsinh, Mr. Khampasong Lattanaphone, Mr. Khamphanh Sosengdala, Mr. Sayanh Bouphavanh, Mr. Phayvanh Manivong, Mr. Bounchiang Keovilayvanh)
Factory B: 4 participants (Mr. Kikeo Somesaway, Mr. Somphone Phonthachack, Mr. Vongsavanh Syammala, Mr. Nivanxay Khosana)
Hotel C: One participant (Mr. Thouy Phetsavanh) ACE: 2 participants (Mr. Junianto, Ms. Cindy Rianti) ECCJ: 4 participants (Tsutomu Okamoto, Taichiro Kawase, Tsutomu Kawasaki,
Yukimitsu Sano)
(2) Overview of the Factory B Factory B possesses two boilers with a steam generation capacity of 8 tons per hour and steam pressure rated at 8 bars. Heavy Fuel oil is used for fuel and the ventilation system is a forced draft system using combustion air fans. A mechanical compressor- type cooling system uses ammonia as its coolant and four 116.4 kW reciprocal-type compressors have been installed. Ammonia condensation is achieved with two evaporative condensers while ammonia evaporation is fully achieved with the use of plate-type heat exchangers. Glycol (PG) cooling and chilled water production are thereby undertaken.
(3) Audit overview 1) Composition of audit team
The Audit and OJT were conducted by splitting participants into a utility group and a process group. A leader and a note-taker were appointed by each group. A leader of the utility group was selected from participants while a staff at Factory B was appointed as the leader of the process group. Although it is best to select every leader from participants, we understand the difficulty for participants to comprehend the processes and accepted the selection.
2) Audit process The audit was performed according to the following process: interview concerning energy conservation activities at the factory in question; an inspection of factory equipment, data collection, and analyses of measurements using measuring
29
instruments, operational logs, and other sources; formulation of energy conservation measures; and reporting of audit results to factory officials. At each stage of the audit, explanations of the significance of the work were given to participants, intermediate data analysis was conducted, and explanations and instructions were given in regards to the data analysis process. In order to thoroughly engage in explanations and instructions on an interactive basis, explanations were given by gathering the participants together in front of a white board and participants themselves were made to carry out and record measurements.
3) Measuring instruments
Measuring instruments as outlined in the following five points were brought in from Japan and the usage and measurement methods of them were explained. For actual measurements, our experts first showed how measurements were to be taken before letting participants themselves take measurements and record the results thereof.
- Radiation thermometer (temperature measuring instrument) HiTESTER 3443 (manufactured by HIOKI E.E. CORPORATION)
- Thermohygrometer HNCHNR (manufactured by Chino Corporation) - Digital oximetry for combustion management XP-3180-E (manufactured by New
Cosmos Electric Co., Ltd.) - Clamp tester (ammeter) 2343 04 (manufactured by Home-Yokogawa Meters &
Instruments Corporation) - Contact-type thermometer (owned by expert Mr. Kawase) 4) Audit of utility facilities
The boiler house, cooling system and compressed air system constitute the most important utility systems to be found in a beer factory were identified as targets of OJT on EC Audit.
(i) Boiler - State of the boiler
Two boilers with a steam generation capacity of 8 tons per hour and steam pressure rated at 8 bars have been installed. Under normal operations, the number 2 boiler is running and the number 1 boiler is on standby. In addition, these boilers are run with steam pressure lowered to 6.5 bars for energy conservation. Heavy fuel oil firing process is introduced for fuel and a heavy fuel oil heater is attached. The fuel oil temperature in the burner is controlled at 80˚C. Fuel flow is controlled by a computer on a cumulative basis each minute using an integrating meter. Feed water into these boilers consists of mixture of advanced treated water (RO water) produced with the use of a reverse osmosis membrane and degassed water obtained by deaerating process-generated return condensate with a deaerator. The volume of combustion air is automatically adjusted according to mechanical links with the fuel
30
flow. The valve position indicator corresponding to the volume of combustion air was set to approximately 40%. At this time, the boiler load was low at a little less than 3 tons per hour compared to the rated load of 8 tons per hour. The ventilation system is a forced draft system by combustion air fans. An exhaust funnel extends for 25 meters from the exhaust side of the boiler and is at slightly positive pressure at the boiler outlet. No air pre-heater or economizer has been installed. No gas exhaust duct damper could be checked.
- Reducing heat loss from exhaust gas The temperature of the exhaust gas and the concentration of oxygen in the exhaust gas were measured in order to ascertain the extent of the loss of exhaust gas. The temperature of the exhaust gas was between 180˚C to 220˚C according to the exhaust gas thermometer installed onto these boilers. The concentration of oxygen was between 6.1% and 7.9% in line with the temperature of the exhaust gas based on measurements taken with an oxygen concentration analyzer. This fluctuation indicates that these boilers function in a manner that reflects changes in the volume of steam consumption of processes caused by replacing the feed batch. If the average concentration of oxygen is 7%, the air ratio will be 1.5. As the average temperature of the exhaust gas is 200˚C, the amount of exhaust gas loss is approximately 9%. The temperature of exhaust gas should be between 180˚C and 220˚C and the concentration of oxygen should be between 3.5% and 5.0% for small-sized boilers. Accordingly, boiler number 2 at Factory B satisfies Japanese standards for the temperature of exhaust gas but does not satisfy said standards for the concentration of oxygen. Thus, there is room, from the standpoint of energy conservation, for lowering the concentration of oxygen (or the air ratio). If we suppose the concentration of oxygen could be reduced by 5%, the amount of heat loss from exhaust gas would be reduced by approximately 7%. In other words, boiler efficiency would be ameliorated by 9–7 =2%. Upon visually examining the smoke being emitted from the exhaust gas stacks of these boilers, no black smoke was observed at all. The flame was also a whitish-orange color; no dark-red color indicating incomplete combustion was observed.
- Measuring heat loss from the surface of boilers The surface temperature of boilers was measured and the volume of heat loss was estimated according to a formula for calculating heat dissipation. The surface temperature was measured using both a contact-type thermometer and a radiation thermometer. The values obtained using both thermometers differed by no more than approximately 2˚C from one another, thereby indicating that they were in favorable agreement. The data obtained using the contact-type thermometer are as follows:
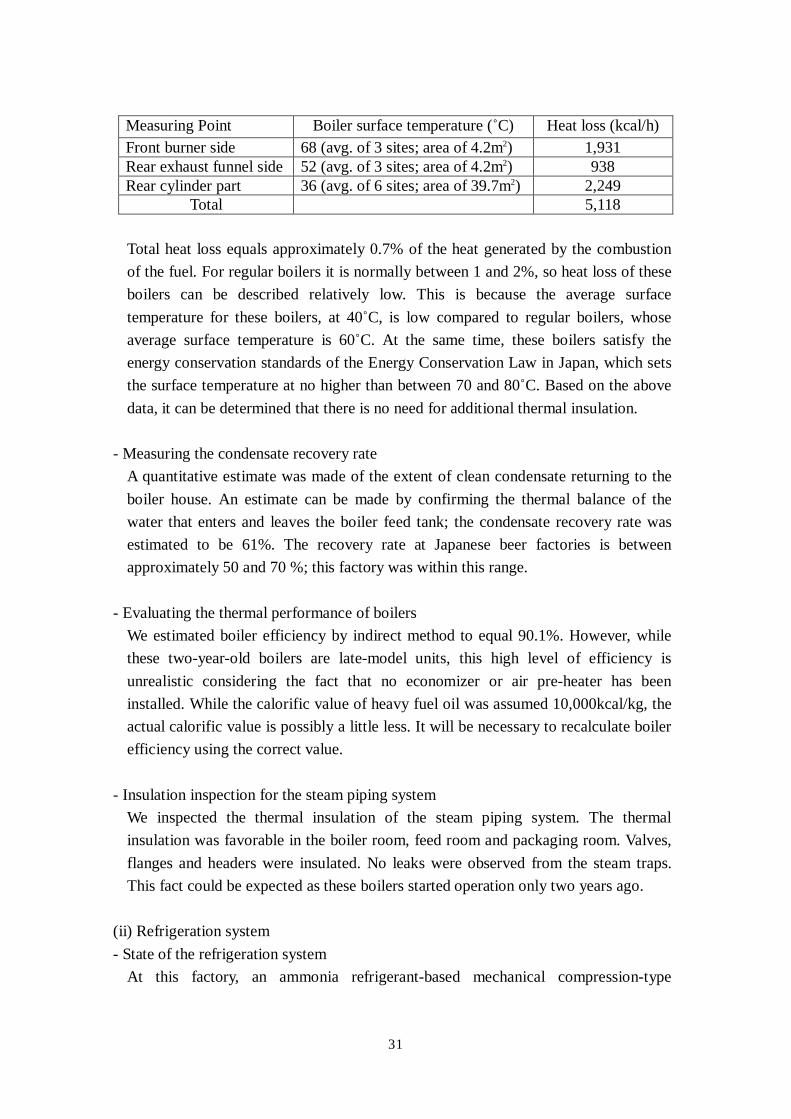
31
Measuring Point Boiler surface temperature (˚C) Heat loss (kcal/h) Front burner side 68 (avg. of 3 sites; area of 4.2m2) 1,931 Rear exhaust funnel side 52 (avg. of 3 sites; area of 4.2m2) 938 Rear cylinder part 36 (avg. of 6 sites; area of 39.7m2) 2,249
Total 5,118 Total heat loss equals approximately 0.7% of the heat generated by the combustion of the fuel. For regular boilers it is normally between 1 and 2%, so heat loss of these boilers can be described relatively low. This is because the average surface temperature for these boilers, at 40˚C, is low compared to regular boilers, whose average surface temperature is 60˚C. At the same time, these boilers satisfy the energy conservation standards of the Energy Conservation Law in Japan, which sets the surface temperature at no higher than between 70 and 80˚C. Based on the above data, it can be determined that there is no need for additional thermal insulation.
- Measuring the condensate recovery rate A quantitative estimate was made of the extent of clean condensate returning to the boiler house. An estimate can be made by confirming the thermal balance of the water that enters and leaves the boiler feed tank; the condensate recovery rate was estimated to be 61%. The recovery rate at Japanese beer factories is between approximately 50 and 70 %; this factory was within this range.
- Evaluating the thermal performance of boilers We estimated boiler efficiency by indirect method to equal 90.1%. However, while these two-year-old boilers are late-model units, this high level of efficiency is unrealistic considering the fact that no economizer or air pre-heater has been installed. While the calorific value of heavy fuel oil was assumed 10,000kcal/kg, the actual calorific value is possibly a little less. It will be necessary to recalculate boiler efficiency using the correct value.
- Insulation inspection for the steam piping system We inspected the thermal insulation of the steam piping system. The thermal insulation was favorable in the boiler room, feed room and packaging room. Valves, flanges and headers were insulated. No leaks were observed from the steam traps. This fact could be expected as these boilers started operation only two years ago.
(ii) Refrigeration system - State of the refrigeration system
At this factory, an ammonia refrigerant-based mechanical compression-type
32
refrigeration system has been installed, with compressors consisting of four 116.4 kW reciprocal-type units. Ammonia condensation is achieved with the use of two evaporative condensers while ammonia evaporation is achieved with the use of plate-type heat exchangers. Glycol (PG) cooling and chilled water production are thereby undertaken.
- Evaluating the performance of evaporative condensers The performance of evaporative condensers is evaluated to which extent the condensation temperature of ammonia approaches the wet-bulb temperature of the ambient air. The difference between the condensation temperature of ammonia and the wet-bulb temperature is referred to as the temperature approach. While the designed value of the temperature approach varies slightly depending on the manufacturer, it is approximately equal to 8˚C. Where a shell-and-tube condenser is used, the temperature approach is approximately equal to 13˚C. The temperature approach for this factory was equal to 28.9 – 24.8 = 4.1˚C. Accordingly, we can conclude that the evaporative condensers in use here are performing at a satisfactory level.
- We observed non-insulated low-temperature pipe sections made from stainless steel for which insulation needs to be enforced.
(iii) Compressed air system - State of the operations of air compressors
Three 55 kW screw compressors, oil-free two-stage screw type for the production of foodstuff, have been adopted. Their discharge pressure is rated at 8.0 bars and their flow rate is rated at 7.2 m3/min.. In line with the current state of low operations, one air compressor is being utilized, one air compressor is on standby, and one air compressor is maintained as backup.
- Energy conservation by reducing the discharge pressure The pressure drop from the compressor room to the terminal process is typically designed to be no more than 0.5 bars. In the case of this factory, it is estimated that there are 200 meters of piping extending from the compressor room to the terminal process. At this distance, it is presumed that the pressure drop will not exceed 0.5 bars. The current discharge pressure is average 7.0 bars; if this were to be reduced to 5.0 bars, it is estimated that a 17% energy conservation effect would be achieved.
- Evaluating the performance of a cooling tower to cool compressed air These air compressors utilize chilled water to cool their piston cylinders. A forced draft tower is employed for this cooling tower. The performance of this cooling tower is evaluated by how much the temperature of the chilled water approaches the wet-bulb temperature of the ambient air. The difference between the temperature of chilled water and the wet-bulb temperature is referred to as the temperature approach.
33
While the designed value of the temperature approach varies slightly by manufacturer, it is approximately between 5 and 5.5˚C. The temperature approach for this factory was determined to equal 29.5 – 25.8 = 3.7˚C. Accordingly, we can conclude that the cooling tower in use here is performing at a satisfactory level.
5) Audit of process facilities - We decided to ascertain the energy usage by key process equipment and investigate
relevant improvement points, introduce advanced technologies of Japan, ascertain the use of hot water as an important utility in beer factories and investigate relevant improvement points, and provide guidance on methods of energy evaluation for the factory as a whole by specific consumption.
- Wort cooler: While the wort cooler consists of a plate-type heat exchanger, it is possible to raise the temperature of the raw materials and hot water on the outlet side by either upgrading or increasing the number of plates in use.
- Beer cooler: Triple valves are installed on the P.G. side (coolant side) of the beer
cooler. Even though the P.G. temperature of the chiller outlet is -4˚C, the temperature at the beer cooler inlet is -0.1˚C, such that beer cannot be adequately chilled. The control method or equipments must be improved.
- Improvement points for thermal insulation The room temperature in the areas around the bottle-washing machines and pasteurizer was relatively high compared with Japanese brewery factory. The central area where the steam heater is installed was especially hot. Temperature measurements revealed that the bottle-washing machines were 75˚C on their surfaces and the pasteurizer was 65˚C on its surface. We advised that the thermal insulation above section is effective both for improvement of work environment and energy conservation. And we advised that heat dissipation could be reduced by cold insulation on the low-temperature valves.
- Ascertaining the state of hot water usage and investigating improvement points The state of hot water usage was exceedingly simple compared to other beer factories. In addition, the volume of hot water used at each usage site had not been ascertained. At Japanese beer factories, hot water is produced using waste heat at many sites, such that it is difficult to ascertain the volume of hot water produced and used on an overall basis. There is a tendency for hot-water management at beer factories to become more important as more energy conservation measures are implemented. As hot-water production based on the use of waste heat at Factory B is pursued, it is believed that the ascertainment of the volume of hot water produced and used will become increasingly important as is the case at Japanese beer factories.
34
- Approach of energy analysis for the entire factory in terms of specific consumption At Japanese beer factories as well as other factories that consume significant amount of energy, focus is placed on energy management for factory operations as well as legal necessity. However, it is a fact that priority is typically directed at increasing production volumes at overseas beer factories—in particular, at beer factories in countries in which production volumes have been increasing dramatically in recent years—and that interest in factory productivity and energy conservation is significantly low throughout factory managers to factory workers working on the frontlines of the production process. In commencing this unit, we gave a lecture by first recognizing its importance. We then collected data corresponding to the last three years, produced a table, and created graphs.
Graph – 1: specific water consumption and specific electrical power consumption Specific Water Consumption
0.0000.2000.4000.6000.8001.0001.2001.400
Jan Feb Mar Apr May Jun Jul Aug Sep Oct Nov Dec
month
Spec
ific W
ater
Cons
umpti
on(m
3/hl)
20082009201020112012
Spesific Electrical Power Consumption
0.05.0
10.015.020.025.030.035.0
Jan Feb Mar Apr May Jun Jul Aug Sep Oct Nov Dec
month
Spec
ific E
lectric
al Po
wer
Cons
umpti
on(kW
h/kL)
2008
2009
2010
2011
2012
Graph – 2: annual production volume – relation of specific consumption as referred to above
We also issued guidance on the significant amount of information that can be obtained from graphs while referring to other cases. Trends that differed considerably from typical patterns were identified by performance data corresponding to Factory B.
07 08 09 10 11 SSC/PrVlm
y = -0.0012x + 94.399
y = -0.0002x + 57.689
y = -9E-05x + 50.158
0.0
20.0
40.0
60.0
80.0
100.0
120.0
0 10000 20000 30000 40000 50000 60000
Production Volume(hl)
Spec
ific S
team
Cons
umpt
ion(t/
kL)
08SSC/PrVlm
09SSC/PrVlm
10SSC/PrVlm
11SSC/PrVlm
12SSC/PrVlm
line 07SSC/PrVlm
line 08SSC/PrVlm
line 09SSC/PrVlm
line 10SSC/PrVlm
line 11SEC/PrVlm
35
While the causes of these differences were not ascertained, it was clear that there are many points that should be improved. We explained that useful information for improving the efficiency of energy usage can be derived from the following: the above graph of the relationship between yearly production volume and specific steam consumption in Factory B indicates that the linear lines for three recent years—2008, 2009, and 2010—are almost drawn as if they can be reconciled into a single line; operation of this factory started in 2008, and this graph suggests that equipment and systems were not at a complete level and operators were unfamiliar with operations in the first year; a highly precise figure for the expected volume of energy use can also be obtained for expected energy use by the factory by using this graph; when a line differs from lines drawn for other years, there might have been 4M (men, machines, materials, and methods) changes in factory equipment or production processes. The linear approximations for 2009 and 2010 for this factory are virtually overlapping, indicating that the factory has stabilized. From the standpoint of energy conservation, however, the fact that various improvements have not yet been implemented is also indicated at the same time.
- Introducing advanced equipment and systems We introduced three systems: a mechanical vapor re-compression system (VRC), a system to reduce carbon dioxide by using nitrogen-generating equipment; and a co-generation system that uses biogas generated by the anaerobic treatment of wastewater. See the contents of introduction prepared for audit of Factory A for more information.
(4) Comments While a beer factory was selected as a site for OJT of Audit, most participants, as like the foregoing PROMEEC industrial OJT held in Cambodia, appeared to find it difficult to understand the audit activities, as they were unfamiliar with such sequential processes as those involved in producing and shipping beer. The employees of Factory B also possessed a poor grasp of the basic knowledge required for energy management. Accordingly, our experts endeavored to provide guidance by revisiting the basics of energy management and energy conservation measures. We emphasized that this activity is OJT for Audit, and had participants take measurements, collect and analyze data, and prepare the Audit report by themselves as much as possible and instructed them to submit the report to the factory and make relevant presentations at our seminar. For the purpose of developing human resources, we utilized materials appropriately prepared in accordance with audit contents, delivered lectures on audit technologies, and introduced five types of measuring instruments and provided instructions on their
36
practical application. While these technical lectures and measurement practice are new experiences and difficult to grasp the content for a majority of the participants, there is no doubt that the first step towards the development of human resources for the promotion of energy conservation was taken. 3. OJT for simplified Audit of building (Hotel C) Experts for building Audit arrived at this location on October 6 and were expected to start OJT activities for Audits of buildings, but the audit site had not yet been determined as of 9:30 the previous morning. However, the consent was subsequently obtained from the chief manager of Hotel C, at which they were staying, to have the hotel itself undergo OJT for Audits. Thus, it was determined at the last minute that OJT activities for Audits on buildings could be conducted. From 14:00 on October 5, director-general Mr. Bouathep and ECCJ’s Mr. Okamoto went to the hotel and spoke with Mr. Thouy Phetsavanh, the chief manager of the hotel. They outlined the OJT activities for Audits on buildings to be carried out from the afternoon of the following day (October 6), requested his cooperation, and extended an invitation to participate in a seminar. (1) Participants: 8 persons
MEM/DOE (1 person), PDEM (1 person), EDL (2 persons), Hotel C (1 person), ACE (1 person), ECCJ (2 persons)
(2) Building overview: Hotel C - History of the Hotel: Construction on this building commenced in the central part of
the Pakse District to serve as the palace of Jao Ma Ha Chee Vit, who was king at the time. The structure was completed in 1969 and enabled to accommodate by 1975. However, due to changes in political circumstances, the king fled to France and the building was left used for a long period, not used as a palace. While this building subsequently operated as a hotel for a decade beginning in 1994 thanks to Thai capital, the business was abandoned due to a failure to maintain profitability. The building was renovated to be used as a hotel, using Laotian capital, for two years from 2003. Between 2005 and 2008, the hotel operated partially while renovation work continued. This work was completed in 2008, and the hotel started operations.
- Scale: 15,514 m2 total floor area; 115 guest rooms; 5,251 m2 air-conditioned area; first through fifth floors used as guest rooms; fourth floor used as special room; sixth floor used as circular conference room; annex house 40 rooms, 2-storied.
- Key facilities: Overview of air-conditioning system / air-conditioners for guest rooms: 18 kBTU x

37
48 units; 12 kBTU x 95 units (package-type air-conditioners); conference room (sixth floor): 100,000 BTU x 2 units; first-floor multipurpose room: 50,000 BTU x 2 units. Overview of electrical system / 220 V incoming power; 50 Hz; no transformer. Feed water and drainage system / lift pump: 4.5 kW x 1 unit. Overview of elevators: elevator: 10 kW x 1 unit; 7 kW x 1 unit.
- Overview of energy consumption: annual electrical power consumption (2009) 398,640 kWh
- Unit cost of electricity: 835 kip/kWh (0.1 USD/kWh, @ 1 USD = 8,080 Kip) (3) Overview of simplified audit This hotel differs significantly from modern hotels in use of natural ventilation, the installation of localized air conditioners and the use of electrical heaters for supplying hot water to each room and block. A natural energy supply is used for the boilers through the burning of firewood, which limits the items of Audit. In this context, investigative matters were summarized into twelve items as based on daytime and nighttime surveys; discussions were carried out with participants with respect to additional surveys and measures. Five improvement points were identified as follows: 1) reducing nighttime lighting in the garden, on walls, along the parapet, and along passageways; 2) reducing night-time lighting at the reception desk; 3) having the first-floor washroom lights turn on and off through the use of sensors; 4) using LED lighting; 5) shutting down one of the two elevators after 22:00 every night. 4. Seminar and workshop (1) Time and place October 11, 2010 (09:00 to 17:00) 1F Hall of the Champasak Palace Hotel (2) Participants: 49 persons (3) Presentation outlines
On behalf of the Laotian government, Mr. Bounsoy Chit PSAONG, Deputy Director Cabinet of Champasak Province, delivered the opening address. SESSION I: Policies, Programs and Initiatives on EE&C (i) Outline and Achievements of PROMEEC Project: PROMEEC Project was
introduced (Ms. Cindy, ACE) (ii) Realized Activities/Outstanding Improvements through PROMEEC Projects:
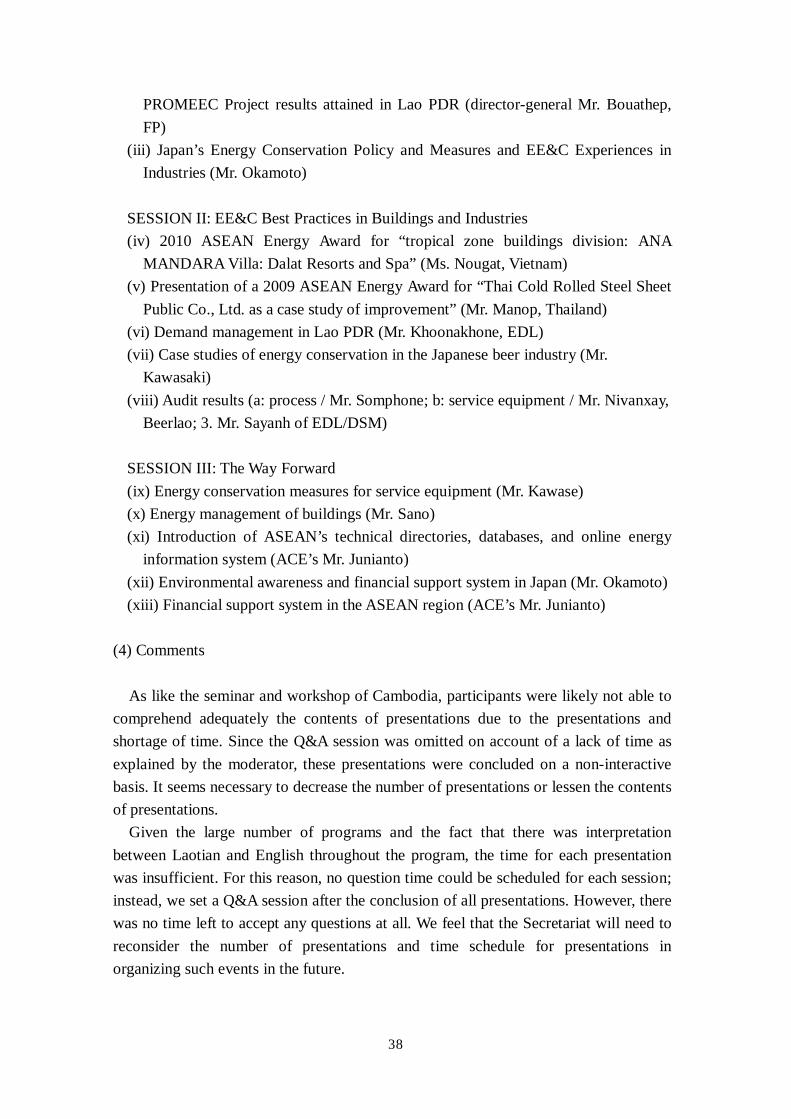
38
PROMEEC Project results attained in Lao PDR (director-general Mr. Bouathep, FP)
(iii) Japan’s Energy Conservation Policy and Measures and EE&C Experiences in Industries (Mr. Okamoto)
SESSION II: EE&C Best Practices in Buildings and Industries (iv) 2010 ASEAN Energy Award for “tropical zone buildings division: ANA
MANDARA Villa: Dalat Resorts and Spa” (Ms. Nougat, Vietnam) (v) Presentation of a 2009 ASEAN Energy Award for “Thai Cold Rolled Steel Sheet
Public Co., Ltd. as a case study of improvement” (Mr. Manop, Thailand) (vi) Demand management in Lao PDR (Mr. Khoonakhone, EDL) (vii) Case studies of energy conservation in the Japanese beer industry (Mr.
Kawasaki) (viii) Audit results (a: process / Mr. Somphone; b: service equipment / Mr. Nivanxay,
Beerlao; 3. Mr. Sayanh of EDL/DSM) SESSION III: The Way Forward (ix) Energy conservation measures for service equipment (Mr. Kawase) (x) Energy management of buildings (Mr. Sano) (xi) Introduction of ASEAN’s technical directories, databases, and online energy
information system (ACE’s Mr. Junianto) (xii) Environmental awareness and financial support system in Japan (Mr. Okamoto) (xiii) Financial support system in the ASEAN region (ACE’s Mr. Junianto)
(4) Comments
As like the seminar and workshop of Cambodia, participants were likely not able to comprehend adequately the contents of presentations due to the presentations and shortage of time. Since the Q&A session was omitted on account of a lack of time as explained by the moderator, these presentations were concluded on a non-interactive basis. It seems necessary to decrease the number of presentations or lessen the contents of presentations.
Given the large number of programs and the fact that there was interpretation between Laotian and English throughout the program, the time for each presentation was insufficient. For this reason, no question time could be scheduled for each session; instead, we set a Q&A session after the conclusion of all presentations. However, there was no time left to accept any questions at all. We feel that the Secretariat will need to reconsider the number of presentations and time schedule for presentations in organizing such events in the future.
39
Participants in the OJT Audits for factories
Hotel for building audit and venue for seminar session
Opening address at Seminar and workshop
Photo of seminar and workshop
Attachments (not attached) I Audit-related materials - 1: Energy Conservation Technologies in Utility Factories - 2: EXCEL Sheet for Engineering Calculations - 3: Energy Conservation in Industrial Refrigeration - 4: Audit Data Sheets for Utility Factories - 5: Audit Results for LBC Champasak Factory (Utility) - 6: Best Practice in Japanese Brewery - 7: Audit Result for Process Units at Lao Brewery in Champasack Province - 8: Process Measure Item - 9: Existing Hot water & Wort flow st Brewing for Lao brewery in Pakse - 10: Existing & New Beer flow in Lao Brewery at Pakse - 11: Energy Data Table & Graph. II Seminar-related materials - 1: Outline and Achievements of PROMEEC Project - 2: Realized Activities/Outstanding Improvements through PROMEEC Projects
40
- 3: Japan’s Energy Conservation Policy and Measures and EE&C Experiences in Industries
- 4: Ana Mandara Villas Dalat of Vietnam - 5: Thai Cold Rolled Steel Sheet Public Co., Ltd. - 6: Demand Side Management - 7: EE&C Best Practices in Japan - 8: Audit Results and Recommendations(a/ Process, b/ Utility, c/ Building) - 9: Energy Conservation Technologies in Utility Factories - 10: Energy Management for Building - 11: In-house Database for Building and Industry PROMEEC 2010–2011 - 12: Technical Directories for Major Industries and Buildings PROMEEC 2010–2011 - 13: Online Energy Information System PROMEEC 2010–2011 - 14: Environmental Awareness and Financial Support System in Japan - 15: Available Financing Windows in ASEAN
41
IV. Thailand (textile industry) 1. Overview of activities In order to implement the Project for the Promotion of Energy Conservation in Major Industries as the third PROMEEC project this year, we visited Bangkok, Thailand from November 21 to 30, and carried out OJT for Audits at a textile factory and held a seminar and workshop to exchange information with officials from Thai industry and ASEAN member countries. A total of 19 persons - 7 officials from the central government, 2 officials from institutions related with energy conservation, 5 officials from the textile factory in question, 3 experts from ECCJ, and 2 engineers from ACE - participated in OJT for audits. A seminar and workshop was attended by a total of 65 persons, including officials from ACE and ECCJ; these participants consisted of the persons referred above and 46 additional persons, including governmental officials and local industry representatives.
Dispatched officials: Tsutomu Okamoto (Technical Cooperation Department); Akira Nakatsu, Kokichi Takeda (technical experts)
Schedule of activities:
Nov. 22 to 26: OJT for audits and audit results report Nov. 29: Seminar and workshop
2. OJT of Audits on Factory D (1) Participants: 19 persons
Ministry of Energy / Department of Alternative Energy Development and Efficiency (DEDE): 7 participants (Mr. Sarat Prakobchat, Mr. Sayam Machima, Mr. Pramote Pintong, Mr. Piriya Klaikaew, Mr. Sittipol Kwangnok, Mr. Pitcha Suthigul, Mr. Peanut Prajakwong)
Energy Saving Consultation Center (ESCC): 1 participant (Mr. Nopporn Watanachai)
Factory D: 5 participants (Mr. Pisit Meesa-Ard, Mr. Pirat Joypan, Mr. Thanasate Thanaraweewan, Mr. Yongyut Suriyapananon, Mr. Somchai Onprew)
Measuretronics Ltd.: 1 participant (Mr. Jedsada Kulvisarut) ACE: 2 participants (Mr. Junianto M, Mr. Chanatip Suksai) ECCJ: 3 participants (Tsutomu Okamoto, Akira Nakatsu, Kokichi Takeda)
(2) Overview of the factory
Factory D, a textiles factory of Company E was established in 1976, located in the
42
suburb of Bangkok, produces textile for export primarily to Western countries, and annual sales is 30 million USD. With 2,200 employees, it possesses fabric cutting machines and various types of sewing machines and irons as well as service equipment consisting of 1 ton/hr small boilers, air conditioners, and air compressors. Electricity (2.5 MWh/yr) and LPG (100 tons/yr) are consumed as energy sources. The unit cost of electricity equals 3.93 B/kWh/h = 11.8 yen/kWh (@ 3 yen/B) while the unit cost of LPG equals 17.9 B/kg-LPG =53.7yen/kg-LPG (@3yen/B). Energy costs represent 1.2 %t of sales.
(3) OJT of Audits for Factory D 1) Equipment and systems of audit and audit groupings
While there were few types of equipment in use as noted above, the equipment and systems of audit were divided into three groups; the trainees were likewise divided into three groups and the tasks of leaders and each member were determined.
Group 1: cooling towers and air-conditioning system Group 2: compressors and lighting Group 3: boilers, steam pipe system, and more
2) Overall energy management at the factory - The adoption of efficient, energy-conserving equipment is somewhat lacking. - No thermal insulation has been applied to valves or flanges; thermal insulation has
not been thoroughly applied. - Maintenance and daily management of equipment is somewhat lacking. - Drawings, specifications, and materials are insufficiently developed. - Data colleting, record keeping, analyses, and more are also somewhat lacking. - Energy consumption as a percentage of total sales is low (approximately 1% level),
such that no concerns could be perceived. 3) Audit of equipment (i) Cooling towers: Since the cooling fans and circulation pumps were both rotating on
a constant basis, we introduced a rotation control system. Since the perforated plates and netting used for gas rectification and straining purposes were detached from all cooling towers (4 in total), water droplets were found to be drifting. We recommended to locate perforated plates and netting properly.
(ii) Air conditioning of all rooms (totaling 30 in number) in which cutting, sewing, and ironing are undertaken: As there were some uninsulated steam pipes in the room, we suggested that thermal insulation be applied immediately. Since the temperature is set to 24±1˚C, some places in the rooms were too cold; for this reason, we advised to raise the temperature by 1˚C. We additionally recommended insulating the steam pipes used for ironing in order to lower the heat dissipation. Since the heat
43
dissipation from lights also results in room temperature rise, we suggested that these lights be replaced by high-efficiency type.
(iii) Air-compressors: - This factory possesses two air compressors, one of which is constantly in operation.
The number 1 unit normally operates, while the number 2 unit only operates on extended shifts or holidays, such that its running time is short. Accordingly, only the number 1 unit was selected for audit. The control system used with this unit is the loading/unloading control system. The configured load/unload pressure levels are 0.6[Mpa] and 0.75[MPa], respectively, and are controlled by discharge pressure. Manufactured in 2007, the number 1 unit is new but does not utilize an inverter.
- Measuring the unloading rate for the number 1 unit For time-series data measurements, highly valid and essential power monitors were used. However, as there was little time for data analysis, we obtained an unloading rate by using data for only one hour extracted from the total measurement data. Consequently, the unloading rate was found to equal approximately 23%, which indicates that significant unloading losses are generated. Furthermore, compressors operate by repeatedly loading and unloading on a frequent basis (approximately 15 times an hour), which suggests that the capacity of air compressors exceeds the volume of consumed air.
- Reducing unloading loss by reducing the capacity of the number 1 unit As air consumption is unknown, we estimate that it equals 6.93 [m3/min.] based on measurement data; this value equals approximately 84% (6.93/8.21) of the rated flow. Accordingly, we estimated the energy conservation effects of replacing the 55 kW unit with a 45 kW unit, which fulfills the standard specifications of air compressors. As a result, we determined that a reduction of 17,490[kWh/y], or 11%, is possible.
- Reducing unloading loss by introducing an inverter The average load is currently 42.4 kW; the corresponding amount of electrical power consumed by inverters is estimated approximately 54% (rated 100%). The energy conservation effect in this case is 58,080 [kWh/y], or 36%.
- Decreasing the discharge pressure (by 0.075 MPa) by introducing an inverter By introducing an inverter and setting the discharge pressure to 0.6 [MPa], it is possible to reduce the pressure to below the current average pressure of 0.675 [MPa] when loading. The energy conservation effect in this case is 9,095 [kWh/y], or 6.5%.
- Decreasing the discharge pressure (by 0.0375 MPa) by installing more receiver tanks The precondition is changing the current unloading pressure setting from 0.75 [MPa] to 0.675 [MPa] to diminish the pressure fluctuation by half. If we assume that the current loading and unloading times were to be maintained despite diminishing the pressure fluctuation, the receiver tank would need to be enlarged by 3m3. The energy
44
conservation effect in this case would be 4,477 [kWh/y], or 3.2%. - Reducing air leaks (by 10%)
We measured the rate of air leaks during the lunch break when the system is at stand-by mode, and surveyed air leaking sites at each location with an air leak checker (UL-102R as made by CTRL Systems). Pressure was measured by referring to the pressure gauge on the receiver tank and time was taken by using a stop watch. This process revealed that the rate of air leaks was approximately 21% and that there were many sites where air is leaking.
- Suspending the use of ventilation fan by installing exhaust duct on air compressor The exhaust air from air compressors is currently discharged indoor. By discharging this exhaust air outdoor by the installation of an exhaust air duct, it will be possible to stop the use of ventilation fan indoor. The energy conservation effect in this case would equal 9,570 [kWh/y].
(iv) Lightings: We measured illumination of the model room (Room 14, Building B) and proposed energy conservation effects of 5,940 [kWh/y] by turning off lighting in unnecessary locations (40 lights) and 9,794[kWh/y] by switching to high-efficiency lamps (changing to inverter-attached Hf-type fluorescent lighting). These measures will reduce the air-conditioning load in all rooms and help contribute to energy conservation.
(v) Boilers: We proposed to adjust a target of 5% for concentration of oxygen in flue gas from the boiler, which is currently 11%. This propose will be estimated 88,490 Bath/y. There are some inadequate thermal insulation parts in the main stem pipe from the boiler. There are also some locations where there is no insulation covering flanges, valves, and other components. Energy conservation effects by fixing up thermal insulation can be expected to equal 11,500 kg-LPG/yr, 205,850 Bath/y.
(4) Comments The OJT for Audits was targeted at participants from the central government and ESCC. Training was undertaken with an emphasis on OJT and trainees were instructed to prepare and submit a report to the factory as well as to prepare and present presentation materials for the seminar. There was not enough time to ascertain the state of factory equipment and energy use, investigate items of energy conservation, and provide guidance on the contents thereof. It must be said that, from the standpoint of ECCJ’s dispatched experts, the Audit results of the factory that provided locations for OJT was insufficient. Nevertheless, the factory executives accepted these audit results positively. We believe that these project activities were undertaken due to the significant leadership of the FP.
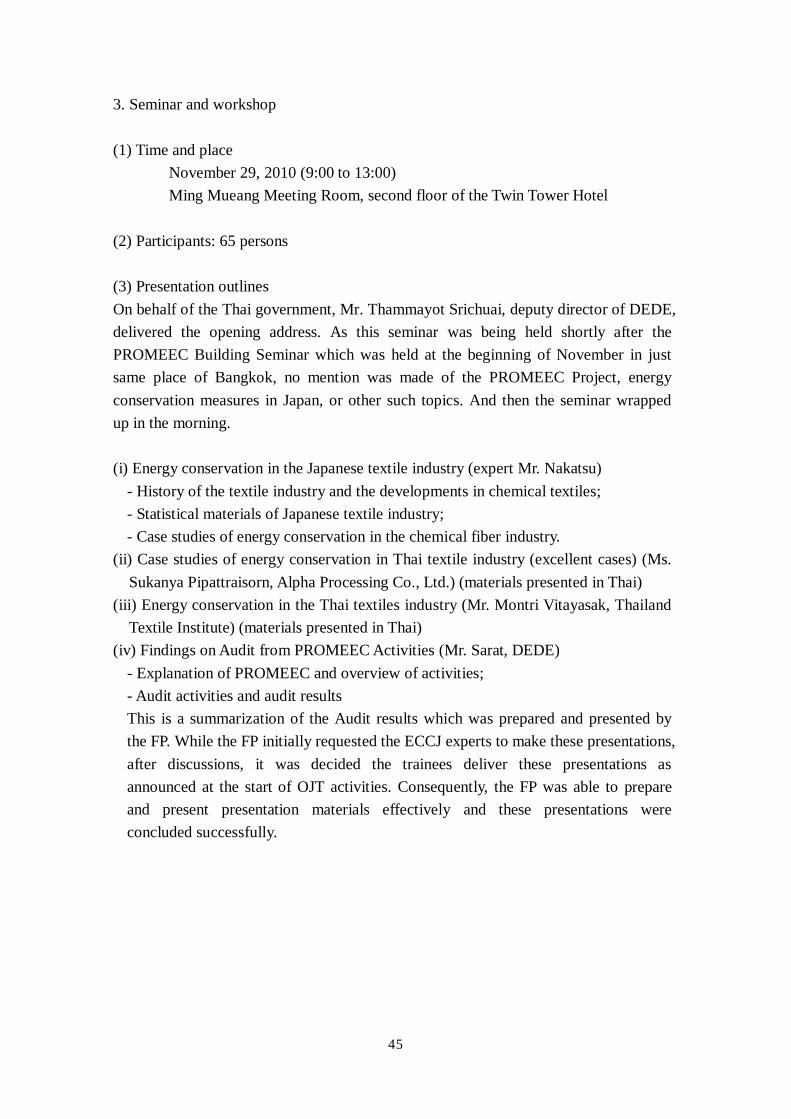
45
3. Seminar and workshop (1) Time and place November 29, 2010 (9:00 to 13:00) Ming Mueang Meeting Room, second floor of the Twin Tower Hotel (2) Participants: 65 persons (3) Presentation outlines On behalf of the Thai government, Mr. Thammayot Srichuai, deputy director of DEDE, delivered the opening address. As this seminar was being held shortly after the PROMEEC Building Seminar which was held at the beginning of November in just same place of Bangkok, no mention was made of the PROMEEC Project, energy conservation measures in Japan, or other such topics. And then the seminar wrapped up in the morning. (i) Energy conservation in the Japanese textile industry (expert Mr. Nakatsu)
- History of the textile industry and the developments in chemical textiles; - Statistical materials of Japanese textile industry; - Case studies of energy conservation in the chemical fiber industry.
(ii) Case studies of energy conservation in Thai textile industry (excellent cases) (Ms. Sukanya Pipattraisorn, Alpha Processing Co., Ltd.) (materials presented in Thai)
(iii) Energy conservation in the Thai textiles industry (Mr. Montri Vitayasak, Thailand Textile Institute) (materials presented in Thai)
(iv) Findings on Audit from PROMEEC Activities (Mr. Sarat, DEDE) - Explanation of PROMEEC and overview of activities; - Audit activities and audit results This is a summarization of the Audit results which was prepared and presented by the FP. While the FP initially requested the ECCJ experts to make these presentations, after discussions, it was decided the trainees deliver these presentations as announced at the start of OJT activities. Consequently, the FP was able to prepare and present presentation materials effectively and these presentations were concluded successfully.
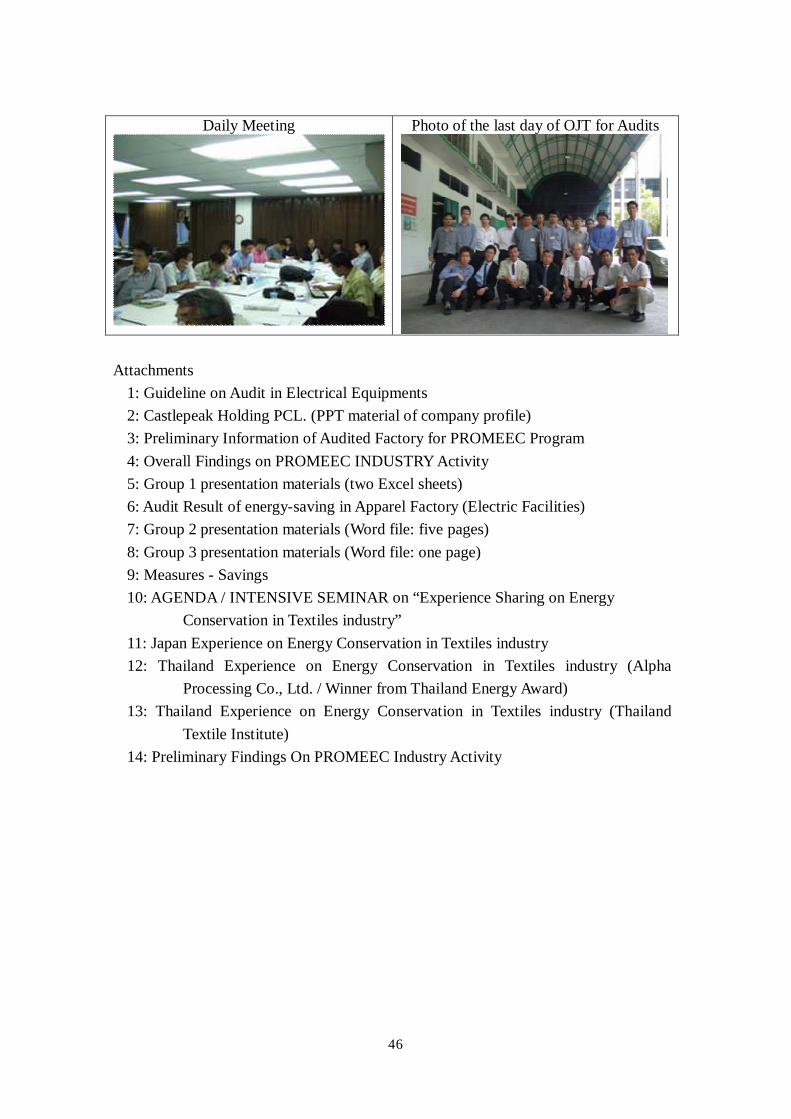
46
Daily Meeting
Photo of the last day of OJT for Audits
Attachments
1: Guideline on Audit in Electrical Equipments 2: Castlepeak Holding PCL. (PPT material of company profile) 3: Preliminary Information of Audited Factory for PROMEEC Program 4: Overall Findings on PROMEEC INDUSTRY Activity 5: Group 1 presentation materials (two Excel sheets) 6: Audit Result of energy-saving in Apparel Factory (Electric Facilities) 7: Group 2 presentation materials (Word file: five pages) 8: Group 3 presentation materials (Word file: one page) 9: Measures - Savings 10: AGENDA / INTENSIVE SEMINAR on “Experience Sharing on Energy
Conservation in Textiles industry” 11: Japan Experience on Energy Conservation in Textiles industry 12: Thailand Experience on Energy Conservation in Textiles industry (Alpha
Processing Co., Ltd. / Winner from Thailand Energy Award) 13: Thailand Experience on Energy Conservation in Textiles industry (Thailand
Textile Institute) 14: Preliminary Findings On PROMEEC Industry Activity
47
V. Developing TD and IHD 1. Overview of the activities As a part of this year’s PROMEEC Project activity, we visited Jakarta, Indonesia, where the office of ACE is located, to ascertain the current state of system development and outstanding issues of the development of TD and IHD for industries and buildings and consult with ACE officials and formulate policies about future development work. 2. Developing TD system (1) Basic policy of TD
TD system is not aimed at developing technical databases but is rather a system to compile and use technical items obtained through PROMEEC activities as a directory.
(2) Original data Case examples selected from ASEAN Energy Awards consisting of (i) Energy Efficient Buildings and (ii) Energy Management/Best Practices for Buildings & Industries came to the basic data used for TD.
(3) System to be used The system will link TD to the web site of the Award and applicable materials are got by opening the awards website linked to TD. For more detailed information, the user can contact the business offices or companies which presented the ASEAN energy awards or obtain technical information with a different search engine. This point will be subject to further study. We will also investigate the possibility of enabling users to directly access to the page of ASEAN energy awards from TD (ACE will be in charge).
(4) Items to be included in TD Items that should be included in a TD shall be selected from materials on the ASEAN Energy Awards by an ECCJ expert and notified to ACE for registration. Specifically, an ECCJ expert shall mark and scan items to be included in a TD on a hard copy of materials on the ASEAN Energy Awards before sending this hard copy to ACE, whereupon ACE shall register the marked items to a TD. ASEAN Energy Awards in the past and from the following year shall be covered.
(5) TD categories (i) Category 1
; Buildings: hospitals, etc. ; industry: cement, etc.
(ii) Category 2 and beyond: categories by technology (for this purpose, the ECCJ will provide advice after compiling the data)
48
(6) Work of ACE (person in charge: Mr. Junianto) (i) Explanatory materials of TD revisions as mentioned above shall be prepared, a
briefing shall be delivered at PS WS in February, and the consent of PROMEEC members shall be obtained. Revision work shall thereafter begin.
(ii) TD System bulletins will be disseminated at each WS. (iii) The materials size shall be appropriate so as to facilitate linking and accessing. (iv) Access point aggregation for each TD and IHDB shall be possible (the frequency
of access to TD or IHD shall be ascertained as a benchmark for usage). 3. Developing an IHD system (1) Basic policy of IHD
The top purpose of IHD is to use it as an EM tool at business entities that are subject of Audit. Data is received during company visit for Audit and entered into an IHD to consolidate the data. Specific measures for this purpose are outlined below:
(2) Activities at Audit (participants from ACE are in charge) (i) On the first day of an audit, a briefing on the purpose of IHD (“to be supplied and
used as an EM tool after data is entered”), the forms, case examples, etc. shall be given by PowerPoint presentation in order to get cooperation.
(ii) From the second day of an Audit, data shall be received or obtained in advance to be entered into an IHD.
(iii) At a meeting at which Audit results are reported to the Audit client, an ACE official shall provide a report on the results entered into an IHD by ACE (including energy consumption trends, changes in specific consumption, and, if possible, comparisons with other business entities in the same industry). A completed file shall be offered to the audited business entity.
(iv) Where necessary, with the approval of the audited business entity, ACE official shall report the outlining (iii) above at an Incentive Seminar.
(3) Ongoing data collection (carried out by ACE official) Data on previously audited business entities and business entities audited this year shall be collected and compiled by ACE.
4. Current state of building sector IHD and revisions as implemented (1) Current state
While checking buildings-related data such as (i) data retained by ACE/ECCJ, (ii) the count of IHD that were previously presented by ACE on a trial usage basis, and (iii) the count of IHD verified this time, some progress of data entry was confirmed, though items have not yet been uploaded to databases.
49
(2) File revisions To produce a master file, we focused on a Cambodian hotel at which we conducted OJT for audits in 2009, entered data, and engaged in necessary form revisions. Since there were no entry items relating to specific energy consumption, (i) the specific energy consumption per total floor area (excluding outdoor parking areas) and (ii) the specific energy consumption per air-conditioning area were added. As there are no ACE standards in particular, specific energy consumption items corresponding to ACE standards have not yet been produced. Also, graphical displays differed between the 2003 version and 2007 version of Excel; revisions were made by unifying all graphs to the 2007 version of software.
5. Current state of industry sector IHD and implemented revisions (1) Current state
While three types of master files consisting of the Cement Energy Management Questionnaire, the Food Energy Management Questionnaire, and the Textile Energy Management Questionnaire have been uploaded, they are not being used. We checked (i) data retained by ACE/ECCJ, (ii) the count of IHD that have been previously presented by ACE on a trial usage basis, and (iii) the count of IHD verified this time regarding industry-related data. In regards to industry, only three cases consisting of food & textiles in 2007 and textiles in 2008 have been entered into ACE’s computers; the volume of data entered thus far is low and the support of the ECCJ is required. In addition, items have not yet been uploaded to databases.
(2) File revisions Since IHD sheets for industry differ according to every industrial sector, we entered data partially prepared by ACE officials on the Vietnamese textile industry as audited in 2007 and produced a master file for the textiles industry. Since the preparation of a master file for each industry is required for every industrial sector, ECCJ experts will need to take time to provide support.

The permission of the International Cooperation Department of the International Cooperation Division of the Energy Conservation Center, Japan must be obtained in advance when publicly disclosing the contents of this report.
Tel.: +81-3-5543-3018 Fax: +81-3-5543-3022