Embed Size (px)
Citation preview
2010 AnnuAl RepoRt
Air ProductsCelebrating the Innovation of the Past and Its Promise for the Future
Air Products | 2010 Annual Report
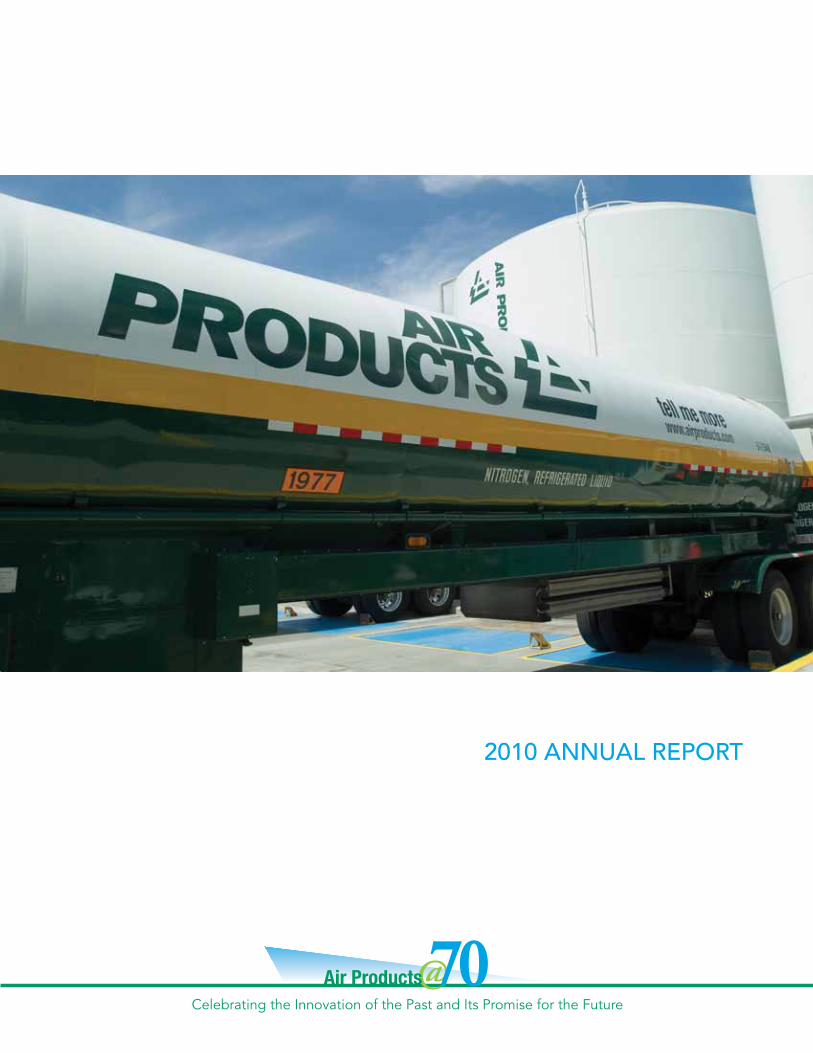
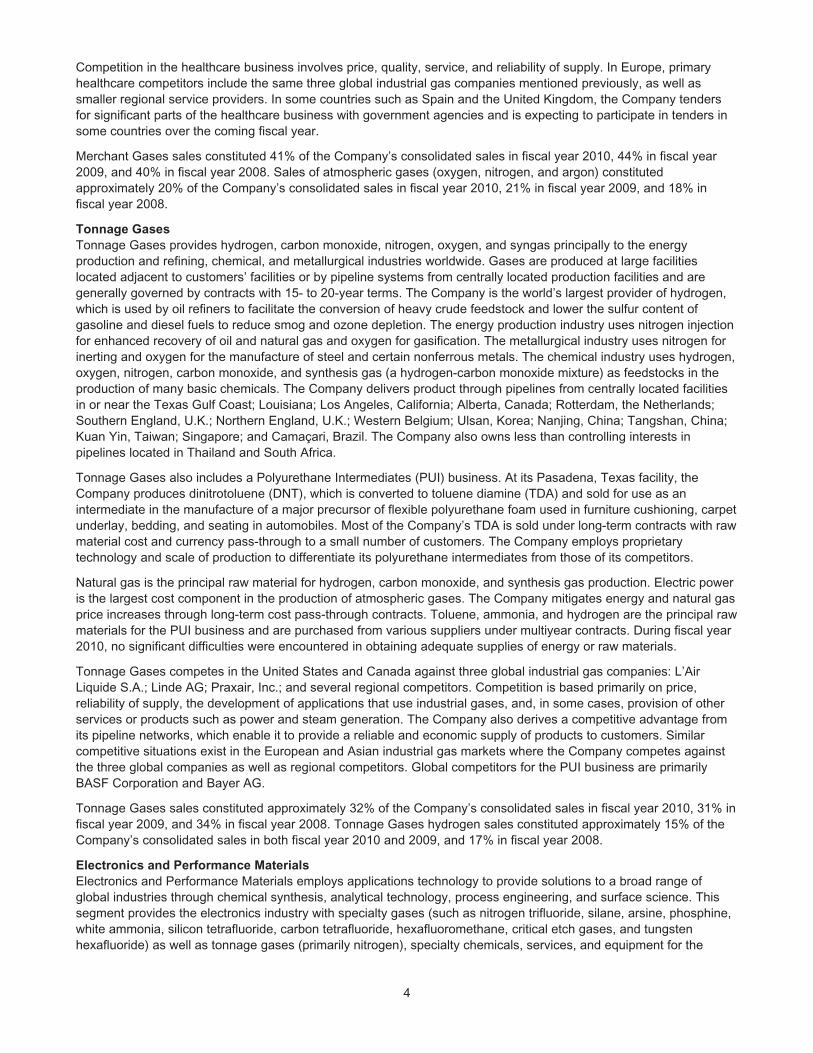
Millions of dollars, except per share 2010 2009 Change
For the YearSales $9,026 $8,256 9%Operating income 1,389 846 64%Operating income (A) 1,485 1,185 25%Net income attributable to Air Products 1,029 631 63%Capital expenditures (A) 1,298 1,475 (12)%Return on capital employed(A) 12.4 % 10.6 %Return on average Air Products shareholders’ equity (B) 19.9 % 13.3 %Operating margin 15.4 % 10.3 %Operating margin(A) 16.5% 14.3%
Per Share DollarSDiluted earnings 4.74 2.96 60%Diluted earnings(A) 5.02 4.06 24%Dividends 1.92 1.79 7%Book value 25.94 22.68 14%
at Year enD Air Products shareholders’ equity $5,547 $4,792Shares outstanding (in millions) 214 211 Shareholders 8,300 8,600Employees (C) 18,300 18,900
Financial Highlights
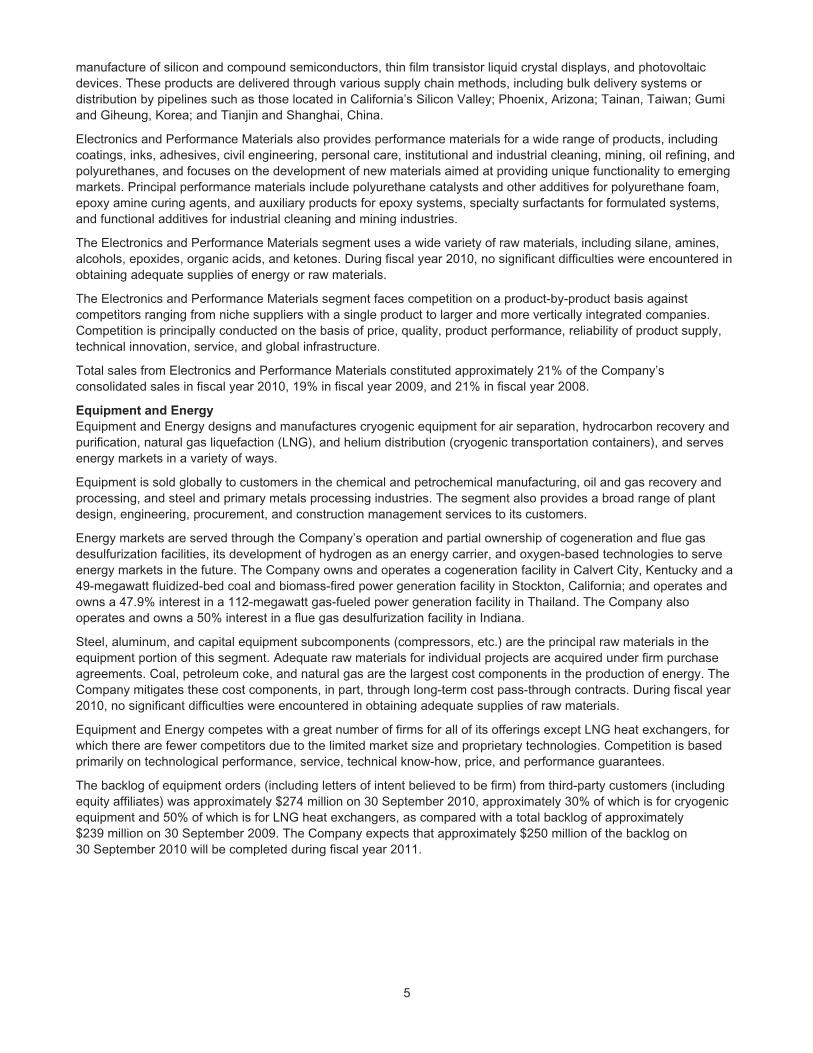
return on air Products Shareholders’ equity
Percentage using income and Air Products shareholders’ equity from continuing operations
SalesBillions of dollars
earnings per ShareDollars—diluted basis
Consolidated Sales by
Business Segment
41%
32%
21%
6%
• Merchant Gases
• Tonnage Gases
• Electronics and Performance Materials
• Equipment and Energy
• United States
• Europe
• Asia
• Canada/Latin America/ROW
32%
39%Consolidated
Sales by Destination
21%
8%
2010
2009
2008
2007
2006
20.1
19.5
15.1
13.3
19.9
10.4
9.1
7.9
9.0
8.3
2010
2009
2008
2007
2006
4.15
4.64
3.18
4.74
2.96
2010
2009
2008
2007
2006
(A) Amounts are non-GAAP measures. See pages V and VI for reconciliation to GAAP results.(B) Calculated using income and five-quarter average Air Products shareholders’ equity from continuing operations.(C) Includes full- and part-time employees from continuing and discontinued operations.
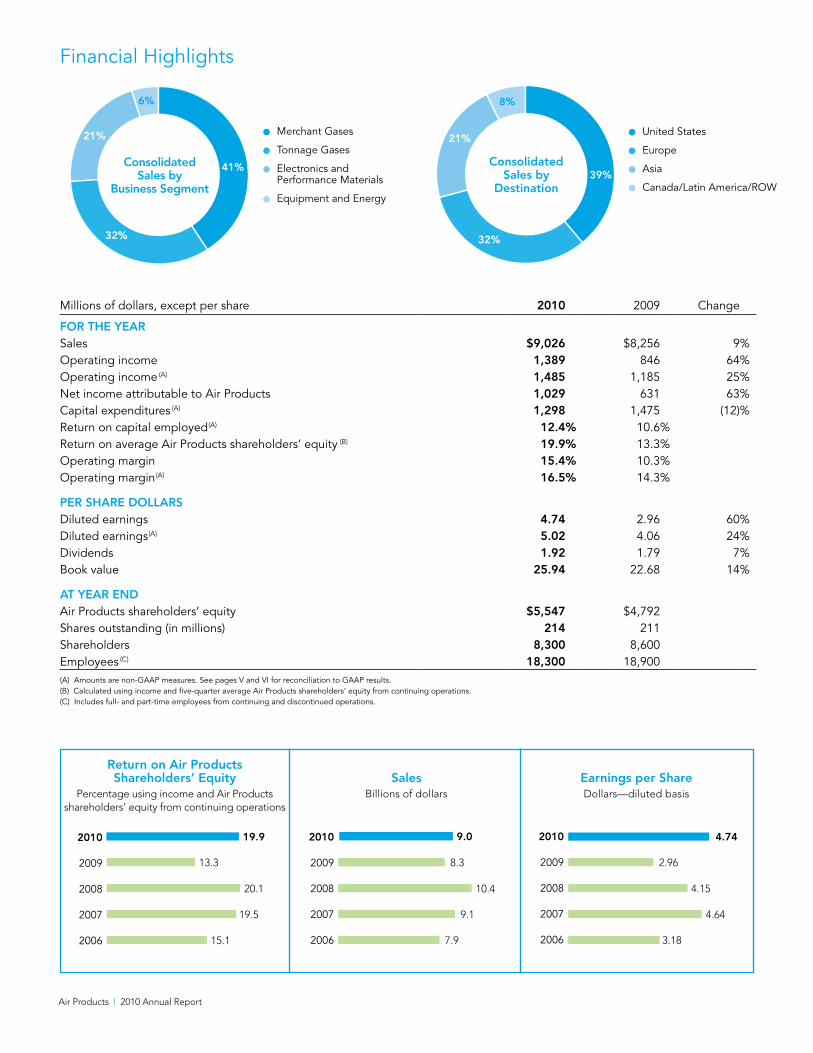
Merchant Gases
Industrial and medical customers throughout the world depend on our oxygen, nitrogen,
argon, helium, hydrogen, and medical and specialty gases for a wide array of applications.
We supply most merchant gas in liquid form to small and larger customers—delivered by the
Air Products tankers you see on the road. We provide smaller quantities of our “packaged”
gases in cylinders and dewars for customers who require more exacting quantities for their
processes. And we make available proprietary on-site gas generation devices (cryogenic
and noncryogenic) to meet customers’ varying purity, pressure and flow rate requirements
economically.
2010 consolidated sales: $3.7 billion
Major end markets: glassmaking, steel, nonferrous, oil field services, pulp and paper, water
systems, metal manufacturing, chemical processing, rubber and plastics, packaging, food
and beverage, healthcare, medical, research and analytical, aerospace, and electronics
2011 segment operating margin goal: 20%
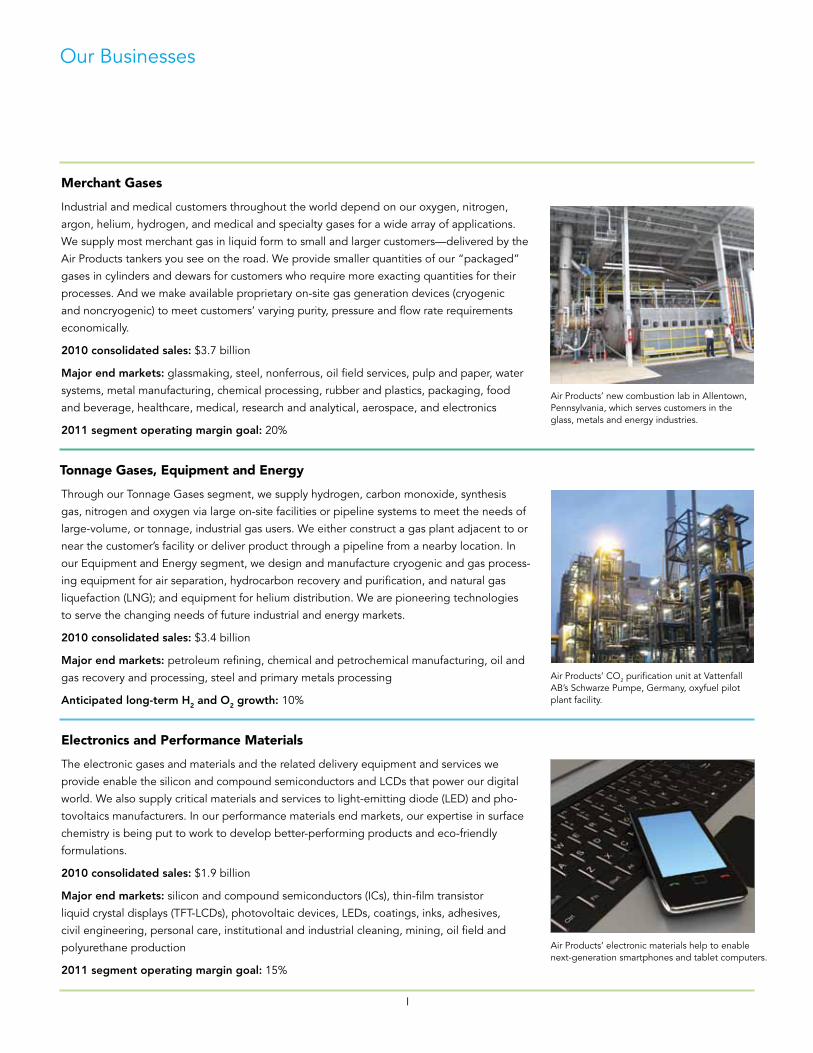
Tonnage Gases, Equipment and Energy
Through our Tonnage Gases segment, we supply hydrogen, carbon monoxide, synthesis
gas, nitrogen and oxygen via large on-site facilities or pipeline systems to meet the needs of
large-volume, or tonnage, industrial gas users. We either construct a gas plant adjacent to or
near the customer’s facility or deliver product through a pipeline from a nearby location. In
our Equipment and Energy segment, we design and manufacture cryogenic and gas process-
ing equipment for air separation, hydrocarbon recovery and purification, and natural gas
liquefaction (LNG); and equipment for helium distribution. We are pioneering technologies
to serve the changing needs of future industrial and energy markets.
2010 consolidated sales: $3.4 billion
Major end markets: petroleum refining, chemical and petrochemical manufacturing, oil and
gas recovery and processing, steel and primary metals processing
anticipated long-term h2 and o2 growth: 10%
Electronics and Performance Materials
The electronic gases and materials and the related delivery equipment and services we
provide enable the silicon and compound semiconductors and LCDs that power our digital
world. We also supply critical materials and services to light-emitting diode (LED) and pho-
tovoltaics manufacturers. In our performance materials end markets, our expertise in surface
chemistry is being put to work to develop better-performing products and eco-friendly
formulations.
2010 consolidated sales: $1.9 billion
Major end markets: silicon and compound semiconductors (ICs), thin-film transistor
liquid crystal displays (TFT-LCDs), photovoltaic devices, LEDs, coatings, inks, adhesives,
civil engineering, personal care, institutional and industrial cleaning, mining, oil field and
polyurethane production
2011 segment operating margin goal: 15%
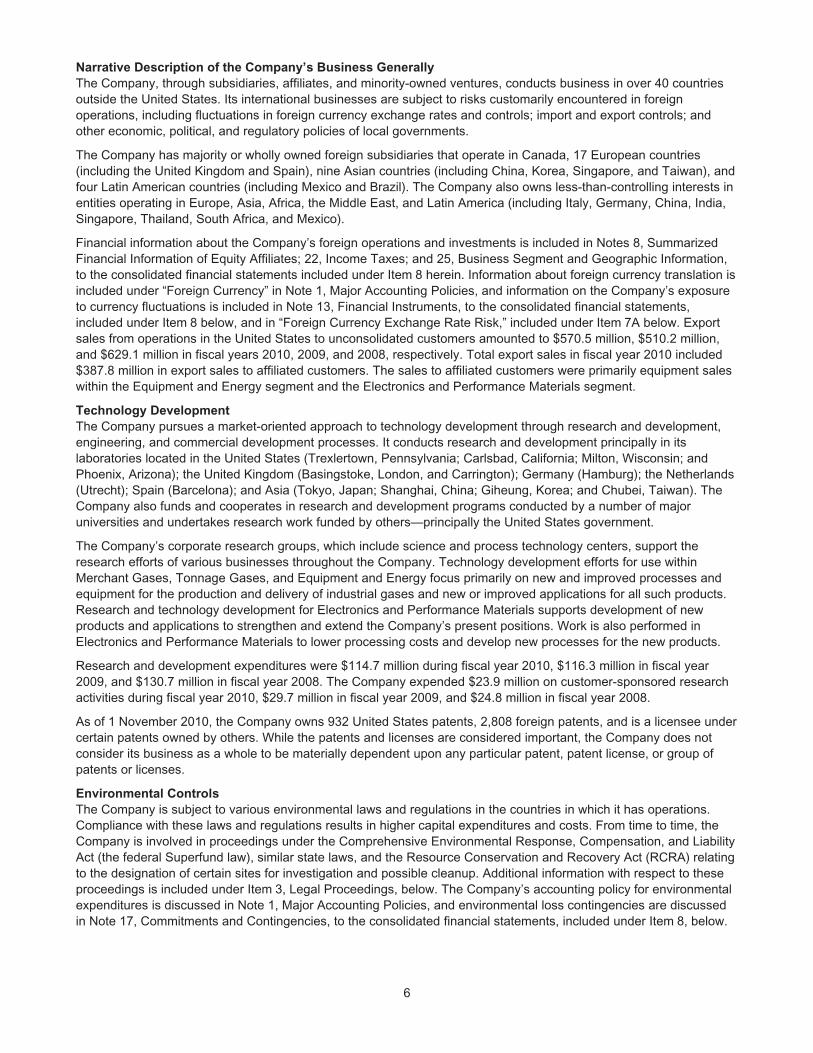
Our Businesses
I
Air Products’ new combustion lab in Allentown, Pennsylvania, which serves customers in the glass, metals and energy industries.
Air Products’ CO2 purification unit at Vattenfall AB’s Schwarze Pumpe, Germany, oxyfuel pilot plant facility.
Air Products’ electronic materials help to enable next-generation smartphones and tablet computers.
Air Products | 2010 Annual Report
To Our Shareholders
Fiscal 2010 results
We finished fiscal 2010 with $9 billion in sales, a 9 percent
increase from the prior year’s $8.3 billion. We delivered strong
volume growth as the economy improved. Our growth was driven
by our Electronics and Performance Materials business, and new
investments and contracts in our Tonnage Gases segment.
This past year, we significantly increased our productivity and
competitiveness. Earnings per share increased 24 percent to
$5.02. Our operating income increased 25 percent to $1.5 billion
and our operating margin grew 220 basis points to 16.5 percent,
our highest margin in recent times. Our return on capital
employed improved to 12.4 percent in fiscal 2010, almost 200
basis points higher than the prior year. Finally, we increased our
dividend for the 28th straight year.
highlights from the Year
During the year, we announced a number of important projects,
including world-scale hydrogen plants for Monsanto in Luling,
Louisiana; ExxonMobil in Rotterdam, the Netherlands; and
PetroChina in Sichuan, China. We also received the largest single
air separation unit (ASU) on-site order ever committed to an
industrial gas company. We will build, own and operate three ASU
trains, producing over 8,200 tons per day (TPD) of oxygen and
more than 3,100 TPD of nitrogen for Pucheng Clean Energy Co., Ltd.
II
Dear Shareholder,
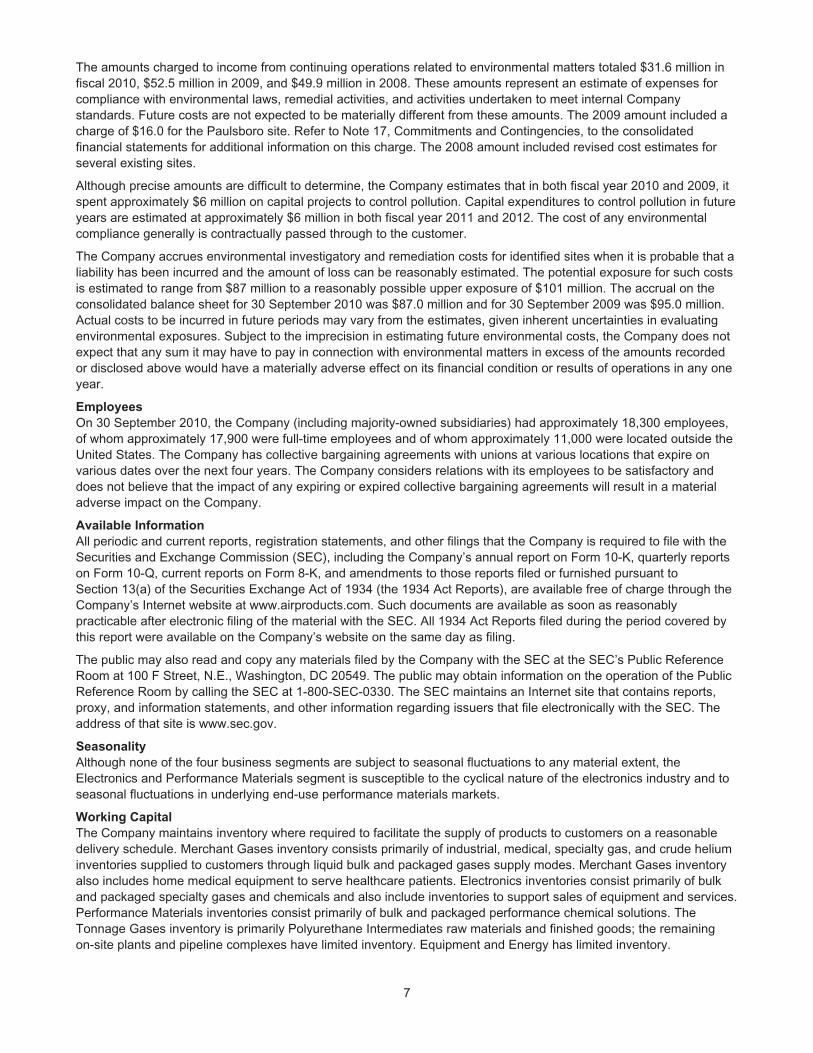
October 1, 2010 marked the beginning of our fiscal year and the 70th anniversary of Air Products’
founding, which we are commemorating with the theme, “Celebrating the Innovation of the Past and Its
Promise for the Future.” The resiliency of this 70-year-old Company is directly attributable to the creativity,
passion and confidence of the Company’s employees. These traits were evident in fiscal 2010 when, after
two challenging years weathering the recession, we saw significant business improvement and announced
a number of new investments and initiatives that will drive growth well into the future. Our employees’
efforts are also why we remain on target to hit our goal of a 17 percent margin in fiscal 2011.
Certain amounts and comparisons to the prior year in this letter are considered non-GAAP measures. Please see pages V and VI for the comparable GAAP amounts and reconciliations.
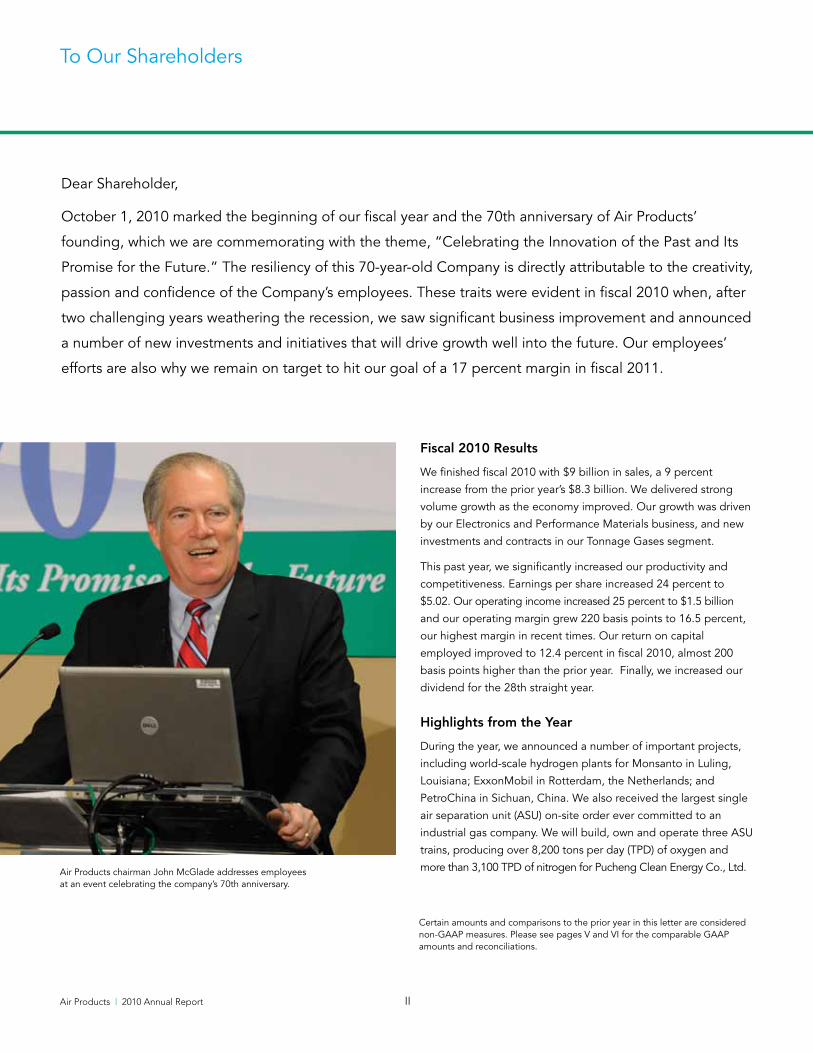
Air Products chairman John McGlade addresses employees at an event celebrating the company’s 70th anniversary.
III
Our Electronics business signed a contract with Samsung to
double the existing bulk gas supply of high-purity oxygen and
nitrogen at the company’s Austin, Texas, site. A significant amount
of specialty gas and chemical delivery equipment will also be
supplied.
Early in the fiscal year, we cut the ribbon on our new world-scale
Performance Materials plant in Nanjing, China, significantly
increasing this business’s presence and capability within the high-
growth Asia region.
Our Equipment business announced a sizable deal with Chevron
to supply its Gorgon Project in western Australia with our
proprietary liquefied natural gas (LNG) process technology and
equipment for three process trains producing up to 15 million
tons of LNG per year.
Of course, we also made a compelling offer to acquire Airgas, Inc.
in February. We believe the combination of our global leadership
and geographic positions in the liquid bulk and tonnage gas
businesses combined with Airgas’ leadership in the U.S. packaged
gases business, will result in a global industrial gas leader with
strengths and competencies across all distribution channels and
geographies.
Celebrating the Innovation of the Past and Its Promise for the Future
Since our founding, we’ve used our understanding of the
industries and customers we serve to develop unique answers to
their problems while driving profitable growth for our investors.
Looking ahead, innovation remains an important element of
our success. In the past year, we have undertaken a number of
initiatives that we expect to pay dividends well into the future. In
our tonnage business, our new hydrogen plants currently under
construction feature technology advancements to maximize
facility energy efficiency while reducing emissions. These
enhanced designs target minimal loss of heat to the environment,
which results in a reduction in the quantity of natural gas
consumed.
Air ProductsCelebrating the Innovation of the Past and Its Promise for the Future
Our work around carbon capture and purification continues to
hold promise. Earlier this year, Air Products was selected by the
U.S. Department of Energy to receive approximately $250 million
in funding under the Industrial Carbon Capture and Sequestration
Program for our project in Port Arthur, Texas. We plan to design,
construct and operate a state-of-the-art system to capture
carbon dioxide (CO2) from our facilities located in Port Arthur.
The recovered and purified CO2 would then be used for injection
into existing oil fields to improve oil production. Approximately
one million tons of CO2 will be recovered annually, purified and
delivered via pipeline to nearby oil fields.
Our efforts don’t end there. We are involved in a number of
projects around the world. In fact, we are targeting the start-up
of our pilot plant at Vattenfall AB, one of Europe’s leading energy
companies, by the end of December. Air Products is installing its
proprietary CO2 capture, purification and compression system at
Vattenfall’s research and development facility in Schwarze Pumpe,
Germany, a project that is viewed as the preeminent CO2 oxyfuel
project in the world.
During the year, we also commissioned our new combustion
lab, which is focused on clean energy. The lab will further enhance
Air Products’ ability to leverage its more than 40 years of
knowledge in combustion, thus providing our customers in
the glass, metals and refining businesses with the efficiency,
productivity and environmental benefits they have come to expect
from working with us.
Innovation has always been at the heart of what we do in our
Electronics and Performance Materials businesses. Electronics
introduced xenon difluoride (XeF2), a unique etching material
used in the electronics industry. The business also introduced its
EXTREMA® Precursors for next-generation memory applications,
which help to enable the newest smartphones and tablet
computers.
In Performance Materials, we introduced a number of new,
environmentally friendly defoamers and surfactants for the
coatings, graphic arts and adhesives markets. These new products
help manufacturers reduce their environmental impact without
sacrificing quality and performance.
Air Products | 2010 Annual Report IV
outlook
As Air Products begins its eighth decade, we are excited by our
opportunities and remain committed to delivering consistent,
strong earnings growth along with improved margins and
returns throughout the economic cycle. We expect our capital
expenditures in 2011 to be in a range of $1.5 to $1.7 billion,
excluding acquisitions, and we continue to be interested in
acquiring captive plants from our customers like we did with
MarkWest and Xingtai Steel. We remain focused on delivering the
performance you have come to expect from us as a shareholder.
As we close out fiscal 2010 and look to the future, I want to
thank our employees around the world for their hard work, focus
and dedication. They created the momentum that will allow us
to deliver on our 17 percent margin target in fiscal 2011 while
driving double-digit EPS growth and continuing our return on
capital improvements. Thank you for your continued support and
investment in Air Products.
Very truly yours,
John E. McGlade
Chairman, President and Chief Executive Officer
Sustainability
We see sustainability as part of what we do and who we are. It
has been and will continue to be a source of growth for us. In the
area of environmental stewardship, we have set aggressive targets
for our performance. As a socially responsible corporation, we
strive to be a good employer and neighbor. We are committed to
building relationships in the communities in which we operate. Our
employees are engaged in their communities and help support our
priorities of education, health and human services, community and
economic development, arts and culture, and environment and
safety.
As we mark the 70th anniversary of Air Products, global macro
trends driven by societal demands, legislative changes, and
demographic shifts are providing even more opportunities for us
to grow.
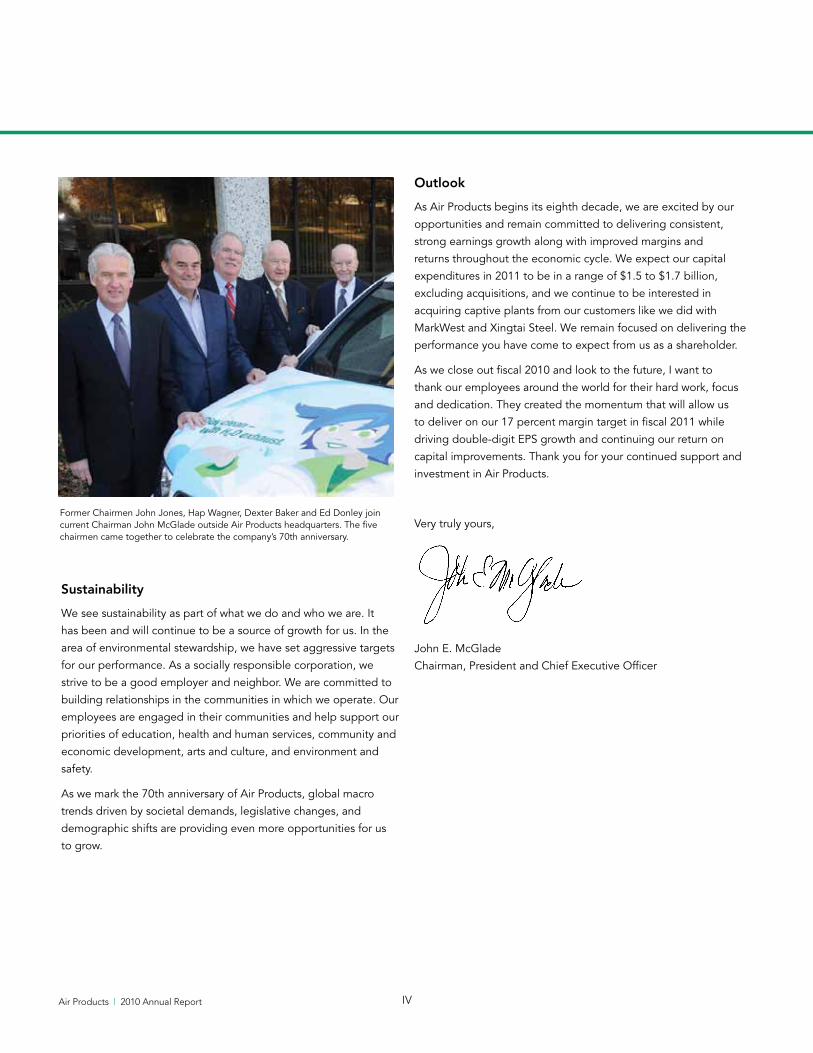
Former Chairmen John Jones, Hap Wagner, Dexter Baker and Ed Donley joincurrent Chairman John McGlade outside Air Products headquarters. The fivechairmen came together to celebrate the company’s 70th anniversary.
Non-GAAP Measures
V
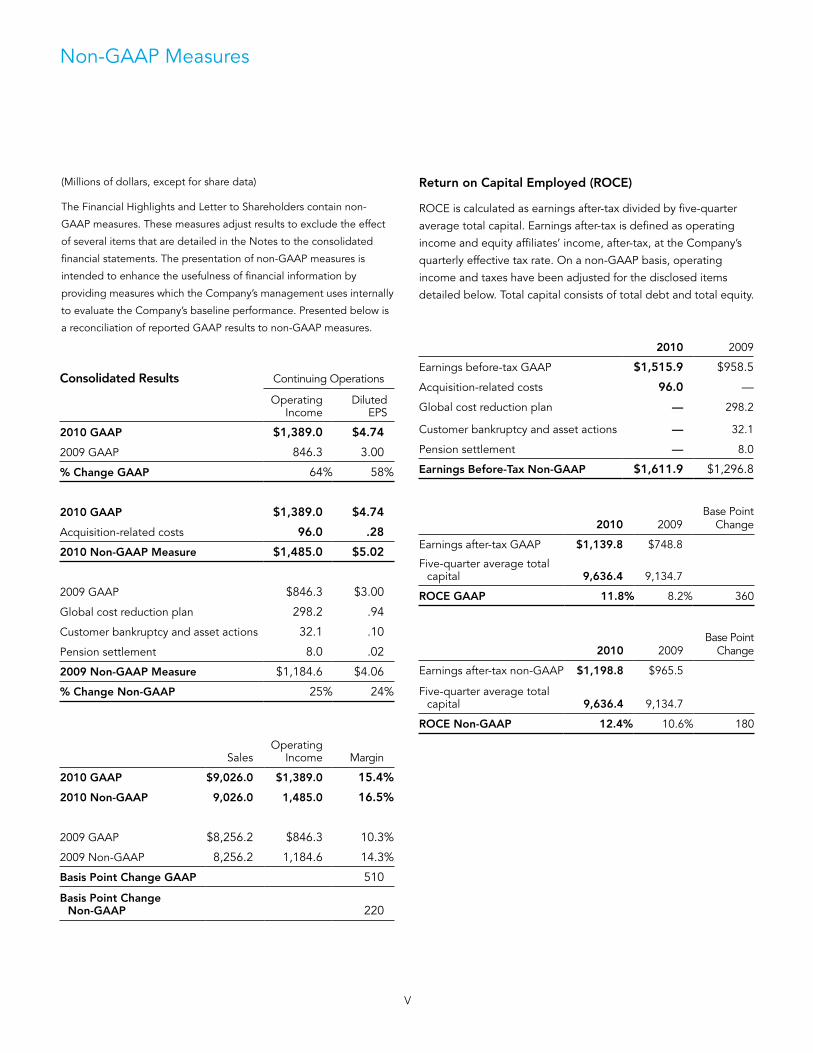
Consolidated results Continuing Operations
Operating Income
Diluted EPS
2010 GaaP $1,389.0 $4.74
2009 GAAP 846.3 3.00
% Change GaaP 64% 58%
2010 GaaP $1,389.0 $4.74
Acquisition-related costs 96.0 .28
2010 non-GaaP Measure $1,485.0 $5.02
2009 GAAP $846.3 $3.00
Global cost reduction plan 298.2 .94
Customer bankruptcy and asset actions 32.1 .10
Pension settlement 8.0 .02
2009 non-GaaP Measure $1,184.6 $4.06
% Change non-GaaP 25% 24%
SalesOperating
Income Margin
2010 GaaP $9,026.0 $1,389.0 15.4%
2010 non-GaaP 9,026.0 1,485.0 16.5%
2009 GAAP $8,256.2 $846.3 10.3%
2009 Non-GAAP 8,256.2 1,184.6 14.3%
Basis Point Change GaaP 510
Basis Point Change non-GaaP 220
(Millions of dollars, except for share data)
The Financial Highlights and Letter to Shareholders contain non-
GAAP measures. These measures adjust results to exclude the effect
of several items that are detailed in the Notes to the consolidated
financial statements. The presentation of non-GAAP measures is
intended to enhance the usefulness of financial information by
providing measures which the Company’s management uses internally
to evaluate the Company’s baseline performance. Presented below is
a reconciliation of reported GAAP results to non-GAAP measures.
return on Capital employed (roCe)
ROCE is calculated as earnings after-tax divided by five-quarter
average total capital. Earnings after-tax is defined as operating
income and equity affiliates’ income, after-tax, at the Company’s
quarterly effective tax rate. On a non-GAAP basis, operating
income and taxes have been adjusted for the disclosed items
detailed below. Total capital consists of total debt and total equity.
2010 2009
Earnings before-tax GAAP $1,515.9 $958.5
Acquisition-related costs 96.0 —
Global cost reduction plan — 298.2
Customer bankruptcy and asset actions — 32.1
Pension settlement — 8.0
earnings Before-tax non-GaaP $1,611.9 $1,296.8
2010 2009Base Point
Change
Earnings after-tax GAAP $1,139.8 $748.8
Five-quarter average total capital 9,636.4 9,134.7
roCe GaaP 11.8% 8.2% 360
2010 2009Base Point
Change
Earnings after-tax non-GAAP $1,198.8 $965.5
Five-quarter average total capital 9,636.4 9,134.7
roCe non-GaaP 12.4% 10.6% 180
Air Products | 2010 Annual Report
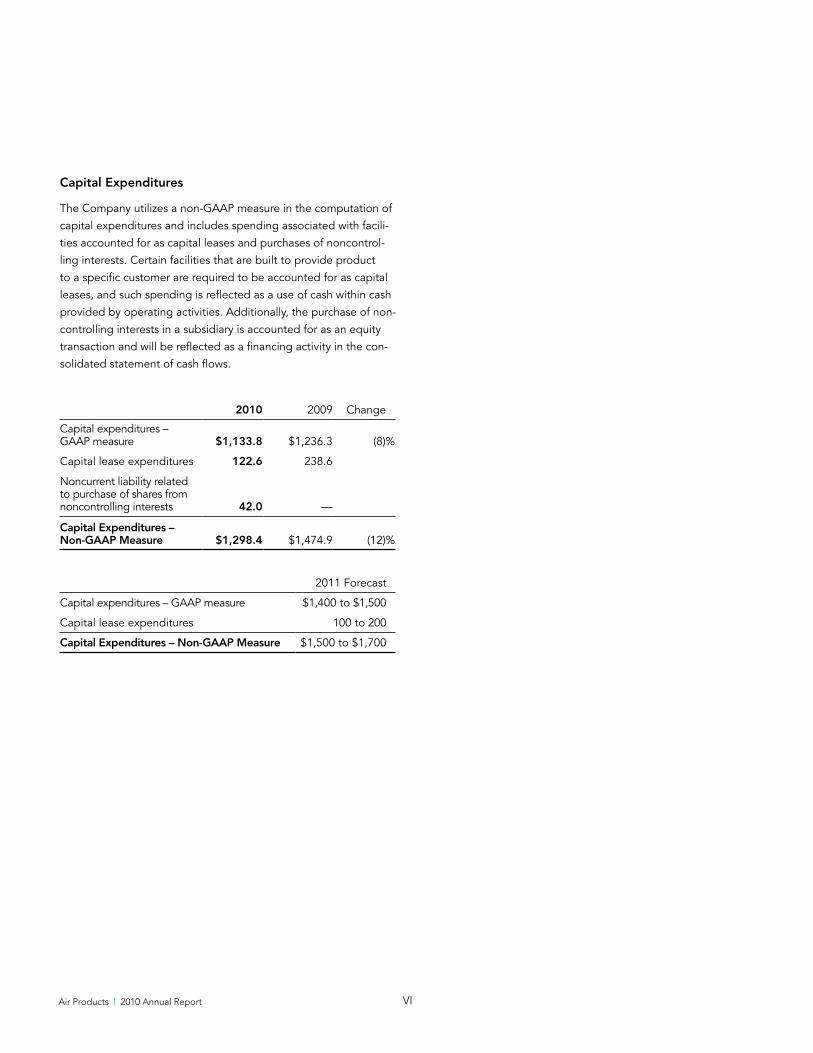
Capital expenditures
The Company utilizes a non-GAAP measure in the computation of
capital expenditures and includes spending associated with facili-
ties accounted for as capital leases and purchases of noncontrol-
ling interests. Certain facilities that are built to provide product
to a specific customer are required to be accounted for as capital
leases, and such spending is reflected as a use of cash within cash
provided by operating activities. Additionally, the purchase of non-
controlling interests in a subsidiary is accounted for as an equity
transaction and will be reflected as a financing activity in the con-
solidated statement of cash flows.
2010 2009 Change
Capital expenditures – GAAP measure $1,133.8 $1,236.3 (8)%
Capital lease expenditures 122.6 238.6
Noncurrent liability related to purchase of shares from noncontrolling interests 42.0 —
Capital expenditures – non-GaaP Measure $1,298.4 $1,474.9 (12)%
2011 Forecast
Capital expenditures – GAAP measure $1,400 to $1,500
Capital lease expenditures 100 to 200
Capital expenditures – non-GaaP Measure $1,500 to $1,700
VI
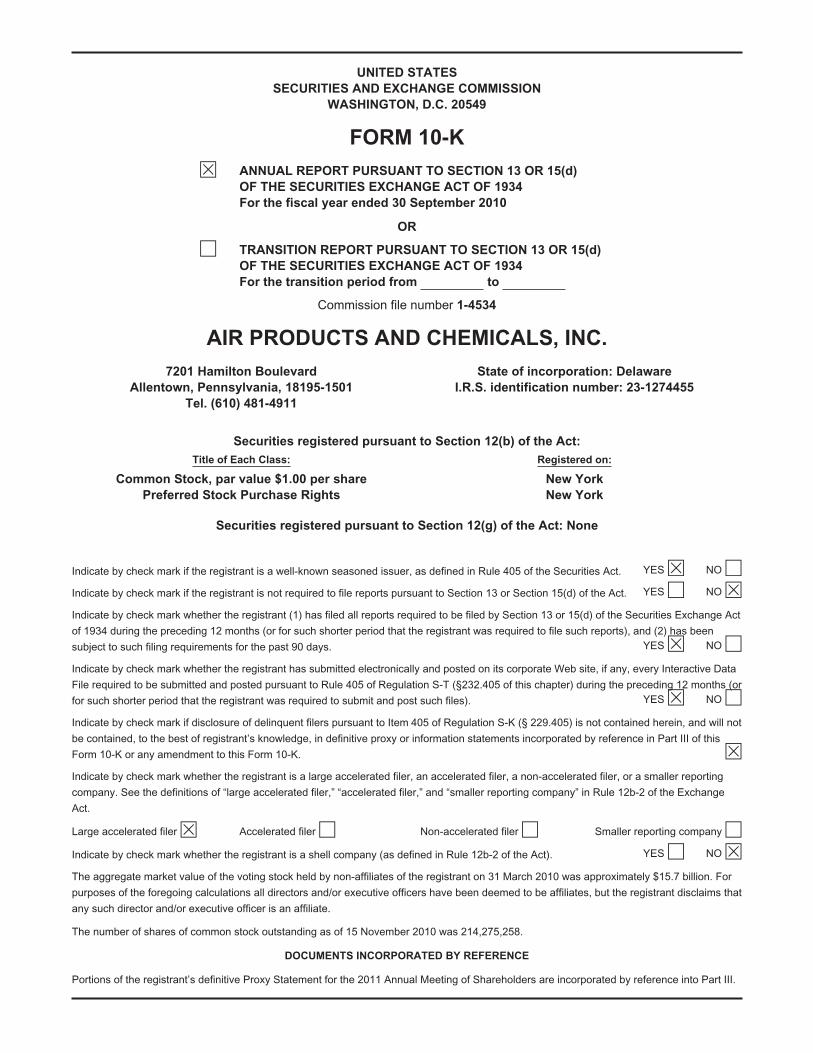
UNITED STATES
SECURITIES AND EXCHANGE COMMISSION
WASHINGTON, D.C. 20549
FORM 10-K
È ANNUAL REPORT PURSUANT TO SECTION 13 OR 15(d)
OF THE SECURITIES EXCHANGE ACT OF 1934
For the fiscal year ended 30 September 2010
OR
‘ TRANSITION REPORT PURSUANT TO SECTION 13 OR 15(d)
OF THE SECURITIES EXCHANGE ACT OF 1934
For the transition period from to
Commission file number 1-4534
AIR PRODUCTS AND CHEMICALS, INC.
7201 Hamilton Boulevard State of incorporation: Delaware
Allentown, Pennsylvania, 18195-1501 I.R.S. identification number: 23-1274455
Tel. (610) 481-4911
Securities registered pursuant to Section 12(b) of the Act:
Title of Each Class: Registered on:
Common Stock, par value $1.00 per share New York
Preferred Stock Purchase Rights New York
Securities registered pursuant to Section 12(g) of the Act: None
Indicate by check mark if the registrant is a well-known seasoned issuer, as defined in Rule 405 of the Securities Act. YESÈ NO‘
Indicate by check mark if the registrant is not required to file reports pursuant to Section 13 or Section 15(d) of the Act. YES‘ NOÈ
Indicate by check mark whether the registrant (1) has filed all reports required to be filed by Section 13 or 15(d) of the Securities Exchange Act
of 1934 during the preceding 12 months (or for such shorter period that the registrant was required to file such reports), and (2) has been
subject to such filing requirements for the past 90 days. YESÈ NO‘
Indicate by check mark whether the registrant has submitted electronically and posted on its corporate Web site, if any, every Interactive Data
File required to be submitted and posted pursuant to Rule 405 of Regulation S-T (§232.405 of this chapter) during the preceding 12 months (or
for such shorter period that the registrant was required to submit and post such files). YESÈ NO‘
Indicate by check mark if disclosure of delinquent filers pursuant to Item 405 of Regulation S-K (§ 229.405) is not contained herein, and will not
be contained, to the best of registrant’s knowledge, in definitive proxy or information statements incorporated by reference in Part III of this
Form 10-K or any amendment to this Form 10-K. È
Indicate by check mark whether the registrant is a large accelerated filer, an accelerated filer, a non-accelerated filer, or a smaller reporting
company. See the definitions of “large accelerated filer,” “accelerated filer,” and “smaller reporting company” in Rule 12b-2 of the Exchange
Act.
Large accelerated filerÈ Accelerated filer‘ Non-accelerated filer‘ Smaller reporting company‘
Indicate by check mark whether the registrant is a shell company (as defined in Rule 12b-2 of the Act). YES‘ NOÈ
The aggregate market value of the voting stock held by non-affiliates of the registrant on 31 March 2010 was approximately $15.7 billion. For
purposes of the foregoing calculations all directors and/or executive officers have been deemed to be affiliates, but the registrant disclaims that
any such director and/or executive officer is an affiliate.
The number of shares of common stock outstanding as of 15 November 2010 was 214,275,258.
DOCUMENTS INCORPORATED BY REFERENCE
Portions of the registrant’s definitive Proxy Statement for the 2011 Annual Meeting of Shareholders are incorporated by reference into Part III.
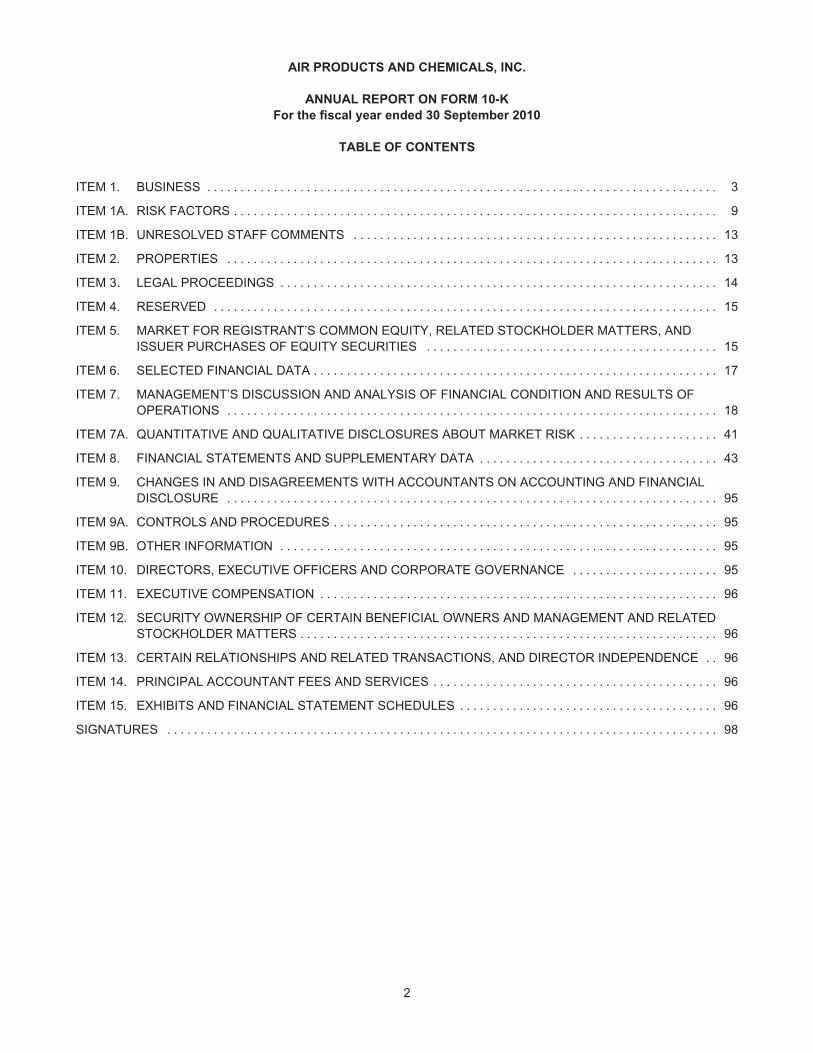
AIR PRODUCTS AND CHEMICALS, INC.
ANNUAL REPORT ON FORM 10-K
For the fiscal year ended 30 September 2010
TABLE OF CONTENTS
ITEM 1. BUSINESS . . . . . . . . . . . . . . . . . . . . . . . . . . . . . . . . . . . . . . . . . . . . . . . . . . . . . . . . . . . . . . . . . . . . . . . . . . . . . 3
ITEM 1A. RISK FACTORS . . . . . . . . . . . . . . . . . . . . . . . . . . . . . . . . . . . . . . . . . . . . . . . . . . . . . . . . . . . . . . . . . . . . . . . . . 9
ITEM 1B. UNRESOLVED STAFF COMMENTS . . . . . . . . . . . . . . . . . . . . . . . . . . . . . . . . . . . . . . . . . . . . . . . . . . . . . . . 13
ITEM 2. PROPERTIES . . . . . . . . . . . . . . . . . . . . . . . . . . . . . . . . . . . . . . . . . . . . . . . . . . . . . . . . . . . . . . . . . . . . . . . . . . 13
ITEM 3. LEGAL PROCEEDINGS . . . . . . . . . . . . . . . . . . . . . . . . . . . . . . . . . . . . . . . . . . . . . . . . . . . . . . . . . . . . . . . . . . 14
ITEM 4. RESERVED . . . . . . . . . . . . . . . . . . . . . . . . . . . . . . . . . . . . . . . . . . . . . . . . . . . . . . . . . . . . . . . . . . . . . . . . . . . . 15
ITEM 5. MARKET FOR REGISTRANT’S COMMON EQUITY, RELATED STOCKHOLDER MATTERS, ANDISSUER PURCHASES OF EQUITY SECURITIES . . . . . . . . . . . . . . . . . . . . . . . . . . . . . . . . . . . . . . . . . . . . 15
ITEM 6. SELECTED FINANCIAL DATA . . . . . . . . . . . . . . . . . . . . . . . . . . . . . . . . . . . . . . . . . . . . . . . . . . . . . . . . . . . . . 17
ITEM 7. MANAGEMENT’S DISCUSSION AND ANALYSIS OF FINANCIAL CONDITION AND RESULTS OFOPERATIONS . . . . . . . . . . . . . . . . . . . . . . . . . . . . . . . . . . . . . . . . . . . . . . . . . . . . . . . . . . . . . . . . . . . . . . . . . . 18
ITEM 7A. QUANTITATIVE AND QUALITATIVE DISCLOSURES ABOUT MARKET RISK . . . . . . . . . . . . . . . . . . . . . 41
ITEM 8. FINANCIAL STATEMENTS AND SUPPLEMENTARY DATA . . . . . . . . . . . . . . . . . . . . . . . . . . . . . . . . . . . . 43
ITEM 9. CHANGES IN AND DISAGREEMENTS WITH ACCOUNTANTS ON ACCOUNTING AND FINANCIALDISCLOSURE . . . . . . . . . . . . . . . . . . . . . . . . . . . . . . . . . . . . . . . . . . . . . . . . . . . . . . . . . . . . . . . . . . . . . . . . . . 95
ITEM 9A. CONTROLS AND PROCEDURES . . . . . . . . . . . . . . . . . . . . . . . . . . . . . . . . . . . . . . . . . . . . . . . . . . . . . . . . . . 95
ITEM 9B. OTHER INFORMATION . . . . . . . . . . . . . . . . . . . . . . . . . . . . . . . . . . . . . . . . . . . . . . . . . . . . . . . . . . . . . . . . . . 95
ITEM 10. DIRECTORS, EXECUTIVE OFFICERS AND CORPORATE GOVERNANCE . . . . . . . . . . . . . . . . . . . . . . 95
ITEM 11. EXECUTIVE COMPENSATION . . . . . . . . . . . . . . . . . . . . . . . . . . . . . . . . . . . . . . . . . . . . . . . . . . . . . . . . . . . . 96
ITEM 12. SECURITY OWNERSHIP OF CERTAIN BENEFICIAL OWNERS AND MANAGEMENT AND RELATEDSTOCKHOLDER MATTERS . . . . . . . . . . . . . . . . . . . . . . . . . . . . . . . . . . . . . . . . . . . . . . . . . . . . . . . . . . . . . . . 96
ITEM 13. CERTAIN RELATIONSHIPS AND RELATED TRANSACTIONS, AND DIRECTOR INDEPENDENCE . . 96
ITEM 14. PRINCIPAL ACCOUNTANT FEES AND SERVICES . . . . . . . . . . . . . . . . . . . . . . . . . . . . . . . . . . . . . . . . . . . 96
ITEM 15. EXHIBITS AND FINANCIAL STATEMENT SCHEDULES . . . . . . . . . . . . . . . . . . . . . . . . . . . . . . . . . . . . . . . 96
SIGNATURES . . . . . . . . . . . . . . . . . . . . . . . . . . . . . . . . . . . . . . . . . . . . . . . . . . . . . . . . . . . . . . . . . . . . . . . . . . . . . . . . . . . 98
2
PART I
ITEM 1. BUSINESS
General Description of Business and Fiscal Year 2010 Developments
Air Products and Chemicals, Inc. (the Company or Air Products), a Delaware corporation originally founded in 1940,serves technology, energy, industrial, and healthcare customers globally with a unique portfolio of products, services,and solutions that include atmospheric gases, process and specialty gases, performance materials, equipment, andservices. The Company is the world’s largest supplier of hydrogen and helium and has built leading positions ingrowth markets such as semiconductor materials, refinery hydrogen, natural gas liquefaction, and advanced coatingsand adhesives. As used in this report, unless the context indicates otherwise, the term “Company” includessubsidiaries and predecessors of the registrant and its subsidiaries.
On 11 February 2010, Air Products Distribution, Inc. (Purchaser), a wholly owned subsidiary of Air Products,commenced a cash tender offer for all the outstanding shares of common stock of Airgas, Inc. (Airgas) not alreadyowned by Air Products. Airgas is the largest U.S. distributor of packaged industrial, medical, and specialty gases, andassociated hard goods such as welding equipment. The offer is scheduled to expire at midnight, New York City time,on Friday, 3 December 2010, unless further extended.
The Company manages its operations, assesses performance, and reports earnings under four business segments:Merchant Gases, Tonnage Gases, Electronics and Performance Materials, and Equipment and Energy.
Financial Information about Segments
Financial information concerning the Company’s four business segments appears in Note 25, Business Segment andGeographic Information, to the consolidated financial statements, included under Item 8 herein.
Narrative Description of Business by Segments
Merchant Gases
Merchant Gases sells atmospheric gases such as oxygen, nitrogen, and argon (primarily recovered by the cryogenicdistillation of air); process gases such as hydrogen and helium (purchased or refined from crude helium); and medicaland specialty gases, along with certain services and equipment, throughout the world to customers in many industries,including those in metals, glass, chemical processing, food processing, healthcare, steel, general manufacturing, andpetroleum and natural gas industries.
Merchant Gases includes the following types of products:
Liquid bulk—Product is delivered in bulk (in liquid or gaseous form) by tanker or tube trailer and stored, usuallyin its liquid state, in equipment designed and installed by the Company at the customer’s site for vaporizing into agaseous state as needed. Liquid bulk sales are typically governed by three- to five-year contracts.
Packaged gases—Small quantities of product are delivered in either cylinders or dewars. The Companyoperates packaged gas businesses in Europe, Asia, and Brazil. In the United States, the Company’s currentpackaged gas business sells products only for the electronics and magnetic resonance imaging (principallyhelium) industries.
Small on-site plants—Customers receive product through small on-sites (cryogenic or noncryogenicgenerators), either by a sale of gas contract or the sale of the equipment to the customer.
Healthcare products—Customers receive respiratory therapies, home medical equipment, and infusion services.These products and services are provided to patients in their homes, primarily in Europe. The Company hasleading market positions in Spain, Portugal, and the United Kingdom, and in Mexico through its equity affiliate.
Electric power is the largest cost component in the production of atmospheric gases—oxygen, nitrogen, and argon.Natural gas is also an energy source at a number of the Company’s Merchant Gases facilities. The Companymitigates energy and natural gas price increases through pricing formulas and surcharges. A shortage or interruptionof electricity or natural gas supply, or a price increase that cannot be passed through to customers, possibly forcompetitive reasons, may adversely affect the operations or results of Merchant Gases. During fiscal year 2010, nosignificant difficulties were encountered in obtaining adequate supplies of energy or raw materials.
Merchant Gases competes worldwide against three global industrial gas companies: L’Air Liquide S.A.; Linde AG;Praxair, Inc.; and several regional sellers (including Airgas, primarily with respect to liquid bulk sales). Competition inindustrial gases is based primarily on price, reliability of supply, and the development of industrial gas applications.
3
Competition in the healthcare business involves price, quality, service, and reliability of supply. In Europe, primaryhealthcare competitors include the same three global industrial gas companies mentioned previously, as well assmaller regional service providers. In some countries such as Spain and the United Kingdom, the Company tendersfor significant parts of the healthcare business with government agencies and is expecting to participate in tenders insome countries over the coming fiscal year.
Merchant Gases sales constituted 41% of the Company’s consolidated sales in fiscal year 2010, 44% in fiscal year2009, and 40% in fiscal year 2008. Sales of atmospheric gases (oxygen, nitrogen, and argon) constitutedapproximately 20% of the Company’s consolidated sales in fiscal year 2010, 21% in fiscal year 2009, and 18% infiscal year 2008.
Tonnage Gases
Tonnage Gases provides hydrogen, carbon monoxide, nitrogen, oxygen, and syngas principally to the energyproduction and refining, chemical, and metallurgical industries worldwide. Gases are produced at large facilitieslocated adjacent to customers’ facilities or by pipeline systems from centrally located production facilities and aregenerally governed by contracts with 15- to 20-year terms. The Company is the world’s largest provider of hydrogen,which is used by oil refiners to facilitate the conversion of heavy crude feedstock and lower the sulfur content ofgasoline and diesel fuels to reduce smog and ozone depletion. The energy production industry uses nitrogen injectionfor enhanced recovery of oil and natural gas and oxygen for gasification. The metallurgical industry uses nitrogen forinerting and oxygen for the manufacture of steel and certain nonferrous metals. The chemical industry uses hydrogen,oxygen, nitrogen, carbon monoxide, and synthesis gas (a hydrogen-carbon monoxide mixture) as feedstocks in theproduction of many basic chemicals. The Company delivers product through pipelines from centrally located facilitiesin or near the Texas Gulf Coast; Louisiana; Los Angeles, California; Alberta, Canada; Rotterdam, the Netherlands;Southern England, U.K.; Northern England, U.K.; Western Belgium; Ulsan, Korea; Nanjing, China; Tangshan, China;Kuan Yin, Taiwan; Singapore; and Camaçari, Brazil. The Company also owns less than controlling interests inpipelines located in Thailand and South Africa.
Tonnage Gases also includes a Polyurethane Intermediates (PUI) business. At its Pasadena, Texas facility, theCompany produces dinitrotoluene (DNT), which is converted to toluene diamine (TDA) and sold for use as anintermediate in the manufacture of a major precursor of flexible polyurethane foam used in furniture cushioning, carpetunderlay, bedding, and seating in automobiles. Most of the Company’s TDA is sold under long-term contracts with rawmaterial cost and currency pass-through to a small number of customers. The Company employs proprietarytechnology and scale of production to differentiate its polyurethane intermediates from those of its competitors.
Natural gas is the principal raw material for hydrogen, carbon monoxide, and synthesis gas production. Electric poweris the largest cost component in the production of atmospheric gases. The Company mitigates energy and natural gasprice increases through long-term cost pass-through contracts. Toluene, ammonia, and hydrogen are the principal rawmaterials for the PUI business and are purchased from various suppliers under multiyear contracts. During fiscal year2010, no significant difficulties were encountered in obtaining adequate supplies of energy or raw materials.
Tonnage Gases competes in the United States and Canada against three global industrial gas companies: L’AirLiquide S.A.; Linde AG; Praxair, Inc.; and several regional competitors. Competition is based primarily on price,reliability of supply, the development of applications that use industrial gases, and, in some cases, provision of otherservices or products such as power and steam generation. The Company also derives a competitive advantage fromits pipeline networks, which enable it to provide a reliable and economic supply of products to customers. Similarcompetitive situations exist in the European and Asian industrial gas markets where the Company competes againstthe three global companies as well as regional competitors. Global competitors for the PUI business are primarilyBASF Corporation and Bayer AG.
Tonnage Gases sales constituted approximately 32% of the Company’s consolidated sales in fiscal year 2010, 31% infiscal year 2009, and 34% in fiscal year 2008. Tonnage Gases hydrogen sales constituted approximately 15% of theCompany’s consolidated sales in both fiscal year 2010 and 2009, and 17% in fiscal year 2008.
Electronics and Performance Materials
Electronics and Performance Materials employs applications technology to provide solutions to a broad range ofglobal industries through chemical synthesis, analytical technology, process engineering, and surface science. Thissegment provides the electronics industry with specialty gases (such as nitrogen trifluoride, silane, arsine, phosphine,white ammonia, silicon tetrafluoride, carbon tetrafluoride, hexafluoromethane, critical etch gases, and tungstenhexafluoride) as well as tonnage gases (primarily nitrogen), specialty chemicals, services, and equipment for the
4
manufacture of silicon and compound semiconductors, thin film transistor liquid crystal displays, and photovoltaicdevices. These products are delivered through various supply chain methods, including bulk delivery systems ordistribution by pipelines such as those located in California’s Silicon Valley; Phoenix, Arizona; Tainan, Taiwan; Gumiand Giheung, Korea; and Tianjin and Shanghai, China.
Electronics and Performance Materials also provides performance materials for a wide range of products, includingcoatings, inks, adhesives, civil engineering, personal care, institutional and industrial cleaning, mining, oil refining, andpolyurethanes, and focuses on the development of new materials aimed at providing unique functionality to emergingmarkets. Principal performance materials include polyurethane catalysts and other additives for polyurethane foam,epoxy amine curing agents, and auxiliary products for epoxy systems, specialty surfactants for formulated systems,and functional additives for industrial cleaning and mining industries.
The Electronics and Performance Materials segment uses a wide variety of raw materials, including silane, amines,alcohols, epoxides, organic acids, and ketones. During fiscal year 2010, no significant difficulties were encountered inobtaining adequate supplies of energy or raw materials.
The Electronics and Performance Materials segment faces competition on a product-by-product basis againstcompetitors ranging from niche suppliers with a single product to larger and more vertically integrated companies.Competition is principally conducted on the basis of price, quality, product performance, reliability of product supply,technical innovation, service, and global infrastructure.
Total sales from Electronics and Performance Materials constituted approximately 21% of the Company’sconsolidated sales in fiscal year 2010, 19% in fiscal year 2009, and 21% in fiscal year 2008.
Equipment and Energy
Equipment and Energy designs and manufactures cryogenic equipment for air separation, hydrocarbon recovery andpurification, natural gas liquefaction (LNG), and helium distribution (cryogenic transportation containers), and servesenergy markets in a variety of ways.
Equipment is sold globally to customers in the chemical and petrochemical manufacturing, oil and gas recovery andprocessing, and steel and primary metals processing industries. The segment also provides a broad range of plantdesign, engineering, procurement, and construction management services to its customers.
Energy markets are served through the Company’s operation and partial ownership of cogeneration and flue gasdesulfurization facilities, its development of hydrogen as an energy carrier, and oxygen-based technologies to serveenergy markets in the future. The Company owns and operates a cogeneration facility in Calvert City, Kentucky and a49-megawatt fluidized-bed coal and biomass-fired power generation facility in Stockton, California; and operates andowns a 47.9% interest in a 112-megawatt gas-fueled power generation facility in Thailand. The Company alsooperates and owns a 50% interest in a flue gas desulfurization facility in Indiana.
Steel, aluminum, and capital equipment subcomponents (compressors, etc.) are the principal raw materials in theequipment portion of this segment. Adequate raw materials for individual projects are acquired under firm purchaseagreements. Coal, petroleum coke, and natural gas are the largest cost components in the production of energy. TheCompany mitigates these cost components, in part, through long-term cost pass-through contracts. During fiscal year2010, no significant difficulties were encountered in obtaining adequate supplies of raw materials.
Equipment and Energy competes with a great number of firms for all of its offerings except LNG heat exchangers, forwhich there are fewer competitors due to the limited market size and proprietary technologies. Competition is basedprimarily on technological performance, service, technical know-how, price, and performance guarantees.
The backlog of equipment orders (including letters of intent believed to be firm) from third-party customers (includingequity affiliates) was approximately $274 million on 30 September 2010, approximately 30% of which is for cryogenicequipment and 50% of which is for LNG heat exchangers, as compared with a total backlog of approximately$239 million on 30 September 2009. The Company expects that approximately $250 million of the backlog on30 September 2010 will be completed during fiscal year 2011.
5
Narrative Description of the Company’s Business Generally
The Company, through subsidiaries, affiliates, and minority-owned ventures, conducts business in over 40 countriesoutside the United States. Its international businesses are subject to risks customarily encountered in foreignoperations, including fluctuations in foreign currency exchange rates and controls; import and export controls; andother economic, political, and regulatory policies of local governments.
The Company has majority or wholly owned foreign subsidiaries that operate in Canada, 17 European countries(including the United Kingdom and Spain), nine Asian countries (including China, Korea, Singapore, and Taiwan), andfour Latin American countries (including Mexico and Brazil). The Company also owns less-than-controlling interests inentities operating in Europe, Asia, Africa, the Middle East, and Latin America (including Italy, Germany, China, India,Singapore, Thailand, South Africa, and Mexico).
Financial information about the Company’s foreign operations and investments is included in Notes 8, SummarizedFinancial Information of Equity Affiliates; 22, Income Taxes; and 25, Business Segment and Geographic Information,to the consolidated financial statements included under Item 8 herein. Information about foreign currency translation isincluded under “Foreign Currency” in Note 1, Major Accounting Policies, and information on the Company’s exposureto currency fluctuations is included in Note 13, Financial Instruments, to the consolidated financial statements,included under Item 8 below, and in “Foreign Currency Exchange Rate Risk,” included under Item 7A below. Exportsales from operations in the United States to unconsolidated customers amounted to $570.5 million, $510.2 million,and $629.1 million in fiscal years 2010, 2009, and 2008, respectively. Total export sales in fiscal year 2010 included$387.8 million in export sales to affiliated customers. The sales to affiliated customers were primarily equipment saleswithin the Equipment and Energy segment and the Electronics and Performance Materials segment.
Technology Development
The Company pursues a market-oriented approach to technology development through research and development,engineering, and commercial development processes. It conducts research and development principally in itslaboratories located in the United States (Trexlertown, Pennsylvania; Carlsbad, California; Milton, Wisconsin; andPhoenix, Arizona); the United Kingdom (Basingstoke, London, and Carrington); Germany (Hamburg); the Netherlands(Utrecht); Spain (Barcelona); and Asia (Tokyo, Japan; Shanghai, China; Giheung, Korea; and Chubei, Taiwan). TheCompany also funds and cooperates in research and development programs conducted by a number of majoruniversities and undertakes research work funded by others—principally the United States government.
The Company’s corporate research groups, which include science and process technology centers, support theresearch efforts of various businesses throughout the Company. Technology development efforts for use withinMerchant Gases, Tonnage Gases, and Equipment and Energy focus primarily on new and improved processes andequipment for the production and delivery of industrial gases and new or improved applications for all such products.Research and technology development for Electronics and Performance Materials supports development of newproducts and applications to strengthen and extend the Company’s present positions. Work is also performed inElectronics and Performance Materials to lower processing costs and develop new processes for the new products.
Research and development expenditures were $114.7 million during fiscal year 2010, $116.3 million in fiscal year2009, and $130.7 million in fiscal year 2008. The Company expended $23.9 million on customer-sponsored researchactivities during fiscal year 2010, $29.7 million in fiscal year 2009, and $24.8 million in fiscal year 2008.
As of 1 November 2010, the Company owns 932 United States patents, 2,808 foreign patents, and is a licensee undercertain patents owned by others. While the patents and licenses are considered important, the Company does notconsider its business as a whole to be materially dependent upon any particular patent, patent license, or group ofpatents or licenses.
Environmental Controls
The Company is subject to various environmental laws and regulations in the countries in which it has operations.Compliance with these laws and regulations results in higher capital expenditures and costs. From time to time, theCompany is involved in proceedings under the Comprehensive Environmental Response, Compensation, and LiabilityAct (the federal Superfund law), similar state laws, and the Resource Conservation and Recovery Act (RCRA) relatingto the designation of certain sites for investigation and possible cleanup. Additional information with respect to theseproceedings is included under Item 3, Legal Proceedings, below. The Company’s accounting policy for environmentalexpenditures is discussed in Note 1, Major Accounting Policies, and environmental loss contingencies are discussedin Note 17, Commitments and Contingencies, to the consolidated financial statements, included under Item 8, below.
6
The amounts charged to income from continuing operations related to environmental matters totaled $31.6 million infiscal 2010, $52.5 million in 2009, and $49.9 million in 2008. These amounts represent an estimate of expenses forcompliance with environmental laws, remedial activities, and activities undertaken to meet internal Companystandards. Future costs are not expected to be materially different from these amounts. The 2009 amount included acharge of $16.0 for the Paulsboro site. Refer to Note 17, Commitments and Contingencies, to the consolidatedfinancial statements for additional information on this charge. The 2008 amount included revised cost estimates forseveral existing sites.
Although precise amounts are difficult to determine, the Company estimates that in both fiscal year 2010 and 2009, itspent approximately $6 million on capital projects to control pollution. Capital expenditures to control pollution in futureyears are estimated at approximately $6 million in both fiscal year 2011 and 2012. The cost of any environmentalcompliance generally is contractually passed through to the customer.
The Company accrues environmental investigatory and remediation costs for identified sites when it is probable that aliability has been incurred and the amount of loss can be reasonably estimated. The potential exposure for such costsis estimated to range from $87 million to a reasonably possible upper exposure of $101 million. The accrual on theconsolidated balance sheet for 30 September 2010 was $87.0 million and for 30 September 2009 was $95.0 million.Actual costs to be incurred in future periods may vary from the estimates, given inherent uncertainties in evaluatingenvironmental exposures. Subject to the imprecision in estimating future environmental costs, the Company does notexpect that any sum it may have to pay in connection with environmental matters in excess of the amounts recordedor disclosed above would have a materially adverse effect on its financial condition or results of operations in any oneyear.
Employees
On 30 September 2010, the Company (including majority-owned subsidiaries) had approximately 18,300 employees,of whom approximately 17,900 were full-time employees and of whom approximately 11,000 were located outside theUnited States. The Company has collective bargaining agreements with unions at various locations that expire onvarious dates over the next four years. The Company considers relations with its employees to be satisfactory anddoes not believe that the impact of any expiring or expired collective bargaining agreements will result in a materialadverse impact on the Company.
Available Information
All periodic and current reports, registration statements, and other filings that the Company is required to file with theSecurities and Exchange Commission (SEC), including the Company’s annual report on Form 10-K, quarterly reportson Form 10-Q, current reports on Form 8-K, and amendments to those reports filed or furnished pursuant toSection 13(a) of the Securities Exchange Act of 1934 (the 1934 Act Reports), are available free of charge through theCompany’s Internet website at www.airproducts.com. Such documents are available as soon as reasonablypracticable after electronic filing of the material with the SEC. All 1934 Act Reports filed during the period covered bythis report were available on the Company’s website on the same day as filing.
The public may also read and copy any materials filed by the Company with the SEC at the SEC’s Public ReferenceRoom at 100 F Street, N.E., Washington, DC 20549. The public may obtain information on the operation of the PublicReference Room by calling the SEC at 1-800-SEC-0330. The SEC maintains an Internet site that contains reports,proxy, and information statements, and other information regarding issuers that file electronically with the SEC. Theaddress of that site is www.sec.gov.
Seasonality
Although none of the four business segments are subject to seasonal fluctuations to any material extent, theElectronics and Performance Materials segment is susceptible to the cyclical nature of the electronics industry and toseasonal fluctuations in underlying end-use performance materials markets.
Working Capital
The Company maintains inventory where required to facilitate the supply of products to customers on a reasonabledelivery schedule. Merchant Gases inventory consists primarily of industrial, medical, specialty gas, and crude heliuminventories supplied to customers through liquid bulk and packaged gases supply modes. Merchant Gases inventoryalso includes home medical equipment to serve healthcare patients. Electronics inventories consist primarily of bulkand packaged specialty gases and chemicals and also include inventories to support sales of equipment and services.Performance Materials inventories consist primarily of bulk and packaged performance chemical solutions. TheTonnage Gases inventory is primarily Polyurethane Intermediates raw materials and finished goods; the remainingon-site plants and pipeline complexes have limited inventory. Equipment and Energy has limited inventory.
7
Customers
The Company does not have a homogeneous customer base or end market, and no single customer accounts formore than 10% of the Company’s consolidated revenues. The Company and the Tonnage Gases and Electronics andPerformance Materials segments do have concentrations of customers in specific industries, primarily refining,chemicals, and electronics. Within each of these industries, the Company has several large-volume customers withlong-term contracts. A negative trend affecting one of these industries, or the loss of one of these major customers,although not material to the Company’s consolidated revenues, could have an adverse impact on the affectedsegment.
Governmental Contracts
No segment’s business is subject to a government entity’s renegotiation of profits or termination of contracts thatwould be material to the Company’s business as a whole.
Executive Officers of the Company
The Company’s executive officers and their respective positions and ages on 15 November 2010 follow. Informationwith respect to offices held is stated in fiscal years.
Name Age Office
M. Scott Crocco 46 Vice President and Corporate Controller (became Vice Presidentin 2008; Corporate Controller in 2007; and Director of CorporateDecision Support in 2003)
Robert D. Dixon(A)
51 Senior Vice President and General Manager – Merchant Gases(became Senior Vice President in 2008; Vice President andGeneral Manager – Merchant Gases in 2007; President – AirProducts Asia in 2003; and Vice President – Air Products Asia in2003)
Paul E. Huck(A)
60 Senior Vice President and Chief Financial Officer (became SeniorVice President in 2008; Vice President and Chief Financial Officerin 2004)
Stephen J. Jones(A)
49 Senior Vice President and General Manager, Tonnage Gases,Equipment and Energy (became Senior Vice President andGeneral Manager, Tonnage Gases, Equipment and Energy in2009; Senior Vice President, General Counsel and Secretary in2008; Vice President and Associate General Counsel in 2007; andVice President and General Manager – Industrial ChemicalsDivision in 2003)
John W. Marsland(A)
44 Senior Vice President, Supply Chain (became Senior VicePresident, Supply Chain in 2010; Vice President and GeneralManager, Global Liquid Bulk, Generated Gases and Helium in2009; Vice President – Business Services in 2009; Vice Presidentand General Manager – Healthcare in 2007; Vice President andGeneral Manager, Global Healthcare in 2005)
John E. McGlade(A)(B)(C)
56 Chairman, President, and Chief Executive Officer (becameChairman and Chief Executive Officer in 2008; President and ChiefOperating Officer in 2006; Group Vice President – Chemicals in2003)
Lynn C. Minella(A)
52 Senior Vice President – Human Resources and Communications(became Senior Vice President – Human Resources andCommunications in 2008; Vice President – Human Resources in2004)
8

Name Age Office
John D. Stanley(A)
52 Senior Vice President and General Counsel (became Senior VicePresident and General Counsel in 2009; Assistant GeneralCounsel, Americas and Europe in 2007; Assistant GeneralCounsel, Corporate and Commercial in 2004)
(A) Member, Corporate Executive Committee(B) Member, Board of Directors(C) Member, Executive Committee of the Board of Directors
ITEM 1A. RISK FACTORS
You should read the following risk factors carefully in conjunction with evaluating our business and the forward-lookinginformation contained in this Annual Report on Form 10-K. Any of the following risks could have a materially adverseeffect on our business, operating results, financial condition, and the actual outcome of matters as to which forward-looking statements are made in this Annual Report on Form 10-K. While we believe we have identified and discussedbelow the key risk factors affecting our business, there may be additional risks and uncertainties that are not presentlyknown or that are not currently believed to be significant that may adversely affect our business, performance, orfinancial condition in the future.
Overall Economic Conditions—Sluggish general economic conditions in certain markets in which the
Company does business may decrease the demand for its goods and services and adversely impact its
revenues, operating results, and cash flow.
Demand for the Company’s products and services depends in part on the general economic conditions affecting thecountries and industries in which the Company does business. Recently, sluggish economic conditions in the U.S. andEurope and in certain industries served by the Company have impacted and may in the future impact demand for theCompany’s products and services, in turn negatively impacting the Company’s revenues and earnings. While marketshave stabilized relative to the extreme economic contraction in 2008—2009, industry utilization rates and thereforepricing pressure continue to be risks. Excess capacity in the Company’s or its competitors’ manufacturing facilitiescould decrease the Company’s ability to maintain pricing and generate profits. Unanticipated contract terminations orproject delays by current customers can also negatively impact financial results.
Asset Impairments—The Company may be required to record impairment on its long-lived assets.
Weak demand may cause underutilization of the Company’s manufacturing capacity or elimination of product lines;contract terminations or customer shutdowns may force sale or abandonment of facilities and equipment; contractualprovisions may allow customer buyout of facilities or equipment; or other events associated with weak economicconditions or specific end market, product, or customer events may require the Company to record an impairment ontangible assets, such as facilities and equipment, as well as intangible assets, such as intellectual property orgoodwill, which would have a negative impact on its financial results.
Competition—Inability to compete effectively in a segment could adversely impact sales and financial
performance.
The Company faces strong competition from several large global competitors and many smaller regional ones in all ofits business segments. Introduction by competitors of new technologies, competing products, or additional capacitycould weaken demand for or impact pricing of the Company’s products, negatively impacting financial results. Inaddition, competitors’ pricing policies could materially affect the Company’s profitability or its market share.
Raw Material and Energy Cost and Availability—Interruption in ordinary sources of supply or an inability to
recover increases in energy and raw material costs from customers could result in lost sales or reduced
profitability.
Energy, including electricity, natural gas, and diesel fuel for delivery trucks, is the largest cost component of theCompany’s business. Because the Company’s industrial gas facilities use substantial amounts of electricity, energyprice fluctuations could materially impact the Company’s revenues and earnings. Hydrocarbons, including natural gas,are the primary feedstock for the production of hydrogen, carbon monoxide, and synthesis gas. The Electronics andPerformance Materials segment uses a wide variety of raw materials, including alcohols, ethyleneamines,
9
cyclohexylamine, acrylonitriles, and glycols. Shortages or price escalation in these materials could negatively impactfinancial results. A disruption in the supply of energy and raw materials, whether due to market conditions, legislativeor regulatory actions, natural events, or other disruption, could prevent the Company from meeting its contractualcommitments, harming its business and financial results.
The Company typically contracts to pass through cost increases in energy and raw materials to its customers, but costvariability can still have a negative impact on its results. The Company may not be able to raise prices as quickly ascosts rise, or competitive pressures may prevent full recovery. Increases in energy or raw material costs that cannotbe passed on to customers for competitive or other reasons would negatively impact the Company’s revenues andearnings. Even where costs are passed through, price increases can cause lower sales volume.
Regulatory Compliance—The Company is subject to extensive government regulation in jurisdictions around
the globe in which it does business. Changes in regulations addressing, among other things, environmental
compliance, import/export restrictions, and taxes, can negatively impact the Company’s operations and
financial results.
The Company is subject to government regulation in the United States and foreign jurisdictions in which it conducts itsbusiness. The application of laws and regulations to the Company’s business is sometimes unclear. Compliance withlaws and regulations may involve significant costs or require changes in business practice that could result in reducedprofitability. Determination of noncompliance can result in penalties or sanctions that could also impact financialresults. Compliance with changes in laws or regulations can require additional capital expenditures or increaseoperating costs. Export controls or other regulatory restrictions could prevent the Company from shipping its productsto and from some markets or increase the cost of doing so. This area continues to attract external focus by multiplecustoms and export enforcement authorities. Changes in tax laws and regulations and international tax treaties couldaffect the financial results of the Company’s businesses.
Greenhouse Gases—Legislative and regulatory responses to global climate change create financial risk.
Some of the Company’s operations are within jurisdictions that have, or are developing, regulatory regimes governingemissions of greenhouse gases (GHG). These include existing and expanding coverage under the European UnionEmissions Trading Scheme; mandatory reporting and reductions at manufacturing facilities in Alberta, Canada; andmandatory reporting and anticipated constraints on GHG emissions in California and Ontario. In addition, the U.S.Environmental Protection Agency has taken preliminary actions towards regulating greenhouse gas emissions.Increased public awareness and concern may result in more international, U.S. federal, and/or regional requirementsto reduce or mitigate the effects of GHG. Although uncertain, these developments could increase the Company’scosts related to consumption of electric power, hydrogen production, and fluorinated gases production. The Companybelieves it will be able to mitigate some of the potential increased cost through its contractual terms, but the lack ofdefinitive legislation or regulatory requirements prevents accurate estimate of the long-term impact on the Company.Any legislation that limits or taxes GHG emissions could impact the Company’s growth, increase its operating costs, orreduce demand for certain of its products.
Environmental Compliance—Costs and expenses resulting from compliance with environmental regulations
may negatively impact the Company’s operations and financial results.
The Company is subject to extensive federal, state, local, and foreign environmental and safety laws and regulationsconcerning, among other things, emissions in the air, discharges to land and water, and the generation, handling,treatment, and disposal of hazardous waste and other materials. The Company takes its environmentalresponsibilities very seriously, but there is a risk of environmental impact inherent in its manufacturing operations andtransportation of chemicals. Future developments and more stringent environmental regulations may require theCompany to make additional unforeseen environmental expenditures. In addition, laws and regulations may requiresignificant expenditures for environmental protection equipment, compliance, and remediation. These additional costsmay adversely affect financial results. For a more detailed description of these matters, see “Narrative Description ofthe Company’s Business Generally—Environmental Controls,” above.
Foreign Operations, Political, and Legal Risks—The Company’s foreign operations can be adversely impacted
by nationalization or expropriation of property, undeveloped property rights, and legal systems or political
instability.
The Company’s operations in certain foreign jurisdictions are subject to nationalization and expropriation risk, andsome of its contractual relationships within these jurisdictions are subject to cancellation without full compensation forloss. Economic and political conditions within foreign jurisdictions, social unrest, or strained relations between
10
countries can cause fluctuations in demand, price volatility, supply disruptions, or loss of property. The occurrence ofany of these risks could have a material, adverse impact on the Company’s operations and financial results.
Interest Rate Increases—The Company’s earnings, cash flow, and financial position can be impacted by
interest rate increases.
At 30 September 2010, the Company had total consolidated debt of $4,128.3 million, of which $468.5 million willmature in the next twelve months. The Company expects to continue to incur indebtedness to fund new projects andreplace maturing debt. Although the Company actively manages its interest rate risk through the use of derivativesand diversified debt obligations, not all borrowings at variable rates are hedged, and new debt will be priced at marketrates. If interest rates increase, the Company’s interest expense could increase significantly, affecting earnings andreducing cash flow available for working capital, capital expenditures, acquisitions, and other purposes. In addition,changes by any rating agency to the Company’s outlook or credit ratings could increase the Company’s cost ofborrowing.
Currency Fluctuations—Changes in foreign currencies may adversely affect the Company’s financial results.
A substantial amount of the Company’s sales are derived from outside the United States and denominated in foreigncurrencies. The Company also has significant production facilities which are located outside of the United States.Financial results therefore will be affected by changes in foreign currency rates. The Company uses certain financialinstruments to mitigate these effects, but it is not cost-effective to hedge foreign currency exposure in a manner thatwould entirely eliminate the effects of changes in foreign exchange rates on earnings, cash flows, and fair values ofassets and liabilities. Accordingly, reported sales, net earnings, cash flows, and fair values have been and in the futurewill be affected by changes in foreign exchange rates. For a more detailed discussion of currency exposure, seeItem 7A, below.
Pension Liabilities—The Company’s results of operations and financial condition could be negatively
impacted by its U.S. and non-U.S. pension plans.
Adverse equity market conditions and volatility in the credit markets have had and may continue to have anunfavorable impact on the value of the Company’s pension trust assets and its future estimated pension liabilities,significantly affecting the net periodic benefit costs of its pension plans and ongoing funding requirements for theseplans. As a result, the Company’s financial results and cash flow in any period could be negatively impacted. Forinformation about potential impacts from pension funding and the use of certain assumptions regarding pensionmatters, see the discussion in Note 16, Retirement Benefits, to the consolidated financial statements, included inItem 8, below.
Catastrophic Events—Catastrophic events could disrupt the Company’s operations or the operations of its
suppliers or customers, having a negative impact on the Company’s business, financial results, and cash flow.
The Company’s operations could be impacted by catastrophic events outside the Company’s control, including severeweather conditions such as hurricanes, floods, earthquakes, and storms, or acts of war and terrorism. Any such eventcould cause a serious business disruption that could affect the Company’s ability to produce and distribute its productsand possibly expose it to third-party liability claims. Additionally, such events could impact the Company’s suppliers, inwhich event energy and raw materials may be unavailable to the Company, or its customers may be unable topurchase or accept the Company’s products and services. Any such occurrence could have a negative impact on theCompany’s operations and financial results.
Operational Risks—Operational and execution risks may adversely affect the Company’s operations or
financial results.
The Company’s operation of its facilities, pipelines, and delivery systems inherently entails hazards that requirecontinuous oversight and control, such as pipeline leaks and ruptures, fire, explosions, toxic releases, mechanicalfailures, or vehicle accidents. If operational risks materialize, they could result in loss of life, damage to theenvironment, or loss of production, all of which could negatively impact the Company’s ongoing operations, financialresults, and cash flow. In addition, the Company’s operating results are dependent on the continued operation of itsproduction facilities and its ability to meet customer requirements. The Company’s operating facilities for theproduction of certain product lines, primarily in certain electronic materials products, are highly concentrated.Insufficient capacity may expose the Company to liabilities related to contract commitments. Operating results are alsodependent on the Company’s ability to complete new construction projects on time, on budget, and in accordance withperformance requirements. Failure to do so may expose the Company to loss of revenue, potential litigation, and lossof business reputation.
11

Information Security—The security of the Company’s Information Technology systems could be
compromised, which could adversely affect its ability to operate.
The Company utilizes a global enterprise resource planning (ERP) system and other technologies for the distributionof information both within the Company and to customers and suppliers. The ERP system and other technologies arepotentially vulnerable to interruption from viruses, hackers, or system breakdown. To mitigate these risks, theCompany has implemented a variety of security measures, including virus protection, redundancy procedures, andrecovery processes. A significant system interruption, however, could materially affect the Company’s operations,business reputation, and financial results.
Litigation and Regulatory Proceedings—The Company’s financial results may be affected by various legal
and regulatory proceedings, including those involving antitrust, environmental, or other matters.
The Company is subject to litigation and regulatory proceedings in the normal course of business and could becomesubject to additional claims in the future, some of which could be material. The outcome of existing legal proceedingsmay differ from the Company’s expectations because the outcomes of litigation, including regulatory matters, are oftendifficult to predict reliably. Various factors or developments can lead the Company to change current estimates ofliabilities and related insurance receivables, where applicable, or make such estimates for matters previously notsusceptible to reasonable estimates, such as a significant judicial ruling or judgment, a significant settlement,significant regulatory developments, or changes in applicable law. A future adverse ruling, settlement, or unfavorabledevelopment could result in charges that could have a materially adverse effect on the Company’s results ofoperations in any particular period. For a more detailed discussion of the legal proceedings involving the Company,see Item 3, below.
Recruiting and Retaining Employees—Inability to attract, retain, or develop skilled employees could adversely
impact the Company’s business.
Sustaining and growing the Company’s business depends on the recruitment, development, and retention of qualifiedemployees. Demographic trends and changes in the geographic concentration of global businesses have createdmore competition for talent. The inability to attract, develop, or retain quality employees could negatively impact theCompany’s ability to take on new projects and sustain its operations, which might adversely affect the Company’soperations or its ability to grow.
Portfolio Management—The success of portfolio management activities is not predictable.
The Company continuously reviews and manages its portfolio of assets in order to maximize value for itsshareholders. Portfolio management involves many variables, including future acquisitions and divestitures,restructurings and resegmentations, and cost-cutting and productivity initiatives. The timing, impact, and ability tocomplete such undertakings; the costs and financial charges associated with such activities; and the ultimate financialimpact of such undertakings are uncertain and can have a negative short- or long-term impact on the Company’soperations and financial results.
RISK FACTORS RELATED TO THE TENDER OFFER FOR AIRGAS
If the Company is successful in acquiring Airgas, it will incur substantial transaction and merger-related costs.
If the Company is successful in its tender offer for Airgas (see Note 3, Airgas Transaction, to the consolidated financialstatements for more information on this transaction), or otherwise succeeds in acquiring Airgas, it will incur substantialnonrecurring transaction and merger-related costs associated with the acquisition of Airgas, combining the operationsof the two companies, and achieving desired synergies. Although the Company expects that the elimination ofduplicative costs and the realization of other efficiencies related to the integration of the two businesses will offset theincremental transaction and merger-related costs, this net benefit may not be achieved when expected, or at all.
The Company will carry significantly more long-term debt obligations if the acquisition is completed.
At the current tender offer of $65.50 per share, the total value of the Airgas transaction would be approximately$7.4 billion, including $5.7 billion of equity and $1.7 billion of assumed debt. In connection with the tender offer, theCompany has secured a $6.7 billion term loan credit facility (the “bridge loan”), and the Company expects to retainapproximately $1 billion of existing Airgas debt. If the tender offer is successful, the Company intends to finance theacquisition primarily by issuing public debt securities. If the Company is unable to successfully market this debtissuance, the bridge loan will be drawn. The bridge loan carries a higher cost than is anticipated for the public debt.
12
The issuance and assumption of this new debt will require a greater proportion of the Company’s cash flow fromoperations to service this debt than the Company has historically had to allocate to debt.
Changes in our credit ratings may have a negative impact on our financing costs in future periods.
The Company anticipates that the debt issuance to finance the acquisition of Airgas will result in a temporarydowngrade of its credit ratings. The Company’s credit rating is a significant factor in determining pricing andavailability of its debt. Changes in our credit ratings could increase our borrowing costs. In addition, our current short-term credit rating allows us to participate in a commercial paper market that has a large number of potential investorsand a high degree of liquidity. A downgrade in our credit ratings, particularly our short-term credit rating, could likelyreduce the amount of commercial paper we could issue, increase our commercial paper borrowing costs, or both. TheCompany expects that its credit rating would be restored to current levels within a few years following the potentialacquisition; however, inability to achieve the anticipated benefits of the transaction or obtain projected prices forassets required to be divested, or other unexpected developments may delay this restoration.
If the acquisition is completed, we will be subject to integration and other risks.
If the Company is successful in acquiring Airgas, the success of the merger will depend, in part, on its ability to realizethe anticipated benefits from combining the businesses. To realize these anticipated benefits, the Company mustsuccessfully integrate the operations and personnel of Airgas into our business. It is possible that the integrationprocess could take longer than anticipated and could result in the loss of valuable employees or the disruption of eachcompany’s ongoing businesses. Failure to achieve the anticipated benefits could result in increased costs or decreasesin the amount of expected revenues and could adversely affect our future business, financial condition, and operatingresults. Additionally, if the acquisition is successful, the Company will be required to divest certain assets to comply withthe Consent Decree approved by the U.S. Federal Trade Commission on 8 October 2010. Failure to find suitablebuyers or obtain a reasonable price for the assets could adversely affect the financial condition of the Company.
ITEM 1B. UNRESOLVED STAFF COMMENTS
The Company has not received any written comments from the Commission staff that remain unresolved.
ITEM 2. PROPERTIES
The Company owns its principal executive offices, which are located at its headquarters in Trexlertown, Pennsylvania,and also owns additional administrative offices in Hersham, England and in Hattingen, Germany. Its regional Asianadministrative offices, which are leased, are located in Hong Kong; Shanghai, China; Taipei, Taiwan; Petaling Jaya,Malaysia; and Singapore. Additional administrative offices are leased in Ontario, Canada; Kawasaki, Japan; Seoul,Korea; Brussels, Belgium; Paris, France; Barcelona, Spain; Rotterdam, the Netherlands; São Paulo, Brazil; andKempton Park, South Africa. Management believes the Company’s manufacturing facilities, described in more detailbelow, are adequate to support its businesses.
Following is a description of the properties used by the Company’s four business segments:
Merchant Gases
Merchant Gases currently operates over 150 facilities in North and South America (approximately 40 of which sitesare owned); over 130 sites in Europe, including healthcare (approximately half of which sites are owned); and over 75facilities in seven countries within Asia. Helium is recovered at sites in Kansas and Texas and distributed from severaltransfill sites in the U.S., Canada, Europe, and Asia. Sales support offices are located at its Trexlertown headquartersand in leased properties in three states, at all administrative sites in Europe, and at 15 sites in Asia. Research anddevelopment (R&D) activities for this segment are conducted in Trexlertown, Pennsylvania.
Tonnage Gases
Tonnage Gases operates over 50 plants in the United States and Canada that produce over 300 standard tons perday of product. Thirty-five of these facilities produce or recover hydrogen, many of which support the four majorpipeline systems located along the Gulf Coast of Texas; on the Mississippi River corridor in Louisiana; in Los Angeles,California; and Alberta, Canada. The Tonnage Gases segment includes a facility in Pasadena, Texas that producesPolyurethane Intermediate products. The segment also operates over 20 tonnage plants in Europe and over 20tonnage plants within Asia, the majority of which are on leasehold type long-term structured agreements. Salessupport offices are located at the Company’s headquarters in Trexlertown, Pennsylvania and leased offices in Texas,Louisiana, California, and Calgary, Alberta in North America, as well as in Hersham, England; Rotterdam, theNetherlands; Shanghai, China; Singapore; and Doha, Qatar in the Middle East.
13
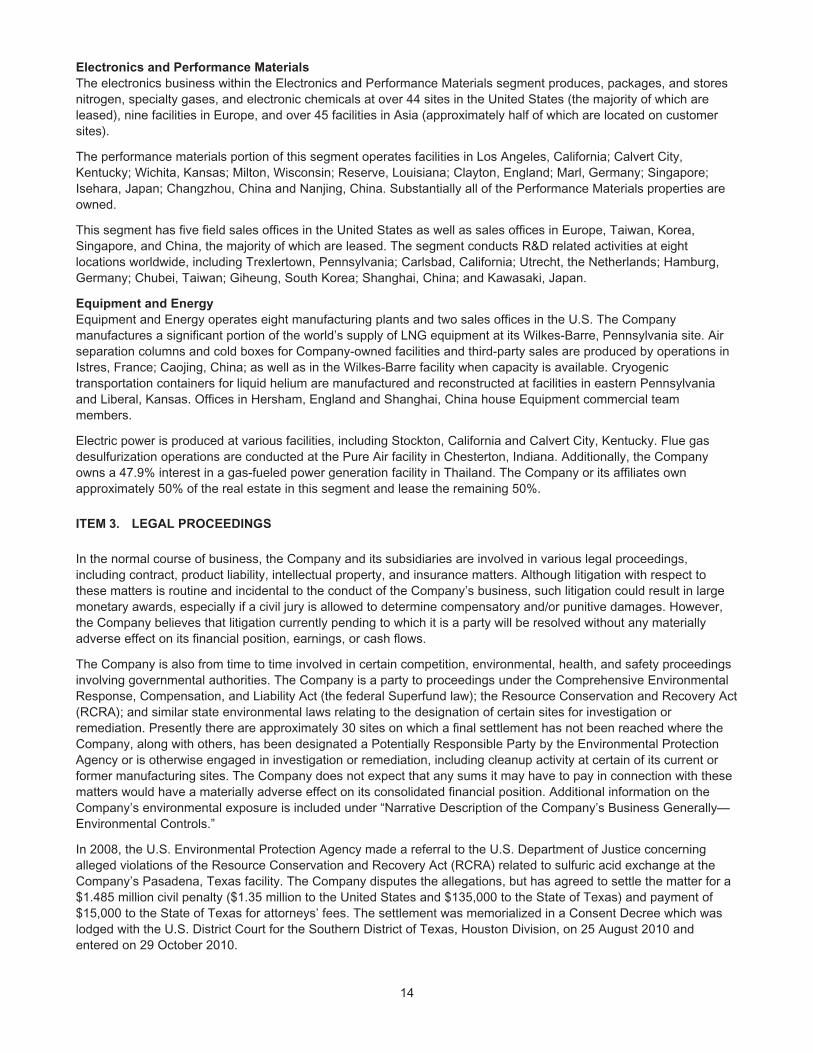
Electronics and Performance Materials
The electronics business within the Electronics and Performance Materials segment produces, packages, and storesnitrogen, specialty gases, and electronic chemicals at over 44 sites in the United States (the majority of which areleased), nine facilities in Europe, and over 45 facilities in Asia (approximately half of which are located on customersites).
The performance materials portion of this segment operates facilities in Los Angeles, California; Calvert City,Kentucky; Wichita, Kansas; Milton, Wisconsin; Reserve, Louisiana; Clayton, England; Marl, Germany; Singapore;Isehara, Japan; Changzhou, China and Nanjing, China. Substantially all of the Performance Materials properties areowned.
This segment has five field sales offices in the United States as well as sales offices in Europe, Taiwan, Korea,Singapore, and China, the majority of which are leased. The segment conducts R&D related activities at eightlocations worldwide, including Trexlertown, Pennsylvania; Carlsbad, California; Utrecht, the Netherlands; Hamburg,Germany; Chubei, Taiwan; Giheung, South Korea; Shanghai, China; and Kawasaki, Japan.
Equipment and Energy
Equipment and Energy operates eight manufacturing plants and two sales offices in the U.S. The Companymanufactures a significant portion of the world’s supply of LNG equipment at its Wilkes-Barre, Pennsylvania site. Airseparation columns and cold boxes for Company-owned facilities and third-party sales are produced by operations inIstres, France; Caojing, China; as well as in the Wilkes-Barre facility when capacity is available. Cryogenictransportation containers for liquid helium are manufactured and reconstructed at facilities in eastern Pennsylvaniaand Liberal, Kansas. Offices in Hersham, England and Shanghai, China house Equipment commercial teammembers.
Electric power is produced at various facilities, including Stockton, California and Calvert City, Kentucky. Flue gasdesulfurization operations are conducted at the Pure Air facility in Chesterton, Indiana. Additionally, the Companyowns a 47.9% interest in a gas-fueled power generation facility in Thailand. The Company or its affiliates ownapproximately 50% of the real estate in this segment and lease the remaining 50%.
ITEM 3. LEGAL PROCEEDINGS
In the normal course of business, the Company and its subsidiaries are involved in various legal proceedings,including contract, product liability, intellectual property, and insurance matters. Although litigation with respect tothese matters is routine and incidental to the conduct of the Company’s business, such litigation could result in largemonetary awards, especially if a civil jury is allowed to determine compensatory and/or punitive damages. However,the Company believes that litigation currently pending to which it is a party will be resolved without any materiallyadverse effect on its financial position, earnings, or cash flows.
The Company is also from time to time involved in certain competition, environmental, health, and safety proceedingsinvolving governmental authorities. The Company is a party to proceedings under the Comprehensive EnvironmentalResponse, Compensation, and Liability Act (the federal Superfund law); the Resource Conservation and Recovery Act(RCRA); and similar state environmental laws relating to the designation of certain sites for investigation orremediation. Presently there are approximately 30 sites on which a final settlement has not been reached where theCompany, along with others, has been designated a Potentially Responsible Party by the Environmental ProtectionAgency or is otherwise engaged in investigation or remediation, including cleanup activity at certain of its current orformer manufacturing sites. The Company does not expect that any sums it may have to pay in connection with thesematters would have a materially adverse effect on its consolidated financial position. Additional information on theCompany’s environmental exposure is included under “Narrative Description of the Company’s Business Generally—Environmental Controls.”
In 2008, the U.S. Environmental Protection Agency made a referral to the U.S. Department of Justice concerningalleged violations of the Resource Conservation and Recovery Act (RCRA) related to sulfuric acid exchange at theCompany’s Pasadena, Texas facility. The Company disputes the allegations, but has agreed to settle the matter for a$1.485 million civil penalty ($1.35 million to the United States and $135,000 to the State of Texas) and payment of$15,000 to the State of Texas for attorneys’ fees. The settlement was memorialized in a Consent Decree which waslodged with the U.S. District Court for the Southern District of Texas, Houston Division, on 25 August 2010 andentered on 29 October 2010.
14
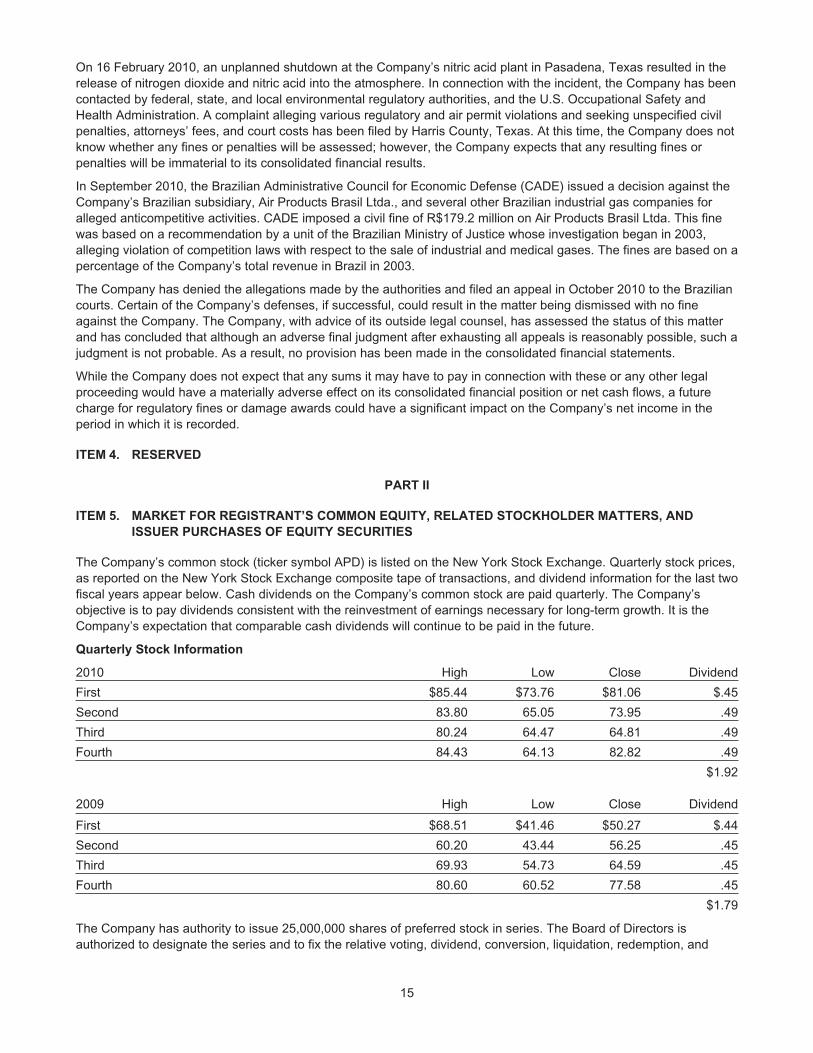
On 16 February 2010, an unplanned shutdown at the Company’s nitric acid plant in Pasadena, Texas resulted in therelease of nitrogen dioxide and nitric acid into the atmosphere. In connection with the incident, the Company has beencontacted by federal, state, and local environmental regulatory authorities, and the U.S. Occupational Safety andHealth Administration. A complaint alleging various regulatory and air permit violations and seeking unspecified civilpenalties, attorneys’ fees, and court costs has been filed by Harris County, Texas. At this time, the Company does notknow whether any fines or penalties will be assessed; however, the Company expects that any resulting fines orpenalties will be immaterial to its consolidated financial results.
In September 2010, the Brazilian Administrative Council for Economic Defense (CADE) issued a decision against theCompany’s Brazilian subsidiary, Air Products Brasil Ltda., and several other Brazilian industrial gas companies foralleged anticompetitive activities. CADE imposed a civil fine of R$179.2 million on Air Products Brasil Ltda. This finewas based on a recommendation by a unit of the Brazilian Ministry of Justice whose investigation began in 2003,alleging violation of competition laws with respect to the sale of industrial and medical gases. The fines are based on apercentage of the Company’s total revenue in Brazil in 2003.
The Company has denied the allegations made by the authorities and filed an appeal in October 2010 to the Braziliancourts. Certain of the Company’s defenses, if successful, could result in the matter being dismissed with no fineagainst the Company. The Company, with advice of its outside legal counsel, has assessed the status of this matterand has concluded that although an adverse final judgment after exhausting all appeals is reasonably possible, such ajudgment is not probable. As a result, no provision has been made in the consolidated financial statements.
While the Company does not expect that any sums it may have to pay in connection with these or any other legalproceeding would have a materially adverse effect on its consolidated financial position or net cash flows, a futurecharge for regulatory fines or damage awards could have a significant impact on the Company’s net income in theperiod in which it is recorded.
ITEM 4. RESERVED
PART II
ITEM 5. MARKET FOR REGISTRANT’S COMMON EQUITY, RELATED STOCKHOLDER MATTERS, AND
ISSUER PURCHASES OF EQUITY SECURITIES
The Company’s common stock (ticker symbol APD) is listed on the New York Stock Exchange. Quarterly stock prices,as reported on the New York Stock Exchange composite tape of transactions, and dividend information for the last twofiscal years appear below. Cash dividends on the Company’s common stock are paid quarterly. The Company’sobjective is to pay dividends consistent with the reinvestment of earnings necessary for long-term growth. It is theCompany’s expectation that comparable cash dividends will continue to be paid in the future.
Quarterly Stock Information
2010 High Low Close Dividend
First $85.44 $73.76 $81.06 $.45
Second 83.80 65.05 73.95 .49
Third 80.24 64.47 64.81 .49
Fourth 84.43 64.13 82.82 .49
$1.92
2009 High Low Close Dividend
First $68.51 $41.46 $50.27 $.44
Second 60.20 43.44 56.25 .45
Third 69.93 54.73 64.59 .45
Fourth 80.60 60.52 77.58 .45
$1.79
The Company has authority to issue 25,000,000 shares of preferred stock in series. The Board of Directors isauthorized to designate the series and to fix the relative voting, dividend, conversion, liquidation, redemption, and
15
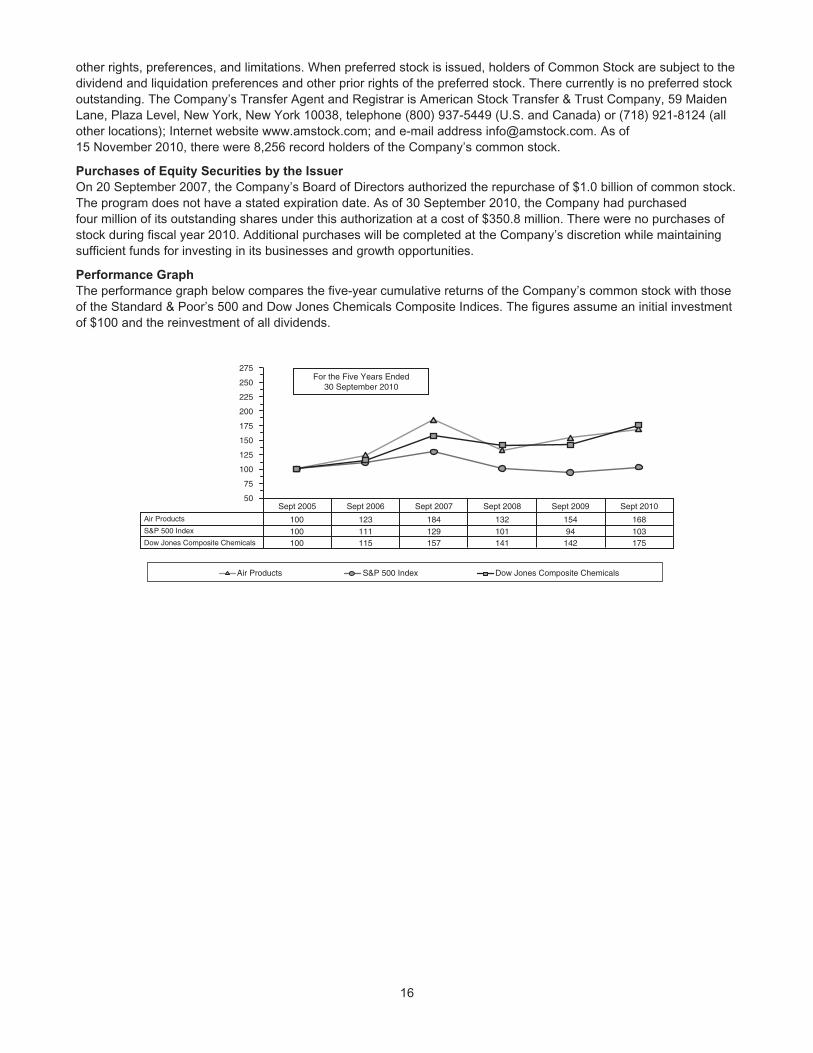
other rights, preferences, and limitations. When preferred stock is issued, holders of Common Stock are subject to thedividend and liquidation preferences and other prior rights of the preferred stock. There currently is no preferred stockoutstanding. The Company’s Transfer Agent and Registrar is American Stock Transfer & Trust Company, 59 MaidenLane, Plaza Level, New York, New York 10038, telephone (800) 937-5449 (U.S. and Canada) or (718) 921-8124 (allother locations); Internet website www.amstock.com; and e-mail address [email protected]. As of15 November 2010, there were 8,256 record holders of the Company’s common stock.
Purchases of Equity Securities by the Issuer
On 20 September 2007, the Company’s Board of Directors authorized the repurchase of $1.0 billion of common stock.The program does not have a stated expiration date. As of 30 September 2010, the Company had purchasedfour million of its outstanding shares under this authorization at a cost of $350.8 million. There were no purchases ofstock during fiscal year 2010. Additional purchases will be completed at the Company’s discretion while maintainingsufficient funds for investing in its businesses and growth opportunities.
Performance Graph
The performance graph below compares the five-year cumulative returns of the Company’s common stock with thoseof the Standard & Poor’s 500 and Dow Jones Chemicals Composite Indices. The figures assume an initial investmentof $100 and the reinvestment of all dividends.
Air Products
S&P 500 Index
Dow Jones Composite Chemicals
Sept 2005
100
275For the Five Years Ended
30 September 2010250
225
200
175
150
125
100
75
50
100100
123
S&P 500 IndexAir Products Dow Jones Composite Chemicals
111115
184129157
132101141
15494142
168103175
Sept 2006 Sept 2007 Sept 2008 Sept 2009 Sept 2010
16
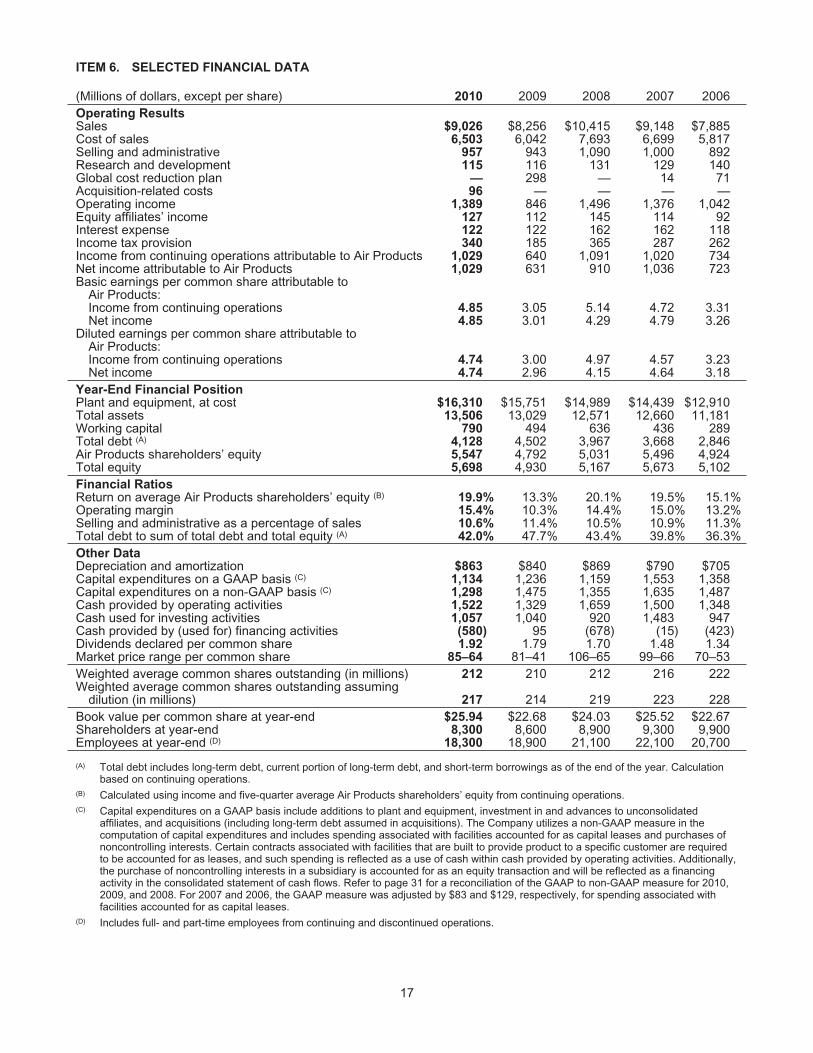
ITEM 6. SELECTED FINANCIAL DATA
(Millions of dollars, except per share) 2010 2009 2008 2007 2006Operating ResultsSales $9,026 $8,256 $10,415 $9,148 $7,885Cost of sales 6,503 6,042 7,693 6,699 5,817Selling and administrative 957 943 1,090 1,000 892Research and development 115 116 131 129 140Global cost reduction plan — 298 — 14 71Acquisition-related costs 96 — — — —Operating income 1,389 846 1,496 1,376 1,042Equity affiliates’ income 127 112 145 114 92Interest expense 122 122 162 162 118Income tax provision 340 185 365 287 262Income from continuing operations attributable to Air Products 1,029 640 1,091 1,020 734Net income attributable to Air Products 1,029 631 910 1,036 723Basic earnings per common share attributable to
Air Products:Income from continuing operations 4.85 3.05 5.14 4.72 3.31Net income 4.85 3.01 4.29 4.79 3.26
Diluted earnings per common share attributable toAir Products:Income from continuing operations 4.74 3.00 4.97 4.57 3.23Net income 4.74 2.96 4.15 4.64 3.18
Year-End Financial PositionPlant and equipment, at cost $16,310 $15,751 $14,989 $14,439 $12,910Total assets 13,506 13,029 12,571 12,660 11,181Working capital 790 494 636 436 289Total debt (A) 4,128 4,502 3,967 3,668 2,846Air Products shareholders’ equity 5,547 4,792 5,031 5,496 4,924Total equity 5,698 4,930 5,167 5,673 5,102Financial RatiosReturn on average Air Products shareholders’ equity (B) 19.9% 13.3% 20.1% 19.5% 15.1%Operating margin 15.4% 10.3% 14.4% 15.0% 13.2%Selling and administrative as a percentage of sales 10.6% 11.4% 10.5% 10.9% 11.3%Total debt to sum of total debt and total equity (A) 42.0% 47.7% 43.4% 39.8% 36.3%Other DataDepreciation and amortization $863 $840 $869 $790 $705Capital expenditures on a GAAP basis (C) 1,134 1,236 1,159 1,553 1,358Capital expenditures on a non-GAAP basis (C) 1,298 1,475 1,355 1,635 1,487Cash provided by operating activities 1,522 1,329 1,659 1,500 1,348Cash used for investing activities 1,057 1,040 920 1,483 947Cash provided by (used for) financing activities (580) 95 (678) (15) (423)Dividends declared per common share 1.92 1.79 1.70 1.48 1.34Market price range per common share 85–64 81–41 106–65 99–66 70–53Weighted average common shares outstanding (in millions) 212 210 212 216 222Weighted average common shares outstanding assuming
dilution (in millions) 217 214 219 223 228Book value per common share at year-end $25.94 $22.68 $24.03 $25.52 $22.67Shareholders at year-end 8,300 8,600 8,900 9,300 9,900Employees at year-end (D) 18,300 18,900 21,100 22,100 20,700
(A) Total debt includes long-term debt, current portion of long-term debt, and short-term borrowings as of the end of the year. Calculationbased on continuing operations.
(B) Calculated using income and five-quarter average Air Products shareholders’ equity from continuing operations.(C) Capital expenditures on a GAAP basis include additions to plant and equipment, investment in and advances to unconsolidated
affiliates, and acquisitions (including long-term debt assumed in acquisitions). The Company utilizes a non-GAAP measure in thecomputation of capital expenditures and includes spending associated with facilities accounted for as capital leases and purchases ofnoncontrolling interests. Certain contracts associated with facilities that are built to provide product to a specific customer are requiredto be accounted for as leases, and such spending is reflected as a use of cash within cash provided by operating activities. Additionally,the purchase of noncontrolling interests in a subsidiary is accounted for as an equity transaction and will be reflected as a financingactivity in the consolidated statement of cash flows. Refer to page 31 for a reconciliation of the GAAP to non-GAAP measure for 2010,2009, and 2008. For 2007 and 2006, the GAAP measure was adjusted by $83 and $129, respectively, for spending associated withfacilities accounted for as capital leases.
(D) Includes full- and part-time employees from continuing and discontinued operations.
17
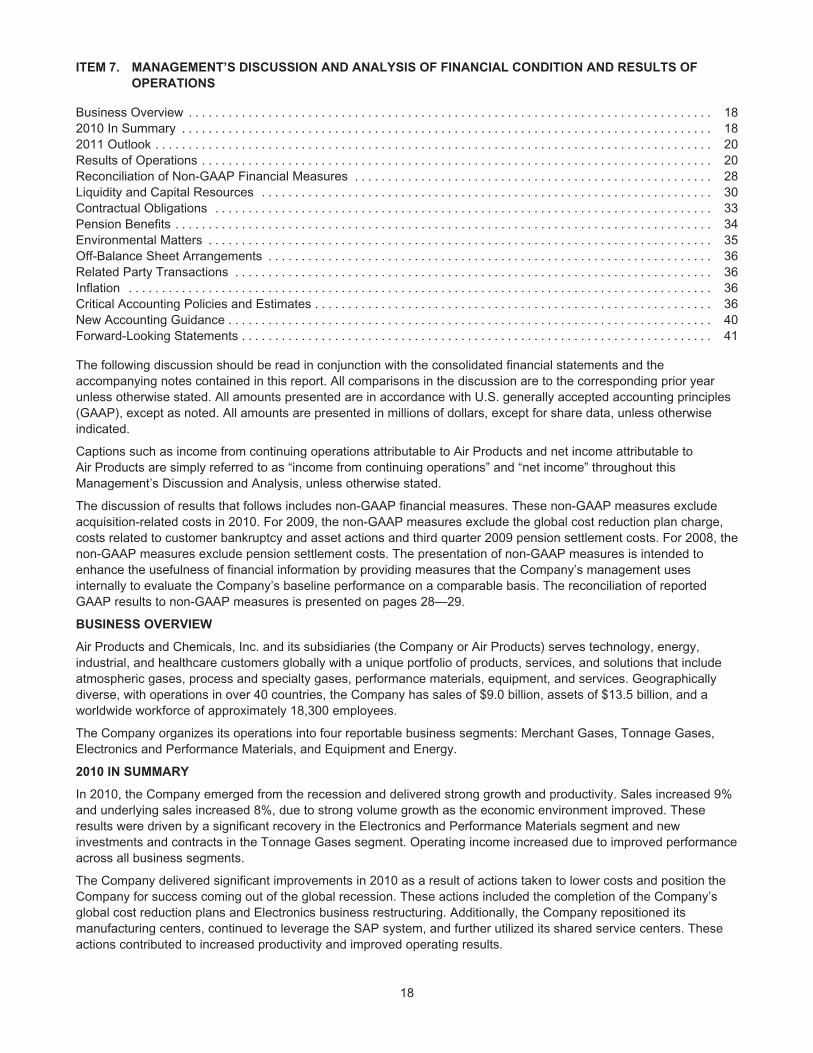
ITEM 7. MANAGEMENT’S DISCUSSION AND ANALYSIS OF FINANCIAL CONDITION AND RESULTS OF
OPERATIONS
Business Overview . . . . . . . . . . . . . . . . . . . . . . . . . . . . . . . . . . . . . . . . . . . . . . . . . . . . . . . . . . . . . . . . . . . . . . . . . . . . . . . 182010 In Summary . . . . . . . . . . . . . . . . . . . . . . . . . . . . . . . . . . . . . . . . . . . . . . . . . . . . . . . . . . . . . . . . . . . . . . . . . . . . . . . . 182011 Outlook . . . . . . . . . . . . . . . . . . . . . . . . . . . . . . . . . . . . . . . . . . . . . . . . . . . . . . . . . . . . . . . . . . . . . . . . . . . . . . . . . . . . 20Results of Operations . . . . . . . . . . . . . . . . . . . . . . . . . . . . . . . . . . . . . . . . . . . . . . . . . . . . . . . . . . . . . . . . . . . . . . . . . . . . . 20Reconciliation of Non-GAAP Financial Measures . . . . . . . . . . . . . . . . . . . . . . . . . . . . . . . . . . . . . . . . . . . . . . . . . . . . . . 28Liquidity and Capital Resources . . . . . . . . . . . . . . . . . . . . . . . . . . . . . . . . . . . . . . . . . . . . . . . . . . . . . . . . . . . . . . . . . . . . 30Contractual Obligations . . . . . . . . . . . . . . . . . . . . . . . . . . . . . . . . . . . . . . . . . . . . . . . . . . . . . . . . . . . . . . . . . . . . . . . . . . . 33Pension Benefits . . . . . . . . . . . . . . . . . . . . . . . . . . . . . . . . . . . . . . . . . . . . . . . . . . . . . . . . . . . . . . . . . . . . . . . . . . . . . . . . . 34Environmental Matters . . . . . . . . . . . . . . . . . . . . . . . . . . . . . . . . . . . . . . . . . . . . . . . . . . . . . . . . . . . . . . . . . . . . . . . . . . . . 35Off-Balance Sheet Arrangements . . . . . . . . . . . . . . . . . . . . . . . . . . . . . . . . . . . . . . . . . . . . . . . . . . . . . . . . . . . . . . . . . . . 36Related Party Transactions . . . . . . . . . . . . . . . . . . . . . . . . . . . . . . . . . . . . . . . . . . . . . . . . . . . . . . . . . . . . . . . . . . . . . . . . 36Inflation . . . . . . . . . . . . . . . . . . . . . . . . . . . . . . . . . . . . . . . . . . . . . . . . . . . . . . . . . . . . . . . . . . . . . . . . . . . . . . . . . . . . . . . . 36Critical Accounting Policies and Estimates . . . . . . . . . . . . . . . . . . . . . . . . . . . . . . . . . . . . . . . . . . . . . . . . . . . . . . . . . . . . 36New Accounting Guidance . . . . . . . . . . . . . . . . . . . . . . . . . . . . . . . . . . . . . . . . . . . . . . . . . . . . . . . . . . . . . . . . . . . . . . . . . 40Forward-Looking Statements . . . . . . . . . . . . . . . . . . . . . . . . . . . . . . . . . . . . . . . . . . . . . . . . . . . . . . . . . . . . . . . . . . . . . . . 41
The following discussion should be read in conjunction with the consolidated financial statements and theaccompanying notes contained in this report. All comparisons in the discussion are to the corresponding prior yearunless otherwise stated. All amounts presented are in accordance with U.S. generally accepted accounting principles(GAAP), except as noted. All amounts are presented in millions of dollars, except for share data, unless otherwiseindicated.
Captions such as income from continuing operations attributable to Air Products and net income attributable toAir Products are simply referred to as “income from continuing operations” and “net income” throughout thisManagement’s Discussion and Analysis, unless otherwise stated.
The discussion of results that follows includes non-GAAP financial measures. These non-GAAP measures excludeacquisition-related costs in 2010. For 2009, the non-GAAP measures exclude the global cost reduction plan charge,costs related to customer bankruptcy and asset actions and third quarter 2009 pension settlement costs. For 2008, thenon-GAAP measures exclude pension settlement costs. The presentation of non-GAAP measures is intended toenhance the usefulness of financial information by providing measures that the Company’s management usesinternally to evaluate the Company’s baseline performance on a comparable basis. The reconciliation of reportedGAAP results to non-GAAP measures is presented on pages 28—29.
BUSINESS OVERVIEW
Air Products and Chemicals, Inc. and its subsidiaries (the Company or Air Products) serves technology, energy,industrial, and healthcare customers globally with a unique portfolio of products, services, and solutions that includeatmospheric gases, process and specialty gases, performance materials, equipment, and services. Geographicallydiverse, with operations in over 40 countries, the Company has sales of $9.0 billion, assets of $13.5 billion, and aworldwide workforce of approximately 18,300 employees.
The Company organizes its operations into four reportable business segments: Merchant Gases, Tonnage Gases,Electronics and Performance Materials, and Equipment and Energy.
2010 IN SUMMARY
In 2010, the Company emerged from the recession and delivered strong growth and productivity. Sales increased 9%and underlying sales increased 8%, due to strong volume growth as the economic environment improved. Theseresults were driven by a significant recovery in the Electronics and Performance Materials segment and newinvestments and contracts in the Tonnage Gases segment. Operating income increased due to improved performanceacross all business segments.
The Company delivered significant improvements in 2010 as a result of actions taken to lower costs and position theCompany for success coming out of the global recession. These actions included the completion of the Company’sglobal cost reduction plans and Electronics business restructuring. Additionally, the Company repositioned itsmanufacturing centers, continued to leverage the SAP system, and further utilized its shared service centers. Theseactions contributed to increased productivity and improved operating results.
18

In February 2010, the Company commenced a tender offer to acquire all of the outstanding shares of Airgas, Inc.(Airgas). Airgas is the largest packaged industrial gases distributor in the U.S. Its fiscal year 2010 annual revenueswere $3.9 and its total assets as of 31 March 2010 were $4.5. The current offer price is $65.50 per share. At this price,the total value of the transaction would be approximately $7.4 billion, including $5.7 billion of equity and $1.7 billon ofassumed debt. The offer and withdrawal rights are scheduled to expire on 3 December 2010, unless further extended.
Highlights for 2010
• Sales of $9,026.0 increased 9%, or $769.8. Underlying business increased 8%, primarily due to higher volumes inthe Electronics and Performance Materials and Tonnage Gases segments.
• Operating income of $1,389.0 increased 64%, or $542.7. On a non-GAAP basis, operating income of $1,485.0increased 25%, or $300.4, primarily due to higher volumes, lower costs, and favorable currency and foreignexchange, partially offset by reduced pricing.
• Income from continuing operations of $1,029.1 increased 61%, or $389.2, and diluted earnings per share fromcontinuing operations of $4.74 increased 58%, or $1.74. On a non-GAAP basis, income from continuingoperations of $1,089.2 increased 26%, or $223.0, and diluted earnings per share from continuing operations of$5.02 increased 24%, or $.96. A summary table of changes in diluted earnings per share is presented below.
• The Company increased the quarterly dividend from $.45 to $.49 per share. This represents the 28th consecutiveyear that the Company has increased its dividend payment.
For a discussion of the challenges, risks, and opportunities on which management is focused, refer to the Company’s2011 Outlook discussions provided throughout the Management’s Discussion and Analysis that follows.
Changes in Diluted Earnings per Share Attributable to Air Products
2010 2009Increase
(Decrease)
Diluted Earnings per Share
Net income $4.74 $2.96 $1.78Discontinued operations — (.04) .04
Continuing Operations—GAAP Basis $4.74 $3.00 $1.74Acquisition-related costs .28 — .28Global cost reduction plan — .94 (.94)Customer bankruptcy and asset actions — .10 (.10)Pension settlement — .02 (.02)
Continuing Operations—Non-GAAP Basis $5.02 $4.06 $.96
Operating Income (after-tax)Underlying business
Volume $1.04Price/raw materials (.30)Costs .22
Currency .09
Operating Income 1.05
Other (after-tax)Equity affiliates’ income .05Interest expense —Income tax rate (.01)Noncontrolling interests (.05)Average shares outstanding (.08)
Other (.09)
Total Change in Diluted Earnings per Share from Continuing
Operations—Non-GAAP Basis $.96
19

2011 OUTLOOK
The Company projects that the gradual economic recovery will continue and that manufacturing will be the leadingsector in the recovery. The Company anticipates global manufacturing growth of 3%–4% in 2011, with stronger growthin Asia and more gradual recoveries in the U.S. and Europe. The Company expects the U.S. will have positive growthof 3%–4% in manufacturing. Europe should increase about 1%–2% and Asia, led by China, is expected to continue asthe strongest region, growing at 6%–7%.
Looking forward, the Company expects volume growth to be the key factor in driving earnings improvement in 2011.Earnings should benefit from new plant onstreams in 2010 and 2011, along with the loading of existing assets. Thesevolume gains will be partially offset by higher pension expense next year, as a result of a decline in the discount ratesfrom September 2009 to September 2010 and lower expected asset returns. Based upon current rates, the Companydoes not expect currency to have a significant impact on 2011 earnings. The Company will continue to focus on costcontrol and will achieve benefits from the cost reduction efforts completed.
If the proposed acquisition of Airgas is consummated in 2011, material impacts affecting most items in the Company’sconsolidated financial statements are expected. In addition, projections, estimates and plans described in thisManagement’s Discussion and Analysis would be materially impacted. Except where noted, the Outlook discussionsprovided throughout the Management’s Discussion and Analysis do not include any impacts of the proposedtransaction.
Outlook by Segment
• Merchant Gases should benefit as capacity utilization of existing facilities continues to improve globally and asnew demand develops, particularly in Asia. Global manufacturing growth, along with new technology applicationsshould continue to increase demand which will drive the loading of facilities.
• Tonnage Gases is expected to benefit from the full-year loading of the 2010 new plant start-ups, along withseveral investments due to come onstream in 2011.
• In Electronics, the Company projects silicon growth of 5%–10% and slow, steady growth of the business with thenewer photovoltaic (PV) and light-emitting diode (LED) businesses growing at higher rates. In the integratedcircuit business, the Company is well positioned with the industry leaders that are starting up new fabricationplants and expanding capacity. The electronics equipment business should also grow in 2011 due to anticipatedcontinued electronics industry capital spending. Growth is expected in Performance Materials as the Companyleverages low cost production facilities in Asia. Additionally, Performance Materials continues to benefit from newproduct, market and application successes.
• Equipment and Energy results are expected to be comparable to 2010 levels. Two to three liquefied natural gas(LNG) orders are expected to be signed in 2011.
RESULTS OF OPERATIONS
Discussion of Consolidated Results
2010 2009 2008
Sales $9,026.0 $8,256.2 $10,414.5Operating income—GAAP Basis 1,389.0 846.3 1,495.8Operating income—Non-GAAP Basis 1,485.0 1,184.6 1,522.1Equity affiliates’ income 126.9 112.2 145.0
Sales
% Change from Prior Year2010 2009
Underlying businessVolume 9% (9)%Price (1)% 1%
Currency 1% (6)%Energy and raw material cost pass-through — (7)%
Total Consolidated Sales Change 9% (21)%
20
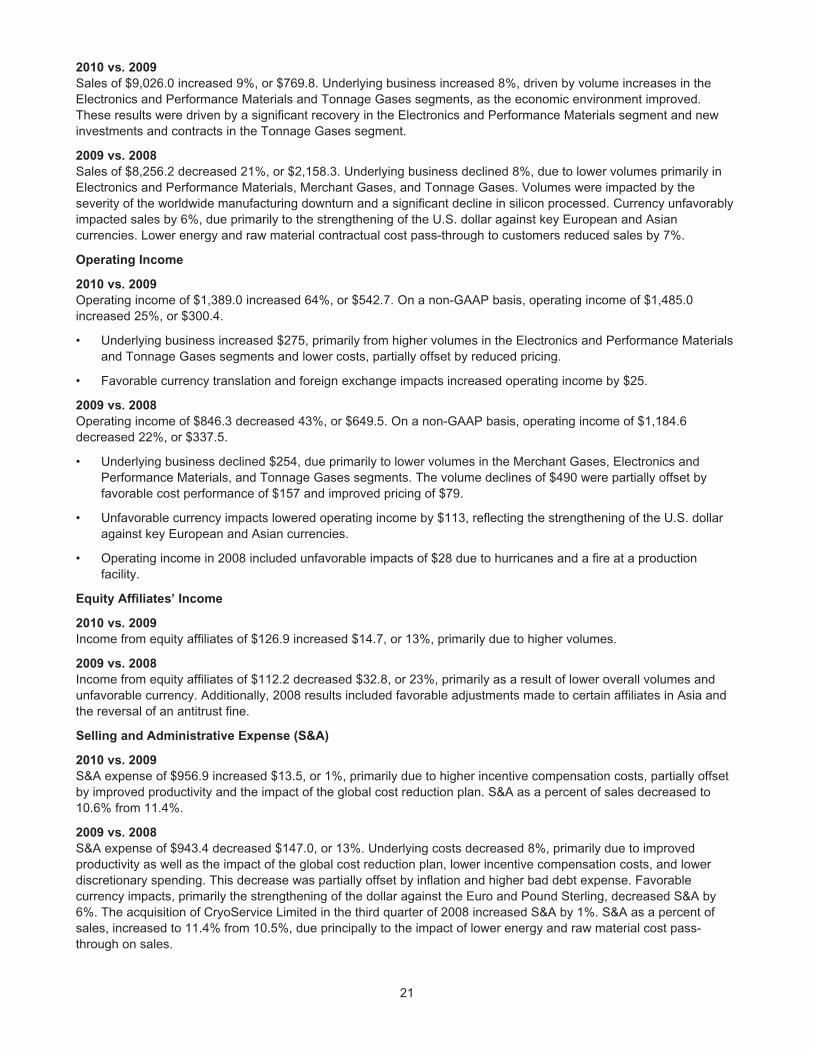
2010 vs. 2009
Sales of $9,026.0 increased 9%, or $769.8. Underlying business increased 8%, driven by volume increases in theElectronics and Performance Materials and Tonnage Gases segments, as the economic environment improved.These results were driven by a significant recovery in the Electronics and Performance Materials segment and newinvestments and contracts in the Tonnage Gases segment.
2009 vs. 2008
Sales of $8,256.2 decreased 21%, or $2,158.3. Underlying business declined 8%, due to lower volumes primarily inElectronics and Performance Materials, Merchant Gases, and Tonnage Gases. Volumes were impacted by theseverity of the worldwide manufacturing downturn and a significant decline in silicon processed. Currency unfavorablyimpacted sales by 6%, due primarily to the strengthening of the U.S. dollar against key European and Asiancurrencies. Lower energy and raw material contractual cost pass-through to customers reduced sales by 7%.
Operating Income
2010 vs. 2009
Operating income of $1,389.0 increased 64%, or $542.7. On a non-GAAP basis, operating income of $1,485.0increased 25%, or $300.4.
• Underlying business increased $275, primarily from higher volumes in the Electronics and Performance Materialsand Tonnage Gases segments and lower costs, partially offset by reduced pricing.
• Favorable currency translation and foreign exchange impacts increased operating income by $25.
2009 vs. 2008
Operating income of $846.3 decreased 43%, or $649.5. On a non-GAAP basis, operating income of $1,184.6decreased 22%, or $337.5.
• Underlying business declined $254, due primarily to lower volumes in the Merchant Gases, Electronics andPerformance Materials, and Tonnage Gases segments. The volume declines of $490 were partially offset byfavorable cost performance of $157 and improved pricing of $79.
• Unfavorable currency impacts lowered operating income by $113, reflecting the strengthening of the U.S. dollaragainst key European and Asian currencies.
• Operating income in 2008 included unfavorable impacts of $28 due to hurricanes and a fire at a productionfacility.
Equity Affiliates’ Income
2010 vs. 2009
Income from equity affiliates of $126.9 increased $14.7, or 13%, primarily due to higher volumes.
2009 vs. 2008
Income from equity affiliates of $112.2 decreased $32.8, or 23%, primarily as a result of lower overall volumes andunfavorable currency. Additionally, 2008 results included favorable adjustments made to certain affiliates in Asia andthe reversal of an antitrust fine.
Selling and Administrative Expense (S&A)
2010 vs. 2009
S&A expense of $956.9 increased $13.5, or 1%, primarily due to higher incentive compensation costs, partially offsetby improved productivity and the impact of the global cost reduction plan. S&A as a percent of sales decreased to10.6% from 11.4%.
2009 vs. 2008
S&A expense of $943.4 decreased $147.0, or 13%. Underlying costs decreased 8%, primarily due to improvedproductivity as well as the impact of the global cost reduction plan, lower incentive compensation costs, and lowerdiscretionary spending. This decrease was partially offset by inflation and higher bad debt expense. Favorablecurrency impacts, primarily the strengthening of the dollar against the Euro and Pound Sterling, decreased S&A by6%. The acquisition of CryoService Limited in the third quarter of 2008 increased S&A by 1%. S&A as a percent ofsales, increased to 11.4% from 10.5%, due principally to the impact of lower energy and raw material cost pass-through on sales.
21
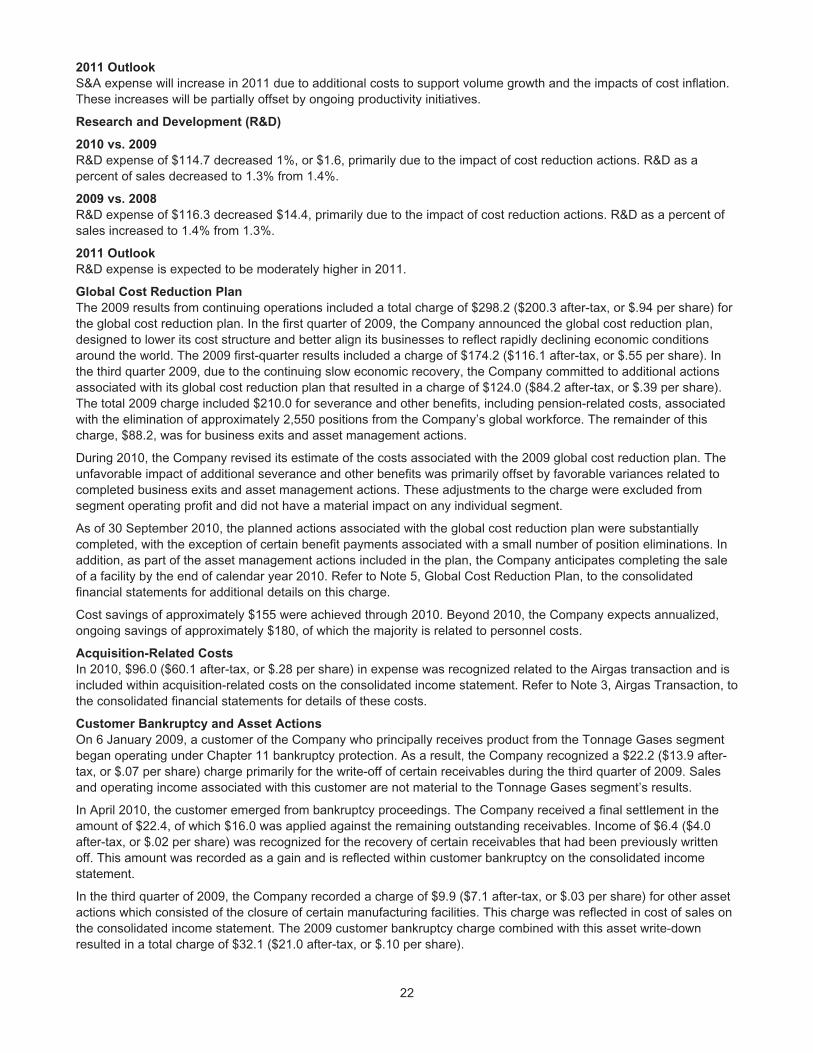
2011 Outlook
S&A expense will increase in 2011 due to additional costs to support volume growth and the impacts of cost inflation.These increases will be partially offset by ongoing productivity initiatives.
Research and Development (R&D)
2010 vs. 2009
R&D expense of $114.7 decreased 1%, or $1.6, primarily due to the impact of cost reduction actions. R&D as apercent of sales decreased to 1.3% from 1.4%.
2009 vs. 2008
R&D expense of $116.3 decreased $14.4, primarily due to the impact of cost reduction actions. R&D as a percent ofsales increased to 1.4% from 1.3%.
2011 Outlook
R&D expense is expected to be moderately higher in 2011.
Global Cost Reduction Plan
The 2009 results from continuing operations included a total charge of $298.2 ($200.3 after-tax, or $.94 per share) forthe global cost reduction plan. In the first quarter of 2009, the Company announced the global cost reduction plan,designed to lower its cost structure and better align its businesses to reflect rapidly declining economic conditionsaround the world. The 2009 first-quarter results included a charge of $174.2 ($116.1 after-tax, or $.55 per share). Inthe third quarter 2009, due to the continuing slow economic recovery, the Company committed to additional actionsassociated with its global cost reduction plan that resulted in a charge of $124.0 ($84.2 after-tax, or $.39 per share).The total 2009 charge included $210.0 for severance and other benefits, including pension-related costs, associatedwith the elimination of approximately 2,550 positions from the Company’s global workforce. The remainder of thischarge, $88.2, was for business exits and asset management actions.
During 2010, the Company revised its estimate of the costs associated with the 2009 global cost reduction plan. Theunfavorable impact of additional severance and other benefits was primarily offset by favorable variances related tocompleted business exits and asset management actions. These adjustments to the charge were excluded fromsegment operating profit and did not have a material impact on any individual segment.
As of 30 September 2010, the planned actions associated with the global cost reduction plan were substantiallycompleted, with the exception of certain benefit payments associated with a small number of position eliminations. Inaddition, as part of the asset management actions included in the plan, the Company anticipates completing the saleof a facility by the end of calendar year 2010. Refer to Note 5, Global Cost Reduction Plan, to the consolidatedfinancial statements for additional details on this charge.
Cost savings of approximately $155 were achieved through 2010. Beyond 2010, the Company expects annualized,ongoing savings of approximately $180, of which the majority is related to personnel costs.
Acquisition-Related Costs
In 2010, $96.0 ($60.1 after-tax, or $.28 per share) in expense was recognized related to the Airgas transaction and isincluded within acquisition-related costs on the consolidated income statement. Refer to Note 3, Airgas Transaction, tothe consolidated financial statements for details of these costs.
Customer Bankruptcy and Asset Actions
On 6 January 2009, a customer of the Company who principally receives product from the Tonnage Gases segmentbegan operating under Chapter 11 bankruptcy protection. As a result, the Company recognized a $22.2 ($13.9 after-tax, or $.07 per share) charge primarily for the write-off of certain receivables during the third quarter of 2009. Salesand operating income associated with this customer are not material to the Tonnage Gases segment’s results.
In April 2010, the customer emerged from bankruptcy proceedings. The Company received a final settlement in theamount of $22.4, of which $16.0 was applied against the remaining outstanding receivables. Income of $6.4 ($4.0after-tax, or $.02 per share) was recognized for the recovery of certain receivables that had been previously writtenoff. This amount was recorded as a gain and is reflected within customer bankruptcy on the consolidated incomestatement.
In the third quarter of 2009, the Company recorded a charge of $9.9 ($7.1 after-tax, or $.03 per share) for other assetactions which consisted of the closure of certain manufacturing facilities. This charge was reflected in cost of sales onthe consolidated income statement. The 2009 customer bankruptcy charge combined with this asset write-downresulted in a total charge of $32.1 ($21.0 after-tax, or $.10 per share).
22

Pension Settlement
The Company’s U.S. supplemental pension plan provides for a lump sum benefit payment option at the time ofretirement, or for corporate officers, six months after the participant’s retirement date. The Company recognizespension settlements when payments exceed the sum of the service and interest cost components of net periodicpension cost of the plan for the fiscal year. A settlement loss is recognized when the pension obligation is settled. TheCompany recognized $11.5, $10.7, and $30.3 of settlement charges in 2010, 2009, and 2008, respectively. Refer toNote 16, Retirement Benefits, to the consolidated financial statements for additional information.
Other Income, Net
Items recorded to other income arise from transactions and events not directly related to the principal income earningactivities of the Company. The detail of other income is presented in Note 23, Supplemental Information, to theconsolidated financial statements.
2010 vs. 2009
Other income of $38.7 increased $15.7, primarily due to a net gain on the sale of assets and favorable foreignexchange. Otherwise, no individual items were significant in comparison to the prior year.
2009 vs. 2008
Other income of $23.0 decreased by $2.8. Other income declined due to losses from asset sales in 2009 andunfavorable foreign exchange. Other income in 2008 included a loss related to fire damage at a production facility. Noother items were individually significant in comparison to the prior year.
Interest Expense
2010 2009 2008
Interest incurred $136.2 $143.8 $184.1Less: Capitalized interest 14.3 21.9 22.1
Interest Expense $121.9 $121.9 $162.0
2010 vs. 2009
Interest incurred decreased $7.6. The decrease was driven by lower average interest rates on variable rate debt,partially offset by a higher average debt balance and the impact of a weaker dollar on the translation of foreigncurrency interest. The change in capitalized interest is driven by a decrease in project spending which qualified forcapitalization.
2009 vs. 2008
Interest incurred decreased by $40.3. This decrease was primarily driven by lower average interest rates on variablerate debt. The impact of a stronger dollar on the translation of foreign currency interest was offset by a higher averagedebt balance. Capitalized interest was comparable to 2008 due to slightly higher project levels offset by lower averageinterest rates.
2011 Outlook
The Company expects interest incurred to be modestly higher. This increase is expected to result from a higheraverage debt balance, higher fees on the Company’s committed credit facility, and slightly higher interest rates onvariable rate debt.
Effective Tax Rate
The effective tax rate equals the income tax provision divided by income from continuing operations before taxes.Refer to Note 22, Income Taxes, to the consolidated financial statements for details on factors affecting the effectivetax rate.
2010 vs. 2009
On a GAAP basis, the effective tax rate was 24.4% and 22.1% in 2010 and 2009, respectively. On a non-GAAP basis,the effective tax rate was 25.2% and 25.3% in 2010 and 2009, respectively.
2009 vs. 2008
On a GAAP basis, the effective tax rate was 22.1% and 24.7% in 2009 and 2008, respectively. On a non-GAAP basis,the effective tax rate was 25.3% and 24.9% in 2009 and 2008, respectively. The effective tax rate was higher in 2009due to lower tax credits and adjustments.
23
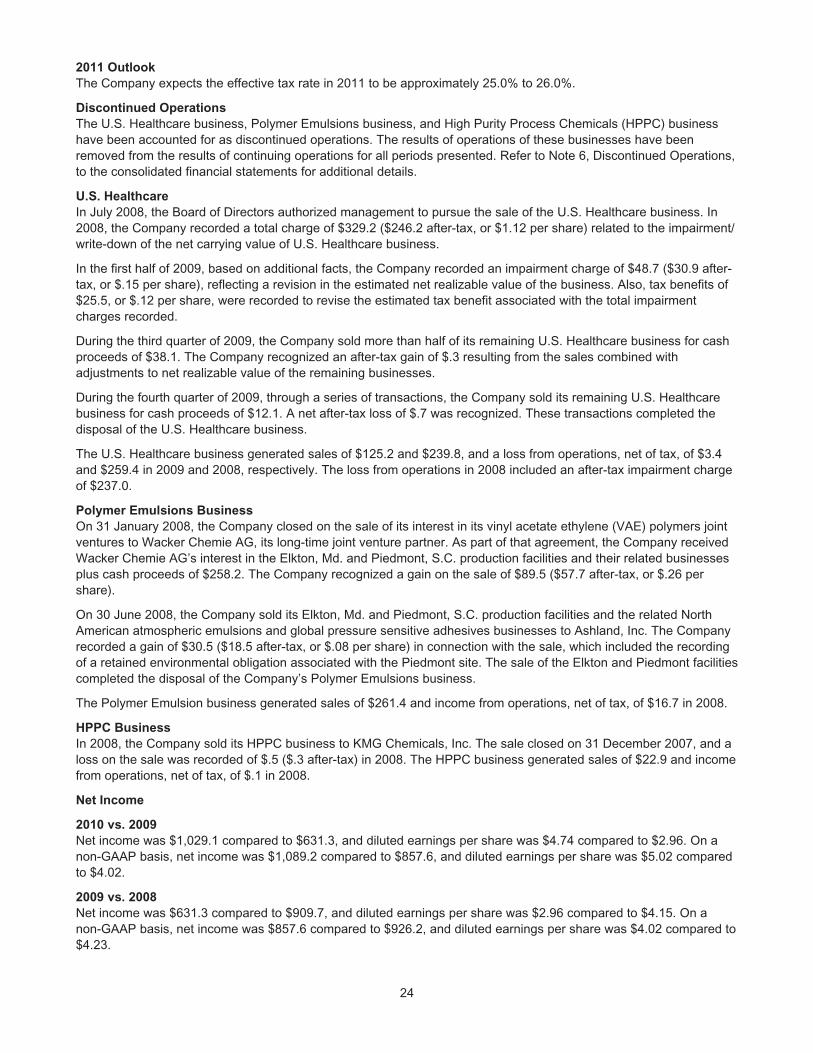
2011 Outlook
The Company expects the effective tax rate in 2011 to be approximately 25.0% to 26.0%.
Discontinued Operations
The U.S. Healthcare business, Polymer Emulsions business, and High Purity Process Chemicals (HPPC) businesshave been accounted for as discontinued operations. The results of operations of these businesses have beenremoved from the results of continuing operations for all periods presented. Refer to Note 6, Discontinued Operations,to the consolidated financial statements for additional details.
U.S. Healthcare
In July 2008, the Board of Directors authorized management to pursue the sale of the U.S. Healthcare business. In2008, the Company recorded a total charge of $329.2 ($246.2 after-tax, or $1.12 per share) related to the impairment/write-down of the net carrying value of U.S. Healthcare business.
In the first half of 2009, based on additional facts, the Company recorded an impairment charge of $48.7 ($30.9 after-tax, or $.15 per share), reflecting a revision in the estimated net realizable value of the business. Also, tax benefits of$25.5, or $.12 per share, were recorded to revise the estimated tax benefit associated with the total impairmentcharges recorded.
During the third quarter of 2009, the Company sold more than half of its remaining U.S. Healthcare business for cashproceeds of $38.1. The Company recognized an after-tax gain of $.3 resulting from the sales combined withadjustments to net realizable value of the remaining businesses.
During the fourth quarter of 2009, through a series of transactions, the Company sold its remaining U.S. Healthcarebusiness for cash proceeds of $12.1. A net after-tax loss of $.7 was recognized. These transactions completed thedisposal of the U.S. Healthcare business.
The U.S. Healthcare business generated sales of $125.2 and $239.8, and a loss from operations, net of tax, of $3.4and $259.4 in 2009 and 2008, respectively. The loss from operations in 2008 included an after-tax impairment chargeof $237.0.
Polymer Emulsions Business
On 31 January 2008, the Company closed on the sale of its interest in its vinyl acetate ethylene (VAE) polymers jointventures to Wacker Chemie AG, its long-time joint venture partner. As part of that agreement, the Company receivedWacker Chemie AG’s interest in the Elkton, Md. and Piedmont, S.C. production facilities and their related businessesplus cash proceeds of $258.2. The Company recognized a gain on the sale of $89.5 ($57.7 after-tax, or $.26 pershare).
On 30 June 2008, the Company sold its Elkton, Md. and Piedmont, S.C. production facilities and the related NorthAmerican atmospheric emulsions and global pressure sensitive adhesives businesses to Ashland, Inc. The Companyrecorded a gain of $30.5 ($18.5 after-tax, or $.08 per share) in connection with the sale, which included the recordingof a retained environmental obligation associated with the Piedmont site. The sale of the Elkton and Piedmont facilitiescompleted the disposal of the Company’s Polymer Emulsions business.
The Polymer Emulsion business generated sales of $261.4 and income from operations, net of tax, of $16.7 in 2008.
HPPC Business
In 2008, the Company sold its HPPC business to KMG Chemicals, Inc. The sale closed on 31 December 2007, and aloss on the sale was recorded of $.5 ($.3 after-tax) in 2008. The HPPC business generated sales of $22.9 and incomefrom operations, net of tax, of $.1 in 2008.
Net Income
2010 vs. 2009
Net income was $1,029.1 compared to $631.3, and diluted earnings per share was $4.74 compared to $2.96. On anon-GAAP basis, net income was $1,089.2 compared to $857.6, and diluted earnings per share was $5.02 comparedto $4.02.
2009 vs. 2008
Net income was $631.3 compared to $909.7, and diluted earnings per share was $2.96 compared to $4.15. On anon-GAAP basis, net income was $857.6 compared to $926.2, and diluted earnings per share was $4.02 compared to$4.23.
24
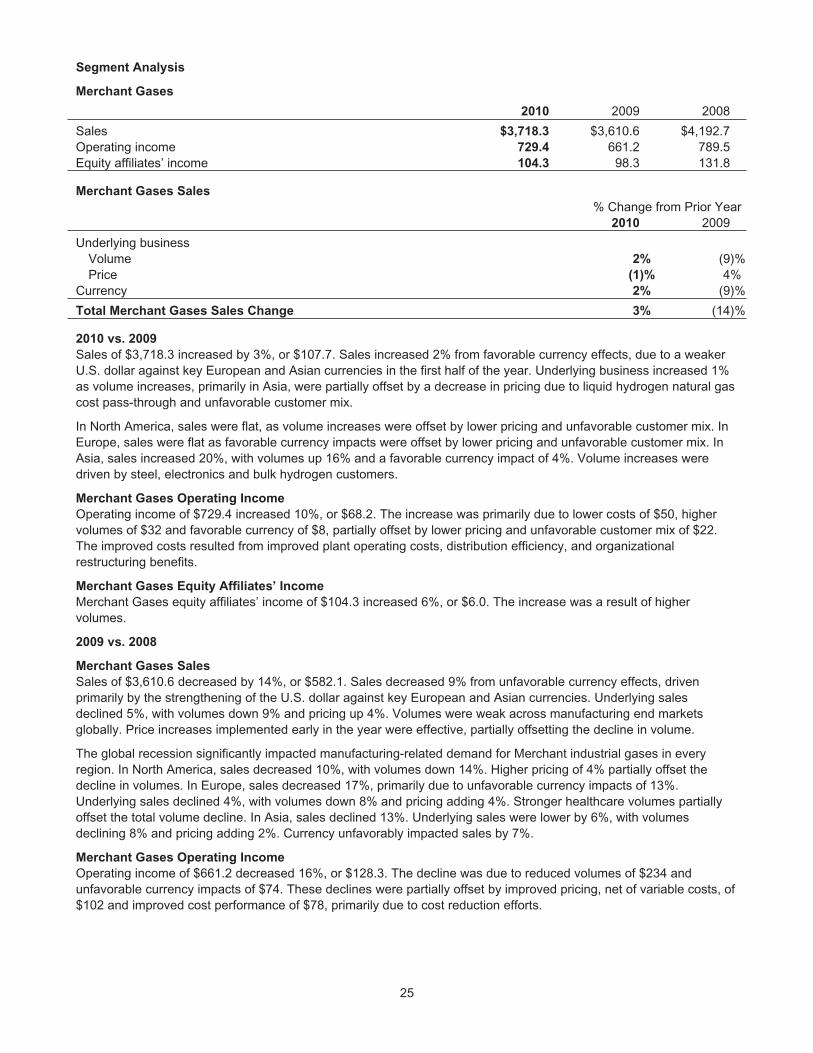
Segment Analysis
Merchant Gases
2010 2009 2008
Sales $3,718.3 $3,610.6 $4,192.7Operating income 729.4 661.2 789.5Equity affiliates’ income 104.3 98.3 131.8
Merchant Gases Sales
% Change from Prior Year2010 2009
Underlying businessVolume 2% (9)%Price (1)% 4%
Currency 2% (9)%
Total Merchant Gases Sales Change 3% (14)%
2010 vs. 2009
Sales of $3,718.3 increased by 3%, or $107.7. Sales increased 2% from favorable currency effects, due to a weakerU.S. dollar against key European and Asian currencies in the first half of the year. Underlying business increased 1%as volume increases, primarily in Asia, were partially offset by a decrease in pricing due to liquid hydrogen natural gascost pass-through and unfavorable customer mix.
In North America, sales were flat, as volume increases were offset by lower pricing and unfavorable customer mix. InEurope, sales were flat as favorable currency impacts were offset by lower pricing and unfavorable customer mix. InAsia, sales increased 20%, with volumes up 16% and a favorable currency impact of 4%. Volume increases weredriven by steel, electronics and bulk hydrogen customers.
Merchant Gases Operating Income
Operating income of $729.4 increased 10%, or $68.2. The increase was primarily due to lower costs of $50, highervolumes of $32 and favorable currency of $8, partially offset by lower pricing and unfavorable customer mix of $22.The improved costs resulted from improved plant operating costs, distribution efficiency, and organizationalrestructuring benefits.
Merchant Gases Equity Affiliates’ Income
Merchant Gases equity affiliates’ income of $104.3 increased 6%, or $6.0. The increase was a result of highervolumes.
2009 vs. 2008
Merchant Gases Sales
Sales of $3,610.6 decreased by 14%, or $582.1. Sales decreased 9% from unfavorable currency effects, drivenprimarily by the strengthening of the U.S. dollar against key European and Asian currencies. Underlying salesdeclined 5%, with volumes down 9% and pricing up 4%. Volumes were weak across manufacturing end marketsglobally. Price increases implemented early in the year were effective, partially offsetting the decline in volume.
The global recession significantly impacted manufacturing-related demand for Merchant industrial gases in everyregion. In North America, sales decreased 10%, with volumes down 14%. Higher pricing of 4% partially offset thedecline in volumes. In Europe, sales decreased 17%, primarily due to unfavorable currency impacts of 13%.Underlying sales declined 4%, with volumes down 8% and pricing adding 4%. Stronger healthcare volumes partiallyoffset the total volume decline. In Asia, sales declined 13%. Underlying sales were lower by 6%, with volumesdeclining 8% and pricing adding 2%. Currency unfavorably impacted sales by 7%.
Merchant Gases Operating Income
Operating income of $661.2 decreased 16%, or $128.3. The decline was due to reduced volumes of $234 andunfavorable currency impacts of $74. These declines were partially offset by improved pricing, net of variable costs, of$102 and improved cost performance of $78, primarily due to cost reduction efforts.
25
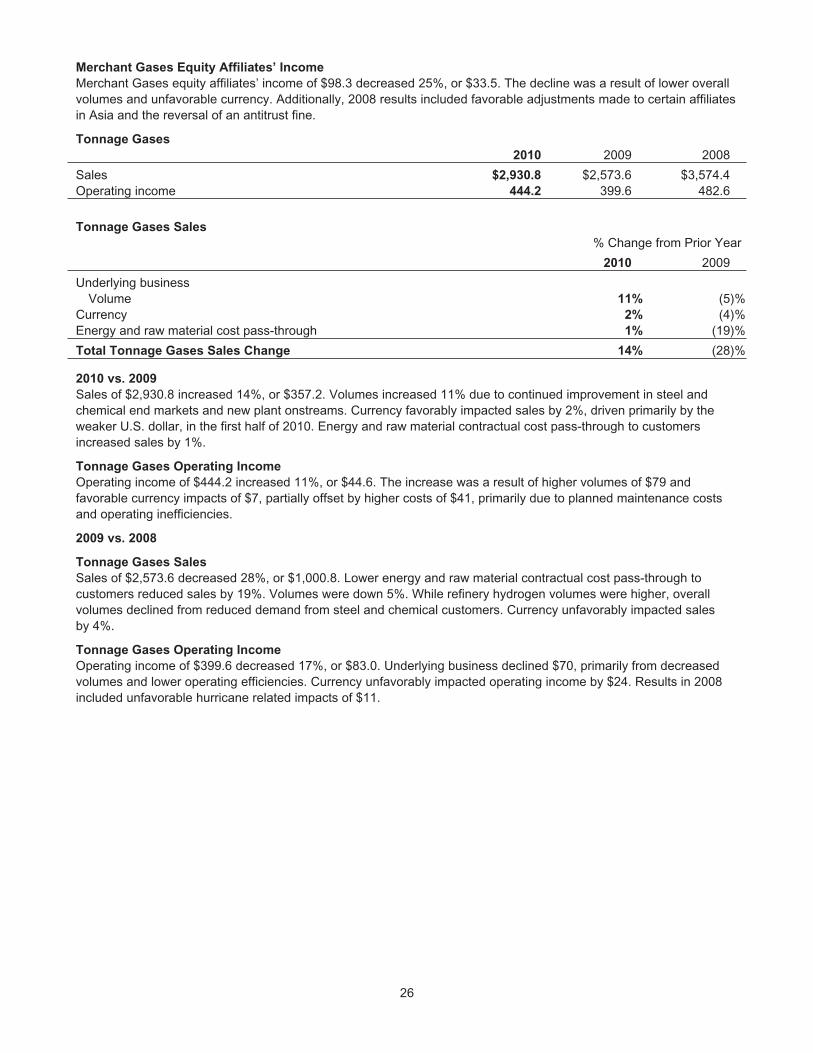
Merchant Gases Equity Affiliates’ Income
Merchant Gases equity affiliates’ income of $98.3 decreased 25%, or $33.5. The decline was a result of lower overallvolumes and unfavorable currency. Additionally, 2008 results included favorable adjustments made to certain affiliatesin Asia and the reversal of an antitrust fine.
Tonnage Gases
2010 2009 2008
Sales $2,930.8 $2,573.6 $3,574.4Operating income 444.2 399.6 482.6
Tonnage Gases Sales
% Change from Prior Year
2010 2009
Underlying businessVolume 11% (5)%
Currency 2% (4)%Energy and raw material cost pass-through 1% (19)%
Total Tonnage Gases Sales Change 14% (28)%
2010 vs. 2009
Sales of $2,930.8 increased 14%, or $357.2. Volumes increased 11% due to continued improvement in steel andchemical end markets and new plant onstreams. Currency favorably impacted sales by 2%, driven primarily by theweaker U.S. dollar, in the first half of 2010. Energy and raw material contractual cost pass-through to customersincreased sales by 1%.
Tonnage Gases Operating Income
Operating income of $444.2 increased 11%, or $44.6. The increase was a result of higher volumes of $79 andfavorable currency impacts of $7, partially offset by higher costs of $41, primarily due to planned maintenance costsand operating inefficiencies.
2009 vs. 2008
Tonnage Gases Sales
Sales of $2,573.6 decreased 28%, or $1,000.8. Lower energy and raw material contractual cost pass-through tocustomers reduced sales by 19%. Volumes were down 5%. While refinery hydrogen volumes were higher, overallvolumes declined from reduced demand from steel and chemical customers. Currency unfavorably impacted salesby 4%.
Tonnage Gases Operating Income
Operating income of $399.6 decreased 17%, or $83.0. Underlying business declined $70, primarily from decreasedvolumes and lower operating efficiencies. Currency unfavorably impacted operating income by $24. Results in 2008included unfavorable hurricane related impacts of $11.
26
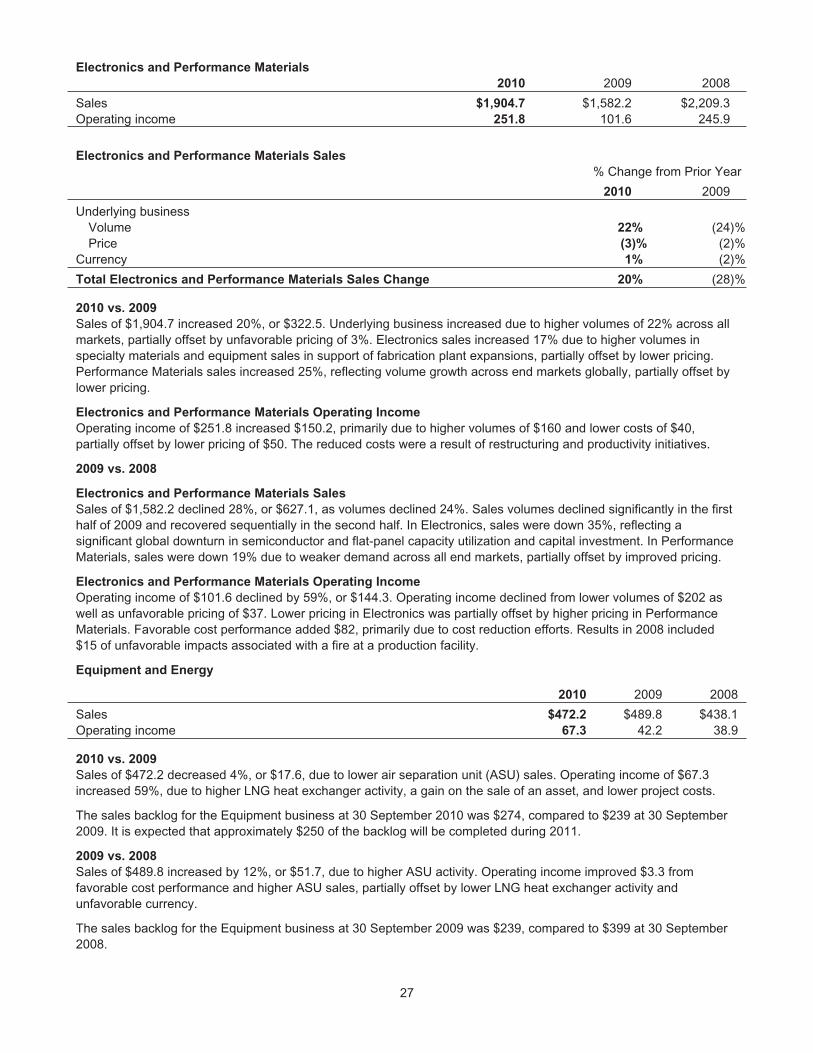
Electronics and Performance Materials
2010 2009 2008
Sales $1,904.7 $1,582.2 $2,209.3Operating income 251.8 101.6 245.9
Electronics and Performance Materials Sales
% Change from Prior Year
2010 2009
Underlying businessVolume 22% (24)%Price (3)% (2)%
Currency 1% (2)%
Total Electronics and Performance Materials Sales Change 20% (28)%
2010 vs. 2009
Sales of $1,904.7 increased 20%, or $322.5. Underlying business increased due to higher volumes of 22% across allmarkets, partially offset by unfavorable pricing of 3%. Electronics sales increased 17% due to higher volumes inspecialty materials and equipment sales in support of fabrication plant expansions, partially offset by lower pricing.Performance Materials sales increased 25%, reflecting volume growth across end markets globally, partially offset bylower pricing.
Electronics and Performance Materials Operating Income
Operating income of $251.8 increased $150.2, primarily due to higher volumes of $160 and lower costs of $40,partially offset by lower pricing of $50. The reduced costs were a result of restructuring and productivity initiatives.
2009 vs. 2008
Electronics and Performance Materials Sales
Sales of $1,582.2 declined 28%, or $627.1, as volumes declined 24%. Sales volumes declined significantly in the firsthalf of 2009 and recovered sequentially in the second half. In Electronics, sales were down 35%, reflecting asignificant global downturn in semiconductor and flat-panel capacity utilization and capital investment. In PerformanceMaterials, sales were down 19% due to weaker demand across all end markets, partially offset by improved pricing.
Electronics and Performance Materials Operating Income
Operating income of $101.6 declined by 59%, or $144.3. Operating income declined from lower volumes of $202 aswell as unfavorable pricing of $37. Lower pricing in Electronics was partially offset by higher pricing in PerformanceMaterials. Favorable cost performance added $82, primarily due to cost reduction efforts. Results in 2008 included$15 of unfavorable impacts associated with a fire at a production facility.
Equipment and Energy
2010 2009 2008
Sales $472.2 $489.8 $438.1Operating income 67.3 42.2 38.9
2010 vs. 2009
Sales of $472.2 decreased 4%, or $17.6, due to lower air separation unit (ASU) sales. Operating income of $67.3increased 59%, due to higher LNG heat exchanger activity, a gain on the sale of an asset, and lower project costs.
The sales backlog for the Equipment business at 30 September 2010 was $274, compared to $239 at 30 September2009. It is expected that approximately $250 of the backlog will be completed during 2011.
2009 vs. 2008
Sales of $489.8 increased by 12%, or $51.7, due to higher ASU activity. Operating income improved $3.3 fromfavorable cost performance and higher ASU sales, partially offset by lower LNG heat exchanger activity andunfavorable currency.
The sales backlog for the Equipment business at 30 September 2009 was $239, compared to $399 at 30 September2008.
27
Other
Other operating income (loss) includes other expense and income that cannot be directly associated with the businesssegments, including foreign exchange gains and losses, interest income, and costs previously allocated to businessesnow reported as discontinued operations. Also included are LIFO inventory adjustments, as the business segmentsuse FIFO and the LIFO pool adjustments are not allocated to the business segments. Corporate general andadministrative costs and research and development costs are fully allocated to the business segments.
2010 vs. 2009
Operating loss was $2.6 compared to $17.3, primarily due to favorable foreign exchange in the current year. No otherindividual items were significant in comparison to the prior year.
2009 vs. 2008
Operating loss of $17.3 decreased by $13.5. The decrease was primarily due to favorable LIFO inventory adjustmentsversus 2008. Unfavorable currency partially offset this decline. No other items were individually significant incomparison to the prior year.
RECONCILIATION OF NON-GAAP FINANCIAL MEASURES
The presentation of non-GAAP measures is intended to enhance the usefulness of financial information by providingmeasures which the Company’s management uses internally to evaluate the Company’s baseline performance on acomparable basis. Presented below are reconciliations of the reported GAAP results to the non-GAAP measures.
Consolidated Results
Operating
Income
Income from
Continuing
Operations
Diluted
EPS
Net
Income
Diluted
EPS
2010 GAAP $1,389.0 $1,029.1 $4.74 $1,029.1 $4.74
2009 GAAP 846.3 639.9 3.00 631.3 2.96
Change GAAP $542.7 $389.2 $1.74 $397.8 $1.78
% Change GAAP 64% 61% 58% 63% 60%
2010 GAAP $1,389.0 $1,029.1 $4.74 $1,029.1 $4.74
Acquisition-related costs (tax impact $35.9) (a) 96.0 60.1 .28 60.1 .28
2010 Non-GAAP Measure $1,485.0 $1,089.2 $5.02 $1,089.2 $5.02
2009 GAAP $846.3 $639.9 $3.00 $631.3 $2.96Global cost reduction plan (tax impact $97.9) (b) 298.2 200.3 .94 200.3 .94Customer bankruptcy and asset actions
(tax impact $11.1) (c) 32.1 21.0 .10 21.0 .10Pension settlement (tax impact $3.0) (d) 8.0 5.0 .02 5.0 .02
2009 Non-GAAP Measure $1,184.6 $866.2 $4.06 $857.6 $4.02
Change Non-GAAP Measure $300.4 $223.0 $.96
% Change Non-GAAP Measure 25% 26% 24%
(a) Based on statutory tax rate of 37.4%
(b) Based on average statutory tax rate of 32.8%
(c) Based on average statutory tax rate of 34.6%
(d) Based on average statutory tax rate of 37.5%
28
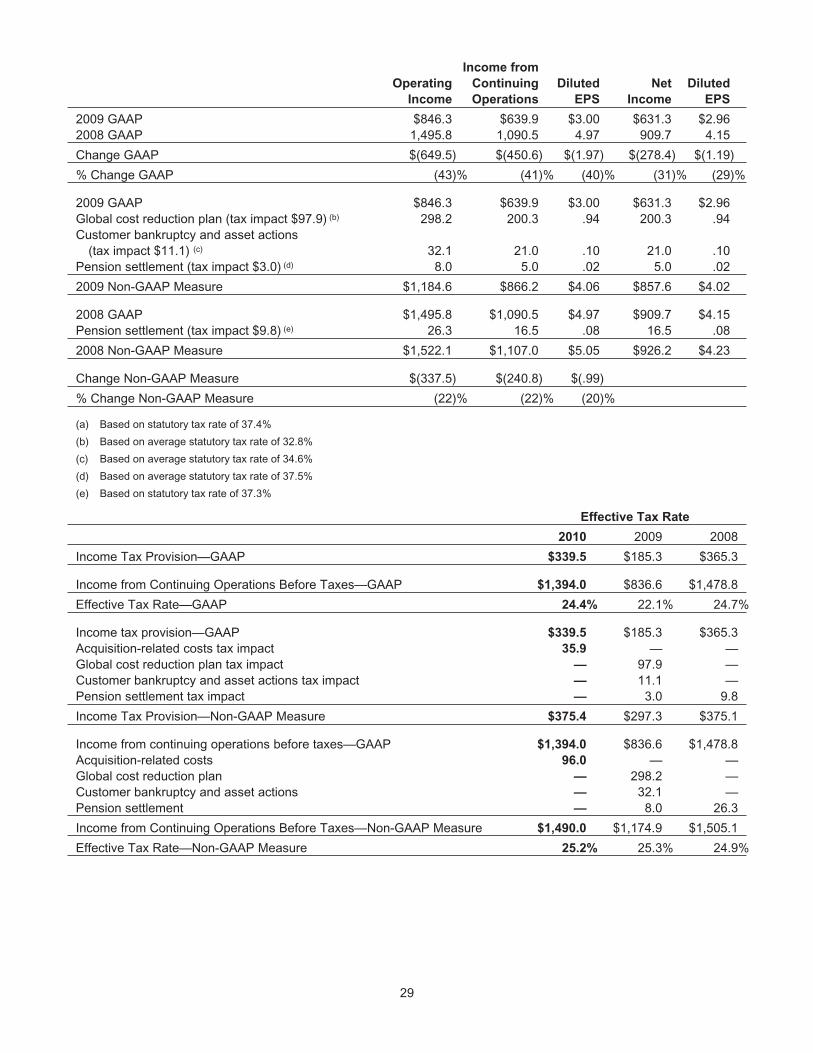
Operating
Income
Income from
Continuing
Operations
Diluted
EPS
Net
Income
Diluted
EPS
2009 GAAP $846.3 $639.9 $3.00 $631.3 $2.962008 GAAP 1,495.8 1,090.5 4.97 909.7 4.15
Change GAAP $(649.5) $(450.6) $(1.97) $(278.4) $(1.19)
% Change GAAP (43)% (41)% (40)% (31)% (29)%
2009 GAAP $846.3 $639.9 $3.00 $631.3 $2.96Global cost reduction plan (tax impact $97.9) (b) 298.2 200.3 .94 200.3 .94Customer bankruptcy and asset actions
(tax impact $11.1) (c) 32.1 21.0 .10 21.0 .10Pension settlement (tax impact $3.0) (d) 8.0 5.0 .02 5.0 .02
2009 Non-GAAP Measure $1,184.6 $866.2 $4.06 $857.6 $4.02
2008 GAAP $1,495.8 $1,090.5 $4.97 $909.7 $4.15Pension settlement (tax impact $9.8) (e) 26.3 16.5 .08 16.5 .08
2008 Non-GAAP Measure $1,522.1 $1,107.0 $5.05 $926.2 $4.23
Change Non-GAAP Measure $(337.5) $(240.8) $(.99)
% Change Non-GAAP Measure (22)% (22)% (20)%
(a) Based on statutory tax rate of 37.4%
(b) Based on average statutory tax rate of 32.8%
(c) Based on average statutory tax rate of 34.6%
(d) Based on average statutory tax rate of 37.5%
(e) Based on statutory tax rate of 37.3%
Effective Tax Rate
2010 2009 2008
Income Tax Provision—GAAP $339.5 $185.3 $365.3
Income from Continuing Operations Before Taxes—GAAP $1,394.0 $836.6 $1,478.8
Effective Tax Rate—GAAP 24.4% 22.1% 24.7%
Income tax provision—GAAP $339.5 $185.3 $365.3Acquisition-related costs tax impact 35.9 — —Global cost reduction plan tax impact — 97.9 —Customer bankruptcy and asset actions tax impact — 11.1 —Pension settlement tax impact — 3.0 9.8
Income Tax Provision—Non-GAAP Measure $375.4 $297.3 $375.1
Income from continuing operations before taxes—GAAP $1,394.0 $836.6 $1,478.8Acquisition-related costs 96.0 — —Global cost reduction plan — 298.2 —Customer bankruptcy and asset actions — 32.1 —Pension settlement — 8.0 26.3
Income from Continuing Operations Before Taxes—Non-GAAP Measure $1,490.0 $1,174.9 $1,505.1
Effective Tax Rate—Non-GAAP Measure 25.2% 25.3% 24.9%
29
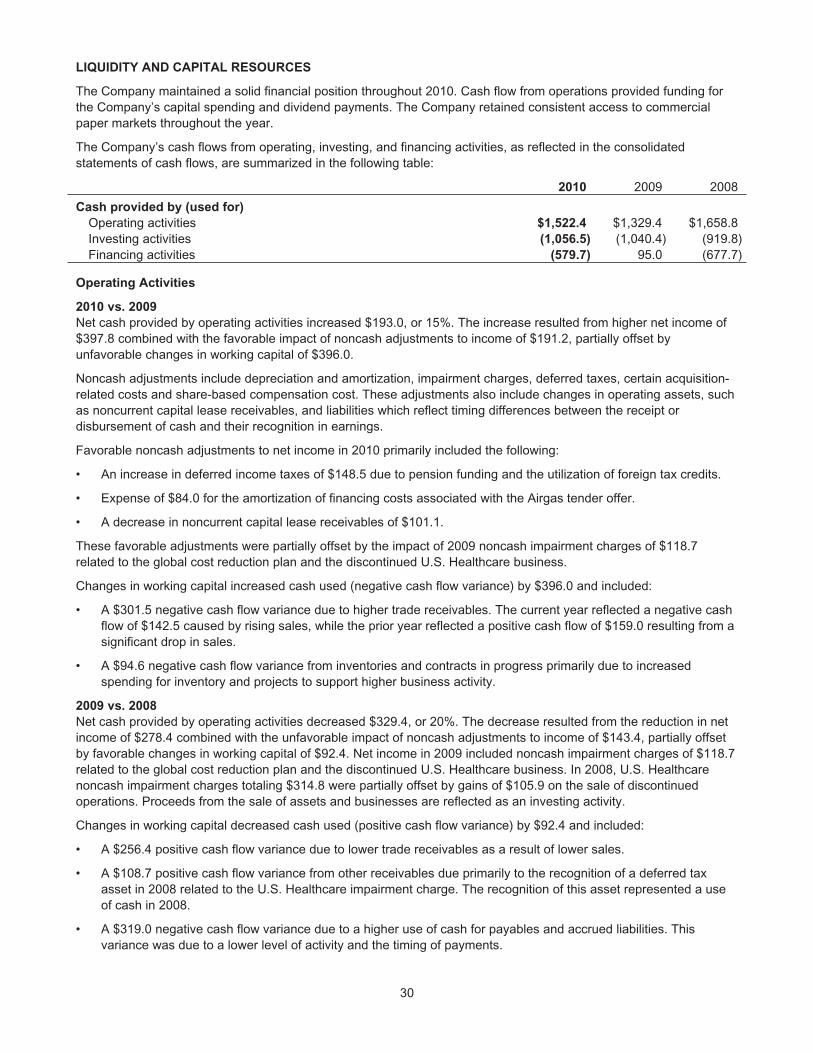
LIQUIDITY AND CAPITAL RESOURCES
The Company maintained a solid financial position throughout 2010. Cash flow from operations provided funding forthe Company’s capital spending and dividend payments. The Company retained consistent access to commercialpaper markets throughout the year.
The Company’s cash flows from operating, investing, and financing activities, as reflected in the consolidatedstatements of cash flows, are summarized in the following table:
2010 2009 2008
Cash provided by (used for)
Operating activities $1,522.4 $1,329.4 $1,658.8Investing activities (1,056.5) (1,040.4) (919.8)Financing activities (579.7) 95.0 (677.7)
Operating Activities
2010 vs. 2009
Net cash provided by operating activities increased $193.0, or 15%. The increase resulted from higher net income of$397.8 combined with the favorable impact of noncash adjustments to income of $191.2, partially offset byunfavorable changes in working capital of $396.0.
Noncash adjustments include depreciation and amortization, impairment charges, deferred taxes, certain acquisition-related costs and share-based compensation cost. These adjustments also include changes in operating assets, suchas noncurrent capital lease receivables, and liabilities which reflect timing differences between the receipt ordisbursement of cash and their recognition in earnings.
Favorable noncash adjustments to net income in 2010 primarily included the following:
• An increase in deferred income taxes of $148.5 due to pension funding and the utilization of foreign tax credits.
• Expense of $84.0 for the amortization of financing costs associated with the Airgas tender offer.
• A decrease in noncurrent capital lease receivables of $101.1.
These favorable adjustments were partially offset by the impact of 2009 noncash impairment charges of $118.7related to the global cost reduction plan and the discontinued U.S. Healthcare business.
Changes in working capital increased cash used (negative cash flow variance) by $396.0 and included:
• A $301.5 negative cash flow variance due to higher trade receivables. The current year reflected a negative cashflow of $142.5 caused by rising sales, while the prior year reflected a positive cash flow of $159.0 resulting from asignificant drop in sales.
• A $94.6 negative cash flow variance from inventories and contracts in progress primarily due to increasedspending for inventory and projects to support higher business activity.
2009 vs. 2008
Net cash provided by operating activities decreased $329.4, or 20%. The decrease resulted from the reduction in netincome of $278.4 combined with the unfavorable impact of noncash adjustments to income of $143.4, partially offsetby favorable changes in working capital of $92.4. Net income in 2009 included noncash impairment charges of $118.7related to the global cost reduction plan and the discontinued U.S. Healthcare business. In 2008, U.S. Healthcarenoncash impairment charges totaling $314.8 were partially offset by gains of $105.9 on the sale of discontinuedoperations. Proceeds from the sale of assets and businesses are reflected as an investing activity.
Changes in working capital decreased cash used (positive cash flow variance) by $92.4 and included:
• A $256.4 positive cash flow variance due to lower trade receivables as a result of lower sales.
• A $108.7 positive cash flow variance from other receivables due primarily to the recognition of a deferred taxasset in 2008 related to the U.S. Healthcare impairment charge. The recognition of this asset represented a useof cash in 2008.
• A $319.0 negative cash flow variance due to a higher use of cash for payables and accrued liabilities. Thisvariance was due to a lower level of activity and the timing of payments.
30
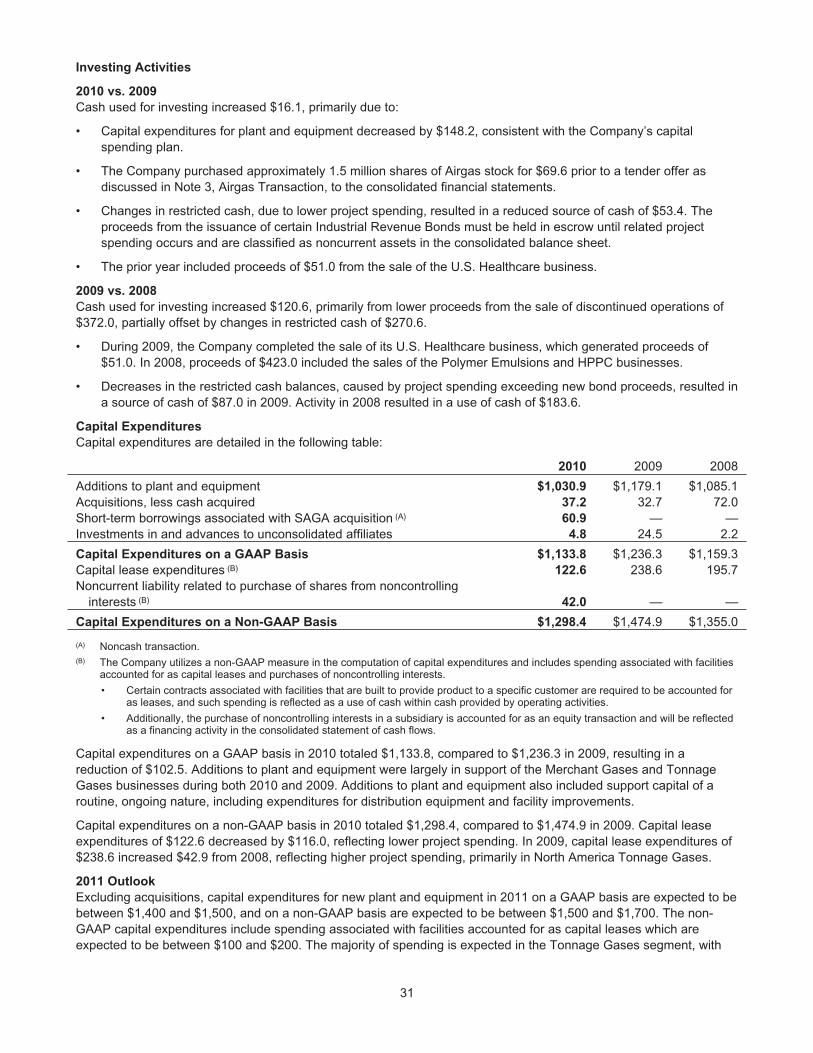
Investing Activities
2010 vs. 2009
Cash used for investing increased $16.1, primarily due to:
• Capital expenditures for plant and equipment decreased by $148.2, consistent with the Company’s capitalspending plan.
• The Company purchased approximately 1.5 million shares of Airgas stock for $69.6 prior to a tender offer asdiscussed in Note 3, Airgas Transaction, to the consolidated financial statements.
• Changes in restricted cash, due to lower project spending, resulted in a reduced source of cash of $53.4. Theproceeds from the issuance of certain Industrial Revenue Bonds must be held in escrow until related projectspending occurs and are classified as noncurrent assets in the consolidated balance sheet.
• The prior year included proceeds of $51.0 from the sale of the U.S. Healthcare business.
2009 vs. 2008
Cash used for investing increased $120.6, primarily from lower proceeds from the sale of discontinued operations of$372.0, partially offset by changes in restricted cash of $270.6.
• During 2009, the Company completed the sale of its U.S. Healthcare business, which generated proceeds of$51.0. In 2008, proceeds of $423.0 included the sales of the Polymer Emulsions and HPPC businesses.
• Decreases in the restricted cash balances, caused by project spending exceeding new bond proceeds, resulted ina source of cash of $87.0 in 2009. Activity in 2008 resulted in a use of cash of $183.6.
Capital Expenditures
Capital expenditures are detailed in the following table:
2010 2009 2008
Additions to plant and equipment $1,030.9 $1,179.1 $1,085.1Acquisitions, less cash acquired 37.2 32.7 72.0Short-term borrowings associated with SAGA acquisition (A) 60.9 — —Investments in and advances to unconsolidated affiliates 4.8 24.5 2.2
Capital Expenditures on a GAAP Basis $1,133.8 $1,236.3 $1,159.3Capital lease expenditures (B) 122.6 238.6 195.7Noncurrent liability related to purchase of shares from noncontrolling
interests (B) 42.0 — —
Capital Expenditures on a Non-GAAP Basis $1,298.4 $1,474.9 $1,355.0
(A) Noncash transaction.(B) The Company utilizes a non-GAAP measure in the computation of capital expenditures and includes spending associated with facilities
accounted for as capital leases and purchases of noncontrolling interests.
• Certain contracts associated with facilities that are built to provide product to a specific customer are required to be accounted foras leases, and such spending is reflected as a use of cash within cash provided by operating activities.
• Additionally, the purchase of noncontrolling interests in a subsidiary is accounted for as an equity transaction and will be reflectedas a financing activity in the consolidated statement of cash flows.
Capital expenditures on a GAAP basis in 2010 totaled $1,133.8, compared to $1,236.3 in 2009, resulting in areduction of $102.5. Additions to plant and equipment were largely in support of the Merchant Gases and TonnageGases businesses during both 2010 and 2009. Additions to plant and equipment also included support capital of aroutine, ongoing nature, including expenditures for distribution equipment and facility improvements.
Capital expenditures on a non-GAAP basis in 2010 totaled $1,298.4, compared to $1,474.9 in 2009. Capital leaseexpenditures of $122.6 decreased by $116.0, reflecting lower project spending. In 2009, capital lease expenditures of$238.6 increased $42.9 from 2008, reflecting higher project spending, primarily in North America Tonnage Gases.
2011 Outlook
Excluding acquisitions, capital expenditures for new plant and equipment in 2011 on a GAAP basis are expected to bebetween $1,400 and $1,500, and on a non-GAAP basis are expected to be between $1,500 and $1,700. The non-GAAP capital expenditures include spending associated with facilities accounted for as capital leases which areexpected to be between $100 and $200. The majority of spending is expected in the Tonnage Gases segment, with
31
approximately $1,000 associated with new plants. It is anticipated that capital expenditures will be funded principallywith cash from continuing operations. In addition, the Company intends to continue to evaluate acquisitionopportunities and investments in equity affiliates.
Financing Activities
2010 vs. 2009
Cash used by financing activities increased $674.7, primarily due to:
• A decrease in long-term proceeds of $384.3. The prior year included proceeds of $400.0 from the issuance of afixed-rate 4.375% 10-year senior note.
• An increase in payments on long-term debt of $353.5, resulting primarily from the repayment of a €250 Eurobond($306.8).
2009 vs. 2008
Cash provided by financing activities increased $772.7, primarily as a result of share repurchases of $793.4 in 2008.In 2009, the Company did not purchase any of its outstanding shares.
Financing and Capital Structure
Capital needs in 2010 were satisfied primarily with cash from operations. At the end of 2010, total debt outstandingwas $4.1 billion compared to $4.5 billion, and cash and cash items were $.4 billion compared to $.5 billion. Total debtat 30 September 2010 and 2009, expressed as a percentage of the sum of total debt and total equity, was 42.0% and47.7%, respectively.
Long-term debt proceeds of $226.2 included $85.0 from the issuance of Industrial Revenue Bonds. Refer to Note 15,Debt, to the consolidated financial statements for additional information.
In February 2010, the Company commenced a tender offer to acquire all outstanding common stock of Airgas asfurther discussed in Note 3, Airgas Transaction, to the consolidated financial statements. In connection with thistender offer, the Company has secured committed financing in the form of a $6.7 billion term loan credit facility.Borrowings under this credit facility will be available beginning on the date of the consummation of the tender offer,which must occur no later than 4 February 2011. All borrowings under this credit facility will mature on the date that isone year from the consummation of the tender offer. The credit facility agreement contains one financial covenant, amaximum leverage ratio, and other affirmative and negative covenants, including restrictions on liens and certainsubsidiary indebtedness. It also requires mandatory commitment reduction/prepayment for certain capital markettransactions and asset dispositions. Fees incurred to secure this credit facility have been deferred and are beingamortized over the term of the arrangement.
The Company has obtained the commitment of a number of commercial banks to lend money at market rateswhenever needed. At 30 September 2009, the Company’s total multicurrency committed credit facility amounted to$1,450. On 8 July 2010, the Company replaced this facility with a new $2,000 multicurrency committed credit facilitymaturing on 8 July 2013. Facility fees were modified to reflect current market rates. The Company has one financialcovenant associated with this new credit facility. The covenant indicates that the ratio of total debt to earnings beforeinterest, taxes, depreciation, and amortization (EBITDA) shall not exceed 3.0. This credit facility provides a source ofliquidity and is used to support the issuance of commercial paper. No borrowings were outstanding under thiscommitment at the end of 2010. Additional commitments totaling $518.7 are maintained by the Company’s foreignsubsidiaries, of which $345.2 was borrowed and outstanding at 30 September 2010.
In 2007, the Board of Directors authorized the repurchase of up to $1,000 of the Company’s outstanding commonstock. During 2010, the Company did not purchase any shares under this authorization. At 30 September 2010,$649.2 in share repurchase authorization remained.
2011 Outlook
Exclusive of the potential Airgas transaction described above, the Company projects a limited need to access thelong-term debt markets in 2011 due to its projected operating cash flows, modest debt maturities and available cashbalance at the end of 2010. Should the Airgas transaction occur, the Company expects to fund this acquisitionprimarily with new debt financing. The Company expects that it will continue to be in compliance with all of its financialcovenants. Also, the Company anticipates that it will continue to be able to access the commercial paper and othershort-term debt markets.
32
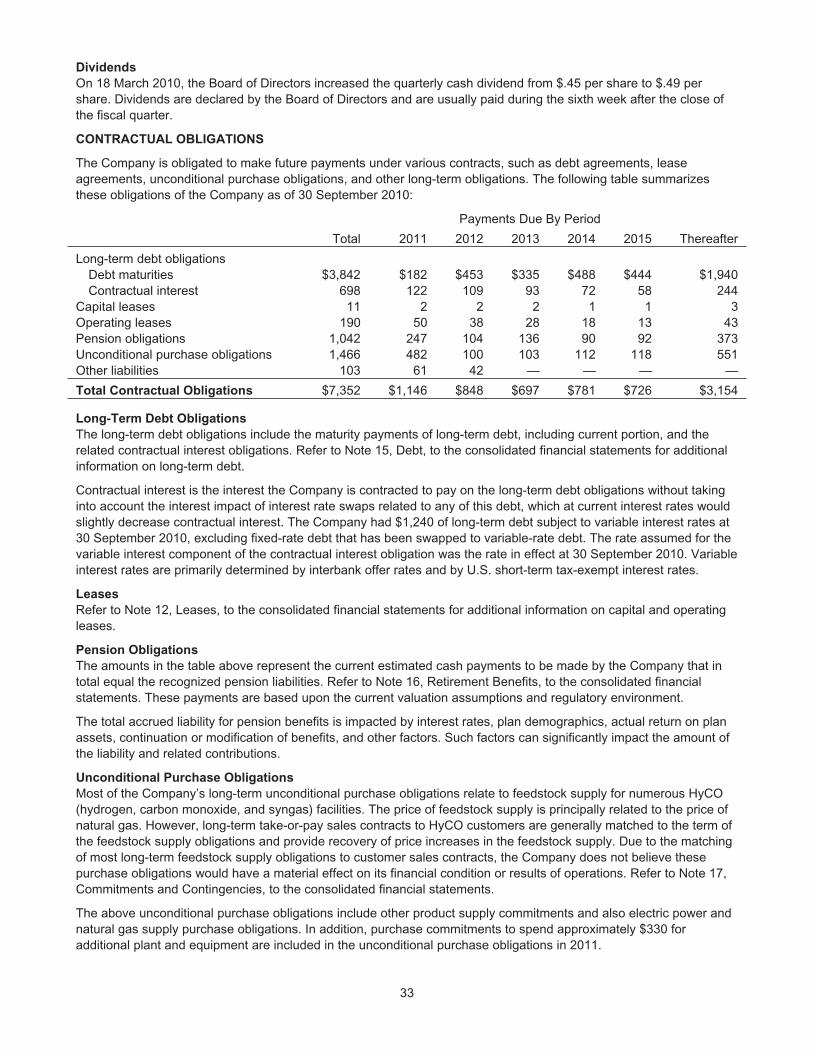
Dividends
On 18 March 2010, the Board of Directors increased the quarterly cash dividend from $.45 per share to $.49 pershare. Dividends are declared by the Board of Directors and are usually paid during the sixth week after the close ofthe fiscal quarter.
CONTRACTUAL OBLIGATIONS
The Company is obligated to make future payments under various contracts, such as debt agreements, leaseagreements, unconditional purchase obligations, and other long-term obligations. The following table summarizesthese obligations of the Company as of 30 September 2010:
Payments Due By Period
Total 2011 2012 2013 2014 2015 Thereafter
Long-term debt obligationsDebt maturities $3,842 $182 $453 $335 $488 $444 $1,940Contractual interest 698 122 109 93 72 58 244
Capital leases 11 2 2 2 1 1 3Operating leases 190 50 38 28 18 13 43Pension obligations 1,042 247 104 136 90 92 373Unconditional purchase obligations 1,466 482 100 103 112 118 551Other liabilities 103 61 42 — — — —
Total Contractual Obligations $7,352 $1,146 $848 $697 $781 $726 $3,154
Long-Term Debt Obligations
The long-term debt obligations include the maturity payments of long-term debt, including current portion, and therelated contractual interest obligations. Refer to Note 15, Debt, to the consolidated financial statements for additionalinformation on long-term debt.
Contractual interest is the interest the Company is contracted to pay on the long-term debt obligations without takinginto account the interest impact of interest rate swaps related to any of this debt, which at current interest rates wouldslightly decrease contractual interest. The Company had $1,240 of long-term debt subject to variable interest rates at30 September 2010, excluding fixed-rate debt that has been swapped to variable-rate debt. The rate assumed for thevariable interest component of the contractual interest obligation was the rate in effect at 30 September 2010. Variableinterest rates are primarily determined by interbank offer rates and by U.S. short-term tax-exempt interest rates.
Leases
Refer to Note 12, Leases, to the consolidated financial statements for additional information on capital and operatingleases.
Pension Obligations
The amounts in the table above represent the current estimated cash payments to be made by the Company that intotal equal the recognized pension liabilities. Refer to Note 16, Retirement Benefits, to the consolidated financialstatements. These payments are based upon the current valuation assumptions and regulatory environment.
The total accrued liability for pension benefits is impacted by interest rates, plan demographics, actual return on planassets, continuation or modification of benefits, and other factors. Such factors can significantly impact the amount ofthe liability and related contributions.
Unconditional Purchase Obligations
Most of the Company’s long-term unconditional purchase obligations relate to feedstock supply for numerous HyCO(hydrogen, carbon monoxide, and syngas) facilities. The price of feedstock supply is principally related to the price ofnatural gas. However, long-term take-or-pay sales contracts to HyCO customers are generally matched to the term ofthe feedstock supply obligations and provide recovery of price increases in the feedstock supply. Due to the matchingof most long-term feedstock supply obligations to customer sales contracts, the Company does not believe thesepurchase obligations would have a material effect on its financial condition or results of operations. Refer to Note 17,Commitments and Contingencies, to the consolidated financial statements.
The above unconditional purchase obligations include other product supply commitments and also electric power andnatural gas supply purchase obligations. In addition, purchase commitments to spend approximately $330 foradditional plant and equipment are included in the unconditional purchase obligations in 2011.
33
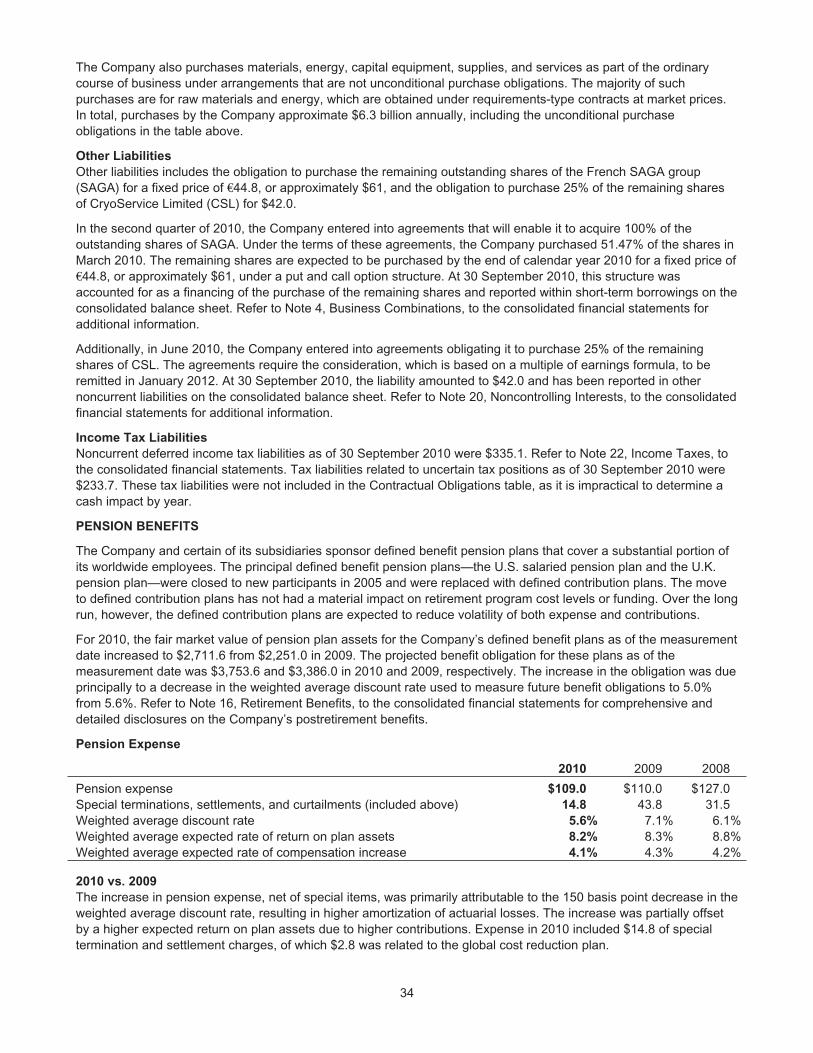
The Company also purchases materials, energy, capital equipment, supplies, and services as part of the ordinarycourse of business under arrangements that are not unconditional purchase obligations. The majority of suchpurchases are for raw materials and energy, which are obtained under requirements-type contracts at market prices.In total, purchases by the Company approximate $6.3 billion annually, including the unconditional purchaseobligations in the table above.
Other Liabilities
Other liabilities includes the obligation to purchase the remaining outstanding shares of the French SAGA group(SAGA) for a fixed price of €44.8, or approximately $61, and the obligation to purchase 25% of the remaining sharesof CryoService Limited (CSL) for $42.0.
In the second quarter of 2010, the Company entered into agreements that will enable it to acquire 100% of theoutstanding shares of SAGA. Under the terms of these agreements, the Company purchased 51.47% of the shares inMarch 2010. The remaining shares are expected to be purchased by the end of calendar year 2010 for a fixed price of€44.8, or approximately $61, under a put and call option structure. At 30 September 2010, this structure wasaccounted for as a financing of the purchase of the remaining shares and reported within short-term borrowings on theconsolidated balance sheet. Refer to Note 4, Business Combinations, to the consolidated financial statements foradditional information.
Additionally, in June 2010, the Company entered into agreements obligating it to purchase 25% of the remainingshares of CSL. The agreements require the consideration, which is based on a multiple of earnings formula, to beremitted in January 2012. At 30 September 2010, the liability amounted to $42.0 and has been reported in othernoncurrent liabilities on the consolidated balance sheet. Refer to Note 20, Noncontrolling Interests, to the consolidatedfinancial statements for additional information.
Income Tax Liabilities
Noncurrent deferred income tax liabilities as of 30 September 2010 were $335.1. Refer to Note 22, Income Taxes, tothe consolidated financial statements. Tax liabilities related to uncertain tax positions as of 30 September 2010 were$233.7. These tax liabilities were not included in the Contractual Obligations table, as it is impractical to determine acash impact by year.
PENSION BENEFITS
The Company and certain of its subsidiaries sponsor defined benefit pension plans that cover a substantial portion ofits worldwide employees. The principal defined benefit pension plans—the U.S. salaried pension plan and the U.K.pension plan—were closed to new participants in 2005 and were replaced with defined contribution plans. The moveto defined contribution plans has not had a material impact on retirement program cost levels or funding. Over the longrun, however, the defined contribution plans are expected to reduce volatility of both expense and contributions.
For 2010, the fair market value of pension plan assets for the Company’s defined benefit plans as of the measurementdate increased to $2,711.6 from $2,251.0 in 2009. The projected benefit obligation for these plans as of themeasurement date was $3,753.6 and $3,386.0 in 2010 and 2009, respectively. The increase in the obligation was dueprincipally to a decrease in the weighted average discount rate used to measure future benefit obligations to 5.0%from 5.6%. Refer to Note 16, Retirement Benefits, to the consolidated financial statements for comprehensive anddetailed disclosures on the Company’s postretirement benefits.
Pension Expense
2010 2009 2008
Pension expense $109.0 $110.0 $127.0Special terminations, settlements, and curtailments (included above) 14.8 43.8 31.5Weighted average discount rate 5.6% 7.1% 6.1%Weighted average expected rate of return on plan assets 8.2% 8.3% 8.8%Weighted average expected rate of compensation increase 4.1% 4.3% 4.2%
2010 vs. 2009
The increase in pension expense, net of special items, was primarily attributable to the 150 basis point decrease in theweighted average discount rate, resulting in higher amortization of actuarial losses. The increase was partially offsetby a higher expected return on plan assets due to higher contributions. Expense in 2010 included $14.8 of specialtermination and settlement charges, of which $2.8 was related to the global cost reduction plan.
34
2009 vs. 2008
The decrease in pension expense was primarily attributable to the 100 basis point increase in the weighted averagediscount rate. Expense in 2009 included $43.8 of special termination, settlement, and curtailment charges, of which$32.3 was related to the global cost reduction plan.
2011 Outlook
Pension expense is estimated to be approximately $122 in 2011, an increase of $27.8 from 2010, net of specialterminations and settlements. In 2011, pension expense will include approximately $94 for amortization of actuariallosses versus $66.8 in 2010. Actuarial losses of $294.8 were incurred in 2010, resulting primarily from lower discountrates. Actuarial gains/losses, in excess of certain thresholds, are amortized into pension expense over the averageremaining service lives of the employees to the extent they are not offset by future gains or losses. Future changes inthe discount rate and actual returns on plan assets, different from expected returns, would impact the actuarial gains/losses and resulting amortization in years beyond 2011.
Pension Funding
Pension funding includes both contributions to funded plans and benefit payments under unfunded plans. Withrespect to funded plans, the Company’s funding policy is that contributions, combined with appreciation and earnings,will be sufficient to pay benefits without creating unnecessary surpluses.
In addition, the Company makes contributions to satisfy all legal funding requirements while managing its capacity tobenefit from tax deductions attributable to plan contributions. The Company analyzes the liabilities and demographics ofeach plan, which help guide the level of contributions. During 2010 and 2009, the Company’s cash contributions tofunded plans and benefit payments under unfunded plans were $406.6 and $184.8, respectively. The majority of thecash contributions were voluntary.
Cash contributions to defined benefit plans, including benefit payments for unfunded plans, are estimated to beapproximately $247 in 2011. Of this amount, $200 was contributed in October 2010. Actual future contributions willdepend on future funding legislation, discount rates, investment performance, plan design, and various other factors.Refer to the Contractual Obligations discussion on page 33 for a projection of future contributions.
ENVIRONMENTAL MATTERS
The Company is subject to various environmental laws and regulations in the countries in which it has operations.Compliance with these laws and regulations results in higher capital expenditures and costs. From time to time, theCompany is involved in proceedings under the Comprehensive Environmental Response, Compensation and LiabilityAct (the federal Superfund law), similar state laws, and the Resource Conservation and Recovery Act (RCRA) relatingto the designation of certain sites for investigation and possible cleanup. The Company’s accounting policy forenvironmental expenditures is discussed in Note 1, Major Accounting Policies, to the consolidated financialstatements, and environmental loss contingencies are discussed in Note 17, Commitments and Contingencies, to theconsolidated financial statements.
The amounts charged to income from continuing operations related to environmental matters totaled $31.6, $52.5,and $49.9 in 2010, 2009, and 2008, respectively. These amounts represent an estimate of expenses for compliancewith environmental laws, remedial activities, and activities undertaken to meet internal Company standards. Futurecosts are not expected to be materially different from these amounts. The 2009 amount included a charge of $16.0 forthe Paulsboro site. Refer to Note 17, Commitments and Contingencies, to the consolidated financial statements foradditional information on this charge. The 2008 amount included revised cost estimates for several existing sites.
Although precise amounts are difficult to determine, the Company estimates that in both 2010 and 2009, it spentapproximately $6 on capital projects to control pollution. Capital expenditures to control pollution in future years areestimated to be approximately $6 in both 2011 and 2012.
The Company accrues environmental investigatory and remediation costs for identified sites when it is probable that aliability has been incurred and the amount of loss can be reasonably estimated. The potential exposure for such costsis estimated to range from $87 to a reasonably possible upper exposure of $101. The consolidated balance sheets at30 September 2010 and 2009 included an accrual of $87.0 and $95.0, respectively. The accrual for the environmentalobligations relating to the Pace, Florida; Piedmont, South Carolina; and the Paulsboro, New Jersey facilities isincluded in these amounts. Refer to Note 17, Commitments and Contingencies, to the consolidated financialstatements for further details on these facilities.
35

Actual costs to be incurred at identified sites in future periods may vary from the estimates, given inherentuncertainties in evaluating environmental exposures. Subject to the imprecision in estimating future environmentalcosts, the Company does not expect that any sum it may have to pay in connection with environmental matters inexcess of the amounts recorded or disclosed above would have a materially adverse impact on its financial position orresults of operations in any one year.
Some of the Company’s operations are within jurisdictions that have, or are developing, regulations governingemissions of greenhouse gases (GHG). These include existing and expanding coverage under the European UnionEmissions Trading Scheme; mandatory reporting and reductions at manufacturing facilities in Alberta, Canada; andmandatory reporting and anticipated constraints on GHG emissions in California and Ontario. In the U.S., regionalinitiatives have been implemented that will regulate GHG emissions from fossil fuel-driven power plants, and somefederal legislative proposals also focus on such power plants. As a large consumer of electric power, the Companycould be impacted by increased costs that may arise from such regulatory controls. In addition, federal legislation hasbeen introduced in the U.S. that would regulate GHG emissions from the Company’s hydrogen facilities and otheroperations, such as production of fluorinated gases manufactured by the Company. In addition, the U.S.Environmental Protection Agency has taken preliminary actions towards regulating GHG emissions. Increased publicawareness and concern may result in more international, U.S. federal, and/or regional requirements to reduce ormitigate the effects of GHG.
The Company may incur costs related to GHG emissions from its hydrogen facilities and other operations such asfluorinated gases production. The Company believes it will be able to mitigate some of the potential costs through itscontractual terms, but the lack of definitive legislation or regulatory requirements prevents accurate prediction of thelong-term impact on the Company. Any legislation that limits or taxes GHG emissions from Company facilities couldimpact the Company’s growth by increasing its operating costs or reducing demand for certain of its products.
Regulation of GHG may also produce new opportunities for the Company. The Company continues to developtechnologies to help its facilities and its customers lower energy consumption, improve efficiency, and loweremissions. The Company is also developing a portfolio of technologies that capture carbon dioxide from power andchemical plants before it reaches the atmosphere, enable cleaner transportation fuels, and facilitate alternate fuelsource development. In addition, the potential demand for clean coal and the Company’s carbon capture solutionscould increase demand for oxygen, one of the Company’s main products, and the Company’s proprietary technologyfor delivering low-cost oxygen.
OFF-BALANCE SHEET ARRANGEMENTS
The Company has entered into certain guarantee agreements as discussed in Note 17, Commitments andContingencies, to the consolidated financial statements. The Company is not a primary beneficiary in any materialvariable interest entity. The Company does not have any derivative instruments indexed to its own stock. TheCompany’s off-balance sheet arrangements are not reasonably likely to have a material impact on financial condition,changes in financial condition, results of operations, or liquidity.
RELATED PARTY TRANSACTIONS
The Company’s principal related parties are equity affiliates operating primarily in the industrial gas business. TheCompany did not engage in any material transactions involving related parties that included terms or other aspectsthat differ from those which would be negotiated at arm’s length with clearly independent parties.
INFLATION
The consolidated financial statements are presented in accordance with U.S. GAAP and do not fully reflect the impactof prior years’ inflation. While the U.S. inflation rate has been modest for several years, the Company operates inmany countries that experience volatility in inflation and foreign exchange rates. The ability to pass on inflationary costincreases is an uncertainty due to general economic conditions and competitive situations. It is estimated that the costof replacing the Company’s plant and equipment today is greater than its historical cost. Accordingly, depreciationexpense would be greater if the expense were stated on a current cost basis.
CRITICAL ACCOUNTING POLICIES AND ESTIMATES
Note 1, Major Accounting Policies, to the consolidated financial statements describes the Company’s majoraccounting policies. Judgments and estimates of uncertainties are required in applying the Company’s accountingpolicies in many areas. However, application of the critical accounting policies discussed below requires
36
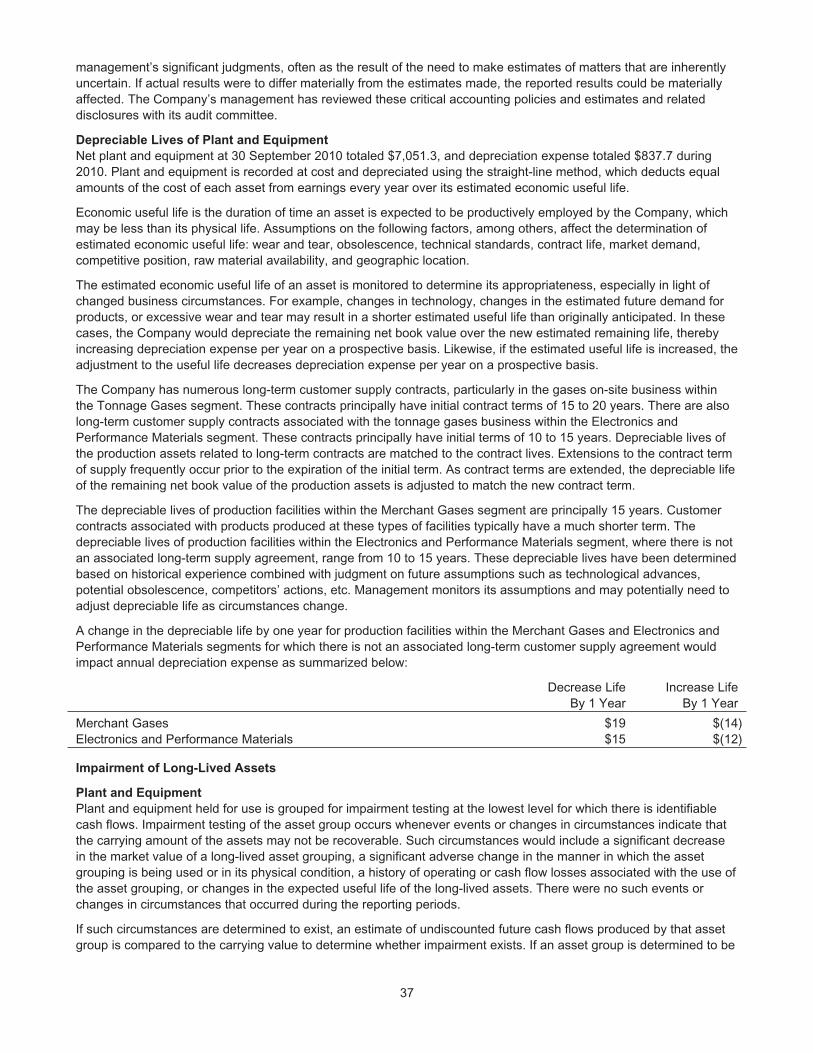
management’s significant judgments, often as the result of the need to make estimates of matters that are inherentlyuncertain. If actual results were to differ materially from the estimates made, the reported results could be materiallyaffected. The Company’s management has reviewed these critical accounting policies and estimates and relateddisclosures with its audit committee.
Depreciable Lives of Plant and Equipment
Net plant and equipment at 30 September 2010 totaled $7,051.3, and depreciation expense totaled $837.7 during2010. Plant and equipment is recorded at cost and depreciated using the straight-line method, which deducts equalamounts of the cost of each asset from earnings every year over its estimated economic useful life.
Economic useful life is the duration of time an asset is expected to be productively employed by the Company, whichmay be less than its physical life. Assumptions on the following factors, among others, affect the determination ofestimated economic useful life: wear and tear, obsolescence, technical standards, contract life, market demand,competitive position, raw material availability, and geographic location.
The estimated economic useful life of an asset is monitored to determine its appropriateness, especially in light ofchanged business circumstances. For example, changes in technology, changes in the estimated future demand forproducts, or excessive wear and tear may result in a shorter estimated useful life than originally anticipated. In thesecases, the Company would depreciate the remaining net book value over the new estimated remaining life, therebyincreasing depreciation expense per year on a prospective basis. Likewise, if the estimated useful life is increased, theadjustment to the useful life decreases depreciation expense per year on a prospective basis.
The Company has numerous long-term customer supply contracts, particularly in the gases on-site business withinthe Tonnage Gases segment. These contracts principally have initial contract terms of 15 to 20 years. There are alsolong-term customer supply contracts associated with the tonnage gases business within the Electronics andPerformance Materials segment. These contracts principally have initial terms of 10 to 15 years. Depreciable lives ofthe production assets related to long-term contracts are matched to the contract lives. Extensions to the contract termof supply frequently occur prior to the expiration of the initial term. As contract terms are extended, the depreciable lifeof the remaining net book value of the production assets is adjusted to match the new contract term.
The depreciable lives of production facilities within the Merchant Gases segment are principally 15 years. Customercontracts associated with products produced at these types of facilities typically have a much shorter term. Thedepreciable lives of production facilities within the Electronics and Performance Materials segment, where there is notan associated long-term supply agreement, range from 10 to 15 years. These depreciable lives have been determinedbased on historical experience combined with judgment on future assumptions such as technological advances,potential obsolescence, competitors’ actions, etc. Management monitors its assumptions and may potentially need toadjust depreciable life as circumstances change.
A change in the depreciable life by one year for production facilities within the Merchant Gases and Electronics andPerformance Materials segments for which there is not an associated long-term customer supply agreement wouldimpact annual depreciation expense as summarized below:
Decrease LifeBy 1 Year
Increase LifeBy 1 Year
Merchant Gases $19 $(14)Electronics and Performance Materials $15 $(12)
Impairment of Long-Lived Assets
Plant and Equipment
Plant and equipment held for use is grouped for impairment testing at the lowest level for which there is identifiablecash flows. Impairment testing of the asset group occurs whenever events or changes in circumstances indicate thatthe carrying amount of the assets may not be recoverable. Such circumstances would include a significant decreasein the market value of a long-lived asset grouping, a significant adverse change in the manner in which the assetgrouping is being used or in its physical condition, a history of operating or cash flow losses associated with the use ofthe asset grouping, or changes in the expected useful life of the long-lived assets. There were no such events orchanges in circumstances that occurred during the reporting periods.
If such circumstances are determined to exist, an estimate of undiscounted future cash flows produced by that assetgroup is compared to the carrying value to determine whether impairment exists. If an asset group is determined to be
37
impaired, the loss is measured based on the difference between the asset group’s fair value and its carrying value. Anestimate of the asset group’s fair value is based on the discounted value of its estimated cash flows. Assets to bedisposed of by sale are reported at the lower of carrying amount or fair value less cost to sell.
The assumptions underlying cash flow projections represent management’s best estimates at the time of theimpairment review. Factors that management must estimate include industry and market conditions, sales volume andprices, costs to produce, inflation, etc. Changes in key assumptions or actual conditions that differ from estimatescould result in an impairment charge. The Company uses reasonable and supportable assumptions when performingimpairment reviews and cannot predict the occurrence of future events and circumstances that could result inimpairment charges.
Goodwill
The acquisition method of accounting for business combinations currently requires the Company to make use ofestimates and judgments to allocate the purchase price paid for acquisitions to the fair value of the net tangible andidentifiable intangible assets. Goodwill represents the excess of the aggregate purchase price over the fair value ofnet assets of an acquired entity. Goodwill, including goodwill associated with equity affiliates of $60.2, was $974.8 asof 30 September 2010. The majority of the Company’s goodwill is assigned to reporting units within the MerchantGases and Electronics and Performance Materials segments. Disclosures related to goodwill are included in Note 10,Goodwill, to the consolidated financial statements.
The Company performs an impairment test annually in the fourth quarter of the fiscal year. In addition, goodwill wouldbe tested more frequently if changes in circumstances or the occurrence of events indicated that potential impairmentexists. The impairment test requires the Company to compare the fair value of business reporting units to carryingvalue, including assigned goodwill. The Company has designated its reporting units for goodwill impairment testing asone level below the operating segment for which discrete financial information is available and whose operatingresults are reviewed by segment managers regularly. Currently, the Company has four business segments and fifteenreporting units. Reporting units are primarily based on products and geographic locations within each businesssegment.
In the fourth quarter of 2010, the Company conducted the required annual test of goodwill for impairment. TheCompany determined that the fair value of each of the reporting units substantially exceeded its carrying value, andtherefore there were no indications of impairment.
The Company primarily uses an income approach valuation model, representing the present value of future cashflows, to determine fair value of a reporting unit. The Company’s valuation model uses a five-year growth period forthe business and an estimated exit trading multiple. Management has determined the income approach valuationmodel represents the most appropriate valuation methodology due to the capital intensive nature of the business,long-term contractual nature of the business, relatively consistent cash flows generated by the Company’s reportingunits, and limited comparables within the industry. The principal assumptions utilized in the Company’s incomeapproach valuation model include revenue growth rate, operating profit margins, discount rate, and exit multiple.Revenue growth rate and operating profit assumptions are consistent with those utilized in the Company’s operatingplan and long-term financial planning process. The discount rate assumption is calculated based upon an estimatedweighted-average cost of capital which includes factors such as the risk-free rate of return, cost of debt, and expectedequity premiums. The exit multiple is determined from comparable industry transactions. Also, the expected cashflows consider the customer attrition rate assumption, which is based on historical experience and current and futureexpected market conditions. Management judgment is required in the determination of each assumption utilized in thevaluation model, and actual results could differ from the estimates.
Intangible Assets
Intangible assets at 30 September 2010 totaled $285.7 and consisted primarily of customer relationships, purchasedpatents, and technology. The Company has no acquired intangible assets with indefinite lives. Intangible assets aretested for impairment as part of the long-lived asset grouping impairment tests. Impairment testing of the asset groupoccurs whenever events or changes in circumstances indicate that the carrying amount of the assets may not berecoverable. See impairment discussion above under Plant and Equipment for a description of how impairment lossesare determined.
Equity Investments
Investments in and advances to equity affiliates totaled $912.8 at 30 September 2010. The majority of the Company’sinvestments are non-publicly traded ventures with other companies in the industrial gas business. Summarized
38
financial information of equity affiliates is included in Note 8, Summarized Financial Information of Equity Affiliates, tothe consolidated financial statements. Equity investments are reviewed for impairment whenever events or changes incircumstances indicate that the carrying amount of the investment may not be recoverable.
In the event that a decline in fair value of an investment occurs, and the decline in value is considered to be other thantemporary, an impairment loss would be recognized. Management’s estimate of fair value of an investment is basedon estimated discounted future cash flows expected to be generated by the investee. Changes in key assumptionsabout the financial condition of an investee or actual conditions that differ from estimates could result in an impairmentcharge.
Income Taxes
The Company accounts for income taxes under the liability method. Under this method, deferred tax assets andliabilities are recognized for the tax effects of temporary differences between the financial reporting and tax bases ofassets and liabilities measured using the enacted tax rate. At 30 September 2010, accrued income taxes and deferredtax liabilities amounted to $73.6 and $335.1, respectively. Tax liabilities related to uncertain tax positions as of30 September 2010 were $233.7. Current and noncurrent deferred tax assets equaled $209.6 at 30 September 2010.Income tax expense was $339.5 for the year ended 30 September 2010. Management judgment is required indetermining income tax expense and the related balance sheet amounts. Judgments are required concerning theultimate outcome of tax contingencies and the realization of deferred tax assets.
Actual income taxes paid may vary from estimates, depending upon changes in income tax laws, actual results ofoperations, and the final audit of tax returns by taxing authorities. Tax assessments may arise several years after taxreturns have been filed. The Company believes that its recorded tax liabilities adequately provide for the probableoutcome of these assessments.
Deferred tax assets are recorded for operating losses and tax credit carryforwards. However, when there are notsufficient sources of future taxable income to realize the benefit of the operating losses or tax credit carryforwards,these deferred tax assets are reduced by a valuation allowance. A valuation allowance is recognized if, based on theweight of available evidence, it is considered more likely than not that some portion or all of the deferred tax asset willnot be realized. The factors used to assess the likelihood of realization include forecasted future taxable income andavailable tax planning strategies that could be implemented to realize or renew net deferred tax assets in order toavoid the potential loss of future tax benefits. The effect of a change in the valuation allowance is reported in thecurrent period tax expense.
A 1% point increase/decrease in the Company’s effective tax rate would have decreased/increased net income byapproximately $14.
Pension Benefits
The amounts recognized in the consolidated financial statements for pension benefits under the defined benefit plansare determined on an actuarial basis utilizing numerous assumptions. The discussion that follows provides informationon the significant assumptions and expense associated with the defined benefit plans.
Actuarial models are used in calculating the pension expense and liability related to the various defined benefit plans.These models have an underlying assumption that the employees render service over their service lives on arelatively consistent basis; therefore, the expense of benefits earned should follow a similar pattern.
Several assumptions and statistical variables are used in the models to calculate the expense and liability related tothe plans. The Company determines assumptions about the discount rate, the expected rate of return on plan assets,and the rate of compensation increase. Note 16, Retirement Benefits, to the consolidated financial statementsincludes disclosure of these rates on a weighted-average basis for both the domestic and international plans. Theactuarial models also use assumptions about demographic factors such as retirement age, mortality, and turnoverrates. The Company believes the actuarial assumptions are reasonable. However, actual results could vary materiallyfrom these actuarial assumptions due to economic events and different rates of retirement, mortality, and turnover.
One of the critical assumptions used in the actuarial models is the discount rate. This rate reflects the prevailingmarket rate for high-quality, fixed-income debt instruments with maturities corresponding to the expected duration ofthe benefit obligations on the annual measurement date for each of the various plans. The rate is used to discount thefuture cash flows of benefit obligations back to the measurement date. For the U.S. plans, the timing and amount ofexpected benefit cash flows are matched with an interest rate curve applicable to the returns of high quality corporatebonds over the expected benefit payment period to determine an overall effective discount rate. In making this
39

determination, the Company considers the yields on the Citigroup Pension Discount Curve and the Citigroup AboveMedian Pension Discount Curve, the general movement of interest rates, and the changes in those rates from oneperiod to the next. This rate can change from year-to-year based on market conditions that affect corporate bondyields. A higher discount rate decreases the present value of the benefit obligations and results in lower pensionexpense. A 50 basis point increase/decrease in the discount rate decreases/increases pension expense byapproximately $23 per year.
The expected rate of return on plan assets represents the average rate of return to be earned by plan assets over theperiod that the benefits included in the benefit obligation are to be paid. The expected return on plan assetsassumption is based on an estimated weighted average of long-term returns of major asset classes. In determiningasset class returns, the Company takes into account long-term returns of major asset classes, historical performanceof plan assets, and related value of active management, as well as the current interest rate environment. Assetallocation is determined by an asset/liability study that takes into account plan demographics, asset returns, andacceptable levels of risk. Lower returns on the plan assets result in higher pension expense. A 50 basis pointincrease/decrease in the estimated rate of return on plan assets decreases/increases pension expense byapproximately $14 per year.
The Company uses a market-related valuation method for recognizing investment gains or losses. Investment gains orlosses are the difference between the expected and actual return based on the market-related value of assets. Thismethod recognizes investment gains or losses over a five-year period from the year in which they occur, whichreduces year-to-year volatility. Expense in future periods will be impacted as gains or losses are recognized in themarket-related value of assets over the five-year period.
The expected rate of compensation increase is another key assumption. The Company determines this rate based onreview of the underlying long-term salary increase trend characteristic of labor markets and historical experience, aswell as comparison to peer companies. A 50 basis point increase/decrease in the expected rate of compensationincreases/decreases pension expense by approximately $12 per year.
Loss Contingencies
In the normal course of business the Company encounters contingencies, i.e., situations involving varying degrees ofuncertainty as to the outcome and effect on the Company. The Company accrues a liability for loss contingencieswhen it is considered probable that a liability has been incurred and the amount of loss can be reasonably estimated.When only a range of possible loss can be established, the most probable amount in the range is accrued. If noamount within this range is a better estimate than any other amount within the range, the minimum amount in therange is accrued.
Contingencies include those associated with litigation and environmental matters for which the Company’s accountingpolicy is discussed in Note 1, Major Accounting Policies, to the consolidated financial statements, and particulars areprovided in Note 17, Commitments and Contingencies, to the consolidated financial statements. Significant judgmentis required in both determining probability and whether the amount of loss associated with a contingency can bereasonably estimated. These determinations are made based on the best available information at the time. Asadditional information becomes available, the Company reassesses probability and estimates of loss contingencies.Revisions in the estimates associated with loss contingencies could have a significant impact on the Company’sresults of operations in the period in which an accrual for loss contingencies is recorded or adjusted. For example, dueto the inherent uncertainties related to environmental exposures, a significant increase to environmental liabilitiescould occur if a new site is designated, the scope of remediation is increased, or the Company’s proportionate share isincreased. Similarly, a future charge for regulatory fines or damage awards associated with litigation could have asignificant impact on the Company’s net income in the period in which it is recorded.
NEW ACCOUNTING GUIDANCE
See Note 2, New Accounting Guidance, to the consolidated financial statements for information concerning theCompany’s implementation and impact of new accounting guidance.
40
FORWARD-LOOKING STATEMENTS
This Management’s Discussion and Analysis contains “forward-looking statements” within the safe harbor provisionsof the Private Securities Litigation Reform Act of 1995, including projections, plans, estimates and expectationsregarding future operations, financial performance, costs and capital expenditures, projects, and applications andtechnologies. These forward-looking statements are based on management’s reasonable expectations andassumptions as of the date this Report is filed regarding important risk factors. Actual performance and financialresults may differ materially from projections and estimates expressed in the forward-looking statements because ofmany factors not anticipated by management, including, without limitation, the Company’s acquisition of Airgas Inc.pursuant to the Company’s pending tender offer; slowing of global economic recovery; renewed deterioration ineconomic and business conditions; weakening demand for the Company’s products; future financial and operatingperformance of major customers and industries served by the Company; unanticipated contract terminations orcustomer cancellations or postponement of projects and sales; asset impairments due to economic conditions orspecific product or customer events; the success of commercial negotiations; the impact of competitive products andpricing; interruption in ordinary sources of supply of raw materials; the ability to recover unanticipated increasedenergy and raw material costs from customers; costs and outcomes of litigation or regulatory activities; successfuldevelopment and market acceptance of new products and applications; the ability to attract, hire and retain qualifiedpersonnel in all regions of the world where the Company operates; consequences of acts of war or terrorism; theeffects of a natural disaster; the success of cost reduction and productivity programs; the timing, impact, and otheruncertainties of future acquisitions or divestitures, including achieving anticipated acquisition synergies; significantfluctuations in interest rates and foreign currencies from that currently anticipated; the continued availability of capitalfunding sources in all of the Company’s foreign operations; the impact of environmental, healthcare, tax or otherlegislation and regulations in jurisdictions in which the Company and its affiliates operate; the impact of new orchanged financial accounting guidance; the timing and rate at which tax credits can be utilized; and other risk factorsdescribed in Section 1A. The Company disclaims any obligation or undertaking to disseminate any updates orrevisions to any forward-looking statements contained in this document to reflect any change in the Company’sassumptions, beliefs or expectations or any change in events, conditions, or circumstances upon which any suchforward-looking statements are based.
ITEM 7A. QUANTITATIVE AND QUALITATIVE DISCLOSURES ABOUT MARKET RISK
The Company’s earnings, cash flows, and financial position are exposed to market risks relating to fluctuations ininterest rates and foreign currency exchange rates. It is the Company’s policy to minimize its cash flow exposure toadverse changes in currency exchange rates and to manage the financial risks inherent in funding with debt capital.
The Company mitigates adverse energy price impacts through its cost pass-through contracts with customers, as wellas price increases. The Company has also entered into a limited number of commodity swap contracts in order toreduce the cash flow exposure to changes in the price of natural gas relative to certain oil-based feedstocks. Therewere no commodity swap contracts outstanding at 30 September 2010.
The Company addresses these financial exposures through a controlled program of risk management that includesthe use of derivative financial instruments. Counterparties to all derivative contracts are major financial institutions,thereby minimizing the risk of credit loss. All instruments are entered into for other than trading purposes. For detailson the types and use of these derivative instruments and the major accounting policies, see Note 1, Major AccountingPolicies, and Note 13, Financial Instruments, to the consolidated financial statements for additional information.
The Company’s derivative and other financial instruments consist of long-term debt (including current portion), interestrate swaps, cross currency interest rate swaps, foreign exchange-forward contracts, foreign exchange-optioncontracts, and commodity swaps. The net market value of these financial instruments combined is referred to belowas the net financial instrument position. The net financial instrument position does not include available-for-salesecurities of $103.6 at 30 September 2010 and $19.4 at 30 September 2009 as disclosed in Note 14, Fair ValueMeasurements, to the consolidated financial statements. The available-for-sale securities in 2010 primarily includedthe investment in Airgas stock of $102.5.
At 30 September 2010 and 2009, the net financial instrument position was a liability of $4,086 and $4,510,respectively. The decrease in the net financial instrument position was due primarily to a reduction in long-term debtand the impact of a stronger U.S. dollar on the translation of foreign currency long-term debt.
The analysis below presents the sensitivity of the market value of the Company’s financial instruments to selectedchanges in market rates and prices. The range of changes chosen reflects the Company’s view of changes that are
41
reasonably possible over a one-year period. Market values are the present value of projected future cash flows basedon the market rates and prices chosen. The market values for interest rate risk and foreign currency risk arecalculated by the Company using a third-party software model that utilizes standard pricing models to determine thepresent value of the instruments based on market conditions (interest rates, spot and forward exchange rates, andimplied volatilities) as of the valuation date.
Interest Rate Risk
The Company’s debt portfolio, including swap agreements, as of 30 September 2010 primarily comprised debtdenominated in Euros (42%) and U.S. dollars (44%), including the effect of currency swaps. This debt portfolio iscomposed of 48% fixed-rate debt and 52% variable-rate debt. Changes in interest rates have different impacts on thefixed- and variable-rate portions of the Company’s debt portfolio. A change in interest rates on the fixed portion of thedebt portfolio impacts the net financial instrument position but has no impact on interest incurred or cash flows. Achange in interest rates on the variable portion of the debt portfolio impacts the interest incurred and cash flows butdoes not impact the net financial instrument position.
The sensitivity analysis related to the fixed portion of the Company’s debt portfolio assumes an instantaneous 100basis point move in interest rates from the level at 30 September 2010, with all other variables held constant. A 100basis point increase in market interest rates would result in a decrease of $87 and $92 in the net liability position offinancial instruments at 30 September 2010 and 2009, respectively. A 100 basis point decrease in market interestrates would result in an increase of $95 and $92 in the net liability position of financial instruments at30 September 2010 and 2009, respectively.
Based on the variable-rate debt included in the Company’s debt portfolio, including the interest rate swap agreements,a 100 basis point increase in interest rates would result in an additional $22 and $20 of interest incurred per year atthe end of 30 September 2010 and 2009, respectively. A 100 basis point decline in interest rates would lower interestincurred by $22 and $20 per year at 30 September 2010 and 2009, respectively.
Foreign Currency Exchange Rate Risk
The sensitivity analysis assumes an instantaneous 10% change in the foreign currency exchange rates from theirlevels at 30 September 2010 and 2009, with all other variables held constant. A 10% strengthening or weakening ofthe functional currency of an entity versus all other currencies would result in a decrease or increase, respectively, of$345 and $369 in the net liability position of financial instruments at 30 September 2010 and 2009, respectively.
The primary currencies for which the Company has exchange rate exposure are the U.S. dollar versus the Euro andthe U.S. dollar versus the Pound Sterling. Foreign currency debt, cross currency interest rate swaps, and foreignexchange-forward contracts are used in countries where the Company does business, thereby reducing its net assetexposure. Foreign exchange-forward contracts are also used to hedge the Company’s firm and highly anticipatedforeign currency cash flows, along with foreign exchange-option contracts. Thus, there is either an asset/liability orcash flow exposure related to all of the financial instruments in the above sensitivity analysis for which the impact of amovement in exchange rates would be in the opposite direction and materially equal (or more favorable in the case ofpurchased foreign exchange-option contracts) to the impact on the instruments in the analysis.
42
ITEM 8. FINANCIAL STATEMENTS AND SUPPLEMENTARY DATA
MANAGEMENT’S REPORT ON INTERNAL CONTROL OVER FINANCIAL REPORTING
Air Products’ management is responsible for establishing and maintaining adequate internal control over financialreporting. Our internal control over financial reporting, which is defined in the following sentences, is a processdesigned to provide reasonable assurance regarding the reliability of our financial reporting and the preparation offinancial statements for external purposes in accordance with U.S. generally accepted accounting principles andincludes those policies and procedures that:
(i) pertain to the maintenance of records that, in reasonable detail, accurately and fairly reflect the transactions anddispositions of the assets of the Company;
(ii) provide reasonable assurance that the transactions are recorded as necessary to permit preparation of financialstatements in accordance with U.S. generally accepted accounting principles, and that receipts and expendituresof the Company are being made only in accordance with authorizations of management and directors of theCompany; and
(iii) provide reasonable assurance regarding prevention or timely detection of unauthorized acquisition, use ordisposition of the Company’s assets that could have a material effect on the financial statements.
Because of inherent limitations, internal control over financial reporting can only provide reasonable assurance andmay not prevent or detect misstatements. Further, because of changes in conditions, the effectiveness of our internalcontrol over financial reporting may vary over time. Our processes contain self-monitoring mechanisms, and actionsare taken to correct deficiencies as they are identified.
Management has evaluated the effectiveness of its internal control over financial reporting based on the framework inInternal Control—Integrated Framework issued by the Committee of Sponsoring Organizations of the TreadwayCommission (COSO). Based on this evaluation, management concluded that, as of 30 September 2010, theCompany’s internal control over financial reporting was effective.
KPMG LLP, an independent registered public accounting firm, has issued their opinion on the Company’s internalcontrol over financial reporting as of 30 September 2010 as stated in their report which appears herein.
/s/ John E. McGlade /s/ Paul E. Huck
John E. McGlade Paul E. HuckChairman, President, and Senior Vice President and
Chief Executive Officer Chief Financial Officer23 November 2010 23 November 2010
43
REPORT OF INDEPENDENT REGISTERED PUBLIC ACCOUNTING FIRM
The Board of Directors and Shareholders of Air Products and Chemicals, Inc.:
We have audited the accompanying consolidated balance sheets of Air Products and Chemicals, Inc. andSubsidiaries (the Company) as of 30 September 2010 and 2009, and the related consolidated income statements andconsolidated statements of equity and cash flows for each of the years in the three-year period ended 30 September2010. In connection with our audits of the consolidated financial statements, we also have audited the financialstatement schedule referred to in item 15(a)(2) in this Form 10-K. We also have audited the Company’s internalcontrol over financial reporting as of 30 September 2010, based on criteria established in Internal Control—IntegratedFramework issued by the Committee of Sponsoring Organizations of the Treadway Commission. The Company’smanagement is responsible for these consolidated financial statements and financial statement schedule, formaintaining effective internal control over financial reporting, and for its assessment of the effectiveness of internalcontrol over financial reporting, included in the accompanying “Management’s Report on Internal Control overFinancial Reporting.” Our responsibility is to express an opinion on these consolidated financial statements andfinancial statement schedule and an opinion on the Company’s internal control over financial reporting based on ouraudits.
We conducted our audits in accordance with the standards of the Public Company Accounting Oversight Board(United States). Those standards require that we plan and perform the audits to obtain reasonable assurance aboutwhether the financial statements are free of material misstatement and whether effective internal control over financialreporting was maintained in all material respects. Our audits of the consolidated financial statements includedexamining, on a test basis, evidence supporting the amounts and disclosures in the financial statements, assessingthe accounting principles used and significant estimates made by management, and evaluating the overall financialstatement presentation. Our audit of internal control over financial reporting included obtaining an understanding ofinternal control over financial reporting, assessing the risk that a material weakness exists, and testing and evaluatingthe design and operating effectiveness of internal control based on the assessed risk. Our audits also includedperforming such other procedures as we considered necessary in the circumstances. We believe that our auditsprovide a reasonable basis for our opinions.
A company’s internal control over financial reporting is a process designed to provide reasonable assurance regardingthe reliability of financial reporting and the preparation of financial statements for external purposes in accordance withgenerally accepted accounting principles. A company’s internal control over financial reporting includes those policiesand procedures that (1) pertain to the maintenance of records that, in reasonable detail, accurately and fairly reflectthe transactions and dispositions of the assets of the company; (2) provide reasonable assurance that transactionsare recorded as necessary to permit preparation of financial statements in accordance with generally acceptedaccounting principles, and that receipts and expenditures of the company are being made only in accordance withauthorizations of management and directors of the company; and (3) provide reasonable assurance regardingprevention or timely detection of unauthorized acquisition, use, or disposition of the company’s assets that could havea material effect on the financial statements.
Because of its inherent limitations, internal control over financial reporting may not prevent or detect misstatements.Also, projections of any evaluation of effectiveness to future periods are subject to the risk that controls may becomeinadequate because of changes in conditions, or that the degree of compliance with the policies or procedures maydeteriorate.
In our opinion, the consolidated financial statements referred to above present fairly, in all material respects, thefinancial position of Air Products and Chemicals, Inc. and Subsidiaries as of 30 September 2010 and 2009, and theresults of their operations and their cash flows for each of the years in the three-year period ended 30 September2010, in conformity with U.S. generally accepted accounting principles. Also in our opinion, the related financialstatement schedule, when considered in relation to the basic consolidated financial statements taken as a whole,presents fairly, in all material respects, the information set forth therein. Also in our opinion, Air Products andChemicals, Inc. and Subsidiaries maintained, in all material respects, effective internal control over financial reportingas of 30 September 2010, based on criteria established in Internal Control—Integrated Framework issued by theCommittee of Sponsoring Organizations of the Treadway Commission.
/s/ KPMG LLPPhiladelphia, Pennsylvania23 November 2010
44
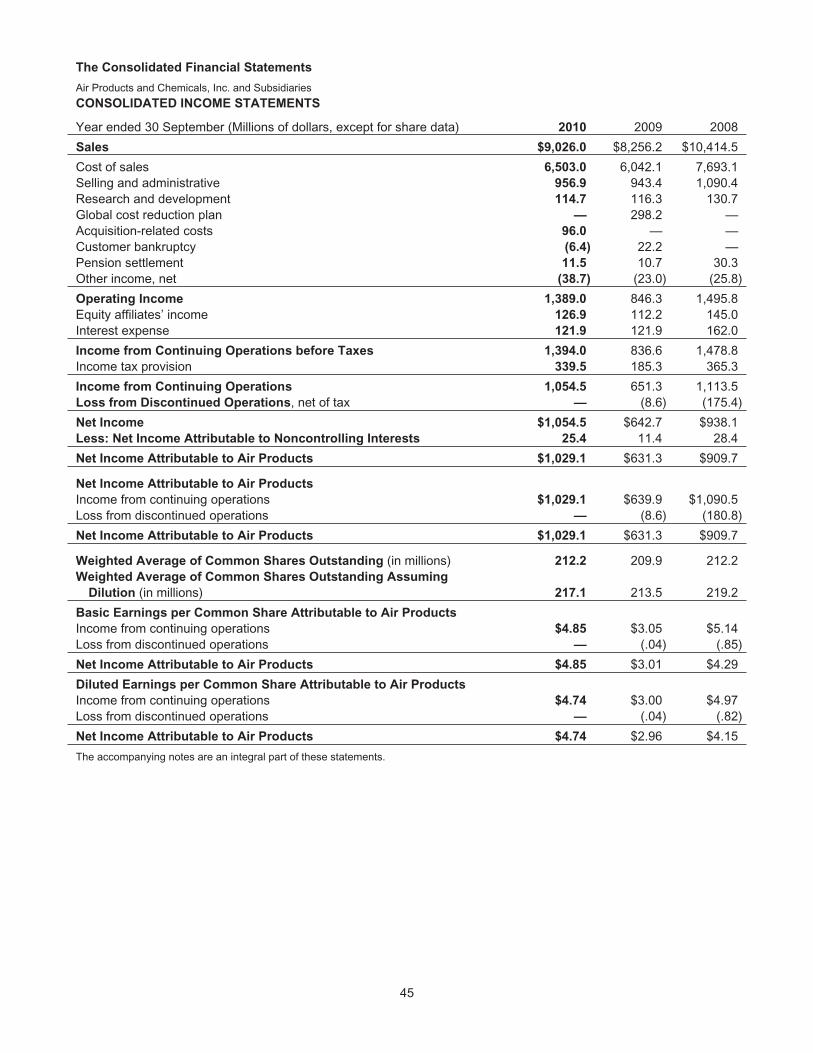
The Consolidated Financial Statements
Air Products and Chemicals, Inc. and Subsidiaries
CONSOLIDATED INCOME STATEMENTS
Year ended 30 September (Millions of dollars, except for share data) 2010 2009 2008
Sales $9,026.0 $8,256.2 $10,414.5
Cost of sales 6,503.0 6,042.1 7,693.1Selling and administrative 956.9 943.4 1,090.4Research and development 114.7 116.3 130.7Global cost reduction plan — 298.2 —Acquisition-related costs 96.0 — —Customer bankruptcy (6.4) 22.2 —Pension settlement 11.5 10.7 30.3Other income, net (38.7) (23.0) (25.8)
Operating Income 1,389.0 846.3 1,495.8Equity affiliates’ income 126.9 112.2 145.0Interest expense 121.9 121.9 162.0
Income from Continuing Operations before Taxes 1,394.0 836.6 1,478.8Income tax provision 339.5 185.3 365.3
Income from Continuing Operations 1,054.5 651.3 1,113.5Loss from Discontinued Operations, net of tax — (8.6) (175.4)
Net Income $1,054.5 $642.7 $938.1Less: Net Income Attributable to Noncontrolling Interests 25.4 11.4 28.4
Net Income Attributable to Air Products $1,029.1 $631.3 $909.7
Net Income Attributable to Air Products
Income from continuing operations $1,029.1 $639.9 $1,090.5Loss from discontinued operations — (8.6) (180.8)
Net Income Attributable to Air Products $1,029.1 $631.3 $909.7
Weighted Average of Common Shares Outstanding (in millions) 212.2 209.9 212.2Weighted Average of Common Shares Outstanding Assuming
Dilution (in millions) 217.1 213.5 219.2
Basic Earnings per Common Share Attributable to Air Products
Income from continuing operations $4.85 $3.05 $5.14Loss from discontinued operations — (.04) (.85)
Net Income Attributable to Air Products $4.85 $3.01 $4.29
Diluted Earnings per Common Share Attributable to Air Products
Income from continuing operations $4.74 $3.00 $4.97Loss from discontinued operations — (.04) (.82)
Net Income Attributable to Air Products $4.74 $2.96 $4.15
The accompanying notes are an integral part of these statements.
45
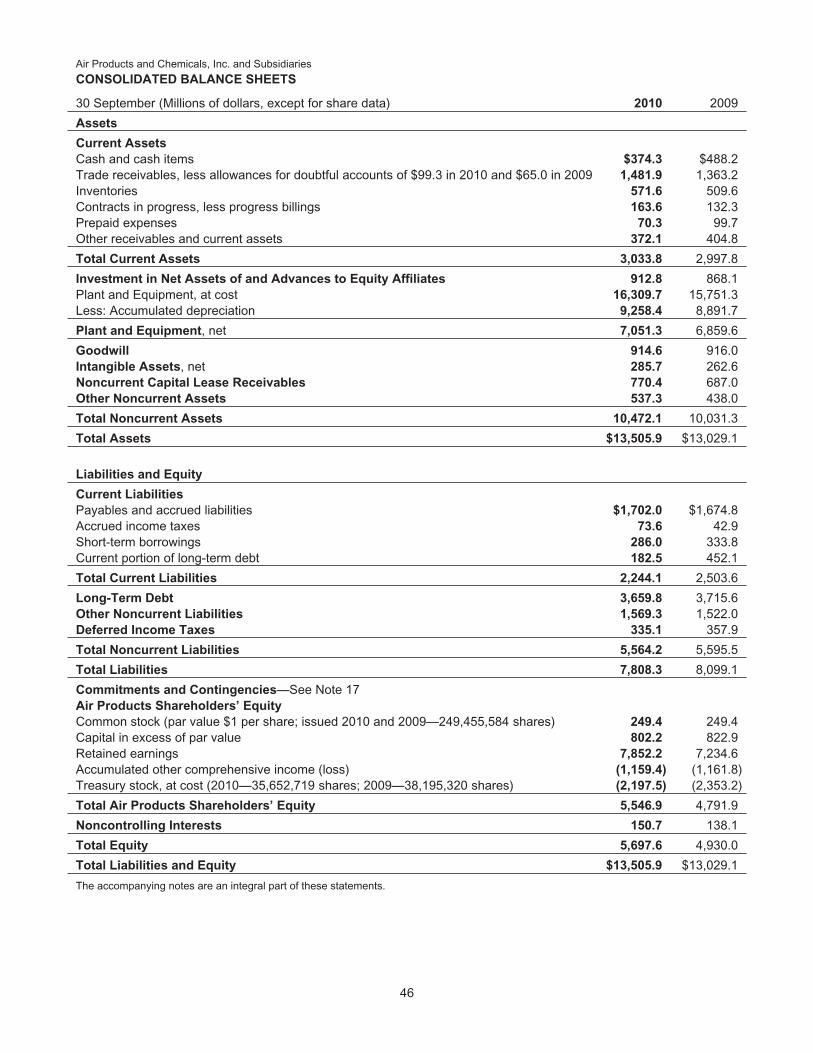
Air Products and Chemicals, Inc. and Subsidiaries
CONSOLIDATED BALANCE SHEETS
30 September (Millions of dollars, except for share data) 2010 2009
Assets
Current Assets
Cash and cash items $374.3 $488.2Trade receivables, less allowances for doubtful accounts of $99.3 in 2010 and $65.0 in 2009 1,481.9 1,363.2Inventories 571.6 509.6Contracts in progress, less progress billings 163.6 132.3Prepaid expenses 70.3 99.7Other receivables and current assets 372.1 404.8
Total Current Assets 3,033.8 2,997.8
Investment in Net Assets of and Advances to Equity Affiliates 912.8 868.1Plant and Equipment, at cost 16,309.7 15,751.3Less: Accumulated depreciation 9,258.4 8,891.7
Plant and Equipment, net 7,051.3 6,859.6
Goodwill 914.6 916.0Intangible Assets, net 285.7 262.6Noncurrent Capital Lease Receivables 770.4 687.0Other Noncurrent Assets 537.3 438.0
Total Noncurrent Assets 10,472.1 10,031.3
Total Assets $13,505.9 $13,029.1
Liabilities and Equity
Current Liabilities
Payables and accrued liabilities $1,702.0 $1,674.8Accrued income taxes 73.6 42.9Short-term borrowings 286.0 333.8Current portion of long-term debt 182.5 452.1
Total Current Liabilities 2,244.1 2,503.6
Long-Term Debt 3,659.8 3,715.6Other Noncurrent Liabilities 1,569.3 1,522.0Deferred Income Taxes 335.1 357.9
Total Noncurrent Liabilities 5,564.2 5,595.5
Total Liabilities 7,808.3 8,099.1
Commitments and Contingencies—See Note 17Air Products Shareholders’ Equity
Common stock (par value $1 per share; issued 2010 and 2009—249,455,584 shares) 249.4 249.4Capital in excess of par value 802.2 822.9Retained earnings 7,852.2 7,234.6Accumulated other comprehensive income (loss) (1,159.4) (1,161.8)Treasury stock, at cost (2010—35,652,719 shares; 2009—38,195,320 shares) (2,197.5) (2,353.2)
Total Air Products Shareholders’ Equity 5,546.9 4,791.9
Noncontrolling Interests 150.7 138.1
Total Equity 5,697.6 4,930.0
Total Liabilities and Equity $13,505.9 $13,029.1
The accompanying notes are an integral part of these statements.
46
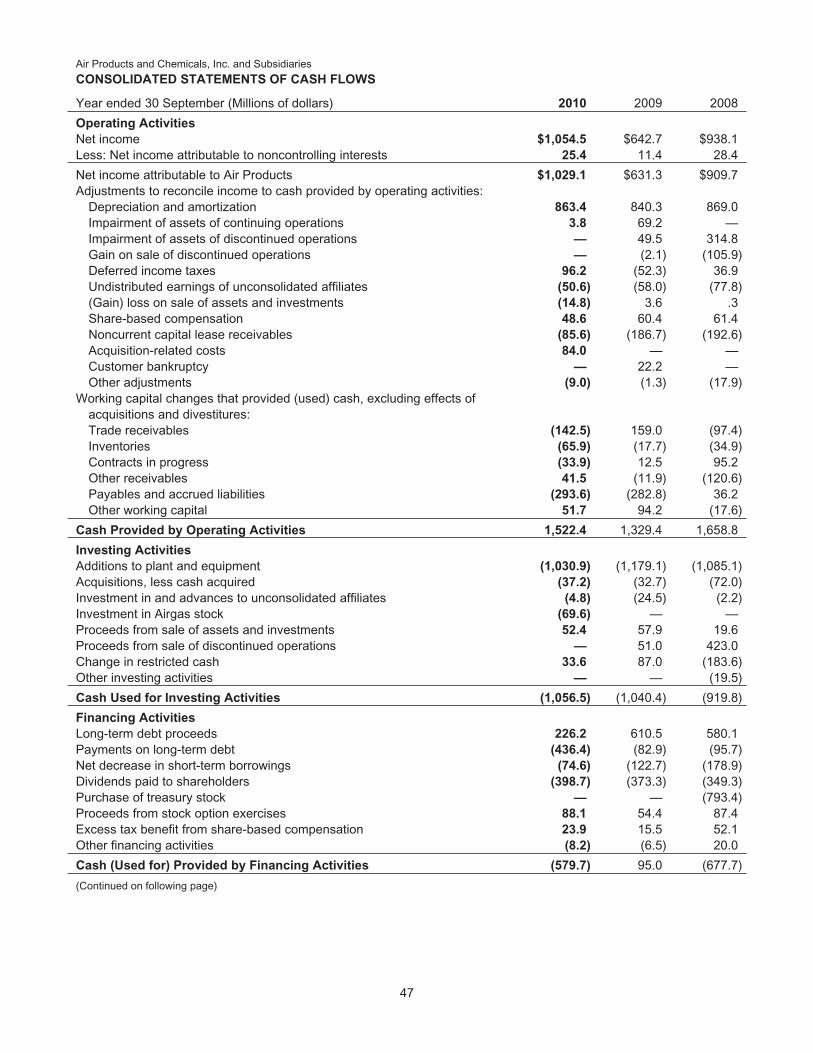
Air Products and Chemicals, Inc. and Subsidiaries
CONSOLIDATED STATEMENTS OF CASH FLOWS
Year ended 30 September (Millions of dollars) 2010 2009 2008
Operating Activities
Net income $1,054.5 $642.7 $938.1Less: Net income attributable to noncontrolling interests 25.4 11.4 28.4
Net income attributable to Air Products $1,029.1 $631.3 $909.7Adjustments to reconcile income to cash provided by operating activities:
Depreciation and amortization 863.4 840.3 869.0Impairment of assets of continuing operations 3.8 69.2 —Impairment of assets of discontinued operations — 49.5 314.8Gain on sale of discontinued operations — (2.1) (105.9)Deferred income taxes 96.2 (52.3) 36.9Undistributed earnings of unconsolidated affiliates (50.6) (58.0) (77.8)(Gain) loss on sale of assets and investments (14.8) 3.6 .3Share-based compensation 48.6 60.4 61.4Noncurrent capital lease receivables (85.6) (186.7) (192.6)Acquisition-related costs 84.0 — —Customer bankruptcy — 22.2 —Other adjustments (9.0) (1.3) (17.9)
Working capital changes that provided (used) cash, excluding effects ofacquisitions and divestitures:Trade receivables (142.5) 159.0 (97.4)Inventories (65.9) (17.7) (34.9)Contracts in progress (33.9) 12.5 95.2Other receivables 41.5 (11.9) (120.6)Payables and accrued liabilities (293.6) (282.8) 36.2Other working capital 51.7 94.2 (17.6)
Cash Provided by Operating Activities 1,522.4 1,329.4 1,658.8
Investing Activities
Additions to plant and equipment (1,030.9) (1,179.1) (1,085.1)Acquisitions, less cash acquired (37.2) (32.7) (72.0)Investment in and advances to unconsolidated affiliates (4.8) (24.5) (2.2)Investment in Airgas stock (69.6) — —Proceeds from sale of assets and investments 52.4 57.9 19.6Proceeds from sale of discontinued operations — 51.0 423.0Change in restricted cash 33.6 87.0 (183.6)Other investing activities — — (19.5)
Cash Used for Investing Activities (1,056.5) (1,040.4) (919.8)
Financing Activities
Long-term debt proceeds 226.2 610.5 580.1Payments on long-term debt (436.4) (82.9) (95.7)Net decrease in short-term borrowings (74.6) (122.7) (178.9)Dividends paid to shareholders (398.7) (373.3) (349.3)Purchase of treasury stock — — (793.4)Proceeds from stock option exercises 88.1 54.4 87.4Excess tax benefit from share-based compensation 23.9 15.5 52.1Other financing activities (8.2) (6.5) 20.0
Cash (Used for) Provided by Financing Activities (579.7) 95.0 (677.7)
(Continued on following page)
47

Air Products and Chemicals, Inc. and Subsidiaries
CONSOLIDATED STATEMENTS OF CASH FLOWS (continued)
Year ended 30 September (Millions of dollars) 2010 2009 2008
Effect of Exchange Rate Changes on Cash (.1) .7 1.7
(Decrease) Increase in Cash and Cash Items (113.9) 384.7 63.0Cash and Cash Items—Beginning of Year 488.2 103.5 40.5
Cash and Cash Items—End of Year $374.3 $488.2 $103.5
Supplemental Cash Flow Information
Significant noncash transactionsShort-term borrowings associated with SAGA acquisition $60.9 $— $—Noncurrent liability related to the purchase of shares from
noncontrolling interests 42.0 — —Cash paid for interest and taxes
Interest (net of amounts capitalized) 126.9 127.6 159.5Taxes (net of refunds) 192.0 124.5 237.2
The accompanying notes are an integral part of these statements.
48
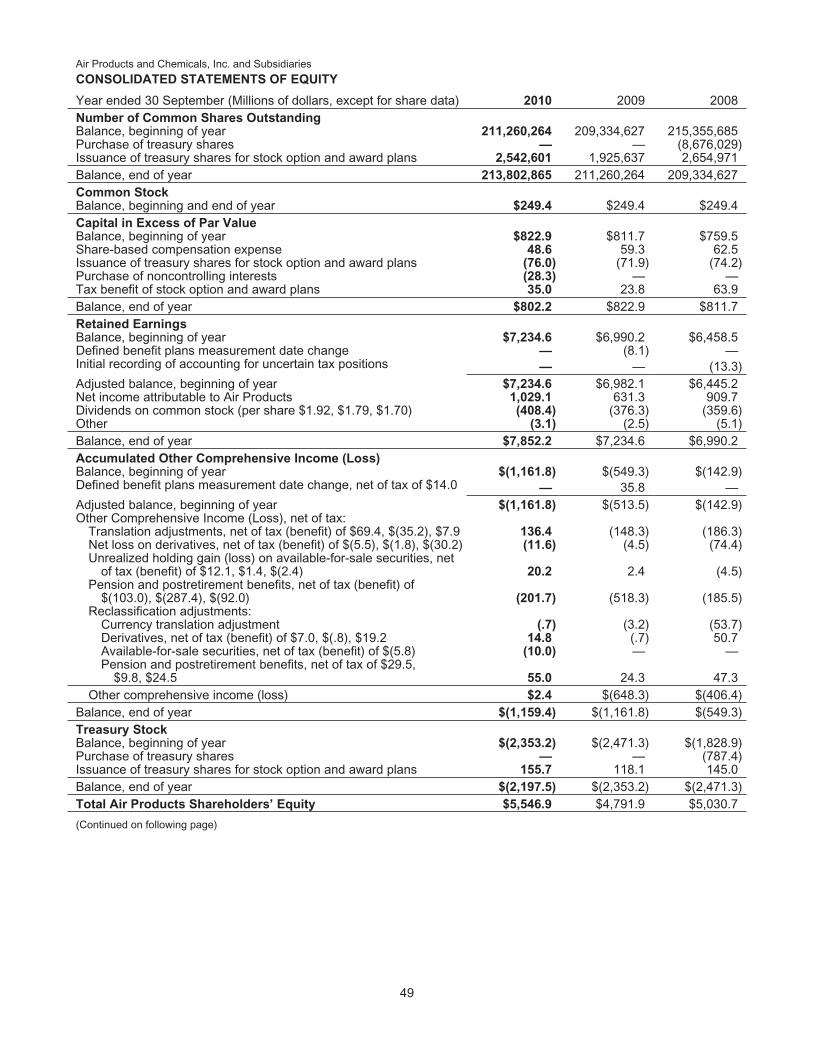
Air Products and Chemicals, Inc. and Subsidiaries
CONSOLIDATED STATEMENTS OF EQUITY
Year ended 30 September (Millions of dollars, except for share data) 2010 2009 2008Number of Common Shares OutstandingBalance, beginning of year 211,260,264 209,334,627 215,355,685Purchase of treasury shares — — (8,676,029)Issuance of treasury shares for stock option and award plans 2,542,601 1,925,637 2,654,971Balance, end of year 213,802,865 211,260,264 209,334,627Common StockBalance, beginning and end of year $249.4 $249.4 $249.4Capital in Excess of Par ValueBalance, beginning of year $822.9 $811.7 $759.5Share-based compensation expense 48.6 59.3 62.5Issuance of treasury shares for stock option and award plans (76.0) (71.9) (74.2)Purchase of noncontrolling interests (28.3) — —Tax benefit of stock option and award plans 35.0 23.8 63.9Balance, end of year $802.2 $822.9 $811.7Retained EarningsBalance, beginning of year $7,234.6 $6,990.2 $6,458.5Defined benefit plans measurement date change — (8.1) —Initial recording of accounting for uncertain tax positions — — (13.3)Adjusted balance, beginning of year $7,234.6 $6,982.1 $6,445.2Net income attributable to Air Products 1,029.1 631.3 909.7Dividends on common stock (per share $1.92, $1.79, $1.70) (408.4) (376.3) (359.6)Other (3.1) (2.5) (5.1)Balance, end of year $7,852.2 $7,234.6 $6,990.2Accumulated Other Comprehensive Income (Loss)Balance, beginning of year $(1,161.8) $(549.3) $(142.9)Defined benefit plans measurement date change, net of tax of $14.0 — 35.8 —Adjusted balance, beginning of year $(1,161.8) $(513.5) $(142.9)Other Comprehensive Income (Loss), net of tax:
Translation adjustments, net of tax (benefit) of $69.4, $(35.2), $7.9 136.4 (148.3) (186.3)Net loss on derivatives, net of tax (benefit) of $(5.5), $(1.8), $(30.2) (11.6) (4.5) (74.4)Unrealized holding gain (loss) on available-for-sale securities, net
of tax (benefit) of $12.1, $1.4, $(2.4) 20.2 2.4 (4.5)Pension and postretirement benefits, net of tax (benefit) of
$(103.0), $(287.4), $(92.0) (201.7) (518.3) (185.5)Reclassification adjustments:
Currency translation adjustment (.7) (3.2) (53.7)Derivatives, net of tax (benefit) of $7.0, $(.8), $19.2 14.8 (.7) 50.7Available-for-sale securities, net of tax (benefit) of $(5.8) (10.0) — —Pension and postretirement benefits, net of tax of $29.5,
$9.8, $24.5 55.0 24.3 47.3Other comprehensive income (loss) $2.4 $(648.3) $(406.4)
Balance, end of year $(1,159.4) $(1,161.8) $(549.3)Treasury StockBalance, beginning of year $(2,353.2) $(2,471.3) $(1,828.9)Purchase of treasury shares — — (787.4)Issuance of treasury shares for stock option and award plans 155.7 118.1 145.0Balance, end of year $(2,197.5) $(2,353.2) $(2,471.3)Total Air Products Shareholders’ Equity $5,546.9 $4,791.9 $5,030.7
(Continued on following page)
49
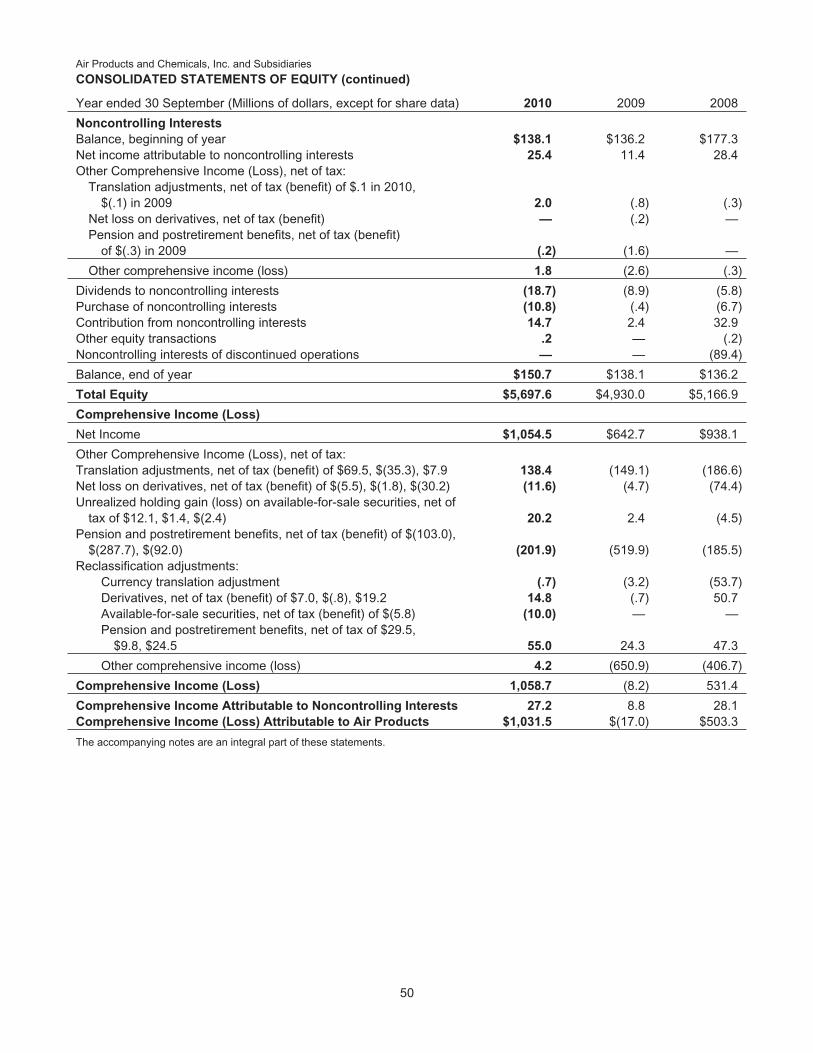
Air Products and Chemicals, Inc. and Subsidiaries
CONSOLIDATED STATEMENTS OF EQUITY (continued)
Year ended 30 September (Millions of dollars, except for share data) 2010 2009 2008
Noncontrolling Interests
Balance, beginning of year $138.1 $136.2 $177.3Net income attributable to noncontrolling interests 25.4 11.4 28.4Other Comprehensive Income (Loss), net of tax:
Translation adjustments, net of tax (benefit) of $.1 in 2010,$(.1) in 2009 2.0 (.8) (.3)
Net loss on derivatives, net of tax (benefit) — (.2) —Pension and postretirement benefits, net of tax (benefit)
of $(.3) in 2009 (.2) (1.6) —
Other comprehensive income (loss) 1.8 (2.6) (.3)
Dividends to noncontrolling interests (18.7) (8.9) (5.8)Purchase of noncontrolling interests (10.8) (.4) (6.7)Contribution from noncontrolling interests 14.7 2.4 32.9Other equity transactions .2 — (.2)Noncontrolling interests of discontinued operations — — (89.4)
Balance, end of year $150.7 $138.1 $136.2
Total Equity $5,697.6 $4,930.0 $5,166.9
Comprehensive Income (Loss)
Net Income $1,054.5 $642.7 $938.1
Other Comprehensive Income (Loss), net of tax:Translation adjustments, net of tax (benefit) of $69.5, $(35.3), $7.9 138.4 (149.1) (186.6)Net loss on derivatives, net of tax (benefit) of $(5.5), $(1.8), $(30.2) (11.6) (4.7) (74.4)Unrealized holding gain (loss) on available-for-sale securities, net of
tax of $12.1, $1.4, $(2.4) 20.2 2.4 (4.5)Pension and postretirement benefits, net of tax (benefit) of $(103.0),
$(287.7), $(92.0) (201.9) (519.9) (185.5)Reclassification adjustments:
Currency translation adjustment (.7) (3.2) (53.7)Derivatives, net of tax (benefit) of $7.0, $(.8), $19.2 14.8 (.7) 50.7Available-for-sale securities, net of tax (benefit) of $(5.8) (10.0) — —Pension and postretirement benefits, net of tax of $29.5,
$9.8, $24.5 55.0 24.3 47.3
Other comprehensive income (loss) 4.2 (650.9) (406.7)
Comprehensive Income (Loss) 1,058.7 (8.2) 531.4
Comprehensive Income Attributable to Noncontrolling Interests 27.2 8.8 28.1Comprehensive Income (Loss) Attributable to Air Products $1,031.5 $(17.0) $503.3
The accompanying notes are an integral part of these statements.
50

Notes to the Consolidated Financial Statements
(Millions of dollars, except for share data)
1. Major Accounting Policies . . . . . . . . . . . . . . . . . . . . . . . . . . . . . . . . . . . . . . . . . . . . . . . . . . . . . . . . . . . . . . . . . . . . . 512. New Accounting Guidance . . . . . . . . . . . . . . . . . . . . . . . . . . . . . . . . . . . . . . . . . . . . . . . . . . . . . . . . . . . . . . . . . . . . . 563. Airgas Transaction . . . . . . . . . . . . . . . . . . . . . . . . . . . . . . . . . . . . . . . . . . . . . . . . . . . . . . . . . . . . . . . . . . . . . . . . . . . 584. Business Combinations . . . . . . . . . . . . . . . . . . . . . . . . . . . . . . . . . . . . . . . . . . . . . . . . . . . . . . . . . . . . . . . . . . . . . . . 585. Global Cost Reduction Plan . . . . . . . . . . . . . . . . . . . . . . . . . . . . . . . . . . . . . . . . . . . . . . . . . . . . . . . . . . . . . . . . . . . . 596. Discontinued Operations . . . . . . . . . . . . . . . . . . . . . . . . . . . . . . . . . . . . . . . . . . . . . . . . . . . . . . . . . . . . . . . . . . . . . . 607. Inventories . . . . . . . . . . . . . . . . . . . . . . . . . . . . . . . . . . . . . . . . . . . . . . . . . . . . . . . . . . . . . . . . . . . . . . . . . . . . . . . . . . 638. Summarized Financial Information of Equity Affiliates . . . . . . . . . . . . . . . . . . . . . . . . . . . . . . . . . . . . . . . . . . . . . . . 639. Plant and Equipment . . . . . . . . . . . . . . . . . . . . . . . . . . . . . . . . . . . . . . . . . . . . . . . . . . . . . . . . . . . . . . . . . . . . . . . . . 64
10. Goodwill . . . . . . . . . . . . . . . . . . . . . . . . . . . . . . . . . . . . . . . . . . . . . . . . . . . . . . . . . . . . . . . . . . . . . . . . . . . . . . . . . . . . 6411. Intangible Assets . . . . . . . . . . . . . . . . . . . . . . . . . . . . . . . . . . . . . . . . . . . . . . . . . . . . . . . . . . . . . . . . . . . . . . . . . . . . . 6512. Leases . . . . . . . . . . . . . . . . . . . . . . . . . . . . . . . . . . . . . . . . . . . . . . . . . . . . . . . . . . . . . . . . . . . . . . . . . . . . . . . . . . . . . 6513. Financial Instruments . . . . . . . . . . . . . . . . . . . . . . . . . . . . . . . . . . . . . . . . . . . . . . . . . . . . . . . . . . . . . . . . . . . . . . . . . 6614. Fair Value Measurements . . . . . . . . . . . . . . . . . . . . . . . . . . . . . . . . . . . . . . . . . . . . . . . . . . . . . . . . . . . . . . . . . . . . . 6915. Debt . . . . . . . . . . . . . . . . . . . . . . . . . . . . . . . . . . . . . . . . . . . . . . . . . . . . . . . . . . . . . . . . . . . . . . . . . . . . . . . . . . . . . . . 7116. Retirement Benefits . . . . . . . . . . . . . . . . . . . . . . . . . . . . . . . . . . . . . . . . . . . . . . . . . . . . . . . . . . . . . . . . . . . . . . . . . . 7317. Commitments and Contingencies . . . . . . . . . . . . . . . . . . . . . . . . . . . . . . . . . . . . . . . . . . . . . . . . . . . . . . . . . . . . . . . 8018. Capital Stock . . . . . . . . . . . . . . . . . . . . . . . . . . . . . . . . . . . . . . . . . . . . . . . . . . . . . . . . . . . . . . . . . . . . . . . . . . . . . . . . 8319. Share-Based Compensation . . . . . . . . . . . . . . . . . . . . . . . . . . . . . . . . . . . . . . . . . . . . . . . . . . . . . . . . . . . . . . . . . . . 8320. Noncontrolling Interests . . . . . . . . . . . . . . . . . . . . . . . . . . . . . . . . . . . . . . . . . . . . . . . . . . . . . . . . . . . . . . . . . . . . . . . 8521. Earnings per Share . . . . . . . . . . . . . . . . . . . . . . . . . . . . . . . . . . . . . . . . . . . . . . . . . . . . . . . . . . . . . . . . . . . . . . . . . . . 8622. Income Taxes . . . . . . . . . . . . . . . . . . . . . . . . . . . . . . . . . . . . . . . . . . . . . . . . . . . . . . . . . . . . . . . . . . . . . . . . . . . . . . . 8623. Supplemental Information . . . . . . . . . . . . . . . . . . . . . . . . . . . . . . . . . . . . . . . . . . . . . . . . . . . . . . . . . . . . . . . . . . . . . 8924. Summary by Quarter (Unaudited) . . . . . . . . . . . . . . . . . . . . . . . . . . . . . . . . . . . . . . . . . . . . . . . . . . . . . . . . . . . . . . . 9125. Business Segment and Geographic Information . . . . . . . . . . . . . . . . . . . . . . . . . . . . . . . . . . . . . . . . . . . . . . . . . . . 92
1. Major Accounting Policies
Consolidation Principles
The consolidated financial statements include the accounts of Air Products and Chemicals, Inc. and those of itscontrolled subsidiaries (the Company or Air Products), which are generally majority owned. Intercompany transactionsand balances are eliminated in consolidation.
The Company consolidates all entities that it controls. The general condition for control is ownership of a majority ofthe voting interests of an entity. Control may also exist in arrangements where the Company is the primary beneficiaryof a variable interest entity. An entity that will absorb the majority of a variable interest entity’s expected losses orexpected residual returns is considered a primary beneficiary of that entity. The Company has determined that it is nota primary beneficiary in any material variable interest entity.
Estimates and Assumptions
The preparation of the financial statements in accordance with U.S. generally accepted accounting principles requiresmanagement to make estimates and assumptions that affect the reported amounts of assets and liabilities anddisclosure of contingent assets and liabilities at the date of the consolidated financial statements and the reportedamounts of revenues and expenses during the reporting period. Actual results could differ from those estimates.
Revenue Recognition
Revenue from product sales is recognized as risk and title to the product transfers to the customer (which generallyoccurs at the time shipment is made), the sales price is fixed or determinable, and collectibility is reasonably assured.Sales returns and allowances are not a business practice in the industry.
Revenues from equipment sale contracts are recorded primarily using the percentage-of-completion method. Underthis method, revenues from the sale of major equipment, such as liquefied natural gas (LNG) heat exchangers andlarge air separation units, are recognized primarily based on labor hours incurred to date compared with total
51
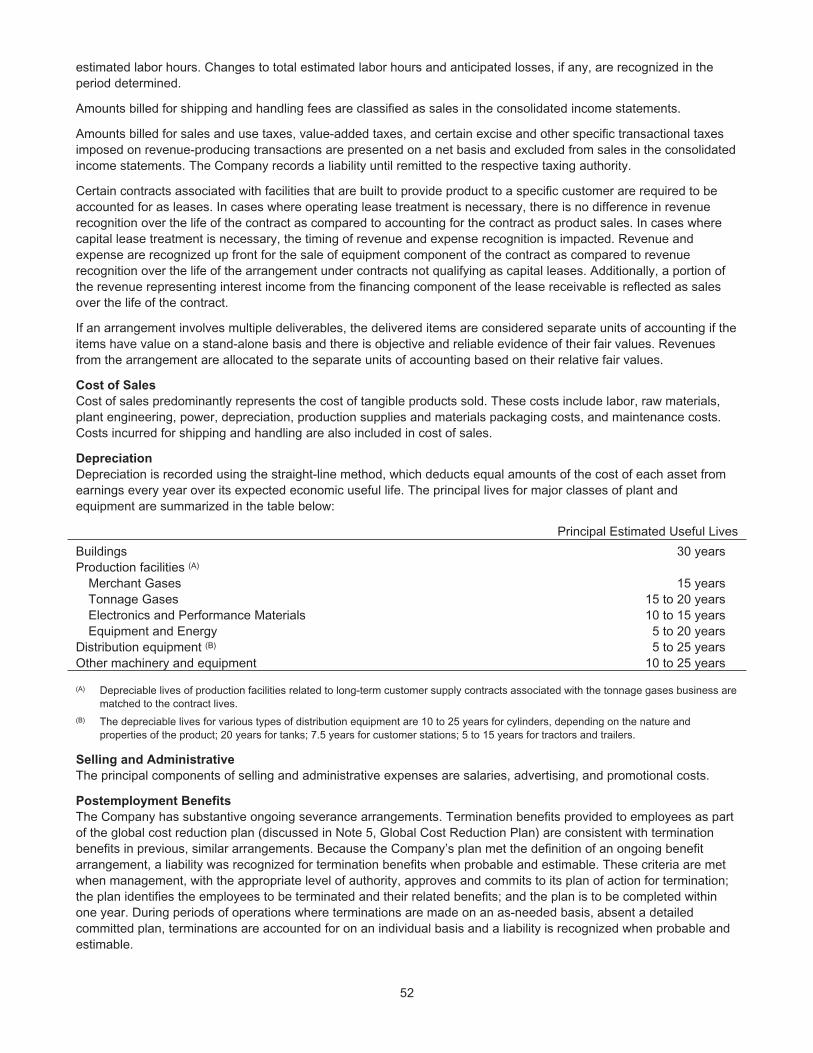
estimated labor hours. Changes to total estimated labor hours and anticipated losses, if any, are recognized in theperiod determined.
Amounts billed for shipping and handling fees are classified as sales in the consolidated income statements.
Amounts billed for sales and use taxes, value-added taxes, and certain excise and other specific transactional taxesimposed on revenue-producing transactions are presented on a net basis and excluded from sales in the consolidatedincome statements. The Company records a liability until remitted to the respective taxing authority.
Certain contracts associated with facilities that are built to provide product to a specific customer are required to beaccounted for as leases. In cases where operating lease treatment is necessary, there is no difference in revenuerecognition over the life of the contract as compared to accounting for the contract as product sales. In cases wherecapital lease treatment is necessary, the timing of revenue and expense recognition is impacted. Revenue andexpense are recognized up front for the sale of equipment component of the contract as compared to revenuerecognition over the life of the arrangement under contracts not qualifying as capital leases. Additionally, a portion ofthe revenue representing interest income from the financing component of the lease receivable is reflected as salesover the life of the contract.
If an arrangement involves multiple deliverables, the delivered items are considered separate units of accounting if theitems have value on a stand-alone basis and there is objective and reliable evidence of their fair values. Revenuesfrom the arrangement are allocated to the separate units of accounting based on their relative fair values.
Cost of Sales
Cost of sales predominantly represents the cost of tangible products sold. These costs include labor, raw materials,plant engineering, power, depreciation, production supplies and materials packaging costs, and maintenance costs.Costs incurred for shipping and handling are also included in cost of sales.
Depreciation
Depreciation is recorded using the straight-line method, which deducts equal amounts of the cost of each asset fromearnings every year over its expected economic useful life. The principal lives for major classes of plant andequipment are summarized in the table below:
Principal Estimated Useful Lives
Buildings 30 yearsProduction facilities (A)
Merchant Gases 15 yearsTonnage Gases 15 to 20 yearsElectronics and Performance Materials 10 to 15 yearsEquipment and Energy 5 to 20 years
Distribution equipment (B) 5 to 25 yearsOther machinery and equipment 10 to 25 years
(A) Depreciable lives of production facilities related to long-term customer supply contracts associated with the tonnage gases business arematched to the contract lives.
(B) The depreciable lives for various types of distribution equipment are 10 to 25 years for cylinders, depending on the nature andproperties of the product; 20 years for tanks; 7.5 years for customer stations; 5 to 15 years for tractors and trailers.
Selling and Administrative
The principal components of selling and administrative expenses are salaries, advertising, and promotional costs.
Postemployment Benefits
The Company has substantive ongoing severance arrangements. Termination benefits provided to employees as partof the global cost reduction plan (discussed in Note 5, Global Cost Reduction Plan) are consistent with terminationbenefits in previous, similar arrangements. Because the Company’s plan met the definition of an ongoing benefitarrangement, a liability was recognized for termination benefits when probable and estimable. These criteria are metwhen management, with the appropriate level of authority, approves and commits to its plan of action for termination;the plan identifies the employees to be terminated and their related benefits; and the plan is to be completed withinone year. During periods of operations where terminations are made on an as-needed basis, absent a detailedcommitted plan, terminations are accounted for on an individual basis and a liability is recognized when probable andestimable.
52
Financial Instruments
The Company addresses certain financial exposures through a controlled program of risk management that includesthe use of derivative financial instruments. Refer to Note 13, Financial Instruments, for further detail on the types anduse of derivative instruments that the Company enters into. The types of derivative financial instruments permitted forsuch risk management programs are specified in policies set by management.
Major financial institutions are counterparties to all of these derivative contracts. The Company has establishedcounterparty credit guidelines and only enters into transactions with financial institutions of investment grade or better.Management believes the risk of incurring losses related to credit risk is remote, and any losses would be immaterialto the consolidated financial results, financial condition, or liquidity.
The Company recognizes these derivatives on the balance sheet at fair value. On the date the derivative instrument isentered into, the Company generally designates the derivative as either (1) a hedge of a forecasted transaction or ofthe variability of cash flows to be received or paid related to a recognized asset or liability (cash flow hedge), (2) ahedge of a net investment in a foreign operation (net investment hedge), or (3) a hedge of the fair value of arecognized asset or liability or of an unrecognized firm commitment (fair value hedge).
The following details the accounting treatment of the Company’s cash flow, fair value, net investment, andnon-designated hedges:
• Changes in the fair value of a derivative that is designated as and meets all the required criteria for a cash flowhedge are recorded in Accumulated Other Comprehensive Income (AOCI) and then recognized in earnings whenthe hedged items affect earnings.
• Changes in the fair value of a derivative that is designated as and meets all the required criteria for a fair valuehedge, along with the gain or loss on the hedged asset or liability that is attributable to the hedged risk, arerecorded in current period earnings.
• Changes in the fair value of a derivative and foreign currency debt that are designated as and meet all therequired criteria for a hedge of a net investment are recorded as translation adjustments in AOCI.
• Changes in the fair value of a derivative that is not designated as a hedge are recorded immediately in earnings.
The Company formally documents the relationships between hedging instruments and hedged items, as well as itsrisk management objective and strategy for undertaking various hedge transactions. This process includes relatingderivatives that are designated as fair value or cash flow hedges to specific assets and liabilities on the balance sheetor to specific firm commitments or forecasted transactions. The Company also formally assesses, at the inception ofthe hedge and on an ongoing basis, whether each derivative is highly effective in offsetting changes in fair values orcash flows of the hedged item. If it is determined that a derivative is not highly effective as a hedge, or if a derivativeceases to be a highly effective hedge, the Company will discontinue hedge accounting with respect to that derivativeprospectively.
Foreign Currency
Since the Company does business in many foreign countries, fluctuations in currency exchange rates affect theCompany’s financial position and results of operations.
In most of the Company’s foreign operations, local currency is considered the functional currency. Generally, foreignsubsidiaries translate their assets and liabilities into U.S. dollars at current exchange rates—that is, the rates in effectat the end of the fiscal period. The gains or losses that result from this process are shown in AOCI in the equitysection of the consolidated balance sheet.
The revenue and expense accounts of foreign subsidiaries are translated into U.S. dollars at the average exchangerates that prevailed during the period. Therefore, the U.S. dollar value of these items on the consolidated incomestatement fluctuates from period to period, depending on the value of the dollar against foreign currencies. Sometransactions are made in currencies different from an entity’s functional currency. Gains and losses from these foreigncurrency transactions are generally included in earnings as they occur.
Environmental Expenditures
Accruals for environmental loss contingencies are recorded when it is probable that a liability has been incurred andthe amount of loss can be reasonably estimated. Remediation costs are capitalized if the costs improve theCompany’s property as compared with the condition of the property when originally constructed or acquired, or if thecosts prevent environmental contamination from future operations. The Company expenses environmental costs
53
related to existing conditions resulting from past or current operations and from which no current or future benefit isdiscernible.
The measurement of environmental liabilities is based on an evaluation of currently available information with respectto each individual site and considers factors such as existing technology, presently enacted laws and regulations, andprior experience in remediation of contaminated sites. An environmental liability related to cleanup of a contaminatedsite might include, for example, a provision for one or more of the following types of costs: site investigation andtesting costs, cleanup costs, costs related to soil and water contamination resulting from tank ruptures, post-remediation monitoring costs, and outside legal fees. These liabilities include costs related to other potentiallyresponsible parties to the extent that the Company has reason to believe such parties will not fully pay theirproportionate share. They do not take into account any claims for recoveries from insurance or other parties and arenot discounted.
As assessments and remediation progress at individual sites, the amount of projected cost is reviewed periodically,and the liability is adjusted to reflect additional technical and legal information that becomes available. Managementhas a well-established process in place to identify and monitor the Company’s environmental exposures. Anenvironmental accrual analysis is prepared and maintained that lists all environmental loss contingencies, even wherean accrual has not been established. This analysis assists in monitoring the Company’s overall environmentalexposure and serves as a tool to facilitate ongoing communication among the Company’s technical experts,environmental managers, environmental lawyers, and financial management to ensure that required accruals arerecorded and potential exposures disclosed.
Actual costs to be incurred at identified sites in future periods may vary from the estimates, given inherentuncertainties in evaluating environmental exposures. Refer to Note 17, Commitments and Contingencies, foradditional information on the Company’s environmental loss contingencies.
The accruals for environmental liabilities are reflected in the consolidated balance sheets, primarily as part of othernoncurrent liabilities, and will be paid over a period of up to 30 years.
Litigation
In the normal course of business, the Company is involved in legal proceedings. The Company accrues a liability forsuch matters when it is probable that a liability has been incurred and the amount can be reasonably estimated. Whenonly a range of possible loss can be established, the most probable amount in the range is accrued. If no amountwithin this range is a better estimate than any other amount within the range, the minimum amount in the range isaccrued. The accrual for a litigation loss contingency includes estimates of potential damages and other directlyrelated costs expected to be incurred.
Share-Based Compensation
The Company has various share-based compensation programs, which include stock options, deferred stock units,and restricted stock. Refer to Note 19, Share-Based Compensation, for further detail. The Company expenses thegrant-date fair value of these awards over the vesting period during which employees perform related services.
Income Taxes
The Company accounts for income taxes under the liability method. Under this method, deferred tax assets andliabilities are recognized for the tax effects of temporary differences between the financial reporting and tax bases ofassets and liabilities using enacted tax rates. A principal temporary difference results from the excess of taxdepreciation over book depreciation because accelerated methods of depreciation and shorter useful lives are usedfor income tax purposes. The cumulative impact of a change in tax rates or regulations is included in income taxexpense in the period that includes the enactment date.
A tax benefit for an uncertain tax position is recognized when it is more likely than not that the position will besustained upon examination based on its technical merits. This position is measured as the largest amount of taxbenefit that is greater than 50% likely of being realized. Interest and penalties related to unrecognized tax benefits arerecognized as a component of income tax expense.
Cash and Cash Items
Cash and cash items include cash, time deposits, and certificates of deposit acquired with an original maturity of threemonths or less.
54
Trade Receivables, Less Allowances for Doubtful Accounts
Trade receivables primarily comprise amounts owed to the Company through its operating activities and arepresented net of allowances for doubtful accounts. The allowances for doubtful accounts represent estimateduncollectible receivables associated with potential customer defaults on contractual obligations. A provision forcustomer defaults is made on a general formula basis when it is determined that the risk of some default is probableand estimable but cannot yet be associated with specific customers. The assessment of the likelihood of customerdefaults is based on various factors, including the length of time the receivables are past due, historical experience,and existing economic conditions. The allowances also include amounts for certain customers where a risk of defaulthas been specifically identified considering factors such as the financial condition of the customer and customerdisputes over contractual terms and conditions. Provisions to the allowances for doubtful accounts charged againstincome were $29.5, $37.8, and $14.4 in 2010, 2009, and 2008, respectively.
Inventories
Inventories are stated at the lower of cost or market. The Company writes down its inventories for estimatedobsolescence or unmarketable inventory based upon assumptions about future demand and market conditions.
The Company utilizes the last-in, first-out (LIFO) method for determining the cost of inventories in the MerchantGases, Tonnage Gases, and Electronics and Performance Materials segments in the United States. Inventories forthese segments outside of the United States are accounted for on the first-in, first-out (FIFO) method, as the LIFOmethod is not generally permitted in the foreign jurisdictions where these segments operate. The inventories of theEquipment and Energy segment on a worldwide basis, as well as all other inventories, are accounted for on the FIFObasis.
At the business segment level, inventories are recorded at FIFO and the LIFO pool adjustments are not allocated tothe business segments.
Equity Investments
The equity method of accounting is used when the Company has a 20% or greater interest in other companies andexercises significant influence but does not have operating control. Under the equity method, original investments arerecorded at cost and adjusted by the Company’s share of undistributed earnings or losses of these companies. Equityinvestments are reviewed for impairment whenever events or changes in circumstances indicate that the carryingamount of the investment may not be recoverable.
Plant and Equipment
Plant and equipment is stated at cost less accumulated depreciation. Construction costs, labor, and applicableoverhead related to installations are capitalized. Expenditures for additions and improvements that extend the lives orincrease the capacity of plant assets are capitalized. The costs of maintenance and repairs of plant and equipment arecharged to expense as incurred.
Fully depreciated assets are retained in the gross plant and equipment and accumulated depreciation accounts untilthey are removed from service. In the case of disposals, assets and related depreciation are removed from theaccounts, and the net amounts, less proceeds from disposal, are included in income.
Restricted Cash
Restricted cash includes the proceeds from the issuance of certain industrial revenue bonds that must be held inescrow until related project spending occurs. Restricted cash is classified as noncurrent assets in the consolidatedbalance sheets.
Capitalized Interest
As the Company builds new plant and equipment, it includes in the cost of these assets a portion of the interestpayments it makes during the year. The amount of capitalized interest was $14.3, $21.9, and $22.1 in 2010, 2009,and 2008, respectively.
Asset Retirement Obligations
The fair value of a liability for an asset retirement obligation is recognized in the period in which it is incurred. Theliability is measured at discounted fair value and is adjusted to its present value in subsequent periods as accretionexpense is recorded. The corresponding asset retirement costs are capitalized as part of the carrying amount of therelated long-lived asset and depreciated over the asset’s useful life. The Company’s asset retirement obligations areprimarily associated with Tonnage Gases on-site long-term supply contracts, under which the Company has built afacility on land leased from the customer and is obligated to remove the facility at the end of the contract term. TheCompany’s asset retirement obligations totaled $57.6 and $43.5 at 30 September 2010 and 2009, respectively.
55
Computer Software
The Company capitalizes costs incurred to purchase or develop software for internal use. Capitalized costs includepurchased computer software packages, payments to vendors/consultants for development and implementation ormodification to a purchased package to meet Company requirements, payroll and related costs for employees directlyinvolved in development, and interest incurred while software is being developed. Capitalized computer software costsare included in the balance sheet classification plant and equipment and depreciated over the estimated useful life ofthe software, generally a period of three to ten years. The Company’s SAP system is being depreciated over aten-year life.
Impairment of Long-Lived Assets
Long-lived assets are evaluated for impairment whenever events or changes in circumstances indicate that thecarrying amount of an asset may not be recoverable. The Company assesses recoverability by comparing the carryingamount of the asset to estimated undiscounted future cash flows expected to be generated by the asset. If an asset isconsidered impaired, the impairment loss to be recognized is measured as the amount by which the asset’s carryingamount exceeds its fair value. Long-lived assets to be disposed of are reported at the lower of carrying amount or fairvalue less cost to sell.
Goodwill
Acquisitions are accounted for using the acquisition method. The purchase price is allocated to the assets acquiredand liabilities assumed based on their estimated fair market values. Any excess purchase price over the fair marketvalue of the net assets acquired, including identified intangibles, is recorded as goodwill. Preliminary purchase priceallocations are made at the date of acquisition and finalized when information needed to affirm underlying estimates isobtained, within a maximum allocation period of one year.
Goodwill is subject to impairment testing at least annually. In addition, goodwill is tested more frequently if a change incircumstances or the occurrence of events indicates that potential impairment exists.
Intangible Assets
Intangible assets with determinable lives primarily consist of customer relationships and purchased patents andtechnology. The Company has no acquired intangible assets with indefinite lives. The cost of intangible assets withdeterminable lives is amortized on a straight-line basis over the estimated period of economic benefit. No residualvalue is estimated for these intangible assets.
Customer relationships are generally amortized over periods of five to twenty-five years. Purchased patents andtechnology and other intangibles are amortized based on contractual terms, ranging generally from five to twentyyears. Amortizable lives are adjusted whenever there is a change in the estimated period of economic benefit.
Retirement Benefits
The cost of retiree benefits is recognized over the employees’ service period. The Company is required to useactuarial methods and assumptions in the valuation of defined benefit obligations and the determination of expense.Differences between actual and expected results or changes in the value of obligations and plan assets are notrecognized in earnings as they occur but, rather, systematically and gradually over subsequent periods. Refer to Note16, Retirement Benefits, for disclosures related to the Company’s pension and other postretirement benefits.
2. New Accounting Guidance
New Accounting Guidance to be Implemented
CONSOLIDATION OF VARIABLE INTEREST ENTITIES
In June 2009, the Financial Accounting Standards Board (FASB) issued authoritative guidance that amends previousguidance for determining whether an entity is a variable interest entity (VIE). It requires an enterprise to perform ananalysis to determine whether the Company’s variable interests give it a controlling financial interest in a VIE. Acompany would be required to assess whether it has an implicit financial responsibility to ensure that a VIE operatesas designed when determining whether it has the power to direct the activities of the VIE that most significantly impactthe entity’s economic performance. In addition, ongoing reassessments of whether an enterprise is the primarybeneficiary of a VIE are required. This guidance is effective for the Company for fiscal year 2011. The adoption of thisguidance will not have a material impact on the Company’s consolidated financial statements.
56
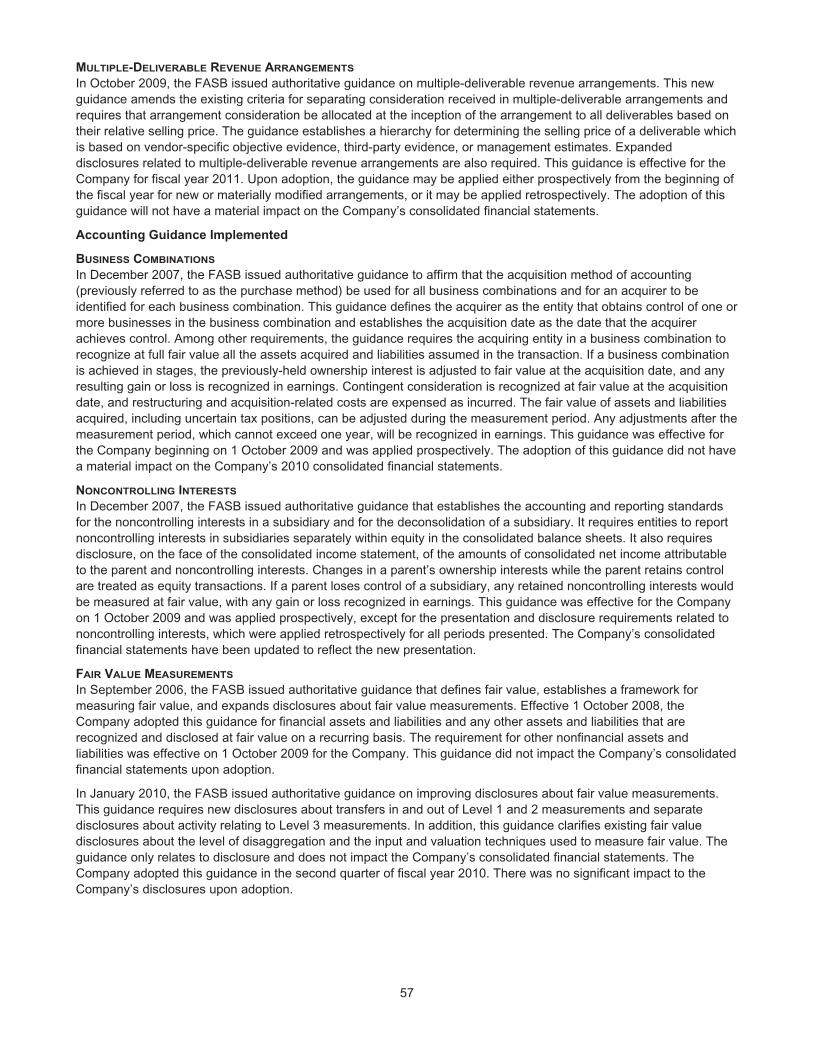
MULTIPLE-DELIVERABLE REVENUE ARRANGEMENTS
In October 2009, the FASB issued authoritative guidance on multiple-deliverable revenue arrangements. This newguidance amends the existing criteria for separating consideration received in multiple-deliverable arrangements andrequires that arrangement consideration be allocated at the inception of the arrangement to all deliverables based ontheir relative selling price. The guidance establishes a hierarchy for determining the selling price of a deliverable whichis based on vendor-specific objective evidence, third-party evidence, or management estimates. Expandeddisclosures related to multiple-deliverable revenue arrangements are also required. This guidance is effective for theCompany for fiscal year 2011. Upon adoption, the guidance may be applied either prospectively from the beginning ofthe fiscal year for new or materially modified arrangements, or it may be applied retrospectively. The adoption of thisguidance will not have a material impact on the Company’s consolidated financial statements.
Accounting Guidance Implemented
BUSINESS COMBINATIONS
In December 2007, the FASB issued authoritative guidance to affirm that the acquisition method of accounting(previously referred to as the purchase method) be used for all business combinations and for an acquirer to beidentified for each business combination. This guidance defines the acquirer as the entity that obtains control of one ormore businesses in the business combination and establishes the acquisition date as the date that the acquirerachieves control. Among other requirements, the guidance requires the acquiring entity in a business combination torecognize at full fair value all the assets acquired and liabilities assumed in the transaction. If a business combinationis achieved in stages, the previously-held ownership interest is adjusted to fair value at the acquisition date, and anyresulting gain or loss is recognized in earnings. Contingent consideration is recognized at fair value at the acquisitiondate, and restructuring and acquisition-related costs are expensed as incurred. The fair value of assets and liabilitiesacquired, including uncertain tax positions, can be adjusted during the measurement period. Any adjustments after themeasurement period, which cannot exceed one year, will be recognized in earnings. This guidance was effective forthe Company beginning on 1 October 2009 and was applied prospectively. The adoption of this guidance did not havea material impact on the Company’s 2010 consolidated financial statements.
NONCONTROLLING INTERESTS
In December 2007, the FASB issued authoritative guidance that establishes the accounting and reporting standardsfor the noncontrolling interests in a subsidiary and for the deconsolidation of a subsidiary. It requires entities to reportnoncontrolling interests in subsidiaries separately within equity in the consolidated balance sheets. It also requiresdisclosure, on the face of the consolidated income statement, of the amounts of consolidated net income attributableto the parent and noncontrolling interests. Changes in a parent’s ownership interests while the parent retains controlare treated as equity transactions. If a parent loses control of a subsidiary, any retained noncontrolling interests wouldbe measured at fair value, with any gain or loss recognized in earnings. This guidance was effective for the Companyon 1 October 2009 and was applied prospectively, except for the presentation and disclosure requirements related tononcontrolling interests, which were applied retrospectively for all periods presented. The Company’s consolidatedfinancial statements have been updated to reflect the new presentation.
FAIR VALUE MEASUREMENTS
In September 2006, the FASB issued authoritative guidance that defines fair value, establishes a framework formeasuring fair value, and expands disclosures about fair value measurements. Effective 1 October 2008, theCompany adopted this guidance for financial assets and liabilities and any other assets and liabilities that arerecognized and disclosed at fair value on a recurring basis. The requirement for other nonfinancial assets andliabilities was effective on 1 October 2009 for the Company. This guidance did not impact the Company’s consolidatedfinancial statements upon adoption.
In January 2010, the FASB issued authoritative guidance on improving disclosures about fair value measurements.This guidance requires new disclosures about transfers in and out of Level 1 and 2 measurements and separatedisclosures about activity relating to Level 3 measurements. In addition, this guidance clarifies existing fair valuedisclosures about the level of disaggregation and the input and valuation techniques used to measure fair value. Theguidance only relates to disclosure and does not impact the Company’s consolidated financial statements. TheCompany adopted this guidance in the second quarter of fiscal year 2010. There was no significant impact to theCompany’s disclosures upon adoption.
57
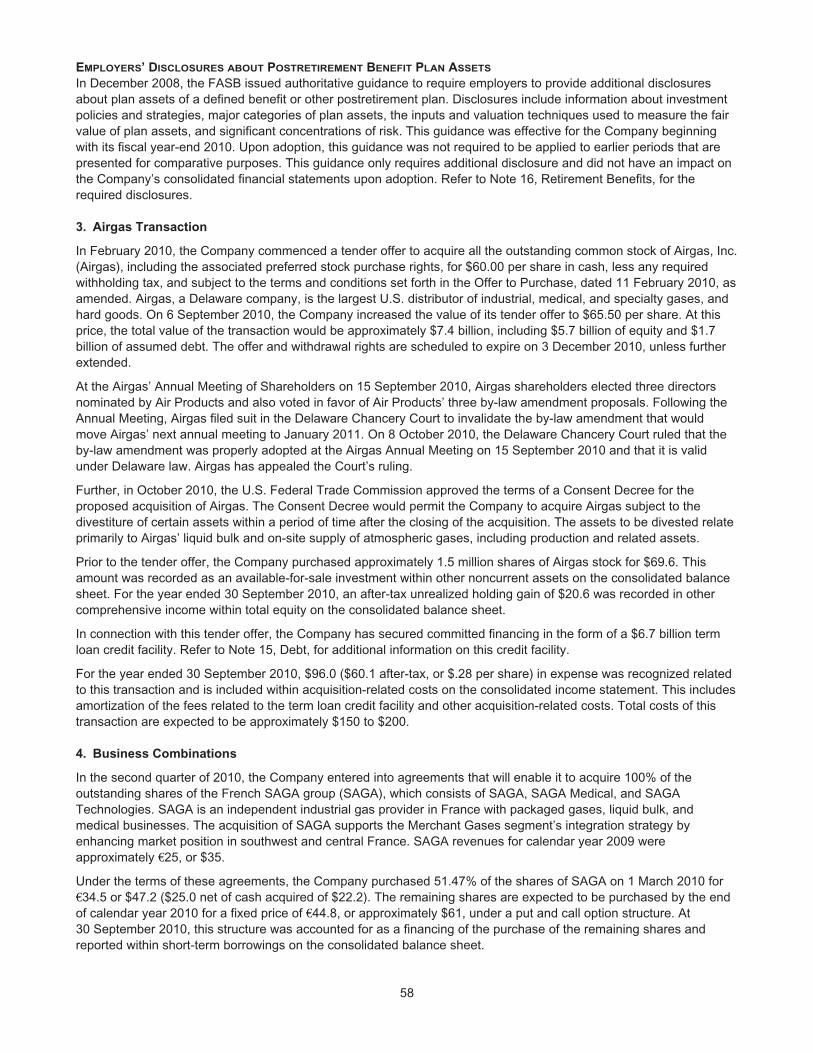
EMPLOYERS’ DISCLOSURES ABOUT POSTRETIREMENT BENEFIT PLAN ASSETS
In December 2008, the FASB issued authoritative guidance to require employers to provide additional disclosuresabout plan assets of a defined benefit or other postretirement plan. Disclosures include information about investmentpolicies and strategies, major categories of plan assets, the inputs and valuation techniques used to measure the fairvalue of plan assets, and significant concentrations of risk. This guidance was effective for the Company beginningwith its fiscal year-end 2010. Upon adoption, this guidance was not required to be applied to earlier periods that arepresented for comparative purposes. This guidance only requires additional disclosure and did not have an impact onthe Company’s consolidated financial statements upon adoption. Refer to Note 16, Retirement Benefits, for therequired disclosures.
3. Airgas Transaction
In February 2010, the Company commenced a tender offer to acquire all the outstanding common stock of Airgas, Inc.(Airgas), including the associated preferred stock purchase rights, for $60.00 per share in cash, less any requiredwithholding tax, and subject to the terms and conditions set forth in the Offer to Purchase, dated 11 February 2010, asamended. Airgas, a Delaware company, is the largest U.S. distributor of industrial, medical, and specialty gases, andhard goods. On 6 September 2010, the Company increased the value of its tender offer to $65.50 per share. At thisprice, the total value of the transaction would be approximately $7.4 billion, including $5.7 billion of equity and $1.7billion of assumed debt. The offer and withdrawal rights are scheduled to expire on 3 December 2010, unless furtherextended.
At the Airgas’ Annual Meeting of Shareholders on 15 September 2010, Airgas shareholders elected three directorsnominated by Air Products and also voted in favor of Air Products’ three by-law amendment proposals. Following theAnnual Meeting, Airgas filed suit in the Delaware Chancery Court to invalidate the by-law amendment that wouldmove Airgas’ next annual meeting to January 2011. On 8 October 2010, the Delaware Chancery Court ruled that theby-law amendment was properly adopted at the Airgas Annual Meeting on 15 September 2010 and that it is validunder Delaware law. Airgas has appealed the Court’s ruling.
Further, in October 2010, the U.S. Federal Trade Commission approved the terms of a Consent Decree for theproposed acquisition of Airgas. The Consent Decree would permit the Company to acquire Airgas subject to thedivestiture of certain assets within a period of time after the closing of the acquisition. The assets to be divested relateprimarily to Airgas’ liquid bulk and on-site supply of atmospheric gases, including production and related assets.
Prior to the tender offer, the Company purchased approximately 1.5 million shares of Airgas stock for $69.6. Thisamount was recorded as an available-for-sale investment within other noncurrent assets on the consolidated balancesheet. For the year ended 30 September 2010, an after-tax unrealized holding gain of $20.6 was recorded in othercomprehensive income within total equity on the consolidated balance sheet.
In connection with this tender offer, the Company has secured committed financing in the form of a $6.7 billion termloan credit facility. Refer to Note 15, Debt, for additional information on this credit facility.
For the year ended 30 September 2010, $96.0 ($60.1 after-tax, or $.28 per share) in expense was recognized relatedto this transaction and is included within acquisition-related costs on the consolidated income statement. This includesamortization of the fees related to the term loan credit facility and other acquisition-related costs. Total costs of thistransaction are expected to be approximately $150 to $200.
4. Business Combinations
In the second quarter of 2010, the Company entered into agreements that will enable it to acquire 100% of theoutstanding shares of the French SAGA group (SAGA), which consists of SAGA, SAGA Medical, and SAGATechnologies. SAGA is an independent industrial gas provider in France with packaged gases, liquid bulk, andmedical businesses. The acquisition of SAGA supports the Merchant Gases segment’s integration strategy byenhancing market position in southwest and central France. SAGA revenues for calendar year 2009 wereapproximately €25, or $35.
Under the terms of these agreements, the Company purchased 51.47% of the shares of SAGA on 1 March 2010 for€34.5 or $47.2 ($25.0 net of cash acquired of $22.2). The remaining shares are expected to be purchased by the endof calendar year 2010 for a fixed price of €44.8, or approximately $61, under a put and call option structure. At30 September 2010, this structure was accounted for as a financing of the purchase of the remaining shares andreported within short-term borrowings on the consolidated balance sheet.
58
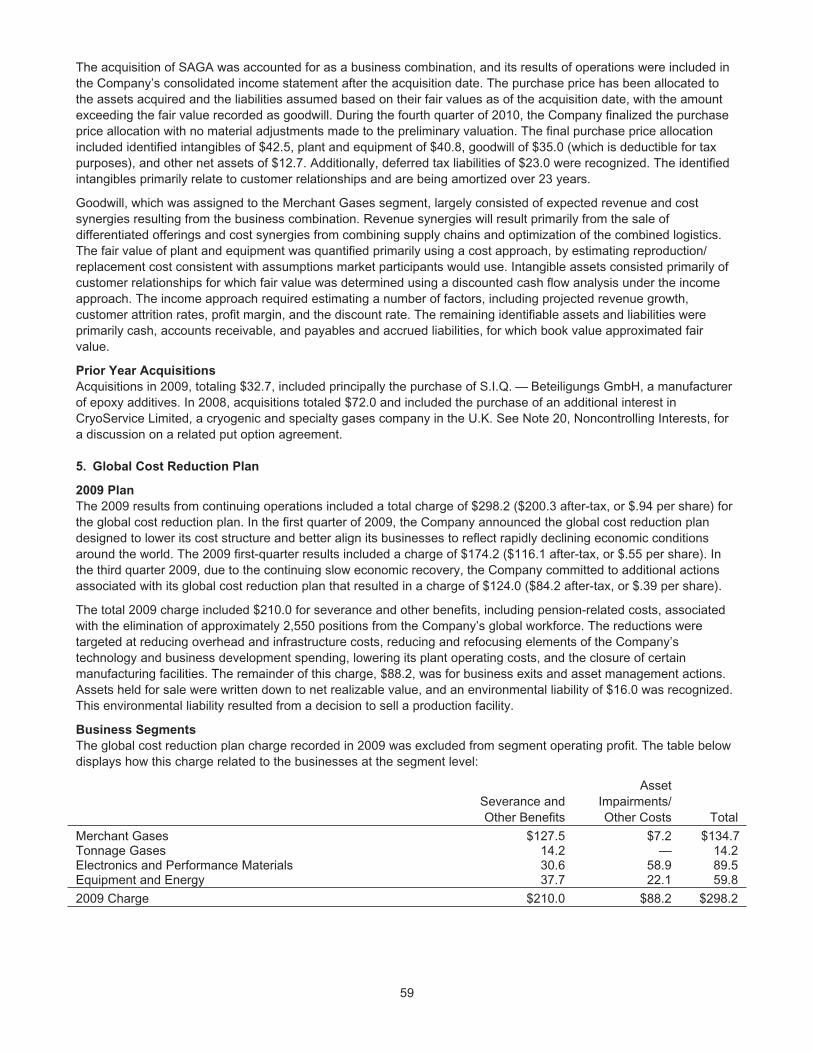
The acquisition of SAGA was accounted for as a business combination, and its results of operations were included inthe Company’s consolidated income statement after the acquisition date. The purchase price has been allocated tothe assets acquired and the liabilities assumed based on their fair values as of the acquisition date, with the amountexceeding the fair value recorded as goodwill. During the fourth quarter of 2010, the Company finalized the purchaseprice allocation with no material adjustments made to the preliminary valuation. The final purchase price allocationincluded identified intangibles of $42.5, plant and equipment of $40.8, goodwill of $35.0 (which is deductible for taxpurposes), and other net assets of $12.7. Additionally, deferred tax liabilities of $23.0 were recognized. The identifiedintangibles primarily relate to customer relationships and are being amortized over 23 years.
Goodwill, which was assigned to the Merchant Gases segment, largely consisted of expected revenue and costsynergies resulting from the business combination. Revenue synergies will result primarily from the sale ofdifferentiated offerings and cost synergies from combining supply chains and optimization of the combined logistics.The fair value of plant and equipment was quantified primarily using a cost approach, by estimating reproduction/replacement cost consistent with assumptions market participants would use. Intangible assets consisted primarily ofcustomer relationships for which fair value was determined using a discounted cash flow analysis under the incomeapproach. The income approach required estimating a number of factors, including projected revenue growth,customer attrition rates, profit margin, and the discount rate. The remaining identifiable assets and liabilities wereprimarily cash, accounts receivable, and payables and accrued liabilities, for which book value approximated fairvalue.
Prior Year Acquisitions
Acquisitions in 2009, totaling $32.7, included principally the purchase of S.I.Q. — Beteiligungs GmbH, a manufacturerof epoxy additives. In 2008, acquisitions totaled $72.0 and included the purchase of an additional interest inCryoService Limited, a cryogenic and specialty gases company in the U.K. See Note 20, Noncontrolling Interests, fora discussion on a related put option agreement.
5. Global Cost Reduction Plan
2009 Plan
The 2009 results from continuing operations included a total charge of $298.2 ($200.3 after-tax, or $.94 per share) forthe global cost reduction plan. In the first quarter of 2009, the Company announced the global cost reduction plandesigned to lower its cost structure and better align its businesses to reflect rapidly declining economic conditionsaround the world. The 2009 first-quarter results included a charge of $174.2 ($116.1 after-tax, or $.55 per share). Inthe third quarter 2009, due to the continuing slow economic recovery, the Company committed to additional actionsassociated with its global cost reduction plan that resulted in a charge of $124.0 ($84.2 after-tax, or $.39 per share).
The total 2009 charge included $210.0 for severance and other benefits, including pension-related costs, associatedwith the elimination of approximately 2,550 positions from the Company’s global workforce. The reductions weretargeted at reducing overhead and infrastructure costs, reducing and refocusing elements of the Company’stechnology and business development spending, lowering its plant operating costs, and the closure of certainmanufacturing facilities. The remainder of this charge, $88.2, was for business exits and asset management actions.Assets held for sale were written down to net realizable value, and an environmental liability of $16.0 was recognized.This environmental liability resulted from a decision to sell a production facility.
Business Segments
The global cost reduction plan charge recorded in 2009 was excluded from segment operating profit. The table belowdisplays how this charge related to the businesses at the segment level:
Severance andOther Benefits
AssetImpairments/Other Costs Total
Merchant Gases $127.5 $7.2 $134.7Tonnage Gases 14.2 — 14.2Electronics and Performance Materials 30.6 58.9 89.5Equipment and Energy 37.7 22.1 59.8
2009 Charge $210.0 $88.2 $298.2
59
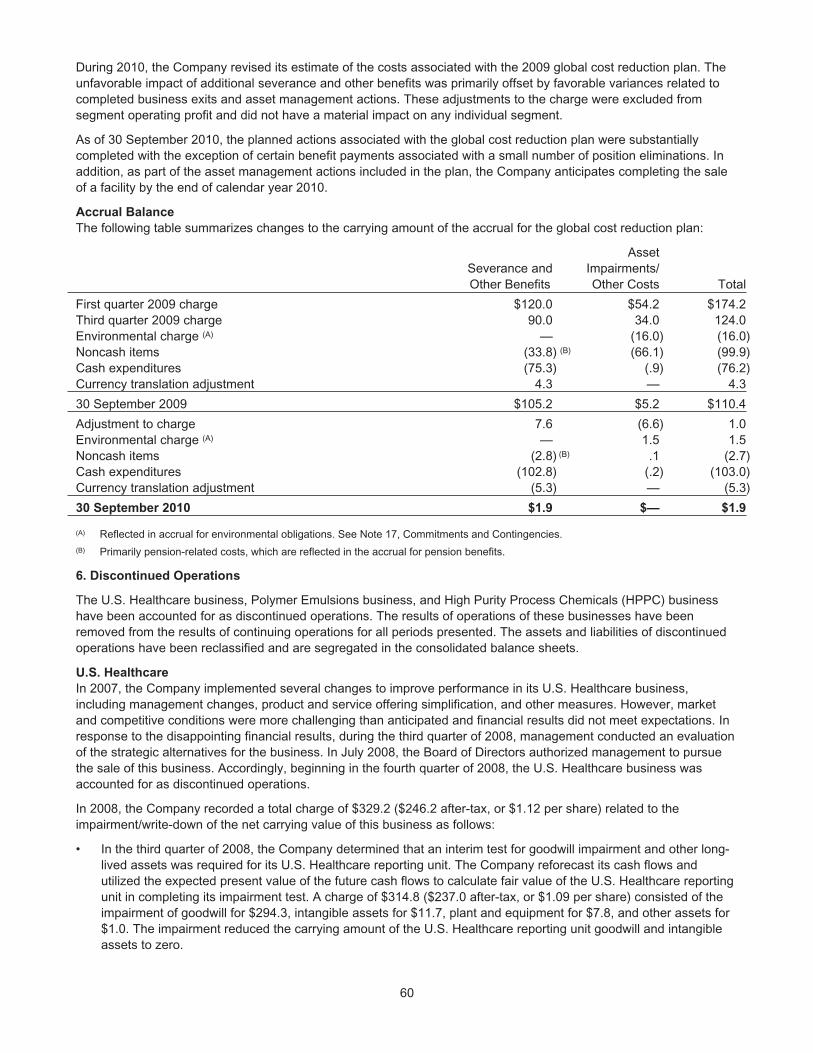
During 2010, the Company revised its estimate of the costs associated with the 2009 global cost reduction plan. Theunfavorable impact of additional severance and other benefits was primarily offset by favorable variances related tocompleted business exits and asset management actions. These adjustments to the charge were excluded fromsegment operating profit and did not have a material impact on any individual segment.
As of 30 September 2010, the planned actions associated with the global cost reduction plan were substantiallycompleted with the exception of certain benefit payments associated with a small number of position eliminations. Inaddition, as part of the asset management actions included in the plan, the Company anticipates completing the saleof a facility by the end of calendar year 2010.
Accrual Balance
The following table summarizes changes to the carrying amount of the accrual for the global cost reduction plan:
Severance andOther Benefits
AssetImpairments/Other Costs Total
First quarter 2009 charge $120.0 $54.2 $174.2Third quarter 2009 charge 90.0 34.0 124.0Environmental charge (A) — (16.0) (16.0)Noncash items (33.8) (B) (66.1) (99.9)Cash expenditures (75.3) (.9) (76.2)Currency translation adjustment 4.3 — 4.3
30 September 2009 $105.2 $5.2 $110.4
Adjustment to charge 7.6 (6.6) 1.0Environmental charge (A) — 1.5 1.5Noncash items (2.8) (B) .1 (2.7)Cash expenditures (102.8) (.2) (103.0)Currency translation adjustment (5.3) — (5.3)
30 September 2010 $1.9 $— $1.9
(A) Reflected in accrual for environmental obligations. See Note 17, Commitments and Contingencies.(B) Primarily pension-related costs, which are reflected in the accrual for pension benefits.
6. Discontinued Operations
The U.S. Healthcare business, Polymer Emulsions business, and High Purity Process Chemicals (HPPC) businesshave been accounted for as discontinued operations. The results of operations of these businesses have beenremoved from the results of continuing operations for all periods presented. The assets and liabilities of discontinuedoperations have been reclassified and are segregated in the consolidated balance sheets.
U.S. Healthcare
In 2007, the Company implemented several changes to improve performance in its U.S. Healthcare business,including management changes, product and service offering simplification, and other measures. However, marketand competitive conditions were more challenging than anticipated and financial results did not meet expectations. Inresponse to the disappointing financial results, during the third quarter of 2008, management conducted an evaluationof the strategic alternatives for the business. In July 2008, the Board of Directors authorized management to pursuethe sale of this business. Accordingly, beginning in the fourth quarter of 2008, the U.S. Healthcare business wasaccounted for as discontinued operations.
In 2008, the Company recorded a total charge of $329.2 ($246.2 after-tax, or $1.12 per share) related to theimpairment/write-down of the net carrying value of this business as follows:
• In the third quarter of 2008, the Company determined that an interim test for goodwill impairment and other long-lived assets was required for its U.S. Healthcare reporting unit. The Company reforecast its cash flows andutilized the expected present value of the future cash flows to calculate fair value of the U.S. Healthcare reportingunit in completing its impairment test. A charge of $314.8 ($237.0 after-tax, or $1.09 per share) consisted of theimpairment of goodwill for $294.3, intangible assets for $11.7, plant and equipment for $7.8, and other assets for$1.0. The impairment reduced the carrying amount of the U.S. Healthcare reporting unit goodwill and intangibleassets to zero.
60
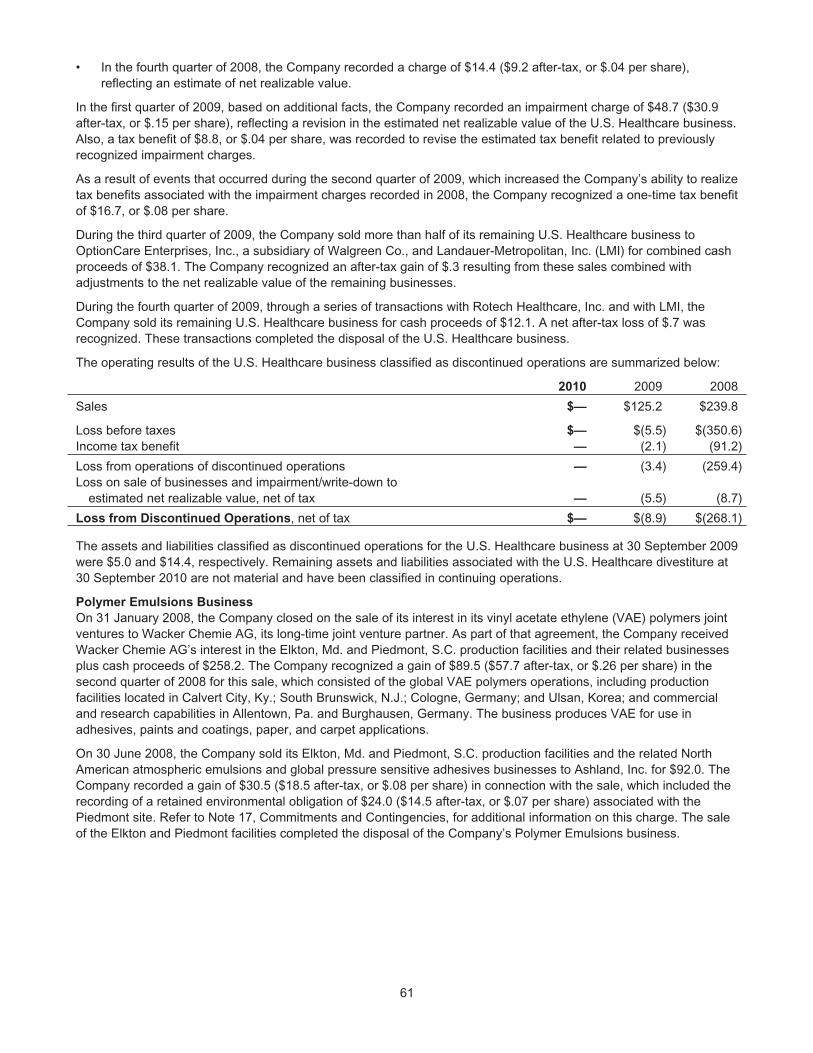
• In the fourth quarter of 2008, the Company recorded a charge of $14.4 ($9.2 after-tax, or $.04 per share),reflecting an estimate of net realizable value.
In the first quarter of 2009, based on additional facts, the Company recorded an impairment charge of $48.7 ($30.9after-tax, or $.15 per share), reflecting a revision in the estimated net realizable value of the U.S. Healthcare business.Also, a tax benefit of $8.8, or $.04 per share, was recorded to revise the estimated tax benefit related to previouslyrecognized impairment charges.
As a result of events that occurred during the second quarter of 2009, which increased the Company’s ability to realizetax benefits associated with the impairment charges recorded in 2008, the Company recognized a one-time tax benefitof $16.7, or $.08 per share.
During the third quarter of 2009, the Company sold more than half of its remaining U.S. Healthcare business toOptionCare Enterprises, Inc., a subsidiary of Walgreen Co., and Landauer-Metropolitan, Inc. (LMI) for combined cashproceeds of $38.1. The Company recognized an after-tax gain of $.3 resulting from these sales combined withadjustments to the net realizable value of the remaining businesses.
During the fourth quarter of 2009, through a series of transactions with Rotech Healthcare, Inc. and with LMI, theCompany sold its remaining U.S. Healthcare business for cash proceeds of $12.1. A net after-tax loss of $.7 wasrecognized. These transactions completed the disposal of the U.S. Healthcare business.
The operating results of the U.S. Healthcare business classified as discontinued operations are summarized below:
2010 2009 2008
Sales $— $125.2 $239.8
Loss before taxes $— $(5.5) $(350.6)Income tax benefit — (2.1) (91.2)
Loss from operations of discontinued operations — (3.4) (259.4)Loss on sale of businesses and impairment/write-down to
estimated net realizable value, net of tax — (5.5) (8.7)
Loss from Discontinued Operations, net of tax $— $(8.9) $(268.1)
The assets and liabilities classified as discontinued operations for the U.S. Healthcare business at 30 September 2009were $5.0 and $14.4, respectively. Remaining assets and liabilities associated with the U.S. Healthcare divestiture at30 September 2010 are not material and have been classified in continuing operations.
Polymer Emulsions Business
On 31 January 2008, the Company closed on the sale of its interest in its vinyl acetate ethylene (VAE) polymers jointventures to Wacker Chemie AG, its long-time joint venture partner. As part of that agreement, the Company receivedWacker Chemie AG’s interest in the Elkton, Md. and Piedmont, S.C. production facilities and their related businessesplus cash proceeds of $258.2. The Company recognized a gain of $89.5 ($57.7 after-tax, or $.26 per share) in thesecond quarter of 2008 for this sale, which consisted of the global VAE polymers operations, including productionfacilities located in Calvert City, Ky.; South Brunswick, N.J.; Cologne, Germany; and Ulsan, Korea; and commercialand research capabilities in Allentown, Pa. and Burghausen, Germany. The business produces VAE for use inadhesives, paints and coatings, paper, and carpet applications.
On 30 June 2008, the Company sold its Elkton, Md. and Piedmont, S.C. production facilities and the related NorthAmerican atmospheric emulsions and global pressure sensitive adhesives businesses to Ashland, Inc. for $92.0. TheCompany recorded a gain of $30.5 ($18.5 after-tax, or $.08 per share) in connection with the sale, which included therecording of a retained environmental obligation of $24.0 ($14.5 after-tax, or $.07 per share) associated with thePiedmont site. Refer to Note 17, Commitments and Contingencies, for additional information on this charge. The saleof the Elkton and Piedmont facilities completed the disposal of the Company’s Polymer Emulsions business.
61
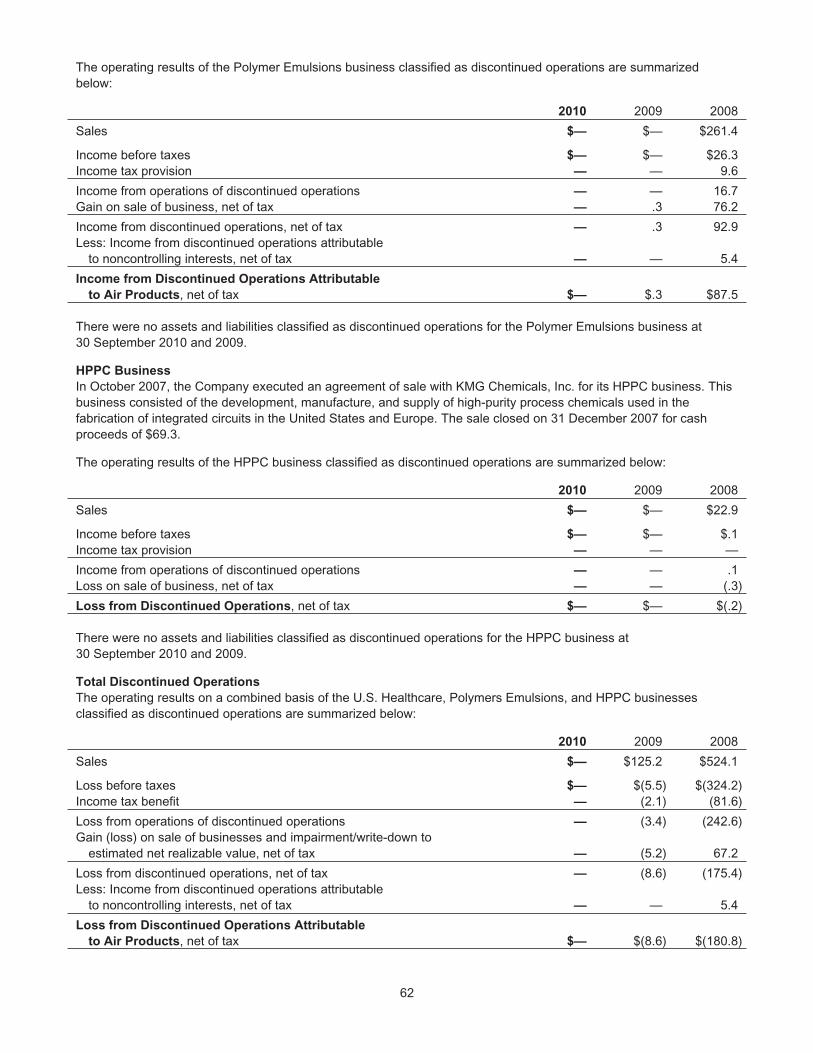
The operating results of the Polymer Emulsions business classified as discontinued operations are summarizedbelow:
2010 2009 2008
Sales $— $— $261.4
Income before taxes $— $— $26.3Income tax provision — — 9.6
Income from operations of discontinued operations — — 16.7Gain on sale of business, net of tax — .3 76.2
Income from discontinued operations, net of tax — .3 92.9Less: Income from discontinued operations attributable
to noncontrolling interests, net of tax — — 5.4
Income from Discontinued Operations Attributable
to Air Products, net of tax $— $.3 $87.5
There were no assets and liabilities classified as discontinued operations for the Polymer Emulsions business at30 September 2010 and 2009.
HPPC Business
In October 2007, the Company executed an agreement of sale with KMG Chemicals, Inc. for its HPPC business. Thisbusiness consisted of the development, manufacture, and supply of high-purity process chemicals used in thefabrication of integrated circuits in the United States and Europe. The sale closed on 31 December 2007 for cashproceeds of $69.3.
The operating results of the HPPC business classified as discontinued operations are summarized below:
2010 2009 2008
Sales $— $— $22.9
Income before taxes $— $— $.1Income tax provision — — —
Income from operations of discontinued operations — — .1Loss on sale of business, net of tax — — (.3)
Loss from Discontinued Operations, net of tax $— $— $(.2)
There were no assets and liabilities classified as discontinued operations for the HPPC business at30 September 2010 and 2009.
Total Discontinued Operations
The operating results on a combined basis of the U.S. Healthcare, Polymers Emulsions, and HPPC businessesclassified as discontinued operations are summarized below:
2010 2009 2008
Sales $— $125.2 $524.1
Loss before taxes $— $(5.5) $(324.2)Income tax benefit — (2.1) (81.6)
Loss from operations of discontinued operations — (3.4) (242.6)Gain (loss) on sale of businesses and impairment/write-down to
estimated net realizable value, net of tax — (5.2) 67.2
Loss from discontinued operations, net of tax — (8.6) (175.4)Less: Income from discontinued operations attributable
to noncontrolling interests, net of tax — — 5.4
Loss from Discontinued Operations Attributable
to Air Products, net of tax $— $(8.6) $(180.8)
62
7. Inventories
The components of inventories are as follows:
30 September 2010 2009
Inventories at FIFO costFinished goods $405.3 $405.5Work in process 29.3 20.9Raw materials and supplies 208.2 151.1
642.8 577.5Less: Excess of FIFO cost over LIFO cost (71.2) (67.9)
$571.6 $509.6
Inventories valued using the LIFO method comprised 40.5% of consolidated inventories before LIFO adjustment atboth 30 September 2010 and 2009. Liquidation of LIFO inventory layers in 2010 and 2008 did not materially affectresults of operations in those years. During 2009, there was no liquidation of prior years’ LIFO inventory layers.
FIFO cost approximates replacement cost. The Company’s inventories have a high turnover, and as a result, there islittle difference between the original cost of an item and its current replacement cost.
8. Summarized Financial Information of Equity Affiliates
The following table presents summarized financial information on a combined 100% basis of the principal companiesaccounted for by the equity method. Amounts presented include the accounts of the following equity affiliates:
Air Products South Africa (50%); INOX Air Products Limited (INOX) (50%);Bangkok Cogeneration Company Limited (49%); Kulim Industrial Gases Sdn. Bhd (50%);Bangkok Industrial Gases Company Ltd. (49%); Sapio Produzione Idrogeno Ossigeno S.r.l. (49%);Chengdu Air & Gas Products Ltd. (50%); SembCorp Air Products (HyCO) Pte. Ltd. (40%);Daido Air Products Electronics, Inc. (20%); Tecnologia en Nitrogeno S. de R.L. de C.V. (50%);DuPont Air Products Nanomaterials, LLC (50%); Tyczka Industrie-Gases GmbH (50%);Helap S.A. (50%); WuXi Hi-Tech Gas Co., Ltd. (50%);High-Tech Gases (Beijing) Co., Ltd. (50%); and principally, other industrial gas producers.INFRA Group (40%);
2010 2009
Current assets $1,133.4 $1,185.2Noncurrent assets 2,071.6 1,916.9Current liabilities 788.9 714.5Noncurrent liabilities 559.9 677.3Net sales 2,293.4 2,129.7Sales less cost of sales 964.4 874.4Net income 293.0 257.7
Dividends received from equity affiliates were $75.4, $52.9, and $65.3 in 2010, 2009, and 2008, respectively.
The investment in net assets of and advances to equity affiliates as of 30 September 2010 and 2009 includedinvestment in foreign affiliates of $877.7 and $834.7, respectively.
As of 30 September 2010 and 2009, the amount of investment in companies accounted for by the equity methodincluded goodwill in the amount of $60.2 and $56.1, respectively.
63
9. Plant and Equipment
The major classes of plant and equipment, at cost, are as follows:
30 September 2010 2009
Land $172.3 $169.4Buildings 886.2 875.5Production facilities
Merchant Gases 3,346.3 3,071.0Tonnage Gases 5,691.4 5,441.7Electronics and Performance Materials 2,061.2 1,907.6Equipment and Energy 296.5 286.8
Total production facilities 11,395.4 10,707.1Distribution equipment 2,918.6 2,802.5Other machinery and equipment 248.0 273.1Construction in progress 689.2 923.7
$16,309.7 $15,751.3
Depreciation expense was $837.7, $815.9, and $848.0, in 2010, 2009, and 2008, respectively.
10. Goodwill
Changes to the carrying amount of consolidated goodwill by segment are as follows:
30 September 2009
Acquisitionsand
Adjustments
CurrencyTranslationand Other 2010
Merchant Gases $601.3 $19.1 $(24.7) $595.7
Tonnage Gases 16.3 (.9) .1 15.5
Electronics and Performance Materials 298.4 .3 4.7 303.4
$916.0 $18.5 $(19.9) $914.6
30 September 2008
Acquisitionsand
Adjustments
CurrencyTranslationand Other 2009
Merchant Gases $626.5 $1.9 $(27.1) $601.3Tonnage Gases 18.0 — (1.7) 16.3Electronics and Performance Materials 283.6 10.0 4.8 298.4
$928.1 $11.9 $(24.0) $916.0
Acquisitions and adjustments related to the Merchant Gases segment in 2010 included $35.0 associated with theSAGA acquisition, offset by a reduction in goodwill for an adjustment related to a previous acquisition of $16.9. Referto Note 4, Business Combinations, for further detail on the SAGA acquisition.
In the fourth quarter of 2010, the Company conducted the required annual test of goodwill for impairment. TheCompany determined that the fair value of each of the reporting units substantially exceeded its carrying value, andtherefore there were no indications of impairment.
64
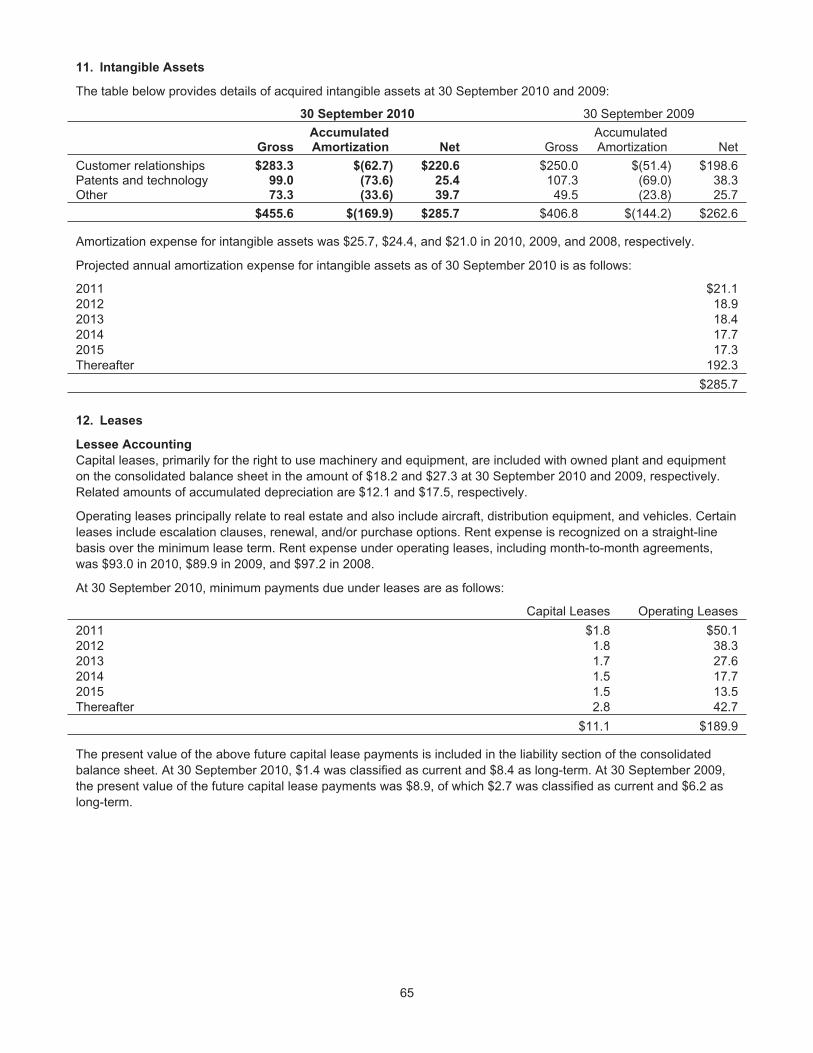
11. Intangible Assets
The table below provides details of acquired intangible assets at 30 September 2010 and 2009:
30 September 2010 30 September 2009
GrossAccumulatedAmortization Net Gross
AccumulatedAmortization Net
Customer relationships $283.3 $(62.7) $220.6 $250.0 $(51.4) $198.6Patents and technology 99.0 (73.6) 25.4 107.3 (69.0) 38.3Other 73.3 (33.6) 39.7 49.5 (23.8) 25.7
$455.6 $(169.9) $285.7 $406.8 $(144.2) $262.6
Amortization expense for intangible assets was $25.7, $24.4, and $21.0 in 2010, 2009, and 2008, respectively.
Projected annual amortization expense for intangible assets as of 30 September 2010 is as follows:
2011 $21.12012 18.92013 18.42014 17.72015 17.3Thereafter 192.3
$285.7
12. Leases
Lessee Accounting
Capital leases, primarily for the right to use machinery and equipment, are included with owned plant and equipmenton the consolidated balance sheet in the amount of $18.2 and $27.3 at 30 September 2010 and 2009, respectively.Related amounts of accumulated depreciation are $12.1 and $17.5, respectively.
Operating leases principally relate to real estate and also include aircraft, distribution equipment, and vehicles. Certainleases include escalation clauses, renewal, and/or purchase options. Rent expense is recognized on a straight-linebasis over the minimum lease term. Rent expense under operating leases, including month-to-month agreements,was $93.0 in 2010, $89.9 in 2009, and $97.2 in 2008.
At 30 September 2010, minimum payments due under leases are as follows:
Capital Leases Operating Leases
2011 $1.8 $50.12012 1.8 38.32013 1.7 27.62014 1.5 17.72015 1.5 13.5Thereafter 2.8 42.7
$11.1 $189.9
The present value of the above future capital lease payments is included in the liability section of the consolidatedbalance sheet. At 30 September 2010, $1.4 was classified as current and $8.4 as long-term. At 30 September 2009,the present value of the future capital lease payments was $8.9, of which $2.7 was classified as current and $6.2 aslong-term.
65
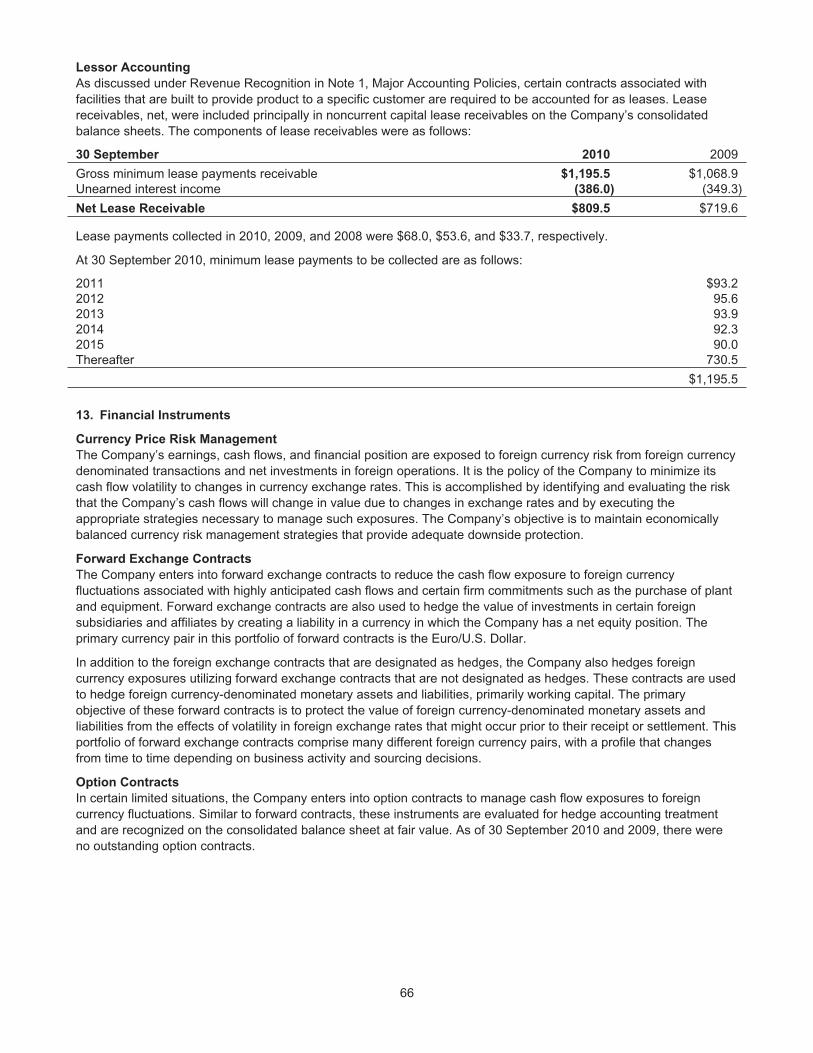
Lessor Accounting
As discussed under Revenue Recognition in Note 1, Major Accounting Policies, certain contracts associated withfacilities that are built to provide product to a specific customer are required to be accounted for as leases. Leasereceivables, net, were included principally in noncurrent capital lease receivables on the Company’s consolidatedbalance sheets. The components of lease receivables were as follows:
30 September 2010 2009
Gross minimum lease payments receivable $1,195.5 $1,068.9Unearned interest income (386.0) (349.3)
Net Lease Receivable $809.5 $719.6
Lease payments collected in 2010, 2009, and 2008 were $68.0, $53.6, and $33.7, respectively.
At 30 September 2010, minimum lease payments to be collected are as follows:
2011 $93.22012 95.62013 93.92014 92.32015 90.0Thereafter 730.5
$1,195.5
13. Financial Instruments
Currency Price Risk Management
The Company’s earnings, cash flows, and financial position are exposed to foreign currency risk from foreign currencydenominated transactions and net investments in foreign operations. It is the policy of the Company to minimize itscash flow volatility to changes in currency exchange rates. This is accomplished by identifying and evaluating the riskthat the Company’s cash flows will change in value due to changes in exchange rates and by executing theappropriate strategies necessary to manage such exposures. The Company’s objective is to maintain economicallybalanced currency risk management strategies that provide adequate downside protection.
Forward Exchange Contracts
The Company enters into forward exchange contracts to reduce the cash flow exposure to foreign currencyfluctuations associated with highly anticipated cash flows and certain firm commitments such as the purchase of plantand equipment. Forward exchange contracts are also used to hedge the value of investments in certain foreignsubsidiaries and affiliates by creating a liability in a currency in which the Company has a net equity position. Theprimary currency pair in this portfolio of forward contracts is the Euro/U.S. Dollar.
In addition to the foreign exchange contracts that are designated as hedges, the Company also hedges foreigncurrency exposures utilizing forward exchange contracts that are not designated as hedges. These contracts are usedto hedge foreign currency-denominated monetary assets and liabilities, primarily working capital. The primaryobjective of these forward contracts is to protect the value of foreign currency-denominated monetary assets andliabilities from the effects of volatility in foreign exchange rates that might occur prior to their receipt or settlement. Thisportfolio of forward exchange contracts comprise many different foreign currency pairs, with a profile that changesfrom time to time depending on business activity and sourcing decisions.
Option Contracts
In certain limited situations, the Company enters into option contracts to manage cash flow exposures to foreigncurrency fluctuations. Similar to forward contracts, these instruments are evaluated for hedge accounting treatmentand are recognized on the consolidated balance sheet at fair value. As of 30 September 2010 and 2009, there wereno outstanding option contracts.
66

The table below summarizes the Company’s outstanding currency price risk management instruments:
2010 2009
30 September
US$
Notional
Years
Average
Maturity
US$Notional
YearsAverageMaturity
Forward Exchange ContractsCash flow hedges $1,605.5 .5 $1,620.7 .8Net investment hedges 648.5 3.0 873.6 3.5Fair value hedges — — 2.7 .4Hedges not designated 373.6 .2 508.9 .6
Total Forward Exchange Contracts $2,627.6 1.1 $3,005.9 1.6
In addition to the above, the Company uses foreign currency denominated debt and qualifying intercompany loans tohedge the foreign currency exposures of the Company’s net investment in certain foreign affiliates. The designatedforeign currency denominated debt at 30 September 2010 includes €782.1 and NT$967.0, and at 30 September 2009includes €1,013.0 and NT$965.0. The designated intercompany loans include €437.0 at both 30 September 2010 and2009.
Debt Portfolio Management
It is the policy of the Company to identify on a continuing basis the need for debt capital and evaluate the financialrisks inherent in funding the Company with debt capital. Reflecting the result of this ongoing review, the debt portfolioand hedging program of the Company are managed with the objectives and intent to (1) reduce funding risk withrespect to borrowings made by the Company to preserve the Company’s access to debt capital and provide debtcapital as required for funding and liquidity purposes, and (2) manage the aggregate interest rate risk and the debtportfolio in accordance with certain debt management parameters.
Interest Rate Swap Contracts
The Company enters into interest rate swap contracts to change the fixed/variable interest rate mix of its debt portfolioin order to maintain the percentage of fixed- and variable-rate debt within the parameters set by management. Inaccordance with these parameters, the agreements are used to optimize interest rate risks and costs inherent in theCompany’s debt portfolio. The current interest rate swap portfolio consists of fixed-to-floating swaps denominated inU.S. dollars and in Euros. In addition, the Company uses interest rate swap agreements to hedge the interest rate onanticipated fixed-rate debt issuance. The notional amount of the interest rate swap agreements are equal to or lessthan the designated debt instrument being hedged. When interest rate swaps are used, the indices of the swapinstruments and the debt to which they are designated are the same. It is the Company’s policy not to enter into anyinterest rate swap contracts which lever a move in interest rates on a greater than one-to-one basis.
Cross Currency Interest Rate Swap Contracts
The Company enters into cross currency interest rate swap contracts when the Company deems necessary. Thesecontracts may entail both the exchange of fixed- and floating-rate interest payments periodically over the life of theagreement and the exchange of one currency for another currency at inception and at a specified future date. Thesecontracts effectively convert the currency denomination of a debt instrument into another currency in which theCompany has a net equity position while changing the interest rate characteristics of the instrument. The contracts areused to hedge long-term intercompany and third-party borrowing transactions and certain net investments in foreignoperations. The current cross currency swap portfolio consists of a single fixed-to-fixed swap between U.S. dollarsand British Pound Sterling.
67
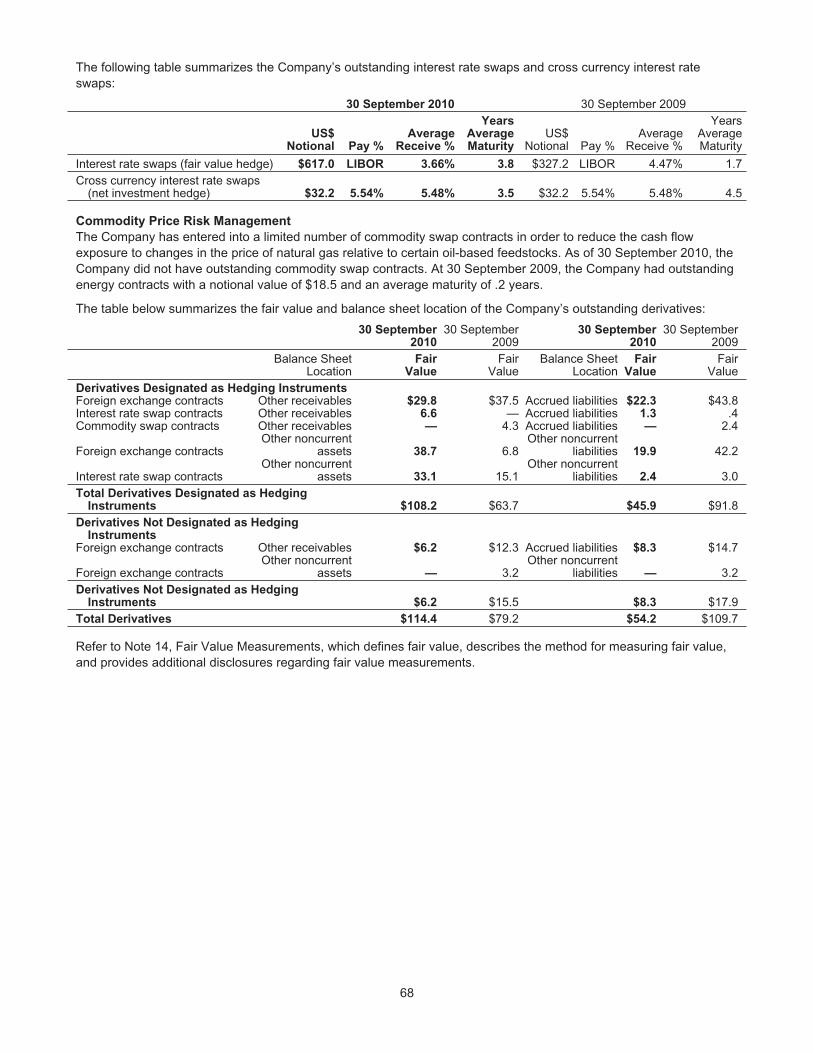
The following table summarizes the Company’s outstanding interest rate swaps and cross currency interest rateswaps:
30 September 2010 30 September 2009
US$Notional Pay %
AverageReceive %
YearsAverageMaturity
US$Notional Pay %
AverageReceive %
YearsAverageMaturity
Interest rate swaps (fair value hedge) $617.0 LIBOR 3.66% 3.8 $327.2 LIBOR 4.47% 1.7Cross currency interest rate swaps
(net investment hedge) $32.2 5.54% 5.48% 3.5 $32.2 5.54% 5.48% 4.5
Commodity Price Risk Management
The Company has entered into a limited number of commodity swap contracts in order to reduce the cash flowexposure to changes in the price of natural gas relative to certain oil-based feedstocks. As of 30 September 2010, theCompany did not have outstanding commodity swap contracts. At 30 September 2009, the Company had outstandingenergy contracts with a notional value of $18.5 and an average maturity of .2 years.
The table below summarizes the fair value and balance sheet location of the Company’s outstanding derivatives:
30 September2010
30 September2009
30 September2010
30 September2009
Balance SheetLocation
FairValue
FairValue
Balance SheetLocation
FairValue
FairValue
Derivatives Designated as Hedging InstrumentsForeign exchange contracts Other receivables $29.8 $37.5 Accrued liabilities $22.3 $43.8Interest rate swap contracts Other receivables 6.6 — Accrued liabilities 1.3 .4Commodity swap contracts Other receivables — 4.3 Accrued liabilities — 2.4
Foreign exchange contractsOther noncurrent
assets 38.7 6.8Other noncurrent
liabilities 19.9 42.2
Interest rate swap contractsOther noncurrent
assets 33.1 15.1Other noncurrent
liabilities 2.4 3.0Total Derivatives Designated as Hedging
Instruments $108.2 $63.7 $45.9 $91.8Derivatives Not Designated as Hedging
InstrumentsForeign exchange contracts Other receivables $6.2 $12.3 Accrued liabilities $8.3 $14.7
Foreign exchange contractsOther noncurrent
assets — 3.2Other noncurrent
liabilities — 3.2Derivatives Not Designated as Hedging
Instruments $6.2 $15.5 $8.3 $17.9Total Derivatives $114.4 $79.2 $54.2 $109.7
Refer to Note 14, Fair Value Measurements, which defines fair value, describes the method for measuring fair value,and provides additional disclosures regarding fair value measurements.
68
The table below summarizes the gain or loss related to the Company’s cash flow, net investment, and non-designatedhedges. The amounts of gain or loss associated with the outstanding fair value hedges are not material.
Year Ended 30 SeptemberForward
Exchange ContractsForeign Currency
Debt Other (A) Total2010 2009 2010 2009 2010 2009 2010 2009
Cash Flow Hedges
Net (gain) loss recognized in OCI(effective portion) $11.3 $7.2 $— $— $.3 $(2.7) $11.6 $4.5
Net gain (loss) reclassified from OCI to sales/cost of sales (effective portion) (10.8) (4.1) — — 2.0 5.3 (8.8) 1.2
Net gain (loss) reclassified from OCI to other(income) expense (effective portion) (6.2) (1.0) — — — — (6.2) (1.0)
Net gain (loss) reclassified from OCI to other(income) expense (ineffective portion) .2 .5 — — — — .2 .5
Net Investment Hedges
Net (gain) loss recognized in OCI $(58.4) $27.1 $(109.8) $52.0 $(.4) $(2.4) $(168.6) $76.7
Derivatives Not Designated as Hedging
Instruments
Net (gain) loss recognized in other (income)expense (B) $24.7 $14.5 $— $— $— $— $24.7 $14.5
(A) Other includes the impact on other comprehensive income (OCI) and earnings related to commodity swap contracts and interest rateswaps.
(B) The impact of the non-designated hedges noted above was largely offset by gains and losses, respectively, resulting from the impact ofchanges in exchange rates on recognized assets and liabilities denominated in nonfunctional currencies.
Credit Risk-Related Contingent Features
Certain derivative instruments are executed under agreements that require the Company to maintain a minimum creditrating opinion from a third party. If the Company’s credit rating falls below this threshold, the counterparty to thederivative instruments has the right to request full collateralization on the derivatives’ net liability position. The netliability position of derivatives with credit risk-related contingent features was $4.2 as of 30 September 2010 and $35.0as of 30 September 2009. Because the Company’s current credit rating is above the various pre-establishedthresholds, no collateral has been posted on these liability positions.
Counterparty Credit Risk Management
The Company executes all derivative transactions with counterparties that are highly rated financial institutions, all ofwhich are investment grade at this time. Some of the Company’s underlying derivative agreements give the Companythe right to require the institution to post collateral if its credit rating falls below the pre-established thresholds. Theseare the same agreements referenced in Credit Risk-Related Contingent Features above. The collateral that thecounterparties would be required to post was $52.2 as of 30 September 2010 and $14.7 as of 30 September 2009. Nofinancial institution is required to post collateral at this time, as all have credit ratings at or above the threshold.
14. Fair Value Measurements
Fair value is defined as an exit price (i.e., the price that would be received to sell an asset or paid to transfer a liabilityin an orderly transaction between market participants at the measurement date). The methods and assumptions usedto measure the fair value of financial instruments are as follows:
Derivatives
The fair value of the Company’s interest rate swap agreements and foreign exchange contracts are quantified usingthe income approach and are based on estimates using standard pricing models. These models take into account thevalue of future cash flows as of the balance sheet date, discounted to a present value using discount factors thatmatch both the time to maturity and currency of the underlying instruments. The computation of the fair values ofthese instruments is generally performed by the Company. These standard pricing models utilize inputs which arederived from or corroborated by observable market data such as interest rate yield curves and currency spot andforward rates. In addition, on an ongoing basis, the Company randomly tests a subset of its valuations against
69
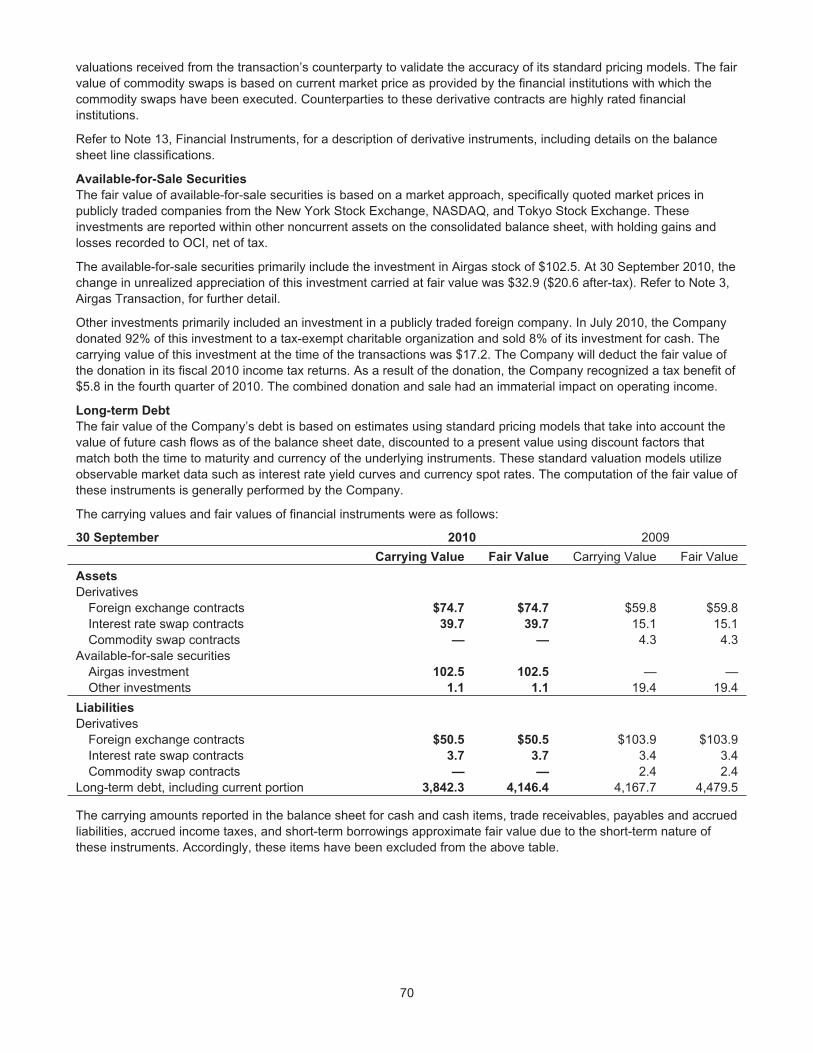
valuations received from the transaction’s counterparty to validate the accuracy of its standard pricing models. The fairvalue of commodity swaps is based on current market price as provided by the financial institutions with which thecommodity swaps have been executed. Counterparties to these derivative contracts are highly rated financialinstitutions.
Refer to Note 13, Financial Instruments, for a description of derivative instruments, including details on the balancesheet line classifications.
Available-for-Sale Securities
The fair value of available-for-sale securities is based on a market approach, specifically quoted market prices inpublicly traded companies from the New York Stock Exchange, NASDAQ, and Tokyo Stock Exchange. Theseinvestments are reported within other noncurrent assets on the consolidated balance sheet, with holding gains andlosses recorded to OCI, net of tax.
The available-for-sale securities primarily include the investment in Airgas stock of $102.5. At 30 September 2010, thechange in unrealized appreciation of this investment carried at fair value was $32.9 ($20.6 after-tax). Refer to Note 3,Airgas Transaction, for further detail.
Other investments primarily included an investment in a publicly traded foreign company. In July 2010, the Companydonated 92% of this investment to a tax-exempt charitable organization and sold 8% of its investment for cash. Thecarrying value of this investment at the time of the transactions was $17.2. The Company will deduct the fair value ofthe donation in its fiscal 2010 income tax returns. As a result of the donation, the Company recognized a tax benefit of$5.8 in the fourth quarter of 2010. The combined donation and sale had an immaterial impact on operating income.
Long-term Debt
The fair value of the Company’s debt is based on estimates using standard pricing models that take into account thevalue of future cash flows as of the balance sheet date, discounted to a present value using discount factors thatmatch both the time to maturity and currency of the underlying instruments. These standard valuation models utilizeobservable market data such as interest rate yield curves and currency spot rates. The computation of the fair value ofthese instruments is generally performed by the Company.
The carrying values and fair values of financial instruments were as follows:
30 September 2010 2009
Carrying Value Fair Value Carrying Value Fair Value
Assets
DerivativesForeign exchange contracts $74.7 $74.7 $59.8 $59.8Interest rate swap contracts 39.7 39.7 15.1 15.1Commodity swap contracts — — 4.3 4.3
Available-for-sale securitiesAirgas investment 102.5 102.5 — —Other investments 1.1 1.1 19.4 19.4
Liabilities
DerivativesForeign exchange contracts $50.5 $50.5 $103.9 $103.9Interest rate swap contracts 3.7 3.7 3.4 3.4Commodity swap contracts — — 2.4 2.4
Long-term debt, including current portion 3,842.3 4,146.4 4,167.7 4,479.5
The carrying amounts reported in the balance sheet for cash and cash items, trade receivables, payables and accruedliabilities, accrued income taxes, and short-term borrowings approximate fair value due to the short-term nature ofthese instruments. Accordingly, these items have been excluded from the above table.
70

The fair value hierarchy prioritizes the inputs to valuation techniques used to measure fair value into three broad levelsas follows:
Level 1—Quoted prices (unadjusted) in active markets for identical assets or liabilities.
Level 2—Inputs that are observable for the asset or liability, either directly or indirectly through market corroboration,for substantially the full term of the asset or liability.
Level 3—Inputs that are unobservable for the asset or liability based on the Company’s own assumptions (about theassumptions market participants would use in pricing the asset or liability).
The following table summarizes assets and liabilities measured at fair value on a recurring basis in the consolidatedbalance sheets:
30 September 2010 30 September 2009
Total Level 1 Level 2 Level 3 Total Level 1 Level 2 Level 3
Assets at Fair Value
DerivativesForeign exchange contracts $74.7 $— $74.7 $— $59.8 $— $59.8 $—Interest rate swap contracts 39.7 — 39.7 — 15.1 — 15.1 —Commodity swap contracts — — — — 4.3 — 4.3 —
Available-for-sale securitiesAirgas investment 102.5 102.5 — — — — — —Other investments 1.1 1.1 — — 19.4 19.4 — —
Total Assets at Fair Value $218.0 $103.6 $114.4 $— $98.6 $19.4 $79.2 $—
Liabilities at Fair Value
DerivativesForeign exchange contracts $50.5 $— $50.5 $— $103.9 $— $103.9 $—Interest rate swap contracts 3.7 — 3.7 — 3.4 — 3.4 —Commodity swap contracts — — — — 2.4 — 2.4 —
Total Liabilities at Fair Value $54.2 $— $54.2 $— $109.7 $— $109.7 $—
15. Debt
The tables below summarize the Company’s outstanding debt at 30 September 2010 and 2009:
Total Debt
30 September 2010 2009
Short-term borrowings $286.0 $333.8Current portion of long-term debt 182.5 452.1Long-term debt 3,659.8 3,715.6
Total Debt $4,128.3 $4,501.5
Short-term Borrowings
30 September 2010 2009
Bank obligations $225.1 $333.8Short-term borrowings associated with SAGA acquisition 60.9 —
Total Short-term Borrowings $286.0 $333.8
The weighted average interest rate of short-term borrowings outstanding at 30 September 2010 and 2009 was 3.2%and 3.9%, respectively.
71
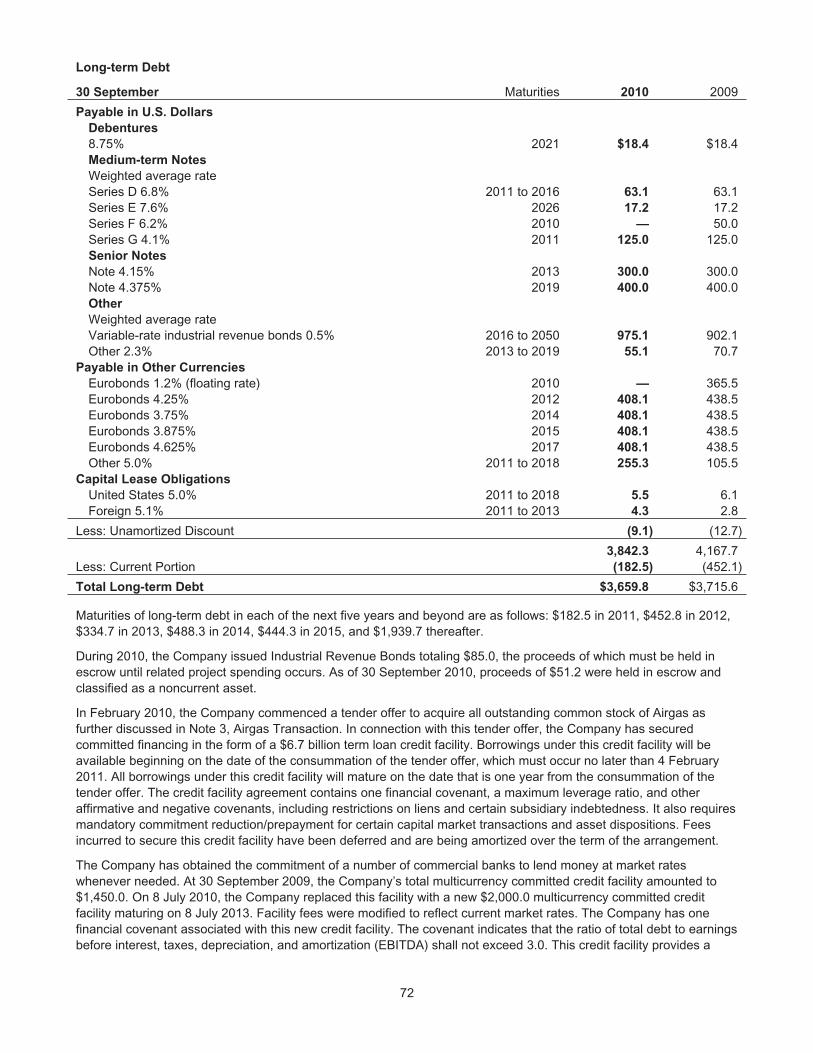
Long-term Debt
30 September Maturities 2010 2009
Payable in U.S. Dollars
Debentures
8.75% 2021 $18.4 $18.4Medium-term Notes
Weighted average rateSeries D 6.8% 2011 to 2016 63.1 63.1Series E 7.6% 2026 17.2 17.2Series F 6.2% 2010 — 50.0Series G 4.1% 2011 125.0 125.0Senior Notes
Note 4.15% 2013 300.0 300.0Note 4.375% 2019 400.0 400.0Other
Weighted average rateVariable-rate industrial revenue bonds 0.5% 2016 to 2050 975.1 902.1Other 2.3% 2013 to 2019 55.1 70.7
Payable in Other Currencies
Eurobonds 1.2% (floating rate) 2010 — 365.5Eurobonds 4.25% 2012 408.1 438.5Eurobonds 3.75% 2014 408.1 438.5Eurobonds 3.875% 2015 408.1 438.5Eurobonds 4.625% 2017 408.1 438.5Other 5.0% 2011 to 2018 255.3 105.5
Capital Lease Obligations
United States 5.0% 2011 to 2018 5.5 6.1Foreign 5.1% 2011 to 2013 4.3 2.8
Less: Unamortized Discount (9.1) (12.7)
3,842.3 4,167.7Less: Current Portion (182.5) (452.1)
Total Long-term Debt $3,659.8 $3,715.6
Maturities of long-term debt in each of the next five years and beyond are as follows: $182.5 in 2011, $452.8 in 2012,$334.7 in 2013, $488.3 in 2014, $444.3 in 2015, and $1,939.7 thereafter.
During 2010, the Company issued Industrial Revenue Bonds totaling $85.0, the proceeds of which must be held inescrow until related project spending occurs. As of 30 September 2010, proceeds of $51.2 were held in escrow andclassified as a noncurrent asset.
In February 2010, the Company commenced a tender offer to acquire all outstanding common stock of Airgas asfurther discussed in Note 3, Airgas Transaction. In connection with this tender offer, the Company has securedcommitted financing in the form of a $6.7 billion term loan credit facility. Borrowings under this credit facility will beavailable beginning on the date of the consummation of the tender offer, which must occur no later than 4 February2011. All borrowings under this credit facility will mature on the date that is one year from the consummation of thetender offer. The credit facility agreement contains one financial covenant, a maximum leverage ratio, and otheraffirmative and negative covenants, including restrictions on liens and certain subsidiary indebtedness. It also requiresmandatory commitment reduction/prepayment for certain capital market transactions and asset dispositions. Feesincurred to secure this credit facility have been deferred and are being amortized over the term of the arrangement.
The Company has obtained the commitment of a number of commercial banks to lend money at market rateswhenever needed. At 30 September 2009, the Company’s total multicurrency committed credit facility amounted to$1,450.0. On 8 July 2010, the Company replaced this facility with a new $2,000.0 multicurrency committed creditfacility maturing on 8 July 2013. Facility fees were modified to reflect current market rates. The Company has onefinancial covenant associated with this new credit facility. The covenant indicates that the ratio of total debt to earningsbefore interest, taxes, depreciation, and amortization (EBITDA) shall not exceed 3.0. This credit facility provides a
72
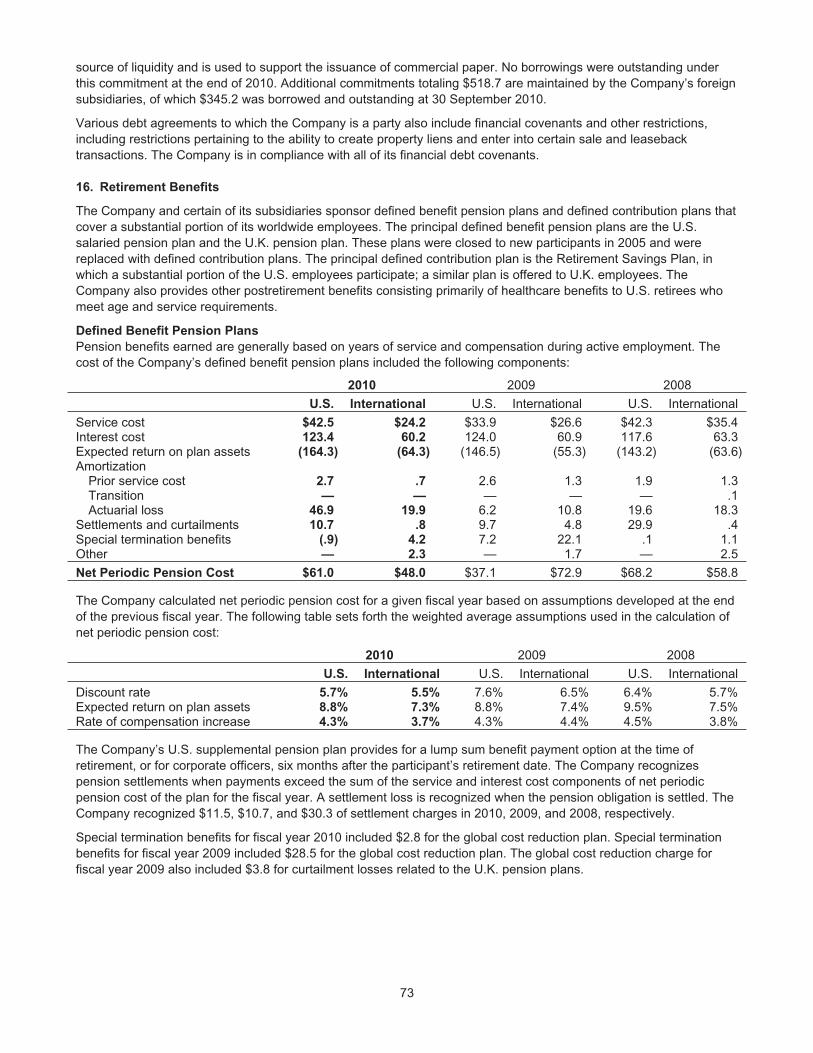
source of liquidity and is used to support the issuance of commercial paper. No borrowings were outstanding underthis commitment at the end of 2010. Additional commitments totaling $518.7 are maintained by the Company’s foreignsubsidiaries, of which $345.2 was borrowed and outstanding at 30 September 2010.
Various debt agreements to which the Company is a party also include financial covenants and other restrictions,including restrictions pertaining to the ability to create property liens and enter into certain sale and leasebacktransactions. The Company is in compliance with all of its financial debt covenants.
16. Retirement Benefits
The Company and certain of its subsidiaries sponsor defined benefit pension plans and defined contribution plans thatcover a substantial portion of its worldwide employees. The principal defined benefit pension plans are the U.S.salaried pension plan and the U.K. pension plan. These plans were closed to new participants in 2005 and werereplaced with defined contribution plans. The principal defined contribution plan is the Retirement Savings Plan, inwhich a substantial portion of the U.S. employees participate; a similar plan is offered to U.K. employees. TheCompany also provides other postretirement benefits consisting primarily of healthcare benefits to U.S. retirees whomeet age and service requirements.
Defined Benefit Pension Plans
Pension benefits earned are generally based on years of service and compensation during active employment. Thecost of the Company’s defined benefit pension plans included the following components:
2010 2009 2008
U.S. International U.S. International U.S. International
Service cost $42.5 $24.2 $33.9 $26.6 $42.3 $35.4Interest cost 123.4 60.2 124.0 60.9 117.6 63.3Expected return on plan assets (164.3) (64.3) (146.5) (55.3) (143.2) (63.6)Amortization
Prior service cost 2.7 .7 2.6 1.3 1.9 1.3Transition — — — — — .1Actuarial loss 46.9 19.9 6.2 10.8 19.6 18.3
Settlements and curtailments 10.7 .8 9.7 4.8 29.9 .4Special termination benefits (.9) 4.2 7.2 22.1 .1 1.1Other — 2.3 — 1.7 — 2.5
Net Periodic Pension Cost $61.0 $48.0 $37.1 $72.9 $68.2 $58.8
The Company calculated net periodic pension cost for a given fiscal year based on assumptions developed at the endof the previous fiscal year. The following table sets forth the weighted average assumptions used in the calculation ofnet periodic pension cost:
2010 2009 2008
U.S. International U.S. International U.S. International
Discount rate 5.7% 5.5% 7.6% 6.5% 6.4% 5.7%Expected return on plan assets 8.8% 7.3% 8.8% 7.4% 9.5% 7.5%Rate of compensation increase 4.3% 3.7% 4.3% 4.4% 4.5% 3.8%
The Company’s U.S. supplemental pension plan provides for a lump sum benefit payment option at the time ofretirement, or for corporate officers, six months after the participant’s retirement date. The Company recognizespension settlements when payments exceed the sum of the service and interest cost components of net periodicpension cost of the plan for the fiscal year. A settlement loss is recognized when the pension obligation is settled. TheCompany recognized $11.5, $10.7, and $30.3 of settlement charges in 2010, 2009, and 2008, respectively.
Special termination benefits for fiscal year 2010 included $2.8 for the global cost reduction plan. Special terminationbenefits for fiscal year 2009 included $28.5 for the global cost reduction plan. The global cost reduction charge forfiscal year 2009 also included $3.8 for curtailment losses related to the U.K. pension plans.
73
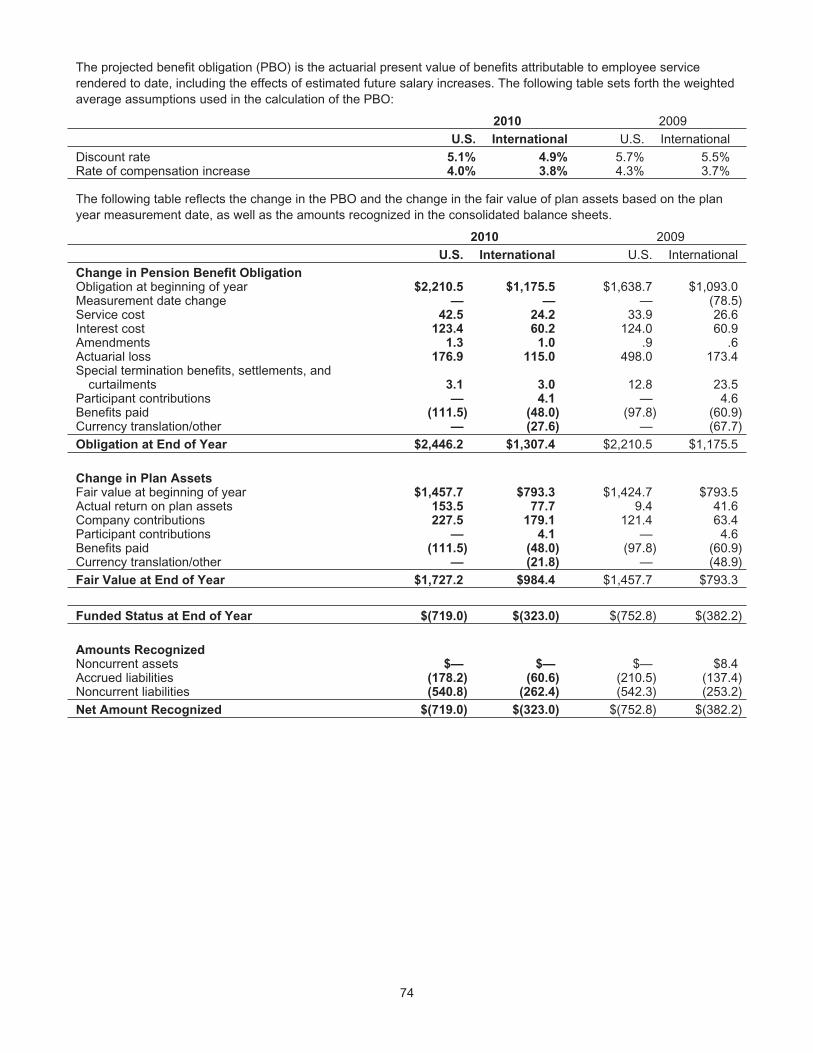
The projected benefit obligation (PBO) is the actuarial present value of benefits attributable to employee servicerendered to date, including the effects of estimated future salary increases. The following table sets forth the weightedaverage assumptions used in the calculation of the PBO:
2010 2009
U.S. International U.S. International
Discount rate 5.1% 4.9% 5.7% 5.5%Rate of compensation increase 4.0% 3.8% 4.3% 3.7%
The following table reflects the change in the PBO and the change in the fair value of plan assets based on the planyear measurement date, as well as the amounts recognized in the consolidated balance sheets.
2010 2009
U.S. International U.S. International
Change in Pension Benefit ObligationObligation at beginning of year $2,210.5 $1,175.5 $1,638.7 $1,093.0Measurement date change — — — (78.5)Service cost 42.5 24.2 33.9 26.6Interest cost 123.4 60.2 124.0 60.9Amendments 1.3 1.0 .9 .6Actuarial loss 176.9 115.0 498.0 173.4Special termination benefits, settlements, and
curtailments 3.1 3.0 12.8 23.5Participant contributions — 4.1 — 4.6Benefits paid (111.5) (48.0) (97.8) (60.9)Currency translation/other — (27.6) — (67.7)
Obligation at End of Year $2,446.2 $1,307.4 $2,210.5 $1,175.5
Change in Plan AssetsFair value at beginning of year $1,457.7 $793.3 $1,424.7 $793.5Actual return on plan assets 153.5 77.7 9.4 41.6Company contributions 227.5 179.1 121.4 63.4Participant contributions — 4.1 — 4.6Benefits paid (111.5) (48.0) (97.8) (60.9)Currency translation/other — (21.8) — (48.9)
Fair Value at End of Year $1,727.2 $984.4 $1,457.7 $793.3
Funded Status at End of Year $(719.0) $(323.0) $(752.8) $(382.2)
Amounts RecognizedNoncurrent assets $— $— $— $8.4Accrued liabilities (178.2) (60.6) (210.5) (137.4)Noncurrent liabilities (540.8) (262.4) (542.3) (253.2)
Net Amount Recognized $(719.0) $(323.0) $(752.8) $(382.2)
74
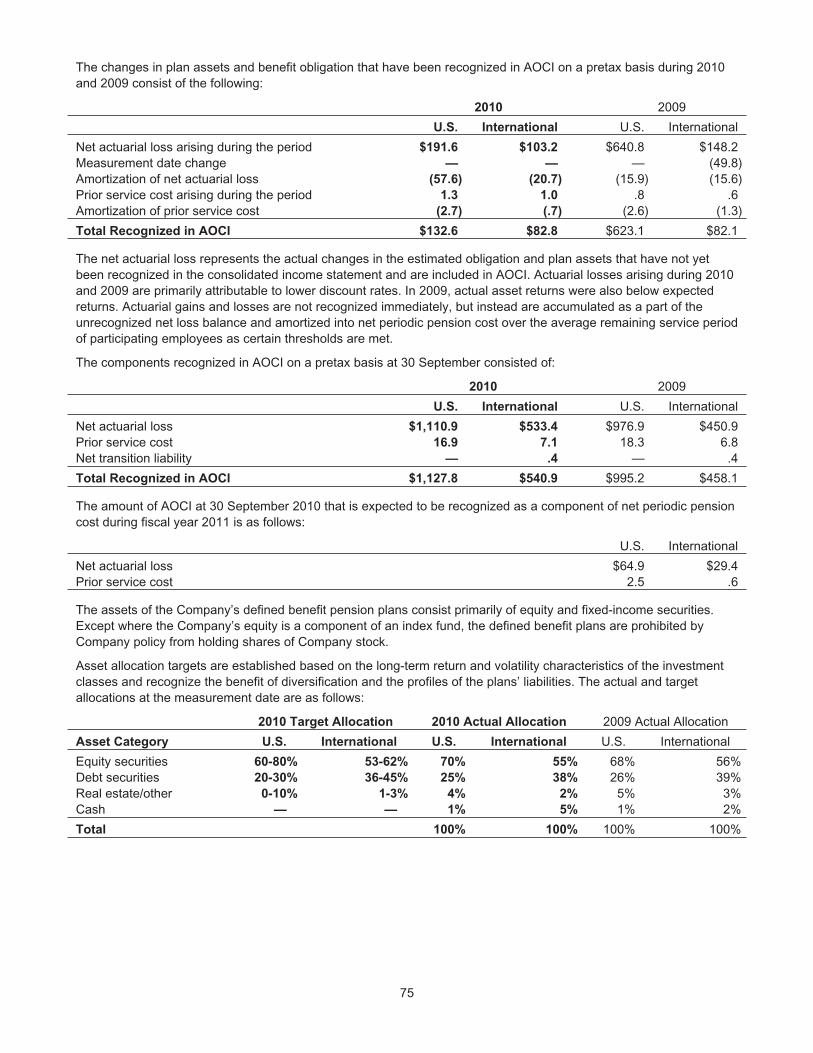
The changes in plan assets and benefit obligation that have been recognized in AOCI on a pretax basis during 2010and 2009 consist of the following:
2010 2009
U.S. International U.S. International
Net actuarial loss arising during the period $191.6 $103.2 $640.8 $148.2Measurement date change — — — (49.8)Amortization of net actuarial loss (57.6) (20.7) (15.9) (15.6)Prior service cost arising during the period 1.3 1.0 .8 .6Amortization of prior service cost (2.7) (.7) (2.6) (1.3)
Total Recognized in AOCI $132.6 $82.8 $623.1 $82.1
The net actuarial loss represents the actual changes in the estimated obligation and plan assets that have not yetbeen recognized in the consolidated income statement and are included in AOCI. Actuarial losses arising during 2010and 2009 are primarily attributable to lower discount rates. In 2009, actual asset returns were also below expectedreturns. Actuarial gains and losses are not recognized immediately, but instead are accumulated as a part of theunrecognized net loss balance and amortized into net periodic pension cost over the average remaining service periodof participating employees as certain thresholds are met.
The components recognized in AOCI on a pretax basis at 30 September consisted of:
2010 2009
U.S. International U.S. International
Net actuarial loss $1,110.9 $533.4 $976.9 $450.9Prior service cost 16.9 7.1 18.3 6.8Net transition liability — .4 — .4
Total Recognized in AOCI $1,127.8 $540.9 $995.2 $458.1
The amount of AOCI at 30 September 2010 that is expected to be recognized as a component of net periodic pensioncost during fiscal year 2011 is as follows:
U.S. International
Net actuarial loss $64.9 $29.4Prior service cost 2.5 .6
The assets of the Company’s defined benefit pension plans consist primarily of equity and fixed-income securities.Except where the Company’s equity is a component of an index fund, the defined benefit plans are prohibited byCompany policy from holding shares of Company stock.
Asset allocation targets are established based on the long-term return and volatility characteristics of the investmentclasses and recognize the benefit of diversification and the profiles of the plans’ liabilities. The actual and targetallocations at the measurement date are as follows:
2010 Target Allocation 2010 Actual Allocation 2009 Actual Allocation
Asset Category U.S. International U.S. International U.S. International
Equity securities 60-80% 53-62% 70% 55% 68% 56%Debt securities 20-30% 36-45% 25% 38% 26% 39%Real estate/other 0-10% 1-3% 4% 2% 5% 3%Cash — — 1% 5% 1% 2%
Total 100% 100% 100% 100%
75

The following table summarizes pension plan assets measured at fair value by asset class at 30 September 2010 (seeNote 14, Fair Value Measurements, for definition of the levels):
Fair Value
Total Level 1 Level 2 Level 3
U.S. Qualified Pension Plans
Cash and cash equivalents $8.3 $8.3 $— $—
Equity securities 551.1 551.1 — —
Equity mutual funds 87.4 87.4 — —
Equity pooled funds 573.1 — 573.1 —
Fixed IncomeBonds (government and corporate) 17.8 — 17.8 —
Mortgage and asset-backed securities 31.7 — 31.7 —
Mutual funds 50.6 50.6 — —
Pooled funds 330.2 — 330.2 —
Real estate pooled funds 77.0 — — 77.0
Total U.S. Qualified Pension Plans $1,727.2 $697.4 $952.8 $77.0
International Pension Plans
Cash and cash equivalents $46.5 $46.5 $— $—
Equity pooled funds 538.3 — 538.3 —
Fixed income pooled funds 297.6 — 297.6 —
Other pooled funds 25.9 — 8.0 17.9
Insurance contracts 76.1 — — 76.1
Total International Pension Plans $984.4 $46.5 $843.9 $94.0
The following table summarizes changes in fair value of the pension plan assets classified as Level 3, by asset class,for the period ended 30 September 2010:
Actual Return On Plan Assets
Fair ValueBeginning
of YearAssets HeldEnd of year
Assets SoldDuring Period
Purchases,Sales, and
Settlements, Net
Fair Value
End
of Year
U.S. Qualified Pension Plans
Real estate pooled funds $72.7 $4.3 $— $— $77.0
Total U.S. Qualified Pension Plans $72.7 $4.3 $— $— $77.0
International Pension Plans
Other pooled funds $13.0 $.5 $.2 $4.2 $17.9
Insurance contracts 66.7 5.1 — 4.3 76.1
Total International Pension Plans $79.7 $5.6 $.2 $8.5 $94.0
The descriptions and fair value methodologies for the U.S. and International pension plan assets are as follows:
Cash and Cash Equivalents
The carrying amounts of cash and cash equivalents approximate fair value due to the short-term maturity.
Equity Securities
Equity securities are valued at the closing market price reported on a U.S. exchange where the security is activelytraded and are therefore classified as Level 1 assets.
Mutual Funds
Shares of mutual funds are valued at the net asset value (NAV) quoted on the exchange where the fund is traded andare classified as Level 1 assets. NAV is used as a practical expedient for fair value.
76
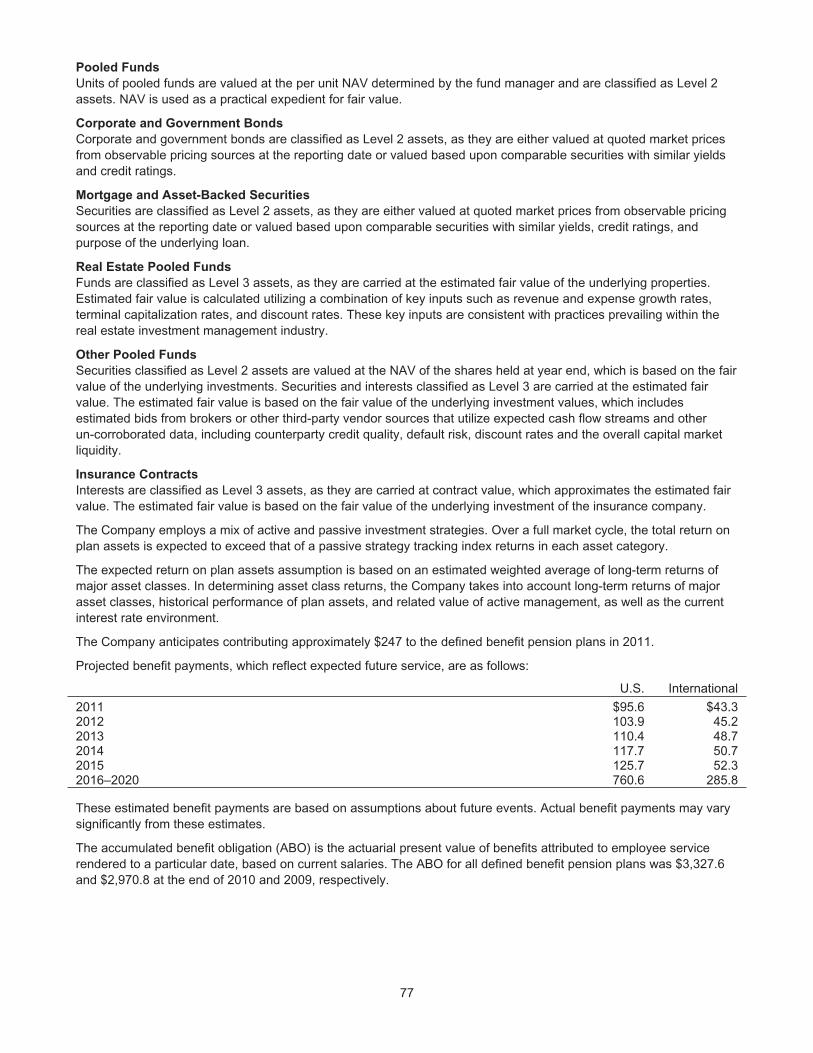
Pooled Funds
Units of pooled funds are valued at the per unit NAV determined by the fund manager and are classified as Level 2assets. NAV is used as a practical expedient for fair value.
Corporate and Government Bonds
Corporate and government bonds are classified as Level 2 assets, as they are either valued at quoted market pricesfrom observable pricing sources at the reporting date or valued based upon comparable securities with similar yieldsand credit ratings.
Mortgage and Asset-Backed Securities
Securities are classified as Level 2 assets, as they are either valued at quoted market prices from observable pricingsources at the reporting date or valued based upon comparable securities with similar yields, credit ratings, andpurpose of the underlying loan.
Real Estate Pooled Funds
Funds are classified as Level 3 assets, as they are carried at the estimated fair value of the underlying properties.Estimated fair value is calculated utilizing a combination of key inputs such as revenue and expense growth rates,terminal capitalization rates, and discount rates. These key inputs are consistent with practices prevailing within thereal estate investment management industry.
Other Pooled Funds
Securities classified as Level 2 assets are valued at the NAV of the shares held at year end, which is based on the fairvalue of the underlying investments. Securities and interests classified as Level 3 are carried at the estimated fairvalue. The estimated fair value is based on the fair value of the underlying investment values, which includesestimated bids from brokers or other third-party vendor sources that utilize expected cash flow streams and otherun-corroborated data, including counterparty credit quality, default risk, discount rates and the overall capital marketliquidity.
Insurance Contracts
Interests are classified as Level 3 assets, as they are carried at contract value, which approximates the estimated fairvalue. The estimated fair value is based on the fair value of the underlying investment of the insurance company.
The Company employs a mix of active and passive investment strategies. Over a full market cycle, the total return onplan assets is expected to exceed that of a passive strategy tracking index returns in each asset category.
The expected return on plan assets assumption is based on an estimated weighted average of long-term returns ofmajor asset classes. In determining asset class returns, the Company takes into account long-term returns of majorasset classes, historical performance of plan assets, and related value of active management, as well as the currentinterest rate environment.
The Company anticipates contributing approximately $247 to the defined benefit pension plans in 2011.
Projected benefit payments, which reflect expected future service, are as follows:
U.S. International
2011 $95.6 $43.32012 103.9 45.22013 110.4 48.72014 117.7 50.72015 125.7 52.32016–2020 760.6 285.8
These estimated benefit payments are based on assumptions about future events. Actual benefit payments may varysignificantly from these estimates.
The accumulated benefit obligation (ABO) is the actuarial present value of benefits attributed to employee servicerendered to a particular date, based on current salaries. The ABO for all defined benefit pension plans was $3,327.6and $2,970.8 at the end of 2010 and 2009, respectively.
77
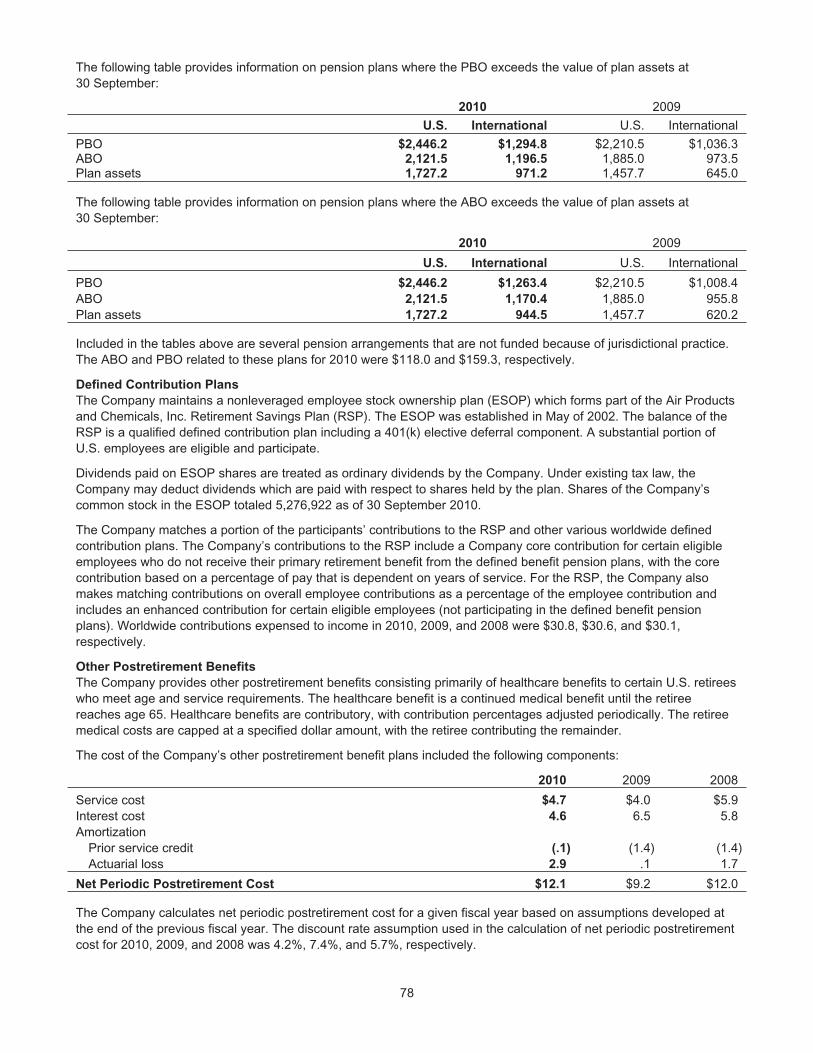
The following table provides information on pension plans where the PBO exceeds the value of plan assets at30 September:
2010 2009
U.S. International U.S. International
PBO $2,446.2 $1,294.8 $2,210.5 $1,036.3ABO 2,121.5 1,196.5 1,885.0 973.5Plan assets 1,727.2 971.2 1,457.7 645.0
The following table provides information on pension plans where the ABO exceeds the value of plan assets at30 September:
2010 2009
U.S. International U.S. International
PBO $2,446.2 $1,263.4 $2,210.5 $1,008.4ABO 2,121.5 1,170.4 1,885.0 955.8Plan assets 1,727.2 944.5 1,457.7 620.2
Included in the tables above are several pension arrangements that are not funded because of jurisdictional practice.The ABO and PBO related to these plans for 2010 were $118.0 and $159.3, respectively.
Defined Contribution Plans
The Company maintains a nonleveraged employee stock ownership plan (ESOP) which forms part of the Air Productsand Chemicals, Inc. Retirement Savings Plan (RSP). The ESOP was established in May of 2002. The balance of theRSP is a qualified defined contribution plan including a 401(k) elective deferral component. A substantial portion ofU.S. employees are eligible and participate.
Dividends paid on ESOP shares are treated as ordinary dividends by the Company. Under existing tax law, theCompany may deduct dividends which are paid with respect to shares held by the plan. Shares of the Company’scommon stock in the ESOP totaled 5,276,922 as of 30 September 2010.
The Company matches a portion of the participants’ contributions to the RSP and other various worldwide definedcontribution plans. The Company’s contributions to the RSP include a Company core contribution for certain eligibleemployees who do not receive their primary retirement benefit from the defined benefit pension plans, with the corecontribution based on a percentage of pay that is dependent on years of service. For the RSP, the Company alsomakes matching contributions on overall employee contributions as a percentage of the employee contribution andincludes an enhanced contribution for certain eligible employees (not participating in the defined benefit pensionplans). Worldwide contributions expensed to income in 2010, 2009, and 2008 were $30.8, $30.6, and $30.1,respectively.
Other Postretirement Benefits
The Company provides other postretirement benefits consisting primarily of healthcare benefits to certain U.S. retireeswho meet age and service requirements. The healthcare benefit is a continued medical benefit until the retireereaches age 65. Healthcare benefits are contributory, with contribution percentages adjusted periodically. The retireemedical costs are capped at a specified dollar amount, with the retiree contributing the remainder.
The cost of the Company’s other postretirement benefit plans included the following components:
2010 2009 2008
Service cost $4.7 $4.0 $5.9Interest cost 4.6 6.5 5.8Amortization
Prior service credit (.1) (1.4) (1.4)Actuarial loss 2.9 .1 1.7
Net Periodic Postretirement Cost $12.1 $9.2 $12.0
The Company calculates net periodic postretirement cost for a given fiscal year based on assumptions developed atthe end of the previous fiscal year. The discount rate assumption used in the calculation of net periodic postretirementcost for 2010, 2009, and 2008 was 4.2%, 7.4%, and 5.7%, respectively.
78
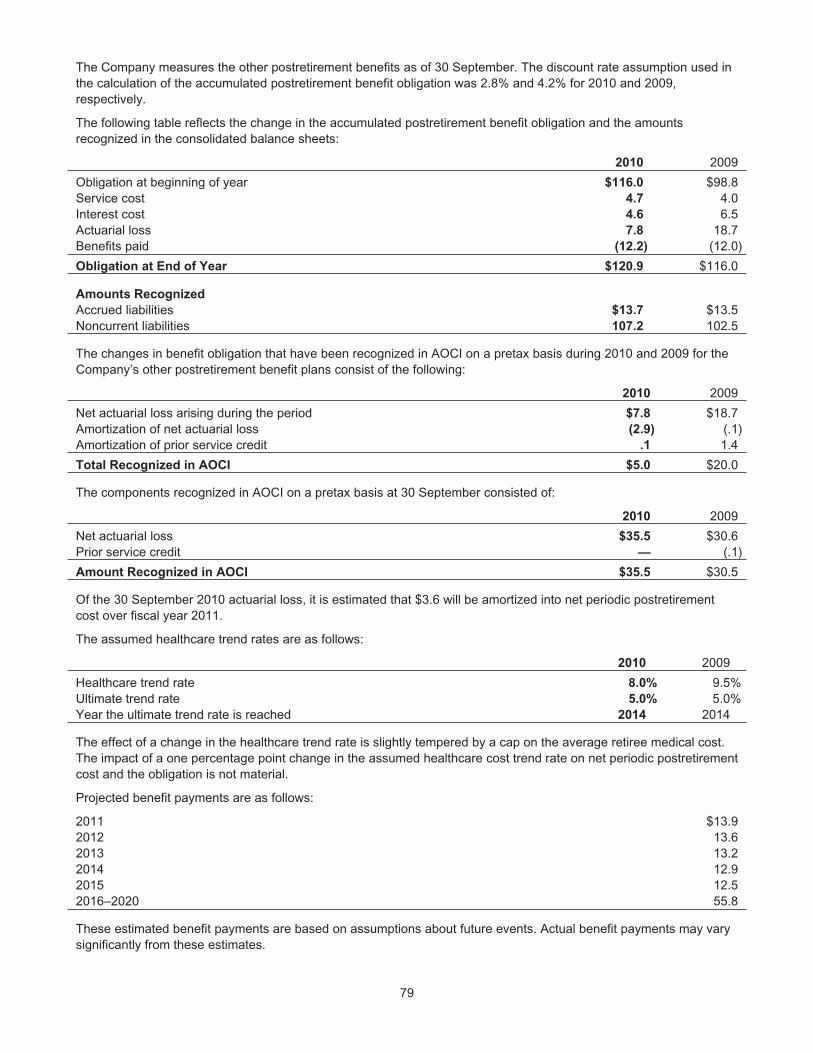
The Company measures the other postretirement benefits as of 30 September. The discount rate assumption used inthe calculation of the accumulated postretirement benefit obligation was 2.8% and 4.2% for 2010 and 2009,respectively.
The following table reflects the change in the accumulated postretirement benefit obligation and the amountsrecognized in the consolidated balance sheets:
2010 2009
Obligation at beginning of year $116.0 $98.8Service cost 4.7 4.0Interest cost 4.6 6.5Actuarial loss 7.8 18.7Benefits paid (12.2) (12.0)
Obligation at End of Year $120.9 $116.0
Amounts Recognized
Accrued liabilities $13.7 $13.5Noncurrent liabilities 107.2 102.5
The changes in benefit obligation that have been recognized in AOCI on a pretax basis during 2010 and 2009 for theCompany’s other postretirement benefit plans consist of the following:
2010 2009
Net actuarial loss arising during the period $7.8 $18.7Amortization of net actuarial loss (2.9) (.1)Amortization of prior service credit .1 1.4
Total Recognized in AOCI $5.0 $20.0
The components recognized in AOCI on a pretax basis at 30 September consisted of:
2010 2009
Net actuarial loss $35.5 $30.6Prior service credit — (.1)
Amount Recognized in AOCI $35.5 $30.5
Of the 30 September 2010 actuarial loss, it is estimated that $3.6 will be amortized into net periodic postretirementcost over fiscal year 2011.
The assumed healthcare trend rates are as follows:
2010 2009
Healthcare trend rate 8.0% 9.5%Ultimate trend rate 5.0% 5.0%Year the ultimate trend rate is reached 2014 2014
The effect of a change in the healthcare trend rate is slightly tempered by a cap on the average retiree medical cost.The impact of a one percentage point change in the assumed healthcare cost trend rate on net periodic postretirementcost and the obligation is not material.
Projected benefit payments are as follows:
2011 $13.92012 13.62013 13.22014 12.92015 12.52016–2020 55.8
These estimated benefit payments are based on assumptions about future events. Actual benefit payments may varysignificantly from these estimates.
79
17. Commitments and Contingencies
Litigation
The Company is involved in various legal proceedings, including competition, environmental, health, safety, productliability, and insurance matters. In September 2010, the Brazilian Administrative Council for Economic Defense(CADE) issued a decision against the Company’s Brazilian subsidiary, Air Products Brasil Ltda., and several otherBrazilian industrial gas companies for alleged anticompetitive activities. CADE imposed a civil fine of R$179.2 on AirProducts Brasil Ltda. This fine was based on a recommendation by a unit of the Brazilian Ministry of Justice whoseinvestigation began in 2003 alleging violation of competition laws with respect to the sale of industrial and medicalgases. The fines are based on a percentage of the Company’s total revenue in Brazil in 2003.
The Company has denied the allegations made by the authorities and filed an appeal in October 2010 to the Braziliancourts. Certain of the Company’s defenses, if successful, could result in the matter being dismissed with no fineagainst the Company. The Company, with advice of its outside legal counsel, has assessed the status of this matterand has concluded that although an adverse final judgment after exhausting all appeals is reasonably possible, such ajudgment is not probable. As a result, no provision has been made in the consolidated financial statements.
The Company is required to provide security in order to suspend execution of the judgment during the appeal process,during which time interest will accrue on the fine. The security could be in the form of a bank guarantee or in otherforms which the courts deem acceptable. The security is only collectible by the courts in the event the Company is notsuccessful in its appeal and does not timely pay the fine. The form of security to be provided by the Company has notbeen finally determined.
While the Company does not expect that any sums it may have to pay in connection with this or any other legalproceeding would have a materially adverse effect on its consolidated financial position or net cash flows, a futurecharge for regulatory fines or damage awards could have a significant impact on the Company’s net income in theperiod in which it is recorded.
Environmental
In the normal course of business, the Company is involved in legal proceedings under the federal Superfund law,similar state environmental laws, and RCRA relating to the designation of certain sites for investigation or remediation.Presently, there are approximately 30 sites on which a final settlement has not been reached where the Company,along with others, has been designated a potentially responsible party by the Environmental Protection Agency or isotherwise engaged in investigation or remediation. In addition, the Company is also involved in cleanup activities atcertain of its current and former manufacturing sites. The Company continually monitors these sites for which it hasenvironmental exposure.
Accruals for environmental loss contingencies are recorded when it is probable that a liability has been incurred andthe amount of loss can be reasonably estimated consistent with the policy set forth in Note 1, Major AccountingPolicies. The consolidated balance sheets at 30 September 2010 and 2009 included an accrual of $87.0 and $95.0,respectively, primarily as part of other noncurrent liabilities. The environmental liabilities will be paid over a period ofup to 30 years. The Company estimates the exposure for environmental loss contingencies to range from $87 to areasonably possible upper exposure of $101 as of 30 September 2010.
Actual costs to be incurred at identified sites in future periods may vary from the estimates, given inherentuncertainties in evaluating environmental exposures. Using reasonably possible alternative assumptions of theexposure level could result in an increase to the environmental accrual. Due to the inherent uncertainties related toenvironmental exposures, a significant increase to the reasonably possible upper exposure level could occur if a newsite is designated, the scope of remediation is increased, a different remediation alternative is identified, or asignificant increase in the Company’s proportionate share occurs. The Company does not expect that any sum it mayhave to pay in connection with environmental matters in excess of the amounts recorded or disclosed above wouldhave a material adverse impact on its financial position or results of operations in any one year.
PACE
At 30 September 2010, $36.5 of the environmental accrual was related to the Pace facility.
In 2006, the Company sold its Amines business, which included operations at Pace, Florida and recognized a liabilityfor retained environmental obligations associated with remediation activities at Pace. The Company is required by the
80
Florida Department of Environmental Protection (FDEP) and the United States Environmental Protection Agency(USEPA) to continue its remediation efforts. The Company estimated that it would take about 20 years to complete thegroundwater remediation, and the costs through completion were estimated to range from $42 to $50. As no amountwithin the range was a better estimate than another, the Company recognized a pretax expense in fiscal 2006 of$42.0 as a component of income from discontinued operations and recorded an environmental accrual of $42.0 incontinuing operations on the consolidated balance sheets. There has been no change to the estimated exposurerange related to the Pace facility.
The Company has implemented many of the remedial corrective measures at the Pace, Florida facility required under1995 Consent Orders issued by the FDEP and the USEPA. Contaminated soils have been bioremediated, and thetreated soils have been secured in a lined on-site disposal cell. Several groundwater recovery systems have beeninstalled to contain and remove contamination from groundwater. The Company completed an extensive assessmentof the site to determine how well existing measures are working, what additional corrective measures may be needed,and whether newer remediation technologies that were not available in the 1990s might be suitable to more quicklyand effectively remove groundwater contaminants. Based on assessment results, the Company completed a focusedfeasibility study that identified new and alternative approaches which should more effectively remove contaminantsand achieve the targeted remediation goals. The Company is reviewing the new approaches with the FDEP.
PIEDMONT
At 30 September 2010, $21.5 of the environmental accrual was related to the Piedmont site.
On 30 June 2008, the Company sold its Elkton, Maryland and Piedmont, South Carolina production facilities and therelated North American atmospheric emulsions and global pressure sensitive adhesives businesses. In connectionwith the sale, the Company recognized a liability for retained environmental obligations associated with remediationactivities at the Piedmont site. This site is under active remediation for contamination caused by an insolvent priorowner. The sale of the site triggered expense recognition. Prior to the sale, remediation costs had been capitalizedsince they improved the property as compared to its condition when originally acquired. The Company is required bythe South Carolina Department of Health and Environmental Control to address both contaminated soil andgroundwater. Numerous areas of soil contamination have been addressed, and contaminated groundwater is beingrecovered and treated. The Company estimated that it would take until 2015 to complete source area remediation andanother 15 years thereafter to complete groundwater recovery, with costs through completion estimated to be $24.0.The Company recognized a pretax expense in 2008 of $24.0 as a component of income from discontinued operationsand recorded an environmental liability of $24.0 in continuing operations on the consolidated balance sheets. Therehas been no change to the estimated exposure.
PAULSBORO
At 30 September 2010, $14.0 of the environmental accrual was related to the Paulsboro site.
During the first quarter of 2009, management committed to a plan to sell the production facility in Paulsboro, NewJersey and recognized a $16.0 environmental liability associated with this site. In December 2009, the Companycompleted the sale of this facility. The Company is required by the New Jersey state law to investigate and, ifcontaminated, remediate a site upon its sale. The Company estimates that it will take at least several years tocomplete the investigation/remediation efforts at this site.
Guarantees and Warranties
The Company is a party to certain guarantee agreements, including debt guarantees of equity affiliates and equitysupport agreements. These guarantees are contingent commitments that are related to activities of the Company’sprimary businesses.
The Company has guaranteed repayment of some additional borrowings of certain unconsolidated equity affiliates. At30 September 2010, these guarantees have terms in the range of two to eight years, with maximum potentialpayments of $28.7.
The Company has entered into an equity support agreement and operations guarantee related to an air separationfacility constructed in Trinidad for a venture in which the Company owns 50%. At 30 September 2010, maximumpotential payments under joint and several guarantees were $68.0. Exposures under the guarantee decline over timeand are completely extinguished by 2024.
To date, no equity contributions or payments have been required since the inception of these guarantees. The fairvalue of the above guarantees is not material.
81
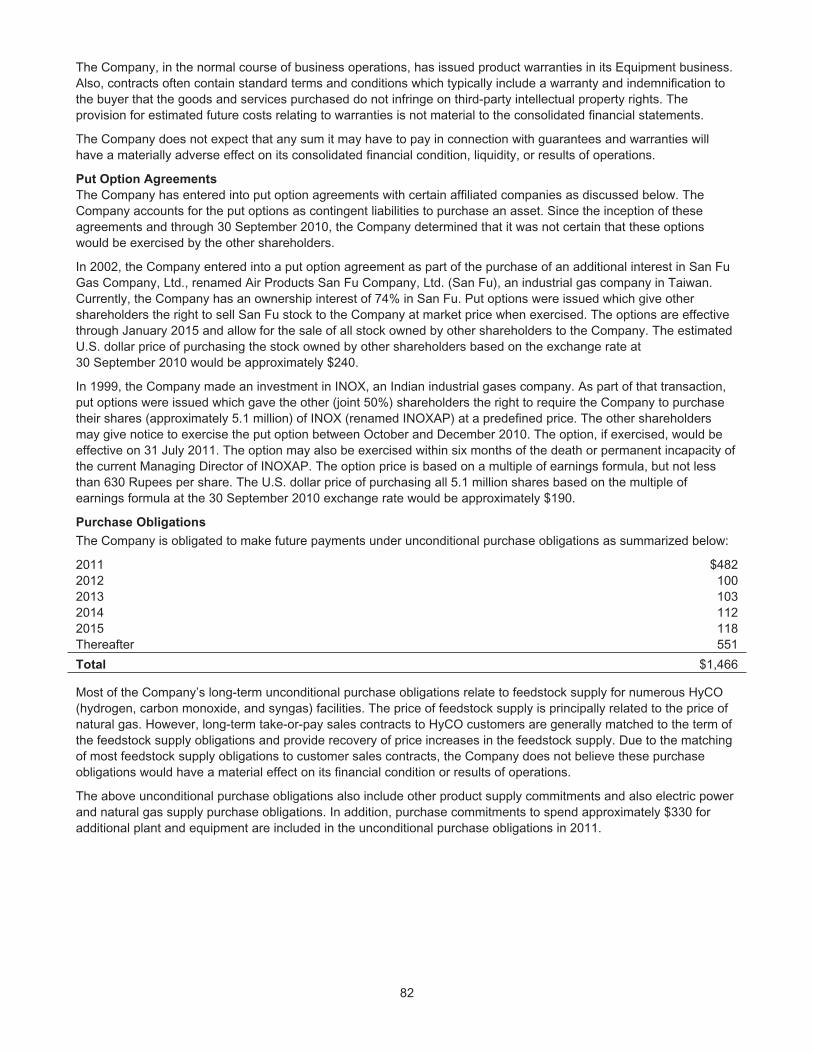
The Company, in the normal course of business operations, has issued product warranties in its Equipment business.Also, contracts often contain standard terms and conditions which typically include a warranty and indemnification tothe buyer that the goods and services purchased do not infringe on third-party intellectual property rights. Theprovision for estimated future costs relating to warranties is not material to the consolidated financial statements.
The Company does not expect that any sum it may have to pay in connection with guarantees and warranties willhave a materially adverse effect on its consolidated financial condition, liquidity, or results of operations.
Put Option Agreements
The Company has entered into put option agreements with certain affiliated companies as discussed below. TheCompany accounts for the put options as contingent liabilities to purchase an asset. Since the inception of theseagreements and through 30 September 2010, the Company determined that it was not certain that these optionswould be exercised by the other shareholders.
In 2002, the Company entered into a put option agreement as part of the purchase of an additional interest in San FuGas Company, Ltd., renamed Air Products San Fu Company, Ltd. (San Fu), an industrial gas company in Taiwan.Currently, the Company has an ownership interest of 74% in San Fu. Put options were issued which give othershareholders the right to sell San Fu stock to the Company at market price when exercised. The options are effectivethrough January 2015 and allow for the sale of all stock owned by other shareholders to the Company. The estimatedU.S. dollar price of purchasing the stock owned by other shareholders based on the exchange rate at30 September 2010 would be approximately $240.
In 1999, the Company made an investment in INOX, an Indian industrial gases company. As part of that transaction,put options were issued which gave the other (joint 50%) shareholders the right to require the Company to purchasetheir shares (approximately 5.1 million) of INOX (renamed INOXAP) at a predefined price. The other shareholdersmay give notice to exercise the put option between October and December 2010. The option, if exercised, would beeffective on 31 July 2011. The option may also be exercised within six months of the death or permanent incapacity ofthe current Managing Director of INOXAP. The option price is based on a multiple of earnings formula, but not lessthan 630 Rupees per share. The U.S. dollar price of purchasing all 5.1 million shares based on the multiple ofearnings formula at the 30 September 2010 exchange rate would be approximately $190.
Purchase Obligations
The Company is obligated to make future payments under unconditional purchase obligations as summarized below:
2011 $4822012 1002013 1032014 1122015 118Thereafter 551
Total $1,466
Most of the Company’s long-term unconditional purchase obligations relate to feedstock supply for numerous HyCO(hydrogen, carbon monoxide, and syngas) facilities. The price of feedstock supply is principally related to the price ofnatural gas. However, long-term take-or-pay sales contracts to HyCO customers are generally matched to the term ofthe feedstock supply obligations and provide recovery of price increases in the feedstock supply. Due to the matchingof most feedstock supply obligations to customer sales contracts, the Company does not believe these purchaseobligations would have a material effect on its financial condition or results of operations.
The above unconditional purchase obligations also include other product supply commitments and also electric powerand natural gas supply purchase obligations. In addition, purchase commitments to spend approximately $330 foradditional plant and equipment are included in the unconditional purchase obligations in 2011.
82

18. Capital Stock
Authorized capital stock consists of 25 million preferred shares with a par value of $1 per share, none of which wasoutstanding at 30 September 2010, and 300 million shares of common stock with a par value of $1 per share.
In 2007, the Board of Directors authorized the repurchase of up to $1,000 of the Company’s outstanding commonstock. The Company repurchases shares pursuant to Rules 10b5-1 and 10b-18 under the Securities Exchange Act of1934, as amended, through a 10b5-1 written repurchase plan established with several brokers. At 30 September2010, $649.2 in share repurchase authorization remained.
19. Share-Based Compensation
The Company has various share-based compensation programs, which include stock options, deferred stock units,and restricted stock. Under all programs, the terms of the awards are fixed at the grant date. The Company issuesshares from treasury stock upon the exercise of stock options, the payout of deferred stock units, and the issuance ofrestricted stock awards. As of 30 September 2010, there were 6,381,410 shares available for future grant under theCompany’s Long-Term Incentive Plan, which is shareholder approved.
Share-based compensation cost recognized in the consolidated income statement is summarized below:
2010 2009 2008
Cost of sales $4.0 $7.9 $8.7Selling and administrative 42.5 46.9 47.0Research and development 2.1 4.1 5.7Global cost reduction plan — 1.5 —
Before-Tax Share-Based Compensation Cost 48.6 60.4 61.4Income tax benefit (18.3) (23.3) (23.6)
After-Tax Share-Based Compensation Cost $30.3 $37.1 $37.8
The amount of share-based compensation cost capitalized in 2010, 2009, and 2008 was not material.
Total before-tax share-based compensation cost by type of program was as follows:
2010 2009 2008
Stock options $25.0 $38.3 $36.5Deferred stock units 21.5 19.2 22.6Restricted stock 2.1 2.9 2.3
Before-Tax Share-Based Compensation Cost $48.6 $60.4 $61.4
Stock Options
The Company has granted awards of options to purchase common stock to executives, selected employees, andoutside directors. The exercise price of stock options equals the market price of the Company’s stock on the date ofthe grant. Options generally vest incrementally over three years, and remain exercisable for ten years from the date ofgrant. Options have not been issued to directors since 2005.
The fair value of options granted was estimated using a lattice-based option valuation model that used theassumptions noted in the table below. Expected volatility and expected dividend yield are based on actual historicalexperience of the Company’s stock and dividends over the historical period equal to the option term. The expected liferepresents the period of time that options granted are expected to be outstanding based on an analysis of Company-specific historical exercise data. The range given below results from certain groups of employees exhibiting differentbehavior. Groups of employees that have similar historical exercise behavior were considered separately for valuationpurposes. The risk-free rate is based on the U.S. Treasury Strips with terms equal to the expected time of exercise asof the grant date.
2010 2009 2008
Expected volatility 32.6% 31.2% 30.4%Expected dividend yield 2.1% 2.1% 2.1%Expected life (in years) 6.8-8.0 6.8-8.0 6.8-8.0Risk-free interest rate 2.9%–3.3% 3.5%–3.9% 4.5%–4.6%
83
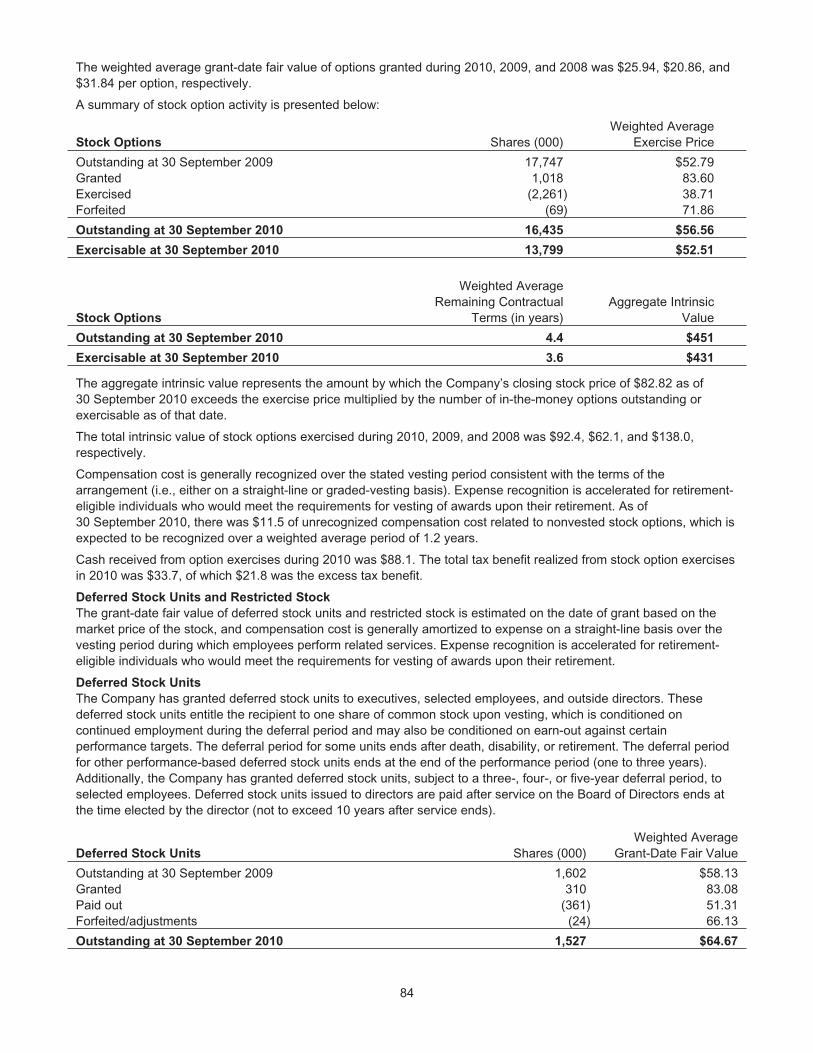
The weighted average grant-date fair value of options granted during 2010, 2009, and 2008 was $25.94, $20.86, and$31.84 per option, respectively.
A summary of stock option activity is presented below:
Stock Options Shares (000)Weighted Average
Exercise Price
Outstanding at 30 September 2009 17,747 $52.79Granted 1,018 83.60Exercised (2,261) 38.71Forfeited (69) 71.86
Outstanding at 30 September 2010 16,435 $56.56
Exercisable at 30 September 2010 13,799 $52.51
Stock Options
Weighted AverageRemaining Contractual
Terms (in years)Aggregate Intrinsic
Value
Outstanding at 30 September 2010 4.4 $451
Exercisable at 30 September 2010 3.6 $431
The aggregate intrinsic value represents the amount by which the Company’s closing stock price of $82.82 as of30 September 2010 exceeds the exercise price multiplied by the number of in-the-money options outstanding orexercisable as of that date.
The total intrinsic value of stock options exercised during 2010, 2009, and 2008 was $92.4, $62.1, and $138.0,respectively.
Compensation cost is generally recognized over the stated vesting period consistent with the terms of thearrangement (i.e., either on a straight-line or graded-vesting basis). Expense recognition is accelerated for retirement-eligible individuals who would meet the requirements for vesting of awards upon their retirement. As of30 September 2010, there was $11.5 of unrecognized compensation cost related to nonvested stock options, which isexpected to be recognized over a weighted average period of 1.2 years.
Cash received from option exercises during 2010 was $88.1. The total tax benefit realized from stock option exercisesin 2010 was $33.7, of which $21.8 was the excess tax benefit.
Deferred Stock Units and Restricted Stock
The grant-date fair value of deferred stock units and restricted stock is estimated on the date of grant based on themarket price of the stock, and compensation cost is generally amortized to expense on a straight-line basis over thevesting period during which employees perform related services. Expense recognition is accelerated for retirement-eligible individuals who would meet the requirements for vesting of awards upon their retirement.
Deferred Stock Units
The Company has granted deferred stock units to executives, selected employees, and outside directors. Thesedeferred stock units entitle the recipient to one share of common stock upon vesting, which is conditioned oncontinued employment during the deferral period and may also be conditioned on earn-out against certainperformance targets. The deferral period for some units ends after death, disability, or retirement. The deferral periodfor other performance-based deferred stock units ends at the end of the performance period (one to three years).Additionally, the Company has granted deferred stock units, subject to a three-, four-, or five-year deferral period, toselected employees. Deferred stock units issued to directors are paid after service on the Board of Directors ends atthe time elected by the director (not to exceed 10 years after service ends).
Deferred Stock Units Shares (000)Weighted Average
Grant-Date Fair Value
Outstanding at 30 September 2009 1,602 $58.13Granted 310 83.08Paid out (361) 51.31Forfeited/adjustments (24) 66.13
Outstanding at 30 September 2010 1,527 $64.67
84
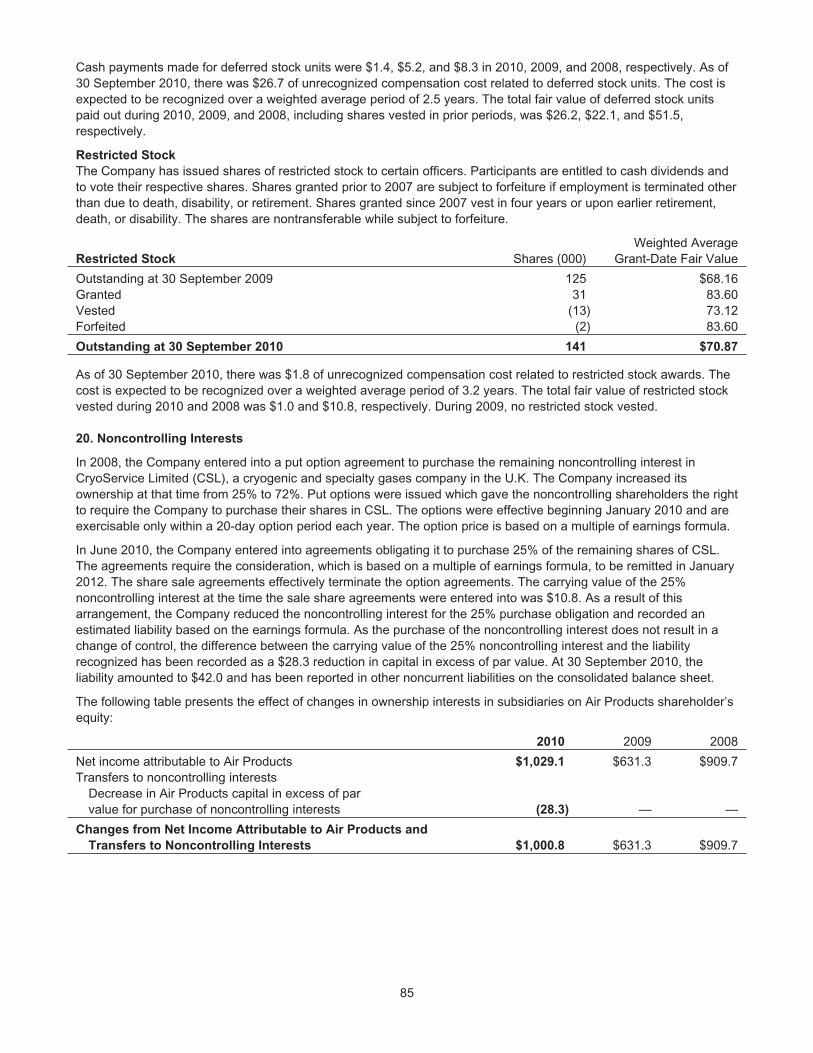
Cash payments made for deferred stock units were $1.4, $5.2, and $8.3 in 2010, 2009, and 2008, respectively. As of30 September 2010, there was $26.7 of unrecognized compensation cost related to deferred stock units. The cost isexpected to be recognized over a weighted average period of 2.5 years. The total fair value of deferred stock unitspaid out during 2010, 2009, and 2008, including shares vested in prior periods, was $26.2, $22.1, and $51.5,respectively.
Restricted Stock
The Company has issued shares of restricted stock to certain officers. Participants are entitled to cash dividends andto vote their respective shares. Shares granted prior to 2007 are subject to forfeiture if employment is terminated otherthan due to death, disability, or retirement. Shares granted since 2007 vest in four years or upon earlier retirement,death, or disability. The shares are nontransferable while subject to forfeiture.
Restricted Stock Shares (000)Weighted Average
Grant-Date Fair Value
Outstanding at 30 September 2009 125 $68.16Granted 31 83.60Vested (13) 73.12Forfeited (2) 83.60
Outstanding at 30 September 2010 141 $70.87
As of 30 September 2010, there was $1.8 of unrecognized compensation cost related to restricted stock awards. Thecost is expected to be recognized over a weighted average period of 3.2 years. The total fair value of restricted stockvested during 2010 and 2008 was $1.0 and $10.8, respectively. During 2009, no restricted stock vested.
20. Noncontrolling Interests
In 2008, the Company entered into a put option agreement to purchase the remaining noncontrolling interest inCryoService Limited (CSL), a cryogenic and specialty gases company in the U.K. The Company increased itsownership at that time from 25% to 72%. Put options were issued which gave the noncontrolling shareholders the rightto require the Company to purchase their shares in CSL. The options were effective beginning January 2010 and areexercisable only within a 20-day option period each year. The option price is based on a multiple of earnings formula.
In June 2010, the Company entered into agreements obligating it to purchase 25% of the remaining shares of CSL.The agreements require the consideration, which is based on a multiple of earnings formula, to be remitted in January2012. The share sale agreements effectively terminate the option agreements. The carrying value of the 25%noncontrolling interest at the time the sale share agreements were entered into was $10.8. As a result of thisarrangement, the Company reduced the noncontrolling interest for the 25% purchase obligation and recorded anestimated liability based on the earnings formula. As the purchase of the noncontrolling interest does not result in achange of control, the difference between the carrying value of the 25% noncontrolling interest and the liabilityrecognized has been recorded as a $28.3 reduction in capital in excess of par value. At 30 September 2010, theliability amounted to $42.0 and has been reported in other noncurrent liabilities on the consolidated balance sheet.
The following table presents the effect of changes in ownership interests in subsidiaries on Air Products shareholder’sequity:
2010 2009 2008
Net income attributable to Air Products $1,029.1 $631.3 $909.7Transfers to noncontrolling interests
Decrease in Air Products capital in excess of parvalue for purchase of noncontrolling interests (28.3) — —
Changes from Net Income Attributable to Air Products and
Transfers to Noncontrolling Interests $1,000.8 $631.3 $909.7
85
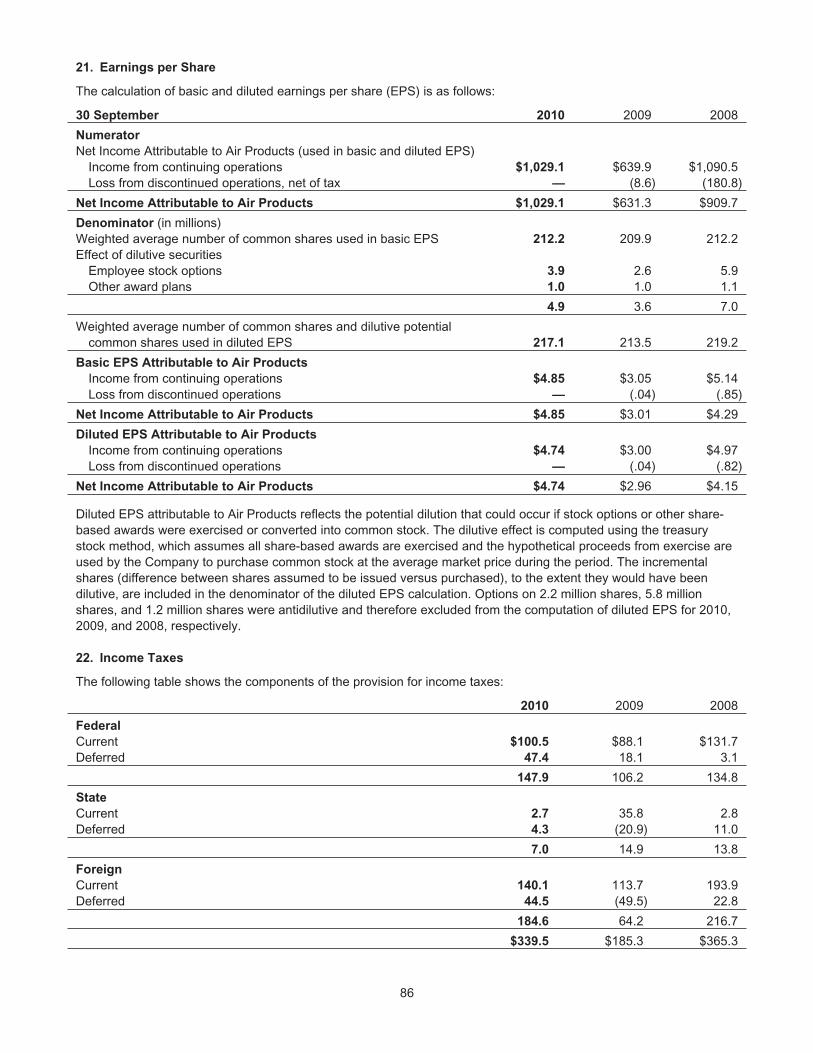
21. Earnings per Share
The calculation of basic and diluted earnings per share (EPS) is as follows:
30 September 2010 2009 2008
Numerator
Net Income Attributable to Air Products (used in basic and diluted EPS)Income from continuing operations $1,029.1 $639.9 $1,090.5Loss from discontinued operations, net of tax — (8.6) (180.8)
Net Income Attributable to Air Products $1,029.1 $631.3 $909.7
Denominator (in millions)Weighted average number of common shares used in basic EPS 212.2 209.9 212.2Effect of dilutive securities
Employee stock options 3.9 2.6 5.9Other award plans 1.0 1.0 1.1
4.9 3.6 7.0
Weighted average number of common shares and dilutive potentialcommon shares used in diluted EPS 217.1 213.5 219.2
Basic EPS Attributable to Air Products
Income from continuing operations $4.85 $3.05 $5.14Loss from discontinued operations — (.04) (.85)
Net Income Attributable to Air Products $4.85 $3.01 $4.29
Diluted EPS Attributable to Air Products
Income from continuing operations $4.74 $3.00 $4.97Loss from discontinued operations — (.04) (.82)
Net Income Attributable to Air Products $4.74 $2.96 $4.15
Diluted EPS attributable to Air Products reflects the potential dilution that could occur if stock options or other share-based awards were exercised or converted into common stock. The dilutive effect is computed using the treasurystock method, which assumes all share-based awards are exercised and the hypothetical proceeds from exercise areused by the Company to purchase common stock at the average market price during the period. The incrementalshares (difference between shares assumed to be issued versus purchased), to the extent they would have beendilutive, are included in the denominator of the diluted EPS calculation. Options on 2.2 million shares, 5.8 millionshares, and 1.2 million shares were antidilutive and therefore excluded from the computation of diluted EPS for 2010,2009, and 2008, respectively.
22. Income Taxes
The following table shows the components of the provision for income taxes:
2010 2009 2008
Federal
Current $100.5 $88.1 $131.7Deferred 47.4 18.1 3.1
147.9 106.2 134.8
State
Current 2.7 35.8 2.8Deferred 4.3 (20.9) 11.0
7.0 14.9 13.8
Foreign
Current 140.1 113.7 193.9Deferred 44.5 (49.5) 22.8
184.6 64.2 216.7
$339.5 $185.3 $365.3
86
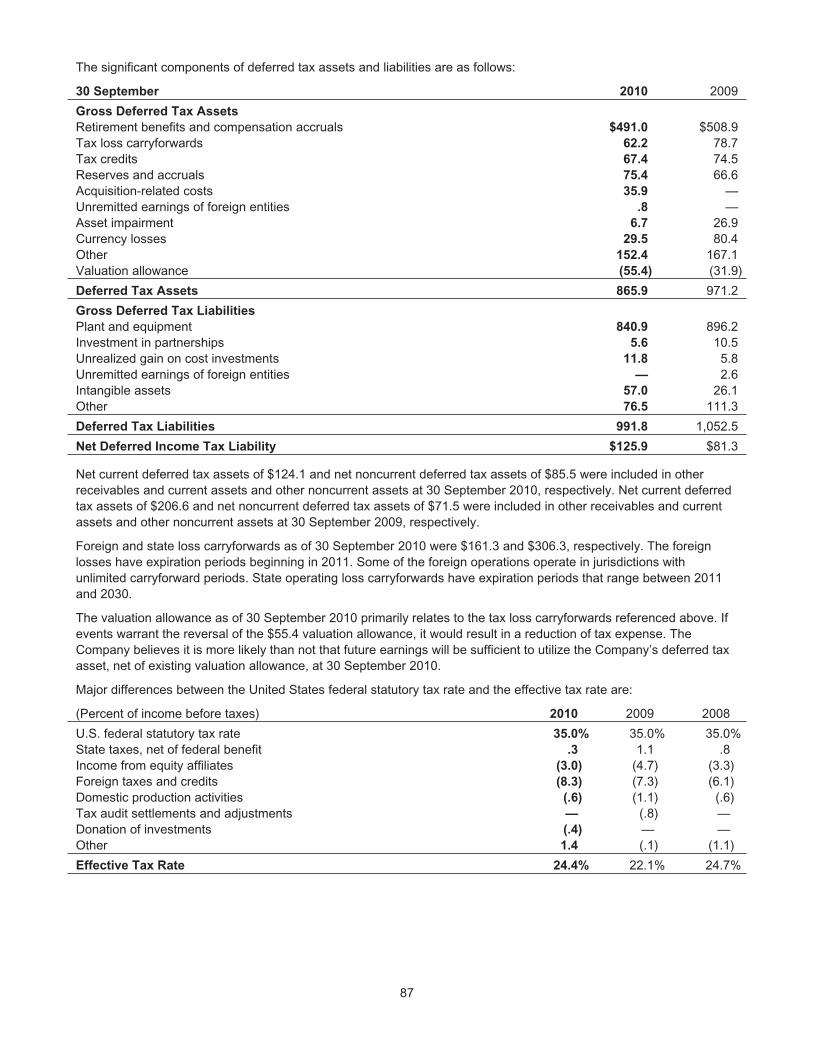
The significant components of deferred tax assets and liabilities are as follows:
30 September 2010 2009
Gross Deferred Tax Assets
Retirement benefits and compensation accruals $491.0 $508.9Tax loss carryforwards 62.2 78.7Tax credits 67.4 74.5Reserves and accruals 75.4 66.6Acquisition-related costs 35.9 —Unremitted earnings of foreign entities .8 —Asset impairment 6.7 26.9Currency losses 29.5 80.4Other 152.4 167.1Valuation allowance (55.4) (31.9)
Deferred Tax Assets 865.9 971.2
Gross Deferred Tax Liabilities
Plant and equipment 840.9 896.2Investment in partnerships 5.6 10.5Unrealized gain on cost investments 11.8 5.8Unremitted earnings of foreign entities — 2.6Intangible assets 57.0 26.1Other 76.5 111.3
Deferred Tax Liabilities 991.8 1,052.5
Net Deferred Income Tax Liability $125.9 $81.3
Net current deferred tax assets of $124.1 and net noncurrent deferred tax assets of $85.5 were included in otherreceivables and current assets and other noncurrent assets at 30 September 2010, respectively. Net current deferredtax assets of $206.6 and net noncurrent deferred tax assets of $71.5 were included in other receivables and currentassets and other noncurrent assets at 30 September 2009, respectively.
Foreign and state loss carryforwards as of 30 September 2010 were $161.3 and $306.3, respectively. The foreignlosses have expiration periods beginning in 2011. Some of the foreign operations operate in jurisdictions withunlimited carryforward periods. State operating loss carryforwards have expiration periods that range between 2011and 2030.
The valuation allowance as of 30 September 2010 primarily relates to the tax loss carryforwards referenced above. Ifevents warrant the reversal of the $55.4 valuation allowance, it would result in a reduction of tax expense. TheCompany believes it is more likely than not that future earnings will be sufficient to utilize the Company’s deferred taxasset, net of existing valuation allowance, at 30 September 2010.
Major differences between the United States federal statutory tax rate and the effective tax rate are:
(Percent of income before taxes) 2010 2009 2008
U.S. federal statutory tax rate 35.0% 35.0% 35.0%State taxes, net of federal benefit .3 1.1 .8Income from equity affiliates (3.0) (4.7) (3.3)Foreign taxes and credits (8.3) (7.3) (6.1)Domestic production activities (.6) (1.1) (.6)Tax audit settlements and adjustments — (.8) —Donation of investments (.4) — —Other 1.4 (.1) (1.1)
Effective Tax Rate 24.4% 22.1% 24.7%
87
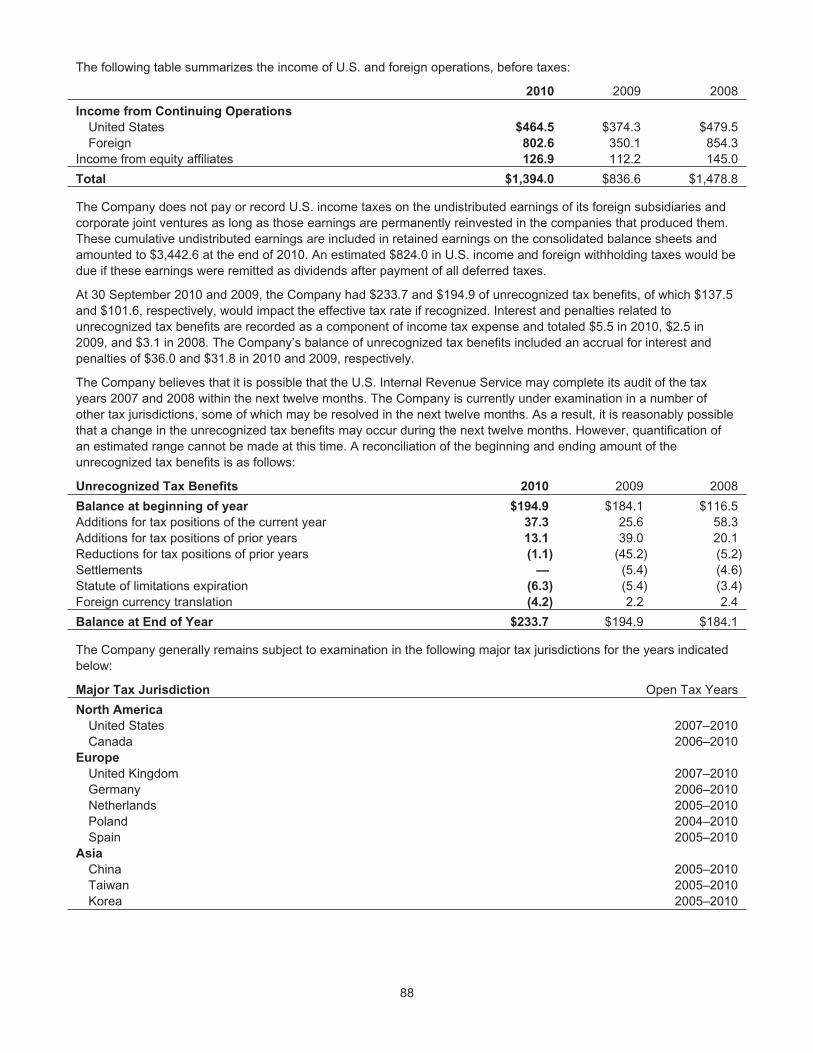
The following table summarizes the income of U.S. and foreign operations, before taxes:
2010 2009 2008
Income from Continuing Operations
United States $464.5 $374.3 $479.5Foreign 802.6 350.1 854.3
Income from equity affiliates 126.9 112.2 145.0
Total $1,394.0 $836.6 $1,478.8
The Company does not pay or record U.S. income taxes on the undistributed earnings of its foreign subsidiaries andcorporate joint ventures as long as those earnings are permanently reinvested in the companies that produced them.These cumulative undistributed earnings are included in retained earnings on the consolidated balance sheets andamounted to $3,442.6 at the end of 2010. An estimated $824.0 in U.S. income and foreign withholding taxes would bedue if these earnings were remitted as dividends after payment of all deferred taxes.
At 30 September 2010 and 2009, the Company had $233.7 and $194.9 of unrecognized tax benefits, of which $137.5and $101.6, respectively, would impact the effective tax rate if recognized. Interest and penalties related tounrecognized tax benefits are recorded as a component of income tax expense and totaled $5.5 in 2010, $2.5 in2009, and $3.1 in 2008. The Company’s balance of unrecognized tax benefits included an accrual for interest andpenalties of $36.0 and $31.8 in 2010 and 2009, respectively.
The Company believes that it is possible that the U.S. Internal Revenue Service may complete its audit of the taxyears 2007 and 2008 within the next twelve months. The Company is currently under examination in a number ofother tax jurisdictions, some of which may be resolved in the next twelve months. As a result, it is reasonably possiblethat a change in the unrecognized tax benefits may occur during the next twelve months. However, quantification ofan estimated range cannot be made at this time. A reconciliation of the beginning and ending amount of theunrecognized tax benefits is as follows:
Unrecognized Tax Benefits 2010 2009 2008
Balance at beginning of year $194.9 $184.1 $116.5Additions for tax positions of the current year 37.3 25.6 58.3Additions for tax positions of prior years 13.1 39.0 20.1Reductions for tax positions of prior years (1.1) (45.2) (5.2)Settlements — (5.4) (4.6)Statute of limitations expiration (6.3) (5.4) (3.4)Foreign currency translation (4.2) 2.2 2.4
Balance at End of Year $233.7 $194.9 $184.1
The Company generally remains subject to examination in the following major tax jurisdictions for the years indicatedbelow:
Major Tax Jurisdiction Open Tax Years
North America
United States 2007–2010Canada 2006–2010
Europe
United Kingdom 2007–2010Germany 2006–2010Netherlands 2005–2010Poland 2004–2010Spain 2005–2010
Asia
China 2005–2010Taiwan 2005–2010Korea 2005–2010
88
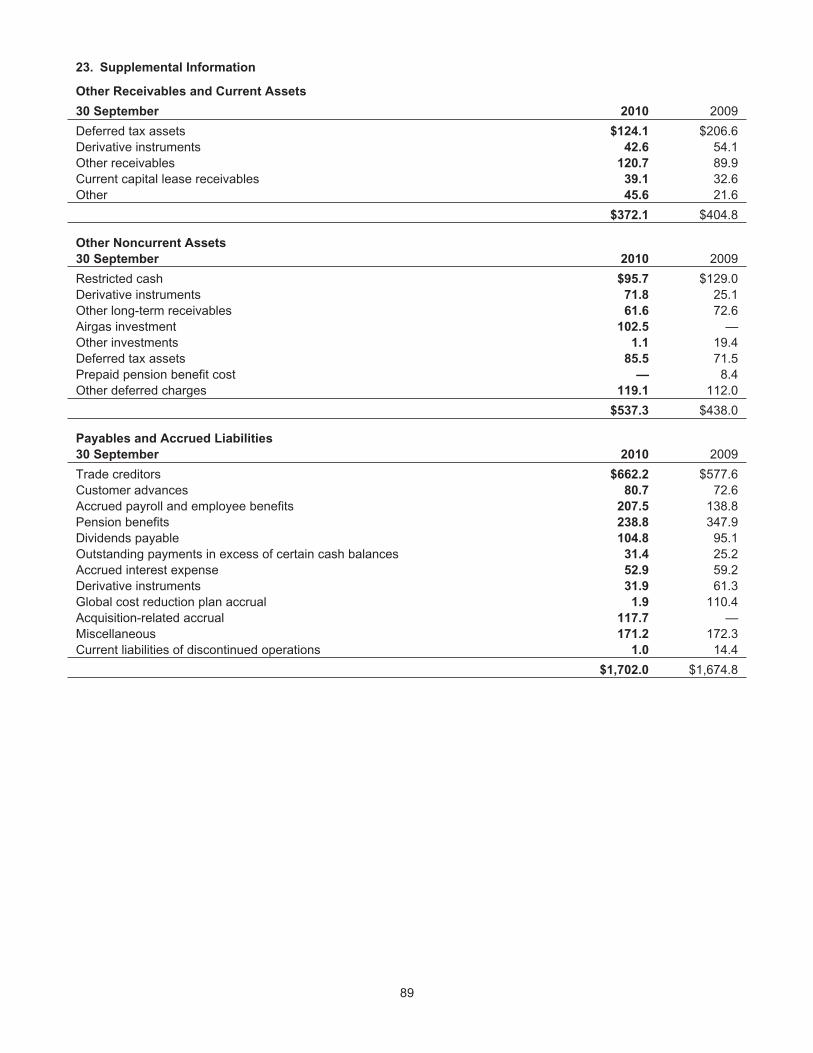
23. Supplemental Information
Other Receivables and Current Assets
30 September 2010 2009
Deferred tax assets $124.1 $206.6Derivative instruments 42.6 54.1Other receivables 120.7 89.9Current capital lease receivables 39.1 32.6Other 45.6 21.6
$372.1 $404.8
Other Noncurrent Assets
30 September 2010 2009
Restricted cash $95.7 $129.0Derivative instruments 71.8 25.1Other long-term receivables 61.6 72.6Airgas investment 102.5 —Other investments 1.1 19.4Deferred tax assets 85.5 71.5Prepaid pension benefit cost — 8.4Other deferred charges 119.1 112.0
$537.3 $438.0
Payables and Accrued Liabilities
30 September 2010 2009
Trade creditors $662.2 $577.6Customer advances 80.7 72.6Accrued payroll and employee benefits 207.5 138.8Pension benefits 238.8 347.9Dividends payable 104.8 95.1Outstanding payments in excess of certain cash balances 31.4 25.2Accrued interest expense 52.9 59.2Derivative instruments 31.9 61.3Global cost reduction plan accrual 1.9 110.4Acquisition-related accrual 117.7 —Miscellaneous 171.2 172.3Current liabilities of discontinued operations 1.0 14.4
$1,702.0 $1,674.8
89
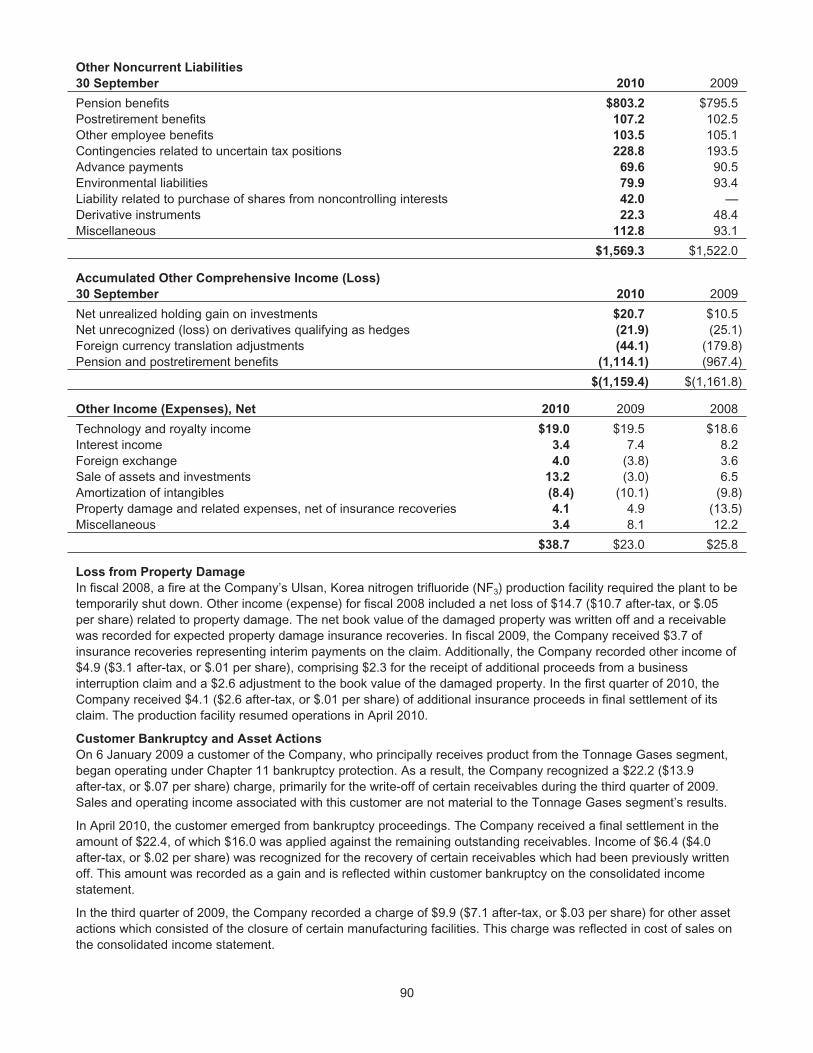
Other Noncurrent Liabilities
30 September 2010 2009
Pension benefits $803.2 $795.5Postretirement benefits 107.2 102.5Other employee benefits 103.5 105.1Contingencies related to uncertain tax positions 228.8 193.5Advance payments 69.6 90.5Environmental liabilities 79.9 93.4Liability related to purchase of shares from noncontrolling interests 42.0 —Derivative instruments 22.3 48.4Miscellaneous 112.8 93.1
$1,569.3 $1,522.0
Accumulated Other Comprehensive Income (Loss)
30 September 2010 2009
Net unrealized holding gain on investments $20.7 $10.5Net unrecognized (loss) on derivatives qualifying as hedges (21.9) (25.1)Foreign currency translation adjustments (44.1) (179.8)Pension and postretirement benefits (1,114.1) (967.4)
$(1,159.4) $(1,161.8)
Other Income (Expenses), Net 2010 2009 2008
Technology and royalty income $19.0 $19.5 $18.6Interest income 3.4 7.4 8.2Foreign exchange 4.0 (3.8) 3.6Sale of assets and investments 13.2 (3.0) 6.5Amortization of intangibles (8.4) (10.1) (9.8)Property damage and related expenses, net of insurance recoveries 4.1 4.9 (13.5)Miscellaneous 3.4 8.1 12.2
$38.7 $23.0 $25.8
Loss from Property Damage
In fiscal 2008, a fire at the Company’s Ulsan, Korea nitrogen trifluoride (NF3) production facility required the plant to betemporarily shut down. Other income (expense) for fiscal 2008 included a net loss of $14.7 ($10.7 after-tax, or $.05per share) related to property damage. The net book value of the damaged property was written off and a receivablewas recorded for expected property damage insurance recoveries. In fiscal 2009, the Company received $3.7 ofinsurance recoveries representing interim payments on the claim. Additionally, the Company recorded other income of$4.9 ($3.1 after-tax, or $.01 per share), comprising $2.3 for the receipt of additional proceeds from a businessinterruption claim and a $2.6 adjustment to the book value of the damaged property. In the first quarter of 2010, theCompany received $4.1 ($2.6 after-tax, or $.01 per share) of additional insurance proceeds in final settlement of itsclaim. The production facility resumed operations in April 2010.
Customer Bankruptcy and Asset Actions
On 6 January 2009 a customer of the Company, who principally receives product from the Tonnage Gases segment,began operating under Chapter 11 bankruptcy protection. As a result, the Company recognized a $22.2 ($13.9after-tax, or $.07 per share) charge, primarily for the write-off of certain receivables during the third quarter of 2009.Sales and operating income associated with this customer are not material to the Tonnage Gases segment’s results.
In April 2010, the customer emerged from bankruptcy proceedings. The Company received a final settlement in theamount of $22.4, of which $16.0 was applied against the remaining outstanding receivables. Income of $6.4 ($4.0after-tax, or $.02 per share) was recognized for the recovery of certain receivables which had been previously writtenoff. This amount was recorded as a gain and is reflected within customer bankruptcy on the consolidated incomestatement.
In the third quarter of 2009, the Company recorded a charge of $9.9 ($7.1 after-tax, or $.03 per share) for other assetactions which consisted of the closure of certain manufacturing facilities. This charge was reflected in cost of sales onthe consolidated income statement.
90
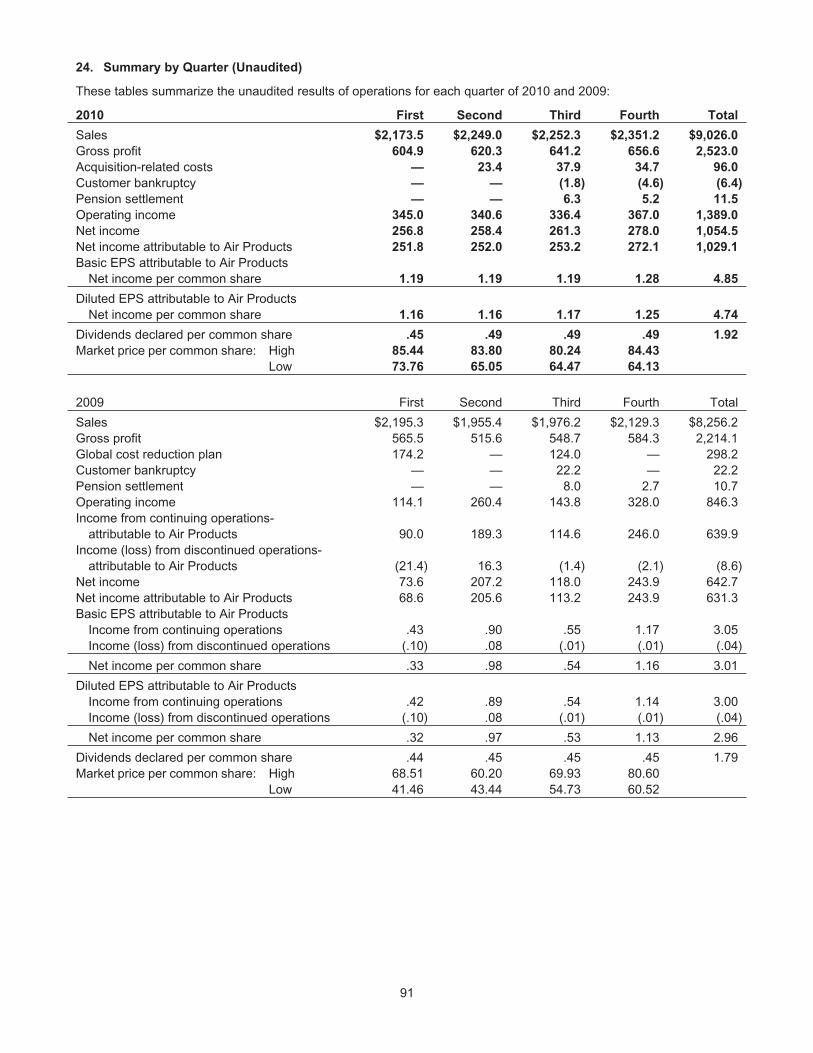
24. Summary by Quarter (Unaudited)
These tables summarize the unaudited results of operations for each quarter of 2010 and 2009:
2010 First Second Third Fourth Total
Sales $2,173.5 $2,249.0 $2,252.3 $2,351.2 $9,026.0
Gross profit 604.9 620.3 641.2 656.6 2,523.0
Acquisition-related costs — 23.4 37.9 34.7 96.0
Customer bankruptcy — — (1.8) (4.6) (6.4)
Pension settlement — — 6.3 5.2 11.5
Operating income 345.0 340.6 336.4 367.0 1,389.0
Net income 256.8 258.4 261.3 278.0 1,054.5
Net income attributable to Air Products 251.8 252.0 253.2 272.1 1,029.1
Basic EPS attributable to Air ProductsNet income per common share 1.19 1.19 1.19 1.28 4.85
Diluted EPS attributable to Air ProductsNet income per common share 1.16 1.16 1.17 1.25 4.74
Dividends declared per common share .45 .49 .49 .49 1.92
Market price per common share: High 85.44 83.80 80.24 84.43
Low 73.76 65.05 64.47 64.13
2009 First Second Third Fourth Total
Sales $2,195.3 $1,955.4 $1,976.2 $2,129.3 $8,256.2Gross profit 565.5 515.6 548.7 584.3 2,214.1Global cost reduction plan 174.2 — 124.0 — 298.2Customer bankruptcy — — 22.2 — 22.2Pension settlement — — 8.0 2.7 10.7Operating income 114.1 260.4 143.8 328.0 846.3Income from continuing operations-
attributable to Air Products 90.0 189.3 114.6 246.0 639.9Income (loss) from discontinued operations-
attributable to Air Products (21.4) 16.3 (1.4) (2.1) (8.6)Net income 73.6 207.2 118.0 243.9 642.7Net income attributable to Air Products 68.6 205.6 113.2 243.9 631.3Basic EPS attributable to Air Products
Income from continuing operations .43 .90 .55 1.17 3.05Income (loss) from discontinued operations (.10) .08 (.01) (.01) (.04)
Net income per common share .33 .98 .54 1.16 3.01
Diluted EPS attributable to Air ProductsIncome from continuing operations .42 .89 .54 1.14 3.00Income (loss) from discontinued operations (.10) .08 (.01) (.01) (.04)
Net income per common share .32 .97 .53 1.13 2.96
Dividends declared per common share .44 .45 .45 .45 1.79Market price per common share: High 68.51 60.20 69.93 80.60
Low 41.46 43.44 54.73 60.52
91
25. Business Segment and Geographic Information
The Company’s segments are organized based on differences in product and/or type of customer. The Company hasfour business segments consisting of Merchant Gases, Tonnage Gases, Electronics and Performance Materials, andEquipment and Energy.
Merchant Gases
The Merchant Gases segment sells atmospheric gases such as oxygen, nitrogen, and argon (primarily recovered bythe cryogenic distillation of air); process gases such as hydrogen and helium (purchased or refined from crudehelium); and medical and specialty gases, along with certain services and equipment, throughout the world tocustomers in many industries, including those in metals, glass, chemical processing, food processing, healthcare,steel, general manufacturing, and petroleum and natural gas industries. There are four principal types of products:liquid bulk, packaged gases, small on-site plants, and healthcare products. Most merchant product is delivered viabulk supply, in liquid or gaseous form, by tanker or tube trailer. Smaller quantities of industrial, specialty, and medicalgases are delivered in cylinders and dewars as “packaged gases,” or through small on-sites (cryogenic ornoncryogenic generators). Through its healthcare business, the Company offers respiratory therapies, home medicalequipment, and infusion services, primarily in Europe. Electricity is the largest cost component in the production ofatmospheric gases. Natural gas is also an energy source at a number of the Company’s Merchant Gases facilities.The Company mitigates energy and natural gas prices through pricing formulas and surcharges. Merchant Gasescompetes worldwide against global industrial gas companies and several regional sellers. Competition in industrialgases is based primarily on price, reliability of supply, and the development of industrial gas applications. Competitionin the healthcare business involves price, quality, service, and reliability of supply.
Tonnage Gases
Tonnage Gases provides hydrogen, carbon monoxide, nitrogen, oxygen, and syngas principally to the energyproduction and refining, chemical, and metallurgical industries worldwide. The Tonnage Gases segment also includesthe Company’s Polyurethane Intermediates (PUI) business. The PUI business markets toluene diamine to customersunder long-term contracts. For large-volume, or “tonnage” industrial gas users, the Company either constructs a gasplant adjacent to or near the customer’s facility—hence the term “on-site”—or delivers product through a pipeline froma nearby location. The Company is the world’s largest provider of hydrogen, which is used by refiners to lower thesulfur content of gasoline and diesel fuels to reduce smog and ozone depletion. Electricity is the largest costcomponent in the production of atmospheric gases, and natural gas is the principal raw material for hydrogen, carbonmonoxide, and syngas production. The Company mitigates energy and natural gas price changes through its long-term cost pass-through type contracts. Tonnage Gases competes against global industrial gas companies, as well asregional competitors. Competition is based primarily on price, reliability of supply, the development of applications thatuse industrial gases and, in some cases, provision of other services or products such as power and steam generation.The Company also derives a competitive advantage from its pipeline networks which enable it to provide reliable andeconomic supply of products to customers.
Electronics and Performance Materials
The Electronics and Performance Materials segment employs applications technology to provide solutions to a broadrange of global industries through expertise in chemical synthesis, analytical technology, process engineering, andsurface science. This segment provides specialty and tonnage gases, specialty chemicals, services, and equipment tothe electronics industry for the manufacture of silicon and compound semiconductors, LCD and other displays, andphotovoltaic devices. The segment also provides performance chemical solutions for the coatings, inks, adhesives,civil engineering, personal care, institutional and industrial cleaning, mining, oil field, polyurethane, and otherindustries. The Electronics and Performance Materials segment faces competition on a product-by-product basisagainst competitors ranging from niche suppliers with a single product to larger and more vertically integratedcompanies. Competition is principally conducted on the basis of price, quality, product performance, reliability ofproduct supply, technical innovation, service, and global infrastructure.
Equipment and Energy
The Equipment and Energy segment designs and manufactures cryogenic and gas processing equipment for airseparation, hydrocarbon recovery and purification, natural gas liquefaction (LNG), and helium distribution, and servesenergy markets in a variety of ways. Equipment is sold worldwide to customers in a variety of industries, includingchemical and petrochemical manufacturing, oil and gas recovery and processing, and steel and primary metalsprocessing. Energy markets are served through the Company’s operation and partial ownership of cogeneration andflue gas desulfurization facilities, its development of hydrogen as an energy carrier, and oxygen-based technologies to
92

serve energy markets in the future. Equipment and Energy competes with a great number of firms for all of itsofferings except LNG heat exchangers, for which there are fewer competitors due to the limited market size andproprietary technologies. Competition is based primarily on technological performance, service, technical know-how,price, and performance guarantees.
Other
Other operating income (loss) includes other expense and income that cannot be directly associated with the businesssegments, including foreign exchange gains and losses, interest income, and costs previously allocated to businessesnow reported as discontinued operations. Also included are LIFO inventory adjustments, as the business segmentsuse FIFO and the LIFO pool adjustments are not allocated to the business segments. Corporate general andadministrative costs and research and development costs are fully allocated to the business segments.
Other assets include cash, restricted cash, deferred tax assets, pension assets, financial instruments, and corporateassets previously allocated to businesses now reported as discontinued operations.
Customers
The Company has a large number of customers, and no single customer accounts for a significant portion of annualsales.
Accounting Policies
The accounting policies of the segments are the same as those described in Note 1, Major Accounting Policies. TheCompany evaluates the performance of segments based upon reported segment operating income. Operating incomeof the business segments includes general corporate expenses. Intersegment sales are not material and are recordedat selling prices that approximate market prices. Equipment manufactured for the Company’s industrial gas businessis generally transferred at cost and not reflected as an intersegment sale. Long-lived assets include investment in netassets of and advances to equity affiliates, net plant and equipment, goodwill, and net intangible assets.
Business Segments
Business segment information is shown below:
Revenue from External Customers 2010 2009 2008
Merchant Gases $3,718.3 $3,610.6 $4,192.7Tonnage Gases 2,930.8 2,573.6 3,574.4Electronics and Performance Materials 1,904.7 1,582.2 2,209.3Equipment and Energy 472.2 489.8 438.1
Segment and Consolidated Totals $9,026.0 $8,256.2 $10,414.5
Operating Income 2010 2009 2008
Merchant Gases $729.4 $661.2 $789.5Tonnage Gases 444.2 399.6 482.6Electronics and Performance Materials 251.8 101.6 245.9Equipment and Energy 67.3 42.2 38.9
Segment Total $1,492.7 $1,204.6 $1,556.9Global cost reduction plan (A) — (298.2) —Acquisition-related costs (96.0) — —Customer bankruptcy and asset actions 6.4 (32.1) —Pension settlement (11.5) (10.7) (30.3)Other (2.6) (17.3) (30.8)
Consolidated Total $1,389.0 $846.3 $1,495.8
(A) Information about how this charge related to the businesses at the segment level is discussed in Note 5, Global Cost Reduction Plan.
93
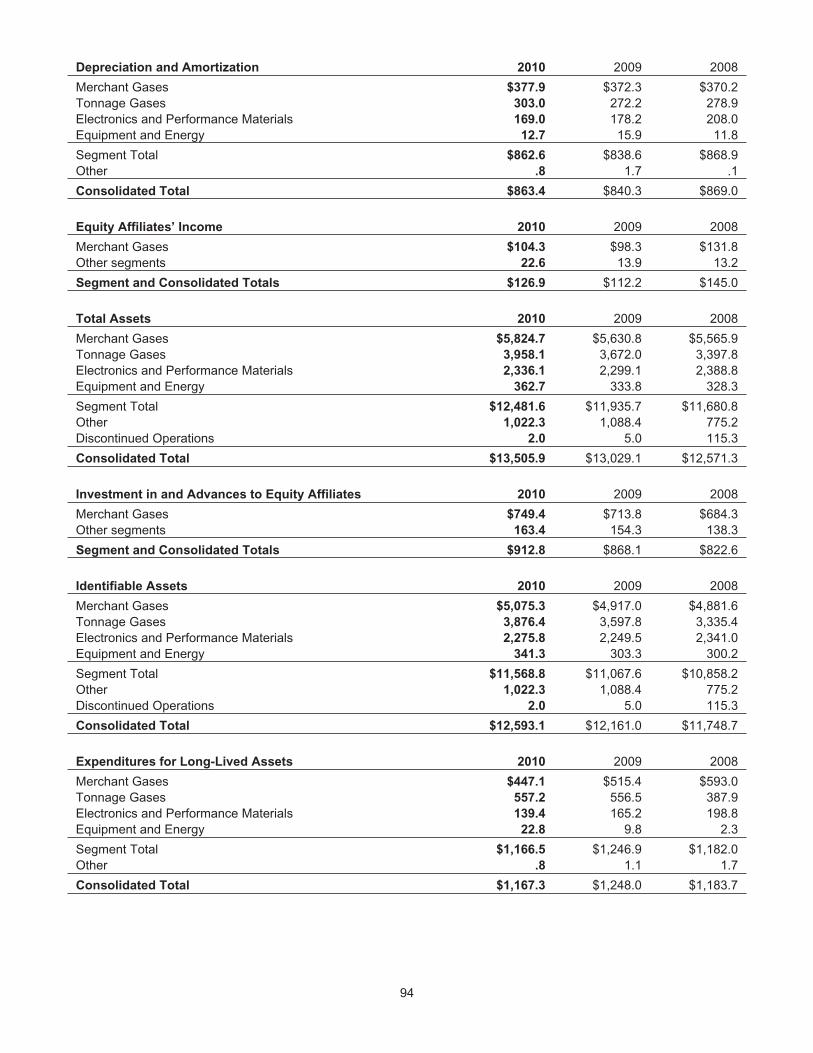
Depreciation and Amortization 2010 2009 2008
Merchant Gases $377.9 $372.3 $370.2Tonnage Gases 303.0 272.2 278.9Electronics and Performance Materials 169.0 178.2 208.0Equipment and Energy 12.7 15.9 11.8
Segment Total $862.6 $838.6 $868.9Other .8 1.7 .1
Consolidated Total $863.4 $840.3 $869.0
Equity Affiliates’ Income 2010 2009 2008
Merchant Gases $104.3 $98.3 $131.8Other segments 22.6 13.9 13.2
Segment and Consolidated Totals $126.9 $112.2 $145.0
Total Assets 2010 2009 2008
Merchant Gases $5,824.7 $5,630.8 $5,565.9Tonnage Gases 3,958.1 3,672.0 3,397.8Electronics and Performance Materials 2,336.1 2,299.1 2,388.8Equipment and Energy 362.7 333.8 328.3
Segment Total $12,481.6 $11,935.7 $11,680.8Other 1,022.3 1,088.4 775.2Discontinued Operations 2.0 5.0 115.3
Consolidated Total $13,505.9 $13,029.1 $12,571.3
Investment in and Advances to Equity Affiliates 2010 2009 2008
Merchant Gases $749.4 $713.8 $684.3Other segments 163.4 154.3 138.3
Segment and Consolidated Totals $912.8 $868.1 $822.6
Identifiable Assets 2010 2009 2008
Merchant Gases $5,075.3 $4,917.0 $4,881.6Tonnage Gases 3,876.4 3,597.8 3,335.4Electronics and Performance Materials 2,275.8 2,249.5 2,341.0Equipment and Energy 341.3 303.3 300.2
Segment Total $11,568.8 $11,067.6 $10,858.2Other 1,022.3 1,088.4 775.2Discontinued Operations 2.0 5.0 115.3
Consolidated Total $12,593.1 $12,161.0 $11,748.7
Expenditures for Long-Lived Assets 2010 2009 2008
Merchant Gases $447.1 $515.4 $593.0Tonnage Gases 557.2 556.5 387.9Electronics and Performance Materials 139.4 165.2 198.8Equipment and Energy 22.8 9.8 2.3
Segment Total $1,166.5 $1,246.9 $1,182.0Other .8 1.1 1.7
Consolidated Total $1,167.3 $1,248.0 $1,183.7
94
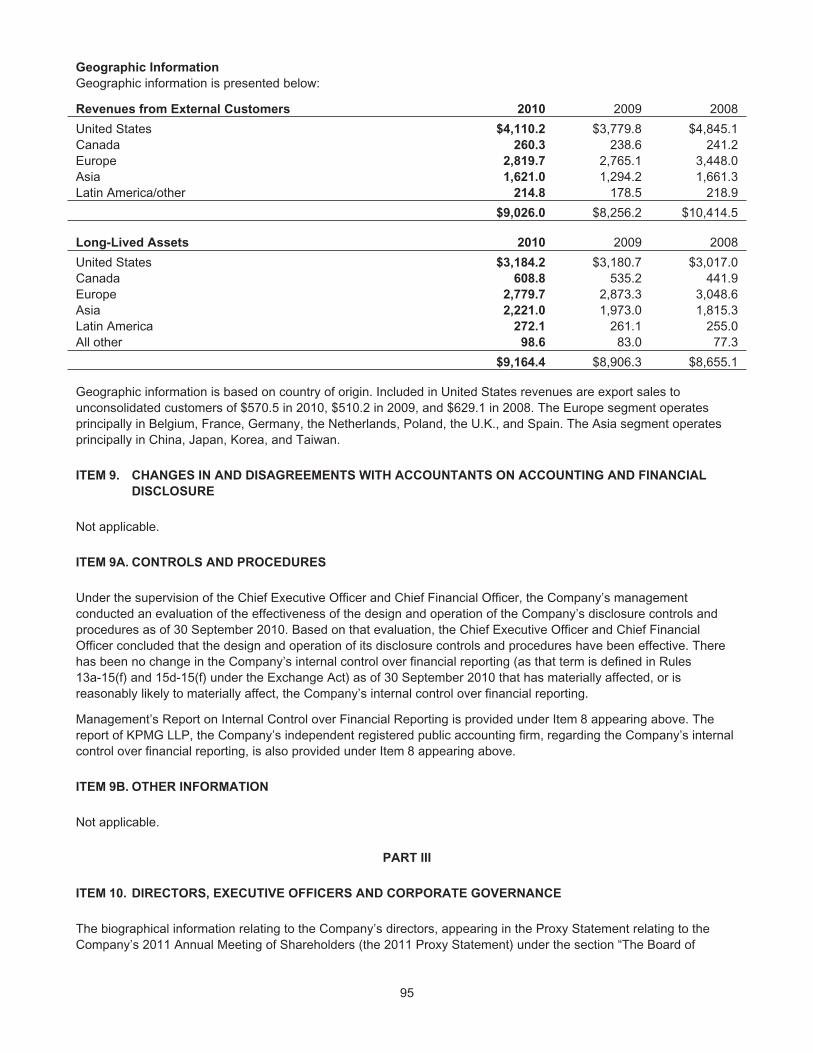
Geographic Information
Geographic information is presented below:
Revenues from External Customers 2010 2009 2008
United States $4,110.2 $3,779.8 $4,845.1Canada 260.3 238.6 241.2Europe 2,819.7 2,765.1 3,448.0Asia 1,621.0 1,294.2 1,661.3Latin America/other 214.8 178.5 218.9
$9,026.0 $8,256.2 $10,414.5
Long-Lived Assets 2010 2009 2008
United States $3,184.2 $3,180.7 $3,017.0Canada 608.8 535.2 441.9Europe 2,779.7 2,873.3 3,048.6Asia 2,221.0 1,973.0 1,815.3Latin America 272.1 261.1 255.0All other 98.6 83.0 77.3
$9,164.4 $8,906.3 $8,655.1
Geographic information is based on country of origin. Included in United States revenues are export sales tounconsolidated customers of $570.5 in 2010, $510.2 in 2009, and $629.1 in 2008. The Europe segment operatesprincipally in Belgium, France, Germany, the Netherlands, Poland, the U.K., and Spain. The Asia segment operatesprincipally in China, Japan, Korea, and Taiwan.
ITEM 9. CHANGES IN AND DISAGREEMENTS WITH ACCOUNTANTS ON ACCOUNTING AND FINANCIAL
DISCLOSURE
Not applicable.
ITEM 9A. CONTROLS AND PROCEDURES
Under the supervision of the Chief Executive Officer and Chief Financial Officer, the Company’s managementconducted an evaluation of the effectiveness of the design and operation of the Company’s disclosure controls andprocedures as of 30 September 2010. Based on that evaluation, the Chief Executive Officer and Chief FinancialOfficer concluded that the design and operation of its disclosure controls and procedures have been effective. Therehas been no change in the Company’s internal control over financial reporting (as that term is defined in Rules13a-15(f) and 15d-15(f) under the Exchange Act) as of 30 September 2010 that has materially affected, or isreasonably likely to materially affect, the Company’s internal control over financial reporting.
Management’s Report on Internal Control over Financial Reporting is provided under Item 8 appearing above. Thereport of KPMG LLP, the Company’s independent registered public accounting firm, regarding the Company’s internalcontrol over financial reporting, is also provided under Item 8 appearing above.
ITEM 9B. OTHER INFORMATION
Not applicable.
PART III
ITEM 10. DIRECTORS, EXECUTIVE OFFICERS AND CORPORATE GOVERNANCE
The biographical information relating to the Company’s directors, appearing in the Proxy Statement relating to theCompany’s 2011 Annual Meeting of Shareholders (the 2011 Proxy Statement) under the section “The Board of
95
Directors,” is incorporated herein by reference. Biographical information relating to the Company’s executive officers isset forth in Item 1 of Part I of this Report.
Information on Section 16(a) Beneficial Ownership Reporting Compliance, appearing in the 2011 Proxy Statementunder the section “Air Products Stock Beneficially Owned by Officers and Directors,” is incorporated herein byreference.
The Company has adopted a Code of Conduct that applies to all employees, including the Chief Executive Officer, theChief Financial Officer, and the Controller. The Code of Conduct can be found at the Company’s Internet website atwww.airproducts.com/codeofconduct.
Information on the Company’s procedures regarding its consideration of candidates recommended by shareholdersand a procedure for submission of such candidates, appearing in the 2011 Proxy Statement under the section“Selection of Directors,” is incorporated by reference. Information on the Company’s Audit Committee and its AuditCommittee Financial Expert, appearing in the 2011 Proxy Statement under the section “Audit Committee,” isincorporated by reference.
ITEM 11. EXECUTIVE COMPENSATION
The information under “Compensation of Executive Officers” which includes “Report of the Management Developmentand Compensation Committee,” “Compensation Discussion and Analysis,” “Executive Compensation Tables,”“Potential Payments Upon Termination or Change in Control,” and “Information About Stock Ownership,” appearing inthe 2011 Proxy Statement, is incorporated herein by reference.
ITEM 12. SECURITY OWNERSHIP OF CERTAIN BENEFICIAL OWNERS AND MANAGEMENT AND RELATED
STOCKHOLDER MATTERS
The information set forth in the sections headed “Persons Owning More than 5% of Air Products Stock as ofSeptember 30, 2010,” “Air Products Stock Beneficially Owned by Officers and Directors as of November 1, 2010,” and“Equity Compensation Plan Information,” appearing in the Proxy Statement relating to the Company’s 2011 AnnualMeeting of Shareholders, is incorporated herein by reference.
ITEM 13. CERTAIN RELATIONSHIPS AND RELATED TRANSACTIONS, AND DIRECTOR INDEPENDENCE
The information appearing in the 2011 Proxy Statement under the sections “Director Independence” and“Transactions with Related Persons” is incorporated by reference.
ITEM 14. PRINCIPAL ACCOUNTANT FEES AND SERVICES
The information appearing in the 2011 Proxy Statement under the section “Fees of Independent Registered PublicAccountant,” is incorporated herein by reference.
PART IV
ITEM 15. EXHIBITS AND FINANCIAL STATEMENT SCHEDULES
(a) The following documents are filed as a part of this report:
(1) The Company’s 2010 consolidated financial statements and the Report of the Independent RegisteredPublic Accounting Firm are included in Part II, Item 8.
(2) Financial Statement Schedules—the following additional information should be read in conjunction withthe consolidated financial statements in the Company’s 2010 consolidated financial statements.
Schedule II Valuation and Qualifying Accounts for the three fiscal years ended 30 September 2010 . . . . 100
96

All other schedules are omitted because the required matter or conditions are not present or because theinformation required by the Schedules is submitted as part of the consolidated financial statements andnotes thereto.
(3) Exhibits—The exhibits filed as a part of this Annual Report on Form 10-K are listed in the Index to Exhibitslocated on page 101 of this Report.
97
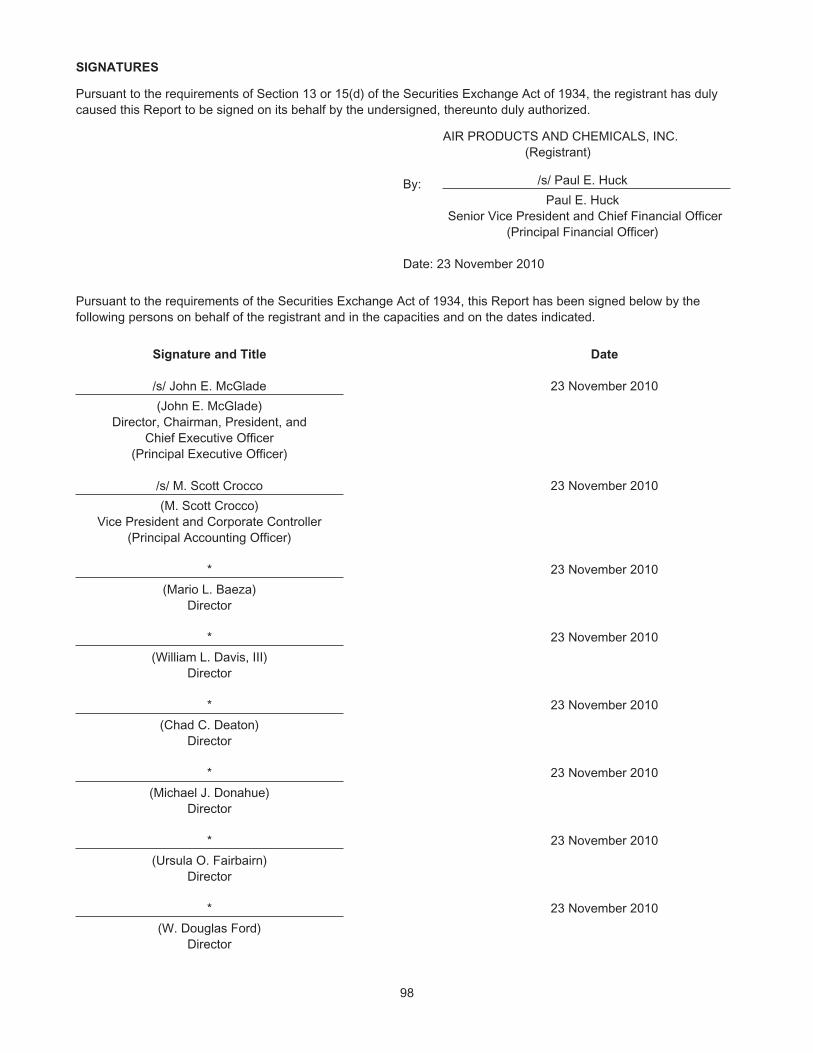
SIGNATURES
Pursuant to the requirements of Section 13 or 15(d) of the Securities Exchange Act of 1934, the registrant has dulycaused this Report to be signed on its behalf by the undersigned, thereunto duly authorized.
AIR PRODUCTS AND CHEMICALS, INC.(Registrant)
By: /s/ Paul E. Huck
Paul E. HuckSenior Vice President and Chief Financial Officer
(Principal Financial Officer)
Date: 23 November 2010
Pursuant to the requirements of the Securities Exchange Act of 1934, this Report has been signed below by thefollowing persons on behalf of the registrant and in the capacities and on the dates indicated.
Signature and Title Date
/s/ John E. McGlade 23 November 2010
(John E. McGlade)Director, Chairman, President, and
Chief Executive Officer(Principal Executive Officer)
/s/ M. Scott Crocco 23 November 2010
(M. Scott Crocco)Vice President and Corporate Controller
(Principal Accounting Officer)
* 23 November 2010
(Mario L. Baeza)Director
* 23 November 2010
(William L. Davis, III)Director
* 23 November 2010
(Chad C. Deaton)Director
* 23 November 2010
(Michael J. Donahue)Director
* 23 November 2010
(Ursula O. Fairbairn)Director
* 23 November 2010
(W. Douglas Ford)Director
98
* 23 November 2010
(Edward E. Hagenlocker)Director
* 23 November 2010
(Evert Henkes)Director
* 23 November 2010
(Margaret G. McGlynn)Director
* 23 November 2010
(Lawrence S. Smith)Director
* Mary T. Afflerbach, Corporate Secretary and Chief Governance Officer, by signing her name hereto, does sign thisdocument on behalf of the above noted individuals, pursuant to a power of attorney duly executed by suchindividuals, which is filed with the Securities and Exchange Commission herewith.
/s/ Mary T. Afflerbach
Mary T. AfflerbachAttorney-in-Fact
Date: 23 November 2010
99

SCHEDULE IICONSOLIDATED
AIR PRODUCTS AND CHEMICALS, INC. AND SUBSIDIARIES
SCHEDULE II–VALUATION AND QUALIFYING ACCOUNTS
For the Years Ended 30 September 2010, 2009, and 2008
AdditionsOther Changes
Increase (Decrease)
Balance atBeginningof Period
Charged toExpense
Chargedto OtherAccounts
CumulativeTranslationAdjustment Other (A)
Balanceat End of
Period
(in millions of dollars)Year Ended 30 September 2010
Allowance for doubtful accounts $65 $4 $25 $— $5 $99Allowance for deferred tax assets 32 26 (2) (1) — 55
Year Ended 30 September 2009Allowance for doubtful accounts $36 $24 $14 $1 $(10) $65Allowance for deferred tax assets 61 (30) — 1 — 32
Year Ended 30 September 2008Allowance for doubtful accounts $33 $10 $4 $— $(11) $36Allowance for deferred tax assets 33 36 — — (8) 61
Note:(A) Primarily write-offs of uncollectible trade receivable accounts and tax valuation allowances.
100
INDEX TO EXHIBITS
Exhibit No. Description
(3) Articles of Incorporation and By-Laws.
3.1 Amended and Restated By-Laws of the Company. (Filed as Exhibit 3 to the Company’s Form 8-KReport dated 24 November 2008.)*
3.2 Restated Certificate of Incorporation of the Company. (Filed as Exhibit 3.2 to the Company’s Form10-K Report for the fiscal year ended 30 September 1987.)*
3.3 Amendment to the Restated Certificate of Incorporation of the Company dated 25 January 1996.(Filed as Exhibit 3.3 to the Company’s Form 10-K Report for the fiscal year ended 30 September1996.)*
(4) Instruments defining the rights of security holders, including indentures. Upon request of theSecurities and Exchange Commission, the Company hereby undertakes to furnish copies of theinstruments with respect to its long-term debt.
4.1 Indenture, dated as of January 18, 1985, between the Company and The Chase Manhattan Bank(National Association), as Trustee. (Filed as Exhibit 4(a) to the Company’s Registration StatementNo. 33-36974.)*
4.2 Indenture, dated as of January 10, 1995, between the Company and The Bank of New York TrustCompany, N.A. (formerly Wachovia Bank, National Association and initially First Fidelity BankCompany, National Association), as Trustee. (Filed as Exhibit 4(a) to the Company’s RegistrationStatement No. 33-57357.)*
(10) Material Contracts
10.1 1990 Deferred Stock Plan of the Company, as amended and restated effective 1 October 1989.(Filed as Exhibit 10.1 to the Company’s Form 10-K Report for the fiscal year ended 30 September1989.)*
10.2 Stock Option Program for Directors of the Company, formerly known as the Stock Option Plan forDirectors. Effective 23 January 2003, this Plan was combined with the Long-Term Incentive Planand offered as a program thereunder. (Filed as Exhibit 10.5 to the Company’s Form 10-K Reportfor the fiscal year ended 30 September 2004.)*
10.3 Amended and Restated Trust Agreement by and between the Company and PNC Bank, N.A.relating to the Defined Benefit Pension Plans dated as of 1 August 1999. (Filed as Exhibit 10.13 tothe Company’s Form 10-K Report for the fiscal year ended 30 September 1999.)*
10.3(a) Amendment No. 1 to the Amended and Restated Trust Agreement by and between the Companyand PNC Bank, N.A. relating to the Defined Benefit Pension Plans, adopted 1 January 2000.(Filed as Exhibit 10.13(a) to the Company’s Form 10-K Report for the fiscal year ended30 September 2000.)*
10.3(b) Amendment No. 2 to the Amended and Restated Trust Agreement by and between the Companyand PNC Bank, N.A. relating to the Defined Benefit Pension Plans, adopted 11 April 2007. (Filedas Exhibit 10.7(b) to the Company’s Form 10-K Report for the fiscal year ended 30 September2007.)*
10.4 Amended and Restated Trust Agreement by and between the Company and PNC Bank, N.A.relating to the Supplementary Savings Plan dated as of 1 August 1999. (Filed as Exhibit 10.14 tothe Company’s Form 10-K Report for the fiscal year ended 30 September 1999.)*
10.4(a) Amendment No. 1 to the Amended and Restated Trust Agreement by and between the Companyand PNC Bank, N.A. relating to the Supplementary Savings Plan, adopted 1 January 2000. (Filedas Exhibit 10.14(a) to the Company’s Form 10-K Report for the fiscal year ended 30 September2000.)*
101
Exhibit No. Description
10.4(b) Amendment No. 2 to the Amended and Restated Trust Agreement by and between the Companyand PNC Bank, N.A. relating to the Defined Contribution Plans, adopted 11 April 2007. (Filed asExhibit 10.8(b) to the Company’s Form 10-K Report for the fiscal year ended 30 September2007.)*
10.5 Form of Award Agreement under the Long-Term Incentive Plan of the Company, used for theFY 2004 awards. (Filed as Exhibit 10.2 to the Company’s Form 10-Q Report for the quarter ended31 December 2003.)*
10.6 Annual Incentive Plan as Amended and Restated Effective 1 October 2008. (Filed as Exhibit 10.7to the Company’s Form 10-Q Report for the quarter ended 31 March 2009.)*
10.7 Stock Incentive Program of the Company effective 1 October 1996. (Filed as Exhibit 10.21 to theCompany’s Form 10-K Report for the fiscal year ended 30 September 2002.)*
10.8 Form of Award Agreement under the Long-Term Incentive Plan of the Company used for theFY 2005 awards. (Filed as Exhibit 10.1 to the Company’s Form 10-Q Report for the quarter ended31 December 2004.)*
10.9 Amended and Restated Deferred Compensation Program for Directors, effective 1 October 2005.(Filed as Exhibit 10.26 to the Company’s Form 10-K Report for the fiscal year ended30 September 2005.)*
10.10 Form of Award Agreement under the Long-Term Incentive Plan of the Company, used forFY 2006 awards. (Filed as Exhibit 10.1 to the Company’s Form 10-Q Report for the quarter ended31 December 2005.)*
10.11 Amended and Restated Long-Term Incentive Plan of the Company effective 28 January 2010.(Filed as Exhibit 10.1 to the Company’s Form 10-Q Report for the quarter ended 30 June 2010.)*
10.12 Compensation Program for Directors effective 1 October 2008. (Filed as Exhibit 10.20 to theCompany’s Form 10-K Report for the fiscal year ended 30 September 2008.)*
10.13 Form of Award Agreement under the Long-Term Incentive Plan of the Company, used forFY 2007 awards. (Filed as Exhibit 10.1 to the Company’s Form 10-Q Report for the quarter ended31 December 2006.)*
10.14 Air Products and Chemicals, Inc. Retirement Savings Plan as amended and restated effectiveOctober 1, 2009 including amendments through September 30, 2010.
10.15 Form of Award Agreement under the Long-Term Incentive Plan of the Company, used for FY2008 awards. (Filed as Exhibit 10.1 to the Company’s Form 10-Q Report for the quarter ended31 December 2007.)*
10.16 Form of Change in Control Severance Agreement for Corporate Executive Committee. (Filed asExhibit 10.1 to the Company’s Form 8-K Report filed on 20 December 2007.)*
10.17 Form of Award Agreement under the Long-Term Incentive Plan of the Company, used for FY2009 Awards. (Filed as Exhibit 10.1 to the Company’s Form 10-Q Report for the quarter ended31 December 2008.)*
10.18 Supplementary Pension Plan of Air Products and Chemicals, Inc. as Amended and RestatedEffective January 1, 2008. (Filed as Exhibit 10.2 to the Company’s Form 10-Q Report for thequarter ended 31 March 2009.)*
10.18(a) Amendment No. 1 to the Supplementary Pension Plan of Air Products and Chemicals, Inc., asAmended and Restated Effective January 1, 2008. (Filed as Exhibit 10.3 to the Company’sForm 10-Q Report for the quarter ended 31 March 2009.)*
10.18(b) Amendment No. 2 to the Supplementary Pension Plan of Air Products and Chemicals, Inc., asAmended and Restated Effective January 1, 2008. (Filed as Exhibit 10.4 to the Company’sForm 10-Q Report for the quarter ended 31 March 2009.)*
102
Exhibit No. Description
10.18(c) Amendment No. 3 to the Supplementary Pension Plan of Air Products and Chemicals, Inc., asAmended and Restated Effective January 1, 2008. (Filed as Exhibit 10.5 to the Company’sForm 10-Q Report for the quarter ended 31 March 2009.)*
10.19 Corporate Executive Committee Separation Program as Amended Effective as of March 18, 2009.(Filed as Exhibit 10.19 to the Company’s Form 10-K Report for the fiscal year ended30 September 2009.)*
10.20 Deferred Compensation Plan as Amended and Restated January 1, 2009. (Filed as Exhibit 10.20to the Company’s Form 10-K Report for fiscal year ended 30 September 2009.)*
10.21 Form of Award Agreement under the Long-Term Incentive Plan of the Company, used for FY2010awards. (Filed as Exhibit 10.1 to the Company’s Form 10-Q Report for the quarter ended 31December 2009.)*
10.22 Amended and Restated Commitment Letter dated March 3, 2010 among Air Products andChemicals, Inc., JPMorgan Chase Bank, N.A. and J.P. Morgan Securities Inc. (Filed asExhibit 10.1 to Form 8-K filed on 5 March 2010 and incorporated herein by reference.)*
10.23 Accession Letter dated March 3, 2010 among Air Products and Chemicals, Inc., The Royal Bankof Scotland plc and RBS Securities Inc. (Filed as Exhibit 10.2 to Form 8-K filed on 5 March 2010and incorporated herein by reference.)*
10.24 Accession Letter dated March 3, 2010 among Air Products and Chemicals, Inc., Deutsche BankAG Cayman Island Branch and Deutsche Bank Securities Inc. (Filed as Exhibit 10.3 to Form 8-Kfiled on 5 March 2010 and incorporated herein by reference.)*
10.25 Accession Letter dated March 3, 2010 among Air Products and Chemicals, Inc., BNP Paribas andBNP Paribas Securities Corp. (Filed as Exhibit 10.4 to Form 8-K filed on 5 March 2010 andincorporated herein by reference.)*
10.26 Accession Letter dated March 3, 2010 among Air Products and Chemicals, Inc., HSBC Securities(USA) Inc. and HSBC Bank USA, N.A. (Filed as Exhibit 10.5 to Form 8-K filed on 5 March 2010and incorporated herein by reference.)*
10.27 Accession Letter dated March 3, 2010 between Air Products and Chemicals, Inc. and The Bank ofTokyo-Mitsubishi UFJ, Ltd. (Filed as Exhibit 10.6 to Form 8-K filed on 5 March 2010 andincorporated herein by reference.)*
10.28 Credit Agreement dated March 31, 2010 among Air Products and Chemicals, Inc., the lendersparties thereto and JPMorgan Chase Bank, N.A., as administrative agent. (Filed as Exhibit 10.7 tothe Company’s Form 10-Q Report for the quarter ended 31 March 2010.)*
10.29 Revolving Credit Facility dated as of July 8, 2010 for $2,000,000,000.
12 Computation of Ratios of Earnings to Fixed Charges.
14 Code of Conduct. (Filed as Exhibit 14 to the Company’s Form 10-K Report for the fiscal yearended 30 September 2005.)*
21 Subsidiaries of the registrant.
(23) Consents of Experts and Counsel.
23.1 Consent of Independent Registered Public Accounting Firm.
24 Power of Attorney.
(31) Rule 13a-14(a)/15d-14(a) Certifications.
31.1 Certification by the Principal Executive Officer pursuant to Rule 13a-14(a) or Rule 15d-14(a) of theSecurities Exchange Act of 1934, as adopted pursuant to Section 302 of the Sarbanes-Oxley Actof 2002.
103
Exhibit No. Description
31.2 Certification by the Principal Financial Officer pursuant to Rule 13a-14(a) or Rule 15d-14(a) of theSecurities Exchange Act of 1934, as adopted pursuant to Section 302 of the Sarbanes-Oxley Actof 2002.
(32) Section 1350 Certifications.
32.1 Certification by the Principal Executive Officer and Principal Financial Officer pursuant to18 U.S.C. Section 1350, as adopted pursuant to Section 906 of the Sarbanes-Oxley Act of2002. †
101.INS XBRL Instance Document††
101.SCH XBRL Taxonomy Extension Schema††
101.CAL XBRL Taxonomy Extension Calculation Linkbase††
101.LAB XBRL Taxonomy Extension Label Linkbase††
101.PRE XBRL Taxonomy Extension Presentation Linkbase††
101.DEF XBRL Taxonomy Extension Definition Linkbase††
* Previously filed as indicated and incorporated herein by reference. Exhibits incorporated by reference are locatedin SEC File No. 1-4534.
† The certification attached as Exhibit 32.1 that accompanies this Annual Report on Form 10-K, is not deemed filedwith the Securities and Exchange Commission and is not to be incorporated by reference into any filing ofAir Products and Chemicals, Inc. under the Securities Act of 1933, as amended, or the Securities Exchange Actof 1934, as amended, whether made before or after the date of this Form 10-K, irrespective of any generalincorporation language contained in such filing.
†† In accordance with Rule 402 of Regulation S-T, the information in these exhibits shall not be deemed to be “filed”for purposes of Section 18 of the Exchange Act, or otherwise subject to the liability of that section, and shall notbe incorporated by reference into any registration statement or other document filed under the Securities Act, orthe Exchange Act, except as shall be expressly set forth by specific reference in such filing.
104

Air Products | 2010 Annual Report
Common Stock InformationTicker Symbol: APDExchange Listing: New York Stock Exchange
Transfer Agent and Registrar: American Stock Transfer and Trust Company59 Maiden Lane, New York, NY 10038Telephone: 800-937-5449Internet: www.amstock.comE-mail: [email protected]
Publications for ShareholdersIn addition to this Annual Report on Form 10-K for the fiscal year ended September 30, 2010, Air Products informs shareholders about Company news through:
Notice of Annual Meeting and Proxy Statement – made available to shareholders in mid-December and posted to the Company’s website at www.airproducts.com/invest/.
Earnings information—shareholders and investors can obtain cop-ies of earnings releases, Annual Reports, 10-Ks and news releases by visiting www.airproducts.com/invest. Shareholders and inves-tors can also register for e-mail updates at that website.
Dividend PolicyDividends on Air Products’ common stock are declared by the board of directors and, when declared, usually will be paid during the sixth week after the close of the fiscal quarter. It is the Compa-ny’s objective to pay dividends consistent with the reinvestment of earnings necessary for long-term growth.
Direct Investment ProgramCurrent shareholders and new investors can conveniently and eco-nomically purchase shares of Air Products’ common stock and re-invest cash dividends through American Stock Transfer and Trust Company. Registered shareholders can purchase shares on Ameri-can Stock Transfer and Trust’s website, www.investpower.com. New investors can obtain information on the website or by calling 877-322-4941 or 718-921-8200.
annual MeetingThe annual meeting of shareholders will be held on Thursday, January 27, 2011.
terminologyThe term Air Products and Chemicals, Inc., as used in this Report, refers solely to the Delaware corporation of that name. The use of such terms as Air Products, Company, division, organization, we, us, our and its, when referring to either Air Products and Chemi-cals, Inc. and its consolidated subsidiaries or to its subsidiaries and affiliates, either individually or collectively, is only for convenience and is not intended to describe legal relationships. Significant sub-sidiaries are listed as an exhibit to the Form 10-K Report filed by Air Products and Chemicals, Inc. with the Securities and Exchange Commission. Groups, divisions or other business segments of Air Products and Chemicals, Inc. described in this Report are not corporate entities.
annual CertificationsThe most recent certifications by our Chief Executive Officer and Chief Financial Officer pursuant to Section 302 of the Sarbanes-Oxley Act of 2002 are filed as exhibits to our Form 10-K. We have also filed with the New York Stock Exchange the most recent Annual CEO Certification as required by Section 303A.12(a) of the New York Stock Exchange Listed Company Manual.
additional InformationThe forward-looking statements contained in this Report are qualified by reference to the section entitled “Forward-Looking Statements” on page 41 of the Form 10-K section.
Shareholders’ Information

For more information about corporate governance practices at Air Products, visit our Corporate Responsibility website at www.airproducts.com/responsibility.
Mario l. Baeza Founder and Controlling Shareholder of Baeza & Co. and Founder and Executive Chairman of V-Me Media, Inc. Director since 1999.
William l. Davis, III (Presiding Director) Former Chairman, President and Chief Executive Officer of RR Donnelley. Director since 2005.
Michael J. Donahue Former Group Executive Vice President and Chief Operating Officer of BearingPoint, Inc. Director since 2001.
Ursula o. Fairbairn President and Chief Executive Officer of Fairbairn Group, LLC. Director since 1998.
W. Douglas Ford Former Chief Executive, Refining and Marketing, of BP Amoco plc. Director since 2003.
edward e. hagenlocker Former Vice Chairman of Ford Motor Company and former Chairman of Visteon Automotive Systems. Director since 1997.
evert henkes Former Chief Executive Officer of Shell Chemicals Ltd. Director since 2006.
John e. McGlade Chairman, President and Chief Executive Officer of Air Products. Director since 2007.
Margaret G. McGlynn Former President, Global Vaccine and Infectious Diseases Division of Merck & Co., Inc. Director since 2005.
Chadwick C. DeatonChairman and Chief Executive Officer, Baker Hughes Inc. Director since 2010.
lawrence S. Smith Former Chief Financial Officer of Comcast Corporation. Director since 2004.
robert D. Dixon Senior Vice President and General Manager—Merchant Gases.
Paul e. huck Senior Vice President and Chief Financial Officer.
Stephen J. Jones Senior Vice President and General Manager— Tonnage Gases, Equipment and Energy.
lynn C. Minella Senior Vice President—Human Resources and Communications.
John e. McGlade Chairman, President and Chief Executive Officer.
John D. Stanley Senior Vice President and General Counsel.
Board of Directors
Corporate Executive Committee
John Marsland Senior Vice President— Supply Chain.
Corporate headquartersAir Products and Chemicals, Inc. 7201 Hamilton Boulevard Allentown, PA 18195-1501USA Tel 610-481-4911 Fax 610-481-5900
Corporate Secretary’s officeTel 610-481-7067
Investor relations officeSimon Moore, Director Tel 610-481-5775
tell me morewww.airproducts.com
© Air Products and Chemicals, Inc., 2010 (33027) 900-10-028-GLB
Cert no. SGSNA-COC-000072