Embed Size (px)
DESCRIPTION
2010 California Standards Test (CST) Results. Lodi Unified School District. Prepared by the Assessment, Research, and Evaluation August 17, 2010 Board Study Session. Executive Summary. For the third consecutive year….. - PowerPoint PPT Presentation
Citation preview
2010 California Standards 2010 California Standards Test (CST) ResultsTest (CST) Results
Lodi Unified School DistrictLodi Unified School District
Prepared by the Assessment, Research, and Evaluation August 17, 2010 Board Study Session
ARE.1011.015 Release of 2010 CST ResultsARE.1011.015 Release of 2010 CST Results 22
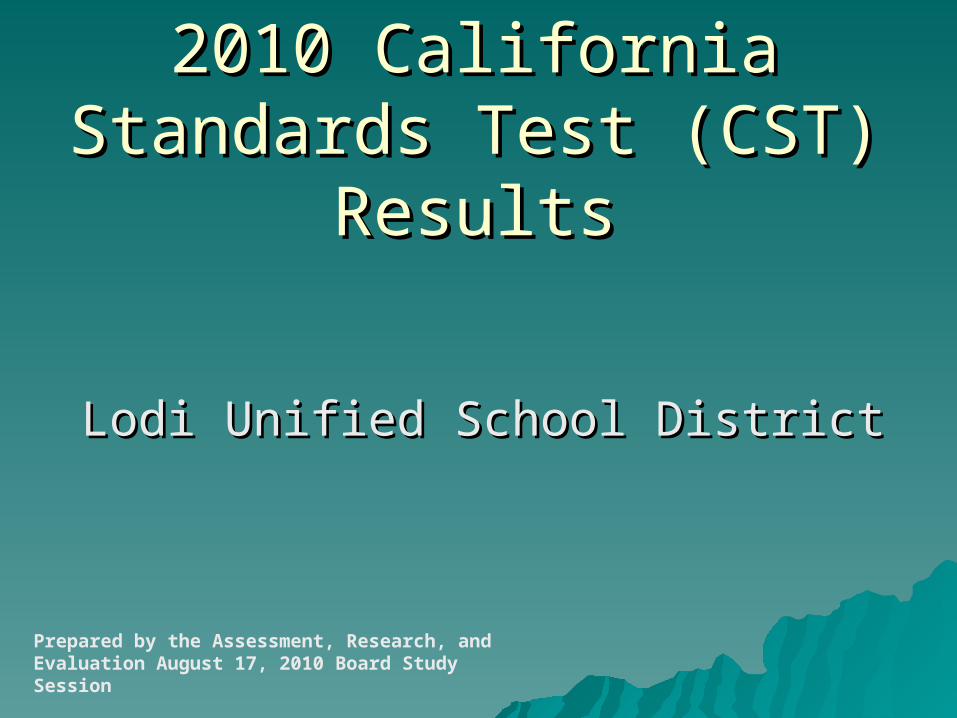
Executive SummaryExecutive Summary For the third consecutive year…..For the third consecutive year…..
– There was an increase in the percent of There was an increase in the percent of students meeting or exceeding standards in:students meeting or exceeding standards in:
English Language ArtsEnglish Language Arts MathematicsMathematics Grade Level ScienceGrade Level Science History-Social Science History-Social Science
– The percent of students meeting or exceeding The percent of students meeting or exceeding English Language Arts and Mathematics English Language Arts and Mathematics standards increased for each of these standards increased for each of these numerically significant student groups:numerically significant student groups:
Economically Disadvantaged studentsEconomically Disadvantaged students Asian studentsAsian students White studentsWhite students

ARE.1011.015 Release of 2010 CST ResultsARE.1011.015 Release of 2010 CST Results 33
Executive SummaryExecutive Summary From 2007 to 2010, there have been mixed From 2007 to 2010, there have been mixed
results regarding the district’s efforts in closing results regarding the district’s efforts in closing the ethnic achievement gaps in English the ethnic achievement gaps in English Language Arts and Mathematics.Language Arts and Mathematics.– English Language ArtsEnglish Language Arts
Since 2007, the achievement gap in English Language Arts Since 2007, the achievement gap in English Language Arts between White and African American students, regardless of between White and African American students, regardless of economic status, has widened. economic status, has widened.
During this same period, the achievement gap in English During this same period, the achievement gap in English Language Arts between White and Hispanic or Latino students Language Arts between White and Hispanic or Latino students has narrowed for non-economically disadvantaged students and has narrowed for non-economically disadvantaged students and widened for economically disadvantaged students.widened for economically disadvantaged students.
– MathematicsMathematics Since 2007, the achievement gap in mathematics between White Since 2007, the achievement gap in mathematics between White
and African American students, regardless of economic status, and African American students, regardless of economic status, has widened.has widened.
During this same period, the achievement gap in mathematics During this same period, the achievement gap in mathematics between White and Hispanic or Latino students, regardless of between White and Hispanic or Latino students, regardless of economic status, has widened.economic status, has widened.
ARE.1011.015 Release of 2010 CST ResultsARE.1011.015 Release of 2010 CST Results 44
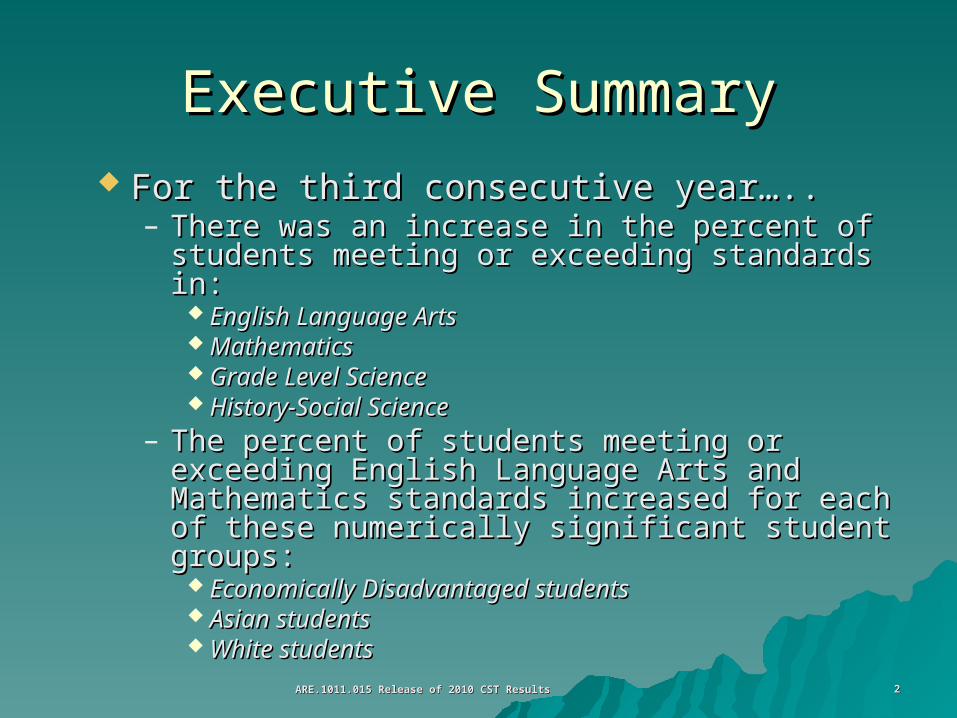
Executive Summary: Executive Summary: Focus Areas for 2010-11Focus Areas for 2010-11
Elementary EducationElementary Education
– English Language English Language ArtsArts
Grades 3 and 6Grades 3 and 6
– MathematicsMathematics Grades 2 and 3Grades 2 and 3
Secondary EducationSecondary Education
– English Language ArtsEnglish Language Arts Grade 11Grade 11
– MathematicsMathematics Algebra I and Algebra I and
GeometryGeometry
– ScienceScience PhysicsPhysics
– History-Social ScienceHistory-Social Science Grade 11Grade 11
ARE.1011.015 Release of 2010 CST ResultsARE.1011.015 Release of 2010 CST Results 55
CST Content Areas AssessedCST Content Areas Assessed
English Language Arts: English Language Arts: Grades 2-11 Grades 2-11
Mathematics: Mathematics: Grades 2-7, General Math, Grades 2-7, General Math, Algebra I, Geometry, Algebra II, and Summative Algebra I, Geometry, Algebra II, and Summative High School MathHigh School Math
Science:Science: Grades 5, 8, and 10 Life Science, Earth Grades 5, 8, and 10 Life Science, Earth Science, Biology, Chemistry, and PhysicsScience, Biology, Chemistry, and Physics
History-Social Science:History-Social Science: Grade 8, and Grade 11 Grade 8, and Grade 11 U.S. History, World HistoryU.S. History, World History
ARE.1011.015 Release of 2010 CST ResultsARE.1011.015 Release of 2010 CST Results 66
Summary Findings – English Summary Findings – English Language ArtsLanguage Arts
Overall, 45% of our students met or exceeded grade level Overall, 45% of our students met or exceeded grade level English Language Arts standards.English Language Arts standards.– This represents a 2 percentage point increase from This represents a 2 percentage point increase from
2009, and a 9 percentage point increase since 2007.2009, and a 9 percentage point increase since 2007.
For the third consecutive year, the percent of students For the third consecutive year, the percent of students meeting or exceeding standards in English Language Arts meeting or exceeding standards in English Language Arts increased for four of the grade levels tested. increased for four of the grade levels tested. – Three-year consecutive percent proficient increase: Three-year consecutive percent proficient increase:
Grades 4, 7, 8, and 10Grades 4, 7, 8, and 10– Two-year consecutive percent proficient increase: Grade Two-year consecutive percent proficient increase: Grade
22– One-year percent proficient increase: Grades 5 and 9One-year percent proficient increase: Grades 5 and 9– Percent proficient no change/decrease: Grades 3, 6, and Percent proficient no change/decrease: Grades 3, 6, and
1111
ARE.1011.015 Release of 2010 CST ResultsARE.1011.015 Release of 2010 CST Results 77
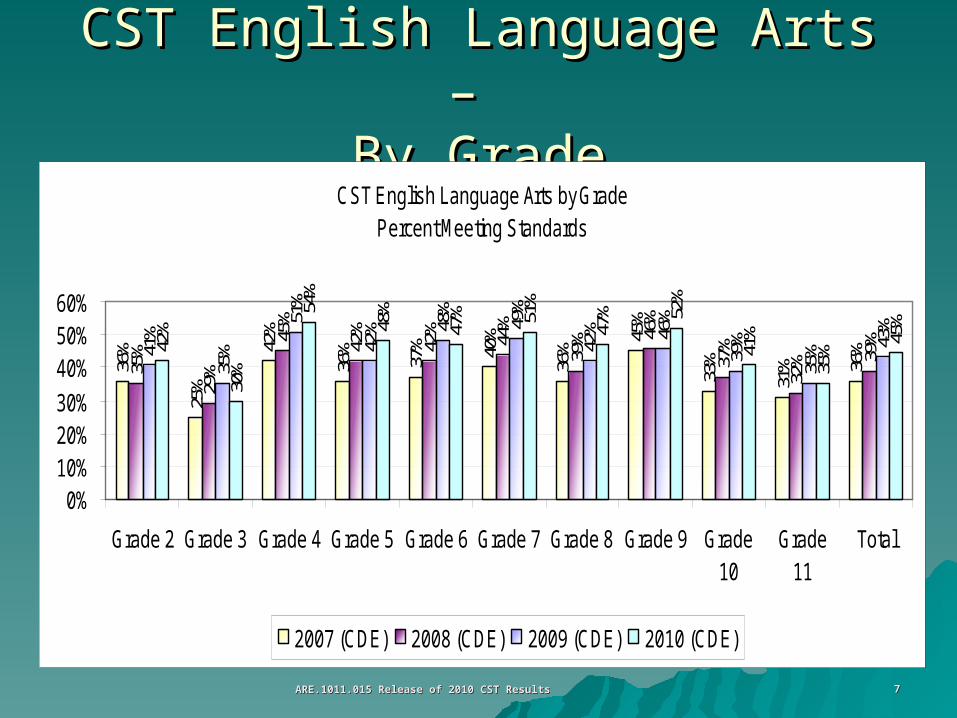
CST English Language Arts – CST English Language Arts – By GradeBy Grade
CST English Language Arts by Grade Percent Meeting Standards
36%
25%
42%
36%
37% 40
%
36%
45%
33%
31% 36
%
35%
29%
45%
42%
42% 44%
39% 46
%
37%
32% 39
%41%
35%
51%
42% 48
%
49%
42% 46
%
39%
35% 43
%
42%
30%
54%
48%
47% 51
%
47% 52
%
41%
35%
45%
0%10%20%30%
40%50%60%
Grade 2 Grade 3 Grade 4 Grade 5 Grade 6 Grade 7 Grade 8 Grade 9 Grade10
Grade11
Total
2007 (CDE) 2008 (CDE) 2009 (CDE) 2010 (CDE)
ARE.1011.015 Release of 2010 CST ResultsARE.1011.015 Release of 2010 CST Results 88
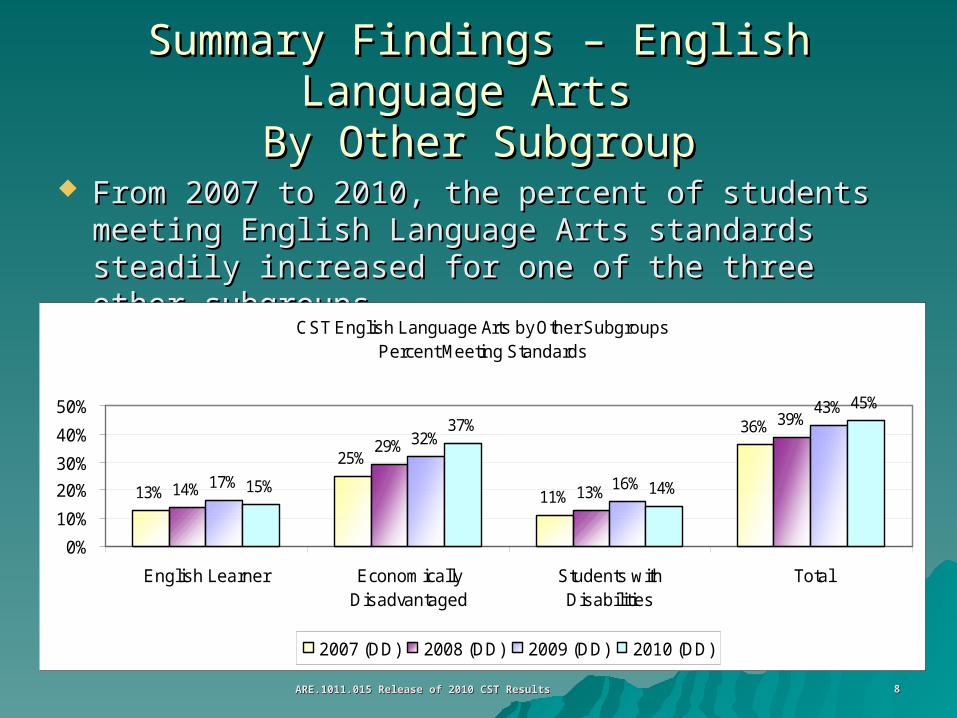
Summary Findings – English Language Arts Summary Findings – English Language Arts By Other SubgroupBy Other Subgroup
From 2007 to 2010, the percent of students From 2007 to 2010, the percent of students meeting English Language Arts standards steadily meeting English Language Arts standards steadily increased for one of the three other subgroups.increased for one of the three other subgroups.
CST English Language Arts by Other SubgroupsPercent Meeting Standards
13%
25%
11%
36%
14%
29%
13%
39%
17%
32%
16%
43%
15%
37%
14%
45%
0%
10%
20%
30%
40%
50%
English Learner EconomicallyDisadvantaged
Students withDisabilities
Total
2007 (DD) 2008 (DD) 2009 (DD) 2010 (DD)
ARE.1011.015 Release of 2010 CST ResultsARE.1011.015 Release of 2010 CST Results 99
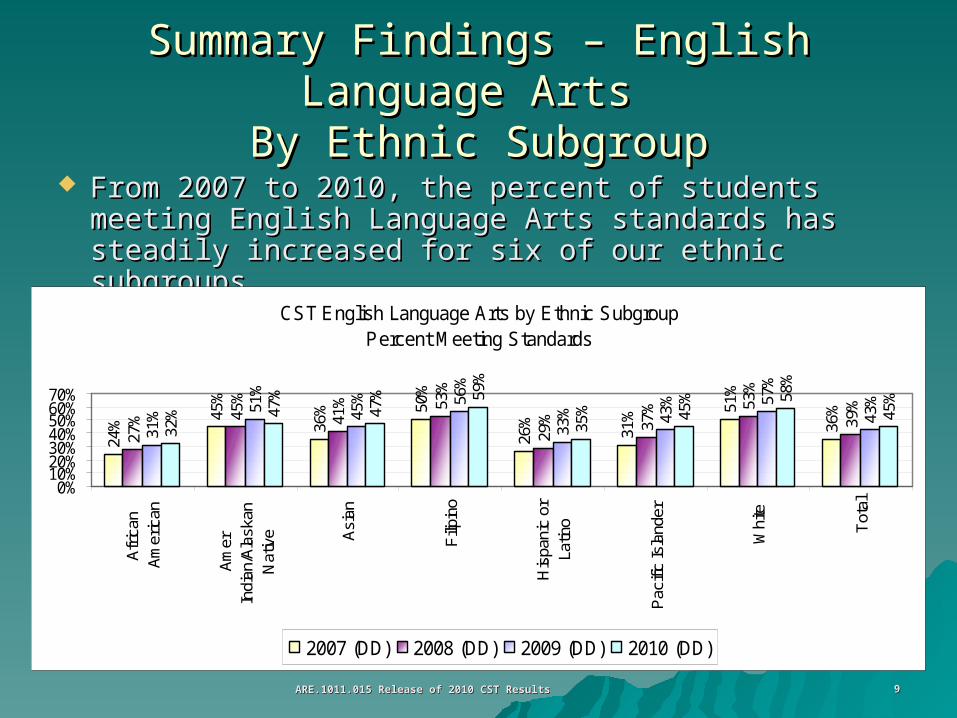
Summary Findings – English Language Arts Summary Findings – English Language Arts By Ethnic SubgroupBy Ethnic Subgroup
From 2007 to 2010, the percent of students From 2007 to 2010, the percent of students meeting English Language Arts standards has meeting English Language Arts standards has steadily increased for six of our ethnic subgroups.steadily increased for six of our ethnic subgroups.
CST English Language Arts by Ethnic Subgroup Percent Meeting Standards
24%
45%
36% 50
%
26%
31% 51
%
36%
27% 45
%
41% 53
%
29% 37
% 53%
39%
31% 51
%
45% 56
%
33% 43
% 57%
43%
32% 47
%
47% 59
%
35% 45
% 58%
45%
0%10%20%30%40%50%60%70%
Afr
ican
Am
eric
an
Am
erIn
dian
/Ala
skan
Nat
ive Asi
an
Filip
ino
His
pani
c or
Latin
o
Pac
ific
Isla
nder
Whi
te
Tot
al
2007 (DD) 2008 (DD) 2009 (DD) 2010 (DD)
ARE.1011.015 Release of 2010 CST ResultsARE.1011.015 Release of 2010 CST Results 1010
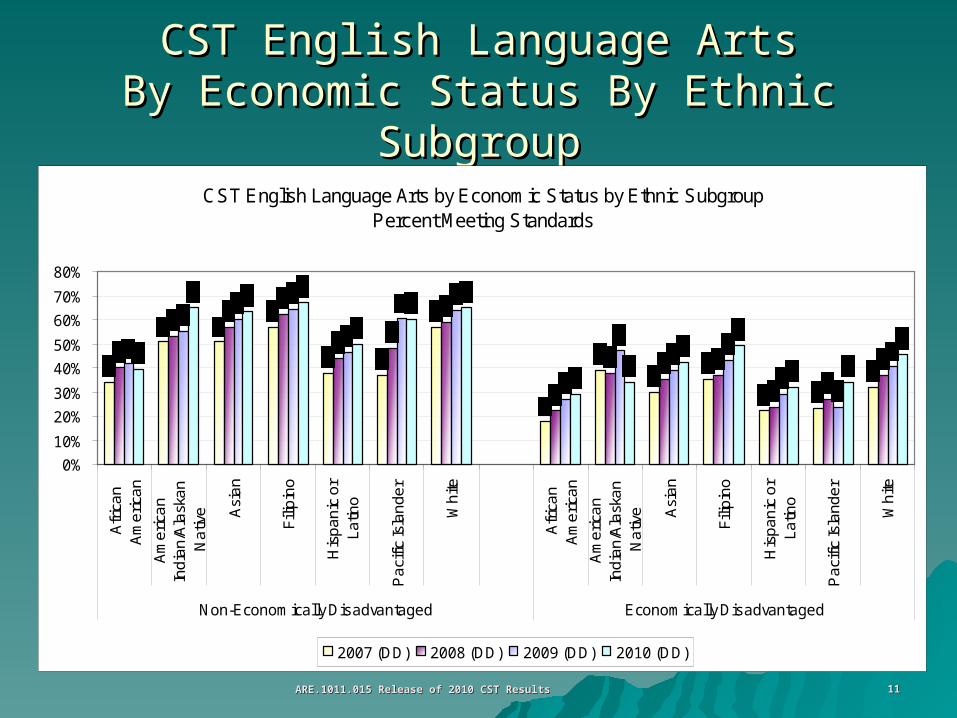
Summary Findings – English Language Arts Summary Findings – English Language Arts By Economic Status By Ethnic SubgroupBy Economic Status By Ethnic Subgroup
Since 2007, the achievement gap in English Since 2007, the achievement gap in English Language Arts between White and African Language Arts between White and African American students, regardless of economic American students, regardless of economic status, has widened. status, has widened.
During this same period, the achievement gap in During this same period, the achievement gap in English Language Arts between White and English Language Arts between White and Hispanic or Latino students has:Hispanic or Latino students has:– narrowed by 4 percentage points for non-narrowed by 4 percentage points for non-
economically disadvantaged students; and economically disadvantaged students; and – widened by 3 percentage points for widened by 3 percentage points for
economically disadvantaged students.economically disadvantaged students.
ARE.1011.015 Release of 2010 CST ResultsARE.1011.015 Release of 2010 CST Results 1111
CST English Language ArtsCST English Language ArtsBy Economic Status By Ethnic SubgroupBy Economic Status By Ethnic Subgroup
CST English Language Arts by Economic Status by Ethnic Subgroup Percent Meeting Standards
0%
10%
20%
30%
40%
50%
60%
70%
80%
Afr
ica
nA
me
rica
n
Am
eri
can
Ind
ian
/Ala
ska
nN
ativ
e Asi
an
Fili
pin
o
His
pa
nic
or
La
tino
Pa
cific
Isla
nd
er
Wh
ite
Afr
ica
nA
me
rica
n
Am
eri
can
Ind
ian
/Ala
ska
nN
ativ
e Asi
an
Fili
pin
o
His
pa
nic
or
La
tino
Pa
cific
Isla
nd
er
Wh
ite
Non-Economically Disadvantaged Economically Disadvantaged
2007 (DD) 2008 (DD) 2009 (DD) 2010 (DD)
ARE.1011.015 Release of 2010 CST ResultsARE.1011.015 Release of 2010 CST Results 1212
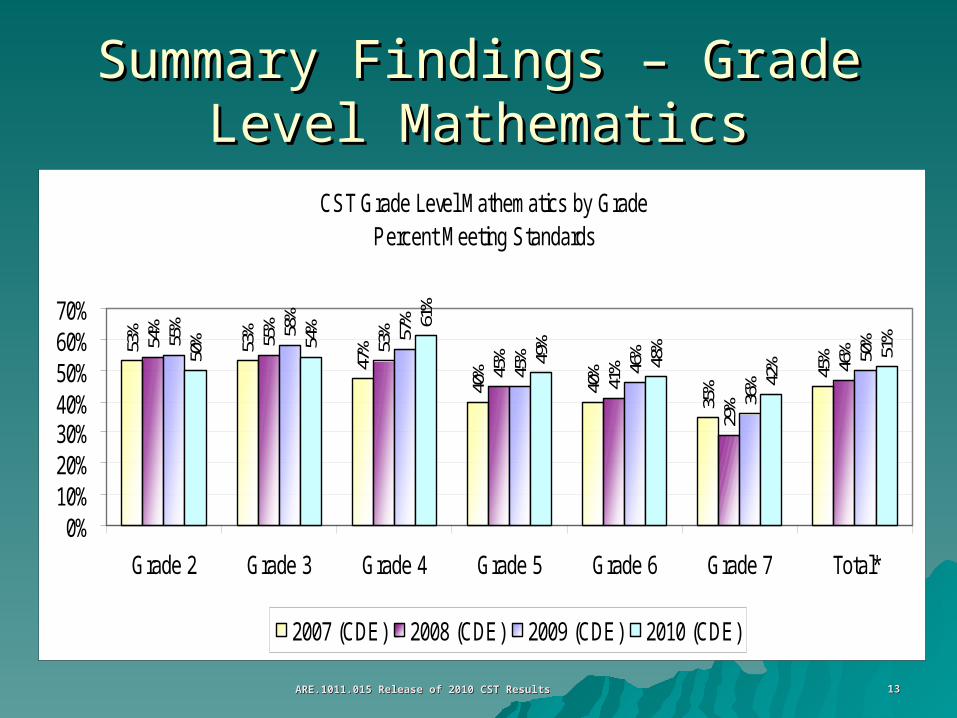
Summary Findings – Grade Level Summary Findings – Grade Level MathematicsMathematics
Overall, 51% of our students met or exceeded grade level Overall, 51% of our students met or exceeded grade level mathematics standards.mathematics standards.– This represents a 1 percentage point increase from 2009, and This represents a 1 percentage point increase from 2009, and
a 6 percentage point increase since 2007.a 6 percentage point increase since 2007.
For the third consecutive year, the percent of students For the third consecutive year, the percent of students meeting or exceeding standards in grade level meeting or exceeding standards in grade level mathematics increased for two of the grade levels tested. mathematics increased for two of the grade levels tested. – Three-year consecutive percent proficient increase: Grades 4 Three-year consecutive percent proficient increase: Grades 4
and 6and 6– Two-year consecutive percent proficient increase: Grade 7Two-year consecutive percent proficient increase: Grade 7– One-year percent proficient increase: Grades 5One-year percent proficient increase: Grades 5– Percent proficient no change/decrease: Grades 2 and 3Percent proficient no change/decrease: Grades 2 and 3
ARE.1011.015 Release of 2010 CST ResultsARE.1011.015 Release of 2010 CST Results 1313
Summary Findings – Grade Level Summary Findings – Grade Level MathematicsMathematics
CST Grade Level Mathematics by GradePercent Meeting Standards
53%
53%
47%
40%
40%
35%
45%
54%
55%
53%
45%
41%
29%
46%55
% 58%
57%
45%
46%
36%
50%
50% 54
% 61%
49%
48%
42% 51
%
0%10%20%30%40%50%60%70%
Grade 2 Grade 3 Grade 4 Grade 5 Grade 6 Grade 7 Total*
2007 (CDE) 2008 (CDE) 2009 (CDE) 2010 (CDE)
ARE.1011.015 Release of 2010 CST ResultsARE.1011.015 Release of 2010 CST Results 1414
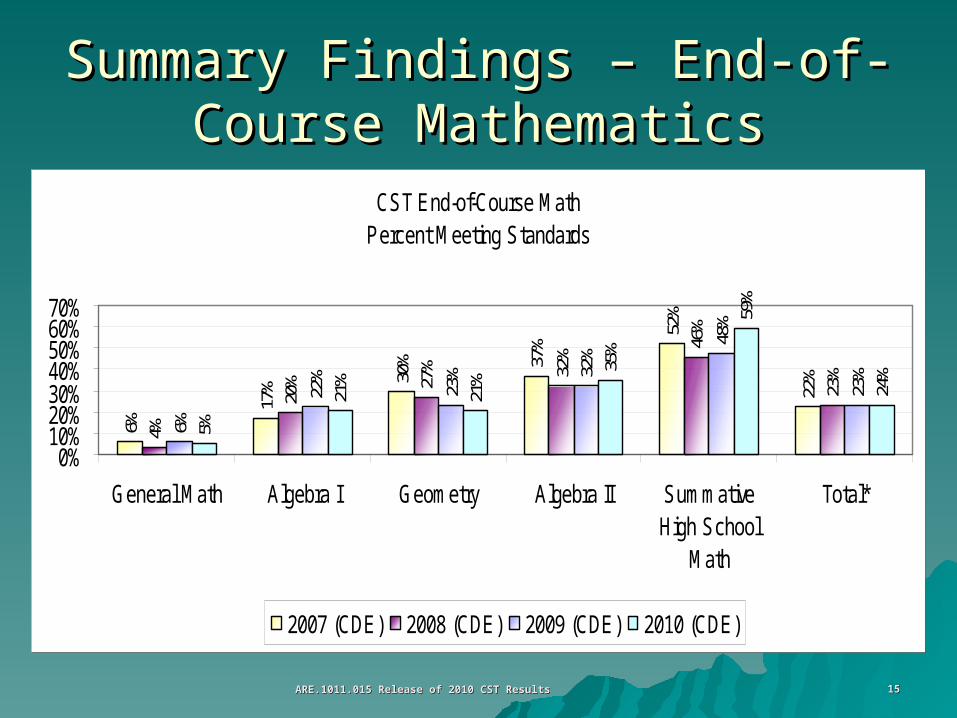
Summary Findings – End-of-Summary Findings – End-of-Course MathematicsCourse Mathematics
Overall, 24% of our students met or exceeded Overall, 24% of our students met or exceeded end-of-course mathematics standards.end-of-course mathematics standards.– This represents a 1 percentage point increase from This represents a 1 percentage point increase from
2009, and a 2 percentage point increase since 2007.2009, and a 2 percentage point increase since 2007.
From 2009 to 2010, the percent of students From 2009 to 2010, the percent of students meeting or exceeding standards in end-of-course meeting or exceeding standards in end-of-course mathematics increased for two of the subjects mathematics increased for two of the subjects tested. tested. – Percent proficient increase: Algebra II and Summative Percent proficient increase: Algebra II and Summative
High School Math High School Math – Percent percent proficient no change/decrease: General Percent percent proficient no change/decrease: General
Math, Algebra I, and GeometryMath, Algebra I, and Geometry
ARE.1011.015 Release of 2010 CST ResultsARE.1011.015 Release of 2010 CST Results 1515
Summary Findings – End-of-Summary Findings – End-of-Course MathematicsCourse Mathematics
CST End-of-Course MathPercent Meeting Standards
6%
17% 30
% 37%
52%
22%
4%
20% 27
% 32%
46%
23%
6%
22%
23% 32
%
48%
23%
5%
21%
21%
35%
59%
24%
0%10%20%30%40%50%60%70%
General Math Algebra I Geometry Algebra II SummativeHigh School
Math
Total*
2007 (CDE) 2008 (CDE) 2009 (CDE) 2010 (CDE)
ARE.1011.015 Release of 2010 CST ResultsARE.1011.015 Release of 2010 CST Results 1616
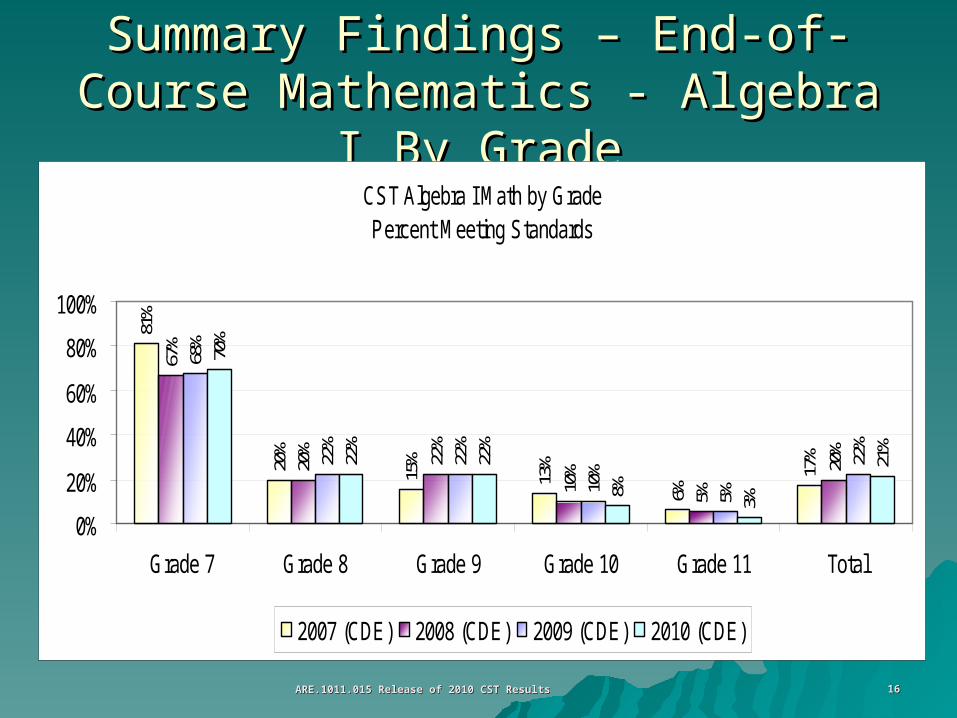
Summary Findings – End-of-Course Summary Findings – End-of-Course Mathematics - Algebra I By GradeMathematics - Algebra I By Grade
CST Algebra I Math by GradePercent Meeting Standards
81%
20%
15%
13%
6%
17%
67%
20% 22%
10%
5%
20%
68%
22%
22%
10%
5%
22%
70%
22%
22%
8% 3%
21%
0%
20%
40%
60%
80%
100%
Grade 7 Grade 8 Grade 9 Grade 10 Grade 11 Total
2007 (CDE) 2008 (CDE) 2009 (CDE) 2010 (CDE)
ARE.1011.015 Release of 2010 CST ResultsARE.1011.015 Release of 2010 CST Results 1717
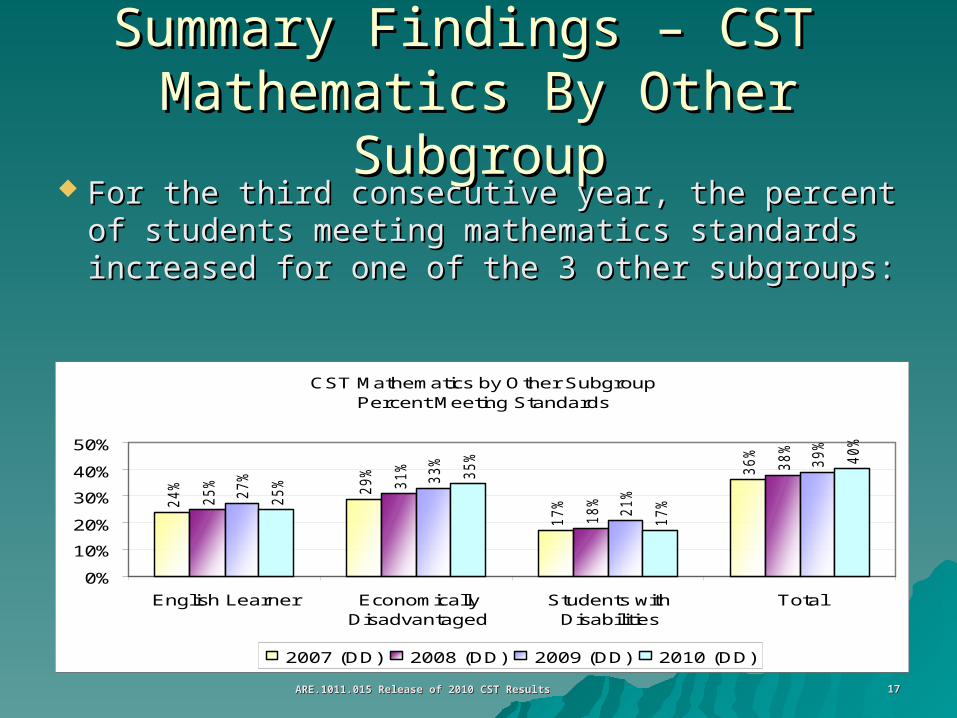
Summary Findings – CST Summary Findings – CST Mathematics By Other SubgroupMathematics By Other Subgroup
For the third consecutive year, the percent For the third consecutive year, the percent of students meeting mathematics standards of students meeting mathematics standards increased for one of the 3 other subgroups: increased for one of the 3 other subgroups:
CST Mathematics by Other SubgroupPercent Meeting Standards
24% 29%
17%
36%
25% 31%
18%
38%
27% 33%
21%
39%
25%
35%
17%
40%
0%
10%
20%
30%
40%
50%
English Learner EconomicallyDisadvantaged
Students withDisabilities
Total
2007 (DD) 2008 (DD) 2009 (DD) 2010 (DD)
ARE.1011.015 Release of 2010 CST ResultsARE.1011.015 Release of 2010 CST Results 1818
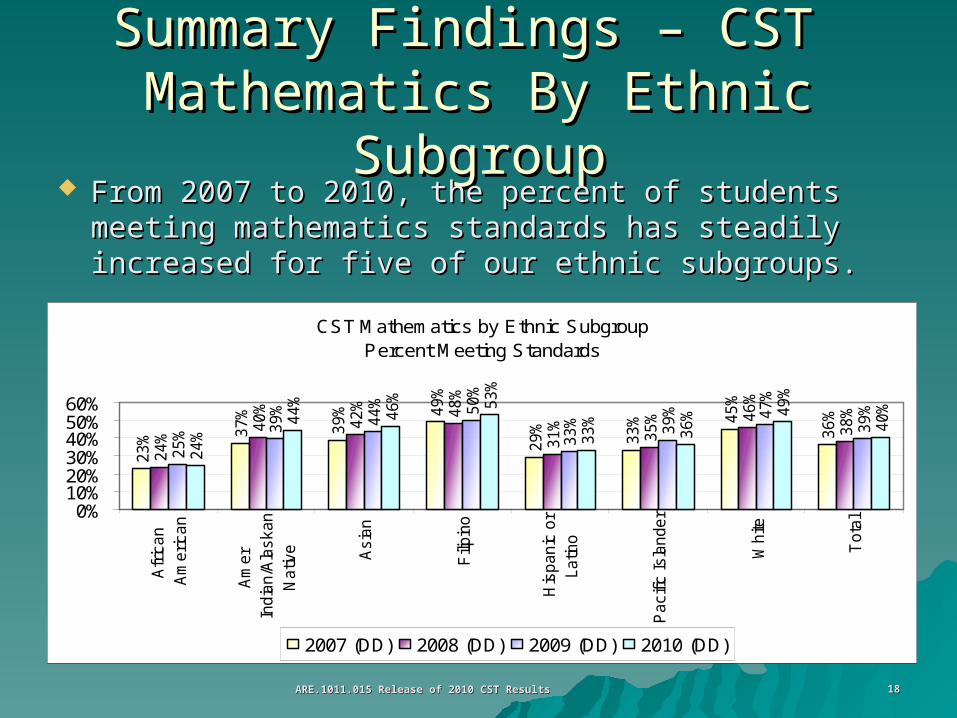
Summary Findings – CST Summary Findings – CST Mathematics By Ethnic SubgroupMathematics By Ethnic Subgroup
From 2007 to 2010, the percent of students From 2007 to 2010, the percent of students meeting mathematics standards has steadily meeting mathematics standards has steadily increased for five of our ethnic subgroups.increased for five of our ethnic subgroups.
CST Mathematics by Ethnic SubgroupPercent Meeting Standards
23% 3
7%
39% 4
9%
29%
33% 4
5%
36%
24%
40%
42% 48%
31%
35% 4
6%
38%
25% 3
9%
44% 50%
33% 39% 47%
39%
24%
44%
46% 53%
33%
36% 4
9%
40%
0%10%20%30%40%50%60%
Afr
ican
Am
erican
Am
er
India
n/A
laskan
Nativ
e Asia
n
Filipin
o
His
panic
or
Latin
o
Pacifi
c Isla
nder
White
Tota
l
2007 (DD) 2008 (DD) 2009 (DD) 2010 (DD)
ARE.1011.015 Release of 2010 CST ResultsARE.1011.015 Release of 2010 CST Results 1919
Summary Findings – CST Mathematics Summary Findings – CST Mathematics Achievement By Economic Status By Ethnic Achievement By Economic Status By Ethnic
SubgroupSubgroup Since 2007, the achievement gap in mathematics between Since 2007, the achievement gap in mathematics between
White and African American students has:White and African American students has:– widened by 3 percentage points for non-economically widened by 3 percentage points for non-economically
disadvantaged students; and disadvantaged students; and – widened by 5 percentage points for economically widened by 5 percentage points for economically
disadvantaged students.disadvantaged students.
During this same period, the achievement gap in During this same period, the achievement gap in mathematics between White and Hispanic or Latino mathematics between White and Hispanic or Latino students has:students has:– widened by 1 percentage points for non-economically widened by 1 percentage points for non-economically
disadvantaged students; and disadvantaged students; and – widened by 2 percentage points for economically widened by 2 percentage points for economically
disadvantaged students.disadvantaged students.
ARE.1011.015 Release of 2010 CST ResultsARE.1011.015 Release of 2010 CST Results 2020
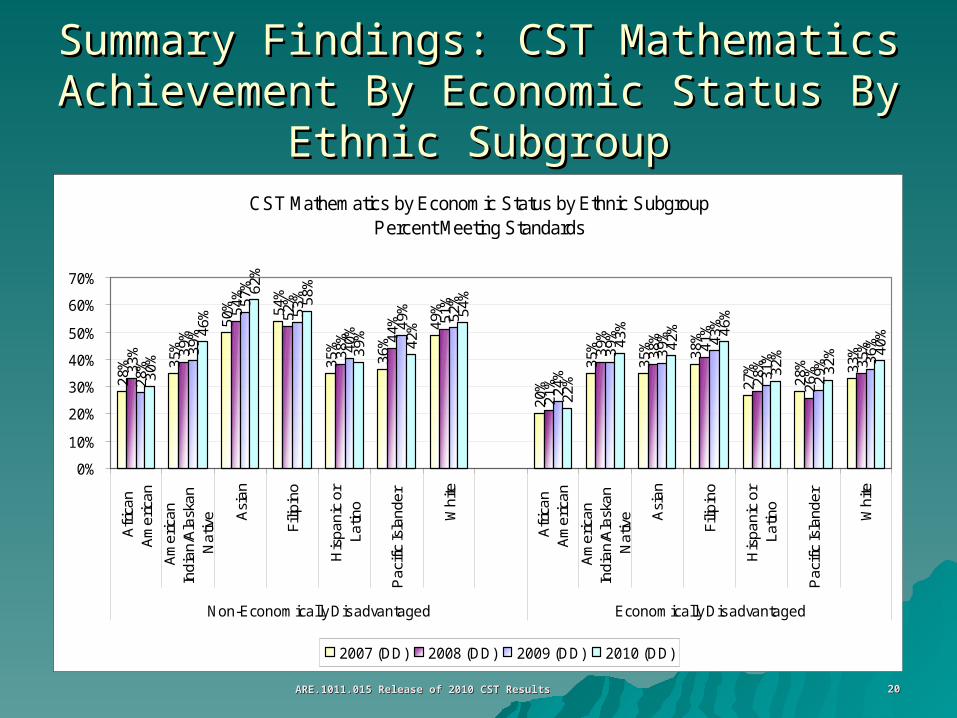
Summary Findings: CST Mathematics Summary Findings: CST Mathematics Achievement By Economic Status By Ethnic Achievement By Economic Status By Ethnic
SubgroupSubgroupCST Mathematics by Economic Status by Ethnic Subgroup
Percent Meeting Standards
28% 35
%
50% 54
%
35%
36%
49%
20%
35%
35% 38
%
27%
28% 33
%
33% 39
%
54%
52%
38% 44
% 51%
21%
39%
38%
41%
28%
26% 35
%
28%
39%
57%
53%
40% 49
%
52%
24%
39%
39% 43
%
31%
29% 36
%
30%
46%
62%
58%
39%
42%
54%
22%
43%
42% 46
%
32%
32% 40
%
0%
10%
20%
30%
40%
50%
60%
70%
Afri
can
Am
eric
an
Am
eric
anIn
dian
/Ala
skan
Nat
ive A
sian
Filip
ino
His
pani
c or
Latin
o
Pac
ific
Isla
nder
Whi
te
Afri
can
Am
eric
an
Am
eric
anIn
dian
/Ala
skan
Nat
ive A
sian
Filip
ino
His
pani
c or
Latin
o
Pac
ific
Isla
nder
Whi
te
Non-Economically Disadvantaged Economically Disadvantaged
2007 (DD) 2008 (DD) 2009 (DD) 2010 (DD)
ARE.1011.015 Release of 2010 CST ResultsARE.1011.015 Release of 2010 CST Results 2121
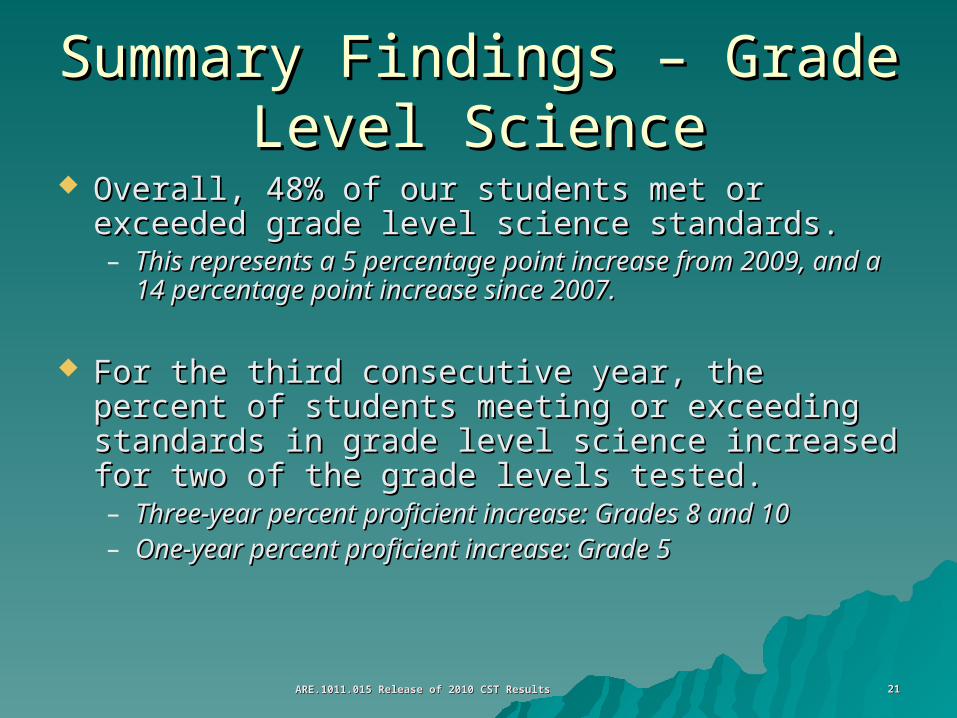
Summary Findings – Grade Summary Findings – Grade Level ScienceLevel Science
Overall, 48% of our students met or exceeded Overall, 48% of our students met or exceeded grade level science standards.grade level science standards.– This represents a 5 percentage point increase from This represents a 5 percentage point increase from
2009, and a 14 percentage point increase since 2007.2009, and a 14 percentage point increase since 2007.
For the third consecutive year, the percent of For the third consecutive year, the percent of students meeting or exceeding standards in students meeting or exceeding standards in grade level science increased for two of the grade grade level science increased for two of the grade levels tested. levels tested. – Three-year percent proficient increase: Grades 8 and 10 Three-year percent proficient increase: Grades 8 and 10 – One-year percent proficient increase: Grade 5 One-year percent proficient increase: Grade 5
ARE.1011.015 Release of 2010 CST ResultsARE.1011.015 Release of 2010 CST Results 2222
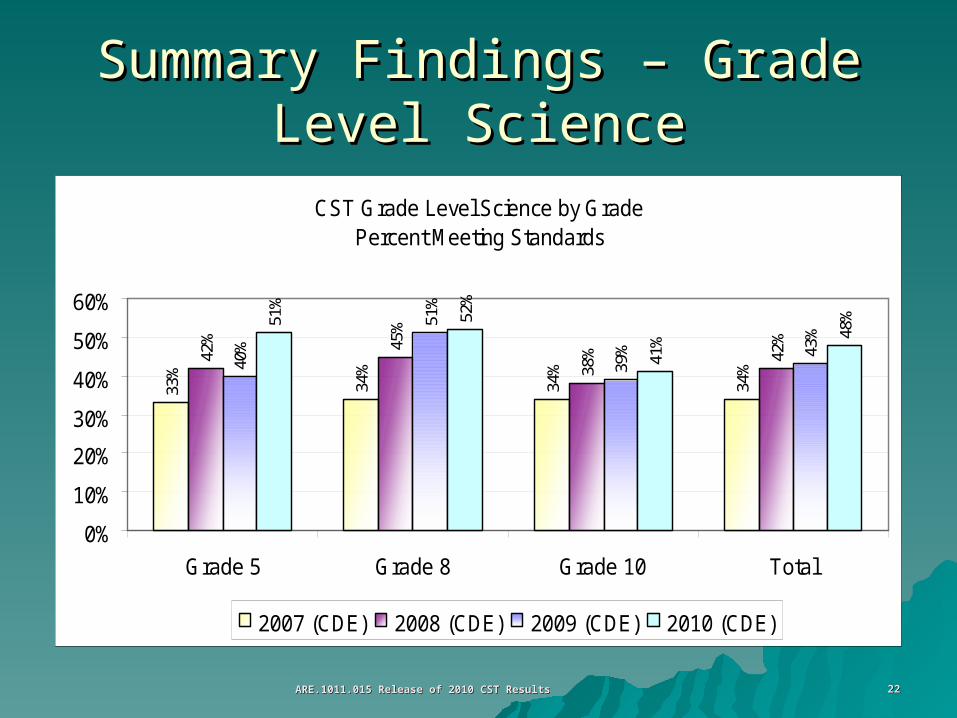
Summary Findings – Grade Level Summary Findings – Grade Level ScienceScience
CST Grade Level Science by GradePercent Meeting Standards
33%
34%
34%
34%
42% 45
%
38% 42
%
40%
51%
39% 43
%
51%
52%
41% 48
%
0%
10%
20%
30%
40%
50%
60%
Grade 5 Grade 8 Grade 10 Total
2007 (CDE) 2008 (CDE) 2009 (CDE) 2010 (CDE)
ARE.1011.015 Release of 2010 CST ResultsARE.1011.015 Release of 2010 CST Results 2323
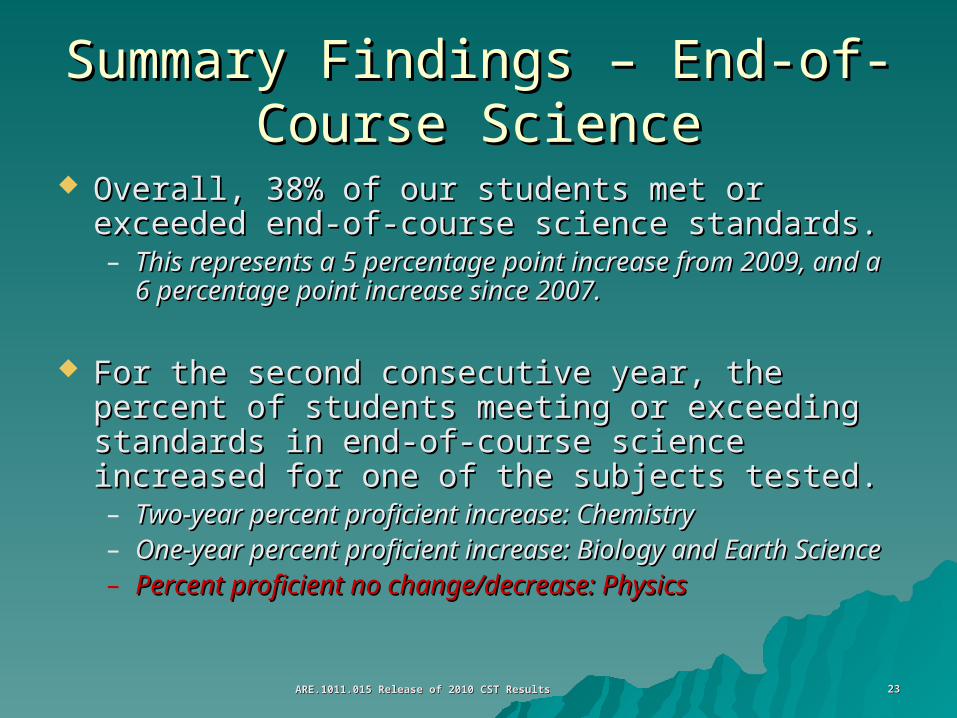
Summary Findings – End-of-Summary Findings – End-of-Course ScienceCourse Science
Overall, 38% of our students met or exceeded Overall, 38% of our students met or exceeded end-of-course science standards.end-of-course science standards.– This represents a 5 percentage point increase from This represents a 5 percentage point increase from
2009, and a 6 percentage point increase since 2007.2009, and a 6 percentage point increase since 2007.
For the second consecutive year, the percent of For the second consecutive year, the percent of students meeting or exceeding standards in end-students meeting or exceeding standards in end-of-course science increased for one of the of-course science increased for one of the subjects tested. subjects tested. – Two-year percent proficient increase: Chemistry Two-year percent proficient increase: Chemistry – One-year percent proficient increase: Biology and Earth One-year percent proficient increase: Biology and Earth
Science Science – Percent proficient no change/decrease: PhysicsPercent proficient no change/decrease: Physics
ARE.1011.015 Release of 2010 CST ResultsARE.1011.015 Release of 2010 CST Results 2424
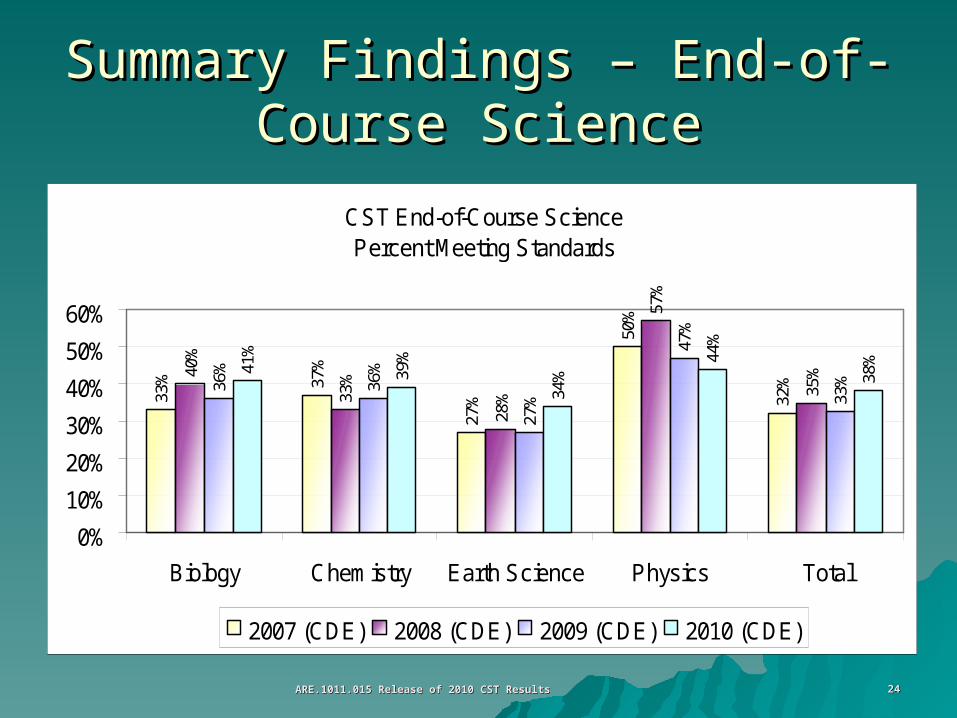
Summary Findings – End-of-Summary Findings – End-of-Course ScienceCourse Science
CST End-of-Course Science Percent Meeting Standards
33% 37
%
27%
50%
32%
40%
33%
28%
57%
35%
36%
36%
27%
47%
33%
41%
39%
34%
44%
38%
0%
10%
20%
30%
40%
50%
60%
Biology Chemistry Earth Science Physics Total
2007 (CDE) 2008 (CDE) 2009 (CDE) 2010 (CDE)
ARE.1011.015 Release of 2010 CST ResultsARE.1011.015 Release of 2010 CST Results 2525
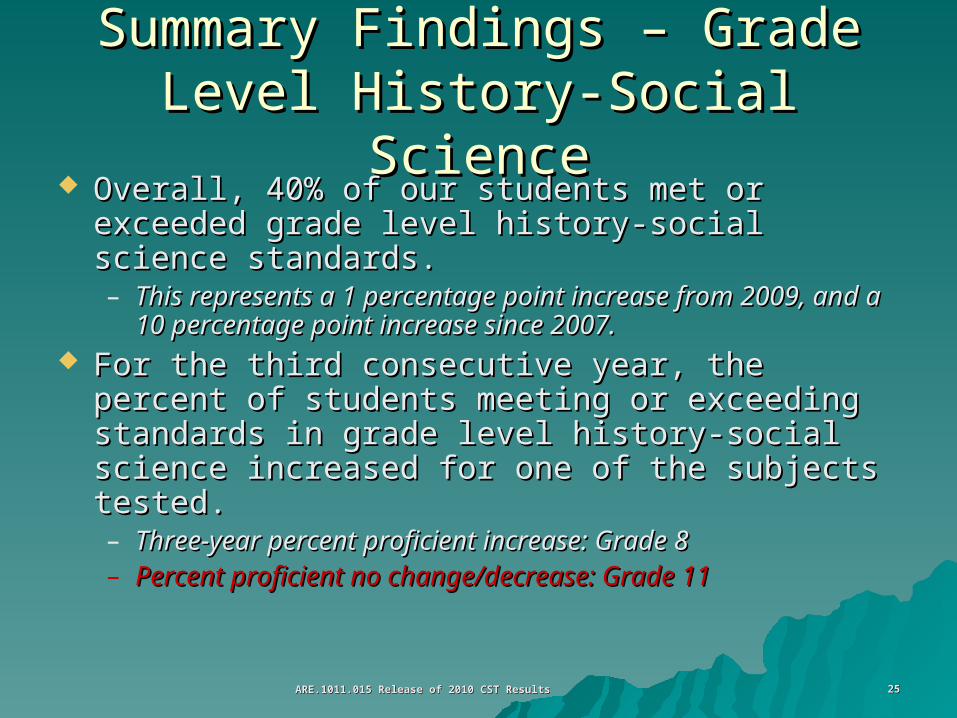
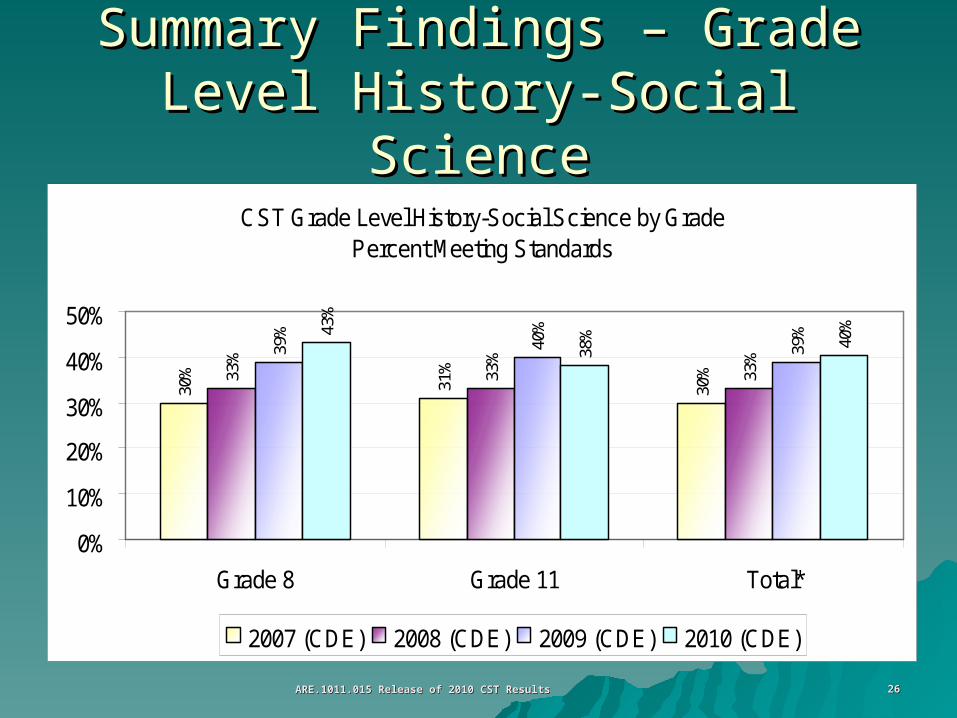
Summary Findings – Grade Level Summary Findings – Grade Level History-Social ScienceHistory-Social Science
Overall, 40% of our students met or exceeded Overall, 40% of our students met or exceeded grade level history-social science standards.grade level history-social science standards.– This represents a 1 percentage point increase from This represents a 1 percentage point increase from
2009, and a 10 percentage point increase since 2007.2009, and a 10 percentage point increase since 2007. For the third consecutive year, the percent of For the third consecutive year, the percent of
students meeting or exceeding standards in students meeting or exceeding standards in grade level history-social science increased for grade level history-social science increased for one of the subjects tested. one of the subjects tested. – Three-year percent proficient increase: Grade 8 Three-year percent proficient increase: Grade 8 – Percent proficient no change/decrease: Grade 11Percent proficient no change/decrease: Grade 11
ARE.1011.015 Release of 2010 CST ResultsARE.1011.015 Release of 2010 CST Results 2626
Summary Findings – Grade Level Summary Findings – Grade Level History-Social ScienceHistory-Social Science
CST Grade Level History-Social Science by Grade Percent Meeting Standards
30%
31%
30%33
%
33%
33%39
%
40%
39%43
%
38% 40
%
0%
10%
20%
30%
40%
50%
Grade 8 Grade 11 Total*
2007 (CDE) 2008 (CDE) 2009 (CDE) 2010 (CDE)
ARE.1011.015 Release of 2010 CST ResultsARE.1011.015 Release of 2010 CST Results 2727
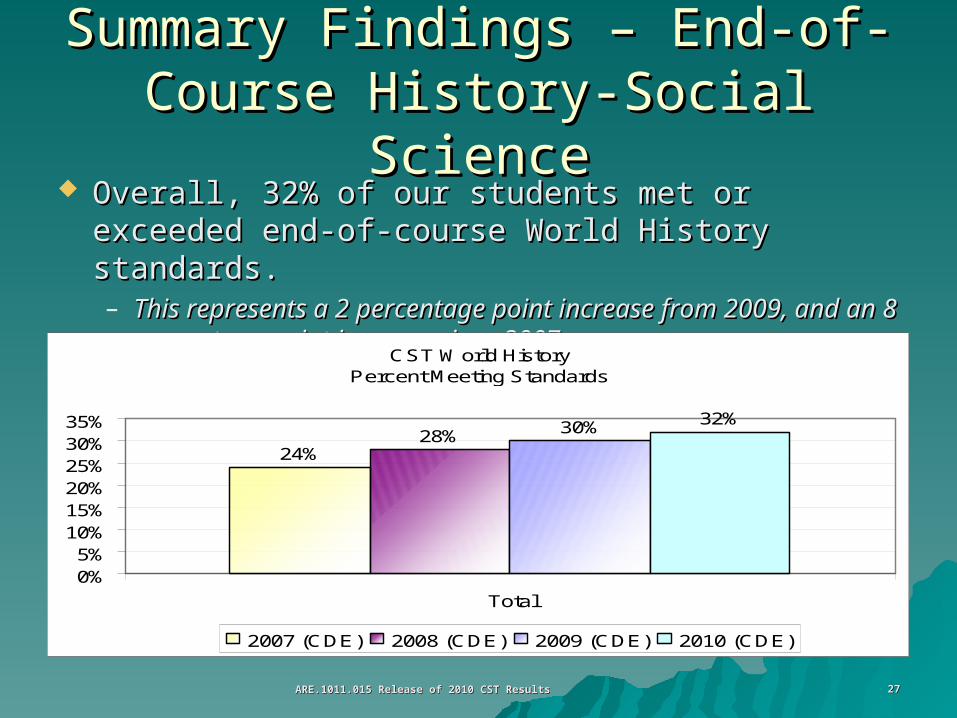
Summary Findings – End-of-Summary Findings – End-of-Course History-Social ScienceCourse History-Social Science
Overall, 32% of our students met or exceeded Overall, 32% of our students met or exceeded end-of-course World History standards.end-of-course World History standards.– This represents a 2 percentage point increase from 2009, This represents a 2 percentage point increase from 2009,
and an 8 percentage point increase since 2007.and an 8 percentage point increase since 2007.
CST World History Percent Meeting Standards
24%28% 30% 32%
0%5%
10%15%20%25%30%35%
Total
2007 (CDE) 2008 (CDE) 2009 (CDE) 2010 (CDE)
ARE.1011.015 Release of 2010 CST ResultsARE.1011.015 Release of 2010 CST Results 2828
Accountability TimelineAccountability Timeline August 18, CST Results releasedAugust 18, CST Results released
August 25, Pre-release of Accountability August 25, Pre-release of Accountability Progress Report (APR):Progress Report (APR):– Adequate Yearly Progress (AYP) Adequate Yearly Progress (AYP) – Academic Performance Index (API)Academic Performance Index (API)
August 31, Public release of APRAugust 31, Public release of APR
September 21, APR Update Report September 21, APR Update Report presented to the LUSD Board of Educationpresented to the LUSD Board of Education