Embed Size (px)
Citation preview

conducted by:
THE OFFICE OF THE sTaTE sErvICE COmmIssIOnEr
Office of the State Service Commissioner
Level 2/144 Macquarie Street
GPO Box 621, Hobart 7001
Tasmania, Australia
Web: www.ossc.tas.gov.au
Phone: 03 6232 7007
Fax: 03 6233 2693
Email: [email protected]
sUrvEY rEPOrT
tASMAnIAn StAte SeRVIceEmPLOYEE sUrvEY
2010

Report Produced By:
The Office of the State Service Commissioner
Published November 2010
Copyright – Office of the State Service Commissioner
Contributing Authors:
Nick Vrisakis, Charlie Zhang, Dr Peter Langford
Voice Project
Print: ISSN 1833-0703
Permission to copy is granted provided the source is acknowledged
Contact: Office of the State Service Commissioner
Level 2/144-148 Macquarie Street
GPO Box 621, Hobart, 7001
Tasmania, Australia
Telephone: 03 6233 3637
Email: [email protected]
Facsimile: 03 6233 2693
Contents
Commissioner’s Foreword 2 Acknowledgements 3
1.0 Executive Summary 3 1.1 Background 3 1.2 Key positive findings 4 1.3 Key opportunities for improvement 4 1.4 Other Findings 6 1.5 Next steps 6
2.0 Background 7 2.1 State Service Act 2000 7 2.2 Survey methodology 7 2.3 Scoring of responses 8 2.4 Response rates 8 2.5 Sample profile 8
3.0 Overall Results 20 3.1 Awareness of Principles and Code of Conduct 20 3.2 Category scores for 14 Principles 20
4.0 Apolitical, Impartial & Ethical 22
5.0 Accountable For Actions & Performance 23
6.0 Community Service & Fairness 24
7.0 Managing Performance 25
8.0 Employment Based On Merit 27
9.0 Application For Employment Open To All 29
10.0 Equity In Employment 30
11.0 Discrimination Free & Diversity Recognised 31
12.0 Quality Leadership 35
13.0 Employee Consultation & Input Encouraged 36
14.0 Safe Workplace 38
15.0 Flexible Workplace 39
16.0 Rewarding Workplace 40
17.0 Fair Internal Grievance Resolution System 43
18.0 Additional Results 46 18.1 Part 2 of the survey 46 18.2 Top 10 and bottom 10 items compared to the 2007 survey 47 18.3 Gap analysis 48
Appendix 1 – State Service Employee Survey 50
tAsMAnIA stAte servICe EMPLOYEE SURVEY REPORt 2010
1

The State Service Act 2000 (the Act) came into effect on 1 May 2001, giving Agencies more flexibility in organising work practices as well as encouraging modern management practices in the workplace (“Agencies” includes Agencies and State Authorities as defined under Schedule 1, Part 1 and Part 2 of the Act). Principles and a Code of Conduct have been incorporated into the Act.
The State Service Principles are designed to ensure we are effectively managing workplaces, are providing opportunities for employees based on equity and fairness, and are delivering a high standard of services to the Government and community. The Code of Conduct provisions reinforce and uphold the Principles by establishing standards of behaviour and conduct that applies to all employees, including Officers and Heads of Agencies.
An important part of the State Service Commissioner’s statutory function is upholding, promoting and ensuring adherence to these Principles and the Code of Conduct within the State Service. The State Service Principles are the cornerstone of the Act. The Principles provide a statement as to both the way that employment is managed in the State Service, and the standards expected of those who work within it. All employees are required to comply with and uphold the Principles, and Heads of Agencies are also required to promote the Principles.
The employee survey has been designed to give all Tasmanian State Service employees the opportunity to express their views about whether work culture and practices within their workplace reflect the requirements of the State Service Principles. The conduct of this survey forms part of my evaluation program and assists in meeting my statutory obligation, as Commissioner, in evaluating Agency practices, procedures, standards and systems in relation to management of, and employment in, the State Service.
The results of the Tasmanian State Service Employee Survey 2010 continue to be a valuable means of assessing the performance of the State Service as a whole alongside the Principles. The results, where possible, have been measured against any changes in employee perspectives that have occurred between conducting the 2007 and 2010 employee surveys.
It is pleasing to note in this report that there continues to be greater awareness amongst employees of the State Service Principles and the Code of Conduct. The overall evaluation that the Principles are being upheld within the State Service has also increased (by 3%) since the results of the employee survey in 2007. Managing Performance and Flexible Workplace were two of the Principles that showed the greatest improvement since the 2007 employee survey (each achieving improvement of 3%). There was also a considerable increase in the participation rate in formal
performance management discussions with mangers/supervisors (a 14% improvement). Nevertheless, there is still considerable room for improvement in both these areas. To a lesser extent an improvement was also seen in the Fair Internal Grievance Resolution Systems and Equity in Employment Principles (each achieving improvement of 2%). However, there remains a number of other areas identified in the report that need to be addressed. Together with information provided through the annual Tasmanian State Service Agency Survey, this information provides me with a more complete understanding of the actual workplace culture within the State Service.
Agencies have initiated the development and review of a considerable number of policies, procedures, standards and systems in recent years. Employee views obtained through this survey could assist Agencies to determine how well these have been communicated to employees and offer an insight into their effectiveness. It continues to be my view that regular evaluation of management practices within government Agencies is a standard part of good modern management practices within any organisation.
Employee surveys of this nature will continue to provide a mechanism by which Agencies progress against these policies and procedures, and employee perceptions of their effectiveness within the State Service can be measured. However, it must continue to be emphasised that the results obtained through this and earlier surveys are the perceptions of employees and not findings of fact. They may or may not be factual. Further research and analysis would need to be undertaken to validate the issues identified in the employee survey.
Iain Frawley ACTING STATE SERVICE COMMISSIONER
CoMMIssIoner’s Foreword
taSManian StatE SERVicE
2
I would like to acknowledge the assistance provided by Nick Vrisakis B Psych, BA, Senior Consultant, Charlie Zhang, MOrg Psych, BBA/BA-Psych Hons, Consultant, and Dr Peter Langford, PhD, MBA, M Clin Psych, B Sc Psych Hons, Director at Voice Project, located at Macquarie University, NSW. They assisted in the Tasmanian State Service Employee Survey 2010, as well as conducting the independent analysis of the data obtained through the Survey and the specific findings outlined in this report. Their technical expertise and input was much appreciated.
I would also like to acknowledge the support and assistance provided by all Agencies and the unions in promoting and encouraging employees to pass on their views by completing the survey.
Finally I would like to acknowledge the work undertaken by the OSSC team and in particular Ian Wilcox who managed this project.
1.1 Background
The 2010 Tasmanian State Service Employee Survey was primarily conducted to measure employees’ confidence in the application of the State Service Principles and the Code of Conduct. The survey also provided an opportunity to collect information about the work experiences and demographic characteristics of the State Service workforce. The results from the survey build on the results from the previous State Service Employee Surveys of 2007 and 2005.
A total of 7,468 employees across 15 Agencies completed either a web-based or paper-based survey, giving a sound overall response rate of 24%. The profile of the survey sample reasonably matched the profile of the State Service workforce, and hence confidence can be placed in results presented in this report as being representative of the overall workforce. Alternative analyses were conducted that weighted under- and over-represented groups to match the workforce profile, however doing so produced almost no change in the overall whole-of-Service results (maximum variation in results was 1%) and hence the unweighted results are presented in this report. Based on the sample size, the estimated margin of error for the results presented here is a very accurate ±0.9%.
This report provides an overview of results relevant to the entire Tasmanian State Service. In discussing some of the results in this report an effort has been made to compare the results from the State Service Employee Survey 2010 with results from the previous State Service Employee Survey in 2007. The 2010 survey contained mostly the same content as the 2007 survey allowing a direct comparison across most items. Therefore it was again possible to see where changes had occurred in the results from the previous survey. The survey also contained items enabling benchmarking against similar public sector surveys in South Australia, Western Australia, Victoria, the Northern Territory and the Australian Public Service. Also, broad comparisons were made with results against benchmarking data from Voice Project based at Macquarie University, the team of researchers and consultants who contributed to the production of this report and who have conducted employee surveys throughout a wide range of other public and private sector organisations.
ACknowledgeMents 1.0 exeCutIve suMMAry
tAsMAnIA stAte servICe EMPLOYEE SURVEY REPORt 2010
3
1.2 Key positive findings
Many strengths of the State Service were identified including the following:
• Thehighestscoringstatementsinthesurveywerethoseassociated with Community Service & Fairness. Specifically, there was strong agreement amongst employees that confidentiality of information is taken seriously, that employees do not abuse their position of authority when dealing with customers and clients, and that employees are committed to providing excellent customer service.
• StatementsrelatingtoApplicationforEmploymentOpen To All were also scored very highly by employees. There was strong agreement that most job vacancies are advertised publicly and that people outside the State Service have the opportunity to apply for jobs within the State Service.
• EquityInEmploymentwasanotherareathatreceivedstrongsupport from employees. A very clear majority of employees felt that cultural background, gender, sexual orientation and age are not barriers to success in their workplaces.
• EmployeesreportedahighlevelofawarenessoftheStateService Principles and the Code of Conduct. There was also good awareness amongst employees of a formal procedure for grievance resolution.
• Therewasstrongendorsementfromemployeesforthelevel of commitment to safety within the State Service, and a high level of agreement that employees display good occupational health and safety awareness. Employees also felt that their managers and supervisors encourage employees to report health and safety risks and take action to ensure employees’ health and safety in the workplace.
• Therewasalsoextensiveagreementthatemployeesareexpected to treat each other respectfully. Additionally, most employees believed their workplaces are free of sexual harassment.
• Finally,employeesreportedastrongunderstandingofwhattheir workplace needs to achieve.
These results are similar to the findings from the 2007 survey, and are quite normal for a workforce of this size. Marked differences are more likely to emerge for individual agencies, departments and workplaces rather than across the entire State Service. A comparison was made between the 2007 and 2010 surveys to determine where there had been increases or decreases from the 2007 survey. However, comparison for all items and Principles was not possible as the 2010 survey included some items that were not included in the 2007 survey. In accordance with best practice for employee surveys, direct comparisons are only made where the item or category content
is identical. Generally, scores had increased compared to the 2007 survey.
The main improvements compared to the 2007 survey were:
• Employeesindicatedagreaterawarenessoftheformalprocess for performance management. Indeed this was supported by a significant increase in the percentage of employees who reported having been involved in a formal performance management discussion.
• Therewasgreatersatisfactionwiththeamountofperformance feedback from manager/supervisors.
• Therewasanincreaseinthepercentageofemployeeswhoreported an awareness of State Service Principles and the State Service Code of Conduct.
• Therewasstrongeragreementamongstemployeesthatworking part-time or using other flexible work options is not a barrier to workplace success. There was also greater agreement regarding the provision of part-time work opportunities for those who want to and that managers/supervisors take into account the differing needs of employees.
• Employeesshowedmoreconfidenceinmanagerscommitment to managing the performance of employees and in their skills to resolve workplace grievances.
• Employeesalsoindicatedagreaterawarenessofformalprocesses or procedures for resolving grievances and disputes in their workplace.
• Therewasstrongerbeliefthathavingadisabilityisnotabarrier to workplace success.
• Feweremployeesreportedhavingbeenbulliedand/orharassed compared to the 2007 survey.
1.3 Key opportunities for improvement
Overall, as was the case for the 2007 survey, the results in this report are similar to, and in some areas better than, results from large-scale surveys of other public and private sector organisations. Whilst the results have generally improved compared to the 2007 survey, there are opportunities for improvement in the following areas:
• Aswasfoundinthe2007survey,justunderhalfoftheworkforce showed uncertainty or disagreement regarding employment decisions being based on merit. More specifically results indicate concerns from employees regarding the fairness of recruitment and promotion decisions. There was a significant proportion of employees who felt that those who serve on selection panels may not have the appropriate skills. Similarly, there was reservation
taSManian StatE SERVicE
4

over whether people with the right knowledge, skills and abilities are chosen for vacant positions. As has been raised in previous reports, employee surveys such as the State Service Employee Survey will never demonstrate universal support for recruitment and promotion processes because of the limited number of promotion opportunities within organisations and the different experience employees have of the selection process. Whilst scores in this area have improved compared to the 2007 survey there would still appear to be some room for improvement on these issues. Compared to the 2007 survey, there has been an increase in the percentage of respondents participating on a selection panel; there has also been a slight increase in confidence in recruitment and selection processes. This may be attributable to increased involvement by employees in the selection process, although the size of the increase suggests this could only become clearer in future surveys.
• Asmentionedabove,therehasbeenanincreaseinawareness of, and confidence in formal grievance handling procedures, as well as improved confidence in managers/supervisors ability to deal with grievances. However, still only approximately half of the workforce has confidence in the processes and in the way their manager would handle the matter. Also, it is still the case that only a minority of employees felt that they would not suffer any negative consequences if they did lodge a grievance.
• Inasimilarresulttothe2007survey,ofalltheissuesmeasured in the survey, employees showed the least confidence regarding how managers handle employees who are performing poorly. Similarly, approximately less than half of employees agreed that good performance was sufficiently recognised (although this has increased compared to the previous survey). It is interesting to note that there has been a noticeable increase in the percentage of employees who are satisfied with the amount of feedback given. Once again, matching results from the 2007 survey, the 2010 survey found that those employees who have had a sit-down performance management discussion with their manager or supervisor reported noticeably greater overall confidence in the way performance is managed. Whilst this may have had some bearing on the increase in those employees who feel good performance is recognised, the size of the increase did not match that for satisfaction with amount of feedback given. This suggests there may be other factors contributing to satisfaction with recognition of good performance.
• Themajorityofemployeesagainshowedsupportfor the quality of leadership within their workplace. The percentage of employees who felt that leadership was of a high standard was slightly more than in the 2007
survey. Nonetheless, a significant minority of employees expressed a lack of support regarding the quality of leadership and a majority lacked confidence in the way change is managed (indeed more than in the previous survey). As has been highlighted previously, leadership is commonly a poorly performing section of many employee surveys, partly because employees often have insufficient knowledge of their senior leaders to have strong confidence in their abilities. Another possible reason identified in the current survey for this lack of confidence might be perceptions of communication between senior managers and employees. This was a new item for the 2010 survey and indicated that less than half of all employees feel that senior managers communicate effectively with employees. Lack of opportunities for leadership training reported by some employees could be another contributing factor to perceptions of leadership quality.
• Withregardstostress,comparedtothe2007results,therehas been no change in the percentage of employees who are satisfied with their stress level. That is, approximately only half are satisfied with their current stress level. In relation to workload, there has been a slight improvement in the percentage of employees who feel their workload is about right. Overall whilst the data suggests there may have been a slight improvement regarding stress and workload issues there are still significant numbers of employees who are feeling uncomfortable with their workload and stress level.
• Mostemployeesreportedtheirworkplacesasbeingfreeof bullying or harassment. Indeed, reports of experiencing bullying or harassment have decreased since the 2005 survey. Nevertheless, a significant minority of employees still do not perceive their workplace as being free of bullying and/or harassment, and whilst the percentage of employees reporting having been bullied and/or harassed has decreased, their satisfaction with how the matter was handled is lower compared to 2007. As was shown in 2007, there is a significant correlation between personal experience of bullying or harassment and overall satisfaction levels. In the 2007 survey, a far more detailed set of questions was again included to improve understanding of the source and nature of bullying and harassment, which were replicated in the 2010 survey. Bullying and harassment are perceived to be equally enacted by fellow employees as well as managers and supervisors and to a noticeably lesser extent by clients. Clients were a lesser source of bullying and harassment in the 2010 survey compared to 2007. The most common forms of bullying and harassment are intimidating and aggressive body language, persistent or unjustified criticism, sarcasm and humiliation, shouting and offensive
tAsMAnIA stAte servICe EMPLOYEE SURVEY REPORt 2010
5
verbal behaviour, withholding information, being isolated and ostracised, inequitable treatment, gossip and rumours being spread, and verbal threats.
• Finally,agapanalysiswasconductedtoexplorethe potential priorities arising from the survey. The issues identified by this analysis as being key areas for improvement were increasing confidence in the grievance resolution system, improving employee consultation and input, improving the way performance is managed, ensuring employment is merit based, improving the feeling of reward and recognition in the workplace, and improving confidence in leadership. These issues were also highlighted in the 2007 report, and whilst there has been improvement in some of these areas, the results provide confirmation that they are still prime opportunities for improvement.
The main decreases compared to the 2007 survey were:
• Feweremployeesagreedthatmostjobvacanciesareadvertised publicly and that people outside the State Service have a reasonable opportunity to apply for jobs.
• Therewaslessagreementamongstemployeesthatmanagers encourage employees to report health and safety incidents and that employees display good occupational health & safety awareness.
• Asmallerpercentageofemployeesfeltthatchangewasmanaged well.
• Feweremployeesagreedthatcustomerfeedbackisusedtoimprove services and that their workplace strives to meet customer service needs.
• Aslightlysmallerpercentageofemployeesfeltthattheirworkplace was free of bullying and/or harassment.
• Therewasmarginallylessagreementregardingemployeestaking responsibility for their decisions and actions.
1.4 Other Findings
Some additional analyses was requested for the 2010 employee survey. These related to the perception about access to flexible work options against perceptions about how well any/all of the Principles are upheld and whether educational background affects employees’ perceptions about whether academic qualifications are valued in the workplace.
A correlation analysis indicated that perceptions about flexible work options, as assessed by the overall score for the Principle Flexible Workplace, was more closely related to scores for some of the Principles than for the overall evaluation that the Principles are upheld. The Principles that had most impact on the Flexible Workplace score were Safe Workplace, Employee Consultation & Input Encourage and Rewarding Workplace. This suggests that perceptions about flexible workplace options may impact on areas such as perceived stress levels, comfort with workload and employee input. This may be the subject of further analysis for the next employee survey.
An assessment of the relationship between educational background and perceived value of academic qualifications was not conclusive; however, there did appear to be a trend for academic achievements and qualifications to be valued more by those with lower levels of education. Again this might prove a more fruitful area of investigation for future surveys.
1.5 Next steps
One of the highest priorities immediately following any employee survey is the distribution of results to managers, employees and other critical stakeholders. Senior managers need to understand the results for the entire State Service as well as for their own agency. Most employees will not want to know the detailed results of the survey but they will want to know the key findings and the actions that will be taken to address at least some of the identified areas for improvement.
A substantial challenge following any large-scale employee survey is planning actions to be taken across the entire State Service as well as actions specific to individual agencies. Following communication of results to senior executives within each agency, these same senior executives need to consider what and local interventions need to be addressed and their priorities. Action plans need to be developed and monitored, with senior executives taking control of fulfilling the plans and reporting progress towards achieving these goals.
taSManian StatE SERVicE
6
2.1 State Service Act 2000
The State Services Act 2000 (the Act) was enacted in December 2000 and commenced on 1 May 2001, following a review of the Tasmanian State Service Act 1984. The intention of the State Service Act 2000 is to provide a professional State Service that is equitable, flexible, forward looking and accountable, while providing the best possible services to the Government and the community.
The Act, which is supplemented and supported by State Service Regulations 2001, Ministerial Directions, Commissioner’s Directions and Agency-based Standing Orders, includes a number of innovative features.
Key amongst these is that all employment decisions in the State Service are to be based on merit. There is a revised definition of merit that provides the increased flexibility needed to address past concerns about merit, workplace diversity, succession planning and employment-related decision-making.
In addition, the Act introduced a set of State Service Principles that provides overarching statements concerning the values of the State Service, the nature of its operations and what is expected of those within it. Many of these Principles had been implicit in the expectations of managers and employees in the past but now they have been specified in legislation in a way that clearly indicates to members of the community what they can expect from their State Service.
Accountability, leadership, ethical behaviour, merit, workplace diversity, fairness and flexibility have all been included in these Principles. The State Service Commissioner, Heads of Agencies, holders of prescribed offices, senior executives and employees are all required to uphold them.
Another significant innovation in the Act is a Code of Conduct. This Code compliments the State Service Principles and clearly sets out the standards of behaviour that are expected from Heads of Agencies, holders of prescribed offices, senior executives and employees. This Code reverses the previous provisions where issues of conduct were expressed negatively in terms of discipline and offences and enables agencies to develop specific conduct provisions appropriate to their operational requirements.
The Act has also established revised procedures for the investigation and determination of alleged breaches of the Code of Conduct. These provisions aim to ensure procedural fairness in the determination of any alleged breach and where a breach has occurred, provided a range of sanctions from counselling to termination of employment.
2.0 BACkground
2.2 Survey methodology
The survey was developed specifically to meet the needs of the Tasmanian State Service and in particular to assess the performance of the State Service against the State Service Principles and Code of Conduct within the State Service Act 2000.
The initial survey content was developed and refined in 2005 by the Office of the State Service Commissioner. The 2007 survey was based primarily on the 2005 survey, with some amendments made based on the review of the 2005 survey and in consultation with stakeholders and between Voice Project and the Office of the State Service Commissioner. The content of the 2010 is once again largely based on the 2007 survey, with minor amendments.
The survey comprised three parts and can be viewed in its entirety in Appendix 1. Part 1 explored employees’ awareness of the State Service Principles and Code of Conduct, and assessed employees’ level of agreement (on a five-point Strongly Agree to Strongly Disagree rating scale) with 74 statements associated with the State Service Principles.
Part 2 of the survey involved 13 Yes-No statements on which employees reported their experiences with events including job applications, selection processes, performance management, bullying and/or harassment, grievance processes, and recreational leave. Some of these Yes-No statements had branching questions if employees answered Yes to an initial question.
Part 3 of the survey requested background information about employees, including information about gender, age, place of birth, first language, identification as being Aboriginal or Torres Strait Islander, having a disability and whether the disability required a work-related adjustment, length of service for the Service and their Agency, employment status, management status, salary, education, caring responsibilities, retirement intentions, and region of work within Tasmania.
Employees’ answers to Parts 2 and 3 of the survey were used to analyse differences in confidence in the Principles across groups with different working experiences and backgrounds.
tAsMAnIA stAte servICe EMPLOYEE SURVEY REPORt 2010
7
2.3 Scoring of responses
The primary score that is used to report employees’ confidence in the application of the Principles is the percentage of employees who agreed or strongly agreed with the statements regarding the Principles. For example, the score for the statement “My workplace is committed to employee health and safety” is 80%, indicating that 80% of employees answered Agree or Strongly Agree with this particular statement. It should be noted that this result does not mean that 20% of employees disagreed – for this particular statement, 12% of employees answered “Neither Agree Or Disagree” (the middle of the five response options) and only 8% of employees answered Disagree or Strongly Disagree. Employees who did not answer a question or responded “Don’t know” are not included in calculations of “% Agree & Strongly Agree” or “% Yes”.
The 77 Agree-Disagree statements in Part 1 of the survey were sorted into 14 categories, with each category representing a Principle within the State Service Act 2000. The 14 Principles can be seen in the survey, a copy of which is on the attached CD. Scores for these Principles were calculated by averaging the scores for all statements within the category. For example, statements 1.3, 1.4, 1.5 and 1.6 were all grouped into a Principle called “Apolitical, Impartial & Ethical”; a score for this Principle was calculated by averaging the scores for the four statements within the category. The bulk of this report is structured around these 14 Principles, with each Principle having its own section within this report. Within each section the results are shown for the overall category (highlighted in blue) and for individual statements.
2.4 Response rates
The overall response rate across the whole State Service was 24%, with 7,468 responses received from the 30,965 employees who were given the opportunity to complete the survey. Surveys were forwarded to employees in each agency who had a current employment contract as at the date of the survey being conducted. This group included those employees who may have had a current employment contract but may not have been at work at the time of the survey. From a statistical point of view, and given the very large and diverse workforce that was being targeted, 24% can be regarded as a sound response rate. The response rate was slightly higher for the web-based survey (26%) than it was for the paper-based survey (21%). While this was lower than the response rate for the 2007 survey (30%), it still affords a high degree of confidence in the data and results.
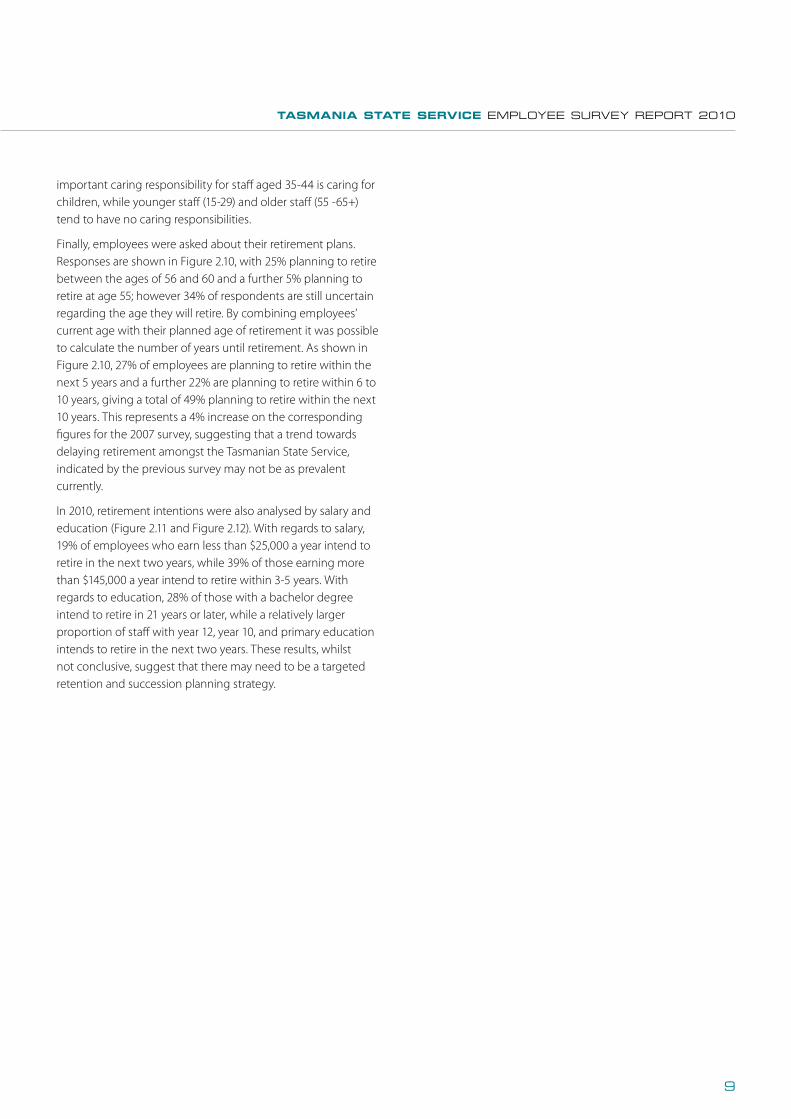
The response rates for individual Agencies are shown in Figure 2.1. Although not universally the case, response rates tended to be higher for the smaller Agencies and lower for the larger Agencies, which is a typical finding for employee surveys
given that larger workforces are harder to communicate with and motivate to complete the survey. Tasmanian Audit Office and The Department of Treasury and Finance produced the highest response rates of 89% and 58% respectively, while the lowest response rates were reported by the Department of Education and the Department of Health & Human Services with response rates of 17% and 22% respectively.
As is shown in the following section, the demographic profile of the employees who completed the survey closely matches the demographic profile of the overall workforce. Given the sound response rate and the representativeness of the survey sample, the results can be confidently assumed to accurately represent the entire State Service. Given this assumption, the response rate of 24% for the overall Service provides a very small margin of error of ±0.9%; that is, the true scores for the whole Service can be confidently assumed to be within a range of 0.9% lower and 0.9% higher than the scores presented in this report.
2.5 Sample profile
Figures 2.2, 2.3 and 2.4 compare the characteristics of the overall State Service workforce with the survey sample. To a very large extent the workforce profile closely matches the sample profile. Nevertheless, there are some differences. The survey sample is slightly under-represented by the Department of Education and slightly over-represented by the Department of Primary Industries, Parks, Water and the Environment (see Figure 2.2). Employees with less than 1 year tenure and 1 year in Agency (Figure 2.3) are slightly under-represented, employees with more than 20 years service are slightly over-represented. Employees in the salary range $35,000 - $45,999 are also slightly under-represented (Figure 2.4). Part-time employees (Figure 2.3) and fixed term employees are also slightly under-represented.
Figure 2.5 shows further details of the survey sample. As shown in Figure 2.5, 14% of the survey sample were born overseas, 4% do not have English as their first language, 2% have an Aboriginal or Torres Strait Islander background, 7% have a disability, 25% are managers or supervisors, 52% have a degree and a further 27% have a TAFE qualification. Figure 2.9 indicates that of those who have a disability approximately half require a work related adjustment.
In addition, Figure 2.5 indicates that 33% care for a child and 49% have no caring responsibilities. Figure 2.6 shows that 54% of males who responded to the survey have no caring responsibilities, while only 47% of females have no caring responsibilities. Similar proportions of males and females report caring responsibilities for children. Figure 2.7 shows that 55% of full-time employees report no caring responsibilities, while only 36% of part-time staff report no caring responsibilities. A greater proportion of part-time staff also report having caring responsibilities for children. Figure 2.8 reports that the most
taSManian StatE SERVicE
8
important caring responsibility for staff aged 35-44 is caring for children, while younger staff (15-29) and older staff (55 -65+) tend to have no caring responsibilities.
Finally, employees were asked about their retirement plans. Responses are shown in Figure 2.10, with 25% planning to retire between the ages of 56 and 60 and a further 5% planning to retire at age 55; however 34% of respondents are still uncertain regarding the age they will retire. By combining employees’ current age with their planned age of retirement it was possible to calculate the number of years until retirement. As shown in Figure 2.10, 27% of employees are planning to retire within the next 5 years and a further 22% are planning to retire within 6 to 10 years, giving a total of 49% planning to retire within the next 10 years. This represents a 4% increase on the corresponding figures for the 2007 survey, suggesting that a trend towards delaying retirement amongst the Tasmanian State Service, indicated by the previous survey may not be as prevalent currently.
In 2010, retirement intentions were also analysed by salary and education (Figure 2.11 and Figure 2.12). With regards to salary, 19% of employees who earn less than $25,000 a year intend to retire in the next two years, while 39% of those earning more than $145,000 a year intend to retire within 3-5 years. With regards to education, 28% of those with a bachelor degree intend to retire in 21 years or later, while a relatively larger proportion of staff with year 12, year 10, and primary education intends to retire in the next two years. These results, whilst not conclusive, suggest that there may need to be a targeted retention and succession planning strategy.
tAsMAnIA stAte servICe EMPLOYEE SURVEY REPORt 2010
9
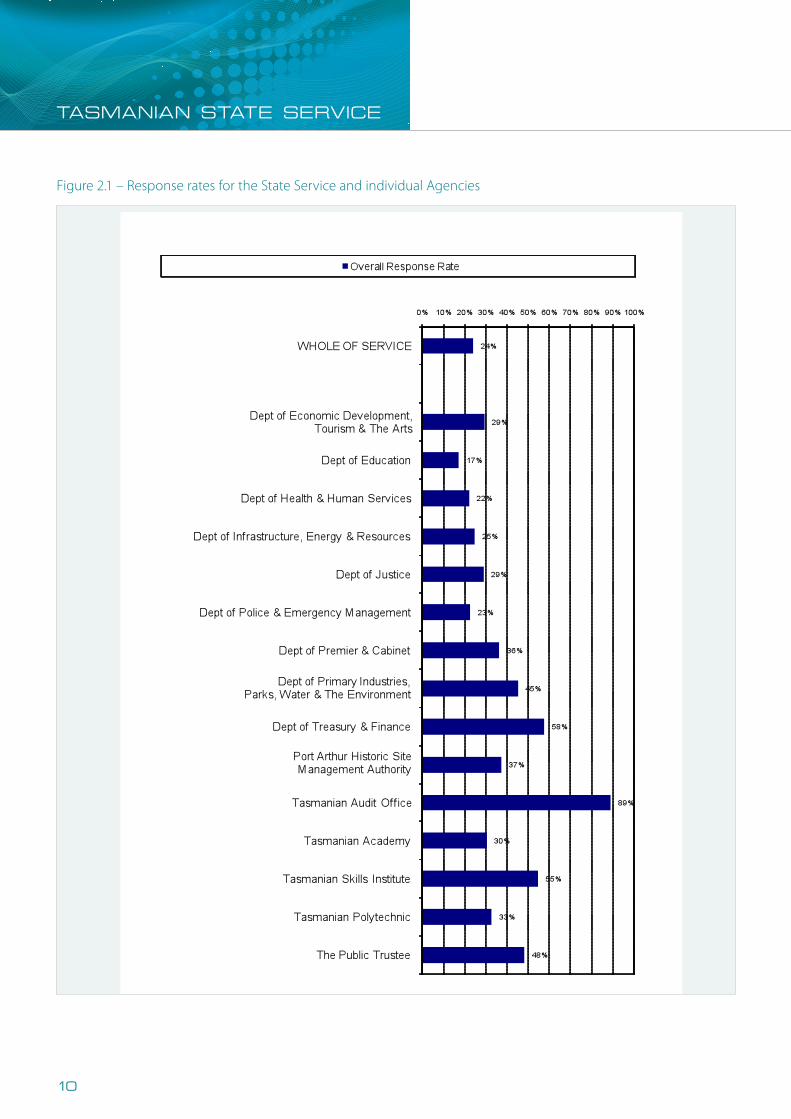
Figure 2.1 – Response rates for the State Service and individual Agencies
Tasmanian State Service Employee Survey Report 2007 1
Figure 2.1 – Response rates for the State Service and individual Agencies
taSManian StatE SERVicE
10
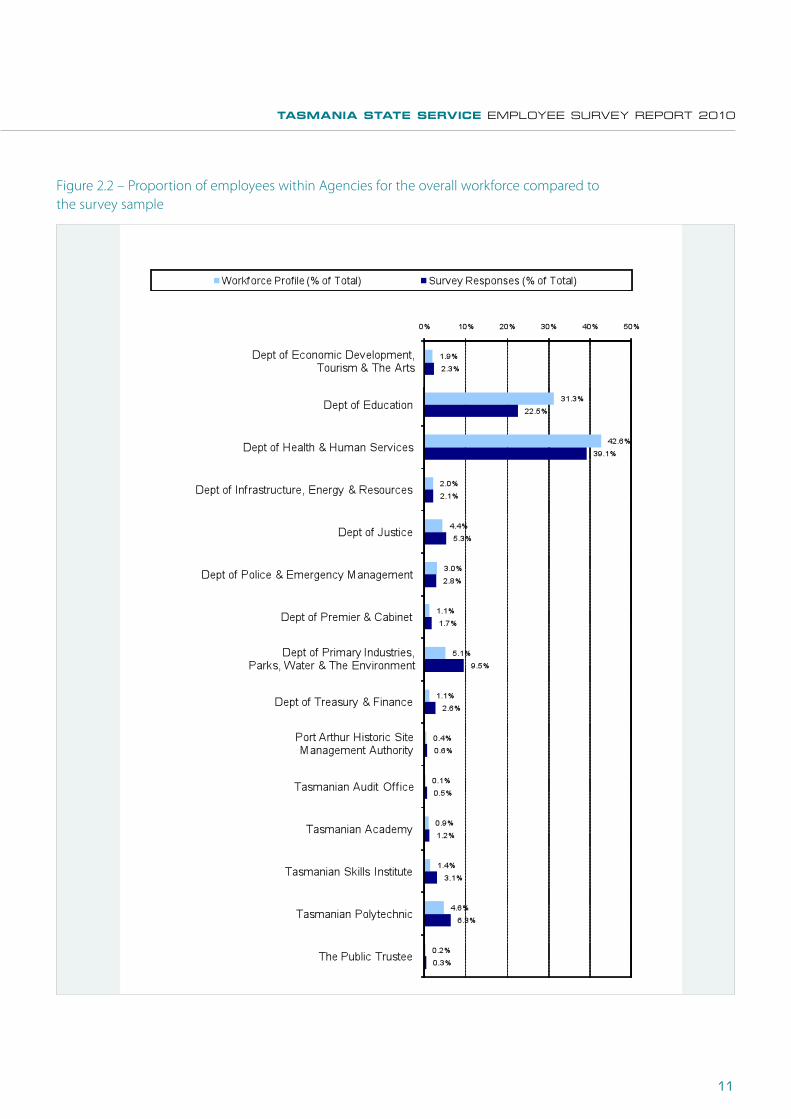
Figure 2.2 – Proportion of employees within Agencies for the overall workforce compared to the survey sample
Tasmanian State Service Employee Survey Report 2010 2
Figure 2.2 – Proportion of employees within Agencies for the overall workforce compared to the survey sample
tAsMAnIA stAte servICe EMPLOYEE SURVEY REPORt 2010
11
Figure 2.3 – Comparison of the workforce profile against the survey sample profile for gender, age, length of service, and full-time/part-time status
Tasmanian State Service Employee Survey Report 2010 16
Figure 2.3 – Comparison of the workforce profile against the survey sample profile for gender, age, length of service, and full-time/part-time status
31%
69%
0%
4%
8%
8%
11%
13%
16%
18%
13%
7%
2%
9%
31%
19%
12%
8%
21%
10%
36%
18%
12%
7%
16%
57%
43%
33%
67%
0%
2%
6%
7%
10%
13%
16%
20%
16%
8%
2%
6%
25%
19%
13%
10%
27%
9%
33%
19%
12%
8%
20%
68%
32%
0% 10% 20% 30% 40% 50% 60% 70% 80%
Male employees
Female employees
15-19
20-24
25-29
30-34
35-39
40-44
45-49
50-54
55-59
60-64
65+
Less than 1 year
1-5 years
6-10 years
11-15 years
16-20 years
More than 20 years
Less than 1 year
1-5 years
6-10 years
11-15 years
16-20 years
More than 20 years
Full-time employees
Part-time employees
Workforce Profile Survey Responses
Employment Status
Years in Agency
Years in Service
Age
Gender
taSManian StatE SERVicE
12

Figure 2.4 – Comparison of the workforce profile against the survey sample profile for employment category, salary, region, and survey method
Tasmanian State Service Employee Survey Report 2010 17
Figure 2.4 – Comparison of the workforce profile against the survey sample profile for employment category, salary, region, and survey method
1%
78%
21%
1%
9%
20%
19%
13%
11%
18%
5%
2%
1%
0%
0%
2%
0%
57%
26%
17%
0%
81%
19%
3%
87%
10%
4%
5%
12%
17%
13%
17%
17%
7%
4%
1%
1%
1%
0%
1%
60%
22%
17%
0%
88%
12%
0% 10% 20% 30% 40% 50% 60% 70% 80% 90%
Senior Executive
Permanent
Fixed-term
less than $25,000
$25,000 – 34,999
$35,000 – 44,999
$45,000 – 54,999
$55,000 – 64,999
$65,000 – 74,999
$75,000 – 84,999
$85,000 – 94,999
$95,000 – 104,999
$105,000 – 114,999
$115,000 – 124,999
$125,000 – 134,999
$135,000 – 144,999
$145,000 or more
South (incl south-east)
North (incl north-east)
North West (incl west)
Outside Tasmania
Online surveys
Paper based Surveys
Workforce Profile Survey Responses
Employment Category
Survey Method
Salary
Region
tAsMAnIA stAte servICe EMPLOYEE SURVEY REPORt 2010
13
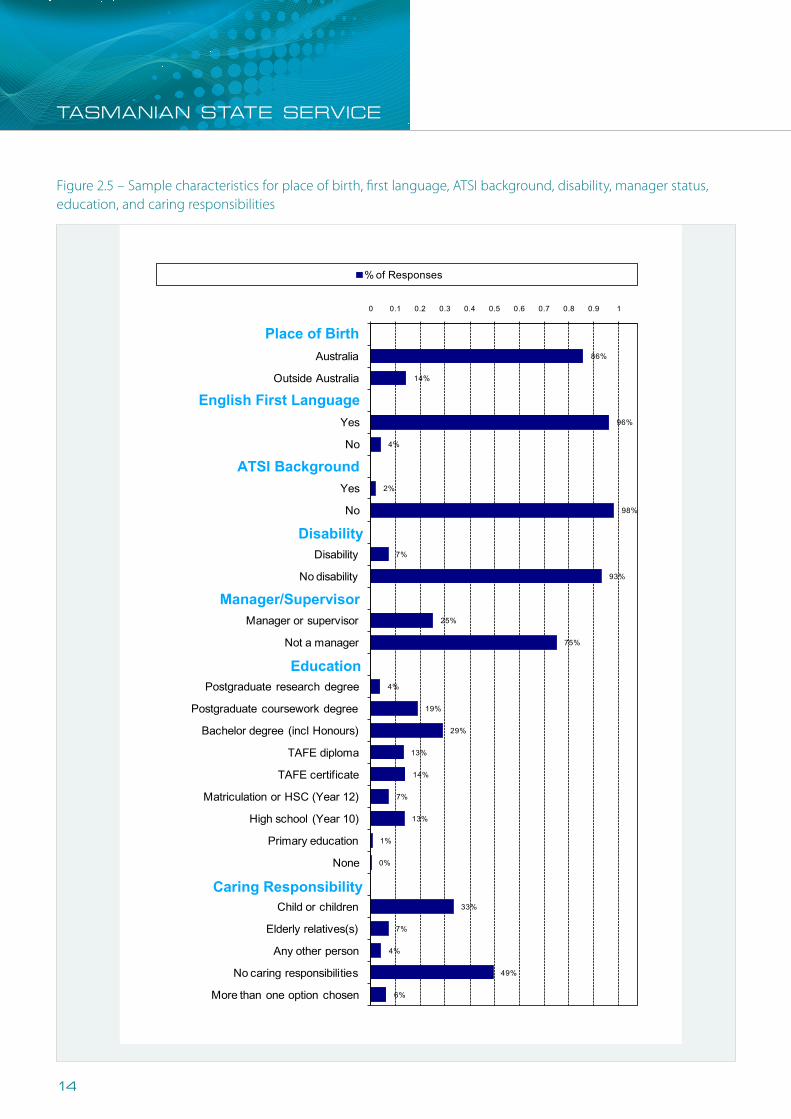
Figure 2.5 – Sample characteristics for place of birth, first language, ATSI background, disability, manager status, education, and caring responsibilities
Tasmanian State Service Employee Survey Report 2010 18
Figure 2.5 – Sample characteristics for place of birth, first language, ATSI background, disability, manager status, education, and caring responsibilities
86%
14%
96%
4%
2%
98%
7%
93%
25%
75%
4%
19%
29%
13%
14%
7%
13%
1%
0%
33%
7%
4%
49%
6%
0 0.1 0.2 0.3 0.4 0.5 0.6 0.7 0.8 0.9 1
Australia
Outside Australia
Yes
No
Yes
No
Disability
No disability
Manager or supervisor
Not a manager
Postgraduate research degree
Postgraduate coursework degree
Bachelor degree (incl Honours)
TAFE diploma
TAFE certificate
Matriculation or HSC (Year 12)
High school (Year 10)
Primary education
None
Child or children
Elderly relatives(s)
Any other person
No caring responsibilities
More than one option chosen
% of Responses
Place of Birth
English First Language
ATSI Background
Disability
Manager/Supervisor
Education
Caring Responsibility
taSManian StatE SERVicE
14
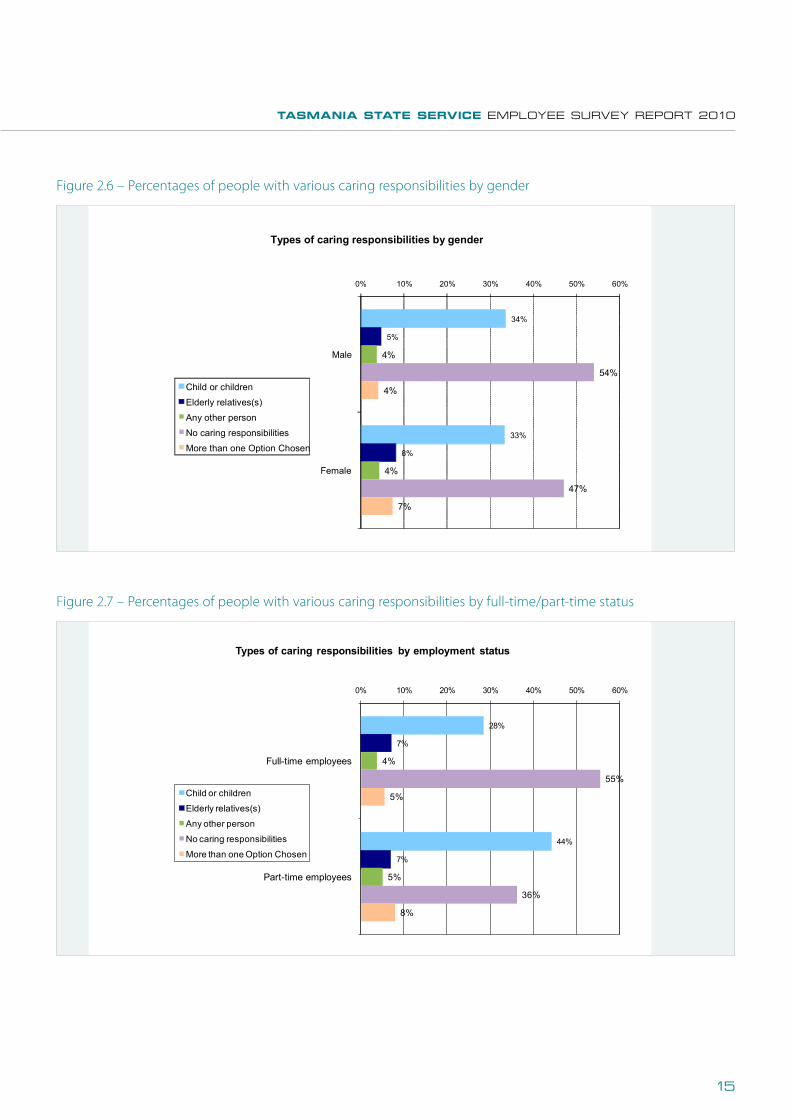
Figure 2.6 – Percentages of people with various caring responsibilities by gender
Figure 2.7 – Percentages of people with various caring responsibilities by full-time/part-time status
Tasmanian State Service Employee Survey Report 2010 19
Figure 2.6 – Percentages of people with various caring responsibilities by gender
34%
33%
5%
8%
4%
4%
54%
47%
4%
7%
0% 10% 20% 30% 40% 50% 60%
Male
Female
Types of caring responsibilities by gender
Child or children Elderly relatives(s) Any other person No caring responsibilities More than one Option Chosen
Tasmanian State Service Employee Survey Report 2010 20
Figure 2.7 – Percentages of people with various caring responsibilities by full-time/part-time status
28%
44%
7%
7%
4%
5%
55%
36%
5%
8%
0% 10% 20% 30% 40% 50% 60%
Full-time employees
Part-time employees
Types of caring responsibilities by employment status
Child or children
Elderly relatives(s)
Any other person
No caring responsibilities
More than one Option Chosen
tAsMAnIA stAte servICe EMPLOYEE SURVEY REPORt 2010
15
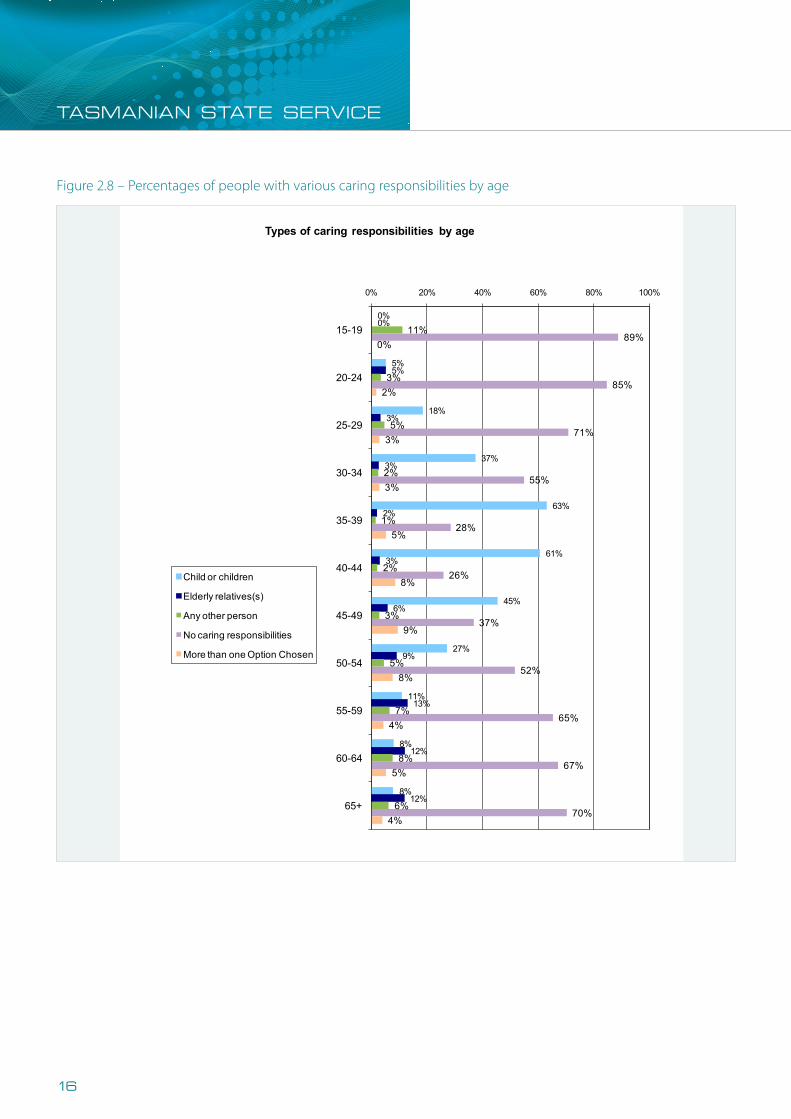
Figure 2.8 – Percentages of people with various caring responsibilities by age
Tasmanian State Service Employee Survey Report 2010 21
Figure 2.8 – Percentages of people with various caring responsibilities by age
0%
5%
18%
37%
63%
61%
45%
27%
11%
8%
8%
0%
5%
3%
3%
2%
3%
6%
9%
13%
12%
12%
11%
3%
5%
2%
1%
2%
3%
5%
7%
8%
6%
89%
85%
71%
55%
28%
26%
37%
52%
65%
67%
70%
0%
2%
3%
3%
5%
8%
9%
8%
4%
5%
4%
0% 20% 40% 60% 80% 100%
15-19
20-24
25-29
30-34
35-39
40-44
45-49
50-54
55-59
60-64
65+
Types of caring responsibilities by age
Child or children
Elderly relatives(s)
Any other person
No caring responsibilities
More than one Option Chosen
taSManian StatE SERVicE
16

Figure 2.9 – Percentages of people with disabilities requiring and not requiring workplace adjustments
Figure 2.10 – Retirement plans
Tasmanian State Service Employee Survey Report 2010 22
Figure 2.9 – Percentages of people with disabilities requiring and not requiring workplace adjustments
46%
54%
0% 10% 20% 30% 40% 50% 60%
Requiring work-related adjustment
Not requiring work-related adjustment
% People With A Disability
Figure 2.10 – Retirement plans
5%
13%
12%
13%
13%
10%
34%
10%
17%
22%
18%
13%
22%
0% 10% 20% 30% 40%
At 55
Between 56-59
At 60
Between 61-64
At 65
Beyond 65
Don't know
0-2 years
3-5 years
6-10 years
11-15 years
16-20 years
21+ years
% of Responses
Years Until Retirement
Retirement Age
tAsMAnIA stAte servICe EMPLOYEE SURVEY REPORt 2010
17
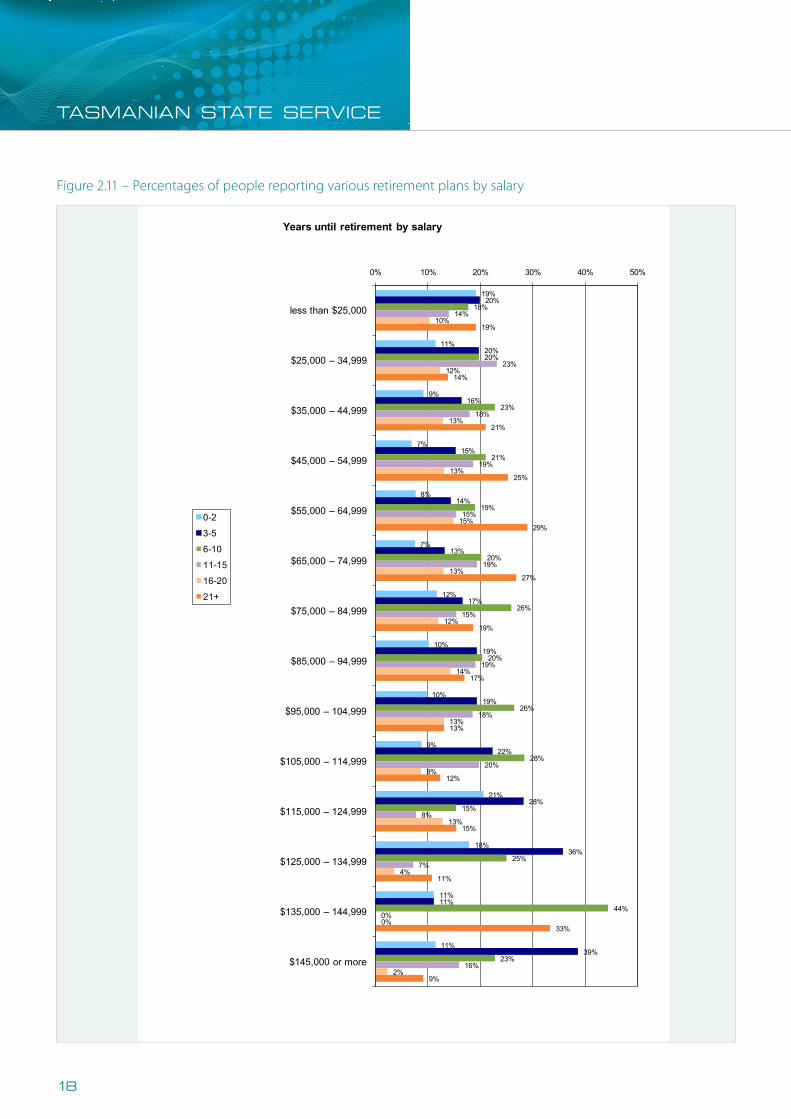
Figure 2.11 – Percentages of people reporting various retirement plans by salary
Tasmanian State Service Employee Survey Report 2010 23
Figure 2.11 – Percentages of people reporting various retirement plans by salary
19%
11%
9%
7%
8%
7%
12%
10%
10%
9%
21%
18%
11%
11%
20%
20%
16%
15%
14%
13%
17%
19%
19%
22%
28%
36%
11%
39%
18%
20%
23%
21%
19%
20%
26%
20%
26%
28%
15%
25%
44%
23%
14%
23%
18%
19%
15%
19%
15%
19%
18%
20%
8%
7%
0%
16%
10%
12%
13%
13%
15%
13%
12%
14%
13%
9%
13%
4%
0%
2%
19%
14%
21%
25%
29%
27%
19%
17%
13%
12%
15%
11%
33%
9%
0% 10% 20% 30% 40% 50%
less than $25,000
$25,000 – 34,999
$35,000 – 44,999
$45,000 – 54,999
$55,000 – 64,999
$65,000 – 74,999
$75,000 – 84,999
$85,000 – 94,999
$95,000 – 104,999
$105,000 – 114,999
$115,000 – 124,999
$125,000 – 134,999
$135,000 – 144,999
$145,000 or more
Years until retirement by salary
0-2
3-5
6-10
11-15
16-20
21+
taSManian StatE SERVicE
18
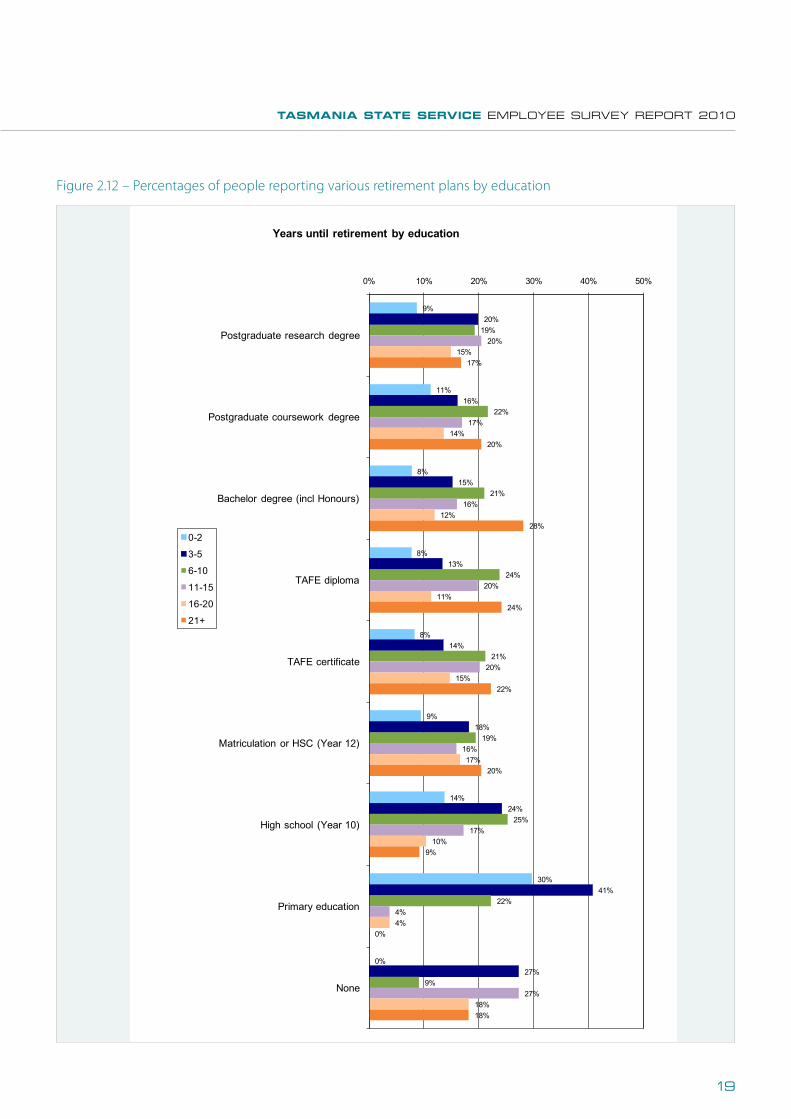
Figure 2.12 – Percentages of people reporting various retirement plans by education
Tasmanian State Service Employee Survey Report 2010 24
Figure 2.12 – Percentages of people reporting various retirement plans by education
9%
11%
8%
8%
8%
9%
14%
30%
0%
20%
16%
15%
13%
14%
18%
24%
41%
27%
19%
22%
21%
24%
21%
19%
25%
22%
9%
20%
17%
16%
20%
20%
16%
17%
4%
27%
15%
14%
12%
11%
15%
17%
10%
4%
18%
17%
20%
28%
24%
22%
20%
9%
0%
18%
0% 10% 20% 30% 40% 50%
Postgraduate research degree
Postgraduate coursework degree
Bachelor degree (incl Honours)
TAFE diploma
TAFE certificate
Matriculation or HSC (Year 12)
High school (Year 10)
Primary education
None
Years until retirement by education
0-2
3-5
6-10
11-15
16-20
21+
tAsMAnIA stAte servICe EMPLOYEE SURVEY REPORt 2010
19
3.0 overAll results
3.1 Awareness of Principles and Code of Conduct
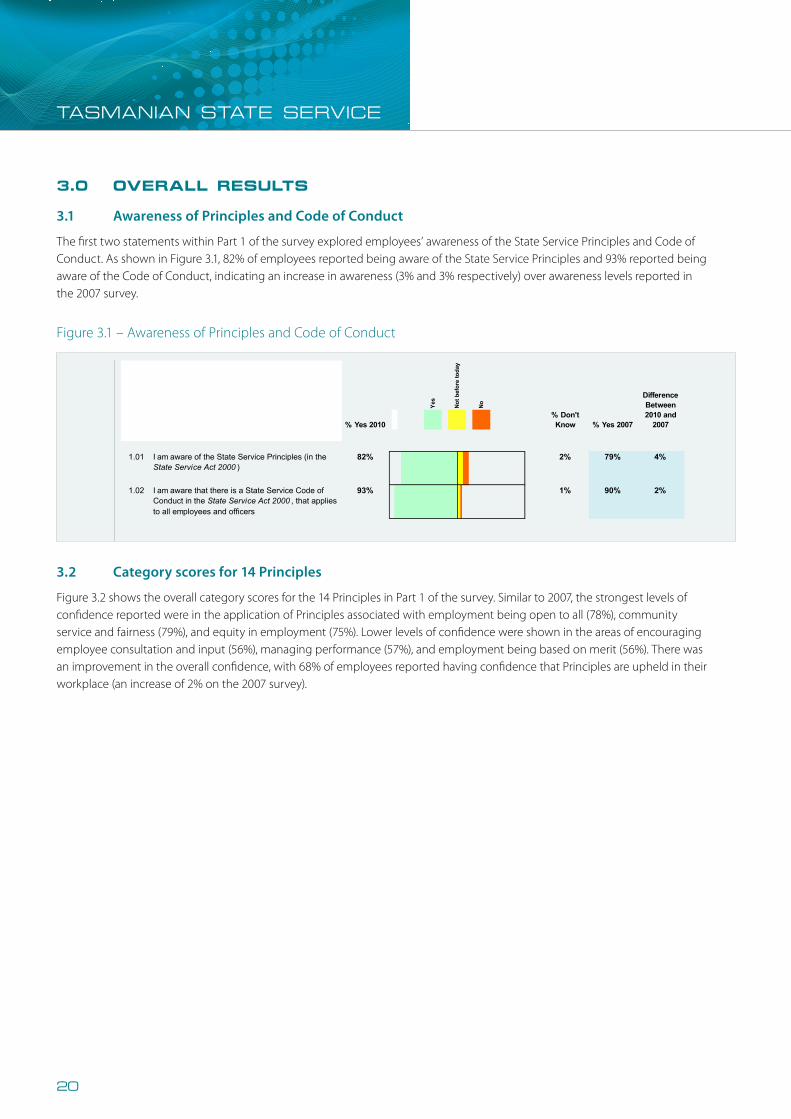
The first two statements within Part 1 of the survey explored employees’ awareness of the State Service Principles and Code of Conduct. As shown in Figure 3.1, 82% of employees reported being aware of the State Service Principles and 93% reported being aware of the Code of Conduct, indicating an increase in awareness (3% and 3% respectively) over awareness levels reported in the 2007 survey.
Figure 3.1 – Awareness of Principles and Code of Conduct
Tasmanian State Service Employee Survey Report 2010 25
3.0 Overall Results 3.1 Awareness of Principles and Code of Conduct
The first two statements within Part 1 of the survey explored employees’ awareness of the State Service Principles and Code of Conduct. As shown in Figure 3.1, 82% of employees reported being aware of the State Service Principles and 93% reported being aware of the Code of Conduct, indicating an increase in awareness (3% and 3% respectively) over awareness levels reported in the 2007 survey.
Figure 3.1 – Awareness of Principles and Code of Conduct
Stro
ngly
% Don't Know % Yes 2007
Difference Between 2010 and
2007Ye
s
Not b
efor
e to
day
No
% Yes 2010
1.01 I am aware of the State Service Principles (in the
State Service Act 2000 )82% 2% 79% 4%
1.02 I am aware that there is a State Service Code of Conduct in the State Service Act 2000 , that applies to all employees and officers
93% 1% 90% 2%
3.2 Category scores for 14 Principles
Figure 3.2 shows the overall category scores for the 14 Principles in Part 1 of the survey. Similar to 2007, the strongest levels of confidence reported were in the application of Principles associated with employment being open to all (78%), community service and fairness (79%), and equity in employment (75%). Lower levels of confidence were shown in the areas of encouraging employee consultation and input (56%), managing performance (57%), and employment being based on merit (56%). There was an improvement in the overall confidence, with 68% of employees reported having confidence that Principles are upheld in their workplace (an increase of 2% on the 2007 survey).
taSManian StatE SERVicE
20

Figure 3.2 – Category scores for groups of related statements
Tasmanian State Service Employee Survey Report 2010 26
Figure 3.2 – Category scores for groups of related statements
Stro
ngly
###Overall Evaluation That Principles Are Upheld(Question 1.73 of the survey)
68% 7% 66% 3%
Apolitical, Impartial & EthicalSection s7 (1) (a) of the State Service Act
70% 1% 69% 1%
Accountable For Actions & PerformanceSection s7 (1) (d) of the State Service Act
68% 1% 67% 1%
Community Service & FairnessSection s7 (1) (f) of the State Service Act
79% 1% 79% 0%
Managing PerformanceSection s7 (1) (j) of the State Service Act
57% 3% 54% 3%
Employment Based On MeritSection s7 (1) (b) of the State Service Act
56% 4% 54% 1%
Application For Employment Open To AllSection s7 (1) (l) of the State Service Act
78% 5% 80% -1%
Equity In EmploymentSection s7 (1) (k) of the State Service Act
75% 5% 73% 2%
Discrimination Free & Diversity RecognisedSection s7 (1) (c) of the State Service Act
71% 5% 70% 1%
Quality LeadershipSection s7 (1) (g) of the State Service Act *
62% 4%
Employee Consultation & Input EncouragedSection s7 (1) (h) of the State Service Act *
56% 5%
Safe WorkplaceSection s7 (1) (i) of the State Service Act
74% 5% 74% -1%
Flexible WorkplaceSection s7 (1) (i) of the State Service Act
64% 7% 62% 3%
Rewarding WorkplaceSection s7 (1) (i) of the State Service Act *
66% 6%
Fair Internal Grievance Resolution SystemSection s7 (1) (m) of the State Service Act
59% 10% 57% 2%
% Don't Know
% Agree & Strongly
Agree 2007
Difference Between 2010 and
2007
Stro
ngly
Agr
ee
Agre
e
Neith
er
Disa
gree
Stro
ngly
Di
sagr
ee
% Agree & Strongly
Agree 2010
* Note: No comparisons have been made between the 2007 and 2010 employee surveys where additional questions were included in the 2010 survey, or where questions have changed
*Note: No comparisons have been made between the 2007 and 2010 employee surveys where additional questions were included in the 2010 survey, or where questions have changed.
tAsMAnIA stAte servICe EMPLOYEE SURVEY REPORt 2010
21

Section 7(1)(a) of the State Service Act 2000 states: “the State Service is apolitical, performing its functions in an impartial, ethical and professional manner”. The results for this Principle are shown in Figure 4.1.
4.0 ApolItICAl, IMpArtIAl & ethICAl
• Themajorityofemployees(70%)agreedthattheirAgencyandtheStateServiceactsinanapolitical,impartialandethicalmanner,showing strong confidence in this Principle.
• Mostemployeesagreedthattheirmanagerorsupervisortakesappropriateactiontocorrectinappropriatebehaviour (68%) of others and encourages employees to avoid conflicts of interest (69%).
• Employeesstronglybelieve(83%)theirorganisationencouragesemployeestobehaveinanethicalmanner,whileonly 60% believed that decisions were fair, objective and ethical.
Figure 4.1 – Apolitical, impartial & ethical
Tasmanian State Service Employee Survey Report 2010 27
4.0 Apolitical, Impartial & Ethical Section 7(1)(a) of the State Service Act 2000 states: “the State Service is apolitical, performing its functions in an impartial, ethical and professional manner”. The results for this Principle are shown in Figure 4.1.
Figure 4.1 – Apolitical, impartial & ethical
Stro
ngly
% Don't Know
% Agree & Strongly
Agree 2007
Difference Between 2010 and
2007
Stro
ngly
Agr
ee
Agre
e
Neith
er
Disa
gree
Stro
ngly
Di
sagr
ee
% Agree & Strongly
Agree 2010
Apolitical, Impartial & EthicalSection s7 (1) (a) of the State Service Act
70% 1% 69% 1%
1.03 My organisation actively encourages all employees to behave in an ethical manner
83% 1% 83% 0%
1.04 In my workplace, decisions about all work matters are made fairly, objectively and ethically
60% 1% 59% 2%
1.05 My manager/supervisor would take appropriate action if decisions being made about work matters were not objective, fair and ethical
68% 1% 67% 1%
1.06 My manager/supervisor encourages employees to avoid conflicts of interest
69% 3% 68% 2%
The majority of employees (70%) agreed that their Agency and the State Service acts in an apolitical, impartial and ethical manner, showing strong confidence in this Principle.
Most employees agreed that their manager or supervisor takes appropriate action to correct inappropriate behaviour (68%) of others and encourages employees to avoid conflicts of interest (69%).
Employees strongly believe (83%) their organisation encourages employees to behave in an ethical manner, while only 60% believed that decisions were fair, objective and ethical.
taSManian StatE SERVicE
22
Tasmanian State Service Employee Survey Report 2010 28
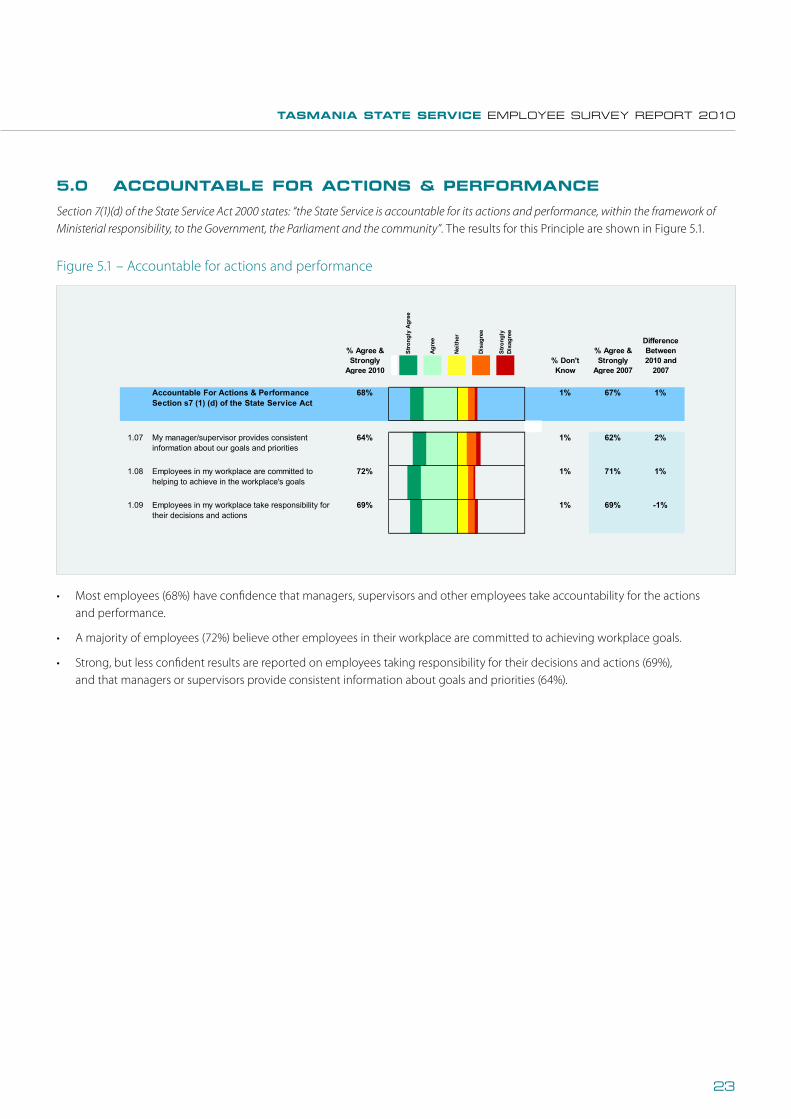
5.0 Accountable For Actions & Performance Section 7(1)(d) of the State Service Act 2000 states: “the State Service is accountable for its actions and performance, within the framework of Ministerial responsibility, to the Government, the Parliament and the community”. The results for this Principle are shown in Figure 5.1.
Figure 5.1 – Accountable for actions and performance
Stro
ngly
% Don't Know
% Agree & Strongly
Agree 2007
Difference Between 2010 and
2007
Stro
ngly
Agr
ee
Agre
e
Neith
er
Disa
gree
Stro
ngly
Di
sagr
ee
% Agree & Strongly
Agree 2010
Accountable For Actions & PerformanceSection s7 (1) (d) of the State Service Act
68% 1% 67% 1%
1.07 My manager/supervisor provides consistent information about our goals and priorities
64% 1% 62% 2%
1.08 Employees in my workplace are committed to helping to achieve in the workplace's goals
72% 1% 71% 1%
1.09 Employees in my workplace take responsibility for their decisions and actions
69% 1% 69% -1%
Most employees (68%) have confidence that managers, supervisors and other employees take accountability for the actions and performance.
A majority of employees (72%) believe other employees in their workplace are committed to achieving workplace goals.
Strong, but less confident results are reported on employees taking responsibility for their decisions and actions (69%), and that managers or supervisors provide consistent information about goals and priorities (64%).
Section 7(1)(d) of the State Service Act 2000 states: “the State Service is accountable for its actions and performance, within the framework of Ministerial responsibility, to the Government, the Parliament and the community”. The results for this Principle are shown in Figure 5.1.
5.0 ACCountABle For ACtIons & perForMAnCe
• Mostemployees(68%)haveconfidencethatmanagers,supervisorsandotheremployeestakeaccountabilityfortheactions and performance.
• Amajorityofemployees(72%)believeotheremployeesintheirworkplacearecommittedtoachievingworkplacegoals.
• Strong,butlessconfidentresultsarereportedonemployeestakingresponsibilityfortheirdecisionsandactions(69%), and that managers or supervisors provide consistent information about goals and priorities (64%).
Figure 5.1 – Accountable for actions and performance
tAsMAnIA stAte servICe EMPLOYEE SURVEY REPORt 2010
23
6.0 CoMMunIty servICe & FAIrness
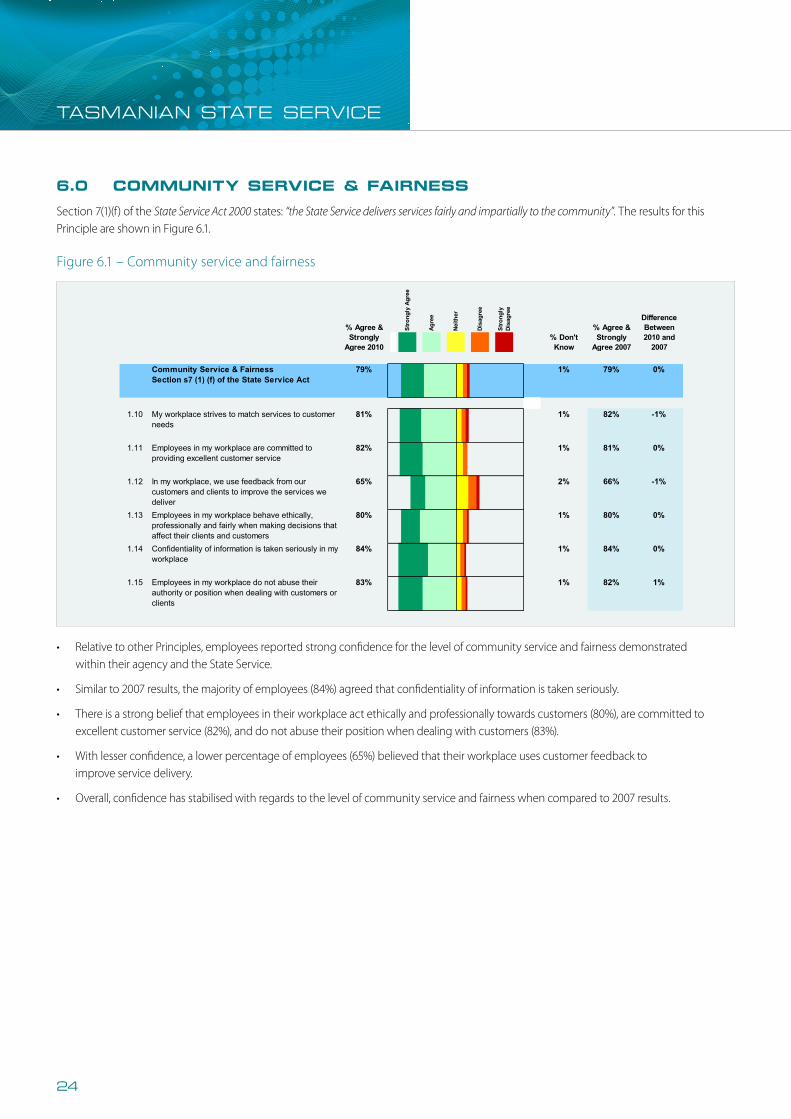
Section 7(1)(f) of the State Service Act 2000 states: “the State Service delivers services fairly and impartially to the community”. The results for this Principle are shown in Figure 6.1.
• RelativetootherPrinciples,employeesreportedstrongconfidenceforthelevelofcommunityserviceandfairnessdemonstrated within their agency and the State Service.
• Similarto2007results,themajorityofemployees(84%)agreedthatconfidentialityofinformationistakenseriously.
• Thereisastrongbeliefthatemployeesintheirworkplaceactethicallyandprofessionallytowardscustomers(80%),arecommittedtoexcellent customer service (82%), and do not abuse their position when dealing with customers (83%).
• Withlesserconfidence,alowerpercentageofemployees(65%)believedthattheirworkplaceusescustomerfeedbackto improve service delivery.
• Overall,confidencehasstabilisedwithregardstothelevelofcommunityserviceandfairnesswhencomparedto2007results.
Figure 6.1 – Community service and fairness
Tasmanian State Service Employee Survey Report 2010 29
6.0 Community Service & Fairness Section 7(1)(f) of the State Service Act 2000 states: “the State Service delivers services fairly and impartially to the community”. The results for this Principle are shown in Figure 6.1.
Figure 6.1 – Community service and fairness
Stro
ngly
% Don't Know
% Agree & Strongly
Agree 2007
Difference Between 2010 and
2007
Stro
ngly
Agr
ee
Agre
e
Neith
er
Disa
gree
Stro
ngly
Di
sagr
ee
% Agree & Strongly
Agree 2010
Community Service & FairnessSection s7 (1) (f) of the State Service Act
79% 1% 79% 0%
1.10 My workplace strives to match services to customer needs
81% 1% 82% -1%
1.11 Employees in my workplace are committed to providing excellent customer service
82% 1% 81% 0%
1.12 In my workplace, we use feedback from our customers and clients to improve the services we deliver
65% 2% 66% -1%
1.13 Employees in my workplace behave ethically, professionally and fairly when making decisions that affect their clients and customers
80% 1% 80% 0%
1.14 Confidentiality of information is taken seriously in my workplace
84% 1% 84% 0%
1.15 Employees in my workplace do not abuse their authority or position when dealing with customers or clients
83% 1% 82% 1%
Relative to other Principles, employees reported strong confidence for the level of community service and fairness demonstrated within their agency and the State Service.
Similar to 2007 results, the majority of employees (84%) agreed that confidentiality of information is taken seriously.
There is a strong belief that employees in their workplace act ethically and professionally towards customers (80%), are committed to excellent customer service (82%), and do not abuse their position when dealing with customers (83%).
With lesser confidence, a lower percentage of employees (65%) believed that their workplace uses customer feedback to improve service delivery.
Overall, confidence has stabilised with regards to the level of community service and fairness when compared to 2007 results.
taSManian StatE SERVicE
24
7.0 MAnAgIng perForMAnCe
Tasmanian State Service Employee Survey Report 2010 30
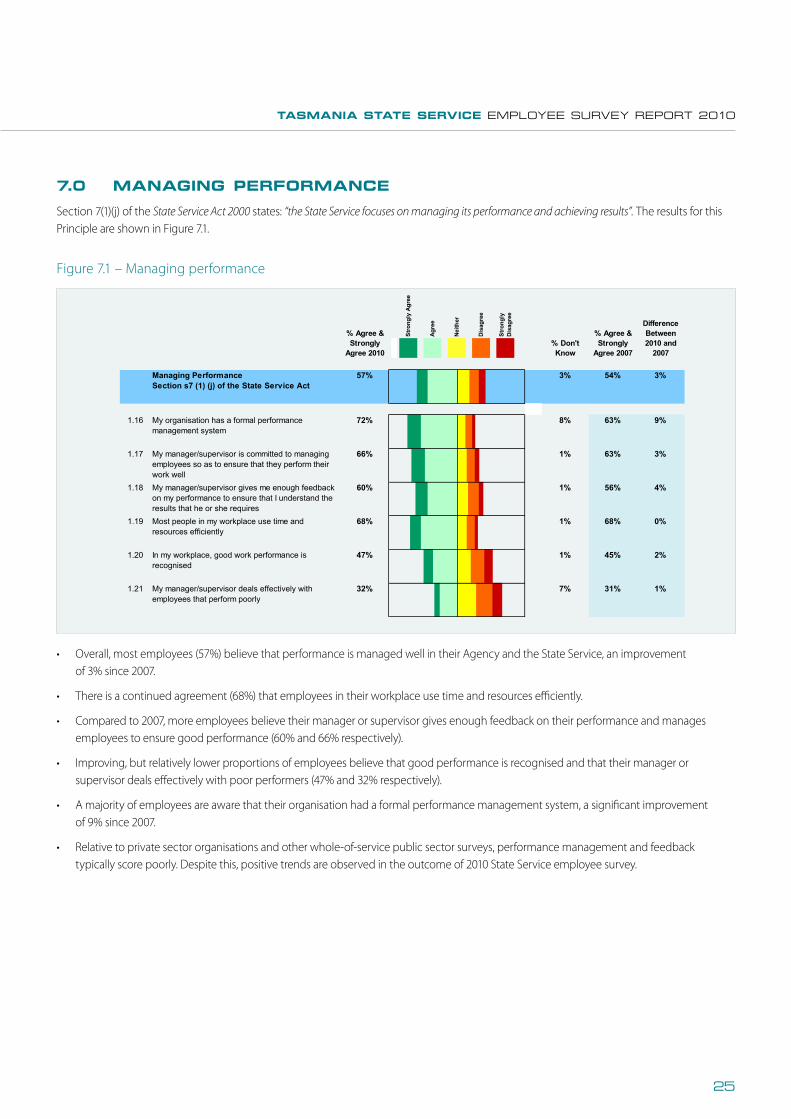
7.0 Managing Performance Section 7(1)(j) of the State Service Act 2000 states: “the State Service focuses on managing its performance and achieving results”. The results for this Principle are shown in Figure 7.1.
Figure 7.1 – Managing performance
Stro
ngly
% Don't Know
% Agree & Strongly
Agree 2007
Difference Between 2010 and
2007
Stro
ngly
Agr
ee
Agre
e
Neith
er
Disa
gree
Stro
ngly
Di
sagr
ee
% Agree & Strongly
Agree 2010
Managing PerformanceSection s7 (1) (j) of the State Service Act
57% 3% 54% 3%
1.16 My organisation has a formal performance management system
72% 8% 63% 9%
1.17 My manager/supervisor is committed to managing employees so as to ensure that they perform their work well
66% 1% 63% 3%
1.18 My manager/supervisor gives me enough feedback on my performance to ensure that I understand the results that he or she requires
60% 1% 56% 4%
1.19 Most people in my workplace use time and resources efficiently
68% 1% 68% 0%
1.20 In my workplace, good work performance is recognised
47% 1% 45% 2%
1.21 My manager/supervisor deals effectively with employees that perform poorly
32% 7% 31% 1%
Overall, most employees (57%) believe that performance is managed well in their Agency and the State Service, an improvement of 3% since 2007.
There is a continued agreement (68%) that employees in their workplace use time and resources efficiently.
Compared to 2007, more employees believe their manager or supervisor gives enough feedback on their performance and manages employees to ensure good performance (60% and 66% respectively).
Improving, but relatively lower proportions of employees believe that good performance is recognised and that their manager or supervisor deals effectively with poor performers (47% and 32% respectively).
A majority of employees are aware that their organisation had a formal performance management system, a significant improvement of 9% since 2007.
Relative to private sector organisations and other whole-of-service public sector surveys, performance management and feedback typically score poorly. Despite this, positive trends are observed in the outcome of 2010 State Service employee survey.
Section 7(1)(j) of the State Service Act 2000 states: “the State Service focuses on managing its performance and achieving results”. The results for this Principle are shown in Figure 7.1.
• Overall,mostemployees(57%)believethatperformanceismanagedwellintheirAgencyandtheStateService,animprovement of 3% since 2007.
• Thereisacontinuedagreement(68%)thatemployeesintheirworkplaceusetimeandresourcesefficiently.
• Comparedto2007,moreemployeesbelievetheirmanagerorsupervisorgivesenoughfeedbackontheirperformanceandmanagesemployees to ensure good performance (60% and 66% respectively).
• Improving,butrelativelylowerproportionsofemployeesbelievethatgoodperformanceisrecognisedandthattheirmanagerorsupervisor deals effectively with poor performers (47% and 32% respectively).
• Amajorityofemployeesareawarethattheirorganisationhadaformalperformancemanagementsystem,asignificantimprovement of 9% since 2007.
• Relativetoprivatesectororganisationsandotherwhole-of-servicepublicsectorsurveys,performancemanagementandfeedbacktypically score poorly. Despite this, positive trends are observed in the outcome of 2010 State Service employee survey.
Figure 7.1 – Managing performance
tAsMAnIA stAte servICe EMPLOYEE SURVEY REPORt 2010
25
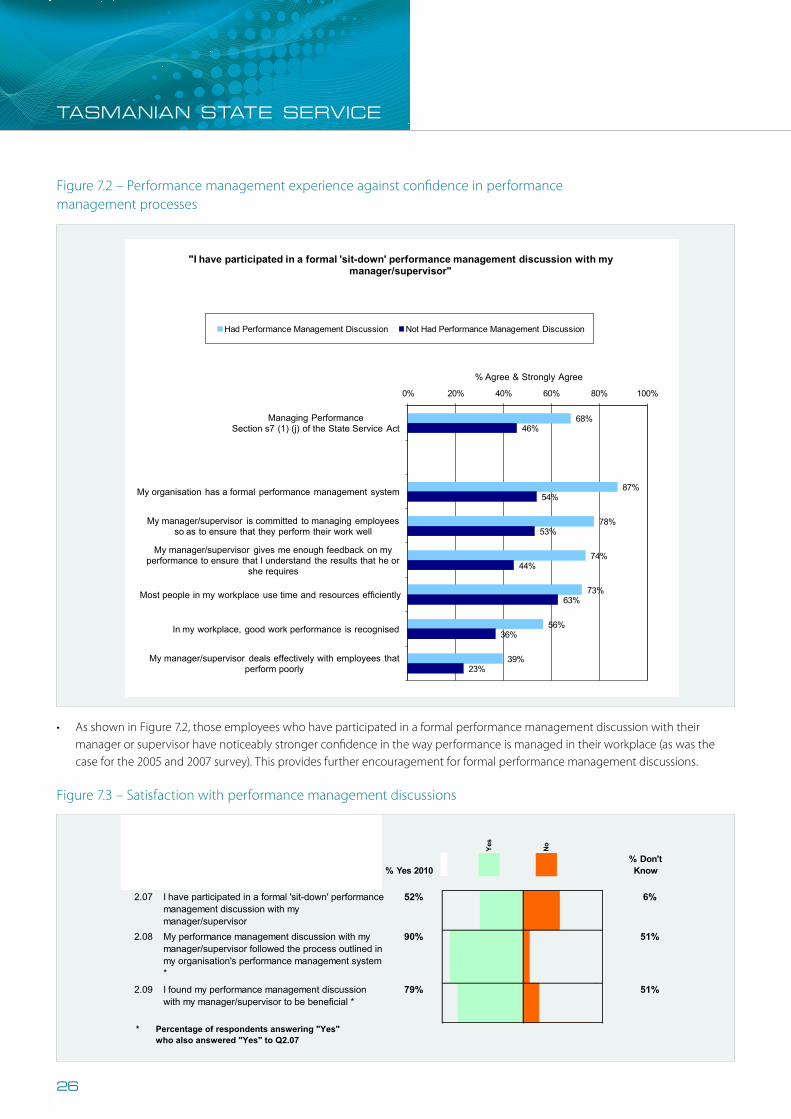
Figure 7.2 – Performance management experience against confidence in performance management processes
Tasmanian State Service Employee Survey Report 2010 31
Figure 7.2 – Performance management experience against confidence in performance management processes
68%
87%
78%
74%
73%
56%
39%
46%
54%
53%
44%
63%
36%
23%
0% 20% 40% 60% 80% 100%
Managing PerformanceSection s7 (1) (j) of the State Service Act
My organisation has a formal performance management system
My manager/supervisor is committed to managing employees so as to ensure that they perform their work well
My manager/supervisor gives me enough feedback on my performance to ensure that I understand the results that he or
she requires
Most people in my workplace use time and resources efficiently
In my workplace, good work performance is recognised
My manager/supervisor deals effectively with employees that perform poorly
% Agree & Strongly Agree
"I have participated in a formal 'sit-down' performance management discussion with my manager/supervisor"
Had Performance Management Discussion Not Had Performance Management Discussion
As shown in Figure 7.2, those employees who have participated in a formal performance management discussion with their manager or supervisor have noticeably stronger confidence in the way performance is managed in their workplace (as was the case for the 2005 and 2007 survey). This provides further encouragement for formal performance management discussions.
Tasmanian State Service Employee Survey Report 2010 32
Figure 7.3 – Satisfaction with performance management discussions
Stro
ngly
% Don't Know% Yes 2010
Yes
No
2.07 I have participated in a formal 'sit-down' performance
management discussion with my manager/supervisor
52% 6%
2.08 My performance management discussion with my manager/supervisor followed the process outlined in my organisation's performance management system *
90% 51%
2.09 I found my performance management discussion with my manager/supervisor to be beneficial *
79% 51%
* Percentage of respondents answering "Yes"
who also answered "Yes" to Q2.07
In 2010, more employees (52%, up from 38% in 2007) report having had a performance management discussion with their manger or supervisor within the last 12 months.
Furthermore, of the people who reported having had a performance management discussion, a strong majority report that the discussion followed the appropriate process (90%, up from 88% in 2007) and found the session to be beneficial (79%, up from 77% in 2007).
• AsshowninFigure7.2,thoseemployeeswhohaveparticipatedinaformalperformancemanagementdiscussionwiththeirmanager or supervisor have noticeably stronger confidence in the way performance is managed in their workplace (as was the case for the 2005 and 2007 survey). This provides further encouragement for formal performance management discussions.
Figure 7.3 – Satisfaction with performance management discussions
taSManian StatE SERVicE
26
Section 7(1)(b) of the State Service Act 2000 states: “the State Service is a public service in which employment decisions are based on merit”. The results for this Principle are shown in Figure 8.1.
8.0 eMployMent BAsed on MerIt
• AsshowninFigure8.1,amajorityofemployees(56%)providedoverallsupportforemploymentbeingbasedonmerit,withanoverall marginal improvement compared to the previous survey.
• Similarto2007,amajorityofemployees(65%)agreethatselectioncriteriaaccuratelyreflectjobrequirements.
• Approximatelyhalfofallemployeesagreedthattheirworkplaceselectspeoplewiththerightcharacteristicsforjobs(55%agreement), that people who serve on selection panels have the necessary skills (58% agreement), that favouritism does not impact promotion decisions (50% agreement), and that recruitment and promotion decisions are fair (48% agreement).
• Despitesomepossiblereservationsamongstemployeesaboutthefairnessofrecruitmentandpromotiondecisions,themajorityof employees feel that their organisation has good procedures and processes for selecting employees (58% agreement).
• Somecautionneedstobeunderstoodbeforeinterpretingtheseresults.Thestatementsassociatedwithrecruitmentandselectiontend to be some of the lowest scoring sections of public sector surveys, with results similar to those presented here. Also, averaged responses to employee surveys will not demonstrate universal support for recruitment and selection processes given the limited number of promotion opportunities within organisations and the limited exposure employees have with recruitment processes (for example, see Figure 8.2).
Figure 8.1 – Employment based on merit
Tasmanian State Service Employee Survey Report 2010 33
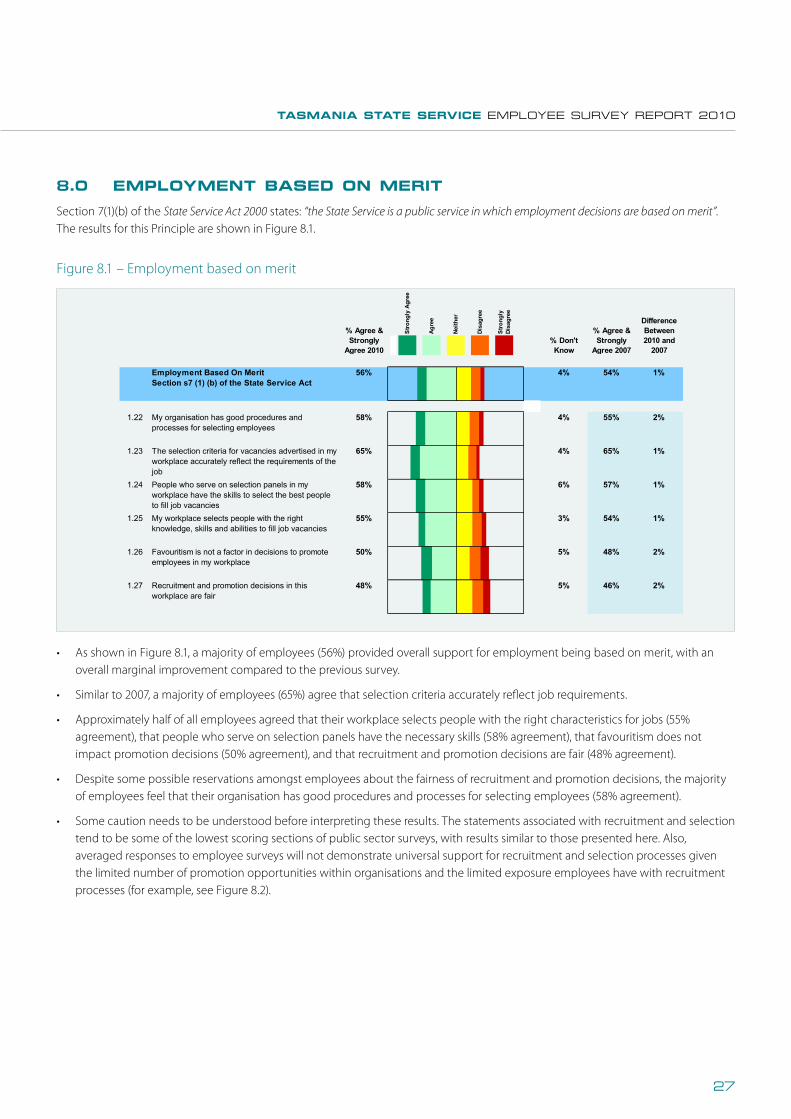
8.0 Employment Based On Merit Section 7(1)(b) of the State Service Act 2000 states: “the State Service is a public service in which employment decisions are based on merit”. The results for this Principle are shown in Figure 8.1.
Figure 8.1 – Employment based on merit
Stro
ngly
% Don't Know
% Agree & Strongly
Agree 2007
Difference Between 2010 and
2007
Stro
ngly
Agr
ee
Agre
e
Neith
er
Disa
gree
Stro
ngly
Di
sagr
ee
% Agree & Strongly
Agree 2010
Employment Based On MeritSection s7 (1) (b) of the State Service Act
56% 4% 54% 1%
1.22 My organisation has good procedures and processes for selecting employees
58% 4% 55% 2%
1.23 The selection criteria for vacancies advertised in my workplace accurately reflect the requirements of the job
65% 4% 65% 1%
1.24 People who serve on selection panels in my workplace have the skills to select the best people to fill job vacancies
58% 6% 57% 1%
1.25 My workplace selects people with the right knowledge, skills and abilities to fill job vacancies
55% 3% 54% 1%
1.26 Favouritism is not a factor in decisions to promote employees in my workplace
50% 5% 48% 2%
1.27 Recruitment and promotion decisions in this workplace are fair
48% 5% 46% 2%
As shown in Figure 8.1, a majority of employees (56%) provided overall support for employment being based on merit, with an overall marginal improvement compared to the previous survey.
Similar to 2007, a majority of employees (65%) agree that selection criteria accurately reflect job requirements.
Approximately half of all employees agreed that their workplace selects people with the right characteristics for jobs (55% agreement), that people who serve on selection panels have the necessary skills (58% agreement), that favouritism does not impact promotion decisions (50% agreement), and that recruitment and promotion decisions are fair (48% agreement).
Despite some possible reservations amongst employees about the fairness of recruitment and promotion decisions, the majority of employees feel that their organisation has good procedures and processes for selecting employees (58% agreement).
tAsMAnIA stAte servICe EMPLOYEE SURVEY REPORt 2010
27
Tasmanian State Service Employee Survey Report 2010 34
Some caution needs to be understood before interpreting these results. The statements associated with recruitment and selection tend to be some of the lowest scoring sections of public sector surveys, with results similar to those presented here. Also, averaged responses to employee surveys will not demonstrate universal support for recruitment and selection processes given the limited number of promotion opportunities within organisations and the limited exposure employees have with recruitment processes (for example, see Figure 8.2).
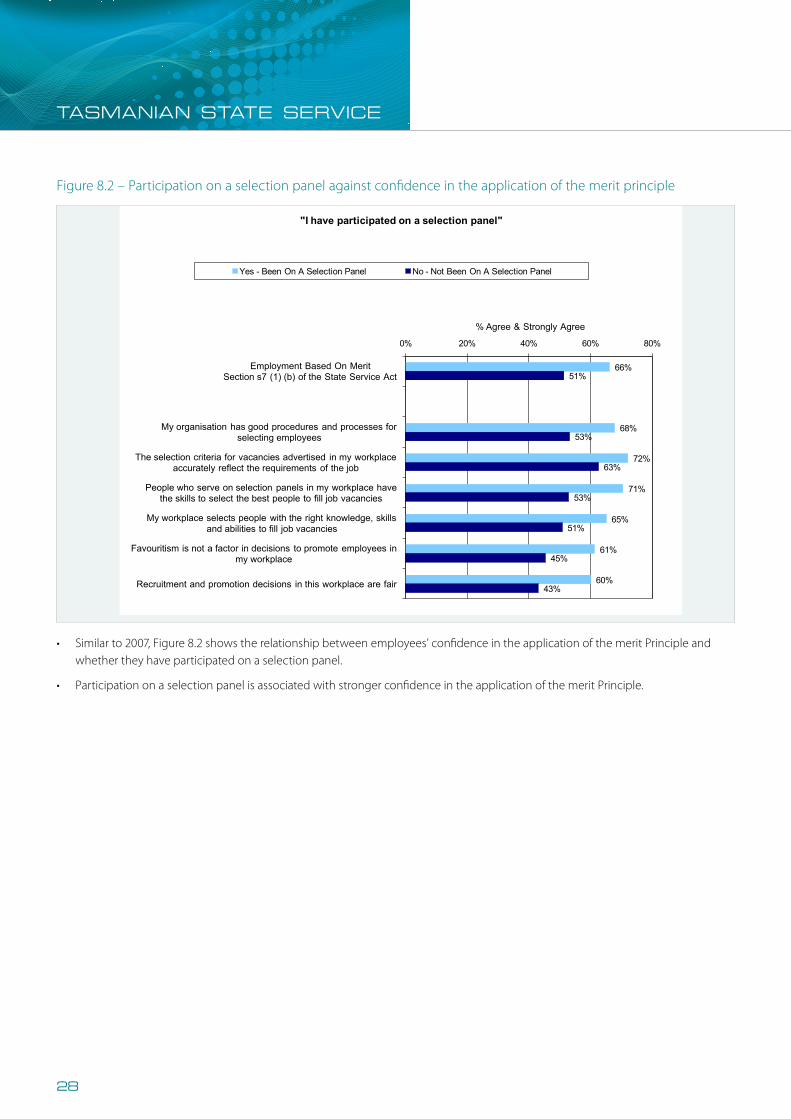
Figure 8.2 – Participation on a selection panel against confidence in the application of the merit principle
66%
68%
72%
71%
65%
61%
60%
51%
53%
63%
53%
51%
45%
43%
0% 20% 40% 60% 80%
Employment Based On MeritSection s7 (1) (b) of the State Service Act
My organisation has good procedures and processes for selecting employees
The selection criteria for vacancies advertised in my workplace accurately reflect the requirements of the job
People who serve on selection panels in my workplace have the skills to select the best people to fill job vacancies
My workplace selects people with the right knowledge, skills and abilities to fill job vacancies
Favouritism is not a factor in decisions to promote employees in my workplace
Recruitment and promotion decisions in this workplace are fair
% Agree & Strongly Agree
"I have participated on a selection panel"
Yes - Been On A Selection Panel No - Not Been On A Selection Panel
Similar to 2007, Figure 8.2 shows the relationship between employees’ confidence in the application of the merit Principle and whether they have participated on a selection panel.
Participation on a selection panel is associated with stronger confidence in the application of the merit Principle.
Figure 8.2 – Participation on a selection panel against confidence in the application of the merit principle
• Similarto2007,Figure8.2showstherelationshipbetweenemployees’confidenceintheapplicationofthemeritPrincipleandwhether they have participated on a selection panel.
• ParticipationonaselectionpanelisassociatedwithstrongerconfidenceintheapplicationofthemeritPrinciple.
taSManian StatE SERVicE
28
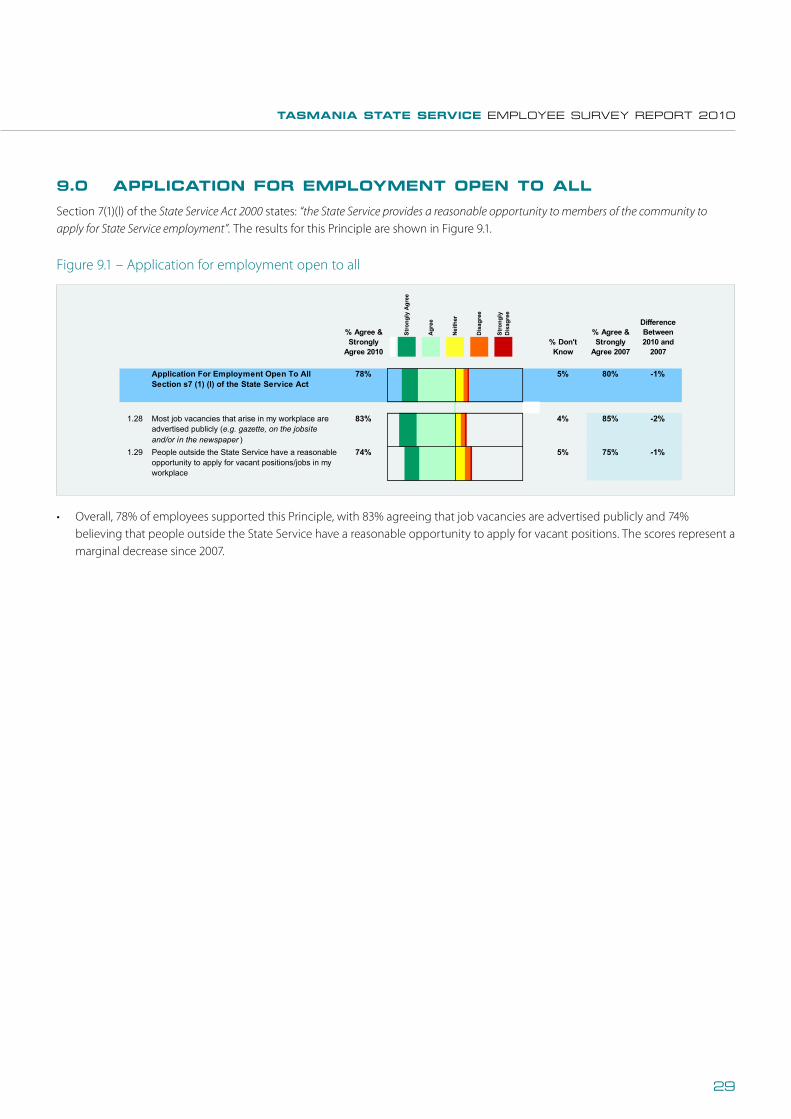
Section 7(1)(l) of the State Service Act 2000 states: “the State Service provides a reasonable opportunity to members of the community to apply for State Service employment”. The results for this Principle are shown in Figure 9.1.
9.0 ApplICAtIon For eMployMent open to All
Figure 9.1 – Application for employment open to all
• Overall,78%ofemployeessupportedthisPrinciple,with83%agreeingthatjobvacanciesareadvertisedpubliclyand74%believing that people outside the State Service have a reasonable opportunity to apply for vacant positions. The scores represent a marginal decrease since 2007.
Tasmanian State Service Employee Survey Report 2010 35
9.0 Application For Employment Open To All Section 7(1)(l) of the State Service Act 2000 states: “the State Service provides a reasonable opportunity to members of the community to apply for State Service employment”. The results for this Principle are shown in Figure 9.1.
Figure 9.1 – Application for employment open to all
Stro
ngly
% Don't Know
% Agree & Strongly
Agree 2007
Difference Between 2010 and
2007
Stro
ngly
Agr
ee
Agre
e
Neith
er
Disa
gree
Stro
ngly
Di
sagr
ee
% Agree & Strongly
Agree 2010
Application For Employment Open To AllSection s7 (1) (l) of the State Service Act
78% 5% 80% -1%
1.28 Most job vacancies that arise in my workplace are advertised publicly (e.g. gazette, on the jobsite and/or in the newspaper )
83% 4% 85% -2%
1.29 People outside the State Service have a reasonable opportunity to apply for vacant positions/jobs in my workplace
74% 5% 75% -1%
Overall, 78% of employees supported this Principle, with 83% agreeing that job vacancies are advertised publicly and 74% believing that people outside the State Service have a reasonable opportunity to apply for vacant positions. The scores represent a marginal decrease since 2007.
tAsMAnIA stAte servICe EMPLOYEE SURVEY REPORt 2010
29

Tasmanian State Service Employee Survey Report 2010 36
10.0 Equity In Employment Section 7(1)(k) of the State Service Act 2000 states: “the State Service promotes equity in employment”. The results for this Principle are shown in Figure 10.1.
Figure 10.1 – Equity in employment
Stro
ngly
% Don't Know
% Agree & Strongly
Agree 2007
Difference Between 2010 and
2007
Stro
ngly
Agr
ee
Agre
e
Neith
er
Disa
gree
Stro
ngly
Di
sagr
ee
% Agree & Strongly
Agree 2010
Equity In EmploymentSection s7 (1) (k) of the State Service Act
75% 5% 73% 2%
1.30 My organisation is committed to promoting equity in employment
71% 5% 70% 1%
1.31 Gender is not a barrier to success in my workplace 82% 4% 80% 2%
1.32 Age is not a barrier to success in my workplace 78% 4% 77% 1%
1.33 Cultural background is not a barrier to success in my workplace
82% 5% 82% 1%
1.34 Sexual orientation is not a barrier to success in my workplace
83% 7% 81% 2%
1.35 Having a disability is not a barrier to success in my workplace
67% 8% 64% 3%
1.36 Having family responsibilities is not a barrier to success in my workplace
75% 5% 72% 3%
1.37 Working part-time or using other flexible work options is not a barrier to success (including career progression ) in my workplace
65% 6% 61% 3%
As shown in Figure 10.1, strong confidence is reported for the Principle of equity in employment, with 75% agreement. Overall, there was a marginal improvement in support since 2007.
Particularly strong agreement was shown for culture, sexual orientation, gender and age not being barriers for success in their Agency (78% to 83% agreement).
Less stronger but positive agreement is reported regarding family responsibilities and having a disability not being barriers to success (75% and 67% respectively).
The lowest score was given for perceptions regarding part-time work and flexible work options, with 65% of employees believing these work patterns were not barriers to success. However, this has improved from 61% agreement in 2007.
In general, 71% of employees believed their organisation is committed to promoting equity in employment.
• AsshowninFigure10.1,strongconfidenceisreportedforthePrincipleofequityinemployment,with75%agreement.Overall,there was a marginal improvement in support since 2007.
• Particularlystrongagreementwasshownforculture,sexualorientation,genderandagenotbeingbarriersforsuccessintheirAgency (78% to 83% agreement).
• Lessstrongerbutpositiveagreementisreportedregardingfamilyresponsibilitiesandhavingadisabilitynotbeingbarrierstosuccess (75% and 67% respectively).
• Thelowestscorewasgivenforperceptionsregardingpart-timeworkandflexibleworkoptions,with65%ofemployeesbelievingthese work patterns were not barriers to success. However, this has improved from 61% agreement in 2007.
• Ingeneral,71%ofemployeesbelievedtheirorganisationiscommittedtopromotingequityinemployment.
10.0 equIty In eMployMent
Figure 10.1 – Equity in employment
Section 7(1)(k) of the State Service Act 2000 states: “the State Service promotes equity in employment”. The results for this Principle are shown in Figure 10.1.
taSManian StatE SERVicE
30
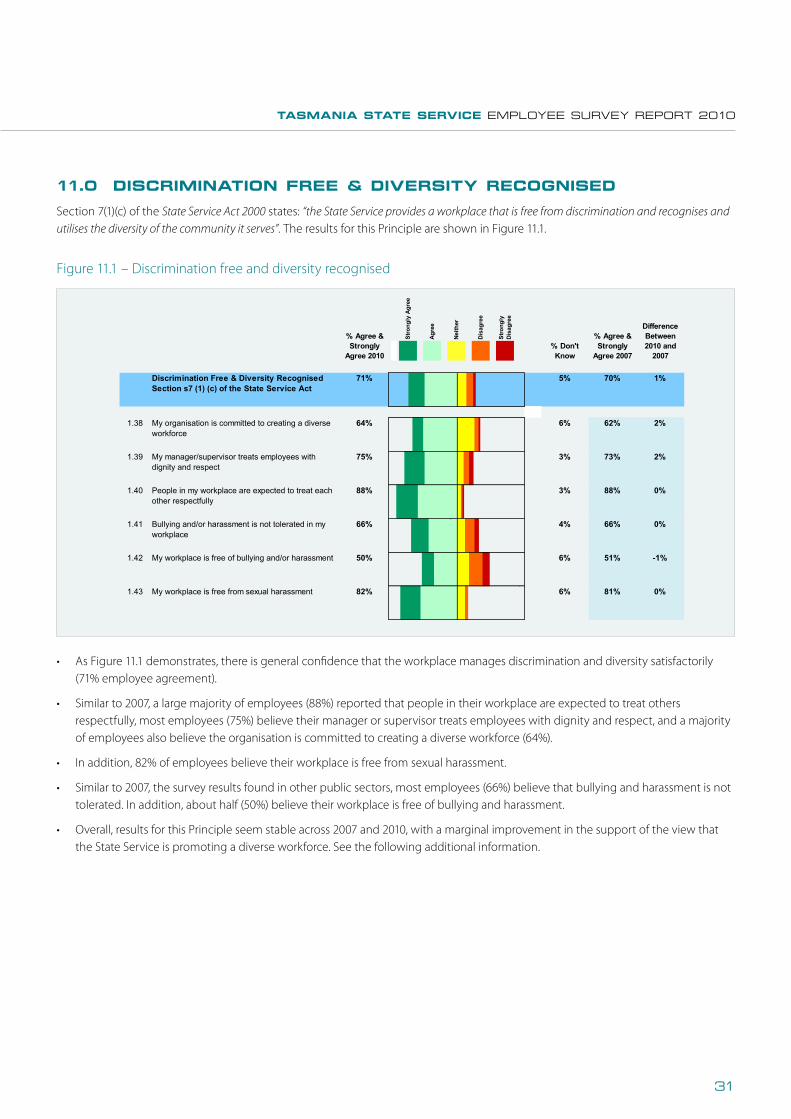
• AsFigure11.1demonstrates,thereisgeneralconfidencethattheworkplacemanagesdiscriminationanddiversitysatisfactorily(71% employee agreement).
• Similarto2007,alargemajorityofemployees(88%)reportedthatpeopleintheirworkplaceareexpectedtotreatothersrespectfully, most employees (75%) believe their manager or supervisor treats employees with dignity and respect, and a majority of employees also believe the organisation is committed to creating a diverse workforce (64%).
• Inaddition,82%ofemployeesbelievetheirworkplaceisfreefromsexualharassment.
• Similarto2007,thesurveyresultsfoundinotherpublicsectors,mostemployees(66%)believethatbullyingandharassmentisnottolerated. In addition, about half (50%) believe their workplace is free of bullying and harassment.
• Overall,resultsforthisPrincipleseemstableacross2007and2010,withamarginalimprovementinthesupportoftheviewthatthe State Service is promoting a diverse workforce. See the following additional information.
11.0 dIsCrIMInAtIon Free & dIversIty reCognIsed
Section 7(1)(c) of the State Service Act 2000 states: “the State Service provides a workplace that is free from discrimination and recognises and utilises the diversity of the community it serves”. The results for this Principle are shown in Figure 11.1.
Figure 11.1 – Discrimination free and diversity recognised
Tasmanian State Service Employee Survey Report 2010 37
11.0 Discrimination Free & Diversity Recognised Section 7(1)(c) of the State Service Act 2000 states: “the State Service provides a workplace that is free from discrimination and recognises and utilises the diversity of the community it serves”. The results for this Principle are shown in Figure 11.1.
Figure 11.1 – Discrimination free and diversity recognised
Stro
ngly
% Don't Know
% Agree & Strongly
Agree 2007
Difference Between 2010 and
2007
Stro
ngly
Agr
ee
Agre
e
Neith
er
Disa
gree
Stro
ngly
Di
sagr
ee
% Agree & Strongly
Agree 2010
Discrimination Free & Diversity RecognisedSection s7 (1) (c) of the State Service Act
71% 5% 70% 1%
1.38 My organisation is committed to creating a diverse workforce
64% 6% 62% 2%
1.39 My manager/supervisor treats employees with dignity and respect
75% 3% 73% 2%
1.40 People in my workplace are expected to treat each other respectfully
88% 3% 88% 0%
1.41 Bullying and/or harassment is not tolerated in my workplace
66% 4% 66% 0%
1.42 My workplace is free of bullying and/or harassment 50% 6% 51% -1%
1.43 My workplace is free from sexual harassment 82% 6% 81% 0%
As Figure 11.1 demonstrates, there is general confidence that the workplace manages discrimination and diversity satisfactorily (71% employee agreement).
Similar to 2007, a large majority of employees (88%) reported that people in their workplace are expected to treat others respectfully, most employees (75%) believe their manager or supervisor treats employees with dignity and respect, and a majority of employees also believe the organisation is committed to creating a diverse workforce (64%).
In addition, 82% of employees believe their workplace is free from sexual harassment.
Similar to 2007, the survey results found in other public sectors, most employees (66%) believe that bullying and harassment is not tolerated. In addition, about half (50%) believe their workplace is free of bullying and harassment.
Overall, results for this Principle seem stable across 2007 and 2010, with a marginal improvement in the support of the view that the State Service is promoting a diverse workforce. See the following additional information.
tAsMAnIA stAte servICe EMPLOYEE SURVEY REPORt 2010
31
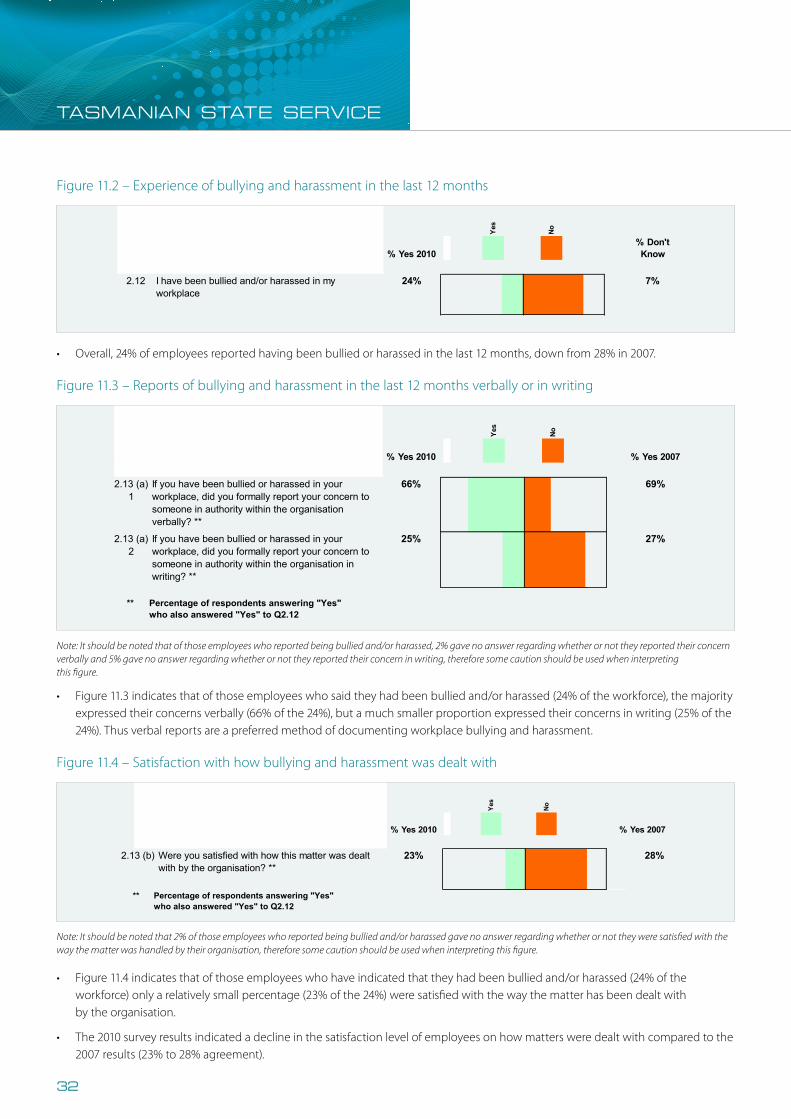
Tasmanian State Service Employee Survey Report 2010 38
Figure 11.2 – Experience of bullying and harassment in the last 12 months
Stro
ngly
% Don't Know% Yes 2010
Yes
No
2.12 I have been bullied and/or harassed in my
workplace24% 7%
Overall, 24% of employees reported having been bullied or harassed in the last 12 months, down from 28% in 2007.
Figure 11.3 – Reports of bullying and harassment in the last 12 months verbally or in writing
Figure 11.3 indicates that of those employees who said they had been bullied and/or
harassed (24% of the workforce), the majority expressed their concerns verbally (66% of the 24%), but a much smaller proportion expressed their concerns in writing (25% of the 24%). Thus verbal reports are a preferred method of documenting workplace bullying and harassment.
Stro
ngly
% Yes 2010
Yes
No% Yes 2007
2.13 (a)
1If you have been bullied or harassed in your workplace, did you formally report your concern to someone in authority within the organisation verbally? **
66% 69%
2.13 (a) 2
If you have been bullied or harassed in your workplace, did you formally report your concern to someone in authority within the organisation in writing? **
25% 27%
** Percentage of respondents answering "Yes" who also answered "Yes" to Q2.12
NB. It should be noted that of those employees who reported being bullied and/or harassed, 2% gave no answer regarding whether or not they reported their concern verbally and 5% gave no answer regarding whether or not they reported their concern in writing, therefore some caution should be used when interpreting this figure.
Tasmanian State Service Employee Survey Report 2010 38
Figure 11.2 – Experience of bullying and harassment in the last 12 months
Stro
ngly
% Don't Know% Yes 2010
Yes
No
2.12 I have been bullied and/or harassed in my
workplace24% 7%
Overall, 24% of employees reported having been bullied or harassed in the last 12 months, down from 28% in 2007.
Figure 11.3 – Reports of bullying and harassment in the last 12 months verbally or in writing
Figure 11.3 indicates that of those employees who said they had been bullied and/or
harassed (24% of the workforce), the majority expressed their concerns verbally (66% of the 24%), but a much smaller proportion expressed their concerns in writing (25% of the 24%). Thus verbal reports are a preferred method of documenting workplace bullying and harassment.
Stro
ngly
% Yes 2010
Yes
No
% Yes 2007
2.13 (a)
1If you have been bullied or harassed in your workplace, did you formally report your concern to someone in authority within the organisation verbally? **
66% 69%
2.13 (a) 2
If you have been bullied or harassed in your workplace, did you formally report your concern to someone in authority within the organisation in writing? **
25% 27%
** Percentage of respondents answering "Yes" who also answered "Yes" to Q2.12
NB. It should be noted that of those employees who reported being bullied and/or harassed, 2% gave no answer regarding whether or not they reported their concern verbally and 5% gave no answer regarding whether or not they reported their concern in writing, therefore some caution should be used when interpreting this figure.
• Overall,24%ofemployeesreportedhavingbeenbulliedorharassedinthelast12months,downfrom28%in2007.
Figure 11.2 – Experience of bullying and harassment in the last 12 months
• Figure11.3indicatesthatofthoseemployeeswhosaidtheyhadbeenbulliedand/orharassed(24%oftheworkforce),themajorityexpressed their concerns verbally (66% of the 24%), but a much smaller proportion expressed their concerns in writing (25% of the 24%). Thus verbal reports are a preferred method of documenting workplace bullying and harassment.
Figure 11.3 – Reports of bullying and harassment in the last 12 months verbally or in writing
Note: It should be noted that of those employees who reported being bullied and/or harassed, 2% gave no answer regarding whether or not they reported their concern verbally and 5% gave no answer regarding whether or not they reported their concern in writing, therefore some caution should be used when interpreting this figure.
Tasmanian State Service Employee Survey Report 2010 39
Figure 11.4 – Satisfaction with how bullying and harassment was dealt with
Figure 11.4 indicates that of those employees who have indicated that they had been bullied and/or harassed (24% of the workforce) only a relatively small percentage (23% of the 24%) were satisfied with the way the matter has been dealt with by the organisation.
The 2010 survey results indicated a decline in the satisfaction level of employees on how matters were dealt with compared to the 2007 results (23% to 28% agreement).
Stro
ngly
% Yes 2010
Yes
No
% Yes 2007
2.13 (b) Were you satisfied with how this matter was dealt
with by the organisation? **23% 28%
** Percentage of respondents answering "Yes"
who also answered "Yes" to Q2.12
NB. It should be noted that 2% of those employees who reported being bullied and/or harassed gave no answer regarding whether or not they were satisfied with the way the matter was handled by their organisation, therefore some caution should be used when interpreting this figure.
Figure 11.4 – Satisfaction with how bullying and harassment was dealt with
• Figure11.4indicatesthatofthoseemployeeswhohaveindicatedthattheyhadbeenbulliedand/orharassed(24%oftheworkforce) only a relatively small percentage (23% of the 24%) were satisfied with the way the matter has been dealt with by the organisation.
• The2010surveyresultsindicatedadeclineinthesatisfactionlevelofemployeesonhowmattersweredealtwithcomparedtothe2007 results (23% to 28% agreement).
Note: It should be noted that 2% of those employees who reported being bullied and/or harassed gave no answer regarding whether or not they were satisfied with the way the matter was handled by their organisation, therefore some caution should be used when interpreting this figure.
taSManian StatE SERVicE
32
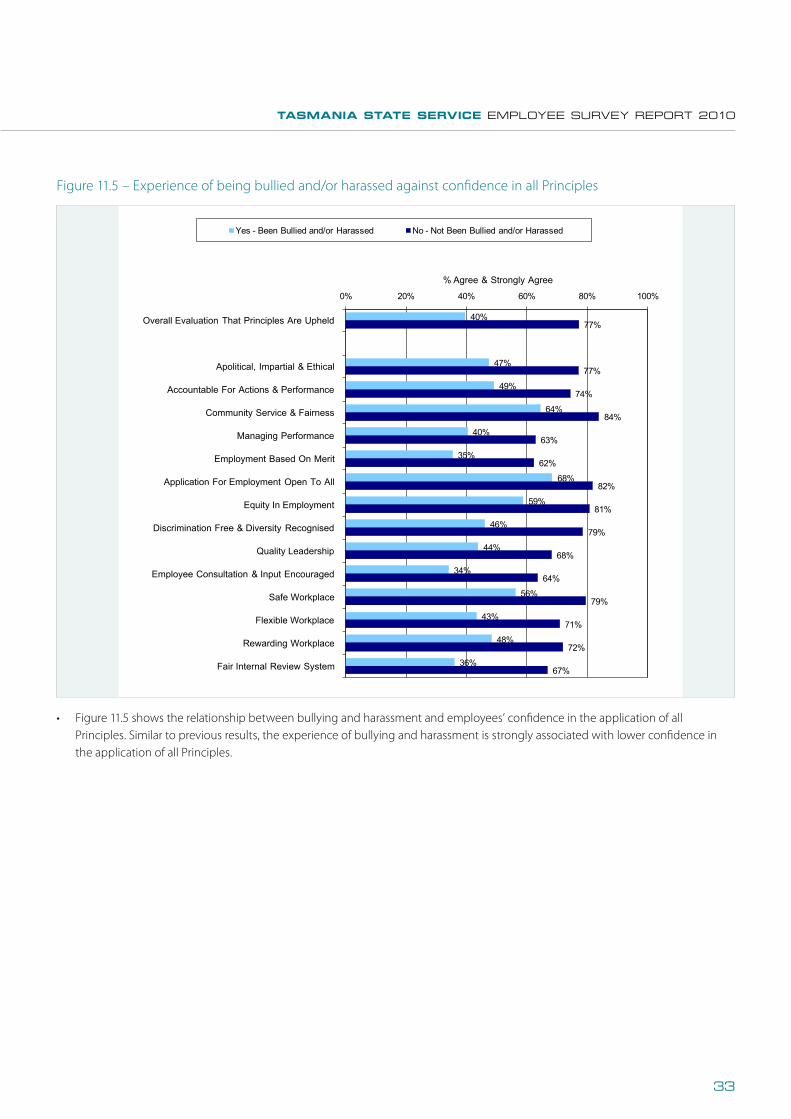
Tasmanian State Service Employee Survey Report 2010 40
Figure 11.5 – Experience of being bullied and/or harassed against confidence in all Principles
40%
47%
49%
64%
40%
35%
68%
59%
46%
44%
34%
56%
43%
48%
36%
77%
77%
74%
84%
63%
62%
82%
81%
79%
68%
64%
79%
71%
72%
67%
0% 20% 40% 60% 80% 100%
Overall Evaluation That Principles Are Upheld
Apolitical, Impartial & Ethical
Accountable For Actions & Performance
Community Service & Fairness
Managing Performance
Employment Based On Merit
Application For Employment Open To All
Equity In Employment
Discrimination Free & Diversity Recognised
Quality Leadership
Employee Consultation & Input Encouraged
Safe Workplace
Flexible Workplace
Rewarding Workplace
Fair Internal Review System
% Agree & Strongly Agree
"I have been bullied and/or harassed in my workplace"
Yes - Been Bullied and/or Harassed No - Not Been Bullied and/or Harassed
Figure 11.5 shows the relationship between bullying and harassment and employees’ confidence in the application of all Principles. Similar to previous results, the experience of bullying and harassment is strongly associated with lower confidence in the application of all Principles.
• Figure11.5showstherelationshipbetweenbullyingandharassmentandemployees’confidenceintheapplicationofallPrinciples. Similar to previous results, the experience of bullying and harassment is strongly associated with lower confidence in the application of all Principles.
Figure 11.5 – Experience of being bullied and/or harassed against confidence in all Principles
tAsMAnIA stAte servICe EMPLOYEE SURVEY REPORt 2010
33
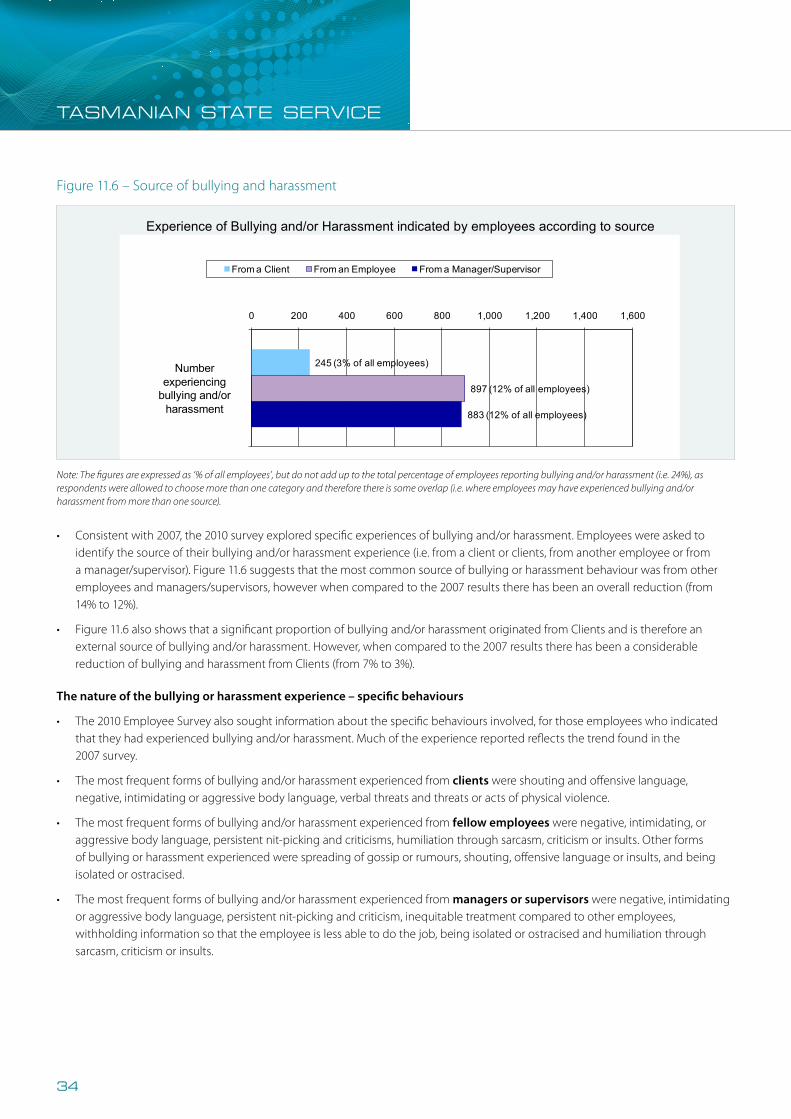
• Consistentwith2007,the2010surveyexploredspecificexperiencesofbullyingand/orharassment.Employeeswereaskedtoidentify the source of their bullying and/or harassment experience (i.e. from a client or clients, from another employee or from a manager/supervisor). Figure 11.6 suggests that the most common source of bullying or harassment behaviour was from other employees and managers/supervisors, however when compared to the 2007 results there has been an overall reduction (from 14% to 12%).
• Figure11.6alsoshowsthatasignificantproportionofbullyingand/orharassmentoriginatedfromClientsandisthereforeanexternal source of bullying and/or harassment. However, when compared to the 2007 results there has been a considerable reduction of bullying and harassment from Clients (from 7% to 3%).
The nature of the bullying or harassment experience – specific behaviours
• The2010EmployeeSurveyalsosoughtinformationaboutthespecificbehavioursinvolved,forthoseemployeeswhoindicatedthat they had experienced bullying and/or harassment. Much of the experience reported reflects the trend found in the 2007 survey.
• Themostfrequentformsofbullyingand/orharassmentexperiencedfromclients were shouting and offensive language, negative, intimidating or aggressive body language, verbal threats and threats or acts of physical violence.
• Themostfrequentformsofbullyingand/orharassmentexperiencedfromfellow employees were negative, intimidating, or aggressive body language, persistent nit-picking and criticisms, humiliation through sarcasm, criticism or insults. Other forms of bullying or harassment experienced were spreading of gossip or rumours, shouting, offensive language or insults, and being isolated or ostracised.
• Themostfrequentformsofbullyingand/orharassmentexperiencedfrommanagers or supervisors were negative, intimidating or aggressive body language, persistent nit-picking and criticism, inequitable treatment compared to other employees, withholding information so that the employee is less able to do the job, being isolated or ostracised and humiliation through sarcasm, criticism or insults.
Figure 11.6 – Source of bullying and harassment
Tasmanian State Service Employee Survey Report 2010 41
Figure 11.6 – Source of bullying and harassment
Experience of Bullying and/or Harassment indicated by employees according to source
245 (3% of all employees)
897 (12% of all employees)
883 (12% of all employees)
0 200 400 600 800 1,000 1,200 1,400 1,600
From a Client From an Employee From a Manager/Supervisor
Number experiencing
bullying and/or harassment
N.B. The figures are expressed as „% of all employees‟, but do not add up to the total percentage of employees reporting bullying and/or harassment (i.e. 24%), as respondents were allowed to choose more than one category and therefore there is some overlap (i.e. where employees may have experienced bullying and/or harassment from more than one source).
Consistent with 2007, the 2010 survey explored specific experiences of bullying and/or harassment. Employees were asked to identify the source of their bullying and/or harassment experience (i.e. from a client or clients, from another employee or from a manager/supervisor). Figure 11.6 suggests that the most common source of bullying or harassment behaviour was from other employees and managers/supervisors, however when compared to the 2007 results there has been an overall reduction (from 14% to 12%).
Figure 11.6 also shows that a significant proportion of bullying and/or harassment originated from Clients and is therefore an external source of bullying and/or harassment. However, when compared to the 2007 results there has been a considerable reduction of bullying and harassment from Clients (from 7% to 3%).
The nature of the bullying or harassment experience – specific behaviours
The 2010 Employee Survey also sought information about the specific behaviours involved, for those employees who indicated that they had experienced bullying and/or harassment. Much of the experience reported reflects the trend found in the 2007 survey.
The most frequent forms of bullying and/or harassment experienced from clients were shouting and offensive language, negative, intimidating or aggressive body language, verbal threats and threats or acts of physical violence.
The most frequent forms of bullying and/or harassment experienced from fellow employees were negative, intimidating, or aggressive body language, persistent nit-picking and criticisms, humiliation through sarcasm, criticism or insults. Other forms of bullying or harassment experienced were spreading of gossip or rumours, shouting, offensive language or insults, and being isolated or ostracised.
The most frequent forms of bullying and/or harassment experienced from managers or supervisors were negative, intimidating or aggressive body language, persistent nit-picking and criticism, inequitable treatment compared to other employees, withholding information so that the employee is less able to do the job, being isolated or ostracised and humiliation through sarcasm, criticism or insults.
Note: The figures are expressed as ‘% of all employees’, but do not add up to the total percentage of employees reporting bullying and/or harassment (i.e. 24%), as respondents were allowed to choose more than one category and therefore there is some overlap (i.e. where employees may have experienced bullying and/or harassment from more than one source).
taSManian StatE SERVicE
34
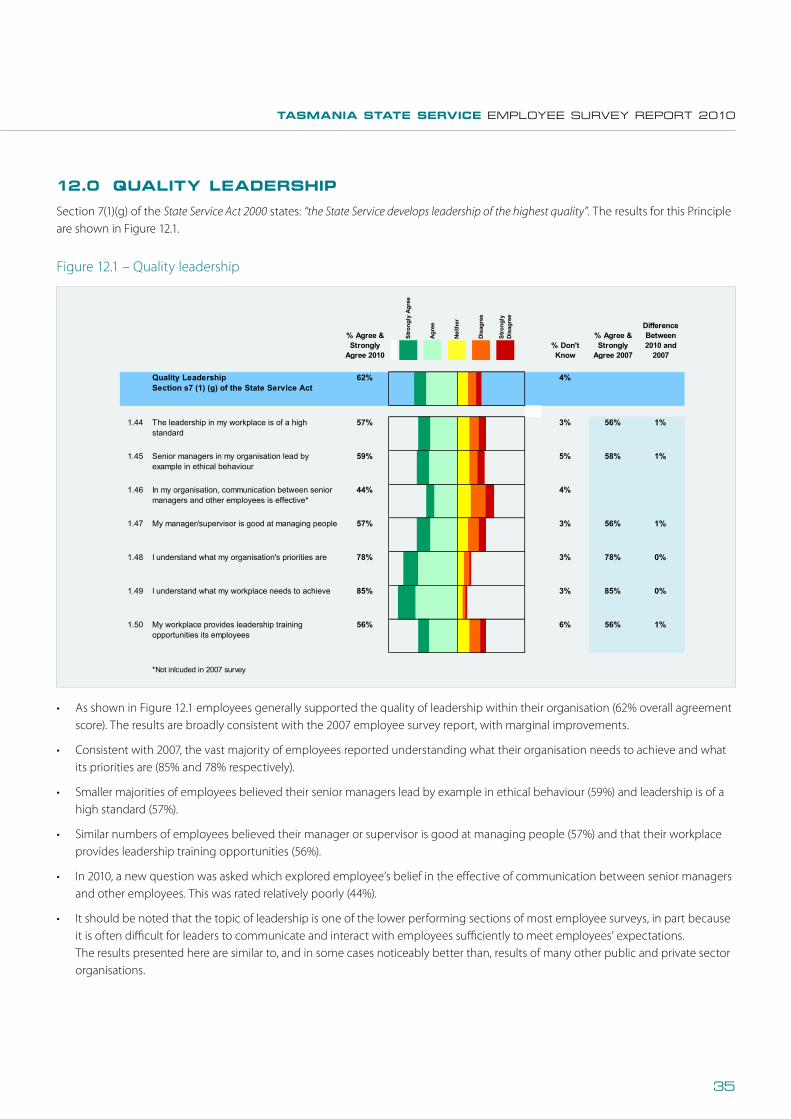
Tasmanian State Service Employee Survey Report 2010 42
12.0 Quality Leadership Section 7(1)(g) of the State Service Act 2000 states: “the State Service develops leadership of the highest quality”. The results for this Principle are shown in Figure 12.1.
Figure 12.1 – Quality leadership
Stro
ngly
% Don't Know
% Agree & Strongly
Agree 2007
Difference Between 2010 and
2007
Stro
ngly
Agr
ee
Agre
e
Neith
er
Disa
gree
Stro
ngly
Di
sagr
ee
% Agree & Strongly
Agree 2010
Quality LeadershipSection s7 (1) (g) of the State Service Act
62% 4%
1.44 The leadership in my workplace is of a high standard
57% 3% 56% 1%
1.45 Senior managers in my organisation lead by example in ethical behaviour
59% 5% 58% 1%
1.46 In my organisation, communication between senior managers and other employees is effective*
44% 4%
1.47 My manager/supervisor is good at managing people 57% 3% 56% 1%
1.48 I understand what my organisation's priorities are 78% 3% 78% 0%
1.49 I understand what my workplace needs to achieve 85% 3% 85% 0%
1.50 My workplace provides leadership training opportunities its employees
56% 6% 56% 1%
*Not inlcuded in 2007 survey
As shown in Figure 12.1 employees generally supported the quality of leadership within their organisation (62% overall agreement score). The results are broadly consistent with the 2007 employee survey report, with marginal improvements.
Consistent with 2007, the vast majority of employees reported understanding what their organisation needs to achieve and what its priorities are (85% and 78% respectively).
Smaller majorities of employees believed their senior managers lead by example in ethical behaviour (59%) and leadership is of a high standard (57%).
Similar numbers of employees believed their manager or supervisor is good at managing people (57%) and that their workplace provides leadership training opportunities (56%).
In 2010, a new question was asked which explored employee’s belief in the effective of communication between senior managers and other employees. This was rated relatively poorly (44%).
It should be noted that the topic of leadership is one of the lower performing sections of most employee surveys, in part because it is often difficult for leaders to communicate and interact with employees sufficiently to meet employees’ expectations. The results presented here are similar to, and in some cases noticeably better than, results of many other public and private sector organisations.
Section 7(1)(g) of the State Service Act 2000 states: “the State Service develops leadership of the highest quality”. The results for this Principle are shown in Figure 12.1.
12.0 quAlIty leAdershIp
Figure 12.1 – Quality leadership
• AsshowninFigure12.1employeesgenerallysupportedthequalityofleadershipwithintheirorganisation(62%overallagreementscore). The results are broadly consistent with the 2007 employee survey report, with marginal improvements.
• Consistentwith2007,thevastmajorityofemployeesreportedunderstandingwhattheirorganisationneedstoachieveandwhatits priorities are (85% and 78% respectively).
• Smallermajoritiesofemployeesbelievedtheirseniormanagersleadbyexampleinethicalbehaviour(59%)andleadershipisofahigh standard (57%).
• Similarnumbersofemployeesbelievedtheirmanagerorsupervisorisgoodatmanagingpeople(57%)andthattheirworkplaceprovides leadership training opportunities (56%).
• In2010,anewquestionwasaskedwhichexploredemployee’sbeliefintheeffectiveofcommunicationbetweenseniormanagersand other employees. This was rated relatively poorly (44%).
• Itshouldbenotedthatthetopicofleadershipisoneofthelowerperformingsectionsofmostemployeesurveys,inpartbecauseit is often difficult for leaders to communicate and interact with employees sufficiently to meet employees’ expectations. The results presented here are similar to, and in some cases noticeably better than, results of many other public and private sector organisations.
tAsMAnIA stAte servICe EMPLOYEE SURVEY REPORt 2010
35

Section 7(1)(h) of the State Service Act 2000 states: “the State Service establishes workplace practices that encourage communication, consultation, cooperation and input from employees on matters that affect their work and workplace”. The results for this Principle are shown in Figure 13.1.
13.0 eMployee ConsultAtIon & Input enCourAged
Figure 13.1 – Employee consultation and input encouraged
• AsshowninFigure13.1,employeesgenerallyagreethatconsultationandinputisencouraged(56%overallagreement).
• Themajorityofemployees(66%)believetheirmanagerorsupervisorisreceptivetoideasputforwardbyemployees.Asmallermajorityofemployees believe input is sought and encouraged (57%) and that their manager or supervisor keeps people informed (59%).
• AlmosthalfoftheService’semployeesbelievethatchangeismanagedwell(43%).Thisissimilarto,andinsomecasesbetterthan,resultsof other recent public sector surveys conducted in other States. However, it should be noted that confidence in change management has decreased compared the 2005 and 2007 survey results.
Tasmanian State Service Employee Survey Report 2010 43
13.0 Employee Consultation & Input Encouraged Section 7(1)(h) of the State Service Act 2000 states: “the State Service establishes workplace practices that encourage communication, consultation, cooperation and input from employees on matters that affect their work and workplace”. The results for this Principle are shown in Figure 13.1.
Figure 13.1 – Employee consultation and input encouraged
Stro
ngly
% Don't Know
% Agree & Strongly
Agree 2007
Difference Between 2010 and
2007
Stro
ngly
Agr
ee
Agre
e
Neith
er
Disa
gree
Stro
ngly
Di
sagr
ee
% Agree & Strongly
Agree 2010
Employee Consultation & Input EncouragedSection s7 (1) (h) of the State Service Act
56% 5%
1.51 Change is managed well in my workplace 43% 5% 44% -1%
1.52 My manager/supervisor is receptive to ideas put forward by employees*
66% 5%
1.53 My manager/supervisor keeps the people in my workplace informed about what is going on
59% 4% 58% 1%
1.54 My input is adequately sought and considered about decisions that directly affect me
57% 4% 57% 0%
*Question not identical and therefore not directly comparable between 2010 and 2007
As shown in Figure 13.1, employees generally agree that consultation and input is encouraged (56% overall agreement).
The majority of employees (66%) believe their manager or supervisor is receptive to ideas put forward by employees. A smaller majority of employees believe input is sought and encouraged (57%) and that their manager or supervisor keeps people informed (59%).
Almost half of the Service’s employees believe that change is managed well (43%). This is similar to, and in some cases better than, results of other recent public sector surveys conducted in other States. However, it should be noted that confidence in change management has decreased compared the 2005 and 2007 survey results.
taSManian StatE SERVicE
36
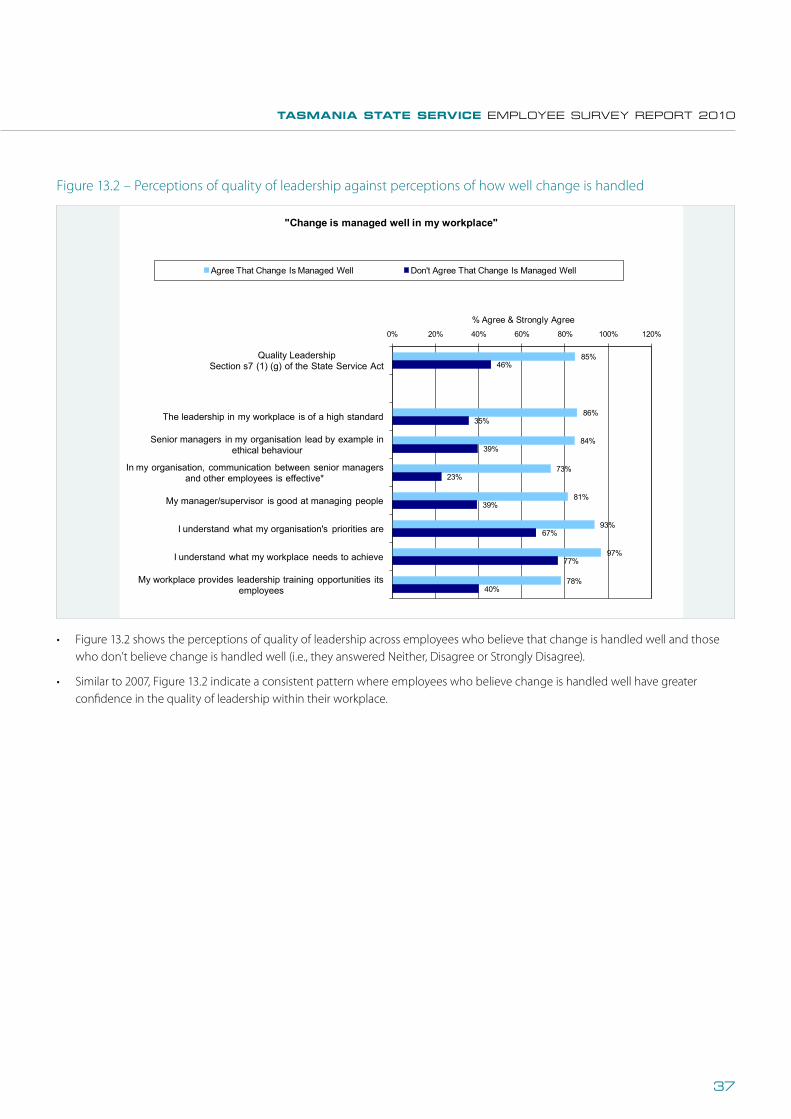
Tasmanian State Service Employee Survey Report 2010 44
Figure 13.2 – Perceptions of quality of leadership against perceptions of how well change is handled
85%
86%
84%
73%
81%
93%
97%
78%
46%
35%
39%
23%
39%
67%
77%
40%
0% 20% 40% 60% 80% 100% 120%
Quality LeadershipSection s7 (1) (g) of the State Service Act
The leadership in my workplace is of a high standard
Senior managers in my organisation lead by example in ethical behaviour
In my organisation, communication between senior managers and other employees is effective*
My manager/supervisor is good at managing people
I understand what my organisation's priorities are
I understand what my workplace needs to achieve
My workplace provides leadership training opportunities its employees
% Agree & Strongly Agree
"Change is managed well in my workplace"
Agree That Change Is Managed Well Don't Agree That Change Is Managed Well
Figure 13.2 shows the perceptions of quality of leadership across employees who believe that change is handled well and those who don’t believe change is handled well (i.e., they answered Neither, Disagree or Strongly Disagree).
Similar to 2007, Figure 13.2 indicate a consistent pattern where employees who believe change is handled well have greater confidence in the quality of leadership within their workplace.
• Figure13.2showstheperceptionsofqualityofleadershipacrossemployeeswhobelievethatchangeishandledwellandthosewho don’t believe change is handled well (i.e., they answered Neither, Disagree or Strongly Disagree).
• Similarto2007,Figure13.2indicateaconsistentpatternwhereemployeeswhobelievechangeishandledwellhavegreaterconfidence in the quality of leadership within their workplace.
Figure 13.2 – Perceptions of quality of leadership against perceptions of how well change is handled
tAsMAnIA stAte servICe EMPLOYEE SURVEY REPORt 2010
37
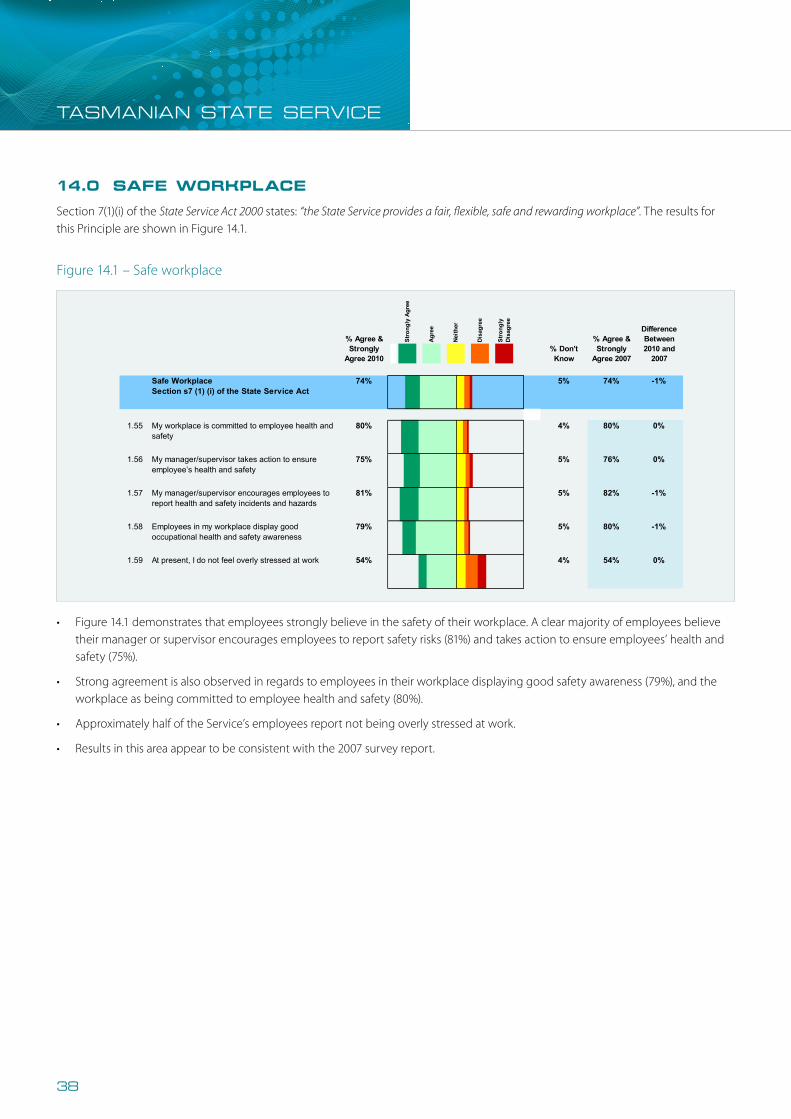
Section 7(1)(i) of the State Service Act 2000 states: “the State Service provides a fair, flexible, safe and rewarding workplace”. The results for this Principle are shown in Figure 14.1.
14.0 sAFe workplACe
• Figure14.1demonstratesthatemployeesstronglybelieveinthesafetyoftheirworkplace.Aclearmajorityofemployeesbelievetheir manager or supervisor encourages employees to report safety risks (81%) and takes action to ensure employees’ health and safety (75%).
• Strongagreementisalsoobservedinregardstoemployeesintheirworkplacedisplayinggoodsafetyawareness(79%),andtheworkplace as being committed to employee health and safety (80%).
• ApproximatelyhalfoftheService’semployeesreportnotbeingoverlystressedatwork.
• Resultsinthisareaappeartobeconsistentwiththe2007surveyreport.
Figure 14.1 – Safe workplace
Tasmanian State Service Employee Survey Report 2010 45
14.0 Safe Workplace Section 7(1)(i) of the State Service Act 2000 states: “the State Service provides a fair, flexible, safe and rewarding workplace”. The results for this Principle are shown in Figure 14.1.
Figure 14.1 – Safe workplace
Stro
ngly
% Don't Know
% Agree & Strongly
Agree 2007
Difference Between 2010 and
2007
Stro
ngly
Agr
ee
Agre
e
Neith
er
Disa
gree
Stro
ngly
Di
sagr
ee
% Agree & Strongly
Agree 2010
Safe WorkplaceSection s7 (1) (i) of the State Service Act
74% 5% 74% -1%
1.55 My workplace is committed to employee health and safety
80% 4% 80% 0%
1.56 My manager/supervisor takes action to ensure employee’s health and safety
75% 5% 76% 0%
1.57 My manager/supervisor encourages employees to report health and safety incidents and hazards
81% 5% 82% -1%
1.58 Employees in my workplace display good occupational health and safety awareness
79% 5% 80% -1%
1.59 At present, I do not feel overly stressed at work 54% 4% 54% 0%
Figure 14.1 demonstrates that employees strongly believe in the safety of their workplace. A clear majority of employees believe their manager or supervisor encourages employees to report safety risks (81%) and takes action to ensure employees’ health and safety (75%).
Strong agreement is also observed in regards to employees in their workplace displaying good safety awareness (79%), and the workplace as being committed to employee health and safety (80%).
Approximately half of the Service’s employees report not being overly stressed at work.
Results in this area appear to be consistent with the 2007 survey report.
taSManian StatE SERVicE
38

Tasmanian State Service Employee Survey Report 2010 46
15.0 Flexible Workplace Section 7(1)(i) of the State Service Act 2000 states: “the State Service provides a fair, flexible, safe and rewarding workplace”. The results for this Principle are shown in Figure 15.1.
Figure 15.1 – Flexible workplace
Stro
ngly
% Don't Know
% Agree & Strongly
Agree 2007
Difference Between 2010 and
2007
Stro
ngly
Agr
ee
Agre
e
Neith
er
Disa
gree
Stro
ngly
Di
sagr
ee
% Agree & Strongly
Agree 2010
Flexible WorkplaceSection s7 (1) (i) of the State Service Act
64% 7% 62% 3%
1.60 My workplace culture supports people to achieve a good work-life balance
60% 5% 59% 2%
1.61 My workplace provides opportunities for me to work part-time if I want to
67% 10% 64% 3%
1.62 My manager/supervisor takes into account the differing needs and circumstances of employees when making decisions
65% 7% 63% 3%
Figure 15.1 shows good support regarding employees’ perception of flexibility in their workplace (64% overall agreement).
Most employees felt that their workplace provides opportunities for them to work part-time (67%), believe their manager or supervisor takes into account the differing needs of employees (65%), and agree that the culture of their workplace supports a good work-life balance (60%).
Results in this area have experienced marginal increases since the 2007 survey, indicating an adoption of further flexible work practices.
Section 7(1)(i) of the State Service Act 2000 states: “the State Service provides a fair, flexible, safe and rewarding workplace”. The results for this Principle are shown in Figure 15.1.
15.0 FlexIBle workplACe
Figure 15.1 – Flexible workplace
• Figure15.1showsgoodsupportregardingemployees’perceptionofflexibilityintheirworkplace(64%overallagreement).
• Mostemployeesfeltthattheirworkplaceprovidesopportunitiesforthemtoworkpart-time(67%),believetheirmanagerorsupervisor takes into account the differing needs of employees (65%), and agree that the culture of their workplace supports a good work-life balance (60%).
• Resultsinthisareahaveexperiencedmarginalincreasessincethe2007survey,indicatinganadoptionoffurtherflexible work practices.
tAsMAnIA stAte servICe EMPLOYEE SURVEY REPORt 2010
39
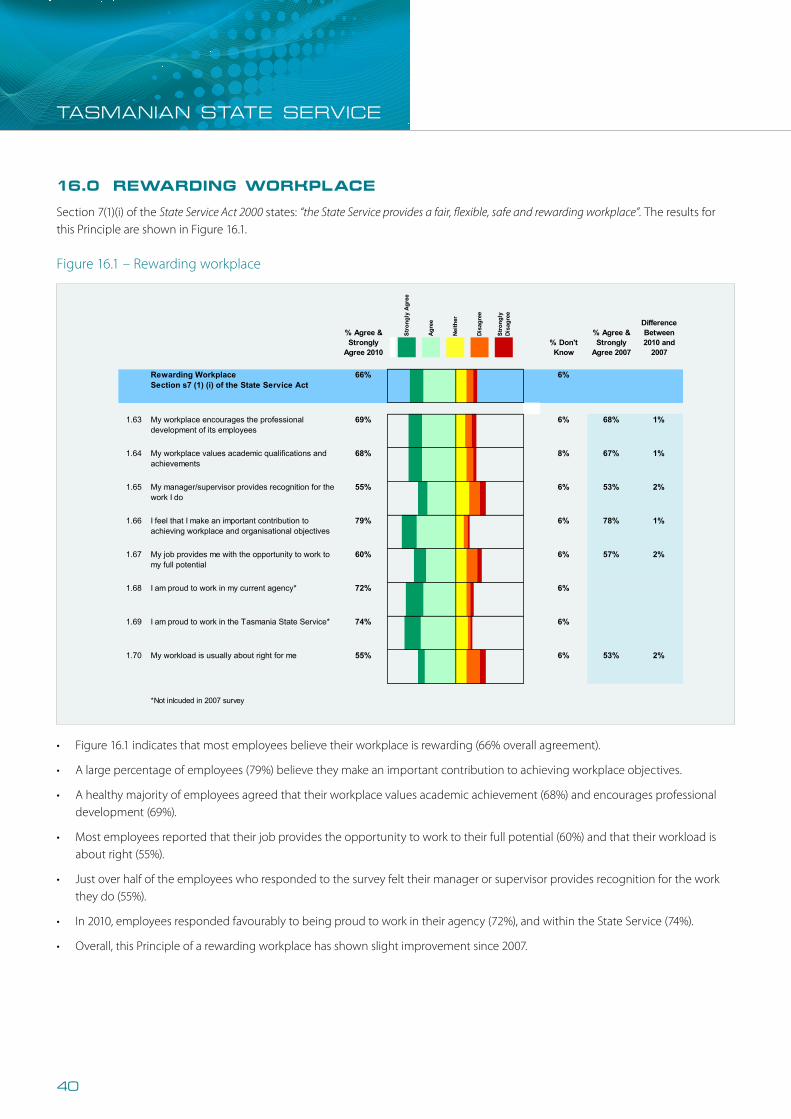
• Figure16.1indicatesthatmostemployeesbelievetheirworkplaceisrewarding(66%overallagreement).
• Alargepercentageofemployees(79%)believetheymakeanimportantcontributiontoachievingworkplaceobjectives.
• Ahealthymajorityofemployeesagreedthattheirworkplacevaluesacademicachievement(68%)andencouragesprofessionaldevelopment (69%).
• Mostemployeesreportedthattheirjobprovidestheopportunitytoworktotheirfullpotential(60%)andthattheirworkloadisabout right (55%).
• Justoverhalfoftheemployeeswhorespondedtothesurveyfelttheirmanagerorsupervisorprovidesrecognitionfortheworkthey do (55%).
• In2010,employeesrespondedfavourablytobeingproudtoworkintheiragency(72%),andwithintheStateService(74%).
• Overall,thisPrincipleofarewardingworkplacehasshownslightimprovementsince2007.
16.0 rewArdIng workplACe
Section 7(1)(i) of the State Service Act 2000 states: “the State Service provides a fair, flexible, safe and rewarding workplace”. The results for this Principle are shown in Figure 16.1.
Figure 16.1 – Rewarding workplace
Tasmanian State Service Employee Survey Report 2010 47
16.0 Rewarding Workplace Section 7(1)(i) of the State Service Act 2000 states: “the State Service provides a fair, flexible, safe and rewarding workplace”. The results for this Principle are shown in Figure 16.1.
Figure 16.1 – Rewarding workplace
Stro
ngly
% Don't Know
% Agree & Strongly
Agree 2007
Difference Between 2010 and
2007
Stro
ngly
Agr
ee
Agre
e
Neith
er
Disa
gree
Stro
ngly
Di
sagr
ee
% Agree & Strongly
Agree 2010
Rewarding WorkplaceSection s7 (1) (i) of the State Service Act
66% 6%
1.63 My workplace encourages the professional development of its employees
69% 6% 68% 1%
1.64 My workplace values academic qualifications and achievements
68% 8% 67% 1%
1.65 My manager/supervisor provides recognition for the work I do
55% 6% 53% 2%
1.66 I feel that I make an important contribution to achieving workplace and organisational objectives
79% 6% 78% 1%
1.67 My job provides me with the opportunity to work to my full potential
60% 6% 57% 2%
1.68 I am proud to work in my current agency* 72% 6%
1.69 I am proud to work in the Tasmania State Service* 74% 6%
1.70 My workload is usually about right for me 55% 6% 53% 2%
*Not inlcuded in 2007 survey
Figure 16.1 indicates that most employees believe their workplace is rewarding (66% overall agreement).
A large percentage of employees (79%) believe they make an important contribution to achieving workplace objectives.
A healthy majority of employees agreed that their workplace values academic achievement (68%) and encourages professional development (69%).
Most employees reported that their job provides the opportunity to work to their full potential (60%) and that their workload is about right (55%).
Just over half of the employees who responded to the survey felt their manager or supervisor provides recognition for the work they do (55%).
In 2010, employees responded favourably to being proud to work in their agency (72%), and within the State Service (74%).
Overall, this Principle of a rewarding workplace has shown slight improvement since 2007.
taSManian StatE SERVicE
40
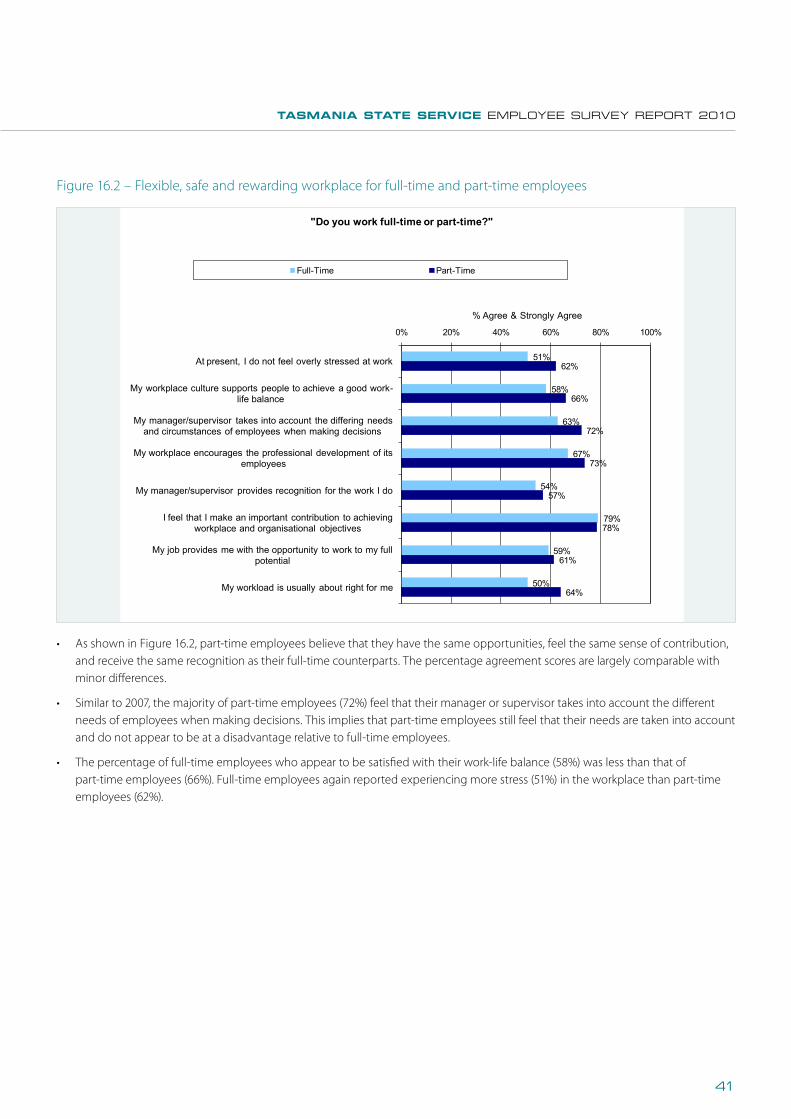
Tasmanian State Service Employee Survey Report 2010 48
Figure 16.2 – Flexible, safe and rewarding workplace for full-time and part-time employees
As shown in Figure 16.2, part-time employees believe that they have the same opportunities, feel the same sense of contribution, and receive the same recognition as their full-time counterparts. The percentage agreement scores are largely comparable with minor differences.
Similar to 2007, the majority of part-time employees (72%) feel that their manager or supervisor takes into account the different needs of employees when making decisions. This implies that part-time employees still feel that their needs are taken into account and do not appear to be at a disadvantage relative to full-time employees.
The percentage of full-time employees who appear to be satisfied with their work-life balance (58%) was less than that of part-time employees (66%). Full-time employees again reported experiencing more stress (51%) in the workplace than part-time employees (62%).
51%
58%
63%
67%
54%
79%
59%
50%
62%
66%
72%
73%
57%
78%
61%
64%
0% 20% 40% 60% 80% 100%
At present, I do not feel overly stressed at work
My workplace culture supports people to achieve a good work-life balance
My manager/supervisor takes into account the differing needs and circumstances of employees when making decisions
My workplace encourages the professional development of its employees
My manager/supervisor provides recognition for the work I do
I feel that I make an important contribution to achieving workplace and organisational objectives
My job provides me with the opportunity to work to my full potential
My workload is usually about right for me
% Agree & Strongly Agree
"Do you work full-time or part-time?"
Full-Time Part-Time
Figure 16.2 – Flexible, safe and rewarding workplace for full-time and part-time employees
• AsshowninFigure16.2,part-timeemployeesbelievethattheyhavethesameopportunities,feelthesamesenseofcontribution,and receive the same recognition as their full-time counterparts. The percentage agreement scores are largely comparable with minor differences.
• Similarto2007,themajorityofpart-timeemployees(72%)feelthattheirmanagerorsupervisortakesintoaccountthedifferentneeds of employees when making decisions. This implies that part-time employees still feel that their needs are taken into account and do not appear to be at a disadvantage relative to full-time employees.
• Thepercentageoffull-timeemployeeswhoappeartobesatisfiedwiththeirwork-lifebalance(58%)waslessthanthatofpart-time employees (66%). Full-time employees again reported experiencing more stress (51%) in the workplace than part-time employees (62%).
tAsMAnIA stAte servICe EMPLOYEE SURVEY REPORt 2010
41

• AsFigure16.3suggests,theredoesnotappeartobeamarkeddifferenceinthereportofflexible,safeandrewardingworkplacebetween those employees with caring responsibilities and those without caring responsibilities. The pattern of scores is very similar for both groups.
• Aslightlyhigherpercentageofemployeeswithcaringresponsibilities(68%,vs65%forthosewithnocaringresponsibilities)agreethat part-time opportunities are available to them.
• However,feweremployeeswithcaringresponsibilitiesfeel(56%)thattheirworkplaceculturesupportspeopletoachieveagoodwork-life balance (62% for those with no caring responsibilities).
• Thistrendissimilartotheresultsreportedin2007.
Figure 16.3 – Flexible, safe and rewarding workplace for employees with and without caring responsibilities
Tasmanian State Service Employee Survey Report 2010 49
Figure 16.3 – Flexible, safe and rewarding workplace for employees with and without caring responsibilities
51%
56%
68%
62%
78%
59%
53%
55%
62%
65%
66%
79%
59%
55%
0% 20% 40% 60% 80% 100%
At present, I do not feel overly stressed at work
My workplace culture supports people to achieve a good work-life balance
My workplace provides opportunities for me to work part-time if I want to
My manager/supervisor takes into account the differing needs and circumstances of employees when making decisions
I feel that I make an important contribution to achieving workplace and organisational objectives
My job provides me with the opportunity to work to my full potential
My workload is usually about right for me
% Agree & Strongly Agree
"Do you spend some time each week providing care for another person"
Yes - Caring Responsibilities No - No Caring Responsibilities
As Figure 16.3 suggests, there does not appear to be a marked difference in the report of flexible, safe and rewarding workplace between those employees with caring responsibilities and those without caring responsibilities. The pattern of scores is very similar for both groups.
A slightly higher percentage of employees with caring responsibilities (68%, vs 65% for those with no caring responsibilities) agree that part-time opportunities are available to them.
However, fewer employees with caring responsibilities feel (56%) that their workplace culture supports people to achieve a good work-life balance (62% for those with no caring responsibilities).
This trend is similar to the results reported in 2007.
taSManian StatE SERVicE
42

Tasmanian State Service Employee Survey Report 2010 50
17.0 Fair Internal Grievance Resolution System Section 7(1)(m) of the State Service Act 2000 states: “the State Service provides a fair system of review of decisions taken in respect of employees”. The results for this Principle are shown in Figure 17.1.
Figure 17.1 – Fair internal grievance resolution system
Stro
ngly
% Don't Know
% Agree & Strongly
Agree 2007
Difference Between 2010 and
2007
Stro
ngly
Agr
ee
Agre
e
Neith
er
Disa
gree
Stro
ngly
Di
sagr
ee
% Agree & Strongly
Agree 2010
Fair Internal Grievance Resolution SystemSection s7 (1) (m) of the State Service Act
59% 10% 57% 2%
1.71 My workplace has a formal process or procedure for resolving grievances and disputes
81% 11% 78% 3%
1.72 I have confidence in the procedures and processes that my organisation uses to resolve employee grievances
48% 11% 46% 2%
1.73 My manager/supervisor is skilled enough to effectively resolve grievances and disputes that arises in my workplace
54% 10% 51% 3%
1.74 I would be comfortable approaching my manager//supervisor to discuss a workplace grievance or dispute
68% 6% 67% 1%
1.75 I feel confident that if I lodge a grievance, I will not suffer any negative consequences
45% 10% 44% 1%
Figure 17.1 indicates that while employees generally felt that their workplace provides a fair internal grievance resolution system (59% overall agreement) they provided varied opinions regarding specific components of the internal grievance resolution system.
A very clear majority of employees (81%) agreed that their workplace has formal grievance processes in place, up from 78% in 2007.
68% of employees reported being comfortable approaching their manager or supervisor to discuss a workplace grievance or dispute. More than half of all employees (54%) believed their manager or supervisor was skilled enough to resolve grievances and disputes.
However, less than half of all employees (48%) report confidence in their agency’s grievance procedures and only 45% felt that they would not suffer any negative consequences if they lodged a grievance. Despite lower scores, these results are similar to results found by other States in their employee surveys.
The overall results for this Principle have improved since 2007, indicating that employees are showing greater confidence in the internal grievance resolution process within the State Service.
• Figure17.1indicatesthatwhileemployeesgenerallyfeltthattheirworkplaceprovidesafairinternalgrievanceresolutionsystem(59% overall agreement) they provided varied opinions regarding specific components of the internal grievance resolution system.
• Averyclearmajorityofemployees(81%)agreedthattheirworkplacehasformalgrievanceprocessesinplace,upfrom78%in2007.
• 68%ofemployeesreportedbeingcomfortableapproachingtheirmanagerorsupervisortodiscussaworkplacegrievanceordispute. More than half of all employees (54%) believed their manager or supervisor was skilled enough to resolve grievances and disputes.
• However,lessthanhalfofallemployees(48%)reportconfidenceintheiragency’sgrievanceproceduresandonly45%feltthatthey would not suffer any negative consequences if they lodged a grievance. Despite lower scores, these results are similar to results found by other States in their employee surveys.
• TheoverallresultsforthisPrinciplehaveimprovedsince2007,indicatingthatemployeesareshowinggreaterconfidenceintheinternal grievance resolution process within the State Service.
17.0 FAIr InternAl grIevAnCe resolutIon systeM
Section 7(1)(m) of the State Service Act 2000 states: “the State Service provides a fair system of review of decisions taken in respect of employees”. The results for this Principle are shown in Figure 17.1.
Figure 17.1 – Fair internal grievance resolution system
tAsMAnIA stAte servICe EMPLOYEE SURVEY REPORt 2010
43
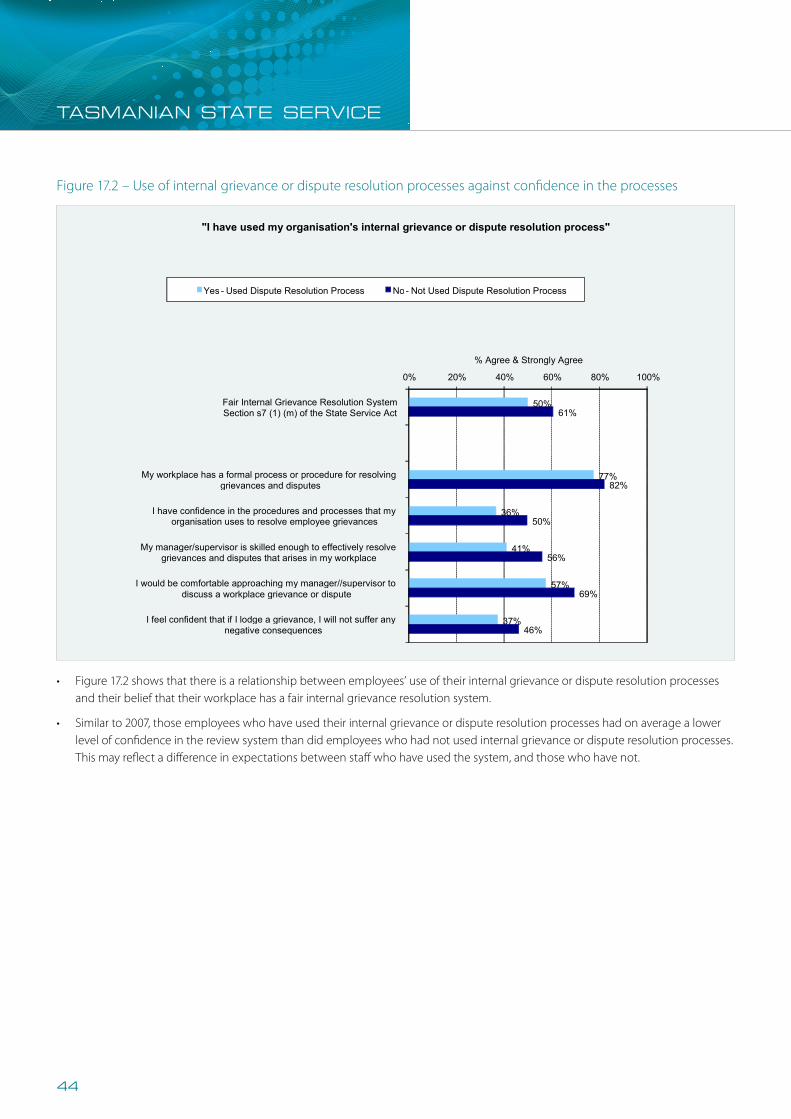
• Figure17.2showsthatthereisarelationshipbetweenemployees’useoftheirinternalgrievanceordisputeresolutionprocessesand their belief that their workplace has a fair internal grievance resolution system.
• Similarto2007,thoseemployeeswhohaveusedtheirinternalgrievanceordisputeresolutionprocesseshadonaveragealowerlevel of confidence in the review system than did employees who had not used internal grievance or dispute resolution processes. This may reflect a difference in expectations between staff who have used the system, and those who have not.
Figure 17.2 – Use of internal grievance or dispute resolution processes against confidence in the processes
Tasmanian State Service Employee Survey Report 2010 51
Figure 17.2 – Use of internal grievance or dispute resolution processes against confidence in the processes
Figure 17.2 shows that there is a relationship between employees’ use of their internal grievance or dispute resolution processes and their belief that their workplace has a fair internal grievance resolution system.
Similar to 2007, those employees who have used their internal grievance or dispute resolution processes had on average a lower level of confidence in the review system than did employees who had not used internal grievance or dispute resolution processes. This may reflect a difference in expectations between staff who have used the system, and those who have not.
50%
77%
36%
41%
57%
37%
61%
82%
50%
56%
69%
46%
0% 20% 40% 60% 80% 100%
Fair Internal Grievance Resolution System Section s7 (1) (m) of the State Service Act
My workplace has a formal process or procedure for resolving grievances and disputes
I have confidence in the procedures and processes that my organisation uses to resolve employee grievances
My manager/supervisor is skilled enough to effectively resolve grievances and disputes that arises in my workplace
I would be comfortable approaching my manager//supervisor to discuss a workplace grievance or dispute
I feel confident that if I lodge a grievance, I will not suffer any negative consequences
% Agree & Strongly Agree
"I have used my organisation's internal grievance or dispute resolution process"
Yes - Used Dispute Resolution Process No - Not Used Dispute Resolution Process
taSManian StatE SERVicE
44
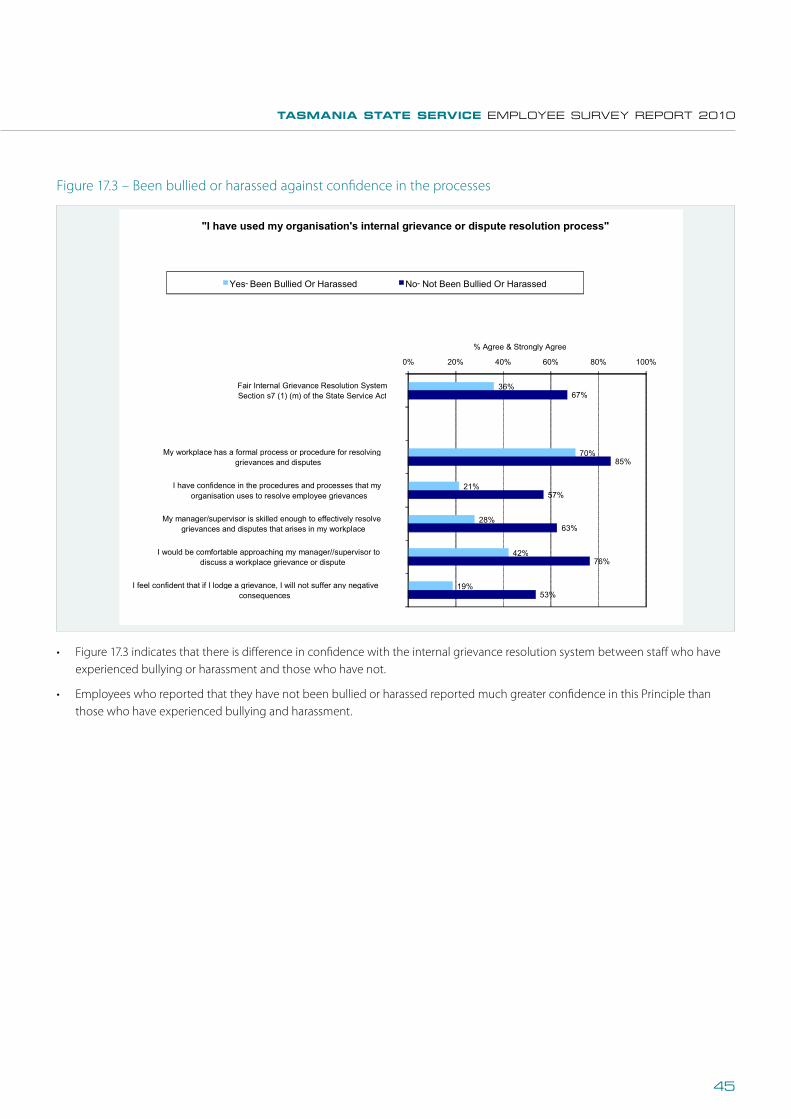
Tasmanian State Service Employee Survey Report 2010 52
Figure 17.3 – Been bullied or harassed against confidence in the processes
Figure 17.3 indicates that there is difference in confidence with the internal grievance resolution system between staff who have experienced bullying or harassment and those who have not.
Employees who reported that they have not been bullied or harassed reported much greater confidence in this Principle than those who have experienced bullying and harassment.
36%
70%
21%
28%
42%
19%
67%
85%
57%
63%
76%
53%
0% 20% 40% 60% 80% 100%
Fair Internal Grievance Resolution System Section s7 (1) (m) of the State Service Act
My workplace has a formal process or procedure for resolving grievances and disputes
I have confidence in the procedures and processes that my organisation uses to resolve employee grievances
My manager/supervisor is skilled enough to effectively resolve grievances and disputes that arises in my workplace
I would be comfortable approaching my manager//supervisor to discuss a workplace grievance or dispute
I feel confident that if I lodge a grievance, I will not suffer any negative consequences
% Agree & Strongly Agree
"I have used my organisation's internal grievance or dispute resolution process"
Yes - Been Bullied Or Harassed No - Not Been Bullied Or Harassed
Figure 17.3 – Been bullied or harassed against confidence in the processes
• Figure17.3indicatesthatthereisdifferenceinconfidencewiththeinternalgrievanceresolutionsystembetweenstaffwhohaveexperienced bullying or harassment and those who have not.
• EmployeeswhoreportedthattheyhavenotbeenbulliedorharassedreportedmuchgreaterconfidenceinthisPrinciplethanthose who have experienced bullying and harassment.
tAsMAnIA stAte servICe EMPLOYEE SURVEY REPORt 2010
45

18.0 AddItIonAl results
This section of the report presents survey results that may not be directly linked to any particular Principle.
18.1 Part 2 of the survey
Figure 18.1 shows employees’ responses to all of Part 2 of the survey (some of which has also been presented earlier in this report) in which employees answered the listed questions based on their personal experiences over the 12 months prior to the survey.
Almost all employees answered Part 2 of the survey, with over 90% of employees indicating a yes or no response to each question.
Notable results shown in Figure 18.1 include 30% (up from 28% in 2007) of employees have participated on a selection panel, 52% of employees had a performance management discussion with their manager/supervisor (up from 38% in 2007), and only 11% of employees have used their organisation’s grievance or dispute resolution processes and is consistent with the 2007 results.
Figure 18.1 – Response distributions for Part 2 of the survey
Tasmanian State Service Employee Survey Report 2010 54
Figure 18.1 – Response distributions for Part 2 of the survey
Stro
ngly
% Yes 2010
Yes
No
% Don't Know % Yes 2007
Difference Between 2010 and
2007
2.01 I have been provided with information about the State Service Principles
49% 6% 47% 1%
2.02 I have been provided with information about the State Service Code of Conduct
54% 6% 53% 1%
2.03 I have applied for a job within the State Service and been successful
35% 8% 34% 1%
2.04 I have applied for a job within the State Service and been unsuccessful
20% 7% 20% 0%
2.05 I have attended a post selection feedback session following an application for a job
14% 7% 13% 1%
2.06 I have participated on a selection panel 30% 6% 28% 1%
2.07 I have participated in a formal 'sit-down' performance management discussion with my manager/supervisor
52% 6% 38% 14%
2.08 My performance management discussion with my manager/supervisor followed the process outlined in my organisation's performance management system *
90% 88% 2%
2.09 I found my performance management discussion with my manager/supervisor to be beneficial *
79% 77% 2%
2.10 I have used my organisation's grievance or dispute resolution process
11% 7% 11% 0%
2.11 I have taken more than two continuous weeks of any type of leave for recreational purposes
53% 9% 52% 2%
2.12 I have been bullied and/or harassed in my workplace 24% 7% 28% -4%
2.13 (a) 1
If you have been bullied or harassed in your workplace, did you formally report your concern to someone in authority within the organisation verbally? **
66% 69% -3%
2.13 (a) 2
If you have been bullied or harassed in your workplace, did you formally report your concern to someone in authority within the organisation in writing? **
25% 27% -2%
2.13 (b) Were you satisfied with how this matter was dealt with by the organisation? **
23% 28% -5%
* Percentage of respondents answering "Yes" who also answered "Yes" to Q2.07
** Percentage of respondents answering "Yes" who also answered "Yes" to Q2.12
taSManian StatE SERVicE
46

Tasmanian State Service Employee Survey Report 2010 55
18.2 Top 10 and bottom 10 items compared to the 2007 survey
One of the advantages of having run two consecutive surveys is that it enables historical benchmarking of data comparing results between the 2007 employee survey and the 2010 survey. For each category or item where a direct comparison could be made, the results from the 2007 survey and the difference between the 2010 and 2007 scores have been listed throughout this report. Figures 18.2 and 18.3 below identify the top 10 and bottom 10 changes between the two surveys. Of the top 10 changes, the first two relate to the improved agreement that the State Service has a formal performance management system, and managers/supervisors providing performance feedback. The other notable change is the improved perception regarding the process and the skill in which managers/supervisors employ to resolve disputes and grievances. Of the bottom 10 changes, it is important to note that only marginal decreases were observed in this year’s survey compared to 2007 results. Reduced confidence were observed in providing more public job advertisements, and providing more vacancies for the people outside of the State Service to apply for. Lower agreements are also observed in the OH&S awareness, and the encouragement of incident and hazard reporting.
Figure 18.2 – Top 10 changes since the 2007 survey
Stro
ngly
% Don't Know
% Agree & Strongly
Agree 2007
Difference Between 2010 and
2007
% Agree & Strongly
Agree 2010
Stro
ngly
Agr
ee
Agr
ee
Nei
ther
Dis
agre
e
Stro
ngly
D
isag
ree
1.16 My organisation has a formal performance management system
72% 8% 63% 9%
1.18 My manager/supervisor gives me enough feedback on my performance to ensure that I understand the results that he or she requires
60% 1% 56% 4%
1.01 I am aware of the State Service Principles (in the State Service Act 2000 )
82% 2% 79% 4%
1.61 My workplace provides opportunities for me to work part-time if I want to
67% 10% 64% 3%
1.37 Working part-time or using other flexible work options is not a barrier to success (including career progression ) in my workplace
65% 6% 61% 3%
1.17 My manager/supervisor is committed to managing employees so as to ensure that they perform their work well
66% 1% 63% 3%
1.71 My workplace has a formal process or procedure for resolving grievances and disputes
81% 11% 78% 3%
1.62 My manager/supervisor takes into account the differing needs and circumstances of employees when making decisions
65% 7% 63% 3%
1.35 Having a disability is not a barrier to success in my workplace
67% 8% 64% 3%
1.73 My manager/supervisor is skilled enough to effectively resolve grievances and disputes that arises in my workplace
54% 10% 51% 3%
.
One of the advantages of having run two consecutive surveys is that it enables historical benchmarking of data comparing results between the 2007 employee survey and the 2010 survey. For each category or item where a direct comparison could be made, the results from the 2007 survey and the difference between the 2010 and 2007 scores have been listed throughout this report. Figures 18.2 and 18.3 below identify the top 10 and bottom 10 changes between the two surveys.
Of the top 10 changes, the first two relate to the improved agreement that the State Service has a formal performance management system, and managers/supervisors providing performance feedback. The other notable change is the improved perception regarding the process and the skill in which managers/supervisors employ to resolve disputes and grievances.
Of the bottom 10 changes, it is important to note that only marginal decreases were observed in this year’s survey compared to 2007 results. Reduced confidence were observed in providing more public job advertisements, and providing more vacancies for the people outside of the State Service to apply for. Lower agreements are also observed in the OH&S awareness, and the encouragement of incident and hazard reporting.
18.2 Top 10 and bottom 10 items compared to the 2007 survey
Figure 18.2 – Top 10 changes since the 2007 survey
tAsMAnIA stAte servICe EMPLOYEE SURVEY REPORt 2010
47

18.3 Gap analysis
Figure 18.4 highlights the potential priorities for attention if the State Service wishes to improve employees’ overall evaluation of the Principles being upheld in their workplace. The 14 Principles in the survey are plotted on two axes. The vertical axis shows the relative agreement that employees reported in each of the 14 categories. The horizontal axis shows the strength of relationship (using statistical correlations) between how people rated the 14 Principles and their overall evaluation.
The benefit of such an analysis is that it allows identification of possible gaps between how well the Principles were scored and how important they appear to be for employees. Those Principles that appear within the oval in Figure 18.4 show an acceptable match between how well they were scored and how important they may be.
If the State Service wishes to improve employees’ overall evaluation of the Principles, those Principles in the bottom right corner of Figure 18.4 are potential priorities for action given they are closely associated with employees’ overall evaluation of the Principles but show some of the lowest scores. Figure 18.4 suggests the highest priorities for action may be improving the Principles of Managing Performance, Employment Based On Merit, Fair Internal Grievance Resolution System, Employee Consultation and Input Encouraged, Rewarding Workplace, and Quality Leadership.
Figure 18.3 – Bottom 10 changes since the 2007 survey
Tasmanian State Service Employee Survey Report 2010 56
Figure 18.3 – Bottom 10 changes since the 2007 survey
1.28 Most job vacancies that arise in my workplace are advertised publicly (e.g. gazette, on the jobsite and/or in the newspaper )
83% 4% 85% -2%
1.57 My manager/supervisor encourages employees to report health and safety incidents and hazards
81% 5% 82% -1%
1.58 Employees in my workplace display good occupational health and safety awareness
79% 5% 80% -1%
1.29 People outside the State Service have a reasonable opportunity to apply for vacant positions/jobs in my workplace
74% 5% 75% -1%
1.51 Change is managed well in my workplace 43% 5% 44% -1%
1.12 In my workplace, we use feedback from our customers and clients to improve the services we deliver
65% 2% 66% -1%
1.10 My workplace strives to match services to customer needs
81% 1% 82% -1%
1.42 My workplace is free of bullying and/or harassment 50% 6% 51% -1%
1.09 Employees in my workplace take responsibility for their decisions and actions
69% 1% 69% -1%
1.56 My manager/supervisor takes action to ensure employee’s health and safety
75% 5% 76% 0%
Stro
ngly
% Don't Know
% Agree & Strongly
Agree 2007
Difference Between 2010 and
2007
% Agree & Strongly
Agree 2010
Stro
ngly
Agr
ee
Agr
ee
Nei
ther
Dis
agre
e
Stro
ngly
D
isag
ree
18.3 Gap analysis
Figure 18.4 highlights the potential priorities for attention if the State Service wishes to improve employees’ overall evaluation of the Principles being upheld in their workplace. The 14 Principles in the survey are plotted on two axes. The vertical axis shows the relative agreement that employees reported in each of the 14 categories. The horizontal axis shows the strength of relationship (using statistical correlations) between how people rated the 14 Principles and their overall evaluation. The benefit of such an analysis is that it allows identification of possible gaps between how well the Principles were scored and how important they appear to be for employees. Those Principles that appear within the oval in Figure 18.4 show an acceptable match between how well they were scored and how important they may be. If the State Service wishes to improve employees’ overall evaluation of the Principles, those Principles in the bottom right corner of Figure 18.4 are potential priorities for action given they are closely associated with employees’ overall evaluation of the Principles but show some of the lowest scores. Figure 18.4 suggests the highest priorities for action may be improving the Principles of Managing Performance, Employment Based On Merit, Fair Internal Grievance Resolution System, Employee Consultation and Input Encouraged, Rewarding Workplace, and Quality Leadership.
taSManian StatE SERVicE
48
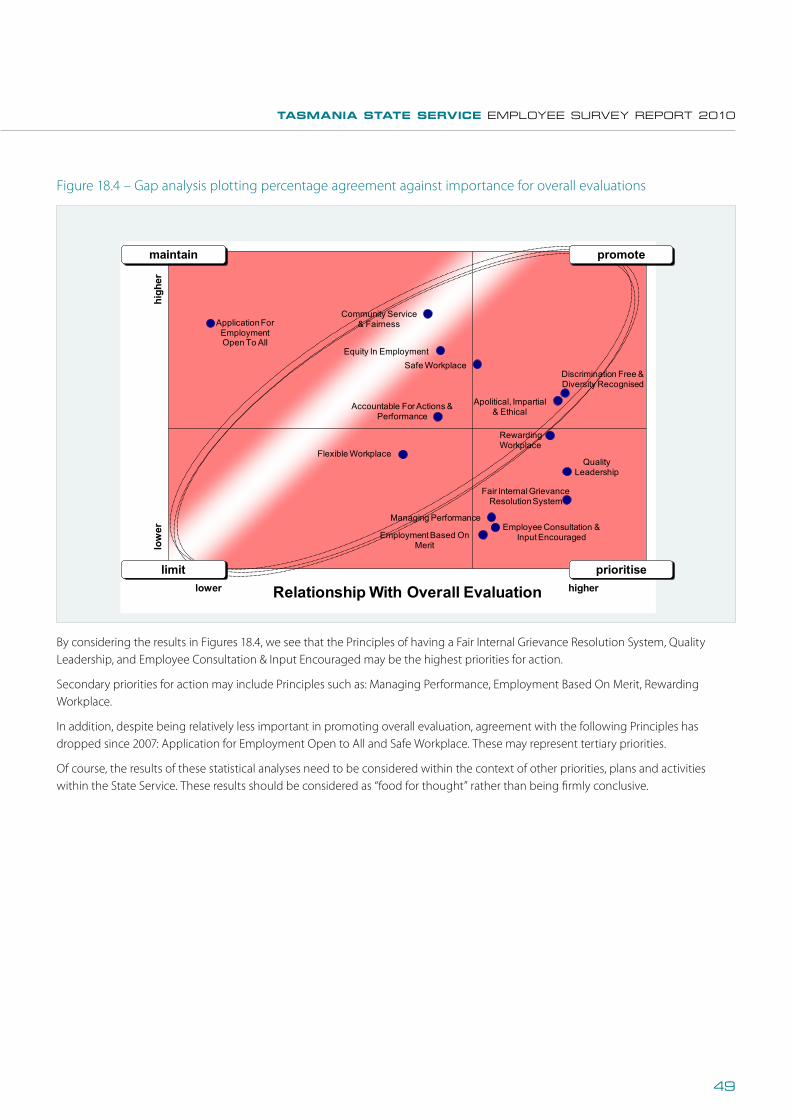
Figure 18.4 – Gap analysis plotting percentage agreement against importance for overall evaluations
Tasmanian State Service Employee Survey Report 2010 57
Figure 18.4 – Gap analysis plotting percentage agreement against importance for overall evaluations
Apolitical, Impartial & EthicalAccountable For Actions &
Performance
Community Service & Fairness
Managing Performance
Employment Based On Merit
Application For Employment Open To All
Equity In Employment
Discrimination Free & Diversity Recognised
Quality Leadership
Employee Consultation & Input Encouraged
Safe Workplace
Flexible Workplace
Rewarding Workplace
Fair Internal Grievance Resolution System
Relationship With Overall Evaluation higherlower
low
erhi
gher
maintain
prioritise
promote
limit
By considering the results in Figures 18.4, we see that the Principles of having a Fair Internal Grievance Resolution System, Quality Leadership, and Employee Consultation & Input Encouraged may be the highest priorities for action. Secondary priorities for action may include Principles such as: Managing Performance, Employment Based On Merit, Rewarding Workplace. In addition, despite being relatively less important in promoting overall evaluation, agreement with the following Principles has dropped since 2007: Application for Employment Open to All and Safe Workplace. These may represent tertiary priorities. Of course, the results of these statistical analyses need to be considered within the context of other priorities, plans and activities within the State Service. These results should be considered as “food for thought” rather than being firmly conclusive.
By considering the results in Figures 18.4, we see that the Principles of having a Fair Internal Grievance Resolution System, Quality Leadership, and Employee Consultation & Input Encouraged may be the highest priorities for action.
Secondary priorities for action may include Principles such as: Managing Performance, Employment Based On Merit, Rewarding Workplace.
In addition, despite being relatively less important in promoting overall evaluation, agreement with the following Principles has dropped since 2007: Application for Employment Open to All and Safe Workplace. These may represent tertiary priorities.
Of course, the results of these statistical analyses need to be considered within the context of other priorities, plans and activities within the State Service. These results should be considered as “food for thought” rather than being firmly conclusive.
tAsMAnIA stAte servICe EMPLOYEE SURVEY REPORt 2010
49
Contents oF thIs Cd
1. State Service Employee Survey 2010
2. Agency Summary Reports
Department of Economic Development, Tourism and the Arts
Department of Education
Department of Health and Human Services
Department of Infrastructure, Energy and Resources
DepartmentofJustice
Department of Police and Emergency Management
Department of Premier and Cabinet
Department of Primary Industries, Parks, Water and the Environment
Department of Treasury and Finance
Tasmanian Audit Office
Port Arthur Historic Site Management Authority
Tasmanian Academy
Tasmanian Polytechnic
Tasmanian Skills Institute
The Public Trustee
3. State Service Employee Survey 2007
4. State Service Principles
5. Commissioner’s Direction No. 2 – State Service Principles
6. State Service Code of Conduct
7. Commissioner’s Direction No. 5 – Procedures for Investigation and Determination of whether an employee has breached the Code of Conduct
8. State Service Commissioner’s Annual Report 2008-2009
9. State Service Commissioner’s Annual Report 2009-2010
taSManian StatE SERVicE
50

Report Produced By:
The Office of the State Service Commissioner
Published November 2010
Copyright – Office of the State Service Commissioner
Contributing Authors:
Nick Vrisakis, Charlie Zhang, Dr Peter Langford
Voice Project
Print: ISSN 1833-0703
Permission to copy is granted provided the source is acknowledged
Contact: Office of the State Service Commissioner
Level 2/144-148 Macquarie Street
GPO Box 621, Hobart, 7001
Tasmania, Australia
Telephone: 03 6233 3637
Email: [email protected]
Facsimile: 03 6233 2693

conducted by:
THE OFFICE OF THE sTaTE sErvICE COmmIssIOnEr
Office of the State Service Commissioner
Level 2/144 Macquarie Street
GPO Box 621, Hobart 7001
Tasmania, Australia
Web: www.ossc.tas.gov.au
Phone: 03 6232 7007
Fax: 03 6233 2693
Email: [email protected]
sUrvEY rEPOrT
tASMAnIAn StAte SeRVIceEmPLOYEE sUrvEY
2010