Embed Size (px)
Citation preview

2010 Fact Book
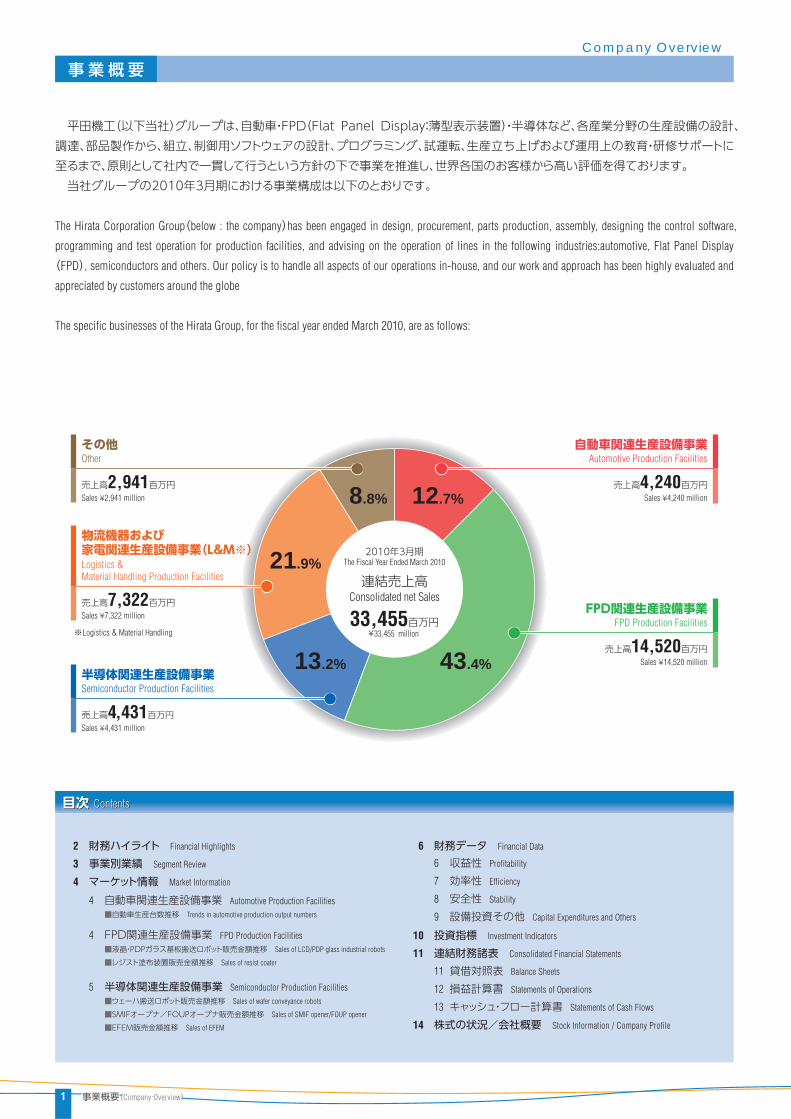
事業概要事業概要(Company OverviewCompany Overview)1 事業概要(Company Overview)
12.7%
43.4%13.2%
21.9%
8.8%
自動車関連生産設備事業Automotive Production Facilities
売上高4,240百万円Sales ¥4,240 million
FPD関連生産設備事業FPD Production Facilities
売上高14,520百万円Sales ¥14,520 million
物流機器および家電関連生産設備事業(L&M※)Logistics & Material Handling Production Facilities
売上高7,322百万円Sales ¥7,322 million
半導体関連生産設備事業Semiconductor Production Facilities
売上高4,431百万円Sales ¥4,431 million
その他Other
売上高2,941百万円Sales ¥2,941 million
2010年3月期The Fiscal Year Ended March 2010
連結売上高Consolidated net Sales
33,455百万円¥33,455 million ※Logistics & Material Handling
事業概要Company Overview
平田機工(以下当社)グループは、自動車・FPD(Flat Panel Display:薄型表示装置)・半導体など、各産業分野の生産設備の設計、調達、部品製作から、組立、制御用ソフトウェアの設計、プログラミング、試運転、生産立ち上げおよび運用上の教育・研修サポートに至るまで、原則として社内で一貫して行うという方針の下で事業を推進し、世界各国のお客様から高い評価を得ております。 当社グループの2010年3月期における事業構成は以下のとおりです。
The Hirata Corporation Group(below : the company)has been engaged in design, procurement, parts production, assembly, designing the control software,
programming and test operation for production facilities, and advising on the operation of lines in the following industries:automotive, Flat Panel Display
(FPD), semiconductors and others. Our policy is to handle all aspects of our operations in-house, and our work and approach has been highly evaluated and
appreciated by customers around the globe
The specific businesses of the Hirata Group, for the fiscal year ended March 2010, are as follows:
目次 Contents目次 Contents
2
3
4
財務ハイライト Financial Highlights
事業別業績 Segment Review
マーケット情報 Market Information
4
4
5
自動車関連生産設備事業 Automotive Production Facilities
FPD関連生産設備事業 FPD Production Facilities
半導体関連生産設備事業 Semiconductor Production Facilities
6
10
11
14
財務データ Financial Data
投資指標 Investment Indicators
連結財務諸表 Consolidated Financial Statements
株式の状況/会社概要 Stock Information / Company Profile
6
7
8
9
収益性 Profitability
効率性 Efficiency
安全性 Stability
設備投資その他 Capital Expenditures and Others
11
12
13
貸借対照表 Balance Sheets
損益計算書 Statements of Operations
キャッシュ・フロー計算書 Statements of Cash Flows
■自動車生産台数推移 Trends in automotive production output numbers
■液晶・PDPガラス基板搬送ロボット販売金額推移 Sales of LCD/PDP glass industrial robots
■レジスト塗布装置販売金額推移 Sales of resist coater
■ウェーハ搬送ロボット販売金額推移 Sales of wafer conveyance robots
■SMIFオープナ/FOUPオープナ販売金額推移 Sales of SMIF opener/FOUP opener
■EFEM販売金額推移 Sales of EFEM

2財務ハイライト(Financial Highlights)
49,710
44,45748,146 47,237
(百万円/¥ in millions)
(百万円/¥ in millions) (百万円/¥ in millions)
0
10,000
20,000
30,000
40,000
50,000
3,0383,420
3,0653,706
2010/3
3,568
3,177
2006/3 2007/3 2009/32008/3
2010/32006/3 2007/3 2009/32008/3
2010/32006/3 2007/3 2009/32008/3
2010/32006/3 2007/3 2009/32008/3
(%)
-1,000
-2,000
-3,000
0
1,000
2,000
3,000
4,000
0
1,000
2,000
0
-20
-25
-30
5
10
0
-1,000
-2,000
-3,000
1,000
2,000
3,000
4,000
33,455
180
364
△2,944 △2,945
△2,340
1,2781,2781,278
434343
0.3
1,8321,832
10.99.1 9.2
1,8691,869 1,8321,869
2010/32009/32008/3
財務ハイライトFinancial Highlights
売上高
経常利益
当期純利益
純資産
総資産
1株当たり純資産(円)
1株当たり当期純利益(円)
自己資本比率(%)
ROE(%)
営業活動によるキャッシュ・フロー
投資活動によるキャッシュ・フロー
財務活動によるキャッシュ・フロー
現金及び現金同等物の期末残高
従業員数(外、平均臨時雇用者数)
Net sales
Ordinary income
Net income
Net assets
Total assets
Book-value per share(yen)
Earnings per share(loss)(yen)
Net assets ratio(%)
Return on equity(%)
Net cash provided by(used in)operating activities
Net cash used in investing activities
Net cash provided by(used in)financing activities
Cash and cash equivalents at end of period
Number of employees(Average number of temporary employees)
49,710
(2,944)
(2,945)
16,615
67,705
1,556.17
(277.58)
24.1
-
(5,344)
(1,670)
13,166
11,116
1,569(303)
47,237
3,568
1,832
20,587
59,416
1,906.54
171.11
34.1
9.2
3,032
(2,827)
(188)
5,203
1,544(270)
2007/3
48,146
3,420
1,869
19,584
54,341
1,807.11
194.39
35.8
10.9
(1,092)
(815)
1,245
5,220
1,468(259)
2006/3
44,457
3,038
1,278
14,746
59,413
1,605.71
130.72
24.8
9.1
1,253
(133)
(695)
5,845
1,378(222)
連結Consolidated
売上高Net sales
経常利益Ordinary income (loss)
営業利益Operating income (loss)
当期純利益/ROENet income (loss)/Return on equity
(百万円/¥ in millions)
33,455
180
43
16,635
51,794
1,557.79
4.19
31.6
0.3
9,656
(329)
(10,340)
10,121
1,565(278)
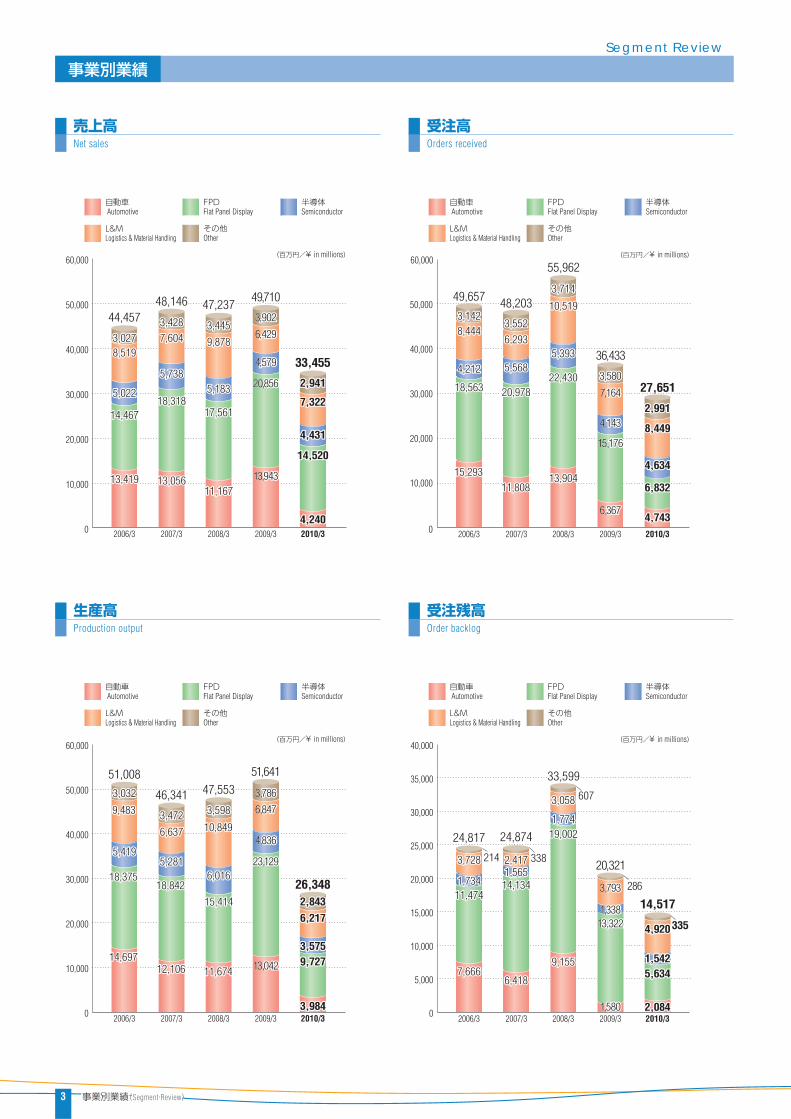
事業別業績事業別業績(Segment ReviewSegment Review)3 事業別業績(Segment Review)
2010/3
(百万円/¥ in millions)
0
10,000
20,000
30,000
40,000
50,000
(百万円/¥ in millions)
2010/3
2010/3
(百万円/¥ in millions) (百万円/¥ in millions)
2010/3
0
10,000
20,000
30,000
40,000
50,000
60,000 60,000
0
10,000
20,000
30,000
40,000
50,000
60,000
0
5,000
10,000
15,000
20,000
25,000
30,000
35,000
40,000
4,2404,240
14,52014,520
4,4314,431
7,3227,322
2,9412,941
33,455
3,9843,984
9,7279,7273,5753,575
6,2176,2172,8432,843
26,348
3,984
9,7273,575
6,2172,843
2,0842,084
5,6345,6341,5421,542
4,9204,920
2,084
5,6341,542
4,920
2006/3 2007/3 2009/3
51,00851,008
46,34146,341
24,81724,817
7,6667,666
24,87424,874
6,4186,418
2006/3 2007/3 2009/3
14,69714,69712,10612,106
214214 338338
2008/3
9,1559,155
2008/3
11,67411,674
607607
18,37518,375
5,4195,419
9,4839,483
3,0323,032
18,84218,842
5,2815,281
6,6376,6373,4723,472
15,41415,414
6,0166,016
10,84910,849
3,5983,598
11,47411,4741,7341,734
3,7283,728
14,13414,1341,5651,5652,4172,417
19,00219,0021,7741,774
3,0583,05847,55347,553
33,59933,59951,008
46,341
14,69712,106 13,04204211,674
18,375
5,419
9,483
3,032
18,842
5,281
6,6373,472
2323,129129
4,836836
6,8478473,786786
15,414
6,016
10,849
3,598
51,64147,553
24,817
7,666
24,874
6,418
1,580580
214 338
286
9,155
607
11,4741,734
3,728
14,1341,5652,417
13,3223,3221,338338
3,793793
19,0021,774
3,058
20,321
33,599
13,042
23,129
4,836
6,8473,786
1,580
13,3221,338
3,793
4,240
14,520
4,431
7,322
2,941 27,651
4,7434,743
6,8326,832
4,6344,634
8,4498,449
2,9912,991
4,743
6,832
4,634
8,449
2,991
49,65749,657
15,29315,29311,80811,808
2006/3 2007/3 2009/3
44,45744,457
2006/3 2007/3 2009/3
13,41913,419 13,05613,056
55,96255,962
13,90413,904
2008/3 2008/3
11,16711,167
14,46714,467
5,0225,022
8,5198,5193,0273,027
18,31818,318
5,7385,738
7,6047,6043,4283,428
17,56117,561
5,1835,183
9,8789,8783,4453,445
48,14648,146 47,23747,23747,23747,237
18,56318,563
4,2124,212
8,4448,4443,1423,142
20,97820,978
5,5685,568
6,2936,2933,5523,552
22,43022,430
5,3935,393
10,51910,519
3,7143,71448,20348,203
44,457
13,94394313,419 13,05611,167
20,856856
4,579,579
6,429,429
3,902,902
14,467
5,022
8,5193,027
18,318
5,738
7,6043,428
17,561
5,183
9,8783,445
48,146 49,71047,237
49,657
15,29311,808
36,433
6,367367
55,962
13,904
18,563
4,212
8,4443,142
20,978
5,568
6,2933,552
15,176176
4,143143
7,164164
3,5803,58022,430
5,393
10,519
3,71448,203
13,943
20,856
4,579
6,429
3,902
6,367
15,176
4,143
7,164
3,580
24,87424,87414,517
335
事業別業績Segment Review
売上高Net sales
受注高Orders received
生産高Production output
受注残高Order backlog
自動車 Automotive
FPDFlat Panel Display
半導体Semiconductor
L&MLogistics & Material Handling
その他Other
自動車 Automotive
FPDFlat Panel Display
半導体Semiconductor
L&MLogistics & Material Handling
その他Other
自動車 Automotive
FPDFlat Panel Display
半導体Semiconductor
L&MLogistics & Material Handling
その他Other
自動車 Automotive
FPDFlat Panel Display
半導体Semiconductor
L&MLogistics & Material Handling
その他Other

4マーケット情報(Market Information)
30,000
60,000
90,000
2007 2008 2010(見込)Estimate
(千台/1 thousand units)
2007 2008 2010(予測)Forecast
2007 2008(予測)Forecast
2010(予測)Forecast
(百万円/¥ in millions)(百万円/¥ in millions)
0
10,000
20,000
30,000
40,000
50,000
60,000
70,000
80,000
2009(推定)Forecast
0
120,000
150,000
2009(見込)Estimate
2009(予測)Forecast
2006
2006
36,500
0
20,000
40,000
60,000
80,000
6,0006,000
00,00000,000
74,55874,558
21,79021,790
96,960
74,558
21,790
58,37058,370
106,497106,497
95,58895,588
31,39031,39024,23024,230
29,89029,890
94,03294,032
19,71019,710
127,700
83,78083,780
137,100
114,330114,330
342375
246342565
601512210
58,370
106,497
95,588
83,780
114,330
31,39024,230
29,890
19,710
94,032
68,22268,222
11,48411,484 11,59611,596
71,859
902
11,56411,564
13,86313,863 13,35913,35910,95410,954
16,55316,553 18,85118,851 19,55919,559
20,18420,18421,40321,403
19,73419,734
5,2365,2365,7795,779
6,2406,240
68,931
880871
68,222
11,484 11,596 11,564
13,863 13,35910,954
16,553 18,851 19,559
20,18421,403
19,734
5,2365,779
9,0809,080
72,965
898
10,96310,963
24,70024,700
20,70420,704
6,6206,620
9,080
10,963
24,700
20,704
6,620
8,0008,000
67,263
889
9,1369,136
23,09023,090
19,71819,718
6,4306,430
8,000
9,136
23,090
19,718
6,4306,240
6,000
30,50029,900
5,6305,630
24,27024,270
5,630
24,270
36,900
7,7007,700
12,90012,900
29,20029,200
40,00040,000
52,90052,900
7,700
12,900
29,200
40,000
52,900
321289
日本Japan
北米North America
アジアAsia
中南米 Central and South America
その他Other
欧州Europe
■自動車生産台数推移Trends in automotive production output numbers
出典:調査会社S社調べSource: Survey company“S”
■液晶・PDPガラス基板搬送ロボット販売金額推移Sales of LCD/PDP glass industrial robots
国内Domestic
海外Overseas
出典:株式会社 富士経済「2009 ワールドワイドFAロボット/RT関連市場の現状と将来展望」「ガラス基板搬送ロボット」より
Source : "Worldwide FA Robots-related Market Complete Report 2009" FUJI KEIZAI CO.,LTD."Glass Substrate Transfer Robot"
■レジスト塗布装置販売金額推移Sales of resist coater
出典:電子ジャーナル「2009 LCD製造装置データブック」Source : "LCD Production Facilities Data Book 2009" ELECTRIC JOURNAL CO.,LTD.
日本Japan
北米North America
欧州Europe
アジアAsia
マーケット情報Market Information
自動車関連生産設備事業Automotive Production Facilities
FPD関連生産設備事業FPD Production Facilities

マーケット情報マーケット情報(Market InformationMarket Information)5 マーケット情報(Market Information)
2007 2008 2009(見込)Estimate
0
20,000
40,000
60,000
80,000
(百万円/¥ in millions)
2010(予測)Forecast
2006
60,800
21,70021,700
39,10039,100
21,700
39,100
68,600
26,00026,000
42,60042,600
26,000
42,600
8,2008,200
58,00058,000
00,00000,000
8,200
16,900
25,100
6,1406,140
58,00058,000
12,06012,060
6,140
12,060
18,200
(百万円/¥ in millions)
2006 2007 2008(見込)Estimate
(百万円/¥ in millions)
2006 2007 2008(見込)Estimate
0
5,000
10,000
15,000
20,000
25,000
30,000
2009(予測)Forecast
2009(予測)Forecast
2005
2005
24,630
22,580
8,5708,570
1,0301,030
8,8908,890
1,5901,590
17,660
6,9806,980
1,4401,44017,2801,3801,380
6,8006,800
5,2505,250
2,6502,650
3,9503,950
5,7505,750
3,5303,530
3,7503,750
3,8603,860
1,9701,970
2,5702,570
3,7203,720
2,0202,020
2,4802,480
4,6204,620
1,7701,770
3,4803,4801,1001,100
1,1301,1301,1201,120
840840 8808802,2802,280
5,8805,880
20,34020,340
53,260
18,92018,920
34,260
13,90013,900
32,610
13,20013,200
15,12015,1202,4402,440
6,3606,360
4,9304,9303,6903,690
16,07016,0702,2002,200
7,7207,720
4,1304,130
4,2204,220
9,1409,1401,5001,500
3,6903,6902,6202,6203,4103,410
8,5208,5201,4201,420
3,5903,5902,5902,5903,2903,290
11,89011,890
4,3904,390
4,1304,130
4,2304,230
4,9404,940
18,13018,130
52,880
47,71047,710
0
10,000
20,000
30,000
40,000
50,000
60,000
20,340 18,920
13,900 13,200
15,1202,440
6,360
4,9303,690
16,0702,200
7,720
4,130
4,220
9,1401,500
3,6902,6203,410
8,5201,420
3,5902,5903,290
11,890
4,390
4,130
4,230
4,940
18,130
47,710
8,570
1,030
8,890
1,590
6,980
1,440 1,380
6,800
5,250
2,650
3,950
5,750
3,530
3,750
3,860
1,970
2,570
3,720
2,020
2,480
4,620
1,770
3,4801,100
1,1301,120
840 8802,280
5,880
19,13019,13019,130
11,00011,000
55,95055,95021,70021,700
11,000
21,700
32,700
マーケット情報Market Information
半導体関連生産設備事業Semiconductor Production Facilities
■ウェーハ搬送ロボット販売金額推移Sales of wafer conveyance robots
国内Domestic
海外Overseas
出典:株式会社 富士経済「2008 ワールドワイドFAロボット/RT関連市場の現状と将来展望」株式会社 富士経済「2009 ワールドワイドFAロボット/RT関連市場の現状と将来展望」より
Source : "Worldwide FA Robots-related Market Complete Report 2008" FUJI KEIZAI CO.,LTD. "Worldwide FA Robots-related Market Complete Report 2009" FUJI KEIZAI CO.,LTD.
■EFEM販売金額推移Sales of EFEM
■SMIFオープナ/FOUPオープナ販売金額推移Sales of SMIF opener/FOUP opener
出典:グローバルネット株式会社「世界半導体製造装置・試験/検査装置市場年鑑2009」よりSource : "World Semiconductor Production Facilities/Trial/inspection Market Almanac 2009" Global Net Corporation
出典:グローバルネット株式会社「世界半導体製造装置・試験/検査装置市場年鑑2009」よりSource : "World Semiconductor Production Facilities/Trial/Inspection Market Almanac 2009" Global Net Corporation
日本Japan
米国USA
韓国Korea
台湾Taiwan
欧州Europe
その他アジアOther Asian countries
日本Japan
米国USA
韓国Korea
台湾Taiwan
欧州Europe
その他アジアOther Asian countries
6財務データ(Financial Data)
0
2,000
-2,000
-3,000
1,000
-1,000
0
5,000
10,000
15,000
0
20,000
40,000
60,000
80,000
0
1,000
-1,000
-2,000
2,000
3,000
4,000
0
1,000
-1,000
-2,000
2,000
3,000
4,000
(百万円/¥ in millions) (%)
5
-5
-10
10
(百万円/¥ in millions) (%)
0
10
30
20
(百万円/¥ in millions) (%)
2
4
6
8
(百万円/¥ in millions) (%)
0
-2
-4
-3,000 -6
2
4
6
8(百万円/¥ in millions) (%)
0
2
-2
-4
-3,000 -6
4
6
8
0
-15
20,000 40
25,000 50
0
0
10,000
20,000
30,000
40,000
50,000(百万円/¥ in millions) (%)
50
60
70
80
90
100
2010/32007/3 2008/3 2009/32006/3
82.182.1 81.381.3
36,51836,51839,161
45,984
38,006
82.1 81.3
36,518 3,0653,065
7.76.9
3,0383,0383,4203,420
△2,944
3,5683,5686.8
7.67.1
△2,340340
59,413
67,705
59,416
△2,945
19,584
16,615
20,587
1,869 1,832
92.592.592.5
28,37528,375
84.884.8
28,375
84.880.580.580.5
1,278
2.92.93.93.9 3.93.9
△5.95.9
3,0383,420 3,568
0.50.5180
0.5
△5.9
3,065
1.11.11.1
△4.7△2,340
54,34114,746
2.93.9 3.9
43
0.10.10.1
△5.9
16,63551,794
2010/32007/3 2008/3 2009/32006/3 2010/32007/3 2008/3 2009/32006/3
2010/32007/3 2008/3 2009/32006/32010/32007/3 2008/3 2009/32006/32010/32007/3 2008/3 2009/32006/3
2.32.3
3.33.3 3.23.22.3
3.3 3.2
10.910.9 9.29.29.19.1 10.9 9.2
0.30.30.3 0.10.10.1
9.1
3,7063,7063,1773,177
6.73,706
3,177
364364364
2010/32009/32008/3
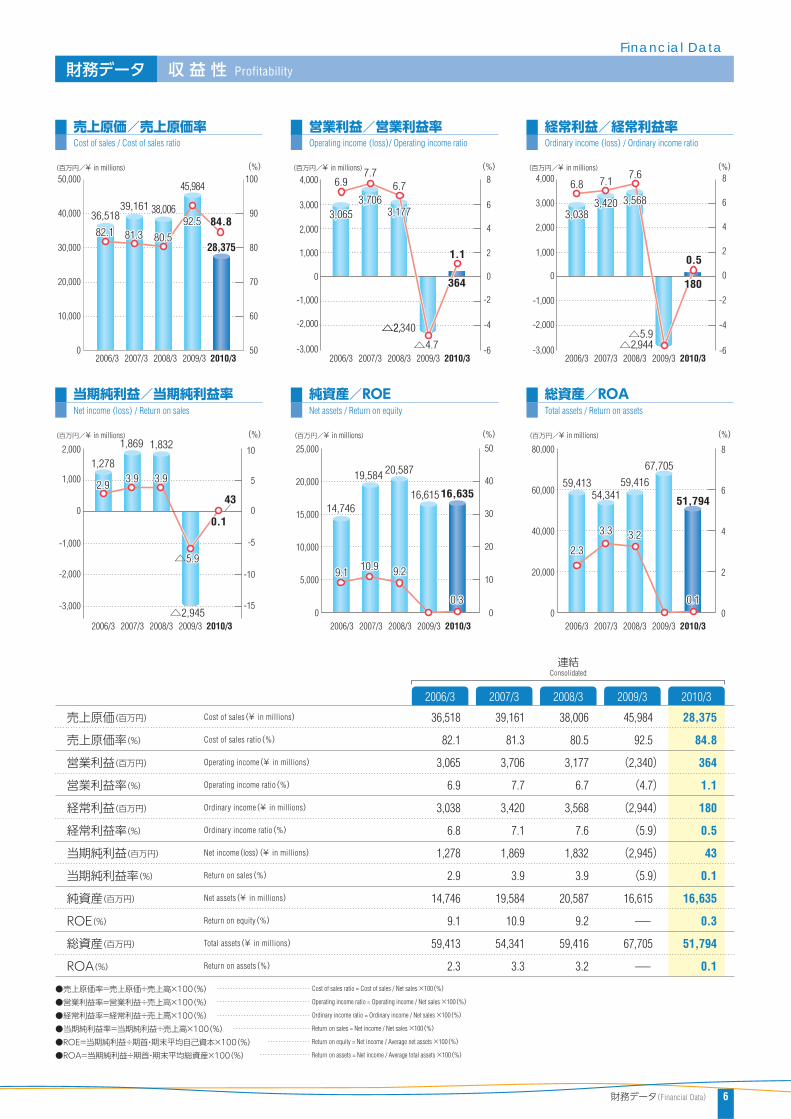
財務データFinancial Data
●売上原価率=売上原価÷売上高×100(%)●営業利益率=営業利益÷売上高×100(%)●経常利益率=経常利益÷売上高×100(%)●当期純利益率=当期純利益÷売上高×100(%)●ROE=当期純利益÷期首・期末平均自己資本×100(%)●ROA=当期純利益÷期首・期末平均総資産×100(%)
売上原価(百万円)
売上原価率(%)
営業利益(百万円)
営業利益率(%)
経常利益(百万円)
経常利益率(%)
当期純利益(百万円)
当期純利益率(%)
純資産(百万円)
ROE(%)
総資産(百万円)
ROA(%)
Cost of sales(¥ in millions)
Cost of sales ratio(%)
Operating income(¥ in millions)
Operating income ratio(%)
Ordinary income(¥ in millions)
Ordinary income ratio(%)
Net income(loss)(¥ in millions)
Return on sales(%)
Net assets(¥ in millions)
Return on equity(%)
Total assets(¥ in millions)
Return on assets(%)
Cost of sales ratio = Cost of sales / Net sales ×100(%)
Operating income ratio = Operating income / Net sales ×100(%)
Ordinary income ratio = Ordinary income / Net sales ×100(%)
Return on sales = Net income / Net sales ×100(%)
Return on equity = Net income / Average net assets ×100(%)
Return on assets = Net income / Average total assets ×100(%)
45,984
92.5
(2,340)
(4.7)
(2,944)
(5.9)
(2,945)
(5.9)
16,615
-
67,705
-
38,006
80.5
3,177
6.7
3,568
7.6
1,832
3.9
20,587
9.2
59,416
3.2
2007/3
39,161
81.3
3,706
7.7
3,420
7.1
1,869
3.9
19,584
10.9
54,341
3.3
2006/3
36,518
82.1
3,065
6.9
3,038
6.8
1,278
2.9
14,746
9.1
59,413
2.3
連結Consolidated
売上原価/売上原価率Cost of sales / Cost of sales ratio
営業利益/営業利益率Operating income (loss)/ Operating income ratio
経常利益/経常利益率Ordinary income (loss) / Ordinary income ratio
当期純利益/当期純利益率Net income (loss) / Return on sales
純資産/ROENet assets / Return on equity
総資産/ROATotal assets / Return on assets
収 益 性 Profitability
28,375
84.8
364
1.1
180
0.5
43
0.1
16,635
0.3
51,794
0.1

7 財務データ財務データ(Financial DataFinancial Data)財務データ(Financial Data)
0
1
2
3
4
5
0
1
2
3
4
5
(回/ times) (回/ times) (回/ times)
(%) (回/ times) (回/ times)
0
5
10
15
0
1
2
3
4
5
0
0.2
0.4
0.6
0.8
1.0
0
2
4
6
8
10
2010/3
2.382.38
2009/32007/3 2008/3 2010/32006/3
2009/32007/3 2008/3 2010/32006/3
2009/32007/3 2008/32006/3
2010/32009/32007/3 2008/32006/3
2009/32007/3 2008/3 2010/32006/3
2009/32007/3 2008/3 2010/32006/3
5.445.44 5.445.445.555.55
0.81 0.830.85
3.16
2.38
2.82
10.67 10.46
3.02
12.02
3.02 2.983.24
2.192.342.17
0.78
2.71
2.97
2.264.97
5.44 5.145.445.44
0.560.560.56
2.052.052.05
2.032.032.03 1.864.64
5.55
2010/32009/32008/3
財務データFinancial Data
ROI(%)
総資産回転率(回)
自己資本回転率(回)
有形固定資産回転率(回)
棚卸資産回転率(回)
売上債権回転率(回)
Return on investment(%)
Total assets turnover(times)
Net assets turnover(times)
Tangible fixed assets turnover(times)
Inventory turnover(times)
Receivables turnover(times)
3.02
0.56
2.05
2.03
4.64
1.86
●ROI=(営業利益+減価償却費)÷(期首・期末平均自己資本+期首・期末平均有利子負債残高)×100(%)
●総資産回転率=売上高÷期首・期末平均総資産(回)●自己資本回転率=売上高÷期首・期末平均自己資本(回)●有形固定資産回転率=売上高÷期首・期末平均有形固定資産(回)●棚卸資産回転率=売上高÷期首・期末平均棚卸資本(回)●売上債権回転率=売上高÷期首・期末平均売上債権(回)※売上債権=受取手形及び売掛金+受取手形割引高
Return on investment = (Operating income + Depreciation and amortization)
/(Average net assets + Average interest-bearing debt)×100(%)
Total assets turnover = Net sales / Average total assets(times)
Net assets turnover = Net sales / Average net assets(times)
Tangible fixed assets turnover = Net sales / Average tangible fixed assets(times)
Inventory turnover = Net sales / Average inventory(times)
Receivables turnover = Net sales / Avearge receivables(times)
Receivables = Trade notes and accounts receivables + Discount on notes receivables
-
0.78
2.71
2.97
5.14
2.26
10.46
0.83
2.38
2.98
5.44
2.19
2007/3
12.02
0.85
2.82
3.24
4.97
2.34
2006/3
10.67
0.81
3.16
3.02
5.55
2.17
連結Consolidated
ROIReturn on investment
総資産回転率Total assets turnover
自己資本回転率Net assets turnover
有形固定資産回転率Tangible fixed assets turnover
棚卸資産回転率Inventory turnover
売上債権回転率Receivables turnover
効率性 Efficiency

8財務データ(Financial Data)
(%) (百万円/¥ in millions) (%)
0
5,000
10,000
15,000
20,000
25,000
0
20
40
60
80
100
0
10
20
30
40
50(百万円/¥ in millions) (%)
(倍/ times)
0
0.5
1.0
1.5
2.0
2.5
2009/32007/3 2008/3
(百万円/¥ in millions)
0
5,000
10,000
15,000
30,000
20,000
25,000
(倍/ times)
0
5
10
15
0
10,000
20,000
30,000
40,000
50,000
60,000
0
30
60
90
120
150
180
40,31040,31071.071.0 61.961.9 63.963.9
1.31.3
0.80.8
2010/32006/32009/32007/3 2008/3 2010/32006/32009/32007/3 2008/3 2010/32006/3
2009/32007/3 2008/3 2010/32006/3
18,94918,949
35,39135,391
34.135.8
9.5
1.3
13.713.1
24.1
31.6
24.824.824.8
1.3
0.90.80.8
1.91.9
39,066
40,310
124.4
150.0 143.4
35,391
19,103 20,350
71.0 61.9 63.9
22,828
68.468.418,949
17,02519,57517,68117,681
30,633
20,370
44,87744,87768.4
20,776
71.171.171.1
0.8
1.9
1.91.91.617,681
131.6
44,877
31,01831,018
139.0
31,018
2009/32007/3 2008/3 2010/32006/3 2009/32007/3 2008/3 2010/32006/3
財務データFinancial Data
安全性 Stability
2010/32009/32008/3
●自己資本比率=自己資本÷総資産×100(%)●流動比率=流動資産÷流動負債×100(%)●固定長期適合率=固定資産÷(自己資本+固定負債)×100(%)●インタレスト・カバレッジ・レシオ=(営業利益+受取利息及び配当)÷支払利息及び債権売却損(倍)●デット・エクイティ・レシオ=有利子負債÷自己資本(倍)
自己資本比率(%)
流動資産(百万円)
流動比率(%)
固定資産(百万円)
固定長期適合率(%)
インタレスト・カバレッジ・レシオ(倍)
有利子負債残高(百万円)
デット・エクイティ・レシオ(倍)Net assets ratio = Net assets / Total assets ×100(%)
Current ratio = Current assets / Current liabilities ×100(%)
Fixed asset / liability ratio = Fixed assets / (Net assets + Long-term liabilities)×100(%)
Interest coverage ratio = (Operating income + Interest and dividend income)/ Interest expenses (times)
Debt equity ratio = Interest-bearing debt / Net assets (times)
Net assets ratio(%)
Current assets(¥ in millions)
Current ratio(%)
Fixed assets(¥ in millions)
Fixed asset / liability ratio(%)
Interest coverage ratio(times)
Interest-bearing debt(¥ in millions)
Debt equity ratio(times)
24.1
44,877
131.6
22,828
68.4
-
30,633
1.9
34.1
39,066
143.4
20,350
63.9
9.5
17,025
0.8
2007/3
35.8
35,391
150.0
18,949
61.9
13.7
17,681
0.9
2006/3
24.8
40,310
124.4
19,103
71.0
13.1
19,575
1.3
連結Consolidated
自己資本比率Net assets ratio
流動資産/流動比率Current assets / Current ratio
固定資産/固定長期適合率Fixed assets / Fixed asset / liability ratio
有利子負債残高Interest-bearing debt
デット・エクイティ・レシオDebt equity ratio
インタレスト・カバレッジ・レシオInterest coverage ratio
31.6
31,018
139.0
20,776
71.1
1.3
20,370
1.6
9 財務データ財務データ(Financial DataFinancial Data)財務データ(Financial Data)
1.91.9
645
1.9
0
500
1,000
1,500
2,000
2,500
3,000
0
10,000
20,000
30,000
40,000
50,000
0
400
800
1,200
1,600
2,000(人/ persons) (千円/¥ in thousands) (千円/¥ in thousands)
(百万円/¥ in millions) (百万円/¥ in millions) (百万円/¥ in millions)
0
200
400
600
800
1,000
-2,000
-1,000
0
1,000
2,000
3,000
(%)
2,369
115
2,240 2,403
△1,891,891
311311
2.42.4 2.22.2
0.70.7
1.91.9
0
200
400
600
800
1,000
1,200
0
1
2
3
4
5
6
555555
9219212,517
596
967
1,544
1,37831,36632,773 33,834
714
588
1,134
1,678
1,569
31,937
1,077
311
2.4 2.2
0.7
1.9
938
323
1,565
21,349
900
1,4681,468
555
921
1,468
△1,891
2007/32006/3 2008/3 2009/3 2010/32007/32006/3 2008/3 2009/3 2010/32007/32006/3 2008/3 2009/3 2010/3
2007/32006/3 2008/3 2009/3 2010/32007/32006/3 2008/3 2009/3 2010/32007/32006/3 2008/3 2009/3 2010/3
2010/32009/32008/3
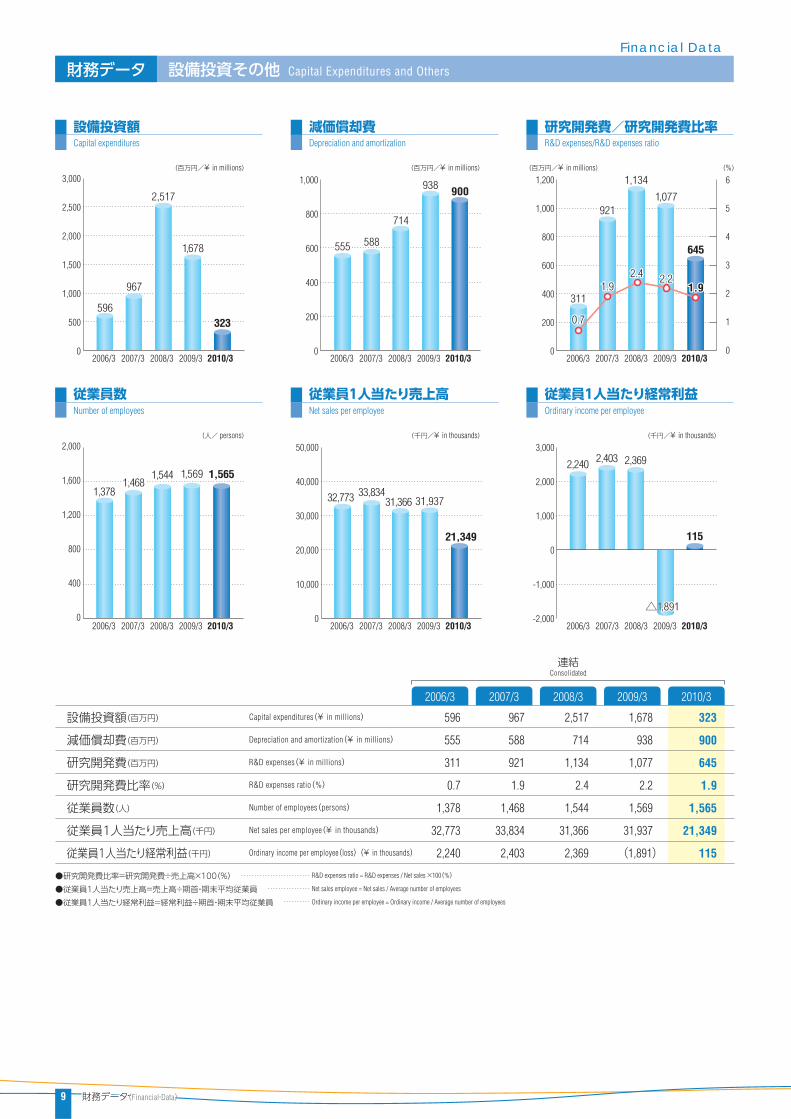
財務データFinancial Data
設備投資額(百万円)
減価償却費(百万円)
研究開発費(百万円)
研究開発費比率(%)
従業員数(人)
従業員1人当たり売上高(千円)
従業員1人当たり経常利益(千円)
Capital expenditures(¥ in millions)
Depreciation and amortization(¥ in millions)
R&D expenses(¥ in millions)
R&D expenses ratio(%)
Number of employees(persons)
Net sales per employee(¥ in thousands)
Ordinary income per employee(loss)(¥ in thousands)
323
900
645
1.9
1,565
21,349
115
●研究開発費比率=研究開発費÷売上高×100(%)●従業員1人当たり売上高=売上高÷期首・期末平均従業員●従業員1人当たり経常利益=経常利益÷期首・期末平均従業員
R&D expenses ratio = R&D expenses / Net sales ×100(%)
Net sales employee = Net sales / Average number of employees
Ordinary income per employee = Ordinary income / Average number of employees
1,678
938
1,077
2.2
1,569
31,937
(1,891)
2,517
714
1,134
2.4
1,544
31,366
2,369
2007/3
967
588
921
1.9
1,468
33,834
2,403
2006/3
596
555
311
0.7
1,378
32,773
2,240
連結Consolidated
設備投資額Capital expenditures
減価償却費Depreciation and amortization
研究開発費/研究開発費比率R&D expenses/R&D expenses ratio
従業員数Number of employees
従業員1人当たり売上高Net sales per employee
従業員1人当たり経常利益Ordinary income per employee
設備投資その他 Capital Expenditures and Others

10投資指標(Investment Indicators)
2007.1 2007.12 2009.1 2 3 4 5 66 7 8 9 10 11 12 2010.1 2 3 42006.12 2008.12
(円/¥) (倍/ times)
-5
0
5
10
-15
-10
(円/¥) (倍/ times)
-100
0
100
200
-300
-200
(円/¥) (倍/ times)
0
500
1,000
1,500
2,000
2,500
0
0.4
0.8
1.2
1.6
2.0
(百万円/¥ in millions) (倍/ times)
-5,000
-2,500
0
2,500
5,000
-10
-5
0
5
10
2007/32006/3 2008/3 2009/3
1.151.15
2010/3
2007/32006/3 2008/3 2009/3 2010/3 2007/32006/3 2008/3 2009/3 2010/3 2007/32006/3 2008/3 2009/3 2010/3
1,807.111,807.11
171.11194.39
4,272
2,3742,3742,374
3,4083,947
1,906.541,906.54
1,605.711.15
237.86200.84
255.54
△27277.58.58 △189.15189.15
1,807.111,556.17
130.72
1,906.54
0.590.59
0.260.26
0.59
0.26
1,557.79
0.340.340.34
6.86.86.8
5.925.925.884.754.754.75
-5
0
5
10
-100
-10-200
100
0
200
1530010.6710.6710.67
△277.58 △189.15
8.88.8 5.75.78.8 5.7
△3,3150
1,000,000
2,000,000
3,000,000
4,000,000
5,000,000
6,000,000
1,500
0
500
1,000
2,000
2,500
3,000
8.128.128.12
6.606.606.60
4.194.194.19
126.38126.38126.38
89.9389.9389.93
投資指標Investment Indicators
連結Consolidated
2010/32009/32008/3
●1株当たり当期純利益=当期純利益÷期中平均発行済株式総数●PER=期末株価÷1株当たり当期純利益(倍)●1株当たり純資産=期末純資産÷期末発行済株式総数●PBR=期末株価÷1株当たり純資産(倍)●1株当たりキャッシュ・フロー=(当期純利益+減価償却費)÷期中平均発行済株式総数●PCFR=期末株価÷1株当たりキャッシュ・フロー(倍)●EBITDA=税金等調整前当期純利益+支払利息+減価償却費●EBITDA倍率=EV÷EBITDAEV(企業価値)=株式時価総額+有利子負債残高+少数株主持分ー現預金ー有価証券
●配当性向=1株当たり配当金÷1株当たり当期純利益×100(%)●純資産配当率=1株当たり配当金÷期首・期末平均1株当たり純資産
(円、EBITDAを除く/¥ except for EBITDA)
1株当たり当期純利益PER(倍)1株当たり純資産PBR(倍)1株当たりキャッシュ・フローPCFR(倍)EBITDA(百万円)EBITDA倍率(倍)1株当たり配当金配当性向(%)純資産配当率(%)
Earnings per share = Net income / Average number of shares outstanding in cash fiscal period
PER = Stock price at fiscal year-end / Earnings per share(times)
Book-value per share = Net assets at fiscal year end / Number of shares outstanding at fiscal year-end
PBR = Stock price at fiscal year-end / Book-value per share(times)
Cash flow per share = (Net income + Depreciation and amortization)/ Average number of shares outstanding in each fiscal period
PCFR = Stock price at fiscal year-end / Cash flow per share(times)
EBITDA = Income before income taxes and minority interests + Interest payable + Depreciation and amortization
EV / EBITDA(times)Enterprise value(EV)= Market value + Interest-bearing debt + Minority shareholders' equity - Cash and deposits - Marketable securities
Dividend payout ratio = Cash dividends per share / Earnings per share ×100(%)
Ratio of dividends to net asset = Cash dividends per share / Average net asset of at the beginning and ending of the term per share
Earnings per share
Price to earnings ratio(times)
Book-value per share
Price to book value ratio(times)
Cash flow per share
Price to cash flow ratio(times)
EBITDA(¥ millions)
EV / EBITDA(times)
Cash dividends per share
Dividend payout ratio(%)
Dividends on equity(%)
4.19
126.38
1,557.79
0.34
89.93
5.88
2,374
6.8
10.00
238.7
0.6
(277.58)-
1,556.17
0.26
(189.15)-
(3,315)-
10.00
-
0.6
171.11
6.60
1,906.54
0.59
237.86
4.75
4,272
5.7
25.00
14.6
1.3
2007/3
194.39
10.67
1,807.11
1.15
255.54
8.12
3,947
8.8
22.50
11.6
1.3
2006/3
130.72
-
1,605.71
-
200.84
-
3,408
-
12.50
9.6
0.8
1株当たり当期純利益(損失)/PEREarnings per share(loss)/ Price to earnings ratio
1株当たり純資産/PBRBook-value per share / Price to book value ratio
1株当たりキャッシュ・フロー/PCFRCash flow per share / Price to cash flow ratio
EBITDA/EBITDA倍率EBITDA / EV / EBITDA
株価の推移Stock price
(株/stock) (円/¥)出来高Volume
株価Stock price

11 連結財務諸表連結財務諸表(Consolidated Financial StatementsConsolidated Financial Statements)連結財務諸表(Consolidated Financial Statements)
2010/3
連結財務諸表Consolidated Financial Statements
■資産の部流動資産 現金及び預金 受取手形及び売掛金 たな卸資産 繰延税金資産 その他 貸倒引当金固定資産有形固定資産 建物及び構築物 機械装置及び運搬具 工具器具及び備品 土地 建設仮勘定無形固定資産 借地権 ソフトウェア のれん その他投資その他の資産 投資有価証券 破産更正債権等 長期貸付金 繰延税金資産 その他 貸倒引当金資産合計
■負債の部流動負債 支払手形及び買掛金 短期借入金 一年以内返済予定の長期借入金 一年以内償還予定の社債 未払金 未払法人税等 未払費用 前受金 賞与引当金 役員賞与引当金 製品保証引当金 その他固定負債 社債 長期借入金 繰延税金負債 再評価に係る繰延税金負債 退職給付引当金 役員退職慰労引当金 その他負債合計
■純資産の部株主資本 資本金 資本剰余金 利益剰余金 自己株式評価・換算差額等 その他有価証券評価差額金 繰延ヘッジ損益 土地再評価差額金 為替換算調整勘定少数株主持分純資産合計負債、純資産合計
貸借対照表 Balance Sheets
連結 Consolidated (千円/¥ in thousands)
39,066,420 5,203,460
23,508,503 8,658,826 1,414,483
390,589 (109,443)20,350,450 16,739,806
4,523,435 1,015,896
588,280 9,891,454
720,740 209,941
27,786 108,207
58,576 15,371
3,400,702 1,884,838
303,033 -
1,184,765 332,477
(304,413)59,416,871
27,248,092 10,140,588
8,264,611 2,298,239
600,000 482,735
1,133,503 2,086,280 1,293,709
106,062 82,900
464,580 294,880
11,581,042 700,000
5,162,896 37,306
2,681,916 2,336,429
643,020 19,473
38,829,134
16,065,026 2,633,962 2,322,634
11,293,342 (184,913)4,225,113
282,208 (19,427)3,841,915
120,417 297,595
20,587,736 59,416,871
35,391,550 5,453,575
19,571,212 8,722,453 1,170,134
492,965 (18,791)
18,949,962 14,979,902
3,984,680 784,425 529,004
9,681,792 -
148,644 27,786 99,940
2,567 18,349
3,821,415 2,493,486
17,791 313,000
950,081 379,227 (332,171)54,341,512
23,601,550 7,242,940 8,550,885 3,551,009
200,000 686,616
91,149 2,140,434
305,426 76,218 84,450
401,471 270,948
11,155,195 1,300,000 4,080,009
31,583 2,681,916 2,286,918
764,530 10,237
34,756,746
14,658,725 2,633,962 2,322,634 9,703,073 (945)
4,777,374 808,516
2,730 3,841,915
124,211 148,665
19,584,765 54,341,512
40,310,608 5,845,995
21,557,086 10,671,639
1,528,033 724,933 (17,081)
19,103,126 14,714,019
3,730,620 565,760 510,679
9,790,834 116,124 159,385
27,786 109,739
3,510 18,349
4,229,721 3,223,185 -
370,802 583,186 256,305
(203,758)59,413,734
32,396,808 12,310,631 10,398,937
2,330,108 300,000 707,799
1,602,384 2,418,319 1,667,578
77,682 -
444,464 138,903
12,161,481 1,000,000 5,546,217
15,931 2,653,030 2,214,028
717,890 14,382
44,558,289
9,639,7741,099,462
685,462 8,006,730 (151,880)5,107,0581,181,647 -
3,913,876 11,534
108,61214,855,45559,413,734
44,877,509 11,116,314 20,482,087 10,671,887
1,776,783 958,667(128,231)
22,828,152 16,765,461
5,153,979 1,186,347
557,529 9,866,107
1,496 354,448
27,786 265,659
45,631 15,371
5,708,243 1,648,5682,648,459-
2,748,782 423,736
(1,761,302)67,705,661
34,088,992 10,877,407 16,561,383
1,664,867 850,000 759,428 127,510
1,184,193 1,169,575
116,399 8,640
512,358 257,228
17,001,030 2,850,000 8,707,549
13,678 2,681,916 1,966,026
664,255 117,603
51,090,022
12,780,3752,633,9622,322,6348,066,924(243,146)3,569,801
280,5524,439
3,841,915(557,105)
265,46116,615,63867,705,661
2009/32008/32007/32006/3
31,018,220 10,121,756 15,413,788
3,764,065 1,473,426
361,099 (115,914)
20,776,680 16,115,761 4,851,441 1,010,367
425,906 9,819,347
8,698 392,471 27,786
317,727 31,586 15,371
4,268,447 1,747,709
706,192 -
2,002,747 450,941 (639,143)
51,794,901
22,313,094 6,355,725 5,306,270 6,638,950
850,000 365,481 44,444
1,497,983 164,529 45,781 46,667
292,380 704,878
12,846,603 2,000,000 5,575,419
19,272 2,666,209 1,718,768
714,981 151,952
35,159,698
12,742,457 2,633,962 2,322,634 8,029,006 (243,146) 3,624,753
329,104 (36,009)
3,818,744 (487,085)
267,991 16,635,202 51,794,901
AssetsCURRENT ASSETSCash and deposits with banksNotes and accounts receivable - tradeInventoriesDeferred tax assetsOtherAllowance for doubtful accountsFIXED ASSETSTangible fixed assetsBuildings and structuresMachinery, equipment and vehiclesTools,furniture and fixturesLandConstruction in progressIntangible fixed assetsLeaseholdSoftwareConsolidation goodwillOtherInvestments and other assetsInvestment securitiesBankrupt and delinquent loans receivable, etc.Long-term loans receivableDeferred tax assetsOtherAllowance for doubtful accountsTOTAL ASSETS
LiabilitiesCURRENT LIABILITIESNotes and accounts payable - tradeShort-term borrowingsCurrent portion of long-term borrowingsCurrent portion of bondsAccounts payable - otherCorporation and inhabitants taxes payableAccrued expensesAdvances receivedAccrued bonusesReserve for directors' and corporate auditors' bonusesReserve for product guaranteeOtherLONG-TERM LIABILITIESBondsLong-term borrowingsDeferred tax liabilitiesDeferred tax liabilities due to revaluationReserve for retirement benefitsReserve for retirement benefits for directors and corporate auditorsOtherTOTAL LIABILITIES
Net AssetsShareholders' equityCapital stockCapital surplusRetained earningsTreasury stockValuation and translation adjustmentNet unrealized gain on other marketable securitiesGain (Loss) on hedged accountRevaluation excess of landForeign currency translation adjustmentsMINORITY INTERESTTOTAL NET ASSETSTOTAL LIABILITIES AND NET ASSETS

12連結財務諸表(Consolidated Financial Statements)
連結財務諸表Consolidated Financial Statements
損益計算書 Statements of Operations
2010/32009/32008/32007/32006/3
連結 Consolidated (千円/¥ in thousands)
売上高
売上原価
売上総利益
販売費及び一般管理費
営業利益
営業外収益
受取利息
受取配当金
為替差益
持分法による投資利益
原材料等売却益
保険配当金
その他
営業外費用
支払利息
為替差損
その他
経常利益
特別利益
固定資産売却益
投資有価証券売却益
貸倒引当金戻入益
助成金収入
その他
特別損失
固定資産除却損
固定資産売却損
投資有価証券評価損
投資有価証券売却損
減損損失
貸倒損失
貸倒引当金繰入額
その他
税金等調整前当期純利益
法人税、住民税及び事業税
法人税等調整額
少数株主利益
当期純利益
Net sales
Cost of sales
Gross profit
Selling,general and administrative expenses
Operating income (loss)
Nonoperating income
Interest income
Dividend income
Foreign exchange gain
Investments gain on equity method
Gain on sales of raw materials
Insurance dividends
Other
Nonoperating expenses
Interest expenses
Foreign exchange loss
Other
Ordinary income (loss)
Extraordinary income
Gain on sales of fixed assets
Gain on sales of investment securities
Reversal of allowance for doubtful accounts
Income from grants
Other
Extraordinary losses
Loss on retirement of fixed assets
Loss on sales of fixed assets
Net unrealized loss on investment securities
Loss on sales of investment securities
Impairment loss
Bad debt write-offs
Provision for allowance for doubtful accounts
Other
Income before income taxes and minority interests (loss)
Corporation,inhabitants and enterprise taxes
Deferred income taxes and other
Minority interest in net income (loss)
Net income (loss)
48,146,651
39,161,467
8,985,184
5,278,476
3,706,707
163,430
26,997
23,650
-
-
23,743
9,014
80,024
449,670
255,051
70,698
123,919
3,420,468
10,178
9,304
-
-
-
874
326,409
24,225
43,792
121,985
-
-
-
136,405
-
3,104,236
951,233
240,128
43,561
1,869,312
44,457,474
36,518,100
7,939,373
4,873,966
3,065,407
276,334
19,773
23,974
125,250
120
15,629
15,030
76,555
303,079
228,654
-
74,424
3,038,661
6,309
481
5,827
-
-
-
420,527
42,512
42,968
25,100
11,238
13,281
96,117
184,000
5,308
2,624,444
2,181,068
(846,569)
11,823
1,278,121
49,710,995
45,984,133
3,726,861
6,067,699
(2,340,838)
144,725
13,430
25,365
-
-
24,808
16,743
64,377
748,783
390,144
157,701
200,937
(2,944,896)
82,797
484
-
1,312
81,000
-
1,781,727
20,907
1,275
251,111
-
-
-
1,457,835
50,596
(4,643,826)
280,274
(1,968,979)
(9,918)
(2,945,201)
47,237,548
38,006,417
9,231,130
6,053,207
3,177,923
784,805
23,102
27,123
590,052
-
29,275
18,886
96,365
394,309
325,616
-
68,693
3,568,419
61,258
907
44,439
15,635
-
275
397,910
88,797
26
-
-
2,978
-
297,368
8,738
3,231,767
1,508,740
(103,381)
(5,856)
1,832,264
33,455,328
28,375,676
5,079,652
4,715,304
364,348
182,426
6,540
26,591
51,884
-
8,620
19,036
69,752
365,797
285,582
-
80,215
180,976
1,193,833
1,514
-
1,145,398
23,574
23,346
187,059
21,479
11,551
-
-
9,406
-
39,797
104,823
1,187,750
69,030
1,069,804
4,937
43,978

13 連結財務諸表連結財務諸表(Consolidated Financial StatementsConsolidated Financial Statements)連結財務諸表(Consolidated Financial Statements)
2010/32009/32008/3
連結財務諸表Consolidated Financial Statements
営業活動によるキャッシュ・フロー 税金等調整前当期純利益(損失) 減価償却費 のれん償却額 貸倒引当金の増加額(減少額) 賞与引当金の増加額(減少額) 役員賞与引当金の増加額(減少額) 製品保証引当金の増加額(減少額) 退職給付引当金の増加額(減少額) 役員退職慰労引当金の増加額(減少額) 受取利息及び受取配当金 支払利息 為替差益 持分法による投資利益(損失) 固定資産売却益 固定資産売却損 固定資産除却損 投資有価証券売却損 投資有価証券売却益 減損損失 貸倒損失 持分変動損失 投資有価証券評価損 売上債権の増加額(減少額) たな卸資産の増加額(減少額) 仕入債務の増加額(減少額) 未払費用の増加額(減少額) 未払金の増加額(減少額) 前受金の増加額(減少額) 役員賞与の支払額 その他小計 利息及び配当金の受取額 利息の支払額 法人税等の支払額営業活動によるキャッシュ・フロー投資活動によるキャッシュ・フロー 投資有価証券の取得による支出 投資有価証券の売却による収入 有形固定資産の取得による支出 有形固定資産の売却による収入 無形固定資産の取得による支出 3ヶ月超定期預金の払戻による収入 3ヶ月超定期預金の預入による支出 貸付金の回収による収入 少数株主からの追加取得による支出 その他投資活動によるキャッシュ・フロー財務活動によるキャッシュ・フロー 短期借入金の純増減額 長期借入による収入 長期借入金の返済による支出 社債発行による収入 社債償還による支出 株式の発行による収入 少数株主からの払込みによる収入 自己株式の取得による支出 自己株式の売却による収入 配当金の支払額 少数株主への配当金の支払額 その他財務活動によるキャッシュ・フロー現金及び現金同等物に係る換算差額現金及び現金同等物の増加額(減少額)現金及び現金同等物の期首残高現金及び現金同等物の期末残高
Cash flows from operating activities
Income before income taxes and minority interests(loss)Depreciation and amortization
Amortization of consolidation goodwill
Increase (Decrease)in allowance for doubtful accounts
Increase (Decrease)in accrued bonuses
Increase (Decrease)in reserve for directors' and corporate auditors' bonuses
Increase (Decrease)in reserve for product guarantee
Increase (Decrease) in reserve for retirement benefits
Increase(Decrease)in reserve for retirement benefits for directors and corporate auditors
Interest and dividend income
Interest expenses
Foreign exchange gain
Investment gain(loss)on equity method
Gain on sales of fixed assets
Loss on sales of fixed assets
Loss on retirement of fixed assets
Loss on sales of investment securities
Gain on sales of investment securities
Impairment loss
Bad debt write-offs
Loss on change holding ratio of subsidiary
Net unrealized loss on investment securities
Increase (Decrease) in notes and accounts receivable-trade
Increase (Decrease) in inventories
Increase (Decrease)in account payable-purchases
Increase (Decrease)in accrued expenses
Increase (Decrease)in account receivables
Increase (Decrease)in advance received
Directors' and corporate auditors' bonuses paid
Other
Subtotal
Interest and dividends received
Interest paid
Payments of income taxes,etc.
Net cash provided by(used in)operating activities
Cash flows from investing activities
Purchases of investment securities
Proceeds from sales of investment securities
Purchases of tangible fixed assets
Proceeds from sales of tangible fixed assets
Purchases of intangible fixed assets
Proceeds from refund of time deposits with a deposit period of over three months
Payment for time deposits with a deposit period of over three months
Proceeds from loans receivable
Payments for additional purchase from minority interests
Other
Net cash used in investing activities
Cash flows from financing activities
Net increase(decrease)in short-term borrowings
Proceeds from long-term borrowings
Repayment of long-term borrowings
Proceeds from issuance of bonds
Bonds redemption
Proceeds from stock issuance
Proceeds from capital increase by minority shareholders
Purchase of treasury stock
Proceeds from sales of treasury stock
Dividends paid
Dividends paid to minority interest
Other
Net cash provided by(used in)financing activities
Effect of exchange rate changes on cash and cash equivalents
Increase(Decrease)in cash and cash equivalents
Cash and cash equivalents at beginning of period
Cash and cash equivalents at end of period
連結 Consolidated
キャッシュ・フロー計算書 Statements of Cash Flows
(千円/¥ in thousands)
3,231,767 714,698
11,900 369,024
30,118 (1,550)
63,316 49,510
(121,510)(50,225)
325,616 (620,125)- (907)
26 88,797 -
(44,439)2,978 - 8,738 -
(4,366,876)62,951
3,035,815 (148,907)(91,441)1,003,899 -
(64,148)3,489,028
47,281 (235,633)(267,799)3,032,876
(321,835)91,794
(2,638,685)2,914
(41,621)305,631 (71,001)
7,609 (161,951)-
(2,827,144)
375,050 3,900,000
(4,072,814)-
(200,000)-
235,389 (183,968)-
(241,995)- -
(188,338)(34,708)(17,315)5,220,775 5,203,460
2007/3
3,104,236 588,091
1,560 129,896 (1,463)
84,450 (43,859)
72,890 46,639
(50,647)261,891 (9,881)-
(9,304)43,792 24,225 - - - - -
121,985 2,037,128 2,000,628
(5,147,543)(274,260)(145,097)(1,400,309)(84,500)
421,287 1,771,836
49,970 (245,775)(2,668,525)(1,092,494)
(18,344)-
(669,655)116,842 (78,062)
300 (219,900)
57,802 -
(4,798)(815,815)
(1,853,654)1,500,000
(1,763,345)492,319
(300,000)3,040,910 -(96)
253,704 (114,142)(10,013)(366)
1,245,314 38,075
(624,920)5,845,695 5,220,775
2006/3
2,624,444 555,786
1,560 176,900
26,224 -
46,267 131,383 (19,145)(43,747)
228,654 (17,277)(120)(481)42,968 42,512 11,238 (5,827)
13,281 95,200 -
25,100 (2,010,674)(5,251,998)
4,190,804 894,756 134,934
1,213,356 (56,900)(67,955)2,981,244
43,567 (237,912)(1,533,432)
1,253,465
(38,020)21,227
(430,237)24,961
(49,587)279,024 -
58,654 - -
(133,977)
(6,096,850)5,600,000 (897,493)
885,068 (100,000)- 7,837 - -
(91,313)(600)(2,580)(695,933)
70,340 493,895
5,351,799 5,845,695
(4,643,826) 938,327
14,201 1,482,859
13,942(74,260)
50,671(370,402)
21,235(38,796) 390,144 134,364-(484) 1,275
20,907- - - - -
251,111(506,904)(2,326,416)
2,009,885(785,680)
338,612 238,780-
(719,607)(3,560,058)
39,910(490,938)(1,333,187)(5,344,273)
(17,619)-
(1,500,902) 1,508
(145,764) 65,200(65,200)-
(7,299)-
(1,670,077)
8,204,750 5,301,771(2,388,216)
3,000,000(600,000)--
(58,233)-
(266,060)-
(27,556) 13,166,456(239,249) 5,912,854 5,203,460
11,116,314
1,187,750 900,890 13,941
(1,135,808) (71,047) 38,027
(220,001) (247,258)
50,725 (33,132) 285,582 (94,483)
344 (1,514) 11,552 21,479--
9,406---
7,159,915 6,937,114
(4,658,309) 310,145
(350,123) (1,056,985)
- 926,741
9,984,953 31,970
(281,049) (79,832)
9,656,041
(27,679)-
(113,635) 6,419
(189,599)---
(4,604)-
(329,100)
(11,165,395) 3,800,000
(1,957,344)-
(850,000)----
(105,067)-
(62,361) (10,340,167)
18,667 (994,558)
11,116,314 10,121,756
14
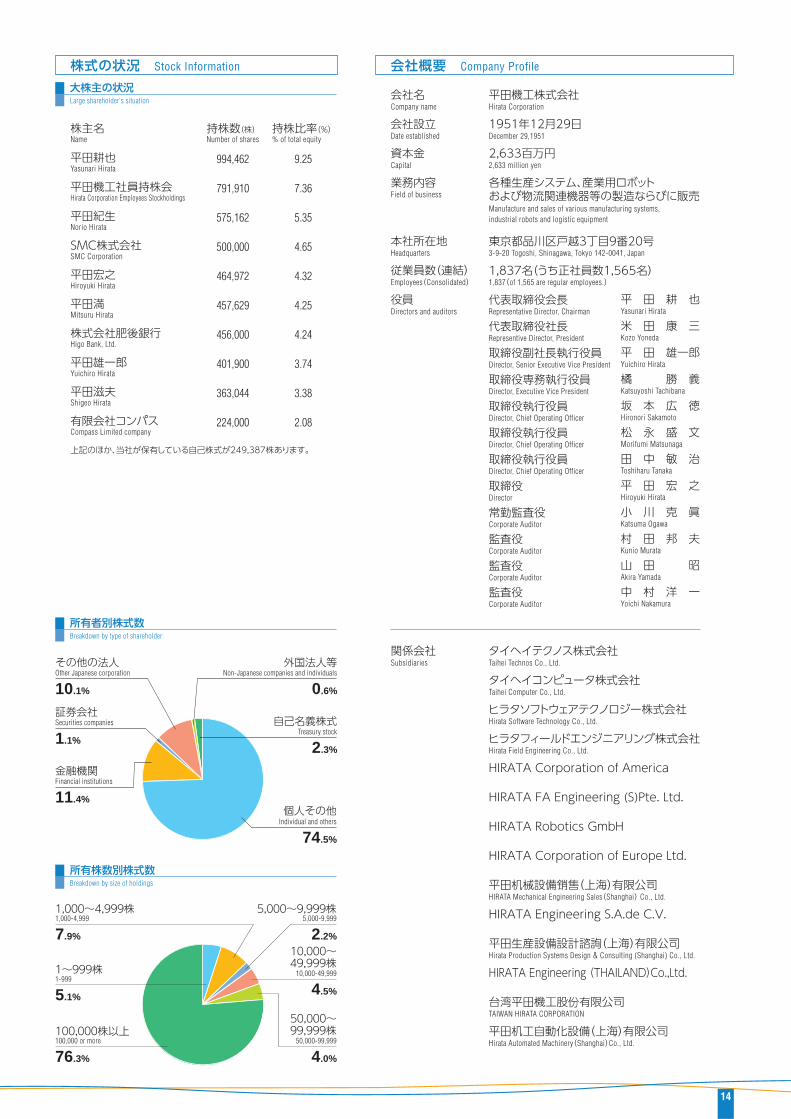
個人その他
74.5%
Individual and others
外国法人等
0.6%
Non-Japanese companies and individuals
金融機関
11.4%
Financial institutions
その他の法人
10.1%
Other Japanese corporation
証券会社
1.1%
Securities companies 自己名義株式
2.3%
Treasury stock
4.0%
50,000-99,999
50,000~99,999株
5,000~9,999株
2.2%
5,000-9,999
100,000株以上
76.3%
100,000 or more
1,000~4,999株
7.9%
1,000-4,999
1~999株
5.1%
1-999
4.5%
10,000-49,999
10,000~49,999株
所有者別株式数Breakdown by type of shareholder
大株主の状況Large shareholder's situation
所有株数別株式数Breakdown by size of holdings
株主名
平田耕也
平田機工社員持株会
平田紀生
SMC株式会社
平田宏之
平田満
株式会社肥後銀行
平田雄一郎
平田滋夫
有限会社コンパス
Name
Yasunari Hirata
Hirata Corporation Employees Stockholdings
Norio Hirata
SMC Corporation
Hiroyuki Hirata
Mitsuru Hirata
Higo Bank, Ltd.
Yuichiro Hirata
Shigeo Hirata
Compass Limited company
上記のほか、当社が保有している自己株式が249,387株あります。
持株数(株)Number of shares
持株比率(%)
9.25
7.36
5.35
4.65
4.32
4.25
4.24
3.74
3.38
2.08
% of total equity
株式の状況 Stock Information 会社概要 Company Profile
994,462
791,910
575,162
500,000
464,972
457,629
456,000
401,900
363,044
224,000
会社名
会社設立
資本金
業務内容
本社所在地
従業員数(連結)
役員
Company name
Date established
Capital
Field of business
Headquarters
Employees(Consolidated)
Directors and auditors
Manufacture and sales of various manufacturing systems, industrial robots and logistic equipment
3-9-20 Togoshi, Shinagawa, Tokyo 142-0041, Japan
1,837(of 1,565 are regular employees.)
平田機工株式会社
1951年12月29日
2,633百万円
各種生産システム、産業用ロボットおよび物流関連機器等の製造ならびに販売
東京都品川区戸越3丁目9番20号
1,837名(うち正社員数1,565名)
代表取締役会長
代表取締役社長
取締役副社長執行役員
取締役専務執行役員
取締役執行役員
取締役執行役員
取締役執行役員
取締役
常勤監査役
監査役
監査役
監査役
平 田 耕 也
米 田 康 三
平 田 雄一郎
橘 勝 義
坂 本 広 徳
松 永 盛 文
田 中 敏 治
平 田 宏 之
小 川 克 眞
村 田 邦 夫
山 田 昭
中 村 洋 一
Hirata Corporation
December 29,1951
2,633 million yen
Representative Director, Chairman
Representive Director, President
Director, Senior Executive Vice President
Director, Executive Vice President
Director, Chief Operating Officer
Director, Chief Operating Officer
Director, Chief Operating Officer
Director
Corporate Auditor
Corporate Auditor
Corporate Auditor
Corporate Auditor
関係会社Subsidiaries
タイヘイテクノス株式会社
タイヘイコンピュータ株式会社
ヒラタソフトウェアテクノロジー株式会社
ヒラタフィールドエンジニアリング株式会社
HIRATA Corporation of America
HIRATA FA Engineering (S)Pte. Ltd.
HIRATA Robotics GmbH
HIRATA Corporation of Europe Ltd.
平田机械設備 售(上海)有限公司
HIRATA Engineering S.A.de C.V.
平田生産設備設計諮詢(上海)有限公司
HIRATA Engineering (THAILAND)Co.,Ltd.
台湾平田機工股 有限公司
平田机工自動化設備(上海)有限公司
Taihei Technos Co., Ltd.
Taihei Computer Co., Ltd.
Hirata Software Technology Co., Ltd.
Hirata Field Engineering Co., Ltd.
HIRATA Mechanical Engineering Sales(Shanghai) Co., Ltd.
Hirata Production Systems Design & Consulting (Shanghai) Co., Ltd.
TAIWAN HIRATA CORPORATION
Hirata Automated Machinery(Shanghai)Co., Ltd.
Yasunari Hirata
Kozo Yoneda
Yuichiro Hirata
Katsuyoshi Tachibana
Hironori Sakamoto
Morifumi Matsunaga
Toshiharu Tanaka
Hiroyuki Hirata
Katsuma Ogawa
Kunio Murata
Akira Yamada
Yoichi Nakamura