Embed Size (px)
Citation preview
2010 IIHF World Junior Championship
Economic Impact Assessment
April 2010
The following analysis provides the economic impact of the 2010 IIHF World Junior Championship hosted by Hockey Canada in the cities of Saskatoon and Regina, Saskatchewan, from December 26, 2009 to January 5, 2010, as well as an estimate of the impact arising from the pre‐tournament games hosted throughout the province prior to the event, as generated by the Sport Tourism Economic Assessment Model, Professional version.
2010 IIHF World Junior Championship – Economic Impact Assessment
Economic Impact Assessment Funding Partner
The Canadian Sport Tourism Alliance wishes to acknowledge the financial support of the 2010 IIHF World Junior Championship host organizing committee in the completion of this report.
For more information about this report, please contact: Tony Fisher, Canadian Sport Tourism Alliance, [email protected] Scott Farley, Hockey Canada, [email protected]
2
2010 IIHF World Junior Championship – Economic Impact Assessment
Contents
1.0 Background ............................................................................................................................................. 4
2.0 Methodology / Survey Results ................................................................................................................ 5
3.0 Operations / Capital Expenditures ........................................................................................................ 11
4.0 Economic Impact Results ...................................................................................................................... 12
5.0 Conclusion ............................................................................................................................................. 15
Appendix 1: Economic Impact Methodology – Sport Tourism Economic Assessment Model ................... 16
Appendix 2: Glossary of Terms used by STEAM .......................................................................................... 18
Appendix 3: 2010 IIHF World Junior Championship Survey ....................................................................... 20
3
2010 IIHF World Junior Championship – Economic Impact Assessment
1.0 Background
The 2010 IIHF World Junior Hockey Championship ran from December 26, 2009 to January 5, 2010 and featured a total of 31 games in the Province of Saskatchewan, with 10 games being hosted in Regina and the remainder being held in Saskatoon. The ten best national junior teams in the world, consisting of Latvia, Slovakia, Switzerland, Austria, the Czech Republic, Finland, Sweden, Russia, the United States and Canada competed over the 11 days of the event. The tournament was a huge success, selling nearly 302,000 seats in during the competition, with an additional 23,500 seats sold in six pre‐tournament cities throughout the Province. The tournament saw Canada’s gold medal streak at the IIHF World Junior Championships end at five, as the gold medal game resulted in a 6‐5 overtime loss to the United States at the Credit Union Centre in Saskatoon.
In addition to showcasing the talents of the world’s top junior hockey players, the event provided a significant economic boost to the economies of the host communities by attracting thousands of spectators to the province. The combined expenditures of these visitors, along with those of the event organizers, generated substantial economic benefits in the host cities of Regina and Saskatoon, the other pre‐tournament host communities, and for the Province of Saskatchewan as a whole. This report details the measurement of the economic impact of the 2010 IIHF World Junior Championship for the host cities and the exhibition game host communities. The next section of the report provides details of the intercept survey that was conducted in order to ascertain both the number of visitors and the expenditures that visitors made while attending the event. Section 3 provides details of the operational and capital expenditures that further contributed to the impact of the event, while Section 4 presents the STEAM‐PRO1 results from the combined expenditures these groups. Section 5 concludes the document with a summary of the findings. The appendices include additional information regarding the economic impact model, a glossary of the terms used and a copy of the survey.
1The Canadian Sport Tourism Alliance’s (CSTA’s) Sport Tourism Economic Assessment Model, Professional version (STEAM PRO) was used to generate the economic impact estimates detailed in this report. STEAM PRO, which was developed in 2006, is a model that has been designed to incorporate the results of primary data collected from event visitors and the budget / capital expenditures of event organizers and others to prepare economic impact assessments. The model is based on the Canadian Tourism Research Institute’s (CTRI ‐ a branch of The Conference Board of Canada) TEAM model, which is the most widely used tourism economic impact model in Canada. The results of STEAM PRO are fully consistent with the CSTA’s STEAM model. A more detailed description of STEAM PRO is contained within Appendix 1.
4
2010 IIHF World Junior Championship – Economic Impact Assessment
2.0 Methodology / Survey Results
Information regarding the composition and spending of spectators at the 2010 IIHF World Junior Championship was collected through the administration of a face to face intercept survey. The survey captured essential information to determine the composition of spectators attending the event and the expenditures of out‐of‐town visitors to the host communities. The survey was conducted using Palm PDAs running Techneos Entryware software.2 A copy of the survey instrument used can be found in Appendix 3.3
Survey Results
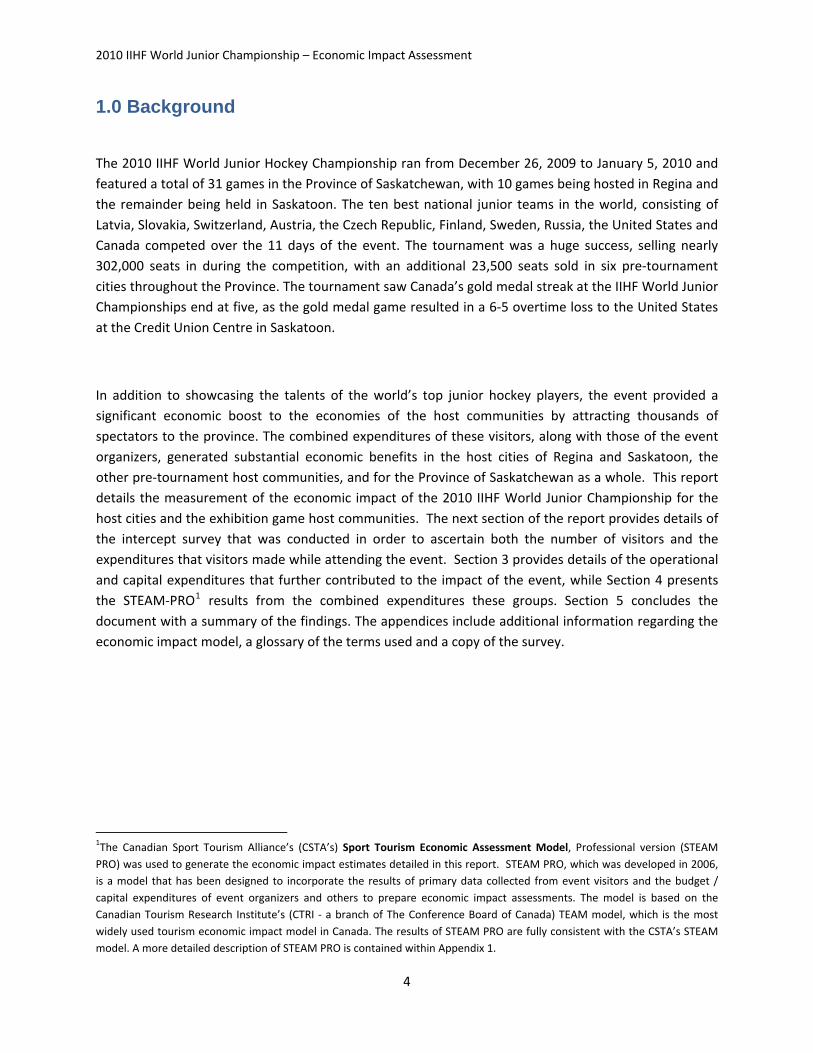
A total of 1,061 visitor parties were approached at the two venues over the course of the event (609 in Saskatoon, 452 in Regina), with 1,023 parties agreeing to participate (595 in Saskatoon, 428 in Regina; a rejection rate of 2.3% /5.3%). Of this group, 38 parties had been previously surveyed (18 in Saskatoon (3.0%) and 20 in Regina (4.4%)), yielding a total of 985 complete surveys (577 in Saskatoon, 408 in Regina). From this group, the vast majority (96.3% or 945 parties) were spectators, with the remaining group comprising of parents, Hockey Canada representatives, scouts or others such as those working at the event (note, those who were working at the event are also excluded, for a total of valid 955 surveys). Figure 2.1 illustrates the survey sample incidence in both Saskatoon and Regina.4
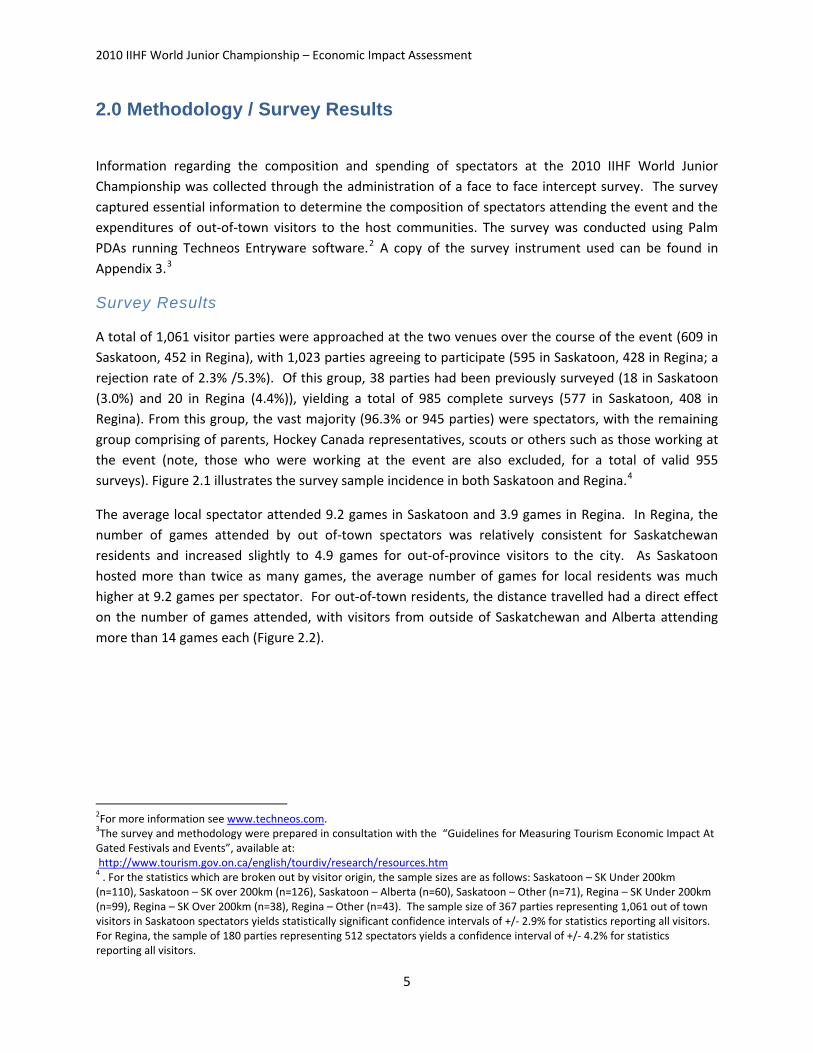
The average local spectator attended 9.2 games in Saskatoon and 3.9 games in Regina. In Regina, the number of games attended by out of‐town spectators was relatively consistent for Saskatchewan residents and increased slightly to 4.9 games for out‐of‐province visitors to the city. As Saskatoon hosted more than twice as many games, the average number of games for local residents was much higher at 9.2 games per spectator. For out‐of‐town residents, the distance travelled had a direct effect on the number of games attended, with visitors from outside of Saskatchewan and Alberta attending more than 14 games each (Figure 2.2).
2For more information see www.techneos.com. 3The survey and methodology were prepared in consultation with the “Guidelines for Measuring Tourism Economic Impact At Gated Festivals and Events”, available at: http://www.tourism.gov.on.ca/english/tourdiv/research/resources.htm 4 . For the statistics which are broken out by visitor origin, the sample sizes are as follows: Saskatoon – SK Under 200km (n=110), Saskatoon – SK over 200km (n=126), Saskatoon – Alberta (n=60), Saskatoon – Other (n=71), Regina – SK Under 200km (n=99), Regina – SK Over 200km (n=38), Regina – Other (n=43). The sample size of 367 parties representing 1,061 out of town visitors in Saskatoon spectators yields statistically significant confidence intervals of +/‐ 2.9% for statistics reporting all visitors. For Regina, the sample of 180 parties representing 512 spectators yields a confidence interval of +/‐ 4.2% for statistics reporting all visitors.
5
2010 IIHF World Junior Championship – Economic Impact Assessment
Figure 2.1 Survey Respondent Origin
Sample Size = 367 Sample Size = 180
SK Under 200km30%
SK Over 200km34%
AB17%
Other Can17%
US / Int'l2%
Saskatoon
SK Under 200km55%
SK Over 200km21%
AB 11%
Other Can8%
US / Int'l5%
Regina
Figure 2.2 Games Attended – Local vs. Out‐of‐Town
14.1
12.412.3
9.69.2
3.9 3.53.4
4.9
0
2
4
6
8
10
12
14
16
Local SK Under 200km
SK Over 200km
Alberta Other Local SK Under 200km
SK Over 200km
Other
Saskatoon Regina
6
2010 IIHF World Junior Championship – Economic Impact Assessment
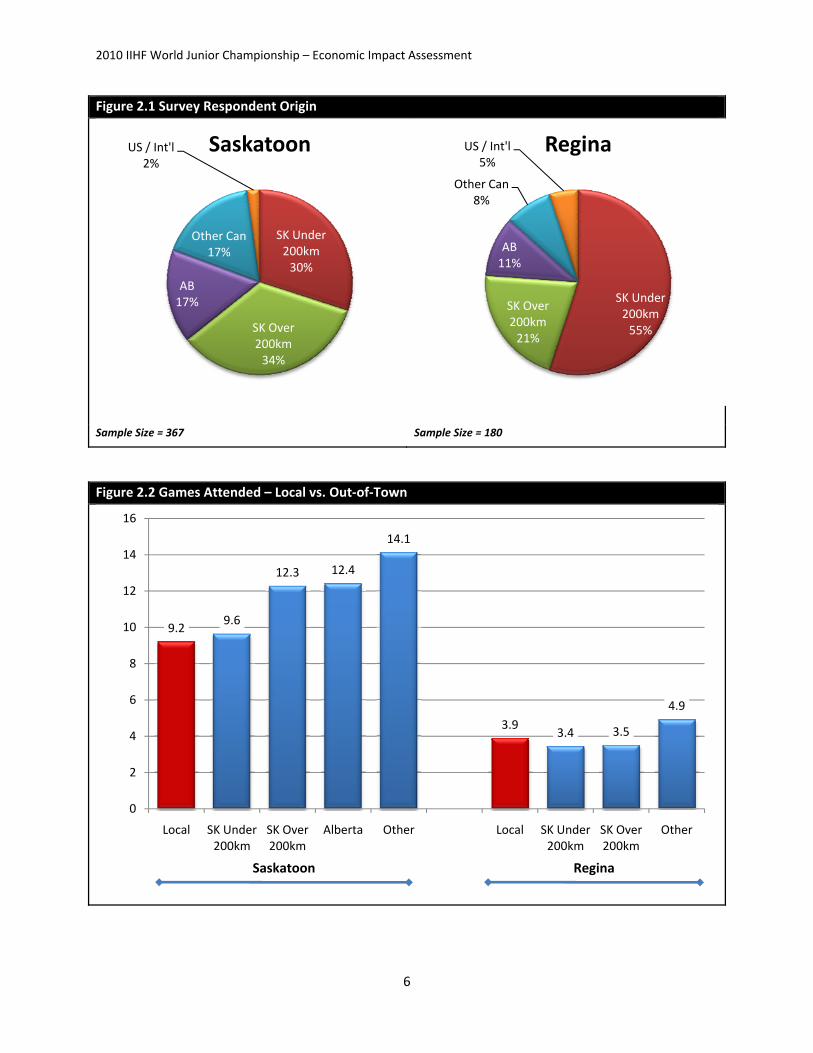
Attendance at the event was calculated through the use of the survey results, as illustrated in Table 2.1 Total attendance at each of the host cities was multiplied by the local/visitor share as determined by the survey to give the total number of games attended by locals and visitors. This figure was then divided by the average number of games attended per spectator. In total, the 2010 IIHF World Junior Championships attracted 13,100 out‐of‐town spectators to Saskatoon and 7,890 out‐of‐town spectators to Regina.
Table 2.1 Spectator attendance calculations
Saskatoon Regina Total Total Attendance 238,278 63,588 301,866
Local / Visitor Share of
Attendance
Local (%) 34.9% 52.7% 38.67%
Visitor (%) 65.1% 47.3% 61.33%
Attendance Local 83,222 33,522 116,744
Visitor 155,056 30,066 185,122
Games / Spectator Local 9.2 3.9 6.6
Visitor 11.8 3.8 8.8
Spectators Local 9,034 8,623 17,657
Visitor 13,099 7,887 20,986
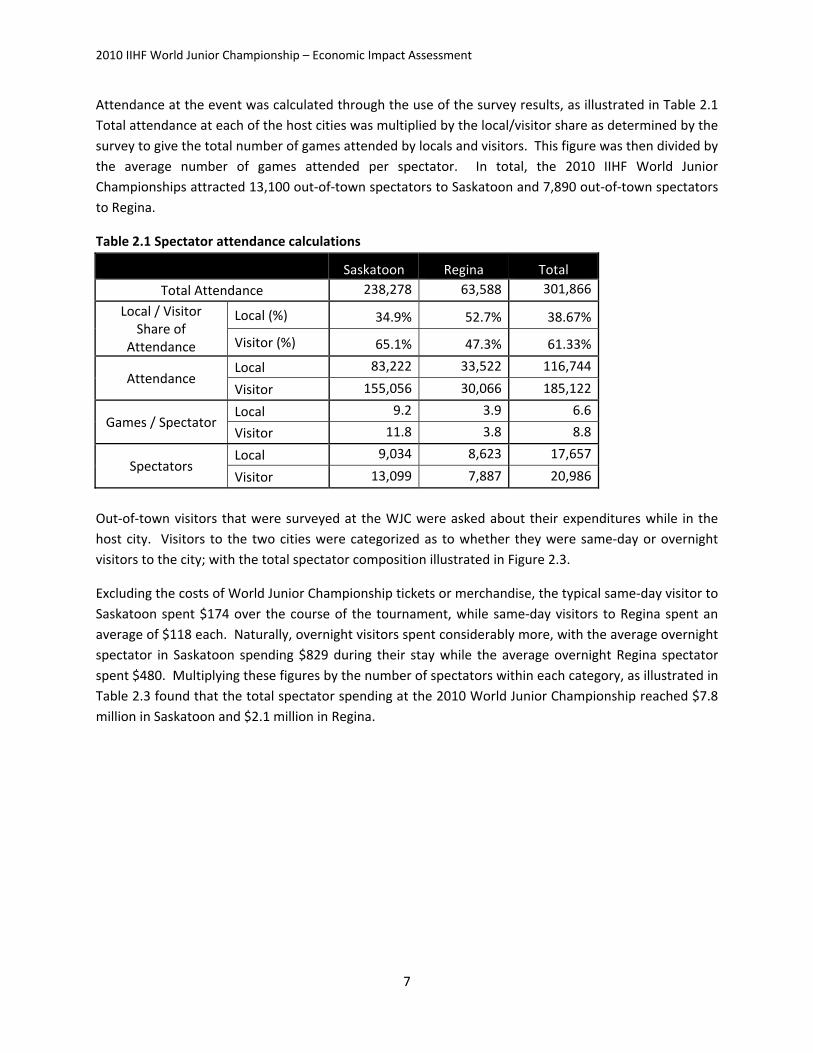
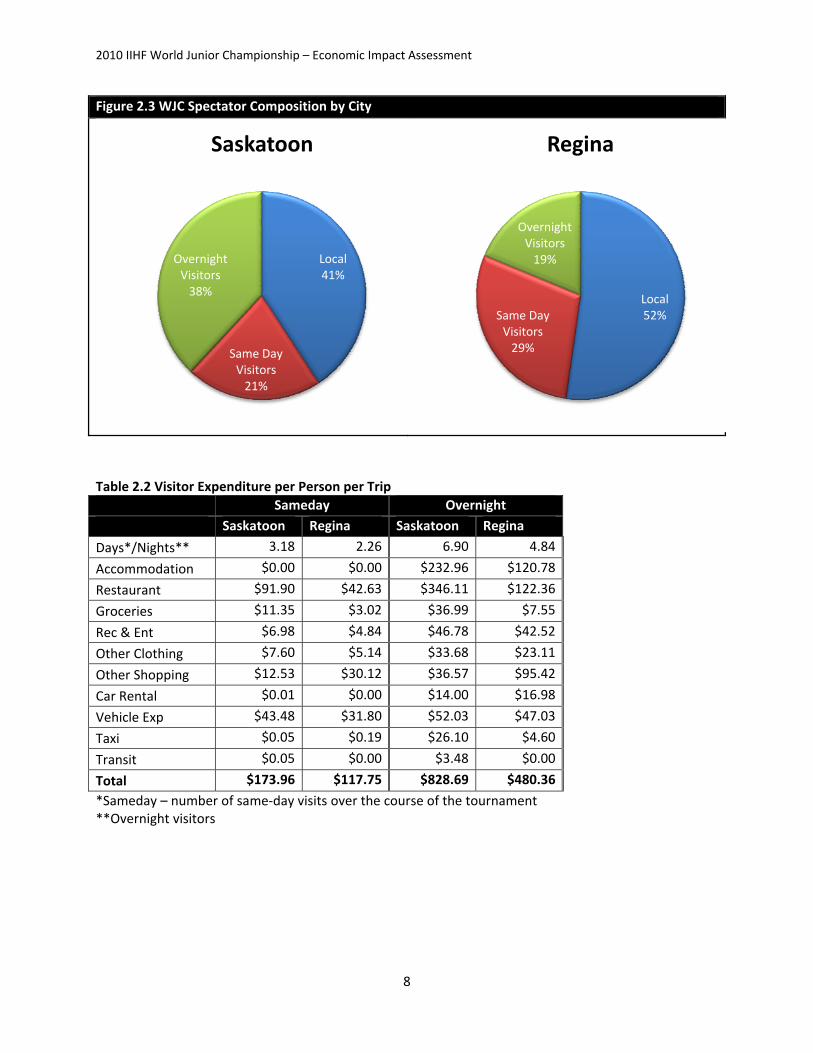
Out‐of‐town visitors that were surveyed at the WJC were asked about their expenditures while in the host city. Visitors to the two cities were categorized as to whether they were same‐day or overnight visitors to the city; with the total spectator composition illustrated in Figure 2.3.
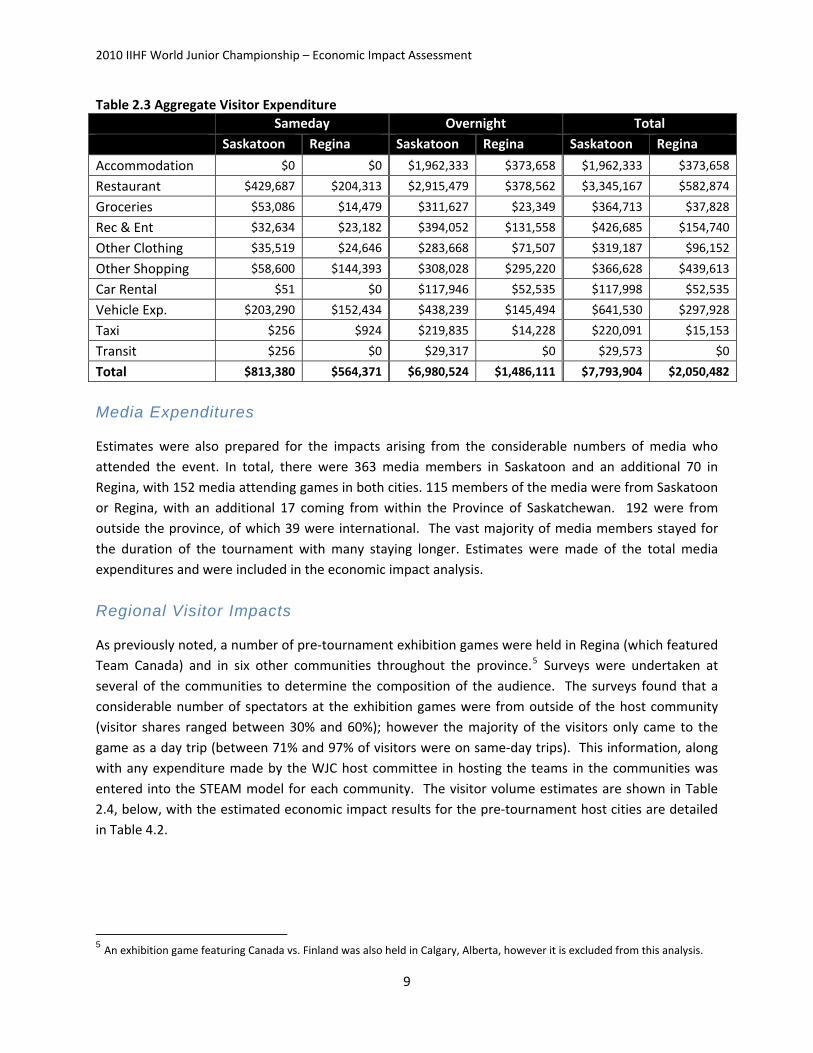
Excluding the costs of World Junior Championship tickets or merchandise, the typical same‐day visitor to Saskatoon spent $174 over the course of the tournament, while same‐day visitors to Regina spent an average of $118 each. Naturally, overnight visitors spent considerably more, with the average overnight spectator in Saskatoon spending $829 during their stay while the average overnight Regina spectator spent $480. Multiplying these figures by the number of spectators within each category, as illustrated in Table 2.3 found that the total spectator spending at the 2010 World Junior Championship reached $7.8 million in Saskatoon and $2.1 million in Regina.
7
2010 IIHF World Junior Championship – Economic Impact Assessment
Figure 2.3 WJC Spectator Composition by City
Local41%
Same Day Visitors21%
Overnight Visitors38%
Saskatoon
Local52%Same Day
Visitors29%
Overnight Visitors19%
Regina
Table 2.2 Visitor Expenditure per Person per Trip Sameday Overnight Saskatoon Regina Saskatoon Regina
Days*/Nights** 3.18 2.26 6.90 4.84
Accommodation $0.00 $0.00 $232.96 $120.78
Restaurant $91.90 $42.63 $346.11 $122.36
Groceries $11.35 $3.02 $36.99 $7.55
Rec & Ent $6.98 $4.84 $46.78 $42.52
Other Clothing $7.60 $5.14 $33.68 $23.11
Other Shopping $12.53 $30.12 $36.57 $95.42
Car Rental $0.01 $0.00 $14.00 $16.98
Vehicle Exp $43.48 $31.80 $52.03 $47.03
Taxi $0.05 $0.19 $26.10 $4.60
Transit $0.05 $0.00 $3.48 $0.00
Total $173.96 $117.75 $828.69 $480.36
*Sameday – number of same‐day visits over the course of the tournament **Overnight visitors
8
2010 IIHF World Junior Championship – Economic Impact Assessment
Table 2.3 Aggregate Visitor Expenditure Sameday Overnight Total Saskatoon Regina Saskatoon Regina Saskatoon Regina
Accommodation $0 $0 $1,962,333 $373,658 $1,962,333 $373,658
Restaurant $429,687 $204,313 $2,915,479 $378,562 $3,345,167 $582,874
Groceries $53,086 $14,479 $311,627 $23,349 $364,713 $37,828
Rec & Ent $32,634 $23,182 $394,052 $131,558 $426,685 $154,740
Other Clothing $35,519 $24,646 $283,668 $71,507 $319,187 $96,152
Other Shopping $58,600 $144,393 $308,028 $295,220 $366,628 $439,613
Car Rental $51 $0 $117,946 $52,535 $117,998 $52,535
Vehicle Exp. $203,290 $152,434 $438,239 $145,494 $641,530 $297,928
Taxi $256 $924 $219,835 $14,228 $220,091 $15,153
Transit $256 $0 $29,317 $0 $29,573 $0
Total $813,380 $564,371 $6,980,524 $1,486,111 $7,793,904 $2,050,482
Media Expenditures
Estimates were also prepared for the impacts arising from the considerable numbers of media who attended the event. In total, there were 363 media members in Saskatoon and an additional 70 in Regina, with 152 media attending games in both cities. 115 members of the media were from Saskatoon or Regina, with an additional 17 coming from within the Province of Saskatchewan. 192 were from outside the province, of which 39 were international. The vast majority of media members stayed for the duration of the tournament with many staying longer. Estimates were made of the total media expenditures and were included in the economic impact analysis.
Regional Visitor Impacts
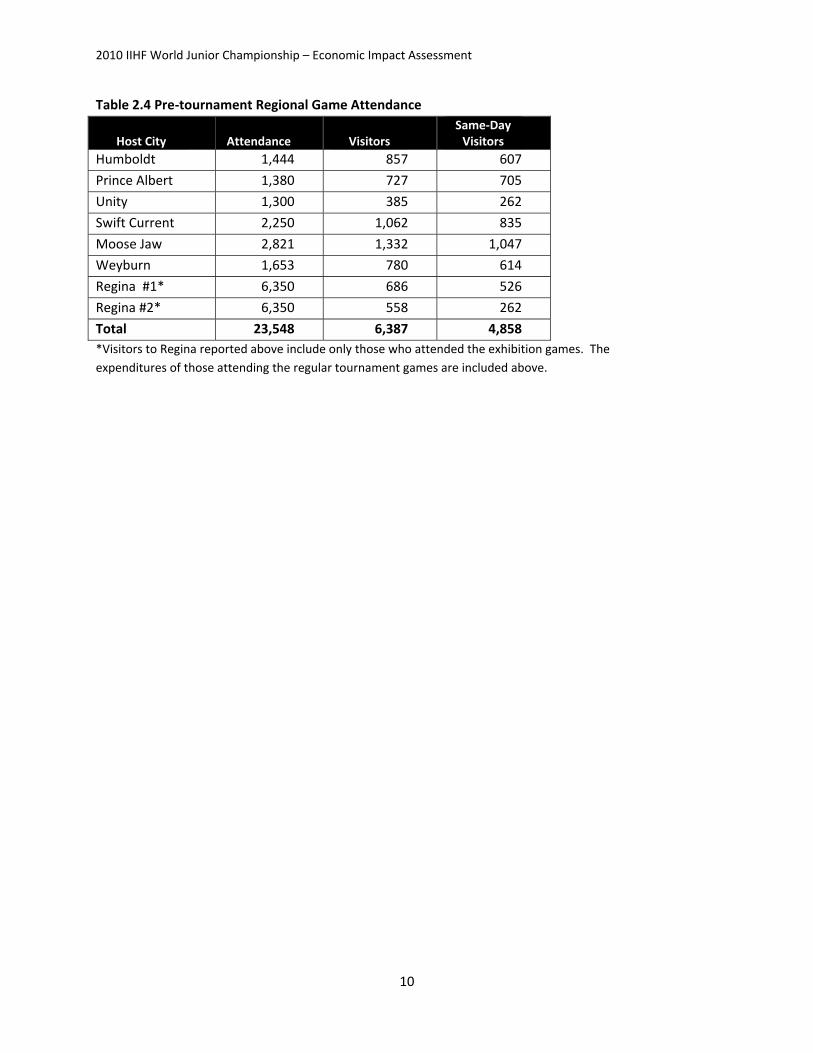
As previously noted, a number of pre‐tournament exhibition games were held in Regina (which featured Team Canada) and in six other communities throughout the province.5 Surveys were undertaken at several of the communities to determine the composition of the audience. The surveys found that a considerable number of spectators at the exhibition games were from outside of the host community (visitor shares ranged between 30% and 60%); however the majority of the visitors only came to the game as a day trip (between 71% and 97% of visitors were on same‐day trips). This information, along with any expenditure made by the WJC host committee in hosting the teams in the communities was entered into the STEAM model for each community. The visitor volume estimates are shown in Table 2.4, below, with the estimated economic impact results for the pre‐tournament host cities are detailed in Table 4.2.
5 An exhibition game featuring Canada vs. Finland was also held in Calgary, Alberta, however it is excluded from this analysis.
9
2010 IIHF World Junior Championship – Economic Impact Assessment
Table 2.4 Pre‐tournament Regional Game Attendance
Host City Attendance Visitors Same‐Day Visitors
Humboldt 1,444 857 607
Prince Albert 1,380 727 705
Unity 1,300 385 262
Swift Current 2,250 1,062 835
Moose Jaw 2,821 1,332 1,047
Weyburn 1,653 780 614
Regina #1* 6,350 686 526
Regina #2* 6,350 558 262
Total 23,548 6,387 4,858 *Visitors to Regina reported above include only those who attended the exhibition games. The expenditures of those attending the regular tournament games are included above.
10
2010 IIHF World Junior Championship – Economic Impact Assessment
3.0 Operations / Capital Expenditures
The 2010 IIHF World Junior Championship host organizing committee invested significantly in producing a high‐caliber event in both Saskatoon and Regina. In addition, operational expenditures were also made by Hockey Canada, event sponsors, and members of the media, which have been factored into the analysis. In both cities, the event also provided the impetus to invest in significant capital upgrades, totaling $4.2 million in Regina and $10.6 million in Saskatoon.
The event also benefited from the efforts of more than 2,400 volunteers, who made a significant contribution to the success of the Championship.
11
2010 IIHF World Junior Championship – Economic Impact Assessment
4.0 Economic Impact Results
The combined spending of the more than 27,000 visitors who attended the pre‐competition and tournament games associated with the 2010 IIHF World Junior Championship, plus the revenues and expenditures of the host organizing committee, media, and the capital upgrades to facilities as a result of hosting event totalled $50.6 million. This spending generated an estimated $86.6 million in economic activity for the Province of Saskatchewan, of which $49.6 million occurred in Saskatoon and $18.9 million occurred in Regina. These expenditures supported $17.5 million in wages and salaries in the Province through the support of 489 jobs, of which an estimated 312 were in Saskatoon and 86 were in Regina.6 The total net economic activity (GDP) generated by the event was $48.4 million throughout the Province, with $27.3 million occurring in Saskatoon and $11.2 million occurring in Regina.
Considerable tax revenues were also produced by the event, totaling $10.4 million. The event supported federal government tax revenues of $4.8 million, and an additional $4.1 million in taxes accrued to the Province of Saskatchewan. Moreover, $1.5 million in taxes was supported in the Saskatchewan municipalities, of which $858,000 accrued in the Saskatoon and $231,000 accrued in Regina.
6 A job reported in this study refers to the number of jobs, vs. full time equivalent (FTE: two people working half time would represent two jobs or one FTE).
12
2010 IIHF World Junior Championship – Economic Impact Assessment
13
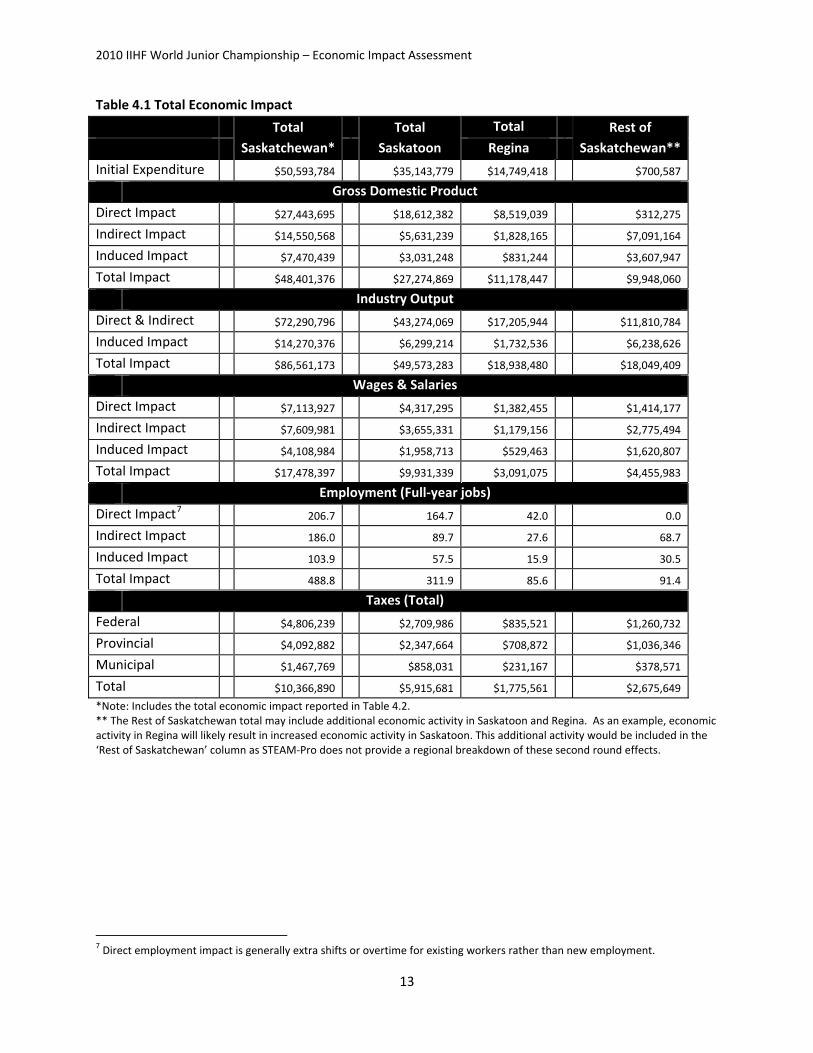
Table 4.1 Total Economic Impact
Total Saskatchewan*
Total Saskatoon
Total Rest of Saskatchewan** Regina
Initial Expenditure $50,593,784 $35,143,779 $14,749,418 $700,587
Gross Domestic Product
Direct Impact $27,443,695 $18,612,382 $8,519,039 $312,275
Indirect Impact $14,550,568 $5,631,239 $1,828,165 $7,091,164
Induced Impact $7,470,439 $3,031,248 $831,244 $3,607,947
Total Impact $48,401,376 $27,274,869 $11,178,447 $9,948,060
Industry Output
Direct & Indirect $72,290,796 $43,274,069 $17,205,944 $11,810,784
Induced Impact $14,270,376 $6,299,214 $1,732,536 $6,238,626
Total Impact $86,561,173 $49,573,283 $18,938,480 $18,049,409
Wages & Salaries
Direct Impact $7,113,927 $4,317,295 $1,382,455 $1,414,177
Indirect Impact $7,609,981 $3,655,331 $1,179,156 $2,775,494
Induced Impact $4,108,984 $1,958,713 $529,463 $1,620,807
Total Impact $17,478,397 $9,931,339 $3,091,075 $4,455,983
Employment (Full‐year jobs)
Direct Impact7 206.7 164.7 42.0 0.0
Indirect Impact 186.0 89.7 27.6 68.7
Induced Impact 103.9 57.5 15.9 30.5
Total Impact 488.8 311.9 85.6 91.4
Taxes (Total)
Federal $4,806,239 $2,709,986 $835,521 $1,260,732
Provincial $4,092,882 $2,347,664 $708,872 $1,036,346
Municipal $1,467,769 $858,031 $231,167 $378,571
Total $10,366,890 $5,915,681 $1,775,561 $2,675,649
*Note: Includes the total economic impact reported in Table 4.2. ** The Rest of Saskatchewan total may include additional economic activity in Saskatoon and Regina. As an example, economic activity in Regina will likely result in increased economic activity in Saskatoon. This additional activity would be included in the ‘Rest of Saskatchewan’ column as STEAM‐Pro does not provide a regional breakdown of these second round effects.
7 Direct employment impact is generally extra shifts or overtime for existing workers rather than new employment.
2010 IIHF World Junior Championship – Economic Impact Assessment
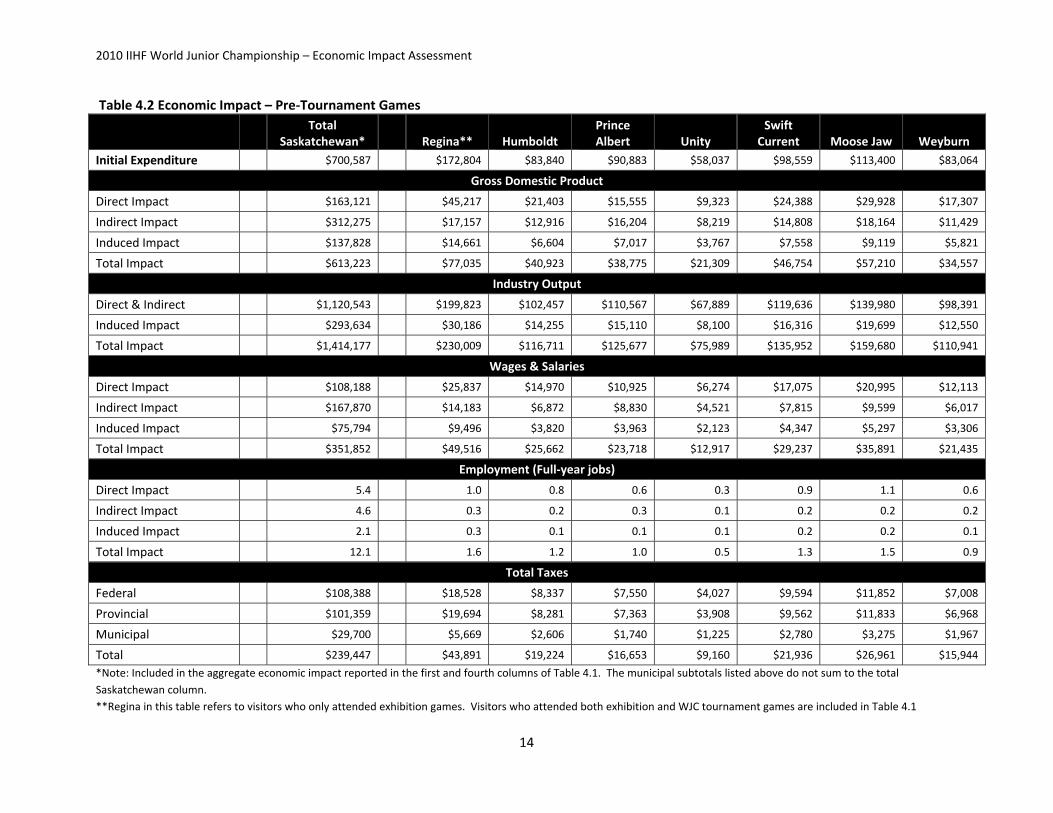
Table 4.2 Economic Impact – Pre‐Tournament Games Total
Saskatchewan* Regina** Humboldt Prince Albert Unity
Swift Current Moose Jaw Weyburn
Initial Expenditure $700,587 $172,804 $83,840 $90,883 $58,037 $98,559 $113,400 $83,064
Gross Domestic Product
Direct Impact $163,121 $45,217 $21,403 $15,555 $9,323 $24,388 $29,928 $17,307
Indirect Impact $312,275 $17,157 $12,916 $16,204 $8,219 $14,808 $18,164 $11,429
Induced Impact $137,828 $14,661 $6,604 $7,017 $3,767 $7,558 $9,119 $5,821
Total Impact $613,223 $77,035 $40,923 $38,775 $21,309 $46,754 $57,210 $34,557
Industry Output
Direct & Indirect $1,120,543 $199,823 $102,457 $110,567 $67,889 $119,636 $139,980 $98,391
Induced Impact $293,634 $30,186 $14,255 $15,110 $8,100 $16,316 $19,699 $12,550
Total Impact $1,414,177 $230,009 $116,711 $125,677 $75,989 $135,952 $159,680 $110,941
Wages & Salaries
Direct Impact $108,188 $25,837 $14,970 $10,925 $6,274 $17,075 $20,995 $12,113
Indirect Impact $167,870 $14,183 $6,872 $8,830 $4,521 $7,815 $9,599 $6,017
Induced Impact $75,794 $9,496 $3,820 $3,963 $2,123 $4,347 $5,297 $3,306
Total Impact $351,852 $49,516 $25,662 $23,718 $12,917 $29,237 $35,891 $21,435
Employment (Full‐year jobs)
Direct Impact 5.4 1.0 0.8 0.6 0.3 0.9 1.1 0.6
Indirect Impact 4.6 0.3 0.2 0.3 0.1 0.2 0.2 0.2
Induced Impact 2.1 0.3 0.1 0.1 0.1 0.2 0.2 0.1
Total Impact 12.1 1.6 1.2 1.0 0.5 1.3 1.5 0.9
Total Taxes
Federal $108,388 $18,528 $8,337 $7,550 $4,027 $9,594 $11,852 $7,008
Provincial $101,359 $19,694 $8,281 $7,363 $3,908 $9,562 $11,833 $6,968
Municipal $29,700 $5,669 $2,606 $1,740 $1,225 $2,780 $3,275 $1,967
Total $239,447 $43,891 $19,224 $16,653 $9,160 $21,936 $26,961 $15,944
*Note: Included in the aggregate economic impact reported in the first and fourth columns of Table 4.1. The municipal subtotals listed above do not sum to the total Saskatchewan column. **Regina in this table refers to visitors who only attended exhibition games. Visitors who attended both exhibition and WJC tournament games are included in Table 4.1
14
2010 IIHF World Junior Championship – Economic Impact Assessment
5.0 Conclusion
The 2010 IIHF World Junior Championship was a tremendous success by all measures, with the event showcasing the talents of the world’s top young hockey players. The event was enjoyed by thousands of local spectators, and supported through the efforts of more than 2,400 volunteers. Moreover, the event attracted 21,000 visitors to the cities of Saskatoon and Regina, with an additional 6,400 visitors at the pre‐competition communities throughout Saskatchewan. In the two host cities, visitor expenditures were in excess of $9.8 million. These expenditures, in combination with the operational expenditures and revenues of the host organizing committee, members of the media, and capital upgrades to the event venues, totaled $50.6 million, resulting in a net increase in economic activity of $48.6 million throughout the Province, of which $27.3 million occurred in Saskatoon and $11.2 million occurred in Regina. The total industry output (or gross economic activity) supported by the event was $86.6 million, supporting $17.5 million in wages and salaries throughout the Province. In the Saskatoon and Regina, a total of $9.9 million and $3.1 million in wages and salaries were supported by the event, along with 312 jobs in Saskatoon and 86 jobs in Regina.
15
2010 IIHF World Junior Championship – Economic Impact Assessment
Appendix 1: Economic Impact Methodology – Sport Tourism Economic Assessment Model
Background
Briefly, the purpose of STEAM is to calculate both the provincial and regional economic impacts of sport tourism. The economic impacts are calculated on the basis of capital and operating expenditures on goods, services and employee salaries, and on the basis of tourist spending within a designated tourism sector. The elements used to measure the economic impacts are Gross Domestic Product (GDP), Employment, Taxes, Industry Output and Imports. STEAM measures the direct, indirect & induced effects for each of these elements.
Technical Description of the Impact Methodology used by STEAM
STEAM and many other impact studies are based on input‐output techniques. Input‐output models involve the use of coefficients that are based on economic or business linkages. These linkages trace how tourist expenditures or business operations filter through the economy. In turn, the coefficients applied are then used to quantify how tourism related activity in a particular region generates employment, taxes, income, etc. The input‐output approach indicates not only the direct and indirect impact of tourism, but can also indicate the induced effect resulting from the re‐spending of wages and salaries generated.
All impacts generated by the model are given at the direct impact stage (i.e. the "front line" businesses impacted by tourism expenditures), indirect impact stage (i.e. those industries which supply commodities and/or services to the "front line" businesses) and the induced impact stage (induced consumption attributable to the wages and salaries generated from both the direct and indirect impact). In this sense, the model is closed with respect to wages. Imports are also determined within the model, so the model is closed with respect to imports. Exports are not endogenized (i.e. additional exports are not assumed with the induced impact) which consequently generates more conservative impacts. Another assumption of the model, which leads to more conservative impacts, is that not all commodities and/or services purchased are assumed to have at least one stage of production within the province. This assumption is crucial for souvenirs, gasoline and other commodities.
16
2010 IIHF World Junior Championship – Economic Impact Assessment
Taxes and employment are key economic considerations. However, as these concepts fall outside of the System of National Account Provincial input/output tables, their impacts must be calculated separately. Current tax and employment data for each region is used to econometrically estimate a series of coefficients and rates. These coefficients and/or rates are then applied to measures determined within the input‐output framework of the model, yielding the final tax and employment figures.
Regional (Sub‐Provincial) Impact Methodology
The method used to simulate intraprovincial commodity flows and ultimately regional impacts follows directly from regional economic principles. The principle is referred to as the "gravity model". Basically the "gravity model" states that the required commodity (& service) inputs will be "recruited" in a manner that takes into consideration economies of scale (i.e. production costs), transportation costs and the availability of specific industries. Economies of scale (i.e. lower production costs) are positively correlated with input demand while greater transportation costs are negatively correlated with input demand. Fulfilling that demand from other provincial regions is contingent on the fact that the specific industry does actually exist. An advantage of using the "gravity model" to simulate intraprovincial commodity flows is that as the industrial composition of the labour force changes, or as new industries appear for the first time in specific regions, the share of production between the various sub‐provincial regions also changes.
By following this principle of the gravity model, all sub‐provincial regions of a province are assigned a coefficient for their relative economies of scale in each industry (using the latest industry labour force measures) as well as a coefficient to represent the transportation cost involved to get each industry's output to the designated market. One variation on the "gravity model" principle involves the estimation of "relative trade distances" by incorporating different "weights" for different modes of transport. Once these coefficients are generated for all regions and over all industries, a measure of sensitivity (mostly relative to price, but in the case of service industries also to a "local preference criteria") is then applied to all commodities. Another variation on the strict "gravity model" approach is that the measure of sensitivity is adjusted by varying the distance exponent (which in the basic "gravity model" is 2) based on the commodity or service required. The variation in distance exponents revolve, principally, around two research hypotheses: (1) the greater the proportion of total shipments from the largest producer (or shipper), the lower the exponent, and (2) the greater the proportion of total flow which is local (intraregional), the higher the exponent.
17
2010 IIHF World Junior Championship – Economic Impact Assessment
Appendix 2: Glossary of Terms used by STEAM
Initial Expenditure ‐ This figure indicates the amount of initial expenditures or revenue used in the analysis. This heading indicates not only the total magnitude of the spending but also the region in which it was spent (thus establishing the "impact" region).
Direct Impact ‐ Relates ONLY to the impact on “front‐line” businesses. These are businesses that initially receive the operating revenue or tourist expenditures for the project under analysis. From a business perspective, this impact is limited only to that particular business or group of businesses involved. From a tourist spending perspective, this can include all businesses such as hotels, restaurants, retail stores, transportation carriers, attraction facilities and so forth.
Indirect Impact ‐ Refers to the impacts resulting from all intermediate rounds of production in the supply of goods and services to industry sectors identified in the direct impact phase. An example of this would be the supply and production of bed sheets to a hotel.
Induced Impact ‐ These impacts are generated as a result of spending by employees (in the form of consumer spending) and businesses (in the form of investment) that benefited either directly or indirectly from the initial expenditures under analysis. An example of induced consumer spending would be the impacts generated by hotel employees on typical consumer items such as groceries, shoes, cameras, etc. An example of induced business investment would be the impacts generated by the spending of retained earnings, attributable to the expenditures under analysis, on machinery and equipment.
Gross Domestic Product (GDP) ‐ This figure represents the total value of production of goods and services in the economy resulting from the initial expenditure under analysis (valued at market prices).
NOTE: The multiplier (A), Total/Initial, represents the total (direct, indirect and induced) impact on GDP for every dollar of direct GDP. This is a measure of the level of spin‐off activity generated as a result of a particular project. For instance if this multiplier is 1.5 then this implies that for every dollar of GDP directly generated by “front‐line” tourism businesses an additional $0.50 of GDP is generated in spin‐off activity (e.g. suppliers).
The multiplier (B), Total/$ Expenditure, represent the total (direct, indirect and induced) impact on GDP for every dollar of expenditure (or revenue from a business perspective). This is a measure of how effective project related expenditures translate into GDP for the province (or region). Depending upon the level of expenditures, this multiplier ultimately determines the overall level of net economic activity associated with the project. To take an example, if this multiplier is 1.0, this means that for every dollar of expenditure, one dollar of total GDP is generated. The magnitude of this multiplier is influenced by the level of withdrawals, or imports, necessary to sustain both production and final demand requirements. The less capable a region or province is at fulfilling all necessary production and final demand requirements, all things being equal, the lower the eventual economic impact will be.
18
2010 IIHF World Junior Championship – Economic Impact Assessment
GDP (at factor cost) ‐ This figure represents the total value of production of goods and services produced by industries resulting from the factors of production. The distinction to GDP (at market prices) is that GDP (at factor cost) is less by the amount of indirect taxes plus subsidies.
Wages & Salaries ‐ This figure represents the amount of wages and salaries generated by the initial expenditure. This information is broken down by the direct, indirect and induced impacts.
Employment ‐ Depending upon the selection of employment units (person‐years or equivalent full‐year jobs) these figures represent the employment generated by the initial expenditure. These figures distinguish between the direct, indirect and induced impact. “Equivalent Full‐Year Jobs”, if selected, include both part‐time and full‐time work in ratios consistent with the specific industries.
NOTE: The multiplier (B) is analogous to Multiplier (B) described earlier with the exception being that employment values are represented per $1,000,000 of spending rather than per dollar of spending. This is done to alleviate the problem of comparing very small numbers that would be generated using the traditional notion of a multiplier (i.e. employment per dollar of initial expenditure).
Industry Output ‐ These figures represent the direct & indirect and total impact (including induced impacts) on industry output generated by the initial tourism expenditure. It should be noted that the industry output measure represents the sum total of all economic activity that has taken place and consequently involve double counting on the part of the intermediate production phase. Since the Gross Domestic Product (GDP) figure includes only the net total of all economic activity (i.e. considers only the value added), the industry output measure will always exceed or at least equal the value of GDP.
Taxes ‐ These figures represent the amount of taxes contributed to municipal, provincial and federal levels of government relating to the project under analysis. This information is broken down by the direct, indirect and induced impacts.
Imports ‐ These figures indicate the direct, indirect and induced final demand and intermediate production requirements for imports both outside the province and internationally.
19

2010 IIHF World Junior Championship – Economic Impact Assessment
20
Appendix 3: 2010 IIHF World Junior Championship Survey
Enter Location:Location
1
Saskatoon Regina Practice
Select GameRegina
2
26 @ 1:00 26 @ 5:00 27 @ 1:00 27 @ 5:00 28 @ 5:00 29 @ 1:00 29 @ 5:00 30 @ 1:00 31 @ 1:00 31 @ 5:00
Select GameSasktatoon
3
26 @ 3:00 26 @ 7:00 27 @ 3:00 27 @ 7:00 28 @ 3:00 29 @ 3:00 29 @ 7:00 30 @ 3:00 31 @ 3:00 31 @ 7:00 2 @ 12:00 2 @ 4:00 2 @ 8:00 3 @ 12:00 3 @ 4:00
3 @ 8:00 4 @ 12:00 4 @ 4:00 4 @ 8:00 5 @ 3:00 5 @ 7:00
WJC Sask

Hello, my name is ________, and I am conducting a survey as to the economic impact of the 2010 IIHFWorld Junior Championship on the behalf of the event organizers. Can I please speak to someone in yourtravel party who is knowledgeable with your trip planning and expenditures?
Intro4
Yes No
Have you or anyone in your travel party been surveyed at a previous WJC game?Previous
5
Yes No
Including yourself, how many people are in your immediate (travel) party?Ptysize
6
Answer:
Respondent Only:How many World Junior Championship EXHIBITION games have you / will you attend (note, exhibitiongames were those played prior to Christmas)
ExhibGames7
Answer:
Respondent only: Including this game, how many 2010 IIHF World Junior Championship REGULAR Games have you / willyou personally attend in total ?
Games8
Answer:
Respondent Only:What kind of ticket did you use to enter today?Ticktype
9
Package A Package B Relegation & Medal Round Single Game (purchased)
Complimentary Working @ event Other

What is your role at the 2010 WJC?Role
10
Spectator Parent Media Scout Hockey Can / Other VIP Other
Are you from [@Location] or are you from out of town?Local
11
From [@Location] Out of town visitor Not Sure / Define out of town
Out of town is defined as being outside of your usual spending environment for the purposes of attendngthe event. If pressed, out of town is defined as more than 80km, one-way or staying overnight away fromhome.
Outoftown12
Where are you from?Origin
13
SK (less than 200km) Other SK Alberta Manitoba BC ON QC Atlantic Can U.S. Intl
Are you making a day trip or staying overnight away from home?Daytrip
14
Daytrip Overnight trip

In total, how many day trips away from home have you / will you make to attend WJC games? NumDT
15
Answer:
In total how many nights have you spent / will you be spending away from home on this trip?Nights1
16
Answer:
Will all of these nights be spent in [@Location]?Nights2
17
Yes No
How many nights will be spent in SK?Nights3
18
Answer:
How many nights will be spent in [@Location]?Nights4
19
Answer:
Are you able to report the spending for all [@Ptysize] members of your party for the duration of your stayin [@Location] or would a different size be more appropriate?Ptyverify
20
Yes, responses for [@Ptysize] is fine No, a different size would be better
Please enter a more appropriate party size:Ptysize2
21
Answer:

Now think about the money that you and your travel party have spent in [@Location] on this trip. Howmuch will your party spend on each of the following items? If your trip is not yet over, please provide yourbest estimate as to what you and your entire travel party will spend for your entire stay in [@Location].
Spendintro22
How much was spent on :Spend
23
AccommodationRestaurant / Bar / ConcessionGrocery / Other F&BRec & Ent. (Movies / Casino / Attractions)2010 WJC Tickets2010 WJC MerchandiseOther Retail ClothingOther ShoppingCar Rental (in [@Location])Car Expenses (gas, etc.in [@Location])Taxi / Airport BusPublic Transit (Bus)
On a scale of 0 to 10, with 10 indicating that the 2010 IIHF World Junior Championship was the onlyreason you came to [@Location], how important was the event in your decision to come?Rating
24
0 1 2 3 4 5 6 7 8 9 10
Did you change the timing of a trip that you would normally take to [@Location] in order to attend theWJC?Timing
25
Yes No

Did you lengthen a regular or planned trip to [@Location] in order to attend the 2010 WJC?Extend
26
Yes No
By how many days? Extend_Days
27
Answer:
Thank you for your time, this completes the survey.End
28
Surveyor Comments - any comments re survey or for event organizers?Surveyor comments
29