Embed Size (px)
Citation preview

2010 Pennsylvania Traffic Data
Bureau of Planning and Research Transportation Planning Information Division
In cooperation with:
US Department of Transportation Federal Highway Administration PUB 601 (8-11)

On The Cover: View of the Benjamin Franklin Parkway and the City of Philadelphia

2010 Pennsylvania Traffic Data Table of Contents 1
P e n n D O T Bureau of Planning and Research
Table of Contents Table of Contents ................................................................................................................................................. 1 Introduction .......................................................................................................................................................... 2 How to Use This Booklet ........................................................................................................................ 2 Updates and Enhancements ................................................................................................................................ 3 ATR/CAVC Conversion Project .............................................................................................................. 3 Local Local Data Collection .................................................................................................................... 3 Ramp Traffic Counting Project ................................................................................................................ 3 Traffic Data Collection .......................................................................................................................................... 4 Type of Data Collected ............................................................................................................................ 4 Traffic Data Collection Sources .............................................................................................................. 5 Permanent Site……………………………………………………………………………………………......................6 Traffic Pattern Group (TPG) .................................................................................................................... 7 Permanent Site Station Locations ........................................................................................................... 8 Strategic Highway Research Program (SHRP) .................................................................................... 10 Permanent Site Location Map ............................................................................................................... 11 Permanent Site Locations by TPG ........................................................................................................ 12 2010 Peak Hour Summary by TPG ...................................................................................................... 14 2010 30th Highest Hour Summary by TPG .......................................................................................... 16 2010 50th Highest Hour Summary by TPG .......................................................................................... 18 2010 Design Hour Summaries (Charts) ................................................................................................ 20 Five Year Summary of Annual Average Daily Traffic (AADT) from Permanent Sites .......................... 22 Statewide Traffic Trends (Table) ........................................................................................................... 24 Statewide Traffic Trends (Chart) ........................................................................................................... 25 Heaviest Holiday Travel Periods: 2010 ................................................................................................. 26 Factoring Process .............................................................................................................................................. 28 Traffic Adjustment Factors .................................................................................................................... 28 Table 350: Hourly Percentages Compiled for Total Vehicles ............................................................... 29 Table 360: Hourly Percentages Compiled for Truck Traffic .................................................................. 34 Hourly Percentages: Total Vehicles (Chart).......................................................................................... 36 Hourly Percentages: Truck Traffic (Chart) ............................................................................................ 36 Table 355: Average Day of Week by Month Factors Compiled for Total Vehicles ............................... 37 Monthly Variation Charts By Traffic Pattern Group (TPG) .................................................................... 42 Table 365: Average Day of Week by Month Factors Compiled for Truck Traffic ................................. 43 Table 370: Yearly Growth Factors ........................................................................................................ 44 Functional Class Groups (FCGs) .......................................................................................................... 45 Table 380: Axle Correction Factors ...................................................................................................... 46 Table 385: Design Hour Factor Default Value ...................................................................................... 47 Table 390: Rigid Equivalent Single Axle Load (ESAL) Factors ............................................................ 48 Table 395: Flexible ESAL Factors ........................................................................................................ 48 Roadway Management System (RMS) Factor Table Application Flow Chart ...................................... 49 Acronyms ........................................................................................................................................................... 50 Index…………………………………………………………………………………………………….........................51

2 2010 Pennsylvania Traffic Data Introduction
P e n n D O T www.dot.state.pa.us
Introduction The “Pennsylvania Traffic Data Book” documents procedures for developing accurate estimates of highway traffic volumes based on sample traffic counts. Traffic information is critical in transportation decision-making related to highway funding, traffic engineering, highway design, air quality analysis, planning and programming, as well as winter services, highway maintenance and construction. The “Pennsylvania Traffic Data Book” provides current traffic expansion factors through the use of tables, charts, and graphs. Expansion factors allow the traffic professional to use a sample traffic count and develop reliable and comparable Annual Average Daily Traffic (AADT) estimates. All tables & charts in the “Pennsylvania Traffic Data Book” are derived from the data of 73 permanent sites. Some of the permanent sites are excluded on a year to year basis. If it is determined a permanent site has less than 50% of the current year’s data, it is not used for the factors. Reasons for a permanent site having less than 50% of the current year’s data would be construction projects or equipment malfunction.
How to Use this Booklet This booklet provides current traffic expansion factors through the use of tables, charts, and graphs. All of the tables, charts, and graphs are listed in the Table of Contents. Refer to the description provided with each table, chart, and graph to ensure that the data presented is what you need. Acronyms are used quite often throughout this publication. A complete list of acronyms and their meanings are located in the back of the booklet. In addition, an index was created for this booklet to help you find a particular topic quickly. We would appreciate any comments or suggestions you can provide on information presented in this booklet. Questions or comments relating to data presented in this publication can be directed to:
Joseph E. Piper, Jr. Telephone: (717) 214-8687
Fax: (717) 783-9152 Email: [email protected]
The 2010 Traffic Data Book and County Traffic Volume Maps are available free on our website!
www.dot.state.pa.us Select: More Links...
Scroll to: Transportation Planning Select: Traffic Information
Select: Traffic Volume Maps or Traffic Data Report
Traffic Volume Maps can be purchased through our Maps and Publications Sales Store by calling (717) 787-6746.

2010 Pennsylvania Traffic Data Introduction 3
P e n n D O T Bureau of Planning and Research
Updates and Developments ATR/CAVC Conversion Project The Bureau of Planning and Research (BPR) continues the process of converting Automatic Traffic Recorder (ATR) sites which only collect vehicle volume to Continuous Automatic Vehicle Classification (CAVC) sites. The upgrade/conversion will allow BPR to collect 13 different vehicle classifications required by the Federal Highway Administration (FHWA); including collection and reporting of motorcycle travel data. In addition, FHWA has amended the Traffic Monitoring Guide (TMG) and added requirements for motorcycle correction factors. To be able to meet the requirements, it is recommended that PennDOT have at least 5 Continuous Automatic Vehicle Classification (CAVC) sites per traffic pattern group (TPG). To date, BPR has been able to upgrade/convert 25 Automatic Traffic Recorder (ATR) sites to Continuous Automatic Vehicle Classification (CAVC) sites. Local Road Traffic Counting Project Pennsylvania’s 2,562 municipalities own 76,834 linear miles of road of which 3,488 linear miles of municipal owned roads are on the Federal-Aid System. These roads on the Federal-Aid System are scheduled for traffic counts on a five year cycle. However, the remaining 73,346 linear miles did not have traffic counts taken on a regular basis. Approximately 7,200 local road traffic counts were set in 2009 to develop a baseline for this new data. During the 2010 traffic count season, 749 sites in PennDOT Engineering Districts 2-0 & 9-0 were completed and 1,377 sites in District 6-0 will be completed during the 2011 traffic count season. Ramp Traffic Counting Project Pennsylvania has approximately 4,320 interchange ramps. In 2010, BPR began scheduling traffic counts to be set on all interchange ramps statewide. Approximately 2,030 sites classified as Interstate ramps were set during the 2010 traffic count season. The data was collected by the vendors on the statewide contract and BPR field staff. In the 2011 traffic count season, BPR will schedule the remaining 2,320 sites that are classified as US, PA and State route interchange ramps.
US 202 / US 30 Interchange – Exton, PA.

4 2010 Pennsylvania Traffic Data Traffic Data Collection
P e n n D O T www.dot.state.pa.us
Traffic Data Collection
Traffic data is collected on 40,000 miles of PennDOT owned roads and 3,300 miles of local federal aid roads in Pennsylvania. Approximately 7,000 raw traffic counts are collected per year by:
• BPR Field Staff • PennDOT Engineering District 1-0 • 15 Metropolitan Planning Organizations (MPOs) • 2 Rural Planning Organizations (RPOs) • Contractors
Volume: The majority of the counts taken as part of our statewide count program record volume of traffic on a roadway. Volume is usually expressed as Annual Average Daily Traffic, (AADT) which represents traffic volume over an average 24-hour period. Classification: One method of data collection used for our count program is vehicle classification. Vehicles are classified into 13 classes ranging from cars to trucks in accordance with the Federal Highway Administration vehicle classification scheme. Weight: Truck weight data is collected from 13 WIM stations. Speed: Speed data is collected from Permanent Traffic Recorders.
Traffic Count set in Downingtown, PA (Chester County)

2010 Pennsylvania Traffic Data Traffic Data Collection 5
P e n n D O T Bureau of Planning and Research
Traffic Data Collection Sources
Automatic Traffic Recorders (ATRs) 46 ATRs strategically located throughout the state count volume and speed data on a continuous basis 365 days per year. A map showing the locations of ATRs throughout the state is provided on page 11.
Short-Term In-Pavement Sites (STIP)
Approximately 230 inductive loop sites, referred to as STIP sites are installed throughout the state of Pennsylvania. Volume data is collected from these permanent sites for a 24-hour period, once a year.
Continuous Automatic Vehicle Classifier (CAVC) 28 CAVC sites collect continuous vehicle classification data. A map showing CAVC locations are provided on page 11. Weigh-In-Motion (WIM)
13 WIM stations provide continuous truck weight and vehicle classification data. WIM stations are shown on the map on page 11.
Pneumatic Tubes
The majority of the counts are collected using pneumatic tubes. Axle counts are collected using a traffic counting device in association with a single pneumatic tube stretched across the roadway. An axle correction factor is applied to adjust vehicle axle base data for the incidence of vehicles with more than two axles. Two tubes are used to count and classify vehicles by type based on axle configuration.
Manual Counts
Manual counts are taken on sections of roadways that are not accessible to automated data collection equipment or have safety limitations. Observers classify vehicles by type based on axle configuration.
Toll Receipts
The Delaware River Joint Toll Bridge Commission and the Delaware River Port Authority document traffic between Pennsylvania and New Jersey. The Pennsylvania Turnpike Commission toll receipt surveys provide automobile and truck data on the Commonwealth’s toll roads.

6 2010 Pennsylvania Traffic Data Permanent Sites
P e n n D O T www.dot.state.pa.us
Permanent Traffic Recorders
Pennsylvania maintains permanent traffic recorders at 89 strategically selected locations throughout the state. These permanent sites collect traffic volume data on a continuous basis throughout the year. This data is used to develop daily and seasonal factors, as well as to identify changes in traffic patterns. Based on a research study performed by Pennsylvania State University and West Virginia University, it was determined that PennDOT locations in the traffic pattern groups were acceptable according to the FHWA Traffic Monitoring Guide.
ATR 391 in Chester County The permanent sites use magnetic loops embedded in the pavement for vehicle detection. The data is stored on site in traffic counters, prior to being automatically polled every night through the use of modems located at each permanent site.

2010 Pennsylvania Traffic Data Permanent Sites 7
P e n n D O T Bureau of Planning and Research
Traffic Pattern Group (TPG)
Highway traffic characteristics can vary by geographical area, roadway type, and population density. Therefore, individual traffic volume counts are categorized into one of ten Traffic Pattern Groups (TPGs). The TPGs are based on highway functional classification, geographic area, and urban/rural characteristics. (See map on pg. 11) Each permanent site is associated with one of the ten TPGs listed below.
Permanent Site data is used in computing:
• Daily, monthly, and seasonal adjustment factors by highway functional classification and
geographic location.
• Yearly growth factors which are used to update older counts in the Department’s Roadway Management System (RMS).
• Design hour factors (peak hour, 30th highest and 50th highest hour) used for the design of highways.
TRAFFIC PATTERN GROUP DESCRIPTION
TPG 1 URBAN - INTERSTATE
TPG 2 RURAL - INTERSTATE
TPG 3 URBAN - OTHER PRINCIPAL ARTERIALS
TPG 4 RURAL - OTHER PRINCIPAL ARTERIALS
TPG 5 URBAN - MINOR ARTERIALS, COLLECTORS, LOCAL ROADS
TPG 6 NORTH RURAL - MINOR ARTERIALS
TPG 7 CENTRAL RURAL- MINOR ARTERIALS
TPG 8 NORTH RURAL - COLLECTORS AND LOCAL ROADS
TPG 9 CENTRAL RURAL- COLLECTORS AND LOCAL ROADS
TPG 10 SPECIAL RECREATIONAL

8 2010 Pennsylvania Traffic Data Permanent Sites
P e n n D O T www.dot.state.pa.us
Permanent Site Locations
This chart lists the permanent site stations by number, county, municipality, traffic route number, state route (SR), segment, and also by a physical description of where the permanent site is located in the state. * Indicates CAVC site ** Indicates WIM Site *** Indicates road is not a PA, US, or Interstate Route
SITE # COUNTY MUNICIPALITY ROUTE SR SEGMENT LOCATION
1 * Erie Springfield Twp. US 20 20 10 0.4 mi. E of Ohio/Pennsylvania Line (West Springfield)
2 Crawford Richmond Twp. PA 77 77 270 0.5 mi. W of PA 408 (New Richmond)
3 Clearfield Huston Twp. PA 255 255 280 1.4 mi. N of PA 153 (Penfield)
4 Tioga Delmar Twp. US 6 6 400 0.9 mi. W of PA 287 (Wellsboro)
5 * Bradford Wysox Twp. *** 1043 10 0.1 mi. NW of SR 1041 (Towanda)
8 Montgomery Whitemarsh Twp. PA 73 73 534 1.4 mi. NW of PA 309-Skippack Pike (Whitemarsh)
15 Fulton Todd Twp. US 522 522 540 1.2 mi. N of US 30 (McConnellsburg)
18 Butler Summitt Twp. PA 38 38 20 0.7 mi. NW of PA 68 (Butler)
19 Washington Union Twp. PA 88 88 750 0.4 mi. S of SR1006-Washington Ave. (Finleyville)
20 * Lawrence Shenango Twp. PA 65 65 264 1.1 mi. S of US 422 (New Castle)
24 * Westmoreland Derry Twp. US 22 22 340 1.0 mi. E of PA 981 (New Alexandria)
27 Elk Highland Twp. PA 66/948 66 60 1.1 mi. E of PA 948 (Russell City)
29 Susquehanna Rush Twp. PA 267 267 190 0.7 mi. S of PA 367 (Lawton)
40 * Schuylkill Schuylkill Twp. US 209 209 860 0.7 mi. S of PA 309 (Tamaqua)
48 * Susquehanna New Milford Twp. US 11 11 420 0.8 mi. SW of PA 848 (New Milford)
51 Potter Eulalia Twp. PA 44 44 700 1.3 mi. SW of PA 49 (Coudersport)
106 ** Berks Windsor Twp. I-78 78 340 1.5 mi. W of PA 143 (Hamburg)
126 * Jefferson Brookville Boro. I-80 80 790 0.6 mi. E of PA 36 (Brookville)
158 ** Centre Boggs Twp. I-80 80 1580 0.6 mi. E of PA 150 (Milesburg)
203 Allegheny Leetsdale Boro. PA 65 65 270 1.0 mi. S of SR 4036 (Leetsdale)
205 * York Manchester Twp. I-83 83 220 1.4 mi. S of PA 238 (North York)
206 Cumberland Wormleysburg Boro. *** 1014 30 Harvey Taylor Bridge on west approach (Harvey Taylor Bridge)
207 Erie Springfield Twp. I-90 90 10 1.1 mi. E of Ohio/Pennsylvania Line (West Springfield)
208 Allegheny Monroeville Boro. I-376 376 820 2.0 mi. W of PA 48 (Monroeville)
210 Cumberland Lemoyne Boro. I-83 83 416 0.6 mi. NE of PA 581 on John Harris Bridge (South Bridge)
216 Susquehanna Great Bend Twp. I-81 81 2314 1.1 mi. N of PA 171 (Hallstead)
301 Erie Lawrence Park Twp. PA 5 5 680 0.5 mi. W of PA 955 (Erie)
304 Lycoming S. Williamsport Boro. US 15 15 250 0.3 mi. S of I-180 (Williamsport)
306 * Pike Palmyra Twp. PA 507 507 280 0.7 mi. N of PA 390 (Hawley)
317 ** Blair Freedom Twp. I-99 99 214 1.0 mi. S of PA 36/PA 164 (East Freedom)
323 Bedford Bedford Twp. US 220 220 310 0.7 mi. S of Business US 220 (Bedford Springs)
324 ** Elk Ridgway Boro. PA 120 120 42 1.1 mi. E of US 219 (Ridgway)
326 Clarion Paint Twp. US 322 322 280 0.5 mi. E of PA 66 (Clarion)
328 * Centre Boggs Twp. PA 150 150 194 1.2 mi. N of 1-80 (Milesburg)
330 Bucks Northampton Twp. PA 532 532 130 1.4 mi. SW of PA 413 (Newtown)
334 * York W. Manchester Twp. US 30 30 170 0.6 mi. W of PA 116 (Thomasville)
349 Lehigh Upper Saucon Twp. PA 309 309 30 0.7 mi. S of PA 378 (Coopersburg)
360 Clearfield Union Twp. US 219 219 670 3.2 mi. S of US 322 (Luthersburg)
362 York North Codorus Twp. PA 616 616 240 1.6 mi. N of PA 214 (New Salem)
363 McKean Lafayette Twp. US 219 219 290 0.1 mi. N of PA 59 (Lewis Run)
364 Lackawanna Newton Twp. PA 307 307 360 50 ft. W of SR 4017 (Clarks Summitt)
367 Union Limestone Twp. PA 45 45 250 0.6 mi. W of PA 104 (Mifflinburg)
370 Westmoreland Rostraver Twp. I-70 70 454 0.9 mi. W of PA 51 (Belle Vernon)
371 Fulton Brush Creek Twp. I-70 70 1522 1.1 mi. S of PA 915 (Crystal Springs)

2010 Pennsylvania Traffic Data Permanent Sites 9
P e n n D O T Bureau of Planning and Research
Permanent Site Locations (Continued) * Indicates CAVC site ** Indicates WIM site *** Indicates road is not a PA, US, or Interstate Route
SITE # COUNTY MUNICIPALITY ROUTE SR SEGMENT LOCATION
372 Union White Deer Twp. I-80 80 2104 0.7 mi. E of US 15 (Milton)
374 Butler Lancaster Twp. I-79 79 904 3.5 mi. N of PA 68 (Zelienople)
375 Allegheny N. Fayette Twp. US 22/30 22 80 0.8 mi. E of PA 978 (Imperial)
376 Luzerne Wilkes-Barre Twp. I-81 81 1664 0.7 mi. N of PA 309-Exit 165A/165B (Wilkes-Barre)
377 Bucks Bristol Twp. I-95 95 404 2.5 mi. S of US 1 (PennDel)
378 Fayette Redstone Twp. US 40 40 160 0.6 mi. W of SR 4020 (Briar Hill)
379 Blair Logan Twp. *** 4013 80 0.4 mi. E of SR 4015 (Altoona)
380 * Berks Exeter Twp. PA 562 562 40 0.2 mi. W of SR 2033 (St. Lawrence)
381 Mercer Hermitage City *** 3019 20 0.9 mi. N of PA 718 (Sharon)
382 Cambria Lower Yoder Twp. *** 3005 40 0.7 mi. SW of PA 56 (Morrellville)
383 * Clinton Pine Creek Twp. PA 150 150 360 0.5 mi. N of SR 1005 (Chatham Run)
384 Tioga Lawrence Twp. *** 4022 50 1.9 mi. E of PA 49 (Nelson)
385 Warren Southwest Twp. *** 3002 30 0.7 mi. W of PA 27 (Enterprise)
386 * Montour Limestone Twp. PA 254 254 10 2.0 mi. E of I-80 (Limestoneville)
387 * Somerset Brothers Valley Twp. *** 2031 110 2.0 mi. S of US 219 (Garrett)
388 Monroe Ross Twp. *** 3004 170 0.4 mi. SW of SR 3015 (Saylorsburg)
389 * Jefferson Perry Twp. PA 536 536 210 0.3 mi. W of SR 3011 (Frostburg)
390 * Lancaster West Donegal Twp. PA 230 230 20 1.7 mi. W of PA 743/241 (Elizabethtown)
391 Chester Warwick Twp. PA 23 23 110 1.5 mi. E of PA 345 (Warwick Area)
392 Luzerne Foster Twp. I-80 80 2684 5.9 mi. E of PA 309 (White Haven)
393 Washington Donegal Twp. I-70 70 2 0.3 mi. E of W. Virginia/Pennsylvania Line (West Alexander)
394 Lehigh Upper Saucon Twp. I-78 78 614 1.1 mi. E of PA 309/PA 145/I-78 Interchange (Allentown)
395 Fayette German Twp. PA 21 21 230 0.1 mi. E of SR 3023 (Uniontown)
410 ** Tioga Nelson Twp. PA 49 49 520 0.5 mi. W of SR 4027 (Nelson)
501 ** Tioga Liberty Twp. US 15 15 142 2.7 mi. N of SR 2005 (Blossburg)
502 ** Mercer Wolf Creek Twp. I-80 80 220 1.4 mi. W of PA 173 (Barkeyville)
503 ** Warren Youngsville Boro. US 6 6 410 0.7 mi. W of PA 27 (Youngsville)
504 ** Delaware Chadds Ford Twp. US 202 202 114 0.8 mi. N of US 1 (Dilworthtown)
505 ** Perry Howe Twp. US 22 22 160 0.7 mi. E of PA 34 (Newport)
506 ** Blair Allegheny Twp. *** 1001 30 0.2 mi. N of SR 1002 (Altoona)
600 ** Franklin Southampton Twp. I-81 81 244 3.0 mi. N of PA 174 (Shippensburg)
700 ** Indiana Armstrong Twp. US 422 422 120 0.5 mi. W of SR 4004 (Indiana)
800 * Centre Spring Twp. I-99 99 800 1.2 mi. N of PA 150 (Bellefonte)
801 * Dauphin Lower Paxton Twp. I-81 81 714 0.7 mi. S of SR 3019 (Paxtonia)
802 * Monroe Coolbaugh Twp. PA 423 423 140 0.2 mi. E of I-380 (Tobyhanna)
803 * Adams Freedom Twp. US 15 15 20 0.5 mi. N of Maryland/Pennsylvania Line (Gettysburg)
804 * Washington Canton Twp. I -70 70 160 1.3 mi. E of US 40 (Washington)
805 * Crawford N. Shenango Twp. PA 285 285 20 0.1 mi. E of SR 3007 (Espyville)
806 * Westmoreland Hempfield Twp. US 30 30 170 0.2 mi. E of Strawberry Lane (Jeannette)
807 * Washington Twilight Boro. I-70 70 380 0.6 mi. W of Exit 39 (Spears)
808 * Indiana W. Wheatfield Twp. US 22 22 242 1300 ft. E of Bethel Cemetery Rd.
809 * McKean Foster Twp. US 219 219 594 50 ft. S of Tuna Crossroads Bridge (Foster Brook)
985 * Cambria Richland Twp. US 219 219 120 1.6 mi. N of PA 56 (St. Michael)

10 2010 Pennsylvania Traffic Data Permanent Sites
P e n n D O T www.dot.state.pa.us
Strategic Highway Research Program (SHRP) and LTPP
The Strategic Highway Research Program (SHRP) was authorized by the U.S. Congress in 1987 as a five-year research initiative. The focus of this initiative was to develop and evaluate technologies and techniques to improve the performance, safety, durability, and efficiency of the nation’s highways. SHRP was directed by a committee of managers from state highway agencies, industry, and academia, and operated as a unit of the National Research Council. Research was concentrated in asphalt, concrete and structures, highway operations, and pavement performance. The Federal Highway Administration assumed coordination of a national program to move the products evaluated or developed under SHRP to the state and local agencies upon completion of the research phase. The Long Term Pavement Performance (LTPP) program was established under SHRP and is currently managed by FHWA. LTPP, which is a 20-year study of in-service pavements, provides the basis for pavement design, maintenance, rehabilitation, and construction methodologies. The Bureau supports this program by collecting weight and vehicle classification data and reporting the data to LTPP.
ATR, CAVC and Weigh-In-Motion (WIM) Locations Map (Opposite)
The ATR, CAVC, and WIM locations map of Pennsylvania, which is shown on the following page, gives an overview of where all of the ATR, CAVC and WIM sites are located. Symbols are used in addition to the site number to identify the location of the site.
US 30 – Chester County

2010 Pennsylvania Traffic Data Permanent Sites 11
P e n n D O T Bureau of Planning and Research
LEH
IGH
CO
NT
INU
OU
S M
ON
ITO
RIN
G S
ITE
S
37430
1
381
002
207
018
385
203
020
386
208
378
019
393
375
387
985
004
051
363
027
372
379 37
132
3003
048
206
349
364
205
362
334
005
367
210
029
015
388
330
008
391
380
392
376
383
326
389
360
328
306
324
158
410
317
ATR
WIM
/C
AVC
CAV
C
126
ERIE
WAR
REN
FOR
EST
McK
EAN
POTT
ER
CAM
ERO
NEL
K
MER
CER
BED
FOR
DBLA
IR
SOM
ERSE
TCAM
BR
IA
IND
IAN
A
ARM
STR
ON
G
BU
TLER
LAW
REN
CE
BEA
VER
ALLE
GH
ENY
WAS
HIN
GTO
N
GR
EEN
EFA
YETT
E
WES
TMO
REL
AND
CLI
NTO
N
LYC
OM
ING
SULL
IVAN
TIO
GA
BR
ADFO
RD
WAY
NE
WYO
MIN
G
PIK
E
LUZE
RN
E
SCH
UYL
KIL
L
CAR
BO
N
CO
LUM
BIA
BU
CK
S
BER
KS CH
ESTE
RLA
NC
ASTE
R
MO
NTG
OM
ERY
YOR
K
LEB
ANO
NPE
RR
Y
CU
MB
ERLA
ND
DAU
PHIN
JUN
IATA
MIF
FLIN
UN
ION
SNYD
ER
ADAM
SFR
ANK
LIN
FULT
ON
HU
NTI
NG
DO
N
DEL
AWAR
E
SUSQ
UEH
ANN
A
MO
NTO
UR
CR
AWFO
RD
VEN
ANG
O
CLA
RIO
N
CLE
ARFI
ELD
LAC
KAW
ANN
A
PHIL
ADEL
PHIA
NO
RTH
-U
MB
ERLA
ND
NO
RTH
HAM
PTO
N
MO
NR
OE
CEN
TRE
800
600
501
502
506
700
505
504
377
370
JEFF
ERSO
N
390
384
216
801
382
001
040
803
804
805
802
024
503
304
395
106
394
809
806
807
808

12 2010 Pennsylvania Traffic Data Permanent Sites
P e n n D O T www.dot.state.pa.us
Permanent Site Locations by Traffic Pattern Group (TPG)
This chart groups the permanent site locations by Traffic Pattern Group. It gives the permanent site number, route, and the urban area or county depending on the TPG into which the permanent site falls. The Annual Average Daily Traffic (AADT) for each permanent site is also listed on this chart.
SITE # ROUTE URBAN AREA AADT SITE # ROUTE COUNTY AADT
205 I-83 YORK 52,706 106 I-78 BERKS 39,468
210 I-83 HARRISBURG 97,178 207 I-90 ERIE 21,460
216 I-81 BINGHAMPTON 28,089 371 I-70 FULTON 18,876
317 I-99 ALTOONA 12,603 372 I-80 UNION 27,516
370 I-70 MONESSEN 32,075 392 I-80 LUZERNE 23,050
376 I-81 WILKES-BARRE 58,951 393 I-70 WASHINGTON 30,979
377 I-95 PHILADELPHIA 54,213 600 I-81 FRANKLIN 37,286
394 I-78 ALLENTOWN 59,668 800 I-99 CENTRE 20,737
801 I-81 HARRISBURG 80,320
804 I-70 PITTSBURGH 54,765
SITE # ROUTE URBAN AREA AADT SITE # ROUTE COUNTY AADT
8 PA 73 PHILADELPHIA 17,828 4 US 6 TIOGA 3,177
206 H. Taylor Br. HARRISBURG 27,319 19 PA 88 WASHINGTON 5,868
301 PA 5 ERIE 13,548 24 US 22 WESTMORELAND 18,228
304 US 15 WILLIAMSPORT 28,828 323 US 220 BEDFORD 3,978
330 PA 532 PHILADELPHIA 11,381 324 PA 120 ELK 4,608
334 US 30 YORK 16,493 326 US 322 CLARION 9,440
375 US 22/30 PITTSBURGH 23,248 360 US 219 CLEARFIELD 2,635
504 US 202 PHILADELPHIA 41,808 363 US 219 MCKEAN 4,861
395 PA 21 FAYETTE 10,808
501 US 15 TIOGA 9,154
503 US 6 WARREN 4,077
505 US 22 PERRY 21,047
700 US 422 INDIANA 13,347
803 US 15 ADAMS 22,173
PERMANENT SITE LOCATIONS BY TPG
TPG 1: URBAN INTERSTATE TPG 2: RURAL INTERSTATE
TPG 3: URBAN PRINCIPAL ARTERIAL TPG 4: RURAL PRINCIPAL ARTERIAL
PERMANENT SITE LOCATIONS BY TPG

2010 Pennsylvania Traffic Data Permanent Sites 13
P e n n D O T Bureau of Planning and Research
Permanent Site Locations by TPG (Continued)
SITE # ROUTE URBAN AREA AADT SITE # ROUTE COUNTY AADT
18 PA 38 BUTLER 6,723 2 PA 77 CRAWFORD 1,911
20 PA 65 NEW CASTLE 7,638 3 PA 255 CLEARFIELD 5,438
379 SR 4013 ALTOONA 1,399 27 PA 66/948 ELK 2,834
380 PA 562 READING 8,631 48 US 11 SUSQUEHANNA 4,835
381 SR 3019 SHARON 480 51 PA 44 POTTER 3,247
382 SR 3005 JOHNSTOWN 1,765 328 PA 150 CENTRE 5,069
390 PA 230 LANCASTER 5,663 410 PA 49 TIOGA 4,335
506 SR 1001 ALTOONA 16,638
SITE # ROUTE COUNTY AADT SITE # ROUTE COUNTY AADT
1 US 20 ERIE 3,156 5 SR 1043 BRADFORD 1,997
15 US 522 FULTON 5,321 29 PA 267 SUSQUEHANNA 1,399
40 US 209 SCHUYLKILL 4,742 383 PA 150 CLINTON 4,243
367 PA 45 UNION 6,210 384 SR 4022 TIOGA 443
391 PA 23 CHESTER 7,714 385 SR 3002 WARREN 1,915
802 PA 423 MONROE 4,287
SITE # ROUTE COUNTY AADT SITE # ROUTE COUNTY AADT
362 PA 616 YORK 6,094 306 PA 507 PIKE 5,856
364 PA 307 LACKAWANNA 4,926 805 PA 285 CRAWFORD 2,892
386 PA 254 MONTOUR 2,214
388 SR 3004 MONROE 3,367
389 PA 536 JEFFERSON 2,068
PERMANENT SITE LOCATIONS BY TPG
PERMANENT SITE LOCATIONS BY TPG
PERMANENT SITE LOCATIONS BY TPG
TPG 9: CENTRAL RURAL COLLECTOR TPG 10: SPECIAL RECREATIONAL
TPG 5: URBAN MINOR ARTERIAL/COLLECTOR TPG 6: NORTH RURAL MINOR ARTERIAL
TPG 7: CENTRAL RURAL MINOR ARTERIAL TPG 8: NORTH RURAL COLLECTOR

14 2010 Pennsylvania Traffic Data Permanent Sites
P e n n D O T www.dot.state.pa.us
2010 Peak Hour by Traffic Pattern Group (TPG)
Site # DateHour
(start) DOW Volume % AADT AADT Site # DateHour
(start) DOW Volume % AADT AADT
205 9/3 4:00 PM Fri 5,391 10.23% 52,706 106 11/28 1:00 PM Sun 4,717 11.95% 39,468
210 1/27 4:00 PM Wed 10,260 10.56% 97,178 207 11/28 3:00 PM Sun 3,147 14.66% 21,460
216 11/28 3:00 PM Sun 4,768 16.97% 28,089 371 11/28 11:00 AM Sun 3,582 18.98% 18,876
317 2/16 3:00 PM Tues 4,310 34.20% 12,603 372 11/28 2:00 PM Sun 4,455 16.19% 27,516
370 9/3 4:00 PM Fri 3,379 10.53% 32,075 392 11/28 3:00 PM Sun 3,740 16.23% 23,050
376 11/24 3:00 PM Wed 6,347 10.77% 58,951 393 11/28 2:00 PM Sun 4,381 14.14% 30,979
377 6/10 5:00 PM Thur 5,887 10.86% 54,213 600 11/8 3:00 PM Mon 4,722 12.66% 37,286
394 11/23 4:00 PM Tues 6,316 10.59% 59,668 800 11/19 4:00 PM Fri 2,763 13.32% 20,737
801 5/13 4:00 PM Thur 7,600 9.46% 80,320
804 11/28 12:00 PM Sun 5,827 10.64% 54,765
Site # DateHour
(start) DOW Volume % AADT AADT Site # DateHour
(start) DOW Volume % AADT AADT
8 12/7 7:00 AM Tues 2,108 11.82% 17,828 4 6/5 10:00 AM Sat 491 15.45% 3,177
206 8/19 4:00 PM Thur 4,338 15.88% 27,319 19 9/15 5:00 PM Wed 683 11.64% 5,868
301 9/9 4:00 PM Thur 1,650 12.18% 13,548 24 10/8 4:00 PM Fri 2,068 11.35% 18,228
304 8/27 4:00 PM Fri 3,032 10.52% 28,828 323 11/28 3:00 PM Sun 501 12.59% 3,978
330 5/20 5:00 PM Thur 1,211 10.64% 11,381 324 11/8 3:00 PM Mon 848 18.40% 4,608
334 3/21 12:00 PM Sun 1,635 9.91% 16,493 326 5/7 4:00 PM Fri 1,121 11.88% 9,440
375 2/1 4:00 PM Mon 3,297 14.18% 23,248 360 10/8 4:00 PM Fri 335 12.71% 2,635
504 11/8 3:00 PM Mon 5,092 12.18% 41,808 363 9/3 3:00 PM Fri 634 13.04% 4,861
395 10/1 4:00 PM Fri 1,192 11.03% 10,808
501 11/28 1:00 PM Sun 1,709 18.67% 9,154
503 8/14 10:00 PM Sat 661 16.21% 4,077
505 3/5 3:00 PM Fri 2,882 13.69% 21,047
700 1/1 1:00 PM Fri 3,723 27.89% 13,347
803 11/25 11:00 AM Thur 2,778 12.53% 22,173
2010 Peak Hour by Traffic Pattern Group (TPG)
TPG 2: Rural InterstateTPG 1: Urban Interstate
2010 Peak Hour by Traffic Pattern Group (TPG)
TPG 3: Urban Principal Arterial TPG 4: Rural Principal Arterial

2010 Pennsylvania Traffic Data Permanent Sites 15
P e n n D O T Bureau of Planning and Research
2010 Peak Hour by TPG (Continued)
Site # DateHour
(start) DOW Volume % AADT AADT Site # DateHour
(start) DOW Volume % AADT AADT
18 10/1 4:00 PM Fri 854 12.70% 6,723 2 3/27 8:00 AM Sat 348 18.21% 1,911
20 6/17 4:00 PM Thur 1,145 14.99% 7,638 3 10/8 4:00 PM Fri 731 13.44% 5,438
379 3/22 4:00 PM Mon 226 16.15% 1,399 27 9/6 2:00 PM Mon 429 15.14% 2,834
380 4/23 5:00 PM Fri 1,073 12.43% 8,631 48 7/23 4:00 PM Fri 596 12.33% 4,835
381 10/31 2:00 PM Sun 71 14.79% 480 51 10/8 3:00 PM Fri 404 12.44% 3,247
382 8/31 3:00 PM Tues 244 13.82% 1,765 328 4/16 3:00 PM Fri 627 12.37% 5,069
390 7/25 5:00 PM Sun 718 12.68% 5,663 410 11/8 3:00 PM Mon 703 16.22% 4,335
506 11/8 3:00 PM Mon 2,629 15.80% 16,638
Site # DateHour
(start) DOW Volume % AADT AADT Site # DateHour
(start) DOW Volume % AADT AADT
1 8/21 4:00 PM Sat 455 14.42% 3,156 5 7/29 5:00 PM Thur 580 29.04% 1,997
15 10/6 3:00 PM Wed 846 15.90% 5,321 29 9/3 5:00 PM Fri 193 13.80% 1,399
40 3/12 4:00 PM Fri 531 11.20% 4,742 383 5/14 4:00 PM Fri 609 14.35% 4,243
367 8/6 6:00 PM Fri 758 12.21% 6,210 384 7/31 12:00 PM Sat 95 21.44% 443
391 6/24 5:00 PM Thur 1,021 13.24% 7,714 385 4/30 4:00 PM Fri 249 13.00% 1,915
802 7/30 6:00 PM Fri 829 19.34% 4,287
Site # DateHour
(start) DOW Volume % AADT AADT Site # DateHour
(start) DOW Volume % AADT AADT
362 6/30 4:00 PM Wed 759 12.45% 6,094 306 7/4 12:00 PM Sun 983 16.79% 5,856
364 8/7 12:00 PM Sat 596 12.10% 4,926 805 7/4 12:00 PM Sun 762 26.35% 2,892
386 7/29 5:00 PM Thur 514 23.22% 2,214
388 6/25 5:00 PM Fri 467 13.87% 3,367
389 5/21 5:00 PM Fri 291 14.07% 2,068
2010 Peak Hour by Traffic Pattern Group (TPG)
TPG 9: Central Rural Collector TPG 10: Special Recreational
TPG 5: Urban Minor Arterial or Collector TPG 6: North Rural Minor Arterial
2010 Peak Hour by Traffic Pattern Group (TPG)
2010 Peak Hour by Traffic Pattern Group (TPG)
TPG 7: Central Rural Minor Arterial TPG 8: North Rural Collector

16 2010 Pennsylvania Traffic Data Permanent Sites
P e n n D O T www.dot.state.pa.us
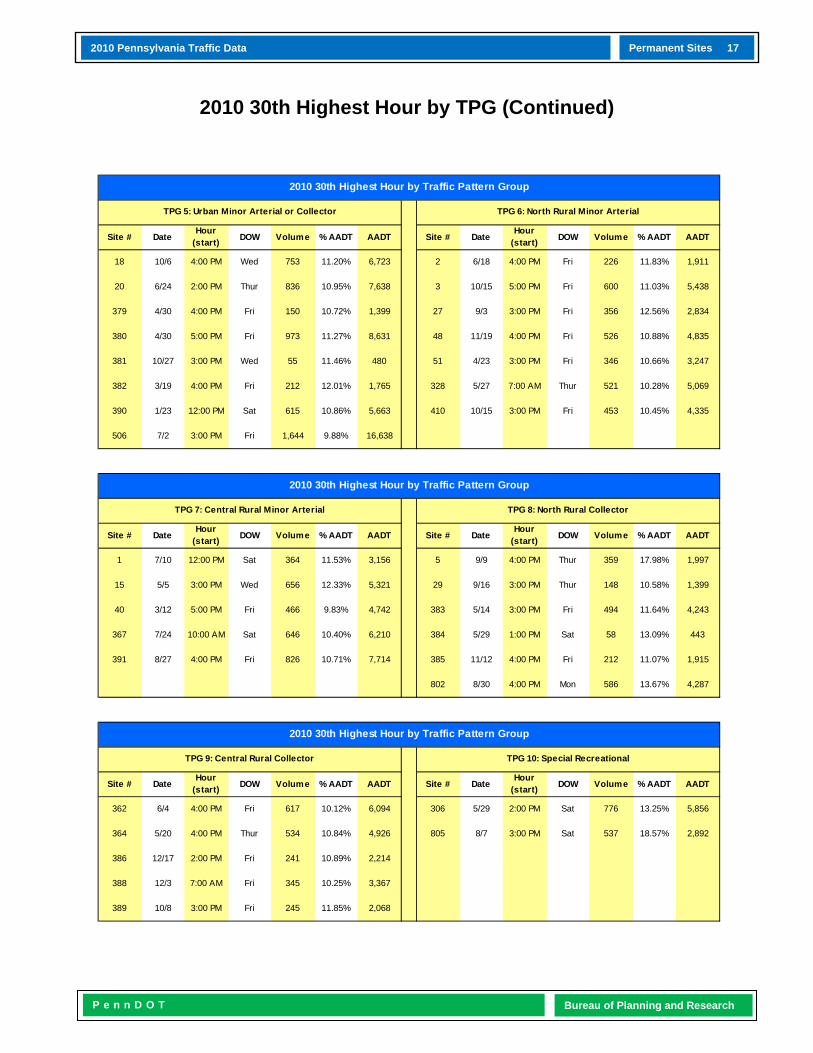
2010 30th Highest Hour by Traffic Pattern Group (TPG)
Site # DateHour
(start) DOW Volume % AADT AADT Site # DateHour
(start) DOW Volume % AADT AADT
205 8/27 4:00 PM Fri 4,860 9.22% 52,706 106 8/6 3:00 PM Fri 3,809 9.65% 39,468
210 1/7 7:00 AM Thur 9,578 9.86% 97,178 207 5/31 4:00 PM Mon 2,726 12.70% 21,460
216 8/15 4:00 PM Sun 3,553 12.65% 28,089 371 7/18 3:00 PM Sun 2,819 14.93% 18,876
317 9/3 3:00 PM Fri 1,475 11.70% 12,603 372 8/21 10:00 AM Sat 2,864 10.41% 27,516
370 9/10 3:00 PM Fri 3,087 9.62% 32,075 392 7/5 12:00 PM Mon 2,470 10.72% 23,050
376 9/3 3:00 PM Fri 5,604 9.51% 58,951 393 9/6 2:00 PM Mon 3,209 10.36% 30,979
377 7/22 5:00 PM Thur 5,483 10.11% 54,213 600 4/2 3:00 PM Fri 3,509 9.41% 37,286
394 8/24 4:00 PM Tues 5,726 9.60% 59,668 800 11/12 4:00 PM Fri 2,364 11.40% 20,737
801 10/19 4:00 PM Tues 7,231 9.00% 80,320
804 9/3 4:00 PM Fri 4,894 8.94% 54,765
Site # DateHour
(start) DOW Volume % AADT AADT Site # DateHour
(start) DOW Volume % AADT AADT
8 4/13 7:00 AM Tues 1,984 11.13% 17,828 4 5/30 1:00 PM Sun 374 11.77% 3,177
206 10/14 7:00 AM Thur 3,748 13.72% 27,319 19 10/14 4:00 PM Thur 625 10.65% 5,868
301 9/30 4:00 PM Thur 1,452 10.72% 13,548 24 5/5 4:00 PM Fri 1,855 10.18% 18,228
304 4/30 3:00 PM Fri 2,799 9.71% 28,828 323 11/19 4:00 PM Fri 419 10.53% 3,978
330 5/19 5:00 PM Wed 1,104 9.70% 11,381 324 11/18 3:00 PM Thur 536 11.63% 4,608
334 4/17 10:00 AM Sat 1,499 9.09% 16,493 326 6/4 3:00 PM Fri 1,023 10.84% 9,440
375 8/22 4:00 PM Sun 2,247 9.67% 23,248 360 9/29 4:00 PM Wed 285 10.82% 2,635
504 11/8 8:00 AM Mon 3,490 8.35% 41,808 363 7/2 5:00 PM Fri 520 10.70% 4,861
395 12/2 4:00 PM Thur 1,058 9.79% 10,808
501 8/15 3:00 PM Sun 1,196 13.07% 9,154
503 9/8 7:00 AM Wed 449 11.01% 4,077
505 8/20 3:00 PM Fri 2,424 11.52% 21,047
700 3/5 3:00 PM Fri 1,494 11.19% 13,347
803 10/10 5:00 PM Sun 2,331 10.51% 22,173
2010 30th Highest Hour by Traffic Pattern Group
TPG 1: Urban Interstate TPG 2: Rural Interstate
2010 30th Highest Hour by Traffic Pattern Group
TPG 3: Urban Principal Arterial TPG 4: Rural Principal Arterial
2010 Pennsylvania Traffic Data Permanent Sites 17
P e n n D O T Bureau of Planning and Research
2010 30th Highest Hour by TPG (Continued)
Site # DateHour
(start) DOW Volume % AADT AADT Site # DateHour
(start) DOW Volume % AADT AADT
18 10/6 4:00 PM Wed 753 11.20% 6,723 2 6/18 4:00 PM Fri 226 11.83% 1,911
20 6/24 2:00 PM Thur 836 10.95% 7,638 3 10/15 5:00 PM Fri 600 11.03% 5,438
379 4/30 4:00 PM Fri 150 10.72% 1,399 27 9/3 3:00 PM Fri 356 12.56% 2,834
380 4/30 5:00 PM Fri 973 11.27% 8,631 48 11/19 4:00 PM Fri 526 10.88% 4,835
381 10/27 3:00 PM Wed 55 11.46% 480 51 4/23 3:00 PM Fri 346 10.66% 3,247
382 3/19 4:00 PM Fri 212 12.01% 1,765 328 5/27 7:00 AM Thur 521 10.28% 5,069
390 1/23 12:00 PM Sat 615 10.86% 5,663 410 10/15 3:00 PM Fri 453 10.45% 4,335
506 7/2 3:00 PM Fri 1,644 9.88% 16,638
Site # DateHour
(start) DOW Volume % AADT AADT Site # DateHour
(start) DOW Volume % AADT AADT
1 7/10 12:00 PM Sat 364 11.53% 3,156 5 9/9 4:00 PM Thur 359 17.98% 1,997
15 5/5 3:00 PM Wed 656 12.33% 5,321 29 9/16 3:00 PM Thur 148 10.58% 1,399
40 3/12 5:00 PM Fri 466 9.83% 4,742 383 5/14 3:00 PM Fri 494 11.64% 4,243
367 7/24 10:00 AM Sat 646 10.40% 6,210 384 5/29 1:00 PM Sat 58 13.09% 443
391 8/27 4:00 PM Fri 826 10.71% 7,714 385 11/12 4:00 PM Fri 212 11.07% 1,915
802 8/30 4:00 PM Mon 586 13.67% 4,287
Site # DateHour
(start) DOW Volume % AADT AADT Site # DateHour
(start) DOW Volume % AADT AADT
362 6/4 4:00 PM Fri 617 10.12% 6,094 306 5/29 2:00 PM Sat 776 13.25% 5,856
364 5/20 4:00 PM Thur 534 10.84% 4,926 805 8/7 3:00 PM Sat 537 18.57% 2,892
386 12/17 2:00 PM Fri 241 10.89% 2,214
388 12/3 7:00 AM Fri 345 10.25% 3,367
389 10/8 3:00 PM Fri 245 11.85% 2,068
TPG 9: Central Rural Collector TPG 10: Special Recreational
2010 30th Highest Hour by Traffic Pattern Group
2010 30th Highest Hour by Traffic Pattern Group
2010 30th Highest Hour by Traffic Pattern Group
TPG 6: North Rural Minor ArterialTPG 5: Urban Minor Arterial or Collector
TPG 7: Central Rural Minor Arterial TPG 8: North Rural Collector

18 2010 Pennsylvania Traffic Data Permanent Sites
P e n n D O T www.dot.state.pa.us
2010 50th Highest Hour by Traffic Pattern Group (TPG)
Site # DateHour
(start) DOW Volume % AADT AADT Site # DateHour
(start) DOW Volume % AADT AADT
205 3/26 4:00 PM Fri 4,799 9.11% 52,706 106 8/8 4:00 PM Sun 3,722 9.43% 39,468
210 1/14 3:00 PM Thur 9,382 9.65% 97,178 207 7/30 2:00 PM Fri 2,578 12.01% 21,460
216 8/8 4:00 PM Sun 3,471 12.36% 28,089 371 8/8 4:00 PM Sun 2,722 14.42% 18,876
317 8/13 5:00 PM Fri 1,416 11.24% 12,603 372 10/1 4:00 PM Fri 2,745 9.98% 27,516
370 5/14 4:00 PM Fri 3,027 9.44% 32,075 392 8/20 2:00 PM Fri 2,408 10.45% 23,050
376 11/28 3:00 PM Sun 5,492 9.32% 58,951 393 8/1 1:00 PM Sun 3,088 9.97% 30,979
377 7/15 5:00 PM Thur 5,410 9.98% 54,213 600 7/23 4:00 PM Fri 3,429 9.20% 37,286
394 8/11 5:00 PM Wed 5,601 9.39% 59,668 800 4/1 4:00 PM Thur 2,276 10.98% 20,737
801 9/29 4:00 PM Wed 7,168 8.92% 80,320
804 7/16 5:00 PM Fri 4,812 8.79% 54,765
Site # DateHour
(start) DOW Volume % AADT AADT Site # DateHour
(start) DOW Volume % AADT AADT
8 4/12 7:00 AM Mon 1,961 11.00% 17,828 4 7/5 2:00 PM Mon 362 11.39% 3,177
206 4/27 7:00 AM Tues 3,706 13.57% 27,319 19 9/9 5:00 PM Thur 608 10.36% 5,868
301 4/1 3:00 PM Thur 1,430 10.56% 13,548 24 11/5 5:00 PM Fri 1,798 9.86% 18,228
304 8/27 5:00 PM Fri 2,749 9.54% 28,828 323 3/5 4:00 PM Fri 408 10.26% 3,978
330 10/7 5:00 PM Thur 1,084 9.52% 11,381 324 7/2 4:00 PM Fri 523 11.35% 4,608
334 5/20 4:00 PM Thur 1,473 8.93% 16,493 326 3/26 4:00 PM Fri 1,005 10.65% 9,440
375 8/18 12:00 PM Wed 2,182 9.39% 23,248 360 4/29 3:00 PM Thur 278 10.55% 2,635
504 11/9 7:00 AM Tues 3,455 8.26% 41,808 363 4/2 2:00 PM Fri 498 10.24% 4,861
395 9/20 4:00 PM Mon 1,038 9.60% 10,808
501 9/3 2:00 PM Fri 1,139 12.44% 9,154
503 9/15 7:00 AM Wed 438 10.74% 4,077
505 3/19 4:00 PM Fri 2,338 11.11% 21,047
700 11/12 3:00 PM Fri 1,416 10.61% 13,347
803 10/8 5:00 PM Fri 2,287 10.31% 22,173
2010 50th Highest Hour by Traffic Pattern Group
TPG 1: Urban Interstate TPG 2: Rural Interstate
2010 50th Highest Hour by Traffic Pattern Group
TPG 3: Urban Principal Arterial TPG 4: Rural Principal Arterial

2010 Pennsylvania Traffic Data Permanent Sites 19
P e n n D O T Bureau of Planning and Research
2010 50th Highest Hour by TPG (Continued)
Site # DateHour
(start) DOW Volume % AADT AADT Site # DateHour
(start) DOW Volume % AADT AADT
18 10/1 5:00 PM Fri 732 10.89% 6,723 2 5/10 4:00 PM Mon 214 11.20% 1,911
20 6/24 12:00 PM Thur 789 10.33% 7,638 3 10/29 4:00 PM Fri 576 10.59% 5,438
379 5/3 4:00 PM Mon 146 10.44% 1,399 27 8/6 4:00 PM Fri 342 12.07% 2,834
380 4/15 4:00 PM Thur 947 10.97% 8,631 48 8/7 10:00 AM Sat 512 10.59% 4,835
381 11/12 5:00 PM Fri 53 11.04% 480 51 8/5 4:00 PM Thur 339 10.44% 3,247
382 5/3 4:00 PM Mon 205 11.61% 1,765 328 7/29 5:00 PM Thur 511 10.08% 5,069
390 4/10 12:00 PM Sat 598 10.56% 5,663 410 4/9 3:00 PM Fri 444 10.24% 4,335
506 5/28 4:00 PM Fri 1,611 9.68% 16,638
Site # DateHour
(start) DOW Volume % AADT AADT Site # DateHour
(start) DOW Volume % AADT AADT
1 7/5 3:00 PM Mon 354 11.22% 3,156 5 9/14 7:00 AM Tues 349 17.48% 1,997
15 10/22 3:00 PM Fri 634 11.92% 5,321 29 11/12 3:00 PM Fri 144 10.29% 1,399
40 4/8 4:00 PM Thur 454 9.57% 4,742 383 4/8 3:00 PM Thur 475 11.19% 4,243
367 12/18 12:00 PM Sat 627 10.10% 6,210 384 7/17 1:00 PM Sat 54 12.19% 443
391 3/26 5:00 PM Fri 810 10.50% 7,714 385 4/15 4:00 PM Thur 203 10.60% 1,915
802 10/29 3:00 PM Fri 571 13.32% 4,287
Site # DateHour
(start) DOW Volume % AADT AADT Site # DateHour
(start) DOW Volume % AADT AADT
362 5/26 4:00 PM Wed 607 9.96% 6,094 306 7/31 10:00 AM Sat 737 12.59% 5,856
364 6/21 4:00 AM Mon 520 10.56% 4,926 805 6/20 1:00 PM Sun 494 17.08% 2,892
386 11/5 3:00 PM Fri 236 10.66% 2,214
388 9/15 4:00 PM Wed 338 10.04% 3,367
389 9/21 3:00 PM Tues 240 11.61% 2,068
TPG 9: Central Rural Collector TPG 10: Special Recreational
2010 50th Highest Hour by Traffic Pattern Group
2010 50th Highest Hour by Traffic Pattern Group
2010 50th Highest Hour by Traffic Pattern Group
TPG 5: Urban Minor Arterial or Collector TPG 6: North Rural Minor Arterial
TPG 7: Central Rural Minor Arterial TPG 8: North Rural Collector
20 2010 Pennsylvania Traffic Data Permanent Sites
P e n n D O T www.dot.state.pa.us
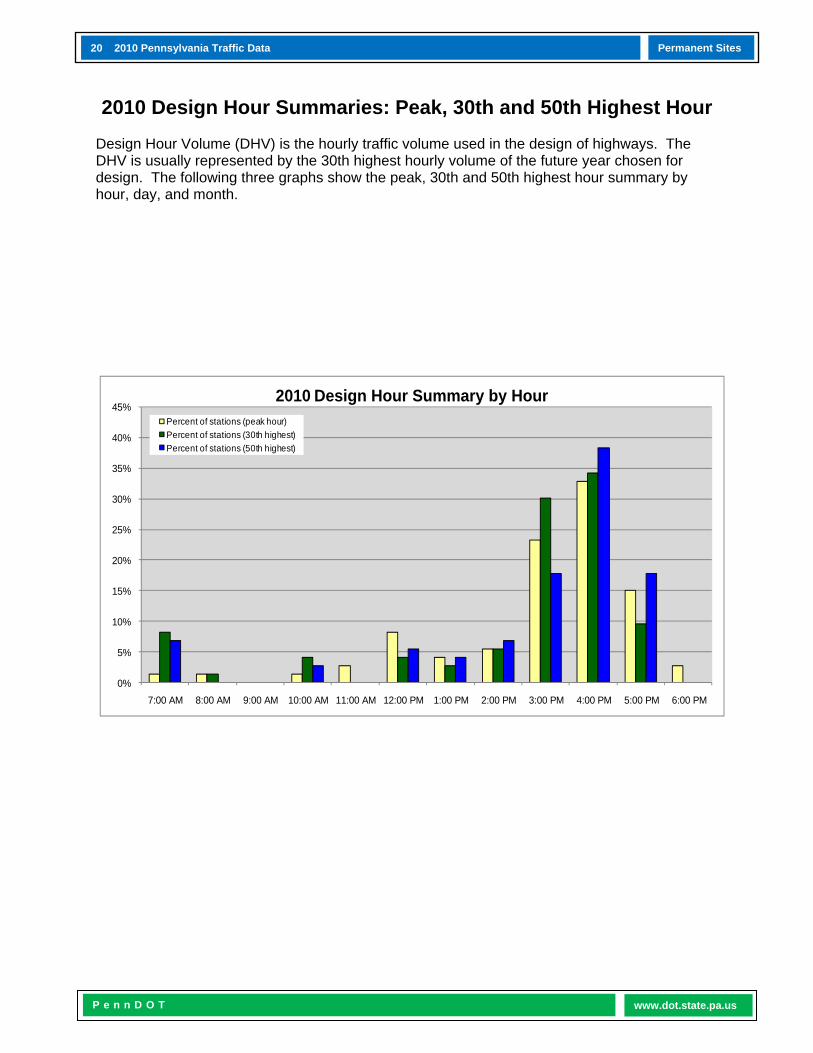
2010 Design Hour Summaries: Peak, 30th and 50th Highest Hour
Design Hour Volume (DHV) is the hourly traffic volume used in the design of highways. The DHV is usually represented by the 30th highest hourly volume of the future year chosen for design. The following three graphs show the peak, 30th and 50th highest hour summary by hour, day, and month.
0%
5%
10%
15%
20%
25%
30%
35%
40%
45%
7:00 AM 8:00 AM 9:00 AM 10:00 AM 11:00 AM 12:00 PM 1:00 PM 2:00 PM 3:00 PM 4:00 PM 5:00 PM 6:00 PM
2010 Design Hour Summary by HourPercent of stations (peak hour)Percent of stations (30th highest)Percent of stations (50th highest)

2010 Pennsylvania Traffic Data Permanent Sites 21
P e n n D O T Bureau of Planning and Research
2010 Design Hour Summaries: Peak, 30th and 50th Highest Hour
0%
5%
10%
15%
20%
25%
30%
35%
40%
45%
50%
Sun Mon Tues Wed Thur Fri Sat
2010 Design Hour Summary by DayPercent of stations (peak hour)Percent of stations (30th highest)Percent of stations (50th highest)
0%
5%
10%
15%
20%
25%
30%
Jan Feb Mar Apr May Jun Jul Aug Sep Oct Nov Dec
2010 Design Hour Summary by MonthPercent of stations (peak hour)Percent of stations (30th highest)Percent of stations (50th highest)

22 2010 Pennsylvania Traffic Data Permanent Sites
P e n n D O T www.dot.state.pa.us
Five Year Summary of Annual Average Daily Traffic (AADT) from Permanent Sites
This chart shows the permanent site station numbers and their Annual Average Daily Traffic (AADT) for the past five years, 2006 through 2010. The percent change is also given for 2009 to 2010 and 2006 to 2010, showing where traffic has increased or decreased.
*Indicates there is no data available.
Site # 2006 2007 2008 2009 2010 2009-2010 2006-2010
1 3,716 3,806 * 3,767 3,156 -19.4% -17.7%
2 2,058 2,098 2,016 1,935 1,911 -1.3% -7.7%
3 5,738 5,728 5,448 5,402 5,438 0.7% -5.5%
4 2,834 2,855 2,741 2,868 3,177 9.7% 10.8%
5 1,441 1,400 1,327 1,336 1,997 33.1% 27.8%
8 15,912 16,282 16,270 16,649 17,828 6.6% 10.7%
15 5,982 5,832 5,564 5,199 5,321 2.3% -12.4%
18 7,015 6,644 6,545 6,414 6,723 4.6% -4.3%
19 5,982 5,821 5,587 5,712 5,868 2.7% -1.9%
20 7,801 7,552 7,381 7,401 7,638 3.1% -2.1%
24 17,350 17,705 * 17,992 18,228 1.3% 4.8%
27 2,773 2,799 2,688 2,742 2,834 3.2% 2.2%
29 1,173 1,156 1,163 1,246 1,399 10.9% 16.2%
40 4,943 5,019 * 4,865 4,742 -2.6% -4.2%
48 4,547 4,547 4,610 4,275 4,835 11.6% 6.0%
51 3,650 3,388 3,195 3,160 3,247 2.7% -12.4%
106 * * * * 39,468 0.0% 0.0%
126 * * * * * 0.0% 0.0%
203 20,589 20,491 20,589 20,570 * 0.0% -0.1%
205 * * * 52,221 52,706 0.9% 0.0%
206 27,977 29,004 28,350 27,590 27,319 -1.0% -2.4%
207 20,577 21,038 21,402 21,107 21,460 1.6% 4.1%
208 65,773 65,294 64,510 62,178 * 0.0% -5.8%
210 116,841 117,292 115,527 113,384 97,178 -16.7% -20.2%
216 28,187 27,395 26,915 27,376 28,089 2.5% -0.3%
301 15,439 15,045 14,757 14,285 13,548 -5.4% -14.0%
304 * * * 26,626 28,828 7.6% 0.0%
306 6,155 5,991 5,784 5,416 5,856 7.5% -5.1%
317 * * * * 12,603 0.0% 0.0%
323 3,651 3,788 3,757 3,877 3,978 2.5% 8.2%
324 * * * * 4,608 0.0% 0.0%
326 10,114 10,027 9,594 9,475 9,440 -0.4% -7.1%
328 5,070 5,138 4,944 4,950 5,069 2.3% 0.0%
330 11,471 11,487 11,371 11,166 11,381 1.9% -0.8%
334 18,933 18,125 17,379 16,951 16,493 -2.8% -14.8%
349 38,480 38,380 37,130 37,154 * 0.0% -3.6%
360 2,658 2,580 2,500 2,368 2,635 10.1% -0.9%
362 5,932 6,019 5,927 5,987 6,094 1.8% 2.7%
363 5,058 5,037 4,817 4,733 4,861 2.6% -4.1%
Annual Average Daily Traffic (AADT) Percent Change

2010 Pennsylvania Traffic Data Permanent Sites 23
P e n n D O T Bureau of Planning and Research
Five Year Summary of AADT from Permanent Sites (Continued)
*Indicates there is no data available.
Site # 2006 2007 2008 2009 2010 2009-2010 2006-2010
364 5,352 5,327 5,192 5,006 4,926 -1.6% -8.6%
367 6,241 6,087 5,894 6,023 6,210 3.0% -0.5%
370 31,099 31,865 32,519 31,319 32,075 2.4% 3.0%
371 19,401 19,092 18,680 18,249 18,876 3.3% -2.8%
372 26,696 27,031 26,543 26,692 27,516 3.0% 3.0%
374 33,927 33,181 32,253 32,941 * 0.0% -3.0%
375 25,170 24,070 23,479 23,249 23,248 0.0% -8.3%
376 61,170 61,431 61,733 60,457 58,951 -2.6% -3.8%
377 53,219 54,592 54,531 54,557 54,213 -0.6% 1.8%
378 10,922 10,660 10,446 8,969 * 0.0% -21.8%
379 1,493 1,515 1,439 1,426 1,399 -1.9% -6.7%
380 9,451 9,171 9,399 9,121 8,631 -5.7% -9.5%
381 671 612 537 520 480 -8.3% -39.8%
382 1,927 1,870 1,782 1,778 1,765 -0.7% -9.2%
383 4,181 3,926 4,223 3,761 4,243 11.4% 1.5%
384 630 606 584 451 443 -1.8% -42.2%
385 2,081 1,929 1,844 1,840 1,915 3.9% -8.7%
386 2,122 2,235 2,271 2,097 2,214 5.3% 4.2%
387 3,384 3,301 3,164 3,219 * 0.0% -5.1%
388 3,961 3,822 3,358 3,220 3,367 4.4% -17.6%
389 2,239 2,182 2,158 2,022 2,068 2.2% -8.3%
390 6,608 6,307 6,267 5,781 5,663 -2.1% -16.7%
391 8,733 8,549 8,170 7,769 7,714 -0.7% -13.2%
392 23,746 23,867 23,035 23,312 23,050 -1.1% -3.0%
393 30,910 30,875 30,513 29,812 30,979 3.8% 0.2%
394 52,363 52,003 55,137 57,096 59,668 4.3% 12.2%
395 * 11,550 10,971 10,736 10,808 0.7% -6.9%
410 * * * * 4,335 0.0% 0.0%
501 * * * * 9,154 0.0% 0.0%
503 * * * * 4,077 0.0% 0.0%
504 * * * * 41,808 0.0% 0.0%
505 * * * * 21,047 0.0% 0.0%
506 * * * * 16,638 0.0% 0.0%
600 * * * * 37,286 0.0% 0.0%
700 * * * * 13,347 0.0% 0.0%
800 * * * 20,493 20,737 1.2% 0.0%
801 * * * 76,651 80,320 4.6% 0.0%
802 * * * * 4,287 0.0% 0.0%
803 * * * * 22,173 0.0% 0.0%
804 * * * * 54,765 0.0% 0.0%
805 * * * * 2,892 0.0% 0.0%
806 * * * * * 0.0% 0.0%
809 * * * * * 0.0% 0.0%
985 * * * 19,748 * 0.0% 0.0%
* 395 Percent change is taken from 2007, 2008, 2009 & 2010 data only, 2007 was first full year of data.* 205, 304, 800 & 801 2009 was first full year of data.* 106, 317, 324, 410, 501, 503, 504, 505, 506, 600, 700, 802, 803, 804 & 805 2010 was first full year of data* 985 2009 only full year of data.* 1, 24 & 40 no 2008 data due to site being inactive.* 203, 208, 349, 374, 378 & 387 no 2010 data due to site being inactive.* 126, 806 & 809 sites inactive.
Annual Average Daily Traffic (AADT) Percent Change

24 2010 Pennsylvania Traffic Data Permanent Sites
P e n n D O T www.dot.state.pa.us
Statewide Traffic Trends: Annual and Multi-Year Change By Traffic Pattern Group
This table shows percent change for the traffic pattern groups at one-year intervals starting with 2005/2006 up to 2009/2010. An overall change in growth over the 5 year period for the traffic pattern groups is also shown on this table.
TRAFFIC PATTERN GROUPS 2005-06 2006-07 2007-08 2008-09 2009-10 2005-10
TPG 1 2.9% 3.0% 2.4% 1.0% 0.0% 9.3%Urban Interstate
TPG 2 3.0% 3.0% 2.4% 2.2% 1.6% 12.2%Rural Interstate
TPG 3 0.7% 1.1% 0.2% 0.3% 0.2% 2.5%Urban Principal Arterial
TPG 4 1.2% 1.3% 0.8% 0.5% 0.3% 4.1%Rural Principal Arterial
TPG 5 0.7% 1.1% 0.2% 0.3% 0.2% 2.5%Urban Minor Arterials or Collectors
TPG 6 1.2% 1.3% 0.8% 0.5% 0.3% 4.1%North Rural Minor Arterials
TPG 7 1.2% 1.3% 0.8% 0.5% 0.3% 4.1%Central Rural Minor Arterials
TPG 8 1.2% 1.3% 0.8% 0.5% 0.3% 4.1%North Rural Collectors
TPG 9 1.2% 1.3% 0.8% 0.5% 0.3% 4.1%Central Rural Collectors
TPG 10 1.2% 1.3% 0.8% 0.5% 0.3% 4.1%Special Recreational
Statewide 1.5% 1.6% 1.0% 0.7% 0.4% 5.1%
Percent Change Per Year, 2005 - 2010

2010 Pennsylvania Traffic Data Permanent Sites 25
P e n n D O T Bureau of Planning and Research
Statewide Traffic Trends
This chart shows yearly changes from 1991 to 2010 and a 20-year cumulative trend for the same period.
2.0%
2.0%
2.0%
2.0%
3.0%
2.0%
2.0%
2.0%
2.0%
0.5%
1.0%
2.0%
2.0%
2.0%
1.8%
1.5%
1.6%
1.0%
0.7%
0.4%
2.0%
4.0%
6.1%
8.2%
11.5%
13.7%
16.0%
18.3%
20.7%
21.3%
22.5%
24.9%
27.4%
30.0%
32.3%
34.3%
36.5%
37.8%
38.8%
39.4%
-10.
0%
0.0%
10.0
%
20.0
%
30.0
%
40.0
%
50.0
%
60.0
%
70.0
%
1991
1992
1993
1994
1995
1996
1997
1998
1999
2000
2001
2002
2003
2004
2005
2006
2007
2008
2009
2010
Percent Growth
Year
Sta
tew
ide
Trav
el T
rend
sA
nnua
l and
Cum
ulat
ive
Gro
wth
Bas
e Ye
ar:
1991
Curren
t Year
Cumulative Total

26 2010 Pennsylvania Traffic Data Permanent Sites
P e n n D O T www.dot.state.pa.us
Heaviest Holiday Travel Periods: 2010
The 73 permanent sites were used to calculate the holidays having the highest seven-day periods of traffic. The highest seven-day holiday periods and the highest day within the seven-day holiday period (total traffic at all permanent site stations) are shown on the chart below:
The chart indicates that Independence Day had the highest seven-day holiday period in 2010 with a total volume of 9,266,855. Thanksgiving ranked second (8,748,873) followed by Labor Day (8,706,592) and Memorial Day (8,160,247). Christmas and New Year’s Day ranked fifth (7,504,560) and sixth (6,116,394) respectively. The highest day during a seven-day holiday period in 2010 was the Friday before Independence Day (July 2, 2010), which had a volume of 1,596,181. The second highest day was the Wednesday before Thanksgiving (November 24, 2010), which had a volume of 1,595,697. The Friday before Labor Day (September 3, 2010), ranked third with 1,543,231, while the Friday before Memorial Day (May 28, 2010), ranked fourth with 1,439,252. The Thursday before Christmas (December 23, 2010) ranked fifth with 1,370,083, while the Thursday before New Year’s Day (December 30, 2010) ranked sixth with 1,036,300.
1,596,181 1,595,697 1,543,231 1,439,252 1,370,083
1,036,300
9,266,855
8,748,873 8,706,592
8,160,247
7,504,560
6,116,394
500,000
1,500,000
2,500,000
3,500,000
4,500,000
5,500,000
6,500,000
7,500,000
8,500,000
9,500,000
Independence Day Thanksgiving Labor Day Memorial Day Christmas New Year's Day
Highest Holiday Periods
Highest Holiday (Day) Highest Holiday Period (7-Day)

2010 Pennsylvania Traffic Data Permanent Sites 27
P e n n D O T Bureau of Planning and Research
Heaviest Holiday Travel Period Comparisons: 2009-2010
Total Volume
Total Volume
1. Memorial Day 1,409,991 1. Independence Day 1,596,181
2. Labor Day 1,383,728 2. Thanksgiving 1,595,697
3. Thanksgiving 1,316,256 3. Labor Day 1,543,231
4. Independence Day 1,314,166 4. Memorial Day 1,439,252
5. Christmas 1,191,002 5. Christmas 1,370,083
6. New Year's Day 989,628 6. New Year's Day 1,036,300
Total Volume
Total Volume
1. Memorial Day 8,049,350 1. Independence Day 9,266,855
2. Independence Day 7,776,275 2. Thanksgiving 8,748,873
3. Labor Day 7,718,298 3. Labor Day 8,706,592
4. Thanksgiving 7,498,077 4. Memorial Day 8,160,247
5. Christmas 6,720,232 5. Christmas 7,504,560
6. New Year's Day 5,799,441 6. New Year's Day 6,116,394
2009 2010
Holiday Holiday
Highest Holiday (Day)
2009 2010
Holiday Holiday
Highest Holiday Period (7-Day)

28 2010 Pennsylvania Traffic Data Factoring Process
P e n n D O T www.dot.state.pa.us
Factoring Process: Traffic Adjustment Factors
Traffic Adjustment Factors Traffic Adjustment Factors are numbers that are used to create traffic statistics representing an average day. Factors are generated by applying statistical methods and programs to raw traffic counts. The different procedures used to factor counts depend on the following outcomes. 24-Hour Total Traffic and Truck Traffic Estimation Count data less than 24-hours (short term counts) must first be expanded to a 24-hour total, which is accomplished through the use of hourly percentage tables. Separate tables are utilized for total vehicles and truck data application. AADT and ADTT Estimation A 24-hour count is processed to an Annual Average Daily Traffic (AADT) and Average Daily Truck Traffic (ADTT) through the application of a “day of week by month” factor. Separate tables are utilized for total vehicle and truck data application. Axle Correction Axle volume count data is collected by counting the number of axles striking a single pneumatic tube stretched across a section of highway and dividing by two. This type of data must be corrected to compensate for vehicles containing more than two axles (specifically truck data) to obtain a representative number of vehicles actually traveling that road section. This representation is obtained through the application of an axle correction factor. Equivalent Single Axle Load Adjustment (ESAL) ESAL adjustment factors are applied to the ADTT for each type of truck classification, to determine the loading effect these truck classes have on the pavement. Two separate calculations are performed: one for rigid type pavement (concrete) and one for flexible type pavement (bituminous). The AASHTO Mechanistic Empirical Pavement Design Guide has incorporated improved methods of determining loading effects of traffic. In the future, these new methods may supersede the use of ESAL factors. Growth Factor If the count to be analyzed was taken earlier than the current year, a regional growth trend is applied to project the older count data to a representative current year estimate. Regional growth trends are established based on Functional Class Group (FCG). Design Hour Volume Factor, DHV (K) The K-factor represents the percentage of AADT during the design hour. It is calculated by dividing the peak hour volume by the AADT. A 24-hour count is required to calculate the K-factor. If this condition is not met (in the case of manual counts), a default value is applied. The default value is calculated from the 73 permanent site stations using the 30th highest hour and is established based on Traffic Pattern Group (TPG).

2010 Pennsylvania Traffic Data Factoring Process 29
P e n n D O T Bureau of Planning and Research
Table 350 Hourly Percentages Compiled for Total Vehicles
The following table shows hourly percentages of total vehicles sorted by Traffic Pattern Group (TPG) for the year 2010. Factors from this table are applied to raw traffic counts of less than 24 hours, which may include volume counts (axle and loop), automatic vehicle classification (AVC), or manual classification counts. Hourly percentages from this table are applied to the known hour periods of the raw count, converting it to a 24-hour total. The factors were developed using the Department’s Traffic Information System (TIS), a PC-based computer application. Raw count data from 2,000 AVC counts, collected statewide and averaged over the last five years, was assigned to the respective TPG and a summary was produced showing the hourly percentage tables by direction (applied to divided roadways).
HOUR DIR 1 DIR 2 TOTAL HOUR DIR 1 DIR 2 TOTAL1 1.07% 1.20% 1.17% 1 1.47% 1.75% 1.74%2 0.81% 0.85% 0.85% 2 1.21% 1.47% 1.43%3 0.75% 0.77% 0.77% 3 1.15% 1.38% 1.32%4 0.83% 0.83% 0.82% 4 1.18% 1.38% 1.33%5 1.25% 1.11% 1.12% 5 1.43% 1.59% 1.54%6 2.67% 2.08% 2.29% 6 2.41% 2.24% 2.26%7 6.00% 4.08% 4.90% 7 4.36% 3.60% 3.68%8 8.30% 5.41% 6.70% 8 5.98% 4.58% 4.82%9 6.88% 5.11% 5.93% 9 5.51% 4.75% 4.90%10 5.46% 4.76% 5.13% 10 5.41% 4.86% 5.13%11 5.21% 4.81% 5.04% 11 5.68% 5.16% 5.45%12 5.27% 5.05% 5.23% 12 5.89% 5.30% 5.65%13 5.34% 5.31% 5.40% 13 5.86% 5.43% 5.71%14 5.39% 5.49% 5.49% 14 5.92% 5.72% 5.88%15 5.89% 6.24% 6.04% 15 6.19% 6.28% 6.27%16 6.55% 7.76% 7.04% 16 6.57% 7.14% 6.81%17 6.66% 8.79% 7.57% 17 6.74% 7.92% 7.12%18 6.48% 8.42% 7.36% 18 6.20% 7.29% 6.59%19 5.21% 5.83% 5.59% 19 5.04% 5.40% 5.33%20 3.95% 4.41% 4.32% 20 4.14% 4.31% 4.40%21 3.26% 3.81% 3.66% 21 3.61% 3.81% 3.89%22 2.82% 3.35% 3.20% 22 3.20% 3.41% 3.47%23 2.27% 2.56% 2.51% 23 2.69% 2.86% 2.90%24 1.66% 1.96% 1.87% 24 2.15% 2.36% 2.36%
TOTAL 100.00% 100.00% 100.00% TOTAL 100.00% 100.00% 100.00%
TPG 1 TPG 2Hourly Percentages: Total Vehicles

30 2010 Pennsylvania Traffic Data Factoring Process
P e n n D O T www.dot.state.pa.us
Table 350 Hourly Percentages Compiled for Total Vehicles (Continued)
HOUR DIR 1 DIR 2 TOTAL HOUR DIR 1 DIR 2 TOTAL1 0.73% 0.99% 0.81% 1 0.87% 1.02% 0.79%2 0.47% 0.59% 0.49% 2 0.61% 0.71% 0.53%3 0.42% 0.47% 0.41% 3 0.55% 0.62% 0.48%4 0.50% 0.47% 0.44% 4 0.69% 0.67% 0.58%5 0.95% 0.70% 0.77% 5 1.20% 0.95% 1.04%6 2.67% 1.63% 2.06% 6 3.16% 2.05% 2.53%7 6.18% 3.62% 4.71% 7 5.96% 3.88% 4.83%8 8.54% 5.38% 6.69% 8 7.42% 5.26% 6.22%9 7.20% 5.05% 6.04% 9 6.33% 5.14% 5.69%10 5.52% 4.63% 5.17% 10 5.47% 4.89% 5.32%11 5.18% 4.68% 5.11% 11 5.32% 4.88% 5.40%12 5.29% 5.07% 5.43% 12 5.40% 5.22% 5.59%13 5.53% 5.41% 5.74% 13 5.54% 5.40% 5.80%14 5.55% 5.59% 5.76% 14 5.78% 5.73% 5.98%15 6.03% 6.44% 6.34% 15 6.26% 6.47% 6.58%16 6.69% 8.19% 7.33% 16 6.83% 8.01% 7.54%17 6.89% 9.26% 7.81% 17 7.10% 8.89% 7.91%18 6.76% 9.08% 7.68% 18 6.80% 8.52% 7.43%19 5.38% 6.41% 5.97% 19 5.20% 6.03% 5.58%20 4.06% 4.79% 4.60% 20 3.90% 4.52% 4.26%21 3.26% 3.98% 3.79% 21 3.20% 3.84% 3.56%22 2.73% 3.40% 3.11% 22 2.80% 3.23% 2.90%23 2.10% 2.38% 2.22% 23 2.19% 2.36% 2.06%24 1.40% 1.77% 1.52% 24 1.42% 1.70% 1.41%
TOTAL 100.00% 100.00% 100.00% TOTAL 100.00% 100.00% 100.00%
Hourly Percentages: Total VehiclesTPG 3 TPG 4

2010 Pennsylvania Traffic Data Factoring Process 31
P e n n D O T Bureau of Planning and Research
Table 350 Hourly Percentages Compiled for Total Vehicles (Continued)
HOUR DIR 1 DIR 2 TOTAL HOUR DIR 1 DIR 2 TOTAL1 0.72% 0.93% 0.69% 1 0.89% 0.87% 0.74%2 0.45% 0.55% 0.40% 2 0.57% 0.56% 0.47%3 0.38% 0.44% 0.32% 3 0.47% 0.45% 0.41%4 0.46% 0.44% 0.34% 4 0.56% 0.60% 0.50%5 0.87% 0.65% 0.64% 5 0.96% 0.83% 0.97%6 2.40% 1.57% 1.85% 6 2.18% 1.73% 2.35%7 5.43% 3.66% 4.38% 7 4.67% 3.51% 4.39%8 7.83% 5.33% 6.48% 8 6.18% 5.43% 5.89%9 6.85% 5.08% 5.91% 9 6.34% 5.04% 5.62%10 5.37% 4.63% 5.03% 10 5.77% 4.69% 5.42%11 5.11% 4.65% 5.01% 11 5.32% 4.93% 5.58%12 5.38% 5.14% 5.45% 12 5.74% 5.29% 5.83%13 5.71% 5.57% 5.87% 13 5.96% 5.97% 6.06%14 5.71% 5.60% 5.78% 14 6.20% 6.22% 6.17%15 6.11% 6.38% 6.37% 15 6.45% 7.06% 6.82%16 6.95% 8.15% 7.55% 16 7.04% 8.64% 7.78%17 7.26% 9.31% 8.16% 17 7.27% 8.88% 8.02%18 7.03% 9.18% 8.03% 18 6.96% 8.66% 7.33%19 5.57% 6.57% 6.22% 19 5.82% 6.03% 5.61%20 4.41% 4.86% 4.87% 20 4.46% 4.55% 4.40%21 3.62% 4.02% 4.02% 21 3.56% 3.73% 3.58%22 2.91% 3.28% 3.11% 22 2.78% 2.86% 2.77%23 2.11% 2.36% 2.12% 23 2.31% 2.07% 1.97%24 1.36% 1.65% 1.38% 24 1.55% 1.42% 1.30%
TOTAL 100.00% 100.00% 100.00% TOTAL 100.00% 100.00% 100.00%
Hourly Percentages: Total VehiclesTPG 5 TPG 6

32 2010 Pennsylvania Traffic Data Factoring Process
P e n n D O T www.dot.state.pa.us
Table 350 Hourly Percentages Compiled for Total Vehicles (Continued)
HOUR DIR 1 DIR 2 TOTAL HOUR DIR 1 DIR 2 TOTAL1 0.82% 0.98% 0.73% 1 0.66% 1.03% 0.70%2 0.53% 0.67% 0.44% 2 0.42% 0.59% 0.43%3 0.49% 0.54% 0.38% 3 0.31% 0.40% 0.35%4 0.56% 0.55% 0.45% 4 0.41% 0.38% 0.39%5 1.02% 0.84% 0.90% 5 0.77% 0.49% 0.73%6 2.66% 1.84% 2.51% 6 2.28% 1.26% 1.97%7 5.75% 3.66% 5.04% 7 5.77% 2.67% 4.33%8 7.40% 5.00% 6.35% 8 7.56% 4.90% 6.16%9 6.32% 4.72% 5.51% 9 6.35% 4.83% 5.70%10 5.48% 4.53% 5.08% 10 5.52% 4.37% 5.21%11 5.33% 4.71% 5.15% 11 5.42% 4.80% 5.32%12 5.53% 5.05% 5.40% 12 5.52% 5.22% 5.60%13 5.82% 5.49% 5.76% 13 6.00% 5.73% 5.95%14 5.77% 5.63% 5.76% 14 5.93% 5.80% 6.00%15 6.35% 6.64% 6.48% 15 6.52% 6.36% 6.58%16 7.08% 8.53% 7.71% 16 6.84% 8.33% 7.74%17 7.30% 9.52% 8.18% 17 7.22% 9.01% 8.15%18 6.76% 9.10% 7.74% 18 6.75% 8.99% 7.71%19 5.31% 6.36% 5.78% 19 5.32% 7.28% 5.99%20 4.10% 4.66% 4.45% 20 4.42% 5.16% 4.72%21 3.44% 3.91% 3.75% 21 3.58% 4.26% 3.88%22 2.74% 3.09% 2.98% 22 2.93% 3.56% 2.98%23 2.03% 2.27% 2.08% 23 2.10% 2.45% 2.05%24 1.40% 1.71% 1.39% 24 1.38% 2.12% 1.37%
TOTAL 100.00% 100.00% 100.00% TOTAL 100.00% 100.00% 100.00%
Hourly Percentages: Total VehiclesTPG 7 TPG 8

2010 Pennsylvania Traffic Data Factoring Process 33
P e n n D O T Bureau of Planning and Research
Table 350 Hourly Percentages Compiled for Total Vehicles (Continued)
HOUR DIR 1 DIR 2 TOTAL HOUR DIR 1 DIR 2 TOTAL1 0.83% 1.23% 0.76% 1 0.48% 0.37% 0.55%2 0.53% 0.76% 0.45% 2 0.40% 0.22% 0.33%3 0.48% 0.64% 0.39% 3 0.43% 0.33% 0.27%4 0.61% 0.65% 0.43% 4 0.32% 0.23% 0.31%5 1.18% 0.93% 0.81% 5 0.56% 0.47% 0.62%6 2.92% 1.96% 2.22% 6 1.38% 1.06% 1.53%7 6.26% 3.91% 4.74% 7 3.55% 1.76% 3.55%8 7.90% 5.17% 6.44% 8 6.21% 2.48% 6.04%9 6.99% 5.02% 5.66% 9 5.76% 3.02% 5.90%10 5.60% 4.56% 4.96% 10 4.53% 3.61% 5.29%11 5.00% 4.48% 4.94% 11 4.88% 4.10% 5.47%12 5.17% 4.73% 5.25% 12 6.04% 4.27% 5.88%13 5.31% 5.45% 5.60% 13 6.83% 5.40% 6.28%14 5.49% 5.56% 5.64% 14 6.86% 5.71% 6.47%15 5.74% 6.49% 6.34% 15 6.24% 5.71% 6.59%16 6.33% 7.78% 7.65% 16 6.37% 7.41% 7.45%17 6.70% 8.63% 8.17% 17 6.63% 9.96% 7.95%18 6.60% 8.25% 7.88% 18 6.85% 12.49% 8.01%19 5.61% 6.33% 6.12% 19 7.16% 7.81% 6.14%20 4.45% 4.66% 4.77% 20 6.86% 7.53% 5.19%21 3.44% 3.98% 3.98% 21 5.06% 7.57% 4.08%22 3.00% 3.48% 3.13% 22 3.38% 4.52% 2.95%23 2.37% 2.98% 2.21% 23 1.99% 2.41% 1.95%24 1.47% 2.37% 1.46% 24 1.22% 1.55% 1.21%
TOTAL 100.00% 100.00% 100.00% TOTAL 100.00% 100.00% 100.00%
Hourly Percentages: Total VehiclesTPG 9 TPG 10

34 2010 Pennsylvania Traffic Data Factoring Process
P e n n D O T www.dot.state.pa.us
Table 360 Hourly Percentages Compiled for Truck Traffic
The following four tables and chart show hourly percentages of truck traffic sorted by Maintenance Functional Class (MFC). These tables are applied separately to raw truck data of less than 24-hours, including both Automatic Vehicle Classification (AVC) and manual counts. Manual classification counts are the primary source of data using these tables. The hourly percentages are calculated from these tables and applied to the sum of the known hour periods and in turn converted to a 24-hour truck total. The factors were developed using 2,000 AVC counts, collected and verified over the last five years. The raw count data was assigned to the respective Traffic Pattern Group (TPG), the truck data was extracted by vehicle type, and the Traffic Information System (TIS) generated a summary showing the hourly percentage table by direction (applied to divided roadways). Truck data is tabulated according to MFC. Hourly weekday truck distribution provides evidence that the hourly percentage changes by MFC provide a valid breakdown of groups. Therefore, a summary was produced converting the TPGs to comparable MFC groups to be consistent with the characteristics of the 2010 Hourly Percentages (Truck Traffic) tables.
HOUR DIR 1 DIR 2 TOTAL HOUR DIR 1 DIR 2 TOTAL0 2.62% 3.11% 2.82% 0 1.24% 1.44% 1.17%1 2.35% 3.00% 2.59% 1 1.12% 1.34% 1.10%2 2.29% 2.84% 2.51% 2 1.19% 1.43% 1.19%3 2.35% 3.01% 2.61% 3 1.44% 1.70% 1.47%4 2.62% 3.17% 2.85% 4 2.01% 2.23% 2.03%5 3.00% 3.55% 3.29% 5 3.26% 3.22% 3.21%6 3.74% 4.12% 3.97% 6 5.01% 4.73% 4.98%7 4.26% 4.52% 4.42% 7 6.34% 5.63% 6.25%8 4.56% 4.71% 4.69% 8 6.84% 6.13% 6.72%9 5.02% 4.87% 4.95% 9 6.53% 6.18% 6.66%
10 5.32% 4.86% 5.17% 10 6.62% 6.28% 6.74%11 5.59% 4.81% 5.25% 11 6.63% 6.37% 6.78%12 5.45% 4.82% 5.23% 12 6.68% 6.45% 6.70%13 5.52% 4.97% 5.28% 13 6.65% 6.51% 6.75%14 5.65% 5.04% 5.36% 14 6.71% 6.76% 6.86%15 5.75% 5.12% 5.36% 15 6.52% 6.60% 6.67%16 5.61% 4.91% 5.20% 16 5.76% 6.08% 5.82%17 5.16% 4.66% 4.91% 17 4.85% 5.09% 4.81%18 4.73% 4.44% 4.58% 18 3.76% 3.98% 3.69%19 4.39% 4.25% 4.29% 19 2.94% 3.13% 2.86%20 3.99% 3.99% 4.03% 20 2.43% 2.68% 2.39%21 3.67% 4.01% 3.85% 21 2.15% 2.34% 2.02%22 3.37% 3.76% 3.58% 22 1.82% 1.98% 1.70%23 2.99% 3.46% 3.21% 23 1.51% 1.71% 1.44%
TOTAL 100.00% 100.00% 100.00% TOTAL 100.00% 100.00% 100.00%
TPG 1 & 2 TPG 3 & 4MAINTENANCE FUNCTIONAL CLASS A MAINTENANCE FUNCTIONAL CLASS B
(INTERSTATES) (PRINCIPAL ARTERIALS)

2010 Pennsylvania Traffic Data Factoring Process 35
P e n n D O T Bureau of Planning and Research
Table 360 Hourly Percentages Compiled for Truck Traffic (Continued)
HOUR DIR 1 DIR 2 TOTAL HOUR DIR 1 DIR 2 TOTAL0 0.98% 1.32% 0.80% 0 1.32% 1.72% 0.97%1 0.88% 1.16% 0.72% 1 1.12% 1.42% 0.85%2 0.92% 1.23% 0.78% 2 1.22% 1.60% 0.90%3 1.13% 1.46% 0.98% 3 1.40% 1.91% 1.11%4 1.54% 1.80% 1.47% 4 2.01% 2.26% 1.61%5 2.66% 2.61% 2.70% 5 3.30% 3.41% 2.83%6 4.72% 4.22% 4.99% 6 5.32% 4.88% 4.96%7 6.67% 5.76% 6.84% 7 5.89% 5.84% 6.66%8 7.09% 6.05% 7.14% 8 6.31% 5.98% 6.81%9 6.70% 5.91% 6.77% 9 6.54% 6.16% 6.51%
10 6.73% 6.03% 6.75% 10 6.34% 6.06% 6.59%11 6.78% 6.09% 6.88% 11 6.41% 6.17% 6.64%12 6.64% 6.25% 6.81% 12 6.62% 6.24% 6.64%13 6.64% 6.35% 6.88% 13 6.38% 6.14% 6.72%14 6.83% 6.83% 7.26% 14 6.55% 6.28% 7.11%15 7.11% 7.05% 7.37% 15 6.32% 6.08% 7.38%16 6.42% 6.76% 6.41% 16 5.94% 5.45% 6.36%17 5.19% 6.09% 5.19% 17 4.98% 4.83% 5.13%18 3.91% 4.57% 3.77% 18 4.10% 4.01% 3.86%19 3.01% 3.56% 2.87% 19 3.26% 3.57% 3.02%20 2.49% 2.87% 2.30% 20 2.81% 3.14% 2.51%21 2.08% 2.39% 1.82% 21 2.34% 2.93% 2.01%22 1.60% 2.00% 1.40% 22 1.89% 2.12% 1.55%23 1.29% 1.64% 1.09% 23 1.63% 1.82% 1.25%
TOTAL 100.00% 100.00% 100.00% TOTAL 100.00% 100.00% 100.00%
(MINOR ARTERIALS) (RURAL COLLECTORS)
TPG 5, 6 & 7 TPG 8 & 9 MAINTENANCE FUNCTIONAL CLASS C MAINTENANCE FUNCTIONAL CLASS D, E & F

36 2010 Pennsylvania Traffic Data Factoring Process
P e n n D O T www.dot.state.pa.us
Hourly Percentages Charts
0.0%
1.0%
2.0%
3.0%
4.0%
5.0%
6.0%
7.0%
8.0%
9.0%
1 2 3 4 5 6 7 8 9 10 11 12 13 14 15 16 17 18 19 20 21 22 23 24
Perc
enta
ge o
f Veh
icle
s
Hour
Hourly Percentages: Total Vehicles
TPG 1 TPG 2 TPG 3 TPG 4 TPG 5 TPG 6 TPG 7 TPG 8 TPG 9 TPG 10
0.0%
1.0%
2.0%
3.0%
4.0%
5.0%
6.0%
7.0%
8.0%
1 2 3 4 5 6 7 8 9 10 11 12 13 14 15 16 17 18 19 20 21 22 23 24
Perc
enta
ge o
f Veh
icle
s
Hour
Hourly Percentages: Truck Traffic
TPG 1 & 2 TPG 3 & 4 TPG 5, 6 & 7 TPG 8 & 9
2010 Pennsylvania Traffic Data Factoring Process 37
P e n n D O T Bureau of Planning and Research
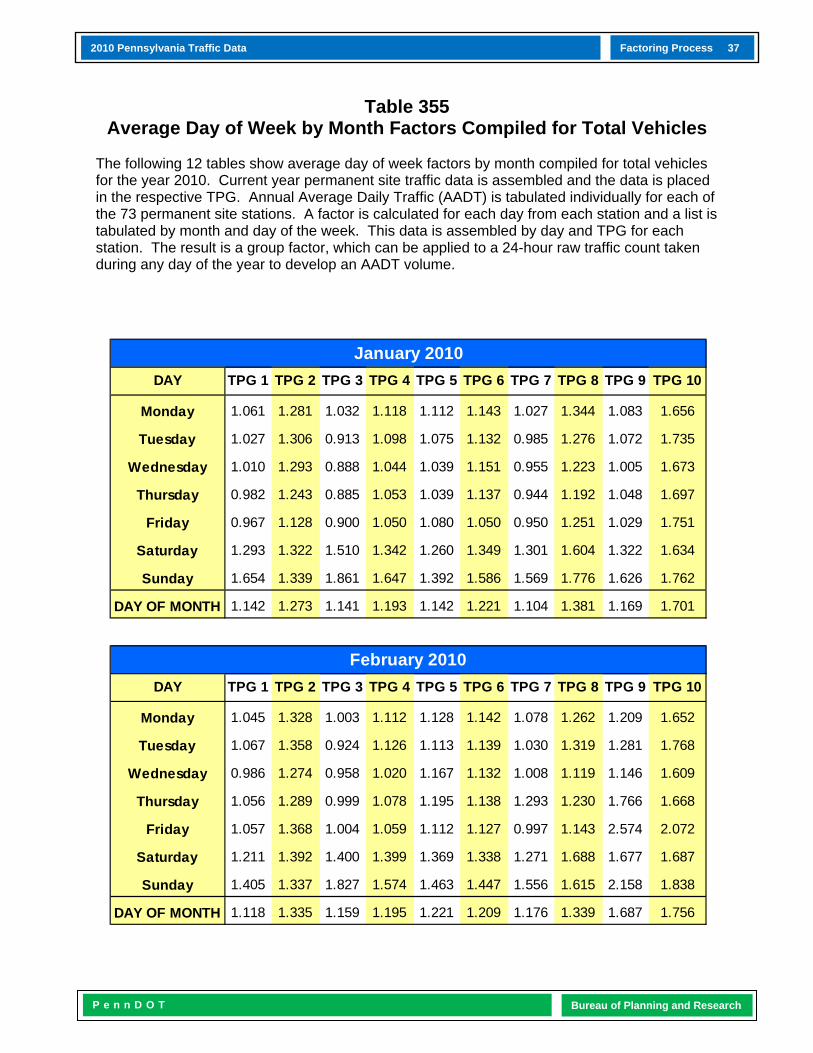
Table 355 Average Day of Week by Month Factors Compiled for Total Vehicles
The following 12 tables show average day of week factors by month compiled for total vehicles for the year 2010. Current year permanent site traffic data is assembled and the data is placed in the respective TPG. Annual Average Daily Traffic (AADT) is tabulated individually for each of the 73 permanent site stations. A factor is calculated for each day from each station and a list is tabulated by month and day of the week. This data is assembled by day and TPG for each station. The result is a group factor, which can be applied to a 24-hour raw traffic count taken during any day of the year to develop an AADT volume.
DAY TPG 1 TPG 2 TPG 3 TPG 4 TPG 5 TPG 6 TPG 7 TPG 8 TPG 9 TPG 10
Monday 1.061 1.281 1.032 1.118 1.112 1.143 1.027 1.344 1.083 1.656
Tuesday 1.027 1.306 0.913 1.098 1.075 1.132 0.985 1.276 1.072 1.735
Wednesday 1.010 1.293 0.888 1.044 1.039 1.151 0.955 1.223 1.005 1.673
Thursday 0.982 1.243 0.885 1.053 1.039 1.137 0.944 1.192 1.048 1.697
Friday 0.967 1.128 0.900 1.050 1.080 1.050 0.950 1.251 1.029 1.751
Saturday 1.293 1.322 1.510 1.342 1.260 1.349 1.301 1.604 1.322 1.634
Sunday 1.654 1.339 1.861 1.647 1.392 1.586 1.569 1.776 1.626 1.762
DAY OF MONTH 1.142 1.273 1.141 1.193 1.142 1.221 1.104 1.381 1.169 1.701
DAY TPG 1 TPG 2 TPG 3 TPG 4 TPG 5 TPG 6 TPG 7 TPG 8 TPG 9 TPG 10
Monday 1.045 1.328 1.003 1.112 1.128 1.142 1.078 1.262 1.209 1.652
Tuesday 1.067 1.358 0.924 1.126 1.113 1.139 1.030 1.319 1.281 1.768
Wednesday 0.986 1.274 0.958 1.020 1.167 1.132 1.008 1.119 1.146 1.609
Thursday 1.056 1.289 0.999 1.078 1.195 1.138 1.293 1.230 1.766 1.668
Friday 1.057 1.368 1.004 1.059 1.112 1.127 0.997 1.143 2.574 2.072
Saturday 1.211 1.392 1.400 1.399 1.369 1.338 1.271 1.688 1.677 1.687
Sunday 1.405 1.337 1.827 1.574 1.463 1.447 1.556 1.615 2.158 1.838
DAY OF MONTH 1.118 1.335 1.159 1.195 1.221 1.209 1.176 1.339 1.687 1.756
January 2010
February 2010

38 2010 Pennsylvania Traffic Data Factoring Process
P e n n D O T www.dot.state.pa.us
Table 355 Average Day of Week by Month Factors Compiled for Total Vehicles
(Continued)
DAY TPG 1 TPG 2 TPG 3 TPG 4 TPG 5 TPG 6 TPG 7 TPG 8 TPG 9 TPG 10
Monday 1.000 1.173 0.902 1.002 1.038 1.067 0.985 1.219 0.979 1.500
Tuesday 0.980 1.151 0.859 0.957 0.989 0.999 0.934 1.151 0.989 1.414
Wednesday 0.959 1.115 0.846 0.935 0.976 0.996 0.906 1.128 0.949 1.324
Thursday 0.935 1.070 0.866 0.945 0.968 0.979 0.932 1.121 0.940 1.404
Friday 0.864 0.990 0.850 0.889 0.952 0.919 0.858 1.122 0.907 1.170
Saturday 1.171 1.112 1.343 1.126 1.116 1.166 1.194 1.246 1.105 1.210
Sunday 1.263 1.057 1.646 1.239 1.214 1.318 1.321 1.504 1.239 1.430
DAY OF MONTH 1.025 1.095 1.045 1.013 1.036 1.063 1.019 1.213 1.015 1.350
DAY TPG 1 TPG 2 TPG 3 TPG 4 TPG 5 TPG 6 TPG 7 TPG 8 TPG 9 TPG 10
Monday 0.979 1.049 0.901 0.933 1.002 0.974 0.909 0.990 0.926 1.158
Tuesday 0.969 1.102 0.847 0.923 0.966 0.943 0.897 1.008 0.897 1.175
Wednesday 0.952 1.069 0.829 0.898 0.930 0.929 0.851 0.961 0.879 1.089
Thursday 0.902 0.985 0.823 0.877 0.935 0.911 0.861 0.936 0.864 1.069
Friday 0.861 0.874 0.865 0.843 0.908 0.845 0.825 0.931 0.842 0.934
Saturday 1.112 1.101 1.323 1.102 1.031 1.085 1.107 1.177 1.028 0.871
Sunday 1.160 0.999 1.761 1.259 1.029 1.103 1.253 1.217 1.114 1.074
DAY OF MONTH 0.991 1.026 1.050 0.976 0.972 0.970 0.958 1.031 0.936 1.053
DAY TPG 1 TPG 2 TPG 3 TPG 4 TPG 5 TPG 6 TPG 7 TPG 8 TPG 9 TPG 10
Monday 1.005 0.977 0.884 0.929 0.994 0.937 0.967 0.980 0.947 0.934
Tuesday 0.992 1.041 0.855 0.932 0.985 0.940 0.891 0.957 0.910 1.132
Wednesday 0.950 0.997 0.834 0.887 0.930 0.911 0.850 0.893 0.886 0.992
Thursday 0.895 0.911 0.829 0.865 0.913 0.871 0.841 0.847 0.865 0.902
Friday 0.850 0.826 0.828 0.816 0.894 0.794 0.778 0.805 0.833 0.730
Saturday 1.080 1.021 1.293 1.044 1.072 0.990 1.045 1.021 0.976 0.633
Sunday 1.150 0.970 1.449 1.161 1.047 1.083 1.188 1.068 1.088 0.736
DAY OF MONTH 0.989 0.963 0.996 0.948 0.976 0.932 0.937 0.939 0.929 0.866
May 2010
March 2010
April 2010

2010 Pennsylvania Traffic Data Factoring Process 39
P e n n D O T Bureau of Planning and Research
Table 355 Average Day of Week by Month Factors Compiled for Total Vehicles
(Continued)
DAY TPG 1 TPG 2 TPG 3 TPG 4 TPG 5 TPG 6 TPG 7 TPG 8 TPG 9 TPG 10
Monday 0.923 0.928 0.877 0.923 0.937 0.916 0.915 0.828 0.883 0.908
Tuesday 0.910 0.968 0.837 0.897 0.930 0.909 0.895 0.798 0.868 0.964
Wednesday 0.901 0.943 0.833 0.888 0.921 0.915 0.895 0.826 0.855 0.957
Thursday 0.867 0.875 0.816 0.863 0.879 0.878 0.868 0.750 0.838 0.859
Friday 0.820 0.811 0.822 0.815 0.871 0.834 0.817 0.707 0.789 0.665
Saturday 1.031 0.971 1.299 1.048 0.992 1.008 1.056 0.905 0.928 0.608
Sunday 1.063 0.891 1.753 1.066 0.984 1.036 1.124 0.888 1.054 0.678
DAY OF MONTH 0.931 0.912 1.034 0.929 0.931 0.928 0.939 0.815 0.888 0.806
DAY TPG 1 TPG 2 TPG 3 TPG 4 TPG 5 TPG 6 TPG 7 TPG 8 TPG 9 TPG 10
Monday 0.954 0.935 1.068 0.962 0.965 0.947 1.019 0.949 0.948 0.783
Tuesday 0.916 0.956 0.859 0.907 0.898 0.904 0.925 0.883 0.884 0.877
Wednesday 0.899 0.927 0.853 0.888 0.872 0.898 0.890 0.856 0.874 0.871
Thursday 0.847 0.960 0.844 0.858 0.875 0.858 0.884 0.780 0.851 0.784
Friday 0.821 0.849 0.864 0.834 0.862 0.835 0.846 0.741 0.814 0.608
Saturday 1.039 0.976 1.383 1.024 0.971 0.974 1.064 1.012 0.959 0.500
Sunday 1.095 0.905 1.646 1.045 0.988 1.002 1.161 1.058 1.043 0.571
DAY OF MONTH 0.939 0.930 1.074 0.931 0.919 0.917 0.970 0.897 0.910 0.713
DAY TPG 1 TPG 2 TPG 3 TPG 4 TPG 5 TPG 6 TPG 7 TPG 8 TPG 9 TPG 10
Monday 0.932 0.878 0.915 0.913 0.916 0.920 0.940 0.911 0.915 0.929
Tuesday 0.914 0.905 0.870 0.905 0.912 0.902 0.913 0.910 0.879 0.963
Wednesday 0.895 0.874 0.861 0.891 0.878 0.892 0.889 0.850 0.886 0.941
Thursday 0.870 0.811 0.847 0.876 0.869 0.863 0.897 0.833 0.871 0.856
Friday 0.828 0.717 0.860 0.829 0.869 0.797 0.852 0.779 0.821 0.658
Saturday 0.988 0.834 1.381 1.020 0.969 0.940 1.065 1.038 0.949 0.550
Sunday 0.994 0.807 1.877 0.972 1.016 1.007 1.176 1.022 1.042 0.594
DAY OF MONTH 0.917 0.832 1.087 0.915 0.918 0.903 0.962 0.906 0.909 0.784
June 2010
July 2010
August 2010

40 2010 Pennsylvania Traffic Data Factoring Process
P e n n D O T www.dot.state.pa.us
Table 355 Average Day of Week by Month Factors Compiled for Total Vehicles
(Continued)
DAY TPG 1 TPG 2 TPG 3 TPG 4 TPG 5 TPG 6 TPG 7 TPG 8 TPG 9 TPG 10
Monday 1.040 0.993 1.134 0.963 0.946 0.953 1.043 0.974 0.976 1.162
Tuesday 0.965 1.045 0.851 0.888 0.940 0.929 0.929 0.879 0.879 1.187
Wednesday 0.938 1.004 0.835 0.875 0.905 0.918 0.892 0.877 0.866 1.127
Thursday 0.928 0.939 0.840 0.875 0.921 0.915 0.933 0.872 0.878 1.081
Friday 0.846 0.817 0.838 0.808 0.867 0.833 0.835 0.728 0.826 0.793
Saturday 1.079 0.946 1.346 1.031 1.006 0.970 1.084 1.049 1.006 0.702
Sunday 1.152 0.934 1.541 1.143 0.992 1.081 1.230 1.234 1.136 0.891
DAY OF MONTH 0.993 0.954 1.055 0.940 0.940 0.943 0.992 0.945 0.938 0.992
DAY TPG 1 TPG 2 TPG 3 TPG 4 TPG 5 TPG 6 TPG 7 TPG 8 TPG 9 TPG 10
Monday 0.955 1.004 0.928 0.930 0.951 0.949 0.965 1.039 0.948 1.240
Tuesday 0.960 1.057 0.865 0.923 0.916 0.936 0.940 1.037 0.913 1.334
Wednesday 0.934 1.033 0.842 0.894 0.893 0.919 0.892 0.970 0.895 1.250
Thursday 0.897 0.947 0.845 0.878 0.904 0.898 0.906 0.922 0.881 1.249
Friday 0.829 0.814 0.831 0.823 0.862 0.831 0.842 0.845 0.842 0.983
Saturday 1.053 1.013 1.320 1.041 1.021 0.997 1.081 1.140 1.024 0.923
Sunday 1.140 0.922 1.801 1.133 1.005 1.039 0.977 1.403 1.184 1.119
DAY OF MONTH 0.967 0.970 1.062 0.946 0.936 0.938 0.943 1.051 0.955 1.157
September 2010
October 2010

2010 Pennsylvania Traffic Data Factoring Process 41
P e n n D O T Bureau of Planning and Research
Table 355 Average Day of Week by Month Factors Compiled for Total Vehicles
(Continued)
DAY TPG 1 TPG 2 TPG 3 TPG 4 TPG 5 TPG 6 TPG 7 TPG 8 TPG 9 TPG 10
Monday 0.970 1.062 0.913 0.974 0.942 0.984 1.000 0.994 0.953 1.391
Tuesday 0.937 1.090 0.868 0.947 0.954 0.940 0.968 0.956 0.941 1.427
Wednesday 0.946 1.068 0.852 0.904 0.897 0.930 0.925 0.909 0.890 1.327
Thursday 0.971 0.992 0.884 0.930 0.935 1.034 0.967 0.930 0.921 1.374
Friday 0.911 0.908 1.005 0.907 0.943 0.887 0.947 0.896 0.897 1.224
Saturday 1.091 1.021 1.409 1.168 1.082 1.114 1.180 1.301 1.117 1.275
Sunday 1.107 1.022 1.850 1.406 1.169 1.151 1.186 1.353 1.321 1.479
DAY OF MONTH 0.990 1.023 1.112 1.034 0.989 1.006 1.025 1.048 1.006 1.357
DAY TPG 1 TPG 2 TPG 3 TPG 4 TPG 5 TPG 6 TPG 7 TPG 8 TPG 9 TPG 10
Monday 0.990 1.243 0.987 1.093 1.162 1.114 1.100 1.096 1.200 1.730
Tuesday 0.964 1.127 0.919 1.065 1.091 1.050 1.030 1.087 1.040 1.605
Wednesday 0.953 1.047 0.890 1.003 1.048 1.060 1.002 1.003 1.072 1.609
Thursday 0.931 1.028 0.882 0.973 1.063 0.988 0.992 0.949 1.014 1.506
Friday 1.033 1.153 1.057 1.022 1.040 1.075 1.043 1.052 1.053 1.460
Saturday 1.207 1.188 1.378 1.173 1.152 1.176 1.190 1.269 1.111 1.464
Sunday 1.368 1.189 1.731 1.470 1.308 1.586 1.492 1.413 1.474 2.049
DAY OF MONTH 1.064 1.139 1.121 1.114 1.123 1.150 1.121 1.124 1.138 1.632
December 2010
November 2010

42 2010 Pennsylvania Traffic Data Factoring Process
P e n n D O T www.dot.state.pa.us
Monthly Variation Charts by Traffic Pattern Group (TPG)
The chart below shows the different variations between months and traffic pattern groups (TPG). The seasonal factors, which are the data this chart is derived from, show the percentage difference between the raw data count and the annual average daily traffic (AADT). The seasonal factors data can be found in Table 355.
‐35%
‐25%
‐15%
‐5%
5%
15%
25%
35%
Janu
ary
February
March
April
May
June July
August
Septem
ber
Octob
er
Novem
ber
Decem
ber
Monthly Variation
TPG 1: Urban Interstate TPG 2: Rural Interstate
TPG 3: Urban Principal Arterial TPG 4: Rural Principal Arterial
TPG 5: Urban Minor Arterials and Collectors TPG 6: North Rural Minor Arterial
TPG 7: Central Rural Minor Arterial TPG 8: North Rural Collector
TPG 9: Central Rural Collector TPG 10: Special Recreational
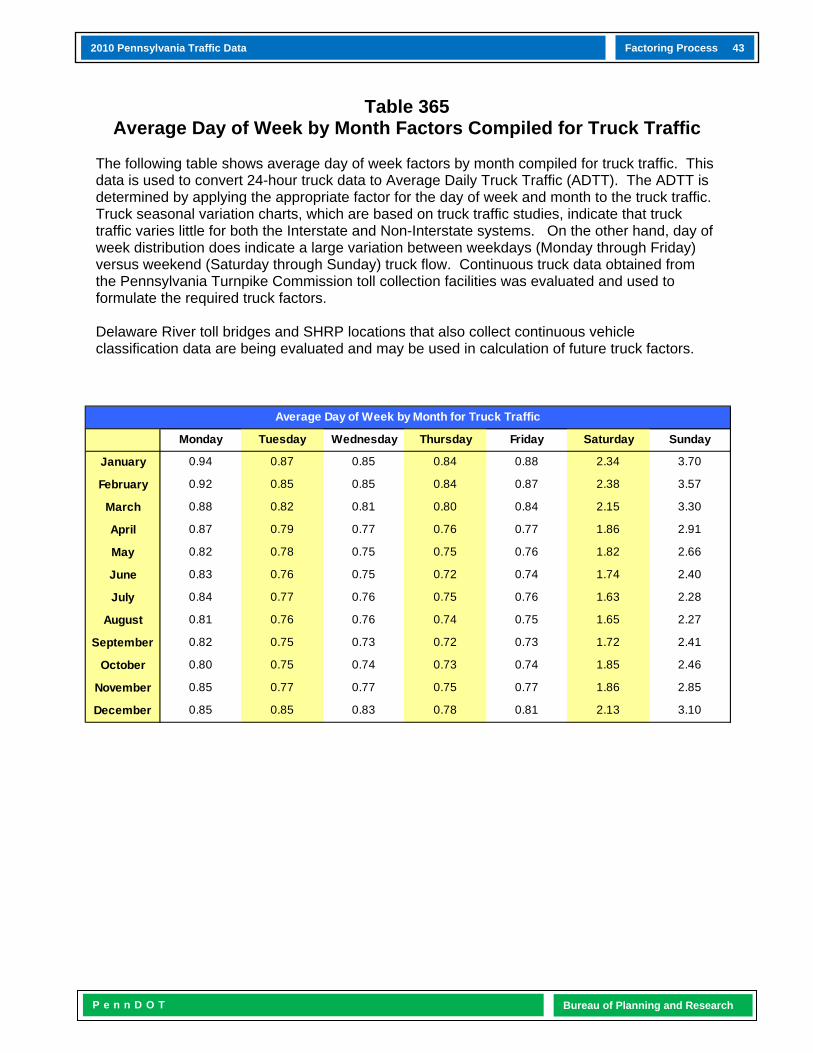
2010 Pennsylvania Traffic Data Factoring Process 43
P e n n D O T Bureau of Planning and Research
Table 365 Average Day of Week by Month Factors Compiled for Truck Traffic
The following table shows average day of week factors by month compiled for truck traffic. This data is used to convert 24-hour truck data to Average Daily Truck Traffic (ADTT). The ADTT is determined by applying the appropriate factor for the day of week and month to the truck traffic. Truck seasonal variation charts, which are based on truck traffic studies, indicate that truck traffic varies little for both the Interstate and Non-Interstate systems. On the other hand, day of week distribution does indicate a large variation between weekdays (Monday through Friday) versus weekend (Saturday through Sunday) truck flow. Continuous truck data obtained from the Pennsylvania Turnpike Commission toll collection facilities was evaluated and used to formulate the required truck factors. Delaware River toll bridges and SHRP locations that also collect continuous vehicle classification data are being evaluated and may be used in calculation of future truck factors.
Monday Tuesday Wednesday Thursday Friday Saturday Sunday
January 0.94 0.87 0.85 0.84 0.88 2.34 3.70
February 0.92 0.85 0.85 0.84 0.87 2.38 3.57
March 0.88 0.82 0.81 0.80 0.84 2.15 3.30
April 0.87 0.79 0.77 0.76 0.77 1.86 2.91
May 0.82 0.78 0.75 0.75 0.76 1.82 2.66
June 0.83 0.76 0.75 0.72 0.74 1.74 2.40
July 0.84 0.77 0.76 0.75 0.76 1.63 2.28
August 0.81 0.76 0.76 0.74 0.75 1.65 2.27
September 0.82 0.75 0.73 0.72 0.73 1.72 2.41
October 0.80 0.75 0.74 0.73 0.74 1.85 2.46
November 0.85 0.77 0.77 0.75 0.77 1.86 2.85
December 0.85 0.85 0.83 0.78 0.81 2.13 3.10
Average Day of Week by Month for Truck Traffic

44 2010 Pennsylvania Traffic Data Factoring Process
P e n n D O T www.dot.state.pa.us
Table 370 Yearly Growth Factors
The yearly growth factors (shown in the following tables) are used to compute the current estimated average daily traffic for count data that is older than the current year. The factor application is applied by Traffic Pattern Group (TPG) and is used to calculate total vehicles and truck estimates. A limited amount of count data is processed through the Yearly Growth Factor table, since most traffic counts are for the current year. To use this table, select the base year of the count from the “YEAR” column and multiply it by the percentage under the corresponding “TPG” row. For example, to determine the current year estimate (2010) of a 2001 base year count having a TPG 5, multiply 1.102 (10.2%) by the AADT of the 2001 count.
The table below shows yearly growth percentages by TPG for 2000 through 2010.
TPG 00-01 01-02 02-03 03-04 04-05 05-06 06-07 07-08 08-09 09-10
TPG 1 2.0% 3.0% 3.0% 3.2% 3.2% 2.9% 3.0% 2.4% 1.0% 0.0%
TPG 2 2.0% 3.0% 3.0% 3.3% 3.2% 3.0% 3.0% 2.4% 2.2% 1.6%
TPG 3 2.0% 1.8% 1.0% 1.4% 1.1% 0.7% 1.1% 0.2% 0.3% 0.2%
TPG 4 1.0% 1.8% 1.3% 1.7% 1.6% 1.2% 1.3% 0.8% 0.5% 0.3%
TPG 5 2.0% 1.8% 1.0% 1.4% 1.1% 0.7% 1.1% 0.2% 0.3% 0.2%
TPG 6 1.0% 1.9% 1.3% 1.7% 1.6% 1.2% 1.3% 0.8% 0.5% 0.3%
TPG 7 1.0% 1.9% 1.3% 1.7% 1.6% 1.2% 1.3% 0.8% 0.5% 0.3%
TPG 8 1.0% 1.9% 1.3% 1.7% 1.6% 1.2% 1.3% 0.8% 0.5% 0.3%
TPG 9 1.0% 1.9% 1.3% 1.7% 1.6% 1.2% 1.3% 0.8% 0.5% 0.3%
TPG 10 1.0% 1.0% 1.0% 1.7% 1.6% 1.2% 1.3% 0.8% 0.5% 0.3%
Yearly Growth Factors: 2000-2010
TPG 00-01 01-02 02-03 03-04 04-05 05-06 06-07 07-08 08-09 09-10
TPG 1 26.3% 23.9% 20.2% 16.7% 13.1% 9.6% 6.5% 3.4% 1.0% 0.0%
TPG 2 30.1% 27.6% 23.9% 20.3% 16.4% 12.8% 9.5% 6.3% 3.8% 1.6%
TPG 3 10.2% 8.1% 6.2% 5.1% 3.6% 2.5% 1.8% 0.7% 0.5% 0.2%
TPG 4 12.1% 11.0% 9.0% 7.6% 5.8% 4.2% 2.9% 1.6% 0.8% 0.3%
TPG 5 10.2% 8.1% 6.2% 5.1% 3.6% 2.5% 1.8% 0.7% 0.5% 0.2%
TPG 6 12.1% 11.0% 9.0% 7.6% 5.8% 4.2% 2.9% 1.6% 0.8% 0.3%
TPG 7 12.1% 11.0% 9.0% 7.6% 5.8% 4.2% 2.9% 1.6% 0.8% 0.3%
TPG 8 12.1% 11.0% 9.0% 7.6% 5.8% 4.2% 2.9% 1.6% 0.8% 0.3%
TPG 9 12.1% 11.0% 9.0% 7.6% 5.8% 4.2% 2.9% 1.6% 0.8% 0.3%
TPG 10 12.1% 11.0% 9.0% 7.6% 5.8% 4.2% 2.9% 1.6% 0.8% 0.3%
Yearly Growth Factors: 2000-2010

2010 Pennsylvania Traffic Data Factoring Process 45
P e n n D O T Bureau of Planning and Research
Functional Class Groups
Traffic volume data displayed in PennDOT’s Roadway Management System (RMS) is projected to a current estimate year (2010) based on County/Functional Class Group (FCG). This provides the user with trends relative to a specific county. The factors are applied annually to the Department’s Roadway Management System (RMS) to produce the current year traffic volume estimate values. The first table shows the FCGs with a description and corresponding Functional Class Codes (FCCs). The second table shows the new FCC breakdown mandated by FHWA that will be adopted in coming years.
** The Federal Functional Classification of a ramp reflects the highest order of Federal Functional Classification of the roadways to which the ramp connects. As an example, Adams County, SR 8001 is the interchange at US 15, a principal arterial, and SR 3001, a minor arterial; therefore, the segments associated with SR 8001 are assigned a Federal Functional Classification of principal arterial.
FCG DESCRIPTIVE NAME FCC
FCG 1 URBAN INTERSTATE FCC 11
FCG 2 RURAL INTERSTATE FCC 01
FCG 3 URBAN - OTHER FREEWAYS/EXPRESSWAYS FCC 12
URBAN - OTHER PRINCIPAL ARTERIALS FCC 14
URBAN - MINOR ARTERIALS FCC 16
RAMPS FCC 99
FCG 4 RURAL - OTHER PRINCIPAL ARTERIALS FCC 02
RURAL - MINOR ARTERIAL FCC 06
FCG 5 URBAN COLLECTORS FCC 17
URBAN - LOCAL FCC 19
FCG 6 RURAL - MAJOR COLLECTOR FCC 07
RURAL - MINOR COLLECTOR FCC 08
RURAL - LOCAL FCC 09
FCC DESCRIPTIVE NAME OLD FCC
01 INTERSTATE 01-11
02 OTHER FREEWAY / EXPRESSWAY 12
03 OTHER PRINCIPAL ARTERIAL 02-14
04 MINOR ARTERIAL 06-16
05 MAJOR COLLECTOR 07-17
06 MINOR COLLECTOR 08
07 LOCAL 09
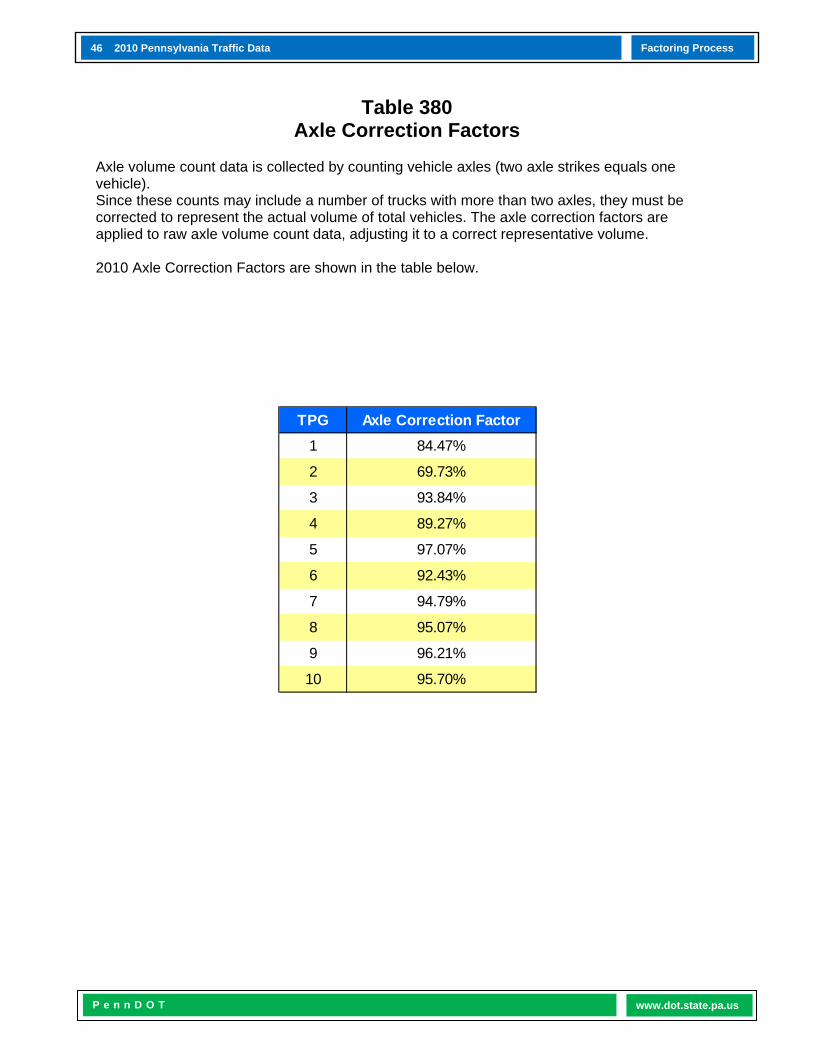
46 2010 Pennsylvania Traffic Data Factoring Process
P e n n D O T www.dot.state.pa.us
Table 380 Axle Correction Factors
Axle volume count data is collected by counting vehicle axles (two axle strikes equals one vehicle). Since these counts may include a number of trucks with more than two axles, they must be corrected to represent the actual volume of total vehicles. The axle correction factors are applied to raw axle volume count data, adjusting it to a correct representative volume. 2010 Axle Correction Factors are shown in the table below.
TPG Axle Correction Factor1 84.47%
2 69.73%
3 93.84%
4 89.27%
5 97.07%
6 92.43%
7 94.79%
8 95.07%
9 96.21%
10 95.70%

2010 Pennsylvania Traffic Data Factoring Process 47
P e n n D O T Bureau of Planning and Research
Table 385 Design Hour Factor Default Values
The design hour factor (K-factor) represents the percent of Annual Average Daily Traffic (AADT) occurring in the peak hour. This value is important in the design of roadways and capacity analysis studies. Count data less than 24-hours and/or data not having directional volumes will not have the necessary raw data required to compute actual K-factor values. The K-factor default values were produced to complete unknown values not generated through the raw count factoring process, and to satisfy Highway Performance Monitoring System (HPMS) reporting requirements. They were developed by processing the actual hourly data from the 73 permanent site stations to identify the 30th highest hour; this hourly volume was divided by the AADT for each station, producing a K-factor. The factors were then averaged by Traffic Pattern Group (TPG). During the raw count factoring process, the K-factor value is programmatically inserted into the Roadway Management System (RMS) database if the raw count data is insufficient to calculate an actual K-factor. 2010 K-Factors and corresponding TPGs are shown in the table below.
TPG K factor default value1 10%
2 11%
3 10%
4 11%
5 11%
6 11%
7 11%
8 13%
9 11%
10 15%

48 2010 Pennsylvania Traffic Data Factoring Process
P e n n D O T www.dot.state.pa.us
Tables 390 and 395 Equivalent Single Axle Load Factors
Equivalent Single Axle Load (ESAL) tables are used to calculate pavement loadings (rigid and flexible types) to produce a common parameter for design and planning purposes. ESAL factors used in RMS were derived through a composite of data obtained from AASHTO guidelines and test data collected from historical Loadometer Surveys. Data obtained through WIM equipment is under review at this time and will be considered in development of future ESAL factors. The AASHTO Mechanistic Empirical Design Guide (MEPDG) has incorporated improved methods of determining loading effects of traffic. In the future, these new methods may supersede the use of ESAL factors. 2010 ESAL factors for rigid pavements are shown by Traffic Pattern Group (TPG) and vehicle classification in Table 390, below.
2010 ESAL factors for flexible pavements are shown by Traffic Pattern Group (TPG) and vehicle classification in Table 395, below.
CLASS TPG 1 TPG 2 TPG 3 TPG 4 TPG 5 TPG 6 TPG 7 TPG 8 TPG 9 TPG 10
BUS 0.240 0.240 0.240 0.240 0.240 0.240 0.240 0.240 0.240 0.240
2 AXLE SIX TIRE 0.240 0.240 0.240 0.240 0.240 0.240 0.240 0.240 0.240 0.240
3 AXLE SINGLE UNIT 1.150 1.150 1.150 1.150 1.150 1.150 1.150 1.150 1.150 1.150
4 AXLE SINGLE UNIT 7.000 7.000 7.000 7.000 7.000 7.000 7.000 7.000 7.000 7.000
3 AXLE WITH TRAILER 0.600 0.600 0.600 0.600 0.600 0.600 0.600 0.600 0.600 0.600
3 AXLE MULTI-AXLE TRAILER 1.590 1.590 1.590 1.590 1.590 1.590 1.590 1.590 1.590 1.590
6 AXLE SINGLE TRAILER 1.421 1.421 1.421 1.421 1.421 1.421 1.421 1.421 1.421 1.421
5 AXLE MULTI TRAILER 2.400 2.400 2.400 2.400 2.400 2.400 2.400 2.400 2.400 2.400
6 AXLE MULTI TRAILER 1.421 1.421 1.421 1.421 1.421 1.421 1.421 1.421 1.421 1.421
7 AXLE MULTI TRAILER 1.421 1.421 1.421 1.421 1.421 1.421 1.421 1.421 1.421 1.421
RIGID ESAL FACTORS
CLASS TPG 1 TPG 2 TPG 3 TPG 4 TPG 5 TPG 6 TPG 7 TPG 8 TPG 9 TPG 10
BUS 0.240 0.240 0.240 0.240 0.240 0.240 0.240 0.240 0.240 0.240
2 AXLE SIX TIRE 0.240 0.240 0.240 0.240 0.240 0.240 0.240 0.240 0.240 0.240
3 AXLE SINGLE UNIT 0.820 0.820 0.820 0.820 0.820 0.820 0.820 0.820 0.820 0.820
4 AXLE SINGLE UNIT 4.500 4.500 4.500 4.500 4.500 4.500 4.500 4.500 4.500 4.500
3 AXLE WITH TRAILER 0.440 0.440 0.440 0.440 0.440 0.440 0.440 0.440 0.440 0.440
3 AXLE MULTI-AXLE TRAILER 1.000 1.000 1.000 1.000 1.000 1.000 1.000 1.000 1.000 1.000
6 AXLE SINGLE TRAILER 0.750 0.750 0.750 0.750 0.750 0.750 0.750 0.750 0.750 0.750
5 AXLE MULTI TRAILER 2.330 2.330 2.330 2.330 2.330 2.330 2.330 2.330 2.330 2.330
6 AXLE MULTI TRAILER 1.276 1.276 1.276 1.276 1.276 1.276 1.276 1.276 1.276 1.276
7 AXLE MULTI TRAILER 1.276 1.276 1.276 1.276 1.276 1.276 1.276 1.276 1.276 1.276
FLEXIBLE ESAL FACTORS

2010 Pennsylvania Traffic Data Factoring Process 49
P e n n D O T Bureau of Planning and Research
Roadway Management System Factor Table Application Flow Chart
I. MANUAL COUNT (LESS THAN 24 HOURS)
II. AUTOMATIC VEHICLE CLASSIFICATION COUNT
III. AXLE AND LOOP VOLUME COUNTS
* Total Vehicles are computed by counting axles (2 axles equals 1 Vehicle)
*AXLE LOOP
TOTALVEHICLES24 HR ADT
TABLE# 355ADJ. TOTAL
VEHICLES24 HOUR
TABLE# 380
Note: DHV is computed from the raw count data.
AUTO
TRUCK
RAWCOUNTDATA
(24 HOURS)
TABLE# 355
TABLE# 365
TABLE# 395
ESALCONVERSION
RIGIDTABLE# 390
TOTALVEHICLES24 HR ADT
TOTALTRUCKS
24 HR ADTT
ESALCONVERSION
FLEXIBLE
# 395AUTO
TRUCK
RAWCOUNTDATA
(8 HOURS)
TOTALVEHICLES24 HOURS
TOTALVEHICLES24 HR ADT
DHVDEFAULTS
TABLE# 350
TABLE# 355
TABLE# 385
TOTALTRUCKS24 HOURS
TABLE# 360 TOTAL
TRUCKS24 HR ADTT
TABLE# 365
ESALCONVERSION
RIGID
TABLE
ESALCONVERSION
FLEXIBLE
TABLE #390
TABLE# 355
AUTOMATIC
DATA EDITS
RMS
DATABASE
VARIANCE
EDIT
AUTOMATIC
DATA EDITS
VARIANCE
EDIT
AUTOMATIC
DATA EDITS
COUNTDATA
(24 HOURS)
RAW
VARIANCE
EDIT
VARIANCE
EDIT

50 2010 Pennsylvania Traffic Data Acronyms
P e n n D O T www.dot.state.pa.us
Acronyms
AADT Annual Average Daily Traffic AASHTO American Association of State Highway & Transportation Officials ACF Axle Correction Factor ADL Average Daily Load ADT Average Daily Traffic ADTT Average Daily Truck Traffic AGF Annual Growth Factor ATR Automatic Traffic Recorder AVC Automatic Vehicle Classification CAVC Continuous Automatic Vehicle Classification DHV Design Hour Volume DOW Day of Week DRJTBC Delaware River Joint Toll Bridge Commission DVMT Daily Vehicle Miles of Travel ESAL Equivalent Single Axle Load FCC Functional Classification Code FCG Functional Classification Group FHWA Federal Highway Administration GIS Geographic Information System HMPS Highway Performance Monitoring System HVTIS Heavy Vehicle Travel Information System ITDUS Internet Traffic Data Upload System ITS Intelligent Transportation Systems LTPP Long Term Pavement Performance MEPDG Mechanistic Empirical Design Guide MFC Maintenance Functional Classification MPO Metropolitan Planning Organization RPO Rural Planning Organization RMS Roadway Management System SHRP Strategic Highway Research Program SR State Route STIP Short-Term In-Pavement TIS Traffic Information System TMG Traffic Monitoring Guide TMS/H Traffic Monitoring System for Highways TPG Traffic Pattern Group TR Traffic Route WIM Weigh-in-Motion

2010 Pennsylvania Traffic Data Index 51
P e n n D O T Bureau of Planning and Research
AADT ........................ 2, 4, 12, 23, 28, 37, 42, 47, 50
ADTT .......................................................... 28, 43, 50
Permanent Traffic Recorders ................................... 6
Station Locations ................................. 8, 9, 11
Locations by Traffic Pattern Group .............. 12
Five Year AADT Summary .......................... 22
Monthly Variations from AADT .................... 42
Peak Hour ................................................... 14
Statewide Traffic Trends.............................. 24
30th Highest Hour ....................................... 16
50th Highest Hour ....................................... 18
Axle Correction Factors .......................................... 46
Axle Counts .............................................................. 5
Continuous Automatic Vehicle Classification . 3, 5, 50
Data Collection ..................................................... 4, 5
Design Hour Volume ............................ 20, 28, 49, 50
Design Hour Summaries ........................................ 20
Equivalent Single Axle Load ...................... 28, 48, 50
Rigid ................................................ 28, 48, 50
Flexible ............................................ 28, 48, 50
Factors ................................................................... 28
Average Day of Week for Total Vehicles ..... 37
Average Day of Week for Truck Traffic........ 43
Axle Correction ............................................ 46
County Functional Class Groups ................. 45
Factor Table Application Flowchart ............. 49
Growth Factor .............................................. 44
Hourly Percentages for Total Vehicles ........ 29
Hourly Percentages for Truck Traffic ........... 34
Design Hour Default Values ....................... 47
ESAL.......................................................... 48
K-Factor ............................................... 28, 47
Monthly Variation ....................................... 42
Yearly Growth ............................................ 44
Functional Class Groups .......................................... 45
Heaviest Holiday Period ........................................... 26
Inductive Loops .......................................................... 5
K-Factor ............................................................. 28, 47
Manual Counts ........................................................... 5
Pneumatic Tubes ....................................................... 5
Statewide Traffic Trends .......................................... 24
Toll Receipts .............................................................. 5
Traffic Pattern Group ............................................ 7, 12
Weigh-In-Motion ................................................... 5, 11
Index