Embed Size (px)
Citation preview
2010 SEED PRODUCTION RESEARCH
AT OREGON STATE UNIVERSITY USDA-ARS COOPERATING
Edited by William C. Young III ____________________________________________________________ Page
Pollen Collected by Native Bumble Bee Colonies Placed Adjacent to Red Clover.............................................1
Characterization of Pollen Loads from Pollen Traps Placed in Honey Bee Hives in Red Clover Seed Fields in the Willamette Valley ...................................................................................................................4
Year to Year Variation in Bumble Bee Activity in Red Clover Seed Production Fields in the Willamette Valley ........................................................................................................................................6
Native Bumble Bee Diversity, Abundance, and Pollination in Crimson Clover and Hairy Vetch Seed Production Fields in Western Oregon..........................................................................................................8
Fertilization of the Choke Pathogen in Orchardgrass Seed Production Fields in the Willamette Valley ..........11
Evaluation of Newly Formulated Molluscides for Control of Slugs in Western Oregon Grass Seed Fields.....15
Sharppoint Fluvellin Biology and Management in Spring-Seeded Tall Fescue Grown for Seed ......................19
Effects of Longer Term Storage on Seed Germination from Grass Seed Harvested at Different Seed Moisture Contents .............................................................................................................................23
Evaluation of Chemical and Mechanical Methods for Maintaining Stand Productivity in Fine Fescue Seed Crop Production Systems in the Absence of Open Field Burning, 2010..........................................26
Energy Use and Efficiency in Perennial Ryegrass Seed Production ..................................................................30
How Well Do Barn Owl Nest Boxes Work in Attracting Barn Owls in the Willamette Valley ........................33
Making Sense of Nitrogen Flux Patterns in the Calapooia River Basin.............................................................40
Grass Seed Agriculture and Invertebrate Communities of Seasonal Wetlands in the Southern Willamette Valley ......................................................................................................................................45
Camelina: Potential Oil Seed Rotation Crop for the Willamette Valley ...........................................................49
Tolerance of Teff to Herbicides..........................................................................................................................52
Downy Brome Control in Newly Planted Kentucky Bluegrass Grown for Seed Under Columbia Basin Conditions........................................................................................................................................54
Influence of Previous Crop and Herbicide Treatments on Rattail Fescue Control in Seedling Kentucky Bluegrass Grown Under Columbia Basin Conditions ...............................................................................56
Elucidating the Biology of the Bluegrass and Denver Billbugs in NE Oregon..................................................59
Department of Crop and Soil Science Ext/CrS 130, 3/11

The following authors have contributed to this report.
Columbia Basin Agricultural and Research Center D.A. Ball, Professor D.J. Wysocki, Extension Soil Scientist Cooperative Extension Service – OSU N.P. Anderson, North Valley Extension Field Crops Agent, Washington, Yamhill and Polk Counties M.E. Mellbye, District Extension Agent, Linn, Benton and Lane Counties T.B. Silberstein, Extension Agent, Marion and Clackamas Counties D.L. Walenta, Extension Crops Specialist, Union County Department of Crop and Soil Science – OSU T.G. Chastain, Associate Professor, Seed Crop Physiology D.W. Curtis, Faculty Research Assistant A.V. Derkatch, former student worker A.J. Dreves, Research Associate, Entomology C.J. Garbacik, Senior Faculty Research Assistant B.J. Hinds-Cook, Faculty Research Assistant G.D. Hoffman, Research Associate, IPM A.G. Hulting, Assistant Professor, Extension Weeds Specialist J.M. Kaser, Faculty Research Assistant, Entomology C.A. Mallory-Smith, Professor of Weed Science S. Maxfield-Taylor, Graduate Student, Entomology S. Rao, Professor, Entomology K.M. Skyrm, Graduate Research Assistant, Entomology W.P. Stephen, Professor Emeritus, Entomology W.C. Young III, Professor Emeritus, Extension Seed Production Department of Fisheries and Wildlife B.D. Dugger, Associate Professor T.S. Garcia, Assistant Professor W.J. Gerth, Senior Faculty Research Assistant J.A. Gervais, Wildlife Ecologist G.R. Giannico, Associate Professor A.T. Herlihy, Professor (Senior Research) J.L. Li, Courtesy Professor L.A. Wyss, Student Hermiston Experiment Station S.I. Rondon, Assistant Professor

National Forage Seed Production Research Center - USDA-ARS S.C. Alderman, Professor and Research Plant Pathologist G.M. Banowetz, Research Microbiologist and Research Leader S.M. Griffith, Professor and Research Plant Physiologist G.W. Mueller-Warrant, Associate Professor and Research Agronomist W.F. Pfender, Professor and Research Plant Pathologist G.W. Whittaker, Research Hydrologist
Use of a commercial or proprietary product in research does not constitute an endorsement of the product by the U.S. Department of Agriculture or
Oregon State University.
1
POLLEN COLLECTED BY NATIVE BUMBLE BEE COLONIES PLACED ADJACENT TO RED CLOVER
K.M. Skyrm, S. Rao, and W.P. Stephen
Introduction Red clover (Trifolium pratense L.) is an important forage leg-ume crop grown for seed in the Willamette Valley of western Oregon. Cross pollination by insects is a pre-requisite for seed production, and bees serve as the primary pollinating agents of red clover. While honey bee hives are generally rented for pollination, bumble bees are considered to be more efficient pollinators of red clover (Rao and Stephen, 2009). Unfortu-nately, bumble bees are commercially unavailable in Oregon as their importation is prohibited due to the risk of disease intro-duction to resident pollinator populations. Hence, growers must rely on populations of wild bumble bees for pollination. Also, the recent decline in honey bee populations due to the incidence of parasites and disease has increased grower interest in evaluating the efficacy of bumble bees as alternative polli-nators for red clover.
Bumble bees are generalist foragers and visit a variety of plant species located in the vicinity of their nests to obtain food re-sources (Alford, 1975). Unlike honey bees, bumble bee work-ers are believed to be largely incapable of communicating the location of food resources to colony members as individuals decide independently which flowers to forage upon within the landscape (Goulson, 2010). Thus, the foraging efficiency of a bumble bee colony depends on the collective behaviors of in-dividual workers (Heinrich, 1979). Unfortunately, the pollen foraging behavior of the majority of bumble bee species is un-known given the difficulty of locating and monitoring nest sites in nature (Goulson, 2010). This information is vital for evalu-ating the efficacy of bumble bee pollinators in crop plants such as red clover. The objective of this study was to characterize pollen collected by individual foragers and stored within colo-nies throughout the bloom period of red clover. This study was focused on Bombus vosnesenskii which is the dominant native bumble bee in the Willamette Valley (Rao and Stephen, 2010).
Methods This study was conducted in a red clover seed production field in Polk County, Oregon. Colonies of B. vosnesenskii were reared by a regional bumble bee propagator (Bee Man Exter-minators LLC, Olympia, WA) using local, spring-collected queens. A total of eight colonies were established within wooden nest boxes (10 x 8.5 x 7.5 in.) and placed on four sepa-rate three-tiered shelves, 3.3 ft. from the red clover field in early July. Bloom in red clover typically lasts until mid-Au-gust in the Willamette Valley but the red clover field used in this study was cut for hay early resulting in early bloom and seed harvest. Hence, colonies were only monitored during three weeks in July and a week in August when the crop was in bloom.
To examine pollen reserves in nests, samples of stored pollen in three pollen pots per colony were extracted weekly, weighed and processed to determine floral composition. Prior to being weighed, pollen samples were dried at 140°F for 24 hrs. Each pollen sample was then diluted using methods of Telleria (1998) and 1ml was extracted to use in analysis. Pollen sam-ples were processed using acetolysis (Erdtman, 1960) and light microscopy to determine floral composition. A total of 900 grains per sample (28,800 grains total) were identified to de-termine floral composition.
Plants located in the vicinity of the red clover field were also surveyed throughout bloom and pollen was collected from each plant in bloom during the four weeks of the study, and proc-essed for use as a reference.
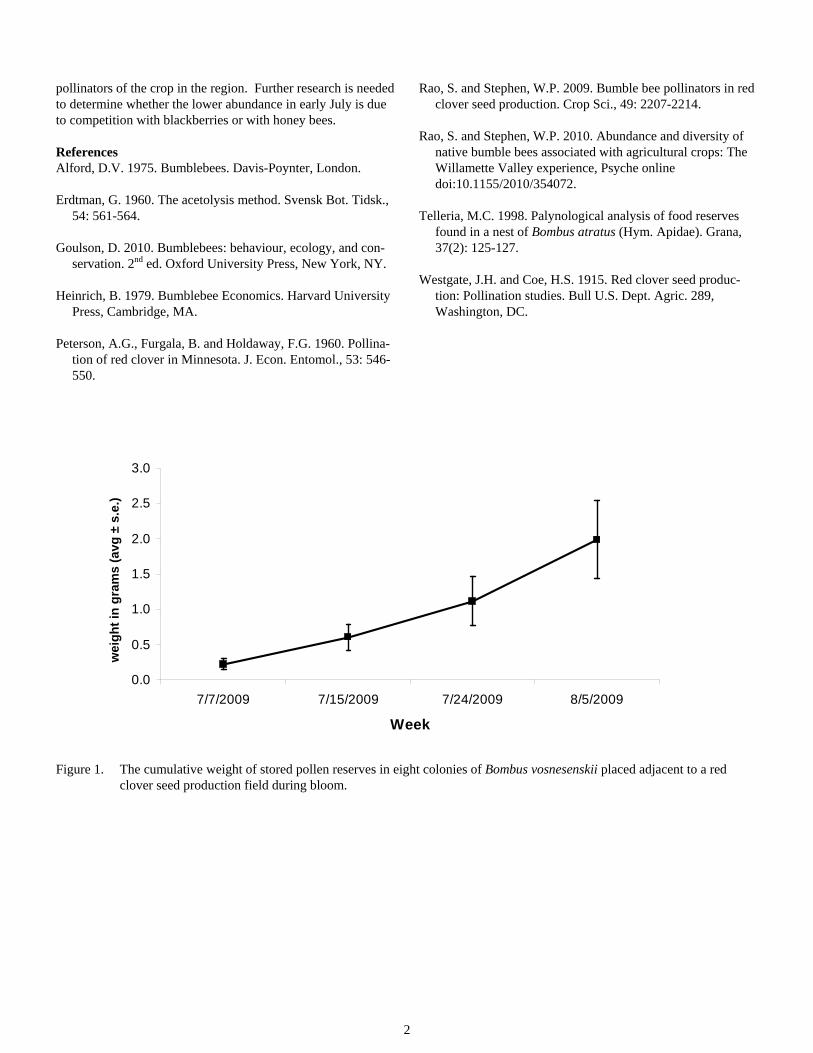
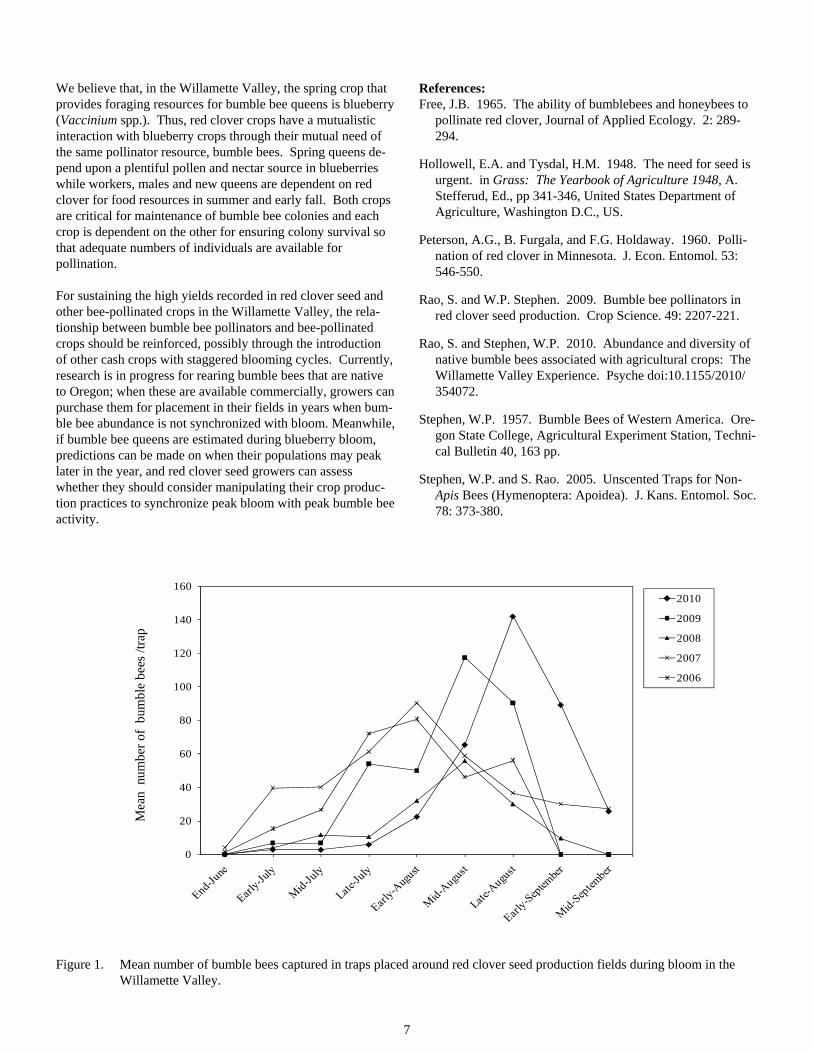
Results and Discussion We observed an increase in both the quantity and diversity of pollen collected by bumble bee colonies placed adjacent to the red clover field over the four weeks of the study. The weight of stored pollen reserves tripled between the first and second sampling periods after which it continued to steadily increase (Figure 1). Bumble bee colonies store pollen reserves for only 2-3 days (Alford, 1975), and hence pollen weight is likely cor-related with colony size. The steady increase in pollen could thus represent the period of rapid colony growth.
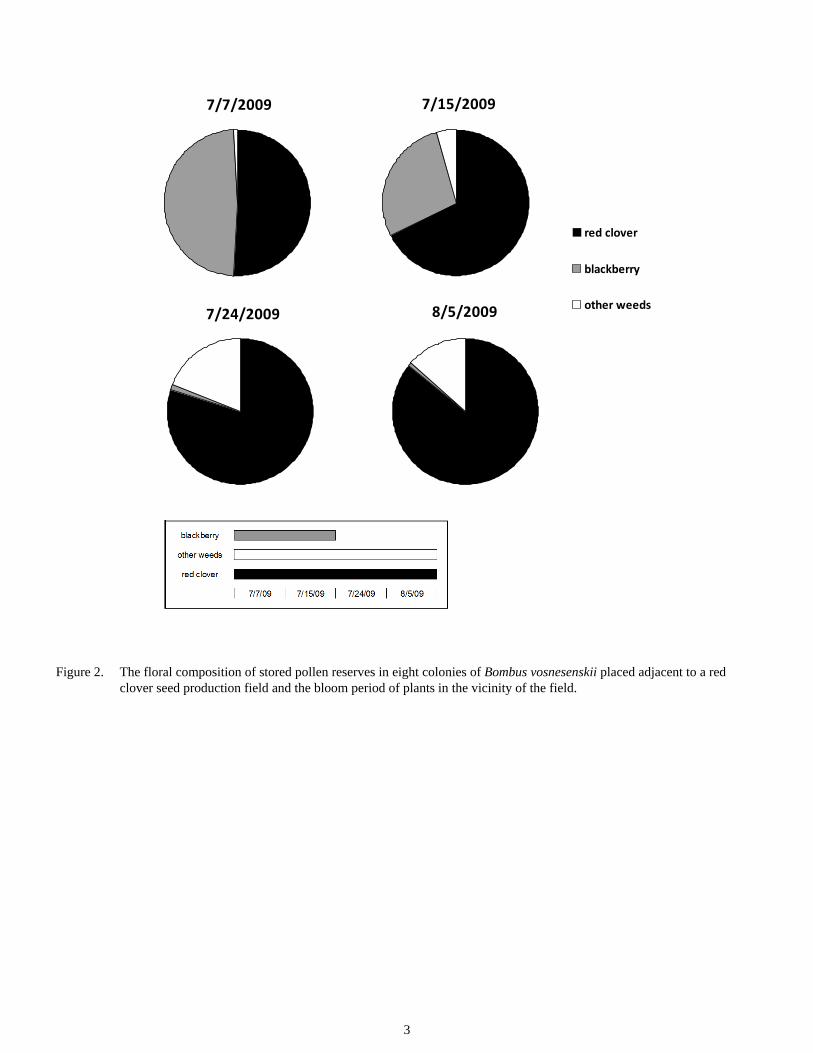
The composition of the pollen changed over the four weeks of the study (Figure 2). Initially, half of the pollen in the pots consisted of red clover pollen and the remaining half was that of blackberry. In the remaining three weeks, close to three fourths of the pollen was comprised of red clover while the remaining consisted of pollen from other weeds surrounding the field as blackberry was no longer in bloom.
The high proportion of blackberry pollen in the pots may sug-gest that bumble bees prefer to forage on blackberries over red clover. However, another factor that potentially affects bumble bee foraging in red clover in early July is competition with honey bees (Rao and Stephen, 2009). Growers typically rent 1-2 hives per acre for pollination of red clover seed crops, and initially honey bee workers appear to forage on the crop. How-ever, after a few weeks, they appear to move to other foraging resources in the vicinity in which nectar is more easily accessi-ble compared to red clover (Westgate and Coe, 1915; Peterson et al., 1960). This period coincides with higher abundance of bumble bees in red clover seed production fields in the Wil-lamette Valley (Rao and Stephen, 2009). The overall high abundance of red clover pollen in the pollen pots in bumble bee colonies provides further evidence of their role as key
2
pollinators of the crop in the region. Further research is needed to determine whether the lower abundance in early July is due to competition with blackberries or with honey bees.
References Alford, D.V. 1975. Bumblebees. Davis-Poynter, London.
Erdtman, G. 1960. The acetolysis method. Svensk Bot. Tidsk., 54: 561-564.
Goulson, D. 2010. Bumblebees: behaviour, ecology, and con-servation. 2nd ed. Oxford University Press, New York, NY.
Heinrich, B. 1979. Bumblebee Economics. Harvard University Press, Cambridge, MA.
Peterson, A.G., Furgala, B. and Holdaway, F.G. 1960. Pollina-tion of red clover in Minnesota. J. Econ. Entomol., 53: 546-550.
Rao, S. and Stephen, W.P. 2009. Bumble bee pollinators in red clover seed production. Crop Sci., 49: 2207-2214.
Rao, S. and Stephen, W.P. 2010. Abundance and diversity of native bumble bees associated with agricultural crops: The Willamette Valley experience, Psyche online doi:10.1155/2010/354072.
Telleria, M.C. 1998. Palynological analysis of food reserves found in a nest of Bombus atratus (Hym. Apidae). Grana, 37(2): 125-127.
Westgate, J.H. and Coe, H.S. 1915. Red clover seed produc-tion: Pollination studies. Bull U.S. Dept. Agric. 289, Washington, DC.
0.0
0.5
1.0
1.5
2.0
2.5
3.0
7/7/2009 7/15/2009 7/24/2009 8/5/2009
Week
wei
gh
t in
gra
ms
(avg
± s
.e.)
Figure 1. The cumulative weight of stored pollen reserves in eight colonies of Bombus vosnesenskii placed adjacent to a red clover seed production field during bloom.
3
red clover
blackberry
other weeds
7/7/2009 7/15/2009
7/24/2009 8/5/2009
Figure 2. The floral composition of stored pollen reserves in eight colonies of Bombus vosnesenskii placed adjacent to a red clover seed production field and the bloom period of plants in the vicinity of the field.

4
CHARACTERIZATION OF POLLEN LOADS FROM POLLEN TRAPS PLACED IN HONEY BEE HIVES IN RED CLOVER SEED FIELDS IN THE WILLAMETTE VALLEY
S. Maxfield-Taylor and S. Rao
Introduction The Willamette Valley in western Oregon is a major producer of red clover (Trifolium pratense L.) seed. In the region, red clover blooms over a six week period from early July to mid-August. Typically, growers in the region rent 1-2 honey bees hives per acre to meet pollination requirements for the crop. Research in the past, however, has raised questions about the efficacy of using honey bees as pollinators of red clover due to their tendency to exhibit “nectar robbing” behavior and to their preference for competing blooms near production sites (Bohart 1957; Hawkins 1956, 1960; Free 1965). In addition, the cost of hives has increased in recent years due to reduced availabil-ity resulting from diseases and the Colony Collapse Disorder. In 2009 and 2010, we conducted a study to determine the for-aging behavior of honey bees in red clover to enable growers to assess their investment in hive rentals, and determine whether to seek an alternative pollinator for production needs.
Methods Pollen traps were placed on honey bee hives for a 2-day dura-tion, 3 times during early (early July), mid (late July-early Au-gust) and late (mid-August) bloom in red clover fields (3 sites in 2009 and 2 sites 2010). Due to trap malfunction, only two pollen samples were collected from one of the 2010 collection
sites. Sub-samples containing 50 pollen loads were randomly selected from each pollen sample. The pollen loads were proc-essed by acetolysis (Erdtman 1943), and pollen grains were identified to plant family using light microscopy.
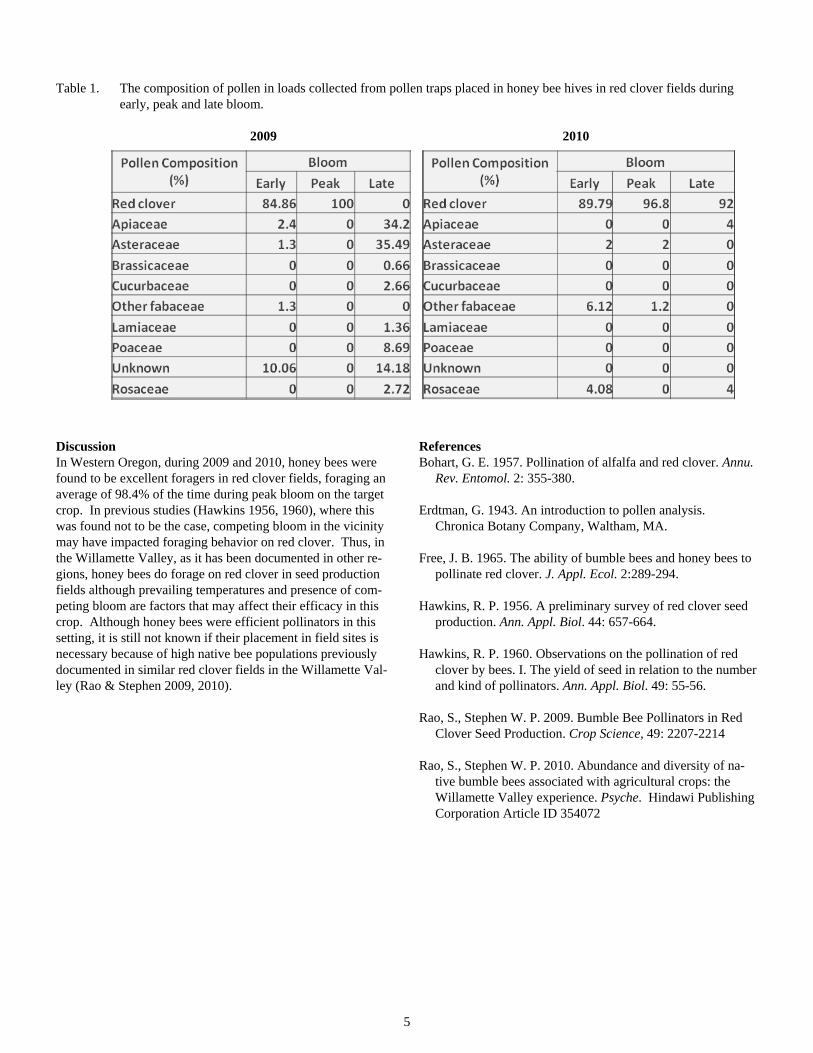
Results Analysis of the 700 pollen loads indicated that the majority of pollen collected by honey bees during early and peak bloom in both years, and during late bloom in 2010, was red clover pol-len (Figure 1.). However, in 2009, honey bees were foraging elsewhere during late bloom (Figure 1). This may have been a result of a heat wave in August 2009 which drastically im-pacted clover bloom.
In all, based on the pollen analysis, 9 plant families were vis-ited by honey bees placed in clover fields in 2009 and 2010 (Table 1). On average, honey bees foraged on non-target plant species 38.4% of the time during 2009, and 8.8% of the time during 2010. However, if the late blooming period from 2009 (in which bloom counts were unusually low at field sites) is excluded from the data, then honey bees foraged on non-target plants species on average 7.6% of the times included in the study, which is much more in line with the following year’s data.
2009 2010
Figure 1. The amount of red clover pollen in loads collected from pollen traps placed in honey bee hives in red clover fields dur-ing early, peak and late bloom.
0
10
20
30
40
50
60
70
80
90
100
Early bloom Peak bloom Late bloom
0
10
20
30
40
50
60
70
80
90
100
Early Bloom Peak Bloom Late Bloom
% o
f al
l pol
len
load
s
5
Table 1. The composition of pollen in loads collected from pollen traps placed in honey bee hives in red clover fields during early, peak and late bloom.
2009 2010
Discussion In Western Oregon, during 2009 and 2010, honey bees were found to be excellent foragers in red clover fields, foraging an average of 98.4% of the time during peak bloom on the target crop. In previous studies (Hawkins 1956, 1960), where this was found not to be the case, competing bloom in the vicinity may have impacted foraging behavior on red clover. Thus, in the Willamette Valley, as it has been documented in other re-gions, honey bees do forage on red clover in seed production fields although prevailing temperatures and presence of com-peting bloom are factors that may affect their efficacy in this crop. Although honey bees were efficient pollinators in this setting, it is still not known if their placement in field sites is necessary because of high native bee populations previously documented in similar red clover fields in the Willamette Val-ley (Rao & Stephen 2009, 2010).
References Bohart, G. E. 1957. Pollination of alfalfa and red clover. Annu.
Rev. Entomol. 2: 355-380.
Erdtman, G. 1943. An introduction to pollen analysis. Chronica Botany Company, Waltham, MA.
Free, J. B. 1965. The ability of bumble bees and honey bees to pollinate red clover. J. Appl. Ecol. 2:289-294.
Hawkins, R. P. 1956. A preliminary survey of red clover seed production. Ann. Appl. Biol. 44: 657-664.
Hawkins, R. P. 1960. Observations on the pollination of red clover by bees. I. The yield of seed in relation to the number and kind of pollinators. Ann. Appl. Biol. 49: 55-56.
Rao, S., Stephen W. P. 2009. Bumble Bee Pollinators in Red Clover Seed Production. Crop Science, 49: 2207-2214
Rao, S., Stephen W. P. 2010. Abundance and diversity of na-tive bumble bees associated with agricultural crops: the Willamette Valley experience. Psyche. Hindawi Publishing Corporation Article ID 354072
6
YEAR TO YEAR VARIATION IN BUMBLE BEE ACTIVITY IN RED CLOVER SEED PRODUCTION FIELDS IN THE WILLAMETTE VALLEY
W.P. Stephen and S. Rao
Introduction Red clover (Trifolium pratense L.) is self-sterile and hence a critical factor for seed production is pollination. The florets on each seed head open over six to eight days but due to rapid decrease in fertility, the florets must be pollinated within two to four days after opening (Free 1965). Hollowell and Tysdal (1948) indicated that 875 million florets are present in a hectare of red clover. This highlights the need for an abundance of pollinators during bloom for achieving high yield in red clover seed crops.
In the Willamette Valley, red clover typically blooms over six weeks in the months of July and August. Producers rent 1-2 honey bee hives per acre for pollination. While honey bees are capable of pollinating red clover under cage conditions (Rao and Stephen 2009), their performance in this crop is known to be affected by the presence of competing foraging resources in the vicinity (Peterson et al. 1960). Alternative pollinators in Oregon include the social bumble bees and a diversity of soli-tary bees. Bumble bees, in particular, are considered to be ex-cellent pollinators of red clover. A diversity of bumble bee species exists in western Oregon (Stephen 1957), of which several species are believed to contribute considerably to the high red clover seed yield recorded in the Willamette Valley compared to other regions in the US (Rao and Stephen 2009; 2010). However, climatic conditions, which vary from year to year, affect bumble bee colony development and forging be-havior, both of which could in turn affect red clover pollination and seed yield. Hence, the objective of this study was to de-termine the variation in bumble bee abundance during red clo-ver bloom over a five year period to determine if tactics need to be developed for ensuring adequate abundance of bumble bees to enable producers to continue to achieve high seed yields.
Methods The study was conducted in red clover seed production fields in Polk county in western Oregon between 2006 and 2010. Bumble bees were sampled using blue vane traps used in ear-lier studies (Stephen and Rao 2005; Rao et al. 2008). Each year, traps were set up in 5-6 fields, from late June to mid-September. Four traps were set up in each field every 7-10 days during bloom. Bumble bees were collected after 48 hours, preserved by freezing, and subsequently identified.
Results and Discussion Over the five years, bumble bees trapped during red clover bloom included Bombus appositus, B. caliginosus, B. califor-nicus, B. griseocollis, B. melanopygus, B. mixtus, B. nevaden-sis, B. sitkensis and B. vosnesenskii. However, B. griseocollis, B. nevadensis and B. vosnesenskii were the most dominant.
Amongst these three species, B. vosnesenskii was by far the most common comprising 50 - 75% of all Bombus observed each year.
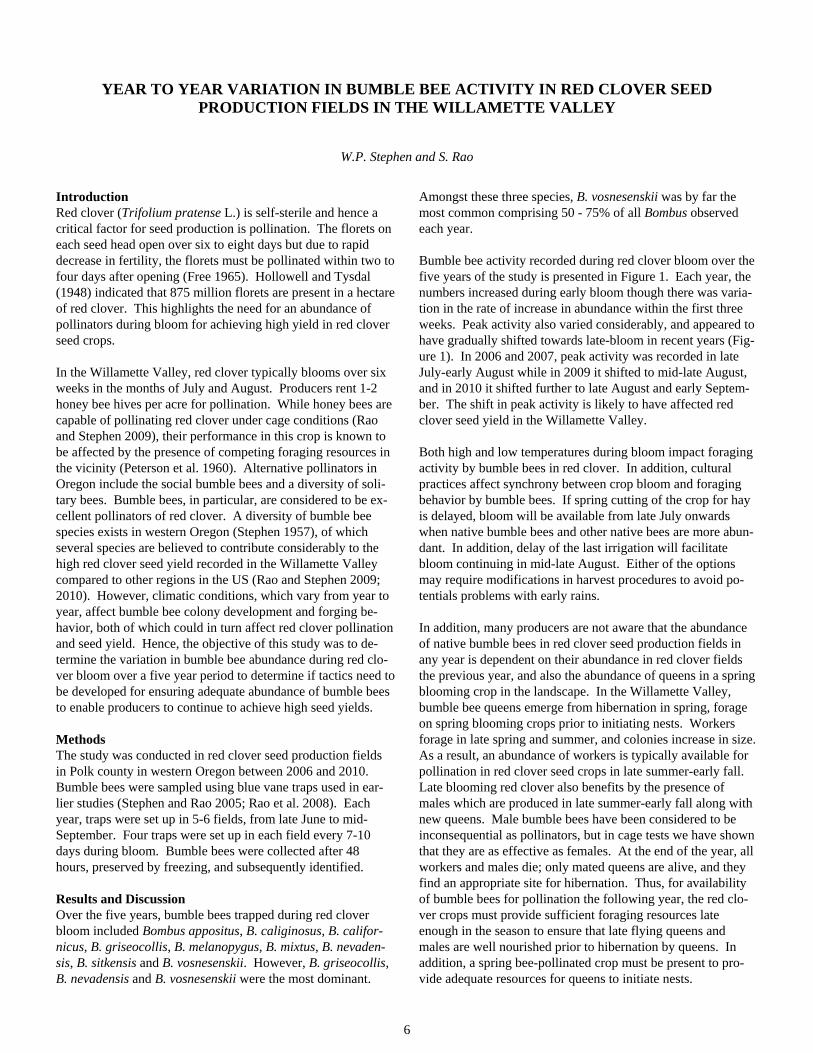
Bumble bee activity recorded during red clover bloom over the five years of the study is presented in Figure 1. Each year, the numbers increased during early bloom though there was varia-tion in the rate of increase in abundance within the first three weeks. Peak activity also varied considerably, and appeared to have gradually shifted towards late-bloom in recent years (Fig-ure 1). In 2006 and 2007, peak activity was recorded in late July-early August while in 2009 it shifted to mid-late August, and in 2010 it shifted further to late August and early Septem-ber. The shift in peak activity is likely to have affected red clover seed yield in the Willamette Valley.
Both high and low temperatures during bloom impact foraging activity by bumble bees in red clover. In addition, cultural practices affect synchrony between crop bloom and foraging behavior by bumble bees. If spring cutting of the crop for hay is delayed, bloom will be available from late July onwards when native bumble bees and other native bees are more abun-dant. In addition, delay of the last irrigation will facilitate bloom continuing in mid-late August. Either of the options may require modifications in harvest procedures to avoid po-tentials problems with early rains.
In addition, many producers are not aware that the abundance of native bumble bees in red clover seed production fields in any year is dependent on their abundance in red clover fields the previous year, and also the abundance of queens in a spring blooming crop in the landscape. In the Willamette Valley, bumble bee queens emerge from hibernation in spring, forage on spring blooming crops prior to initiating nests. Workers forage in late spring and summer, and colonies increase in size. As a result, an abundance of workers is typically available for pollination in red clover seed crops in late summer-early fall. Late blooming red clover also benefits by the presence of males which are produced in late summer-early fall along with new queens. Male bumble bees have been considered to be inconsequential as pollinators, but in cage tests we have shown that they are as effective as females. At the end of the year, all workers and males die; only mated queens are alive, and they find an appropriate site for hibernation. Thus, for availability of bumble bees for pollination the following year, the red clo-ver crops must provide sufficient foraging resources late enough in the season to ensure that late flying queens and males are well nourished prior to hibernation by queens. In addition, a spring bee-pollinated crop must be present to pro-vide adequate resources for queens to initiate nests.
7
We believe that, in the Willamette Valley, the spring crop that provides foraging resources for bumble bee queens is blueberry (Vaccinium spp.). Thus, red clover crops have a mutualistic interaction with blueberry crops through their mutual need of the same pollinator resource, bumble bees. Spring queens de-pend upon a plentiful pollen and nectar source in blueberries while workers, males and new queens are dependent on red clover for food resources in summer and early fall. Both crops are critical for maintenance of bumble bee colonies and each crop is dependent on the other for ensuring colony survival so that adequate numbers of individuals are available for pollination.
For sustaining the high yields recorded in red clover seed and other bee-pollinated crops in the Willamette Valley, the rela-tionship between bumble bee pollinators and bee-pollinated crops should be reinforced, possibly through the introduction of other cash crops with staggered blooming cycles. Currently, research is in progress for rearing bumble bees that are native to Oregon; when these are available commercially, growers can purchase them for placement in their fields in years when bum-ble bee abundance is not synchronized with bloom. Meanwhile, if bumble bee queens are estimated during blueberry bloom, predictions can be made on when their populations may peak later in the year, and red clover seed growers can assess whether they should consider manipulating their crop produc-tion practices to synchronize peak bloom with peak bumble bee activity.
References: Free, J.B. 1965. The ability of bumblebees and honeybees to
pollinate red clover, Journal of Applied Ecology. 2: 289-294.
Hollowell, E.A. and Tysdal, H.M. 1948. The need for seed is urgent. in Grass: The Yearbook of Agriculture 1948, A. Stefferud, Ed., pp 341-346, United States Department of Agriculture, Washington D.C., US.
Peterson, A.G., B. Furgala, and F.G. Holdaway. 1960. Polli-nation of red clover in Minnesota. J. Econ. Entomol. 53: 546-550.
Rao, S. and W.P. Stephen. 2009. Bumble bee pollinators in red clover seed production. Crop Science. 49: 2207-221.
Rao, S. and Stephen, W.P. 2010. Abundance and diversity of native bumble bees associated with agricultural crops: The Willamette Valley Experience. Psyche doi:10.1155/2010/ 354072.
Stephen, W.P. 1957. Bumble Bees of Western America. Ore-gon State College, Agricultural Experiment Station, Techni-cal Bulletin 40, 163 pp.
Stephen, W.P. and S. Rao. 2005. Unscented Traps for Non-Apis Bees (Hymenoptera: Apoidea). J. Kans. Entomol. Soc. 78: 373-380.
0
20
40
60
80
100
120
140
1602010
2009
2008
2007
2006
Figure 1. Mean number of bumble bees captured in traps placed around red clover seed production fields during bloom in the Willamette Valley.
Mea
n n
umbe
r of
bum
ble
bees
/tra
p
8
NATIVE BUMBLE BEE DIVERSITY, ABUNDANCE, AND POLLINATION IN CRIMSON CLOVER AND HAIRY VETCH SEED PRODUCTION FIELDS IN WESTERN OREGON
N.P. Anderson, S. Rao and A.V. Derkatch
Introduction Crimson clover (Trifolium incarnatum) and hairy vetch (Vicia villosa) are two crops with increasing importance in western Oregon. Due to a decline in grass seed production, acreage of alternative crops like clover and vetch seed increased by nearly 50% in western Oregon between 2007 and 2010 (USDA Farm Service Agency, 2010). These two crops are important forage legumes and have recently gained value as cover crops in a diverse range of production systems across the United States because of their ability to fix nitrogen.
Due to cool wet weather conditions, pollination is particularly critical for seed crops such as crimson clover and hairy vetch which bloom in the spring and early summer in western Ore-gon. Some bees, such as honey bees, do not fly on cool and rainy days. In contrast, many native bees, including bumble bees, are more efficient under less than optimal weather condi-tions. Western Oregon has a rich fauna of native bees, espe-cially bumble bees. However, for good yield, the life cycle of the bee needs to be synchronized with the bloom of the crop. There is little information on the diversity and abundance of bees present during bloom for these early blooming seed crops.
Studies in red clover, which blooms in the summer, have documented that there is high diversity and abundance of na-tive bumble bees in western Oregon (Rao and Stephen, 2009). Similar information has been lacking for the early blooming crops such as crimson clover and hairy vetch. These crops bloom when climatic conditions do not favor honey bee flight. Hence, they are largely dependent on naturally occurring bees. The buildup of bumblebee colonies depends on availability of food resources in spring and early summer. Thus, crops that bloom in the spring are of particular importance for establish-ment of new nests and production of workers that pollinate crops that bloom later in the spring and summer. Therefore, in this study, information on the diversity and the abundance of native bumble bees was assessed to determine whether ade-quate numbers are present for optimum pollination.
Methods The study was conducted on 4 crimson clover and 4 hairy vetch fields in Washington County during the spring and early summer of 2011. Data were collected during the month of May when crimson clover was in bloom and in late-May through June when hairy vetch was in bloom. During the time of the study, rented honey bee hives were present on 3 of 4 crimson clover fields and on 0 of 4 hairy vetch fields.
Diversity was measured by collecting bees for species identifi-cation using modified funnel traps fitted onto a clear plastic
collecting jar approximately 15 x 15 cm (Stephen and Rao, 2007). Two polypropylene vanes, 24 x 13 cm x 3 mm, inserted into a poly screw cap located above the collecting jar were used as an attractant. Traps were left in the field for 48 hours each week. Specimens were removed from the trap and each bumble bee was identified by species.
At each site, bumble bee abundance was estimated during 10 sets of 2 minute counts when visual observations were made while walking the field. Counts were completed 2 times per day, once in the morning and once in the afternoon. Counts were conducted throughout the entirety of bloom for each of the crops.
In addition, 50 seed heads were collected at random from the 4 crimson clover fields. A random subsample of 25 seed heads was further selected. Each of the 25 seed heads was examined closely and the number of flowers per seed head was recorded to estimate seed yield per head. This component was not com-pleted on hairy vetch due to the natural variability in the num-ber of seeds produced per seed pod.
Results and Discussion Diversity. Several native bumble bee species were identified in the traps. Species identified in the crimson clover fields in-cluded Bombus vosnesenskii, B. nevadensis, B. melanopygus and B. appositus. Each of these species, except B. melanopygus, was identified in the hairy vetch fields. This is not surprising as B. melanopygus is the first bumble bee spe-cies to emerge in the western Oregon and hence populations could have reduced by the time of bloom in hairy vetch.
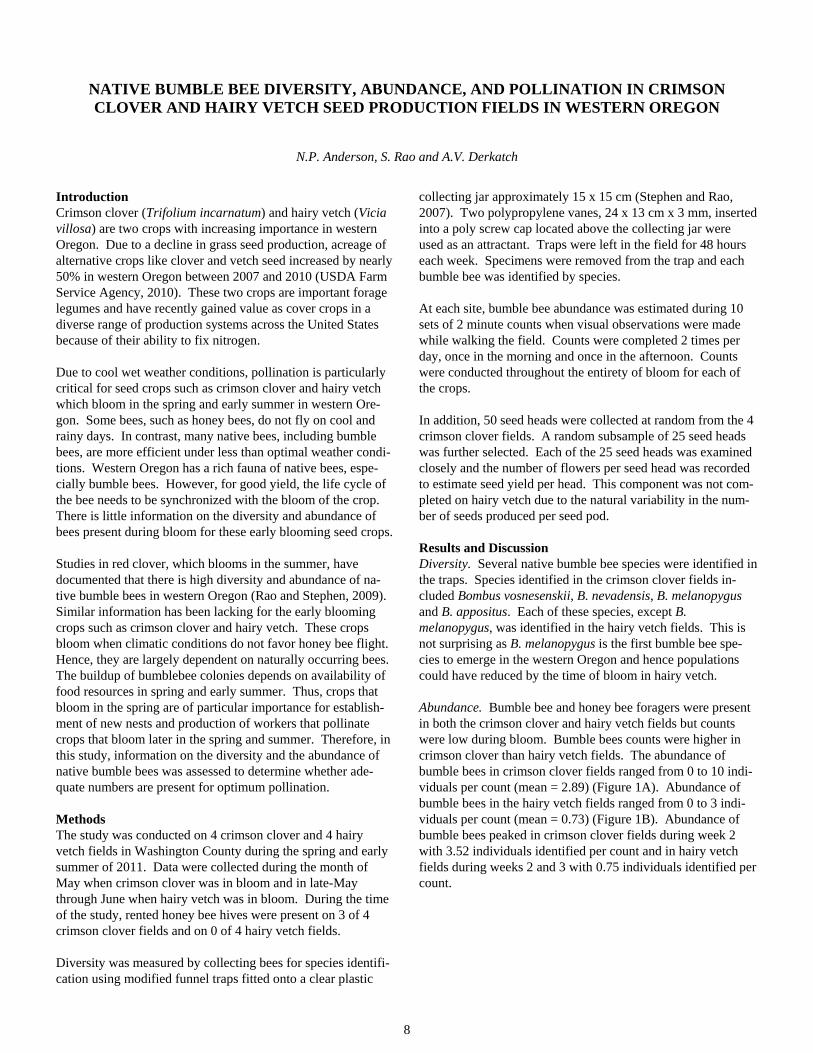
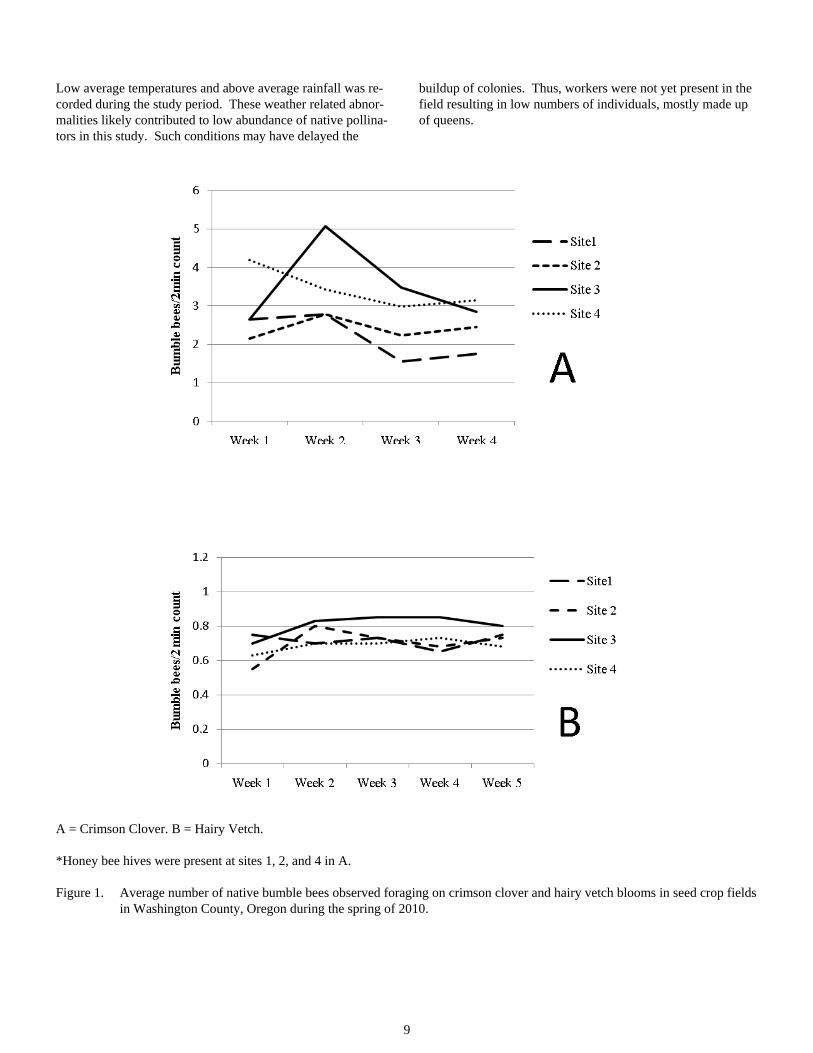
Abundance. Bumble bee and honey bee foragers were present in both the crimson clover and hairy vetch fields but counts were low during bloom. Bumble bees counts were higher in crimson clover than hairy vetch fields. The abundance of bumble bees in crimson clover fields ranged from 0 to 10 indi-viduals per count (mean = 2.89) (Figure 1A). Abundance of bumble bees in the hairy vetch fields ranged from 0 to 3 indi-viduals per count (mean = 0.73) (Figure 1B). Abundance of bumble bees peaked in crimson clover fields during week 2 with 3.52 individuals identified per count and in hairy vetch fields during weeks 2 and 3 with 0.75 individuals identified per count.
9
Low average temperatures and above average rainfall was re-corded during the study period. These weather related abnor-malities likely contributed to low abundance of native pollina-tors in this study. Such conditions may have delayed the
buildup of colonies. Thus, workers were not yet present in the field resulting in low numbers of individuals, mostly made up of queens.
A = Crimson Clover. B = Hairy Vetch.
*Honey bee hives were present at sites 1, 2, and 4 in A.
Figure 1. Average number of native bumble bees observed foraging on crimson clover and hairy vetch blooms in seed crop fields in Washington County, Oregon during the spring of 2010.
10
Estimation of seed yield per seed head. An average of 74.4% of flowers produced seeds in the 4 crimson clover fields. Per-centages ranged from 65.9% to 83.2%. Despite low abundance figures, the crimson clover crop was adequately pollinated and normal seed yields were achieved.
There was no positive correlation between presence of honey bee hives and increased seed yield.
The study needs to be repeated over 2-3 years to determine year to year variations and to see if the low abundance of na-tive bumble bees observed in 2010 was driven by poor weather conditions during bloom. In addition, future studies are needed to determine if bumble bees are foraging on crimson clover and hairy vetch blooms for pollen or just honey. Estimations are also needed on the abundance of honey bee workers with pol-len loads in both these crops. Finally, a comparison of seed yield in fields with and without honey bee hives will provide insights on whether or not native bumble bee populations are adequate for pollination of these two crops in western Oregon.
References Rao, S. and W.P. Stephen. 2009. Bumble bee pollinators in
red clover seed production. Crop Science. 49: 2207-2214.
Rao, S. and W.P. Stephen. 2010. Abundance and diversity of native bumble bees associated with agricultural crops: The Willamette Valley Experience. Psyche. (In Press).
Acknowledgments The authors would like to thank Calvin Grossen, Spencer Gates, John T. Bernards, North Valley Farms, Behrman Farms and Dierickx Farms for allowing us to work on their fields. This research was funded by the Agricultural Research Foundation.
11
FERTILIZATION OF THE CHOKE PATHOGEN IN ORCHARDGRASS SEED PRODUCTION FIELDS IN THE WILLAMETTE VALLEY
S. Rao, G.D. Hoffman, J.M. Kaser and S.C. Alderman
Introduction Choke disease in orchardgrass seed production fields in the Willamette Valley is caused by an endophytic fungus, Epichloë typhina. The fungus, native to Europe, was inadvertently in-troduced into cultivated orchardgrass fields in western Oregon in the late 1990s (Alderman et al. 1997). In the presence of an abundance of host plants in close proximity, the fungus spread rapidly, and soon reached epidemic levels (Pfender and Alder-man 1999; 2006). During vegetative growth of the or-chardgrass, the fungus develops internally but when the plant switches to the reproductive phase, it proliferates externally forming stromata. These surround the inflorescence and, as a result, no seeds are produced on the affected tillers. Hence, the expression of the pathogen is called choke disease (Sampson and Western 1954).
Epichloë typhina has a self incompatible mating system in which transfer of spermatia between opposite mating types is required for fertilization and initiation of the sexual stage (White and Bultman 1987). Fertilized stromata are covered with a layer of orange fruiting bodies, the perithecia, in which ascospores are produced. In the wild, flies in the genus Botanophila are believed to transfer spermatia between fungal stromata of opposite mating types during oviposition (Bultman and White 1988). They drag their abdomen across the stroma, defecating spermatia in the process thereby facilitating fertili-zation of the fungus. An abundance of the fly species is pre-sent in association with E. typhina on orchardgrass in Oregon (Rao and Baumann 2004). However, surveys over three years indicated a lack of correlation between fly abundance and fun-gal fertilization (Rao and Baumann 2004). This suggests that, although flies are likely involved in fertilization of stromata, other mechanisms could also be responsible for fertilization of the choke pathogen in the Willamette Valley. Here, we docu-ment that ascospores, slugs and water splashes from rain can serve as alternative mechanisms for transfer of spermatia be-tween opposite mating types of the choke pathogen in or-chardgrass fields in Oregon.
Fertilization by ascospores A laboratory experiment was conducted to determine if asco-spores produced after fertilization of early emerging stromata can in turn fertilize subsequent stromata that emerge. Asco-spores ejected from fertile stromata onto glass slides were sus-pended in water, and subsequently the suspension was trans-ferred to unfertilized stromata (Alderman and Rao 2008). A similar suspension was prepared and transferred using conidia, and water was used as a control. A thickening of the stromata at the point of conidia or ascospore application was observed within 72 hours in all stromata inoculated with ascospores or
conidia. There was no thickening or evidence of fertilization in stromata inoculated with only water. Ascospore germination from each stroma treated with conidia or ascospores exceeded 90% (Alderman and Rao 2008).
Based on these studies, in orchardgrass fields in western Ore-gon, ascospores from early-fertilized stromata could well fa-cilitate subsequent fertilization of stromata. Earlier studies documented that fertilization commences in early May (Rao and Ackerman 2009). Hence, it is possible that Botanophila flies are responsible for fertilization of early emerging stro-mata, while early ascospores provide an alternative mechanism for subsequent fertilization. Also, a large number of asco-spores are released from individual stroma in the region (Kaser et al. 2009); this could account for the rapid, widespread, and near complete fertilization of stromata observed in cultivated orchardgrass fields.
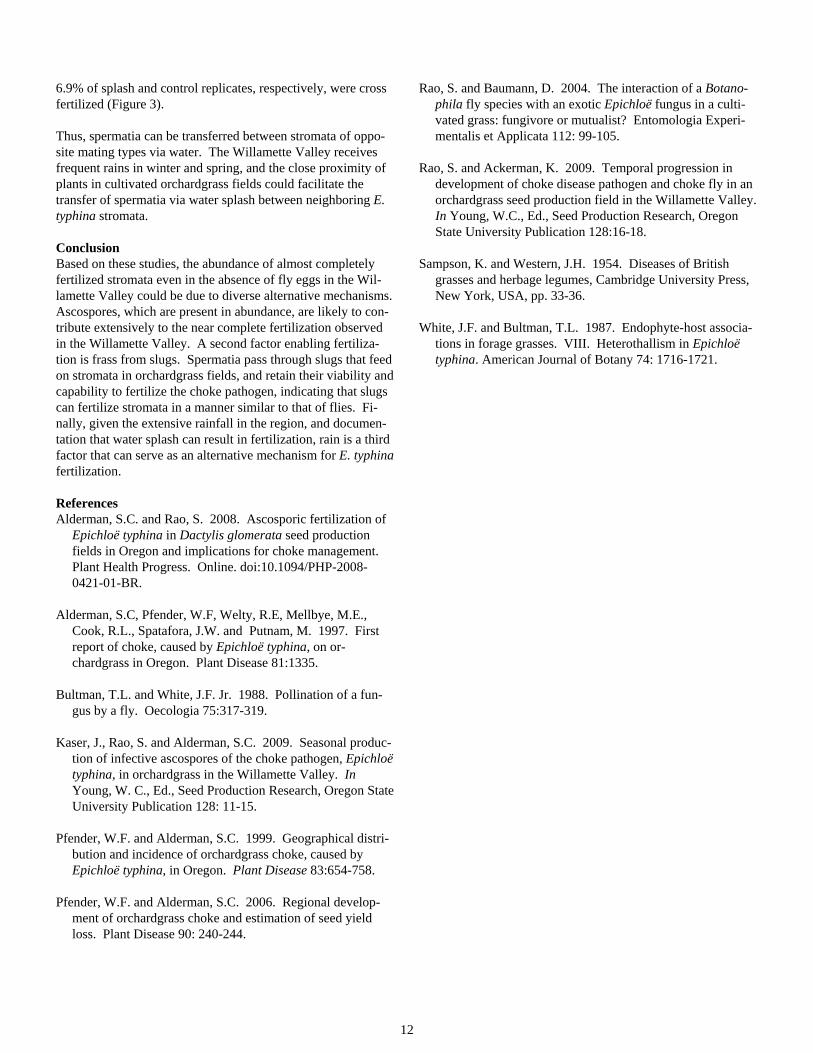
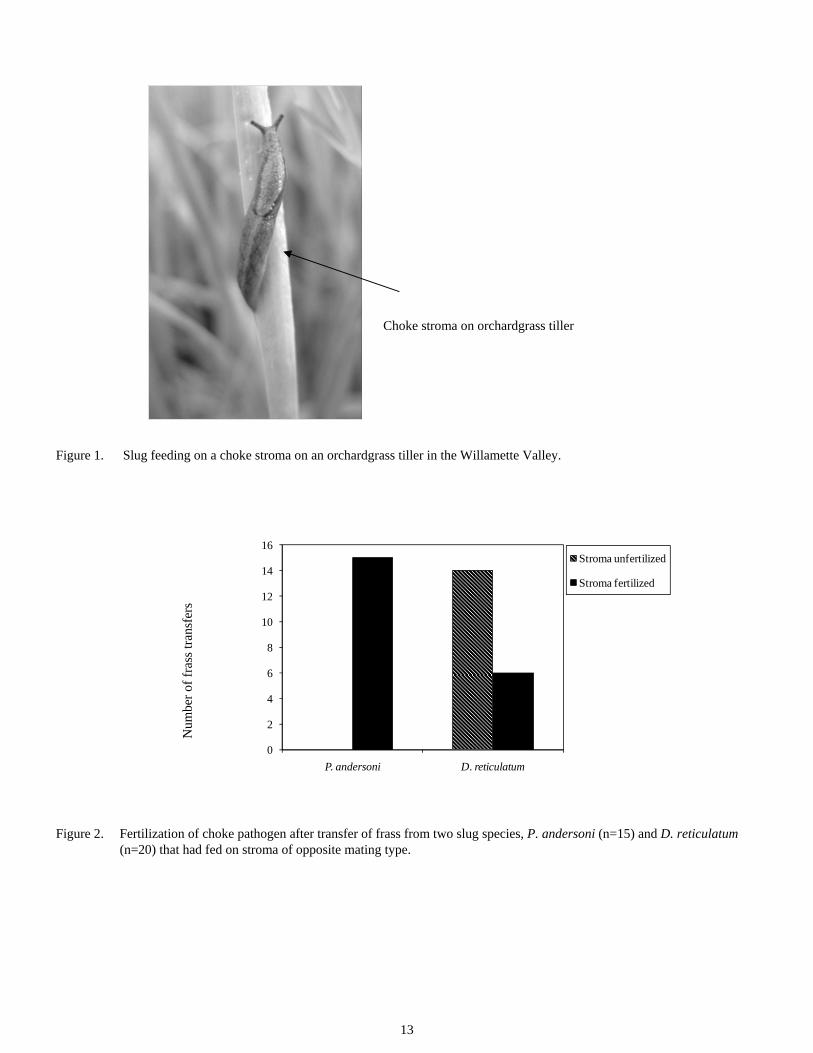
Fertilization by slugs Slugs feed on choke stromata in orchardgrass fields in Oregon (Figure 1), and spermatia are present in their frass. To deter-mine if the spermatia are viable and can fertilize the fungus, a frass transfer experiment was conducted with two slug species, the native Prophysaon andersoni, and the introduced Deroce-rus reticulatum. Frass from each species collected after expo-sure to an E. typhina stroma was transferred to a stroma of the opposite mating type, which was then examined after 10-14 days for signs of fertilization.
The fertilization response in the two slug species was signifi-cantly different. All frass transfers from P. andersoni, and 6 of 20 transfers from D. reticulatum resulted in fertilization (Fig-ure 2). Thus, it is possible that spermatia that are consumed and excreted by slugs, especially the native P. andersoni, can serve as a vector for fertilization of the choke pathogen in cul-tivated orchardgrass fields in the Willamette Valley.
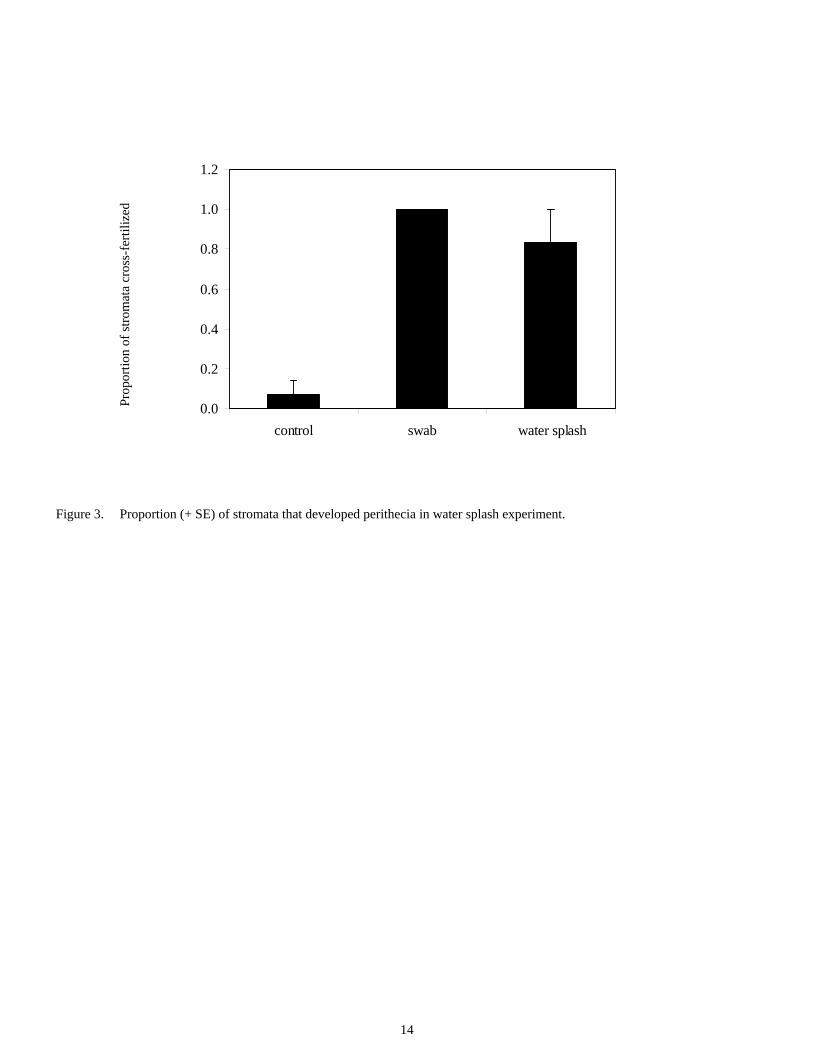
Fertilization through water splash A greenhouse experiment was conducted to determine if water splash might facilitate fertilization of choke. Cages with two orchardgrass plants of opposite mating types (determined using molecular techniques) were randomly assigned to one of the following three treatments with six replications: water splash between plants, cotton swab between neighboring stromata, or no treatment (control). Observations made seven days later indicated significant differences in fertilization between the swab treatment and control, and the water splash treatment and control but not between the swab and water splash treatments. All swab replicates were cross fertilized, while 83.3% and
12
6.9% of splash and control replicates, respectively, were cross fertilized (Figure 3).
Thus, spermatia can be transferred between stromata of oppo-site mating types via water. The Willamette Valley receives frequent rains in winter and spring, and the close proximity of plants in cultivated orchardgrass fields could facilitate the transfer of spermatia via water splash between neighboring E. typhina stromata.
Conclusion Based on these studies, the abundance of almost completely fertilized stromata even in the absence of fly eggs in the Wil-lamette Valley could be due to diverse alternative mechanisms. Ascospores, which are present in abundance, are likely to con-tribute extensively to the near complete fertilization observed in the Willamette Valley. A second factor enabling fertiliza-tion is frass from slugs. Spermatia pass through slugs that feed on stromata in orchardgrass fields, and retain their viability and capability to fertilize the choke pathogen, indicating that slugs can fertilize stromata in a manner similar to that of flies. Fi-nally, given the extensive rainfall in the region, and documen-tation that water splash can result in fertilization, rain is a third factor that can serve as an alternative mechanism for E. typhina fertilization.
References Alderman, S.C. and Rao, S. 2008. Ascosporic fertilization of
Epichloë typhina in Dactylis glomerata seed production fields in Oregon and implications for choke management. Plant Health Progress. Online. doi:10.1094/PHP-2008-0421-01-BR.
Alderman, S.C, Pfender, W.F, Welty, R.E, Mellbye, M.E., Cook, R.L., Spatafora, J.W. and Putnam, M. 1997. First report of choke, caused by Epichloë typhina, on or-chardgrass in Oregon. Plant Disease 81:1335.
Bultman, T.L. and White, J.F. Jr. 1988. Pollination of a fun-gus by a fly. Oecologia 75:317-319.
Kaser, J., Rao, S. and Alderman, S.C. 2009. Seasonal produc-tion of infective ascospores of the choke pathogen, Epichloë typhina, in orchardgrass in the Willamette Valley. In Young, W. C., Ed., Seed Production Research, Oregon State University Publication 128: 11-15.
Pfender, W.F. and Alderman, S.C. 1999. Geographical distri-bution and incidence of orchardgrass choke, caused by Epichloë typhina, in Oregon. Plant Disease 83:654-758.
Pfender, W.F. and Alderman, S.C. 2006. Regional develop-ment of orchardgrass choke and estimation of seed yield loss. Plant Disease 90: 240-244.
Rao, S. and Baumann, D. 2004. The interaction of a Botano-phila fly species with an exotic Epichloë fungus in a culti-vated grass: fungivore or mutualist? Entomologia Experi-mentalis et Applicata 112: 99-105.
Rao, S. and Ackerman, K. 2009. Temporal progression in development of choke disease pathogen and choke fly in an orchardgrass seed production field in the Willamette Valley. In Young, W.C., Ed., Seed Production Research, Oregon State University Publication 128:16-18.
Sampson, K. and Western, J.H. 1954. Diseases of British grasses and herbage legumes, Cambridge University Press, New York, USA, pp. 33-36.
White, J.F. and Bultman, T.L. 1987. Endophyte-host associa-tions in forage grasses. VIII. Heterothallism in Epichloë typhina. American Journal of Botany 74: 1716-1721.
13
Figure 1. Slug feeding on a choke stroma on an orchardgrass tiller in the Willamette Valley.
0
2
4
6
8
10
12
14
16
P. andersoni D. reticulatum
Stroma unfertilized
Stroma fertilized
Figure 2. Fertilization of choke pathogen after transfer of frass from two slug species, P. andersoni (n=15) and D. reticulatum (n=20) that had fed on stroma of opposite mating type.
Num
ber
of f
rass
tran
sfer
s
Choke stroma on orchardgrass tiller
14
0.0
0.2
0.4
0.6
0.8
1.0
1.2
control swab water splash
Figure 3. Proportion (+ SE) of stromata that developed perithecia in water splash experiment.
Pro
port
ion
of s
trom
ata
cros
s-fe
rtil
ized
15
EVALUATION OF NEWLY FORMULATED MOLLUSCIDES FOR CONTROL OF SLUGS IN WESTERN OREGON GRASS SEED FIELDS
N.P. Anderson, G.D. Hoffman and A.J. Dreves
Introduction Economically, slugs are still among the most important pest species causing damage to grass seed production in western Oregon. Two of the most prominent slugs are the gray field slug (Deroceras reticulatum) and the brown-banded slug (Arion circumscriptus). Reduction or elimination of open field burning, adoption of minimum or no-tillage farming practices, improved field drainage, and greatly increased levels of or-ganic matter and post-harvest residue in western Oregon’s grass seed fields have increased food, habitat, and moisture essential for sustaining large populations of slugs. Sustainable cultural practices such as direct seeding and chopping back and returning post harvest residues to soil surface appear to in-crease slug populations. The gray field slug has become one of the most costly grass pests in Oregon, resulting in extensive loss of seedling stands, and increased production costs incurred for reseeding and control. Fall grass seedling establishment is problematic if large populations of slugs are not controlled prior to planting and weather is favorable. The objective of these trials was to evaluate four newly formulated molluscide products for control of slugs in grass seed fields in western Oregon in late fall.
Materials and Methods Two trials were conducted in grass seed fields for control of slugs in October, 2010. Trials were located at: 1) 3 year old tall fescue field in Washington County and 2) a newly direct seeded intermediate ryegrass field in Linn County. At each study site, 50 ft x 50 ft plots were established in a randomized complete block design and replicated 3 times. Seven mollus-cide treatments included: 1) untreated control; 2) Deadline MP® pellet bait applied at 10 lbs/acre; 3) Sluggo® pellet bait applied at 15 lbs/acre; 4) Slugkill 2% FeEDTA pellet bait ap-plied at 15 lbs/acre; 5) Slugkill 5% FeEDTA pellet bait applied at 10 lbs/acre; 6) NEU1165P pellet bait applied at 15 lbs/acre; and 7) Sluggo Plus® pellet bait applied at 15 lbs/acre. Baits were applied with a rotary bait spreader. Treatments were es-tablished in areas of the fields where heavy slug populations were documented prior to baiting. Baits were applied when temperatures were between 45-50°F, soil moisture was present, and wind speed was less than 10 MPH.
Slug populations were evaluated prior to- and post-application of test materials. Three 18 x 18 in. slug blankets (designed by Liphatec Inc.) were soaked in water and randomly placed and secured in each plot. The study began on October 19 in Washington Co. and October 25 in Linn Co. Number of slugs per blanket was recorded 2 days prior to application of all treatments, 2 days post-application, and at 7, 10, and, 14 days after treatment. The 14 day post treatment evaluation at the
Washington Co. site was not possible due the grower’s plant-ing schedule for the field. At each evaluation, slugs were re-moved and blankets were relocated in a new location within the plot. Observations of slug species diversity and age were documented.
Due to the continuing high population of large slugs at the study location in Linn Co., and the emergence of populations of juvenile slugs (0.250 g or less), bait was re-applied at this study location 14 days after the initial evaluation. Evaluations were made 2, 7, 10 and 16 days after the second baiting oc-curred. Following the second bait application, adult and juve-nile slugs were differentiated and recorded.
Data were statistically analyzed using ANOVA and LSD. Slug- days were calculated by averaging the number of slugs counted per plot on a given evaluation day by the number of slugs counted in the same plot on the previous evaluation day. This average was then multiplied by the number of days be-tween the two evaluation days.
Results Pre-bait evaluations showed that high numbers of gray field slugs (Deroceras reticulatum) were present at both sites. A small number (<5%) of brown-banded slugs (Arion circum-scriptus) were also documented.
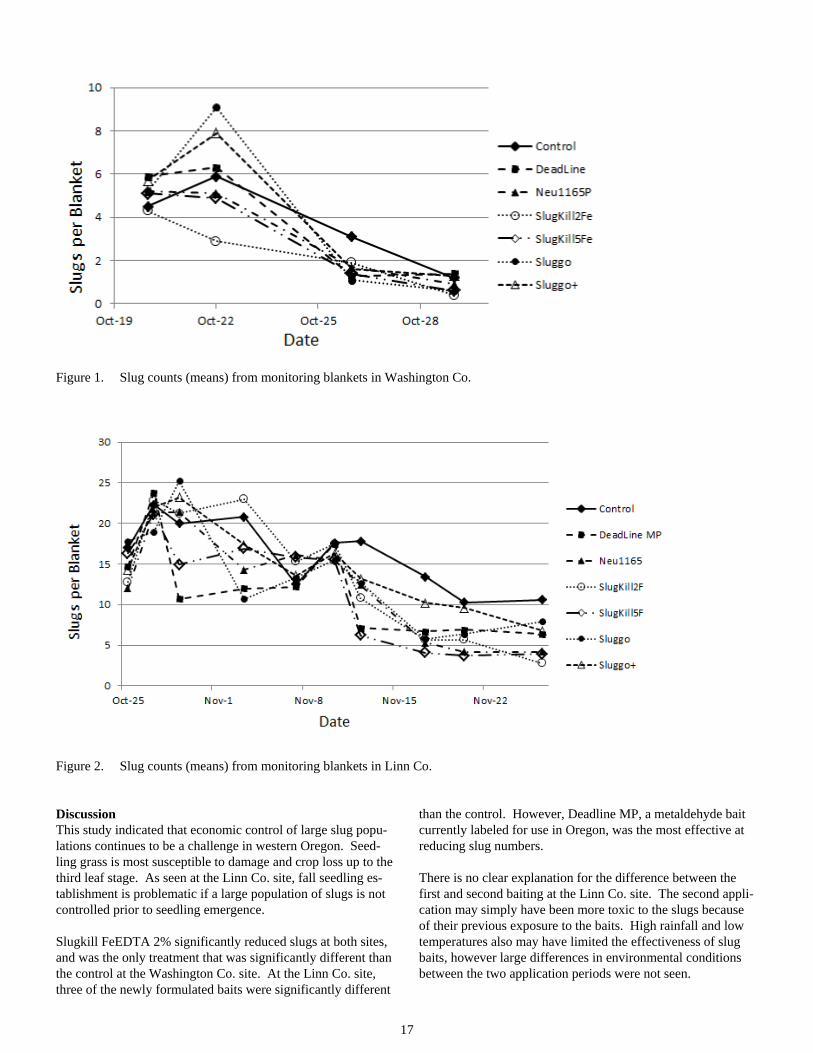
There were significant differences between treatments (P ≤ 0.05) at both sites. At the Washington Co. site, Slugkill 2% FeEDTA was the only treatment with significantly less slug days/blanket compared to the control (Table 1). A confound-ing pattern at this site was the decline in the control plots that paralleled the decline seen in the treated plots (Figure 2). Weather events, including cold temperatures at night, most likely influenced reduced numbers of slugs found under blankets.
At the Linn Co. site, NEU1165P, Sluggo, Slugkill 5% FeEDTA and Deadline MP-treated plots had significantly less slug-days/blanket compared to the control (Table 2).
The second baiting at the Linn Co. site was more effective than the first baiting (Figure 2). Seven days after the first baiting the average slug population over all the bait treated plots was 23% less than the untreated control. Seven days after the sec-ond baiting the average population in treated plots was 94% less than the untreated control. The poor slug control from the first baiting period resulted in extensive damage to the newly-emerged seedlings. By the time the second bait was applied there was already significant stand loss.
16
The average high and low temperatures over the 5 days subse-quent to the first baiting were 54.8 °F and 41.2 °F, respectively. For the second baiting period they were 52.8 °F and 40.5 °F. Rainfall during this five day period was 0.74 inches after the
first baiting and 0.26 inches after the second baiting. Wind may have played a role in reducing numbers.
Over the course of the two baiting periods the proportion of small juvenile slugs (0.250 g) increased.
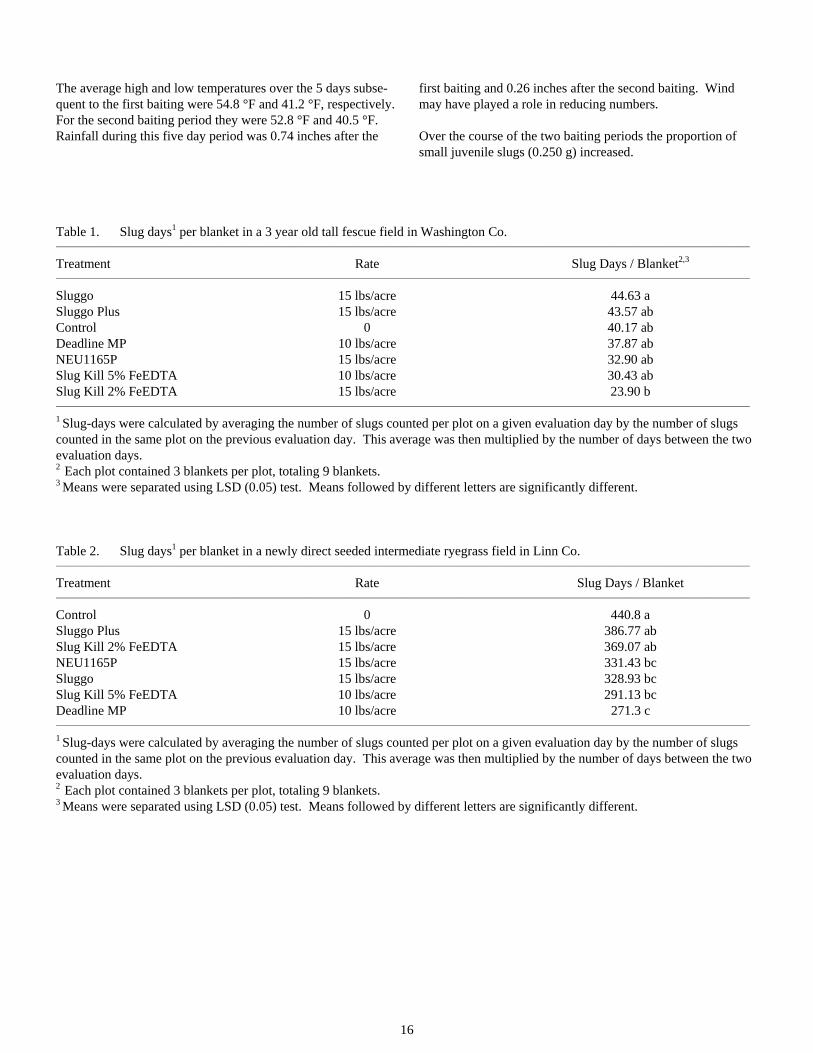
Table 1. Slug days1 per blanket in a 3 year old tall fescue field in Washington Co. _________________________________________________________________________________________________________________________________________________________________
Treatment Rate Slug Days / Blanket2,3 _________________________________________________________________________________________________________________________________________________________________
Sluggo 15 lbs/acre 44.63 a Sluggo Plus 15 lbs/acre 43.57 ab Control 0 40.17 ab Deadline MP 10 lbs/acre 37.87 ab NEU1165P 15 lbs/acre 32.90 ab Slug Kill 5% FeEDTA 10 lbs/acre 30.43 ab Slug Kill 2% FeEDTA 15 lbs/acre 23.90 b _________________________________________________________________________________________________________________________________________________________________
1 Slug-days were calculated by averaging the number of slugs counted per plot on a given evaluation day by the number of slugs counted in the same plot on the previous evaluation day. This average was then multiplied by the number of days between the two evaluation days. 2 Each plot contained 3 blankets per plot, totaling 9 blankets. 3 Means were separated using LSD (0.05) test. Means followed by different letters are significantly different. Table 2. Slug days1 per blanket in a newly direct seeded intermediate ryegrass field in Linn Co. _________________________________________________________________________________________________________________________________________________________________
Treatment Rate Slug Days / Blanket _________________________________________________________________________________________________________________________________________________________________
Control 0 440.8 a Sluggo Plus 15 lbs/acre 386.77 ab Slug Kill 2% FeEDTA 15 lbs/acre 369.07 ab NEU1165P 15 lbs/acre 331.43 bc Sluggo 15 lbs/acre 328.93 bc Slug Kill 5% FeEDTA 10 lbs/acre 291.13 bc Deadline MP 10 lbs/acre 271.3 c _________________________________________________________________________________________________________________________________________________________________
1 Slug-days were calculated by averaging the number of slugs counted per plot on a given evaluation day by the number of slugs counted in the same plot on the previous evaluation day. This average was then multiplied by the number of days between the two evaluation days. 2 Each plot contained 3 blankets per plot, totaling 9 blankets. 3 Means were separated using LSD (0.05) test. Means followed by different letters are significantly different.
17
Figure 1. Slug counts (means) from monitoring blankets in Washington Co.
Figure 2. Slug counts (means) from monitoring blankets in Linn Co.
Discussion This study indicated that economic control of large slug popu-lations continues to be a challenge in western Oregon. Seed-ling grass is most susceptible to damage and crop loss up to the third leaf stage. As seen at the Linn Co. site, fall seedling es-tablishment is problematic if a large population of slugs is not controlled prior to seedling emergence.
Slugkill FeEDTA 2% significantly reduced slugs at both sites, and was the only treatment that was significantly different than the control at the Washington Co. site. At the Linn Co. site, three of the newly formulated baits were significantly different
than the control. However, Deadline MP, a metaldehyde bait currently labeled for use in Oregon, was the most effective at reducing slug numbers.
There is no clear explanation for the difference between the first and second baiting at the Linn Co. site. The second appli-cation may simply have been more toxic to the slugs because of their previous exposure to the baits. High rainfall and low temperatures also may have limited the effectiveness of slug baits, however large differences in environmental conditions between the two application periods were not seen.

18
We observed that younger slugs are more difficult to control than older slugs. Younger slugs may not feed as much on the baits, so are more difficult to kill. They are a continual source of re-infestation, and along with the surviving large slugs re-quired the additional baiting. It is important that adequate slug control coincides with the emergence of grass seedlings to en-sure good establishment.
No attempt was made to quantify differences between mixtures versus single product treatments. We recommend that these and other newly formulated baits continue to be tested in repli-cated field trials in western Oregon as there is a continued need for product development and registration to provide adequate control of these damaging pests.
Acknowledgements This work was funded by the Oregon Seed Council/Oregon Department of Agriculture and Neudorff North America. We also extend our appreciation to Behrman Farms and Pugh Seed Farm, Inc. for the use of their fields in the conduct of this study.
19
SHARPPOINT FLUVELLIN BIOLOGY AND MANAGEMENT IN SPRING-SEEDED TALL FESCUE GROWN FOR SEED
D.W. Curtis, B.J. Hinds-Cook, A.G. Hulting and C.A. Mallory-Smith
Introduction Sharppoint fluvellin (Kickxia elatine) is a problematic weed in grass seed growing areas of western Oregon. Sharppoint fluvellin is in the Scrophularaceae family (figwort or snap-dragon family). The species is native to Europe. The genus name Kickxia refers to Jean Kickx Jr. who was a botany pro-fessor in Belgium in the nineteenth century. Elatine is ancient Greek for low creeping plant which describes the prostrate growth habit of sharppoint fluvellin well. A less common re-lated species is roundleaf or female fluvellin (Kickxia spuria). Sharppoint fluvellin is found on roadsides, agricultural fields, orchards, gardens and nurseries in the southern states, a few central states and throughout Oregon, Washington and Califor-nia. Sharppoint fluvellin is an annual with soft, hairy foliage and a “mat-like” appearance when mature. Leaves are mostly alternate and slightly heart shaped or arrow-head shaped and may resemble field bindweed. Flowers are two lipped, white to pale yellow with a purple upper lip and a distinctive spur. Fruit is nearly round and opens at the top to disperse seeds. Sharppoint fluvellin has a fibrous or woody taproot in large individuals and thrives under hot dry conditions. Competitive effects are not well documented but the plant is noted for the ability to regenerate following physical injury during emer-gence. In addition, sharppoint fluvellin is tolerant of many
herbicides. Reproduction is through seed, while most seeds remain near the parent plant they are easily moved by soil and water. Sharppoint fluvellin flowers from June through Sep-tember and perhaps even longer in the Willamette Valley. Buried seed may survive up to 20 years, but most germinate relatively quickly. These growth characteristics make sharppoint fluvellin highly competitive with spring-planted tall fescue, especially in non-irrigated plantings. Many crop advi-sors and producers feel stand establishment of tall fescue in the spring could be enhanced through the control of this weed species.
The objective of this research was to evaluate herbicides for sharppoint fluvellin control and quantify crop injury in spring-planted tall fescue for seed production. Four studies were con-ducted over four years in the Willamette Valley.
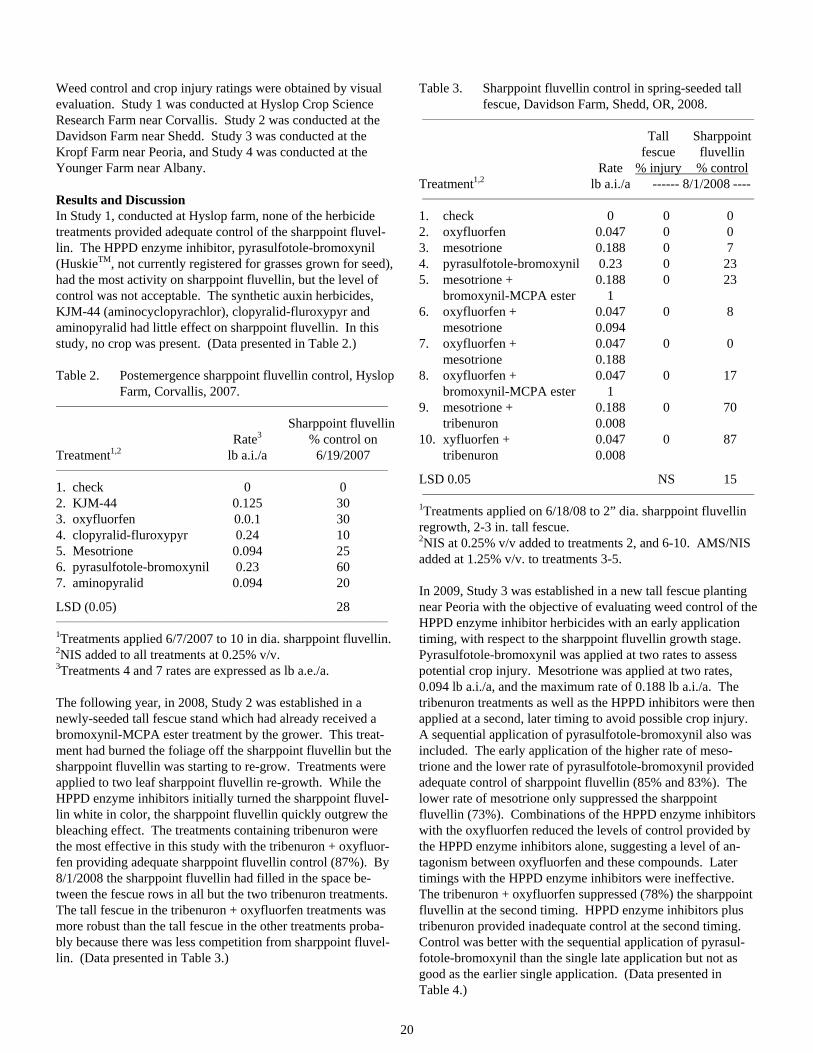
Methods Studies were conducted as randomized complete block experi-ments with four replications with the exception of the first study that had only two replications. Treatments were applied with a unicycle sprayer that delivered 20 GPA at 20 psi. Ap-plication conditions are presented in Table 1.
Table 1. Application conditions. _______________________________________________________________________________________________________________________________________________________________
Site 1 Site 2 ---------------------Site 3 -------------------- Site 4 Application date 6/7/07 6/18/08 5/15/09 6/4/09 6/16/09 5/27/10 _______________________________________________________________________________________________________________________________________________________________
Air temperature (F) 65 56 53 75 73 60 Relative humidity (%) 56 85 86 68 56 68 Soil temperature (F) 77 59 62 86 82 70 Tall Fescue growth stage no crop 2-3 in. tall 2-4 leaf jointing 2 joints 3-4 leaf Sharppoint growth stage (dia.) 10 in. 2 in. 3 in. 6-12 in. 6-12 in. 3-4 in. _______________________________________________________________________________________________________________________________________________________________
20
Weed control and crop injury ratings were obtained by visual evaluation. Study 1 was conducted at Hyslop Crop Science Research Farm near Corvallis. Study 2 was conducted at the Davidson Farm near Shedd. Study 3 was conducted at the Kropf Farm near Peoria, and Study 4 was conducted at the Younger Farm near Albany.
Results and Discussion In Study 1, conducted at Hyslop farm, none of the herbicide treatments provided adequate control of the sharppoint fluvel-lin. The HPPD enzyme inhibitor, pyrasulfotole-bromoxynil (HuskieTM, not currently registered for grasses grown for seed), had the most activity on sharppoint fluvellin, but the level of control was not acceptable. The synthetic auxin herbicides, KJM-44 (aminocyclopyrachlor), clopyralid-fluroxypyr and aminopyralid had little effect on sharppoint fluvellin. In this study, no crop was present. (Data presented in Table 2.)
Table 2. Postemergence sharppoint fluvellin control, Hyslop Farm, Corvallis, 2007.
_____________________________________________________________________________
Sharppoint fluvellin Rate3 % control on Treatment1,2 lb a.i./a 6/19/2007 _____________________________________________________________________________
1. check 0 0 2. KJM-44 0.125 30 3. oxyfluorfen 0.0.1 30 4. clopyralid-fluroxypyr 0.24 10 5. Mesotrione 0.094 25 6. pyrasulfotole-bromoxynil 0.23 60 7. aminopyralid 0.094 20
LSD (0.05) 28 _____________________________________________________________________________
1Treatments applied 6/7/2007 to 10 in dia. sharppoint fluvellin. 2NIS added to all treatments at 0.25% v/v. 3Treatments 4 and 7 rates are expressed as lb a.e./a. The following year, in 2008, Study 2 was established in a newly-seeded tall fescue stand which had already received a bromoxynil-MCPA ester treatment by the grower. This treat-ment had burned the foliage off the sharppoint fluvellin but the sharppoint fluvellin was starting to re-grow. Treatments were applied to two leaf sharppoint fluvellin re-growth. While the HPPD enzyme inhibitors initially turned the sharppoint fluvel-lin white in color, the sharppoint fluvellin quickly outgrew the bleaching effect. The treatments containing tribenuron were the most effective in this study with the tribenuron + oxyfluor-fen providing adequate sharppoint fluvellin control (87%). By 8/1/2008 the sharppoint fluvellin had filled in the space be-tween the fescue rows in all but the two tribenuron treatments. The tall fescue in the tribenuron + oxyfluorfen treatments was more robust than the tall fescue in the other treatments proba-bly because there was less competition from sharppoint fluvel-lin. (Data presented in Table 3.)
Table 3. Sharppoint fluvellin control in spring-seeded tall fescue, Davidson Farm, Shedd, OR, 2008.
_____________________________________________________________________________
Tall Sharppoint fescue fluvellin Rate % injury % control Treatment1,2 lb a.i./a ------ 8/1/2008 ---- _____________________________________________________________________________
1. check 0 0 0 2. oxyfluorfen 0.047 0 0 3. mesotrione 0.188 0 7 4. pyrasulfotole-bromoxynil 0.23 0 23 5. mesotrione + 0.188 0 23 bromoxynil-MCPA ester 1 6. oxyfluorfen + 0.047 0 8 mesotrione 0.094 7. oxyfluorfen + 0.047 0 0 mesotrione 0.188 8. oxyfluorfen + 0.047 0 17 bromoxynil-MCPA ester 1 9. mesotrione + 0.188 0 70 tribenuron 0.008 10. xyfluorfen + 0.047 0 87 tribenuron 0.008
LSD 0.05 NS 15 _____________________________________________________________________________
1Treatments applied on 6/18/08 to 2” dia. sharppoint fluvellin regrowth, 2-3 in. tall fescue. 2NIS at 0.25% v/v added to treatments 2, and 6-10. AMS/NIS added at 1.25% v/v. to treatments 3-5. In 2009, Study 3 was established in a new tall fescue planting near Peoria with the objective of evaluating weed control of the HPPD enzyme inhibitor herbicides with an early application timing, with respect to the sharppoint fluvellin growth stage. Pyrasulfotole-bromoxynil was applied at two rates to assess potential crop injury. Mesotrione was applied at two rates, 0.094 lb a.i./a, and the maximum rate of 0.188 lb a.i./a. The tribenuron treatments as well as the HPPD inhibitors were then applied at a second, later timing to avoid possible crop injury. A sequential application of pyrasulfotole-bromoxynil also was included. The early application of the higher rate of meso-trione and the lower rate of pyrasulfotole-bromoxynil provided adequate control of sharppoint fluvellin (85% and 83%). The lower rate of mesotrione only suppressed the sharppoint fluvellin (73%). Combinations of the HPPD enzyme inhibitors with the oxyfluorfen reduced the levels of control provided by the HPPD enzyme inhibitors alone, suggesting a level of an-tagonism between oxyfluorfen and these compounds. Later timings with the HPPD enzyme inhibitors were ineffective. The tribenuron + oxyfluorfen suppressed (78%) the sharppoint fluvellin at the second timing. HPPD enzyme inhibitors plus tribenuron provided inadequate control at the second timing. Control was better with the sequential application of pyrasul-fotole-bromoxynil than the single late application but not as good as the earlier single application. (Data presented in Table 4.)
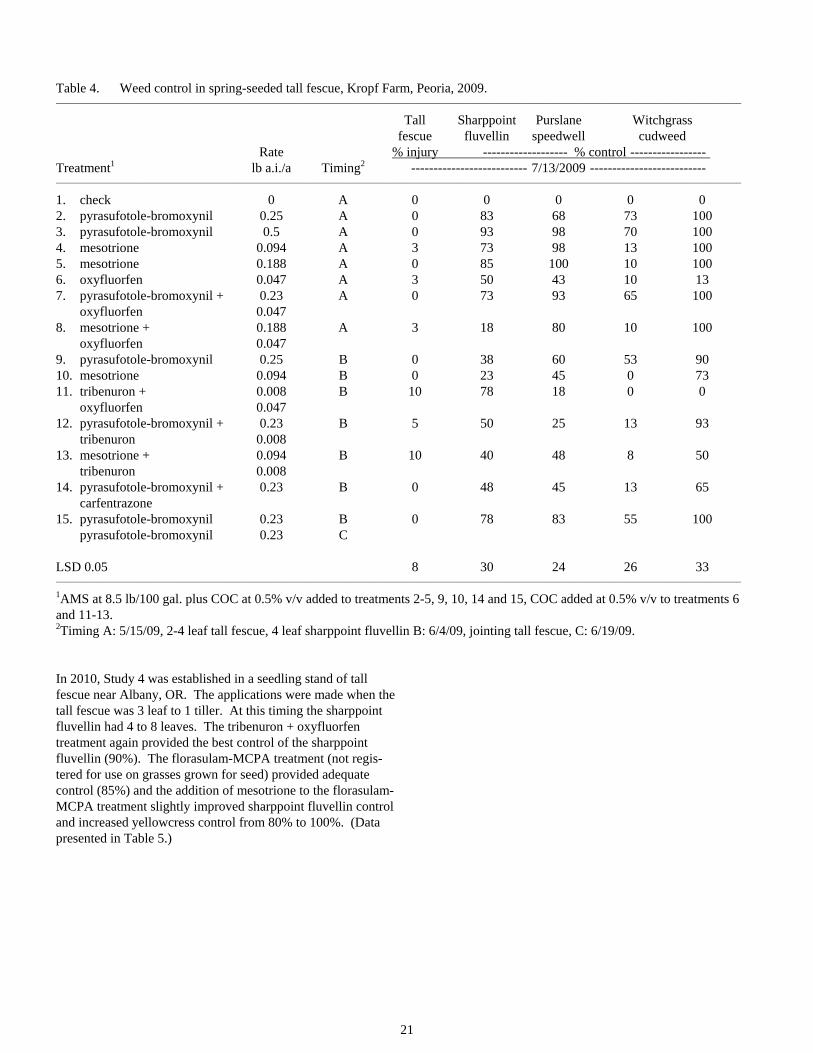
21
Table 4. Weed control in spring-seeded tall fescue, Kropf Farm, Peoria, 2009. _______________________________________________________________________________________________________________________________________________________________
Tall Sharppoint Purslane Witchgrass fescue fluvellin speedwell cudweed Rate % injury ------------------- % control ----------------- Treatment1 lb a.i./a Timing2 -------------------------- 7/13/2009 -------------------------- _______________________________________________________________________________________________________________________________________________________________
1. check 0 A 0 0 0 0 0 2. pyrasufotole-bromoxynil 0.25 A 0 83 68 73 100 3. pyrasufotole-bromoxynil 0.5 A 0 93 98 70 100 4. mesotrione 0.094 A 3 73 98 13 100 5. mesotrione 0.188 A 0 85 100 10 100 6. oxyfluorfen 0.047 A 3 50 43 10 13 7. pyrasufotole-bromoxynil + 0.23 A 0 73 93 65 100 oxyfluorfen 0.047 8. mesotrione + 0.188 A 3 18 80 10 100 oxyfluorfen 0.047 9. pyrasufotole-bromoxynil 0.25 B 0 38 60 53 90 10. mesotrione 0.094 B 0 23 45 0 73 11. tribenuron + 0.008 B 10 78 18 0 0 oxyfluorfen 0.047 12. pyrasufotole-bromoxynil + 0.23 B 5 50 25 13 93 tribenuron 0.008 13. mesotrione + 0.094 B 10 40 48 8 50 tribenuron 0.008 14. pyrasufotole-bromoxynil + 0.23 B 0 48 45 13 65 carfentrazone 15. pyrasufotole-bromoxynil 0.23 B 0 78 83 55 100 pyrasufotole-bromoxynil 0.23 C LSD 0.05 8 30 24 26 33 _______________________________________________________________________________________________________________________________________________________________
1AMS at 8.5 lb/100 gal. plus COC at 0.5% v/v added to treatments 2-5, 9, 10, 14 and 15, COC added at 0.5% v/v to treatments 6 and 11-13. 2Timing A: 5/15/09, 2-4 leaf tall fescue, 4 leaf sharppoint fluvellin B: 6/4/09, jointing tall fescue, C: 6/19/09.
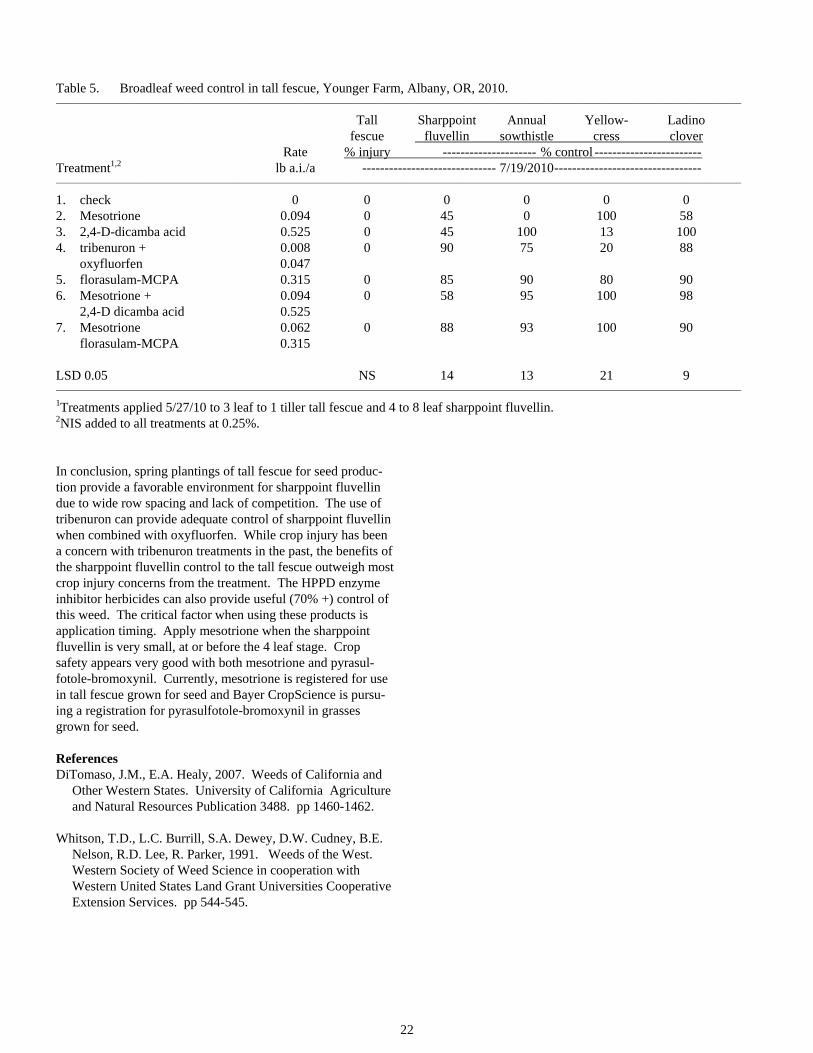
In 2010, Study 4 was established in a seedling stand of tall fescue near Albany, OR. The applications were made when the tall fescue was 3 leaf to 1 tiller. At this timing the sharppoint fluvellin had 4 to 8 leaves. The tribenuron + oxyfluorfen treatment again provided the best control of the sharppoint fluvellin (90%). The florasulam-MCPA treatment (not regis-tered for use on grasses grown for seed) provided adequate control (85%) and the addition of mesotrione to the florasulam-MCPA treatment slightly improved sharppoint fluvellin control and increased yellowcress control from 80% to 100%. (Data presented in Table 5.)
22
Table 5. Broadleaf weed control in tall fescue, Younger Farm, Albany, OR, 2010. _______________________________________________________________________________________________________________________________________________________________
Tall Sharppoint Annual Yellow- Ladino fescue fluvellin sowthistle cress clover Rate % injury --------------------- % control ------------------------ Treatment1,2 lb a.i./a ------------------------------ 7/19/2010--------------------------------- _______________________________________________________________________________________________________________________________________________________________
1. check 0 0 0 0 0 0 2. Mesotrione 0.094 0 45 0 100 58 3. 2,4-D-dicamba acid 0.525 0 45 100 13 100 4. tribenuron + 0.008 0 90 75 20 88 oxyfluorfen 0.047 5. florasulam-MCPA 0.315 0 85 90 80 90 6. Mesotrione + 0.094 0 58 95 100 98 2,4-D dicamba acid 0.525 7. Mesotrione 0.062 0 88 93 100 90 florasulam-MCPA 0.315 LSD 0.05 NS 14 13 21 9 _______________________________________________________________________________________________________________________________________________________________
1Treatments applied 5/27/10 to 3 leaf to 1 tiller tall fescue and 4 to 8 leaf sharppoint fluvellin. 2NIS added to all treatments at 0.25%.
In conclusion, spring plantings of tall fescue for seed produc-tion provide a favorable environment for sharppoint fluvellin due to wide row spacing and lack of competition. The use of tribenuron can provide adequate control of sharppoint fluvellin when combined with oxyfluorfen. While crop injury has been a concern with tribenuron treatments in the past, the benefits of the sharppoint fluvellin control to the tall fescue outweigh most crop injury concerns from the treatment. The HPPD enzyme inhibitor herbicides can also provide useful (70% +) control of this weed. The critical factor when using these products is application timing. Apply mesotrione when the sharppoint fluvellin is very small, at or before the 4 leaf stage. Crop safety appears very good with both mesotrione and pyrasul-fotole-bromoxynil. Currently, mesotrione is registered for use in tall fescue grown for seed and Bayer CropScience is pursu-ing a registration for pyrasulfotole-bromoxynil in grasses grown for seed.
References DiTomaso, J.M., E.A. Healy, 2007. Weeds of California and
Other Western States. University of California Agriculture and Natural Resources Publication 3488. pp 1460-1462.
Whitson, T.D., L.C. Burrill, S.A. Dewey, D.W. Cudney, B.E. Nelson, R.D. Lee, R. Parker, 1991. Weeds of the West. Western Society of Weed Science in cooperation with Western United States Land Grant Universities Cooperative Extension Services. pp 544-545.
23
.
EFFECTS OF LONGER TERM STORAGE ON SEED GERMINATION FROM GRASS SEED HARVESTED AT DIFFERENT SEED MOISTURE CONTENTS
T.B. Silberstein, M.E. Mellbye, T.G. Chastain and W.C. Young III
Seed moisture content is probably the best indicator of the physiological maturity in grass seed crops for determining when swathing (windrowing) is to be done for harvesting seed. Since grass seed crops do not pollinate and mature over a uni-form time period, there is a wide range of seed maturity within a crop stand. In order to optimize the time to swath grass seed crops, there is a balance between cutting too early and too late. Cutting too early at high moisture content shortens the seed fill period and can cause reduced seed size and increase the num-ber of immature seed. Cutting too late at low moisture content can decrease yield through losses due to seed shattering (Klein and Harmond, 1971; Andersen and Andersen, 1980). Both of these extremes can have an impact on seed quality as well as seed yield. Research was also done in the Willamette Valley of Oregon for tall fescue (Andrade et al., 1994) as well as peren-nial ryegrass, orchardgrass, and fine fescues (Klein and Har-mond, 1971).
Studies conducted between 2004 and 2008 provided updated recommendations on how wide a range of seed moisture the grass seed crops can be swathed at and still maintain maximum yields. These trials were designed to compare harvest at differ-ent seed moisture contents and verify recommendations previ-ously available. Results of these studies are reported in the Seed Production Research Report series (2004, 2005, 2007, and 2008) and brought together in the OSU Extension Publication EM 9012-E Using Seed Moisture as a Harvest Management Tool. In addition to determining the harvest seed moisture range, sub-samples of cleaned seed from some of these trials were put into storage to determine longer term effects on germination. These samples were stored for at least one year (depending on trial) and retested for germination.
Materials and Methods Seed samples from all plots in each of the trials listed in Table 1 had initial germination tests conducted in December following harvest (except the Aruba 2007 trials – no initial germination tests were done). Seed samples were stored in an office building where temperature ranged from 65-75º F for the duration of the study. Initial seed samples were sub-sampled and replications were bulked by treatment (for cost savings) for preliminary germination screening in December, 2009. Trials that had a range of germination close to 5% (2007 Aruba creeping red fescue – 4% and 2008 Manhattan perennial ryegass – 4.75%) were re-tested using all plots in the particular trial (4 replications and 3 treatments in a randomized complete block) to provide data for statistical analysis.
Table 1. Germination test dates. __________________________________________________________________________
Species Harvest Germination Variety year test date __________________________________________________________________________
----- (month/years) --- Tall fescue Avenger 2008 12/08 12/09 --- Tarheel II 2008 12/08 12/09 --- Perennial ryegrass Chaparral 2008 12/08 12/09 --- Caddieshack 2008 12/08 12/09 5/10 Chewings fescue Ambrose 2008 12/08 12/09 --- Creeping red fescue Aruba 2006 12/06 12/09 --- Aruba 2007 --- 12/09 5/10 Wendy Jean 2008 12/08 12/09 --- __________________________________________________________________________
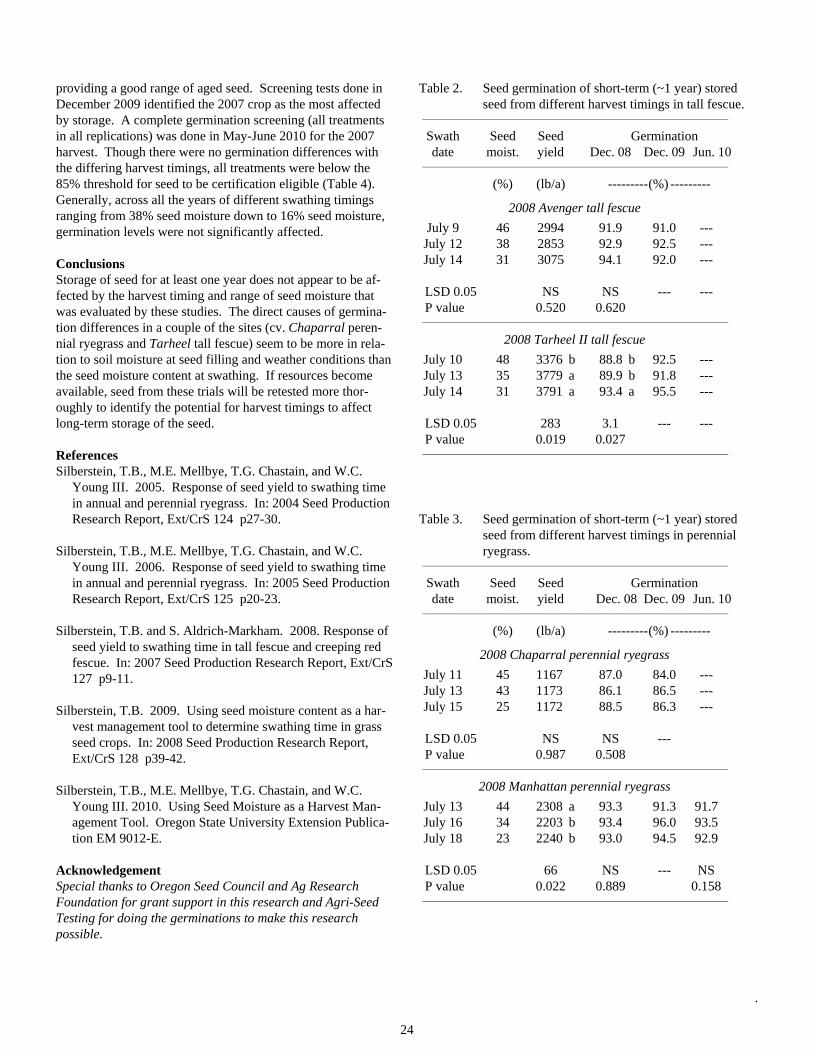
Results and Discussion Tall fescue Both sites retested for germination were within germination requirements (85%) at all harvest timings (Table 2). The ger-mination levels even improved at all harvest timings with seed from the cv. Tarheel site. There may have been some post har-vest dormancy still affecting the initial germinations following harvest. These data indicate that seed storage for an additional year did not negatively affect seed germination in tall fescue.
Perennial ryegrass Germination in the perennial ryegrass trials had a little more variability than other trials. The cv. Chaparral site started with lower germination values that were probably caused by mois-ture stress conditions during seed fill (Table 3). Initial retesting of the seed from this site indicated small differences in germination, but the earliest swathing time did drop below 85%. If funding becomes available further germination tests of this site would be warranted. The cv. Manhattan site still maintained germination levels above 90% and were above the minimum germination requirements (85%) for this certified seed.
Fine fescue Fine fescue seed was tested from 2006, 2007 and 2008
24
.
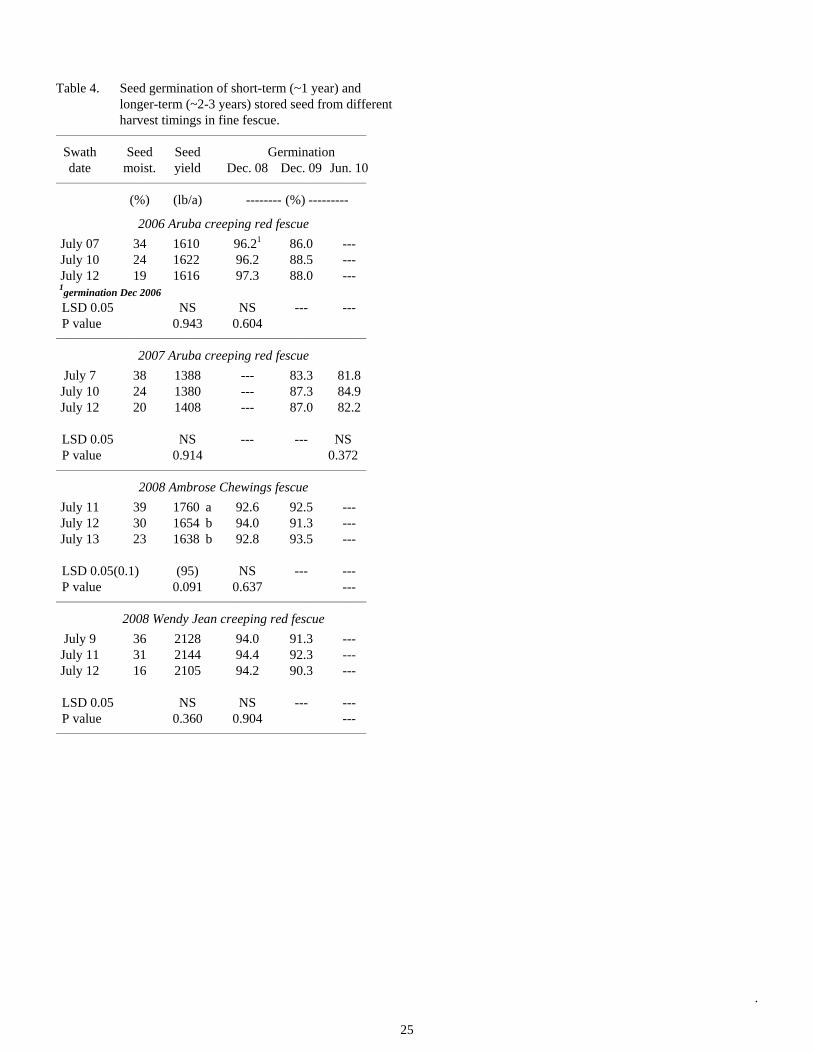
providing a good range of aged seed. Screening tests done in December 2009 identified the 2007 crop as the most affected by storage. A complete germination screening (all treatments in all replications) was done in May-June 2010 for the 2007 harvest. Though there were no germination differences with the differing harvest timings, all treatments were below the 85% threshold for seed to be certification eligible (Table 4). Generally, across all the years of different swathing timings ranging from 38% seed moisture down to 16% seed moisture, germination levels were not significantly affected.
Conclusions Storage of seed for at least one year does not appear to be af-fected by the harvest timing and range of seed moisture that was evaluated by these studies. The direct causes of germina-tion differences in a couple of the sites (cv. Chaparral peren-nial ryegrass and Tarheel tall fescue) seem to be more in rela-tion to soil moisture at seed filling and weather conditions than the seed moisture content at swathing. If resources become available, seed from these trials will be retested more thor-oughly to identify the potential for harvest timings to affect long-term storage of the seed.
References Silberstein, T.B., M.E. Mellbye, T.G. Chastain, and W.C.
Young III. 2005. Response of seed yield to swathing time in annual and perennial ryegrass. In: 2004 Seed Production Research Report, Ext/CrS 124 p27-30.
Silberstein, T.B., M.E. Mellbye, T.G. Chastain, and W.C. Young III. 2006. Response of seed yield to swathing time in annual and perennial ryegrass. In: 2005 Seed Production Research Report, Ext/CrS 125 p20-23.
Silberstein, T.B. and S. Aldrich-Markham. 2008. Response of seed yield to swathing time in tall fescue and creeping red fescue. In: 2007 Seed Production Research Report, Ext/CrS 127 p9-11.
Silberstein, T.B. 2009. Using seed moisture content as a har-vest management tool to determine swathing time in grass seed crops. In: 2008 Seed Production Research Report, Ext/CrS 128 p39-42.
Silberstein, T.B., M.E. Mellbye, T.G. Chastain, and W.C. Young III. 2010. Using Seed Moisture as a Harvest Man-agement Tool. Oregon State University Extension Publica-tion EM 9012-E.
Acknowledgement Special thanks to Oregon Seed Council and Ag Research Foundation for grant support in this research and Agri-Seed Testing for doing the germinations to make this research possible.
Table 2. Seed germination of short-term (~1 year) stored seed from different harvest timings in tall fescue.
_______________________________________________________________________
Swath Seed Seed Germination date moist. yield Dec. 08 Dec. 09 Jun. 10 _______________________________________________________________________
(%) (lb/a) ---------(%) ---------
2008 Avenger tall fescue
July 9 46 2994 91.9 91.0 --- July 12 38 2853 92.9 92.5 --- July 14 31 3075 94.1 92.0 --- LSD 0.05 NS NS --- --- P value 0.520 0.620 _______________________________________________________________________
2008 Tarheel II tall fescue
July 10 48 3376 b 88.8 b 92.5 --- July 13 35 3779 a 89.9 b 91.8 --- July 14 31 3791 a 93.4 a 95.5 --- LSD 0.05 283 3.1 --- --- P value 0.019 0.027 _______________________________________________________________________
Table 3. Seed germination of short-term (~1 year) stored
seed from different harvest timings in perennial ryegrass.
_______________________________________________________________________
Swath Seed Seed Germination date moist. yield Dec. 08 Dec. 09 Jun. 10 _______________________________________________________________________
(%) (lb/a) ---------(%) ---------
2008 Chaparral perennial ryegrass
July 11 45 1167 87.0 84.0 --- July 13 43 1173 86.1 86.5 --- July 15 25 1172 88.5 86.3 --- LSD 0.05 NS NS --- P value 0.987 0.508 _______________________________________________________________________
2008 Manhattan perennial ryegrass
July 13 44 2308 a 93.3 91.3 91.7 July 16 34 2203 b 93.4 96.0 93.5 July 18 23 2240 b 93.0 94.5 92.9 LSD 0.05 66 NS --- NS P value 0.022 0.889 0.158 _______________________________________________________________________
25
.
Table 4. Seed germination of short-term (~1 year) and longer-term (~2-3 years) stored seed from different harvest timings in fine fescue.
________________________________________________________________________
Swath Seed Seed Germination date moist. yield Dec. 08 Dec. 09 Jun. 10 ________________________________________________________________________
(%) (lb/a) -------- (%) ---------
2006 Aruba creeping red fescue
July 07 34 1610 96.21 86.0 --- July 10 24 1622 96.2 88.5 --- July 12 19 1616 97.3 88.0 --- 1germination Dec 2006 LSD 0.05 NS NS --- --- P value 0.943 0.604 ________________________________________________________________________
2007 Aruba creeping red fescue
July 7 38 1388 --- 83.3 81.8 July 10 24 1380 --- 87.3 84.9 July 12 20 1408 --- 87.0 82.2 LSD 0.05 NS --- --- NS P value 0.914 0.372 ________________________________________________________________________
2008 Ambrose Chewings fescue
July 11 39 1760 a 92.6 92.5 --- July 12 30 1654 b 94.0 91.3 --- July 13 23 1638 b 92.8 93.5 --- LSD 0.05(0.1) (95) NS --- --- P value 0.091 0.637 --- ________________________________________________________________________
2008 Wendy Jean creeping red fescue
July 9 36 2128 94.0 91.3 --- July 11 31 2144 94.4 92.3 --- July 12 16 2105 94.2 90.3 --- LSD 0.05 NS NS --- --- P value 0.360 0.904 --- ________________________________________________________________________

26
EVALUATION OF CHEMICAL AND MECHANICAL METHODS FOR MAINTAINING STAND PRODUCTIVITY IN FINE FESCUE SEED CROP PRODUCTION SYSTEMS IN THE
ABSENCE OF OPEN FIELD BURNING, 2010
T.B. Silberstein, T.G. Chastain and W.C. Young III
There are no effective, non-thermal post-harvest residue man-agement practices available that maintain an economic yield over the life of the stand (5 years +) in fine fescue seed pro-duction for western Oregon. Seed yields typically decline fol-lowing the first harvest in the absence of field burning. Yield reductions ranged from 10 to more than 50% when non-thermal treatments such as baling and flail chopping the stubble were compared with burning (Young et al., 1998, Zapiola et al., 2006). Aggressive stubble management improved yields over baling alone, but was still lower yielding than field burning and not an economic substitute given the added cost of baling and flail chopping.
The primary obstacle in fine fescues and Kentucky bluegrass is the need to expose the lower crown area at the soil surface (Meints et al., 2001, Chastain et al., 1997) and to minimize the amount of crop residue remaining. Research has been con-ducted on both fine fescues and Kentucky bluegrass in a effort to determine a way to substitute field burning with a nonther-mal mechanical method. Vigorous fall tillers that are the major contributor to seed yield originate from the crowns of well es-tablished plants (Canode and Law, 1979). In addition to the need for crown tillers to predominate, the creeping habit of red fescue also can cause excessive crowding in the stand and limit the size and capability of the new tillers. If stand conditions are crowded in the fall, then fewer tillers are sufficiently ma-ture to be vernalized, a process required for flowering.
With these two factors in mind, residue management and stand crowding, this research will determine if there is a lower cost way of encouraging strong tiller development in the fall using two different strategies:
1) Row spraying technology (Young, et al., 1996) to thin and maintain defined rows.
2) No-till row cleaners to expose row strips in regular inter-vals. Crown exposure and improved light penetration should increase growth in exposed rows and cover areas between the rows with a straw mulch.
Procedures Trials were established in cooperating grower fields. Four fields received treatments that included row-spray treatments and/or mechanical row cleaner (thatching) treatment. Two fields were younger stands (2nd and 3rd year crop) and two fields were older (5th and 6th year crop). Three of the fields had replicated trials and one had strips of different treatments ap-plied. All sites were either baled and flail chopped or had the full straw load flail chopped back on the stand. Row-spray and
row- cleaner treatments were applied in the late fall using the equipment purchased with funds granted for this project. A tractor from one of the farms was used to operate the equip-ment. One younger and one older stand also had a spring ap-plied row-spray treatments. All plots were field scale ~25-50 ft. (wide) by ~300 ft. (long), which allowed for standard har-vest using grower equipment.
In addition to harvesting for seed yield, foot-row samples were taken to determine fertile tiller number, height of crop at ma-turity, and specific dry weight (dry wt/tiller).
Results Site 1 – Lustrous creeping red fescue, Doerfler Rd. This site is an older stand of creeping red fescue that was de-clining in yield. Treated areas all had a full straw load flail chopped and left in the field. The disk/re-grow treatment was done by the grower to renovate the stand. This strip was disked after harvest several times and left to re-grow. The untreated control only had the full straw load left on the field. The thatch treatment was applied by going over the area 4-5 times with the row cleaner in an attempt to cut out portions of the stand. The fall row spray (glyphosate at 2% solution) was applied in No-vember with nozzles set to sprray a 6-inch wide band on 12 inch centers in an attempt to take out about 1/2 - 2/3 of the stand. The spring row spray was applied in mid-March at the onset of rapid re-growth.
Seed yields were dramatically lower in the spring row-spray treatment (Table 1). There were also fewer and shorter fertile tillers in this treatment (Table 6), which may have caused the lower yields. The effective spray out was about 75% of the stand and it was unable to recover. All other treatments were comparable in yield. Regrowth on the spring row-spray was very good after harvest, as the stand looked healthy with strong rows formed. These strips will be harvested in 2011 to deter-mine the long-term effects on using row-spraying to renovate the stand.
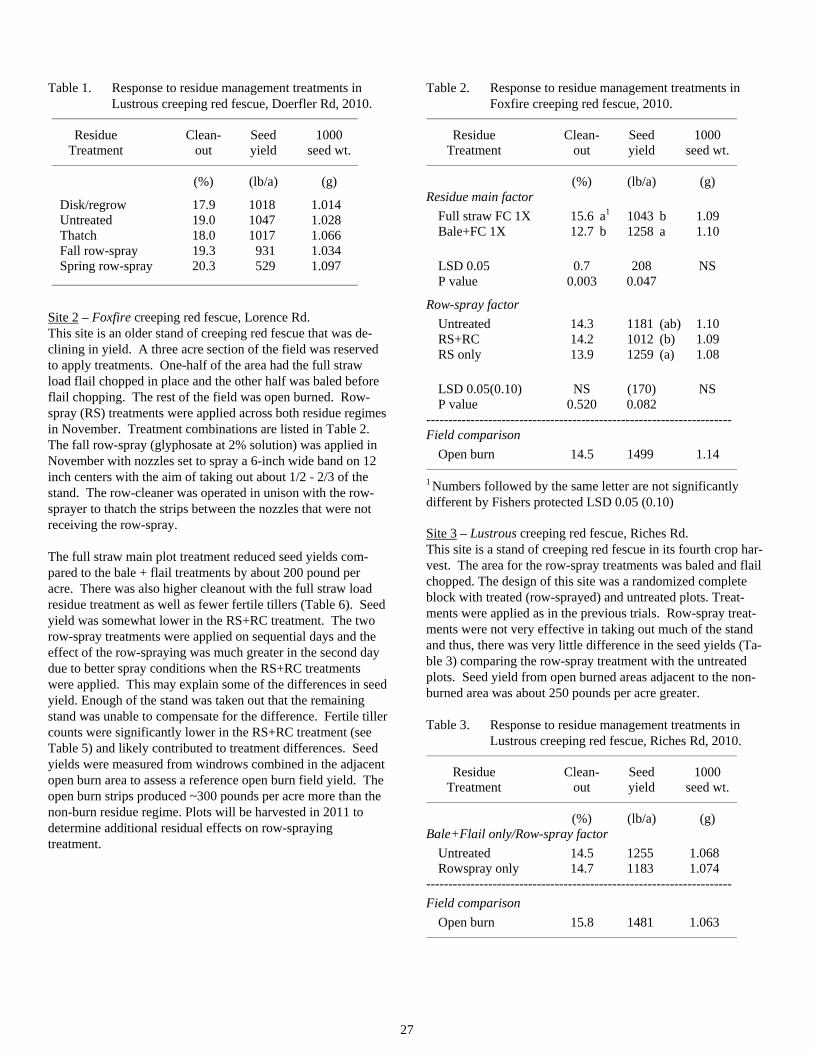
27
Table 1. Response to residue management treatments in Lustrous creeping red fescue, Doerfler Rd, 2010.
_______________________________________________________________________
Residue Clean- Seed 1000 Treatment out yield seed wt. _______________________________________________________________________
(%) (lb/a) (g)
Disk/regrow 17.9 1018 1.014 Untreated 19.0 1047 1.028 Thatch 18.0 1017 1.066 Fall row-spray 19.3 931 1.034 Spring row-spray 20.3 529 1.097 _______________________________________________________________________
Site 2 – Foxfire creeping red fescue, Lorence Rd. This site is an older stand of creeping red fescue that was de-clining in yield. A three acre section of the field was reserved to apply treatments. One-half of the area had the full straw load flail chopped in place and the other half was baled before flail chopping. The rest of the field was open burned. Row-spray (RS) treatments were applied across both residue regimes in November. Treatment combinations are listed in Table 2. The fall row-spray (glyphosate at 2% solution) was applied in November with nozzles set to spray a 6-inch wide band on 12 inch centers with the aim of taking out about 1/2 - 2/3 of the stand. The row-cleaner was operated in unison with the row-sprayer to thatch the strips between the nozzles that were not receiving the row-spray.
The full straw main plot treatment reduced seed yields com-pared to the bale + flail treatments by about 200 pound per acre. There was also higher cleanout with the full straw load residue treatment as well as fewer fertile tillers (Table 6). Seed yield was somewhat lower in the RS+RC treatment. The two row-spray treatments were applied on sequential days and the effect of the row-spraying was much greater in the second day due to better spray conditions when the RS+RC treatments were applied. This may explain some of the differences in seed yield. Enough of the stand was taken out that the remaining stand was unable to compensate for the difference. Fertile tiller counts were significantly lower in the RS+RC treatment (see Table 5) and likely contributed to treatment differences. Seed yields were measured from windrows combined in the adjacent open burn area to assess a reference open burn field yield. The open burn strips produced ~300 pounds per acre more than the non-burn residue regime. Plots will be harvested in 2011 to determine additional residual effects on row-spraying treatment.
Table 2. Response to residue management treatments in Foxfire creeping red fescue, 2010.
________________________________________________________________________
Residue Clean- Seed 1000 Treatment out yield seed wt. ________________________________________________________________________
(%) (lb/a) (g) Residue main factor
Full straw FC 1X 15.6 a1 1043 b 1.09 Bale+FC 1X 12.7 b 1258 a 1.10
LSD 0.05 0.7 208 NS P value 0.003 0.047
Row-spray factor
Untreated 14.3 1181 (ab) 1.10 RS+RC 14.2 1012 (b) 1.09 RS only 13.9 1259 (a) 1.08
LSD 0.05(0.10) NS (170) NS P value 0.520 0.082 --------------------------------------------------------------------- Field comparison
Open burn 14.5 1499 1.14 ________________________________________________________________________
1 Numbers followed by the same letter are not significantly different by Fishers protected LSD 0.05 (0.10)
Site 3 – Lustrous creeping red fescue, Riches Rd. This site is a stand of creeping red fescue in its fourth crop har-vest. The area for the row-spray treatments was baled and flail chopped. The design of this site was a randomized complete block with treated (row-sprayed) and untreated plots. Treat-ments were applied as in the previous trials. Row-spray treat-ments were not very effective in taking out much of the stand and thus, there was very little difference in the seed yields (Ta-ble 3) comparing the row-spray treatment with the untreated plots. Seed yield from open burned areas adjacent to the non-burned area was about 250 pounds per acre greater.
Table 3. Response to residue management treatments in Lustrous creeping red fescue, Riches Rd, 2010.
________________________________________________________________________
Residue Clean- Seed 1000 Treatment out yield seed wt. ________________________________________________________________________
(%) (lb/a) (g) Bale+Flail only/Row-spray factor
Untreated 14.5 1255 1.068 Rowspray only 14.7 1183 1.074 ---------------------------------------------------------------------
Field comparison
Open burn 15.8 1481 1.063 ________________________________________________________________________
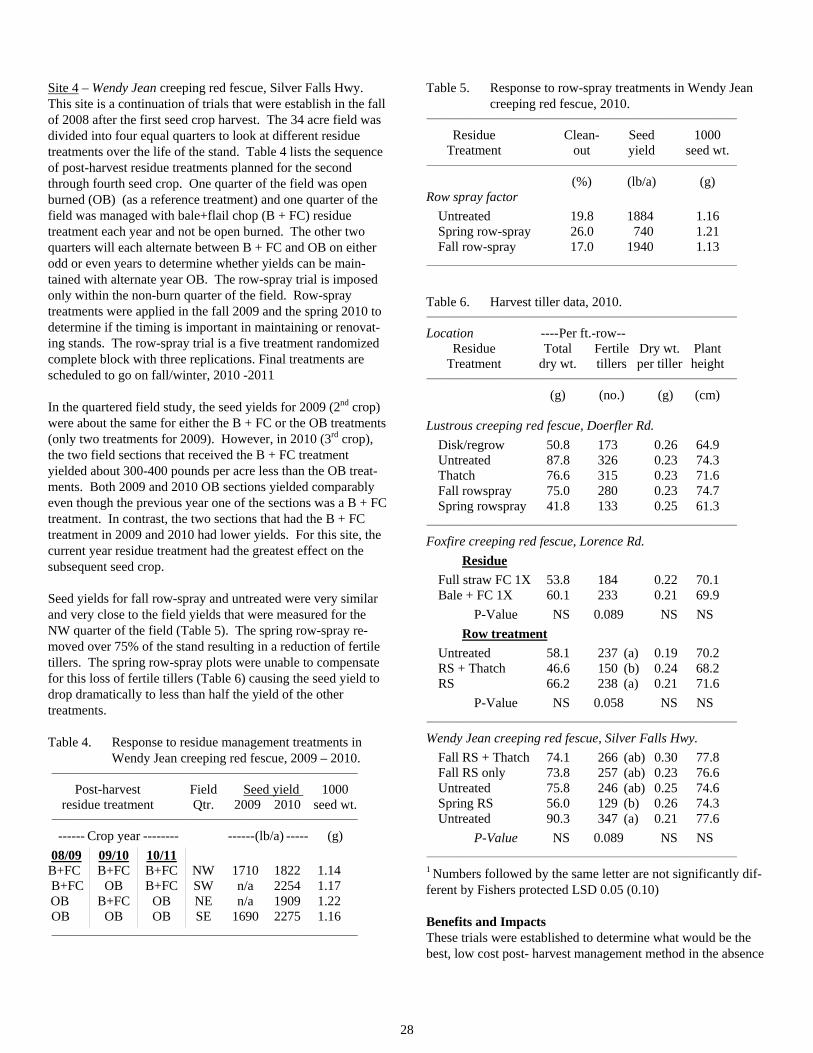
28
Site 4 – Wendy Jean creeping red fescue, Silver Falls Hwy. This site is a continuation of trials that were establish in the fall of 2008 after the first seed crop harvest. The 34 acre field was divided into four equal quarters to look at different residue treatments over the life of the stand. Table 4 lists the sequence of post-harvest residue treatments planned for the second through fourth seed crop. One quarter of the field was open burned (OB) (as a reference treatment) and one quarter of the field was managed with bale+flail chop (B + FC) residue treatment each year and not be open burned. The other two quarters will each alternate between B + FC and OB on either odd or even years to determine whether yields can be main-tained with alternate year OB. The row-spray trial is imposed only within the non-burn quarter of the field. Row-spray treatments were applied in the fall 2009 and the spring 2010 to determine if the timing is important in maintaining or renovat-ing stands. The row-spray trial is a five treatment randomized complete block with three replications. Final treatments are scheduled to go on fall/winter, 2010 -2011
In the quartered field study, the seed yields for 2009 (2nd crop) were about the same for either the B + FC or the OB treatments (only two treatments for 2009). However, in 2010 (3rd crop), the two field sections that received the B + FC treatment yielded about 300-400 pounds per acre less than the OB treat-ments. Both 2009 and 2010 OB sections yielded comparably even though the previous year one of the sections was a B + FC treatment. In contrast, the two sections that had the B + FC treatment in 2009 and 2010 had lower yields. For this site, the current year residue treatment had the greatest effect on the subsequent seed crop.
Seed yields for fall row-spray and untreated were very similar and very close to the field yields that were measured for the NW quarter of the field (Table 5). The spring row-spray re-moved over 75% of the stand resulting in a reduction of fertile tillers. The spring row-spray plots were unable to compensate for this loss of fertile tillers (Table 6) causing the seed yield to drop dramatically to less than half the yield of the other treatments.
Table 4. Response to residue management treatments in Wendy Jean creeping red fescue, 2009 – 2010.
_______________________________________________________________________
Post-harvest Field Seed yield 1000 residue treatment Qtr. 2009 2010 seed wt. _______________________________________________________________________
------ Crop year -------- ------(lb/a) ----- (g)
08/09 09/10 10/11 B+FC B+FC B+FC NW 1710 1822 1.14 B+FC OB B+FC SW n/a 2254 1.17 OB B+FC OB NE n/a 1909 1.22 OB OB OB SE 1690 2275 1.16 _______________________________________________________________________
Table 5. Response to row-spray treatments in Wendy Jean creeping red fescue, 2010.
________________________________________________________________________
Residue Clean- Seed 1000 Treatment out yield seed wt. ________________________________________________________________________
(%) (lb/a) (g) Row spray factor
Untreated 19.8 1884 1.16 Spring row-spray 26.0 740 1.21 Fall row-spray 17.0 1940 1.13 ________________________________________________________________________
Table 6. Harvest tiller data, 2010. ________________________________________________________________________
Location ----Per ft.-row-- Residue Total Fertile Dry wt. Plant Treatment dry wt. tillers per tiller height ________________________________________________________________________
(g) (no.) (g) (cm) Lustrous creeping red fescue, Doerfler Rd.
Disk/regrow 50.8 173 0.26 64.9 Untreated 87.8 326 0.23 74.3 Thatch 76.6 315 0.23 71.6 Fall rowspray 75.0 280 0.23 74.7 Spring rowspray 41.8 133 0.25 61.3 ________________________________________________________________________
Foxfire creeping red fescue, Lorence Rd.
Residue
Full straw FC 1X 53.8 184 0.22 70.1 Bale + FC 1X 60.1 233 0.21 69.9
P-Value NS 0.089 NS NS
Row treatment
Untreated 58.1 237 (a) 0.19 70.2 RS + Thatch 46.6 150 (b) 0.24 68.2 RS 66.2 238 (a) 0.21 71.6
P-Value NS 0.058 NS NS ________________________________________________________________________
Wendy Jean creeping red fescue, Silver Falls Hwy.
Fall RS + Thatch 74.1 266 (ab) 0.30 77.8 Fall RS only 73.8 257 (ab) 0.23 76.6 Untreated 75.8 246 (ab) 0.25 74.6 Spring RS 56.0 129 (b) 0.26 74.3 Untreated 90.3 347 (a) 0.21 77.6
P-Value NS 0.089 NS NS ________________________________________________________________________
1 Numbers followed by the same letter are not significantly dif-ferent by Fishers protected LSD 0.05 (0.10)
Benefits and Impacts These trials were established to determine what would be the best, low cost post- harvest management method in the absence
29
of burning, so open burn treatments were not incorporated into the primary treatment areas. Row-spraying is effective at re-ducing the stand and taking out excessive growth. A major finding in the 2010 data is that, in most cases, spraying out at least half of the stand did not generally reduce yields (except the RS+RC treatment at Site 2). The plants were able to com-pensate for this loss in stand. Spring row-spraying generally had a negative effect on the current year crop, but the same treatments also have vigorous growth in the subsequent fall. The thatch treatment needs to be much more aggressive in fu-ture to remove a larger portion of the stand than was done in this trial. These plots will be followed to harvest in 2011 to determine if there is a carryover in the improvement of stand productivity. At Site 4 there appears to be less effect on seed yield in the second year (early stand life) without burning but in the third crop, yields were declining compared to the open burn treatment. This would indicate that if a grower would want to reduce the number of fields that will be open burned, it may be best to focus open burns on older stands and try alter-nate treatments in the second year to keep the stand productive. This strategy was evident at Site 4 where there was a bale + flail chop in 2008 followed by an open burn in 2009. This area did as well as the continuous open burn treatments. In contrast the site that was open burned in 2008 then bale+flail in 2009 had a drop off in yield after one year on no-burning. Three of these sites will be followed through the 2011 harvest.
Canode, C.L. and A.G. Law. 1979. Thatch and tiller size as influenced by residue management in Kentucky bluegrass seed production. Agron. J. 71:289-291.
Chastain, T.G., W.C. Young III, G.L. Kiemnec, C.J. Garbacik, T.B.Silberstein, G.A.Gingrich, and G.H. Cook. 1997. Stubble management for creeping red fescue and Kentucky bluegrass seed crops. In W.C. Young (ed) Seed production research at Oregon State University. Dept of Crop and Soil Sci. Ext/Crs 110. Oregon State Univ. Corvallis, OR.
Meints, Paul D., Thomas G. Chastain, William C. Young III, Gary M. Banowetz and Carol J. Garbacik. 2001. Stubble management effects on three creeping red fescue cultivars grown for seed production. Agron. J. 93:1276-1281.
Young, W.C. III, T.G. Chastain, M.E.Mellbye, T.B.Silberstein and C.J. Garbacik. 1996. Establishment of rows in volun-teer annual ryegrass seed crops using a shielded sprayer. In W.C. Young (ed) Seed production research at Oregon State University. Dept of Crop and Soil Sci. Ext/Crs 110. Oregon State Univ. Corvallis, OR.
Young, William C., III, Gale A. Gingrich, Thomas B. Silber-stein, and Bryon M. Quebbeman. 1998. Post-harvest resi-due management of creeping red and chewing fescue seed crops. Agron. J. 90:69-73.
Zapiola, Maria L., Thomas G. Chastain, Carol J. Garbacik, Thomas B. Silberstein, and William C. Young III. 2006. Trinexapac-ethyl and open field burning maximize seed yield in creeping red fescue. Argon. J. 98:1427-1434.
Acknowledgements Special thanks to Oregon Seed Council and Ag Research Foundation for grant support in this research, and to cooper-ating fine fescue seed growers to make this research possible.
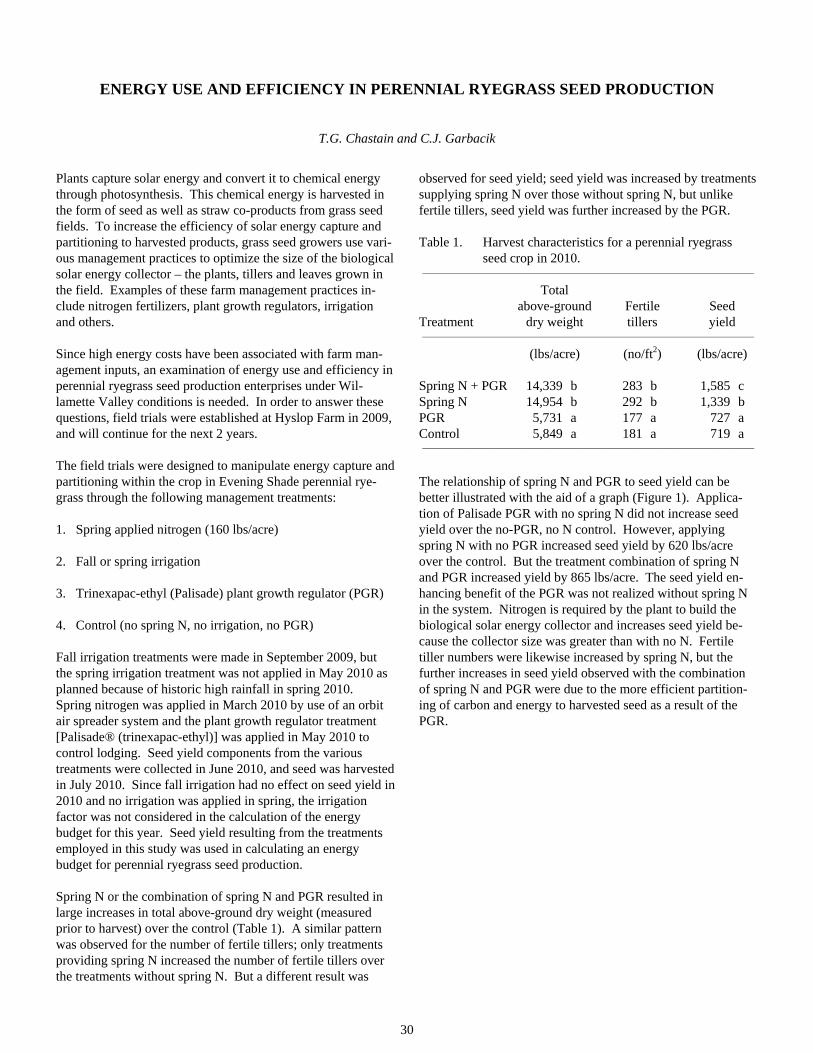
30
ENERGY USE AND EFFICIENCY IN PERENNIAL RYEGRASS SEED PRODUCTION
T.G. Chastain and C.J. Garbacik
Plants capture solar energy and convert it to chemical energy through photosynthesis. This chemical energy is harvested in the form of seed as well as straw co-products from grass seed fields. To increase the efficiency of solar energy capture and partitioning to harvested products, grass seed growers use vari-ous management practices to optimize the size of the biological solar energy collector – the plants, tillers and leaves grown in the field. Examples of these farm management practices in-clude nitrogen fertilizers, plant growth regulators, irrigation and others.
Since high energy costs have been associated with farm man-agement inputs, an examination of energy use and efficiency in perennial ryegrass seed production enterprises under Wil-lamette Valley conditions is needed. In order to answer these questions, field trials were established at Hyslop Farm in 2009, and will continue for the next 2 years.
The field trials were designed to manipulate energy capture and partitioning within the crop in Evening Shade perennial rye-grass through the following management treatments:
1. Spring applied nitrogen (160 lbs/acre)
2. Fall or spring irrigation
3. Trinexapac-ethyl (Palisade) plant growth regulator (PGR)
4. Control (no spring N, no irrigation, no PGR)
Fall irrigation treatments were made in September 2009, but the spring irrigation treatment was not applied in May 2010 as planned because of historic high rainfall in spring 2010. Spring nitrogen was applied in March 2010 by use of an orbit air spreader system and the plant growth regulator treatment [Palisade® (trinexapac-ethyl)] was applied in May 2010 to control lodging. Seed yield components from the various treatments were collected in June 2010, and seed was harvested in July 2010. Since fall irrigation had no effect on seed yield in 2010 and no irrigation was applied in spring, the irrigation factor was not considered in the calculation of the energy budget for this year. Seed yield resulting from the treatments employed in this study was used in calculating an energy budget for perennial ryegrass seed production.
Spring N or the combination of spring N and PGR resulted in large increases in total above-ground dry weight (measured prior to harvest) over the control (Table 1). A similar pattern was observed for the number of fertile tillers; only treatments providing spring N increased the number of fertile tillers over the treatments without spring N. But a different result was
observed for seed yield; seed yield was increased by treatments supplying spring N over those without spring N, but unlike fertile tillers, seed yield was further increased by the PGR.
Table 1. Harvest characteristics for a perennial ryegrass seed crop in 2010.
_____________________________________________________________________________
Total above-ground Fertile Seed Treatment dry weight tillers yield _____________________________________________________________________________
(lbs/acre) (no/ft2) (lbs/acre) Spring N + PGR 14,339 b 283 b 1,585 c Spring N 14,954 b 292 b 1,339 b PGR 5,731 a 177 a 727 a Control 5,849 a 181 a 719 a _____________________________________________________________________________
The relationship of spring N and PGR to seed yield can be better illustrated with the aid of a graph (Figure 1). Applica-tion of Palisade PGR with no spring N did not increase seed yield over the no-PGR, no N control. However, applying spring N with no PGR increased seed yield by 620 lbs/acre over the control. But the treatment combination of spring N and PGR increased yield by 865 lbs/acre. The seed yield en-hancing benefit of the PGR was not realized without spring N in the system. Nitrogen is required by the plant to build the biological solar energy collector and increases seed yield be-cause the collector size was greater than with no N. Fertile tiller numbers were likewise increased by spring N, but the further increases in seed yield observed with the combination of spring N and PGR were due to the more efficient partition-ing of carbon and energy to harvested seed as a result of the PGR.
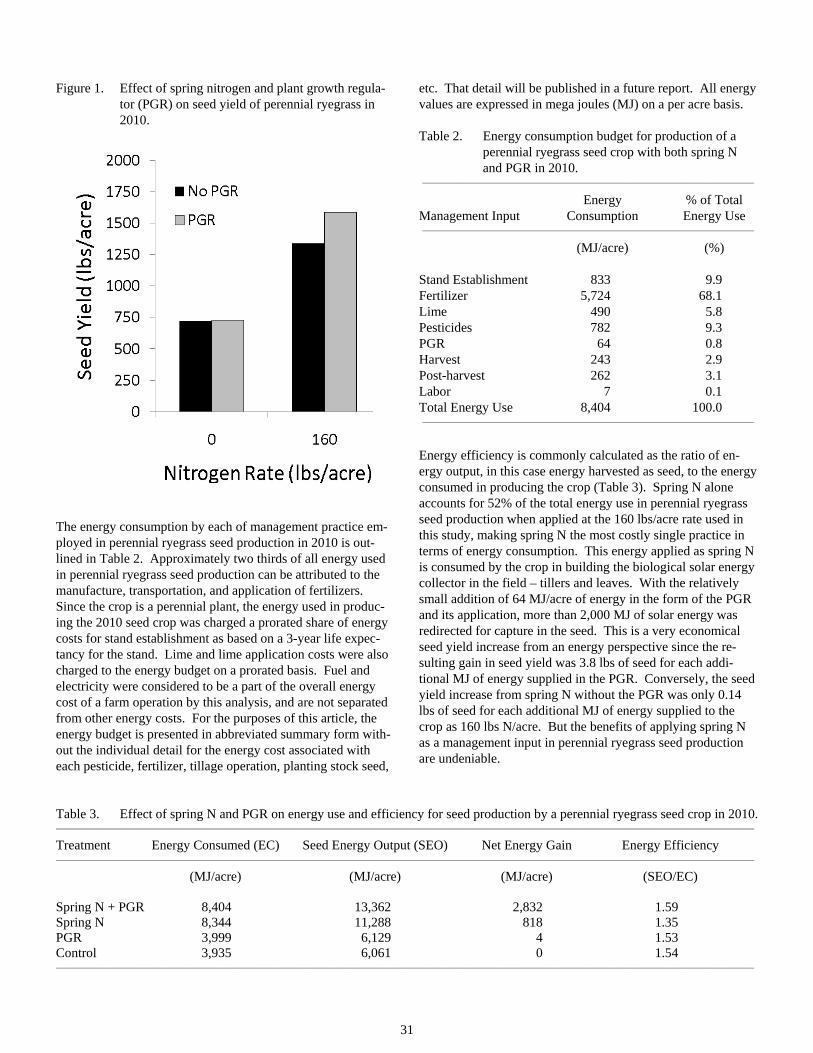
31
Figure 1. Effect of spring nitrogen and plant growth regula-tor (PGR) on seed yield of perennial ryegrass in 2010.
The energy consumption by each of management practice em-ployed in perennial ryegrass seed production in 2010 is out-lined in Table 2. Approximately two thirds of all energy used in perennial ryegrass seed production can be attributed to the manufacture, transportation, and application of fertilizers. Since the crop is a perennial plant, the energy used in produc-ing the 2010 seed crop was charged a prorated share of energy costs for stand establishment as based on a 3-year life expec-tancy for the stand. Lime and lime application costs were also charged to the energy budget on a prorated basis. Fuel and electricity were considered to be a part of the overall energy cost of a farm operation by this analysis, and are not separated from other energy costs. For the purposes of this article, the energy budget is presented in abbreviated summary form with-out the individual detail for the energy cost associated with each pesticide, fertilizer, tillage operation, planting stock seed,
etc. That detail will be published in a future report. All energy values are expressed in mega joules (MJ) on a per acre basis.
Table 2. Energy consumption budget for production of a perennial ryegrass seed crop with both spring N and PGR in 2010.
_____________________________________________________________________________
Energy % of Total Management Input Consumption Energy Use _____________________________________________________________________________
(MJ/acre) (%) Stand Establishment 833 9.9 Fertilizer 5,724 68.1 Lime 490 5.8 Pesticides 782 9.3 PGR 64 0.8 Harvest 243 2.9 Post-harvest 262 3.1 Labor 7 0.1 Total Energy Use 8,404 100.0 _____________________________________________________________________________
Energy efficiency is commonly calculated as the ratio of en-ergy output, in this case energy harvested as seed, to the energy consumed in producing the crop (Table 3). Spring N alone accounts for 52% of the total energy use in perennial ryegrass seed production when applied at the 160 lbs/acre rate used in this study, making spring N the most costly single practice in terms of energy consumption. This energy applied as spring N is consumed by the crop in building the biological solar energy collector in the field – tillers and leaves. With the relatively small addition of 64 MJ/acre of energy in the form of the PGR and its application, more than 2,000 MJ of solar energy was redirected for capture in the seed. This is a very economical seed yield increase from an energy perspective since the re-sulting gain in seed yield was 3.8 lbs of seed for each addi-tional MJ of energy supplied in the PGR. Conversely, the seed yield increase from spring N without the PGR was only 0.14 lbs of seed for each additional MJ of energy supplied to the crop as 160 lbs N/acre. But the benefits of applying spring N as a management input in perennial ryegrass seed production are undeniable.
Table 3. Effect of spring N and PGR on energy use and efficiency for seed production by a perennial ryegrass seed crop in 2010. __________________________________________________________________________________________________________________________________________________________________
Treatment Energy Consumed (EC) Seed Energy Output (SEO) Net Energy Gain Energy Efficiency __________________________________________________________________________________________________________________________________________________________________
(MJ/acre) (MJ/acre) (MJ/acre) (SEO/EC) Spring N + PGR 8,404 13,362 2,832 1.59 Spring N 8,344 11,288 818 1.35 PGR 3,999 6,129 4 1.53 Control 3,935 6,061 0 1.54 __________________________________________________________________________________________________________________________________________________________________

32
Perennial ryegrass is an energy efficient crop even if the straw co-product is not considered. From the results of this study, the calculated energy efficiency of seed harvested from peren-nial ryegrass ranged from 1.35 to 1.59. In other words, the harvest of perennial ryegrass seed produced 35% to 59% more energy than it consumed in production of the crop. The net gain in energy by the crop was of course, the result of captured solar energy embodied in the harvested seed. This return on energy investment in perennial ryegrass seed production is comparable to corn grown in the mid-west at 1.67.
When energy from the straw co-product is included along with seed in the calculation of energy efficiency, the values for per-
ennial ryegrass seed crops climbs to ratios ranging from 6.19 to 7.17 (Table 4). The energy captured by the crop and embodied in the straw can be harvested and removed from the field for the production of biofuels or to be consumed in livestock to create meat or milk. The straw energy can also be returned to the soil as chopped straw and the subsequently released nutri-ents that can be utilized by the plant in the production of future seed crops.
The energy use and efficiency values will be further refined with additional data to be presented in future reports.
Table 4. Effect of spring N and PGR on energy use and efficiency for seed and straw co-product produced by a perennial rye-
grass seed crop in 2010. __________________________________________________________________________________________________________________________________________________________________
Seed and Straw Treatment Energy Consumed (EC) Energy Output (StEO) Net Energy Gain Energy Efficiency __________________________________________________________________________________________________________________________________________________________________
(MJ/acre) (MJ/acre) (MJ/acre) (StEO/EC) Spring N + PGR 8,404 59,961 30,420 7.13 Spring N 8,344 59,888 30,407 7.17 PGR 3,999 24,751 -385 6.19 Control 3,935 25,072 0 6.37 __________________________________________________________________________________________________________________________________________________________________
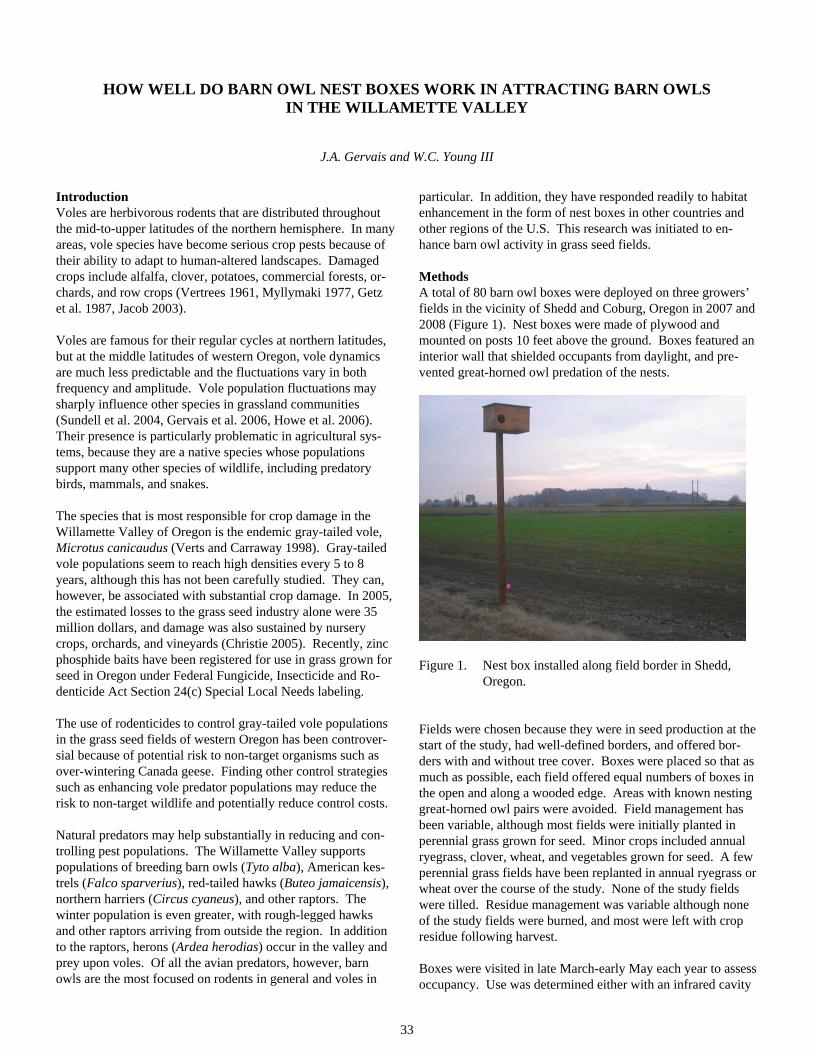
33
HOW WELL DO BARN OWL NEST BOXES WORK IN ATTRACTING BARN OWLS IN THE WILLAMETTE VALLEY
J.A. Gervais and W.C. Young III
Introduction Voles are herbivorous rodents that are distributed throughout the mid-to-upper latitudes of the northern hemisphere. In many areas, vole species have become serious crop pests because of their ability to adapt to human-altered landscapes. Damaged crops include alfalfa, clover, potatoes, commercial forests, or-chards, and row crops (Vertrees 1961, Myllymaki 1977, Getz et al. 1987, Jacob 2003).
Voles are famous for their regular cycles at northern latitudes, but at the middle latitudes of western Oregon, vole dynamics are much less predictable and the fluctuations vary in both frequency and amplitude. Vole population fluctuations may sharply influence other species in grassland communities (Sundell et al. 2004, Gervais et al. 2006, Howe et al. 2006). Their presence is particularly problematic in agricultural sys-tems, because they are a native species whose populations support many other species of wildlife, including predatory birds, mammals, and snakes.
The species that is most responsible for crop damage in the Willamette Valley of Oregon is the endemic gray-tailed vole, Microtus canicaudus (Verts and Carraway 1998). Gray-tailed vole populations seem to reach high densities every 5 to 8 years, although this has not been carefully studied. They can, however, be associated with substantial crop damage. In 2005, the estimated losses to the grass seed industry alone were 35 million dollars, and damage was also sustained by nursery crops, orchards, and vineyards (Christie 2005). Recently, zinc phosphide baits have been registered for use in grass grown for seed in Oregon under Federal Fungicide, Insecticide and Ro-denticide Act Section 24(c) Special Local Needs labeling.
The use of rodenticides to control gray-tailed vole populations in the grass seed fields of western Oregon has been controver-sial because of potential risk to non-target organisms such as over-wintering Canada geese. Finding other control strategies such as enhancing vole predator populations may reduce the risk to non-target wildlife and potentially reduce control costs.
Natural predators may help substantially in reducing and con-trolling pest populations. The Willamette Valley supports populations of breeding barn owls (Tyto alba), American kes-trels (Falco sparverius), red-tailed hawks (Buteo jamaicensis), northern harriers (Circus cyaneus), and other raptors. The winter population is even greater, with rough-legged hawks and other raptors arriving from outside the region. In addition to the raptors, herons (Ardea herodias) occur in the valley and prey upon voles. Of all the avian predators, however, barn owls are the most focused on rodents in general and voles in
particular. In addition, they have responded readily to habitat enhancement in the form of nest boxes in other countries and other regions of the U.S. This research was initiated to en-hance barn owl activity in grass seed fields.
Methods A total of 80 barn owl boxes were deployed on three growers’ fields in the vicinity of Shedd and Coburg, Oregon in 2007 and 2008 (Figure 1). Nest boxes were made of plywood and mounted on posts 10 feet above the ground. Boxes featured an interior wall that shielded occupants from daylight, and pre-vented great-horned owl predation of the nests.
Figure 1. Nest box installed along field border in Shedd, Oregon.
Fields were chosen because they were in seed production at the start of the study, had well-defined borders, and offered bor-ders with and without tree cover. Boxes were placed so that as much as possible, each field offered equal numbers of boxes in the open and along a wooded edge. Areas with known nesting great-horned owl pairs were avoided. Field management has been variable, although most fields were initially planted in perennial grass grown for seed. Minor crops included annual ryegrass, clover, wheat, and vegetables grown for seed. A few perennial grass fields have been replanted in annual ryegrass or wheat over the course of the study. None of the study fields were tilled. Residue management was variable although none of the study fields were burned, and most were left with crop residue following harvest.
Boxes were visited in late March-early May each year to assess occupancy. Use was determined either with an infrared cavity
34
probe or by opening the box briefly to determine contents. Boxes were also visited in December-February of each year, for maintenance and clean-out. One box post was broken by a tractor boom and not replaced, but all other boxes either re-mained erect or were reinstalled if damaged by field operations or flooding for the duration of the study period, which lasted through the summer of 2010.
Nest box contents and signs of use were noted during all visits. Bird species using boxes were determined if possible, and all contents were carefully described. The ground below each nest boxes was searched for pellets or droppings that might indicate use either as a roost or perch. Use by perching diurnal raptors also was recorded.
Nest box coordinates were estimated using a Garmin GPS76, and imported into a Geographic Information System (GIS) for analysis. We used the Willamette Valley Land Use/Land Cover geospatial data set (updated 2001, http://www.nwhi.org/index/gisdata#Willamette%20Valley%20Specific%20GIS%20Data) to estimate landscape vegetation characteristics. Landscape characteristics were selected based on previous studies of barn owls and the particular features of the study area. Landscape characteristics measured included distance to the nearest contrasting habitat edge in meters, the amount of forest edge along agricultural fields within 110 yards (100 meters), 1010 yards (1 km), and 2188 yards (2 km) of the nest box, and amount of forest area measured in hectares within those distances of the nest box. Characteristics were compared between boxes that were used for either roosting or nesting by barn owls and all other boxes. Boxes used and not used by kestrels were compared similarly. Habitat features used in the analysis were selected based on reported habitat use by radio-tagged barn owls in other studies (Colvin 1984, Taylor 1994).
Results Overall, box use by nesting kestrels and barn owls was low. Half the boxes were installed in winter of 2007. In the summer and fall of 2008, the remaining 40 boxes were installed in the Coburg region. No use was recorded in 2008. Subsequent monitoring revealed 3 barn owl nests in 2009 and 2 in 2010 (Figures 2 and 3). Two of the 3 nests in 2009 failed and were abandoned. Both were identified after they failed by the pres-ence of decayed young owls in the nest box. One of these nests failed in the nestling period following the death of one of the adult owls. One of the 2 nests in 2010 also failed from un-known causes, although the remaining nest appeared to suc-cessfully fledge young.
A total of 5 kestrel nests were initiated during 2009 and 2010 (Figures 2 and 3). Three nests belonging to kestrels in 2010 all failed, although an additional 4 boxes appeared to be used as roosts. Two kestrel nests found in 2009 also failed. These were identified after the nesting season by the presence of abandoned eggs in the box. An additional 4 boxes were docu-mented to be kestrel roosts in 2010. Because roosting may
leave little sign, it is expected that roosting activity was greatly underestimated for both species.
Unfortunately, the biggest beneficiaries of the box network were European starlings (Sturnus vulgaris), which consistently used a quarter of the boxes for nesting each year. Two addi-tional passerine nests whose builders were not identified were also found in 2010.
Of the boxes that were used by barn owls, most were located along open fencerows with no woody or shrubby vegetation or narrow field borders with little woody vegetation. One box along a fencerow bordering a forested patch contained a single barn owl pellet in 2009, and in 2010 a box along a hedgerow with isolated ash trees was used as a roost by a male owl. This box was 0.65 miles away from an active nest. Sample sizes are too small to reveal clear patterns (Table 1); point estimates of habitat features are similar between the used and unused nest boxes.
Kestrels did use some boxes along forested edges; the forested edge in one case was that of a riparian wet area with small ash trees less than 15 feet in height. The patch was roughly rectan-gular and measured 167 yards long by 128 yards wide. A sec-ond nest was located on a fence line between two fields. The fence line supported a hedgerow with some small ash trees that were also less than 20 feet in height. The very small sample of used boxes leads to extremely imprecise confidence intervals, and none of the specific characteristics examined appear to have been selected by the kestrels.
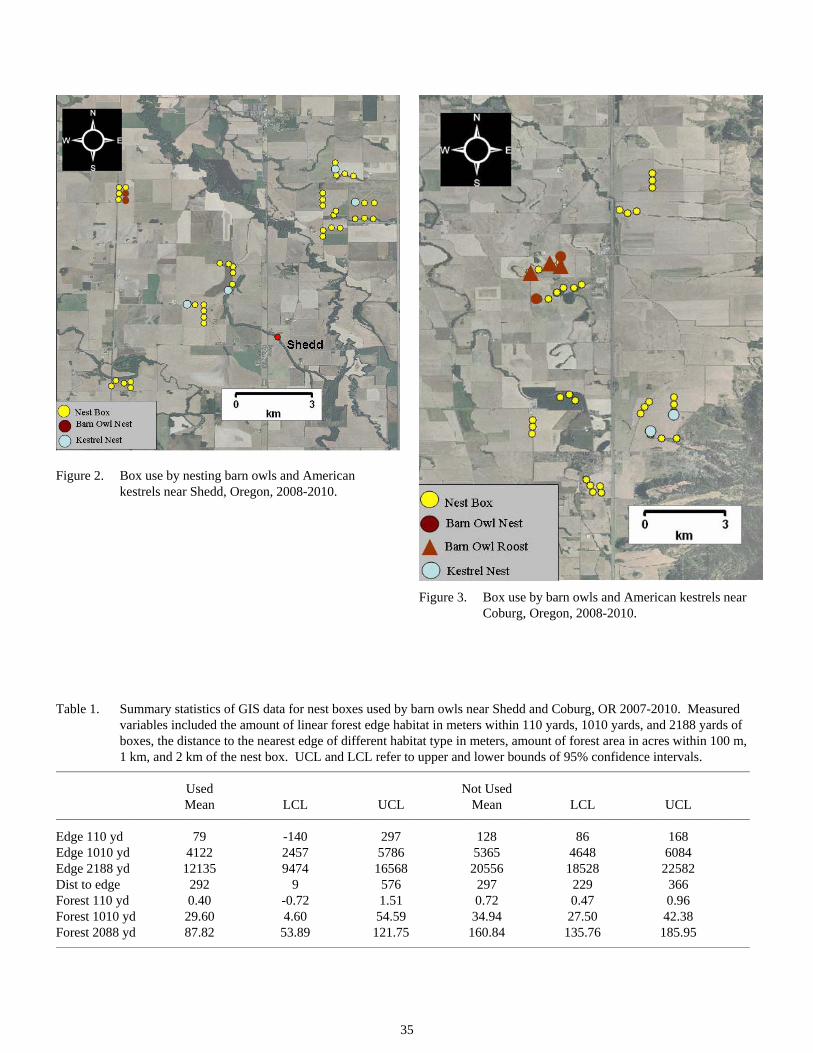
35
Figure 2. Box use by nesting barn owls and American kestrels near Shedd, Oregon, 2008-2010.
Figure 3. Box use by barn owls and American kestrels near Coburg, Oregon, 2008-2010.
Table 1. Summary statistics of GIS data for nest boxes used by barn owls near Shedd and Coburg, OR 2007-2010. Measured
variables included the amount of linear forest edge habitat in meters within 110 yards, 1010 yards, and 2188 yards of boxes, the distance to the nearest edge of different habitat type in meters, amount of forest area in acres within 100 m, 1 km, and 2 km of the nest box. UCL and LCL refer to upper and lower bounds of 95% confidence intervals.
_________________________________________________________________________________________________________________________________________________________________
Used Not Used Mean LCL UCL Mean LCL UCL _________________________________________________________________________________________________________________________________________________________________
Edge 110 yd 79 -140 297 128 86 168 Edge 1010 yd 4122 2457 5786 5365 4648 6084 Edge 2188 yd 12135 9474 16568 20556 18528 22582 Dist to edge 292 9 576 297 229 366 Forest 110 yd 0.40 -0.72 1.51 0.72 0.47 0.96 Forest 1010 yd 29.60 4.60 54.59 34.94 27.50 42.38 Forest 2088 yd 87.82 53.89 121.75 160.84 135.76 185.95 _________________________________________________________________________________________________________________________________________________________________
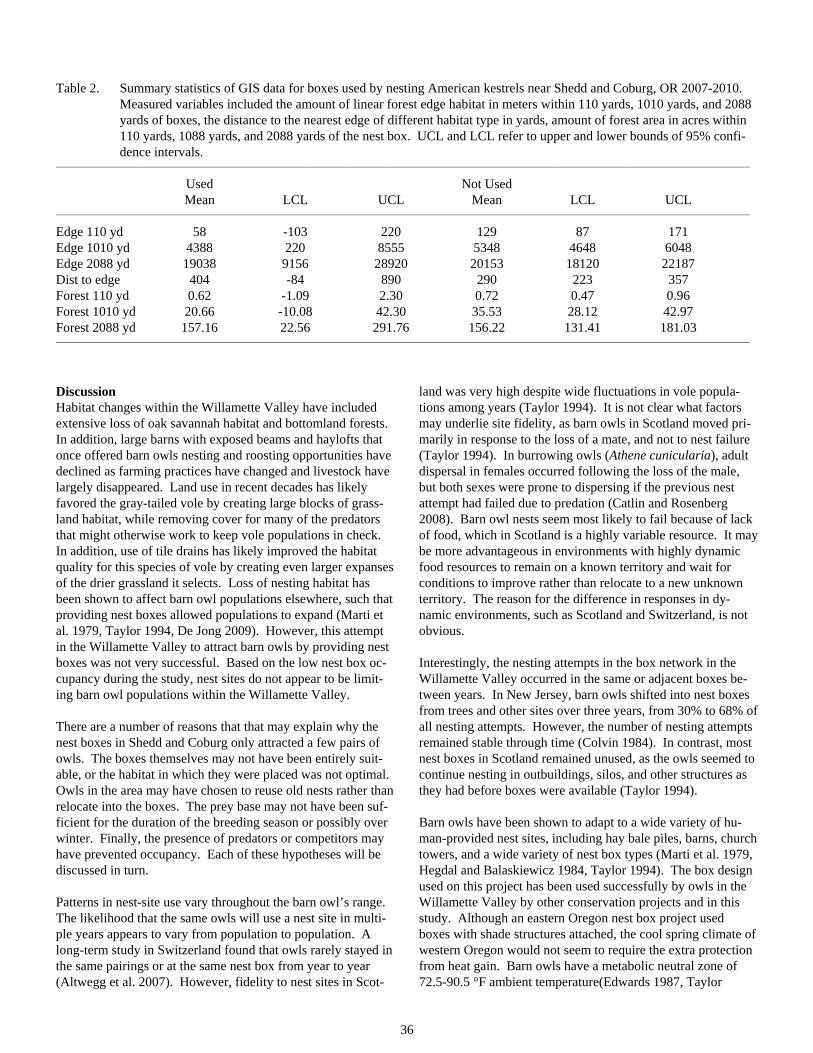
36
Table 2. Summary statistics of GIS data for boxes used by nesting American kestrels near Shedd and Coburg, OR 2007-2010. Measured variables included the amount of linear forest edge habitat in meters within 110 yards, 1010 yards, and 2088 yards of boxes, the distance to the nearest edge of different habitat type in yards, amount of forest area in acres within 110 yards, 1088 yards, and 2088 yards of the nest box. UCL and LCL refer to upper and lower bounds of 95% confi-dence intervals.
_________________________________________________________________________________________________________________________________________________________________
Used Not Used Mean LCL UCL Mean LCL UCL _________________________________________________________________________________________________________________________________________________________________
Edge 110 yd 58 -103 220 129 87 171 Edge 1010 yd 4388 220 8555 5348 4648 6048 Edge 2088 yd 19038 9156 28920 20153 18120 22187 Dist to edge 404 -84 890 290 223 357 Forest 110 yd 0.62 -1.09 2.30 0.72 0.47 0.96 Forest 1010 yd 20.66 -10.08 42.30 35.53 28.12 42.97 Forest 2088 yd 157.16 22.56 291.76 156.22 131.41 181.03 _________________________________________________________________________________________________________________________________________________________________
Discussion Habitat changes within the Willamette Valley have included extensive loss of oak savannah habitat and bottomland forests. In addition, large barns with exposed beams and haylofts that once offered barn owls nesting and roosting opportunities have declined as farming practices have changed and livestock have largely disappeared. Land use in recent decades has likely favored the gray-tailed vole by creating large blocks of grass-land habitat, while removing cover for many of the predators that might otherwise work to keep vole populations in check. In addition, use of tile drains has likely improved the habitat quality for this species of vole by creating even larger expanses of the drier grassland it selects. Loss of nesting habitat has been shown to affect barn owl populations elsewhere, such that providing nest boxes allowed populations to expand (Marti et al. 1979, Taylor 1994, De Jong 2009). However, this attempt in the Willamette Valley to attract barn owls by providing nest boxes was not very successful. Based on the low nest box oc-cupancy during the study, nest sites do not appear to be limit-ing barn owl populations within the Willamette Valley.
There are a number of reasons that that may explain why the nest boxes in Shedd and Coburg only attracted a few pairs of owls. The boxes themselves may not have been entirely suit-able, or the habitat in which they were placed was not optimal. Owls in the area may have chosen to reuse old nests rather than relocate into the boxes. The prey base may not have been suf-ficient for the duration of the breeding season or possibly over winter. Finally, the presence of predators or competitors may have prevented occupancy. Each of these hypotheses will be discussed in turn.
Patterns in nest-site use vary throughout the barn owl’s range. The likelihood that the same owls will use a nest site in multi-ple years appears to vary from population to population. A long-term study in Switzerland found that owls rarely stayed in the same pairings or at the same nest box from year to year (Altwegg et al. 2007). However, fidelity to nest sites in Scot-
land was very high despite wide fluctuations in vole popula-tions among years (Taylor 1994). It is not clear what factors may underlie site fidelity, as barn owls in Scotland moved pri-marily in response to the loss of a mate, and not to nest failure (Taylor 1994). In burrowing owls (Athene cunicularia), adult dispersal in females occurred following the loss of the male, but both sexes were prone to dispersing if the previous nest attempt had failed due to predation (Catlin and Rosenberg 2008). Barn owl nests seem most likely to fail because of lack of food, which in Scotland is a highly variable resource. It may be more advantageous in environments with highly dynamic food resources to remain on a known territory and wait for conditions to improve rather than relocate to a new unknown territory. The reason for the difference in responses in dy-namic environments, such as Scotland and Switzerland, is not obvious.
Interestingly, the nesting attempts in the box network in the Willamette Valley occurred in the same or adjacent boxes be-tween years. In New Jersey, barn owls shifted into nest boxes from trees and other sites over three years, from 30% to 68% of all nesting attempts. However, the number of nesting attempts remained stable through time (Colvin 1984). In contrast, most nest boxes in Scotland remained unused, as the owls seemed to continue nesting in outbuildings, silos, and other structures as they had before boxes were available (Taylor 1994).
Barn owls have been shown to adapt to a wide variety of hu-man-provided nest sites, including hay bale piles, barns, church towers, and a wide variety of nest box types (Marti et al. 1979, Hegdal and Balaskiewicz 1984, Taylor 1994). The box design used on this project has been used successfully by owls in the Willamette Valley by other conservation projects and in this study. Although an eastern Oregon nest box project used boxes with shade structures attached, the cool spring climate of western Oregon would not seem to require the extra protection from heat gain. Barn owls have a metabolic neutral zone of 72.5-90.5 °F ambient temperature(Edwards 1987, Taylor
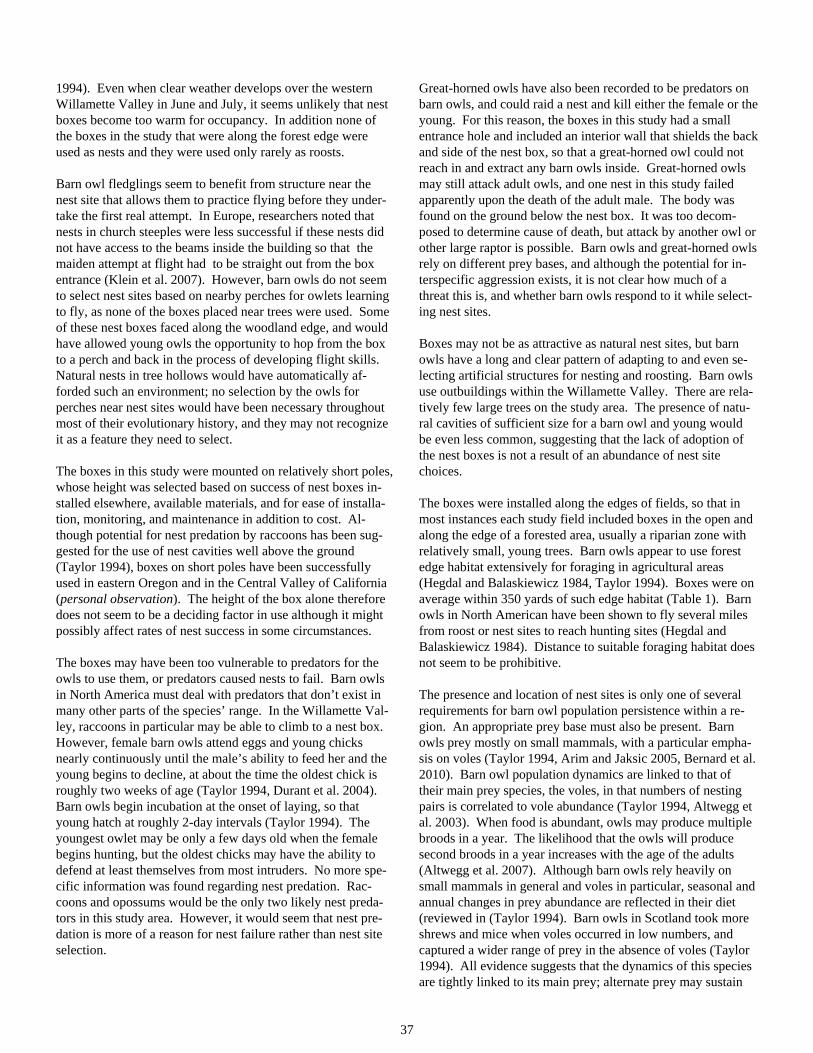
37
1994). Even when clear weather develops over the western Willamette Valley in June and July, it seems unlikely that nest boxes become too warm for occupancy. In addition none of the boxes in the study that were along the forest edge were used as nests and they were used only rarely as roosts.
Barn owl fledglings seem to benefit from structure near the nest site that allows them to practice flying before they under-take the first real attempt. In Europe, researchers noted that nests in church steeples were less successful if these nests did not have access to the beams inside the building so that the maiden attempt at flight had to be straight out from the box entrance (Klein et al. 2007). However, barn owls do not seem to select nest sites based on nearby perches for owlets learning to fly, as none of the boxes placed near trees were used. Some of these nest boxes faced along the woodland edge, and would have allowed young owls the opportunity to hop from the box to a perch and back in the process of developing flight skills. Natural nests in tree hollows would have automatically af-forded such an environment; no selection by the owls for perches near nest sites would have been necessary throughout most of their evolutionary history, and they may not recognize it as a feature they need to select.
The boxes in this study were mounted on relatively short poles, whose height was selected based on success of nest boxes in-stalled elsewhere, available materials, and for ease of installa-tion, monitoring, and maintenance in addition to cost. Al-though potential for nest predation by raccoons has been sug-gested for the use of nest cavities well above the ground (Taylor 1994), boxes on short poles have been successfully used in eastern Oregon and in the Central Valley of California (personal observation). The height of the box alone therefore does not seem to be a deciding factor in use although it might possibly affect rates of nest success in some circumstances.
The boxes may have been too vulnerable to predators for the owls to use them, or predators caused nests to fail. Barn owls in North America must deal with predators that don’t exist in many other parts of the species’ range. In the Willamette Val-ley, raccoons in particular may be able to climb to a nest box. However, female barn owls attend eggs and young chicks nearly continuously until the male’s ability to feed her and the young begins to decline, at about the time the oldest chick is roughly two weeks of age (Taylor 1994, Durant et al. 2004). Barn owls begin incubation at the onset of laying, so that young hatch at roughly 2-day intervals (Taylor 1994). The youngest owlet may be only a few days old when the female begins hunting, but the oldest chicks may have the ability to defend at least themselves from most intruders. No more spe-cific information was found regarding nest predation. Rac-coons and opossums would be the only two likely nest preda-tors in this study area. However, it would seem that nest pre-dation is more of a reason for nest failure rather than nest site selection.
Great-horned owls have also been recorded to be predators on barn owls, and could raid a nest and kill either the female or the young. For this reason, the boxes in this study had a small entrance hole and included an interior wall that shields the back and side of the nest box, so that a great-horned owl could not reach in and extract any barn owls inside. Great-horned owls may still attack adult owls, and one nest in this study failed apparently upon the death of the adult male. The body was found on the ground below the nest box. It was too decom-posed to determine cause of death, but attack by another owl or other large raptor is possible. Barn owls and great-horned owls rely on different prey bases, and although the potential for in-terspecific aggression exists, it is not clear how much of a threat this is, and whether barn owls respond to it while select-ing nest sites.
Boxes may not be as attractive as natural nest sites, but barn owls have a long and clear pattern of adapting to and even se-lecting artificial structures for nesting and roosting. Barn owls use outbuildings within the Willamette Valley. There are rela-tively few large trees on the study area. The presence of natu-ral cavities of sufficient size for a barn owl and young would be even less common, suggesting that the lack of adoption of the nest boxes is not a result of an abundance of nest site choices.
The boxes were installed along the edges of fields, so that in most instances each study field included boxes in the open and along the edge of a forested area, usually a riparian zone with relatively small, young trees. Barn owls appear to use forest edge habitat extensively for foraging in agricultural areas (Hegdal and Balaskiewicz 1984, Taylor 1994). Boxes were on average within 350 yards of such edge habitat (Table 1). Barn owls in North American have been shown to fly several miles from roost or nest sites to reach hunting sites (Hegdal and Balaskiewicz 1984). Distance to suitable foraging habitat does not seem to be prohibitive.
The presence and location of nest sites is only one of several requirements for barn owl population persistence within a re-gion. An appropriate prey base must also be present. Barn owls prey mostly on small mammals, with a particular empha-sis on voles (Taylor 1994, Arim and Jaksic 2005, Bernard et al. 2010). Barn owl population dynamics are linked to that of their main prey species, the voles, in that numbers of nesting pairs is correlated to vole abundance (Taylor 1994, Altwegg et al. 2003). When food is abundant, owls may produce multiple broods in a year. The likelihood that the owls will produce second broods in a year increases with the age of the adults (Altwegg et al. 2007). Although barn owls rely heavily on small mammals in general and voles in particular, seasonal and annual changes in prey abundance are reflected in their diet (reviewed in (Taylor 1994). Barn owls in Scotland took more shrews and mice when voles occurred in low numbers, and captured a wider range of prey in the absence of voles (Taylor 1994). All evidence suggests that the dynamics of this species are tightly linked to its main prey; alternate prey may sustain
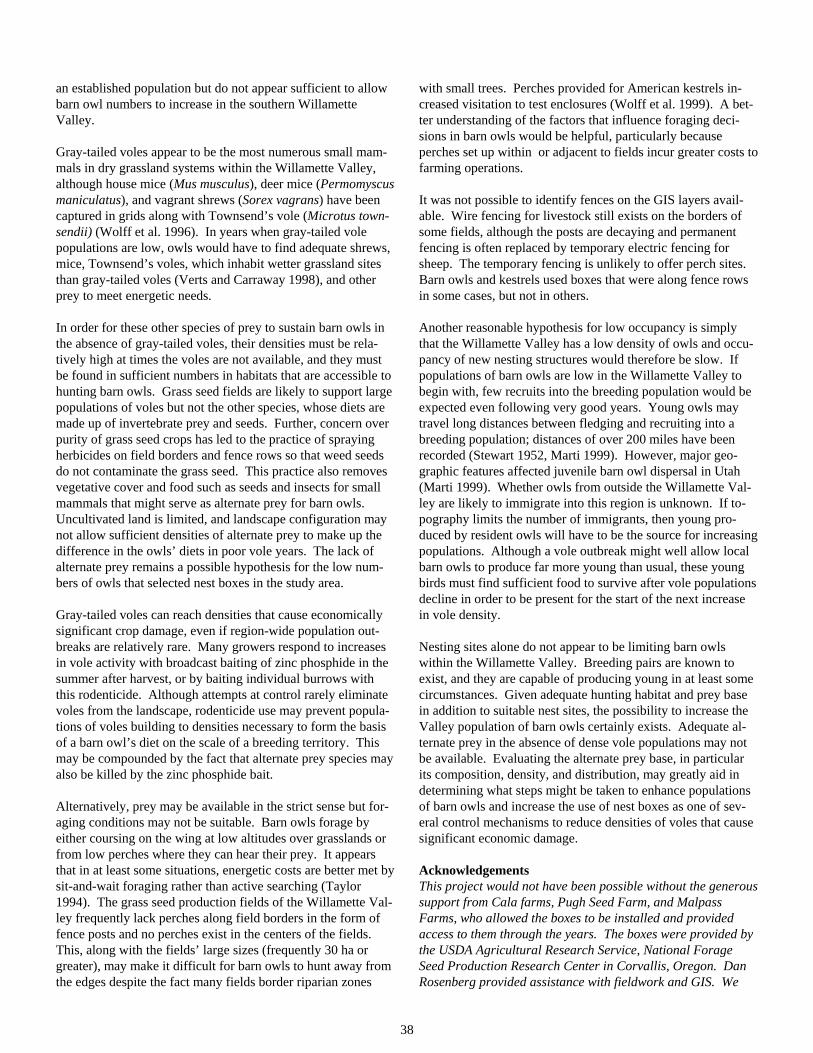
38
an established population but do not appear sufficient to allow barn owl numbers to increase in the southern Willamette Valley.
Gray-tailed voles appear to be the most numerous small mam-mals in dry grassland systems within the Willamette Valley, although house mice (Mus musculus), deer mice (Permomyscus maniculatus), and vagrant shrews (Sorex vagrans) have been captured in grids along with Townsend’s vole (Microtus town-sendii) (Wolff et al. 1996). In years when gray-tailed vole populations are low, owls would have to find adequate shrews, mice, Townsend’s voles, which inhabit wetter grassland sites than gray-tailed voles (Verts and Carraway 1998), and other prey to meet energetic needs.
In order for these other species of prey to sustain barn owls in the absence of gray-tailed voles, their densities must be rela-tively high at times the voles are not available, and they must be found in sufficient numbers in habitats that are accessible to hunting barn owls. Grass seed fields are likely to support large populations of voles but not the other species, whose diets are made up of invertebrate prey and seeds. Further, concern over purity of grass seed crops has led to the practice of spraying herbicides on field borders and fence rows so that weed seeds do not contaminate the grass seed. This practice also removes vegetative cover and food such as seeds and insects for small mammals that might serve as alternate prey for barn owls. Uncultivated land is limited, and landscape configuration may not allow sufficient densities of alternate prey to make up the difference in the owls’ diets in poor vole years. The lack of alternate prey remains a possible hypothesis for the low num-bers of owls that selected nest boxes in the study area.
Gray-tailed voles can reach densities that cause economically significant crop damage, even if region-wide population out-breaks are relatively rare. Many growers respond to increases in vole activity with broadcast baiting of zinc phosphide in the summer after harvest, or by baiting individual burrows with this rodenticide. Although attempts at control rarely eliminate voles from the landscape, rodenticide use may prevent popula-tions of voles building to densities necessary to form the basis of a barn owl’s diet on the scale of a breeding territory. This may be compounded by the fact that alternate prey species may also be killed by the zinc phosphide bait.
Alternatively, prey may be available in the strict sense but for-aging conditions may not be suitable. Barn owls forage by either coursing on the wing at low altitudes over grasslands or from low perches where they can hear their prey. It appears that in at least some situations, energetic costs are better met by sit-and-wait foraging rather than active searching (Taylor 1994). The grass seed production fields of the Willamette Val-ley frequently lack perches along field borders in the form of fence posts and no perches exist in the centers of the fields. This, along with the fields’ large sizes (frequently 30 ha or greater), may make it difficult for barn owls to hunt away from the edges despite the fact many fields border riparian zones
with small trees. Perches provided for American kestrels in-creased visitation to test enclosures (Wolff et al. 1999). A bet-ter understanding of the factors that influence foraging deci-sions in barn owls would be helpful, particularly because perches set up within or adjacent to fields incur greater costs to farming operations.
It was not possible to identify fences on the GIS layers avail-able. Wire fencing for livestock still exists on the borders of some fields, although the posts are decaying and permanent fencing is often replaced by temporary electric fencing for sheep. The temporary fencing is unlikely to offer perch sites. Barn owls and kestrels used boxes that were along fence rows in some cases, but not in others.
Another reasonable hypothesis for low occupancy is simply that the Willamette Valley has a low density of owls and occu-pancy of new nesting structures would therefore be slow. If populations of barn owls are low in the Willamette Valley to begin with, few recruits into the breeding population would be expected even following very good years. Young owls may travel long distances between fledging and recruiting into a breeding population; distances of over 200 miles have been recorded (Stewart 1952, Marti 1999). However, major geo-graphic features affected juvenile barn owl dispersal in Utah (Marti 1999). Whether owls from outside the Willamette Val-ley are likely to immigrate into this region is unknown. If to-pography limits the number of immigrants, then young pro-duced by resident owls will have to be the source for increasing populations. Although a vole outbreak might well allow local barn owls to produce far more young than usual, these young birds must find sufficient food to survive after vole populations decline in order to be present for the start of the next increase in vole density.
Nesting sites alone do not appear to be limiting barn owls within the Willamette Valley. Breeding pairs are known to exist, and they are capable of producing young in at least some circumstances. Given adequate hunting habitat and prey base in addition to suitable nest sites, the possibility to increase the Valley population of barn owls certainly exists. Adequate al-ternate prey in the absence of dense vole populations may not be available. Evaluating the alternate prey base, in particular its composition, density, and distribution, may greatly aid in determining what steps might be taken to enhance populations of barn owls and increase the use of nest boxes as one of sev-eral control mechanisms to reduce densities of voles that cause significant economic damage.
Acknowledgements This project would not have been possible without the generous support from Cala farms, Pugh Seed Farm, and Malpass Farms, who allowed the boxes to be installed and provided access to them through the years. The boxes were provided by the USDA Agricultural Research Service, National Forage Seed Production Research Center in Corvallis, Oregon. Dan Rosenberg provided assistance with fieldwork and GIS. We
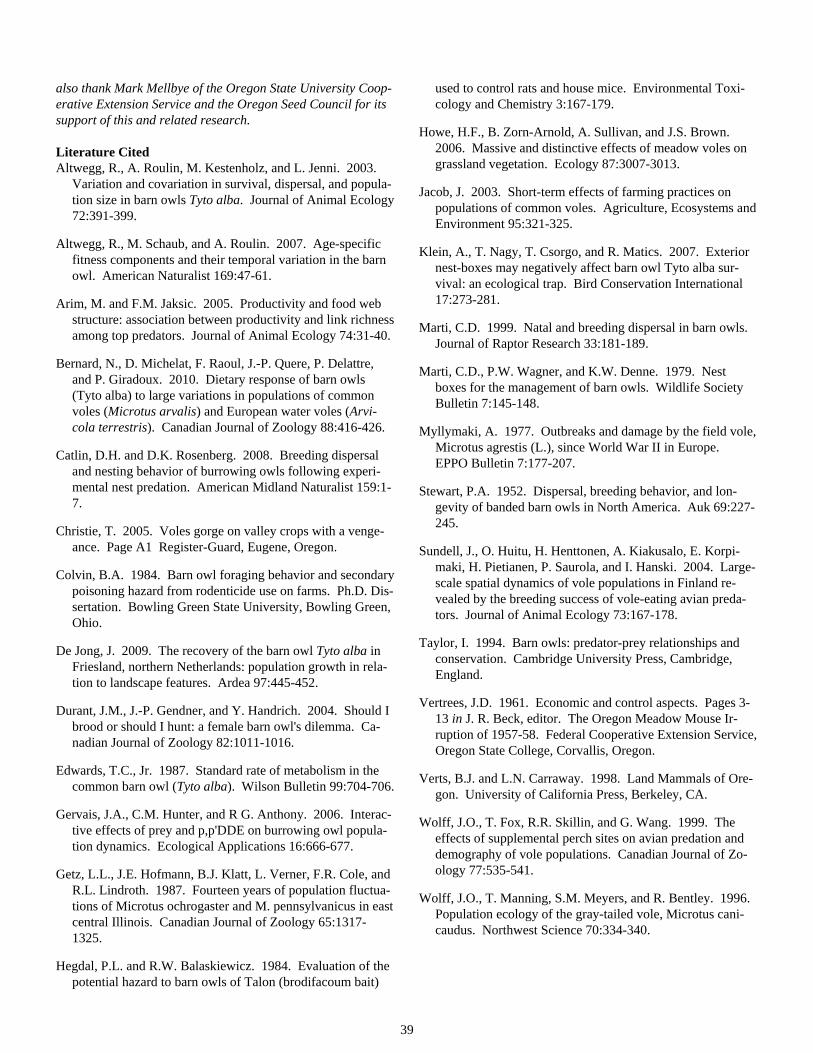
39
also thank Mark Mellbye of the Oregon State University Coop-erative Extension Service and the Oregon Seed Council for its support of this and related research.
Literature Cited Altwegg, R., A. Roulin, M. Kestenholz, and L. Jenni. 2003.
Variation and covariation in survival, dispersal, and popula-tion size in barn owls Tyto alba. Journal of Animal Ecology 72:391-399.
Altwegg, R., M. Schaub, and A. Roulin. 2007. Age-specific fitness components and their temporal variation in the barn owl. American Naturalist 169:47-61.
Arim, M. and F.M. Jaksic. 2005. Productivity and food web structure: association between productivity and link richness among top predators. Journal of Animal Ecology 74:31-40.
Bernard, N., D. Michelat, F. Raoul, J.-P. Quere, P. Delattre, and P. Giradoux. 2010. Dietary response of barn owls (Tyto alba) to large variations in populations of common voles (Microtus arvalis) and European water voles (Arvi-cola terrestris). Canadian Journal of Zoology 88:416-426.
Catlin, D.H. and D.K. Rosenberg. 2008. Breeding dispersal and nesting behavior of burrowing owls following experi-mental nest predation. American Midland Naturalist 159:1-7.
Christie, T. 2005. Voles gorge on valley crops with a venge-ance. Page A1 Register-Guard, Eugene, Oregon.
Colvin, B.A. 1984. Barn owl foraging behavior and secondary poisoning hazard from rodenticide use on farms. Ph.D. Dis-sertation. Bowling Green State University, Bowling Green, Ohio.
De Jong, J. 2009. The recovery of the barn owl Tyto alba in Friesland, northern Netherlands: population growth in rela-tion to landscape features. Ardea 97:445-452.
Durant, J.M., J.-P. Gendner, and Y. Handrich. 2004. Should I brood or should I hunt: a female barn owl's dilemma. Ca-nadian Journal of Zoology 82:1011-1016.
Edwards, T.C., Jr. 1987. Standard rate of metabolism in the common barn owl (Tyto alba). Wilson Bulletin 99:704-706.
Gervais, J.A., C.M. Hunter, and R G. Anthony. 2006. Interac-tive effects of prey and p,p'DDE on burrowing owl popula-tion dynamics. Ecological Applications 16:666-677.
Getz, L.L., J.E. Hofmann, B.J. Klatt, L. Verner, F.R. Cole, and R.L. Lindroth. 1987. Fourteen years of population fluctua-tions of Microtus ochrogaster and M. pennsylvanicus in east central Illinois. Canadian Journal of Zoology 65:1317-1325.
Hegdal, P.L. and R.W. Balaskiewicz. 1984. Evaluation of the potential hazard to barn owls of Talon (brodifacoum bait)
used to control rats and house mice. Environmental Toxi-cology and Chemistry 3:167-179.
Howe, H.F., B. Zorn-Arnold, A. Sullivan, and J.S. Brown. 2006. Massive and distinctive effects of meadow voles on grassland vegetation. Ecology 87:3007-3013.
Jacob, J. 2003. Short-term effects of farming practices on populations of common voles. Agriculture, Ecosystems and Environment 95:321-325.
Klein, A., T. Nagy, T. Csorgo, and R. Matics. 2007. Exterior nest-boxes may negatively affect barn owl Tyto alba sur-vival: an ecological trap. Bird Conservation International 17:273-281.
Marti, C.D. 1999. Natal and breeding dispersal in barn owls. Journal of Raptor Research 33:181-189.
Marti, C.D., P.W. Wagner, and K.W. Denne. 1979. Nest boxes for the management of barn owls. Wildlife Society Bulletin 7:145-148.
Myllymaki, A. 1977. Outbreaks and damage by the field vole, Microtus agrestis (L.), since World War II in Europe. EPPO Bulletin 7:177-207.
Stewart, P.A. 1952. Dispersal, breeding behavior, and lon-gevity of banded barn owls in North America. Auk 69:227-245.
Sundell, J., O. Huitu, H. Henttonen, A. Kiakusalo, E. Korpi-maki, H. Pietianen, P. Saurola, and I. Hanski. 2004. Large-scale spatial dynamics of vole populations in Finland re-vealed by the breeding success of vole-eating avian preda-tors. Journal of Animal Ecology 73:167-178.
Taylor, I. 1994. Barn owls: predator-prey relationships and conservation. Cambridge University Press, Cambridge, England.
Vertrees, J.D. 1961. Economic and control aspects. Pages 3-13 in J. R. Beck, editor. The Oregon Meadow Mouse Ir-ruption of 1957-58. Federal Cooperative Extension Service, Oregon State College, Corvallis, Oregon.
Verts, B.J. and L.N. Carraway. 1998. Land Mammals of Ore-gon. University of California Press, Berkeley, CA.
Wolff, J.O., T. Fox, R.R. Skillin, and G. Wang. 1999. The effects of supplemental perch sites on avian predation and demography of vole populations. Canadian Journal of Zo-ology 77:535-541.
Wolff, J.O., T. Manning, S.M. Meyers, and R. Bentley. 1996. Population ecology of the gray-tailed vole, Microtus cani-caudus. Northwest Science 70:334-340.
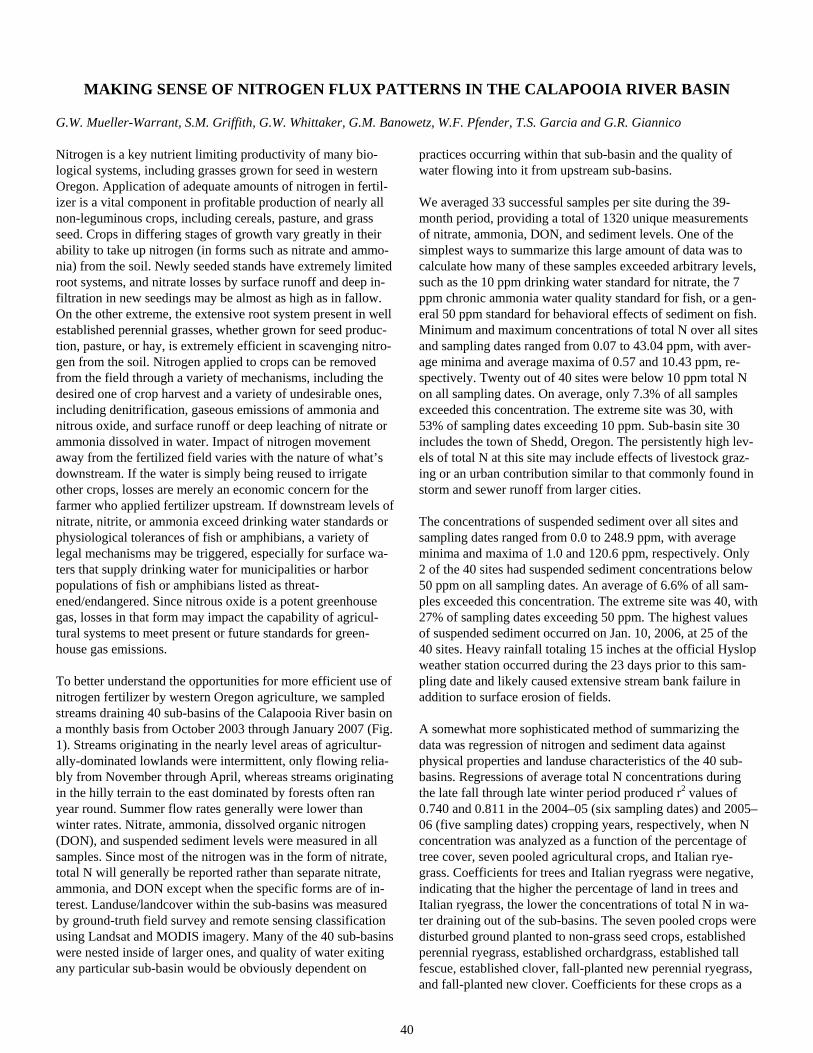
40
MAKING SENSE OF NITROGEN FLUX PATTERNS IN THE CALAPOOIA RIVER BASIN
G.W. Mueller-Warrant, S.M. Griffith, G.W. Whittaker, G.M. Banowetz, W.F. Pfender, T.S. Garcia and G.R. Giannico
Nitrogen is a key nutrient limiting productivity of many bio-logical systems, including grasses grown for seed in western Oregon. Application of adequate amounts of nitrogen in fertil-izer is a vital component in profitable production of nearly all non-leguminous crops, including cereals, pasture, and grass seed. Crops in differing stages of growth vary greatly in their ability to take up nitrogen (in forms such as nitrate and ammo-nia) from the soil. Newly seeded stands have extremely limited root systems, and nitrate losses by surface runoff and deep in-filtration in new seedings may be almost as high as in fallow. On the other extreme, the extensive root system present in well established perennial grasses, whether grown for seed produc-tion, pasture, or hay, is extremely efficient in scavenging nitro-gen from the soil. Nitrogen applied to crops can be removed from the field through a variety of mechanisms, including the desired one of crop harvest and a variety of undesirable ones, including denitrification, gaseous emissions of ammonia and nitrous oxide, and surface runoff or deep leaching of nitrate or ammonia dissolved in water. Impact of nitrogen movement away from the fertilized field varies with the nature of what’s downstream. If the water is simply being reused to irrigate other crops, losses are merely an economic concern for the farmer who applied fertilizer upstream. If downstream levels of nitrate, nitrite, or ammonia exceed drinking water standards or physiological tolerances of fish or amphibians, a variety of legal mechanisms may be triggered, especially for surface wa-ters that supply drinking water for municipalities or harbor populations of fish or amphibians listed as threat-ened/endangered. Since nitrous oxide is a potent greenhouse gas, losses in that form may impact the capability of agricul-tural systems to meet present or future standards for green-house gas emissions.
To better understand the opportunities for more efficient use of nitrogen fertilizer by western Oregon agriculture, we sampled streams draining 40 sub-basins of the Calapooia River basin on a monthly basis from October 2003 through January 2007 (Fig. 1). Streams originating in the nearly level areas of agricultur-ally-dominated lowlands were intermittent, only flowing relia-bly from November through April, whereas streams originating in the hilly terrain to the east dominated by forests often ran year round. Summer flow rates generally were lower than winter rates. Nitrate, ammonia, dissolved organic nitrogen (DON), and suspended sediment levels were measured in all samples. Since most of the nitrogen was in the form of nitrate, total N will generally be reported rather than separate nitrate, ammonia, and DON except when the specific forms are of in-terest. Landuse/landcover within the sub-basins was measured by ground-truth field survey and remote sensing classification using Landsat and MODIS imagery. Many of the 40 sub-basins were nested inside of larger ones, and quality of water exiting any particular sub-basin would be obviously dependent on
practices occurring within that sub-basin and the quality of water flowing into it from upstream sub-basins.
We averaged 33 successful samples per site during the 39-month period, providing a total of 1320 unique measurements of nitrate, ammonia, DON, and sediment levels. One of the simplest ways to summarize this large amount of data was to calculate how many of these samples exceeded arbitrary levels, such as the 10 ppm drinking water standard for nitrate, the 7 ppm chronic ammonia water quality standard for fish, or a gen-eral 50 ppm standard for behavioral effects of sediment on fish. Minimum and maximum concentrations of total N over all sites and sampling dates ranged from 0.07 to 43.04 ppm, with aver-age minima and average maxima of 0.57 and 10.43 ppm, re-spectively. Twenty out of 40 sites were below 10 ppm total N on all sampling dates. On average, only 7.3% of all samples exceeded this concentration. The extreme site was 30, with 53% of sampling dates exceeding 10 ppm. Sub-basin site 30 includes the town of Shedd, Oregon. The persistently high lev-els of total N at this site may include effects of livestock graz-ing or an urban contribution similar to that commonly found in storm and sewer runoff from larger cities.
The concentrations of suspended sediment over all sites and sampling dates ranged from 0.0 to 248.9 ppm, with average minima and maxima of 1.0 and 120.6 ppm, respectively. Only 2 of the 40 sites had suspended sediment concentrations below 50 ppm on all sampling dates. An average of 6.6% of all sam-ples exceeded this concentration. The extreme site was 40, with 27% of sampling dates exceeding 50 ppm. The highest values of suspended sediment occurred on Jan. 10, 2006, at 25 of the 40 sites. Heavy rainfall totaling 15 inches at the official Hyslop weather station occurred during the 23 days prior to this sam-pling date and likely caused extensive stream bank failure in addition to surface erosion of fields.
A somewhat more sophisticated method of summarizing the data was regression of nitrogen and sediment data against physical properties and landuse characteristics of the 40 sub-basins. Regressions of average total N concentrations during the late fall through late winter period produced r2 values of 0.740 and 0.811 in the 2004–05 (six sampling dates) and 2005–06 (five sampling dates) cropping years, respectively, when N concentration was analyzed as a function of the percentage of tree cover, seven pooled agricultural crops, and Italian rye-grass. Coefficients for trees and Italian ryegrass were negative, indicating that the higher the percentage of land in trees and Italian ryegrass, the lower the concentrations of total N in wa-ter draining out of the sub-basins. The seven pooled crops were disturbed ground planted to non-grass seed crops, established perennial ryegrass, established orchardgrass, established tall fescue, established clover, fall-planted new perennial ryegrass, and fall-planted new clover. Coefficients for these crops as a
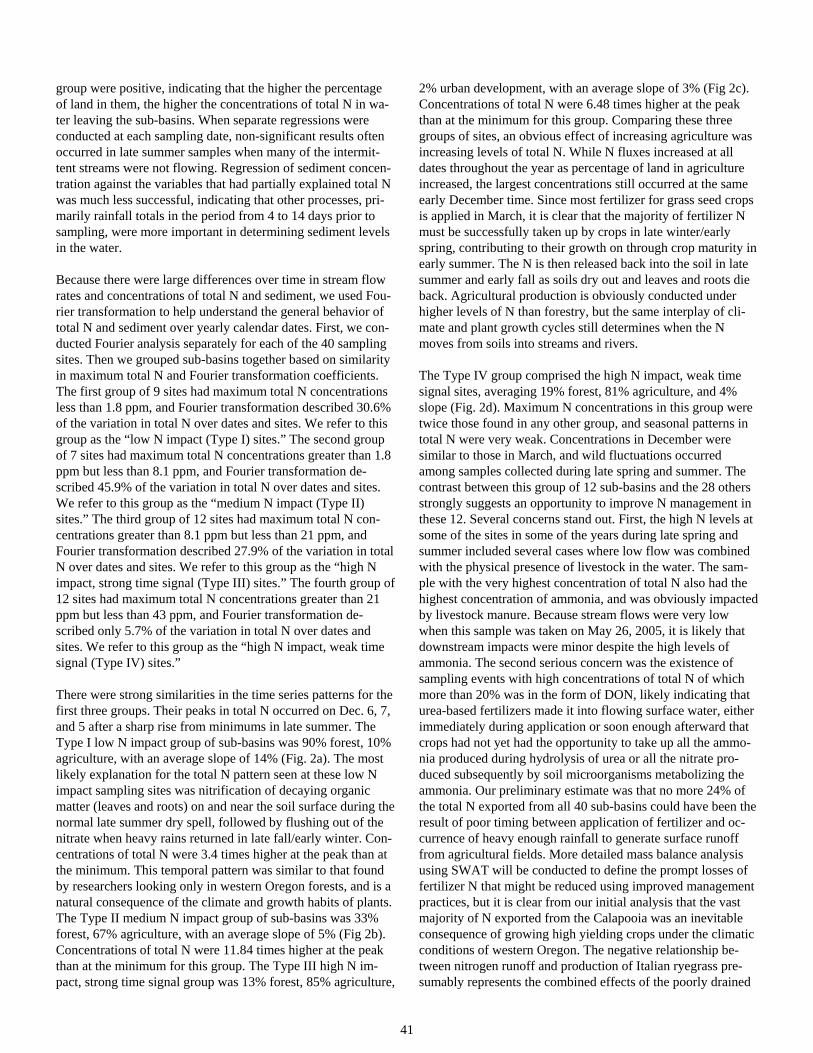
41
group were positive, indicating that the higher the percentage of land in them, the higher the concentrations of total N in wa-ter leaving the sub-basins. When separate regressions were conducted at each sampling date, non-significant results often occurred in late summer samples when many of the intermit-tent streams were not flowing. Regression of sediment concen-tration against the variables that had partially explained total N was much less successful, indicating that other processes, pri-marily rainfall totals in the period from 4 to 14 days prior to sampling, were more important in determining sediment levels in the water.
Because there were large differences over time in stream flow rates and concentrations of total N and sediment, we used Fou-rier transformation to help understand the general behavior of total N and sediment over yearly calendar dates. First, we con-ducted Fourier analysis separately for each of the 40 sampling sites. Then we grouped sub-basins together based on similarity in maximum total N and Fourier transformation coefficients. The first group of 9 sites had maximum total N concentrations less than 1.8 ppm, and Fourier transformation described 30.6% of the variation in total N over dates and sites. We refer to this group as the “low N impact (Type I) sites.” The second group of 7 sites had maximum total N concentrations greater than 1.8 ppm but less than 8.1 ppm, and Fourier transformation de-scribed 45.9% of the variation in total N over dates and sites. We refer to this group as the “medium N impact (Type II) sites.” The third group of 12 sites had maximum total N con-centrations greater than 8.1 ppm but less than 21 ppm, and Fourier transformation described 27.9% of the variation in total N over dates and sites. We refer to this group as the “high N impact, strong time signal (Type III) sites.” The fourth group of 12 sites had maximum total N concentrations greater than 21 ppm but less than 43 ppm, and Fourier transformation de-scribed only 5.7% of the variation in total N over dates and sites. We refer to this group as the “high N impact, weak time signal (Type IV) sites.”
There were strong similarities in the time series patterns for the first three groups. Their peaks in total N occurred on Dec. 6, 7, and 5 after a sharp rise from minimums in late summer. The Type I low N impact group of sub-basins was 90% forest, 10% agriculture, with an average slope of 14% (Fig. 2a). The most likely explanation for the total N pattern seen at these low N impact sampling sites was nitrification of decaying organic matter (leaves and roots) on and near the soil surface during the normal late summer dry spell, followed by flushing out of the nitrate when heavy rains returned in late fall/early winter. Con-centrations of total N were 3.4 times higher at the peak than at the minimum. This temporal pattern was similar to that found by researchers looking only in western Oregon forests, and is a natural consequence of the climate and growth habits of plants. The Type II medium N impact group of sub-basins was 33% forest, 67% agriculture, with an average slope of 5% (Fig 2b). Concentrations of total N were 11.84 times higher at the peak than at the minimum for this group. The Type III high N im-pact, strong time signal group was 13% forest, 85% agriculture,
2% urban development, with an average slope of 3% (Fig 2c). Concentrations of total N were 6.48 times higher at the peak than at the minimum for this group. Comparing these three groups of sites, an obvious effect of increasing agriculture was increasing levels of total N. While N fluxes increased at all dates throughout the year as percentage of land in agriculture increased, the largest concentrations still occurred at the same early December time. Since most fertilizer for grass seed crops is applied in March, it is clear that the majority of fertilizer N must be successfully taken up by crops in late winter/early spring, contributing to their growth on through crop maturity in early summer. The N is then released back into the soil in late summer and early fall as soils dry out and leaves and roots die back. Agricultural production is obviously conducted under higher levels of N than forestry, but the same interplay of cli-mate and plant growth cycles still determines when the N moves from soils into streams and rivers.
The Type IV group comprised the high N impact, weak time signal sites, averaging 19% forest, 81% agriculture, and 4% slope (Fig. 2d). Maximum N concentrations in this group were twice those found in any other group, and seasonal patterns in total N were very weak. Concentrations in December were similar to those in March, and wild fluctuations occurred among samples collected during late spring and summer. The contrast between this group of 12 sub-basins and the 28 others strongly suggests an opportunity to improve N management in these 12. Several concerns stand out. First, the high N levels at some of the sites in some of the years during late spring and summer included several cases where low flow was combined with the physical presence of livestock in the water. The sam-ple with the very highest concentration of total N also had the highest concentration of ammonia, and was obviously impacted by livestock manure. Because stream flows were very low when this sample was taken on May 26, 2005, it is likely that downstream impacts were minor despite the high levels of ammonia. The second serious concern was the existence of sampling events with high concentrations of total N of which more than 20% was in the form of DON, likely indicating that urea-based fertilizers made it into flowing surface water, either immediately during application or soon enough afterward that crops had not yet had the opportunity to take up all the ammo-nia produced during hydrolysis of urea or all the nitrate pro-duced subsequently by soil microorganisms metabolizing the ammonia. Our preliminary estimate was that no more 24% of the total N exported from all 40 sub-basins could have been the result of poor timing between application of fertilizer and oc-currence of heavy enough rainfall to generate surface runoff from agricultural fields. More detailed mass balance analysis using SWAT will be conducted to define the prompt losses of fertilizer N that might be reduced using improved management practices, but it is clear from our initial analysis that the vast majority of N exported from the Calapooia was an inevitable consequence of growing high yielding crops under the climatic conditions of western Oregon. The negative relationship be-tween nitrogen runoff and production of Italian ryegrass pre-sumably represents the combined effects of the poorly drained
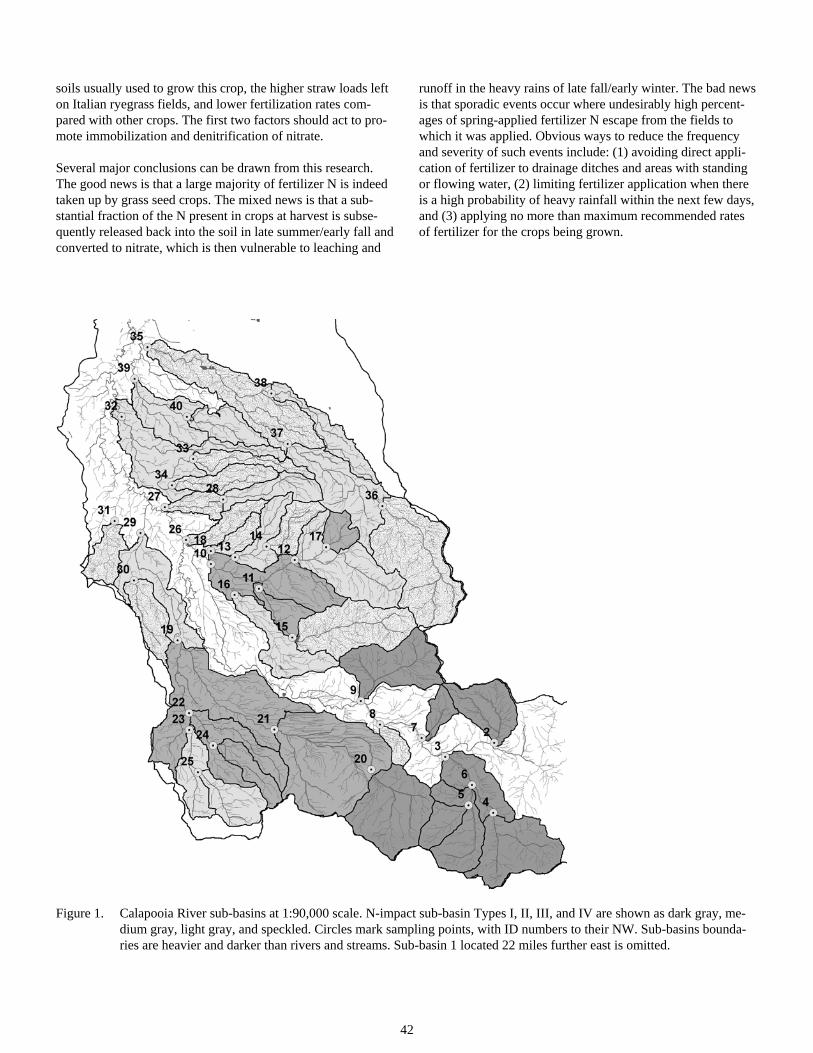
42
soils usually used to grow this crop, the higher straw loads left on Italian ryegrass fields, and lower fertilization rates com-pared with other crops. The first two factors should act to pro-mote immobilization and denitrification of nitrate.
Several major conclusions can be drawn from this research. The good news is that a large majority of fertilizer N is indeed taken up by grass seed crops. The mixed news is that a sub-stantial fraction of the N present in crops at harvest is subse-quently released back into the soil in late summer/early fall and converted to nitrate, which is then vulnerable to leaching and
runoff in the heavy rains of late fall/early winter. The bad news is that sporadic events occur where undesirably high percent-ages of spring-applied fertilizer N escape from the fields to which it was applied. Obvious ways to reduce the frequency and severity of such events include: (1) avoiding direct appli-cation of fertilizer to drainage ditches and areas with standing or flowing water, (2) limiting fertilizer application when there is a high probability of heavy rainfall within the next few days, and (3) applying no more than maximum recommended rates of fertilizer for the crops being grown.
Figure 1. Calapooia River sub-basins at 1:90,000 scale. N-impact sub-basin Types I, II, III, and IV are shown as dark gray, me-dium gray, light gray, and speckled. Circles mark sampling points, with ID numbers to their NW. Sub-basins bounda-ries are heavier and darker than rivers and streams. Sub-basin 1 located 22 miles further east is omitted.
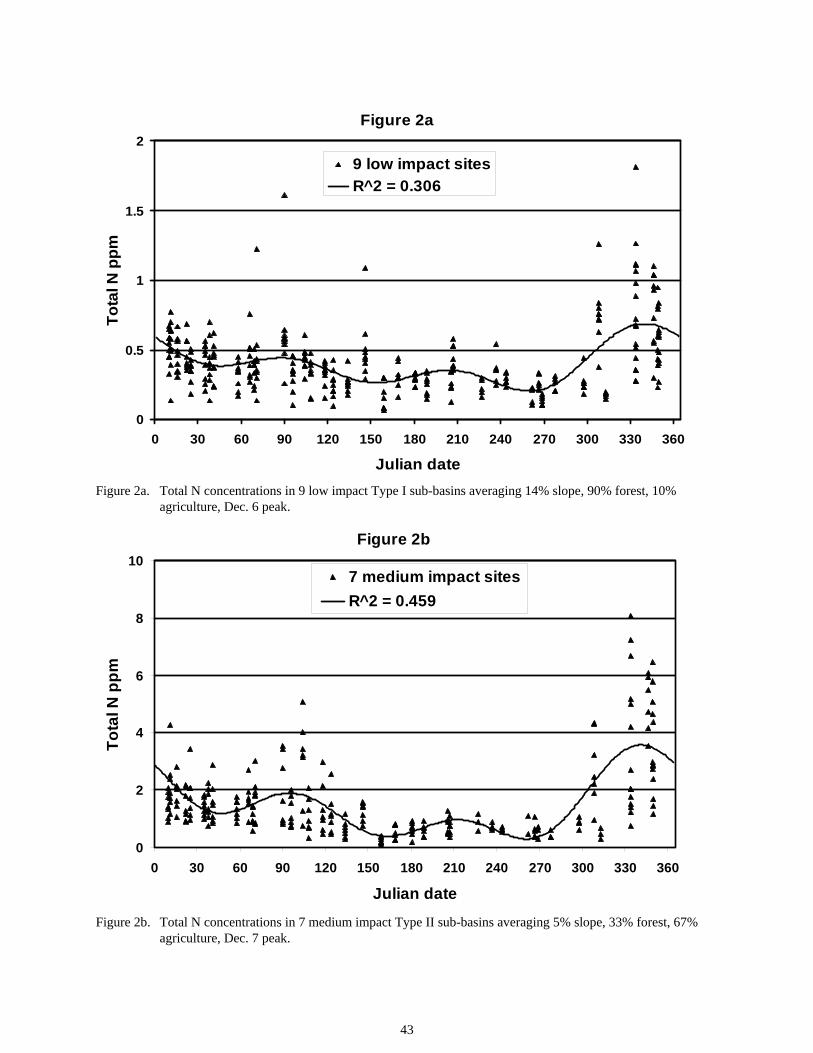
43
Figure 2a
0
0.5
1
1.5
2
0 30 60 90 120 150 180 210 240 270 300 330 360
Julian date
To
tal N
pp
m
9 low impact sites
R^2 = 0.306
Figure 2a. Total N concentrations in 9 low impact Type I sub-basins averaging 14% slope, 90% forest, 10%
agriculture, Dec. 6 peak.
Figure 2b
0
2
4
6
8
10
0 30 60 90 120 150 180 210 240 270 300 330 360
Julian date
To
tal N
pp
m
7 medium impact sites
R^2 = 0.459
Figure 2b. Total N concentrations in 7 medium impact Type II sub-basins averaging 5% slope, 33% forest, 67%
agriculture, Dec. 7 peak.
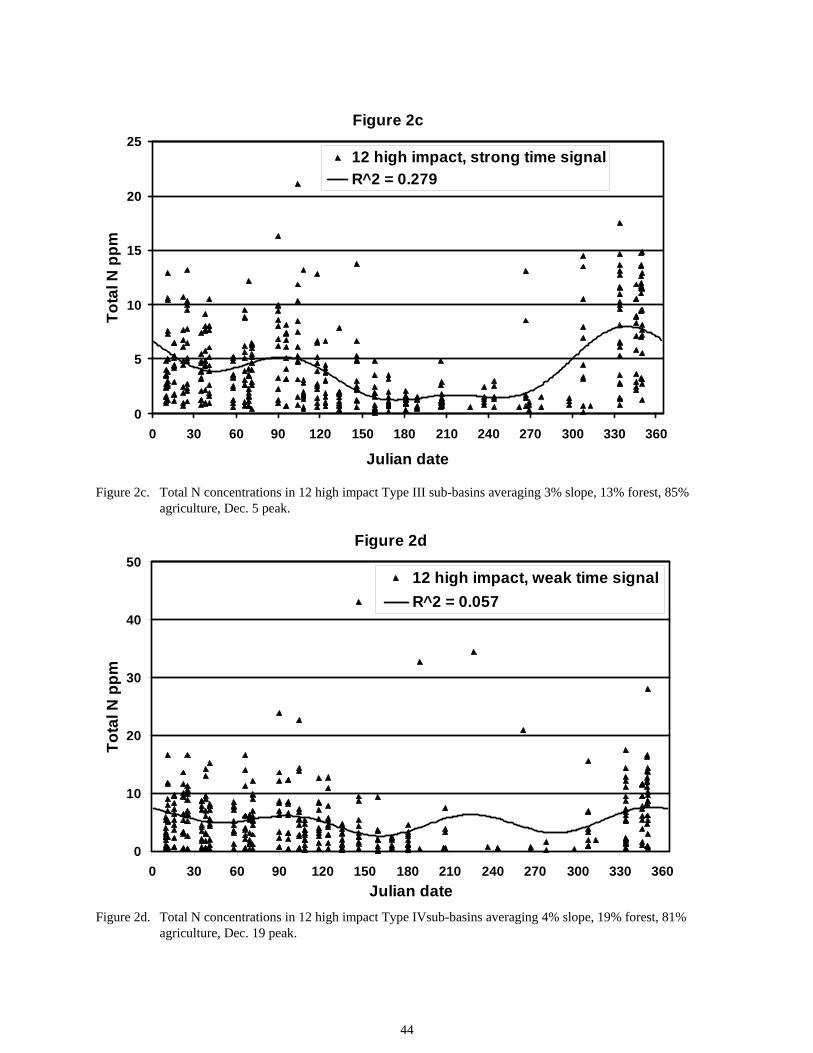
44
Figure 2c
0
5
10
15
20
25
0 30 60 90 120 150 180 210 240 270 300 330 360
Julian date
To
tal N
pp
m
12 high impact, strong time signal
R^2 = 0.279
Figure 2c. Total N concentrations in 12 high impact Type III sub-basins averaging 3% slope, 13% forest, 85%
agriculture, Dec. 5 peak.
Figure 2d
0
10
20
30
40
50
0 30 60 90 120 150 180 210 240 270 300 330 360
Julian date
To
tal N
pp
m
12 high impact, weak time signal
R^2 = 0.057
Figure 2d. Total N concentrations in 12 high impact Type IVsub-basins averaging 4% slope, 19% forest, 81%
agriculture, Dec. 19 peak.
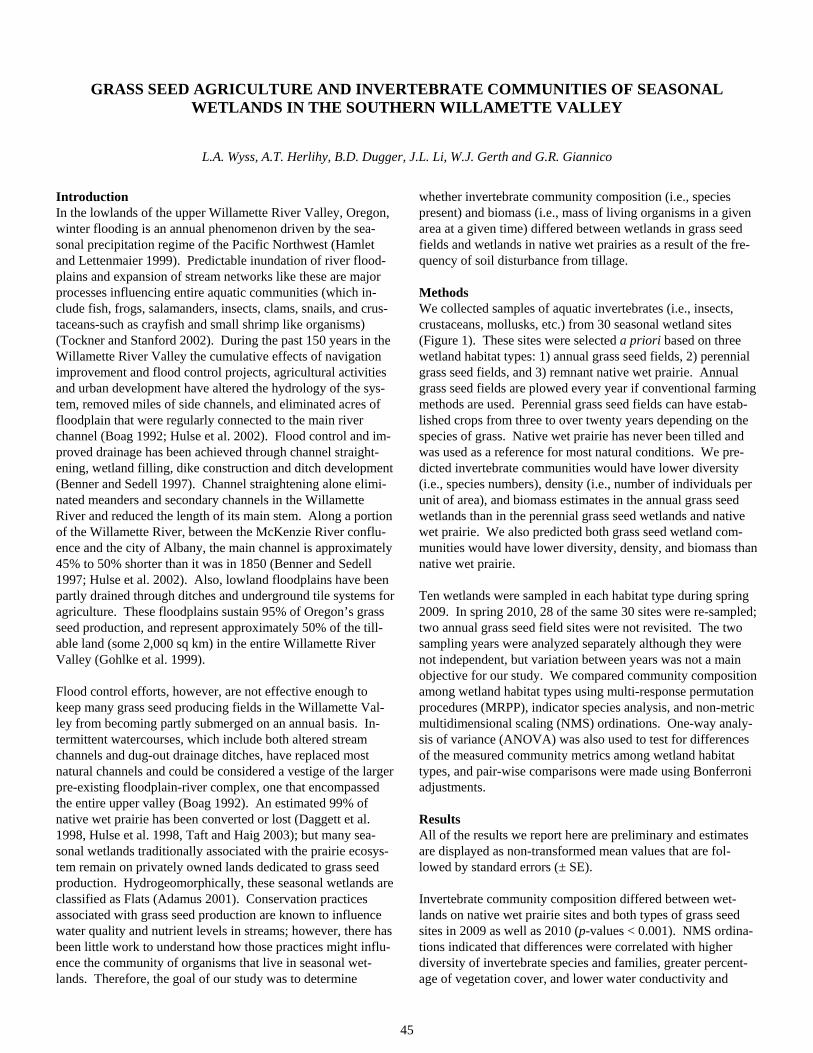
45
GRASS SEED AGRICULTURE AND INVERTEBRATE COMMUNITIES OF SEASONAL WETLANDS IN THE SOUTHERN WILLAMETTE VALLEY
L.A. Wyss, A.T. Herlihy, B.D. Dugger, J.L. Li, W.J. Gerth and G.R. Giannico
Introduction In the lowlands of the upper Willamette River Valley, Oregon, winter flooding is an annual phenomenon driven by the sea-sonal precipitation regime of the Pacific Northwest (Hamlet and Lettenmaier 1999). Predictable inundation of river flood-plains and expansion of stream networks like these are major processes influencing entire aquatic communities (which in-clude fish, frogs, salamanders, insects, clams, snails, and crus-taceans-such as crayfish and small shrimp like organisms) (Tockner and Stanford 2002). During the past 150 years in the Willamette River Valley the cumulative effects of navigation improvement and flood control projects, agricultural activities and urban development have altered the hydrology of the sys-tem, removed miles of side channels, and eliminated acres of floodplain that were regularly connected to the main river channel (Boag 1992; Hulse et al. 2002). Flood control and im-proved drainage has been achieved through channel straight-ening, wetland filling, dike construction and ditch development (Benner and Sedell 1997). Channel straightening alone elimi-nated meanders and secondary channels in the Willamette River and reduced the length of its main stem. Along a portion of the Willamette River, between the McKenzie River conflu-ence and the city of Albany, the main channel is approximately 45% to 50% shorter than it was in 1850 (Benner and Sedell 1997; Hulse et al. 2002). Also, lowland floodplains have been partly drained through ditches and underground tile systems for agriculture. These floodplains sustain 95% of Oregon’s grass seed production, and represent approximately 50% of the till-able land (some 2,000 sq km) in the entire Willamette River Valley (Gohlke et al. 1999).
Flood control efforts, however, are not effective enough to keep many grass seed producing fields in the Willamette Val-ley from becoming partly submerged on an annual basis. In-termittent watercourses, which include both altered stream channels and dug-out drainage ditches, have replaced most natural channels and could be considered a vestige of the larger pre-existing floodplain-river complex, one that encompassed the entire upper valley (Boag 1992). An estimated 99% of native wet prairie has been converted or lost (Daggett et al. 1998, Hulse et al. 1998, Taft and Haig 2003); but many sea-sonal wetlands traditionally associated with the prairie ecosys-tem remain on privately owned lands dedicated to grass seed production. Hydrogeomorphically, these seasonal wetlands are classified as Flats (Adamus 2001). Conservation practices associated with grass seed production are known to influence water quality and nutrient levels in streams; however, there has been little work to understand how those practices might influ-ence the community of organisms that live in seasonal wet-lands. Therefore, the goal of our study was to determine
whether invertebrate community composition (i.e., species present) and biomass (i.e., mass of living organisms in a given area at a given time) differed between wetlands in grass seed fields and wetlands in native wet prairies as a result of the fre-quency of soil disturbance from tillage.
Methods We collected samples of aquatic invertebrates (i.e., insects, crustaceans, mollusks, etc.) from 30 seasonal wetland sites (Figure 1). These sites were selected a priori based on three wetland habitat types: 1) annual grass seed fields, 2) perennial grass seed fields, and 3) remnant native wet prairie. Annual grass seed fields are plowed every year if conventional farming methods are used. Perennial grass seed fields can have estab-lished crops from three to over twenty years depending on the species of grass. Native wet prairie has never been tilled and was used as a reference for most natural conditions. We pre-dicted invertebrate communities would have lower diversity (i.e., species numbers), density (i.e., number of individuals per unit of area), and biomass estimates in the annual grass seed wetlands than in the perennial grass seed wetlands and native wet prairie. We also predicted both grass seed wetland com-munities would have lower diversity, density, and biomass than native wet prairie.
Ten wetlands were sampled in each habitat type during spring 2009. In spring 2010, 28 of the same 30 sites were re-sampled; two annual grass seed field sites were not revisited. The two sampling years were analyzed separately although they were not independent, but variation between years was not a main objective for our study. We compared community composition among wetland habitat types using multi-response permutation procedures (MRPP), indicator species analysis, and non-metric multidimensional scaling (NMS) ordinations. One-way analy-sis of variance (ANOVA) was also used to test for differences of the measured community metrics among wetland habitat types, and pair-wise comparisons were made using Bonferroni adjustments.
Results All of the results we report here are preliminary and estimates are displayed as non-transformed mean values that are fol-lowed by standard errors (± SE).
Invertebrate community composition differed between wet-lands on native wet prairie sites and both types of grass seed sites in 2009 as well as 2010 (p-values < 0.001). NMS ordina-tions indicated that differences were correlated with higher diversity of invertebrate species and families, greater percent-age of vegetation cover, and lower water conductivity and
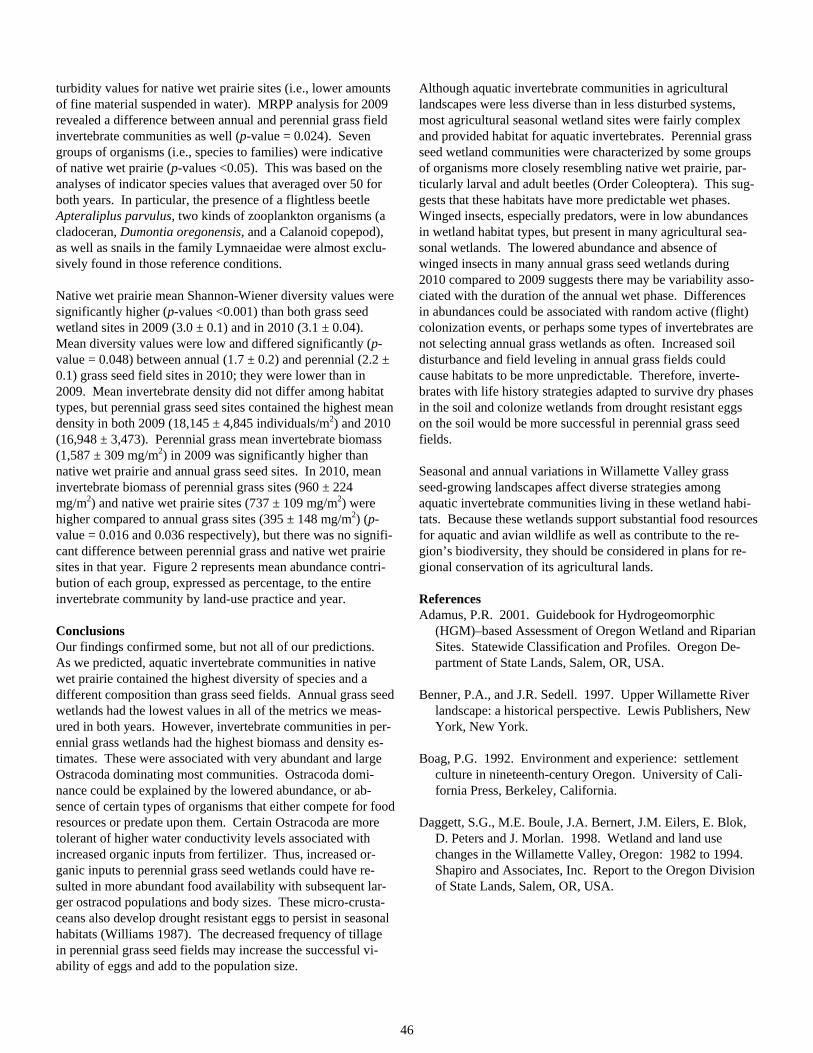
46
turbidity values for native wet prairie sites (i.e., lower amounts of fine material suspended in water). MRPP analysis for 2009 revealed a difference between annual and perennial grass field invertebrate communities as well (p-value = 0.024). Seven groups of organisms (i.e., species to families) were indicative of native wet prairie (p-values <0.05). This was based on the analyses of indicator species values that averaged over 50 for both years. In particular, the presence of a flightless beetle Apteraliplus parvulus, two kinds of zooplankton organisms (a cladoceran, Dumontia oregonensis, and a Calanoid copepod), as well as snails in the family Lymnaeidae were almost exclu-sively found in those reference conditions.
Native wet prairie mean Shannon-Wiener diversity values were significantly higher (p-values <0.001) than both grass seed wetland sites in 2009 (3.0 ± 0.1) and in 2010 (3.1 ± 0.04). Mean diversity values were low and differed significantly (p-value = 0.048) between annual (1.7 ± 0.2) and perennial (2.2 ± 0.1) grass seed field sites in 2010; they were lower than in 2009. Mean invertebrate density did not differ among habitat types, but perennial grass seed sites contained the highest mean density in both 2009 (18,145 ± 4,845 individuals/m2) and 2010 (16,948 ± 3,473). Perennial grass mean invertebrate biomass (1,587 ± 309 mg/m2) in 2009 was significantly higher than native wet prairie and annual grass seed sites. In 2010, mean invertebrate biomass of perennial grass sites (960 ± 224 mg/m2) and native wet prairie sites (737 ± 109 mg/m2) were higher compared to annual grass sites (395 ± 148 mg/m2) (p-value = 0.016 and 0.036 respectively), but there was no signifi-cant difference between perennial grass and native wet prairie sites in that year. Figure 2 represents mean abundance contri-bution of each group, expressed as percentage, to the entire invertebrate community by land-use practice and year.
Conclusions Our findings confirmed some, but not all of our predictions. As we predicted, aquatic invertebrate communities in native wet prairie contained the highest diversity of species and a different composition than grass seed fields. Annual grass seed wetlands had the lowest values in all of the metrics we meas-ured in both years. However, invertebrate communities in per-ennial grass wetlands had the highest biomass and density es-timates. These were associated with very abundant and large Ostracoda dominating most communities. Ostracoda domi-nance could be explained by the lowered abundance, or ab-sence of certain types of organisms that either compete for food resources or predate upon them. Certain Ostracoda are more tolerant of higher water conductivity levels associated with increased organic inputs from fertilizer. Thus, increased or-ganic inputs to perennial grass seed wetlands could have re-sulted in more abundant food availability with subsequent lar-ger ostracod populations and body sizes. These micro-crusta-ceans also develop drought resistant eggs to persist in seasonal habitats (Williams 1987). The decreased frequency of tillage in perennial grass seed fields may increase the successful vi-ability of eggs and add to the population size.
Although aquatic invertebrate communities in agricultural landscapes were less diverse than in less disturbed systems, most agricultural seasonal wetland sites were fairly complex and provided habitat for aquatic invertebrates. Perennial grass seed wetland communities were characterized by some groups of organisms more closely resembling native wet prairie, par-ticularly larval and adult beetles (Order Coleoptera). This sug-gests that these habitats have more predictable wet phases. Winged insects, especially predators, were in low abundances in wetland habitat types, but present in many agricultural sea-sonal wetlands. The lowered abundance and absence of winged insects in many annual grass seed wetlands during 2010 compared to 2009 suggests there may be variability asso-ciated with the duration of the annual wet phase. Differences in abundances could be associated with random active (flight) colonization events, or perhaps some types of invertebrates are not selecting annual grass wetlands as often. Increased soil disturbance and field leveling in annual grass fields could cause habitats to be more unpredictable. Therefore, inverte-brates with life history strategies adapted to survive dry phases in the soil and colonize wetlands from drought resistant eggs on the soil would be more successful in perennial grass seed fields.
Seasonal and annual variations in Willamette Valley grass seed-growing landscapes affect diverse strategies among aquatic invertebrate communities living in these wetland habi-tats. Because these wetlands support substantial food resources for aquatic and avian wildlife as well as contribute to the re-gion’s biodiversity, they should be considered in plans for re-gional conservation of its agricultural lands.
References Adamus, P.R. 2001. Guidebook for Hydrogeomorphic
(HGM)–based Assessment of Oregon Wetland and Riparian Sites. Statewide Classification and Profiles. Oregon De-partment of State Lands, Salem, OR, USA.
Benner, P.A., and J.R. Sedell. 1997. Upper Willamette River landscape: a historical perspective. Lewis Publishers, New York, New York.
Boag, P.G. 1992. Environment and experience: settlement culture in nineteenth-century Oregon. University of Cali-fornia Press, Berkeley, California.
Daggett, S.G., M.E. Boule, J.A. Bernert, J.M. Eilers, E. Blok, D. Peters and J. Morlan. 1998. Wetland and land use changes in the Willamette Valley, Oregon: 1982 to 1994. Shapiro and Associates, Inc. Report to the Oregon Division of State Lands, Salem, OR, USA.
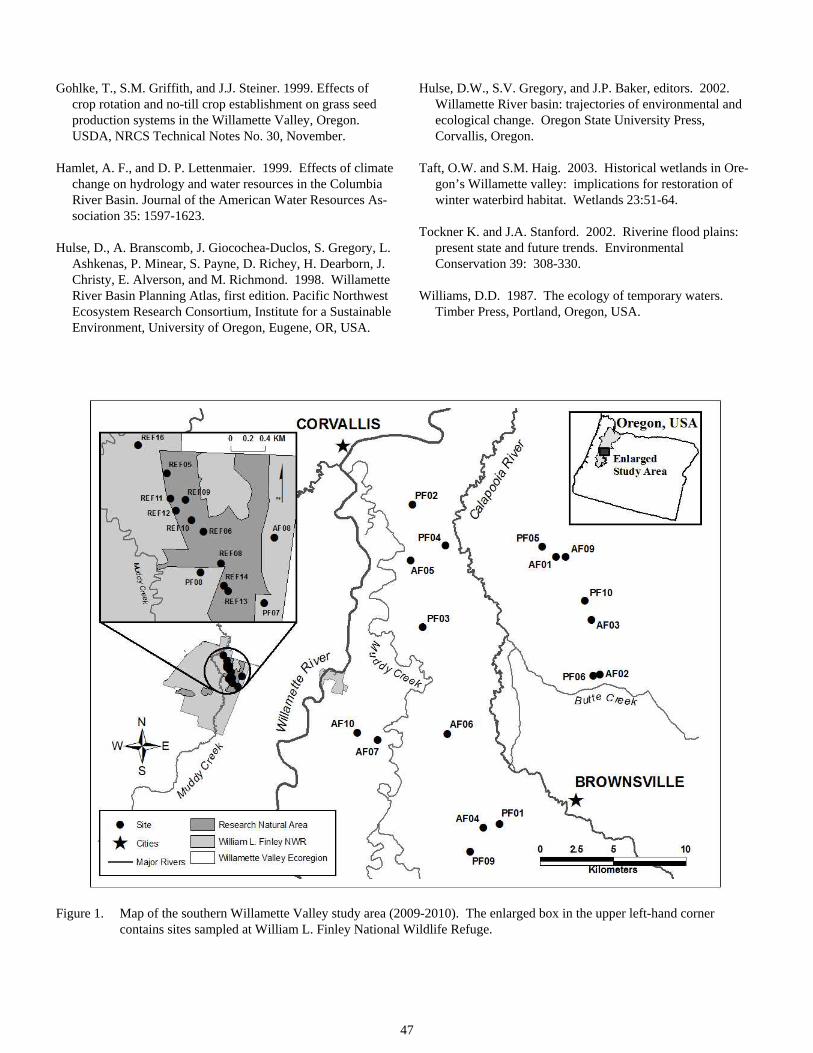
47
Gohlke, T., S.M. Griffith, and J.J. Steiner. 1999. Effects of crop rotation and no-till crop establishment on grass seed production systems in the Willamette Valley, Oregon. USDA, NRCS Technical Notes No. 30, November.
Hamlet, A. F., and D. P. Lettenmaier. 1999. Effects of climate change on hydrology and water resources in the Columbia River Basin. Journal of the American Water Resources As-sociation 35: 1597-1623.
Hulse, D., A. Branscomb, J. Giocochea-Duclos, S. Gregory, L. Ashkenas, P. Minear, S. Payne, D. Richey, H. Dearborn, J. Christy, E. Alverson, and M. Richmond. 1998. Willamette River Basin Planning Atlas, first edition. Pacific Northwest Ecosystem Research Consortium, Institute for a Sustainable Environment, University of Oregon, Eugene, OR, USA.
Hulse, D.W., S.V. Gregory, and J.P. Baker, editors. 2002. Willamette River basin: trajectories of environmental and ecological change. Oregon State University Press, Corvallis, Oregon.
Taft, O.W. and S.M. Haig. 2003. Historical wetlands in Ore-gon’s Willamette valley: implications for restoration of winter waterbird habitat. Wetlands 23:51-64.
Tockner K. and J.A. Stanford. 2002. Riverine flood plains: present state and future trends. Environmental Conservation 39: 308-330.
Williams, D.D. 1987. The ecology of temporary waters. Timber Press, Portland, Oregon, USA.
Figure 1. Map of the southern Willamette Valley study area (2009-2010). The enlarged box in the upper left-hand corner contains sites sampled at William L. Finley National Wildlife Refuge.
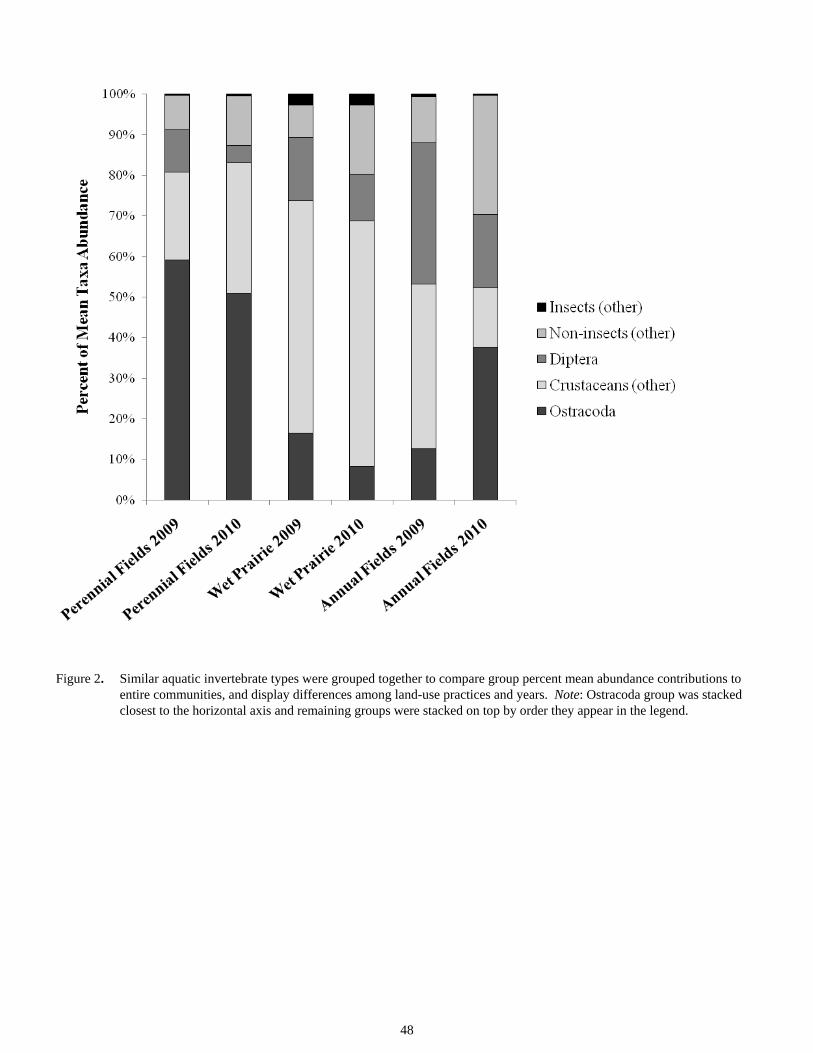
48
Figure 2. Similar aquatic invertebrate types were grouped together to compare group percent mean abundance contributions to entire communities, and display differences among land-use practices and years. Note: Ostracoda group was stacked closest to the horizontal axis and remaining groups were stacked on top by order they appear in the legend.
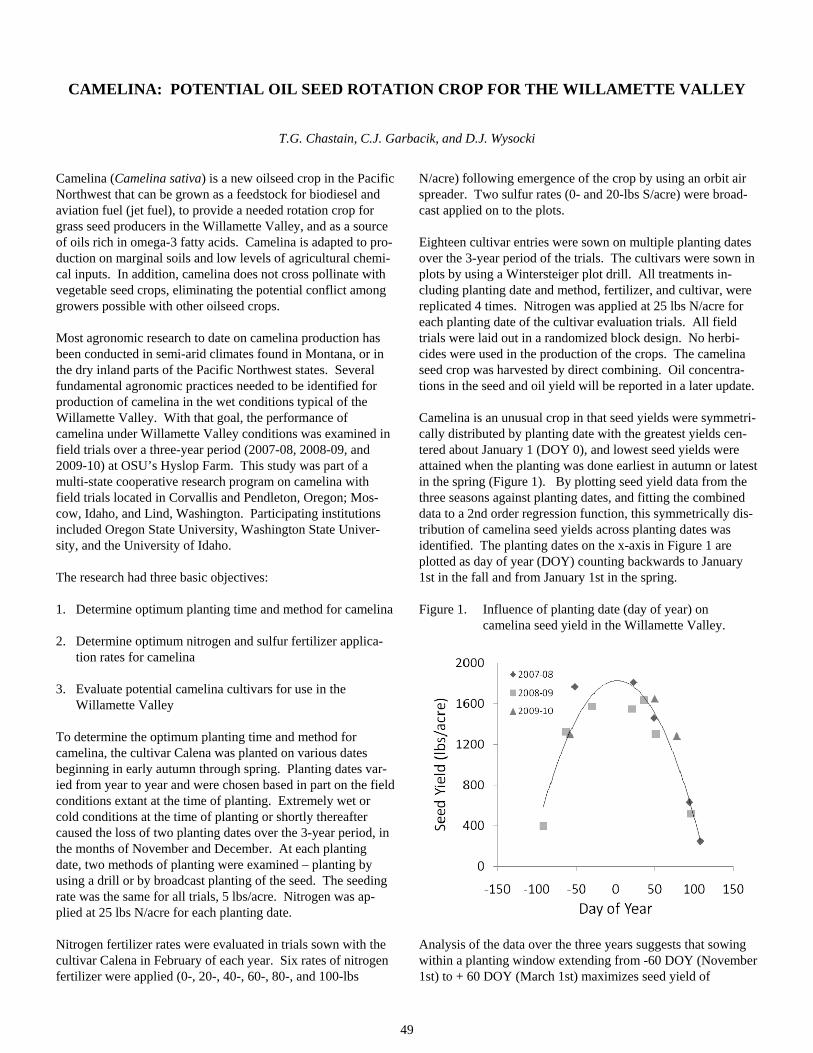
49
CAMELINA: POTENTIAL OIL SEED ROTATION CROP FOR THE WILLAMETTE VALLEY
T.G. Chastain, C.J. Garbacik, and D.J. Wysocki
Camelina (Camelina sativa) is a new oilseed crop in the Pacific Northwest that can be grown as a feedstock for biodiesel and aviation fuel (jet fuel), to provide a needed rotation crop for grass seed producers in the Willamette Valley, and as a source of oils rich in omega-3 fatty acids. Camelina is adapted to pro-duction on marginal soils and low levels of agricultural chemi-cal inputs. In addition, camelina does not cross pollinate with vegetable seed crops, eliminating the potential conflict among growers possible with other oilseed crops.
Most agronomic research to date on camelina production has been conducted in semi-arid climates found in Montana, or in the dry inland parts of the Pacific Northwest states. Several fundamental agronomic practices needed to be identified for production of camelina in the wet conditions typical of the Willamette Valley. With that goal, the performance of camelina under Willamette Valley conditions was examined in field trials over a three-year period (2007-08, 2008-09, and 2009-10) at OSU’s Hyslop Farm. This study was part of a multi-state cooperative research program on camelina with field trials located in Corvallis and Pendleton, Oregon; Mos-cow, Idaho, and Lind, Washington. Participating institutions included Oregon State University, Washington State Univer-sity, and the University of Idaho.
The research had three basic objectives:
1. Determine optimum planting time and method for camelina
2. Determine optimum nitrogen and sulfur fertilizer applica-tion rates for camelina
3. Evaluate potential camelina cultivars for use in the Willamette Valley
To determine the optimum planting time and method for camelina, the cultivar Calena was planted on various dates beginning in early autumn through spring. Planting dates var-ied from year to year and were chosen based in part on the field conditions extant at the time of planting. Extremely wet or cold conditions at the time of planting or shortly thereafter caused the loss of two planting dates over the 3-year period, in the months of November and December. At each planting date, two methods of planting were examined – planting by using a drill or by broadcast planting of the seed. The seeding rate was the same for all trials, 5 lbs/acre. Nitrogen was ap-plied at 25 lbs N/acre for each planting date.
Nitrogen fertilizer rates were evaluated in trials sown with the cultivar Calena in February of each year. Six rates of nitrogen fertilizer were applied (0-, 20-, 40-, 60-, 80-, and 100-lbs
N/acre) following emergence of the crop by using an orbit air spreader. Two sulfur rates (0- and 20-lbs S/acre) were broad-cast applied on to the plots.
Eighteen cultivar entries were sown on multiple planting dates over the 3-year period of the trials. The cultivars were sown in plots by using a Wintersteiger plot drill. All treatments in-cluding planting date and method, fertilizer, and cultivar, were replicated 4 times. Nitrogen was applied at 25 lbs N/acre for each planting date of the cultivar evaluation trials. All field trials were laid out in a randomized block design. No herbi-cides were used in the production of the crops. The camelina seed crop was harvested by direct combining. Oil concentra-tions in the seed and oil yield will be reported in a later update.
Camelina is an unusual crop in that seed yields were symmetri-cally distributed by planting date with the greatest yields cen-tered about January 1 (DOY 0), and lowest seed yields were attained when the planting was done earliest in autumn or latest in the spring (Figure 1). By plotting seed yield data from the three seasons against planting dates, and fitting the combined data to a 2nd order regression function, this symmetrically dis-tribution of camelina seed yields across planting dates was identified. The planting dates on the x-axis in Figure 1 are plotted as day of year (DOY) counting backwards to January 1st in the fall and from January 1st in the spring.
Figure 1. Influence of planting date (day of year) on camelina seed yield in the Willamette Valley.
Analysis of the data over the three years suggests that sowing within a planting window extending from -60 DOY (November 1st) to + 60 DOY (March 1st) maximizes seed yield of
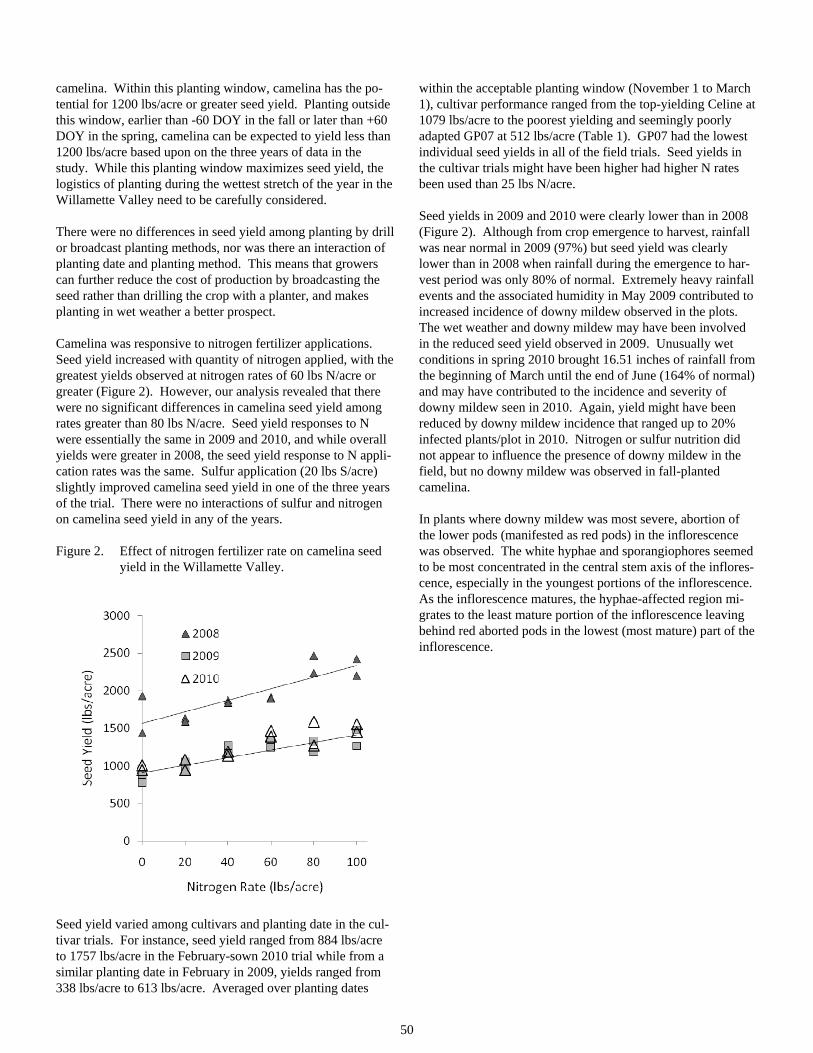
50
camelina. Within this planting window, camelina has the po-tential for 1200 lbs/acre or greater seed yield. Planting outside this window, earlier than -60 DOY in the fall or later than +60 DOY in the spring, camelina can be expected to yield less than 1200 lbs/acre based upon on the three years of data in the study. While this planting window maximizes seed yield, the logistics of planting during the wettest stretch of the year in the Willamette Valley need to be carefully considered.
There were no differences in seed yield among planting by drill or broadcast planting methods, nor was there an interaction of planting date and planting method. This means that growers can further reduce the cost of production by broadcasting the seed rather than drilling the crop with a planter, and makes planting in wet weather a better prospect.
Camelina was responsive to nitrogen fertilizer applications. Seed yield increased with quantity of nitrogen applied, with the greatest yields observed at nitrogen rates of 60 lbs N/acre or greater (Figure 2). However, our analysis revealed that there were no significant differences in camelina seed yield among rates greater than 80 lbs N/acre. Seed yield responses to N were essentially the same in 2009 and 2010, and while overall yields were greater in 2008, the seed yield response to N appli-cation rates was the same. Sulfur application (20 lbs S/acre) slightly improved camelina seed yield in one of the three years of the trial. There were no interactions of sulfur and nitrogen on camelina seed yield in any of the years.
Figure 2. Effect of nitrogen fertilizer rate on camelina seed yield in the Willamette Valley.
Seed yield varied among cultivars and planting date in the cul-tivar trials. For instance, seed yield ranged from 884 lbs/acre to 1757 lbs/acre in the February-sown 2010 trial while from a similar planting date in February in 2009, yields ranged from 338 lbs/acre to 613 lbs/acre. Averaged over planting dates
within the acceptable planting window (November 1 to March 1), cultivar performance ranged from the top-yielding Celine at 1079 lbs/acre to the poorest yielding and seemingly poorly adapted GP07 at 512 lbs/acre (Table 1). GP07 had the lowest individual seed yields in all of the field trials. Seed yields in the cultivar trials might have been higher had higher N rates been used than 25 lbs N/acre.
Seed yields in 2009 and 2010 were clearly lower than in 2008 (Figure 2). Although from crop emergence to harvest, rainfall was near normal in 2009 (97%) but seed yield was clearly lower than in 2008 when rainfall during the emergence to har-vest period was only 80% of normal. Extremely heavy rainfall events and the associated humidity in May 2009 contributed to increased incidence of downy mildew observed in the plots. The wet weather and downy mildew may have been involved in the reduced seed yield observed in 2009. Unusually wet conditions in spring 2010 brought 16.51 inches of rainfall from the beginning of March until the end of June (164% of normal) and may have contributed to the incidence and severity of downy mildew seen in 2010. Again, yield might have been reduced by downy mildew incidence that ranged up to 20% infected plants/plot in 2010. Nitrogen or sulfur nutrition did not appear to influence the presence of downy mildew in the field, but no downy mildew was observed in fall-planted camelina.
In plants where downy mildew was most severe, abortion of the lower pods (manifested as red pods) in the inflorescence was observed. The white hyphae and sporangiophores seemed to be most concentrated in the central stem axis of the inflores-cence, especially in the youngest portions of the inflorescence. As the inflorescence matures, the hyphae-affected region mi-grates to the least mature portion of the inflorescence leaving behind red aborted pods in the lowest (most mature) part of the inflorescence.
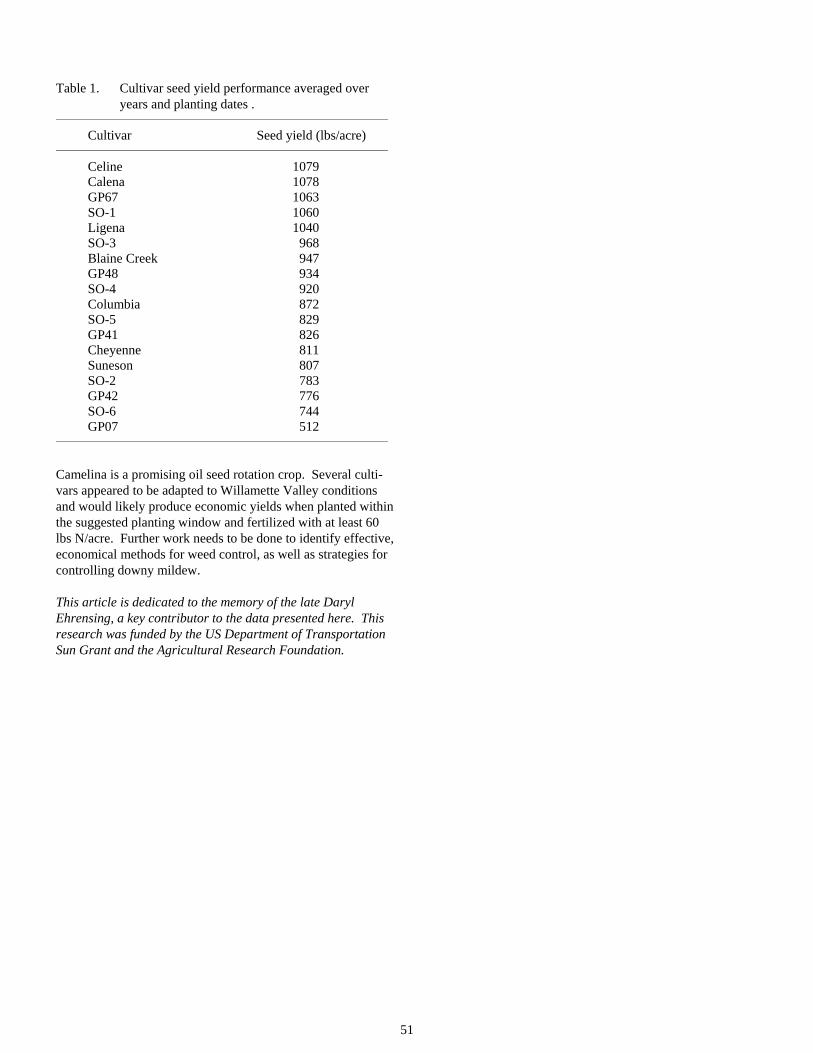
51
Table 1. Cultivar seed yield performance averaged over years and planting dates .
_____________________________________________________________________________
Cultivar Seed yield (lbs/acre) _____________________________________________________________________________
Celine 1079 Calena 1078 GP67 1063 SO-1 1060 Ligena 1040 SO-3 968 Blaine Creek 947 GP48 934 SO-4 920 Columbia 872 SO-5 829 GP41 826 Cheyenne 811 Suneson 807 SO-2 783 GP42 776 SO-6 744 GP07 512 _____________________________________________________________________________
Camelina is a promising oil seed rotation crop. Several culti-vars appeared to be adapted to Willamette Valley conditions and would likely produce economic yields when planted within the suggested planting window and fertilized with at least 60 lbs N/acre. Further work needs to be done to identify effective, economical methods for weed control, as well as strategies for controlling downy mildew.
This article is dedicated to the memory of the late Daryl Ehrensing, a key contributor to the data presented here. This research was funded by the US Department of Transportation Sun Grant and the Agricultural Research Foundation.
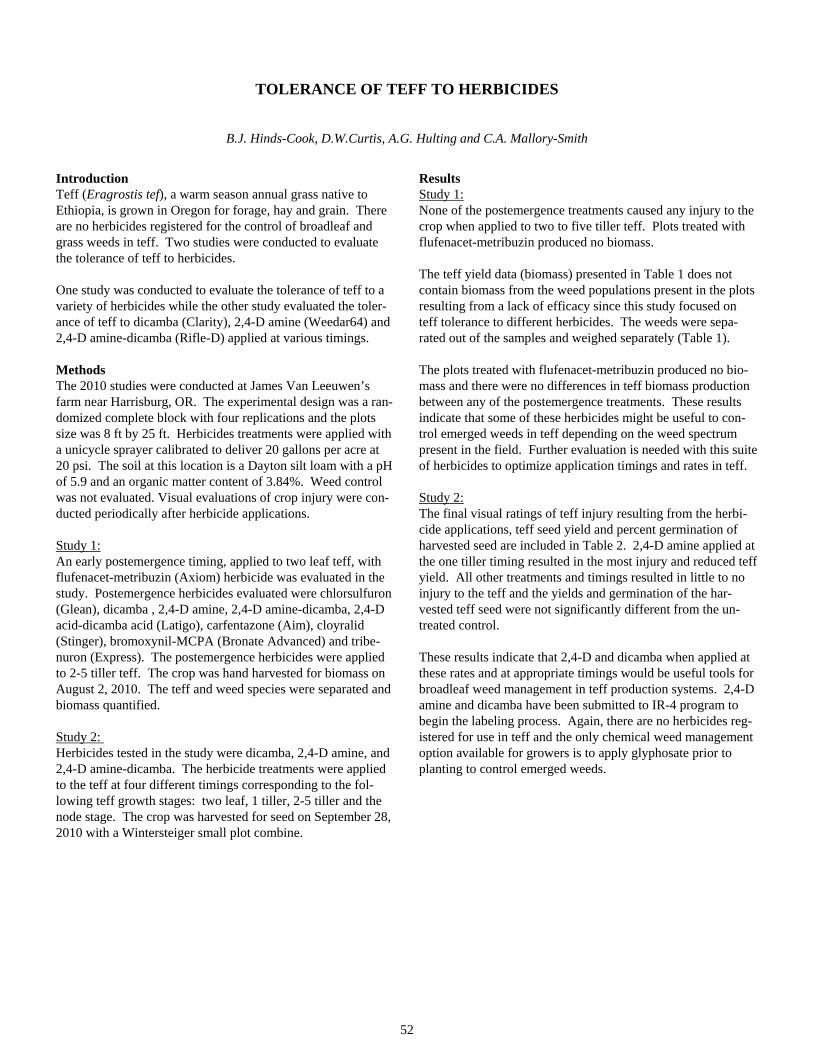
52
TOLERANCE OF TEFF TO HERBICIDES
B.J. Hinds-Cook, D.W.Curtis, A.G. Hulting and C.A. Mallory-Smith
Introduction Teff (Eragrostis tef), a warm season annual grass native to Ethiopia, is grown in Oregon for forage, hay and grain. There are no herbicides registered for the control of broadleaf and grass weeds in teff. Two studies were conducted to evaluate the tolerance of teff to herbicides.
One study was conducted to evaluate the tolerance of teff to a variety of herbicides while the other study evaluated the toler-ance of teff to dicamba (Clarity), 2,4-D amine (Weedar64) and 2,4-D amine-dicamba (Rifle-D) applied at various timings.
Methods The 2010 studies were conducted at James Van Leeuwen’s farm near Harrisburg, OR. The experimental design was a ran-domized complete block with four replications and the plots size was 8 ft by 25 ft. Herbicides treatments were applied with a unicycle sprayer calibrated to deliver 20 gallons per acre at 20 psi. The soil at this location is a Dayton silt loam with a pH of 5.9 and an organic matter content of 3.84%. Weed control was not evaluated. Visual evaluations of crop injury were con-ducted periodically after herbicide applications.
Study 1: An early postemergence timing, applied to two leaf teff, with flufenacet-metribuzin (Axiom) herbicide was evaluated in the study. Postemergence herbicides evaluated were chlorsulfuron (Glean), dicamba , 2,4-D amine, 2,4-D amine-dicamba, 2,4-D acid-dicamba acid (Latigo), carfentazone (Aim), cloyralid (Stinger), bromoxynil-MCPA (Bronate Advanced) and tribe-nuron (Express). The postemergence herbicides were applied to 2-5 tiller teff. The crop was hand harvested for biomass on August 2, 2010. The teff and weed species were separated and biomass quantified.
Study 2: Herbicides tested in the study were dicamba, 2,4-D amine, and 2,4-D amine-dicamba. The herbicide treatments were applied to the teff at four different timings corresponding to the fol-lowing teff growth stages: two leaf, 1 tiller, 2-5 tiller and the node stage. The crop was harvested for seed on September 28, 2010 with a Wintersteiger small plot combine.
Results Study 1: None of the postemergence treatments caused any injury to the crop when applied to two to five tiller teff. Plots treated with flufenacet-metribuzin produced no biomass.
The teff yield data (biomass) presented in Table 1 does not contain biomass from the weed populations present in the plots resulting from a lack of efficacy since this study focused on teff tolerance to different herbicides. The weeds were sepa-rated out of the samples and weighed separately (Table 1).
The plots treated with flufenacet-metribuzin produced no bio-mass and there were no differences in teff biomass production between any of the postemergence treatments. These results indicate that some of these herbicides might be useful to con-trol emerged weeds in teff depending on the weed spectrum present in the field. Further evaluation is needed with this suite of herbicides to optimize application timings and rates in teff.
Study 2: The final visual ratings of teff injury resulting from the herbi-cide applications, teff seed yield and percent germination of harvested seed are included in Table 2. 2,4-D amine applied at the one tiller timing resulted in the most injury and reduced teff yield. All other treatments and timings resulted in little to no injury to the teff and the yields and germination of the har-vested teff seed were not significantly different from the un-treated control.
These results indicate that 2,4-D and dicamba when applied at these rates and at appropriate timings would be useful tools for broadleaf weed management in teff production systems. 2,4-D amine and dicamba have been submitted to IR-4 program to begin the labeling process. Again, there are no herbicides reg-istered for use in teff and the only chemical weed management option available for growers is to apply glyphosate prior to planting to control emerged weeds.
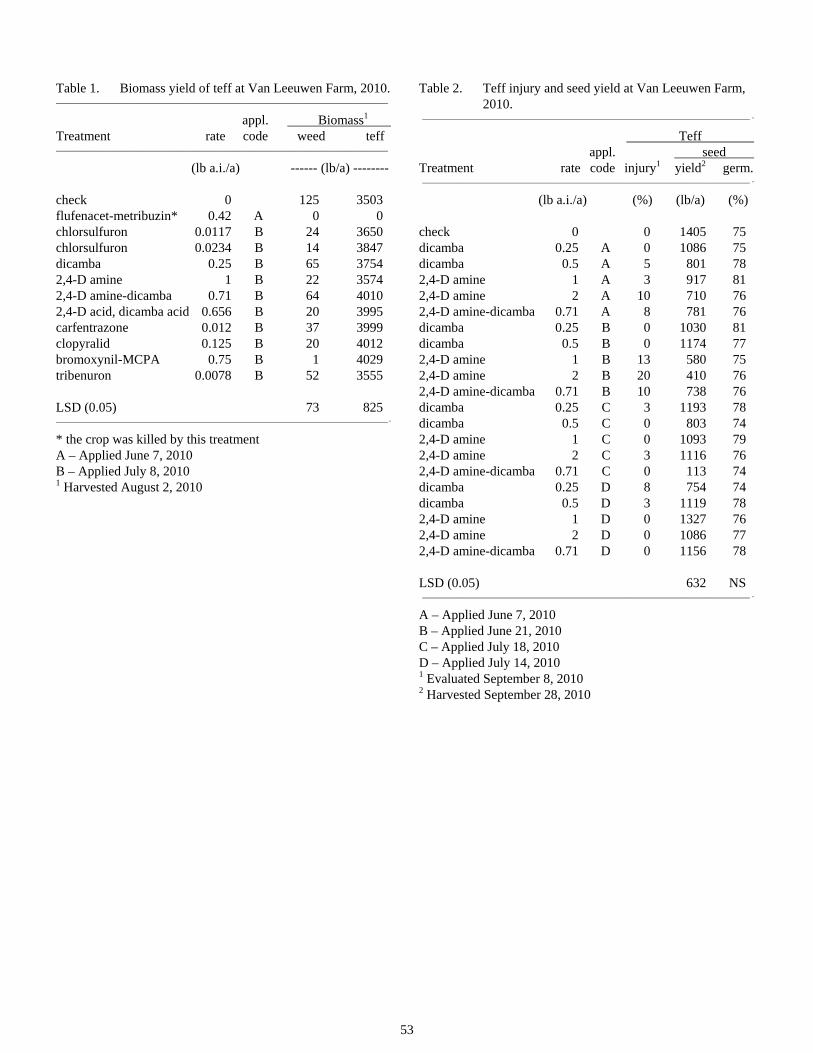
53
Table 1. Biomass yield of teff at Van Leeuwen Farm, 2010. _____________________________________________________________________________
appl. Biomass1 Treatment rate code weed teff _____________________________________________________________________________
(lb a.i./a) ------ (lb/a) -------- check 0 125 3503 flufenacet-metribuzin* 0.42 A 0 0 chlorsulfuron 0.0117 B 24 3650 chlorsulfuron 0.0234 B 14 3847 dicamba 0.25 B 65 3754 2,4-D amine 1 B 22 3574 2,4-D amine-dicamba 0.71 B 64 4010 2,4-D acid, dicamba acid 0.656 B 20 3995 carfentrazone 0.012 B 37 3999 clopyralid 0.125 B 20 4012 bromoxynil-MCPA 0.75 B 1 4029 tribenuron 0.0078 B 52 3555 LSD (0.05) 73 825 _____________________________________________________________________________ . * the crop was killed by this treatment A – Applied June 7, 2010 B – Applied July 8, 2010 1 Harvested August 2, 2010
Table 2. Teff injury and seed yield at Van Leeuwen Farm, 2010.
____________________________________________________________________________ . Teff appl. seed Treatment rate code injury1 yield2 germ. ____________________________________________________________________________ .
(lb a.i./a) (%) (lb/a) (%) check 0 0 1405 75 dicamba 0.25 A 0 1086 75 dicamba 0.5 A 5 801 78 2,4-D amine 1 A 3 917 81 2,4-D amine 2 A 10 710 76 2,4-D amine-dicamba 0.71 A 8 781 76 dicamba 0.25 B 0 1030 81 dicamba 0.5 B 0 1174 77 2,4-D amine 1 B 13 580 75 2,4-D amine 2 B 20 410 76 2,4-D amine-dicamba 0.71 B 10 738 76 dicamba 0.25 C 3 1193 78 dicamba 0.5 C 0 803 74 2,4-D amine 1 C 0 1093 79 2,4-D amine 2 C 3 1116 76 2,4-D amine-dicamba 0.71 C 0 113 74 dicamba 0.25 D 8 754 74 dicamba 0.5 D 3 1119 78 2,4-D amine 1 D 0 1327 76 2,4-D amine 2 D 0 1086 77 2,4-D amine-dicamba 0.71 D 0 1156 78 LSD (0.05) 632 NS ____________________________________________________________________________ .
A – Applied June 7, 2010 B – Applied June 21, 2010 C – Applied July 18, 2010 D – Applied July 14, 2010 1 Evaluated September 8, 2010 2 Harvested September 28, 2010
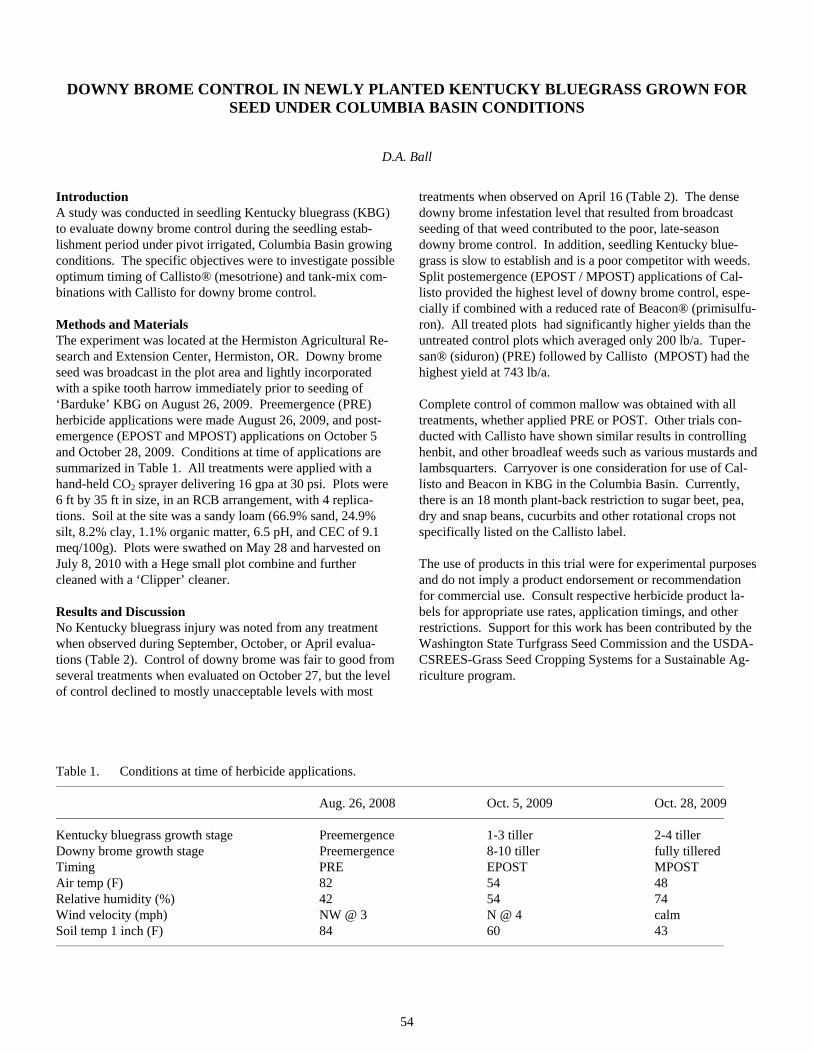
54
DOWNY BROME CONTROL IN NEWLY PLANTED KENTUCKY BLUEGRASS GROWN FOR SEED UNDER COLUMBIA BASIN CONDITIONS
D.A. Ball
Introduction A study was conducted in seedling Kentucky bluegrass (KBG) to evaluate downy brome control during the seedling estab-lishment period under pivot irrigated, Columbia Basin growing conditions. The specific objectives were to investigate possible optimum timing of Callisto® (mesotrione) and tank-mix com-binations with Callisto for downy brome control.
Methods and Materials The experiment was located at the Hermiston Agricultural Re-search and Extension Center, Hermiston, OR. Downy brome seed was broadcast in the plot area and lightly incorporated with a spike tooth harrow immediately prior to seeding of ‘Barduke’ KBG on August 26, 2009. Preemergence (PRE) herbicide applications were made August 26, 2009, and post-emergence (EPOST and MPOST) applications on October 5 and October 28, 2009. Conditions at time of applications are summarized in Table 1. All treatments were applied with a hand-held CO2 sprayer delivering 16 gpa at 30 psi. Plots were 6 ft by 35 ft in size, in an RCB arrangement, with 4 replica-tions. Soil at the site was a sandy loam (66.9% sand, 24.9% silt, 8.2% clay, 1.1% organic matter, 6.5 pH, and CEC of 9.1 meq/100g). Plots were swathed on May 28 and harvested on July 8, 2010 with a Hege small plot combine and further cleaned with a ‘Clipper’ cleaner.
Results and Discussion No Kentucky bluegrass injury was noted from any treatment when observed during September, October, or April evalua-tions (Table 2). Control of downy brome was fair to good from several treatments when evaluated on October 27, but the level of control declined to mostly unacceptable levels with most
treatments when observed on April 16 (Table 2). The dense downy brome infestation level that resulted from broadcast seeding of that weed contributed to the poor, late-season downy brome control. In addition, seedling Kentucky blue-grass is slow to establish and is a poor competitor with weeds. Split postemergence (EPOST / MPOST) applications of Cal-listo provided the highest level of downy brome control, espe-cially if combined with a reduced rate of Beacon® (primisulfu-ron). All treated plots had significantly higher yields than the untreated control plots which averaged only 200 lb/a. Tuper-san® (siduron) (PRE) followed by Callisto (MPOST) had the highest yield at 743 lb/a.
Complete control of common mallow was obtained with all treatments, whether applied PRE or POST. Other trials con-ducted with Callisto have shown similar results in controlling henbit, and other broadleaf weeds such as various mustards and lambsquarters. Carryover is one consideration for use of Cal-listo and Beacon in KBG in the Columbia Basin. Currently, there is an 18 month plant-back restriction to sugar beet, pea, dry and snap beans, cucurbits and other rotational crops not specifically listed on the Callisto label.
The use of products in this trial were for experimental purposes and do not imply a product endorsement or recommendation for commercial use. Consult respective herbicide product la-bels for appropriate use rates, application timings, and other restrictions. Support for this work has been contributed by the Washington State Turfgrass Seed Commission and the USDA-CSREES-Grass Seed Cropping Systems for a Sustainable Ag-riculture program.
Table 1. Conditions at time of herbicide applications. ___________________________________________________________________________________________________________________________________________________________
Aug. 26, 2008 Oct. 5, 2009 Oct. 28, 2009 ___________________________________________________________________________________________________________________________________________________________
Kentucky bluegrass growth stage Preemergence 1-3 tiller 2-4 tiller Downy brome growth stage Preemergence 8-10 tiller fully tillered Timing PRE EPOST MPOST Air temp (F) 82 54 48 Relative humidity (%) 42 54 74 Wind velocity (mph) NW @ 3 N @ 4 calm Soil temp 1 inch (F) 84 60 43 ___________________________________________________________________________________________________________________________________________________________
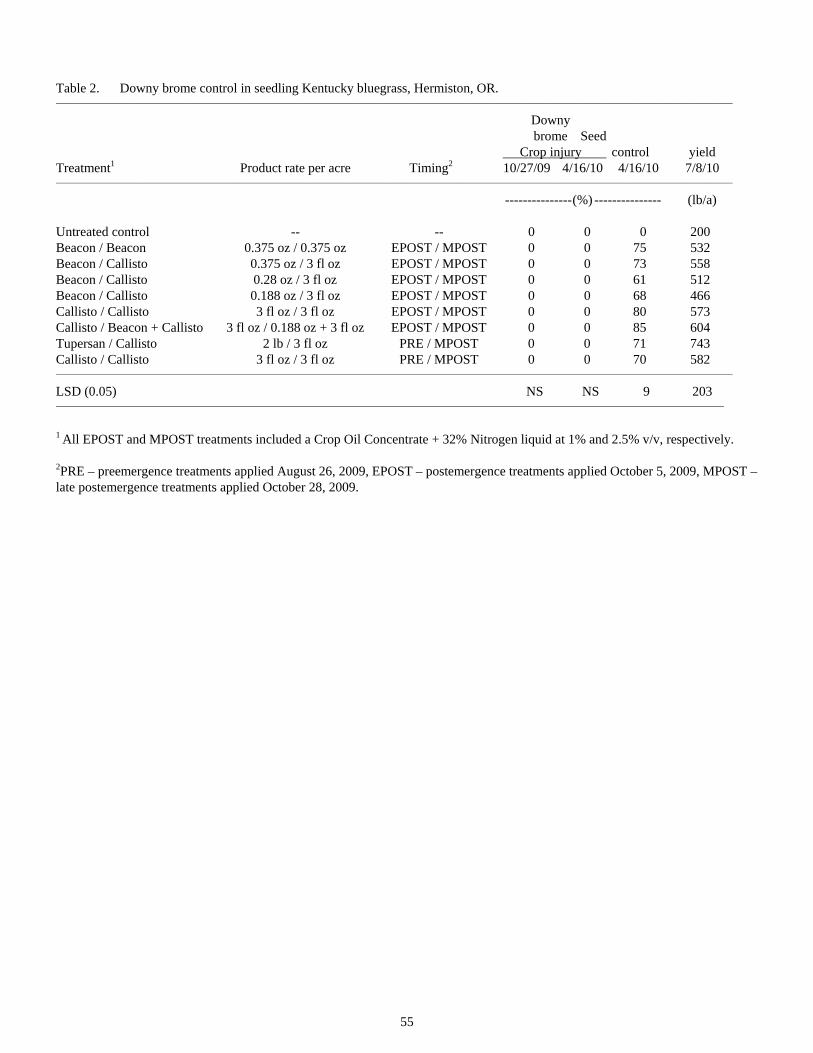
55
Table 2. Downy brome control in seedling Kentucky bluegrass, Hermiston, OR. _____________________________________________________________________________________________________________________________________________________________
Downy brome Seed Crop injury control yield Treatment1 Product rate per acre Timing2 10/27/09 4/16/10 4/16/10 7/8/10 _____________________________________________________________________________________________________________________________________________________________
---------------(%) --------------- (lb/a) Untreated control -- -- 0 0 0 200 Beacon / Beacon 0.375 oz / 0.375 oz EPOST / MPOST 0 0 75 532 Beacon / Callisto 0.375 oz / 3 fl oz EPOST / MPOST 0 0 73 558 Beacon / Callisto 0.28 oz / 3 fl oz EPOST / MPOST 0 0 61 512 Beacon / Callisto 0.188 oz / 3 fl oz EPOST / MPOST 0 0 68 466 Callisto / Callisto 3 fl oz / 3 fl oz EPOST / MPOST 0 0 80 573 Callisto / Beacon + Callisto 3 fl oz / 0.188 oz + 3 fl oz EPOST / MPOST 0 0 85 604 Tupersan / Callisto 2 lb / 3 fl oz PRE / MPOST 0 0 71 743 Callisto / Callisto 3 fl oz / 3 fl oz PRE / MPOST 0 0 70 582 _____________________________________________________________________________________________________________________________________________________________
LSD (0.05) NS NS 9 203 ___________________________________________________________________________________________________________________________________________________________
1 All EPOST and MPOST treatments included a Crop Oil Concentrate + 32% Nitrogen liquid at 1% and 2.5% v/v, respectively.
2PRE – preemergence treatments applied August 26, 2009, EPOST – postemergence treatments applied October 5, 2009, MPOST – late postemergence treatments applied October 28, 2009.
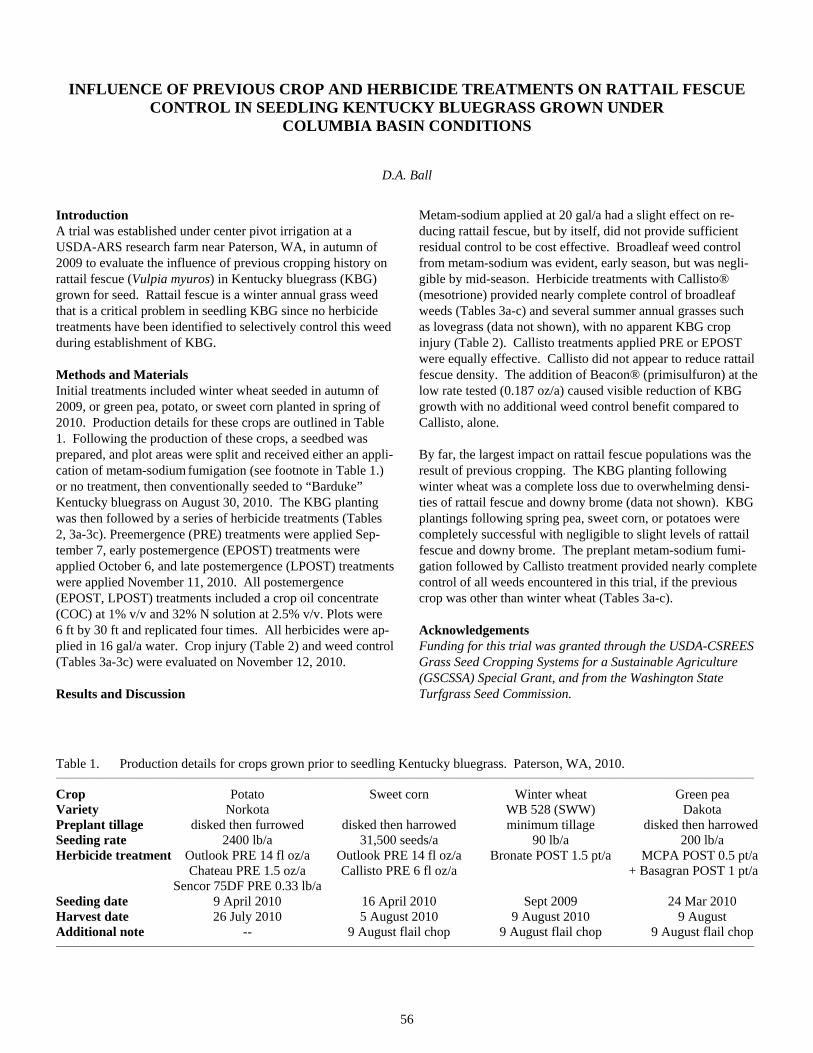
56
INFLUENCE OF PREVIOUS CROP AND HERBICIDE TREATMENTS ON RATTAIL FESCUE CONTROL IN SEEDLING KENTUCKY BLUEGRASS GROWN UNDER
COLUMBIA BASIN CONDITIONS
D.A. Ball
Introduction A trial was established under center pivot irrigation at a USDA-ARS research farm near Paterson, WA, in autumn of 2009 to evaluate the influence of previous cropping history on rattail fescue (Vulpia myuros) in Kentucky bluegrass (KBG) grown for seed. Rattail fescue is a winter annual grass weed that is a critical problem in seedling KBG since no herbicide treatments have been identified to selectively control this weed during establishment of KBG.
Methods and Materials Initial treatments included winter wheat seeded in autumn of 2009, or green pea, potato, or sweet corn planted in spring of 2010. Production details for these crops are outlined in Table 1. Following the production of these crops, a seedbed was prepared, and plot areas were split and received either an appli-cation of metam-sodium fumigation (see footnote in Table 1.) or no treatment, then conventionally seeded to “Barduke” Kentucky bluegrass on August 30, 2010. The KBG planting was then followed by a series of herbicide treatments (Tables 2, 3a-3c). Preemergence (PRE) treatments were applied Sep-tember 7, early postemergence (EPOST) treatments were applied October 6, and late postemergence (LPOST) treatments were applied November 11, 2010. All postemergence (EPOST, LPOST) treatments included a crop oil concentrate (COC) at 1% v/v and 32% N solution at 2.5% v/v. Plots were 6 ft by 30 ft and replicated four times. All herbicides were ap-plied in 16 gal/a water. Crop injury (Table 2) and weed control (Tables 3a-3c) were evaluated on November 12, 2010.
Results and Discussion
Metam-sodium applied at 20 gal/a had a slight effect on re-ducing rattail fescue, but by itself, did not provide sufficient residual control to be cost effective. Broadleaf weed control from metam-sodium was evident, early season, but was negli-gible by mid-season. Herbicide treatments with Callisto® (mesotrione) provided nearly complete control of broadleaf weeds (Tables 3a-c) and several summer annual grasses such as lovegrass (data not shown), with no apparent KBG crop injury (Table 2). Callisto treatments applied PRE or EPOST were equally effective. Callisto did not appear to reduce rattail fescue density. The addition of Beacon® (primisulfuron) at the low rate tested (0.187 oz/a) caused visible reduction of KBG growth with no additional weed control benefit compared to Callisto, alone.
By far, the largest impact on rattail fescue populations was the result of previous cropping. The KBG planting following winter wheat was a complete loss due to overwhelming densi-ties of rattail fescue and downy brome (data not shown). KBG plantings following spring pea, sweet corn, or potatoes were completely successful with negligible to slight levels of rattail fescue and downy brome. The preplant metam-sodium fumi-gation followed by Callisto treatment provided nearly complete control of all weeds encountered in this trial, if the previous crop was other than winter wheat (Tables 3a-c).
Acknowledgements Funding for this trial was granted through the USDA-CSREES Grass Seed Cropping Systems for a Sustainable Agriculture (GSCSSA) Special Grant, and from the Washington State Turfgrass Seed Commission.
Table 1. Production details for crops grown prior to seedling Kentucky bluegrass. Paterson, WA, 2010. __________________________________________________________________________________________________________________________________________________________________
Crop Potato Sweet corn Winter wheat Green pea Variety Norkota WB 528 (SWW) Dakota Preplant tillage disked then furrowed disked then harrowed minimum tillage disked then harrowed Seeding rate 2400 lb/a 31,500 seeds/a 90 lb/a 200 lb/a Herbicide treatment Outlook PRE 14 fl oz/a Outlook PRE 14 fl oz/a Bronate POST 1.5 pt/a MCPA POST 0.5 pt/a Chateau PRE 1.5 oz/a Callisto PRE 6 fl oz/a + Basagran POST 1 pt/a Sencor 75DF PRE 0.33 lb/a Seeding date 9 April 2010 16 April 2010 Sept 2009 24 Mar 2010 Harvest date 26 July 2010 5 August 2010 9 August 2010 9 August Additional note -- 9 August flail chop 9 August flail chop 9 August flail chop __________________________________________________________________________________________________________________________________________________________________
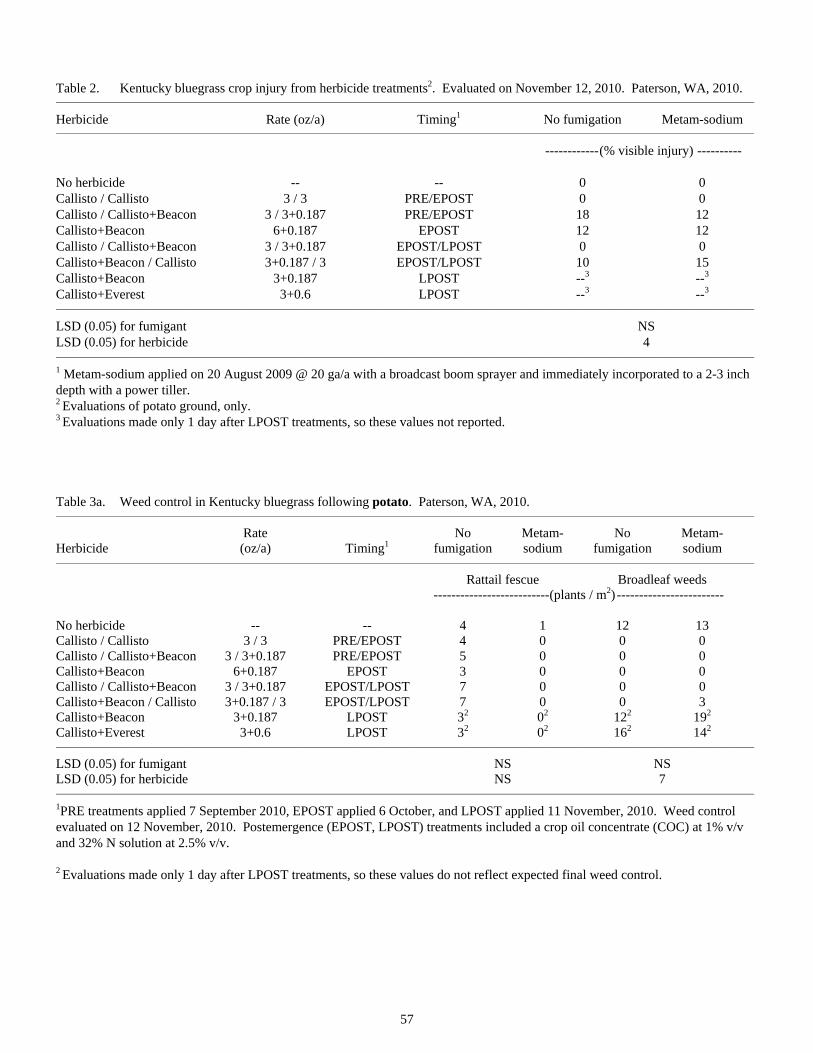
57
Table 2. Kentucky bluegrass crop injury from herbicide treatments2. Evaluated on November 12, 2010. Paterson, WA, 2010. __________________________________________________________________________________________________________________________________________________________________
Herbicide Rate (oz/a) Timing1 No fumigation Metam-sodium
__________________________________________________________________________________________________________________________________________________________________
------------(% visible injury) ---------- No herbicide -- -- 0 0 Callisto / Callisto 3 / 3 PRE/EPOST 0 0 Callisto / Callisto+Beacon 3 / 3+0.187 PRE/EPOST 18 12 Callisto+Beacon 6+0.187 EPOST 12 12 Callisto / Callisto+Beacon 3 / 3+0.187 EPOST/LPOST 0 0 Callisto+Beacon / Callisto 3+0.187 / 3 EPOST/LPOST 10 15 Callisto+Beacon 3+0.187 LPOST --3 --3
Callisto+Everest 3+0.6 LPOST --3 --3
__________________________________________________________________________________________________________________________________________________________________
LSD (0.05) for fumigant NS LSD (0.05) for herbicide 4 __________________________________________________________________________________________________________________________________________________________________
1 Metam-sodium applied on 20 August 2009 @ 20 ga/a with a broadcast boom sprayer and immediately incorporated to a 2-3 inch depth with a power tiller. 2 Evaluations of potato ground, only. 3 Evaluations made only 1 day after LPOST treatments, so these values not reported.
Table 3a. Weed control in Kentucky bluegrass following potato. Paterson, WA, 2010. __________________________________________________________________________________________________________________________________________________________________
Rate No Metam- No Metam- Herbicide (oz/a) Timing1 fumigation sodium fumigation sodium __________________________________________________________________________________________________________________________________________________________________
Rattail fescue Broadleaf weeds --------------------------(plants / m2)------------------------ No herbicide -- -- 4 1 12 13 Callisto / Callisto 3 / 3 PRE/EPOST 4 0 0 0 Callisto / Callisto+Beacon 3 / 3+0.187 PRE/EPOST 5 0 0 0 Callisto+Beacon 6+0.187 EPOST 3 0 0 0 Callisto / Callisto+Beacon 3 / 3+0.187 EPOST/LPOST 7 0 0 0 Callisto+Beacon / Callisto 3+0.187 / 3 EPOST/LPOST 7 0 0 3 Callisto+Beacon 3+0.187 LPOST 32 02 122 192
Callisto+Everest 3+0.6 LPOST 32 02 162 142 __________________________________________________________________________________________________________________________________________________________________
LSD (0.05) for fumigant NS NS LSD (0.05) for herbicide NS 7 __________________________________________________________________________________________________________________________________________________________________
1PRE treatments applied 7 September 2010, EPOST applied 6 October, and LPOST applied 11 November, 2010. Weed control evaluated on 12 November, 2010. Postemergence (EPOST, LPOST) treatments included a crop oil concentrate (COC) at 1% v/v and 32% N solution at 2.5% v/v.
2 Evaluations made only 1 day after LPOST treatments, so these values do not reflect expected final weed control.
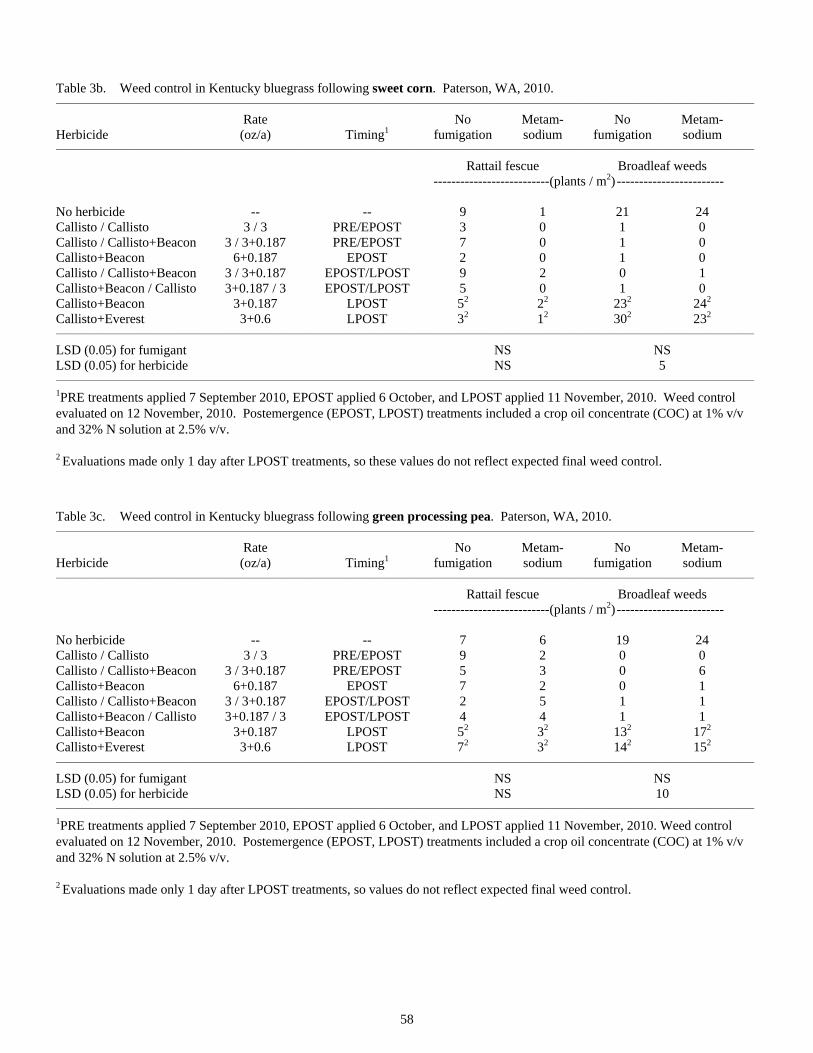
58
Table 3b. Weed control in Kentucky bluegrass following sweet corn. Paterson, WA, 2010. __________________________________________________________________________________________________________________________________________________________________
Rate No Metam- No Metam- Herbicide (oz/a) Timing1 fumigation sodium fumigation sodium __________________________________________________________________________________________________________________________________________________________________
Rattail fescue Broadleaf weeds --------------------------(plants / m2)------------------------ No herbicide -- -- 9 1 21 24 Callisto / Callisto 3 / 3 PRE/EPOST 3 0 1 0 Callisto / Callisto+Beacon 3 / 3+0.187 PRE/EPOST 7 0 1 0 Callisto+Beacon 6+0.187 EPOST 2 0 1 0 Callisto / Callisto+Beacon 3 / 3+0.187 EPOST/LPOST 9 2 0 1 Callisto+Beacon / Callisto 3+0.187 / 3 EPOST/LPOST 5 0 1 0 Callisto+Beacon 3+0.187 LPOST 52 22 232 242
Callisto+Everest 3+0.6 LPOST 32 12 302 232 __________________________________________________________________________________________________________________________________________________________________
LSD (0.05) for fumigant NS NS LSD (0.05) for herbicide NS 5 __________________________________________________________________________________________________________________________________________________________________
1PRE treatments applied 7 September 2010, EPOST applied 6 October, and LPOST applied 11 November, 2010. Weed control evaluated on 12 November, 2010. Postemergence (EPOST, LPOST) treatments included a crop oil concentrate (COC) at 1% v/v and 32% N solution at 2.5% v/v.
2 Evaluations made only 1 day after LPOST treatments, so these values do not reflect expected final weed control.
Table 3c. Weed control in Kentucky bluegrass following green processing pea. Paterson, WA, 2010. __________________________________________________________________________________________________________________________________________________________________
Rate No Metam- No Metam- Herbicide (oz/a) Timing1 fumigation sodium fumigation sodium __________________________________________________________________________________________________________________________________________________________________
Rattail fescue Broadleaf weeds --------------------------(plants / m2)------------------------ No herbicide -- -- 7 6 19 24 Callisto / Callisto 3 / 3 PRE/EPOST 9 2 0 0 Callisto / Callisto+Beacon 3 / 3+0.187 PRE/EPOST 5 3 0 6 Callisto+Beacon 6+0.187 EPOST 7 2 0 1 Callisto / Callisto+Beacon 3 / 3+0.187 EPOST/LPOST 2 5 1 1 Callisto+Beacon / Callisto 3+0.187 / 3 EPOST/LPOST 4 4 1 1 Callisto+Beacon 3+0.187 LPOST 52 32 132 172
Callisto+Everest 3+0.6 LPOST 72 32 142 152 __________________________________________________________________________________________________________________________________________________________________
LSD (0.05) for fumigant NS NS LSD (0.05) for herbicide NS 10 __________________________________________________________________________________________________________________________________________________________________
1PRE treatments applied 7 September 2010, EPOST applied 6 October, and LPOST applied 11 November, 2010. Weed control evaluated on 12 November, 2010. Postemergence (EPOST, LPOST) treatments included a crop oil concentrate (COC) at 1% v/v and 32% N solution at 2.5% v/v.
2 Evaluations made only 1 day after LPOST treatments, so values do not reflect expected final weed control.
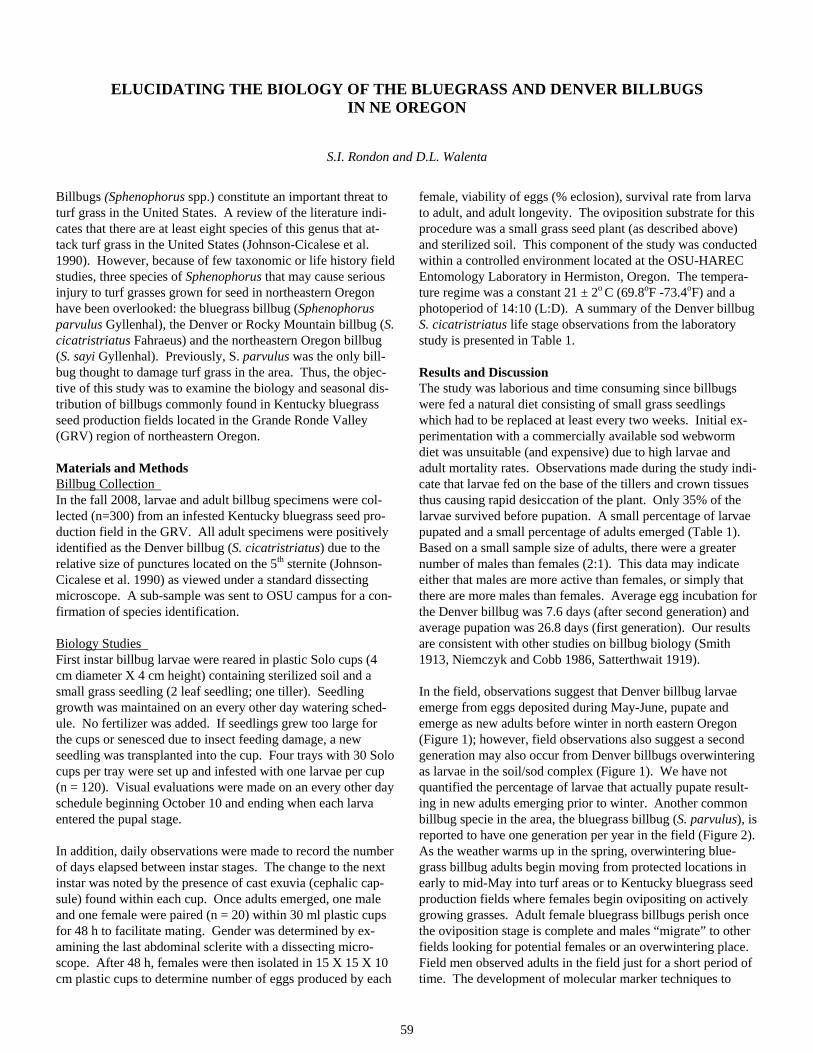
59
ELUCIDATING THE BIOLOGY OF THE BLUEGRASS AND DENVER BILLBUGS IN NE OREGON
S.I. Rondon and D.L. Walenta
Billbugs (Sphenophorus spp.) constitute an important threat to turf grass in the United States. A review of the literature indi-cates that there are at least eight species of this genus that at-tack turf grass in the United States (Johnson-Cicalese et al. 1990). However, because of few taxonomic or life history field studies, three species of Sphenophorus that may cause serious injury to turf grasses grown for seed in northeastern Oregon have been overlooked: the bluegrass billbug (Sphenophorus parvulus Gyllenhal), the Denver or Rocky Mountain billbug (S. cicatristriatus Fahraeus) and the northeastern Oregon billbug (S. sayi Gyllenhal). Previously, S. parvulus was the only bill-bug thought to damage turf grass in the area. Thus, the objec-tive of this study was to examine the biology and seasonal dis-tribution of billbugs commonly found in Kentucky bluegrass seed production fields located in the Grande Ronde Valley (GRV) region of northeastern Oregon.
Materials and Methods Billbug Collection In the fall 2008, larvae and adult billbug specimens were col-lected (n=300) from an infested Kentucky bluegrass seed pro-duction field in the GRV. All adult specimens were positively identified as the Denver billbug (S. cicatristriatus) due to the relative size of punctures located on the 5th sternite (Johnson-Cicalese et al. 1990) as viewed under a standard dissecting microscope. A sub-sample was sent to OSU campus for a con-firmation of species identification.
Biology Studies First instar billbug larvae were reared in plastic Solo cups (4 cm diameter X 4 cm height) containing sterilized soil and a small grass seedling (2 leaf seedling; one tiller). Seedling growth was maintained on an every other day watering sched-ule. No fertilizer was added. If seedlings grew too large for the cups or senesced due to insect feeding damage, a new seedling was transplanted into the cup. Four trays with 30 Solo cups per tray were set up and infested with one larvae per cup (n = 120). Visual evaluations were made on an every other day schedule beginning October 10 and ending when each larva entered the pupal stage.
In addition, daily observations were made to record the number of days elapsed between instar stages. The change to the next instar was noted by the presence of cast exuvia (cephalic cap-sule) found within each cup. Once adults emerged, one male and one female were paired (n = 20) within 30 ml plastic cups for 48 h to facilitate mating. Gender was determined by ex-amining the last abdominal sclerite with a dissecting micro-scope. After 48 h, females were then isolated in 15 X 15 X 10 cm plastic cups to determine number of eggs produced by each
female, viability of eggs (% eclosion), survival rate from larva to adult, and adult longevity. The oviposition substrate for this procedure was a small grass seed plant (as described above) and sterilized soil. This component of the study was conducted within a controlled environment located at the OSU-HAREC Entomology Laboratory in Hermiston, Oregon. The tempera-ture regime was a constant 21 ± 2o C (69.8oF -73.4oF) and a photoperiod of 14:10 (L:D). A summary of the Denver billbug S. cicatristriatus life stage observations from the laboratory study is presented in Table 1.
Results and Discussion The study was laborious and time consuming since billbugs were fed a natural diet consisting of small grass seedlings which had to be replaced at least every two weeks. Initial ex-perimentation with a commercially available sod webworm diet was unsuitable (and expensive) due to high larvae and adult mortality rates. Observations made during the study indi-cate that larvae fed on the base of the tillers and crown tissues thus causing rapid desiccation of the plant. Only 35% of the larvae survived before pupation. A small percentage of larvae pupated and a small percentage of adults emerged (Table 1). Based on a small sample size of adults, there were a greater number of males than females (2:1). This data may indicate either that males are more active than females, or simply that there are more males than females. Average egg incubation for the Denver billbug was 7.6 days (after second generation) and average pupation was 26.8 days (first generation). Our results are consistent with other studies on billbug biology (Smith 1913, Niemczyk and Cobb 1986, Satterthwait 1919).
In the field, observations suggest that Denver billbug larvae emerge from eggs deposited during May-June, pupate and emerge as new adults before winter in north eastern Oregon (Figure 1); however, field observations also suggest a second generation may also occur from Denver billbugs overwintering as larvae in the soil/sod complex (Figure 1). We have not quantified the percentage of larvae that actually pupate result-ing in new adults emerging prior to winter. Another common billbug specie in the area, the bluegrass billbug (S. parvulus), is reported to have one generation per year in the field (Figure 2). As the weather warms up in the spring, overwintering blue-grass billbug adults begin moving from protected locations in early to mid-May into turf areas or to Kentucky bluegrass seed production fields where females begin ovipositing on actively growing grasses. Adult female bluegrass billbugs perish once the oviposition stage is complete and males “migrate” to other fields looking for potential females or an overwintering place. Field men observed adults in the field just for a short period of time. The development of molecular marker techniques to
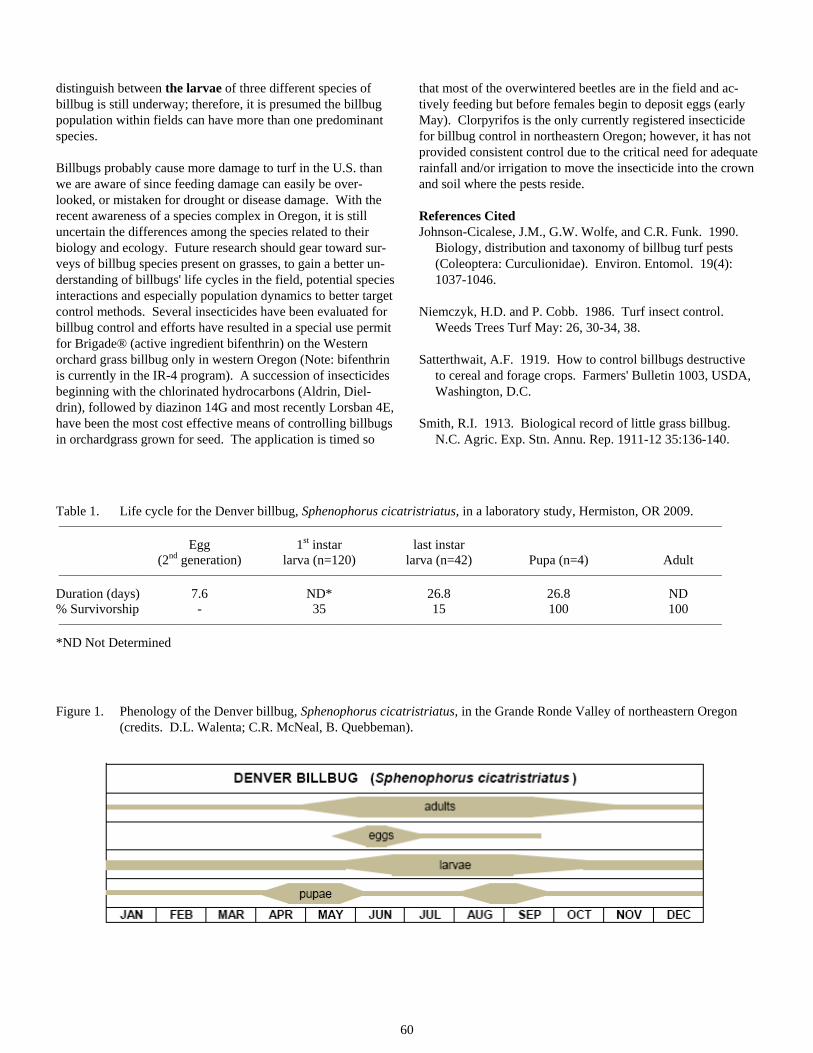
60
distinguish between the larvae of three different species of billbug is still underway; therefore, it is presumed the billbug population within fields can have more than one predominant species.
Billbugs probably cause more damage to turf in the U.S. than we are aware of since feeding damage can easily be over-looked, or mistaken for drought or disease damage. With the recent awareness of a species complex in Oregon, it is still uncertain the differences among the species related to their biology and ecology. Future research should gear toward sur-veys of billbug species present on grasses, to gain a better un-derstanding of billbugs' life cycles in the field, potential species interactions and especially population dynamics to better target control methods. Several insecticides have been evaluated for billbug control and efforts have resulted in a special use permit for Brigade® (active ingredient bifenthrin) on the Western orchard grass billbug only in western Oregon (Note: bifenthrin is currently in the IR-4 program). A succession of insecticides beginning with the chlorinated hydrocarbons (Aldrin, Diel-drin), followed by diazinon 14G and most recently Lorsban 4E, have been the most cost effective means of controlling billbugs in orchardgrass grown for seed. The application is timed so
that most of the overwintered beetles are in the field and ac-tively feeding but before females begin to deposit eggs (early May). Clorpyrifos is the only currently registered insecticide for billbug control in northeastern Oregon; however, it has not provided consistent control due to the critical need for adequate rainfall and/or irrigation to move the insecticide into the crown and soil where the pests reside.
References Cited Johnson-Cicalese, J.M., G.W. Wolfe, and C.R. Funk. 1990.
Biology, distribution and taxonomy of billbug turf pests (Coleoptera: Curculionidae). Environ. Entomol. 19(4): 1037-1046.
Niemczyk, H.D. and P. Cobb. 1986. Turf insect control. Weeds Trees Turf May: 26, 30-34, 38.
Satterthwait, A.F. 1919. How to control billbugs destructive to cereal and forage crops. Farmers' Bulletin 1003, USDA, Washington, D.C.
Smith, R.I. 1913. Biological record of little grass billbug. N.C. Agric. Exp. Stn. Annu. Rep. 1911-12 35:136-140.
Table 1. Life cycle for the Denver billbug, Sphenophorus cicatristriatus, in a laboratory study, Hermiston, OR 2009. ____________________________________________________________________________________________________________________________
Egg 1st instar last instar (2nd generation) larva (n=120) larva (n=42) Pupa (n=4) Adult ____________________________________________________________________________________________________________________________
Duration (days) 7.6 ND* 26.8 26.8 ND % Survivorship - 35 15 100 100 ____________________________________________________________________________________________________________________________
*ND Not Determined
Figure 1. Phenology of the Denver billbug, Sphenophorus cicatristriatus, in the Grande Ronde Valley of northeastern Oregon (credits. D.L. Walenta; C.R. McNeal, B. Quebbeman).
61
Figure 2. Phenology of the Bluegrass billbug, Sphenophorus parvulus, in the Grande Ronde Valley of northeastern Oregon (cred-its. D.L. Walenta; C.R. McNeal, B. Quebbeman).


This report has been published with a grant from the Oregon Seed Council
Appreciation is expressed to the Officers of the 2010-2011 Oregon Seed Council:
Larry Venell, President John Odenthal, FirstVice President
Nick Bowers, Second Vice President Don Doerfler, Treasurer
Roger Beyer, Executive Secretary
Business Address
Oregon Seed Council 494 State Street, Suite 220
Salem, OR 97301
Tel: (503) 585-1157 FAX: (503) 585-1292
E-mail: [email protected] www.OregonSeedCouncil.org
Sincere appreciation is also extended to the growers who have allowed trials to be conducted on their farms. Data presented in many of the research
reports would not be available without their cooperation.
Lastly, appreciation is also expressed to Mrs. Barbara Reed for her conscientious attention to detail in formatting this manuscript for publication.
Now available online at http://cropandsoil.oregonstate.edu/seed-ext

Agriculture, Family and Community Development, 4-H Youth, Forestry, Energy and Extension Sea Grant Programs. Oregon State University, United States Department of Agriculture, and Oregon counties cooperating. The Extension Service offers its programs and materials equally to all people.