Embed Size (px)
Citation preview

1
ArevaEPRDCPEm Resource
From: BRYAN Martin (EXTERNAL AREVA) [[email protected]]Sent: Wednesday, June 30, 2010 1:37 PMTo: Tesfaye, GetachewCc: ROMINE Judy (AREVA); SLAY Lysa (AREVA); RYAN Tom (AREVA); WILLIFORD Dennis
(AREVA); PATTON Jeff (AREVA); COLEMAN Sue (AREVA); GARDNER George Darrell (AREVA); Carneal, Jason; GUCWA Len (EXTERNAL AREVA); SALM Robert (AREVA); MOLSEED Chris (AREVA); STOUDT Roger (AREVA)
Subject: DRAFT Response to U.S. EPR Design Certification Application RAI No. 266, FSAR Ch 6, Supplement 7, Questions 06.02.01.04-4 and 06.02.02-33
Attachments: RAI 266 Supplement 7 Response US EPR DC - DRAFT.pdf
Getachew, Earlier today AREVA provided RAI Supplement 6 to provide revised dates for the final response, including questions 06.02.01.04-4 and 06.02.02-33 (August 4, 2010). To support interacting with the NRC on these questions, a draft response is attached. Let me know if the staff has any questions or if the response can be sent as final. Thanks, Martin (Marty) C. Bryan U.S. EPR Design Certification Licensing Manager AREVA NP Inc. Tel: (434) 832-3016 702 561-3528 cell [email protected]

Hearing Identifier: AREVA_EPR_DC_RAIs Email Number: 1643 Mail Envelope Properties (BC417D9255991046A37DD56CF597DB7106B69E48) Subject: DRAFT Response to U.S. EPR Design Certification Application RAI No. 266, FSAR Ch 6, Supplement 7, Questions 06.02.01.04-4 and 06.02.02-33 Sent Date: 6/30/2010 1:36:55 PM Received Date: 6/30/2010 1:37:03 PM From: BRYAN Martin (EXTERNAL AREVA) Created By: [email protected] Recipients: "ROMINE Judy (AREVA)" <[email protected]> Tracking Status: None "SLAY Lysa (AREVA)" <[email protected]> Tracking Status: None "RYAN Tom (AREVA)" <[email protected]> Tracking Status: None "WILLIFORD Dennis (AREVA)" <[email protected]> Tracking Status: None "PATTON Jeff (AREVA)" <[email protected]> Tracking Status: None "COLEMAN Sue (AREVA)" <[email protected]> Tracking Status: None "GARDNER George Darrell (AREVA)" <[email protected]> Tracking Status: None "Carneal, Jason" <[email protected]> Tracking Status: None "GUCWA Len (EXTERNAL AREVA)" <[email protected]> Tracking Status: None "SALM Robert (AREVA)" <[email protected]> Tracking Status: None "MOLSEED Chris (AREVA)" <[email protected]> Tracking Status: None "STOUDT Roger (AREVA)" <[email protected]> Tracking Status: None "Tesfaye, Getachew" <[email protected]> Tracking Status: None Post Office: AUSLYNCMX02.adom.ad.corp Files Size Date & Time MESSAGE 568 6/30/2010 1:37:03 PM RAI 266 Supplement 7 Response US EPR DC - DRAFT.pdf 1063581 Options Priority: Standard Return Notification: No Reply Requested: No Sensitivity: Normal Expiration Date: Recipients Received:


Response to
Request for Additional Information No. 266, Supplement 7
9/10/2009
U.S. EPR Standard Design Certification AREVA NP Inc.
Docket No. 52-020 SRP Section: 06.02.01 - Containment Functional Design SRP Section: 06.02.01.02 - Sub-compartment Analysis
SRP Section: 06.02.01.03 - Mass and Energy Release Analysis for Postulated Loss-of-Coolant Accidents (LOCAs)
SRP Section: 06.02.01.04 - Mass and Energy Release Analysis for Postulated Secondary System Pipe Ruptures
SRP Section: 06.02.02 - Containment Heat Removal Systems
Application Section: FSAR Chapter 6
QUESTIONS for Containment and Ventilation Branch 1 (AP1000/EPR Projects) (SPCV)
Draft
eleasents (LOCents (LOC
rgy Release Anagy Release em Pipe Ruptures Pipe Ruptures
tainment Heat Removal Synt Heat Removal Sy
n Section: FSAR Chapter 6 on: FSAR Chapter
ment and Ventilatid Ventilation Branchon Branch(SPCV)CV)

AREVA NP Inc.
Response to Request for Additional Information No. 266, Supplement 6 U.S. EPR Design Certification Application Page 2 of 25
Question 06.02.01.04-4:
This question relates to conservativeness of the secondary system break mass and energy release calculations in FSAR Section 6.2.1.4. In RAI #82 6.01.02.04-1d the staff questioned the assumptions used to calculate reactor power following a main steam line break and the effect of these assumptions on containment analysis. In the response AREVA provided a curve of reactor power vs. time for the MSLB case calculated to produce the highest calculated containment temperature and pressure. This was for a postulated double ended break with the reactor at an initial power level of 50%. Offsite power was assumed to remain available so that the reactor coolant pumps would continue to operate. The break flow was assumed to be limited by the area of the flow restrictors in the steam generator nozzles to 1.4 ft2. The RELAP5/Mod2-B&W computer code was used to model the reactor system. No return to power was calculated even though the most reactive control rod was assumed to be stuck and to not enter the core following reactor trip.
AREVA also evaluated the consequences of a main steam line break in FSAR Section 15.1.5 to determine the potential for reactor core damage. In these evaluations the S-RELAP5 computer code was used. For the limiting break a return to power was calculated which reached a maximum of 23.14% over a period of approximately 200 seconds. This energy generation is sufficient, if considered in the containment analysis to have a considerable effect on the calculated containment temperature and pressure. In the response to RAI #34 15.01.05-2, AREVA provided the results from the sensitivity study of postulated steam line breaks for which the potential for core damage was evaluated. Initial power levels of 100%, 60%, 25% and 0% were investigated using S-RELAP5. The core was calculated to return to power generation following reactor trip regardless of the initial power level. The staff understands that part of the reason that return to power was calculated for the Chapter 15 analyses but not for the Chapter 6 analysis, was that a much higher control rod shutdown margin was assumed for the Chapter 6 analyses as compared with the Chapter 15 analyses. Provide analyses of the containment response to postulated main steam line breaks for which the core physics assumptions are consistent or conservative as compared to those which the staff is reviewing to support the main steam line break analyses in FSAR chapter 15.
The above questions are follow-up questions to previously issued RAIs and the containment audit held in Lynchburg on July 14 and 15, 2009.
Response to Question 06.02.01.04-4:
The limiting S-RELAP5 main steam line break (MSLB) event scenario (in terms of core consequences from post-scram return-to-criticality) has been previously identified in U.S. EPR FSAR Tier 2, Section 15.1.5 as a postulated 1.72 ft2 break in a main steam line upstream of the affected steam generator (SG) main steam isolation valve (MSIV) at end-of-cycle (EOC) hot-zero-power (HZP) conditions with offsite power remaining available to operate the reactor coolant pumps. The MSLB effluent discharge, although assumed in U.S. EPR FSAR Tier 2, Chapter 15 to be outside containment but upstream of the MSIV (i.e., atmospheric back-pressure), constitutes a consistent basis upon which to formulate the mass and energy release rates (M&E) for an in-containment MSLB containment analysis in U.S. EPR FSAR Tier 2, Chapter 6. The single failure assumed in identifying the limiting case MSLB with respect to U.S. EPR FSAR Tier 2, Chapter 15 core consequences is a main steam relief control valve (MSRCV) that remains fully open on an SG unaffected by the break location subsequent to MSIV closure.
Draft
as
steam line breaksteam line breIn these evaluations thhese evaluation
to power was calculated wher was calculated whimately 200 seconds. This ene00 seconds. This ene
t analysis to have a considerables to have a considerabled pressure. In the response to Rure. In the response
e sensitivity study of postulated sty study of postulated sevaluated. Initial power levels oed. Initial power level
AP5. The core was calculated toe core was calculated tess of the initial power level. The initial power level. Th
r was calculated for the Chapterwas calculated for the Chapterch higher control rod shutdown mch higher control rod sh
ed with the Chapter 15 analyses.d with the Chapter 15 analysated main steam line breaks for ted main steam line breaks forDvative as compared to thosevative as compared to
ses in FSAR chapter 1ses in FSAR chapte
ow-up quesow-up quesy 14 any 14 an

AREVA NP Inc.
Response to Request for Additional Information No. 266, Supplement 6 U.S. EPR Design Certification Application Page 3 of 25
The MSRCV effluent discharge to atmosphere is independent of MSLB mass and energy flow into containment and, therefore, does not contribute to containment M&Es.
The limiting U.S. EPR FSAR Tier 2, Chapter 15 MSLB case, together with several other scenarios, was investigated using the U.S. EPR FSAR Tier 2, Chapter 15 S-RELAP5 methodology to confirm the limiting initial plant conditions and MSLB size and single failure relative to severity of containment response (see Table 06.02.01.04-4-1). These include:
A 1.72 ft2 MSLB from EOC HZP upstream of the MSIV with single failure of an unaffected SG MSRCV to close (offsite power available).
A double-ended guillotine (DEG) MSLB from EOC HZP upstream of the MSIV with single failure of an unaffected SG MSRCV to close (offsite power available).
A 1.72 ft2 MSLB from EOC HZP upstream of the MSIV with single failure of the affected SG MSIV to close (offsite power available).
A DEG MSLB from EOC 25 percent rated thermal power (RTP) upstream of the MSIV with single failure of the affected SG MSIV to close (offsite power available).
Figure 06.02.01.04-4-1 shows the results of the four U.S. EPR FSAR Tier 2, Chapter 15 S-RELAP5 methodology-based GOTHIC calculations previously mentioned, together with GOTHIC calculations (RELAP5-BW M&Es) of the limiting U.S. EPR FSAR Tier 2, Chapter 6 analysis of record (DEG MSLB from 20 percent RTP) (green curve) and a U.S. EPR FSAR Tier 2, Chapter 6-based double-ended MSLB from HZP (blue curve). The results indicate:
The limiting U.S. EPR FSAR Tier 2, Chapter 15-based S-RELAP5 HZP 1.72ft2 MSLB calculated peak containment pressure (with no credit taken for high Pcont pressure isolation) is not bounded by the limiting U.S. EPR FSAR Tier 2, Chapter 6-based RELAP5-BW 20 percent power DEG MSLB calculated peak containment pressure.
The limiting single failure in terms of containment consequences is the failure of the affected SG MSIV to close.
The limiting U.S. EPR FSAR Tier 2, Chapter 15-based MSLB scenario in terms of containment consequences is the 1.72 ft2 split MSLB from HZP EOC conditions with failure of the affected SG MSIV to close and no loss of offsite power (LOOP).
The overall results of the S-RELAP5/GOTHIC containment analyses indicate that the limiting Chapter 15-based HZP MSLB scenario is not bounded by the corresponding U.S. EPR FSAR Tier 2, Chapter 6 limiting case MSLB scenario although no credit is taken for high containment pressure (Pcont) isolation in any of the S-RELAP5 analyses.
In order to quantify the conservatism inherent in the U.S. EPR FSAR Tier 2, Chapter 6 methodology, the results of a postulated unisolable EOC HZP 1.72ft2 MSLB, using a U.S. EPR S-RELAP5 best-estimate (BE) model, were compared to the U.S. EPR FSAR Tier 2, Chapter 6 limiting MSLB analysis of record and the limiting containment consequence U.S. EPR FSAR Tier 2, Chapter 15-based MSLB containment analysis results previously mentioned. Successive S-RELAP5 parameterization runs were undertaken implementing individual bounding assumptions one at a time while incrementally transforming the BE model into a best-estimate evaluation model (BEEM). The GOTHIC peak containment pressure results quantified the added conservatism afforded by each additional bounding assumption in assessing the overall conservatism in the calculated peak containment pressure figure of merit. All cases
Draft
with
al power (RTP) upl power (RTPe (offsite power availablffsite power ava
the four U.S. EPR FSAR Tier 2.S. EPR FSAR Tier 2lculations previously mentionedns previously mentioned
&Es) of the limiting U.S. EPR FShe limiting U.S. EPR 20 percent RTP) (nt RTP) (green curvegreen curve))
MSLB from HZP (from HZP (blue curveblue curve).
AR Tier 2, Chapter 15-based S-R2, Chapter 15-based Sment pressure (with no credit taent pressure (with no credit ta
e limiting U.S. EPR FSAR Tier 2e limiting U.S. EPR FSAR Tier 2
DrG MSLB calculated peak containG MSLB calculated peak c
gle failure in terms of containmgle failure in terms of containmee
R FSAR Tier 2, ChaR FSAR Tier 2, CDces is the 1.7ces is the 1.7o close ao close a
AREVA NP Inc.
Response to Request for Additional Information No. 266, Supplement 6 U.S. EPR Design Certification Application Page 4 of 25
were run using S-RELAP5 to generate M&Es for subsequent GOTHIC analyses. In order to afford a common basis of comparison for computed M&E release rates between methodologies, Moody single-velocity critical flow modeling at the break plane was used throughout. All cases assumed offsite power remained available. The individual cases included (in order of execution):
1. BE: base case - 1.72 ft2 unisolable MSLB from EOC HZP (no single failure) using Moody critical flow modeling at the break.
2. BE+: base case PLUS implementation of a second RELAP5 SEPARATR component model at the SG#4 dryer elevation to afford nearly steam only exiting the affected SG.
3. BEEM: case #2 PLUS single failure of the affected SG#4 MSIV to close.
4. BEEM: case #3 PLUS bounding emergency feed water (EFW) flow to the affected SG initiated at break initiation (t0); PLUS post-scram shutdown margin (SDM) reduction to 6000 pcm.
5. BEEM: case #4 PLUS limiting main feed water (MFW) flow to the affected SG (complete replacement of affected SG inventory lost out the break until MFW isolation--analogous to the limiting U.S. EPR FSAR Tier 2, Chapter 15.1.5 MSLB case) at minimum temperature (250°F); PLUS degraded ECC injection flow/boron concentration and Technical Specification (TS) minimum emergency core coolant (ECC) temperature (59°F); PLUS minimum EFW temperature (50°F); PLUS TS minimum SDM (3000pcm).
No credit was taken for the high containment pressure isolation signal in any of these calculations, which would isolate main steam and main feed and, thereby, foreshorten the duration and extent of the overcooling event. This is an additional conservatism because crediting the isolation signal would curtail M&E releases to the containment. The quantification of conservatism results are shown in Table 06.02.01.04-4-2 and Figure 06.02.01.04-4-2.
Bounding MFW (Case 5) is the largest single contributor to added conservatism in terms of increased containment peak pressure, which is the figure of merit. This effect is magnified in the U.S. EPR FSAR Tier 2, Chapter 15 evaluation model (EM) due to specific modeling techniques designed to maximize core consequences.
The U.S. EPR FSAR Tier 2, Chapter 15.1.5 limiting MSLB scenario bounding peak containment pressure is attributed to modeling differences between the U.S. EPR FSAR Tier 2, Chapter 6 EM and U.S. EPR FSAR Tier 2, Chapter 15 EM. A comparison of the modeling features of the three models (BE, Chapter 6 EM, Chapter 15 EM) reveals three major modeling differences in the U.S. EPR FSAR Tier 2, Chapter 15 EM (shown in bold in Table 06.02.01.04-4-3) affecting the calculation of the peak containment pressure. These include:
Single-node SG boiler section modeling
Limiting MFW introduction (complete replacement of affected SG inventory lost out the break until MFW isolation).
Skewed stuck-rod region reactivity weighting.
The conservatisms incorporated into the U.S. EPR FSAR Tier 2, Chapter 15 EM are intended to create circumstances maximizing core consequences. These circumstances are unnecessarily
Draft
(Edown mow
r (MFW) flow to the aMFW) flow to tut the break until MFW isobreak until MFW
er 15.1.5 MSLB case) at minimMSLB case) at minim flow/boron concentration and Tconcentration and T
ncy core coolant (ECC) temperacoolant (ECC) tem); PLUS TS minimum SDM (300TS minimum SDM (30
containment pressure isolation sment pressure isolation ate main steam and main feed asteam and main feed
vercooling evenrcooling event. This is an addis an adnal would curtail M&E releases nal would curtail M&E releases
Drs are shown in Table 06.02.01.0s are shown in Table 06.02
ase 5) is the largest single conase 5) is the largest single cont peak pressure, which ist peak pressure, whi
2, Chapter 15 eval2, Chapter 15 evDximize core coximize core c
apteapte

AREVA NP Inc.
Response to Request for Additional Information No. 266, Supplement 6 U.S. EPR Design Certification Application Page 5 of 25
conservative for the containment analysis. The conservatisms associated with these considerations are addressed in subsequent paragraphs.
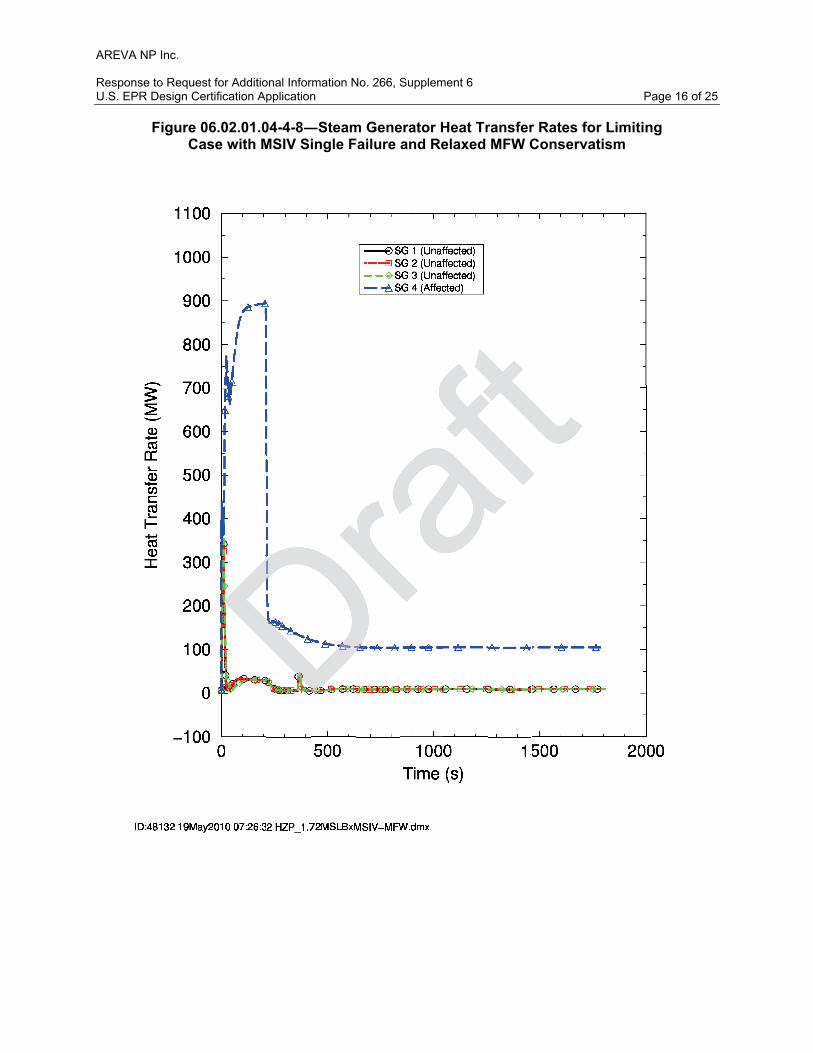
Compared to the U.S. EPR FSAR Tier 2, Chapter 6 EM commonly accepted SG nodalization scheme, the U.S. EPR FSAR Tier 2, Chapter 15 EM SG model consists of two nodes - a boiler section node and a steam dome node - joined by a special purpose junction that passes only steam. The net effect of this modeling approach is to enhance the primary-to-secondary heat transfer rate by placing SG liquid inventories in contact with SG secondary-side tube heat transfer surface areas all the time. There is no progressive SG heat transfer surface area degradation during SG dryout as evidenced by the heat transfer precipice in Figure 06.02.01.04-4-3. The blowdown M&E release rates are artificially enhanced, producing relatively higher calculated peak containment pressures.
Compared to the U.S. EPR FSAR Tier 2, Chapter 6 EM conservative MFW treatment during SG depressurization, the U.S. EPR FSAR Tier 2, Chapter 15 EM SG model completely replaces all affected SG inventories lost out the break until receipt of the MFW isolation signal. Approximately 46,000 lbm, in excess of a conservative 10,000 lbm bounding amount contained within the length of MFW piping under low-low MFW demand conditions, is introduced at 250°F, artificially delaying affected SG dryout and elevating M&Es (see Figure 06.02.01.04-4-4). The net effect of this modeling approach, coupled with the single-node boiler region noding, is to artificially prolong the viability of primary-to-secondary heat transfer enhancing the duration and extent of the overcooling event. The blowdown M&E release rates are artificially enhanced producing relatively higher calculated peak containment pressures.
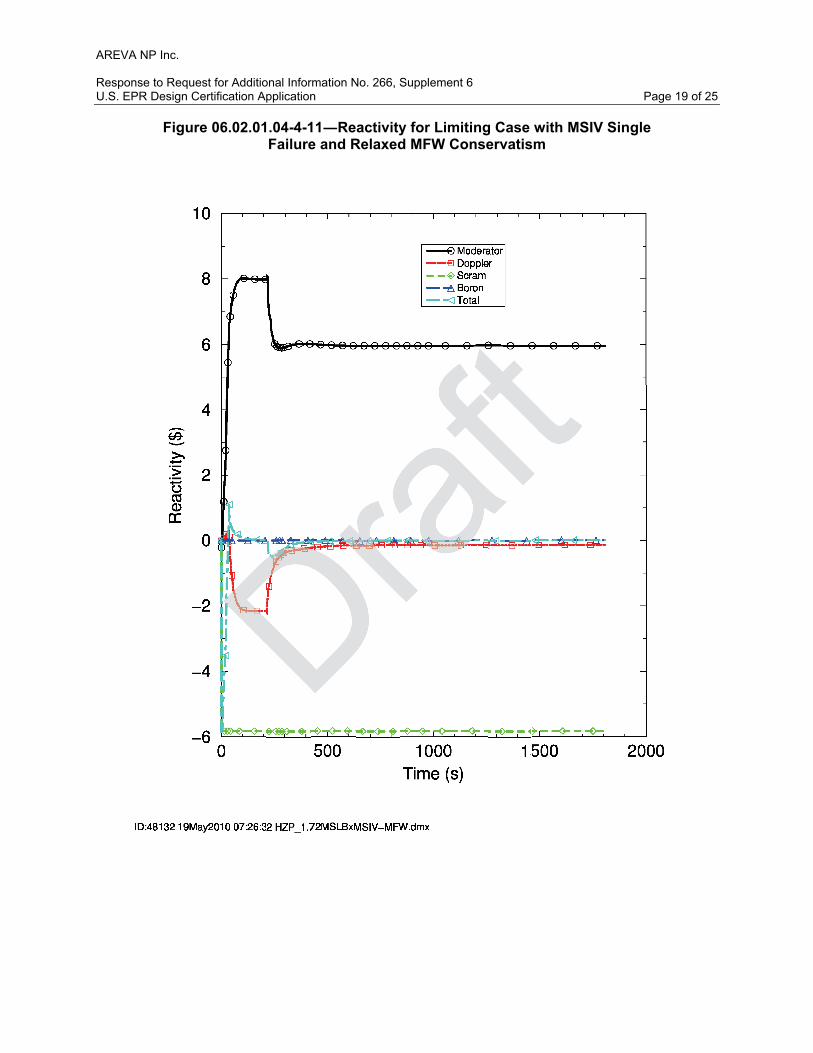
Compared to the U.S. EPR FSAR Tier 2, Chapter 6 EM conservative assumptions of 20 percent unaffected loop core flow inter-mixing with the affected loop (80 percent-20 percent flow split), together with 50 percent-50 percent affected-to-unaffected core sector reactivity weighting, the U.S. EPR FSAR Tier 2, Chapter 15 EM reactor vessel/core model assumes no loop inter-mixing, and, reactivity weighting heavily skewed toward the stuck rod region. The net effect of this modeling approach is to confine the overcooling to the affected loop only, resulting in a recriticality in which approximately 50 percent of the total return to power occurs in the stuck-rod region alone, with approximately 80 percent of the total return to power occurring in the affected quarter-core sector (see Figure 06.02.01.04-4-5). Coupled with the excessive MFW flow, this results in a quasi-steady return to approximately 23 percent power, artificially enhancing M&E releases, and producing relatively higher calculated peak containment pressures.
In order to validate the results, the limiting U.S. EPR FSAR Tier 2, Chapter 15.1.5 EM MSLB scenario, with alternate failure of the affected SG MSIV to close, was repeated using relaxed conservatism with respect to affected SG MFW flow. A limit of 10,000 lbm MFW flow into the affected SG was applied to the model consistent with bounding the mass of MFW in the main feed line downstream of the low flow control valve during very-low flow conditions.
The U.S. EPR plant response to a 1.72 ft2 break in a main steam line upstream of the MSIV at EOC HZP conditions, assuming that (1) offsite power remains available, (2) the affected SG MSIV sticks in the fully open position, and, (3) a maximum of 10,000 lbm MFW flow is allowed into the affected SG during its depressurization, has been simulated with S-RELAP5 using the U.S. EPR FSAR Tier 2, Chapter 15 EM, as modified above, to generate M&Es for subsequent multi-node GOTHIC containment analysis. Key parameter results are shown in Figure 06.02.01.04-4-7 through Figure 06.02.01.04-4-15.
Draft
coapter 15te
eak until receeak until receconservative 10,0conservative
der low-low MFW demalow-low MFW dected SG dryout and elevatinG dryout and elevatin
modeling approach, coupled withapproach, coupled witolong the viability of primary-to-se viability of primary-to-
d extent of the overcooling eventof the overcooling evnced producing relatively higherducing relatively highe
R FSAR Tier 2, Chapter 6 EM coTier 2, Chapter 6 EM p core flow inter-mixing with the aore flow inter-mixing with the a
with 50 percent-50 percent affectith 50 percent-50 percent affec
Dr. EPR FSAR Tier 2, Chapter 15 EPR FSAR Tier 2, Chapte
xing, and, reactivity weighting hexing, and, reactivity weighting hf this modeling approach is tof this modeling approac
recriticality in which apprecriticality in which od region alone, witod region alone, w
affected quarteaffected quartow, this ow, this
anan

AREVA NP Inc.
Response to Request for Additional Information No. 266, Supplement 6 U.S. EPR Design Certification Application Page 6 of 25
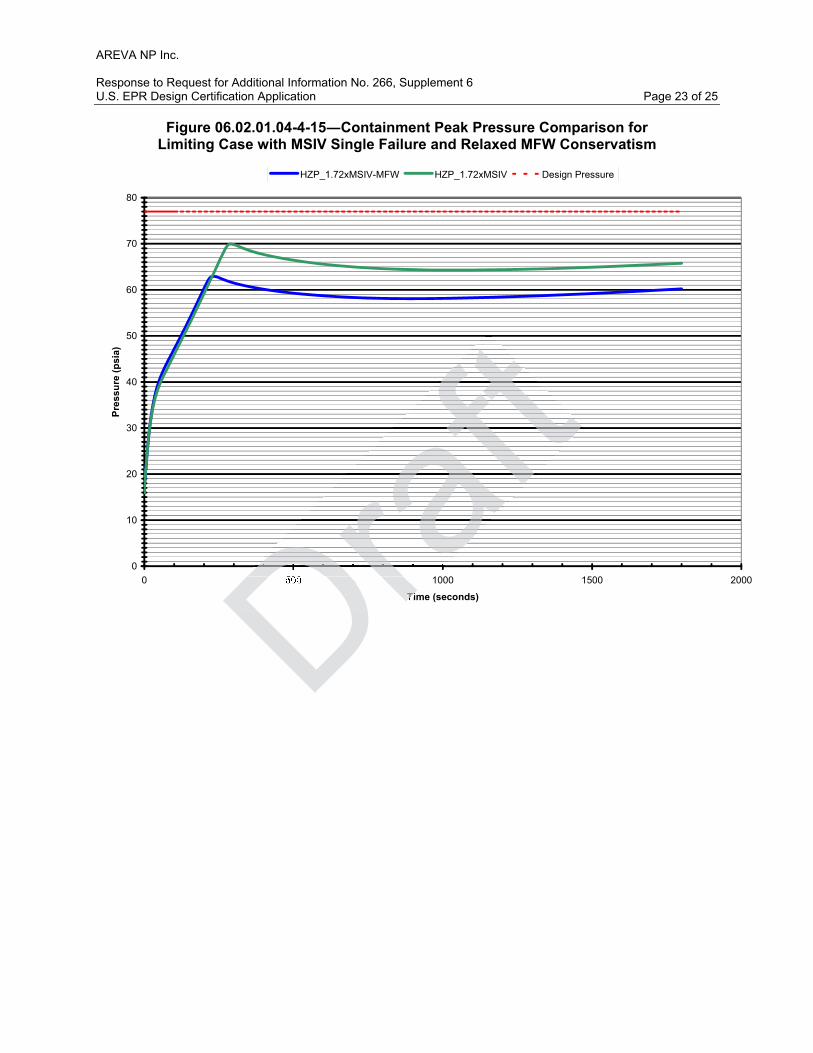
As shown in Figure 06.02.01.04-4-15, the relaxed MFW conservatism case (blue curve)produces a peak containment pressure approximately 7 psi lower than the limiting MFW case (green curve). As shown in Figure 06.02.01.04-4-16, the approximate 63 psia relaxed conservatism peak pressure (orange curve) is comparable to the result from the counterpart U.S. EPR FSAR Tier 2, Chapter 6 EM 1.72 ft2 MSLB (pink curve) (3000 pcm SDM), which takes credit for high Pcont isolation, whereas the relaxed MFW conservatism case does not. The net effect of taking credit for high Pcont isolation is to lower calculated peak containment pressure. The counterpart U.S. EPR FSAR Tier 2, Chapter 6 EM 1.72 ft2 MSLB calculated peak containment pressure, therefore, bounds the relaxed MFW conservatism calculated peak containment pressure and is itself bounded by the U.S. EPR FSAR Tier 2, Chapter 6 analysis of record peak containment pressure (green curve). The validation results clearly demonstrate that the Chapter 6 methodology conservatively bounds calculated peak containment pressure.
The intent of the guidelines in NUREG-0800 SRP, Section 6.2.1.4 is to conservatively bound the MSLB M&E releases to containment in calculating the limiting peak containment pressure. Figure 06.02.01.04-4-6 illustrates a U.S. EPR FSAR Tier 2, Chapter 6 methodology-based 1.72 ft2 counterpart MSLB scenario (3000 pcm SDM with credit for high Pcont isolation) calculated peak containment pressure (pink curve) of approximately 63 psia, which includes conservatisms of approximately 9 percent based on containment design pressure (red) when compared to best-estimate calculations (green curve) (7 psi P), and design margins of approximately 17 percent (13 psi P) on the same basis. The U.S. EPR FSAR Tier 2, Chapter 15 methodology (blue curve), which is intended for core consequence analysis, includes conservatisms of approximately 18 percent based on containment design pressure when compared to best-estimate calculations (14 psi P), when applied to containment analysis. The set of bounding circumstances for U.S. EPR FSAR Tier 2, Chapter 15 core consequence analysis is unnecessarily conservative for application to U.S. EPR FSAR Tier 2, Chapter 6 containment consequence analysis as demonstrated by the quantification of conservatism results, especially with regard to limiting MFW flow. Dr
aftn 6.2.16
imiting peakimiting peaTier 2, Chapter 6Tier 2, Chapt
th credit for high Pcredit for high Pcont iproximately 63 psia, which inately 63 psia, which i
ased on containment design preontainment design pregreen curveurve) (7 psi ) (7 psi P), and desP), and de
n the same basis. The U.S. EPme basis. The U.S. Eh is intended for core consequened for core consequen
8 percentnt
Dra based on containmen based on containme
culations (14 psi (14 p P), when appl), when appes for U.S. EPR FSAR Tier 2, CS. EPR FSAR Tier 2, C
conservative for application to Uconservative for application to Unce analysis as demonstrated bynce analysis as demonst
th regard to limiting MFW flow. th regard to limiting MFW flow

AREVA NP Inc.
Response to Request for Additional Information No. 266, Supplement 6 U.S. EPR Design Certification Application Page 7 of 25
Table 06.02.01.04-4-1 MSLB Containment Peak Pressure Results
S-RELAP5/GOTHIC Chapter 15 Methodology-based Containment Peak Pressure Results Initial Power,
(% Power) Break Size Single Failure Peak Pressure, (psia)
HZP 1.72 ft2 MSRCV 67.4 HZP 200% MSRCV 62.9 HZP 1.72 ft2 MSIV 69.8 25 200% MSIV 59.9
Table 06.02.01.04-4-2 MSLB Quantification of Conservatism Results
Case Scenario Total Energy at Peak Pcont
Min inlet Tcore at
SGDryout
Peak Pcont(psia)
Return to Power
1 BE EOC HZP 1.72ft2 MSLB (+Moody)
320.3x10⁶ BTUsBE base case ~453°F ~56* @ ~180s
(base)no
2 BE+ EOC HZP 1.72ft2 MSLB(+steam only)
~5.6x10⁶ BTUsadditional ~448°F ~58* @ ~180s
(+2psi) no
3 BEEM EOC HZP 1.72ft2 MSLB(+MSIV failure)
~34.1x10⁶ BTUs additional ~447°F ~61* @ ~200s
(+3psi) no
4 BEEM EOC HZP 1.72ft2 MSLB(+maxEFW)
~3.7x10⁶ BTUsadditional ~444°F ~62* @ ~200s
(+1psi) no
5 BEEM EOC HZP 1.72ft2 MSLB(+limiting MFW)
~104.8x10⁶
BTUs additional ~408°F ~72* @ ~340s (+10psi)
yes @ 260s
* No credit taken for high Pcont isolation
Draftrgy at rgy at
PPcontcon
MinTTcorecore
SGSDryout Dryoutttftftfttfttftttt0.3x106 BTUsBTUs
BE base case case ~453°F°F ~56~56ftftaftaftaftfttafttafttttt~5.6x106x1066 BTUs BTadditionaladditional ~448°F~448°aftaftafafaftafttafafttttMSLB
e) ~34.1x1034.1x1066 BTUs BTUs
additionaladdition ~44~4rrrafafraarafafaaf72ft2 MSLBSLBEFW)FW)
~3.7x101066 BTUs BTUsadditionalitionalrrDrDrDrraaDraDraaaZP 1.72ftZP 1.72ft22 MSLB MS
miting MFW) miting ~104.8x1
BTUs adBTUsDrDrDrDrDrDrDraDrDrDr

AREVA NP Inc.
Response to Request for Additional Information No. 266, Supplement 6 U.S. EPR Design Certification Application Page 8 of 25
Table 06.02.01.04-4-3 U.S. EPR HZP RELAP5 Input Model Comparisons
Feature BE (base model) Ch. 15 EM Ch. 6 EM
Reactivity BE EOC HZP; Equal weighting
Min SDM/MTC; Biased stuck rod region weighting
Min SDM/MTC; 50-50 weighting
Boundaryconditions
nominal EFW; nominal MFW; nominal ECC
Max EFW @ t0; limiting MFW flow;Degraded ECC
Max EFW @ t0; Conservative MFW; Degraded ECC
Single failure none MSRCV MSIV
Break fluid mixture 2-phase 1-phase 2-phase
Break critical flow model Moody Moody Moody
Rx core model ¼ - ¾ core sectors; 60-40 loop mixing
¼ - ¾ core sectors +stuck rod region; no loop mixing
¼ - ¾ core sectors; 80-20 loop mixing
SG model Representativenodalization
1-node boiler region w/ steam only junc.
Representativenodalization
Draftttft
core sectorscore sectors uck rod region; rod region;
no loop mixing mixing ftfttttt1-node boiler region boiler regw/ steam only junc. steam only junc.
RR
aaaafttafa taftt

AREVA NP Inc.
Response to Request for Additional Information No. 266, Supplement 6 U.S. EPR Design Certification Application Page 9 of 25
Figure 06.02.01.04-4-1 MSLB Containment Peak Pressure Comparisons
0
10
20
30
40
50
60
70
80
0 500 1000 1500 2000
Time (seconds)
Pres
sure
(psi
a)
S-R5_HZP1.72_PR2 S-R5_HZP4.12_PR18 S-R5_HZP1.72xMSIV_PR2S-R5_P25%4.12xMSIV_PR18 R5-BW_HZP4.12_PR30 R5-BW_P20%4.12_PR20Design Pressure
DraDraftDraDraDraDraDrararararararaafafafafafafafafaftaftaftaftaftaftftftftftftftftftftftftftftftfttttttraafftftt
DraDDDDrDraraaDraft500500 1000
Time (seconTime (s

AREVA NP Inc.
Response to Request for Additional Information No. 266, Supplement 6 U.S. EPR Design Certification Application Page 10 of 25
Figure 06.02.01.04-4-2 Parametric Bounding Assumption Added Conservatism Containment Pressure Results
0
10
20
30
40
50
60
70
80
0 500 1000 1500 2000
Time (seconds)
Pres
sure
(psi
a)
BE_HZP1.72base BE_HZP1.72stm BE_HZP1.72fail BE_HZP1.72efw BE_HZP1.72mfw Design Pressure
ttDrDraftDraDraDraDraDraDraDraDraDrarararararaafafafafafafafaftaftaftaftaftaftftftftftftftftftftftftftftttttraafftft
DrDDDDrDrararaDrtt
Dr500 1500
TimTi

AREVA NP Inc.
Response to Request for Additional Information No. 266, Supplement 6 U.S. EPR Design Certification Application Page 11 of 25
Figure 06.02.01.04-4-3 Steam Generator Heat Transfer Rates for Limiting Case with MSIV Single Failure

AREVA NP Inc.
Response to Request for Additional Information No. 266, Supplement 6 U.S. EPR Design Certification Application Page 12 of 25
Figure 06.02.01.04-4-4 Excess MFW in Limiting Chapter 15.1.5 MSLB Scenario

AREVA NP Inc.
Response to Request for Additional Information No. 266, Supplement 6 U.S. EPR Design Certification Application Page 13 of 25
Figure 06.02.01.04-4-5 Reactor Power for Limiting Case with MSIV Single Failure

AREVA NP Inc.
Response to Request for Additional Information No. 266, Supplement 6 U.S. EPR Design Certification Application Page 14 of 25
Figure 06.02.01.04-4-6 GOTHIC Calculated Peak Containment Pressure Comparisons
0
10
20
30
40
50
60
70
80
0 500 1000 1500 2000
Time (seconds)
Pres
sure
(psi
a)
BE_HZP1.72base Ch6EM1.72+3000pcm S-R5_HZP1.72xMSIV Design Pressure
DrDraftDrDrDraDraDraDraDraDraDrararararararaaafafafafafafaftaftaftaftaftftftftftftftftftftftftftftftfttttt
DraafaftfttDrDDDDrDrrDt
500
T
AREVA NP Inc.
Response to Request for Additional Information No. 266, Supplement 6 U.S. EPR Design Certification Application Page 15 of 25
Figure 06.02.01.04-4-7 Break Flow Rate Comparison for Limiting Case with MSIV Single Failure and Relaxed MFW Conservatism
AREVA NP Inc.
Response to Request for Additional Information No. 266, Supplement 6 U.S. EPR Design Certification Application Page 16 of 25
Figure 06.02.01.04-4-8 Steam Generator Heat Transfer Rates for Limiting Case with MSIV Single Failure and Relaxed MFW Conservatism

AREVA NP Inc.
Response to Request for Additional Information No. 266, Supplement 6 U.S. EPR Design Certification Application Page 17 of 25
Figure 06.02.01.04-4-9 Feedwater Flow Rates for Limiting Case with MSIV Single Failure and Relaxed MFW Conservatism

AREVA NP Inc.
Response to Request for Additional Information No. 266, Supplement 6 U.S. EPR Design Certification Application Page 18 of 25
Figure 06.02.01.04-4-10 Steam Generator Secondary-Side Coolant Inventories for Limiting Case with MSIV Single Failure and Relaxed MFW
Conservatism
AREVA NP Inc.
Response to Request for Additional Information No. 266, Supplement 6 U.S. EPR Design Certification Application Page 19 of 25
Figure 06.02.01.04-4-11 Reactivity for Limiting Case with MSIV Single Failure and Relaxed MFW Conservatism

AREVA NP Inc.
Response to Request for Additional Information No. 266, Supplement 6 U.S. EPR Design Certification Application Page 20 of 25
Figure 06.02.01.04-4-12 Reactor Power for Limiting Case with MSIV Single Failure and Relaxed MFW Conservatism

AREVA NP Inc.
Response to Request for Additional Information No. 266, Supplement 6 U.S. EPR Design Certification Application Page 21 of 25
Figure 06.02.01.04-4-13 Integrated Break Mass Flowrate Comparison for Limiting Case with MSIV Single Failure and Relaxed MFW Conservatism

AREVA NP Inc.
Response to Request for Additional Information No. 266, Supplement 6 U.S. EPR Design Certification Application Page 22 of 25
Figure 06.02.01.04-4-14 Integrated Break Energy Flowrate Comparison for Limiting Case with MSIV Single Failure and Relaxed MFW Conservatism
AREVA NP Inc.
Response to Request for Additional Information No. 266, Supplement 6 U.S. EPR Design Certification Application Page 23 of 25
Figure 06.02.01.04-4-15 Containment Peak Pressure Comparison for Limiting Case with MSIV Single Failure and Relaxed MFW Conservatism
0
10
20
30
40
50
60
70
80
0 500 1000 1500 2000
Time (seconds)
Pres
sure
(psi
a)
HZP_1.72xMSIV-MFW HZP_1.72xMSIV Design Pressure
ftftftftfttttttftftftftftftftftftftaftafafafaftaftaftaftaftaftrafrararararaafafafafDraDraDraDraDraDraDraDraDraDraraafDrftftt
DrDDDDrDDrDrararaDr500
Ti

AREVA NP Inc.
Response to Request for Additional Information No. 266, Supplement 6 U.S. EPR Design Certification Application Page 24 of 25
Figure 06.02.01.04-4-16 Comparison of Results
0
10
20
30
40
50
60
70
80
0 500 1000 1500 2000
Time (seconds)
Pres
sure
(psi
a)
S-R5_HZP1.72_PR2 S-R5_HZP1.72xMSIV_PR2 R5-BW_P20%4.12_PR20S-R5_HZP1.72xMSIV-MFW Ch6EM1.72+3000pcm Design Pressure
FSAR Impact:
The U.S. EPR FSAR will not be changed as a result of this question. DraDraftDraDraDraDraDraDraDrarararararaaafafafafafafafaftaftaftaftaftaftftftftftftftftftftftftftftfttttttraafftftt
DraDDDDrDrararaDraftD
500 10
TimeTim
be changebe change
AREVA NP Inc.
Response to Request for Additional Information No. 266, Supplement 6 U.S. EPR Design Certification Application Page 25 of 25
Question 06.02.02-33:
This question relates to containment heat removal systems in FSAR Section 6.2.2.
In RAI #82 6.02.02-1a, the staff requested that AREVA justify the statements, that: (1) in the LHSI heat exchangers conservative fouling factors were used; and (2) the GOTHIC heat exchanger model is a conservative representation. The response to the RAI provided the fouling factors, characterizing them as typical. It was mentioned that the fouling factors can be monitored with available systems information. The response also indicates , that benchmarking of the GOTHIC heat exchanger model against heat exchanger performance data yielded an overall heat transfer coefficient, UA value, of 2.47 E + 06 BTU/(hr-F°).
The containment analysis seems to use an overall heat transfer coefficient of 3.53 E + 06 BTU/(hr-F°). See Table 6.3-5 of the FSAR. The use of this coefficient together with typical fouling factors does not provide sufficient conservatism in the GOTHIC representation of the LHSI heat exchangers.
It is the staff’s understanding that AREVA is performing revised containment analyses with a multi-node model of the GOTHIC code. For the revised calculations demonstrate that the fouling factors in the revised calculations conservatively represent those that will be present over the life of the unit.
Concerning the GOTHIC heat exchanger model, demonstrate the conservativeness of the model relative to the benchmarking information, and quantify the conservativeness. The above questions are follow-up questions to previously issued RAIs and the containment audit held in Lynchburg on July 14 and 15, 2009.
Response to Question 06.02.02-33:
The Response to Question 06.02.02-1a stated that the heat exchanger model included in the GOTHIC containment analysis model was benchmarked to an overall heat transfer coefficient (UA value) of 2.4738E+06 BTU/hr-°F. This overall heat transfer coefficient, along with the typical fouling factors, represents a conservative model compared to the overall heat transfer coefficient (UA value) of 3.5361E+06 BTU/hr-°F shown in U.S. EPR FSAR, Tier 2, Table 6.3-5, which corresponds to the design of the low head safety injection (LHSI) heat exchanger.
The GOTHIC multi-node model includes fouling factors that represent those expected over the life of the plant (i.e., fouling factors as a result of normally occurring decay heat removal fluid conditions). The effects of debris-laden post-LOCA recirculation fluid conditions on the heat exchanger fouling factors is described in the Response to RAI-297, Question 06.02.02-42.
FSAR Impact:
The U.S. EPR FSAR will not be changed as a result of this question.
Draft
is coefin the GOTin the GOT
rforming revised containmeng revised containmehe revised calculations demoned calculations demon
conservatively represent those thtively represent those th
hanger model, demonstrate the cel, demonstrate thking information, and quantify themation, and quantify th
ions to previously issued RAIs apreviously issued RAIs 15, 2009. 5, 2009
on 06.02.02-33: on 06.02.02-33:
uestion 06.02.02-1a stated thuestion 06.02.02-1a staanalysis model was benanalysis model was
6 BTU/hr-°F. This6 BTU/hr-°F. Thsents a conssents a consD1E+06 B1E+06
ofof


![2009/07/24 Areva EPR DC - Response to U.S. EPR Design Certification Application … · 2012. 12. 2. · 1 ArevaEPRDCPEm Resource From: Pederson Ronda M (AREVA NP INC) [Ronda.Pederson@areva.com]](https://img.pdfslide.net/doc/110x75/6117fa0cc0a9b343717e6f6c/20090724-areva-epr-dc-response-to-us-epr-design-certification-application.jpg)


![2009/05/13 Areva EPR DC - Response to U.S. EPR Design ... · 1 ArevaEPRDCPEm Resource From: Pederson Ronda M (AREVA NP INC) [Ronda.Pederson@areva.com] Sent: Wednesday, May 13, 2009](https://img.pdfslide.net/doc/110x75/5fa83fe16f08fd68a6724bf1/20090513-areva-epr-dc-response-to-us-epr-design-1-arevaeprdcpem-resource.jpg)

![2011/07/06 Areva EPR DC - Response to U.S. EPR Design ... · 1 ArevaEPRDCPEm Resource From: WILLIFORD Dennis (AREVA) [Dennis.Williford@areva.com] Sent: Wednesday, July 06, 2011 3:47](https://img.pdfslide.net/doc/110x75/6016f56c1fbc8a5335319bdd/20110706-areva-epr-dc-response-to-us-epr-design-1-arevaeprdcpem-resource.jpg)