Embed Size (px)
DESCRIPTION
http://www.equitycenter.org/images/stories/PDFs/2010.april%20nnotes.pdf
Citation preview
Last month’s issue of News & Notes began a discussion of the district weights and adjustments in Tier 1. The Basic Allotment (BA), Adjusted Basic Allotment (ABA) and, finally, the Adjusted Allotment (AA) were reviewed in some detail to provide readers with a basic understanding of the foundations of our school finance system.
This month’s articles are continuations of that discussion with emphasis on the funding weights and adjustments that make up Tier 1 and are multiplied by the AA in determining the categorical funding allotments.
Tier 1 has five of these student allotments, each with its own student weights. They are Special Education, Compensatory Education (Comp Ed), Bilingual Education, Career and Technology Education (CATE) and Gifted and Talented Education (GT).
The formulas used to determine funding in each of these categories are similar. They each follow this pattern: the AA is multiplied by a student count, then multiplied by the weight for that category.
However, the formulas differ in other ways. For example, for fund-ing purposes these allotments fall into two distinct categories.
For Special Education and Career and Technology Education funding, the number of full-time equivalent (FTE)1 students is subtracted from a district’s total number of students in average daily attendance (ADA). Eligible students are fully funded for whatever portion of time is spent in the program. The per student funding levels for these programs are determined by multiplying the applicable student weight by the district’s AA.
On the other hand, Bilingual Education, Comp Ed and GT funding allotments are in addition to the funding a district receives for regular program. Each district’s AA is multiplied by the weight for each program to deter-mine the additional funding per student added for the cost of each program. As for the other programs, the difference is in the degree to which students are weighted. (See chart on BACK)
Allotment Weights and Other Adjustments in Tier 1
Student Weights: Recognizing Variations in the Cost of Educating Children
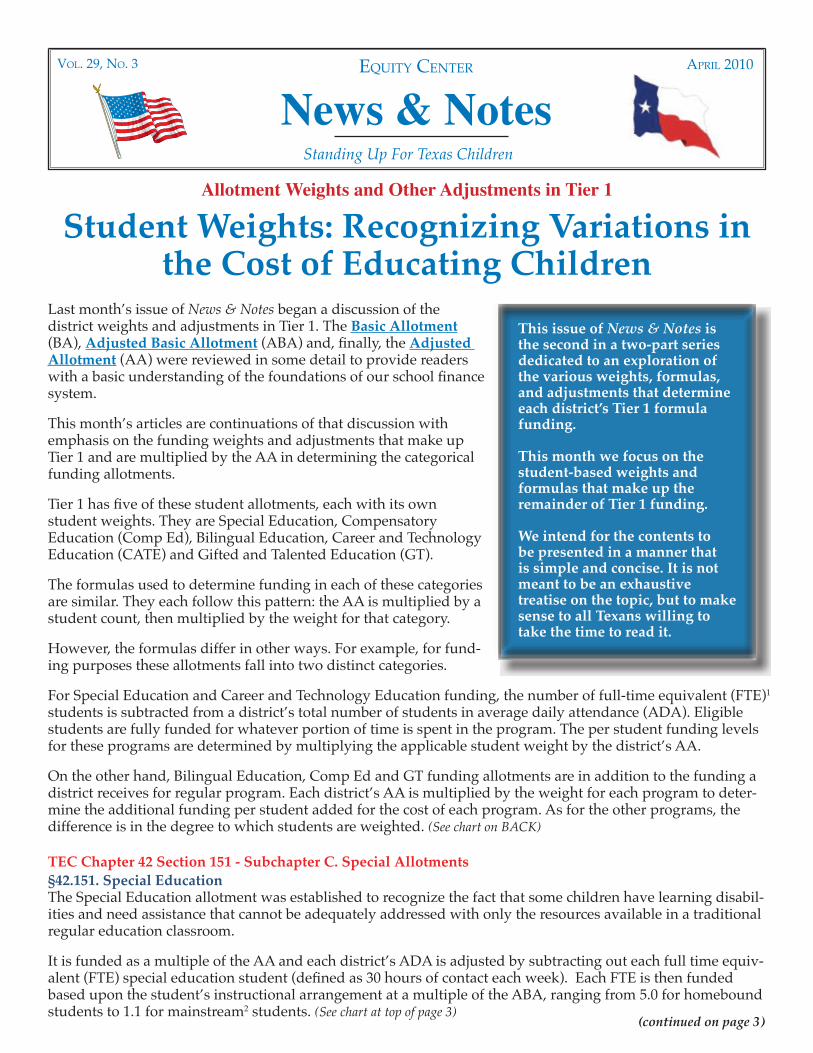
Equity CEntEr
News & NotesVol. 29, no. 3 April 2010
Standing Up For Texas Children
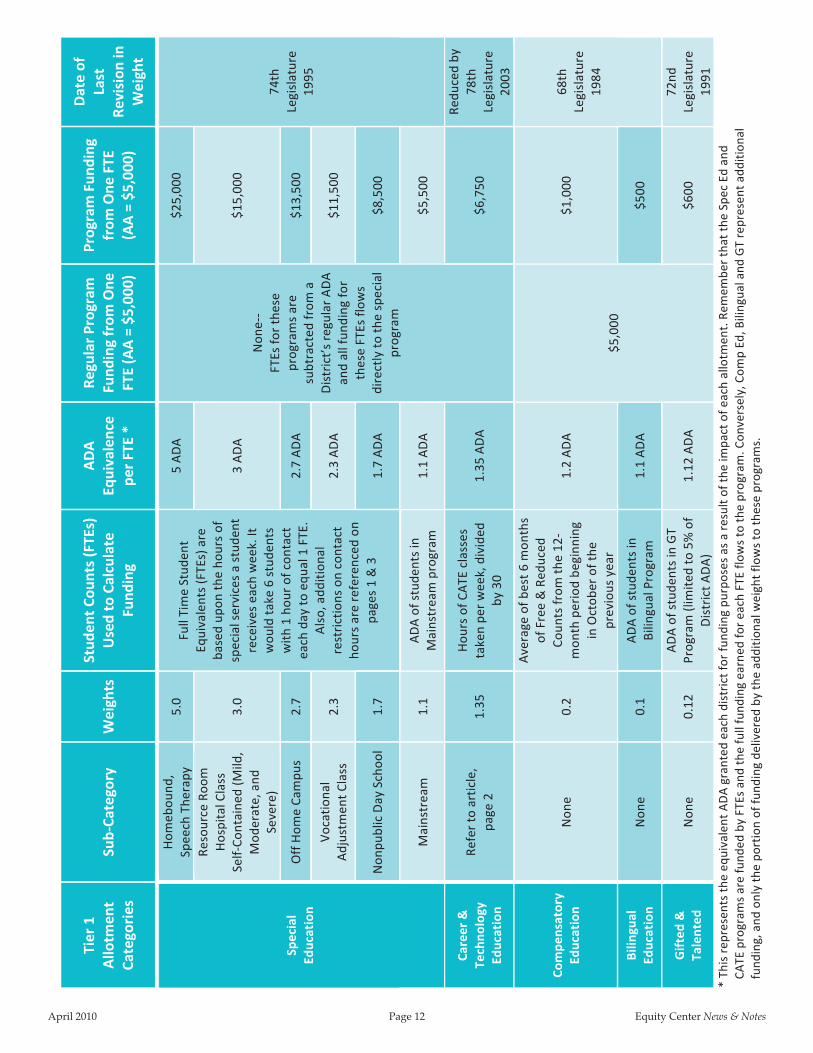
TEC Chapter 42 Section 151 - Subchapter C. Special Allotments§42.151. Special EducationThe Special Education allotment was established to recognize the fact that some children have learning disabil-ities and need assistance that cannot be adequately addressed with only the resources available in a traditional regular education classroom.
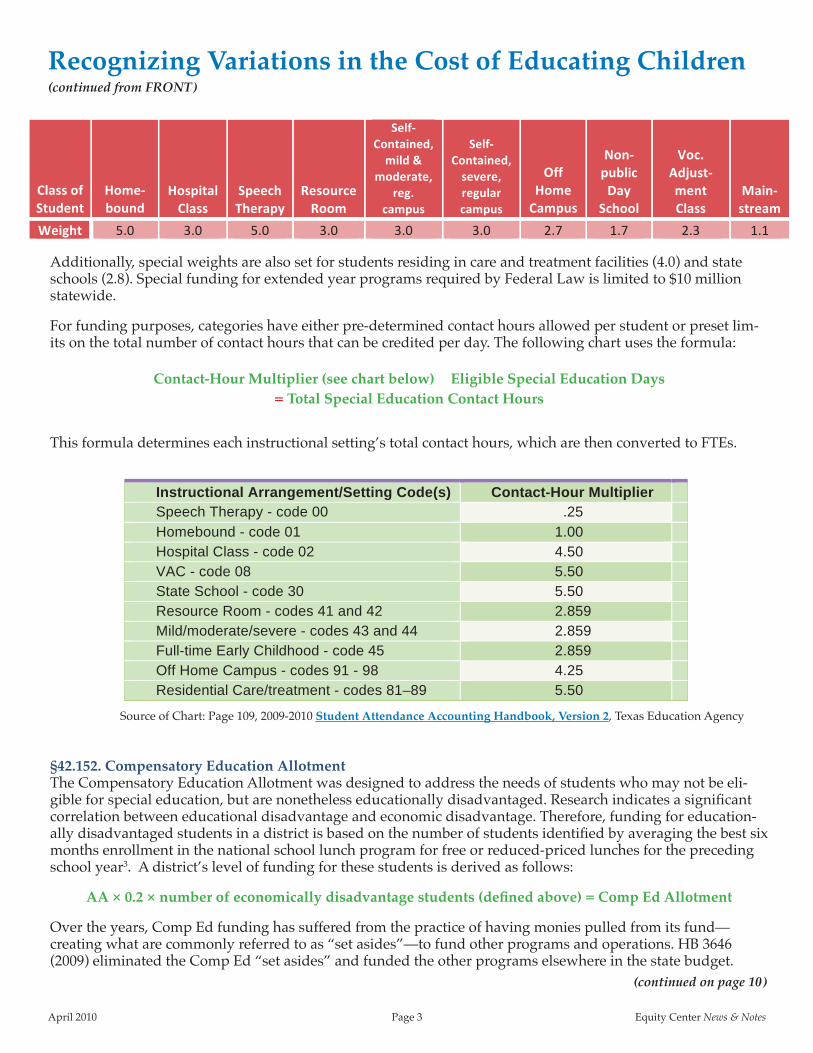
It is funded as a multiple of the AA and each district’s ADA is adjusted by subtracting out each full time equiv-alent (FTE) special education student (defined as 30 hours of contact each week). Each FTE is then funded based upon the student’s instructional arrangement at a multiple of the ABA, ranging from 5.0 for homebound students to 1.1 for mainstream2 students. (See chart at top of page 3)
(continued on page 3)
This issue of News & Notes is the second in a two-part series dedicated to an exploration of the various weights, formulas, and adjustments that determine each district’s Tier 1 formula funding.
This month we focus on the student-based weights and formulas that make up the remainder of Tier 1 funding.
We intend for the contents to be presented in a manner that is simple and concise. It is not meant to be an exhaustive treatise on the topic, but to make sense to all Texans willing to take the time to read it.
April 2010 Equity Center News & NotesPage 2
The New Instructional Facilities Allotment (NIFA), created by Senate Bill 4 (1999), provides funding for operational expenses associated with opening a new instructional facility. It is available to all pub-lic school districts that construct new instructional facilities and meet the requirements of the state statute and rules (TEC §42.158).
Who? NIFA is available to all public school districts that construct new instructional buildings. “Chapter 41” districts are eligible for NIFA, while charter schools are not.
What? Facilities eligible for NIFA must meet certain standards. The facility must be a newly constructed facility used for teaching; have its own campus ID number, principal and assigned instructional staff; operate under its own record of expenditures that is not a subset of another school budget and be physically separate from other existing school structures (a covered walkway is allowed). Addition-ally, the facility may not be a renovated building, an expansion of existing facilities or a portable or temporary structure.
How Much? NIFA is limited by statute to $25 million per year. Each new campus is eligible for a reimbursement of $250 per student in Average Daily Attendance (ADA) for the first year of operation. During the sec-ond year, a new campus is eligible to receive $250 per ADA for each additional student who was not present the first year.
If total allotments exceed the sum-certain $25 million budgeted per year, the commissioner reduces each district’s allotment proportionately. Reductions are prorated depending on a district’s ability to make up the lost funding.v
NIFA v. IFADespite appearances, NIFA and IFA
(Instructional Facilities Allotment) are two unrelated and distinct programs. The “N” in
NIFA reminds us that NIFA is intended to pay for the costs of equipping and opening a brand new facility, whereas the IFA program provides funding for the cost of construction or renova-
tion of a new or existing facility associated with an I&S tax levy. Moreover, eligible districts can receive IFA funding year after year, and funding is determined by a guaranteed yield system that typically covers only the poorest school districts.
New Instructional Facilities Allotment (NIFA)
DON’t FORGET TO MARK YOUR CALENDAR FOR THE 9TH ANNUAL
SCHOOL FINANCE SUMMER CONFERENCE - JULY 29 & 30, 2010Round Rock, Texas
For details go towww.edlaw.com
April 2010 Equity Center News & NotesPage 3
§42.152. Compensatory Education AllotmentThe Compensatory Education Allotment was designed to address the needs of students who may not be eli-gible for special education, but are nonetheless educationally disadvantaged. Research indicates a significant correlation between educational disadvantage and economic disadvantage. Therefore, funding for education-ally disadvantaged students in a district is based on the number of students identified by averaging the best six months enrollment in the national school lunch program for free or reduced-priced lunches for the preceding school year3. A district’s level of funding for these students is derived as follows:
AA × 0.2 × number of economically disadvantage students (defined above) = Comp Ed Allotment
Over the years, Comp Ed funding has suffered from the practice of having monies pulled from its fund— creating what are commonly referred to as “set asides”—to fund other programs and operations. HB 3646 (2009) eliminated the Comp Ed “set asides” and funded the other programs elsewhere in the state budget.
Recognizing Variations in the Cost of Educating Children(continued from FRONT)
Additionally, special weights are also set for students residing in care and treatment facilities (4.0) and state schools (2.8). Special funding for extended year programs required by Federal Law is limited to $10 million statewide.
For funding purposes, categories have either pre-determined contact hours allowed per student or preset lim-its on the total number of contact hours that can be credited per day. The following chart uses the formula:
This formula determines each instructional setting’s total contact hours, which are then converted to FTEs.
Additionally,specialweightsarealsosetforstudentsresidingincareandtreatmentfacilities(4.0)and
stateschools(2.8).SpecialfundingforextendedyearprogramsrequiredbyFederalLawislimitedto$10
millionstatewide.
Forfundingpurposes,categorieshaveeitherpre‐determinedcontacthoursallowedperstudentor
presetlimitsonthetotalnumberofcontacthoursthatcanbecreditedperday.Thefollowingchartuses
theformula:
Contact‐HourMultiplier(seechartbelow)×EligibleSpecialEducationDays
=TotalSpecialEducationContactHours
Thisformuladetermineseachinstructionalsetting’stotalcontacthours.ThatisthenconvertedtoFTE’s
todeterminefundingasdiscussedearlier.
Instructional Arrangement/Setting Code(s) Contact-Hour Multiplier Speech Therapy - code 00 .25 Homebound - code 01 1.00 Hospital Class - code 02 4.50 VAC - code 08 5.50 State School - code 30 5.50 Resource Room - codes 41 and 42 2.859 Mild/moderate/severe - codes 43 and 44 2.859 Full-time Early Childhood - code 45 2.859 Off Home Campus - codes 91 - 98 4.25 Residential Care/treatment - codes 81–89 5.50
SourceofChart:Page109,2009‐2010StudentAttendanceAccountingHandbook,Version2,Texas
EducationAgency
Classof
Student
Home‐
bound
Hospital
Class
Speech
Therapy
Resource
Room
Self‐
Contained,
mild&
moderate,
reg.
campus
Self‐
Contained,
severe,
regular
campus
Off
Home
Campus
Non‐
public
Day
School
Voc.
Adjust‐
ment
Class
Main‐
stream
Weight 5.0 3.0 5.0 3.0 3.0 3.0 2.7 1.7 2.3 1.1
Contact-Hour Multiplier (see chart below) × Eligible Special Education Days= Total Special Education Contact Hours
Instructional Arrangement/Setting Code(s) Contact-Hour Multiplier Speech Therapy - code 00 .25 Homebound - code 01 1.00Hospital Class - code 02 4.50VAC - code 08 5.50State School - code 30 5.50Resource Room - codes 41 and 42 2.859Mild/moderate/severe - codes 43 and 44 2.859Full-time Early Childhood - code 45 2.859Off Home Campus - codes 91 - 98 4.25Residential Care/treatment - codes 81–89 5.50
(continued on page 10)
Source of Chart: Page 109, 2009-2010 Student Attendance Accounting Handbook, Version 2, Texas Education Agency
April 2010 Equity Center News & NotesPage 4
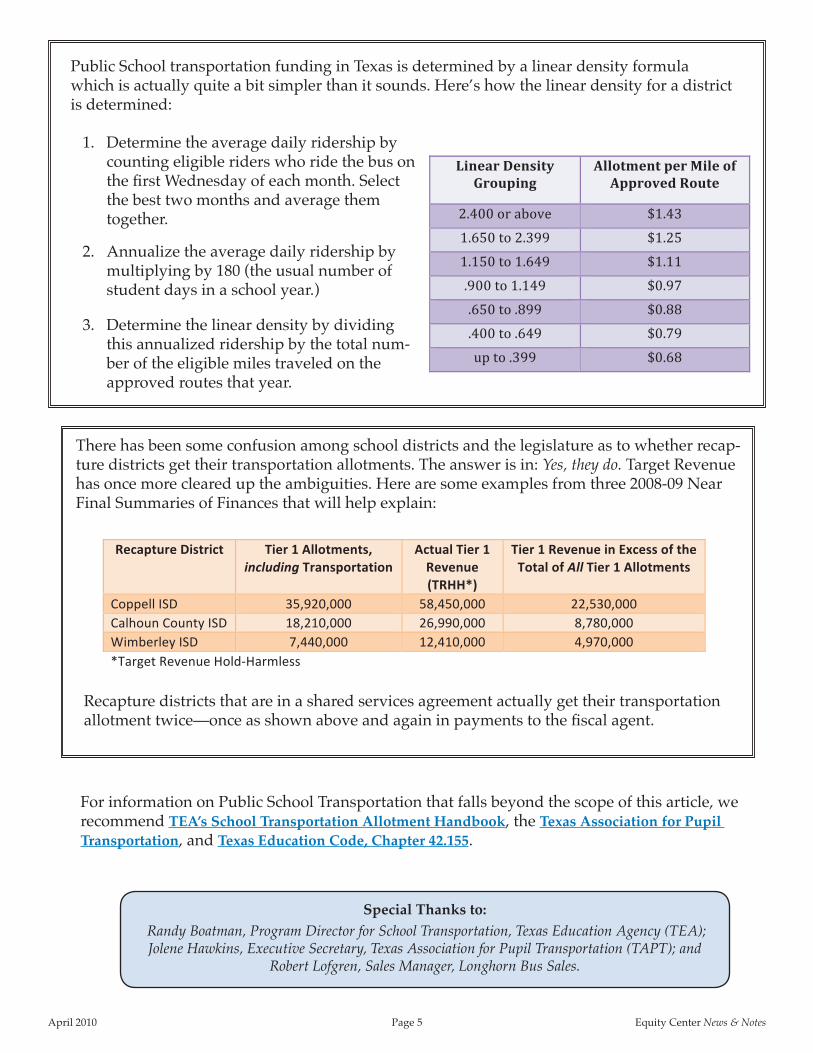
Public School Transportation is a very important contributor to student success. After all, it is impos-sible to teach kids if they aren't there, right?
The American School Bus Council estimates that 480,000 school buses nationally carry 26 million children to school every school day. To put that in perspective, 26 million children roughly equals the population of Texas.
Total miles per year? A staggering 5.76 billion miles! Putting it in perspective, that represents more than 12,000 round trips to the moon.
But, there is a huge disconnect in Texas Public School funding. For 2008-09, the statewide transporta-tion expenditures were four times the sum of the state transportation allotments. Why is the ratio so lopsided—and getting more so? Incredibly, the per-mile state funding rates have not changed since 1984.
Have you ever wondered what a district's transportation funding would be if the 1984 rates were increased to keep pace with inflation, or the cost of fuel, or the cost of a new school bus? The chart below gives you an interesting picture. [The chart begins with data from 1994 since we could not find any data going back to 1984. One can rightly assume the adjustments would be even more striking with data from that 10 year period between 1984 and 1994.]v
Movin’ on Down the RoadIn a National-School-Bus-Glossy-Yellow School Bus
April 2010 Equity Center News & NotesPage 5
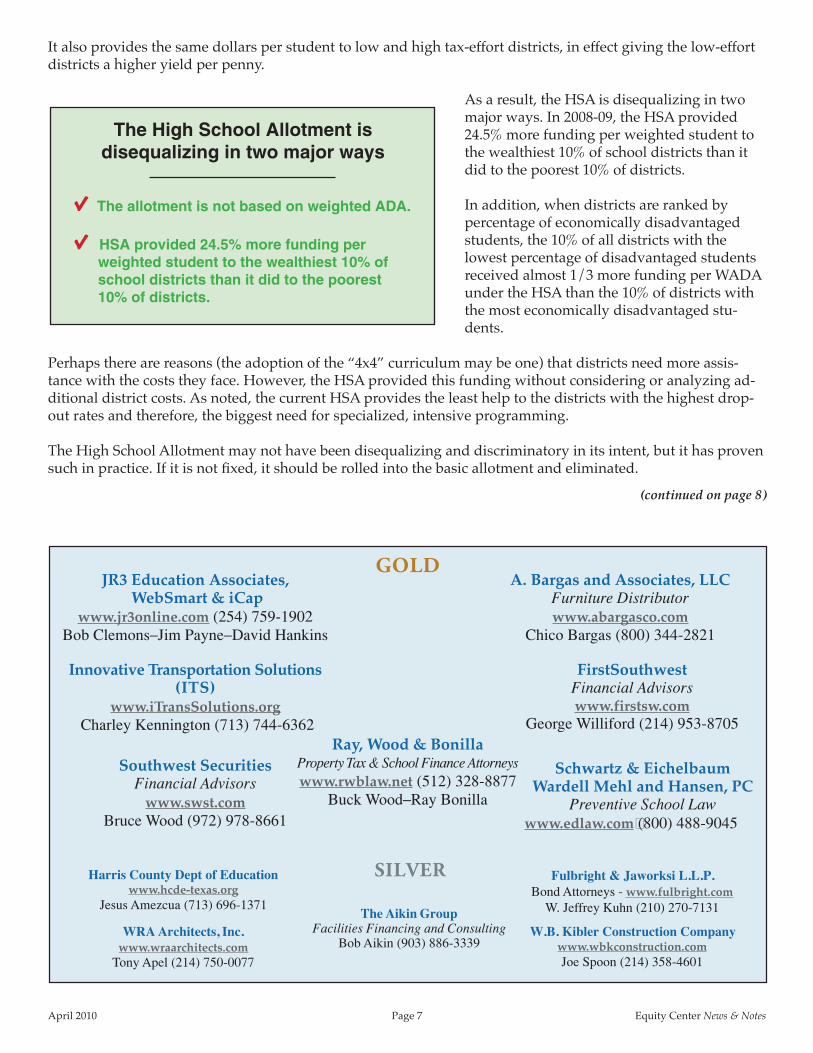
There has been some confusion among school districts and the legislature as to whether recap-ture districts get their transportation allotments. The answer is in: Yes, they do. Target Revenue has once more cleared up the ambiguities. Here are some examples from three 2008-09 Near Final Summaries of Finances that will help explain:
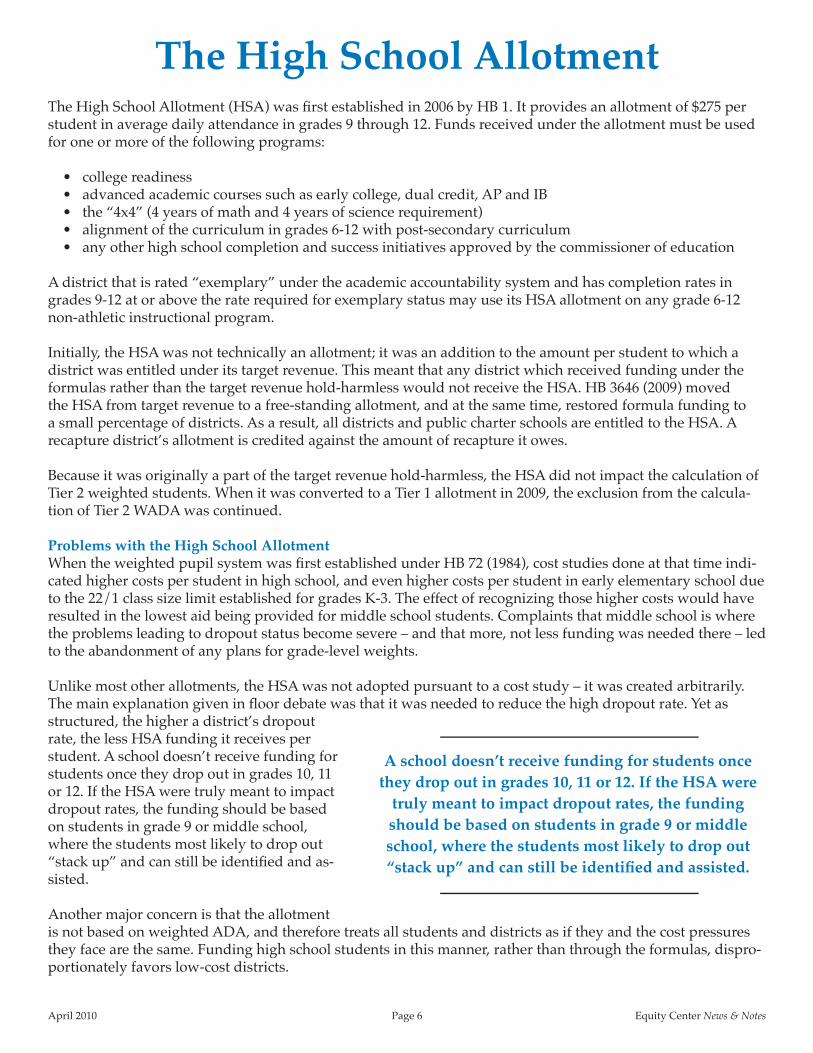
Public School transportation funding in Texas is determined by a linear density formula which is actually quite a bit simpler than it sounds. Here’s how the linear density for a district is determined:
1. Determine the average daily ridership by counting eligible riders who ride the bus on the first Wednesday of each month. Select the best two months and average them together.
2. Annualize the average daily ridership by multiplying by 180 (the usual number of student days in a school year.)
3. Determine the linear density by dividing this annualized ridership by the total num-ber of the eligible miles traveled on the approved routes that year.
For information on Public School Transportation that falls beyond the scope of this article, we recommend TEA’s School Transportation Allotment Handbook, the Texas Association for Pupil Transportation, and Texas Education Code, Chapter 42.155.
Special Thanks to: Randy Boatman, Program Director for School Transportation, Texas Education Agency (TEA); Jolene Hawkins, Executive Secretary, Texas Association for Pupil Transportation (TAPT); and
Robert Lofgren, Sales Manager, Longhorn Bus Sales.
Recapture districts that are in a shared services agreement actually get their transportation allotment twice—once as shown above and again in payments to the fiscal agent.
For information on Public School Transportation that falls beyond the scope of this article, we recommend TEA's School Transportation Allotment Handbook, the Texas Association of Pupil Transportation, and Texas Education Code, Chapter 42.155.
2009-2010 Student Attendance Accounting Handbook, Version 2, Texas Education Agency
www.edlaw.com
April 2010 Equity Center News & NotesPage 6
The High School Allotment (HSA) was first established in 2006 by HB 1. It provides an allotment of $275 per student in average daily attendance in grades 9 through 12. Funds received under the allotment must be used for one or more of the following programs: • college readiness • advanced academic courses such as early college, dual credit, AP and IB • the “4x4” (4 years of math and 4 years of science requirement) • alignment of the curriculum in grades 6-12 with post-secondary curriculum • any other high school completion and success initiatives approved by the commissioner of education
A district that is rated “exemplary” under the academic accountability system and has completion rates in grades 9-12 at or above the rate required for exemplary status may use its HSA allotment on any grade 6-12 non-athletic instructional program.
Initially, the HSA was not technically an allotment; it was an addition to the amount per student to which a district was entitled under its target revenue. This meant that any district which received funding under the formulas rather than the target revenue hold-harmless would not receive the HSA. HB 3646 (2009) moved the HSA from target revenue to a free-standing allotment, and at the same time, restored formula funding to a small percentage of districts. As a result, all districts and public charter schools are entitled to the HSA. A recapture district’s allotment is credited against the amount of recapture it owes.
Because it was originally a part of the target revenue hold-harmless, the HSA did not impact the calculation of Tier 2 weighted students. When it was converted to a Tier 1 allotment in 2009, the exclusion from the calcula-tion of Tier 2 WADA was continued.
Problems with the High School AllotmentWhen the weighted pupil system was first established under HB 72 (1984), cost studies done at that time indi-cated higher costs per student in high school, and even higher costs per student in early elementary school due to the 22/1 class size limit established for grades K-3. The effect of recognizing those higher costs would have resulted in the lowest aid being provided for middle school students. Complaints that middle school is where the problems leading to dropout status become severe – and that more, not less funding was needed there – led to the abandonment of any plans for grade-level weights.
Unlike most other allotments, the HSA was not adopted pursuant to a cost study – it was created arbitrarily. The main explanation given in floor debate was that it was needed to reduce the high dropout rate. Yet as structured, the higher a district’s dropout rate, the less HSA funding it receives per student. A school doesn’t receive funding for students once they drop out in grades 10, 11 or 12. If the HSA were truly meant to impact dropout rates, the funding should be based on students in grade 9 or middle school, where the students most likely to drop out “stack up” and can still be identified and as-sisted.
Another major concern is that the allotment is not based on weighted ADA, and therefore treats all students and districts as if they and the cost pressures they face are the same. Funding high school students in this manner, rather than through the formulas, dispro-portionately favors low-cost districts.
The High School Allotment
A school doesn’t receive funding for students once they drop out in grades 10, 11 or 12. If the HSA were
truly meant to impact dropout rates, the funding should be based on students in grade 9 or middle school, where the students most likely to drop out “stack up” and can still be identified and assisted.
Page 7April 2010 Equity Center News & Notes
Fulbright & Jaworksi L.L.P.Bond Attorneys - www.fulbright.com
W. Jeffrey Kuhn (210) 270-7131
W.B. Kibler Construction Companywww.wbkconstruction.comJoe Spoon (214) 358-4601
Ray, Wood & BonillaProperty Tax & School Finance Attorneyswww.rwblaw.net (512) 328-8877
Buck Wood–Ray Bonilla
A. Bargas and Associates, LLCFurniture Distributorwww.abargasco.com
Chico Bargas (800) 344-2821
FirstSouthwestFinancial Advisorswww.firstsw.com
George Williford (214) 953-8705
JR3 Education Associates, WebSmart & iCap
www.jr3online.com (254) 759-1902Bob Clemons–Jim Payne–David Hankins
Southwest SecuritiesFinancial Advisors
www.swst.comBruce Wood (972) 978-8661
Schwartz & EichelbaumWardell Mehl and Hansen, PC
Preventive School Lawwww.edlaw.com�(800) 488-9045
WRA Architects, Inc.www.wraarchitects.com
Tony Apel (214) 750-0077
Harris County Dept of Educationwww.hcde-texas.org
Jesus Amezcua (713) 696-1371 The Aikin GroupFacilities Financing and Consulting
Bob Aikin (903) 886-3339
Innovative Transportation Solutions(ITS)
www.iTransSolutions.org Charley Kennington (713) 744-6362
GOLD
SILVER
April 2010 Equity Center News & NotesPage 7
It also provides the same dollars per student to low and high tax-effort districts, in effect giving the low-effort districts a higher yield per penny.
As a result, the HSA is disequalizing in two major ways. In 2008-09, the HSA provided 24.5% more funding per weighted student to the wealthiest 10% of school districts than it did to the poorest 10% of districts.
In addition, when districts are ranked by percentage of economically disadvantaged students, the 10% of all districts with the lowest percentage of disadvantaged students received almost 1/3 more funding per WADA under the HSA than the 10% of districts with the most economically disadvantaged stu-dents.
Perhaps there are reasons (the adoption of the “4x4” curriculum may be one) that districts need more assis-tance with the costs they face. However, the HSA provided this funding without considering or analyzing ad-ditional district costs. As noted, the current HSA provides the least help to the districts with the highest drop-out rates and therefore, the biggest need for specialized, intensive programming.
The High School Allotment may not have been disequalizing and discriminatory in its intent, but it has proven such in practice. If it is not fixed, it should be rolled into the basic allotment and eliminated.
(continued on page 8)
The High School Allotment is disequalizing in two major ways
√ The allotment is not based on weighted ADA.
√ HSA provided 24.5% more funding per weighted student to the wealthiest 10% of school districts than it did to the poorest 10% of districts.
April 2010 Equity Center News & NotesPage 8
The High School Allotment (continued)(continued from page 7)
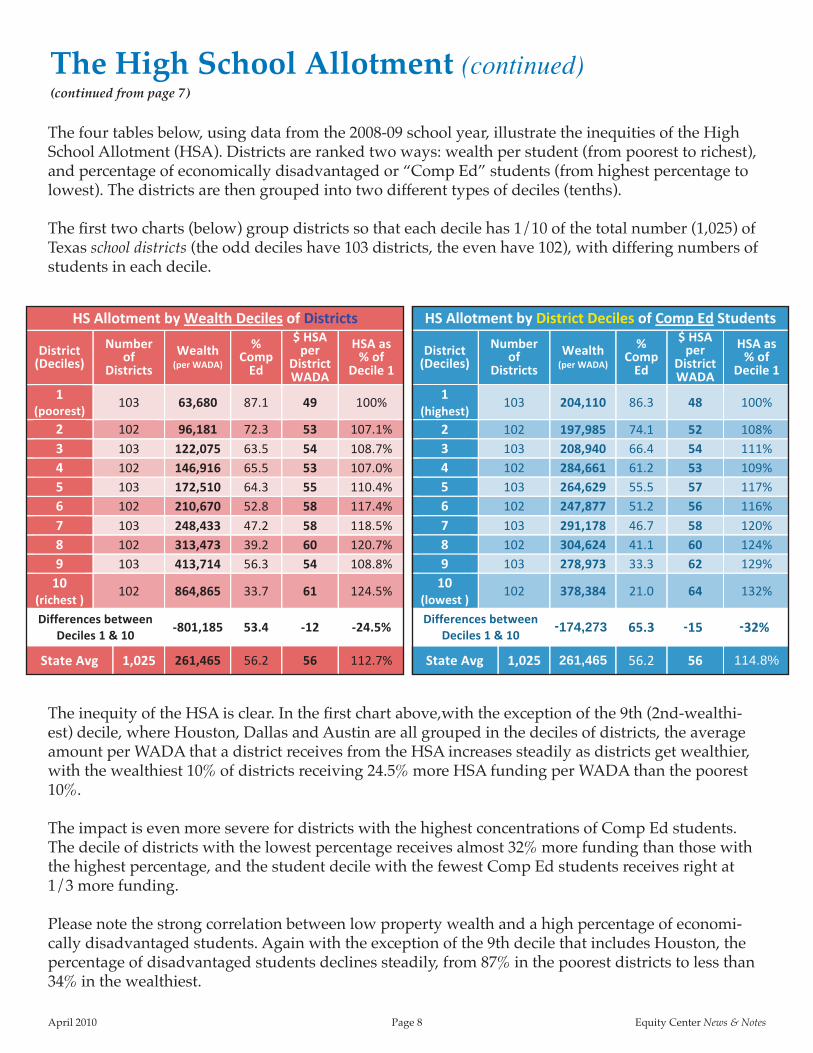
The four tables below, using data from the 2008-09 school year, illustrate the inequities of the High School Allotment (HSA). Districts are ranked two ways: wealth per student (from poorest to richest), and percentage of economically disadvantaged or “Comp Ed” students (from highest percentage to lowest). The districts are then grouped into two different types of deciles (tenths).
The first two charts (below) group districts so that each decile has 1/10 of the total number (1,025) of Texas school districts (the odd deciles have 103 districts, the even have 102), with differing numbers of students in each decile.
The inequity of the HSA is clear. In the first chart above,with the exception of the 9th (2nd-wealthi-est) decile, where Houston, Dallas and Austin are all grouped in the deciles of districts, the average amount per WADA that a district receives from the HSA increases steadily as districts get wealthier, with the wealthiest 10% of districts receiving 24.5% more HSA funding per WADA than the poorest 10%.
The impact is even more severe for districts with the highest concentrations of Comp Ed students. The decile of districts with the lowest percentage receives almost 32% more funding than those with the highest percentage, and the student decile with the fewest Comp Ed students receives right at 1/3 more funding.
Please note the strong correlation between low property wealth and a high percentage of economi-cally disadvantaged students. Again with the exception of the 9th decile that includes Houston, the percentage of disadvantaged students declines steadily, from 87% in the poorest districts to less than 34% in the wealthiest.
238,295
117%
174,273
261,465 114.8%
238,295
117%
- - -
April 2010 Equity Center News & NotesPage 9
You should be receiving the EC Xpress by email every Tuesday.
If not... please check your spam filter to make sure our emails are not getting blocked. Please talk to your technical folks and have them add our
domain name ’equitycenter.org’ to your ‘white list.’
This will allow your district to receive our emails. This is especially important when communicating legislative issues to you... not just during the session, but NOW!
As a benefit of membership, we are emailing member district Superintendents and CFO/Business Managers a weekly EC XPress email. It’s an insightful one-pager that discusses
various school finance topics affecting all Texas school districts.
Are You Getting It?
238,295
117%
174,273
261,465 114.8%
117%
-238,295 - -
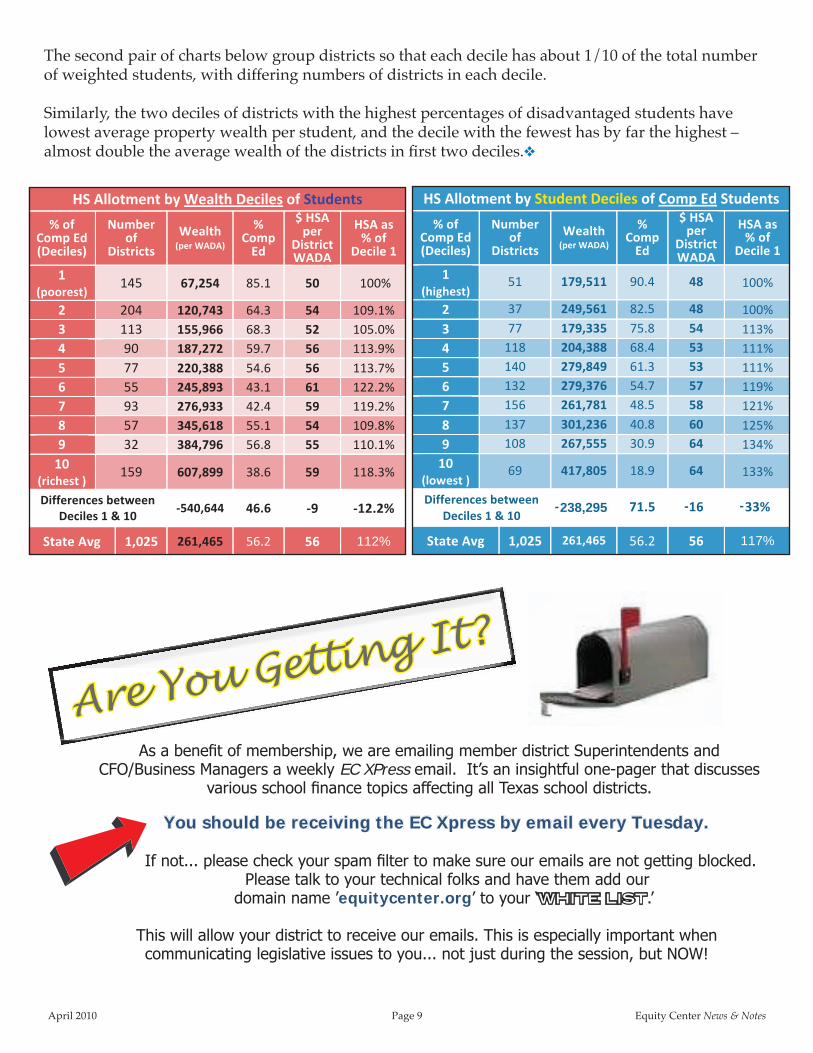
The second pair of charts below group districts so that each decile has about 1/10 of the total number of weighted students, with differing numbers of districts in each decile. Similarly, the two deciles of districts with the highest percentages of disadvantaged students have lowest average property wealth per student, and the decile with the fewest has by far the highest – almost double the average wealth of the districts in first two deciles.v
Here are four tables, using data from the 2008-09 school year, that illustrate the inequities of the High School Allotment (HSA). Districts are ranked two ways: by wealth per student (from poorest to richest), and by percentage of economically disadvantaged, “Comp Ed” students (from highest percentage to lowest).
The districts are then grouped into two different types of deciles (tenths). The first charts group districts so that each decile has 1/10 of the total number (1,025) of Texas school districts (the odd deciles have 103 districts, the even have 102), with differing numbers of students in each decile. The second pair of charts group districts so that each decile has about 1/10 of the total number of weighted students, with differing numbers of districts in each decile.
85.1
64.3 109.1%68.3 105.0%59.7 113.9%54.6 113.7%43.1 122.2%42.4 119.2%55.1 109.8%56.8 110.1%
38.6 118.3%
46.6
56.2 112.2% 112%
April 2010 Equity Center News & NotesPage 10
Recognizing Variations in the Cost of Educating Children (continued)(continued from page 3)
§ 42.153. Bilingual Education AllotmentThe Bilingual Education Allotment is intended to address the additional costs associated with providing bilin-gual education or special language programs for children with limited English proficiency. Additional funding for these programs is determined as follows:
AA × 0.1 × the ADA of students in a bilingual or special language program = Bilingual Ed Allotment
Bilingual Education funds are limited in use for such things as student evaluation, instructional materials and equipment, staff development, salary supplements and supplies required for effective instruction and smaller class size.
§ 42.154. Career and Technology Education AllotmentWhen first established, this allotment funded vocational programs such as Agriculture, Distributive Education (Work Study Program) and Home Economics. In fact, as a reflection of Texas’ more rural based economy, at one time each district with a high school was guaranteed funding for at least two vocational teachers, regardless of the number of students in the school. In 1984 funding changed to an FTE4 student based system funded at a 1.45 level.
Today, the title has changed to Career and Technology Education (CATE) and has been expanded to include ex-tensive new state approved career and technology related offerings. The weight has been reduced three times to 1.35. Base funding for CATE programs is determined as follows:
AA × 1.35 × FTEs in the CATE program = CATE Allotment
Students in grades 9 through 12 are eligible for the basic CATE programs. Additionally, students with disabili-ties in grades 7 through 12 are eligible for CATE program funding. Funding for CATE programs follows the students and is used to provide CATE programs.
HB 3646 added a new funding allotment to CATE programs. The Advanced Career and Technology Allotment provides a district an additional $50 for each student enrolled in at least two advanced Career and Technology courses.
§ 42.156. Gifted and Talented Student AllotmentThe Gifted and Talented (GT) Allotment was designed to provide additional funding above the AA to enable districts to develop and serve the needs of students identified by the district as “Gifted and Talented.” For each identified student a school district serves in a program for gifted and talented students, additional funding is determined as follows:
AA × 0.12 × number of students served in a GT program5 = Gifted and Talented Student Allotment
Funds allocated for GT must be used for providing programs for gifted and talented students. However, there are various types of GT programs and qualification for those programs is not always based solely on intelli-gence measures. v
1 Full-time equivalent students are based on contact hours. Contact time is recorded in time intervals as small as 15 minutes. For example, it requires the equivalent of six students with one contact hour each day to generate one FTE.2 Mainstream students are funded by multiplying their weight (1.1) by their ADA. FTE’s are not used for Mainstream.3 Additional Compensatory Education is provided at a 2.41 weight for each FTE in a remedial and support program because of pregnancy. 4 Special Education and Career and Technology Education are the primary allotments that use FTEs. 5 A district’s GT Allotment is limited to a maximum of five percent of the district’s ADA.

April 2010 Equity Center News & NotesPage 11
JR3 EDUCATION ASSOCIATES, LP
The Source for Successful School Support ServicesProven Solutions for Texas School Districts
Provide Retired Web Based Software Digital DocumentMaster Educators Integrated Finance-SIS Management
[email protected] [email protected]@jr3online.com [email protected] JR3Education Associates, LP for an onsite demonstration of our products
Call (254) 759-1902 or Toll Free (866) 759-1902www.jr3online.com
2010 GOLD Sponsor - www.jr3online.com
2010 GOLD Sponsor - www.edlaw.com
April 2010 Equity Center News & NotesPage 12