Embed Size (px)
Citation preview

Calhoun: The NPS Institutional Archive
Reports and Technical Reports All Technical Reports Collection
2011-11-06
Marines vs. Contractors: An Analysis of
a Supply Outsourcing Initiative and Its
Impact on Cost and Efficiency
Robert Dinwoodie
http://hdl.handle.net/10945/33596
CORE Metadata, citation and similar papers at core.ac.uk
Provided by Calhoun, Institutional Archive of the Naval Postgraduate School
=^Åèìáëáíáçå=oÉëÉ~êÅÜ=mêçÖê~ã=do^ar^qb=p`elli=lc=_rpfkbpp=C=mr_if`=mlif`v=k^s^i=mlpqdo^ar^qb=p`elli=
Approved for public release, distribution is unlimited.
Prepared for: Naval Postgraduate School, Monterey, California 93943
NPS-AM-11-190
^`nrfpfqflk=obpb^o`e=
pmlkploba=obmloq=pbofbp==
Marines vs. Contractors: An Analysis of a Supply
Outsourcing Initiative and Its Impact on Cost and Efficiency
6 November 2011
by
Capt. Dennis Herold, USMC, and
Capt. Robert Dinwoodie, USMC
Advisors: Dr. Daniel A. Nussbaum, Visiting Professor, and
Donald E. Summers, Senior Lecturer
Graduate School of Business & Public Policy
Naval Postgraduate School

=^Åèìáëáíáçå=oÉëÉ~êÅÜ=mêçÖê~ã=do^ar^qb=p`elli=lc=_rpfkbpp=C=mr_if`=mlif`v=k^s^i=mlpqdo^ar^qb=p`elli=
The research presented in this report was supported by the Acquisition Chair of the Graduate School of Business & Public Policy at the Naval Postgraduate School. To request Defense Acquisition Research or to become a research sponsor, please contact: NPS Acquisition Research Program Attn: James B. Greene, RADM, USN, (Ret.) Acquisition Chair Graduate School of Business and Public Policy Naval Postgraduate School 555 Dyer Road, Room 332 Monterey, CA 93943-5103 Tel: (831) 656-2092 Fax: (831) 656-2253 E-mail: [email protected] Copies of the Acquisition Sponsored Research Reports may be printed from our website www.acquisitionresearch.net

==^Åèìáëáíáçå=oÉëÉ~êÅÜ=mêçÖê~ã=do^ar^qb=p`elli=lc=_rpfkbpp=C=mr_if`=mlif`v - i - k^s^i=mlpqdo^ar^qb=p`elli=
Abstract
Since 2001, the Marine Corps has outsourced the management of all
individual issue combat gear. This contracted outsourcing, called the Consolidated
Issue Facility (CIF) and then the Individual Issue Facility (IIF) under the direction of
local Marine Expeditionary Force Headquarters (MEF HQ) and Marine Corps
Logistics Command (LOGCOM), is responsible for the distribution, management,
and collection of every Marine’s individual combat issue of gear—a task previously
accomplished by each unit’s individual organic supply section. By removing this
burden on the supply sections, the Marine Corps was theoretically able to free-up
Marines to fill billets in warfighting roles. The Marine Corps has touted the ability to
save money and create efficiencies that did not exist previously with organic Marine
Corps–led supply operations.
The Marine Corps is looking to increase the amount of assets managed by
outside vendors by outsourcing management of unit assets such as soft-walled
shelters and camouflage netting to a Unit Issue Facility (UIF) using the same model
as the CIF/IIF. This paper explores whether the CIF/IIF program saved the Marine
Corps money from 2001 through 2010, allowed for transfer of personnel to other
roles, and was an effective model for future outsourcing endeavors.
Keywords: A-76, outsourcing, privatization, CIF, Marine Corps, supply

==^Åèìáëáíáçå=oÉëÉ~êÅÜ=mêçÖê~ã=do^ar^qb=p`elli=lc=_rpfkbpp=C=mr_if`=mlif`v - ii - k^s^i=mlpqdo^ar^qb=p`elli=
THIS PAGE INTENTIONALLY LEFT BLANK
^Åèìáëáíáçå=oÉëÉ~êÅÜ=mêçÖê~ã=do^ar^qb=p`elli=lc=_rpfkbpp=C=mr_if`=mlif`v - iii - k^s^i=mlpqdo^ar^qb=p`elli=
Acknowledgments
We would both like to thank many different individuals who assisted us in
gathering data, understanding concepts, and putting it all together to complete this
thesis. First, this project would never have been possible without the tutelage and
guidance of our advisors, Dr. Daniel Nussbaum and Don Summers. We thank you for
your time, patience, and guidance during this long process. Second, we would like to
thank the Marines of the I Marine Expeditionary Force (MEF) Comptroller’s office,
especially, Chief Warrant Officer 2 Grant Murphy. His help in understanding the
program’s financials was pivotal to our analysis. Finally, we would like to thank Dr. Kenn
Doerr for his assistance in creating our model and understanding operational risk.
Without the assistance, professionalism, and expertise of all those, named and
unnamed, who helped us over the past year, this thesis would not be the quality product
it is. Thank you.
–Rob Dinwoodie & Dennis Herold
Individual Acknowledgements:
I need to thank my wife, Cameron. Without her love, support, and tolerance of
long hours and piles of documents all over the house, this thesis would not be
completed. Thank you.
–Rob Dinwoodie
I want to first and foremost thank my wife and best friend, Nieves, for her
unwavering support and patience that allowed for the completion of this thesis.
Additionally, I want to thank my son, Antonio, and daughter, Lucia, for supplying the
humor and lighter side of life that kept me grounded. Finally, I want to thank and
dedicate this work to my former MAG-12 Ground Supply family of Marines as you
provided me the insight, compassion, motivation and inspiration to complete this thesis
and give back to the Marine Corps. Thank you.
–Dennis Herold
^Åèìáëáíáçå=oÉëÉ~êÅÜ=mêçÖê~ã=do^ar^qb=p`elli=lc=_rpfkbpp=C=mr_if`=mlif`v - iv - k^s^i=mlpqdo^ar^qb=p`elli=
THIS PAGE INTENTIONALLY LEFT BLANK

==^Åèìáëáíáçå=oÉëÉ~êÅÜ=mêçÖê~ã=do^ar^qb=p`elli=lc=_rpfkbpp=C=mr_if`=mlif`v - v - k^s^i=mlpqdo^ar^qb=p`elli=
About the Authors
Dennis Herold, Captain, U.S. Marine Corps, Graduate School of Business and
Public Policy. Captain Herold earned a BS in 2006 from California State University San
Marcos. Captain Herold is a ground supply officer with over 18 years combined officer
and enlisted service. Prior to attending the Naval Postgraduate School, he was on the
MAG-12 HQ staff in Iwakuni, Japan. Upon graduation from the Defense Systems
Analysis Program at the Naval Postgraduate School in December 2011, Captain Herold
will report to Marine Corps Systems Command in Quantico, Virginia.
Robert Dinwoodie, Captain, U.S. Marine Corps, Graduate School of Business
and Public Policy. Captain Dinwoodie earned a BA in 2001 from DePauw University in
Greencastle, Indiana. Captain Dinwoodie is a ground supply officer with over 10 years
of business and military leadership experience. Prior to attending the Naval
Postgraduate School, he was on the MAG-11 HQ staff in San Diego, California, serving
as the S-4 officer. Upon graduation from the Defense Systems Analysis Program at the
Naval Postgraduate School in December 2011, Captain Dinwoodie will report to
Headquarters Marine Corps, Programs and Resources Division to serve as the force
application plans officer.

==^Åèìáëáíáçå=oÉëÉ~êÅÜ=mêçÖê~ã=do^ar^qb=p`elli=lc=_rpfkbpp=C=mr_if`=mlif`v - vi - k^s^i=mlpqdo^ar^qb=p`elli=
=
=
THIS PAGE INTENTIONALLY LEFT BLANK
===^Åèìáëáíáçå=oÉëÉ~êÅÜ=mêçÖê~ã=do^ar^qb=p`elli=lc=_rpfkbpp=C=mr_if`=mlif`v - vii - k^s^i=mlpqdo^ar^qb=p`elli=
=
NPS-AM-11-190
^`nrfpfqflk=obpb^o`e=
pmlkploba=obmloq=pbofbp==
Marines vs. Contractors: An Analysis of a Supply
Outsourcing Initiative and Its Impact on Cost and Efficiency
6 November 2011
by
Capt. Dennis Herold, USMC, and
Capt. Robert Dinwoodie, USMC
Advisors: Dr. Daniel A. Nussbaum, Visiting Professor, and
Donald E. Summers, Senior Lecturer
Graduate School of Business & Public Policy
Naval Postgraduate School
Disclaimer: The views represented in this report are those of the author and do not reflect the official policy position of the Navy, the Department of Defense, or the Federal Government.
===^Åèìáëáíáçå=oÉëÉ~êÅÜ=mêçÖê~ã=do^ar^qb=p`elli=lc=_rpfkbpp=C=mr_if`=mlif`v - viii - k^s^i=mlpqdo^ar^qb=p`elli=
=
THIS PAGE INTENTIONALLY LEFT BLANK

==^Åèìáëáíáçå=oÉëÉ~êÅÜ=mêçÖê~ã=do^ar^qb=p`elli=lc=_rpfkbpp=C=mr_if`=mlif`v - ix - k^s^i=mlpqdo^ar^qb=p`elli=
Table of Contents
Abstract ................................................................................................................ i
Acknowledgments ............................................................................................. iii
About the Authors .............................................................................................. v
Table of Contents ............................................................................................... ix
List of Acronyms and Abbreviations ............................................................... xi
Executive Summary ........................................................................................ xvii
I. Introduction and Problem Identification ................................................ 1
A. Introduction ...................................................................................... 1
B. Background ..................................................................................... 1
C. Purpose ........................................................................................... 2
D. Scope and Limitations ..................................................................... 3
E. Research Questions ........................................................................ 3
F. Relevance ....................................................................................... 4
G. Thesis Organization ......................................................................... 5
II. History and Analysis of Outsourcing Policy .......................................... 7
A. Introduction ...................................................................................... 7
B. Reasons to Outsource ................................................................... 15
C. Risks of Outsourcing ..................................................................... 19
D. Marine Corps’ Outsourcing Experience ......................................... 24
E. Summary ....................................................................................... 32
III. Data ......................................................................................................... 35
A. Background Information ................................................................ 35
B. Units Analyzed .............................................................................. 35

==^Åèìáëáíáçå=oÉëÉ~êÅÜ=mêçÖê~ã=do^ar^qb=p`elli=lc=_rpfkbpp=C=mr_if`=mlif`v - x - k^s^i=mlpqdo^ar^qb=p`elli=
C. Sources of Data ............................................................................. 36
D. Methodology of Analysis ................................................................ 41
E. Summary ....................................................................................... 53
IV. Analysis .................................................................................................. 55
A. Analysis of Costs of Outsourcing ................................................... 55
B. Summary ....................................................................................... 58
C. Chapter Summary ......................................................................... 78
V. Results .................................................................................................... 79
A. Introduction .................................................................................... 79
B. Impacts on Efficiency of Outsourcing Unit Assets ......................... 80
C. Future CIF/UIF NPV and Regret Model ......................................... 82
D. Decision Model NPV Results ......................................................... 83
E. Regret Model Results .................................................................... 84
VI. Conclusions and Recommendations ................................................... 87
A. Conclusions ................................................................................... 87
B. Recommendations......................................................................... 89
C. Recommendations for Further Study ............................................. 93
List of References ............................................................................................. 95
2003 - 2011 Sponsored Research Topics ..................................................... 103

^Åèìáëáíáçå=oÉëÉ~êÅÜ=mêçÖê~ã=do^ar^qb=p`elli=lc=_rpfkbpp=C=mr_if`=mlif`v - xi - k^s^i=mlpqdo^ar^qb=p`elli=
List of Acronyms and Abbreviations
ASR Authorized Strength Reports
BN 1/1 1st Battalion, 1st Marine Division.
BAH Basic Allowance Housing
BTA Business Transformation Agency
BY Budget Year
CBO Congressional Budget Office
CBRN Chemical Biological Radiological and Nuclear
CBRN-D Chemical, Biological, Radiological, and Nuclear Defense
CIF Consolidated Issue Facility
CLI Career Length Issue
CO Commanding Officer
CONUS Continental United States
CSF Consolidated Storage Facility
CSP Consolidated Storage Program
CTAP Contingency Training Allowance Pool
DSB Defense Science Board
DoD Department of Defense
DoN Department of the Navy
EB/EC Electronic Business/Electronic Commerce
EDA Electronic Document Access
EDS Electronic Data Systems
FAIR Federal Activities Inventory Reform
FAR Federal Acquisition Regulations

==^Åèìáëáíáçå=oÉëÉ~êÅÜ=mêçÖê~ã=do^ar^qb=p`elli=lc=_rpfkbpp=C=mr_if`=mlif`v - xii - k^s^i=mlpqdo^ar^qb=p`elli=
FFP Firm-Fixed Price
FPDS–NG Federal Procurement Data System–Next Generation
FY Fiscal Year
GBL Government Bills of Lading
HP Hewlett Packard
I&L Installation and Logistics
I MEF I Marine Expeditionary Force
ICCE Individual Combat Clothing and Equipment
IIF Individual Issue Facility
IPAC Installation Personnel Administration Centers
IR Interest Rate
IT Information Technology
KBR Kellog, Brown and Root
LMSI Logistics Material and Installation
LOGCOM Logistics Command
MAG-39 Marine Aircraft Group-39
MCAS Marine Corps Air Station
MEF Marine Expeditionary Force
MEF HQ Expeditionary Force Headquarters
MEO Most Efficient Organization
MEU Marine Expeditionary Units
MOS Military Occupational Specialty
MWRC Mountain Warfare Training Center

==^Åèìáëáíáçå=oÉëÉ~êÅÜ=mêçÖê~ã=do^ar^qb=p`elli=lc=_rpfkbpp=C=mr_if`=mlif`v - xiii - k^s^i=mlpqdo^ar^qb=p`elli=
MWSS Marine Wing Support Squadron
NBCD Nuclear, Biological, and Chemical Defense
NCCA Naval Center for Cost Analysis
NGEN Next Generation Network
NMCI Navy and Marine Corps Intranet
NPV Net Present Value
NSN National Stock Number
NSP Non-Lethal Service Providers
O&S Operating and Support
OMB Office of Management and Budget
OUSD (AT&L) Office of the Under Secretary of Defense for Acquisition, Technology, and Logistics
QASP Quality Assurance Surveillance Plan
PCS Permanent Change of Station
PMB President’s Management Budget
PMC Private Military Companies
PSC Private Security Companies
PWS Performance Work Statement
SOW Statement of Work
SRB Service Record Book
STAP Special Training Allowance Pool
SWS&CN Soft Walled Shelters and Camouflage Netting
T/E Table of Equipment
T/O Table of Organization

==^Åèìáëáíáçå=oÉëÉ~êÅÜ=mêçÖê~ã=do^ar^qb=p`elli=lc=_rpfkbpp=C=mr_if`=mlif`v - xiv - k^s^i=mlpqdo^ar^qb=p`elli=
TAMCNS Table of Authorized Material Control Numbers
TAP Temporary Allowance Pool
TFAS Total Force System
TFSD Total Force Structure Division
TFSMS Total Force Structure Management System
UIF Unit Issue Facility
VAMOSC Visibility and Management of Operating and Support Costs
==^Åèìáëáíáçå=oÉëÉ~êÅÜ=mêçÖê~ã=do^ar^qb=p`elli=lc=_rpfkbpp=C=mr_if`=mlif`v - xv - k^s^i=mlpqdo^ar^qb=p`elli=
Glossary
Bn 1/1: 1st Battalion, 1st Marine Division. Infantry battalion at Camp Pendleton
CBRN-D: Chemical, Biological, Radiological, and Nuclear Defense. Gear used for
purposes of defending against the aforementioned threats. This gear can
be unit level assets or personally worn by Marines.
CIF: Consolidated Issue Facility. The program name for centralized
management of ICCE from 2001–2009.
CSP: Consolidated Storage Program: Overarching program to manage
outsourcing of unit-level and ICCE
ICCE: Individual Combat Clothing and Equipment. Also called ICE. The terms
are used interchangeably.
IIF: Individual Issue Facility. This is what the CIF program was renamed in
2009. This program included management of Field Protective Masks and
CBRN-D gear.
IR: Interest Rate. Rate at which interest is paid to borrow money.
MAG-39: Marine Aircraft Group-39. Headquarters element for several aviation
squadrons at Camp Pendleton.
MWSS-372: Marine Wing Support Squadron-372. Supporting element for several
MAGs.
NPV: Net Present Value. Time-specific value of the expenditures and income
from an investment.

==^Åèìáëáíáçå=oÉëÉ~êÅÜ=mêçÖê~ã=do^ar^qb=p`elli=lc=_rpfkbpp=C=mr_if`=mlif`v - xvi - k^s^i=mlpqdo^ar^qb=p`elli=
STAP/TAP: Special Training Allowance Pool or Temporary Allowance Pool.
Equipment that is not frequently used by units. Units can check this gear
out for use on an as required basis.
SWS&CN: Soft Walled Shelters and Camouflage Netting. Unit assets to be managed
under UIF program.
T/E: Table of Equipment. Listing of Marine units authorized equipment.
T/O: Table of Organization. Listing of a Marine units authorized personnel.
UIF: Unit Issue Facility. Centralized management program of SWS&CN,
program is apart of CSP.
==^Åèìáëáíáçå=oÉëÉ~êÅÜ=mêçÖê~ã=do^ar^qb=p`elli=lc=_rpfkbpp=C=mr_if`=mlif`v= = - xvii - k^s^i=mlpqdo^ar^qb=p`elli=
Executive Summary
In 2000, the Marine Corps outsourced the management of Individual Combat
Clothing and Equipment (ICCE) assets from organic ground supply accounts to the
Consolidated Issue Facility (CIF) in order to increase efficiencies and reduce the
management burden on the operating forces. After 10 years of a presumably
successful outsourcing endeavor, the Marine Corps is further outsourcing unit assets
to a Unit Issue Facility (UIF). Our thesis analyzed the historical impact of outsourcing
ICCE assets on Marine Corps personnel costs and unit efficiencies and forecasted
future impacts resulting from outsourcing unit assets. This analysis showed that
while organic supply account inventories decreased as a result of outsourcing ICCE
assets, supply manning levels either remained constant or increased, resulting in
significant impacts to costs and efficiencies from 2000 to 2010.
Outsourcing ICCE assets did achieve the goal of reducing the management
burden on operating forces; however, by maintaining pre-outsourcing unit supply
structures and staffing levels, the Marine Corps realized increased personnel costs
and decreased unit efficiencies. An analysis of the supply Military Occupational
Specialties (MOS; 3002, 3010, 3043, 3051, 3052) Marine Corps-wide and three
separate organic supply accounts (MWSS-372, MAG-39, and BN 1/1) under I
Marine Expeditionary Force (MEF) concluded that from 2000 to 2010, both the Table
of Organization (T/O) numbers and staffing levels either remained constant or
increased slightly. Overall, by examining Marine Corps Total Force Structure
Division (TFSD) Authorized Strength Reports (ASRs), the Marine Corps added
1,123 billets in the Supply MOS between 1999 and 2010.
To evaluate the financial opportunity cost (regret) of adding the CIF program
and not cutting personnel, these costs were modeled using Excel and Crystal Ball.
Actual personnel costs were compared to a hypothetical rolling implementation of up
to 40% reduction in supply personnel, which the vendor claims the program saves
on their website. Our model showed that over a 10-year period, the Marine Corps

==^Åèìáëáíáçå=oÉëÉ~êÅÜ=mêçÖê~ã=do^ar^qb=p`elli=lc=_rpfkbpp=C=mr_if`=mlif`v= = - xviii - k^s^i=mlpqdo^ar^qb=p`elli=
failed to realize, on average, $1.01 billion in savings by not cutting personnel. In
addition, organic supply account efficiencies decreased between 59.6% and 76.7%
by maintaining less gear with pre-outsourcing staffing levels.
If staffing levels continue unchanged, by outsourcing unit level assets to a unit
issue facility(UIF) and ICCE (CIF) under the Consolidated Storage Program (CSP), it
is forecasted that the Marine Corps stands to pay an additional $1.1 billion in
personnel costs and realize additional decreases in unit efficiencies over the next 10
years. In conclusion, in order for the benefit of outsourcing supply assets to outweigh
its costs, the Marine Corps must ensure that personnel reductions are in-line with
current and future outsourcing initiatives. However, this action risks undercutting the
Marine unit’s ability to remain self-supporting in expeditionary environments.
Renewed thinking about the Supply MOS’s structure and role are required to meet
the changing needs of logistics modernization and cost savings, while still delivering
world-class warfighter support.
=^Åèìáëáíáçå=oÉëÉ~êÅÜ=mêçÖê~ã=do^ar^qb=p`elli=lc=_rpfkbpp=C=mr_if`=mlif`v - 1 - k^s^i=mlpqdo^ar^qb=p`elli=
I. Introduction and Problem Identification
A. Introduction
The purpose of this research is to analyze the costs of outsourcing Marine Corps
individual combat clothing equipment (ICCE) assets through the Consolidated Issue
Facility (CIF) and determine if it would be an appropriate cost-based model for future
outsourcing of Marine Corps unit level assets. This chapter begins with a discussion of
the background of the federal government’s mandated rules and guidelines, which are
applicable to all government outsourcing through the use of Office of Management and
Budget (OMB, 2003) Circular A-76. We then discuss the background of outsourcing the
Marine Corps ICCE assets and the scope and purpose of the research and analysis.
Finally, the chapter concludes with the thesis questions and their relevance to the
research.
B. Background
The federal government outsources non-inherently governmental functions to the
civilian sector as a cost-savings tool. By allowing the private sector to compete for
contracts to provide services the government previously performed internally, the
government hopes to capitalize on industry best-business practices that promote
efficiency and cut costs. Outsourcing is mandated by the Federal Acquisition Reform
(FAIR) Act of 1998. OMB Circular A-76 (OMB, 2003), titled Performance of Commercial
Activities, provides guidance on how to outsource. In addition, the FAIR Act directs
federal agencies to submit a yearly inventory to the OMB of commercial activities
performed by federal employees. Compliance with these two directives allows the
federal government to consistently assess the activities it is required to perform and
those that it can privatize, thus keeping the federal government at the smallest size
possible. According to the Congressional Research Service, since 1966 the “DoD has
set the pace as the lead federal agency in using OMB Circular A-76 cost comparison
studies as a tool for managing competition for federal contracts” (Grasso, 2005).

==^Åèìáëáíáçå=oÉëÉ~êÅÜ=mêçÖê~ã=do^ar^qb=p`elli=lc=_rpfkbpp=C=mr_if`=mlif`v= = - 2 - k^s^i=mlpqdo^ar^qb=p`elli=
Since 2000, the Marine Corps has outsourced the management of all individual
issue combat gear (Marine Corps, 2000a). This contracted outsourcing, called the CIF
from 2001–2009, under the direction of local Marine Expeditionary Force Headquarters
(MEF HQ) and Marine Logistics Command (LOGCOM), is responsible for the
distribution, management, and collection of every Marine’s ICCE. The program changed
names in 2009, and became the Individual Issue Facility (IIF). The CIF and
subsequently, the IIF, fall under a larger program called the Consolidated Storage
Program (CSP). ICCE was previously managed by using each unit’s organic supply
section. The Marine Corps reasoned that if the burden were removed from the supply
sections, Marines would be free to fill billets in other critical Military Occupational
Specialties (MOSs; Marine Corps Team ISS 360, 2006). Through this program, the
Marine Corps has touted cost savings and new operational efficiencies that did not exist
previously with Marine Corps-led supply operations (Marine Corps, 2000a). Success of
the CIF led the Marine Corps to privatize the issue, recovery, and management of gas
masks, uniform items, and Chemical Biological Radiological and Nuclear Defense
(CBRN) equipment to the Consolidated Storage Facility (CSF). The Marine Corps is
now looking to further remove management of unit assets, such as soft-walled shelters
and camouflage netting, to a Unit Issue Facility (UIF,) using a model similar to the CIF
(Logistics Management Specialists, 2009). In this thesis, we explore the level of
efficiencies and cost savings created by the model employed at the CIF, and use the
analysis of this 10-year-old program to determine a basis for recommending whether
the UIF is a viable option for future supply outsourcing.
C. Purpose
Many good reasons can be identified to outsource not inherently governmental
activities to civilian contractors. The potential to save money and create efficiencies
over existing military means is one of these reasons. For example, in one
Congressional Budget Office (CBO; 2005) report, the Army was found to have saved
over 90% in costs by outsourcing expeditionary logistics support. However, these fiscal
savings must be balanced against a Marine Corps Supply section that is effective at its

==^Åèìáëáíáçå=oÉëÉ~êÅÜ=mêçÖê~ã=do^ar^qb=p`elli=lc=_rpfkbpp=C=mr_if`=mlif`v= = - 3 - k^s^i=mlpqdo^ar^qb=p`elli=
mission. Does the reduction in manpower and commander-controlled assets reduce a
unit’s flexibility to achieve and maintain mission readiness/effectiveness? To arrive at
that answer, we evaluated the costs and performance of the CIF program to determine
if savings and efficiencies have actually occurred. We explored any cost savings or
increases to determine their root causes and placed them into context, such as
increased operational tempo and rising costs. Finally, in this study we add to the
existing Marine Corps logistics and supply outsourcing body of knowledge and help to
build a stronger decision-making framework to evaluate future privatization decisions.
D. Scope and Limitations
In this thesis, we evaluated the performance of the CIF over a 12-year period,
1999–2010. The evaluation reached back to the CIF pre-implementation phase and
followed the program through 2010. This 12-year period was long enough to show
operational costs, structures, impacts, and lessons learned. The length of time studied
provided sufficient information from which to draw conclusions regarding costs and
efficiency of the CIF program. A possible limitation of our research is that we were not
privy to any documents or information from the program office within the Marine Corps.
All our contract and cost data come from central Department of Defense (DoD) and
open-source databases.
E. Research Questions
In this study, we assessed the CIF’s performance over a 12-year period and
asked, did this program actually save the Marine Corps money and create efficiencies
not previously recognized? If it was beneficial to the Corps, will it be a good model to
use for privatizing management of unit assets? If it was not an effective program, why is
that the case and what should have been done differently? In the process of answering
these questions, we also explored the following questions:
Does the privatized management of supply assets reduce cost and create efficiencies for the Marine Corps?
==^Åèìáëáíáçå=oÉëÉ~êÅÜ=mêçÖê~ã=do^ar^qb=p`elli=lc=_rpfkbpp=C=mr_if`=mlif`v= = - 4 - k^s^i=mlpqdo^ar^qb=p`elli=
Can the UIF provide an efficient alternative to and reduce the costs of an organic supply account?
How is risk balanced against money saving in an outsourcing decision?
F. Relevance
This research is timely and important in the current context of the greater DoD
acquisition strategy. In 2009, 57% of the defense budget was dedicated to services
acquisition (Office of the Under Secretary of Defense for Acquisition, Technology, and
Logistics [OUSD(AT&L)], 2011, p. 1). Yet, a 2011 Defense Science Board (DSB) Task
Force found that the current acquisition workforce is inadequately prepared to acquire
and execute $400 billion in annual service contracts (OUSD[AT&L], 2011, p. 1).
According to the Board, one reason is that the DoD does not have “a meaningful
taxonomy for services in order to develop useful definitions, performance standards,
and outcome measures for each type of service” (OUSD[AT&L], 2011, p. 1). When
evaluated in conjunction with the Secretary of Defense’s mandate to reduce service
contracting by 10% for three years (Munoz, 2011), the Board’s statement indicates that
a gap exists between the need to save money and the expertise to actually do it. In this
environment, it is important to know the effects of past outsourcing efforts to allocate
resources for the future.
Finally, if a project is not working, it should be discontinued without throwing
good money after bad. Conversely, if a project is a model for others to follow, it should
be applied across all Services to capture maximum cost savings for the DoD. In an era
when reducing defense spending is a mantra for reducing federal deficits, it is important
for decision-makers to accurately assess the performance of privatization endeavors,
especially when they are looking to expand the scope of those efforts. Within an often
stove-piped bureaucracy, where enterprise-wide projects span multiple periods of
leadership, cost and performance assessments can be difficult to capture accurately. In
this project, we attempted to do just that by analyzing one of the biggest and most
visible privatization efforts in recent Marine Corps history.
==^Åèìáëáíáçå=oÉëÉ~êÅÜ=mêçÖê~ã=do^ar^qb=p`elli=lc=_rpfkbpp=C=mr_if`=mlif`v= = - 5 - k^s^i=mlpqdo^ar^qb=p`elli=
G. Thesis Organization
Five chapters follow this introductory chapter. Chapter II is the literature review in
which we describe in detail the federal government’s use of OMB Circular A-76 and the
FAIR Act (1998) for the outsourcing of government functions to the private sector. We
start this chapter with a historical overview of the OMB Circular A-76 process and then
narrow in scope to address specifically military functions. We end the chapter by
identifying risks associated with outsourcing military functions, in general, and with the
Marine Corps outsourcing experience, in particular. In Chapter III, we detail the
collection process, type of data, and methodology we used in analyzing the outsourcing
of the Marine Corps ICCE assets as a model for further organic asset outsourcing. In
Chapter IV, we describe our analysis procedures, and in Chapter V, we detail the
results of the analysis. Chapter VI is the final chapter, and in it we answer our research
questions and provide suggestions and recommendations for further study.
=^Åèìáëáíáçå=oÉëÉ~êÅÜ=mêçÖê~ã=do^ar^qb=p`elli=lc=_rpfkbpp=C=mr_if`=mlif`v - 6 - k^s^i=mlpqdo^ar^qb=p`elli=
THIS PAGE INTENTIONALLY LEFT BLANK

=^Åèìáëáíáçå=oÉëÉ~êÅÜ=mêçÖê~ã=do^ar^qb=p`elli=lc=_rpfkbpp=C=mr_if`=mlif`v - 7 - k^s^i=mlpqdo^ar^qb=p`elli=
II. History and Analysis of Outsourcing Policy
In Chapter II, we provide the results of our literature review. We begin by defining
outsourcing and introducing its impact on the federal government. We then describe the
history of OMB Circular A-76 as it applies to all outsourcing initiatives within the federal
government. Next, we discuss several reasons to outsource and identify outsourcing’s
associated risks. Finally, we conclude with a discussion of the Marine Corps
outsourcing experience.
A. Introduction
1. Outsourcing
Merriam–Webster’s Online Dictionary defines outsourcing as procurement “under
contract with an outside supplier” (“Outsourcing,” 2006). This definition suggests that
any procurement for either goods or services performed under a contractual obligation
to an outside agency is considered outsourcing. Outsourcing, or privatization, is a
make-versus-buy decision to determine whether to purchase goods and services from
the private sector or to perform those activities in-house. If the decision to privatize is
made, the primary goal is to reduce costs while maintaining performance (Mahoney &
Schofield, 2006). In more thorough terms, a 1996 report from the Defense Science
Board (DSB) Task Force on Outsourcing and Privatization (1996) gave a more robust
definition to guide policy:
Outsourcing often refers to the transfer of a support function traditionally performed by an in-house organization to an outside service provider. Outsourcing occurs in both the public and private sectors. While the outsourcing firm or government organization continues to provide appropriate oversight, the vendor is typically granted a degree of flexibility regarding how the work is performed. In successful outsourcing arrangements, the vendor utilizes new technologies and business practices to improve service delivery and/or reduce support costs. Vendors are usually selected as the result of a competition among qualified bidders. (p. 7A)
In action, outsourcing is a powerful, force-multiplying tool for the federal
government. As early as the Revolutionary War, the government sought help from

==^Åèìáëáíáçå=oÉëÉ~êÅÜ=mêçÖê~ã=do^ar^qb=p`elli=lc=_rpfkbpp=C=mr_if`=mlif`v= = - 8 - k^s^i=mlpqdo^ar^qb=p`elli=
private citizens “to drive wagons; provide architectural engineering, and carpentry
services; obtain foodstuffs; and deliver medical services” (Schneck, 2001, p. 5). In
regard to the quality and indispensability of outsourced services, the first Secretary of
Treasury, Robert Morris, said this:
Experience has sooner or later pointed out contracts with private men of substance and talents equal to understanding as the cheapest, most certain and consequently the best mode of obtaining those articles, which are necessary for subsistence, clothing and moving of an army. (as cited in Huston, 1966, p. 71)
It seems that the reasons for outsourcing have not changed in over 235 years,
and, as this thesis shows, neither have many of outsourcing’s negative issues.
2. History of OMB Circular A-76
OMB Circular A-76 is a federal law that defines “federal policy regarding the
performance of commercial activities … (and) sets forth the procedures for determining
whether commercial activities should be performed under contract with commercial
sources or in-house using Government facilities and personnel” (OMB, 1999, p. 1).
Additionally, it outlines the process for managed competition between federal agencies
and the private sector. One of A-76’s underlying principles is that the government
should not compete with its citizens; rather, it should support the competitive system
that provides this country’s economic strength (OMB, 1999, p. 1). While the A-76 has
changed in scope and direction over its history, a key tenet has remained at its core:
The private sector can provide some goods and services more economically and
efficiently than the federal government. Finally, the A-76 provides an analytical
framework to support the government in its decisions of who can best provide needed
products and services (Grasso, 2005, p. 2).
Although it has changed over the years, the original idea for the A-76 was born
during the mid-1950s. President Eisenhower and his administration, fearful of the
growing power and “unwarranted influence of the military-industrial complex in a post-
World War II world” (Nakashima, 2001, p. 27), encouraged federal agencies to obtain
goods and services from the private sector when such action was deemed cost effective

==^Åèìáëáíáçå=oÉëÉ~êÅÜ=mêçÖê~ã=do^ar^qb=p`elli=lc=_rpfkbpp=C=mr_if`=mlif`v= = - 9 - k^s^i=mlpqdo^ar^qb=p`elli=
(General Accounting Office [GAO], 2001, p. 2). This action led to the creation of the
Commercial–Industrial Studies Program that developed guidelines and procedures for
outsourcing (Moreau, 2002, p. 1). The policy stated, “Federal agencies will not provide a
function in-house that is obtainable from a private source unless Government
performance of that function has been justified in the national interest” (Moreau, 2002,
p. 1). In this unspecific policy-speak, activities such as dropping bombs on enemy
nations would be in the national interest, whereas making paper would not.
In 1955, the Eisenhower Administration officially instituted a direct policy
predecessor to the A-76, Budget Bulletin 55-4. It stated,
It is the general policy of the Federal Government that it will not start or carry on any commercial activity to provide a service or product for its own use if such product or service can be procured from private enterprise through ordinary business channels. (GAO, 1998, p. 4)
Breaking this statement down, we discover that a commercial activity is “one
which is operated by a Federal executive agency and which provides a product or
service that could be obtained from a commercial source” (OMB, 2003, p. 2).
Consequently, those activities/functions that do not fall under the definition of
commercial activities but that are “so intimately related to the public interest as to
mandate performance by Government employees” (FAIR Act, 1998, 105(a)) are defined
as inherently governmental. Under this policy, dropping bombs on foreign countries is
inherently governmental and making paper for a country’s own consumption is not
because paper can be acquired on the open market. Therefore, the government should
retain the ability to drop bombs, but divest itself of paper-manufacturing capabilities.
However, no guidelines existed at this time about how to do this in a standardized
manner.
In 1966, the OMB formalized its outsourcing policy with Circular A-76. Within a
year, due to political changes and external pressures, the OMB implemented its first
revision of the A-76 process (Moreau, 2002, p. 1). This revision provided formal
guidelines and procedures for cost comparisons. In 1979, the A-76 underwent its

==^Åèìáëáíáçå=oÉëÉ~êÅÜ=mêçÖê~ã=do^ar^qb=p`elli=lc=_rpfkbpp=C=mr_if`=mlif`v= = - 10 - k^s^i=mlpqdo^ar^qb=p`elli=
second revision to clarify the requirements of an agency to contract out non-inherently
governmental functions (Moreau, 2002, p. 1).
After Ronald Reagan was elected president, his administration emphasized that
big government was inefficient, wasteful, and unmanageable (Grasso, 2005, p. 1). In
1983, after a two-year analysis of the A-76 process, the OMB revised the A-76 a third
time to codify procedures to capture the initial intent of the Eisenhower Administration’s
outsourcing policies. It established procedures identifying situations when private
companies could perform commercial activities previously performed by the
government. The OMB’s intent was to guide the government to outsource activities that
the commercial sector could produce more economically and to focus on those
functions deemed inherently governmental (Moreau, 2002, p. 8).
From the late 1980s through the early 1990s, administrative and legislative
constraints forced outsourcing competitions into a lull. This lull ended in 1993 after
recommendations from the Clinton Administration’s National Performance Review
(NPR) stated that the government needed to shift its focus from “works better, costs
less” to “works better and does less” (Gore, 1997, p. 42). The Clinton Administration
identified a target reduction in the civil service workforce by 300,000 individuals and set
out to “blur conventional lines between the public and private sectors” (Guttman, 2003,
p. 289). Although this sounded revolutionary, it was nothing more than ideas “proposed
to reform government by contracting out activities which had often been contracted out
for decades” (Guttman, 2003, p. 289).
In 1995, representatives from the GAO and the OMB testified to Congress that
“after several decades’ experience with the policy[,] ... they could not easily determine
whether federal outsourcing had been beneficial or cost-effective” (Nakashima, 2001, p.
27). Shortly after that, a fourth A-76 revision was released in 1996. It clarified
procedures for determining whether recurring activities required outsourcing. This
revision added that when looking to compete for government jobs with industry,
decision-makers should
==^Åèìáëáíáçå=oÉëÉ~êÅÜ=mêçÖê~ã=do^ar^qb=p`elli=lc=_rpfkbpp=C=mr_if`=mlif`v= = - 11 - k^s^i=mlpqdo^ar^qb=p`elli=
balance the interests of the parties to make-versus-buy cost comparisons,
provide a level playing field between public and private offer or to a competition, and
encourage competition and choice in the management and performance of commercial activity (OMB, 2003, p. 2).
Regardless of policy initiatives to reduce the size of the federal government, the
federal government’s official workforce in 1999 stood around two million people.
Commenting on this number, Guttman (2003) observed, “That’s a fraction of the
‘shadow government’ which comprises an estimated 8 million employees who work for
the government on the basis of grants and contracts” (p. 289).
In 1999, the OMB revised the A-76 process a fifth time, allowing exceptions from
previous policy objectives. This revision stated that the government could engage in
inherently commercial activities if the following criteria were met:
The function was determined critical to combat effectiveness or mission effectiveness would suffer due to outsourcing.
A commercial source was not available or could not provide the product or service to meet government requirements in a timely manner.
Another federal agency could not provide the goods or services.
The procurement of goods or services from commercial firms would result in a higher cost to the government than if the item was produced internally. (OMB, 2003, p. 3)
Now the government had greater discretion to outsource only when it made
financial sense, rather than being forced by a blanket statement to privatize commercial
activities regardless of cost.
A key companion to this revision was the new statutory requirements of the FAIR
Act of 1998. In essence, the FAIR Act provided a how-to process for identifying federal
government functions that were not deemed inherently governmental (FAIR Act, 1998,
Sec 2). By further defining what inherently governmental meant and by offering
procedural guidance, this fifth revision was far more robust than previous versions. To

==^Åèìáëáíáçå=oÉëÉ~êÅÜ=mêçÖê~ã=do^ar^qb=p`elli=lc=_rpfkbpp=C=mr_if`=mlif`v= = - 12 - k^s^i=mlpqdo^ar^qb=p`elli=
ensure action from federal agencies, the Act required a yearly report from the head of
each executive agency that detailed all activities performed by federal government
sources that each agency deemed inherently governmental (FAIR Act, 1998, Sec 2).
For accountability, this list was to go directly to the OMB and Congress for review each
year.
In 2001, President Bush released the President’s Management Budget (PMB),
which identified competitive sourcing as one of five management initiatives designed to
enhance government effectiveness (Office of the Under Secretary of Defense for
Defense, Personnel, and Readiness, 2004, p. 33). His goal was to make 425,000
federal government jobs out of two million “eligible for private contracting” (Nakashima,
2001, p. 27). It is important to note that the PMB placed a direct emphasis on unification
and simplification of the acquisition environment to support the procurement process
and provide less ambiguity when complying with acquisition directives (Office of the
Under Secretary of Defense for Defense, Personnel, and Readiness, 2004, p. 33). This
became the impetus for another two-year review of OMB Circular A-76.
In 2003, the most recent A-76 version was released. This 2003 revision
thoroughly outlines guidelines and procedures for whether the federal government
should perform an activity in-house with organic government personnel or outsource the
activity to the private sector (OMB, 2003, p. 2). Four succinct attachments break down
the documentation and submission requirements to ensure standardized compliance
across all agencies of the federal government. Attachment A contains the inventory
process for categorizing activities as commercial or inherently governmental.
Attachment B identifies the process used for public–private competitions. Attachment C
outlines the rules for calculating competition costs, and Attachment D supplies the
Circular’s definitions (Luckey, 2003, p. 1). The Commercial Activities Panel, which was
convened by the GAO, was chiefly responsible for the 2003 A-76 revisions. The Panel
stated, “[The] new Circular permits a greater reliance on procedures contained in the
Federal Acquisition Regulations, and should result in a more transparent, simpler, and
consistent applied process” (Walker, 2003, p. 65).

==^Åèìáëáíáçå=oÉëÉ~êÅÜ=mêçÖê~ã=do^ar^qb=p`elli=lc=_rpfkbpp=C=mr_if`=mlif`v= = - 13 - k^s^i=mlpqdo^ar^qb=p`elli=
3. Selective Sourcing and the Current A-76 Policy
In the late 1990s, the Navy pioneered the selective sourcing process to
circumvent the A-76 process, which was “widely criticized as costly, time-consuming,
and biased” (Cahlink, 2001, p. 48). Under strategic sourcing, unlike A-76, the goal is not
just reductions in manpower. Instead, the goals are to improve how the unit or function
operates and to find the right balance between workers and efficiency. Specifically,
“strategic sourcing is aimed at eliminating obsolete business practices, consolidating
jobs, restructuring organizations, … adopting commercial business practices” and
saving money for specific strategies (Cahlink, 2003, p. 2232). In addition, “that allowed
the services to eventually cancel outsourcing competitions for tens of thousands of jobs”
(Cahlink, 2003, p. 2232). It is about taking a fresh look at how business is conducted.
As Anderson, McGuiness, and Spicer (2001) noted in their book From Chaos to Clarity,
How Cost-Based Competition Hurts the DoD, a primary advantage of selective sourcing
is “that strategic sourcing generates smarter business decisions because it addresses
the question of whether a function should be performed at all before answering the
question of who should perform it. The traditional A-76 process lacked this first step”
(pp. 4–25).
These selective sourcing ideas were unofficially implemented by the DoD in April
2000 (Anderson et al., 2001, pp. 4–21). The spirit of those practices guided new
changes to the A-76 process two years later. The intent behind the 2003 version of
OMB Circular A-76 rests on these four classic economic assumptions:
The federal government should not compete against its citizens, but should rely on the commercial sector to supply products and services needed by the government.
The government can conduct cost-comparison studies to determine who best to do the work through a process of managed competitions.
Market forces can determine the most effective and cost-efficient methods to operate functions in both government and commercial sectors.

==^Åèìáëáíáçå=oÉëÉ~êÅÜ=mêçÖê~ã=do^ar^qb=p`elli=lc=_rpfkbpp=C=mr_if`=mlif`v= = - 14 - k^s^i=mlpqdo^ar^qb=p`elli=
The nature of competition within the marketplace can be self-managed and not require government oversight. (Grasso, 2005, p. 3)
With a foundation in place, the government hoped to achieve three specific goals
by outsourcing. The three distinct goals of the A-76 process are as follows: (a) achieve
economy and enhanced productivity, (b) keep inherently governmental functions in-
house, and (c) rely on the commercial sector for products and services when
economical (Moreau, 2002, p. 8). As stated in a Congressional Research Service report
to Congress (Halchin, 2003),
The 2003 revision, among other things, required agencies to submit inventories of their inherently governmental activities; eliminated direct conversions (that is, functions that met certain requirements could be converted to the private sector without the agency having to hold a public-private competition for each function); and established specific time frames for the completion of standard and streamlined competitions. (p. 2)
The aim of the updated policy was to create a most efficient organization (MEO)
through streamlined government operations or through privatization. The privatization
process now had three stages:
1) Develop a performance work statement (PWS) describing the work to be done.
2) Design the most efficient organization (MEO). This becomes the government’s bid to keep services in-house.
3) Compare the government’s and contractors’ bids to determine who can perform the work most efficiently. (Halchin, 2003, pp. 6–7)
According to the law, the work should remain in-house unless a contractor’s bid
is “equal to or exceeds the lesser of 10 percent of the personnel-related costs for
performance of that function in the agency tender; or $10,000,000” (OMB, 2003, p. B-
16). The goal is not to outsource every possible job that the civilian sector can perform.
Rather, it is to assess the most efficient organization possible and, based on that
assessment, to outsource only activities over which the government does not own a
competitive advantage.
==^Åèìáëáíáçå=oÉëÉ~êÅÜ=mêçÖê~ã=do^ar^qb=p`elli=lc=_rpfkbpp=C=mr_if`=mlif`v= = - 15 - k^s^i=mlpqdo^ar^qb=p`elli=
a. DoD Budget Impacts
Projected savings from either the A-76 process or strategic sourcing have direct
impacts on current budgets. As a result of the Defense Reform Initiatives of 1997, which
governed the DoD’s A-76 practices, “anticipated savings were taken out of the budget
immediately up front without proof that the savings would actually occur” (Anderson et
al., pp. 4–14). For example, the Marine Corps could project future savings of $100
million from competitions, without ever proving that those savings were feasible. That
$100 million could then be immediately reallocated elsewhere to future years’ spending.
This put an enormous up-front pressure on the Services to announce competitions and
future savings, but without a corresponding infrastructure to ensure these savings were
occurring.
B. Reasons to Outsource
1. Introduction
Up to this point in our thesis, we have discussed outsourcing from a broad
perspective, emphasizing the larger federal government and the history of OMB Circular
A-76. The historical background of the A-76 process is pivotal to setting the stage for
how and why the DoD competitively sources activities. Outsourcing is vital to the DoD in
order to increase warfighter end strength, reduce costs, and increase the efficiency of
organizations (Mahoney & Schofield, 2006, pp. 13–17).
2. Increase Warfighter End Strength
As long as wars have been fought, militaries have been searching for ways to
operate most effectively. Since the post–Cold War military end-strength drawdown of
the late 1980s, the DoD has been pursuing outsourcing with vigor. By replacing military
personnel with contractor personnel, the Services are able to reassign their personnel to
operational areas in which shortages exist (GAO, 2003). With the current commitments
in Iraq and Afghanistan approaching 10 years and forces stretched all around the globe,
the structure of the military has become heavily reliant on outsourcing contractors.

==^Åèìáëáíáçå=oÉëÉ~êÅÜ=mêçÖê~ã=do^ar^qb=p`elli=lc=_rpfkbpp=C=mr_if`=mlif`v= = - 16 - k^s^i=mlpqdo^ar^qb=p`elli=
Simply stated, contractors provide a cost-effective and cost-efficient way to fill capability
gaps.
In current combat zones, battlefield contractors clean toilets, serve food, drive
convoys, and conduct security for high-ranking individuals. Many of these contractors
carry weapons and have engaged in firefights, often fighting alongside military forces
(Priest, 2004, p. A01). Contractors are a critical force multiplier because they allow the
military to focus on its core competencies while the contractors provide sustained cost-
efficient support (Priest, 2004, p. A01). In Iraq, the Logistics Civil Augmentation
Program III (LOGCAP III), a contract awarded by the Army to Kellog, Brown, and Root
(KBR), has produced impressive results:
KBR employees have served more than one billion meals, delivered approximately 440 million pounds of mail, produced nearly 23 billion gallons of water, issued more than 8 billion gallons of fuel, hosted more than 170 million patrons at MWR (Morale, Welfare and Recreation) facilities, logged more than 701 million miles transporting supplies and equipment for the military, and laundered 78 million bundles of laundry all in an effort to support U.S. troops as they carry out dangerous missions. (“KBR Plans,” 2010, p. 10)
This program has allowed the armed forces to put more combat brigades into
war zones to fight because it has freed up military personnel who no longer have to
provide those activities internally. Because military end strength is dictated by law, the
military has taken an active role in reviewing positions that can be replaced by civilians,
thus allowing more troops for combat roles.
According to the article “Reconsidering Battlefield Contractors” by Doug Brooks
and Jim Shevlin (2005), the utility of this type of outsourcing is indispensable. As Brooks
and Shevlin (2005) stated,
[The] reality is that the U.S. Military recognizes and relies on the enormous value of the private sector for supply, construction, personal security details, convoy security, and logistics. At a time of operational overstretching, outsourcing services does much to reduce the enormous burden and stress placed on regular soldiers. (p. 110)
==^Åèìáëáíáçå=oÉëÉ~êÅÜ=mêçÖê~ã=do^ar^qb=p`elli=lc=_rpfkbpp=C=mr_if`=mlif`v= = - 17 - k^s^i=mlpqdo^ar^qb=p`elli=
The article also highlighted three major service sectors within the “Peace and
Stability” (Brooks & Shevlin, 2005, pp. 103–104) industry. First, non-lethal service
providers (NSPs) provide construction services, logistics support, maintenance, and
most of the other non-military, commercial-type activities. Second, private security
companies (PSCs) furnish protection for people, places, and things that provide security
in the United States and around the world, even in the most kinetic combat zones.
Third, private military companies (PMCs) “are used to alter the strategic shape of
conflict. ... They generally work for states ... and provide military and police training”
(Brooks & Shevlin, 2005, pp. 103–104). With so many military services that can be
provided by outsourcing, it is easy to see why Peace and Stability is a $20 billion-a-year
industry (Brooks & Shevlin, 2005, p. 104).
3. Reduce Costs
The acquisition of services accounts for over 50% of the DoD’s annual
acquisition budget, surpassing its purchases of supplies (Implementing Improvements,
2011, p. 11). A recent DSB Task Force found that the current service acquisition total is
$400 billion annually (OUSD[AT&L], 2011, p. 11). Given this level of spending,
potentially large savings can be achieved through competition.
The DoD estimates that competitive competitions could yield cost savings of 20–
30% (Grasso, 2005, p. 10). In 2003, the OMB claimed that the DoD achieved savings of
30% on over 3,000 competitions conducted since 1979 (GAO, 2000, p. 6). In addition, a
CBO report from 2005 showed that the Army realized a 90% savings in costs by using
contractors to deliver logistics support in Iraq (CBO, 2005, p. 36). The majority of these
savings came from the reduced personnel costs that resulted from eliminating military
jobs and competitive sourcing of existing service contracts (i.e., putting contracts up for
bid every few years to get a better deal).
As a direct result within the DoD, the MEO bid process means cost savings are
often realized regardless of whether the DoD or the commercial sector wins the
competition (CBO, 2005, p. 36). By reducing personnel and service costs, the DoD can
==^Åèìáëáíáçå=oÉëÉ~êÅÜ=mêçÖê~ã=do^ar^qb=p`elli=lc=_rpfkbpp=C=mr_if`=mlif`v= = - 18 - k^s^i=mlpqdo^ar^qb=p`elli=
reinvest that money into procurement, operations, and maintenance. For example, if the
Marine Corps shaved $1 billion from personnel costs, it would have $1 billion to spend
on buying new weapons. All of these reasons combined make outsourcing an attractive
way to carry out government functions and increase cost effectiveness.
4. Increase Efficiency
Outsourcing is mandated by Circular A-76 (OMB, 2003, p. 105) and used in
conjunction with the FAIR Act of 1998 (1998). From the DoD’s perspective, compliance
with these two laws allows it to consistently assess the activities it is required to perform
and those that can be privatized, keeping its costs and size to a minimum. This is the
primary reason why the MEO concept for competitive outsourcing benefits the DoD.
In addition to compliance with the laws, several other valuable reasons motivate
the DoD to outsource: increased surge capacity and speed, force multiplication,
increased specialized skills, ease of use, and cost efficiency (Brooks & Shevlin, 2005, p.
107). Contractors are used because there is a gap in military/governmental capability
and because contractors possess the capability to fill those gaps. For example, as
Brooks and Shevlin (2005) wrote,
Surge capacity and speed refers to the ability of the military to increase its capabilities and specialties quickly. The process of recruiting or conscripting takes months and years. ... Many military specialties in greatest demand require years of training. ... By contrast, private firms can quickly recruit personnel with the needed expertise from the global pool of former military [personnel] and fill short-term contracts with finite costs. (p. 106)
Contractors can operate more efficiently by using fewer people and resources than the
military and without the same restrictions as are imposed on the DoD. In addition,
contractors implement best practices from the business world that amplify these positive
effects, often in sharp contrast to the DoD.
In their book Personnel Savings in Competitively Sourced DoD Activities: Are
They Real? Will They Last?, Susan Gates and Albert Robbert (2000) discussed the
reasons government organizations do not streamline functions to increase efficiencies

==^Åèìáëáíáçå=oÉëÉ~êÅÜ=mêçÖê~ã=do^ar^qb=p`elli=lc=_rpfkbpp=C=mr_if`=mlif`v= = - 19 - k^s^i=mlpqdo^ar^qb=p`elli=
without outside stimulus (p. 1). In contrast to the commercial sector, where
organizations face strong incentives to reduce costs, improve effectiveness, and
increase efficiency, the DoD focuses more on results and maximizes the availability of
resources (Gates & Robbert, 2000, p. 36). The benefits of the symbiotic relationship
between the commercial sector and the DoD are realized in this gap between these
organizations’ strategic views and goals. The commercial sector is awarded contracts,
and their profits come from meeting performance goals while keeping costs low. Private
companies are forced to do more with less. On the other hand, the DoD is able to
maximize its resources (i.e., spend less money) while receiving the same or better
levels of service. The bottom line is that, done correctly, competition can spur efficiency
and innovation.
C. Risks of Outsourcing
1. Introduction
There are definite risks to outsourcing. Often, these risks outweigh the benefits
and are key factors in whether or not a particular outsourcing initiative is successful.
Because the A-76 process places such a strong emphasis on cost avoidance, proposals
for costly in-house alternatives to outsourcing are usually not put forward, even though
they could provide long-term strategic benefits (Gates & Robbert, 2000, p. 37). For
example, the A-76 process favors privatizing the operations of warehouse personnel
instead of investing in a new inventory management system that could make
government personnel more efficient and cost effective in the long run. This leads to
outsourcing functions based solely on costs rather than on associated risks. One
argument that supports this practice may be that the risks and associated costs are
difficult to quantify, while the benefits of outsourcing are much easier to quantify
because in-house cost reductions are easy to identify (Brooks, White, & Moore, 2004, p.
84).

=^Åèìáëáíáçå=oÉëÉ~êÅÜ=mêçÖê~ã=do^ar^qb=p`elli=lc=_rpfkbpp=C=mr_if`=mlif`v - 20 - k^s^i=mlpqdo^ar^qb=p`elli=
2. Associated Risks
a. Strategic vs. Operational Risks
Strategic risks are associated with the decision to outsource a function, whereas
operational risks are associated with how to outsource a function (Brooks et al., 2004, p.
85). In their master’s thesis Cost Analysis of Outsourcing an Air Force Supply
Squadron, Ryan Mahoney and Scott Schofield (2006) discussed the difference between
strategic and operational risk, and they offered several examples. Two relevant risks
from their thesis warrant attention here: outsourcing of core competencies and
packaging of requirements (Mahoney & Schofield, 2006, p. 13).
Military core competency is defined by the DoD Senior Executive Council as “a
complex harmonization of individual technologies and production skills that create
unique military capabilities valued by the force employing them” (GAO, 2003, p. 41).
The Council identifies a core competency as “one that provides a significant contribution
for the combatant commander, is a direct contributor to the value of the service, is
difficult to imitate, provides a means of differentiation, and has potential application to a
number of national security needs” (GAO, 2003, p. 42). For example, a core
competency of the Marine Corps is integrated combined arms. This means that the
Marine Corps offers the Combatant Commander the ability to execute a scalable sea,
air, and land battle plan in any environment around the world. Each branch of Service,
unit, and individual troop has competencies that define its operational mission. These
competencies are the heart of military and national security operations and should not
be outsourced. The A-76 process, however, only focuses on functions deemed
inherently governmental. Core competency is not adequately addressed by policy
(OMB, 2003, p. 3). Although this may seem a matter of semantics, the important part is
that not all inherently governmental functions are core competencies and vice versa.
Thus, risk exists if military core competencies are outsourced (GAO, 2003, p. 2).
The second risk, packaging requirements, refers to the DoD identifying
commercial activities to be studied, and then bundling these activities, where possible,
with other activities for outsourcing (Powell, 2002, p. 23). For example, if the Marine

==^Åèìáëáíáçå=oÉëÉ~êÅÜ=mêçÖê~ã=do^ar^qb=p`elli=lc=_rpfkbpp=C=mr_if`=mlif`v= = - 21 - k^s^i=mlpqdo^ar^qb=p`elli=
Corps contracted with a company to cut the grass at Camp Pendleton, it would make
sense to eliminate the contract for a different company to pick up trash around the
buildings. It would create a savings for the government to have the company that cuts
the grass also pick up trash. The risk lies in improperly bundling activities. Through
proper bundling, several functions can be combined to reduce contractor competition,
thereby reducing the occurrence of opportunistic behavior. Improper bundling or failure
to bundle at all leads to increased costs associated with outsourcing. Although bundling
is an important step in the A-76 process and should be executed to its full extent, this
bundling process involves a certain level of risk that should be taken into account.
b. Service Contract Shortfalls
While many risks are associated with service acquisition contracting, two
particular examples from a 2011 DSB Task Force report, Improving Service Acquisition
Contracting (OUSD[AT&L], 2011), are noteworthy. First, there are often no “quality,
productivity, and performance standards for each type of service” (OUSD[AT&L], 2011,
p. 1) within the DoD. Second, buying services is very different than buying airplanes,
tanks, and guns, but the DoD does not have policies in place that acknowledge this
difference. In fact, most of the “current acquisition regulations, laws, policies, standards,
training, education, and management structure are focused on optimizing the
characteristics of products. Only a small fraction of these focus on the way services are
acquired” (OUSD[AT&L], 2011, p. 9).
The first issue, no standard performance metrics, implies the government lacks a
coherent method for evaluating “quality, quantity, timeliness, continuity, and other
factors measured as the contract is executed” (OUSD[AT&L], 2011, p. 9). This would be
akin to buying an airplane without the ability to evaluate if the airplane is operating to
key performance parameters. Every service function is different. For example, it is
impossible to evaluate the performance of security services and dining facility
operations in the same way. Methods must be established to identify the quality and
performance of each sector in relation to other services in the same portfolio.
==^Åèìáëáíáçå=oÉëÉ~êÅÜ=mêçÖê~ã=do^ar^qb=p`elli=lc=_rpfkbpp=C=mr_if`=mlif`v= = - 22 - k^s^i=mlpqdo^ar^qb=p`elli=
To remedy this situation, the DSB Task Force recommends implementing
“performance-based and cost-based outcome measures to achieve desired behavior”
(OUSD[AT&L], 2011, p. 9). This means, for example, that each contracted security force
at locations worldwide should be measured using similar metrics. A simplified, across-
the-board standard for a particular service portfolio would allow the government to
quickly and easily ascertain how companies are performing in relation to their peers. In
addition, this standard would allow the government to retain ownership of best practices
from across the industry, ensuring these practices are included as requirements in
future contracts.
The second issue is that the government needs to update its acquisition
infrastructure to properly handle service contracting. According to the DSB Task Force,
The entire defense workforce lacks knowledge and experience in service contracting, auditing, and oversight. ... [A] large contributing factor to this lack of knowledge and experience is that functional personnel currently managing service programs are not considered members of the DoD acquisition workforce. (OUSD[AT&L], 2011, p. 23)
When “$10 million for service contracts are routine, and $100 million contracts
are not out of the ordinary” (OUSD[AT&L], 2011, p. 9), it would seem imperative to have
competent contracting officers. A poorly trained service contracting workforce means
that the entire sector’s performance is hampered by far-reaching consequences.
Ineffective, inefficient, and poorly executed contracts imply the government does not
realize intended cost savings and performance standards. For example, contracting
officers often execute contracts “to the maximum amount allotted with little regard for
the efficiencies that could be realized” (OUSD[AT&L], 2011, p. 9). In essence,
contracting officers unintentionally maximize the contractor’s profits without regard to
the quality of service the government receives.
Remedying this troubling lack of training and experience requires a top-to-bottom
review of how service contracting personnel are recruited and trained. One of the most
urgent reforms is to establish more formal training and certification requirements for

==^Åèìáëáíáçå=oÉëÉ~êÅÜ=mêçÖê~ã=do^ar^qb=p`elli=lc=_rpfkbpp=C=mr_if`=mlif`v= = - 23 - k^s^i=mlpqdo^ar^qb=p`elli=
service acquisition professionals (OUSD[AT&L], 2011, p. 24). A more educated
workforce would allow the sector to become more efficient, flexible, creative, and
effective in its duties. Furthermore, the service contracting sector needs to rapidly gain
competent experience. A novel approach to doing this would be to seek out
professionals from the commercial sector (OUSD[AT&L], 2011, p. 25). By recruiting and
retaining individuals with service contracting experience from the private sector, the
government could quickly capitalize on existing best practices. This would reduce the
learning curve, allowing the DoD to quickly make up lost ground within this critical
acquisition sector.
3. Manpower Risks
The first risk to manpower from outsourcing relates to a structural change within
the organization that outsourcing affects. When a certain function within the military is
outsourced, the workload for the outsourced function’s section is reduced to make those
personnel available for reassignment to more critical roles (GAO, 1999, p. 14). Even
though the support function is outsourced, the overall military authorizations in that
service may not decline because the military positions that are deleted from one
function are put to use in another function (Gates & Robbert, 2000). The risk of
outsourcing a military function and maintaining the underlying force structure without
deleting or reassigning personnel is increased personnel costs.
Major Christopher Rabassi (2010), the operations officer at the Marine Corps
Ground Supply School, made the following statement in regard to outsourcing ground
supply assets:
The establishment of the consolidated issue facility reduced the need for (warehouse clerks) at the standard battalion level account. Other current initiatives are also reducing the equipment footprint within a battalion supply warehouse, so the obvious question is “what are these Marines doing?” (p. 59)
The question he posed directly addresses the issue of maintaining current
structure in the face of outsourcing that may lead to increased personnel costs for the
Marine Corps or other military agencies.

==^Åèìáëáíáçå=oÉëÉ~êÅÜ=mêçÖê~ã=do^ar^qb=p`elli=lc=_rpfkbpp=C=mr_if`=mlif`v= = - 24 - k^s^i=mlpqdo^ar^qb=p`elli=
The second risk to manpower is reduced promotion competitiveness because of
decreased occupational credibility. Service members who are freed up because of
outsourcing can be tasked more frequently outside of their occupation. This increased
time out of their occupational specialty can affect promotion opportunities because
these service members lack occupational credibility compared to their peers. According
to Manpower and Reserve Affairs’ 2011 debrief regarding the results of the Marine
Corps staff non-commissioned officer promotion board (Headquarters, Marine Corps,
2011), Marines who do not have at least one to two years observed time in their military
occupational specialty (MOS) are less competitive than their peers. Therefore, reduced
upward mobility is the career risk imposed on military personnel because individuals in
outsourced MOSs lack the skills to perform at a supervisory level.
The final risk is retaining qualified personnel. This potential risk goes hand-in-
hand with promotion opportunities. If the occupation is unable to promote members
beyond a certain rank due to issues such as MOS credibility or better pay in the private
sector, these members will be forced to either move to another MOS or separate from
the Service completely. As shown in the following section, this brain drain can have far-
reaching impacts many years down the line.
D. Marine Corps’ Outsourcing Experience
The Marine Corps’ outsourcing experience is filled with periods of intense focus
on privatization of not inherently governmental services and with periods of almost no
outsourcing efforts, despite government mandate. Between 1995 and 1998, the Marine
Corps did not conduct any A-76 competitive sourcing studies. In the same period, the
other Services successfully privatized 5,757 positions and announced the competition
for another 74,504 positions for potential conversion (GAO, 1999, p. 5). Then, in 1999
the assistant deputy chief of staff for Marine Corps Installation and Logistics (I&L) made
the following statement before a House Armed Services Committee: “The United States
Marine Corps is committed to managing its resources in the most effective and efficient
manner while transforming to a modernized force designed to meet our national security
==^Åèìáëáíáçå=oÉëÉ~êÅÜ=mêçÖê~ã=do^ar^qb=p`elli=lc=_rpfkbpp=C=mr_if`=mlif`v= = - 25 - k^s^i=mlpqdo^ar^qb=p`elli=
objectives now and into the 21st Century” (Statement of Mr. Robert E. Hammond, 1999,
p. 2).
This sentiment was backed up by Commandant James Jones, who believed the
Marine Corps should get out of some MOSs completely in order to shift Marines to
warfighting roles. In an interview, he recommended the Marines get out of garrison food
service altogether to “free up more Marines for assignment to the operating forces”
(“USMC Commandant,” 1999, p. 24). General Jones stated, “privatizing the garrison
food service in the continental U.S. will make nearly 600 Marine cooks available for re-
designation to combat arms specialties” (“USMC commandant,” 1999, p. 24). This late
1990s push for privatization from top leadership caused a fundamental shift in the
Marine Corps over the following decade. Since then, the Marine Corps has outsourced
logistics, supply services, information technology (IT), police and fire services, food
services, and myriad other functions. From 1999 to 2006, approximately 4,000 billets
were studied for conversion and 1,943 were approved (Marine Corps, 2006). During this
time, however, the Marine Corps outsourced more of its services to civilians while
expanding the size of its force 15% over the course of the decade (GlobalSecurity.org,
2011). In the next sections of this literature review, we focus on the Marine Corps’ larger
outsourcing endeavors in IT and in supplies and logistics.
1. Information Technology
In the Department of the Navy (DoN), a project called Navy and Marine Corps
Intranet (NMCI) provides enterprise-wide IT management. NMCI struggled from the
outset, and then achieved quiet success. In October 2000, Electronic Data Systems
(EDS) won a then $6.9 billion contract to provide outsourced IT management for the
Navy and Marine Corps to consolidate over 200 independent networks and systems
(Schneider, 2000, p. E2). According to Military Information Technology (“Delivering IT
Solutions,” 2010), NMCI was
a revolutionary approach for obtaining voice, video and data communications and computing capabilities within the DoN. Today, NMCI is the U.S. government’s largest IT outsourcing program and is the biggest intranet in the world. Through a

==^Åèìáëáíáçå=oÉëÉ~êÅÜ=mêçÖê~ã=do^ar^qb=p`elli=lc=_rpfkbpp=C=mr_if`=mlif`v= = - 26 - k^s^i=mlpqdo^ar^qb=p`elli=
partnership with industry, NMCI provides mission-critical IT services to nearly 700,000 military and civilian users on 360,000 workstations and laptops in more than 3,000 locations. It also accounts for 70 percent of all naval IT operations. (p. 1)
Out of these large numbers, the Marine Corps originally planned on transitioning
86,000 individual workstations to the network to outfit its military and civilian personnel
(Donnelly, 2006). This gigantic undertaking is second only to the whole Internet in
number of users (Hewlett Packard [HP], 2011).
Industry analysts used a simple analogy to describe the plan:
It was the old phone company model: you do not own your phone, the wires, the back office, the technicians, the switches, the overhead, or any other aspect of phone service; you only control and manage what takes place on the phone. ... You paid for a level of service, and the phone company controlled everything about the process. That was the model that was chosen for NMCI: a guarantee that the network would have connectivity and that it would work. (Grace, 2011, p. 96)
The complete outsourcing of services to a single vendor presented many risks to
the government: loss of operational control, management, the ability to deploy to war
zones, and brain drain. Many talented IT professionals in the Navy and Marine Corps
left to seek better opportunities in the civilian sector (Grace, 2011, p. 96).
As of 2011, 700,000 Navy, Marine, and civilian users have utilized 387,000
computer workstations around the world (HP, 2011). Even though EDS met its
contractual requirements, it was not without massive issues during implementation, and
“the early years were beyond painful” (Grace, 2011, p. 96). In the early stages of the
project, “EDS was losing money on NMCI, experiencing a $334M loss in the first quarter
of 2003, and a loss of $316M for the first six months of 2004” (Jordan, 2007, p. 6). As
problems persisted, Congress took notice and wanted answers. In 2006, six years and
an extra $2.4 billion after the contract was awarded, a GAO (2006) report stated the
following:
The Navy had met only 3 of 20 performance targets (15 percent) associated with the program’s goals and nine related performance categories. By not

==^Åèìáëáíáçå=oÉëÉ~êÅÜ=mêçÖê~ã=do^ar^qb=p`elli=lc=_rpfkbpp=C=mr_if`=mlif`v= = - 27 - k^s^i=mlpqdo^ar^qb=p`elli=
implementing its performance plan, the Navy has invested, and risks continuing to invest heavily, in a program that is not subject to effective performance management and has yet to produce expected results. (p. 1)
The report also showed that only 69% of Marines were satisfied with NMCI and
only 72% were satisfied with the contractor-provided services (GAO, 2006, p. 44),
numbers that are well below the program goal of 85%. The key issue identified by the
GAO was the lack of performance metrics to evaluate the program as it was
implemented. If the system was to meet its technical goals and promote user
satisfaction, performance parameters were required. Essentially, the program focused
on rolling out functional computers and not on how well the users adapted to and used
the network.
By 2010, the DoN had invested $9.3 billion in NMCI (Wideman, 2010), and it was
at the end of its original contract: “NMCI was essentially a success and [had] achieved
most of the goals for which it was designed. ... Most of the problems [had] been
resolved with the constraints of policy, procedure, and security—three very difficult
masters” (Jordan, 2007, p. 10). As early as 2008, the Navy and Marine Corps were
looking to further outsource the Next Generation Network (NGEN). This $14.5 billion IT
program was intended to build on NMCI’s enterprise-wide foundation (Thurmer, 2011).
However, in a reversal of strategy, the NGEN will give “the Navy and Marine Corps
more direct command and control of the network and [open] it to multiple contractors
and their sub[contractors]” (Grace, 2011, p. 96).
DoN leadership, realizing that one size does not fit all, hopes that the new NGEN
approach will promote more competition, better pricing, and greater innovation
(Thurmer, 2011). As noted previously, a potential costly issue is that many IT
professionals left the government for the business world. Currently, “the services are
struggling to find that same government talent to implement the transfer of the exact
same system from the hands of industry back into the control and management of
government” (Grace, 2011, p. 96). By adopting “a more direct role in commanding and
==^Åèìáëáíáçå=oÉëÉ~êÅÜ=mêçÖê~ã=do^ar^qb=p`elli=lc=_rpfkbpp=C=mr_if`=mlif`v= = - 28 - k^s^i=mlpqdo^ar^qb=p`elli=
controlling operation of the network” (Schneider, 2000, p. 2), the Navy can keep IT
specialists in its own ranks instead of losing them to contracting companies.
2. Supply and Logistics: Consolidated Issue Facility
The Marine Corps’ CIF system of ICCE issuance and management represented
a large departure from previous practice up until 2001. The program that preceded it,
Career Length Issue (CLI), issued each Marine his or her equipment one time, and the
Marine took the equipment everywhere and was responsible for maintaining it
throughout his or her entire enlistment. A full complement of ICCE was approximately
35 items and included everything from cold- and wet-weather clothing to medical kits to
backpacks (Federal Information & News Dispatch, 1998). The Marine Corps recorded
the gear in the Marine’s Service Record Book (SRB) to document the items and total
cost. Marines then returned the gear to the supply section of their last unit before
leaving the Service. Any missing gear had to be replaced at the individual Marine’s
expense, or a missing gear statement had to be signed by the commanding officer
(CO).
The CLI was great in theory; however, problems existed in accountability from
both individual Marines and ground supply. There was no enterprise-wide visibility of the
items after they left the warehouse, and, quite often, Marines left the Service without
turning in their gear. The program presented an extremely large problem accounting for
gear that was checked in to one supply unit but checked out from another. The Marine
Corps could not track the movement of gear and, thus, was forced to continually replace
gear. This program lasted about two years before being scrapped for the CIF model of
centralized asset management. CLI officially ended on January 4, 2000, when the
commandant issued MARADMIN 003/00 (Marine Corps, 2000a). It directed a “transition
to CIFs as the primary method of logistics support for ICCE. ... Logistics support for
ICCE [was] centrally managed to increase efficiencies, reduce the burden on the
Operating Forces, and improve customer support” (Marine Corps, 2000a, p. 1).

=^Åèìáëáíáçå=oÉëÉ~êÅÜ=mêçÖê~ã=do^ar^qb=p`elli=lc=_rpfkbpp=C=mr_if`=mlif`v - 29 - k^s^i=mlpqdo^ar^qb=p`elli=
The initial Marine Corps order states that CIF’s mission was
to provide centralized issue, recovery, and associated management of ICCE for operating force units and Marines assigned to bases, posts, and stations in a geographical region. The CIF mission may be expanded when ICCE management is fully implemented. Future areas of consideration include nuclear, biological, and chemical defense (NBCD) items; contingency training allowance pool (CTAP) items; support for formal schools; and any other material conducive to centralized issue and recovery. (Marine Corps, 2000a, p. 1)
From the outset, this program was created with expansion in mind. It was created
with the goals of eventually managing a full complement of gear that was previously
managed by organic supply sections and of creating efficiencies and reducing workload
on the operating forces.
Under the current CIF program, when a Marine checks into a unit, he or she
receives a full complement of gear from the base CIF facility. The Marine keeps it for his
or her entire tour at that base, and upon permanent change of station (PCS) orders, the
Marine turns in his or her gear to the local CIF. The Marine then pays the government
for any missing or damaged gear before he or she is allowed to check out of the unit
and execute the new PCS orders. If the Marine stays within the same MEF (e.g., moves
from a unit at Pendleton to 29 Palms), he or she keeps that complement of gear. This is
possible because the MEF owns and controls all the gear; it is just managed by an
outside contractor.
Even though life cycle management of ICCE is privatized, the local unit
commander is still responsible for what happens to the gear in each Marine's
possession and is required to adjudicate any gear that is lost or stolen. The battalion
CO has to investigate each instance of suspected loss and decide whether to charge
the Marine for the value of the missing property or write it off for line-of-work reasons.
For example, a Marine turns his or her gear into the CIF after deployment to Iraq. The
Marine is missing a substantial portion of his or her gear, but it is missing because the
truck he or she was riding in caught fire and was destroyed, including all the gear. The
CO can write that off as a combat loss, and the Marine is not held financially
responsible for that gear. However, if the Marine is missing gear because of negligence,
==^Åèìáëáíáçå=oÉëÉ~êÅÜ=mêçÖê~ã=do^ar^qb=p`elli=lc=_rpfkbpp=C=mr_if`=mlif`v= = - 30 - k^s^i=mlpqdo^ar^qb=p`elli=
the CO directs that he or she be held responsible for the entire value of the missing
gear.
The amount of gear the contractors manage is very large and is tracked by a
proprietary automated asset-management tool. Within the I MEF alone, the CIF
program manages 161 Table of Authorized Material Control Numbers (TAMCNS)
assets, with 1,026,487 items in stock and 3,993,000 items issued to Marines (Lion
Vallen Industries, 2011b). Each gear set is valued at approximately $4,400 (Lion Vallen
Industries, 2011b), and each CIF satellite warehouse can outfit all the Marines stationed
at that base. In addition, according to a CIF employee, “we have to maintain
accountability of everything in the warehouse, and if something is not accounted for, the
company writes a check to the government for the lost items” (Zimmer, 2004). This
pressure on the contractor helps the Marine Corps ensure it receives high levels of
asset accountability for its money.
According to the Lion Vallen Industries website (2011a), since 2001, it has
support[ed] the Marine Corps operating forces worldwide with Total Asset Visibility. ... LVI actively manages over 480 National Stock Number (NSN) items in inventory approaching $1B in assets. Inventory accuracy increased from 80% to 99.9998% with LVI taking financial accountability of the value chain for ICCE assets, and issue effectiveness has increased to 99.97%. ... LVI currently operates 17 Individual Issue Facilities (IIFs) in CONUS and Japan, managing ICE and individual CBRNE gear, compared to 281 Control Points prior to consolidation, and with uniformed personnel reductions estimated at 40%. Individual and unit equipment issue times have dropped dramatically with Unit Deployment Program (UDP) issue times decreasing from 10 to 1.5 days. The laundry and asset repair and refurbish capabilities provided by LVI have extended asset service life with approximately $35M replacement value of items repaired annually. (Lion Vallen Industries, 2011a)
Because of the success of the CIF program, it was expanded into the Individual
Issue Facility (IIF) in 2008, and one contractor now manages the issue of all ICCE, gas
masks, and personal chemical biological radiological and nuclear defense (CBRN-D)
equipment. Previously, one contractor managed CBRN-D gear while another managed
ICCE (Wharton, 2010).
==^Åèìáëáíáçå=oÉëÉ~êÅÜ=mêçÖê~ã=do^ar^qb=p`elli=lc=_rpfkbpp=C=mr_if`=mlif`v= = - 31 - k^s^i=mlpqdo^ar^qb=p`elli=
However, the CIF program is not without drawbacks. For example, the
contractors do not operate in combat zones. A unit’s individual supply sections are
responsible for procuring, maintaining, and distributing ICCE gear in combat zones and
on ships when units are embarked aboard Marine Expeditionary Units (MEUs). Often,
this means that there is not resident knowledge of how to maintain or care for the gear
when deployed because this function is not performed back in the continental United
States (CONUS).
Since the CIF’s inception, supply Marines have a reduced workload because the
management of ICCE gear was given to the CIF. Often, supply Marines find themselves
filling odd jobs around base or being deployed into non-supply positions. In a Marine
Corps Gazette article, Major Rabassi (2010), a Marine Corps supply expert made the
following statement:
The workload is still not as great as when units maintained their own stock of individual equipment. Many of these Marines find themselves as incidental vehicle operators or local security, which is obviously an essential function for units given the current operational commitments. ... Furthermore, the civilian conversion of the contingency training and equipment pool has also reduced the need for 3051s [warehousemen]. (p. 59)
This reduction in workload leads to the possibility that the current Marine Corps
supply Marines are not as capable or effective as previous generations, or that their
position is not even required anymore given the push to privatize supply functions.
The IIF model of management is now moving toward managing unit assets such
as camouflage netting and soft-walled shelters, called the Unit Issue Facility (UIF).
According to a September 15, 2010, contract award announcement for the UIF, the
contractor will provide “overall coordination, streamlining, supervision, item issuance,
recovery, maintenance, repair, cleaning, storage, and status reporting” (Federal
Information & News Dispatch, 2010) of camouflage netting and soft-walled shelters at
Marine Corps bases around the world. Under this program, units will no longer have
direct management of these assets. The UIF will centrally manage and distribute the
items on an as-required basis. If a unit is conducting field operations, their supply unit

==^Åèìáëáíáçå=oÉëÉ~êÅÜ=mêçÖê~ã=do^ar^qb=p`elli=lc=_rpfkbpp=C=mr_if`=mlif`v= = - 32 - k^s^i=mlpqdo^ar^qb=p`elli=
must request the size, type, and number of tents required from the MEF, who will then
direct the UIF to loan out the items. Currently, if a commander directs training, he or she
can have the gear removed immediately from his or her unit’s supply warehouse, a
function performed by a supply Marine. With this further reduction in workload, the
future of supply Marines remains uncertain.
The Marine Corps currently plans to move to a sole-source contractor that
manages the entire array of outsourced logistics and supply functions. The program is
called the Consolidated Storage Project (CSP), and its mission is to “provide enterprise
level management and logistics support (e.g., issue, recover, storage, requisitioning,
maintenance, management, inventory visibility, accountability, automated shelf-life
management, forecasting, etc.) for ICCE, CBRND equipment, Special Training and
Allowance Poll (STAP) items (extreme hot/cold weather gear), and camouflage
netting/soft-walled shelters” (Marine Corps Logistics Command, 2009). In 2008, a one-
year contract with six one-year renewal options, valued at approximately $140 million,
was awarded to TAOS Industries to manage the entire CSP (“Marines Pact to Agility,”
2008). However, for unreported reasons, the contract fell through and was sourced
again in 2010; it is expected to be awarded in 2012 (Logistics Management Specialists,
2009).
To date, there have not been any published studies on the effectiveness of the
Marine Corps’ CIF concept during its 11-year history. This thesis is the first independent
study of the effects that the CIF has had on the Marine Corps in regard to cost and
effectiveness. Furthermore, no studies exist showing if the privatized, centralized
management of unit-level assets is more cost effective and efficient than using organic
supply personnel.
E. Summary
We began this chapter by introducing the concept of outsourcing and how it
applies to the federal government. We discussed the history of the OMB A-76 process
and how the current revisions to this process affect both current and future outsourcing

==^Åèìáëáíáçå=oÉëÉ~êÅÜ=mêçÖê~ã=do^ar^qb=p`elli=lc=_rpfkbpp=C=mr_if`=mlif`v= = - 33 - k^s^i=mlpqdo^ar^qb=p`elli=
initiatives. We then discussed the reasons to outsource by identifying the advantages of
increased warfighter end strength, decreased costs, and increased efficiency. We
further highlighted the advantages of outsourcing and identified associated risks related
to service contract shortfalls and manpower. Finally, we concluded the chapter with a
discussion of the Marine Corps’ outsourcing experience with IT and the CIF. In
Chapters III and IV, we discuss our data collection process and analysis methodology.

=^Åèìáëáíáçå=oÉëÉ~êÅÜ=mêçÖê~ã=do^ar^qb=p`elli=lc=_rpfkbpp=C=mr_if`=mlif`v - 34 - k^s^i=mlpqdo^ar^qb=p`elli=
THIS PAGE INTENTIONALLY LEFT BLANK

=^Åèìáëáíáçå=oÉëÉ~êÅÜ=mêçÖê~ã=do^ar^qb=p`elli=lc=_rpfkbpp=C=mr_if`=mlif`v - 35 - k^s^i=mlpqdo^ar^qb=p`elli=
III. Data
In Chapter III, we describe the data we used and how we collected it. We begin
by defining the type of data and the Marine Corps units represented in this data. Then,
we describe the sources we used to compile the personnel and equipment data. Finally,
we conclude with cost data associated with outsourcing and personnel.
A. Background Information
1. Types of Data
The data we collected and analyzed for this study are a combination of personnel
manning documents, equipment authorizations, and cost reports associated with
various contracts. Because of the enormous amount of data available, we were able to
perform a thorough analysis of the costs associated with outsourcing ICCE, which
allowed us to capture overall contract performance for future unit equipment
outsourcing. The sources of these data varied depending on the type of information and
time frame the data covered. A large part of these data were retrieved from Marine
Corps and Navy databases, with a small part retrieved from external sources. In order
to analyze adequately the effectiveness of outsourcing individual equipment and to
make recommendations regarding future unit equipment outsourcing, we collected data
ranging from early 1991 to 2010.
B. Units Analyzed
Three separate units within the I Marine Expeditionary Force (I MEF) were used
as case studies to analyze and compare changes over a 10-year period corresponding
to the length of the CIF contract. These units were Marine Wing Support Squadron
(MWSS) 372, Marine Aircraft Group (MAG) 39, and Infantry Battalion (Bn) 1/1. We
specifically chose these three particular units for a number of reasons. First, they
represent the three major tactical elements of the Marine Corps with regard to aviation,
ground, and service support. This was vital to ensuring an accurate representation of
the Marine Corps’ operating forces as a whole. Second, all three units are located on
==^Åèìáëáíáçå=oÉëÉ~êÅÜ=mêçÖê~ã=do^ar^qb=p`elli=lc=_rpfkbpp=C=mr_if`=mlif`v= = - 36 - k^s^i=mlpqdo^ar^qb=p`elli=
Marine Corps Base Camp Pendleton, which provided for a common support structure,
operating and deployment environment, and ICEE outsourcing background. All three of
these units draw their ICCE from the same CIF. This allowed us to derive our data
analysis from commonalities in shared databases, location, and functionality, as well as
from common practices with regard to asset accountability and unit checkout
procedures of individual gear. Finally, these units fell under I MEF, from which we had
retrieved all associated outsourcing costs for the CIF/IIF. This commonality was vital to
ensuring that the cost analysis matched the personnel and equipment analysis.
1. Avoiding Sample Bias
On the tactical level, the study examined the effects of policy on three units’ costs
at one base because all units share the same support structure and, as a result, made
the effects of policy easier to analyze. However, to prevent missing possible cost
changes because of the enterprise-wide implementation of the CIF, this thesis also
looked at the total cost of supply personnel end strength for the entire Marine Corps.
The total cost and supply personnel end strength allowed us to capture the effects of
the CIF program on the Marine Corps’ intermediate and strategic levels over the
historical period.
C. Sources of Data
The three major categories of data collection were personnel, equipment, and the
costs associated with the previous two. Under these categories, the sources of data
used were the Marine Corps, Navy, and external databases. Not every category used
all three sources for data, because some sources were more complete than others.

=^Åèìáëáíáçå=oÉëÉ~êÅÜ=mêçÖê~ã=do^ar^qb=p`elli=lc=_rpfkbpp=C=mr_if`=mlif`v - 37 - k^s^i=mlpqdo^ar^qb=p`elli=
1. Personnel
a. Table of Organizations (T/Os)
This thesis required both current and historical Marine Corps Table of
Organization (T/O) manning documents. These manning documents identify the
personnel structure of each unit within the Marine Corps and are used by the Marine
Corps’ manpower department in force shaping and billet assignments. We used
manning documents from 1991, 1993, 2005, and 2010. This particular timeline provided
a snapshot of T/Os for pre-outsourcing of ICCE management through CIF’s
implementation (1990 and 1993), post CIF implementation and operations (2005), and
pre-outsourcing of unit assets (soft-walled shelters and camouflage netting) for the UIF
(2010). We used the Total Force Structure Division (TFSD) and GlobalSecurity.org
databases to compile the T/O documents.
The TFSD was responsible for collecting, filtering, and disseminating a large
portion of this T/O data. This database could only support historical requests back to
2002 because information prior to this date had been purged from the databases.
Therefore, TFSD provided the 2005 and 2010 T/Os using the Total Force Structure
Management System (TFSMS), which allows ad hoc queries of data for any unit in the
Marine Corps. The queried data topics compiled from TFSMS were billet description,
grade, billeted MOS, and chargeable billets. The T/O data consisted of all chargeable
ground supply MOSs, including 3002: Ground Supply Officer, 3043: Ground Supply
Administration, and 3051: Ground Supply Warehousemen.
We collected 1991 and 1993 historical T/O data from GlobalSecurity.org. These
open-source manning documents provided a complete historical T/O document for each
type of unit. Although these T/O documents were not unit specific, the type of unit
structure is the same across the Marine Corps. For example, the T/O for MWSS-372 at
Camp Pendleton, California, matches the T/O for MWSS-272 at Marine Corps Air
Station (MCAS) in New River, North Carolina. In addition, changes to T/O are a zero-
sum game, where any change of personnel within a unit requires an off-setting change
in another unit of the same type.

==^Åèìáëáíáçå=oÉëÉ~êÅÜ=mêçÖê~ã=do^ar^qb=p`elli=lc=_rpfkbpp=C=mr_if`=mlif`v= = - 38 - k^s^i=mlpqdo^ar^qb=p`elli=
b. Authorized Strength Reports (ASRs)
To analyze how the end strength of the Marine Corps’ supply personnel has
changed from 1999 (pre CIF) to 2010 (post CIF) we looked at the TFSD’s Authorized
Strength Reports (ASRs) for 1999–2002, and 2010. Similar to the T/Os, the ASRs from
these years allowed us to analyze the preCIF and post-CIF supply personnel structure.
The ASR is a summary of the billets the Marine Corps bought in any particular year.
The Marine Corps then staffs units’ T/Os based on the billets bought through the ASR
process and the unit’s priority. Units designated as excepted are staffed at 100% of their
T/O, while priority units are staffed at 95% of their T/O, unless assignable personnel
inventory is available. In that case, they are staffed at 100%. Finally, proportionate
shares, or pro-share units, are staffed with whatever personnel are available (Marine
Corps, 2010b). Whereas the T/O is the theoretical ideal strength for a unit, the ASR is
actually what the Marine Corps purchased for that unit’s staffing. This information
allowed us to compare the different layers of ideal staffing and actual staffing. These
ASRs not only showed us the Marine Corps-wide supply personnel staffing, but also the
tactical units we examined. This allowed us to conduct an extremely in-depth analysis
and provided us with the ability to cross reference any changes.
2. Equipment
We compiled asset and table-of-equipment (T/E) data for all CIFs and the three
units mentioned previously. T/E data is a formal listing of the Marine Corps’ required
Type I Table of Authorized Material Control Numbers (TAMCN), which are assigned to
every asset for every unit. While the Marine Corps identifies different types of materials
and assets, only Type I assets are identified as unit requirements by the Marine Corps.
This equipment data was provided by two specific sources: TFSD and the CIF website
(www.usmccif.com).
TFSD provided current 2010 T/E data for all three units. Much like the T/Os, T/Es
are standardized for similar type units. For example, a T/E for one fixed-wing MAG will

==^Åèìáëáíáçå=oÉëÉ~êÅÜ=mêçÖê~ã=do^ar^qb=p`elli=lc=_rpfkbpp=C=mr_if`=mlif`v= = - 39 - k^s^i=mlpqdo^ar^qb=p`elli=
be the same for another fixed-wing MAG. The CIF website provided a complete
inventory listing of all TAMCNs and the quantities that are controlled and managed by
each MEF and Training Command under the CIF. One distinction must be noted: While
the T/E data defines gear requirements for units, it does not define requirements for the
CIFs. The CIF’s asset requirements, such as quantities, stocking levels, and fill rates,
are defined by each individual MEF and managed by a contract representative.
Using the T/E and CIF data, we analyzed the pre- and post-CIF implementation
effects on organic supply accounts with regard to asset management and personnel
efficiency, which will be covered in depth in Chapter IV. With both data sets, we focused
on the outsourced TAMCNs to the CIF and on the planned outsourcing of TAMCNs
associated with soft-walled shelters and camouflage netting.
3. Costs
a. Outsourcing
We used both open-source contract information and data gathered from the I
MEF comptroller’s office to gain a better perspective on the costs of outsourcing ICCE
under the CIF contract. These sources provided cost data from the beginning of 2000–
2010. The data consisted of contracting, procurement, and fielding costs associated
with outsourcing ICCE to the CIF. The data encompassed 2001 contracted budgeted
costs and documented actual costs over the length of the contract up to 2010. The two
primary data sources used for CIF contract cost information were the Electronic
Document Access (EDA) system and the Federal Procurement Data System–Next
Generation (FPDS–NG).
a. Electronic Data Access
We gained access to the EDA system in order to query all contract information
for the CIF program. The EDA is defined as follows:

==^Åèìáëáíáçå=oÉëÉ~êÅÜ=mêçÖê~ã=do^ar^qb=p`elli=lc=_rpfkbpp=C=mr_if`=mlif`v= = - 40 - k^s^i=mlpqdo^ar^qb=p`elli=
The Electronic Document Access (EDA) program is one of the Business Transformation Agency (BTA) Sourcing Environment programs. EDA supports the goals of the BTA to simplify and standardize the methods that DoD uses to interact with commercial and government suppliers in the acquisition of catalog, stock, as well as made-to-order and engineer-to-order goods and services initiatives to increase the application of Electronic Business/Electronic Commerce (EB/EC) across the Department of Defense (DoD). The EDA is a web-based system that provides secure online access, storage, and retrieval of contracts, contract modifications, Government Bills of Lading (GBLs), DFAS Transactions for Others (E110), vouchers, and Contract Deficiency Reports to authorized users throughout the DoD. (Electronic Document Access–Next Generation [EDA–NG], 2011)
This system provided a conclusive list of all original and modified contract
information for the CIF contract, including statements of work, authorized wage rates,
budgeted costs, and phase-in plans from 2001–2010. We focused primarily on total
budgeted costs of the CIF contract. While the EDA system provided all budgeted costs,
we needed to use the FPDS–NG system to capture all actual costs.
b. Federal Procurement Data System–Next Generation
The FPDS–NG is a federally mandated system that requires all government
agencies to report cost data on federal procurements. This system captures actual cost
data of all “contracts whose estimated value is $3,000 or more or that may be $3,000 or
more” (FPDS–NG, 2011). In addition, every modification to those contracts, regardless
of dollar value, must also be reported to the FPDS–NG. The reported cost data is used
to
measure and assess the impact of federal procurement on the nation’s economy, learn how awards are made to businesses in various socioeconomic categories, understand the impact of full and open competition on the acquisition process, and to address changes to procurement policy. (FPDS–NG, 2011)
The FPDS–NG provided us with a complete list of all actual obligated costs
incurred on the CIF contract from 2001–2010. While the EDA provided a foundation of
detailed contract and budgeting information, the FPDS–NG provided summary-level

==^Åèìáëáíáçå=oÉëÉ~êÅÜ=mêçÖê~ã=do^ar^qb=p`elli=lc=_rpfkbpp=C=mr_if`=mlif`v= = - 41 - k^s^i=mlpqdo^ar^qb=p`elli=
information of actual obligated costs categorized by CIF location, date obligated and
fiscal year, and contract/funding office. This information allowed us to contrast budgeted
costs to actual obligated costs, ultimately painting a complete financial picture of CIF
program costs.
b. Personnel
The Naval Center for Cost Analysis (NCCA) operates the Visibility and
Management of Operating and Support Costs (VAMOSC) database. This management
information system collects and reports U.S. Navy and U.S. Marine Corps historical
weapon system operating and support (O&S) costs. Our focus for extrapolating data
was on Marine Corps-wide supply personnel O&S costs. We accessed current and
historical cost data associated with all ground supply personnel across the Marine
Corps. Due to this system’s ease of use, we were able to manipulate it to create queries
that could be further broken down to capture costs of individually billeted Marines per
unit, per year. We could then marry costs with actual manning levels for each of the
three units, data that could then be compared to the T/Os for staffing levels. The ability
to see all Marine Corps personnel costs incurred since 2002 allowed us to create a
detailed analysis.
D. Methodology of Analysis
1. Overview
With the data mentioned earlier, we used four methods of analysis to determine
the effects on the Marine Corps of privatizing ICCE management. In analyzing and
modeling this information for the CIF, we conducted an analysis to determine if the CIF
cost model should be used to further outsource unit equipment. The cost comparison,
efficiency, and model methods are as follows:
Compare organic supply unit structures and personnel efficiency rates from a pre-CIF outsourced posture to a post-CIF outsourced posture based on historical and current T/O and T/E data.

==^Åèìáëáíáçå=oÉëÉ~êÅÜ=mêçÖê~ã=do^ar^qb=p`elli=lc=_rpfkbpp=C=mr_if`=mlif`v= = - 42 - k^s^i=mlpqdo^ar^qb=p`elli=
Compare contracted/budgeted CIF program costs to actual program costs.
Compare cost savings in reducing supply personnel by 40% to the cost-savings regret of maintaining a pre-outsourced personnel structure.
Evaluate the CIF program’s impacts on the Marine Corps from 2001–2010 and create a model to evaluate net present value (NPV) and opportunity cost.
Create an IIF/UIF NPV and opportunity cost model to forecast costs of the CIF program by adding soft-walled shelters and camouflage netting (SWS&CN).
Each of these methods is designed to capture costs associated with outsourcing
individual gear to the CIF. All cost comparisons identified in this section are analyzed
using CIF program cost data. Analysis of personnel costs is, therefore, compared and
contrasted as a cost component of outsourcing the CIF and is never analyzed as a
single cost factor. To capture the major cost driver of outsourcing the CIF, we focused
on all costs associated with the entire CIF program and all costs the Marine Corps paid
for supply personnel. We assumed that all gear costs associated with the CIF program
were sunk costs and would have been realized by the Marine Corps regardless of
whether or not the individual gear had been outsourced. Therefore, the analysis focused
on a cost comparison between maintaining pre-outsourced supply-structure personnel
levels and reducing supply personnel up to 40%. In addition, the analysis focused on
cost comparisons between budgeted and actual program costs in order to model cost
behavior for future outsourcing of unit gear.
a. Pre-Privatized Supply Unit Structures vs. Post-Privatized
Supply Unit Structures
Comparing pre- and post-outsourcing supply unit structures and then analyzing
the comparison data is the easiest method to determine whether or not supply
personnel numbers changed at the using unit level after CIF outsourcing. The supply
unit structure consists of both T/O and T/E numbers that can be analyzed to show
changes and to define the efficiency metric as a ratio of personnel to assets. This

==^Åèìáëáíáçå=oÉëÉ~êÅÜ=mêçÖê~ã=do^ar^qb=p`elli=lc=_rpfkbpp=C=mr_if`=mlif`v= = - 43 - k^s^i=mlpqdo^ar^qb=p`elli=
analysis focused on the three units mentioned in the data section: MAG-39, MWSS-372,
and Bn1/1. We compared changes over the length of the CIF contract. This
methodology provided a clear basis for a Marine Corps-wide comparison between
personnel and asset numbers at the unit level because T/Os and T/Es are standardized
among all similar units.
We compared T/O and T/E numbers from 2001–2010 and identified changes in
both. This simple analysis showed whether or not there were any changes in personnel
to these units, as well as the impact outsourcing had on the number of assets managed.
A ratio of assets to personnel was then used to identify the number of assets managed
per Marine from 2001–2010. This ratio defined the efficiency metric for organic unit
supply personnel and showed the magnitude of changes to personnel and assets. Table
1 summarizes the T/O and T/E numbers to be compared and analyzed.
Table 1. Pre- and Post-CIF T/O and T/E Numbers
Pre CIF: 2000 Post CIF: 2010
T/O T/E T/O T/E MAG 27 6833 MAG 27 1590 MWSS 13 39968 MWSS 15 16140 BN 11 62020 BN 11 16455
The numbers presented in Table 1 include T/O, the number of supply personnel
required at each unit’s organic supply account/division, and T/E, the total number of
Type 1 assets each account is required to manage. The T/E numbers in Table 1 do not
take into account any Type 2 or Type 3 unit-specific assets, which may or may not be
managed by a specific unit. These assets were intentionally disregarded for the
purposes of the analysis so that unit categories could be compared on the basis of
individual gear. In addition, the inclusion of these numbers would not add value to the
analysis. The methods we used to analyze costs associated with the T/O numbers are
discussed in Section C.

==^Åèìáëáíáçå=oÉëÉ~êÅÜ=mêçÖê~ã=do^ar^qb=p`elli=lc=_rpfkbpp=C=mr_if`=mlif`v= = - 44 - k^s^i=mlpqdo^ar^qb=p`elli=
b. Budgeted/Contracted CIF Program Costs vs. Actual CIF
Program Costs
We compared budgeted/contracted CIF program costs with actual CIF program
costs by incorporating inflation factors to compare program cost growth against the rise
in inflation. This method of analysis compared the actual program costs after the
completion of the initial contract period to the cost that should have been attained under
the original contract. This analysis captured any cost growth associated with the
performance of the contract and provided a direct link to the CIF model, which we
discuss in the CIF cost model section of this thesis. For this comparison, fiscal year
2001 is the base year of budgeted costs.
We used two methods to validate the total costs that were actually spent over the
program’s 10-year period. First, we retrieved all of the contract modifications from
2001–2010. We pulled these documents from the EDA portal under the base contract
number M67004-01-D-0003. We identified each CIF location or cost center from its own
unique four-digit code at the end of the base contract number. For example, Camp
Pendleton was listed as M67004-01-D-003/0002.
Next, we examined the final contract modification for each site. Any time a
modification was made to the contract, it was given a new number. The first modification
to the M67004-01-D-003/0002 was, logically, given the number 1. For Camp Pendleton
alone, 69 contract modifications were made between 2001 and 2010. The final contract
modification for each site contained a summary of all previous modifications. This
allowed us to accurately estimate real costs for each IIF location, Program Management
Office, and special project for each year of the contract. Over the course of the contract,
the Marine Corps obligated $332,858,744.
After we had broken down all those costs, we verified actual payments to the
contractor through the Federal Procurement Data System–Next Generation (FPDS–NG)
web portal. This website, run by the federal government, allows anyone to view

==^Åèìáëáíáçå=oÉëÉ~êÅÜ=mêçÖê~ã=do^ar^qb=p`elli=lc=_rpfkbpp=C=mr_if`=mlif`v= = - 45 - k^s^i=mlpqdo^ar^qb=p`elli=
“contracts whose estimated value is $3,000 or more or that may be $3,000 or more.
Every modification to that contract, regardless of dollar value must be reported to
FPDS–NG” (FPDS–NG, 2011). This information allowed us to verify that the amounts
stated on the contract had been paid out as intended.
c. Cost Savings in Reducing Supply Personnel up to 40% vs.
Regret by Maintaining a Pre-Outsourced Personnel Structure
The first step in this analysis was determining the total costs of supply personnel
from 2001–2010. All Marine Corps supply personnel costs were taken from the
VAMOSC web portal and database. The data only went back to 2002. All data were
pulled in fiscal year (FY) 2010 dollars, so that each year's costs would be directly
comparable to each other. When needed, costs were inflated or deflated using the
appropriate Marine Corps Manpower inflation index. This database allowed for all costs
associated with employing Marine personnel to be analyzed. The costs do not include
only salary, but all basic allowance housing (BAH), dependent pay, healthcare,
bonuses, and pensions. Since the cost of employing an individual is much more than
just salary, we felt it was important to include every salary-related cost the Marine Corps
incurred from 2002–2010 in employing supply Marines. The data from VAMOSC was
then broken down to the individual unit level to identify all MWSS-372, BN 1/1, and
MAG-39 personnel costs from 2002–2010. Table 2 shows the Marine Corps-wide costs
associated with all supply billets with a 30XX MOS designation code. All costs are in FY
2010 dollars.
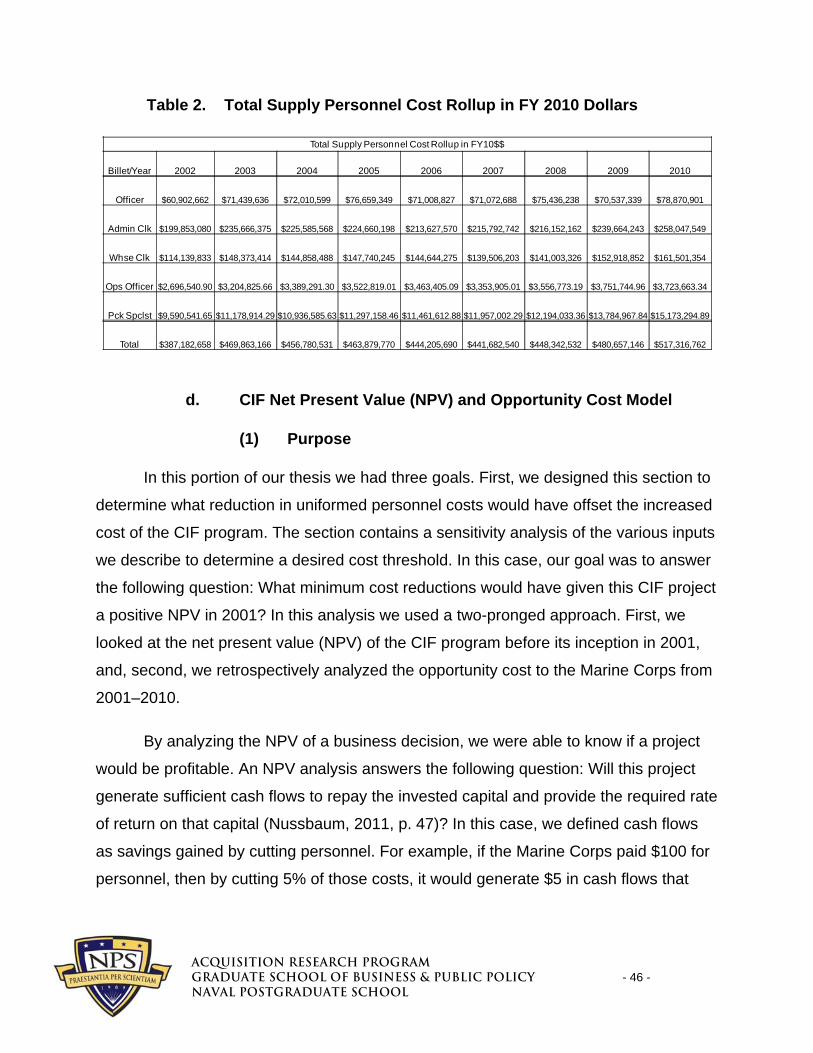
=^Åèìáëáíáçå=oÉëÉ~êÅÜ=mêçÖê~ã=do^ar^qb=p`elli=lc=_rpfkbpp=C=mr_if`=mlif`v - 46 - k^s^i=mlpqdo^ar^qb=p`elli=
Table 2. Total Supply Personnel Cost Rollup in FY 2010 Dollars
Total Supply Personnel Cost Rollup in FY10$$
Billet/Year 2002 2003 2004 2005 2006 2007 2008 2009 2010
Officer $60,902,662 $71,439,636 $72,010,599 $76,659,349 $71,008,827 $71,072,688 $75,436,238 $70,537,339 $78,870,901
Admin Clk $199,853,080 $235,666,375 $225,585,568 $224,660,198 $213,627,570 $215,792,742 $216,152,162 $239,664,243 $258,047,549
Whse Clk $114,139,833 $148,373,414 $144,858,488 $147,740,245 $144,644,275 $139,506,203 $141,003,326 $152,918,852 $161,501,354
Ops Officer $2,696,540.90 $3,204,825.66 $3,389,291.30 $3,522,819.01 $3,463,405.09 $3,353,905.01 $3,556,773.19 $3,751,744.96 $3,723,663.34
Pck Spclst $9,590,541.65 $11,178,914.29 $10,936,585.63 $11,297,158.46 $11,461,612.88 $11,957,002.29 $12,194,033.36 $13,784,967.84 $15,173,294.89
Total $387,182,658 $469,863,166 $456,780,531 $463,879,770 $444,205,690 $441,682,540 $448,342,532 $480,657,146 $517,316,762
d. CIF Net Present Value (NPV) and Opportunity Cost Model
(1) Purpose
In this portion of our thesis we had three goals. First, we designed this section to
determine what reduction in uniformed personnel costs would have offset the increased
cost of the CIF program. The section contains a sensitivity analysis of the various inputs
we describe to determine a desired cost threshold. In this case, our goal was to answer
the following question: What minimum cost reductions would have given this CIF project
a positive NPV in 2001? In this analysis we used a two-pronged approach. First, we
looked at the net present value (NPV) of the CIF program before its inception in 2001,
and, second, we retrospectively analyzed the opportunity cost to the Marine Corps from
2001–2010.
By analyzing the NPV of a business decision, we were able to know if a project
would be profitable. An NPV analysis answers the following question: Will this project
generate sufficient cash flows to repay the invested capital and provide the required rate
of return on that capital (Nussbaum, 2011, p. 47)? In this case, we defined cash flows
as savings gained by cutting personnel. For example, if the Marine Corps paid $100 for
personnel, then by cutting 5% of those costs, it would generate $5 in cash flows that

==^Åèìáëáíáçå=oÉëÉ~êÅÜ=mêçÖê~ã=do^ar^qb=p`elli=lc=_rpfkbpp=C=mr_if`=mlif`v= = - 47 - k^s^i=mlpqdo^ar^qb=p`elli=
could be invested elsewhere. In basic financial terms, a project with an NPV greater
than 1 should be undertaken and a project with an NPV less than 1 should not.
Another term that requires a definition is opportunity cost. Opportunity cost is an
accounting term that describes money that could have been utilized, but was not
because an alternative action was taken. It is the cost of an alternative that must be
forgone in order to pursue a different action. Put another way, it is the benefits you
could have received by taking an alternative action (“Opportunity Cost,” 2011). For
example, people decide to attend college and earn a bachelor’s degree, which means
spending money rather than working and getting paid for a few years, because they
hope that the investment in education will pay more in the long run. In this case, the
opportunity cost is the money forgone from not working during the four years in college.
Opportunity cost is also called regret because if its benefits are not gained or
maximized, the chosen action becomes a regret because a gain was missed. In this
case, the regret the Marine Corps faced was the money it could have saved and
reinvested in equipment, if it had not paid, instead, for excess supply personnel.
To meet the second goal, we utilized our decision model. This model is designed
to value the NPV of the program at inception and is conducted from the viewpoint of the
decision-maker in 2000. Using it, we analyzed estimated costs and savings over the life
cycle, generated by the CIF program at the nominal interest rate from the first year of
the program.
To meet our final aim, we used our Regret Model to value the regret (gain
foregone) in 2010 associated with not reassigning or cutting supply Marines over the
previous 10 years. The differences in these two approaches clearly contrast planned
savings from realized savings or costs and the tremendous opportunity cost of inaction.
In designing all the models, we made several assumptions. First, we assumed a
rolling implementation of personnel cuts and reassignment due to the difficulty in
changing the Marine Corps’ manpower structure. We assumed the implementation
==^Åèìáëáíáçå=oÉëÉ~êÅÜ=mêçÖê~ã=do^ar^qb=p`elli=lc=_rpfkbpp=C=mr_if`=mlif`v= = - 48 - k^s^i=mlpqdo^ar^qb=p`elli=
would begin at 0% in 2001 and would increase incrementally until a 40% savings was
achieved, a savings rate the CIF vendor claimed was possible. Second, a discount rate
was associated with valuing the NPV of the program’s first year, 2001.
This model does not address cost savings from improved management practices
or modernization. There are a few reasons for this. First, efficiency is a value, not a
measurable cost. Merriam–Webster’s Online Dictionary defines efficient as “productive
of desired effects, especially; productive without waste” (“Efficient,” 2011). It is a quality
that is difficult to estimate with exact numbers. While standardizing processes and
procedures reduces cost, there is no hard and fast number that can be achieved
through such practices. Second, every outsourcing situation is different and there are no
numbers, or even ranges of estimates published on the topic, which forecast efficiency
savings in terms of dollars. The degree to which efficiencies translate to cost savings
depends on a host of immeasurable factors. For example, the quality of employees in a
company would determine how much operational cost was saved by one company over
another. A company with 20 years of experience would theoretically produce greater
cost savings than a company with two years of experience. However, a company with
two years of experience could own a proprietary computer program that gives them a
competitive advantage in the market. For the purposes of our model, we have no metric
to capture the myriad variables included in measuring efficiency-to-cost savings.
Finally, as the 2007 OMB report on competitive sourcing states,
Efficiencies, especially in the larger and more successful competitions, are achieved in a number of ways—not simply through workforce realignments and reductions in labor costs. Competition has brought about improved performance standards, the adoption of new technologies, the consolidation of operations and other process reengineering, and lower contract support costs. (OMB, 2008, p. 13)
Regardless of the difficulty in quantifying the efficiency-related cost savings, the
majority of costs saved through outsourcing initiatives are achieved through the
elimination of personnel costs because they are the easiest savings to forecast.
==^Åèìáëáíáçå=oÉëÉ~êÅÜ=mêçÖê~ã=do^ar^qb=p`elli=lc=_rpfkbpp=C=mr_if`=mlif`v= = - 49 - k^s^i=mlpqdo^ar^qb=p`elli=
Because of the difficulty of estimating even a range of potential cost savings from
operating more efficiently, we left this variable out of our analysis.
(2) Modeling Programs
We utilized Microsoft Excel and Crystal Ball to build the model. While Excel is a
widely used and understood program, Crystal Ball is not as common. According to
Oracle Corporation (2011), the maker of Crystal Ball, this program is a
spreadsheet-based application suite for predictive modeling, forecasting, simulation, and optimization. It gives you unparalleled insight into the critical factors affecting risk. With Crystal Ball, you can make the right tactical decisions to reach your objectives and gain a competitive edge under even the most uncertain market conditions.
Crystal Ball allowed us to forecast financial impacts based on historical cost data,
assumptions, and the uncertainty involved in input metrics. The program allowed us to
predict a range of outcomes based on the number of trials we needed to reach our
desired confidence interval. We chose to run the simulation 10,000 times, and Crystal
Ball built a distribution of outcomes based on those 10,000 trials.
(3) Model Variables
This section discusses the variables that are included in our Regret, Decision,
and Break Even Sensitivity Analysis Models
(a) Variables Common to All Models
Supply Manpower Costs: These costs were taken from the Naval Visibility and
Management of Operating and Support Costs (VAMOSC) database for all Marine Corps
supply personnel from 2001–2010.
(b) Decision Model Variables
CIF Program Costs: These costs were extracted for each year from the actual awarded contract.

==^Åèìáëáíáçå=oÉëÉ~êÅÜ=mêçÖê~ã=do^ar^qb=p`elli=lc=_rpfkbpp=C=mr_if`=mlif`v= = - 50 - k^s^i=mlpqdo^ar^qb=p`elli=
Expected Manpower Savings Percent: This percentage was based on the assumption of a rolling implementation schedule from 2001–2010. We assumed that the percentage would increase incrementally to 40%.
Manpower Savings: This is determined by multiplying the expected manpower savings percent by the budget year manpower costs. These costs are in budget year dollars.
NPV Lognormal Interest Rate (IR): This is the value calculated by Excel using cash flows generated from savings by subtracting CIF program costs from reduced manpower costs at the published discount rate. It uses a log normally distributed discount rate to show the effects of interest rate changes on the project’s NPV.
NPV Fixed IR: This number shows the value of the project’s NPV using a fixed interest rate.
Discount Rate: This is based on the Congressional Budget Office's published historical discount rates from 1979–2011.
(c) Regret Model Variables
CIF Program Costs: These costs were extracted for each year from the actual contract awarded.
Manpower Costs Percent: This is the same as the expected manpower savings percent. It is now a cost since the Marine Corps did not realize this as savings.
Manpower Costs: These costs are determined by multiplying supply personnel costs from 2001–2010 converted to FY 2010 constant dollars by the manpower cost percent.
Manpower Reallocation: This is an estimate of the percentage of Marines, who even though still in a Marine supply MOS, performed other jobs and training that created value for the Marine Corps. For example, a supply Marine receives training to become a machine gunner on an Iraq deployment. He is not in a supply MOS, but because of reduced workload on his unit, he is able to fill an additional role and provide additional value to the Marine Corps.
Overall Costs after Reallocation: This is the product of the manpower reallocation percentage and the manpower costs.

==^Åèìáëáíáçå=oÉëÉ~êÅÜ=mêçÖê~ã=do^ar^qb=p`elli=lc=_rpfkbpp=C=mr_if`=mlif`v= = - 51 - k^s^i=mlpqdo^ar^qb=p`elli=
Overall Regret after Reallocation: This is the difference between manpower costs and overall costs after reallocation.
(4) Modeling Choices
Crystal Ball and Excel were used to define assumptions and forecasts for the
following variables over 10,000 trials:
NPV Fixed IR. This forecast was defined to estimate the NPV using the fixed Interest Rate over 10,000 trials.
NPV Lognormal IR. This forecast takes into account the effects of a log normally distributed random variable for the interest rate on NPV over 10,000 trials.
Expected Manpower Savings Percent. A triangular distribution was used to define these assumptions’ random variables. We assumed that the percentage of personnel savings would conform to a rolling implementation and follow this schedule with the low, average, and high boundaries identified in Table 3.
Table 3. Rolling Implementation of Personnel Cost Reductions
2002 2003 2004 2005 2006 2007–2010
5% 15% 25% 30% 35% 40%
2.5%, 5%, 7.5% 10%, 15%, 20% 20%, 25%,30% 25%, 30%,35% 30%,35%,40% 35%,40%,42%
Manpower Reallocation Percent. A triangular distribution was used to define this assumption’s random variable. It was assumed the triangular distribution would have the low, average, and high percentage of personnel reallocations identified in Table 4.
Table 4. Manpower Reallocation Percent Based on a Triangle Distribution
15%
10%, 15%, 20%
Overall Costs due to Reallocation. This forecast was defined to estimate its confidence interval over 10,000 trials.

==^Åèìáëáíáçå=oÉëÉ~êÅÜ=mêçÖê~ã=do^ar^qb=p`elli=lc=_rpfkbpp=C=mr_if`=mlif`v= = - 52 - k^s^i=mlpqdo^ar^qb=p`elli=
Overall Regret after Reallocation. This forecast was defined to estimate its confidence interval over 10,000 trials.
Lognormal Discount Rate. This variable was modeled based on historical data of nominal interest rates from 1980–2000. This was done to interject the historical perspective that interest rates change over time. The interest rates used to calculate the NPV in 2000 will not be the same in 2001, and this change can impact the program’s value. The effects of interest rate changes can have dramatic impacts on the NPV. The data were fit using Crystal Ball, and they conformed to a Lognormal distribution. This lognormal discount rate was then entered directly into the decision model NPV forecast.
e. Future CIF/UIF Net Present Value and Opportunity Cost Model
To predict the potential impacts on the Marine Corps by continuing the CIF
program, we used the exact same model as we did to retrospectively examine the CIF
from 2001–2010. All the variables stayed the same. The only difference was the data
used for the input variables. First, we used 2010 supply personnel cost data, and
predicted those costs through 2020 based on published inflation rates.
To estimate future program costs of the CIF and UIF, we used the 2010 final
costs, and indexed those for inflation into 2012 dollars. We also added the estimated
costs from 2008 of including the SWS&CN in the program. A failed CSP contract
showed the yearly cost of managing SWS&CN to be approximately $980,000 in 2008
(Marine Corps Contract M67004-08-D-0018, 2008). We then used Marine Corps
operations and maintenance inflation data to convert that number into TY 2012 dollars.
The CIF and SWS&CN values were added together for 2012, and then indexed for
inflation growth until 2020. This methodology allowed us to compare the Marine Corps’
planned personnel costs with CIF costs.
We also used the current 2012 nominal interest rate of 3% for our calculations
and included a log normally distributed interest rate based on 1980–2011 data to add a
range of variability to the forecast. This model allowed us to evaluate the contract’s

==^Åèìáëáíáçå=oÉëÉ~êÅÜ=mêçÖê~ã=do^ar^qb=p`elli=lc=_rpfkbpp=C=mr_if`=mlif`v= = - 53 - k^s^i=mlpqdo^ar^qb=p`elli=
current NPV and to predict the contract’s future NPV to the Marine Corps, as well as to
predict potential regret from not making changes to the personnel structure.
E. Summary
In this chapter, we identified the sources and type of data we compiled. We also
discussed the Marine Corps units we used and provided insight into the reasons for
their selection. Finally, we concluded the chapter by identifying the personnel and
equipment costs associated with outsourcing. In the next chapter, we discuss the
methodology we used to analyze this data.

=^Åèìáëáíáçå=oÉëÉ~êÅÜ=mêçÖê~ã=do^ar^qb=p`elli=lc=_rpfkbpp=C=mr_if`=mlif`v - 54 - k^s^i=mlpqdo^ar^qb=p`elli=
THIS PAGE INTENTIONALLY LEFT BLANK

=^Åèìáëáíáçå=oÉëÉ~êÅÜ=mêçÖê~ã=do^ar^qb=p`elli=lc=_rpfkbpp=C=mr_if`=mlif`v - 55 - k^s^i=mlpqdo^ar^qb=p`elli=
IV. Analysis
A. Analysis of Costs of Outsourcing
1. Introduction
In Chapter IV, we discuss the results of the analysis we conducted using the
methods described in the previous chapter. We begin this chapter with a brief
discussion of the A-76 process as it pertains to the outsourcing of the CIF. We then
compare and analyze costs and efficiences in the manner described in the methodology
section. Finally, we conclude with a presentation of the results of the analysis.
2. A-76 Process
We begin our analysis with a description of how the A-76 process relates to CIF
outsourcing. A key finding is that we do not believe an A-76 study was completed before
the CIF program was implemented. We believe that the Marine Corps instead used the
selective sourcing process to restructure Marine Corps ICCE management. First, we
found that the contract included a Performance of Work Statement (PWS) and a Quality
Assurance Surveillance Plan (QASP), which are part of every A-76 competition.
However, the contracting database we examined does not show any evidence that an
A-76 study was performed. The scope of the CIF project, as defined in its Statement of
Work (SOW), is to “increase efficiency, reduce costs, and improve customer support”
(Marine Corps, 2003, p. 4). Because the CIF program focused on creating greater value
in business practices, it fits with the goals of the strategic sourcing initiatives.
3. Pre-Outsourcing Supply Unit Structures vs. Post-Outsourcing
Supply Unit Structures
The data in Table 1 make it very apparent that there were no decreases in
personnel from 2000–2010 and that the MWSSs increased from 13 supply personnel in
2000 to 15 supply personnel in 2010. Additionally, T/E assets decreased significantly
across all three units during this same time period. We attribute this decrease in assets

==^Åèìáëáíáçå=oÉëÉ~êÅÜ=mêçÖê~ã=do^ar^qb=p`elli=lc=_rpfkbpp=C=mr_if`=mlif`v= = - 56 - k^s^i=mlpqdo^ar^qb=p`elli=
to the outsourcing of all ICCE assets to the CIF. In the analysis that follows, we first
evaluate the T/E reduction that is reflected in Table 1.
Using the data from Table 1, we calculated the decrease in T/E assets for each
unit from 2000–2010, which is illustrated in Figure 1. This illustration only represents
T/E assets and does not take T/O personnel into account. The personnel numbers are
used in the efficiency analysis later.
Figure 1. T/E Quantities: Pre- and Post-CIF
The amount of assets managed by organic units was reduced drastically by
outsourcing ICCE assets to the CIF. The MAG’s, MWSS’s, and BN’s accounts
decreased by 76.7% (5,243 assets), 59.6% (23,828 assets), and 73.5% (45,565
assets), respectively, because of CIF outsourcing. Although Figure 1 shows T/E assets
only for 2000 and 2010, the percentage decrease from pre-CIF to post-CIF numbers
actually happened in 2001, the year the Marine Corps relinquished control of ICCE
assets to the CIF. This percentage decrease was maintained from 2001–2010. In order
to keep this analysis in perspective, we should clarify that these percentages represent
the total amount of individual gear outsourced to the CIF, and they do not take into
account the differences in size or dollar value of any T/E assets. This means that one
glove is counted in the same manner as one truck. Therefore, the percentages capture
only the overall quantity of T/E assets outsourced. This decrease in the amount of

==^Åèìáëáíáçå=oÉëÉ~êÅÜ=mêçÖê~ã=do^ar^qb=p`elli=lc=_rpfkbpp=C=mr_if`=mlif`v= = - 57 - k^s^i=mlpqdo^ar^qb=p`elli=
assets is in keeping with the Marine Corps’ intent to reduce the management burden on
supply sections. Our next question was how does this decrease in the overall quantity of
gear affect supply personnel’s efficiency when T/Os remain constant?
Asset management is performed by supply personnel assigned to organic using-
unit supply accounts. These personnel are divided into two separate sections: MOS
3043 (supply administration clerks) and MOS 3051(warehouse clerks). The
administration Marines are responsible for the daily record keeping of the supply
account, while the warehouse Marines are responsible for the daily operations of the
warehouse. The workload within these duties is directly tied to the number of assets
managed. This is the foundation of the efficiency metric as we have defined it.
For this thesis, we have defined supply personnel efficiency as the number of
assets divided by the number of supply Marines per unit. This simple ratio shows that if
100 items are managed by 10 supply Marines, the efficiency ratio is 10 items per
Marine. This does not take into account additional duties assigned to supply Marines,
either inside or outside their primary MOSs, because these duties would be assigned
regardless of how many assets a supply section manages. Therefore, we treated this as
a constant variable and did not include it in the analysis. However, in the summary to
this section, we address the effects that decreased workloads, caused by supply
accounts that maintained pre-CIF T/O manning levels, had on the secondary duties
assigned to supply personnel. Table 5 illustrates the ratio of T/E assets to T/O
personnel and identifies the number of assets managed per Marine in 2000 and 2010.
Table 5. Pre- and Post-CIF Ratio of T/E Assets to T/O Personnel
Pre CIF: 2000 Post CIF: 2010
T/O T/E Assets per
Marine Ratio T/O T/E Assets per Marine
Ratio
MAG 27 6833 253.1 MAG 27 1590 58.9
MWSS 13 39968 3074.5 MWSS 15 16140 1076.0
BN 11 62020 5638.2 BN 11 16455 1495.9
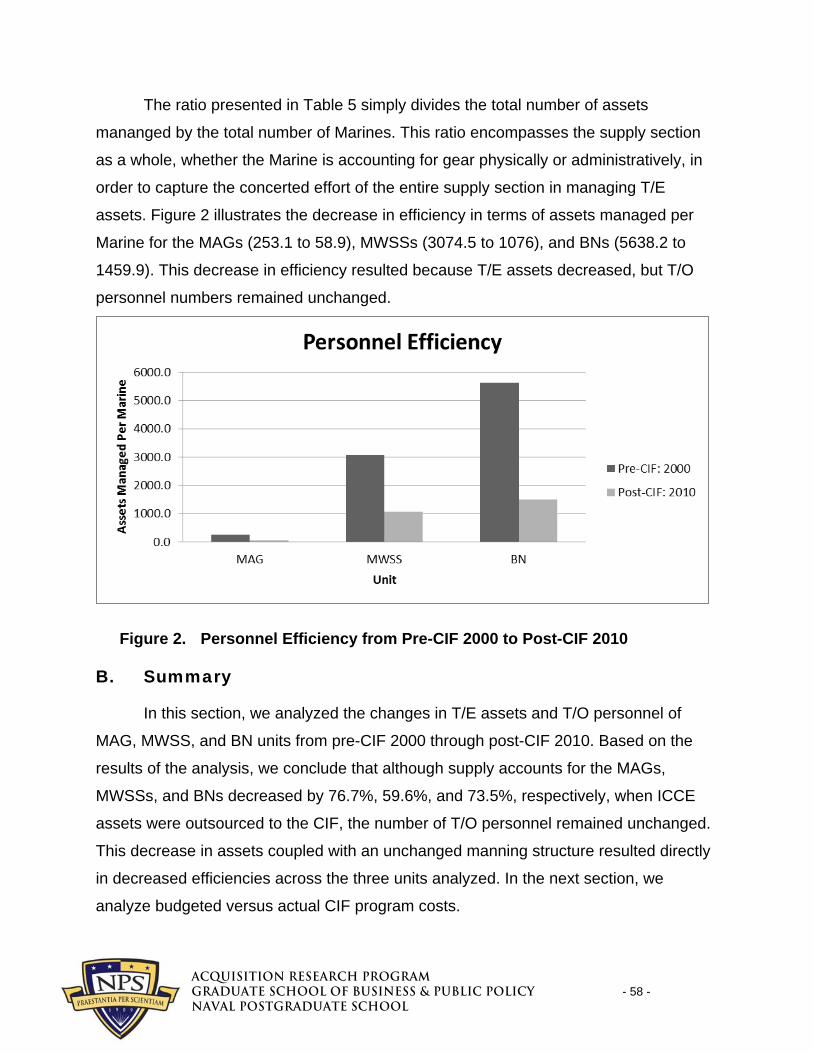
==^Åèìáëáíáçå=oÉëÉ~êÅÜ=mêçÖê~ã=do^ar^qb=p`elli=lc=_rpfkbpp=C=mr_if`=mlif`v= = - 58 - k^s^i=mlpqdo^ar^qb=p`elli=
The ratio presented in Table 5 simply divides the total number of assets
mananged by the total number of Marines. This ratio encompasses the supply section
as a whole, whether the Marine is accounting for gear physically or administratively, in
order to capture the concerted effort of the entire supply section in managing T/E
assets. Figure 2 illustrates the decrease in efficiency in terms of assets managed per
Marine for the MAGs (253.1 to 58.9), MWSSs (3074.5 to 1076), and BNs (5638.2 to
1459.9). This decrease in efficiency resulted because T/E assets decreased, but T/O
personnel numbers remained unchanged.
Figure 2. Personnel Efficiency from Pre-CIF 2000 to Post-CIF 2010
B. Summary
In this section, we analyzed the changes in T/E assets and T/O personnel of
MAG, MWSS, and BN units from pre-CIF 2000 through post-CIF 2010. Based on the
results of the analysis, we conclude that although supply accounts for the MAGs,
MWSSs, and BNs decreased by 76.7%, 59.6%, and 73.5%, respectively, when ICCE
assets were outsourced to the CIF, the number of T/O personnel remained unchanged.
This decrease in assets coupled with an unchanged manning structure resulted directly
in decreased efficiencies across the three units analyzed. In the next section, we
analyze budgeted versus actual CIF program costs.

==^Åèìáëáíáçå=oÉëÉ~êÅÜ=mêçÖê~ã=do^ar^qb=p`elli=lc=_rpfkbpp=C=mr_if`=mlif`v= = - 59 - k^s^i=mlpqdo^ar^qb=p`elli=
1. Marine Corps Supply Personnel End Strength and Costs
a. Supply Personnel End Strength
To analyze how the Marine Corps supply personnel end strength changed from
1999 (pre CIF) through 2010 (post CIF), we looked at Total Force Structure Division’s
(TFSD) Authorized Strength Reports (ASRs) for 1999–2002 and for 2010. Table 6 and
Figure 3 show all of the Marine Corps’ supply billets and their changes over time. They
do not include Marine Corps reserve billets. Only active duty billets are included. The
table and graph clearly show that between 1999 and 2010, all supply billets saw an
increase in their end strength. Administrative clerks and warehouse clerks saw the
biggest increase, as their end strength increased 23.16% and 20.67%, respectively.
More interesting, the Marine Corps-wide ratio between administrative clerks and
warehousemen remained relatively constant over time. Over the five years we
examined, there was consistently an average of 1.46 administrative clerks for every
warehouse clerk. This makes sense because if personnel in these two fields changed
within using units, the units would need to maintain the same employee ratios so they
could meet unit-level objectives. Finally, Table 6 shows the percentage growth of each
supply MOS over the 12-year period.
Table 6. Marine Corps Total Supply Personnel Authorized Strength Report (ASR) Rollup
MOS Billet Description 1999 2000 2001 2002 2010 % Chg from Base Year
3002 Supply Officer 462 462 475 475 468 1.30%
3010 Supply Operations Officer 33 34 34 34 37 12.12%
3043 Administrative Clerk 2927 2964 3048 3062 3605 23.16%
3051 Warehouseman 2013 2052 2076 2079 2429 20.67%
3052 Packaging Specialist 176 185 187 188 195 10.80%
5611 5697 5820 5838 6734 20.01%
1.454 1.444 1.468 1.473 1.484 2.07%3043/3051 Ratio
TOTAL
Marine Corps Total Supply Personnel Authorized Strength Report (ASR) Rollup
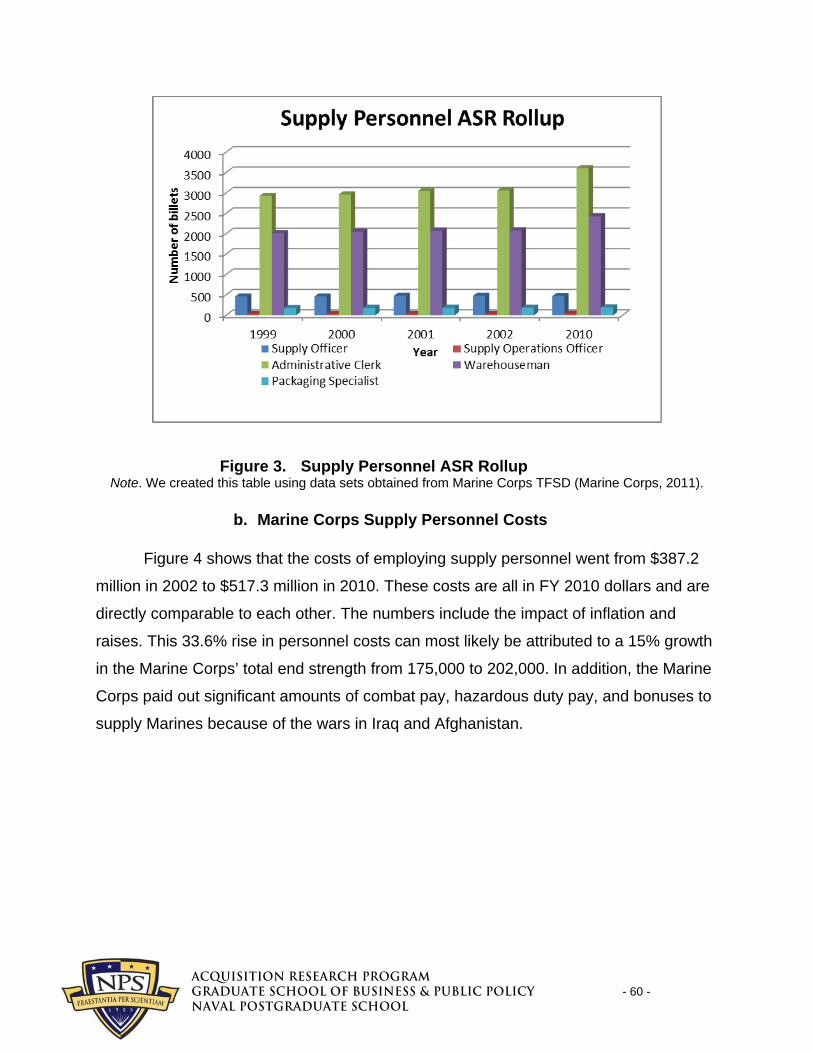
==^Åèìáëáíáçå=oÉëÉ~êÅÜ=mêçÖê~ã=do^ar^qb=p`elli=lc=_rpfkbpp=C=mr_if`=mlif`v= = - 60 - k^s^i=mlpqdo^ar^qb=p`elli=
Figure 3. Supply Personnel ASR Rollup Note. We created this table using data sets obtained from Marine Corps TFSD (Marine Corps, 2011).
b. Marine Corps Supply Personnel Costs
Figure 4 shows that the costs of employing supply personnel went from $387.2
million in 2002 to $517.3 million in 2010. These costs are all in FY 2010 dollars and are
directly comparable to each other. The numbers include the impact of inflation and
raises. This 33.6% rise in personnel costs can most likely be attributed to a 15% growth
in the Marine Corps’ total end strength from 175,000 to 202,000. In addition, the Marine
Corps paid out significant amounts of combat pay, hazardous duty pay, and bonuses to
supply Marines because of the wars in Iraq and Afghanistan.

==^Åèìáëáíáçå=oÉëÉ~êÅÜ=mêçÖê~ã=do^ar^qb=p`elli=lc=_rpfkbpp=C=mr_if`=mlif`v= = - 61 - k^s^i=mlpqdo^ar^qb=p`elli=
Figure 4. Total Supply Personnel Costs, 2002–2010 (Constant FY 2010 Dollars)
Note. We created this table using data sets obtained from VAMOSC (DoN, 2009).
2. Camp Pendleton Unit Comparison
We examined three tactical units—MWSS-372, Bn 1/1, and MAG-39—to
determine if they made supply capability changes at the tactical unit level. All three units
have organic supply capabilities and moved gear to the CIF facilities. These three units
are all stationed at Camp Pendleton and all utilize the same CIF facility.
a. Table of Organization and Costs
No T/O data exist for any units prior to 2002 within the Marine Corps databases.
However, GlobalSecurity.org still has every historical Marine Corps T/O on its website.
This website allowed us to search for T/Os changes that occurred before the CIF was
implemented; in 2005, several years after the program began; and in 2010, the year the
contract was up for renewal. Marine Corps Total Force Structure Division (TFSD)
provided us the 2005 and 2010 T/O's for the respective units. Personnel costs were
extracted from the VAMOSC database. All costs to employ personnel were factored into
the personnel costs in their respective tables.
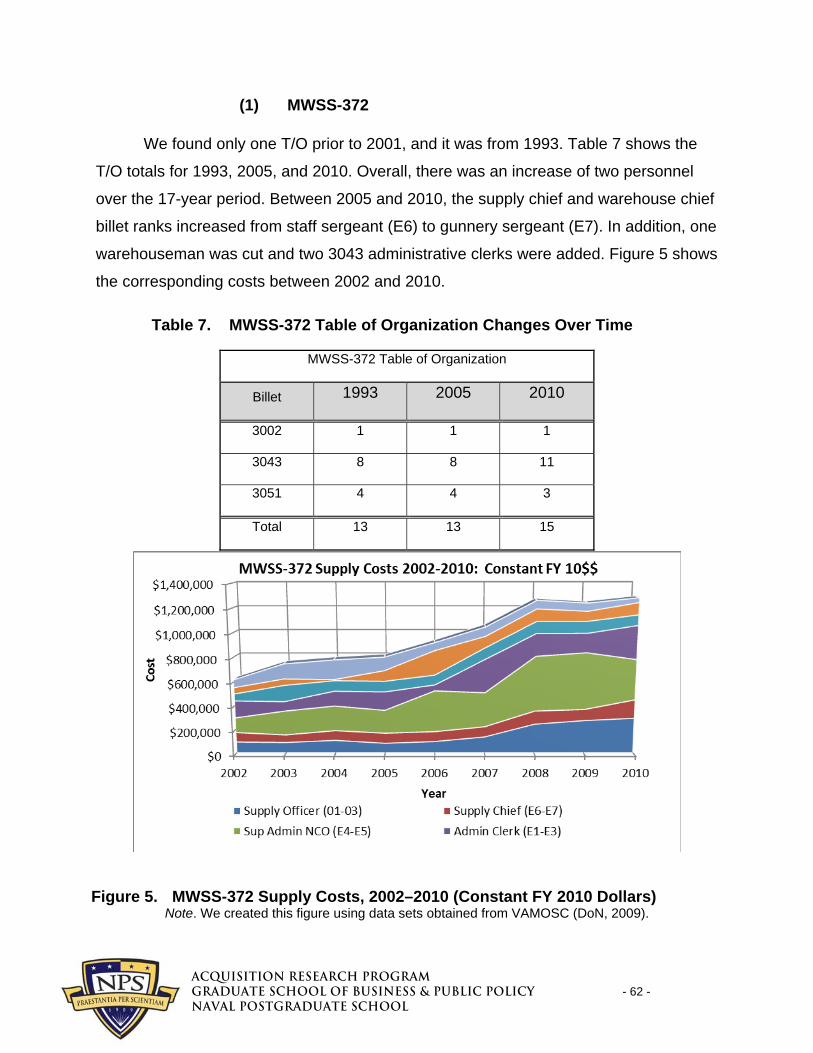
==^Åèìáëáíáçå=oÉëÉ~êÅÜ=mêçÖê~ã=do^ar^qb=p`elli=lc=_rpfkbpp=C=mr_if`=mlif`v= = - 62 - k^s^i=mlpqdo^ar^qb=p`elli=
(1) MWSS-372
We found only one T/O prior to 2001, and it was from 1993. Table 7 shows the
T/O totals for 1993, 2005, and 2010. Overall, there was an increase of two personnel
over the 17-year period. Between 2005 and 2010, the supply chief and warehouse chief
billet ranks increased from staff sergeant (E6) to gunnery sergeant (E7). In addition, one
warehouseman was cut and two 3043 administrative clerks were added. Figure 5 shows
the corresponding costs between 2002 and 2010.
Table 7. MWSS-372 Table of Organization Changes Over Time
MWSS-372 Table of Organization
Billet 1993 2005 2010
3002 1 1 1
3043 8 8 11
3051 4 4 3
Total 13 13 15
Figure 5. MWSS-372 Supply Costs, 2002–2010 (Constant FY 2010 Dollars) Note. We created this figure using data sets obtained from VAMOSC (DoN, 2009).

==^Åèìáëáíáçå=oÉëÉ~êÅÜ=mêçÖê~ã=do^ar^qb=p`elli=lc=_rpfkbpp=C=mr_if`=mlif`v= = - 63 - k^s^i=mlpqdo^ar^qb=p`elli=
(2) 1st Battalion, 1st Marine Division
Over the 20-year period we examined, there were no changes to Bn 1/1’s T/O or
ASR. We found only one T/O prior to 2001. It was from 1990 and available on
GlobalSecurity.org’s website. Bn 1/1’s organizational structure remained consistent
throughout this time frame on all the metrics we used. Its cost of operations increased
from $665,139 to $882,397 in 2010. Since all these costs are in FY 2010 dollars, this
change reflects a significant increase in the unit’s costs of operations. Increases in
deployment and combat pay, in addition to re-enlistment bonuses paid out to enlisted
personnel, could account for this change. Table 8 and Figure 6 show the results.
Table 8. 1/1’s T/O Changes Over Time
BN 1/1’s Table of Organization
Billet 1990 2005 2010
3002 1 1 1
3043 6 6 6
3051 4 4 4
Total 11 11 11
Note. We created this table using data obtained from Marine Corps TFSD (Marine Corps, 2011) and
Globalsecirity.org (2011).

==^Åèìáëáíáçå=oÉëÉ~êÅÜ=mêçÖê~ã=do^ar^qb=p`elli=lc=_rpfkbpp=C=mr_if`=mlif`v= = - 64 - k^s^i=mlpqdo^ar^qb=p`elli=
Figure 6. Bn 1/1’s Supply Personnel Costs, 2002–2010 (Constant FY 2010 Dollars)
Note. We created this table using data sets obtained from VAMOSC (DoN, 2009).
(3) MAG-39
The earliest T/O we found for MAG-39 was from 1990. No changes were made
to their T/O from 1990 through 2010. Their personnel costs for supply operations started
at $1.2 million in 2002 and were roughly the same in 2010. The spikes in their costs of
operations correspond to their deployment schedule. They were deployed to Iraq from
January–October 2003 (MAG-39 History, 2011), which coincides with the first spike in
their costs. Table 9 and Figure 7 show the results of our analysis of this unit.
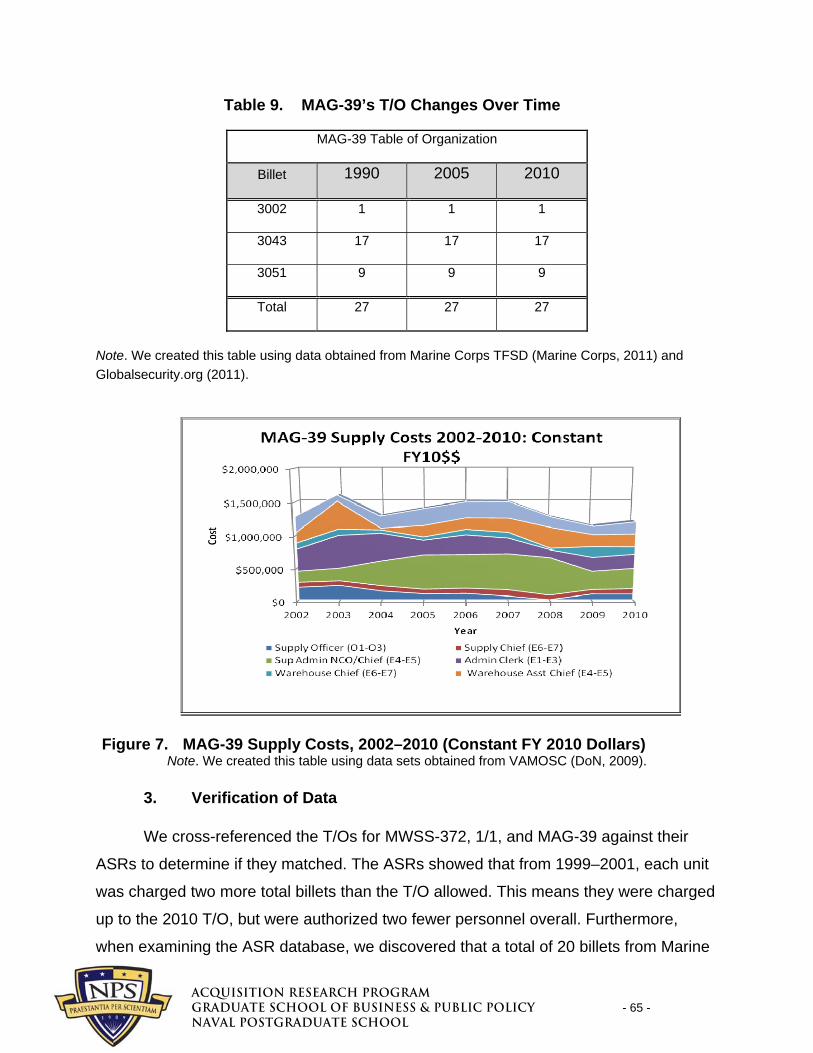
=^Åèìáëáíáçå=oÉëÉ~êÅÜ=mêçÖê~ã=do^ar^qb=p`elli=lc=_rpfkbpp=C=mr_if`=mlif`v - 65 - k^s^i=mlpqdo^ar^qb=p`elli=
Table 9. MAG-39’s T/O Changes Over Time
MAG-39 Table of Organization
Billet 1990 2005 2010
3002 1 1 1
3043 17 17 17
3051 9 9 9
Total 27 27 27
Note. We created this table using data obtained from Marine Corps TFSD (Marine Corps, 2011) and
Globalsecurity.org (2011).
Figure 7. MAG-39 Supply Costs, 2002–2010 (Constant FY 2010 Dollars) Note. We created this table using data sets obtained from VAMOSC (DoN, 2009).
3. Verification of Data
We cross-referenced the T/Os for MWSS-372, 1/1, and MAG-39 against their
ASRs to determine if they matched. The ASRs showed that from 1999–2001, each unit
was charged two more total billets than the T/O allowed. This means they were charged
up to the 2010 T/O, but were authorized two fewer personnel overall. Furthermore,
when examining the ASR database, we discovered that a total of 20 billets from Marine

==^Åèìáëáíáçå=oÉëÉ~êÅÜ=mêçÖê~ã=do^ar^qb=p`elli=lc=_rpfkbpp=C=mr_if`=mlif`v= = - 66 - k^s^i=mlpqdo^ar^qb=p`elli=
Corps Reserve MWSSs had been cut from the records. Table 10 highlights that the
Marine Corps bought a consistent amount of supply personnel from 1999–2010. This
coincides with the individual unit T/Os that showed few changes were made to those
manning structures. Finally, as Table 6 and Figure 3 show, the Marine Corps added
1,123 active-duty supply billets between 1999 and 2010, and costs increased
accordingly. In summary, by cross verifying the units’ T/Os and ASRs, we determined
that the number of supply personnel did not drop within the three units we analyzed.
Table 10. Using Unit ASR End-Strength Rollup
Using-Unit ASR End-Strength Rollup 1999 2000 2001 2002 2010
MWSS-372 15 15 15 15 15 MAG-39 29 29 29 29 28 BN 1/1 11 11 11 11 11
4. CIF Program Findings
a. Contract
The contractual data gathered from the CIF program for 2001–2010 gave us a
vast amount of data to analyze. The contract was originally issued at the end of 2001,
and was a one-year contract with nine additional option years (Marine Corps Contract
M67004-01-D-0003, 2001). This means the Marine Corps had the option to get out of
the contract if it did not feel the program was proceeding as planned or to renew the
contract for another year if program objectives were being met.
The contract was set up under several different reimbursement arrangements
based on the type of program cost. First, the program management and operations
costs (labor, facilities, equipment, and material) were set up as a firm-fixed price (FFP)
with an award fee. According to Federal Acquisition Regulations (FAR), subsection
16.202-1, an FFP contract is defined as follows:
A firm-fixed-price contract provides for a price that is not subject to any adjustment on the basis of the contractor’s cost experience in performing the

==^Åèìáëáíáçå=oÉëÉ~êÅÜ=mêçÖê~ã=do^ar^qb=p`elli=lc=_rpfkbpp=C=mr_if`=mlif`v= = - 67 - k^s^i=mlpqdo^ar^qb=p`elli=
contract. This contract type places upon the contractor maximum risk and full responsibility for all costs and resulting profit or loss. It provides maximum incentive for the contractor to control costs and perform effectively and imposes a minimum administrative burden upon the contracting parties. (FAR, 2005)
Under the operational aspect of the program, contractors are incentivized to keep
costs low and run the operations efficiently because they get to keep any money not
used for operations that year. However, the government is not liable for payment of any
cost overruns.
The award-fee aspect of the contract is used to give the contractor further
incentive to maintain high levels of performance in an environment where performance
measurement is difficult to quantify. According to the FAR, subpart 16.404,
Award-fee provisions may be used in fixed-price contracts when the Government wishes to motivate a contractor and other incentives cannot be used because contractor performance cannot be measured objectively. Such contracts shall establish a fixed price (including normal profit) for the effort. This price will be paid for satisfactory contract performance. Award-fee earned (if any) will be paid in addition to that fixed price. (FAR, 2005)
At the outset, the Marine Corps understood that the program’s performance
goals and objectives would be difficult to quantify. Nonetheless, the contractor was
given additional incentive to perform well in its contractual duties. If performance
objectives exist for this program, we could not find them for evaluation in this thesis.
A cost-reimbursement (CR) contract is used to repay the vendor for all costs of
purchasing ICCE for the Marine Corps. No burden, fee, or profits are allowed under this
reimbursement type. According to the FAR,
Cost-reimbursement types of contracts provide for payment of allowable incurred costs, to the extent prescribed in the contract. These contracts establish an estimate of total cost for the purpose of obligating funds and establishing a ceiling that the contractor may not exceed (except at its own risk) without the approval of the contracting officer. (FAR, 2005, 16.301-1)
When the contractor purchases $5 million in helmets, they submit the receipts to
the contracting officer representative who then authorizes repayment of the $5 million.

==^Åèìáëáíáçå=oÉëÉ~êÅÜ=mêçÖê~ã=do^ar^qb=p`elli=lc=_rpfkbpp=C=mr_if`=mlif`v= = - 68 - k^s^i=mlpqdo^ar^qb=p`elli=
This ensures the contractor is not purchasing fewer items than required to meet the
Marine Corps’ equipment requirements in order to save money. The Marine Corps
bears full fiscal responsibility for its equipment costs. In addition, the contractor is
required to procure ICCE through standard DoD channels. The contractor acts as a
purchasing unit in place of an organic Marine supply section.
The logistics material and installation (LMSI) costs for site set-up, modifications,
or upgrades are on a cost-plus-fixed-fee basis. This contract is used as follows:
A cost-plus-fixed-fee contract is a cost-reimbursement contract that provides for payment to the contractor of a negotiated fee that is fixed at the inception of the contract. The fixed fee does not vary with actual cost, but may be adjusted as a result of changes in the work to be performed under the contract. This contract type permits contracting for efforts that might otherwise present too great a risk to contractors, but it provides the contractor only a minimum incentive to control costs. (FAR, 2005, 16.306)
Under this form of contract, the Marine Corps essentially pays for the costs
associated with the contractor’s maintenance or upgrades to its facilities, but gives the
contractor room to exceed the contract amount if costs are more expensive than
expected. For example, a contractor estimated that setting up a warehouse would cost
$150,000. However, after work was completed, the total costs were $200,000. This
means the Marine Corps assumes the burden of cost overruns because at the
contract’s inception, accurate estimates were unavailable.
b. Implementation
The CIF project’s scope included a rolling implementation schedule. In the base
year of the contract, 2001, CIF sites were set up only at Camp Pendleton (CA), Camp
Lejeune (NC), and Camp Foster (Okinawa, Japan). As the program continued, more
sites and services were put into operation. Table 11 shows the 16 CIF locations in 2010
that issue ICCE and CBRN-D gear (Marine Corps, 2010a). STAP gear is processed
only at the Mountain Warfare Training Center (MWRC) and at the main CIF/IIF facilities
at Camp Pendleton, Camp Lejeune, and Camp Hansen.
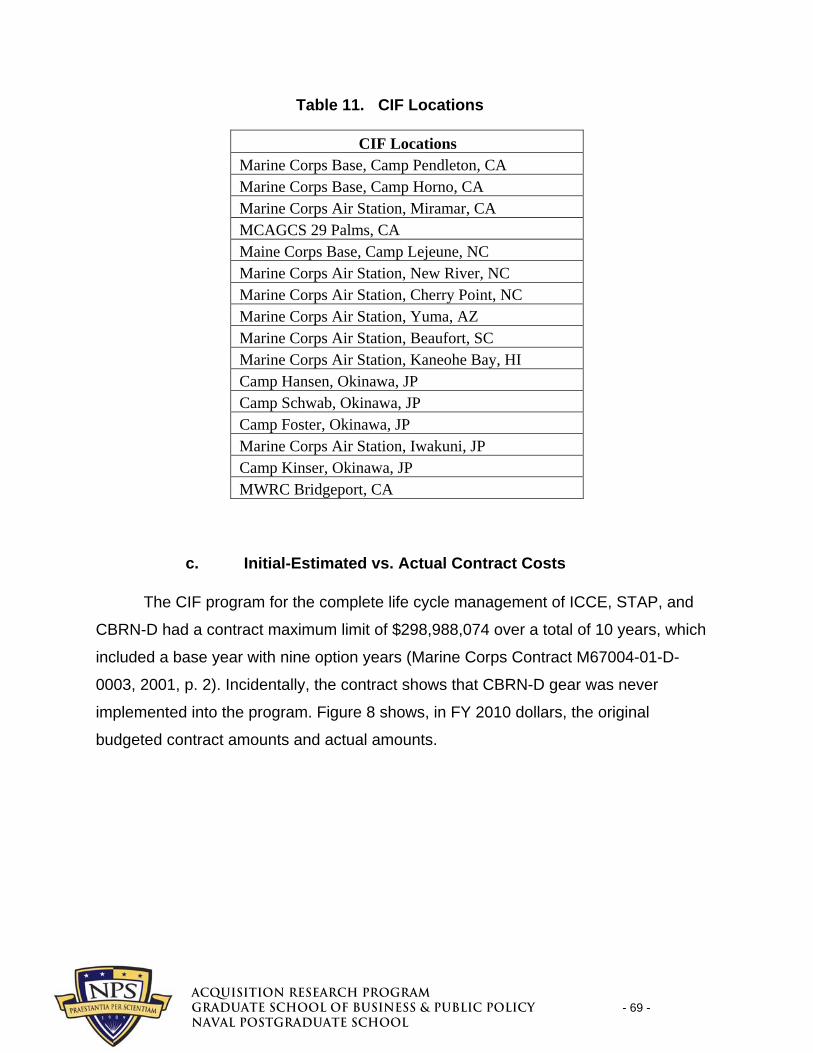
=^Åèìáëáíáçå=oÉëÉ~êÅÜ=mêçÖê~ã=do^ar^qb=p`elli=lc=_rpfkbpp=C=mr_if`=mlif`v - 69 - k^s^i=mlpqdo^ar^qb=p`elli=
Table 11. CIF Locations
CIF Locations Marine Corps Base, Camp Pendleton, CA Marine Corps Base, Camp Horno, CA Marine Corps Air Station, Miramar, CA MCAGCS 29 Palms, CA Maine Corps Base, Camp Lejeune, NC Marine Corps Air Station, New River, NC Marine Corps Air Station, Cherry Point, NC Marine Corps Air Station, Yuma, AZ Marine Corps Air Station, Beaufort, SC Marine Corps Air Station, Kaneohe Bay, HI Camp Hansen, Okinawa, JP Camp Schwab, Okinawa, JP Camp Foster, Okinawa, JP Marine Corps Air Station, Iwakuni, JP Camp Kinser, Okinawa, JP MWRC Bridgeport, CA
c. Initial-Estimated vs. Actual Contract Costs
The CIF program for the complete life cycle management of ICCE, STAP, and
CBRN-D had a contract maximum limit of $298,988,074 over a total of 10 years, which
included a base year with nine option years (Marine Corps Contract M67004-01-D-
0003, 2001, p. 2). Incidentally, the contract shows that CBRN-D gear was never
implemented into the program. Figure 8 shows, in FY 2010 dollars, the original
budgeted contract amounts and actual amounts.

==^Åèìáëáíáçå=oÉëÉ~êÅÜ=mêçÖê~ã=do^ar^qb=p`elli=lc=_rpfkbpp=C=mr_if`=mlif`v= = - 70 - k^s^i=mlpqdo^ar^qb=p`elli=
Figure 8. CIF Total Budgeted vs. Actual Costs, 2001–2002 (FY 2010 Dollars) Note. We created this table using data obtained from Marine Corps Contract M67004-01-D-0003 (2001).
The costs included all estimated program management fees, awards, LMSI, ICE,
operational costs, overtime, special projects, and estimated costs for Japanese
locations. The original contract did not include estimates for the special costs
associated with the CIFs in Japan, but there was a roughly $10 million gap between the
forecast amount of $289,962,265 and the contract’s stated maximum amount of
$298,988,074. We assumed that the costs for CIFs in Japan would account for that gap.
To include those costs in the budgeted number, we averaged the difference between
$298.98 million and $289.96 million over the remainder of the contract and added this
number to the actual estimated contract costs.
Our research showed that the money was not disbursed as evenly as the
contracts stipulated, but that the total dollar amount was accurate. The FPDS–NG
showed that the Marine Corps’ outlays for the CIF project were $329,054,807 from
2001–2010. We estimated that the difference between obligated and actual outlays
represents money that was obligated, but never used. Regardless of its source, the
difference between the two amounts was only 1.14%. Therefore, we treated the
obligated and actual outlays as accurate for our analysis. Table 12 shows all costs

==^Åèìáëáíáçå=oÉëÉ~êÅÜ=mêçÖê~ã=do^ar^qb=p`elli=lc=_rpfkbpp=C=mr_if`=mlif`v= = - 71 - k^s^i=mlpqdo^ar^qb=p`elli=
associated with the program. All dollar amounts are in budget year (BY) dollars and
have not been adjusted for inflation.
Table 12. CIF Contract Total Costs, 2001–2010
Service/Supplies Amount % of Total Cost
After Hour Operations $348,236 0.10%
Facility Upgrade $2,545,685 0.76%
ICCE Repair $36,639 0.01%
Operations $70,475,428 21.17%
PM Management $15,945,593 4.79%
Sustainment Material $212,111,150 63.72%
Systems Mat/Installation $8,935,840 2.68%
TAP Operations $1,833,780 0.55%
TAP Operations PM $713,454 0.21%
Special Projects $19,912,939 5.98%
Grand Total $332,858,744.21 100.00%
CIF Contract Total Costs 2001‐2010
d. Yearly Contract Allocations
The contract showed that the first year’s costs, over $120 million, were used
primarily for sustainment gear costs and to set up program fees. Even though the
money was allocated in that fiscal year, it was not necessarily spent then. In 2008,
2009, and 2010, large gear allocations kept the total program costs high. It could be
argued that with or without the CIF, the Marine Corps would have incurred those costs,
which makes them irrelevant for our comparison. In addition, because of the wild cost
swings associated with sustainment gear purchases, they are not a good estimator of
program operational costs over time. Their value for our analysis is further diminished
because the money allocated for these purchases may not have been used within the
designated fiscal year. Therefore, we removed all sustainment gear costs from Figure 9,
which is a comparison of budgeted and actual total non-gear costs in FY 2010 dollars.

==^Åèìáëáíáçå=oÉëÉ~êÅÜ=mêçÖê~ã=do^ar^qb=p`elli=lc=_rpfkbpp=C=mr_if`=mlif`v= = - 72 - k^s^i=mlpqdo^ar^qb=p`elli=
Figure 9. CIF Non-Gear Costs, 2001–2010 (FY 2010 Dollars) Note. We created this table using data obtained from Marine Corps Contract M67004-01-D-0003 (2001).
On average, actual costs were 89% higher than budgeted costs for non-gear
costs. Table 13 highlights that the majority of the $34 million in extra costs over the
program’s lifetime resulted from unplanned special projects and increases in operations
costs. Gear costs were actually overestimated in 2001. While it is likely that money was
shifted from accounts, the end result is still the same: $34 million in cost growth. This
represents an overall cost growth factor of 1.114.

=^Åèìáëáíáçå=oÉëÉ~êÅÜ=mêçÖê~ã=do^ar^qb=p`elli=lc=_rpfkbpp=C=mr_if`=mlif`v - 73 - k^s^i=mlpqdo^ar^qb=p`elli=
Table 13. Budgeted vs. Actual CIF Costs
Budgeted vs. Actual CIF Costs Budgeted Actual Difference
After-Hour Operations $452,952 $348,236 $104,716 CBRN Operations $3,184,506 $0 $3,184,506 Facility Upgrades $0 $2,545,685 -$2,545,685 ICCE Repairs $0 $36,639 -$36,639 ICE/CIF Special Projects (T&M) $0 $17,109,109
-$17,109,109
MCCUU Operations $0 $706,320 -$706,320 MCCUU Operations (02’–03’) $0 $895,114 -$895,114 Name Tags/Service Tapes $0 $721,896 -$721,896
Operations $37,166,432 $70,475,428 -$33,308,996
PM Management $16,277,011 $15,945,593 $331,418 Sustainment Materials $225,292,714 $212,111,150 $13,181,564Systems Mat/Installation $1,387,470 $8,935,840 -$7,548,370 TAP After-Hour Operations $29,552 $29,552 TAP Installation $510,798 $510,798 TAP Operations $4,781,873 $1,833,780 $2,948,093 TAP Operations PM $0 $713,454 -$713,454 TAP Repair $21,447 $21,447 Traspo Cost ISO MCCUU $0 $773,802 -$773,802 Excess Budget Authority $9,883,319 $0 $9,883,319
Total $298,988,074 $333,152,046-$34,163,972
Total Extra Costs $34,163,972
Figure 10 shows the budgeted and actual operational and program management
(PM) costs paid to the contractor, adjusted for inflation. As more locations and services
were added, operations costs increased in kind. In 2001 and 2002, the program was
being implemented at only a few sites, which is apparent by the program’s relatively low
costs then as compared to 2003 and beyond. By 2003, most of the satellite offices were
up and running, thus driving costs up. By 2006, all 16 CIF/IIF locations were running.
Surprisingly, the data show an average yearly growth of 58% in operations and PM
costs. As shown in Figure 10, the difference is primarily in the costs of operations.
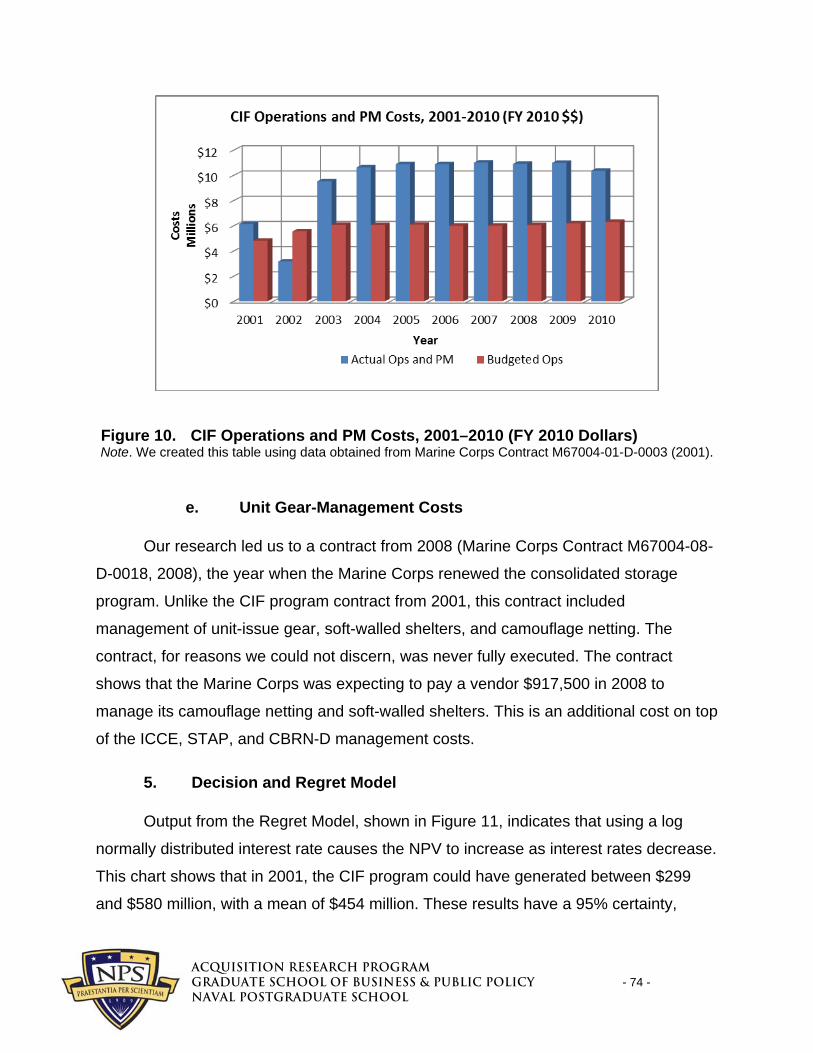
==^Åèìáëáíáçå=oÉëÉ~êÅÜ=mêçÖê~ã=do^ar^qb=p`elli=lc=_rpfkbpp=C=mr_if`=mlif`v= = - 74 - k^s^i=mlpqdo^ar^qb=p`elli=
Figure 10. CIF Operations and PM Costs, 2001–2010 (FY 2010 Dollars) Note. We created this table using data obtained from Marine Corps Contract M67004-01-D-0003 (2001).
e. Unit Gear-Management Costs
Our research led us to a contract from 2008 (Marine Corps Contract M67004-08-
D-0018, 2008), the year when the Marine Corps renewed the consolidated storage
program. Unlike the CIF program contract from 2001, this contract included
management of unit-issue gear, soft-walled shelters, and camouflage netting. The
contract, for reasons we could not discern, was never fully executed. The contract
shows that the Marine Corps was expecting to pay a vendor $917,500 in 2008 to
manage its camouflage netting and soft-walled shelters. This is an additional cost on top
of the ICCE, STAP, and CBRN-D management costs.
5. Decision and Regret Model
Output from the Regret Model, shown in Figure 11, indicates that using a log
normally distributed interest rate causes the NPV to increase as interest rates decrease.
This chart shows that in 2001, the CIF program could have generated between $299
and $580 million, with a mean of $454 million. These results have a 95% certainty,

==^Åèìáëáíáçå=oÉëÉ~êÅÜ=mêçÖê~ã=do^ar^qb=p`elli=lc=_rpfkbpp=C=mr_if`=mlif`v= = - 75 - k^s^i=mlpqdo^ar^qb=p`elli=
given the input variables. This value could have been realized had the Marine Corps cut
supply Marines or permanently reallocated them to other MOSs. For the sake of
simplicity, the model used only those program costs that had been officially estimated in
2001. The program was expected to cost $289 million, but the savings the program
generated were almost double this estimated cost.
Figure 11. CIF NPV Output Analysis
As shown in Figure 12, differences between the fixed and lognormal interest rate
NPV forecasts are interesting. The figure shows that as the interest rates change so will
the NPV, or regret, of the program if there are no manpower cuts. This means that as
time goes on and interest rates drop, the opportunity cost of not making changes
increases. Because of cash flows in a project, interest rate changes can have a
profound impact on the NPV. After running the current scenario through 10,000 trials on
Crystal Ball, we discovered that as the interest rate dropped (which it actually did from
2001–2010), the value of the program increased. To a decision-maker, this result also
shows that using a static discount rate can overestimate a program’s value. Historically,
interest rates change from year to year. Between 1980 and 2011, nominal interest rates
remained constant in consecutive years only three times. Our calculations showed that
the mean value of the NPV based on a fixed interest rate was almost $50 million higher
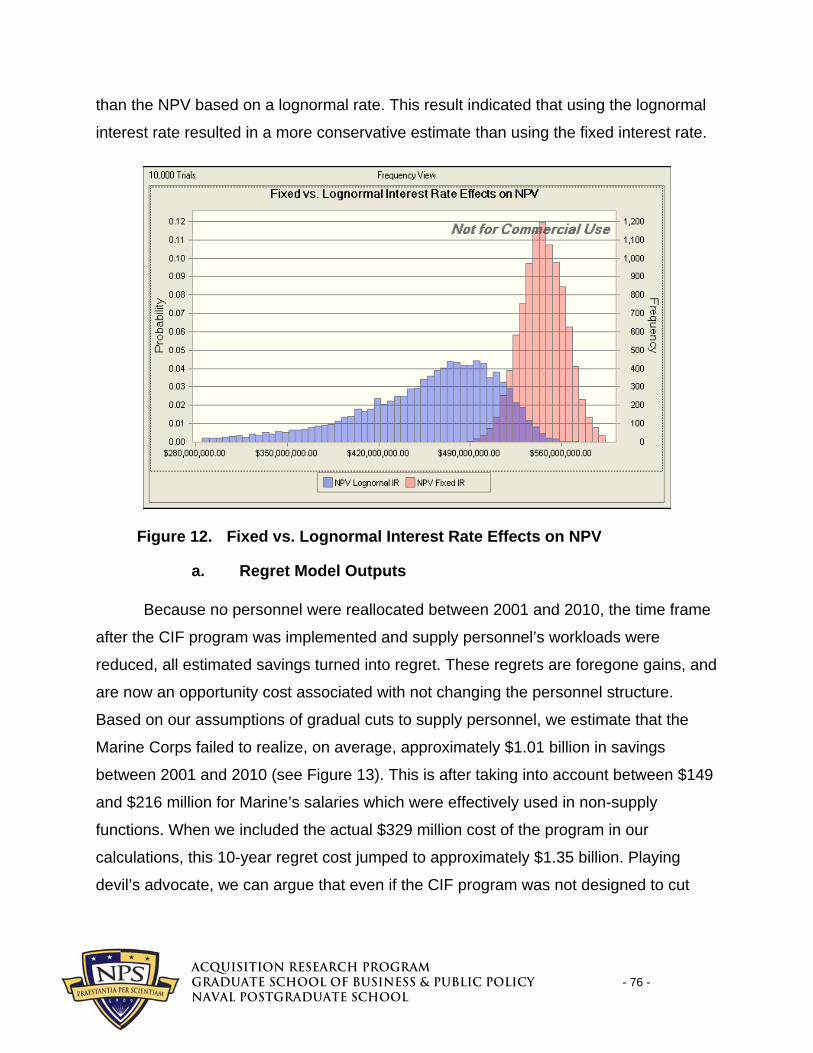
==^Åèìáëáíáçå=oÉëÉ~êÅÜ=mêçÖê~ã=do^ar^qb=p`elli=lc=_rpfkbpp=C=mr_if`=mlif`v= = - 76 - k^s^i=mlpqdo^ar^qb=p`elli=
than the NPV based on a lognormal rate. This result indicated that using the lognormal
interest rate resulted in a more conservative estimate than using the fixed interest rate.
Figure 12. Fixed vs. Lognormal Interest Rate Effects on NPV
a. Regret Model Outputs
Because no personnel were reallocated between 2001 and 2010, the time frame
after the CIF program was implemented and supply personnel’s workloads were
reduced, all estimated savings turned into regret. These regrets are foregone gains, and
are now an opportunity cost associated with not changing the personnel structure.
Based on our assumptions of gradual cuts to supply personnel, we estimate that the
Marine Corps failed to realize, on average, approximately $1.01 billion in savings
between 2001 and 2010 (see Figure 13). This is after taking into account between $149
and $216 million for Marine’s salaries which were effectively used in non-supply
functions. When we included the actual $329 million cost of the program in our
calculations, this 10-year regret cost jumped to approximately $1.35 billion. Playing
devil’s advocate, we can argue that even if the CIF program was not designed to cut
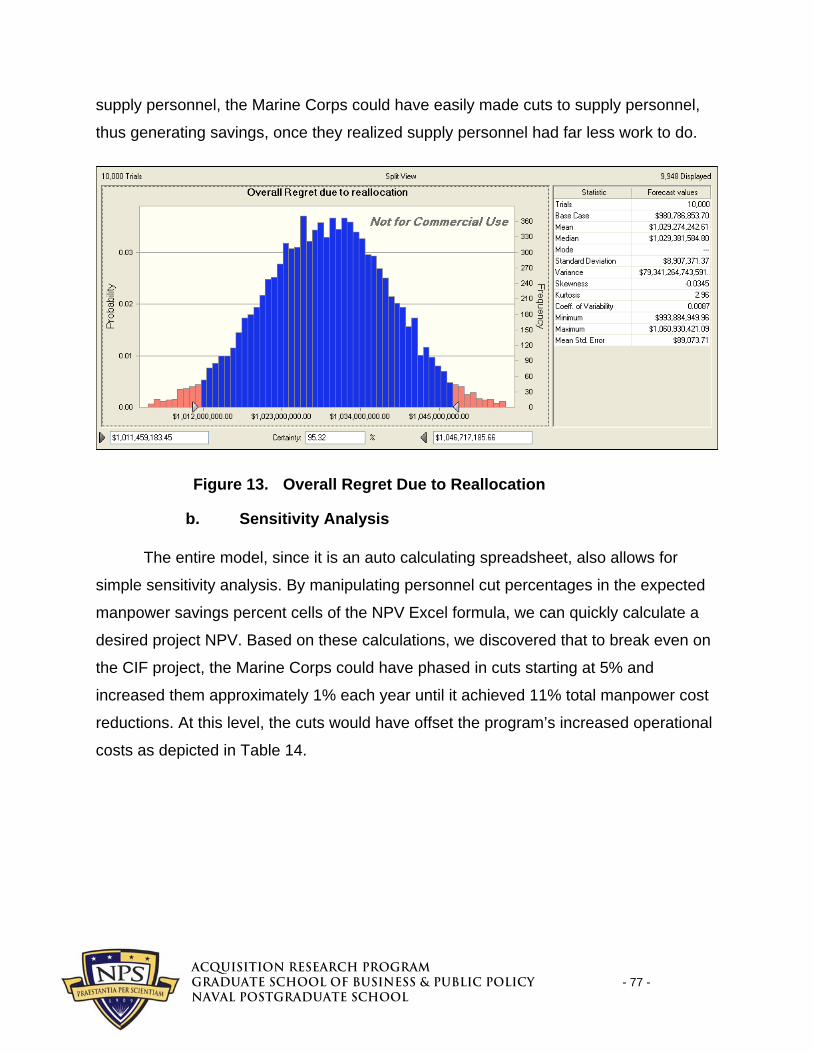
==^Åèìáëáíáçå=oÉëÉ~êÅÜ=mêçÖê~ã=do^ar^qb=p`elli=lc=_rpfkbpp=C=mr_if`=mlif`v= = - 77 - k^s^i=mlpqdo^ar^qb=p`elli=
supply personnel, the Marine Corps could have easily made cuts to supply personnel,
thus generating savings, once they realized supply personnel had far less work to do.
Figure 13. Overall Regret Due to Reallocation
b. Sensitivity Analysis
The entire model, since it is an auto calculating spreadsheet, also allows for
simple sensitivity analysis. By manipulating personnel cut percentages in the expected
manpower savings percent cells of the NPV Excel formula, we can quickly calculate a
desired project NPV. Based on these calculations, we discovered that to break even on
the CIF project, the Marine Corps could have phased in cuts starting at 5% and
increased them approximately 1% each year until it achieved 11% total manpower cost
reductions. At this level, the cuts would have offset the program’s increased operational
costs as depicted in Table 14.

==^Åèìáëáíáçå=oÉëÉ~êÅÜ=mêçÖê~ã=do^ar^qb=p`elli=lc=_rpfkbpp=C=mr_if`=mlif`v= = - 78 - k^s^i=mlpqdo^ar^qb=p`elli=
Table 14. Break Even Sensitivity Analysis
C. Chapter Summary
In this chapter, our analysis showed that the Marine Corps spent $332 million on
the CIF program between 2001 and 2010. There were no cuts to supply personnel
during that time period, and, in fact, the Marine Corps added over 1,000 supply billets.
Because of its failure to reallocate supply personnel, the Marine Corps’ opportunity cost
was approximately $1.3 billion. This money could have been reallocated to fund other
programs and equipment, or other critical manpower requirements. Overall, the
workload of supply Marines dropped, making them less efficient and making a supply
section more costly to operate.
=^Åèìáëáíáçå=oÉëÉ~êÅÜ=mêçÖê~ã=do^ar^qb=p`elli=lc=_rpfkbpp=C=mr_if`=mlif`v - 79 - k^s^i=mlpqdo^ar^qb=p`elli=
V. Results
A. Introduction
In the previous section, we discussed the ASR process and how the Marine
Corps staffs units based on T/O allocation and unit priority. We then analyzed the
Marine Corps-wide supply personnel field from 1999–2010 and showed that there was a
consistent increase in billeted supply personnel across the board. From there, we
analyzed costs associated with manning the priority MAG-39, MWSS-373, and BN 1/1
units and showed that from 2002–2010, those costs remained fairly consistent for MAG-
39 and increased for MWSS-373 and BN 1/1 from year to year. In this section, we
analyze those costs based on the unit’s T/E asset posture from pre- to post-CIF
outsourcing.
In order to compare the costs assigned to assets from a pre- to post-outsourcing
posture, we needed a baseline cost number. These baseline costs, identified as Total
Personnel Costs in Table 15, were derived by averaging the total personnel costs per
unit from 2002–2010. We used this averaging method to hold costs constant so we
could analyze the change associated with the decrease in asset numbers. The second
part of the table, titled Personnel Costs Assigned per Item, shows the cost associated
with each managed item and was derived by simply dividing the personnel costs by the
number of T/E assets. The data from Table 15 and Figure 14 illustrate that as the
number of assets managed decreased from a pre-CIF to a post-CIF/CNSWS supply
posture, the costs to manage the remaining gear increased. This data also show that by
maintaining constant supply personnel manning levels, it becomes increasingly more
expensive to manage fewer assets.

=^Åèìáëáíáçå=oÉëÉ~êÅÜ=mêçÖê~ã=do^ar^qb=p`elli=lc=_rpfkbpp=C=mr_if`=mlif`v - 80 - k^s^i=mlpqdo^ar^qb=p`elli=
Table 15. Baseline Unit Personnel Costs
Personnel Costs Assigned per Item
Total Personnel Costs Pre CIF Post CIF Post CIF/CNSWS
MAG-39 $1,359,531 $198.97 $855.05 $1,002.60 MWSS-
372 $970,326 $24.28 $60.12 $98.36
BN 1/1 $820,812 $13.23 $49.88 $55.96
Figure 14. Per Item Management Cost
B. Impacts on Efficiency of Outsourcing Unit Assets
The results of our evaluation of the pre- versus post-outsourcing supply unit
structures showed that T/O personnel numbers remained constant with minimal
increases from 2000–2010. In addition, T/E assets drastically decreased as a result of
outsourcing individual equipment to the CIF. This means that supply personnel numbers
were not reduced along with asset reductions so that organic supply accounts managed
less gear with the same number of Marines. This led to a decrease in overall supply
personnel efficiency. Given these results, we forecast a further decrease in supply

==^Åèìáëáíáçå=oÉëÉ~êÅÜ=mêçÖê~ã=do^ar^qb=p`elli=lc=_rpfkbpp=C=mr_if`=mlif`v= = - 81 - k^s^i=mlpqdo^ar^qb=p`elli=
assets and personnel efficiency as a result of outsourcing camouflage netting and soft-
walled shelters (CNSWS) while maintaining historical T/O numbers.
Table 16 shows T/O and T/E post-CIF numbers for 2010 and forecasted post-
CIF/CNSWS numbers for 2012. The forecasted numbers for 2012 show the impacts of
outsourcing T/E CNSWS assets while maintaining historical T/O personnel numbers.
Figures 15 and 16 illustrate the decreases in assets and efficiencies shown in Table 16.
Table 16. Comparison of 2010 and Projected 2012 Asset Management Ratios
Figure 15. T/E Quantity Comparison
Post-CIF: 2010 Post-CIF/CNSWS: 2012
T/O T/E Assets per Marine T/O T/E
Assets per Marine
MAG 27 1590 58.9 MAG 27 1356 50.2 MWSS 15 16140 1076.0 MWSS 15 9865 657.7 BN 11 16455 1495.9 BN 11 14667 1333.4

==^Åèìáëáíáçå=oÉëÉ~êÅÜ=mêçÖê~ã=do^ar^qb=p`elli=lc=_rpfkbpp=C=mr_if`=mlif`v= = - 82 - k^s^i=mlpqdo^ar^qb=p`elli=
Figure 16. Individual Unit Personnel Efficiency Ratios
In the recommendations section, we discuss measures that can mitigate the
personnel efficiency loss.
C. Future CIF/UIF NPV and Regret Model
To predict the potential impacts on the Marine Corps of continuing the CIF
program, we used the same model we used to retrospectively examine CIF impact from
2001–2010. All the variables stayed the same. The only difference was the data used
for the input variables. We started with 2010 supply personnel cost data and then
predicted those costs through 2020, based on published inflation rates.
To estimate future CIF and UIF program costs, we used the 2010 final program
costs and indexed them for inflation into 2012 dollars. We also added the estimated
costs from 2008 of including the SWS&CN aspect into the program. A failed CSP
contract from 2008 showed the yearly cost in 2008 of managing SWS&CN to be
approximately $980,000 (Marine Corps Contract M67004-08-D-0018, 2008). We then
used Marine Corps operations and maintenance inflation data to convert that number
into TY 2012 dollars, which are used for budgeting within the government. The CIF and
SWS&CN values were added together for 2012 and then indexed for inflation growth
==^Åèìáëáíáçå=oÉëÉ~êÅÜ=mêçÖê~ã=do^ar^qb=p`elli=lc=_rpfkbpp=C=mr_if`=mlif`v= = - 83 - k^s^i=mlpqdo^ar^qb=p`elli=
until 2020. Because the estimated costs of CIF operations between 2001 and 2010
were higher than the actual costs, the actual operational growth factor of 1.89 was
applied to the estimated SWS&CN costs. This method allowed us to compare the
planned Marine Corps personnel costs with the CIF costs.
We used the current 2012 nominal interest rate of 3% for our calculations and
included a uniformly distributed interest rate based on data from 1980–2011 to add a
range of variability to the forecast. This model allowed us to evaluate the contract’s NPV
in 2011, based on our assumptions, as well as to predict potential regret from not
making personnel structure changes.
D. Decision Model NPV Results
Once again, it was assumed that personnel cuts would be phased in from 2012
through 2020. The nominal interest rate was defined as a random variable, fitting a
uniform distribution, with interest rates ranging from 1–6%. In a uniform distribution, all
values have an equal probability of falling between the minimum and maximum values.
We could not use a lognormal interest rate, as we did in the CIF model, because
interest rates are currently so low that the standard deviation resulted in a negative
interest rate, which is impossible in reality. As Figure 17 shows, with cuts starting at 1%
in 2012 and increasing incrementally until 40% is reached, the 2011 NPV of the project
over 100,000 trials at a 95% confidence interval is between $575 and $907 million. This
represents a huge area in which cuts can be made and those savings can be re-
invested elsewhere.

==^Åèìáëáíáçå=oÉëÉ~êÅÜ=mêçÖê~ã=do^ar^qb=p`elli=lc=_rpfkbpp=C=mr_if`=mlif`v= = - 84 - k^s^i=mlpqdo^ar^qb=p`elli=
Figure 17. 2011 NPV of CIF/UIF Contract
E. Regret Model Results
In this case, if history is an indication of the future and no cuts are made, the
Marine Corps once again faces a substantial opportunity cost for not restructuring its
supply personnel and removing its workload even further. As Figure 18 shows, the
average regret of this inaction, with 95% certainty, is between $964 million and $1.18
billion. When we add the $360 million in estimated costs of the CSP program, the regret
climbs to approximately $1.4 billion. Because this is the second iteration of this
program, all the previous opportunity costs must then be added on top. This means that
over a 20-year period, the Marine Corps will have an overall regret of approximately
$2.7 billion from not restructuring its supply personnel.

==^Åèìáëáíáçå=oÉëÉ~êÅÜ=mêçÖê~ã=do^ar^qb=p`elli=lc=_rpfkbpp=C=mr_if`=mlif`v= = - 85 - k^s^i=mlpqdo^ar^qb=p`elli=
Figure 18. Overall Financial Regret of CIF/UIF Program

=^Åèìáëáíáçå=oÉëÉ~êÅÜ=mêçÖê~ã=do^ar^qb=p`elli=lc=_rpfkbpp=C=mr_if`=mlif`v - 86 - k^s^i=mlpqdo^ar^qb=p`elli=
THIS PAGE INTENTIONALLY LEFT BLANK

=^Åèìáëáíáçå=oÉëÉ~êÅÜ=mêçÖê~ã=do^ar^qb=p`elli=lc=_rpfkbpp=C=mr_if`=mlif`v - 87 - k^s^i=mlpqdo^ar^qb=p`elli=
VI. Conclusions and Recommendations
A. Conclusions
At the beginning of this thesis, we posed several questions we felt were pertinent
in order to answer our fundamental question: Can the UIF provide an efficient
alternative to the organic supply account, an alternative that will reduce costs to the
Marine Corps? The answers to these major questions laid the framework and guided
our recommendations for the future of Marine Corps supply outsourcing.
1. Did the privatized management of supply assets reduce cost and
create efficiencies for the Marine Corps?
According to our analysis, the CIF program achieved the Marine Corps’ goal of
reducing the management burden of individual assets on its supply accounts by
outsourcing all ICCE equipment and reducing operating inventory. However, by
maintaining pre-outsourcing unit supply personnel structures and staffing levels over the
course of the CIF contract, the Marine Corps’ overall costs increased, while the
efficiency of its supply personnel decreased. The Marine Corps incurred an additional
cost because it outsourced ICCE management while still funding organic personnel
costs. If the Marine Corps continues to outsource unit assets without reducing Marine
supply personnel, it will continue to increase costs and decrease organic supply
efficiency. By not reallocating or cutting supply personnel from 2001–2010 and, thereby,
incurring additional costs in its supply operations, the Marine Corps faced a $1.3 billion
opportunity cost. The Marine Corps could have reallocated that money into other
personnel or equipment.
2. Can the UIF provide an efficient alternative and reduce costs to the
Marine Corps when compared with an organic supply account?
As ground supply officers who have both led organic supply units, we believe that
outsourcing supply functions can benefit the Marine Corps by reducing the management
burden to organic supply units and by increasing efficiencies beyond the supply unit’s
current capabilities. However, for the benefits of outsourcing to outweigh its costs, the
==^Åèìáëáíáçå=oÉëÉ~êÅÜ=mêçÖê~ã=do^ar^qb=p`elli=lc=_rpfkbpp=C=mr_if`=mlif`v= = - 88 - k^s^i=mlpqdo^ar^qb=p`elli=
Marine Corps must ensure that personnel reductions are in line with outsourcing efforts.
Otherwise, supply personnel will have less and less work to do as more assets are
removed from their accounts. The vacuum created by outsourcing must be addressed
by reducing personnel levels or retraining in additional skills or MOSs in order to benefit
both the Marine Corps and the individual Marine. We address these concerns in the
recommendations section. If supply personnel were eliminated, then the additional costs
of managing the SWS&CN or other unit assets in the UIF would make sense. The
additional enterprise-wide cost to the Marine Corps would be, by our estimates, an
additional $2 million per year. To offset this additional expense, the Marine Corps would
only need to eliminate approximately 30–35 supply Marines per year. However, if supply
Marines are not eliminated, the Marine Corps will pay an additional expense that is not
required.
3. How is risk balanced against the aims of saving money in an
outsourcing decision?
From the Marine Corps perspective, it is a risky proposition to eliminate a
substantial portion of supply Marines because they are essential assets in supporting
tactical units during operations. One of the biggest drawbacks to cutting supply
personnel end strength is that supply Marines are key to providing supply support in
garrison and deployed environments. Cutting these personnel, and their associated
costs, poses extraordinary operational risk to the Marine Corp’s ability to accomplish its
mission. Since the Marine Corps is an organization that prides itself on being
expeditionary by nature and capable of deploying anywhere in the world on a moment’s
notice, the risk of not being self-sustaining is anathema to its mission. According to
Doerr, Lewis, and Eaton (2005), “The degree of operational risk a contractor can
assume is limited in many cases by the nature of military operations. ... [D]ifficult issues
relating to physical risk, insurance, and liability of non-military personnel in or near
combat need to be addressed” (p. 179). If significant numbers of supply personnel are
cut or reallocated, then units cannot self-support when deployed. A contractor will not
provide tactical, unit-level supply support in a combat zone, anywhere in the world, at
the Commander-in-Chief’s direction. If contractors did provide this service, it would be at

==^Åèìáëáíáçå=oÉëÉ~êÅÜ=mêçÖê~ã=do^ar^qb=p`elli=lc=_rpfkbpp=C=mr_if`=mlif`v= = - 89 - k^s^i=mlpqdo^ar^qb=p`elli=
an extremely high cost and without the depth and flexibility an organic unit can provide.
Organic supply personnel can be tasked to perform any tasks required to complete the
myriad operations Marines conduct worldwide, including security, logistics, and most
importantly, a rifleman. A rifleman, above all, is a Marine’s primary duty. Contractors
could only fill the roles defined in their contract, and certainly, cannot conduct combat
operations.
B. Recommendations
1. Reduce Supply T/O and Staffing Levels at Using Units
Supply personnel T/Os and staffing goals should be reduced at the organic
supply account level either by (a) re-designating excess personnel to combat roles, or
(b) re-assigning those personnel to other logistics functions. Given the similarity
between the functions of supply and logistics MOSs, this reallocation would be an easy
step to take. The re-designation of supply Marines to combat roles will shift personnel
costs associated with those billets to more critical MOSs. With the Marine Corps facing
a drawdown of personnel from 202,000 to 175,000, the ability to retain every warfighter
possible is critical in order for the Marine Corps to retain its combat capability.
According to our analysis, the Marine Corps can gain the greatest cost savings by
reducing or re-designating MAG units’ supply personnel. These ground supply units
should be the primary focus of the reduction of supply personnel work forces and their
re-designation to combat roles in order to effectively utilize these Marines within the
ground combat element, using a model similar to the one currently used by battalion
supply accounts.
Unlike MAG and MWSS supply accounts, organic battalion supply accounts have
the unique ability to properly utilize supply Marines to support additional supply chain
operations or combat roles outside of the supply account. This ability is based solely on
the nature of their operating and training environments. We therefore recommend that
the T/O and staffing levels of the battalion accounts remain unchanged, while the MAG
and MWSS accounts are reduced. This course of action would allow the Marine Corps

==^Åèìáëáíáçå=oÉëÉ~êÅÜ=mêçÖê~ã=do^ar^qb=p`elli=lc=_rpfkbpp=C=mr_if`=mlif`v= = - 90 - k^s^i=mlpqdo^ar^qb=p`elli=
to reduce overall personnel costs, increase unit efficiencies, and reinforce combat roles.
The other option is to re-assign supply personnel to other supply functions.
MAG and MWSS supply Marines should either be re-designated to combat roles
as described previously, or re-assigned to other functions within the Marine Corps’
supply chain. By reassigning supply Marines from organic supply units to other supply
or logistics functions, Marines are effectively employed within the supply field, and unit
personnel costs are reduced. This re-assignment benefits the Marine Corps by
broadening its supply capability and the expertise of its supply Marines. It also provides
those Marines with increased supply proficiency through effective supply utilization.
However, this option comes with substantial risk to operational capability.
2. A-76 Studies and Centralized Organic Supply Management
The Marine Corps should ensure that all future outsourcing contracts go through
the A-76 process in order to identify any potential cost efficiencies gained through the
creation of a most efficient organization (MEO). The creation of the MEO for the CIF
program had the potential to identify cost savings and alternatives to increase efficiency.
One possible way to remedy the difference between a need for modernized
supply operations that take advantage of streamlined and centralized management
practices is to adopt a program the Marine Corps already has in place. This would
involve moving CSP functions to a model similar to Marine Corps Installation Personnel
Administration Centers (IPAC).
In the IPAC model, the Marine Corps consolidated the administration field and
removed large portions of administration personnel from tactical units, to a central
facility on every Marine Corps base. According to All Marine Corps Order 058/05, the
purposes of IPAC, coupled with a new automated personnel system, the Marine Corps
Total Force System (TFAS), are to
improve Marine Corps administrative procedures by automating processes, decreasing redundancy of data input, reducing costs associated with administrative transactions, and ensuring the accuracy of the data resident in the

==^Åèìáëáíáçå=oÉëÉ~êÅÜ=mêçÖê~ã=do^ar^qb=p`elli=lc=_rpfkbpp=C=mr_if`=mlif`v= = - 91 - k^s^i=mlpqdo^ar^qb=p`elli=
Marine Corps Total Force System. As TFAS has matured, the Marine Corps has reduced the number of Marines required to provide administrative support, and saved Marine’s valuable time by improving the efficiency of administrative support provided. (Marine Corps, 2005, para. A)
This sounds very similar to the goals of the CIF program in 2000 “to increase
efficiencies, reduce the burden on the Operating Forces, and improve customer
support” (Marine Corps, 2000b). These values are also the objectives of the updated
CSP program:
1) Effective—Rights things, at the right place, at the right time
2) Item Management and Accountability—Web-based asset visibility
3) Reduced Logistics management costs through standardized processes (Marine Corps Systems Command, 2007)
It is in the best interest of the Marine Corps, at all levels, to create more value
and operate more efficiently. The Marine Corps successfully integrated technology and
efficient practices into its personnel administration operations. There is no reason that it
cannot do the same in supply operations. By adopting a model similar to the IPAC,
where individual units send Marines to fill billets at the base CIF, the Marine Corps can
promote professional improvement, centralized management of assets, and reduced
risk to fill key billets if deployed.
Furthermore, with the precedence that the CIF has set for the Marine Corps over
the past 10 years, lessons learned from the program can be easily incorporated and
transferred back to Marine control. As discussed earlier, risk is associated with losing
control of the entire value stream when outsourcing a function. NMCI is a prime
example. In 2000, the goal was to outsource all operational control to a contractor with
the required expertise to bring Navy and Marine Corps computer networks rapidly into
the 21st century. However, a decade later, with NGEN, NMCI’s predecessor, the DoN
“will have a more direct role in commanding and controlling operation of the network”
(Taylor, 2010, p. 39). This paradigm shift is happening because, as Captain Scott
Weiler, NMCI program manager states,

==^Åèìáëáíáçå=oÉëÉ~êÅÜ=mêçÖê~ã=do^ar^qb=p`elli=lc=_rpfkbpp=C=mr_if`=mlif`v= = - 92 - k^s^i=mlpqdo^ar^qb=p`elli=
we [the DoN] wanted to take a greater role in the management of the enterprise. ... We had direct control and oversight in NMCI, so that didn't really change, but we wanted to grow a cadre of government employees to do more of the work directly hands-on. We also wanted to own infrastructure, wanted the option to hold infrastructure, and we wanted to hold competitions. (Taylor, 2010, p. 37)
Ultimately, this allows the DoN greater flexibility in directing operations and
controlling risk as it sees fit.
While there would be a learning curve associated with returning supply
management to the Marine Corps, it would not be an insurmountable task. In the NGEN
program, the DoN is purchasing intellectual property and infrastructure back from the
vendor (Taylor, 2010, p. 37). The Marine Corps could negotiate a purchase of the
vendor’s web-based asset visibility tool and warehouse management system.
Additionally, it already owns all the warehouses and facilities the CIF operates so there
would be minimal fees associated with resuming control of operations.
Finally, this plan would allow the Marine Corps to improve how it does supply and
logistics management, rather than simply being a customer of improved logistics
support. Lean Six Sigma, Total Quality Management, and the Theory of Constraints are
the premier management philosophies of the 21st century. In the Marine Corps ground
supply, these ideas have not been readily integrated into the curriculum and practices.
Marine Corps Aviation supply and logistics, on the other hand, has adopted these
practices in a program called AIRspeed. The AIRspeed program’s aim is “to achieve
readiness by meeting mission requirements, while simultaneously reducing inventory
and operating expenses” (Goldratt, 2009, p. 2). Since its inception in 2004, the program
has improved aircraft readiness and reduced costs by hundreds of millions of dollars
across all levels of the Naval Aviation Enterprise (Naval Aviation Enterprise, 2011).
Marine ground supply could also harness the power of these best business practices
and simultaneously increase the value of its personnel in the process by giving them
training that is valuable inside the DoD and the business world.
The Marine Corps effectively reorganized its organic administration sections to
become more efficient and effective. Similarly, Marine Corps Aviation logistics also

==^Åèìáëáíáçå=oÉëÉ~êÅÜ=mêçÖê~ã=do^ar^qb=p`elli=lc=_rpfkbpp=C=mr_if`=mlif`v= = - 93 - k^s^i=mlpqdo^ar^qb=p`elli=
modernized itself from within to provide world-class, effective support to warfighters
based on best business practices. This is the benefit of reorganization and is one of the
goals an MEO can ultimately provide: a more cost-efficient alternative to outsourcing.
There are undoubtedly more factors involved in the CIF/UIF decision to outsource
supply management than we analyzed because we were not privy to the information.
Given the Marine Corps’ successes with improvements in services and reductions in
costs, we recommend that the Marine Corps perform an A-76 study on outsourcing unit
assets and create an MEO in order to determine the most cost-efficient alternative. This
would provide the Marine Corps with the opportunity to evaluate the feasibility of
providing an “in-house” alternative that provides value for the Marine Corps and not
simply a goal to reduce costs.
C. Recommendations for Further Study
1) Coupling the speed and scale of Marine Corps outsourcing with the results of our analysis on maintaining pre-outsourcing personnel structures, an analysis should be performed on the impact to promotions and longevity not only for ground supply personnel, but for all fields that face significant outsourcing of functions. Because major outsourcing of supply functions began in early 2001 and continued outsourcing is on the horizon, the ground supply community may be faced with myriad challenges in staying competitive for promotions and reenlistments. An analysis should be performed to evaluate these challenges based on historical data as the Marine Corps continues to outsource functions and wrestles to couple asset outsourcing with personnel restructuring.
2) An analysis should be performed in order to capture the efficiency of outsourcing unit-specific-type assets and the impacts that this outsourcing will have on mission readiness and control. The major difference between CIF and UIF is that the CIF controls individually assigned assets while the UIF controls unit-assigned assets. Outsourcing unit assets produces unique challenges not associated with individual gear, such as differences in unit missions and requirements that a consolidated-outsourcing framework may be unable to achieve.
==^Åèìáëáíáçå=oÉëÉ~êÅÜ=mêçÖê~ã=do^ar^qb=p`elli=lc=_rpfkbpp=C=mr_if`=mlif`v= = - 94 - k^s^i=mlpqdo^ar^qb=p`elli=
THIS PAGE INTENTIONALLY LEFT BLANK
==^Åèìáëáíáçå=oÉëÉ~êÅÜ=mêçÖê~ã=do^ar^qb=p`elli=lc=_rpfkbpp=C=mr_if`=mlif`v= = - 95 - k^s^i=mlpqdo^ar^qb=p`elli=
List of References
Anderson, W. M., McGuiness, J. J., & Spicer, J. S. (2001). From chaos to clarity: How current cost-based strategies are undermining the Department of Defense: Report of the Military Research Fellows. Fort Belvoir, VA: Defense Acquisition University Press.
Brooks, C. M., White, E. J., & Moore, D. E. (2004). Outsourcing options to meet Navy recapitalization goals (Master’s thesis, Naval Postgraduate School). Available from National Technical Information Service.
Brooks, D., & Shevlin, J. (2005). Reconsidering battlefield contractors. Georgetown Journal of International Affairs, 6(2), 103–112.
Cahlink, G. (2001). Downsizing detour. Government Executive, 33(1), 47–52.
Cahlink, G. (2003, July 12). Where there’s more at stake. National Journal, 35(28), 2232–2233
Congressional Budget Office (CBO). (2005). Logistics support for deployed military services. Washington, DC: Library of Congress.
Defense Science Board (DSB) Task Force on Outsourcing and Privatization. (1996). Report of the Defense Science Board Task Force on Outsourcing and Privatization. Washington, DC: Office of the Under Secretary of Defense for Acquisition and Technology.
Department of the Navy (DoN). (2009). Marine corps supply personnel operating costs [database query]. Retrieved from: Visibility and management of operating and support costs (VAMOSC) database. https://www.vamosc.navy.mil/.
Delivering IT solutions. (2010, February 14). Military Information Technology, 14(1). Retrieved from http://www.military-information-technology.com/mit-home/222-mit-2010-volume-14-issue-1-february/2418-delivering-it-solutions.html
Doerr, K., Lewis, I., & Eaton, D. R. (2005). Measurement issues in performance based logistics. Journal of Public Procurement, 5(2), 164–186.
Donnelly, H. (2006, April). Q&A: Brigadier General George J. Allen: Expeditionary CIO: IT for winning battles and making Marines. Military Information Technology, 10(3). Retrieved from http://www.military-information-technology.com/mit-home/118-mit-2006-volume-10-issue-3/1068-qaa-brigadier-general-george-j-allen.html

==^Åèìáëáíáçå=oÉëÉ~êÅÜ=mêçÖê~ã=do^ar^qb=p`elli=lc=_rpfkbpp=C=mr_if`=mlif`v= = - 96 - k^s^i=mlpqdo^ar^qb=p`elli=
Efficient. (2011). In Merriam–Webster’s online dictionary (11th ed.). Retrieved from http://www.merriam-webster.com
Electronic Document Access–Next Generation (EDA–NG). (2011). About EDA. Retrieved from http://eda.ogden.disa.mil/
Federal Acquisition Regulation (FAR), 48 C.F.R. ch. 1 (2005).
Federal Activities Inventory Reform (FAIR) Act of 1998, Pub. L. No. 105–270, 112 Stat. 2382 (1998).
Federal Information & News Dispatch. (1998, April 1). 84—Career length issue “782 gear.” Commerce Business Daily. Retrieved from http://www.cbd-net.com/
Federal Information & News Dispatch. (2010). Contracts for September 15, 2010. Retrieved from http://www.cbd-net.com/
Federal Procurement Data System–Next Generation (FPDS–NG). (2011). FAQ. Retrieved August 2, 2011 from https://www.fpds.gov/fpdsng_cms/
Gates, S. M., & Robbert, A. A. (2000). Personnel savings in competitively sourced DoD activities: Are they real? Will they last? (MR-1117-OSD). Santa Monica, CA: RAND.
General Accounting Office (GAO). (1998, March). Defense management challenges facing DoD in implementing defense reform initiatives: Statement of David R. Warren, Director, Defense Management Issues, National Security and International Affairs Division, before the Subcommittee on Military Readiness, Committee on National Security, House of Representatives (GAO-98-122). Washington, DC: Author.
General Accounting Office. (GAO). (1999, February). DoD competitive sourcing: Results of recent competitions: Report to the Chairman, Subcommittee on Readiness and Management Support, Committee on Armed Services, U.S. Senate (GAO/NSIAD-99-44). Washington, DC: Author.
General Accounting Office (GAO). (2000). DoD competitive sourcing: Savings are occurring, but actions are needed to improve accuracy of savings estimates (GAO/NSIAD-00-107). Washington, DC: Author.
General Accounting Office (GAO). (2001). DOD competitive sourcing: Effects of A-76 studies on federal employees’ employment, pay, and benefits vary (GAO-01-388). Washington, DC: Author.
General Accounting Office (GAO). (2003). Defense management: DoD faces challenges implementing its core competency approach and A-76 competitions (GAO-03-818). Washington, DC: Author.

==^Åèìáëáíáçå=oÉëÉ~êÅÜ=mêçÖê~ã=do^ar^qb=p`elli=lc=_rpfkbpp=C=mr_if`=mlif`v= = - 97 - k^s^i=mlpqdo^ar^qb=p`elli=
GlobalSecurity.org. (2011). Military personnel end strength. Retrieved from http://www.globalsecurity.org/military/agency/end-strength.html
Goldratt, A. Y. (2009). The Enterprise AIRSpeed journey: Strategic direction and the integration of the Theory of Constraints, Lean, and Six Sigma (TOCLSS) to achieve focused system improvement. Retrieved from http://www.goldratt.com/pdfs/AIRSpeedCaseStudy.pdf
Gore, A. (1997). Serving the American public: Best practices in performance measurement (Benchmarking Study Report). Washington, DC: National Performance Review.
Government Accountability Office (GAO). (2006, December). Information technology: DoD needs to ensure that Navy Marine Corps intranet program is meeting goals and satisfying customers (GAO-07-51). Washington, DC: Author.
Grace, J. A. (2011, April). With NGEN, it’s deja vu all over again. Signal, 8(65), 96.
Grasso, V. B. (2005). Defense outsourcing: The OMB Circular A-76 policy. Washington, DC: Congressional Research Service.
Guttman, D. (2003, September). Contracting United States government work: Organizational and constitutional models. Public Organization Review, 3, 288–290.
Halchin, E. R. (2003). The Federal Activities Inventory Reform Act and Circular A-76. Retrieved from http://digital.library.unt.edu/govdocs/crs/permalink/meta-crs-Rl31024
Headquarters, Marine Corps. (2011). Results of the 2010 staff sergeant and gunnery sergeant selection board (Internal report). Washington, DC: Author.
Hewlett Packard (HP). (2011). Navy Marine Corps intranet: About NMCI. Retrieved from http://h10134.www1.hp.com/sites/nmci/about/
Huston, J. A. (1966). The sinews of war: Army logistics, 1775–1953. Washington, DC: United States Army, Office of the Chief of Military History.
Implementing improvements to defense wartime contracting: Statement before the Commission on Wartime Contracting in Iraq and Afghanistan, 112th Cong. 1 (2011, April 25) (statement of Jacques S. Gansler).
Jordan, K. (2007, September). The NMCI experience and lessons learned: The consolidation of networks by outsourcing. Case Studies in National Security Transformation, 12. Retrieved from

==^Åèìáëáíáçå=oÉëÉ~êÅÜ=mêçÖê~ã=do^ar^qb=p`elli=lc=_rpfkbpp=C=mr_if`=mlif`v= = - 98 - k^s^i=mlpqdo^ar^qb=p`elli=
http://www.ndu.edu/CTNSP/docUploaded/Case%2012%20%20The%20NMCI%20Experience%20and%20Lessons%20Learned.pdf
KBR plans to continue Logcap III work supporting Army. (2010, May 13). Manufacturing Close–Up. Retrieved from http://www.closeupmedia.com/Publications.html
Lion Vallen Industries. (2010). Consolidated storage program (CSP) system capabilities. PowerPoint presentation, 3 MEF Comptroller’s Office, Okinawa, Japan.
Lion Vallen Industries. (2011a). Customers: U.S. Marine Corps. Retrieved from http://www.lionprotects.com/content/us-marine-corps
Lion Vallen Industries. (2011b). USMC individual combat clothing and equipment total asset visibility tool: Camp Pendleton asset visibility summary. Retrieved from http://www.usmccif.com
Logistics Management Specialists. (2009). Consolidated storage update brief (Unpublished presentation slides). MARCORSYSCOM, Albany, GA.
Luckey, J. R. (2003). OMB circular A-76: legal reach and proposed modifications. (RS21489). Washington, DC: Congressional Research Service.
Mahoney, R. J., & Schofield, S. D. (2006). Cost analysis of outsourcing an Air Force supply squadron (Unpublished master’s thesis). Naval Postgraduate School, Monterey, CA.
Marine Aircraft Group 39. (2011) Marine Aircraft Group 39 history. Retrieved from http://www.3maw.usmc.mil
Marine Corps. (2000a, January 4). Cancellation of career length issue (CLI) and establishment of consolidated issue facilities (MARADMIN 003/00). Arlington, VA: Author.
Marine Corps. (2000b, July 13). Centralized logistics management for individual combat clothing and equipment (ICCE) and consolidated issue facilities (CIF; Marine Corps Order 4400.196). Washington, DC: Author.
Marine Corps. (2003). Marine Corps individual combat clothing and equipment (ICCE) life-cycle management and consolidated issue facility (CIF) logistics management and services performance based statement of work (Attachment to contract M67004-01-D-0003). Albany, GA: Author.
Marine Corps. (2005, November 28) Total Force Administration System and Installation Personnel Administration Centers (IPAC; MARADMIN 058/05). Washington, DC: Author.

==^Åèìáëáíáçå=oÉëÉ~êÅÜ=mêçÖê~ã=do^ar^qb=p`elli=lc=_rpfkbpp=C=mr_if`=mlif`v= = - 99 - k^s^i=mlpqdo^ar^qb=p`elli=
Marine Corps. (2006). Copy of FY06 mil-civ conversion list, “February 9, 2006 version.” Retrieved from http://www.manpower.usmc.mil
Marine Corps. (2010a). IIF logistics management and services statement of objectives. Retrieved from https://www.neco.navy.mil/.../M6700411R0006LVI_IIF_SOO_Bridge
Marine Corps. (2010b, January 8). Precedence levels for manning and staffing (Marine Corps Order 5320.12G). Washington, DC: Author.
Marine Corps. (2011). Authorized strength reports (ASRs) and tables of organization (T/Os) [database records]. Retrieved from Total Force Structure Division (TFSD).
Marine Corps Contract M67004-01-D-0003. (2001). Retrieved from Electronic Data Access in August 2011.
Marine Corps Contract M67004-08-D-0018. (2008). Retrieved from Electronic Data Access in August 2011.
Marine Corps Systems Command. (2007). Consolidated storage program [Presentation slides]. Retrieved from http://www.marcorsyscom.usmc.mil/sites/pmice/Operations/ProgramReviewMar07/ConsolStorPgrm.pdf
Marine Corps Team ISS 360. (2006). Intermediate level supply chain management study for the United States Marine Corps. Albany, GA: Marine Corps Logistics Command.
Marines pact to agility. (2008, August 26). Journal of Commerce. Retrieved from http://www.joc.com/logistics-economy/marines-pact-agility
Moreau, T. J. (2002). The evaluation of appropriateness of OMB Circular A-76 studies on revenue-generating functions in defense working capital fund activities (Unpublished master’s thesis). Naval Postgraduate School, Monterey, CA.
Munoz, C. (2011, January 7). Gates unveils massive new cost cutting initiatives. Defense Daily. Retrieved from http://www.defensedaily.com/publications/dd/12342.html
Nakashima, E. (2001, June 8). Bush opens 40,000 federal workers’ jobs to competition; Goal: Put 425,000 positions up for grabs to contractors. The Washington Post, p. 27.
Naval Aviation Enterprise. (2011). Airspeed success stories. Retrieved from http://www.cnaf.navy.mil/nae/

==^Åèìáëáíáçå=oÉëÉ~êÅÜ=mêçÖê~ã=do^ar^qb=p`elli=lc=_rpfkbpp=C=mr_if`=mlif`v= = - 100 - k^s^i=mlpqdo^ar^qb=p`elli=
Nussbaum, D. (2011). Economic analysis (Cost estimation curriculum presentation slides). Naval Postgraduate School, Monterey, CA.
Office of Management and Budget (OMB). (1999). Performance of commercial activities (OMB Circular A-76). 1999 Revision. Washington, DC: Author
Office of Management and Budget (OMB). (2003, May 29). Performance of commercial activities (OMB Circular A-76). 2003 Revision. Washington, DC: Author.
Office of Management and Budget (OMB). (2008). Competitive sourcing: Report on competitive sourcing results fiscal year 2007. Washington, DC: Author.
Office of the Under Secretary of Defense for Acquisition, Technology, and Logistics (OUSD[AT&L]). (2011). Improvements to services contracting: Report to the Defense Science Board. Washington, DC: Author.
Office of the Under Secretary of Defense for Personnel and Readiness. (2004). President’s management agenda: The results from the Department of Defense. Washington, DC: Author.
Opportunity cost. (2011). In Investopedia.com’s online dictionary. Retrieved from http://www.investopedia.com
Oracle Corporation. (2011). Oracle crystal ball. Retrieved from http://www.oracle.com/us/products/applications/crystalball/index.html
Outsourcing. (2011). In Merriam–Webster’s online dictionary (11th ed.). Retrieved from http://www.merriam-webster.com
Powell, C. A. (2002). Transaction cost economics and A-76: A framework for defense managers (Unpublished master’s thesis). Naval Postgraduate School, Monterey, CA.
Priest, D. (2004, April 6). Private guards repel attack on U.S. headquarters. The Washington Post, p. A01.
Rabassi, C. (2010). Reorganize supply: The time has come. Marine Corps Gazette, 94(2), 58–61.
Schneck, R. G. (2001). Contractors: A strategic asset or Achilles’ heel? (Unpublished master’s thesis). Army War College, Carlisle, PA.
Schneider, G. (2000, October 7). Navy embraces online mission: EDS gets $7 billion-dollar intranet job. The Washington Post, p. 2.

==^Åèìáëáíáçå=oÉëÉ~êÅÜ=mêçÖê~ã=do^ar^qb=p`elli=lc=_rpfkbpp=C=mr_if`=mlif`v= = - 101 - k^s^i=mlpqdo^ar^qb=p`elli=
Statement of Robert E. Hammond, Assistant Deputy Chief for Installations and Logistics, United States Marine Corps, before the House Armed Services Committee, 106th Cong. 2 (1999, March).
Taylor, D. P. (2010). Navy delays starting the NGEN. Signal, 65(4), 37–39.
Thurmer, K. E. (2011, March). Teaming for the Navy network. Military Information Technology, 15(2). Retrieved from http://www.military-information-technology.com/mit-home/308-mit-2011-volume-15-issue-2-march/4067-teaming-for-the-navy-network.html
USMC commandant on record with ROA. (1999). The Officer, 75(9), 24–26.
Walker, D. M. (2003). Competitive sourcing: Implementation will be challenging for federal agencies. Washington, DC: General Accounting Office.
Wharton, A. M. (2010, May 10). Schwab IIF hosting open house. Retrieved from http://www.marines.mil/
Wideman, J. (2010, September 28).15 budget busting technology projects. Information Week Online. Retrieved from http://www.informationweek.com/news/galleries/hardware/reviews/227500060?queryText=nmci
Zimmer, J. L., III. (2004, January 8). Supply no longer belongs to Marines. Retrieved from http://www.marines.mil/

==^Åèìáëáíáçå=oÉëÉ~êÅÜ=mêçÖê~ã=do^ar^qb=p`elli=lc=_rpfkbpp=C=mr_if`=mlif`v= = - 102 - k^s^i=mlpqdo^ar^qb=p`elli=
THIS PAGE INTENTIONALLY LEFT BLANK

=^Åèìáëáíáçå=oÉëÉ~êÅÜ=mêçÖê~ã=do^ar^qb=p`elli=lc=_rpfkbpp=C=mr_if`=mlif`v= = k^s^i=mlpqdo^ar^qb=p`elli=
2003 - 2011 Sponsored Research Topics
Acquisition Management
Acquiring Combat Capability via Public-Private Partnerships (PPPs)
BCA: Contractor vs. Organic Growth
Defense Industry Consolidation
EU-US Defense Industrial Relationships
Knowledge Value Added (KVA) + Real Options (RO) Applied to Shipyard Planning Processes
Managing the Services Supply Chain
MOSA Contracting Implications
Portfolio Optimization via KVA + RO
Private Military Sector
Software Requirements for OA
Spiral Development
Strategy for Defense Acquisition Research
The Software, Hardware Asset Reuse Enterprise (SHARE) repository
Contract Management
Commodity Sourcing Strategies
Contracting Government Procurement Functions
Contractors in 21st-century Combat Zone
Joint Contingency Contracting
Model for Optimizing Contingency Contracting, Planning and Execution
Navy Contract Writing Guide
Past Performance in Source Selection
Strategic Contingency Contracting
Transforming DoD Contract Closeout
USAF Energy Savings Performance Contracts
USAF IT Commodity Council
USMC Contingency Contracting
=^Åèìáëáíáçå=oÉëÉ~êÅÜ=mêçÖê~ã=do^ar^qb=p`elli=lc=_rpfkbpp=C=mr_if`=mlif`v= = k^s^i=mlpqdo^ar^qb=p`elli=
Financial Management
Acquisitions via Leasing: MPS case
Budget Scoring
Budgeting for Capabilities-based Planning
Capital Budgeting for the DoD
Energy Saving Contracts/DoD Mobile Assets
Financing DoD Budget via PPPs
Lessons from Private Sector Capital Budgeting for DoD Acquisition Budgeting Reform
PPPs and Government Financing
ROI of Information Warfare Systems
Special Termination Liability in MDAPs
Strategic Sourcing
Transaction Cost Economics (TCE) to Improve Cost Estimates
Human Resources
Indefinite Reenlistment
Individual Augmentation
Learning Management Systems
Moral Conduct Waivers and First-term Attrition
Retention
The Navy’s Selective Reenlistment Bonus (SRB) Management System
Tuition Assistance
Logistics Management
Analysis of LAV Depot Maintenance
Army LOG MOD
ASDS Product Support Analysis
Cold-chain Logistics
Contractors Supporting Military Operations
Diffusion/Variability on Vendor Performance Evaluation
Evolutionary Acquisition
Lean Six Sigma to Reduce Costs and Improve Readiness
=^Åèìáëáíáçå=oÉëÉ~êÅÜ=mêçÖê~ã=do^ar^qb=p`elli=lc=_rpfkbpp=C=mr_if`=mlif`v= = k^s^i=mlpqdo^ar^qb=p`elli=
Naval Aviation Maintenance and Process Improvement (2)
Optimizing CIWS Lifecycle Support (LCS)
Outsourcing the Pearl Harbor MK-48 Intermediate Maintenance Activity
Pallet Management System
PBL (4)
Privatization-NOSL/NAWCI
RFID (6)
Risk Analysis for Performance-based Logistics
R-TOC AEGIS Microwave Power Tubes
Sense-and-Respond Logistics Network
Strategic Sourcing
Program Management
Building Collaborative Capacity
Business Process Reengineering (BPR) for LCS Mission Module Acquisition
Collaborative IT Tools Leveraging Competence
Contractor vs. Organic Support
Knowledge, Responsibilities and Decision Rights in MDAPs
KVA Applied to AEGIS and SSDS
Managing the Service Supply Chain
Measuring Uncertainty in Earned Value
Organizational Modeling and Simulation
Public-Private Partnership
Terminating Your Own Program
Utilizing Collaborative and Three-dimensional Imaging Technology
A complete listing and electronic copies of published research are available on our website: www.acquisitionresearch.net

=^Åèìáëáíáçå=oÉëÉ~êÅÜ=mêçÖê~ã=do^ar^qb=p`elli=lc=_rpfkbpp=C=mr_if`=mlif`v= = k^s^i=mlpqdo^ar^qb=p`elli=
THIS PAGE INTENTIONALLY LEFT BLANK

^Åèìáëáíáçå=êÉëÉ~êÅÜ=mêçÖê~ã=dê~Çì~íÉ=ëÅÜççä=çÑ=ÄìëáåÉëë=C=éìÄäáÅ=éçäáÅó=k~î~ä=éçëíÖê~Çì~íÉ=ëÅÜççä=RRR=avbo=ol^aI=fkdboplii=e^ii=jlkqbobvI=`^ifclokf^=VPVQP=
www.acquisitionresearch.net
![MIMR d'tvr X9—fa ZOZOMARINE STADIUM 311 WED vs [13:00] … · 2020-03-04 · MIMR d'tvr X9—fa ZOZOMARINE STADIUM 311 WED vs [13:00] 2020 CHIBA LOTTE MARINES SAT vs [13:00] SUN](https://img.pdfslide.net/doc/110x75/5f368eeb5cfe0668cc0391bf/mimr-dtvr-x9afa-zozomarine-stadium-311-wed-vs-1300-2020-03-04-mimr-dtvr.jpg)