Embed Size (px)
Citation preview

1
STUDY INTO THE IMPACT OF THE SUPPLY VOLTAGE ON THE MAINS
SUPPLIED INDUCTION MACHINE DRIVE SYSTEMS
A dissertation submitted to the University of Manchester for the degree of MSc in
the Faculty of Engineering and Physical Sciences
2011
ABDUL REHMAN ISHFAQ
School of Electrical and Electronic Engineering
Supervisor: Dr Nigel Schofield

2
TABLE OF CONTENTS
1. Introduction………………………………………………………………….. 9
1.1.Aims……………………………………………………………………… 9
1.2. Review of Overvoltage problem and its effect on domestic appliances……… 9
1.3. Voltage Optimisation………………………………………………………….. 12
1.4. Motivation…………………………………………………………………….. 14
1.5. Thesis Structure………………………………………………………………. 14
2. Project Devices, Software and Setup………………………………………... 16
2.1. Devices and their functions………………………………………………….. 16
2.2. Software programmes……………………………………………………….. 19
2.3. Experimental Setup…………………………………………………………... 19
2.4. Wiring Diagram………………………………………………………………. 22
3. Methodology…………………………………………………………………... 25
3.1. Experimental Limitations……………………………………………………. 25
3.2. Experimental Methodology………………………………………………….. 28
4. Experimental Observations………………………………………………….. 33
4.1. Experiment at 270V………………………………………………………….. 33
5. Analysis of Results…………………………………………………………… 39
5.1. Motor Temperature………………………………………………………….. 39
5.2. Freezer Temperature………………………………………………………… 39
5.3. Current………………………………………………………………………... 41
5.4. Power Consumption………………………………………………………….. 42
5.5. Apparent Power………………………………………………………………. 43
5.6. Power Factor…………………………………………………………………. 43
5.7. Reactive Power……………………………………………………………….. 43
5.8. Supply Voltage………………………………………………………………... 44
5.9. Trend of Motor Parameters…………………………………………………. 45
6. Analytical Analysis…………………………………………………………… 48
6.1. Electrical data and Equivalent circuit……………………………………… 48
6.2. Equations……………………………………………………………………… 49
6.3. Torque-Speed Characteristics………………………………………………. 54
7. Conclusions…………………………………………………………………… 55

3
LIST OF FIGURES
Figure 1: Overvoltage Supply…………………………………………………… 11
Figure 2: Difference between voltage optimiser and step-down transformer…… 13
Figure 3: VPhase voltage optimiser……………………………………………... 13
Figure 4: How VPhase works…………………………………………………… 14
Figure 5: Inside of VPhase voltage optimiser…………………………………… 18
Figure 6: Experimental Setup Part-I…………………………………………….. 19
Figure 7: Voltage and Current Transducer Circuits…………………………....... 20
Figure 8: Experimental Setup Part-II………………………………………….... 21
Figure 9: NI-9211 and its temperature sensing and interface equipment………... 22
Figure 10:Wiring Diagram for voltage and current measurement………………... 23
Figure 11:Wiring diagram for temperature measurements………………………. 23
Figure 12:Wiring diagram for VPhase and VARIAC…………………………. .. 23
Figure 13:Motor case at the back of the freezer………………………………..... 24
Figure 14:Domestic Freezer……………………………………………………… 28
Figure 15:Temperature-time profile of domestic freezer……………………….. 29
Figure 16:Mains voltage fluctuations…………………………………………… 31
Figure 17:Motor temperature at 270V…………………………………………... 33
Figure 18:Freezer temperature at 270V………………………………………..... 34
Figure 19:Ambient/Room temperature………………………………………….. 34
Figure 20:270V Supply voltage………………………………………………….. 35
Figure 21:Current drawn at 270V………………………………………………. 35
Figure 22:Power consumption at 270V………………………………………… 36
Figure 23:Apparent Power at 270V…………………………………………….. 36
Figure 24:Power Factor at 270V………………………………………………... 37
Figure 25:Reactive Power at 270V……………………………………………… 37
Figure 26:Motor temperature at different voltages……………………………... 39
Figure 27:Encircled area of motor temperature…………………………………. 39
Figure 28:Freezer temperature at different temperature……………………...... 40
Figure 29:Encircled area of freezer temperature……………………………….. 40
Figure 30:Current Drawn at different voltages………………………………..... 41
Figure 31:Power consumption at different voltages……………………………. 42
Figure 32:Apparent power at different voltages………………………………… 43
Figure 33:Power factor at different voltages……………………………………. 43
Figure 34:Reactive power at different voltages…………………………………. 44
Figure 35:Different supply voltages……………………………………………... 44
Figure 36:Parameters Trendline…………………………………………………. 47
Figure 37:Equivalent Circuit of Induction motor……………………………….. 48
Figure 38:Equivalent Circuit with values……………………………………….. 49
Figure 39:Power flow diagram…………………………………………………... 49
Figure 40:Equivalent Circuit with combined rotor & magnetizing impedance……… 50
Figure 41:bar chart representing losses at different voltages…………………… 53
Figure 42:Torque-Speed characteristics………………………………………… 54
Figure 43:Comparison between Mains and VPhase for all parameters………… 56

4
ABSTRACT:
It is a well-known fact that always the middle path, which is the way of balance, should
be followed. For example in a human body a certain level of sugar is required. If the
sugar exceeds or drops below that level, it can cause complications. This case is the same
for electrical machines as well. The electric machine (human body) needs a certain level
of supply voltage (sugar) to operate well otherwise, it will cause complications.
It is very important that the electrical power which the appliances are subjected to, needs
to be at their rated value. This is because the performance of the appliance is optimum
only at its designated value. Unfortunately, in the UK, the electric appliances are supplied
with voltage higher than their required value which is wasting a considerable amount of
energy, deteriorating the performance of the electric appliances and is proving very costly
for electricity consumers.
Voltage optimisation, which is an energy-saving technique, is considered as an optimum
solution for the problem of overvoltage. Its definition is reducing and stabilising the
supply voltage to the equipment rated value. VPhase, an AIM listed company in Chester,
develops these voltage optimisation devices for domestic sectors in the UK. Their voltage
optimisers are now being extensively used in both the industrial and the domestic sectors
saving big businesses millions in reduced electricity bills.
This problem of overvoltage and the effect of voltage optimisation on the domestic
appliances will be investigated in this project. In order to determine the effects of the
overvoltage, several experiments at different supply voltages and one using VPhase
voltage optimiser will be carried out on one domestic freezer, which is one of the most
commonly used domestic appliance.
For every experiment, the motor parameters such as temperature, power consumption,
current drawn etc. will be measured. In the end, the parameter values for all the
experiments will be analysed in order to determine the benefit of voltage optimisation for
domestic appliances.

5
DECLARATION:
No portion of the work referred to in the dissertation has been submitted in support of an
application for another degree or qualification of this or any other university or other
institute of learning.

6
INTELLECTUAL PROPERTY STATEMENT:
i. The author of this dissertation (including any appendices and/or schedules to
this dissertation) owns certain copyright or related rights in it (the
“Copyright”) and s/he has given The University of Manchester certain rights
to use such Copyright, including for administrative purposes.
ii. Copies of this dissertation, either in full or in extracts and whether in hard or
electronic copy, may be made only in accordance with the Copyright, Designs
and Patents Act 1988 (as amended) and regulations issued under it or, where
appropriate, in accordance with licensing agreements which the University has
entered into. This page must form part of any such copies made.
iii. The ownership of certain Copyright, patents, designs, trademarks and other
intellectual property (the “Intellectual Property”) and any reproductions of
copyright works in the dissertation, for example graphs and tables
(“Reproductions”), which may be described in this dissertation, may not be
owned by the author and may be owned by third parties. Such Intellectual
Property and Reproductions cannot and must not be made available for use
without the prior written permission of the owner(s) of the relevant
Intellectual Property and/or Reproductions.
iv. Further information on the conditions under which disclosure, publication and
commercialisation of this dissertation, the Copyright and any Intellectual
Property and/or Reproductions described in it may take place is available in
the University IP Policy (see
http://documents.manchester.ac.uk/display.aspx?DocID=487), in any relevant
Dissertation restriction declarations deposited in the University Library, The
University Library’s regulations (see
http://www.manchester.ac.uk/library/aboutus/regulations) and in The
University’s Guidance for the Presentation of Dissertations.

7
To my family and supervisor for their support and help in all of my academic pursuits.

8
ACKNOWLEDGEMENTS
I would like to thank all my teachers and friends for their help and mentorship,
their continued support and assistance during my whole MSc course.
I would especially like to thank my supervisor, Dr. Nigel Schofield for all his
help. He has been a source of inspiration and support during the course of my research. I
have learnt a lot from him and his experience and he has always been there to help me out
whenever I needed help. I would like to thank him for his assistance in helping me write
this thesis as well.
I would also like to thank Dr. Stephen Mangan from the VPhase Company for
providing me with the equipment for my dissertation.
In the end I would like to thank all my family for their continued support and
prayers in all my endeavours without which all of this could not be possible.

9
CHAPTER 1: INTRODUCTION
1.1. AIMS
The aims of this project are to:
i) Study the effects of mains supply voltage on single-phase induction motor.
ii) To investigate the motor’s performance at different supply voltages.
iii) To determine the advantages of reducing and stabilising the supply voltage
using a Voltage Optimiser and
iv) Compare and analyse the motor’s performance at different voltages in order to
find out the benefits of Voltage Optimiser.
1.2. REVIEW OF OVERVOLTAGE PROBLEM AND ITS EFFECT ON
DOMESTIC APPLIANCES
In order to introduce the problem of overvoltage it is important to know the background
which will help understand why this problem has gained the attention of many utility
suppliers and consumer. A considerable amount of literature has been published on this
topic, some of which is mentioned below.
“Electrical power is an important raw material for all industrial and commercial operations
and, like any other raw material, the quality of supply is very important. This ‘quality of
supply’ is a very significant issue that is becoming increasingly important to electricity
consumers at all levels of usage. Both electric utilities and end users of electric power are
becoming increasingly concerned about the quality of electric power. The main reason for
increased concern about the quality of electric power is the continued push for increasing
productivity for all utility customers. Manufacturers want faster, more productive, more
efficient machinery. Utilities encourage this effort because it helps their customers become
more profitable and also helps defer large investments in substations and generation by
using more efficient load equipment. Interestingly, the equipment installed to increase the
10
productivity is also often the equipment that suffers the most from common power
disruptions. And the equipment is sometimes the source of additional power quality
problems. When entire processes are automated, the efficient operation of machines and
their controls becomes increasingly dependent on quality of power.” [1].
“Various sources use the term "power quality" with different meaning. It is used
synonymously with "supply reliability," "service quality," "voltage quality," "current
quality," "quality of supply," and "quality of consumption." Judging by the different
definitions, power quality is generally meant to express the quality of voltage and/or the
quality of current and can be defined as:
“The measure, analysis, and improvement of the bus voltage to maintain a sinusoidal
waveform at rated voltage and frequency”.
This definition includes all momentary and steady-state phenomena [2]”. It is evident from
the above definition that it is the quality of the supply voltage that plays a vital role in the
performance of various domestic appliances. “Ideally, the best electrical supply would be a
constant magnitude and frequency sinusoidal voltage waveform. If the quality of the
supply voltage is good, then any loads connected to it will run satisfactory and efficiently
and installation running costs and carbon footprint will be minimal. However, if the loads
are subjected to a poor supply voltage then either, they will fail prematurely or will have a
reduced lifetime. The efficiency of the electrical installation will also reduce.
The question that arises, is the quality of the supply voltage in the UK for domestic
appliances, optimal and problem-free? “Following European harmonisation in 1995, the
declared electricity supply in the UK became 230V nominal, +10% to -6%, so supply
voltage could be anywhere between 216V and 253V depending on local conditions. The
European standard covering the UK (EN 50160:2007) now says that the permissible range
is 230±10%, making the range between 207V to 253V. Most electrical equipment,
designed to work for the whole European market, actually has an optimum operating
level of 220V, as this was the nominal supply level prior to 1995. Yet in practice over
90% of sites in the UK continue to receive voltage at the historic average level of 242V -
and will continue to do so because the design of the supply infrastructure cannot easily be

11
changed. Thus it has come into recognition that the UK has a national problem of
overvoltage.
Figure 1. Overvoltage supply
Generally when we plug in to the mains supply we don't give a second thought as to how
this overvoltage might affect the efficiency of the electrical equipment we connect”[3]. It
is also taken for granted that since magnitude of the supply voltage in the UK (i.e.242V)
falls within the tolerance band (207V to 253V), so subjecting equipment to that level of
overvoltage is acceptable. In fact, the purpose of these bands is to accommodate the normal
hour-to-hour swings in plant voltage. Operation on a continuous basis at either the high or
low extreme puts unnecessary stress on the motor.
The impact of this overvoltage on the performance of domestic appliances is also well-
known. The equipment that is effected the most is the single-phase induction motors
(SPIM) which are extensively used in domestic appliances (e.g. in washing machines,
fridges, freezers etc.). As it is mentioned above, the optimum operating level for most
electrical equipment is 220V so when single-phase induction motors are supplied with a
voltage higher than its rated value, it can lead to several problems, some of which are
discussed below.
i) Overvoltage causes a reduction in equipment lifetime and increases in energy
consumed with no improvement in performance.
ii) Excessive overvoltage results in saturation of the iron core, wasting energy
through eddy currents and increased hysteresis losses.
iii) Drawing excessive current results in excess heat output due to copper losses. The
additional stress of overvoltage on motors will decrease motor lifetime.

12
iv) Avoiding overvoltage high enough to cause saturation does not reduce efficiency
so substantial energy savings can be made through reducing iron and copper losses.
v) Reducing voltage to an induction motor reduces the motor flux which results in
reduced core loss and also in reduced stator copper loss since the magnetizing
component of stator current is reduced. The motor speed will be affected, but speed
is mainly a function of supply frequency and number of poles [4].
Therefore it is very important to solve the problem of overvoltage in order to optimize the
performance and energy-savings of domestic appliances.
1.3. VOLTAGE OPTIMIZATION
The problem of overvoltage mentioned above, has been overlooked both as a problem and
an opportunity. No attention has been paid to the problems that it causes to the equipment
or the amount of energy that is wasted. “It bears resemblance to using a sledgehammer to
crack a nut. In terms of overvoltage, it is like using an electric sledgehammer (supply
voltage) to crack an electric nut (appliance). Using too much force where only a little
would do obviously wastes energy, costs more money and shortens the life of equipment
but this is something that is happening and is not given any consideration” [5].
The only real way to address this issue is to step-down the voltage locally, to ensure site-
by-site that energy using equipment is receiving the correct and rated voltage in order to
maximise their efficiency and lifespan. Voltage optimisation is a term that does just that.
“It refers to the well-known energy-saving technique of reducing the voltage to the
equipment’s rated value in order to reduce losses and save energy. It is one of the most
efficient ways of overcoming the problem of overvoltage and has recently received
increasing interest as an effective means of reducing electricity bills, with considerable
savings being realised on many domestic sites”[3].
Voltage optimisers, also known as voltage regulators, not just bring the voltage down to a
certain level as an ordinary step-down transformer does, but also try to stabilize the
voltage. Normally, the supply voltage at mains in domestic sector is not only at a higher

13
level, but it is also non-sinusoidal and contains a lot of fluctuations or variations. This
worsens the situation for the appliances that not only they are subjected to a high voltage,
they also have to cope with the problems caused by impure and unsteady supply voltage.
Thus the energy savings using a voltage optimiser is greater than a simple step-down
transformer. The following figure shows an example illustrating the key differences
between the two methods.
Figure 2. Difference between a voltage optimiser and a step-down transformer [6]
VPhase, which is based in Chester and is AIM listed, is a company which is sponsoring
this project. It is an energy technology company that has developed a patented voltage
optimisation technology that tests have shown delivers tangible benefits in domestic
installations.
Figure 3. VPhase Voltage optimiser

14
The technology has been independently trialled and tested, ensuring that the claimed
energy savings are certainly achievable in the majority of households throughout the UK.
Figure 4. How VPhase Voltage optimiser works[7]
VPhase is committed to raising the awareness of voltage optimisation technology and
firmly placing it on the green agenda as a viable alternative energy technology. They are
currently selling the unit based on the energy saving potential to the consumer, but are also
aware that voltage optimization will also extend the lifetime of appliances [7].
1.4. MOTIVATION
The motivation of this project is to find out how much beneficial the voltage optimisers are
for the domestic equipment. What is the reason behind their increased energy-savings?
How is the performance of the single-phase induction motor improved with the optimized
voltage? Several experiments will be conducted at different voltages. Comparing and
analysing the motor parameters’ values for the two experiments will determine the
significance and benefit of voltage optimization for domestic appliances.
1.5. THESIS STRUCTURE
Chapter 1: This chapter has given some background on overvoltage problem in the UK
and voltage optimisation. It also highlights the beneficial effects of voltage optimisation on
domestic appliances.
Chapter 2: This chapter is all about the devices used and their functions. It also details the
experimental setup and wiring diagrams.

15
Chapter 3: This chapter is about the way the experiment will be conducted. It tells about
the methodology of the experiment, for instance how many experiments will be carried
out? How they will be carried out etc.
Chapter 4: This chapter shows the measurements obtained from the experiments. It
contains graphs and tables detailing the maximum, minimum or the average values of the
motor parameters over a certain time period.
Chapter 5: The analysis of the results from the experiments will be discussed in this
chapter. This chapter will usually contain waveforms of all the parameters. One parameter
e.g. temperature, will have the measurements from all experiments shown in one graph.
This is done in order to conveniently examine the differences in the parameters and
whether it is beneficial for the equipment or not. It also contains the trend of the
parameters with respect to voltage.
Chapter 6: The analytical section. This will contain some mathematical expressions used
to determine stator and rotor losses. This is just to give a little overview as how the
temperature of the motor rises at high voltages. The data will be taken from Electric
Machinery Fundamentals book by Stephen Chapman.
Chapter 7: This chapter is about conclusions. After analysing the results obtained from the
experiments, we will explain that how voltage optimisation benefits domestic appliances.
What is the overall effect of reducing the voltage of the equipment to its rated value by
using the voltage optimisers?
16
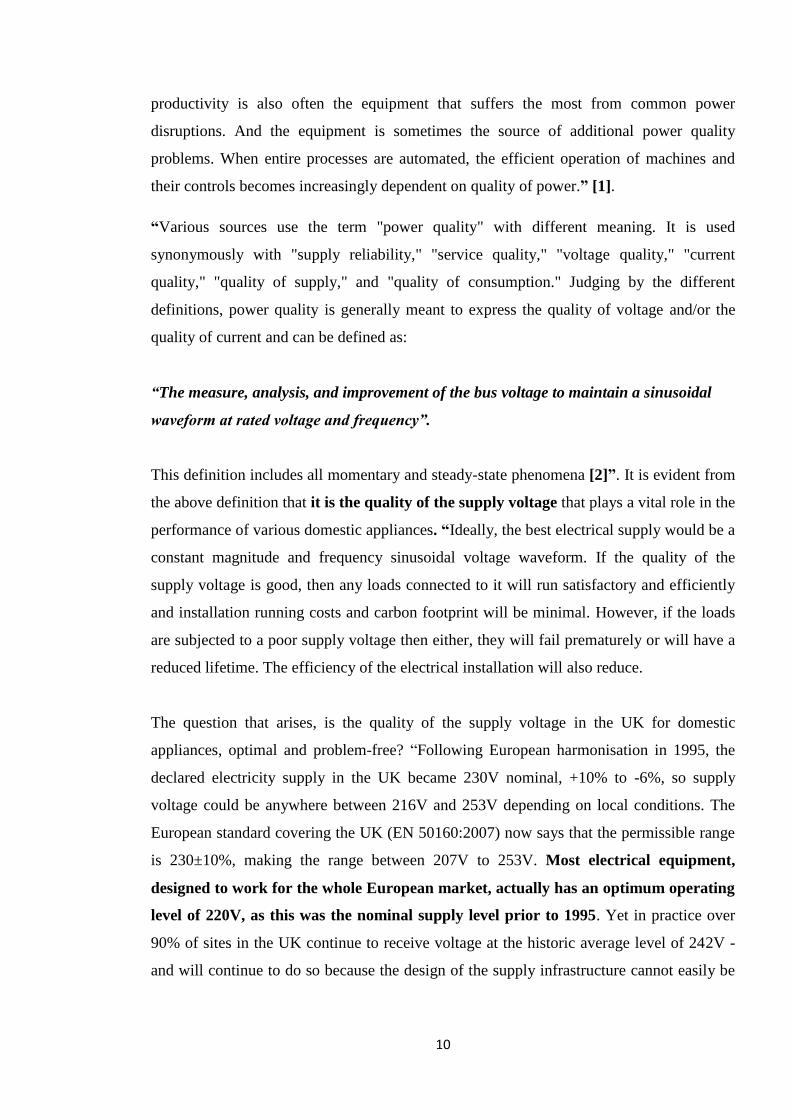
CHAPTER 2: PROJECT DEVICES, SOFTWARES AND SETUP
This chapter is about the devices that will be used to carry out the experiment and how are
they setup. Several devices are used to measure different motor parameters. The figures of
the devices are shown in Appendix section.
2.1. DEVICES AND THEIR FUNCTIONS
i) National Instruments NI-9211 Thermocouple
The NI-9211 Thermocouple is used for high accuracy thermocouple measurements. For
this project, this device is used to measure temperature. It uses type-K thermocouple
interface equipment.
For this project, it will be used to measure;
a) Motor’s Temperature
b) Inside temperature of the freezer
c) Ambient/Room temperature
ii) DENT Instruments Elite Pro Power Meter
The DENT Instruments Elite pro power meter is a device that will be used for this project
to measure the voltage, current, power consumption, power factor, reactive and apparent
power. For voltage measurement, it has three live channels and one neutral. Since this
project deals with single-phase induction motor therefore, only one live channel will be
used along with the neutral.
iii) DENT Instruments 50 Amp Split-core Current Transformer
The DENT Instruments current transformer is used to measure the current drawn by the
load. It measures the current by passing current carrying live wire through its core.

17
The black (negative) and white (positive) wires of the current transformer are connected to
the DENT Elite Pro Power meter.
iv) 2 LEM LV-25P Voltage Transducers
Two voltage transducers have been used for this project. They are used as an alternative to
DENT data logger for voltage measurement. One voltage transducer is used to display the
mains supply voltage while the other is for displaying the voltage of either VPhase voltage
optimiser or the VARIAC (variable autotransformer).
v) 2 LEM LA-55P Current Transducers
These devices are almost similar to the DENT split-core current transformer. Their purpose
for this project is measure the current drawn by the load (freezer). This is also achieved by
passing current carrying live wire through their core.
Both voltage and current transducers are actually used as another means of measuring
voltage and current.
vi) National Instruments USB-6008
The National Instruments USB-6008 provides basic data acquisition functionality for
applications such as simple data logging, portable measurements, and academic lab
experiments. It can acquire/generate analog and digital signals. For the purpose of this
project, it is used to acquire the output of voltage and current transducers and display them
graphically on Lab view software.
vii) A VARIAC
A variac is a variable auto-transformer. The purpose of using it is to test the motor’s
performance and measure its parameters at different voltages ranging from 230V to 270V.

18
viii) VPhase Voltage Optimiser
The VPhase voltage optimiser as shown in fig.3 is a voltage optimisation unit supplied by
VPhase Company. The purpose of using it is to test how beneficial voltage
optimisers/regulators are for domestic appliances. What amount of savings is achieved? In
the first part of the experiment, the motors will be supplied with the mains voltage
(i.e.242V) and in the second part, the VPhase voltage optimiser will be used to reduce and
stabilize the mains supply and test its effect on motor’s performance. The comparison of
the mains and VPhase voltage optimiser will determine the benefits of voltage
optimisation.
Figure 5. Inside of VPhase Voltage Optimiser
Step-down Transformer
Power electronics circuits that stabilize the fluctuations of the mains supply
Output (220V) Input (mains)

19
2.2. SOFTWARE PROGRAMMES
Two softwares have been used for this project.
i) LabView Software for displaying and copying temperature, voltage and current
measurements using thermocouple, voltage and current transducers
respectively.
ii) ELOG Pro 2004 Software used by DENT data logger for measuring voltage,
current, real, reactive and apparent power, and power factor.
2.3. EXPERIMENTAL SETUP
The device setup and the wiring diagram are shown below.
Figure 6. Experimental Setup Part-I
This is one part of the experiment setup while the other part which contains DATA logger
and thermocouple will be shown later. The above diagram has numbers shown which are
described below.
1- The white box which contains voltage and current transducers circuits.
2- The VPhase Voltage optimiser
1
2
3
4
5
6
7
8
9
10
11

20
3- DC power supply which is used to power up voltage and current transducers.
4- Switch board which is connected to the output of VARIAC. It will have voltages
ranging from 230V-270V.
5- Switch board which is connected to plug (number 10) via voltage transducer
circuit.
6- VARIAC
7- Switch board which is connected to the output of VPhase voltage optimiser.
8- Digital multimeter for displaying the voltage of VARIAC.
9- NI-USB 6008 which has several wires connected to it. These wires come out of the
white box and are actually the output of voltage and current transducers.
10- This is the plug which is connected to either VARIAC output socket board (number
4) or VPhase voltage optimiser output socket board (number 7).
11- The mains supply socket board. This is connected to the mains supply via one
voltage transducer circuit.
Figure 7. Voltage and current transducers circuits
In the above figure, there are two circuits. One is connected to the mains (242V)
while the other can be connected to the output of either VARIAC or VPhase
voltage optimiser.

21
Figure 8. Experimental Setup Part-II
This is the other part of the setup which contains DATA logger and the thermocouple. The
data logger shown has two connections, one is connected to a socket board for voltage
measurement, and for current measurement, for which the logger uses current transformer.
When both voltage and current are present, the logger calculates the power factor and the
real, apparent and reactive power.
The figure also shows NI-9211 thermocouple which uses three channels using K-type
thermocouple interface equipment. One channel connected to motor terminal, one for
ambient/room temperature and one going inside the freezer.
Figure 9. NI-9211 and its Temperature sensing and Interface Equipment
Figure 6 to figure 9 shown above represent the complete experimental setup. The figure of
all the devices used will be shown in appendix section.
(a) (b) (c)
22
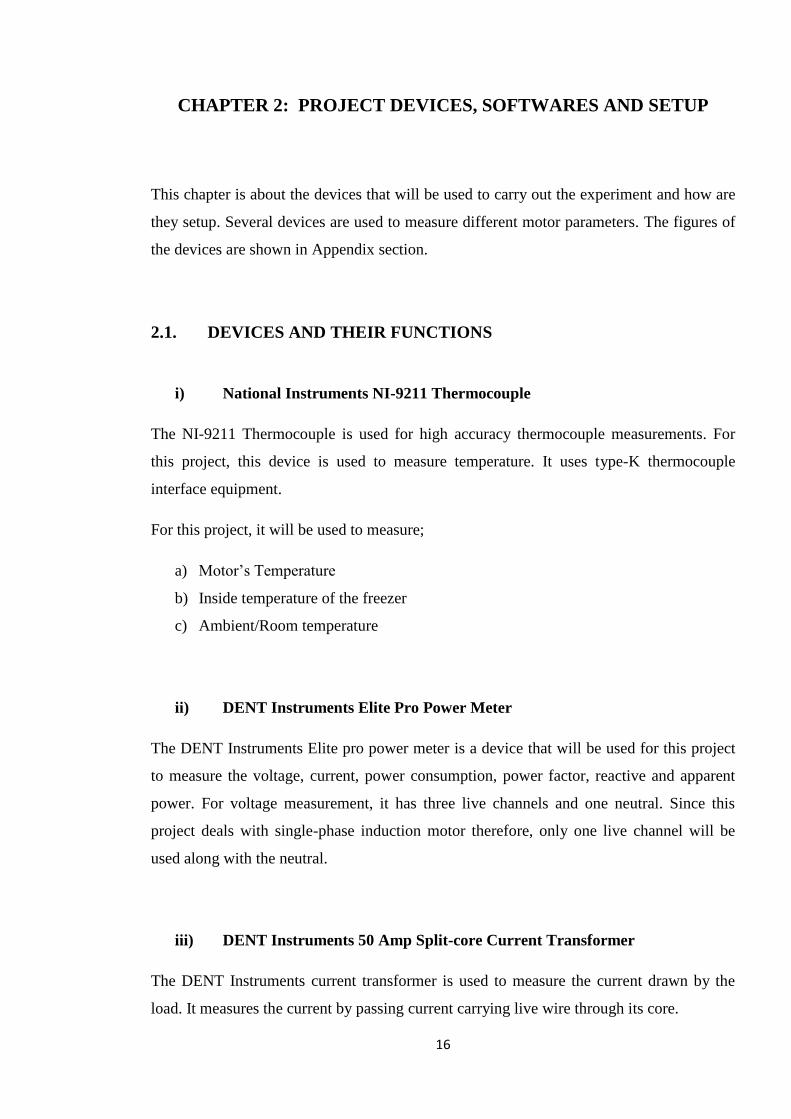
2.4. WIRING DIAGRAM
Figure 10. Wiring diagram for voltage and current measurements only
The wiring diagram shown above shows the connection of voltage and current transducers
and DENT data logger only. The above figure shows that one circuit containing voltage
and current transducer is connected to the mains supply socket board and the other circuit
is connected to the socket board whose voltage is dependent upon the connection of its
plug. The voltage and current measured by voltage and current transducers respectively, is
acquired by the NI-USB 6008 in order to display it on Labview.
The DENT data logger’s plug is connected to a socket board for voltage measurement. For
instance, if it is connected to the mains supply socket board, the logger will show mains
supply voltage. The logger measures the current using current transformer. This current
transformer passes the live wire of the load (freezer) through its core as shown above. The
current measured is acquired by the data logger which in turn uses both voltage and current
to calculate power factor and real, reactive and apparent power.
23
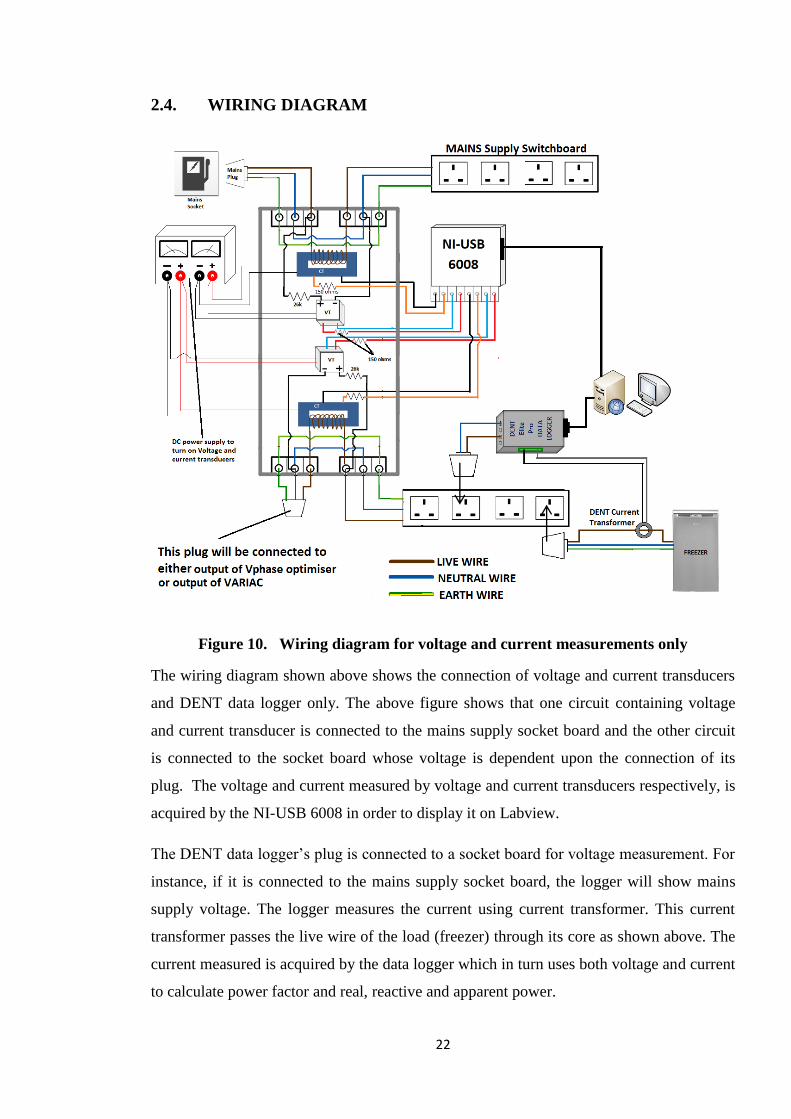
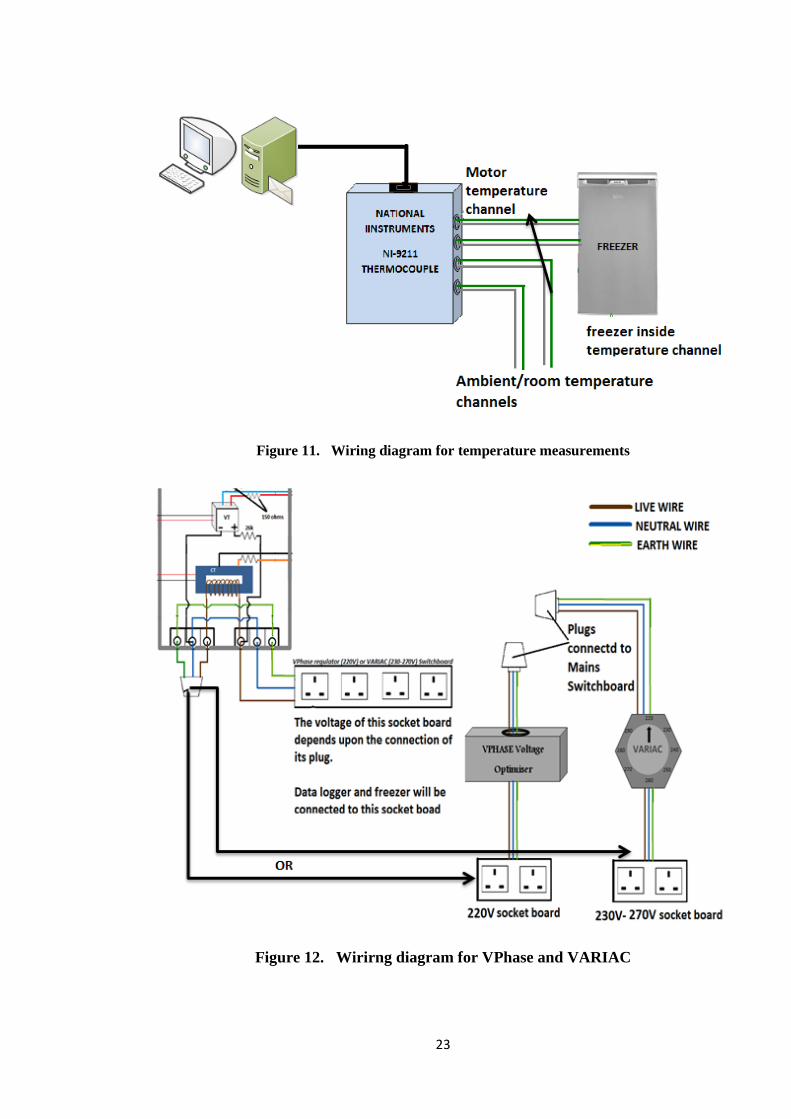
Figure 11. Wiring diagram for temperature measurements
Figure 12. Wirirng diagram for VPhase and VARIAC

24
The above diagram tries to clarify the connection of the socket board which is connected to
one voltage and current transducer circuit and whose voltage depends upon the connection
of its plug. When we are investigating the performance of motor with VPhase voltage
optimiser, then the plug will be connected to the VPhase output socket board (220V).
Thus the socket board which the freezer and data logger are connected to, will have 220V.
But if we are determining motor’s performance at different voltages, then the plug will be
connected to the VARIAC output socket board.
More explanation of the voltage and current transducers circuits and how they measure
their respective parameters, the lab view programmes that are used to display voltage and
current will be shown in Appendix section.

25
CHAPTER 3: METHODOLOGY
This chapter will explain the methodology of the experiment and how it is carried out.
Some part of the experiment has already been explained in the previous chapters regarding
the devices and their usage. This chapter is composed of two sections which are explained
below.
3.1. EXPERIMENT LIMITATIONS
The experiment for the project has several limitations related to the equipment being used
for it. The limitations are related to the temperature measurement, the output power and the
electrical data of the motor.
i) Temperature measurement of the motor
The temperature is the most important parameter of this project. Since it is temperature
which is one of the key factors that determine the losses in the motor and the difference in
the temperature defines the difference in the magnitude of losses, therefore temperature has
to be measured accurately in order to prove the advantages of voltage optimisation. The
higher the losses, the hotter the motor becomes and higher the temperature. Similarly, the
lower the losses, the cooler the motor and lower the temperature.
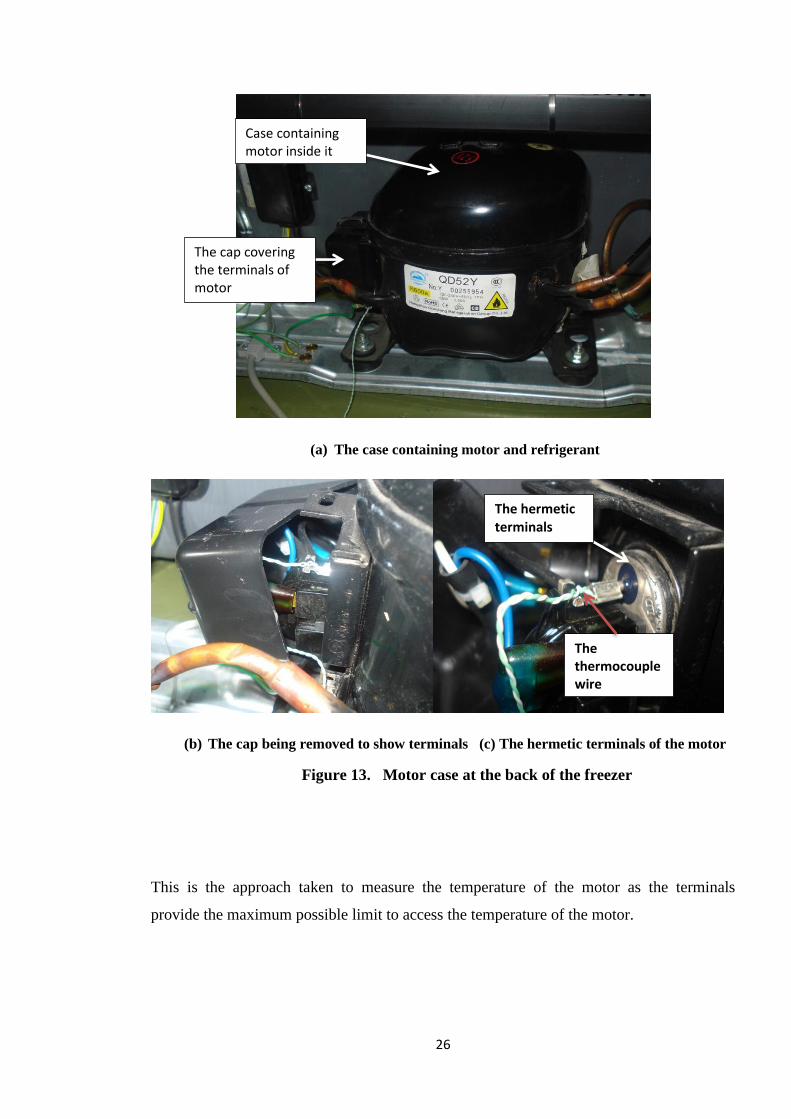
The temperature that is usually measured is from the inside of the motor i.e. the stator
windings, the core etc. In case of freezers and refrigerators, the motor is actually packed
inside a case along with its refrigerant. This case is at the back of the freezer. It is apparent
that opening the case will cause the refrigerant to come out and hence the freezer will fail
to function. So the obvious approach was to find the terminals of the motor since they will
have the highest temperature and because it is the closest access to the motor which is
packed inside. So the thermocouple wire is connected to the terminals as it is the only part
which is available outside. The following figures will show the terminals of the motor and
the connection of thermocouple wire. The following figure shows the case which contains
the motor and the refrigerant.
26
(a) The case containing motor and refrigerant
(b) The cap being removed to show terminals (c) The hermetic terminals of the motor
Figure 13. Motor case at the back of the freezer
This is the approach taken to measure the temperature of the motor as the terminals
provide the maximum possible limit to access the temperature of the motor.
Case containing motor inside it
The cap covering the terminals of motor
The hermetic terminals
The thermocouple wire

27
ii) The output power of the motor
The output power of the motor is another important factor which can be used to determine
the magnitude of losses in the motor as it is evident from the equation;
(3.1)
and
(3.2)
Usually, the output power is measured using a dynamometer. It consists of an absorption
unit and usually includes a means for measuring torque and rotational speed. An absorption
unit consists of some type of rotor in a housing which is coupled to the rotor of the motor.
As it is mentioned above, the motor is inside the case and it is not possible to have access
to its shaft so it is not possible to measure the output power using a dynamometer.
The way to find out the output power is to know the useful work that the motor does. The
motors of the freezers compress the refrigerant after which it goes through condensation,
expansion and evaporation. But the only work done by the motor is compression. The
greater the compression, the cooler the inside temperature of the freezer. This gives an
indication of the motor’s output power since the motor has to perform more compression in
order to achieve the lowest temperature hence its output power is greater.
The consideration of the freezer’s inside temperature is only an indication of the output
power. The magnitude of the output power is still unknown. Nevertheless, it is useful
because the motor takes certain amount of input power, perform compression and cools the
inside temperature of the freezer. So any variation in the supply voltage can affect the
compression of the motor and thus vary the freezer’s inside temperature. This variation of
the inside temperature will give an indication of the changing output power.

28
iii) The Electrical data of the motor
This is another limitation which prevents from calculating the losses, the torque, the output
power and other parameters of the motor analytically. The electrical data of the motor is
extremely important in measuring important parameters of both stator and rotor.
The only important data that is given for this project is the input power, power
consumption and the rated current. But there is no stator, magnetizing and rotor
inductances or resistances which are important in measuring losses and output power.
(a) Outside view (b) Nameplate data (c) Thermostat control
Figure 14. Domestic Freezer
3.2. EXPERIMENT METHODOLOGY
The experiment for this project consists of several parts. Most of the functions of the
devices used have already been explained in the previous chapters so this section discusses
how the experiments are carried out. What procedures will be used to conduct the
experiment.
The main purpose of the experiments is to determine the motor’s parameters at different
voltages. The performance of the motor using VPhase voltage optimiser is taken as a
reference. All other experiments will be compared to it in order to investigate the
advantages of voltage optimization.
The steps that are taken to perform the experiments are mentioned below.
838mm(L)x483mm(W)x457mm(D)

29
i) The thermostat of the freezer
The thermostat of the freezer is set to SUPER level in order to study the effects of the
voltage on the motor operating at its maximum level. All the experiments will be
conducted with the same thermostat level.
ii) The temperature-time profile of the freezer motor
Before the experiment begins, it is important to understand how the freezer motor works.
Does it remain on all the time, because if it does, then the temperature inside the freezer
may continue to decrease and spoil the food or the temperature of the motor will continue
to rise hence damaging the device or there is a limit to which the motor can perform its
work. These are very important concepts to understand in order to analyse the
measurements we will analyse in later stages. The temperature-time profile of the motor
and inside freezer temperature (output power) is shown below.
Figure 15. Temperature-Time Profile of Domestic freezer

30
The above figure shows four waveforms representing different temperatures. The red and
blue waveforms represent the motor temperature and two channels of the NI-9211
thermocouple. The green waveform represents the room/ambient temperature and one
channel being used for this purpose. The purple waveform represents the freezer’s inside
temperature and again one channel of thermocouple is used here. The x-axis shows the
time in hours when the freezer is on and the y-axis shows the temperature in degree
centigrade. The measurement taken is for 48 hours (2 days) approximately.
The graph shows that when the freezer turns on from ambient state, the motor temperature
begins to rise and the inside temperature begins to drop. A time comes when the motor has
reached its maximum temperature while the freezer has attained its lowest freezing point.
This is the time when the motor turn off and then it enters a steady state.
When the motor operates in a steady-state, it is repeats the same cycle every now and then
i.e. after reaching a certain temperature it turns off and then turns on and this cycle
continues. The same thing happens for the freezer inside temperature as well. When the
minimum freezing point is reached, the operation stops and the temperature begins to rise
and when it reaches a certain level, the motor turns on again. The maximum temperature of
the motor, both in and out of steady-state and the minimum freezing point of the freezer
depends upon the level of the thermostat. If the thermostat is set to lower level the
maximum temperature of the motor will be lower and correspondingly the minimum
freezing point of the freezer will not be that low.
An important point to note here is that this is the temperature-time profile of the freezer
with its door closed at all times. If the door is opened for some time then the inside freezer
temperature will begin to rise and the motor will turn on and start compressing in order to
keep it low and hence the motor comes out of the steady-state.
All the measurements of the motor’s temperature will be taken when it is operating in
steady-state and the values for five hours will be used. This means that the door will
remain closed at all times.

31
iii) Maintaining the supply voltage variation
This is another important aspect of the experiment. Usually the supply voltage at the mains
has a variation of about 5-6 volts. This can have undesirable effect on the motor as it can
cause some change in torque and slip and can affect the process of production of the motor.
This can also cause vibration of the motor which can weaken the mechanical strength of
the motor shaft.
So in order to reduce the effect of the voltage fluctuations an approach is taken that would
require a continuous monitoring of the supply voltage using DENT data loggers ‘Real
Time Voltage Display Function’. This approach is only possible for some experiments. It
can’t be used for measurements for mains supply as it is not controlled by us. Similarly, the
measurements for VPhase also don’t require this continuous monitoring approach as
VPhase automatically tries to maintain a certain voltage level with its power electronic
circuits inside (shown in fig.11).
So only the experiments which will use VARIAC (i.e. 230V to 270V) will use this
continuous monitoring method. In this method the real-time voltage will be observed
continuously for 5 hours and every time there is a variation, the VARIAC voltage will be
adjusted immediately to bring it back to its rated level. The maximum allowable variation
limit is 3V. So if there is a fluctuation outside this limit, the variac voltage will be
increased or decreased to adjust it.
Figure 16. Mains voltage fluctuations

32
The experiments that are done to investigate motor’s performance at different voltage
levels are mentioned below.
i) Experiment at Mains Supply (242V)
ii) Experiment at 230 V (using VARIAC)
iii) Experiment at 240 V (using VARIAC)
iv) Experiment at 250 V (using VARIAC)
v) Experiment at 260 V (using VARIAC)
vi) Experiment at 270 V (using VARIAC)
vii) Experiment using VPhase Voltage Optimiser (reference experiment)
After conducting all the experiments, the parameters’ values and waveforms will be
analysed and compared which will determine the overall effect of reducing and stabilizing
the supply voltage using VPhase voltage optimiser.

33
CHAPTER 4: EXPERIMENTAL OBSERVATIONS
In this chapter, the values of the parameters of all experiments measured will be shown and
calculated.
4.1. EXPERIMENT AT 270 V (USING VARIAC)
4.1.1. Motor Temperature
Figure 17. Motor Temperature at 270V
Table 1. Motor Temperature at 270V
Motor’s Temperature at 270V
Cycle 1 Cycle 2 Cycle 3
Maximum Temperature 74.305 74.91 75.58
Minimum Temperature 46.82 46.92 47.74
Overall Average Temperature
for 5 hours 66.42

34
4.1.2 Freezer Temperature
Figure 18. Freezer Temperature at 270V
Table 2. Freezer Temperature at 270V
4.1.3 Ambient/Room Temperature
Figure 19. Room Temperature
Freezer Inside Temperature at 270V
Cycle 1 Cycle 2 Cycle 3
Maximum Temperature -23.16 -23.05 -23.28
Minimum Temperature -30.46 -30.46 -30.42
Overall Average Temperature
for 5 hours -28.16

35
4.1.4. Voltage
Figure 20. 270V Supply Voltage
The voltage variation is kept between 3 volts (269-272V).
4.1.5. Current
Figure 21. Current drwan at 270V
Current(Amps) at 270V
Cycle 1 Cycle 2 Cycle 3
Maximum Current 0.73 0.73 0.73
Average Current for ON time 0.717 0.718 0.718
Overall Average Current for 5
hours 0.717
Table 3. Current at 270V

36
4.1.6. Power Consumption
Figure 22. Power consumption at 270V
Power Consumption(kW) at 270V
Cycle 1 Cycle 2 Cycle 3
Maximum Power 0.094 0.094 0.094
Average Power for ON time 0.085 0.085 0.085
Overall Average Power for 5
hours 0.061
Table 4. Power Consumption at 270V
4.1.7. Apparent Power
Figure 23. Apparent power at 270V
Table 5. Apparent Power at 270V
Apparent Power(kVA) at 270V
Cycle 1 Cycle 2 Cycle 3
Maximum Apparent Power 0.198 0.198 0.199
Average Apparent Power for
ON time
0.193 0.194 0.194
Overall Average Apparent
Power for 5 hours 0.141

37
4.1.8. Power Factor
Figure 24. Power factor at 270V
Power Factor at 270V
Cycle 1 Cycle 2 Cycle 3
Minimum Power Factor 0.42 0.42 0.42
Average Power Factor for ON
time
0.44 0.44 0.44
Overall Average Power Factor
for 5 hours 0.6
Table 6. Power Factor at 270V
4.1.9. Reactive Power
Figure 25. Reactive power at 270V
Reactive Power(kVAR) at 270V
Cycle 1 Cycle 2 Cycle 3
Maximum Reactive Power 0.177 0.178 0.177
Average Reactive Power for ON
time
0.173 0.174 0.173
Overall Average Reactive
Power for 5 hours 0.124
Table 7. Reactive Power at 270V

38
The measurements of motor parameters obtained at 270V are shown above. The important
thing to note is that transients/impulses are neglected. They are not included while
calculating the average values.
The overall average value for 5 hours is calculated by taking the motor off-time as well i.e.
the whole time period. This is due to the fact that at different voltages, the motor ON an
OFF times are different.
The rest of the experiments will be conducted the same way and they will be shown in
Appendix section.

39
CHAPTER 5: ANALYSIS OF RESULTS
This chapter will compare and analyse the results of all the measurements. The comparison
of motor parameter at different voltages will help understand the benefits of stepping-down
the voltage to the equipment’s rated value.
All parameters will be shown in one graph and some part of it will be magnified to better
understand the difference in the parameter value.
5.1. MOTOR TEMPERATURE
Figure 26. Motor Temperature at different voltages
Figure 27. Encircled area

40
The above figures show the motor temperature at different voltages. It is evident that the
higher the supply voltage, the higher the motor temperature which results in shortening of
motor life.
It can also be seen that the change in supply voltage varies the ON and OFF time of the
motor. At higher voltages, the motor ON time is longer which causes additional problems.
Firstly, the motor operates at high temperature and secondly the motor stays at that
temperature for a longer time. This can significantly reduce the equipment life.
So using a voltage optimiser has clearly shown the advantage over all other voltages in
terms of temperature. The motor operates at far lower temperature and the losses inside the
motor are significantly reduced.
5.2. FREEZER TEMPERATURE
Figure 28. Freezer temperature at different voltages
Figure 29. Encircled area

41
The figures above show the inside temperature of the freezer. It shows that reducing the
voltage even reduces the inside temperature of the freezer as well. This is obvious because
the freezer’s inside temperature is taken as the output power of the motor and output power
of the motor is related to the supply voltage.
But this reduction in the freezer temperature is almost negligible. It is only 1-2°C
compared to the reduction in the motor operating temperature of almost 7-8°C (65°C for
mains and 58°C for VPhase optimiser). So this minute reduction is greatly compromised
by the huge difference in the motor operating temperature which is extremely important in
terms of motor life.
5.3. CURRENT
Figure 30. Current drawn at different voltages
The figure shows that at higher voltages the motor draws more current. This can be factor
in the increased operating temperature as higher current means more copper losses inside
the motor which dissipate as heat. Another important point to note is that the motor rated
current is 0.6A (fig. 14b). So higher voltages the motor draws current more than its rated
value which results in losses.

42
The current drawn by the motor using VPhase voltage optimiser is the lowest of all. This is
very beneficial because even by drawing lower current and at lower operating temperature,
the freezer is almost attaining its lowest temperature. So 1-2°C temperature difference is
greatly compromised by the lower current drawn and lower operating temperature of the
motor.
The point of using a “sledgehammer to crack a nut” is proved here. That when little
voltage can perform the same work, so why use a higher voltage and waste energy.
5.4. POWER CONSUMPTION
Figure 31. Power consumption at different voltages
It is apparent that the lower the voltage and lower current drawn, the lower the power
consumption will be as the following mathematical equation shows.
(5.1)
V is the supply voltage, I is the current drawn and cosØ is the power factor which is higher
at lower supply voltage. The power factor graph will be shown later.
Power consumption using VPhase optimiser is the lowest of all which can contribute to a
great energy savings.

43
5.5. APPARENT POWER
Figure 32. Apparent power at different voltages
The apparent power is also affected by the voltage. The lower the voltage and current
drawn, the lower the apparent power.
5.6. POWER FACTOR
Figure 33. Power Factor at different voltages

44
The power factor graph shows that it improves when the supply voltage is reduced. This
change in power factor will be shown in the next chapter. The power factor is optimum
with VPhase optimiser as it is closer to unity which is the highest power factor.
5.7. REACTIVE POWER
Figure 34. Reactive Power at different voltages
The reactive power, which is inversely proportional to the power factor and which can also
contribute to energy-savings, at all voltages is shown. The lower the voltage the lower is
the reactive power and higher is the power factor. The reactive power using VPhase
optimiser is the lowest of all.
5.8. SUPPLY VOLTAGES
Figure 35. Different supply voltages

45
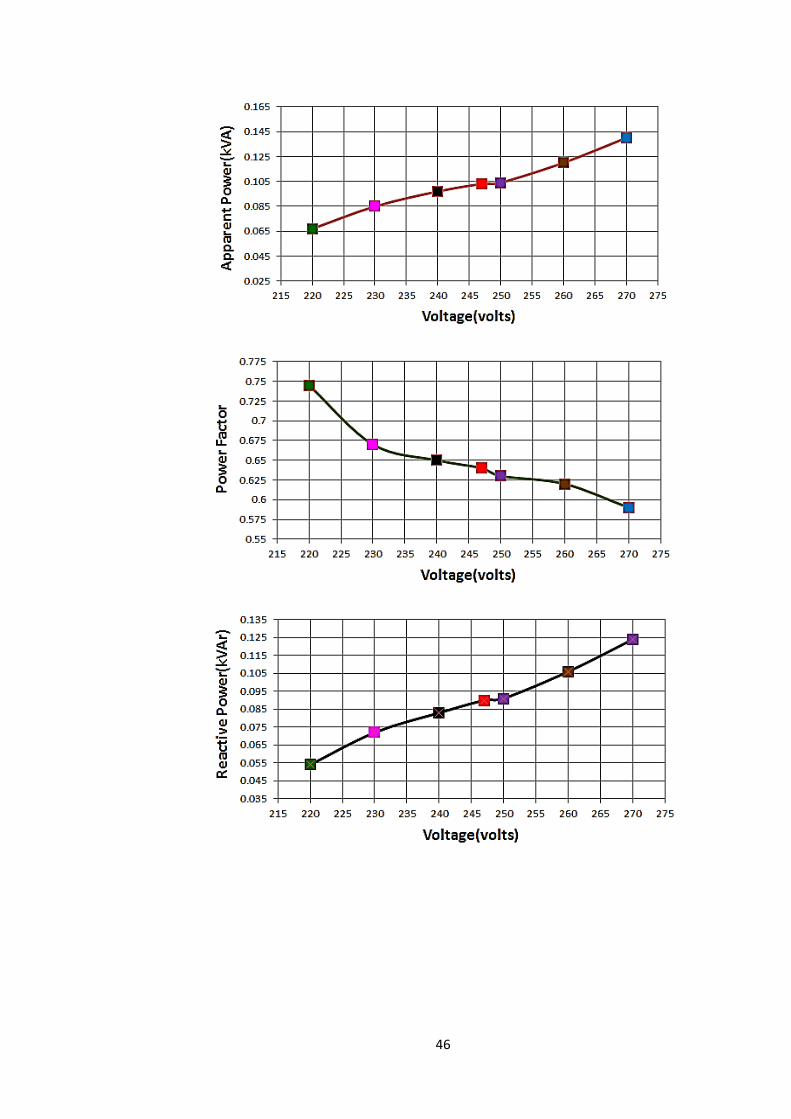
5.9. TREND OF MOTOR PARAMETERS
This section will display the trend of motor parameters with respect to voltage. This will be
more convenient in order to examine the effects of different voltages on the performance of
the motor. The average values used to display the trend of the parameters below are
calculated by considering the motor OFF time as well because the ON time is different at
different voltage.
The average values of motor maximum temperature is the same for every cycle, so its
average will remain the same and in that scenario too, the lower voltages have lower
maximum motor temperature.
46

47
Figure 36. Parameters Trendline
The analysis of the results shows that the motor performance is optimum when the supply
voltage is reduced and stabilised using a VPhase voltage optimiser. This is what voltage
optimisation is about. The above measurements have clearly shown less motor operating
temperature, less current drawn, less power consumption and improved power factor. All
of these account for lower losses, increased equipment life and substantial energy-savings.
Another positive aspect of using a VPhase optimiser is that all the experiments are done at
a room temperature of 23°C. In occasions when the motors are operating at a higher room
temperature, let’s say 32°C, this will make motor operate at much higher temperatures than
the experiments have yielded. So at mains supply, the maximum operating temperature of
the motor is 65-66°C. this temperature could go higher at higher room temperature. So
reducing the voltage increases the maximum allowable room temperature.

48
CHAPTER 6: ANALYTICAL ANALYSIS
In chapter number 3, some experiment limitations were mentioned. One of them was the
lack of electrical data of the motor given. But since, the analytical analysis is an important
aspect of the project, so it cannot be ignored.
For this reason, an ordinary induction motor whose electrical data is given is taken. This is
just to show that how more current or higher voltages create losses inside the motor and
how the inside temperature of the freezer is affected by the variation in supply voltage.
The data for the motor is selected from Problem 10-5 of Chapter 10 from Electric
Machinery Fundamentals by Stephen Chapman 4th
Edition[8].
6.1. ELECTRICAL DATA AND EQUIVALENT CIRCUIT
Number of Poles 2
Frequency 50Hz
Stator Resistance 1.4Ω
Rotor Resistance 1.5 Ω
Stator Reactance 1.9 Ω
Rotor Reactance 1.9 Ω
Magnetizing Reactance 100 Ω
Motor RPM 1425
Slip 0.05
Core loss 291W
Table 8. Motor Electrical data
Figure 37. Equivalent Circuit of Induction Motor
49
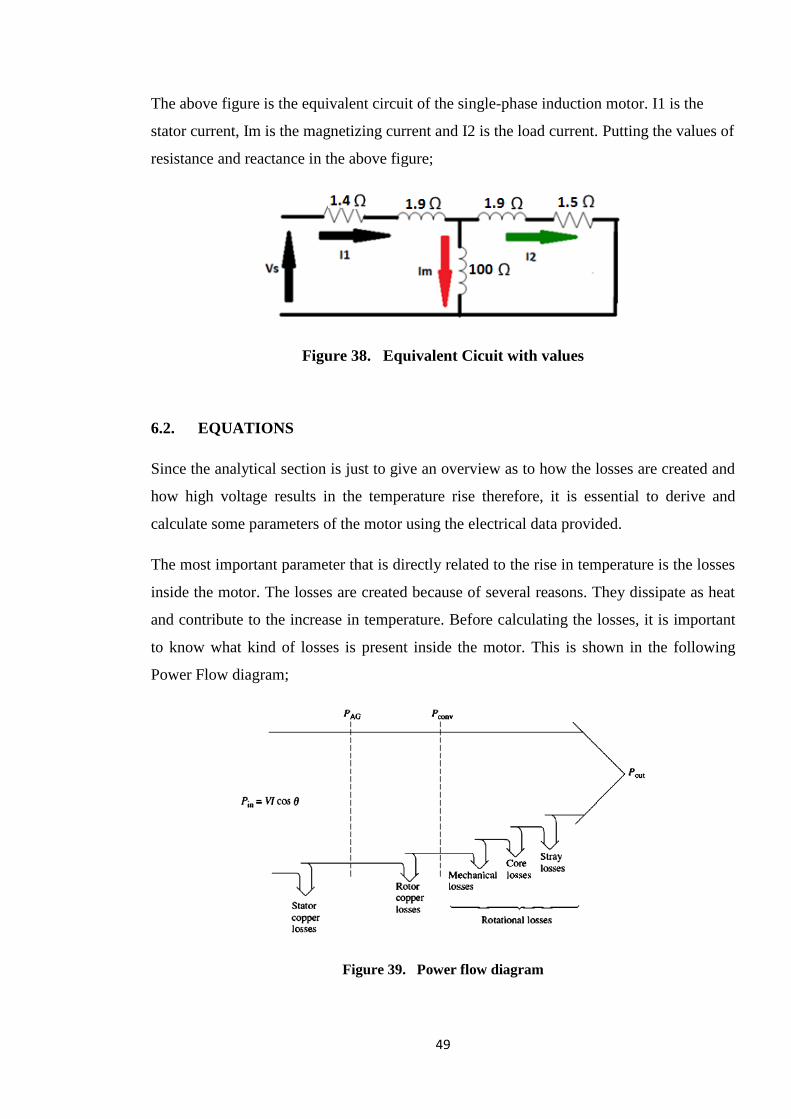
The above figure is the equivalent circuit of the single-phase induction motor. I1 is the
stator current, Im is the magnetizing current and I2 is the load current. Putting the values of
resistance and reactance in the above figure;
Figure 38. Equivalent Cicuit with values
6.2. EQUATIONS
Since the analytical section is just to give an overview as to how the losses are created and
how high voltage results in the temperature rise therefore, it is essential to derive and
calculate some parameters of the motor using the electrical data provided.
The most important parameter that is directly related to the rise in temperature is the losses
inside the motor. The losses are created because of several reasons. They dissipate as heat
and contribute to the increase in temperature. Before calculating the losses, it is important
to know what kind of losses is present inside the motor. This is shown in the following
Power Flow diagram;
Figure 39. Power flow diagram

50
The power flow diagram shows that when the motor is supplied with input power, the first
loss it has to encounter is the stator loss. The reduced input power now crosses the air gap
where it enters rotor circuit. The power in the air gap is the one which is consumed in the
rotor circuit resistance. After some losses in the rotor, the remaining power is now
converted into mechanical form. Finally, after some additional rotational losses associated
with mechanical power, the output power is finally delivered.
The most significant losses that account for almost 65% of the total losses are the stator
and rotor losses and these are the ones that will be calculated.
The core losses are mainly because of the saturation. High currents due to high voltage
create more flux in the core and push it into saturation region which causes overheating
and thus contribute to temperature rise. The losses associated with the core are hysteresis
and eddy currents. But these losses are mainly the function of the frequency and this is the
reason the core loss is assumed constant and according to the example its value is set to
291W.
Another important assumption is that the torque and speed are kept constant as there is a
little difference in the output power (inside freezer temperature) at different voltages.
To find the losses in the stator, the first step is to find the equivalent impedance of the
motor. The rotor impedance referred to the stator is;
⁄ (6.1)
The combined rotor and magnetizing impedance seen by the stator is given by;
(6.2)
After obtaining the combined rotor and magnetizing impedance, the equivalent circuit is
Figure 40. Equivalent circuit for combined rotor and magnetizing impedance
51
Where,
(6.3)
The total impedance of the circuit is given by;
(6.4)
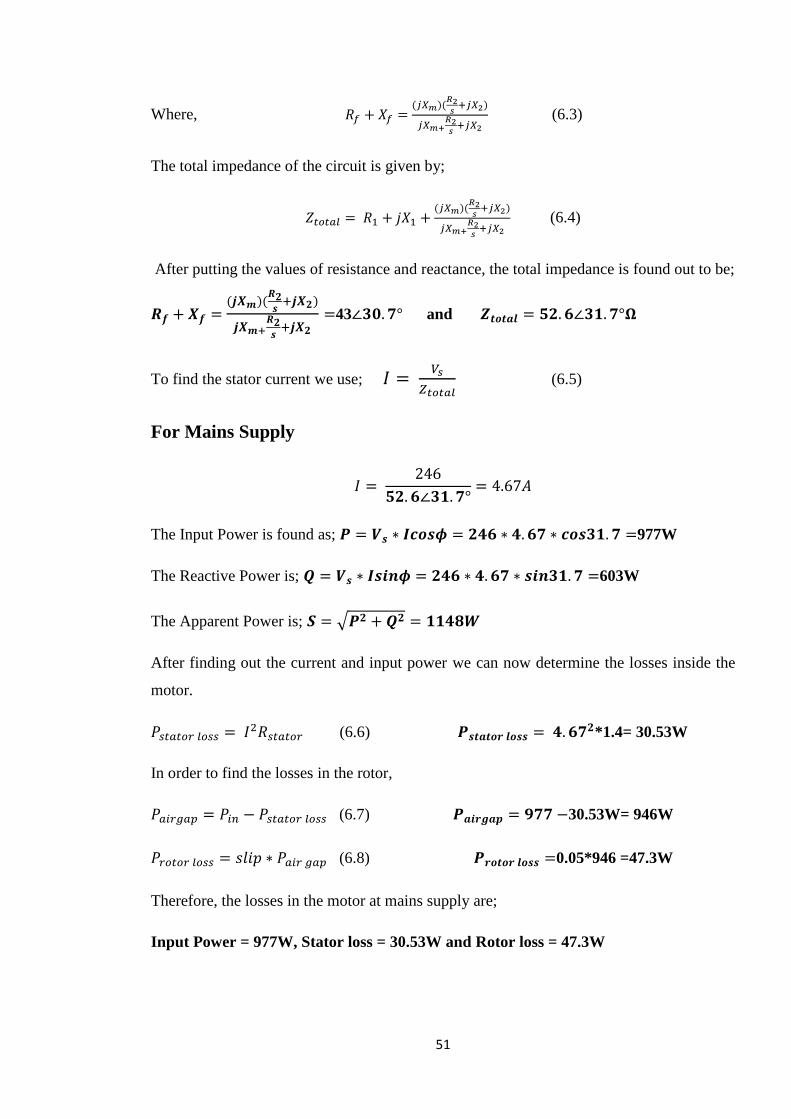
After putting the values of resistance and reactance, the total impedance is found out to be;
43 and
To find the stator current we use;
(6.5)
For Mains Supply
The Input Power is found as; 977W
The Reactive Power is; 603W
The Apparent Power is; √
After finding out the current and input power we can now determine the losses inside the
motor.
(6.6) *1.4= 30.53W
In order to find the losses in the rotor,
(6.7) 30.53W= 946W
(6.8) 0.05*946 =47.3W
Therefore, the losses in the motor at mains supply are;
Input Power = 977W, Stator loss = 30.53W and Rotor loss = 47.3W

52
For VPhase Voltage Optimiser (220V)
To find the stator current we use;
The input power is found as; 919W
The Reactive Power is; 483W
The Apparent Power is; √
After finding out the current and input power we can now determine the losses inside the
motor.
*1.4= 24.46
In order to find the losses in the rotor,
24.46W= 894W
0.05*894 =44.7W
So for VPhase the Stator loss = 24.46W and Rotor loss = 44.7W

53
For 270V
To find the stator current we use;
The input power is found as; 1178W
The Reactive Power is; 727W
The Apparent Power is; √
After finding out the current and input power we can now determine the losses inside the
motor.
*1.4= 36.8
In order to find the losses in the rotor,
24.46W= 1141W
0.05*894 =57.05W
So for 270V the Stator loss = 36.8W and Rotor loss = 57.05W.
The overall result is shown below.
Figure 41. Bar Chart representing losses at different voltages

54
Another important analysis regarding the motor output power is about the torque/speed
curve.
Figure 42. Torque-speed curve for different voltages
This will help understand why the output power becomes slightly less when the supply
voltage is reduced. In the above figure we have assumed a straight load line for any given
voltage. When the supply voltage is reduced, the slip increases as shown in the figure. This
increase in slip causes the motor speed to decrease a little.
(6.9)
It is because of that reduction in the motor speed and hence the output power, that the
freezer temperature was slightly lower than it is at higher voltages.
It is certain that the losses and the input power do not exactly represent a the values for a
freezer motor but the analytical analysis is just to give an overview that how losses
increase with the increase in supply voltage and how they increase the temperature of the
motor when they dissipate as heat.

55
CHAPTER 7: CONCLUSIONS
Chapter 4 and chapter 5 contain some waveforms that clearly give the evidence of why
voltage optimisation is instrumental in improving the performance of the domestic
appliance. Higher voltage puts an unnecessary burden on the motor and hence causes
complications. So the best solution is to maintain the voltage at the rated level of the
equipment.
The main comparison of the project was between the mains and VPhase optimiser. Since it
is the mains supply our equipment is subjected to and we want to see the effects or
reducing the voltage, so the following graphs will show the difference of the motor
parameters.

56
Figure 43. Comparison between Mains and Vphase of all parameters
The results above clearly show the differences between mains and VPhase voltage
optimiser obtained from the experiments. This is exactly what was mentioned in the
beginning of the project that voltage optimisation saves energy, reduce losses and increase
the lifetime of the equipment.
However reducing the voltage does increase the slip, which decreases the speed of the
motor and hence the output power. This is the reason why with VPhase optimiser, the
freezer inside temperature was slightly less than at mains supply. But this negligible
difference is greatly compensated by the reduction in losses and power consumption.
There was little literature review for this project. This is because the experiment done for
this project involved basic knowledge, some of which are highlighted in chapter 6, for
example, high voltage produces more current in the motor and currents are associated with
losses etc. The papers present in the IEEE website and others had little or no relevance to
this project.
This is the result of voltage optimisation of one household. If this technology is
implemented in much of the domestic sector in the UK, we can imagine how much energy-
savings can be achieved nationwide and how the appliances will work for a longer period
of time.

57
REFERENCES
[1] Chapter 1 from Electrical Power Systems Quality, Second Edition by Stephen
Dugan, Mark Mcgranaghan, H Santoso and H Beaty
[2] Chapter 1 from Power Quality in Power Systems and Electrical Machines By
Mohammad Masoum
[3] http://www.electricalreview.co.uk/features/119181/Power_quality_-
_The_hidden_cost_of_over-voltage_.html
[4] Feasability Report
[5] http://www.explainthatstuff.com/voltage-optimisation.html
[6] http://www.voltageoptimisation.com/
[7] www.vphase.co.uk
[8] Electric Machinery Fundamentals, 4th
Edition by Stephen Chapman.

58
APPENDIX
The appendix will contain several sections that were left. The sections will be shown
according to the chapter number.
FROM CHAPTER 2: PROJECT DEVICES, SOFTWARES AND SETUP
NI-9211 Thermocouple with its interfacing equipment and NI-USB 6008
DENT Data logger and 50 Amp Split-core Current transformer
LEM Voltage and Current Transducer

59
FROM CHAPTER 4: EXPERIMENTAL OBSERVATIONS
The experiments of 260V, 250V, Mains, 240V, 230V and VPhase will be shown.
260 V EXPERIMENT (USING VARIAC)
Motor’s Temperature at 260 V
Cycle 1 Cycle 2 Cycle 3 Cycle 4 Cycle 5
Maximum Temperature 68.15 68.55 68.77 69.22 69.01
Minimum Temperature 45.74 45.08 45.23 45.68 46.2
Average Temperature for 5
hours 62.8
Freezer Inside Temperature at 260 V
Cycle 1 Cycle 2 Cycle 3 Cycle 4 Cycle 5
Maximum Temperature -23.64 -23.19 -23.63 -23.55 -23.64
Minimum Temperature -30.20 -30.18 -30.12 -30.21 -30.06
Average Minimum Temperature
for 5 hours -28

60
Current at 260V
Cycle 1 Cycle 2 Cycle 3 Cycle 4 Cycle 5
Maximum Current 0.68 0.68 0.7 0.69 0.68
Average Current for ON
time
0.67 0.66 0.67 0.66 0.66
Overall Average Current
for 5 hours 0.46

61
Power Consumption at 260V
Cycle 1 Cycle 2 Cycle 3 Cycle 4 Cycle 5
Maximum Current 0.088 0.086 0.087 0.087 0.088
Average Current for ON
time
0.079 0.078 0.079 0.078 0.078
Overall Average Current
for 5 hours 0.055
Apparent Power at 260V
Cycle 1 Cycle 2 Cycle 3 Cycle 4 Cycle 5
Maximum Apparent Power 0.177 0.177 0.177 0.177 0.177
Average Apparent Power
for ON time
0.173 0.173 0.173 0.173 0.173
Overall Average Apparent
Power for 5 hours 0.12

62
Power Factor at 260V
Cycle 1 Cycle 2 Cycle 3 Cycle 4 Cycle 5
Minimum Power Factor 0.44 0.44 0.44 0.44 0.44
Average Power Factor for
ON time
0.45 0.45 0.45 0.45 0.45
Overall Average Power
Factor for 5 hours 0.62
Reactive Power at 260V
Cycle 1 Cycle 2 Cycle 3 Cycle 4 Cycle 5
Maximum Current 0.157 0.157 0.156 0.157 0.157
Average Current for ON
time
0.153 0.153 0.153 0.153 0.153
Overall Average Current
for 5 hours 0.106

63
250 V EXPERIMENT (USING VARIAC)
Motor’s Temperature at 250 V
Cycle 1 Cycle 2 Cycle 3 Cycle 4 Cycle 5
Maximum Temperature 65.53 65.84 66.35 66.64 65.57
Minimum Temperature 44.48 44.64 44.9 44.33 44.64
Average Temperature for 5
hours 59.52
Freezer Inside Temperature at 250 V
Cycle 1 Cycle 2 Cycle 3 Cycle 4 Cycle 5
Maximum Temperature -23 -23.74 -23.76 -23.8 -23.69
Minimum Temperature -29.94 -30.04 -30.01 -30 -30.01
Average Temperature for 5
hours -27.8

64
Current at 250V
Cycle 1 Cycle 2 Cycle 3 Cycle 4 Cycle 5
Maximum Current 0.64 0.64 0.64 0.63 0.63
Average Current for ON
time
0.622 0.621 0.622 0.622 0.621
Overall Average Current
for 5 hours 0.42

65
Power Consumption at 250V
Cycle 1 Cycle 2 Cycle 3 Cycle 4 Cycle 5
Maximum Power 0.082 0.082 0.082 0.081 0.082
Average Power for ON
time
0.074 0.074 0.073 0.074 0.074
Overall Average Power for
5 hours 0.051
Apparent Power at 250V
Cycle 1 Cycle 2 Cycle 3 Cycle 4 Cycle 5
Maximum Apparent Power 0.159 0.159 0.16 0.158 0.158
Average Apparent Power
for ON time
0.155 0.155 0.155 0.154 0.155
Overall Average Apparent
Power for 5 hours 0.105

66
Power Factor at 250V
Cycle 1 Cycle 2 Cycle 3 Cycle 4 Cycle 5
Minimum Power Factor 0.45 0.46 0.46 0.46 0.46
Average Power Factor for
ON time
0.475 0.476 0.475 0.474 0.475
Overall Average Power
Factor for 5 hours 0.63
Reactive Power at 250V
Cycle 1 Cycle 2 Cycle 3 Cycle 4 Cycle 5
Maximum Reactive Power 0.139 0.139 0.139 0.138 0.139
Average Reactive Power
for ON time
0.136 0.136 0.136 0.136 0.136
Overall Average Reactive
Power for 5 hours 0.091

67
MAINS EXPERIMENT
Motor’s Temperature at Mains Supply
Cycle 1 Cycle 2 Cycle 3 Cycle 4 Cycle 5
Maximum Temperature 65.9 65.62 65.47 65.84 65.8
Minimum Temperature 44.17 44.17 44.28 43.88 44.47
Average Temperature for 5
hours 58.6
Freezer Inside Temperature at Mains Supply
Cycle 1 Cycle 2 Cycle 3 Cycle 4 Cycle 5
Maximum Temperature -23.7 -23.7 -23.8 -23.7 -23.9
Minimum Temperature -30.25 -30.22 -29.23 -30.24 -30.21
Average Temperature for 5
hours -27.74

68
Current at Mains Supply
Cycle 1 Cycle 2 Cycle 3 Cycle 4 Cycle 5
Maximum Current 0.61 0.62 0.62 0.61 0.61
Average Current for ON
time
0.59 0.59 0.6 0.59 0.59
Overall Average Current
for 5 hours 0.416

69
Power Consumption at 260V
Cycle 1 Cycle 2 Cycle 3 Cycle 4 Cycle 5
Maximum Power 0.08 0.081 0.081 0.081 0.08
Average Power for ON
time
0.072 0.072 0.072 0.071 0.072
Overall Average Power for
5 hours 0.049
Apparent Power at Mains Supply
Cycle 1 Cycle 2 Cycle 3 Cycle 4 Cycle 5
Maximum Current 0.152 0.152 0.153 0.152 0.151
Average Current for ON
time
0.146 0.145 0.149 0.147 0.145
Overall Average Current
for 5 hours 0.103

70
Power Factor at Mains Supply
Cycle 1 Cycle 2 Cycle 3 Cycle 4 Cycle 5
Minimum Current 0.47 0.48 0.47 0.47 0.47
Average Power Factor for
ON time
0.49 0.49 0.49 0.49 0.48
Overall Average Power
Factor for 5 hours 0.106
Reactive Power at 260V
Cycle 1 Cycle 2 Cycle 3 Cycle 4 Cycle 5
Maximum Reactive Power 0.133 0.129 0.133 0.131 0.129
Average Reactive Power
for ON time
0.126 0.128 0.129 0.128 0.126
Overall Average Reactive
Power for 5 hours 0.09
71
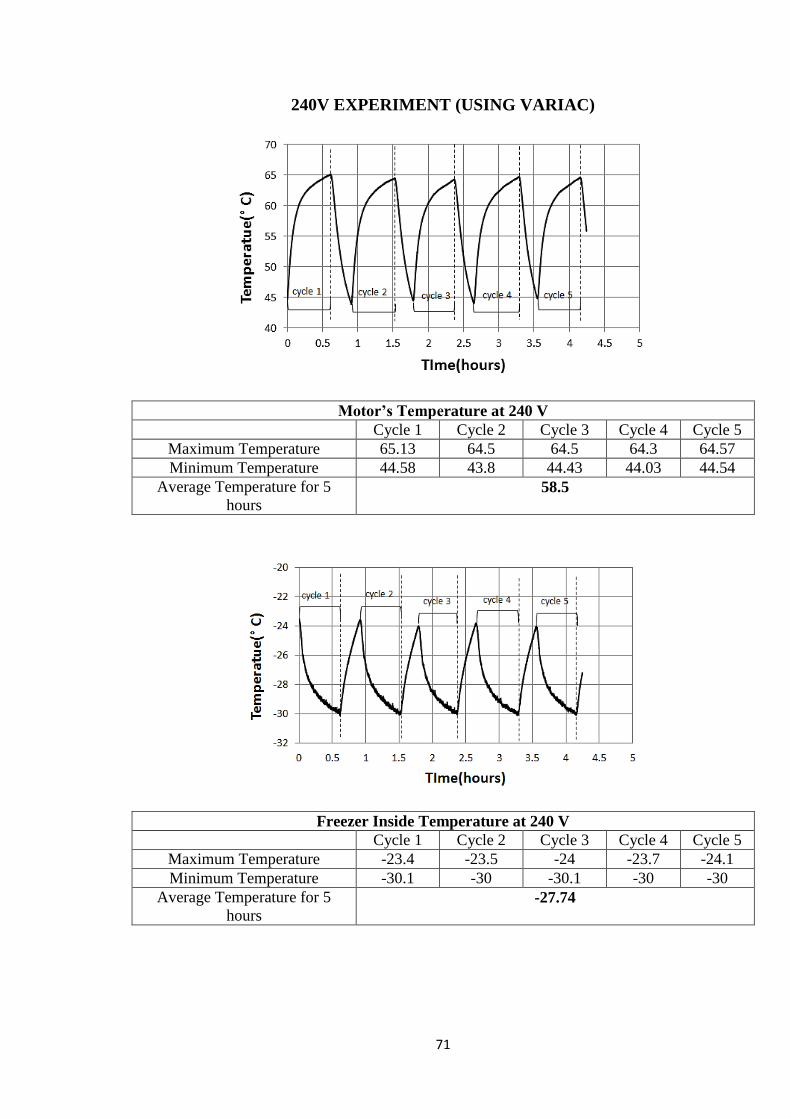
240V EXPERIMENT (USING VARIAC)
Motor’s Temperature at 240 V
Cycle 1 Cycle 2 Cycle 3 Cycle 4 Cycle 5
Maximum Temperature 65.13 64.5 64.5 64.3 64.57
Minimum Temperature 44.58 43.8 44.43 44.03 44.54
Average Temperature for 5
hours 58.5
Freezer Inside Temperature at 240 V
Cycle 1 Cycle 2 Cycle 3 Cycle 4 Cycle 5
Maximum Temperature -23.4 -23.5 -24 -23.7 -24.1
Minimum Temperature -30.1 -30 -30.1 -30 -30
Average Temperature for 5
hours -27.74

72
Current at 240V
Cycle 1 Cycle 2 Cycle 3 Cycle 4 Cycle 5
Maximum Current 0.59 0.59 0.59 0.59 0.59
Average Current for ON
time
0.57 0.58 0.58 0.58 0.58
Overall Average Current
for 5 hours 0.4

73
Power Consumption at 240V
Cycle 1 Cycle 2 Cycle 3 Cycle 4 Cycle 5
Maximum Power 0.077 0.078 0.077 0.078 0.077
Average Power for ON
time
0.069 0.069 0.067 0.069 0.07
Overall Average Power for
5 hours 0.048
Apparent Power at 240V
Cycle 1 Cycle 2 Cycle 3 Cycle 4 Cycle 5
Maximum Apparent Power 0.143 0.143 0.143 0.143 0.142
Average Apparent Power
for ON time
0.139 0.139 0.139 0.139 0.139
Overall Average Apparent
Power for 5 hours 0.097

74
Power Factor at 240V
Cycle 1 Cycle 2 Cycle 3 Cycle 4 Cycle 5
Minimum Power Factor 0.47 0.48 0.48 0.48 0.48
Average Power Factor for
ON time
0.5 0.5 0.5 0.5 0.5
Overall Average Power
Factor for 5 hours 0.65
Reactive Power at 240V
Cycle 1 Cycle 2 Cycle 3 Cycle 4 Cycle 5
Maximum Reactive Power 0.125 0.123 0.122 0.122 0.122
Average Reactive Power
for ON time
0.119 0.119 0.119 0.12 0.119
Overall Average Reactive
Power for 5 hours 0.083

75
230V EXPERIMENT (USING VARIAC)
Motor’s Temperature at 230 V
Cycle 1 Cycle 2 Cycle 3 Cycle 4 Cycle 5
Maximum Temperature 63 62.7 62.69 62.7 63.2
Minimum Temperature 44.1 43 43.17 43.6 43.07
Average Temperature for 5
hours 56.4
Freezer Inside Temperature at 230 V
Cycle 1 Cycle 2 Cycle 3 Cycle 4 Cycle 5
Maximum Temperature -23.9 -23.8 -23.8 -24 -23.8
Minimum Temperature -29.8 -29.7 -30 -29.8 -29.8
Average Temperature for 5
hours -27.6

76
Current at 230V
Cycle 1 Cycle 2 Cycle 3 Cycle 4 Cycle 5
Maximum Current 0.56 0.56 0.56 0.57 0.56
Average Current for ON
time
0.54 0.53 0.54 0.54 0.54
Overall Average Current
for 5 hours 0.37

77
Power Consumption at 230V
Cycle 1 Cycle 2 Cycle 3 Cycle 4 Cycle 5
Maximum Power 0.074 0.075 0.074 0.074 0.074
Average Power for ON
time
0.065 0.065 0.065 0.065 0.065
Overall Average Power for
5 hours 0.044
Apparent Power at 230V
Cycle 1 Cycle 2 Cycle 3 Cycle 4 Cycle 5
Maximum Apparent Power 0.131 0.131 0.13 0.131 0.131
Average Apparent Power
for ON time
0.126 0.126 0.126 0.126 0.126
Overall Average Apparent
Power for 5 hours 0.085

78
Power Factor at 230V
Cycle 1 Cycle 2 Cycle 3 Cycle 4 Cycle 5
Minimum Power Factor 0.5 0.51 0.5 0.51 0.5
Average Power Factor for
ON time
0.52 0.52 0.52 0.52 0.52
Overall Average Power
Factor for 5 hours 0.67
Reactive Power at 230V
Cycle 1 Cycle 2 Cycle 3 Cycle 4 Cycle 5
Maximum Current 0.108 0.109 0.108 0.108 0.108
Average Current for ON
time
0.106 0.107 0.106 0.106 0.106
Overall Average Current
for 5 hours 0.072

79
220V (VPHASE VOLTAGE OPTIMISER) EXPERIMENT
Motor’s Temperature using VPhase Optimiser
Cycle 1 Cycle 2 Cycle 3 Cycle 4 Cycle 5 Cycle 6 Cycle 7 Cycle 8
Maximum Temperature 58.1 58.06 58.2 58.1 57.8 57.9 57.7 57.6
Minimum Temperature 41.6 41.7 41.2 41.7 41.2 41.7 41.5 41.5
Average Temperature for 5
hours 51.3
Freezer Inside Temperature using VPhase Optimiser
Cycle 1 Cycle 2 Cycle 3 Cycle 4 Cycle 5 Cycle 6 Cycle 7 Cycle 8
Maximum Temperature -23.6 -23.5 -23.6 -23.5 -23.5 -23.5 -23.6 -23.6
Minimum Temperature -28.3 -28.4 -28.23 -28.13 -28.56 -28.3 -28.3 -28.3
Average Temperature for 5
hours -26.1

80
Current using VPhase Optimiser
Cycle 1 Cycle 2 Cycle 3 Cycle 4 Cycle 5 Cycle 6 Cycle 7 Cycle 8
Maximum Current 0.53 0.53 0.55 0.53 0.53 0.53 0.53 0.54
Average Current for ON
time
0.51 0.51 0.51 0.51 0.51 0.51 0.51 0.51
Overall Average Current
for 5 hours 0.303

81
Power Consumption using VPhase Optimiser
Cycle 1 Cycle 2 Cycle 3 Cycle 4 Cycle 5 Cycle 6 Cycle 7 Cycle 8
Maximum Power 0.071 0.071 0.072 0.071 0.071 0.072 0.072 0.071
Average Power for ON
time
0.064 0.064 0.064 0.064 0.065 0.063 0.064 0.064
Overall Average Power for
5 hours 0.038
Apparent Power using VPhase Optimiser
Cycle 1 Cycle 2 Cycle 3 Cycle 4 Cycle 5 Cycle 6 Cycle 7 Cycle 8
Maximum Apparent Power 0.117 0.117 0.117 0.118 0.118 0.117 0.117 0.117
Average Apparent Power
for ON time
0.113 0.113 0.113 0.113 0.113 0.113 0.113 0.113
Overall Average Apparent
Power for 5 hours 0.067

82
Power Factor using VPhase Optimiser
Cycle 1 Cycle 2 Cycle 3 Cycle 4 Cycle 5 Cycle 6 Cycle 7 Cycle 8
Minimum Power Factor 0.54 0.54 0.55 0.54 0.55 0.55 0.54 0.54
Average Power Factor for
ON time
0.57 0.57 0.56 0.56 0.56 0.57 0.57 0.57
Overall Average Power
Factor for 5 hours 0.745
Reactive Power using VPhase Optimiser
Cycle 1 Cycle 2 Cycle 3 Cycle 4 Cycle 5 Cycle 6 Cycle 7 Cycle 8
Maximum Reactive Power 0.095 0.094 0.095 0.094 0.094 0.094 0.094 0.095
Average Reactive Power
for ON time
0.092 0.093 0.093 0.093 0.093 0.093 0.093 0.093
Overall Average Reactive
Power for 5 hours 0.054
83
The measurements of the experiments that were left are shown above. The ambient/room
temperature has not been shown for some of the experiments because all the experiments
were conducted in the same room temperature which is 22-23°C.
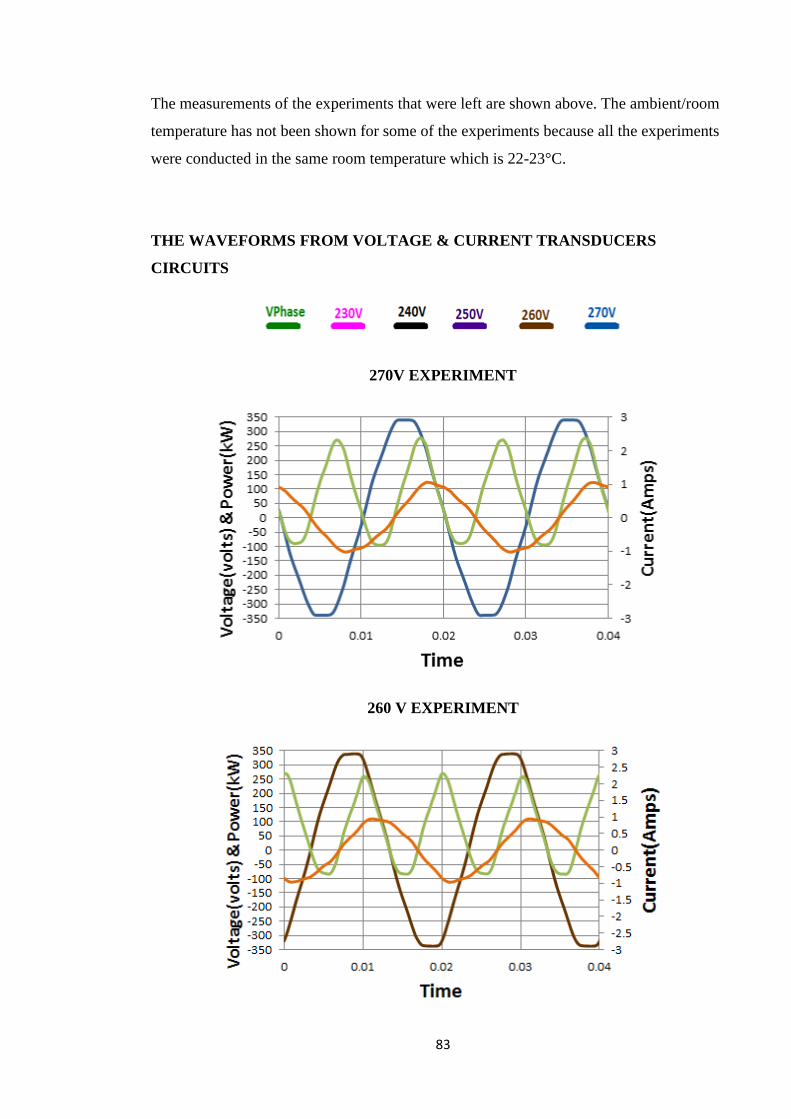
THE WAVEFORMS FROM VOLTAGE & CURRENT TRANSDUCERS
CIRCUITS
270V EXPERIMENT
260 V EXPERIMENT

84
260 V EXPERIMENT
260 V EXPERIMENT

85
260 V EXPERIMENT
The time shown in the above graphs is different than the time of the temperature or current,
power etc. which was for 5 hours. This is because the NI-9211 thermocouple rate was set
to ‘2 Hz’ i.e. for every o.5 sec it acquired a measurement. The voltage and current
transducers were connected to NI-USB 6008 device whose rate of acquiring samples was
set to 3.3kHz i.e. after every 0.0003 sec it acquired a sample. So thousands of samples for
5 hours were acquired but only the samples for 0.04 sec are shown in the above graphs for
clear viewing.

86
THE WAY VOLTAGE AND CURRENT TRANSDUCERS WORK
The figure shown above is of voltage. It is shown that how it operates and measure the
voltage which is then acquired by the NI-USB 6008 to display on Labview software.
Voltage transducer is basically a transformer like equipment which has a 2kV isolation
between its primary and secondary. It uses two resistors, one on the primary side which has
a higher value of 26kΩ and the other on the secondary side which has a value of 150Ω.
The turns ratio between the primary and secondary is 2500:1000 or 2.5.
The principle of operation is;
Primary Side:
246 V goes to 26kΩ resistance and produces current.
The 10mA current is then multiplied by 2.5 (turns ratio). 10mA*2.5=25mA
Secondary Side:
This current is now multiplied with the 150Ω resistance on the secondary side.
25mA*150Ω=3.75V
This is the voltage, which is representing the mains supply voltage and is acquired by the
NI-USB 6008 and displayed on Lab view software.
It is apparent that this voltage of 3.75V will be higher for higher supply voltage and vice
versa.

87
The figure is representing the current transducer which measures the current, multiplies it
with the resistance, in our case 150Ω, to convert it into voltage for NI-USB 6008 to
acquire. The principle of operation is:
If, let’s say, 0.5A current is flowing in the live wire which is wrapped 8 times around the
current transducer.
0.5A * 8(turns) = 4A
Then, 4A is multiplied with the current transducer turns ratio of 1:1000 or 0.001.
4A*0.001= 0.004A
Then this 0.004A is multiplied with the 150Ω resistance on the secondary side which
converts it into voltage for acquisition.
0.004A*150Ω=0.6A
This 0.6A is representing the 0.5A current flowing in the live wire. It is higher for higher
currents and vice versa.

88
The programme on Lab view for acquiring voltage signals from voltage and current
transducers.
THE END


![Ruh (soul), 'Adhaab al-qabr, Hearing of Dead- Maulana Abdul Rehman Kailani (ra) [urdu]](https://img.pdfslide.net/doc/110x75/5571f2bf49795947648cfcfe/ruh-soul-adhaab-al-qabr-hearing-of-dead-maulana-abdul-rehman-kailani-ra-urdu.jpg)