Embed Size (px)
DESCRIPTION
Pengrowth Energy Corporation's 2011 annual report
Citation preview

PENGROWTH ENERGY CORPORATION
2011 Annual Results

Operating MeasuresYears ended December 31 2011 2010 2009 2008 2007
PRODUCTIONCrude Oil (bbl per day) 21,455 21,743 22,841 24,416 26,327Heavy Oil (bbl per day) 6,425 6,789 7,551 8,122 7,168Natural gas liquids (bbl per day) 9,659 9,611 9,590 9,315 9,409Natural Gas (Mcf per day) 218,601 219,302 237,217 240,825 266,980Total (boe per day) 73,973 74,693 79,518 81,991 87,401Annual (MMboe) 27.0 27.3 29.0 30.0 31.9
BENCHMARK PRICESWTI (U.S.$ per bbl) 95.11 79.61 62.09 99.75 72.36NYMEX (U.S.$ per MMBtu) 4.03 4.38 4.16 8.90 7.12AECO (Cdn $ per MMBtu)(1) 3.63 3.99 3.99 8.19 6.46Currency ($U.S. = $1 Cdn) 1.01 0.97 0.88 0.94 0.93
AVERAGE REALIZED PRICESCrude Oil ($ per bbl)(1) 89.94 76.22 72.97 78.25 72.14Heavy Oil ($ per bbl) 68.24 60.22 52.72 75.77 44.53Natural gas liquids ($ per bbl) 69.31 56.99 42.12 70.67 58.86Natural Gas ($ per Mcf) 4.08 5.00 5.14 8.19 7.29Average price per boe(1) 53.13 49.68 46.37 62.90 53.98
AVERAGE NETBACKCrude Oil netback ($ per bbl)(1) 51.76 41.50 42.80 44.45 46.80Heavy Oil netback ($ per bbl) 39.98 32.62 29.99 51.53 26.34Natural gas liquids netback ($ per bbl) 37.69 30.02 17.81 31.35 27.80Natural Gas netback ($ per Mcf) 1.71 2.70 2.95 4.68 4.00Operating netback ($ per boe)(1) 28.45 26.92 26.07 35.64 31.47Net capital expenditures ($ millions)(2) 609.1 333.8 207.4 401.9 309.7Reserves (proved plus probable)Reserves at year end (MMboe) 330.5 318.4 295.7 323.5 319.9
(1) Prior year restated to conform to presentation in the current period.(2) Net capital expenditures includes Drilling Royalty Credits and capitalized stock based compensation.
TABLE OF CONTENTSPresident’s Message . . . . . . . . . . . . . . . . . . . . . . . . . . . . . . . . 1Summary of Financial and Operating Results . . . . . . . . . . . . 3Management’s Discussion & Analysis . . . . . . . . . . . . . . . . . . 4Management’s Report to Shareholders . . . . . . . . . . . . . . . . . 38
Auditor’s Report . . . . . . . . . . . . . . . . . . . . . . . . . . . . . . . . . . . 39Consolidated Financial Statements . . . . . . . . . . . . . . . . . . . 41Notes to Consolidated Financial Statements . . . . . . . . . . . . 45Corporate Information . . . . . . . . . . . . . . . . . . . . . . . . . . . . . . IBC
President’s Message
To our shareholders,
Over the past two years, we have made some significant changes to our business strategy focusing our attention on thetransformation to a dividend paying Exploration and Production (E&P) company. In 2011 we executed the largest capital program inour history, targeting organic opportunities on our existing asset base. While the flooding and forest fires in northern Albertacaused the beginning of the year to get off to a slow start, we built momentum through the second half of the year, allowing us toreach key operational and corporate targets.
During the year, we continued to build capacity and strengthen our technical capabilities at all levels within the organization,including welcoming Mr. Marlon McDougall as our Chief Operating Officer (COO) in early August. Marlon brings an increased focusand strong leadership to our operations.
Important and significant progress was made in 2011. Below are some key highlights from the year that I would like to share withyou:
Highlights• Production volumes for 2011 were at the high end of guidance at 73,973 barrels of oil equivalent per day (boepd), and were
essentially flat year-over-year, despite the challenging start. 2011 exit production volumes were also on target at 76,789 boepd.• Reserve additions from internal capital development activities and technical revisions replaced 145 percent of annual
production, with the addition of approximately 39.3 million boe (MMboe) of proved plus probable (2P) reserves. Our 2P reservesincreased by 3.8 percent to total 330.5 MMboe with proved reserves accounting for 71 percent of total 2P reserves.
• Our Lindbergh steam assisted gravity drainage (SAGD) pilot project was completed, on-budget and on-time. Steam injectionwas initiated in early February 2012.
• We maintained our financial flexibility at year-end 2011, with our $1.0 billion term credit facility being essentially undrawn.• Our year-end debt-to-earnings before interest, depreciation and amortization ratio remained constant at 1.6 times.
Defining Our Operational GoalsWith a focus on large accumulations of oil and liquids-rich natural gas in the Western Canadian Sedimentary Basin, we are applyingnew technologies to enhance recovery from existing pools. At the same time, we continue to manage the mix of our matureproperties, as these properties provide a stable, low decline production profile to compliment the development of ourunconventional resource plays. We will continue to aggregate our concentrated land positions in core areas to ensure high capitalinvestment efficiencies and low cost structures while pursuing strategic acquisitions in core areas.
Given the outlook for natural gas prices, we are concentrating our efforts on developing operated oil and liquids-rich gas resourceopportunities. Our efforts in 2011 and again in 2012 are primarily focused on key plays in our core areas which provide superiorrates of return. The bulk of the 2011 capital was directed to our Swan Hills play, where we have increased our capital spending overthe past few years to capitalize on the significant and growing inventory of high value development opportunities.
We have summarized the progress made in 2011, on our three core areas below.
Swan HillsAt Swan Hills, total development capital of approximately $282 million was spent in 2011, resulting in the drilling of 70 wells(48.1 net) and the growth of our light oil production by approximately 4,000 boepd as of December 31, 2011.
Average five days initial production (IP) rates for new wells remain strong, with new wells brought on production in the fourthquarter producing approximately 700 boepd. At year-end, a total of 12 additional wells were awaiting completion and tie-in, prior tobeing brought on production as well as having two rigs drilling in the Swan Hills area. We anticipate that a multi-rig drillingprogram will continue in the area throughout 2012.
LindberghThe Lindbergh SAGD project is a key component of our growth strategy with the potential to increase oil and liquids production byup to 30,000 barrels per day (bopd).
Construction was completed on our SAGD pilot project, both on-budget and on-time and steam injection was initiated in earlyFebruary, 2012. The Environmental Protection and Enhancement Act (EPEA) application for the first phase 12,500 bopd commercialproject was submitted to the Energy Resources Conservation Board (ERCB) and Alberta Environment at the end of December, 2011.Three core-hole rigs were drilling in December, with ten core-holes completed as part of the continuing resource assessment andvalidation in the Lindbergh area.
PENGROWTH 2011 President’s Message 1
We anticipate sanctioning the first 12,500 bopd commercial phase at Lindbergh in the second quarter of 2013, pending favorablepilot performance and regulatory approvals.
OldsIn the Olds area, we continued with the development of our liquids-rich Elkton gas program, drilling three wells and tying-in afourth well drilled late in 2010. These four wells had average 30 day IP rates of 480 boepd, consisting of 2.2 million cubic feet perday (MMcfpd) of gas and 110 bopd of natural gas liquids (NGL). The positive results from the Elkton liquids-rich gas wells haveprovided additional drilling locations for 2012. A new liquids-rich gas play concept was tested in the third quarter with the drillingand completion of our first Mannville gas well in the area. The well was tied-in early in the fourth quarter and had a 30 day IP rate inexcess of 500 boepd, consisting of approximately 1.9 MMcfpd of gas and 190 bopd of NGL.
OutlookWe made substantial progress in 2011 and are well positioned to execute on our 2012 development plans. We have excellentfinancial flexibility and continue to focus our capital dollars on increasing the oil and liquids production mix at Pengrowth.
In January of 2012, we released the details of our $625 million 2012 capital expenditure program and provided guidance onproduction and operating costs for 2012. The capital program will focus on oil and liquids-rich gas opportunities and is intended toincrease our oil and liquids weighting from 51 to 54 percent. Full year 2012 production guidance is between 74,500 and 76,500 boepdwith an exit rate of approximately 78,000 boepd, a two percent increase from our 2011 exit rate.
We will monitor and analyze the Lindbergh SAGD pilot results over the next several months to get a better understanding of theresource as we prepare for commerciality in 2014. We anticipate having our independent reserves evaluators, GLJ PetroleumConsultants Ltd., provide an updated reserve evaluation late in the third quarter of 2012.
I’d like to take the opportunity to thank all of our shareholders for their continued support. We are entering 2012 in a position ofstrength and with great confidence. I look forward to sharing with you the milestones we achieve throughout the coming months.
Sincerely
Derek W. EvansPresident and Chief Executive OfficerFebruary 28, 2012
2 PENGROWTH 2011 President’s Message

SUMMARY OF FINANCIAL & OPERATING RESULTSCertain comparative figures have changed due to International Financial Reporting Standards and to conform to current presentation.
(monetary amounts in millions, except per share amounts or as otherwise stated)Three months ended Twelve months ended
Dec 31, 2011 Dec 31, 2010 % Change Dec 31, 2011 Dec 31, 2010 % ChangeSTATEMENT OF (LOSS) INCOMEOil and gas sales (1) $ 389.2 $ 344.9 13 $ 1,453.7 $ 1,368.7 6Adjusted Net Income (2) $ 22.3 $ 40.7 (45) $ 110.9 $ 208.4 (47)Net (loss) income $ (9.0) $ (152.0) (94) $ 84.5 $ 149.8 (44)Net (loss) income per share $ (0.03) $ (0.47) (94) $ 0.25 $ 0.50 (50)CASH FLOWFunds flow from operations (1) (4) $ 171.1 $ 139.9 22 $ 620.0 $ 626.2 (1)Funds flow from operations per share (1) (3) $ 0.50 $ 0.44 14 $ 1.87 $ 2.09 (11)Net capital expenditures (5) $ 142.1 $ 130.9 9 $ 609.1 $ 333.8 82Net capital expenditures per share (3) $ 0.41 $ 0.41 – $ 1.83 $ 1.11 65Dividends paid (3) $ 71.4 $ 67.4 6 $ 277.5 $ 250.6 11Dividends paid per share (3) $ 0.21 $ 0.21 – $ 0.84 $ 0.84 –Weighted average number of shares outstanding (000’s) (3) 345,163 321,319 7 332,182 299,763 11
BALANCE SHEET (6)
Working capital deficiency (1) $ (137.3) $ (109.2) 26Property, plant and equipment $ 4,074.4 $ 3,738.0 9Exploration and evaluation assets $ 563.8 $ 511.6 10Long term debt $ 1,007.7 $ 1,024.4 (2)Shareholders’ equity (1) (3) $ 3,347.3 $ 3,182.3 5Shareholders’ equity per share (3) $ 9.29 $ 9.76 (5)Currency ($U.S. = $1 Cdn) (closing rate at period end) $ 0.9833 $ 1.0054Number of shares outstanding at period end (000’s) (3) 360,282 326,024 11
AVERAGE DAILY PRODUCTIONLight oil (bbls) 22,935 21,762 5 21,455 21,743 (1)Heavy oil (bbls) 6,448 6,673 (3) 6,425 6,789 (5)Natural gas liquids (bbls) 10,478 10,177 3 9,659 9,611 1Natural gas (Mcf) 220,977 218,044 1 218,601 219,302 –Total production (boe) 76,691 74,953 2 73,973 74,693 (1)Total Annual Production (Mboe) 7,056 6,896 2 27,000 27,263 (1)
AVERAGE REALIZED PRICES (after commodity risk management)Light oil (per bbl) (1) $ 91.58 $ 76.13 20 $ 89.94 $ 76.22 18Heavy oil (per bbl) $ 76.13 $ 60.42 26 $ 68.24 $ 60.22 13Natural gas liquids (per bbl) $ 70.54 $ 56.74 24 $ 69.31 $ 56.99 22Natural gas (per Mcf) $ 3.77 $ 4.87 (23) $ 4.08 $ 5.00 (18)Average realized price per boe (1) $ 54.28 $ 49.34 10 $ 53.13 $ 49.68 7
CONTRIBUTION BASED ON OPERATING NETBACKS (2)
Light oil 54% 45% 53% 45%Heavy oil 14% 12% 12% 11%Natural gas liquids 20% 16% 17% 14%Natural gas 12% 27% 18% 30%
PROVED PLUS PROBABLE RESERVESLight oil (Mbbls) 116,823 110,297 6Heavy oil (Mbbls) 31,898 26,472 20Natural gas liquids (Mbbls) 30,746 29,481 4Natural gas (Bcf) 906 913 (1)Total oil equivalent (Mboe) 330,511 318,429 4
CAPITAL PERFORMANCEFinding & Development Cost (F&D) (per boe) (7) $ 20.12 $ 15.32 31Finding, Development & Acquisition Cost (FD&A) (per boe) (7) $ 20.04 $ 18.46 9Recycle Ratio (1) (8) 1.4 1.8 (20)
(1) Prior periods restated to conform to presentation in the current period.(2) See definition under section “Non-GAAP Financial Measures”.(3) Pengrowth Energy Corporation is the entity resulting from the conversion of Pengrowth Energy Trust. See note regarding conversion below.(4) See definition under section “Additional GAAP Measures”.(5) Net capital expenditures includes Drilling Royalty Credits and capitalized stock based compensation.(6) Balance Sheet amounts are at period end.(7) Includes the changes in Future Development Capital (“FDC”) and based on Proved plus Probable Reserves.(8) Recycle Ratio is calculated as operating netback per boe divided by F&D costs per boe based on Proved plus Probable Reserves.
Note regarding currency: all figures contained within this report are quoted in Canadian dollars unless otherwise indicated.Note regarding oil production: references to light oil contained within this report include light and medium oil.
Note regarding corporate conversion: Pengrowth Energy Corporation is the entity resulting from the conversion of Pengrowth Energy Trust to adividend paying corporation effective December 31, 2010. References to “shares”, “shareholder” and “dividends” should be read as references to
“trust units”, “trust unitholder” and “distributions” respectively for periods prior to December 31, 2010.
PENGROWTH 2011 Summary of Financial & Operating Results 3

MANAGEMENT’S DISCUSSION & ANALYSIS
The following Management’s Discussion and Analysis (“MD&A”) of financial results should be read in conjunction with the auditedfinancial statements for the year ended December 31, 2011 of Pengrowth Energy Corporation. The MD&A is based on informationavailable to February 28, 2012.
STRUCTURE OF THE CORPORATION
Pengrowth Energy Corporation (the “Corporation”) is a Canadian resource company that is engaged in the production, development,exploration and acquisition of oil and natural gas assets. The Corporation was formed through a reorganization involving PengrowthEnergy Trust (the “Trust”), Pengrowth Corporation, its subsidiaries and the security holders of the Trust and Pengrowth Corporationpursuant to a Plan of Arrangement (the “Arrangement”) under the Business Corporations Act (Alberta).
On December 31, 2010 (the “Date of Conversion”), the Trust completed its conversion from an open-end investment trust to acorporation through a business combination resulting in the unitholders of the Trust and the exchangeable shareholders ofPengrowth Corporation owning all the common shares of the Corporation. Unitholders of the Trust received common shares in theCorporation on a one-for-one basis. Exchangeable shareholders of Pengrowth Corporation received 1.02308 common shares of theCorporation for each exchangeable share held. Pursuant to the Arrangement agreement, shareholders’ capital was reduced by theamount of the deficit of the Trust on December 31, 2010. The management team and Board of Directors of the Corporation arecomprised of the former management team and elected members of the Board of Directors of the Trust.
The Corporation effected an internal reorganization subsequent to the Date of Conversion whereby, among other things, the Trustand its subsidiaries were dissolved and the Corporation received all the assets and assumed all the liabilities of the Trust.
The Arrangement has been accounted for on a continuity of interest basis and accordingly, the consolidated financial statements forperiods prior to the date of conversion reflect the financial position, results of operations and cash flows as if the Corporation hadalways carried on the business formerly carried on by the Trust. This MD&A may at times refer to common shares, shareholders,shareholders’ capital and dividends which prior to the Arrangement were referred to as trust units, trust unitholders, trustunitholder’s capital and distributions, respectively. References made to trust units are those issued by the Trust. Comparativeamounts in this MD&A will also reflect the history of the Trust and its subsidiaries.
FREQUENTLY RECURRING TERMS
Pengrowth uses the following frequently recurring industry terms in this MD&A: “bbls” refers to barrels, “Mbbls” refers tothousands of barrels, “boe” refers to barrels of oil equivalent, “Mboe” refers to a thousand boe, “MMboe” refers to million boe,“Mcf” refers to thousand cubic feet, “MMcf” refers to million cubic feet, “Bcf” refers to billion cubic feet, , “MMBtu” refers to millionBritish thermal units and “MW” refers to megawatt. Disclosure provided herein in respect of a boe may be misleading, particularly ifused in isolation. A boe conversion ratio of six Mcf of natural gas to one barrel of crude oil equivalent is based on an energyequivalency conversion method primarily applicable at the burner tip and does not represent a value equivalency at the wellhead.
ADVISORY REGARDING FORWARD-LOOKING STATEMENTS
This MD&A contains forward-looking statements within the meaning of securities laws, including the “safe harbour” provisions ofCanadian securities legislation and the United States Private Securities Litigation Reform Act of 1995. Forward-looking information isoften, but not always, identified by the use of words such as “anticipate”, “believe”, “expect”, “plan”, “intend”, “forecast”, “target”,“project”, “guidance”, “may”, “will”, “should”, “could”, “estimate”, “predict” or similar words suggesting future outcomes orlanguage suggesting an outlook. Forward-looking statements in this MD&A include, but are not limited to, statements with respectto: reserves, 2012 production, the proportion of 2012 production of each product type, production additions from Pengrowth’s 2012development program, royalty expenses, 2012 operating expenses, deferred income taxes, goodwill, asset retirement obligations,taxability of dividends, remediation, reclamation and abandonment expenses, capital expenditures, development activities, generaland administration expenses, and proceeds from the disposal of properties. Statements relating to “reserves” are forward-lookingstatements, as they involve the implied assessment, based on certain estimates and assumptions that the reserves described existin the quantities predicted or estimated and can profitably be produced in the future.
Forward-looking statements and information are based on Pengrowth’s current beliefs as well as assumptions made by, andinformation currently available to, Pengrowth concerning general economic and financial market conditions, anticipated financialperformance, business prospects, strategies, regulatory developments, including in respect of taxation, royalty rates andenvironmental protection, future capital expenditures and the timing thereof, future oil and natural gas commodity prices anddifferentials between light, medium and heavy oil prices, future oil and natural gas production levels, future exchange rates and
4 PENGROWTH 2011 Management’s Discussion & Analysis

interest rates, the proceeds of anticipated divestitures, the amount of future cash dividends paid by Pengrowth, the cost ofexpanding our property holdings, our ability to obtain labour and equipment in a timely manner to carry out development activities,our ability to market our oil and natural gas successfully to current and new customers, the impact of increasing competition, ourability to obtain financing on acceptable terms, our ability to add production and reserves through our development, exploitation andexploration activities. Although management considers these assumptions to be reasonable based on information currentlyavailable to it, they may prove to be incorrect.
By their very nature, forward-looking statements involve inherent risks and uncertainties, both general and specific, and risks thatpredictions, forecasts, projections and other forward-looking statements will not be achieved. We caution readers not to placeundue reliance on these statements as a number of important factors could cause the actual results to differ materially from thebeliefs, plans, objectives, expectations and anticipations, estimates and intentions expressed in such forward-looking statements.These factors include, but are not limited to: the volatility of oil and gas prices; production and development costs and capitalexpenditures; the imprecision of reserve estimates and estimates of recoverable quantities of oil, natural gas and liquids;Pengrowth’s ability to replace and expand oil and gas reserves; ability to produce those reserves; production may be impacted byunforeseen events such as equipment failure and weather related causes; environmental claims and liabilities; incorrectassessments of value when making acquisitions; increases in debt service charges; the loss of key personnel; the marketability ofproduction; defaults by third party operators; unforeseen title defects; fluctuations in foreign currency and exchange rates;inadequate insurance coverage; counterparty risk; compliance with environmental laws and regulations; changes in tax and royaltylaws; Pengrowth’s ability to access external sources of debt and equity capital; the implementation of International FinancialReporting Standards; and the implementation of greenhouse gas emissions legislation. Further information regarding these factorsmay be found under the heading “Business Risks” herein and under “Risk Factors” in Pengrowth’s most recent Annual InformationForm (AIF), and in Pengrowth’s most recent consolidated financial statements, management information circular, quarterly reports,material change reports and news releases. Copies of Pengrowth’s Canadian public filings are available on SEDAR atwww.sedar.com. Pengrowth’s U.S. public filings, including the most recent annual report form 40-F as supplemented by its filingson form 6-K, are available at www.sec.gov.
Pengrowth cautions that the foregoing list of factors that may affect future results is not exhaustive. When relying on our forward-looking statements to make decisions with respect to Pengrowth, investors and others should carefully consider the foregoingfactors and other uncertainties and potential events. Furthermore, the forward-looking statements contained in this MD&A aremade as of the date of this MD&A and Pengrowth does not undertake any obligation to update publicly or to revise any of theincluded forward-looking statements, except as required by law. The forward-looking statements in this document are provided forthe limited purpose of enabling current and potential investors to evaluate an investment in Pengrowth. Readers are cautioned thatsuch statements may not be appropriate, and should not be used for other purposes.
The forward-looking statements contained in this MD&A are expressly qualified by this cautionary statement.
ADOPTION OF INTERNATIONAL FINANCIAL REPORTING STANDARDS (IFRS)
On January 1, 2011, Pengrowth adopted International Financial Reporting Standards (“IFRS”) for financial reporting purposes, usinga transition date of January 1, 2010. The financial statements for the year ended December 31, 2011, have been prepared inaccordance with IFRS, and herein after referred to as GAAP. Required comparative information has been restated from previouslypublished financial statements which were prepared in accordance with Canadian Generally Accepted Accounting Principles(“previous GAAP”). For additional information regarding the changes see section “International Financial Reporting Standards(IFRS)” in this MD&A.
CRITICAL ACCOUNTING ESTIMATES
The financial statements are prepared in accordance with IFRS. Management is required to make estimates and assumptions thataffect the reported amounts of assets and liabilities at the date of the financial statements and revenues and expenses for theperiod ended. Certain of these estimates may change from period to period resulting in a material impact on Pengrowth’s results ofoperations, financial position, and change in financial position.
The following describes Pengrowth’s significant critical accounting estimates.
Estimating oil and gas reserves
Pengrowth engages a qualified, independent oil and gas reserves evaluator to perform an estimation of the Corporation’s oil andgas reserves at least annually. Reserves form the basis for the calculation of depletion charges and assessment of impairment ofoil and gas assets. Reserves are estimated using the reserve definitions and guidelines prescribed by National Instrument 51-101(NI 51-101) and the Canadian Oil and Gas Evaluation Handbook (COGEH).
PENGROWTH 2011 Management’s Discussion & Analysis 5

Proved plus probable reserves are defined as the “best estimate” of quantities of oil, natural gas and related substances estimatedto be commercially recoverable from known accumulations, from a given date forward, based on drilling, geological, geophysicaland engineering data, the use of established technology and specified economic conditions. It is equally likely that the actualremaining quantities recovered will be greater than or less than the sum of the estimated proved plus probable reserves. Theestimates are made using all available geological and reservoir data as well as historical production data. Estimates are reviewedand revised as appropriate. Revisions occur as a result of changes in prices, costs, fiscal regimes and reservoir performance or achange in Pengrowth’s plans with respect to future development or operating practices.
Determination of Cash Generating Units (“CGUs”)
CGUs are the smallest group of assets that generate cash inflows largely independent from other assets or group of assets.Determination of what constitutes a CGU is subject to management’s judgment. The asset composition of a CGU can directly impactthe recoverability of the assets included therein. The recoverability of development and production asset carrying values areassessed at the CGU level. In assessing the recoverability of oil and gas properties, each CGU’s carrying value is compared to itsrecoverable amount, defined as the greater of fair value less costs to sell and value in use.
Asset Retirement Obligation
Pengrowth estimates obligations under environmental regulations in respect of decommissioning and site restoration. Theseobligations are determined based on the expected present value of expenses required in the process of plugging and abandoningwells, dismantling of wellheads, production and transportation facilities and restoration of producing areas in accordance withrelevant legislation, discounted from the date when expenses are expected to be incurred. Most of the abandonment of Pengrowth’swells is estimated to take place far in the future. Therefore, changes in estimated timing of future expenses, estimated logistics ofperforming abandonment work and the discount rate used to present value future expenses could have a significant effect on thecarrying amount of the decommissioning provision.
Impairment testing
Impairment testing of property, plant and equipment is completed for each of Pengrowth’s CGUs. Impairment testing is based onestimates of proved plus probable reserves, production rates, oil and natural gas prices, future costs, discount rates and otherrelevant assumptions. The impairment assessment of goodwill is based on the estimated fair value of Pengrowth’s CGUs. By theirnature, these estimates are subject to measurement uncertainty and may impact the financial statements of future periods.
Valuation of trade and other receivables, and prepayments to suppliers
Management estimates the likelihood of the collection of trade and other receivables and recovery of prepayments based on ananalysis of individual accounts. Factors taken into consideration include the aging of receivables in comparison with the creditterms allowed to customers and the financial position and collection history with the customer. Should actual collections be lessthan estimates, Pengrowth would be required to record an additional expense.
COMPARATIVE FIGURES
Certain changes to the presentation of oil and gas sales, operating expenses, and transportation on the Statements of Income weremade in 2011, and as such comparative periods have been restated with no impact to net income. Management believes that thesepresentation changes better reflect Pengrowth’s operating results.
ADDITIONAL GAAP MEASURE
Funds Flow from Operations
Pengrowth uses Funds Flow from Operations, a Generally Accepted Accounting Principles (“GAAP”) measure that is not definedunder IFRS. Management believes that in addition to cash provided by operations, Funds Flow from Operations, as reported in theConsolidated Statements of Cash Flow is a useful supplemental measure as it provides an indication of the funds generated byPengrowth’s principal business activities prior to consideration of changes in working capital and remediation expenditures.Pengrowth considers this to be a key measure of performance as it demonstrates its ability to generate cash flow necessary to funddividends and capital investments.
NON-GAAP FINANCIAL MEASURES
This MD&A refers to certain financial measures that are not determined in accordance with IFRS. These measures do not havestandardized meanings and may not be comparable to similar measures presented by other oil and gas companies. Measures suchas operating netbacks do not have standardized meanings prescribed by GAAP. See the section of this MD&A entitled OperatingNetbacks for a discussion of the calculation.
6 PENGROWTH 2011 Management’s Discussion & Analysis

The current level of capital expenditures funded through retained cash flow, as compared to debt or equity, can be determined whenit is compared to the difference in Funds Flow from Operations and dividends paid as shown on the Statement of Cash Flow.
Management monitors Pengrowth’s capital structure using non-GAAP financial metrics. The two metrics are Total Debt to thetrailing twelve months Earnings Before Interest, Taxes, Depletion, Depreciation, Amortization, Accretion, and other non-cash items(“EBITDA”) and Total Debt to Total Capitalization. Total Debt is the sum of working capital deficit and long term debt as shown onthe Balance Sheet, and Total Capitalization is the sum of Total Debt and Shareholders’ Equity.
Payout Ratio is a term used to evaluate financial flexibility and the capacity to fund dividends. Payout Ratio is defined on apercentage basis as dividends declared divided by Funds Flow from Operations.
Adjusted Net Income
Management believes that in addition to net income, Adjusted Net Income is a useful supplemental measure as it reflects theunderlying performance of Pengrowth’s business activities by excluding the after tax effect of certain mark-to-market non-cashitems that may significantly impact net income from period to period based on movements in future commodity prices and foreignexchange rates.
OPERATIONAL MEASURES
The reserves and production in this MD&A refer to company interest reserves or production that is Pengrowth’s working interestshare of production or reserves prior to the deduction of Crown and other royalties plus any Pengrowth owned royalty interest inproduction or reserves at the wellhead. Company interest is more fully described in the AIF.
When converting natural gas to equivalent barrels of oil within this MD&A, Pengrowth uses the industry standard of six Mcf to oneboe. Barrels of oil equivalent may be misleading, particularly if used in isolation; a conversion ratio of six Mcf of natural gas to oneboe is based on an energy equivalency conversion and does not represent a value equivalency at the wellhead. Production volumes,revenues and reserves are reported on a company interest gross basis (before royalties) in accordance with Canadian practice.
Pengrowth’s ability to grow both reserves and production can be measured with the following metrics: Reserves per debt adjustedshare and production per debt adjusted share. Reserves per debt adjusted share are measured using year-end proved plusprobable reserves and the number of common shares outstanding at year-end. The measurements are debt-adjusted by assumingadditional shares are issued at year-end share prices to replace year-end long-term debt outstanding.
Production per debt adjusted share is measured in respect of the average production for the year and the weighted average numberof common shares outstanding during the year. The measurements are debt-adjusted by assuming additional shares are issued atyear-end share prices to replace year-end long-term debt outstanding.
Recycle ratio is a measure of value creation for each dollar spent. This measure is calculated as operating netback per boe dividedby Finding and Development (“F&D”) cost per boe and can also be calculated using Finding, Development & Acquisition (“FD&A”)cost per boe. Recycle ratio can be calculated including or excluding Future Development Capital (“FDC”).
CURRENCY
All amounts are stated in Canadian dollars unless otherwise specified.
Pengrowth’s fourth quarter and annual results for 2011 are contained within this MD&A.
PENGROWTH 2011 Management’s Discussion & Analysis 7

2011 AND 2012 GUIDANCE AND 2011 FINANCIAL HIGHLIGHTS
The following table provides a summary of the 2011 and 2012 Guidance and a review of 2011 actual results.
2011 2011 2011 2012Guidance Actual Variance Guidance
Annual Average Production (boe/d) 72,000 - 74,000 73,973 – 74,500 - 76,500 (1)
Exit Production (2) 75,500 - 76,500 76,789 – 78,000 (1)
Royalty Expense (% of Sales) (3) 20.0 19.3 (0.7) 20.0
Operating Expense ($/boe) 14.45 (4) 14.15 (0.30) 13.89 (4)
G&A Expense (cash & non-cash) ($/boe) 3.00 (4) 2.79 (0.21) 2.68 (4)
Net capital expenditures ($ millions) (5) 610.0 609.1 (0.9) 625.0
(1) Based on production guidance levels provided on January 24, 2012 and excludes Lindbergh volumes.(2) Exit production based on December average.(3) Royalty expense as a % of sales excludes the impact of commodity risk management contracts.(4) Operating and G&A expense ($/boe) assume the midpoint of production guidance.(5) Net capital expenditures includes Drilling Royalty Credits and capitalized stock based compensation.
Full year and exit production was at the high end of Guidance due to favourable drilling results in the fourth quarter.
Operating expense and G&A per boe were below Guidance primarily due to increased volumes in the fourth quarter.
Pengrowth will include net operating income or loss associated with the Lindbergh Steam Assisted Gravity Drainage (“SAGD”)project in net capital expenditures until commerciality is declared, pursuant to Pengrowth’s Exploration and Evaluation Assets(“E&E Assets”) accounting policy (see Note 7 to the financial statements for additional information).
FINANCIAL HIGHLIGHTS
Three months ended Twelve months ended(monetary amounts in millions, exceptper boe amounts or as otherwise stated)
Dec 31,2011
Sept 30,2011
Dec 31,2010
Dec 31,2011
Dec 31,2010
Production (boe/d) 76,691 74,568 74,953 73,973 74,693
Net capital expenditures (1) $ 142.1 $ 163.8 $ 130.9 $ 609.1 $ 333.8
Funds flow from operations (2) $ 171.1 $ 150.4 $ 139.9 $ 620.0 $ 626.2
Operating netback ($/boe) (2) (3) $ 29.99 $ 27.15 $ 25.02 $ 28.45 $ 26.92
Adjusted Net Income (4) $ 22.3 $ 22.9 $ 40.7 $ 110.9 $ 208.4
Net (loss) income $ (9.0) $ (0.5) $ (152.0) $ 84.5 $ 149.8
Included in net (loss) income :
Realized gain (loss) on commodity risk management (5) $ 2.7 $ 14.2 $ 19.1 $ 16.8 $ 75.1
Unrealized (loss) gain on commodity risk management (5) $ (102.9) $ 58.1 $ (52.5) $ (40.0) $ 6.9
Unrealized foreign exchange gain (loss) (5) $ 29.2 $ (76.4) $ 29.7 $ (19.1) $ 49.9
Non-cash gain on investments (5) $ 23.0 $ – $ – $ 23.0 $ 73.8
Deferred tax reduction (expense) $ 13.7 $ (16.1) $ (165.9) $ (22.3) $ (171.3)
(1) Net capital expenditures includes Drilling Royalty Credits and capitalized stock based compensation.(2) Prior periods restated to conform to presentation in the current period.(3) Includes the impact of realized commodity risk management contracts.(4) See definition under section “Non-GAAP Financial Measures”.(5) Pre-tax amount.
8 PENGROWTH 2011 Management’s Discussion & Analysis

Funds Flow from Operations
($ millions) Q4 % Change Full Year % Change
2010 Funds Flow from Operations (1) 139.9 626.2
Volume variance 9.8 7 (16.0) (3)
Price variance 49.2 35 154.4 25
Realized gains on risk management contracts 16.3 (12) (58.2) (9)
Other Income 1.6 1 4.8 1
Royalty expense (11.4) (8) (25.2) (4)
Drilling Credits (2) – – (16.7) (3)
Expenses:
Operating 5.2 4 (24.8) (4)
Transportation 0.9 – (0.6) –
Cash G&A (4.2) (3) (18.0) (3)
Interest & Financing (1.5) (1) (5.4) (1)
Realized foreign exchange (0.5) – 0.5 –
Other Expenses (1.6) (1) (1.0) –
2011 Funds Flow from Operations (1) 171.1 22 620.0 (1)
(1) Prior period restated to conform to presentation in the current period.(2) In the second quarter of 2010, a $16.7 million gain was recorded related to purchased drilling credits and a property disposition where the
proceeds received consisted of drilling credits in excess of the value of the assets sold.
Funds Flow from Operations increased 22 percent in the fourth quarter of 2011 compared to the same period in 2010. The increasewas driven by higher commodity prices for liquids and increased fourth quarter production partially offset by lower realized gains onrisk management contracts and lower natural gas prices. Funds Flow from Operations decreased one percent on a year-over-yearbasis. The decrease is due to lower realized gains on risk management contracts, higher operating costs primarily due to increasedpower costs, higher royalties and G&A costs, lower production volumes, and the absence of gains from purchasing third partydrilling credits, mostly offset by higher liquids commodity prices.
Price Sensitivity
The following table illustrates the sensitivity of Funds Flow from Operations to changes in commodity prices.
Estimated Commodity Price Environment (1) Assumption Change
Estimated Impact on12 month Cash Flow (2)(3)
($ millions)
WTI(4) Oil Price US$/bbl $107.75 $1.00
Light Oil Production 7.1
Heavy Oil Production 1.8
NGL Production 2.9
11.8
AECO Natural Gas Price
Natural Gas Production Cdn$/Mcf $2.39 $0.10 6.1
(1) Calculations are performed independently and are not indicative of actual results when multiple variables change at the same time.
(2) Commodity price is based on an estimation of the 12 month forward price curve at February 28, 2012 and does not include the impact of riskmanagement contracts.
(3) The calculated impact on revenue/cash flow is only applicable within a limited range of the change indicated and is based on productionguidance levels contained herein.
(4) West Texas Intermediate.
PENGROWTH 2011 Management’s Discussion & Analysis 9

Net Income or Loss
For the fourth quarter of 2011, a net loss of $9.0 million was recorded, compared to a net loss of $0.5 million in the third quarter of2011, representing an increase in the loss of $8.5 million. The larger loss in the fourth quarter of 2011 is primarily due to non-cashlosses of $28.0 million (net of deferred tax) noted below and summarized in the Adjusted Net Income reconciliation table, whichmore than offset the increase in Funds Flow from Operations of $20.7 million:
• A $120.2 million (net of deferred tax) adverse change from unrealized commodity risk management contracts comprised ofan unrealized loss in the fourth quarter of $102.9 million ($76.8 million, net of deferred tax) compared to an unrealizedgain of $58.1 million ($43.4 million, net of deferred tax) in the third quarter of 2011.
• A $92.2 million (net of deferred tax) favourable impact from unrealized foreign exchange comprised of a gain in the fourthquarter of $29.2 million ($25.5 million, net of deferred tax) compared to an unrealized foreign exchange loss of $76.4million ($66.7 million, net of deferred tax) in the third quarter of 2011.
A $143.0 million increase in net income was recorded in the fourth quarter of 2011 compared to the same period last year primarilydue to the IFRS non-cash tax effect of changing to a corporate structure of $180.8 million, which was recorded in 2010. Funds Flowfrom Operations increased $31.2 million in the fourth quarter of 2011 compared to 2010. In addition, other non-cash losses of $59.5million (net of deferred tax), detailed below, affected net income in the fourth quarter of 2011 compared to the same period in 2010:
• A $39.1 million (net of deferred tax) adverse change from unrealized commodity risk management contracts comprised ofan unrealized loss of $102.9 million ($76.8 million, net of deferred tax) in the fourth quarter of 2011 compared to anunrealized loss of $52.5 million ($37.7 million, net of deferred tax) in the same period in 2010.
• An impairment charge of $27.4 million ($20.4 million, net of deferred tax) in the fourth quarter of 2011 relating to theGroundbirch CGU.
On a year-over-year basis net income decreased $65.3 million from $149.8 million in 2010 to $84.5 million in 2011. The reduction in2011 is primarily due to changes in certain non-cash items noted below, some of which are summarized in the Adjusted Net Incomereconciliation:
• A $34.8 million (net of deferred tax) adverse change from unrealized commodity risk management contracts comprised ofan unrealized loss of $40.0 million in 2011 ($29.8 million, net of deferred tax) compared to an unrealized gain of $6.9million ($5.0 million, net of deferred tax) in 2010.
• A $60.3 million (net of deferred tax) unfavourable impact from unrealized foreign exchange comprised of an unrealizedloss of $19.1 million in 2011 ($16.7 million, net of deferred tax) compared to an unrealized gain of $49.9 million ($43.6million, net of deferred tax) in 2010.
• A $53.7 million (net of deferred tax) adverse change from gains on investments comprised of a $23.0 million investmentgain in 2011 ($20.1 million, net of deferred tax) in 2011 as compared to a $73.8 million gain ($73.8 million, net of deferredtax) on Monterey shares in 2010.
• 2011 also includes an impairment charge of $27.4 million ($20.4 million, net of deferred tax) relating to the GroundbirchCGU.
• Partially offsetting the above were two significant deferred tax items in 2010 which resulted in the 2010 deferred taxexpense being higher than 2011 by $103.2 million. Tax deductible distributions made by the Trust in 2010 have beenreplaced by taxable dividends made by the Corporation in 2011, resulting in the deferred tax expense being lower in 2010 by$77.6 million. This was more than offset by the absence of a $180.8 million IFRS charge to deferred tax expense in 2010relating to changing to a corporate structure.
10 PENGROWTH 2011 Management’s Discussion & Analysis
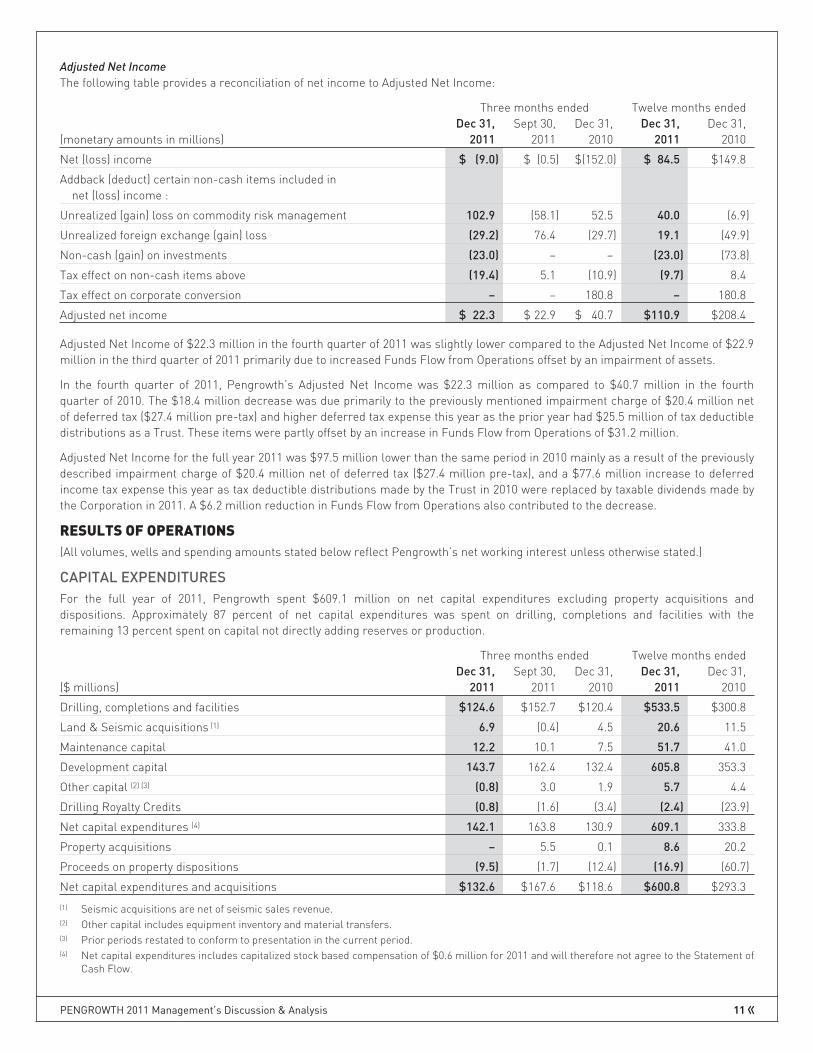
Adjusted Net Income
The following table provides a reconciliation of net income to Adjusted Net Income:
Three months ended Twelve months ended
(monetary amounts in millions)Dec 31,
2011Sept 30,
2011Dec 31,
2010Dec 31,
2011Dec 31,
2010
Net (loss) income $ (9.0) $ (0.5) $(152.0) $ 84.5 $149.8
Addback (deduct) certain non-cash items included innet (loss) income :
Unrealized (gain) loss on commodity risk management 102.9 (58.1) 52.5 40.0 (6.9)
Unrealized foreign exchange (gain) loss (29.2) 76.4 (29.7) 19.1 (49.9)
Non-cash (gain) on investments (23.0) – – (23.0) (73.8)
Tax effect on non-cash items above (19.4) 5.1 (10.9) (9.7) 8.4
Tax effect on corporate conversion – – 180.8 – 180.8
Adjusted net income $ 22.3 $ 22.9 $ 40.7 $110.9 $208.4
Adjusted Net Income of $22.3 million in the fourth quarter of 2011 was slightly lower compared to the Adjusted Net Income of $22.9million in the third quarter of 2011 primarily due to increased Funds Flow from Operations offset by an impairment of assets.
In the fourth quarter of 2011, Pengrowth’s Adjusted Net Income was $22.3 million as compared to $40.7 million in the fourthquarter of 2010. The $18.4 million decrease was due primarily to the previously mentioned impairment charge of $20.4 million netof deferred tax ($27.4 million pre-tax) and higher deferred tax expense this year as the prior year had $25.5 million of tax deductibledistributions as a Trust. These items were partly offset by an increase in Funds Flow from Operations of $31.2 million.
Adjusted Net Income for the full year 2011 was $97.5 million lower than the same period in 2010 mainly as a result of the previouslydescribed impairment charge of $20.4 million net of deferred tax ($27.4 million pre-tax), and a $77.6 million increase to deferredincome tax expense this year as tax deductible distributions made by the Trust in 2010 were replaced by taxable dividends made bythe Corporation in 2011. A $6.2 million reduction in Funds Flow from Operations also contributed to the decrease.
RESULTS OF OPERATIONS
(All volumes, wells and spending amounts stated below reflect Pengrowth’s net working interest unless otherwise stated.)
CAPITAL EXPENDITURESFor the full year of 2011, Pengrowth spent $609.1 million on net capital expenditures excluding property acquisitions anddispositions. Approximately 87 percent of net capital expenditures was spent on drilling, completions and facilities with theremaining 13 percent spent on capital not directly adding reserves or production.
Three months ended Twelve months ended
($ millions)Dec 31,
2011Sept 30,
2011Dec 31,
2010Dec 31,
2011Dec 31,
2010
Drilling, completions and facilities $124.6 $152.7 $120.4 $533.5 $300.8
Land & Seismic acquisitions (1) 6.9 (0.4) 4.5 20.6 11.5
Maintenance capital 12.2 10.1 7.5 51.7 41.0
Development capital 143.7 162.4 132.4 605.8 353.3
Other capital (2) (3) (0.8) 3.0 1.9 5.7 4.4
Drilling Royalty Credits (0.8) (1.6) (3.4) (2.4) (23.9)
Net capital expenditures (4) 142.1 163.8 130.9 609.1 333.8
Property acquisitions – 5.5 0.1 8.6 20.2
Proceeds on property dispositions (9.5) (1.7) (12.4) (16.9) (60.7)
Net capital expenditures and acquisitions $132.6 $167.6 $118.6 $600.8 $293.3
(1) Seismic acquisitions are net of seismic sales revenue.(2) Other capital includes equipment inventory and material transfers.(3) Prior periods restated to conform to presentation in the current period.(4) Net capital expenditures includes capitalized stock based compensation of $0.6 million for 2011 and will therefore not agree to the Statement of
Cash Flow.
PENGROWTH 2011 Management’s Discussion & Analysis 11

DRILLING ACTIVITYPengrowth participated in the drilling of 241 gross wells (122.6 net wells) in 2011.
Q4 2011 Q3 2011 Q2 2011 Q1 2011 Full Year 2011Gross Net Gross Net Gross Net Gross Net Gross Net
Focus Areas (1)
Swan Hills 16 10.5 17 11.1 23 17.9 14 8.6 70 48.1
Groundbirch – – 1 1.0 – – 3 3.0 4 4.0
Lindbergh 13 13.0 1 1.0 2 2.0 2 2.0 18 18.0
Bodo Polymer Project – – 30 30.0 5 5.0 – – 35 35.0
Olds 2 0.4 2 1.5 – – 5 2.9 9 4.8
Other Areas (1) 27 1.7 35 5.0 22 3.0 21 3.0 105 12.7
Total wells drilled 58 25.6 86 49.6 52 27.9 45 19.5 241 122.6
(1) Drilling activity reflects both operated and partner operated properties.
DEVELOPMENT CAPITAL ACTIVITIESPengrowth’s capital spending breakdown by area is as follows:
($ millions) Q4 2011 Q3 2011 Q2 2011 Q1 2011 Full Year 2011
Focus Areas (1)
Swan Hills $ 64.8 81.8 93.3 42.2 $282.1
Groundbirch 1.0 18.5 9.0 42.1 70.6
Lindbergh 34.1 13.6 10.2 3.5 61.4
Bodo Polymer Project 5.1 19.6 4.6 – 29.3
Olds 8.5 11.0 10.3 20.0 49.8
113.5 144.5 127.4 107.8 493.2
Other Areas (2) 11.1 8.2 7.5 13.5 40.3
Drilling, completions & facilities 124.6 152.7 134.9 121.3 533.5
Maintenance 12.2 10.1 12.1 17.3 51.7
Land & Seismic Acquisitions 6.9 (0.4) 12.7 1.4 20.6
Other (2) (0.8) 3.0 2.8 0.7 5.7
Drilling Royalty Credits (0.8) (1.6) – – (2.4)
Net capital expenditures (3) $142.1 163.8 162.5 140.7 $609.1
(1) Spending amounts reflect the activity for both operated and partner operated properties.(2) Prior periods restated to conform to presentation in the current period.(3) Net capital expenditures includes capitalized stock based compensation of $0.6 million.
Focus Areas
(Pengrowth references average well test results for certain properties. These results are not necessarily representative of long-term well performance or ultimate recoveries.)
Swan Hills TrendWith a net estimated 2.3 billion barrels of 42° API original oil in place in the Beaverhill Lake formation (Energy ResourcesConservation Board estimate), the Swan Hills Trend is the most significant conventional oil resource area across Pengrowth’s landbase. This extensive carbonate oil reservoir provides Pengrowth with significant opportunities to put its expertise in horizontaldrilling and multi-stage acid fracturing of carbonate reservoirs to work on its operated interests in Judy Creek, Carson Creek,House Mountain, Deer Mountain and Virginia Hills. Success in 2010 across the Swan Hills Trend drove increased activity in 2011.
During the fourth quarter, 10 operated wells (9.3 net) were drilled. Two of the wells were completed and tested with average five dayinitial production (“IP”) rates of over 600 boe per day per well and are anticipated to be tied-in during the first quarter of 2012. Theremaining eight wells drilled in the fourth quarter are expected to be completed, tested and tied-in during the first quarter of 2012.Activity during the fourth quarter also included bringing on stream 11 operated wells (10.3 net) drilled and completed in the secondand third quarters with average five day IP rates in excess of 690 boe per day per well.
12 PENGROWTH 2011 Management’s Discussion & Analysis
For full year 2011, a total of 46 operated wells (43.7 net) were drilled. Pengrowth brought on stream 36 operated wells (34.9 net) in2011 with average five day IP rates in excess of 500 boe per day per well.
At year end, Pengrowth had two rigs drilling in the Swan Hills area and anticipates that a multi-rig drilling program will continuethrough 2012.
Lindbergh Steam Assisted Gravity Drainage (“SAGD”) ProjectConstruction of the central processing facility, well-pad and surface pipelines at the Lindbergh SAGD Pilot Facility continuedthrough the fourth quarter in preparation for commissioning activities which commenced in January 2012. Two SAGD well-pairs(two producers and two injectors) were drilled and completed in the fourth quarter and nine core-holes were completed as part ofthe continuing resource assessment and validation in the Lindbergh area. First steam injection commenced essentially on time andbudget in early February 2012.
For full year 2011, 18 gross wells (18.0 net) were drilled, with four being the well-pairs and 14 being core-holes. Data from the newwells have been incorporated by GLJ Petroleum Consultants Ltd. in re-assessing the Lindbergh Contingent Resource volumes,which will be filed with Pengrowth’s AIF.
GroundbirchThe fourth quarter saw little activity in the Groundbirch area as the natural gas price decline shifted spending to liquids projectswith more robust economics.
During 2011, four Montney horizontal wells (4.0 net wells) were drilled, completed and tied-in. Of the four wells, one came onstream early in the second quarter, with the other three wells coming on stream late in the third quarter. The 30 day IP rates forthese four wells averaged approximately 550 boe per day. Pengrowth does not anticipate similar activity levels at Groundbirch in2012.
OldsIn the fourth quarter of 2011 Pengrowth’s first Mannville well, drilled in the third quarter, was tied-in and had a 30 day IP rate inexcess of 500 boe per day.
In 2011 Pengrowth continued with the liquids rich gas program, tying-in a well drilled late in 2010 and drilling and completing threeadditional wells. These four Elkton wells had average 30 day IP rates of 480 boe per day with 50 bbls per MMcf liquid yield. Thesepositive results have validated additional well locations for 2012.
East Bodo and CactusThe East Bodo and Cactus heavy oil properties which straddle the Alberta-Saskatchewan border produce primarily from theMcLaren and Lloydminster formations. These properties produce heavy oil through a combination of water flooding with enhancedoil recovery through the injection of polymer.
In 2011, positive results from Pengrowth’s ongoing polymer flood in the Lloydminster formation at East Bodo led to an additional35 wells being drilled in the third quarter of 2011.
Completion and tie-in operations were executed during the fourth quarter on 26 producers and nine injectors. At the end of 2011this project was ramping up and had added approximately 360 boe per day of production to Pengrowth’s exit rate.
2012 Capital ProgramPengrowth currently anticipates a 2012 capital program, excluding acquisitions, of $625 million, an increase of three percent from2011 net capital expenditures of $609.1 million. Pengrowth’s operated 2012 capital program is 100 percent focused on developmentof oil and liquids rich gas plays, with the majority of the capital to be spent in the three key areas of Swan Hills ($255 million), theOlds area ($85 million) and the Lindbergh SAGD ($59 million).
PENGROWTH 2011 Management’s Discussion & Analysis 13
RESERVES AND PERFORMANCE MEASURESReserves – Company Interest
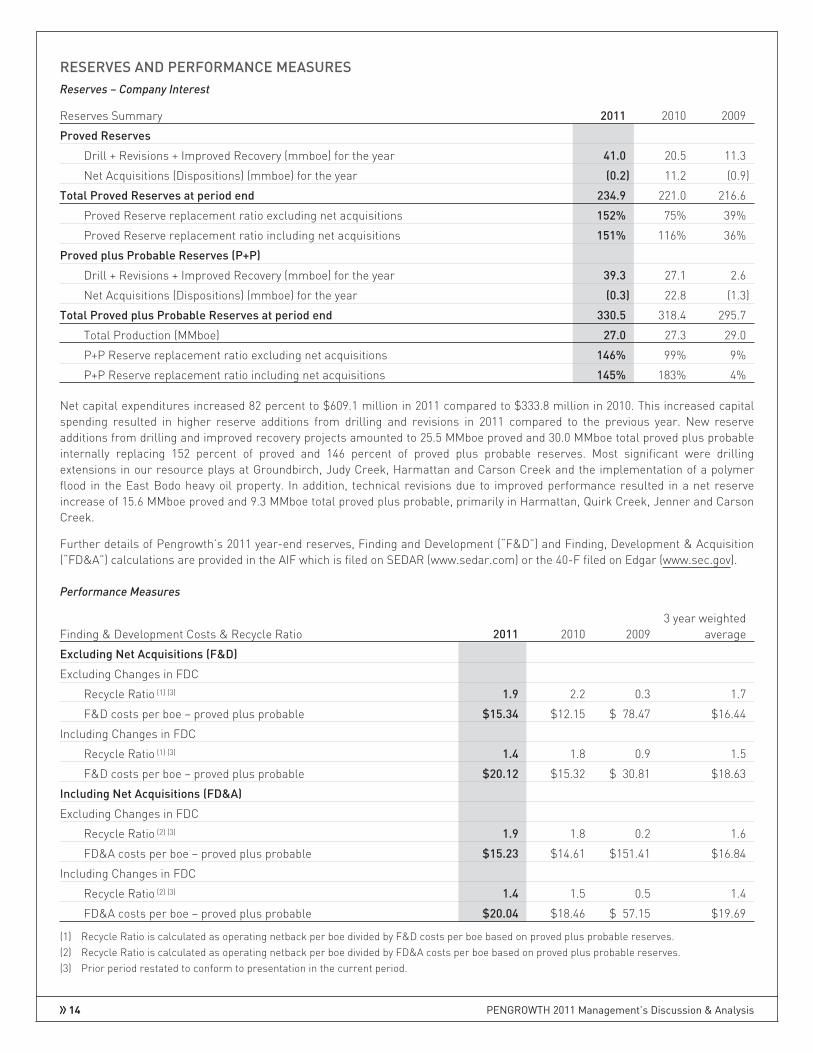
Reserves Summary 2011 2010 2009
Proved Reserves
Drill + Revisions + Improved Recovery (mmboe) for the year 41.0 20.5 11.3
Net Acquisitions (Dispositions) (mmboe) for the year (0.2) 11.2 (0.9)
Total Proved Reserves at period end 234.9 221.0 216.6
Proved Reserve replacement ratio excluding net acquisitions 152% 75% 39%
Proved Reserve replacement ratio including net acquisitions 151% 116% 36%
Proved plus Probable Reserves (P+P)
Drill + Revisions + Improved Recovery (mmboe) for the year 39.3 27.1 2.6
Net Acquisitions (Dispositions) (mmboe) for the year (0.3) 22.8 (1.3)
Total Proved plus Probable Reserves at period end 330.5 318.4 295.7
Total Production (MMboe) 27.0 27.3 29.0
P+P Reserve replacement ratio excluding net acquisitions 146% 99% 9%
P+P Reserve replacement ratio including net acquisitions 145% 183% 4%
Net capital expenditures increased 82 percent to $609.1 million in 2011 compared to $333.8 million in 2010. This increased capitalspending resulted in higher reserve additions from drilling and revisions in 2011 compared to the previous year. New reserveadditions from drilling and improved recovery projects amounted to 25.5 MMboe proved and 30.0 MMboe total proved plus probableinternally replacing 152 percent of proved and 146 percent of proved plus probable reserves. Most significant were drillingextensions in our resource plays at Groundbirch, Judy Creek, Harmattan and Carson Creek and the implementation of a polymerflood in the East Bodo heavy oil property. In addition, technical revisions due to improved performance resulted in a net reserveincrease of 15.6 MMboe proved and 9.3 MMboe total proved plus probable, primarily in Harmattan, Quirk Creek, Jenner and CarsonCreek.
Further details of Pengrowth’s 2011 year-end reserves, Finding and Development (“F&D”) and Finding, Development & Acquisition(“FD&A”) calculations are provided in the AIF which is filed on SEDAR (www.sedar.com) or the 40-F filed on Edgar (www.sec.gov).
Performance Measures
Finding & Development Costs & Recycle Ratio 2011 2010 20093 year weighted
average
Excluding Net Acquisitions (F&D)
Excluding Changes in FDC
Recycle Ratio (1) (3) 1.9 2.2 0.3 1.7
F&D costs per boe – proved plus probable $15.34 $12.15 $ 78.47 $16.44
Including Changes in FDC
Recycle Ratio (1) (3) 1.4 1.8 0.9 1.5
F&D costs per boe – proved plus probable $20.12 $15.32 $ 30.81 $18.63
Including Net Acquisitions (FD&A)
Excluding Changes in FDC
Recycle Ratio (2) (3) 1.9 1.8 0.2 1.6
FD&A costs per boe – proved plus probable $15.23 $14.61 $151.41 $16.84
Including Changes in FDC
Recycle Ratio (2) (3) 1.4 1.5 0.5 1.4
FD&A costs per boe – proved plus probable $20.04 $18.46 $ 57.15 $19.69
(1) Recycle Ratio is calculated as operating netback per boe divided by F&D costs per boe based on proved plus probable reserves.(2) Recycle Ratio is calculated as operating netback per boe divided by FD&A costs per boe based on proved plus probable reserves.(3) Prior period restated to conform to presentation in the current period.
14 PENGROWTH 2011 Management’s Discussion & Analysis
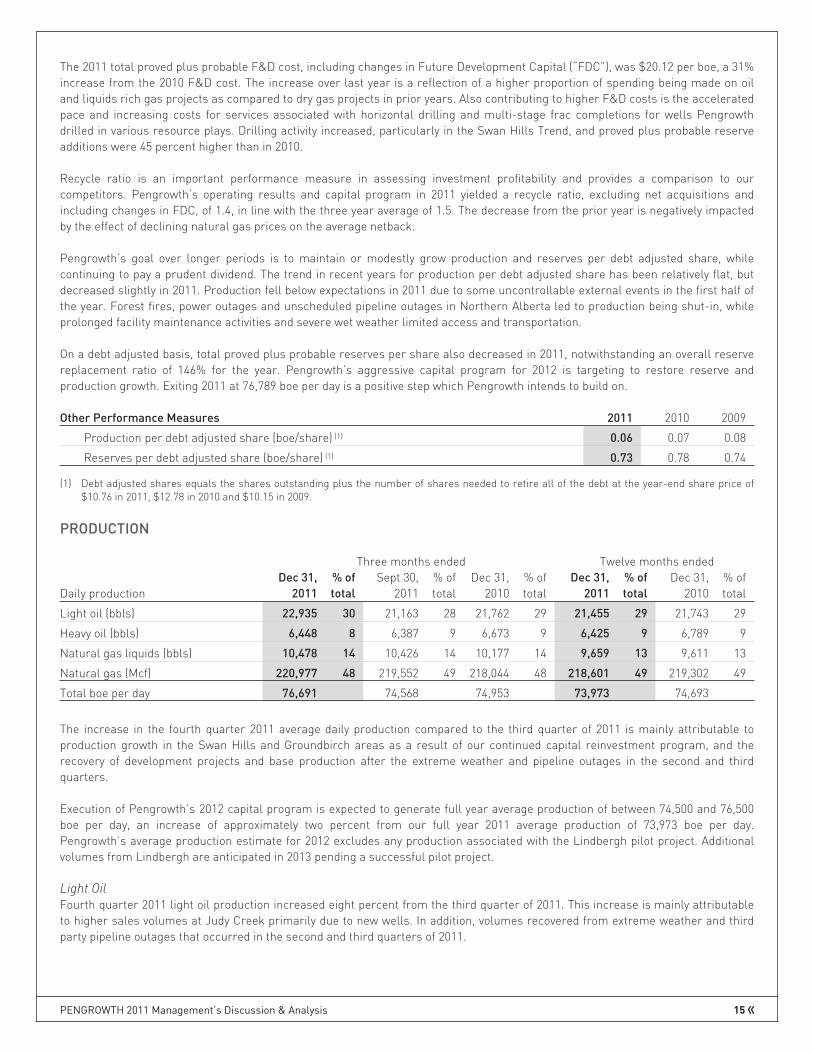
The 2011 total proved plus probable F&D cost, including changes in Future Development Capital (“FDC”), was $20.12 per boe, a 31%increase from the 2010 F&D cost. The increase over last year is a reflection of a higher proportion of spending being made on oiland liquids rich gas projects as compared to dry gas projects in prior years. Also contributing to higher F&D costs is the acceleratedpace and increasing costs for services associated with horizontal drilling and multi-stage frac completions for wells Pengrowthdrilled in various resource plays. Drilling activity increased, particularly in the Swan Hills Trend, and proved plus probable reserveadditions were 45 percent higher than in 2010.
Recycle ratio is an important performance measure in assessing investment profitability and provides a comparison to ourcompetitors. Pengrowth’s operating results and capital program in 2011 yielded a recycle ratio, excluding net acquisitions andincluding changes in FDC, of 1.4, in line with the three year average of 1.5. The decrease from the prior year is negatively impactedby the effect of declining natural gas prices on the average netback.
Pengrowth’s goal over longer periods is to maintain or modestly grow production and reserves per debt adjusted share, whilecontinuing to pay a prudent dividend. The trend in recent years for production per debt adjusted share has been relatively flat, butdecreased slightly in 2011. Production fell below expectations in 2011 due to some uncontrollable external events in the first half ofthe year. Forest fires, power outages and unscheduled pipeline outages in Northern Alberta led to production being shut-in, whileprolonged facility maintenance activities and severe wet weather limited access and transportation.
On a debt adjusted basis, total proved plus probable reserves per share also decreased in 2011, notwithstanding an overall reservereplacement ratio of 146% for the year. Pengrowth’s aggressive capital program for 2012 is targeting to restore reserve andproduction growth. Exiting 2011 at 76,789 boe per day is a positive step which Pengrowth intends to build on.
Other Performance Measures 2011 2010 2009
Production per debt adjusted share (boe/share) (1) 0.06 0.07 0.08
Reserves per debt adjusted share (boe/share) (1) 0.73 0.78 0.74
(1) Debt adjusted shares equals the shares outstanding plus the number of shares needed to retire all of the debt at the year-end share price of$10.76 in 2011, $12.78 in 2010 and $10.15 in 2009.
PRODUCTION
Three months ended Twelve months ended
Daily productionDec 31,
2011% oftotal
Sept 30,2011
% oftotal
Dec 31,2010
% oftotal
Dec 31,2011
% oftotal
Dec 31,2010
% oftotal
Light oil (bbls) 22,935 30 21,163 28 21,762 29 21,455 29 21,743 29
Heavy oil (bbls) 6,448 8 6,387 9 6,673 9 6,425 9 6,789 9
Natural gas liquids (bbls) 10,478 14 10,426 14 10,177 14 9,659 13 9,611 13
Natural gas (Mcf) 220,977 48 219,552 49 218,044 48 218,601 49 219,302 49
Total boe per day 76,691 74,568 74,953 73,973 74,693
The increase in the fourth quarter 2011 average daily production compared to the third quarter of 2011 is mainly attributable toproduction growth in the Swan Hills and Groundbirch areas as a result of our continued capital reinvestment program, and therecovery of development projects and base production after the extreme weather and pipeline outages in the second and thirdquarters.
Execution of Pengrowth’s 2012 capital program is expected to generate full year average production of between 74,500 and 76,500boe per day, an increase of approximately two percent from our full year 2011 average production of 73,973 boe per day.Pengrowth’s average production estimate for 2012 excludes any production associated with the Lindbergh pilot project. Additionalvolumes from Lindbergh are anticipated in 2013 pending a successful pilot project.
Light OilFourth quarter 2011 light oil production increased eight percent from the third quarter of 2011. This increase is mainly attributableto higher sales volumes at Judy Creek primarily due to new wells. In addition, volumes recovered from extreme weather and thirdparty pipeline outages that occurred in the second and third quarters of 2011.
PENGROWTH 2011 Management’s Discussion & Analysis 15
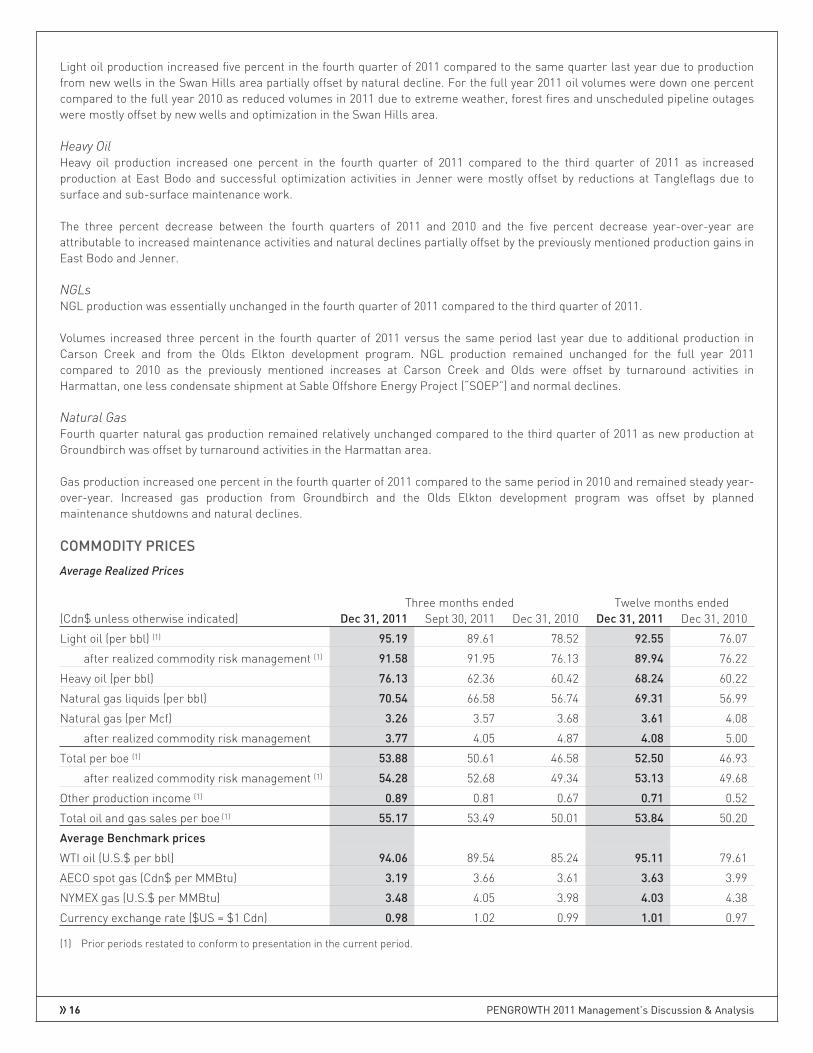
Light oil production increased five percent in the fourth quarter of 2011 compared to the same quarter last year due to productionfrom new wells in the Swan Hills area partially offset by natural decline. For the full year 2011 oil volumes were down one percentcompared to the full year 2010 as reduced volumes in 2011 due to extreme weather, forest fires and unscheduled pipeline outageswere mostly offset by new wells and optimization in the Swan Hills area.
Heavy OilHeavy oil production increased one percent in the fourth quarter of 2011 compared to the third quarter of 2011 as increasedproduction at East Bodo and successful optimization activities in Jenner were mostly offset by reductions at Tangleflags due tosurface and sub-surface maintenance work.
The three percent decrease between the fourth quarters of 2011 and 2010 and the five percent decrease year-over-year areattributable to increased maintenance activities and natural declines partially offset by the previously mentioned production gains inEast Bodo and Jenner.
NGLsNGL production was essentially unchanged in the fourth quarter of 2011 compared to the third quarter of 2011.
Volumes increased three percent in the fourth quarter of 2011 versus the same period last year due to additional production inCarson Creek and from the Olds Elkton development program. NGL production remained unchanged for the full year 2011compared to 2010 as the previously mentioned increases at Carson Creek and Olds were offset by turnaround activities inHarmattan, one less condensate shipment at Sable Offshore Energy Project (“SOEP”) and normal declines.
Natural GasFourth quarter natural gas production remained relatively unchanged compared to the third quarter of 2011 as new production atGroundbirch was offset by turnaround activities in the Harmattan area.
Gas production increased one percent in the fourth quarter of 2011 compared to the same period in 2010 and remained steady year-over-year. Increased gas production from Groundbirch and the Olds Elkton development program was offset by plannedmaintenance shutdowns and natural declines.
COMMODITY PRICES
Average Realized Prices
Three months ended Twelve months ended(Cdn$ unless otherwise indicated) Dec 31, 2011 Sept 30, 2011 Dec 31, 2010 Dec 31, 2011 Dec 31, 2010
Light oil (per bbl) (1) 95.19 89.61 78.52 92.55 76.07
after realized commodity risk management (1) 91.58 91.95 76.13 89.94 76.22
Heavy oil (per bbl) 76.13 62.36 60.42 68.24 60.22
Natural gas liquids (per bbl) 70.54 66.58 56.74 69.31 56.99
Natural gas (per Mcf) 3.26 3.57 3.68 3.61 4.08
after realized commodity risk management 3.77 4.05 4.87 4.08 5.00
Total per boe (1) 53.88 50.61 46.58 52.50 46.93
after realized commodity risk management (1) 54.28 52.68 49.34 53.13 49.68
Other production income (1) 0.89 0.81 0.67 0.71 0.52
Total oil and gas sales per boe (1) 55.17 53.49 50.01 53.84 50.20
Average Benchmark prices
WTI oil (U.S.$ per bbl) 94.06 89.54 85.24 95.11 79.61
AECO spot gas (Cdn$ per MMBtu) 3.19 3.66 3.61 3.63 3.99
NYMEX gas (U.S.$ per MMBtu) 3.48 4.05 3.98 4.03 4.38
Currency exchange rate ($US = $1 Cdn) 0.98 1.02 0.99 1.01 0.97
(1) Prior periods restated to conform to presentation in the current period.
16 PENGROWTH 2011 Management’s Discussion & Analysis

For the full year 2011, WTI benchmark crude oil prices increased 19 percent from 2010, averaging U.S. $95.11 per barrel comparedto an average price of U.S. $79.61 per barrel in 2010. 2011 fourth quarter benchmark crude prices increased five percent from anaverage price of U.S. $89.54 per bbl in the third quarter 2011 and 10 percent from an average price of U.S. $85.24 in the fourthquarter 2010. Pengrowth’s average realized price for light oil, after risk management activities, averaged Cdn $89.94 per barrel in2011 compared to Cdn $76.22 in 2010, an 18 percent increase. Fourth quarter 2011 realized prices were essentially unchanged fromthe third quarter 2011, primarily due to lower realized commodity risk management activities. Compared to the same quarter lastyear, fourth quarter 2011 realized prices were 21 percent higher primarily due to higher benchmark prices.
Natural gas markets continued their downward trend in 2011 as mild weather combined with oversupply issues largely attributableto increased production from shale gas plays more than offset demand. The U.S. based NYMEX natural gas benchmark averagedU.S. $4.03 per MMBtu in 2011, an eight percent decline from 2010 average prices of U.S. $4.38 per MMBtu. Fourth quarter 2011benchmark prices decreased 14 percent from an average price of U.S. $4.05 per MMBtu in the third quarter 2011 and 13 percentfrom an average price of U.S. $3.98 per MMBtu in the fourth quarter 2010.
AECO spot prices continued to trade at a discount to the NYMEX benchmark, although the gap narrowed throughout the year. AECOspot prices declined nine percent year over year to an average price of Cdn $3.63 per MMBtu in 2011 from Cdn $3.99 per MMBtu in2010. Fourth quarter 2011 prices decreased approximately 13 percent from the third quarter 2011 average price of Cdn $3.66 perMMBtu and 12 percent from the fourth quarter 2010 average price of Cdn $3.61 per MMBtu.
Pengrowth’s average realized natural gas price after risk management activities was Cdn $4.08 per Mcf in 2011, an 18 percentdecline compared to the 2010 average realized price of Cdn $5.00 per Mcf. Fourth quarter 2011 prices declined seven percent and23 percent when compared to third quarter 2011 and fourth quarter 2010 average realized prices of Cdn $4.05 per Mcf and Cdn$4.87 per Mcf. The decline in average realized prices quarter over quarter is mainly attributable to the decline in the benchmarkprices partially offset by risk management activities. On a year over year basis, realized prices were also lower due to a lowercontribution from realized gas commodity risk management activities in 2011.
Pengrowth’s full year total average realized price, after risk management activities was Cdn $53.13 per boe in 2011, an approximateseven percent increase over the 2010 average of Cdn $49.68 per boe. This increase is primarily a result of higher benchmark pricesfor crude oil partially offset by lower natural gas prices and lower contribution from gas commodity risk contracts. Total averagerealized price of Cdn $54.28 per boe in the fourth quarter of 2011 was three percent higher than Cdn $52.68 per boe in the thirdquarter of 2011 and 10 percent higher than the average realized price of Cdn $49.34 per boe in the fourth quarter 2010. The higherrealized price compared to the third quarter 2011 was primarily due to higher crude oil benchmark prices partially offset by weakerbenchmark natural gas prices. Compared to the same quarter last year, realized prices in the fourth quarter of 2011 were higherdue to stronger benchmark prices for crude oil, partially offset by a lower contribution from realized gas commodity riskmanagement activities in 2011.
Commodity Risk Management Gains (Losses)
Three months ended Twelve months endedDec 31, 2011 Sept 30, 2011 Dec 31, 2010 Dec 31, 2011 Dec 31, 2010
Realized
Light oil ($ millions) (7.6) 4.6 (4.8) (20.4) 1.2
Light oil ($ per bbl) (3.61) 2.34 (2.39) (2.61) 0.15
Natural gas ($ millions) 10.4 9.6 23.9 37.3 73.9
Natural gas ($ per Mcf) 0.51 0.48 1.19 0.47 0.92
Combined ($ millions) 2.8 14.2 19.1 16.9 75.1
Combined ($ per boe) 0.40 2.07 2.76 0.63 2.75
Unrealized
Total unrealized risk management (liabilities)assets at period end ($ millions) (42.0) 60.8 (2.1) (42.0) (2.1)
Less: Unrealized risk management assets(liabilities) at beginning of period ($ millions) 60.8 2.7 50.4 (2.1) (9.0)
Unrealized (loss) gain on risk managementcontracts (102.8) 58.1 (52.5) (39.9) 6.9
PENGROWTH 2011 Management’s Discussion & Analysis 17
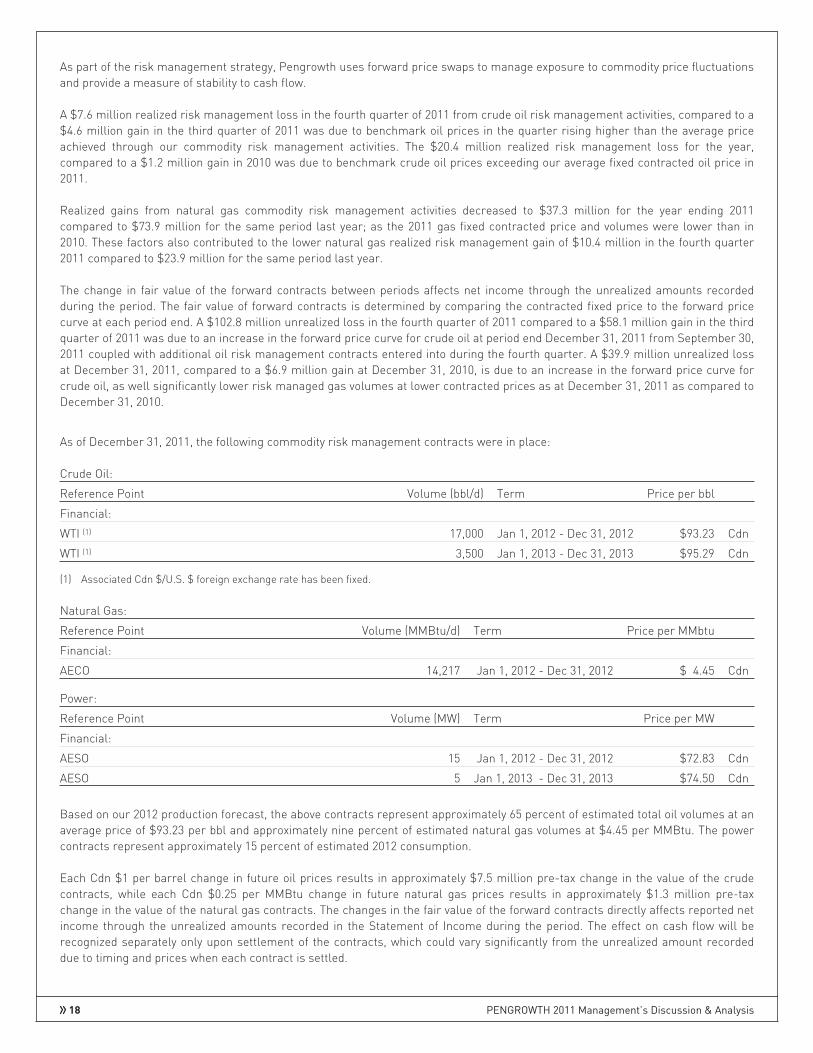
As part of the risk management strategy, Pengrowth uses forward price swaps to manage exposure to commodity price fluctuationsand provide a measure of stability to cash flow.
A $7.6 million realized risk management loss in the fourth quarter of 2011 from crude oil risk management activities, compared to a$4.6 million gain in the third quarter of 2011 was due to benchmark oil prices in the quarter rising higher than the average priceachieved through our commodity risk management activities. The $20.4 million realized risk management loss for the year,compared to a $1.2 million gain in 2010 was due to benchmark crude oil prices exceeding our average fixed contracted oil price in2011.
Realized gains from natural gas commodity risk management activities decreased to $37.3 million for the year ending 2011compared to $73.9 million for the same period last year; as the 2011 gas fixed contracted price and volumes were lower than in2010. These factors also contributed to the lower natural gas realized risk management gain of $10.4 million in the fourth quarter2011 compared to $23.9 million for the same period last year.
The change in fair value of the forward contracts between periods affects net income through the unrealized amounts recordedduring the period. The fair value of forward contracts is determined by comparing the contracted fixed price to the forward pricecurve at each period end. A $102.8 million unrealized loss in the fourth quarter of 2011 compared to a $58.1 million gain in the thirdquarter of 2011 was due to an increase in the forward price curve for crude oil at period end December 31, 2011 from September 30,2011 coupled with additional oil risk management contracts entered into during the fourth quarter. A $39.9 million unrealized lossat December 31, 2011, compared to a $6.9 million gain at December 31, 2010, is due to an increase in the forward price curve forcrude oil, as well significantly lower risk managed gas volumes at lower contracted prices as at December 31, 2011 as compared toDecember 31, 2010.
As of December 31, 2011, the following commodity risk management contracts were in place:
Crude Oil:
Reference Point Volume (bbl/d) Term Price per bbl
Financial:
WTI (1) 17,000 Jan 1, 2012 - Dec 31, 2012 $93.23 Cdn
WTI (1) 3,500 Jan 1, 2013 - Dec 31, 2013 $95.29 Cdn
(1) Associated Cdn $/U.S. $ foreign exchange rate has been fixed.
Natural Gas:
Reference Point Volume (MMBtu/d) Term Price per MMbtu
Financial:
AECO 14,217 Jan 1, 2012 - Dec 31, 2012 $ 4.45 Cdn
Power:
Reference Point Volume (MW) Term Price per MW
Financial:
AESO 15 Jan 1, 2012 - Dec 31, 2012 $72.83 Cdn
AESO 5 Jan 1, 2013 - Dec 31, 2013 $74.50 Cdn
Based on our 2012 production forecast, the above contracts represent approximately 65 percent of estimated total oil volumes at anaverage price of $93.23 per bbl and approximately nine percent of estimated natural gas volumes at $4.45 per MMBtu. The powercontracts represent approximately 15 percent of estimated 2012 consumption.
Each Cdn $1 per barrel change in future oil prices results in approximately $7.5 million pre-tax change in the value of the crudecontracts, while each Cdn $0.25 per MMBtu change in future natural gas prices results in approximately $1.3 million pre-taxchange in the value of the natural gas contracts. The changes in the fair value of the forward contracts directly affects reported netincome through the unrealized amounts recorded in the Statement of Income during the period. The effect on cash flow will berecognized separately only upon settlement of the contracts, which could vary significantly from the unrealized amount recordeddue to timing and prices when each contract is settled.
18 PENGROWTH 2011 Management’s Discussion & Analysis

If each contract were to settle at the contract price in effect at December 31, 2011, future revenue and cash flow would be $42.0million lower than if the contracts were not in place based on the estimated fair value of the risk management liability at period end.The $42.0 million liability is composed of a net liability of $38.6 million relating to contracts expiring within one year and a netliability of $3.4 million relating to contracts expiring beyond one year. Pengrowth currently fixes the Canadian dollar exchange rateat the same time it swaps U.S. dollar denominated commodity in order to protect against changes in the foreign exchange rate.
Each Cdn $1 per MW change in future power prices would result in approximately $0.2 million pre-tax change in the fair value of therisk management contracts.
Pengrowth has not designated any outstanding commodity contracts as hedges for accounting purposes and therefore recordsthese contracts on the Balance Sheet at their fair value and recognizes changes in fair value on the Statement of Income asunrealized commodity risk management gains or losses. There will continue to be volatility in earnings to the extent that the fairvalue of commodity contracts fluctuate, however these non-cash amounts do not impact Pengrowth’s operating cash flow. Realizedcommodity risk management gains or losses are recorded in oil and gas sales on the Statement Income and impacts cash flow atthat time.
In accordance with policies approved by the Board of Directors, Pengrowth may sell forward its production by product volume orpower consumption as follows:
Percent of Monthly Interest Production or estimated Power Consumption Forward Period
Up to 65% 1 - 12 Months
Up to 45% 13 - 24 Months
Up to 30% 25 - 36 Months
Each commodity risk management transaction for natural gas or crude oil shall not exceed 20,000 MMBtu per day and 2,500 bblsper day respectively. Each power consumption risk management transaction shall not exceed 25 MW.
OIL AND GAS SALES
Contribution Analysis
The following table shows the contribution of each product category to the overall sales revenue inclusive of realized commodityrisk management activities
Three months ended Twelve months ended
($ millions except percentages)Sales Revenue
Dec 31,2011
% oftotal
Sept 30,2011
% oftotal
Dec 31,2010
% oftotal
Dec 31,2011
% oftotal
Dec 31,2010
% oftotal
Light oil (1) 193.2 49 179.1 49 152.4 44 704.3 49 604.9 44
Heavy oil 45.2 12 36.6 10 37.1 11 160.0 11 149.2 11
Natural gas liquids 68.0 17 63.9 17 53.1 15 244.4 17 199.9 15
Natural gas 76.5 20 81.8 22 97.6 29 325.9 22 400.4 29
Brokered sales/sulphur (1) 6.3 2 5.5 1 4.7 1 19.1 1 14.3 1
Total oil and gas sales (1) 389.2 366.9 344.9 1,453.7 1,368.7
(1) Prior period restated to conform to presentation in the current period.
PENGROWTH 2011 Management’s Discussion & Analysis 19
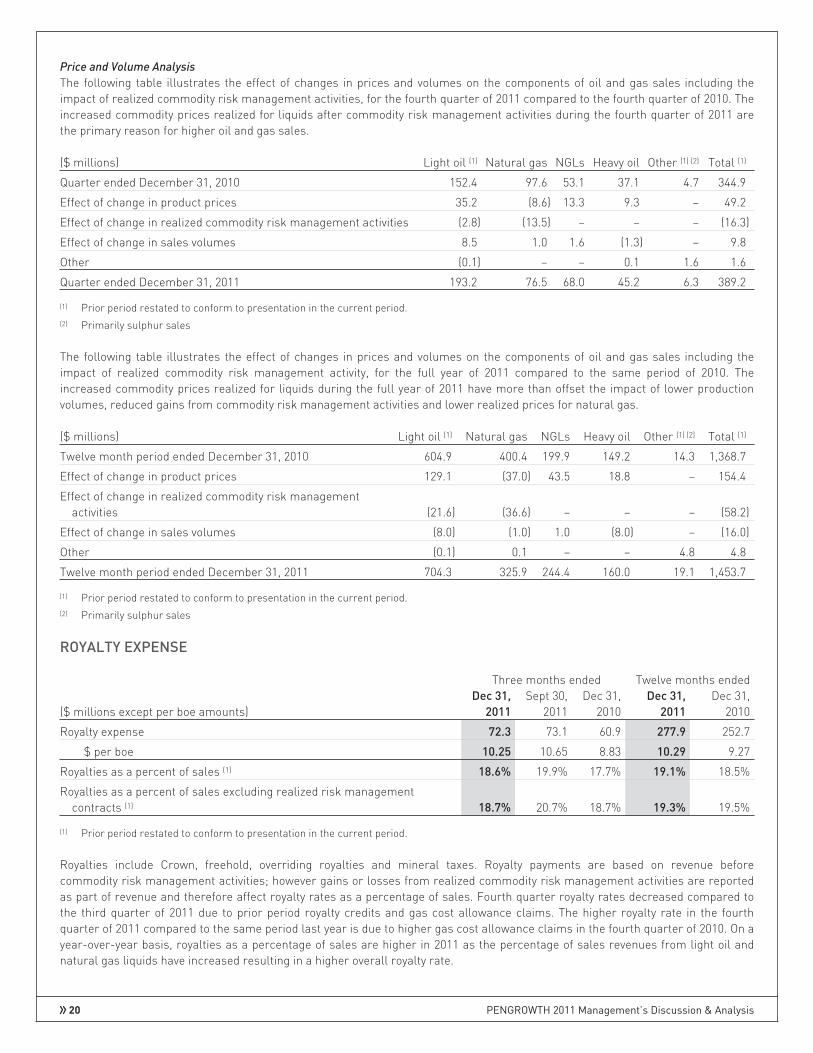
Price and Volume Analysis
The following table illustrates the effect of changes in prices and volumes on the components of oil and gas sales including theimpact of realized commodity risk management activities, for the fourth quarter of 2011 compared to the fourth quarter of 2010. Theincreased commodity prices realized for liquids after commodity risk management activities during the fourth quarter of 2011 arethe primary reason for higher oil and gas sales.
($ millions) Light oil (1) Natural gas NGLs Heavy oil Other (1) (2) Total (1)
Quarter ended December 31, 2010 152.4 97.6 53.1 37.1 4.7 344.9
Effect of change in product prices 35.2 (8.6) 13.3 9.3 – 49.2
Effect of change in realized commodity risk management activities (2.8) (13.5) – – – (16.3)
Effect of change in sales volumes 8.5 1.0 1.6 (1.3) – 9.8
Other (0.1) – – 0.1 1.6 1.6
Quarter ended December 31, 2011 193.2 76.5 68.0 45.2 6.3 389.2
(1) Prior period restated to conform to presentation in the current period.(2) Primarily sulphur sales
The following table illustrates the effect of changes in prices and volumes on the components of oil and gas sales including theimpact of realized commodity risk management activity, for the full year of 2011 compared to the same period of 2010. Theincreased commodity prices realized for liquids during the full year of 2011 have more than offset the impact of lower productionvolumes, reduced gains from commodity risk management activities and lower realized prices for natural gas.
($ millions) Light oil (1) Natural gas NGLs Heavy oil Other (1) (2) Total (1)
Twelve month period ended December 31, 2010 604.9 400.4 199.9 149.2 14.3 1,368.7
Effect of change in product prices 129.1 (37.0) 43.5 18.8 – 154.4
Effect of change in realized commodity risk managementactivities (21.6) (36.6) – – – (58.2)
Effect of change in sales volumes (8.0) (1.0) 1.0 (8.0) – (16.0)
Other (0.1) 0.1 – – 4.8 4.8
Twelve month period ended December 31, 2011 704.3 325.9 244.4 160.0 19.1 1,453.7
(1) Prior period restated to conform to presentation in the current period.(2) Primarily sulphur sales
ROYALTY EXPENSE
Three months ended Twelve months ended
($ millions except per boe amounts)Dec 31,
2011Sept 30,
2011Dec 31,
2010Dec 31,
2011Dec 31,
2010
Royalty expense 72.3 73.1 60.9 277.9 252.7
$ per boe 10.25 10.65 8.83 10.29 9.27
Royalties as a percent of sales (1) 18.6% 19.9% 17.7% 19.1% 18.5%
Royalties as a percent of sales excluding realized risk managementcontracts (1) 18.7% 20.7% 18.7% 19.3% 19.5%
(1) Prior period restated to conform to presentation in the current period.
Royalties include Crown, freehold, overriding royalties and mineral taxes. Royalty payments are based on revenue beforecommodity risk management activities; however gains or losses from realized commodity risk management activities are reportedas part of revenue and therefore affect royalty rates as a percentage of sales. Fourth quarter royalty rates decreased compared tothe third quarter of 2011 due to prior period royalty credits and gas cost allowance claims. The higher royalty rate in the fourthquarter of 2011 compared to the same period last year is due to higher gas cost allowance claims in the fourth quarter of 2010. On ayear-over-year basis, royalties as a percentage of sales are higher in 2011 as the percentage of sales revenues from light oil andnatural gas liquids have increased resulting in a higher overall royalty rate.
20 PENGROWTH 2011 Management’s Discussion & Analysis

Royalty expense for 2012 is forecasted to be approximately 20 percent of Pengrowth’s sales excluding the impact of riskmanagement contracts.
OPERATING EXPENSES
Three months ended Twelve months ended
($ millions except per boe amounts)Dec 31,
2011Sept 30,
2011Dec 31,
2010Dec 31,
2011Dec 31,
2010
Operating expenses (1) 99.7 99.5 104.9 382.0 357.2
$ per boe 14.13 14.51 15.21 14.15 13.10
(1) Prior period restated to conform to presentation in the current period.
Operating expenses in the fourth quarter of 2011 were relatively unchanged from the third quarter of 2011 however, decreased twopercent on a per boe basis. Fourth quarter operating cost savings, primarily in well servicing and general maintenance offset aslight increase in power costs quarter-over-quarter. Subsurface activity and lease and right-of-way maintenance in the fourthquarter of 2011 were significantly down from the same period in 2010 and more than offset the impact of higher power costs whencomparing the same two periods.
For the full year of 2011 compared to 2010, operating expenses increased seven percent. Increased expenses were primarilyattributable to significantly higher power prices, which represented two-thirds of the year-over-year increase. In addition, increasedsubsurface maintenance and optimization, increased road, lease and right-of-way maintenance attributable to flooding and extremewet weather conditions and increased turnaround activity also contributed to higher operating costs in 2011.
2012 operating expenses are forecast to be $384 million or $13.89 per boe. Power costs are approximately 20 percent ofPengrowth’s operating costs and will continue to be actively managed through optimizing power usage and risk managementprograms.
TRANSPORTATION COSTS
Three months ended Twelve months ended
($ millions except per bbl and per Mcf amounts)Dec 31,
2011Sept 30,
2011Dec 31,
2010Dec 31,
2011Dec 31,
2010
Oil transportation (1) 3.7 6.3 4.1 18.4 16.6
$ per bbl 1.75 3.25 2.07 2.34 2.09
Natural gas transportation 1.7 1.8 2.4 7.1 8.5
$ per Mcf 0.09 0.09 0.12 0.09 0.11
NGL transportation 0.2 – – 0.2 –
$ per bbl 0.20 – – 0.05 –
(1) Prior period restated to conform to presentation in the current period.
Oil transportation decreased approximately 41 percent in the fourth quarter of 2011 compared to the third quarter of 2011 primarilydue to a decrease in Pengrowth’s clean product trucking costs as the Rainbow Pipeline, which experienced an unscheduledinterruption in May 2011, resumed shipping in September 2011. Overall transportation costs increased two percent year-over-yearas higher clean product trucking costs were mostly offset by reduced natural gas transportation, primarily due to renegotiatedrates.
Pengrowth incurs transportation costs for its natural gas production once the product enters a pipeline at a title transfer point.Pengrowth has the option to sell some of its natural gas directly to markets outside of Alberta by incurring additional transportationcosts. Pengrowth sells most of its natural gas without incurring significant additional transportation costs. Pengrowth also incurstransportation costs on its oil and NGL production that includes clean oil trucking charges and pipeline costs up to the custodytransfer point. Pengrowth has elected to sell approximately 75 percent of its crude oil at market points beyond the wellheadincurring transportation costs to the first major trading point. The transportation cost is dependent upon third party rates anddistance the product travels on the pipeline prior to changing ownership or custody.
PENGROWTH 2011 Management’s Discussion & Analysis 21

OPERATING NETBACKS
There is no standardized measure of operating netbacks and therefore operating netbacks, as presented below, may not becomparable to similar measures presented by other companies. Pengrowth’s operating netbacks have been calculated by takingGAAP balances directly from the Statement of Income and dividing by production. Certain assumptions have been made inallocating operating expenses, other income and royalty injection credits between light oil, heavy oil, natural gas and NGLproduction.
Pengrowth realized an average operating netback of $29.99 per boe in the fourth quarter of 2011 compared to $27.15 per boe in thethird quarter of 2011 and $25.02 per boe for the fourth quarter of 2010. The increase in the netback in the fourth quarter of 2011compared to the third quarter of 2011 is primarily due to higher NGL and heavy oil commodity prices. Operating netback for the fullyear of 2011 is higher than the same period of 2010 as a result of higher liquids commodity prices partially offset by higheroperating and royalty expenses, and lower natural gas prices.
The sales price used in the calculation of operating netbacks is after realized commodity risk management gains or losses.
Three months ended Twelve months endedCombined Netbacks ($ per boe) Dec 31, 2011 Sept 30, 2011 Dec 31, 2010 Dec 31, 2011 Dec 31, 2010Oil & gas sales (1) 55.17 53.49 50.01 53.84 50.20Royalties (10.25) (10.65) (8.83) (10.29) (9.27)Operating expenses (14.13) (14.51) (15.21) (14.15) (13.09)Transportation costs (1) (0.80) (1.18) (0.95) (0.95) (0.92)Operating netback (1) 29.99 27.15 25.02 28.45 26.92
Three months ended Twelve months endedLight Oil Netbacks ($ per bbl) Dec 31, 2011 Sept 30, 2011 Dec 31, 2010 Dec 31, 2011 Dec 31, 2010Oil & gas sales (1) 92.49 92.89 76.83 90.75 76.83Royalties (21.29) (20.46) (17.32) (20.37) (17.32)Operating expenses (1) (15.40) (17.78) (18.22) (16.26) (15.91)Transportation costs (1) (1.75) (3.25) (2.07) (2.36) (2.10)Operating netback (1) 54.05 51.40 39.23 51.76 41.50
Three months ended Twelve months endedHeavy Oil Netbacks ($ per bbl) Dec 31, 2011 Sept 30, 2011 Dec 31, 2010 Dec 31, 2011 Dec 31, 2010Oil & gas sales (1) 76.13 62.36 60.42 68.24 60.22Royalties (13.65) (14.23) (11.25) (13.81) (11.84)Operating expenses (1) (13.91) (15.54) (16.23) (14.45) (15.76)Operating netback 48.57 32.59 32.94 39.98 32.62
Three months ended Twelve months endedNGLs Netbacks ($ per bbl) Dec 31, 2011 Sept 30, 2011 Dec 31, 2010 Dec 31, 2011 Dec 31, 2010Oil & gas sales 70.54 66.58 56.74 69.31 56.99Royalties (14.51) (19.42) (13.97) (16.92) (14.80)Operating expenses (12.34) (17.03) (13.56) (14.65) (12.17)Transportation costs (0.20) – – (0.05) –Operating netback 43.49 30.13 29.21 37.69 30.02
Three months ended Twelve months endedNatural Gas Netbacks ($ per Mcf) Dec 31, 2011 Sept 30, 2011 Dec 31, 2010 Dec 31, 2011 Dec 31, 2010Oil & gas sales (1) 3.98 4.22 5.03 4.24 5.12Royalties (0.26) (0.31) (0.31) (0.33) (0.42)Operating expenses (1) (2.31) (1.98) (2.28) (2.11) (1.89)Transportation costs (0.09) (0.09) (0.12) (0.09) (0.11)Operating netback 1.32 1.84 2.32 1.71 2.70
(1) Prior period restated to conform to presentation in the current period.
22 PENGROWTH 2011 Management’s Discussion & Analysis

GENERAL AND ADMINISTRATIVE EXPENSES
Three months ended Twelve months ended($ millions except per boe amounts) Dec 31, 2011 Sept 30, 2011 Dec 31, 2010 Dec 31, 2011 Dec 31, 2010
Cash G&A expense 16.3 14.5 12.1 64.3 46.3
$ per boe 2.31 2.11 1.76 2.38 1.70
Non-cash G&A expense 2.0 2.4 (1.0) 11.0 4.6
$ per boe 0.28 0.35 (0.16) 0.41 0.17
Total G&A 18.3 16.9 11.1 75.3 50.9
$ per boe 2.60 2.46 1.61 2.79 1.87
Fourth quarter cash G&A expenses are higher when compared to the third quarter mainly due to increased information technology(“IT”) costs and professional services. Cash G&A expenses for 2011 include certain costs relating to IT, office facilities andoperations support previously charged to operating expenses in 2010. The impact of this change for the fourth quarter and the fullyear of 2011 is approximately $2.3 million and approximately $12.7 million, respectively. In addition, severance costs, performancebonus true-up and non-recurring items contribute to higher cash G&A expenses in 2011 when compared to 2010.
The non-cash component of G&A represents the compensation expense associated with Pengrowth’s Long Term Incentive Plans(LTIP) (see Note 14 to the financial statements). The compensation costs associated with these plans are expensed over theapplicable vesting period. The $6.4 million increase in the 2011 non-cash G&A as compared to 2010 was primarily due to the higherexpense calculation for the new LTIP. Also contributing was a higher performance multiplier of 0.5 applicable to the DeferredEntitlement Share Units (“DESU”) in 2011 as compared to a zero performance multiplier booked in 2010 applicable to the DESUsthat vested in 2011.
Total G&A costs are expected to decrease for 2012 to $2.68 per boe when compared to the full year 2011 of $2.79 per boe. Includedin Pengrowth’s 2012 G&A forecast are non-cash G&A costs of approximately $0.49 per boe compared to $0.41 per boe in 2011.
DEPLETION, DEPRECIATION, AMORTIZATION AND ACCRETION
Three months ended Twelve months ended($ millions except per boe amounts) Dec 31, 2011 Sept 30, 2011 Dec 31, 2010 Dec 31, 2011 Dec 31, 2010
Depletion, depreciation and amortization 117.6 112.8 108.2 437.9 432.4
$ per boe 16.67 16.44 15.69 16.22 15.86
Accretion 4.0 3.9 4.0 15.6 17.7
$ per boe 0.57 0.57 0.58 0.58 0.65
Depletion and depreciation of property, plant and equipment is calculated using the unit of production method based on proved plusprobable reserves and is based on the dollar value of the property, plant and equipment asset base. Depletion expense in the fourthquarter of 2011 compared to the third quarter of 2011 reflects a higher depletion cost as a result of increased production offset bypositive reserve revisions booked in the fourth quarter. Depletion expense in the fourth quarter and for the year ended 2011compared to the same periods last year were higher due mainly to the impact of the increased capital program in 2011 as comparedto 2010 and higher costs associated with horizontal drilling and multi-stage frac completions for wells drilled in the year.
Accretion is a charge to earnings that increases the Asset Retirement Obligations (ARO) liability for the passage of time (unwindingof the discount). Accretion is charged to net income over the lifetime of the producing oil and gas assets. Accretion has remainedrelatively stable compared to the third quarter of 2011. Accretion has decreased year over year due a reduction in the discount rateslate in 2010 with further reduction in the third and fourth quarters of 2011.
IMPAIRMENT
In the fourth quarter of 2011, Pengrowth recognized a $27.4 million pre-tax impairment charge on the producing portion of theGroundbirch CGU as the carrying value exceeded the fair value on December 31, 2011. Fair value was determined based on the totalproved plus probable reserves estimated by Pengrowth’s independent reserves evaluator using the period end commodity priceforecast of Pengrowth’s independent reserves evaluator and discounted at a market rate.
PENGROWTH 2011 Management’s Discussion & Analysis 23
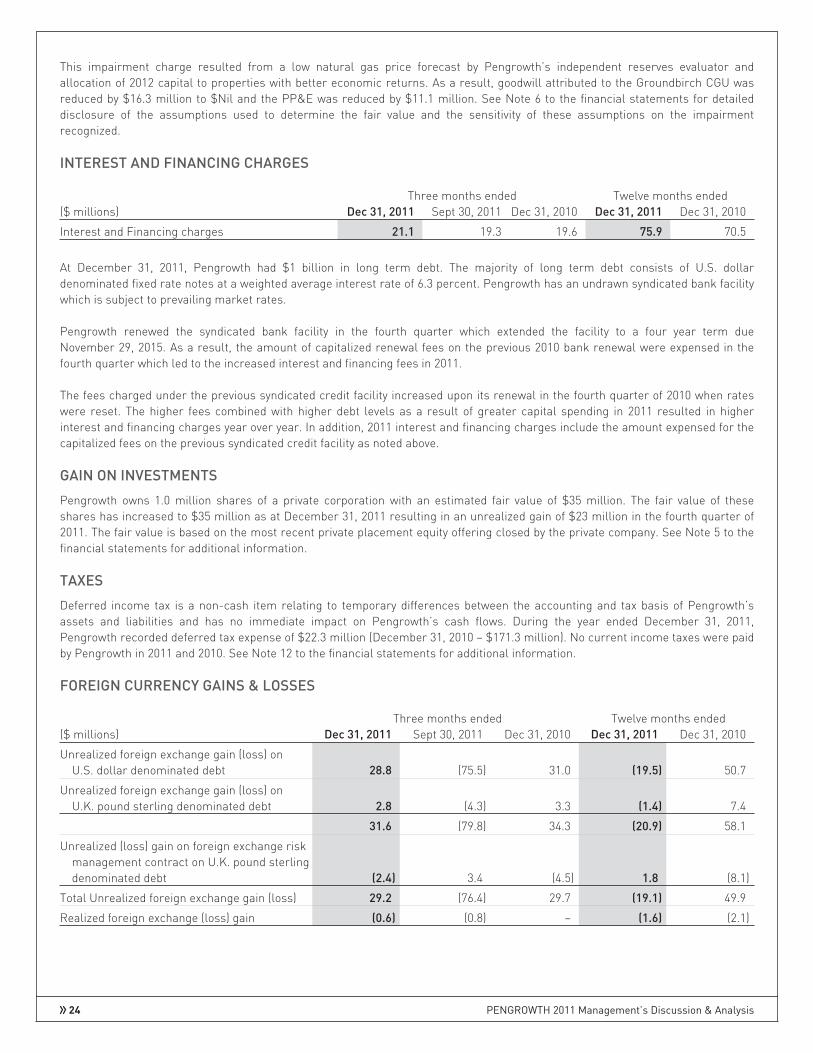
This impairment charge resulted from a low natural gas price forecast by Pengrowth’s independent reserves evaluator andallocation of 2012 capital to properties with better economic returns. As a result, goodwill attributed to the Groundbirch CGU wasreduced by $16.3 million to $Nil and the PP&E was reduced by $11.1 million. See Note 6 to the financial statements for detaileddisclosure of the assumptions used to determine the fair value and the sensitivity of these assumptions on the impairmentrecognized.
INTEREST AND FINANCING CHARGES
Three months ended Twelve months ended($ millions) Dec 31, 2011 Sept 30, 2011 Dec 31, 2010 Dec 31, 2011 Dec 31, 2010
Interest and Financing charges 21.1 19.3 19.6 75.9 70.5
At December 31, 2011, Pengrowth had $1 billion in long term debt. The majority of long term debt consists of U.S. dollardenominated fixed rate notes at a weighted average interest rate of 6.3 percent. Pengrowth has an undrawn syndicated bank facilitywhich is subject to prevailing market rates.
Pengrowth renewed the syndicated bank facility in the fourth quarter which extended the facility to a four year term dueNovember 29, 2015. As a result, the amount of capitalized renewal fees on the previous 2010 bank renewal were expensed in thefourth quarter which led to the increased interest and financing fees in 2011.
The fees charged under the previous syndicated credit facility increased upon its renewal in the fourth quarter of 2010 when rateswere reset. The higher fees combined with higher debt levels as a result of greater capital spending in 2011 resulted in higherinterest and financing charges year over year. In addition, 2011 interest and financing charges include the amount expensed for thecapitalized fees on the previous syndicated credit facility as noted above.
GAIN ON INVESTMENTS
Pengrowth owns 1.0 million shares of a private corporation with an estimated fair value of $35 million. The fair value of theseshares has increased to $35 million as at December 31, 2011 resulting in an unrealized gain of $23 million in the fourth quarter of2011. The fair value is based on the most recent private placement equity offering closed by the private company. See Note 5 to thefinancial statements for additional information.
TAXES
Deferred income tax is a non-cash item relating to temporary differences between the accounting and tax basis of Pengrowth’sassets and liabilities and has no immediate impact on Pengrowth’s cash flows. During the year ended December 31, 2011,Pengrowth recorded deferred tax expense of $22.3 million (December 31, 2010 – $171.3 million). No current income taxes were paidby Pengrowth in 2011 and 2010. See Note 12 to the financial statements for additional information.
FOREIGN CURRENCY GAINS & LOSSES
Three months ended Twelve months ended($ millions) Dec 31, 2011 Sept 30, 2011 Dec 31, 2010 Dec 31, 2011 Dec 31, 2010
Unrealized foreign exchange gain (loss) onU.S. dollar denominated debt 28.8 (75.5) 31.0 (19.5) 50.7
Unrealized foreign exchange gain (loss) onU.K. pound sterling denominated debt 2.8 (4.3) 3.3 (1.4) 7.4
31.6 (79.8) 34.3 (20.9) 58.1
Unrealized (loss) gain on foreign exchange riskmanagement contract on U.K. pound sterlingdenominated debt (2.4) 3.4 (4.5) 1.8 (8.1)
Total Unrealized foreign exchange gain (loss) 29.2 (76.4) 29.7 (19.1) 49.9
Realized foreign exchange (loss) gain (0.6) (0.8) – (1.6) (2.1)
24 PENGROWTH 2011 Management’s Discussion & Analysis

Pengrowth’s unrealized foreign exchange gains and losses are primarily attributable to the translation of the foreign denominatedlong term debt. The gains or losses are calculated by comparing the translated Canadian dollar balance of foreign denominatedlong term debt from one period to another. The total unrealized foreign exchange gain in the fourth quarter was $29.2 millioncompared to an unrealized foreign exchange loss of $76.4 million and a gain of $29.7 million in the third quarter of 2011 and fourthquarter of 2010, respectively. The unrealized foreign exchange gain this quarter compared to the loss in the third quarter wasmainly the result of an increase in the closing exchange rate of the Canadian dollar to U.S. dollar since September 2011. The totalunrealized foreign exchange loss as at December 31, 2011 was $19.1 million, compared to an unrealized gain of $49.9 million as atDecember 31, 2010. The unrealized loss this year compared to the gain in the prior year was mainly the result of a decrease in theclosing exchange rate of the Canadian dollar to U.S. dollar since 2010.
As some realized commodity prices are derived from U.S. denominated benchmarks, a weaker U.S. dollar negatively impacts oil andgas revenues. To mitigate this, Pengrowth elects to hold a portion of its long term debt in U.S. dollars as a natural hedge. Therefore,a decline in revenues as a result of foreign exchange fluctuations will be partially offset by a reduction in U.S. dollar interestexpense.
ASSET RETIREMENT OBLIGATIONS
($ millions) Dec 31, 2011 Dec 31, 2010 ChangeARO, opening balance 447.1 450.6 (3.5)Revisions due to discount rate changes 206.6 90.9 115.7Expenditures on remediation (21.9) (20.9) (1.0)Accretion and Other (1) 29.1 (73.5) 102.6ARO, closing balance 660.9 447.1 213.8
(1) 2010 includes revision for inflation.
The total future ARO is based on management’s estimate of costs to remediate, reclaim and abandon wells and facilities havingregard for Pengrowth’s working interest and the estimated timing of the costs to be incurred in future periods. Pengrowth hasdeveloped an internal process to calculate these estimates which considers applicable regulations, actual and anticipated costs,type and size of well or facility and the geographic location.
For the year ended December 31, 2011, Pengrowth’s ARO liability increased by $213.8 million. The increase is mainly due to the AROdiscount rate being revised from three and one half percent per annum in the first six months of 2011 to three percent per annum inthe third quarter, and then to two and one half percent per annum in the fourth quarter to reflect changes to the underlying riskfree long term Government of Canada bond yield.
Pengrowth has estimated the net present value of its total ARO to be $660.9 million as at December 31, 2011 (December 31, 2010 –$447.1 million), based on a total escalated future liability of $1.8 billion (December 31, 2010 – $1.8 billion). These costs are expectedto be incurred over 65 years with the majority of the costs incurred between 2036 and 2077. A risk free rate of two and one halfpercent per annum and an inflation rate of one and one half percent were used to calculate the net present value of the ARO.
REMEDIATION TRUST FUNDS AND REMEDIATION AND ABANDONMENT EXPENSEDuring 2011, Pengrowth’s contributions were $7.1 million (December 31, 2010 – $7.6 million), into trust funds established to fundcertain abandonment and reclamation costs associated with Judy Creek and SOEP. The total balance of the remediation trust fundswas $49.7 million at December 31, 2011 (December 31, 2010 – $42.1 million).
Every five years Pengrowth must evaluate the value of the assets in the Judy Creek remediation trust fund and the outstanding ARO,and make recommendations to the former owner of the Judy Creek properties as to whether contribution levels should be changed.The next evaluation is anticipated to occur in 2012. Contributions to the Judy Creek remediation trust fund may change based onfuture evaluations of the fund.
As a working interest holder in SOEP, Pengrowth is under a contractual obligation to contribute to a remediation trust fund. Thefunding levels are based on the raw gas delivered and processed at the various facilities; funding levels for this fund may changeeach year pending a review by the owners.
Pengrowth takes a proactive approach to managing its well abandonment and site restoration obligations. There is an on-goingprogram to abandon wells and reclaim well and facility sites. Through December 31, 2011, Pengrowth spent $21.9 million onabandonment and reclamation (December 31, 2010 – $20.9 million). Pengrowth expects to spend approximately $18.5 million in2012 on reclamation and abandonment, excluding contributions to remediation trust funds and orphan well levies from the AlbertaEnergy Resources Conservation Board.
PENGROWTH 2011 Management’s Discussion & Analysis 25

CLIMATE CHANGE PROGRAMS
Since becoming effective July 1, 2007, Alberta regulates Greenhouse Gas (“GHG”) emissions under the Climate Change andEmissions Management Act, the Specified Gas Reporting Regulation (the “SGRR”), which imposes GHG emissions reportingrequirements, and the Specified Gas Emitters Regulation (the “SGER”) which imposes GHG emissions limits. These regulationsrequire Alberta facilities that emit more than 100,000 tonnes of greenhouse gases a year to reduce emissions intensity by 12percent over the average baseline emission levels of 2003, 2004 and 2005. Companies can make their reductions throughimprovements to their operations; by purchasing Alberta-based offset credits or by contributing to the Climate Change andEmissions Management Fund. Pengrowth in 2011 operated two facilities that are subject to the Alberta climate change regulationswhere a 12 percent reduction from the baseline is required. Collectively, these facilities have reduced emissions by approximately34 percent exceeding current-day requirements. Further reductions to baseline targets may occur and Pengrowth is assessingoptions for meeting future changes to greenhouse gas emission requirements. If the emissions remain at the current levels and thebaseline is modified, Pengrowth may experience additional annual costs of as much as $0.5 million for the acquisition of creditsrelating to the facilities. Unutilized credits from one year may be carried forward to future years. For further information, seePengrowth’s AIF. Pengrowth is waiting on additional information from other jurisdictions to assess the impact it will have on itsoperations.
GOODWILL
In accordance with IFRS, goodwill is tested for impairment at each year end, or when there is an indication of impairment, inconjunction with the assessment of impairment of property, plant and equipment. As at December 31, 2011, Pengrowth recordedgoodwill of $700.7 million. Goodwill decreased by $16.3 million in the current year due to an impairment of the producing portion ofthe Groundbirch property acquired in the Monterey Exploration Ltd. business combination. See Notes 4 and 8 to the financialstatements for details. Management has assessed the remaining goodwill for impairment and determined there is no additionalimpairment at December 31, 2011.
WORKING CAPITAL
The working capital deficiency at December 31, 2011 was $137.3 million, compared to $109.2 million at December 31, 2010.
FINANCIAL RESOURCES AND LIQUIDITY
As at: Dec 31, 2011 Dec 31, 2010 Change
($ millions)Term credit facilities $ – $ 39.0 $ (39.0)
Senior unsecured notes 1,007.7 985.4 22.3
Long term debt 1,007.7 1,024.4 (16.7)
Working capital deficiency 137.3 109.2 28.1
Total debt $1,145.0 $1,133.6 $ 11.4
Years Ended Dec 31 2011 Dec 31 2010 Change
Net income $ 84.5 $ 149.8 $ (65.3)
Add:
Interest and financing charges 75.9 70.5 5.4
Deferred tax expense 22.3 171.3 (149.0)
Depletion, depreciation, amortization and accretion 453.5 450.1 3.4
Impairment of assets 27.4 – 27.4
Other non-cash expenses (income) 34.8 (145.4) 180.2
EBITDA $ 698.4 $ 696.3 $ 2.1
Total debt to EBITDA 1.6 1.6
Total Capitalization (1) $4,492.3 $4,315.9 $ 176.4
Total debt as a percentage of total capitalization 25.5% 26.3%
(1) Total capitalization includes total outstanding debt plus Shareholders’ Equity. Total outstanding debt includes working capital deficit (excess).
26 PENGROWTH 2011 Management’s Discussion & Analysis

As at December 31, 2011, long term debt decreased by $16.7 million from December 31, 2010. In November 2011, Pengrowthcompleted an equity offering for net proceeds of $288.1 million which was used primarily to pay down amounts owing on therevolving credit facility as a result of an increased capital program in 2011. The decrease in long term debt was offset by an increaseof $21.0 million due to foreign currency translation losses of approximately $19.6 million on the U.S. dollar denominated debt, and$1.4 million on the U.K. pound sterling denominated debt. The decrease in debt resulted in a trailing 12 month Total Debt to EBITDAratio at December 31, 2011 of 1.6x which is within corporate targets.
Term Credit Facilities
At December 31, 2011, Pengrowth’s revolving credit facility was undrawn (December 31, 2010 – $39 million) and letters of credit of$24 million (December 31, 2010 – $18 million) were outstanding. The credit facility includes a committed value of $1 billion and a$250 million expansion feature providing Pengrowth with up to $1.25 billion of credit capacity from a syndicate of seven Canadianand three foreign banks. The revolving credit facility matures on November 29, 2015 and can be extended at Pengrowth’s discretionany time prior to maturity subject to syndicate approval.
Pengrowth also maintains a $50 million demand operating facility with one Canadian bank. As at December 31, 2011, this facilitywas undrawn (December 31, 2010 – $22 million) and $1.5 million (December 31, 2010 – $5 million) in outstanding letters of creditwere outstanding. When utilized, this facility appears on the Balance Sheet as a current liability in Bank indebtedness.
Together, these two facilities provide Pengrowth with approximately $1,062 million of available credit capacity at December 31,2011, with the ability to expand the facilities by an additional $250 million.
Financial Covenants
Pengrowth’s senior unsecured notes and credit facilities are subject to a number of covenants, all of which were met at all timesduring the preceding twelve months, and at December 31, 2011. All loan agreements can be found on SEDAR (www.sedar.com) filedunder “Other” or “Material Document”.
The calculation for each financial covenant is based on specific definitions, is not in accordance with GAAP and cannot be readilyreplicated by referring to Pengrowth’s financial statements. The financial covenants are substantially similar between the creditfacilities and the senior unsecured notes.
Key financial covenants are summarized below:
1. Total senior debt must not exceed 3.0 times EBITDA for the last four fiscal quarters;
2. Total debt must not exceed 3.5 times EBITDA for the last four fiscal quarters;
3. Total senior debt (excluding working capital) must be less than 50 percent of total book capitalization; and
4. EBITDA must not be less than four times interest expense.
There may be instances, such as financing an acquisition, where it would be acceptable for total debt to trailing EBITDA to betemporarily offside. In the event of a significant acquisition, certain credit facility financial covenants are relaxed for two fiscalquarters after the close of the acquisition. Pengrowth may prepare pro forma financial statements for debt covenant purposes andhas additional flexibility under its debt covenants for a set period of time. This would be a strategic decision recommended bymanagement and approved by the Board of Directors with steps taken in the subsequent period to restore Pengrowth’s capitalstructure based on its capital management objectives.
Failing a financial covenant may result in one or more of Pengrowth’s loans being in default. In certain circumstances, being indefault of one loan will, absent a cure, result in other loans also being in default. In the event that non-compliance continued,Pengrowth would have to repay, refinance or re-negotiate the terms and conditions of the debt and may have to suspend dividendsto shareholders.
If certain financial ratios reach or exceed certain levels, management may consider steps to improve these ratios. These steps mayinclude, but are not limited to, raising equity, property dispositions, reducing capital expenditures or dividends. Details of thesemeasures are included in Note 17 to the December 31, 2011, financial statements.
Dividend Reinvestment Plan
Pengrowth’s Dividend Reinvestment Plan (“DRIP”) entitles shareholders to reinvest cash dividends in additional shares of theCorporation. Under the DRIP, the shares are issued from treasury at a five percent discount to the weighted average closing price ofall shares traded on the TSX for the five trading days preceding a dividend payment date.
PENGROWTH 2011 Management’s Discussion & Analysis 27
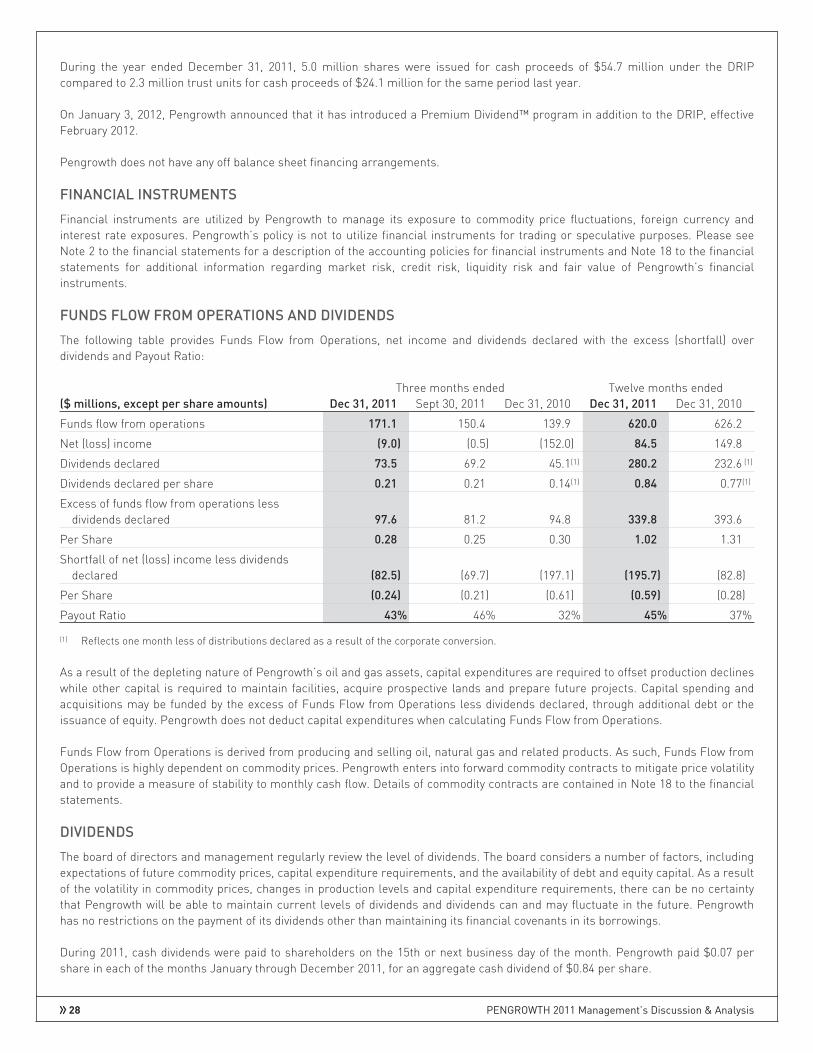
During the year ended December 31, 2011, 5.0 million shares were issued for cash proceeds of $54.7 million under the DRIPcompared to 2.3 million trust units for cash proceeds of $24.1 million for the same period last year.
On January 3, 2012, Pengrowth announced that it has introduced a Premium Dividend™ program in addition to the DRIP, effectiveFebruary 2012.
Pengrowth does not have any off balance sheet financing arrangements.
FINANCIAL INSTRUMENTS
Financial instruments are utilized by Pengrowth to manage its exposure to commodity price fluctuations, foreign currency andinterest rate exposures. Pengrowth’s policy is not to utilize financial instruments for trading or speculative purposes. Please seeNote 2 to the financial statements for a description of the accounting policies for financial instruments and Note 18 to the financialstatements for additional information regarding market risk, credit risk, liquidity risk and fair value of Pengrowth’s financialinstruments.
FUNDS FLOW FROM OPERATIONS AND DIVIDENDS
The following table provides Funds Flow from Operations, net income and dividends declared with the excess (shortfall) overdividends and Payout Ratio:
Three months ended Twelve months ended($ millions, except per share amounts) Dec 31, 2011 Sept 30, 2011 Dec 31, 2010 Dec 31, 2011 Dec 31, 2010
Funds flow from operations 171.1 150.4 139.9 620.0 626.2
Net (loss) income (9.0) (0.5) (152.0) 84.5 149.8
Dividends declared 73.5 69.2 45.1(1) 280.2 232.6 (1)
Dividends declared per share 0.21 0.21 0.14(1) 0.84 0.77(1)
Excess of funds flow from operations lessdividends declared 97.6 81.2 94.8 339.8 393.6
Per Share 0.28 0.25 0.30 1.02 1.31
Shortfall of net (loss) income less dividendsdeclared (82.5) (69.7) (197.1) (195.7) (82.8)
Per Share (0.24) (0.21) (0.61) (0.59) (0.28)
Payout Ratio 43% 46% 32% 45% 37%
(1) Reflects one month less of distributions declared as a result of the corporate conversion.
As a result of the depleting nature of Pengrowth’s oil and gas assets, capital expenditures are required to offset production declineswhile other capital is required to maintain facilities, acquire prospective lands and prepare future projects. Capital spending andacquisitions may be funded by the excess of Funds Flow from Operations less dividends declared, through additional debt or theissuance of equity. Pengrowth does not deduct capital expenditures when calculating Funds Flow from Operations.
Funds Flow from Operations is derived from producing and selling oil, natural gas and related products. As such, Funds Flow fromOperations is highly dependent on commodity prices. Pengrowth enters into forward commodity contracts to mitigate price volatilityand to provide a measure of stability to monthly cash flow. Details of commodity contracts are contained in Note 18 to the financialstatements.
DIVIDENDS
The board of directors and management regularly review the level of dividends. The board considers a number of factors, includingexpectations of future commodity prices, capital expenditure requirements, and the availability of debt and equity capital. As a resultof the volatility in commodity prices, changes in production levels and capital expenditure requirements, there can be no certaintythat Pengrowth will be able to maintain current levels of dividends and dividends can and may fluctuate in the future. Pengrowthhas no restrictions on the payment of its dividends other than maintaining its financial covenants in its borrowings.
During 2011, cash dividends were paid to shareholders on the 15th or next business day of the month. Pengrowth paid $0.07 pershare in each of the months January through December 2011, for an aggregate cash dividend of $0.84 per share.
28 PENGROWTH 2011 Management’s Discussion & Analysis

SUMMARY OF QUARTERLY RESULTSThe following table is a summary of quarterly information for 2011 and 2010.
2011 Q1 Q2 Q3 Q4
Oil and gas sales ($ millions) (1) 340.9 356.7 366.9 389.2
Net income (loss) ($ millions) 5.4 88.5 (0.5) (9.0)
Net income (loss) per share ($) 0.02 0.27 – (0.03)
Net income (loss) per share - diluted ($) 0.02 0.27 – (0.03)
Funds flow from operations ($ millions) 146.8 151.7 150.4 171.1
Dividends declared ($ millions) 68.6 68.9 69.2 73.5
Dividends declared per share ($) 0.21 0.21 0.21 0.21
Daily production (boe) 73,634 70,958 74,568 76,691
Total production (Mboe) 6,627 6,457 6,860 7,056
Average realized price ($ per boe) 51.15 54.41 52.68 54.28
Operating netback ($ per boe) 27.64 28.97 27.15 29.99
2010 Q1 Q2 Q3 Q4
Oil and gas sales ($ millions) (1) 362.7 340.8 320.3 344.9
Net income (loss) ($ millions) 139.0 18.2 144.6 (152.0)
Net income (loss) per share ($) 0.48 0.06 0.49 (0.47)
Net income (loss) per share - diluted ($) 0.48 0.06 0.48 (0.47)
Funds flow from operations ($ millions) 161.5 175.5 149.3 139.9
Dividends declared ($ millions) 61.0 61.2 65.3 45.1(2)
Distributions declared per unit ($) 0.21 0.21 0.21 0.14(2)
Daily production (boe) 75,627 75,517 72,704 74,953
Total production (Mboe) 6,806 6,872 6,689 6,896
Average realized price ($ per boe) (1) 52.79 49.17 47.39 49.34
Operating netback ($ per boe) (1) 28.24 27.75 26.64 25.02
(1) Prior period restated to conform to presentation in the current period.(2) Reflects one month less of distribution declared as a result of the corporate conversion.
In addition to natural decline, production changes over these quarters was a result of production limitations due to first quarter2011 unscheduled pipeline outage, second quarter 2011 scheduled maintenance shutdowns and restrictions due to flooding andforest fires and unscheduled maintenance in the third quarter of 2010 partly offset by the Monterey acquisition in the third quarterof 2010. Changes in commodity prices have affected oil and gas sales, which have been partially muted by risk management activityto mitigate price volatility and to provide a measure of stability to monthly cash flow. Quarterly net income (loss) has also beenimpacted by non-cash charges, in particular depletion, depreciation and amortization, impairment charges, unrealized gains oninvestments, accretion of ARO, unrealized mark-to-market gains and losses, unrealized foreign exchange gains and losses, andfuture taxes. Funds flow was also impacted by changes in royalty expense, operating and general and administrative costs.
PENGROWTH 2011 Management’s Discussion & Analysis 29
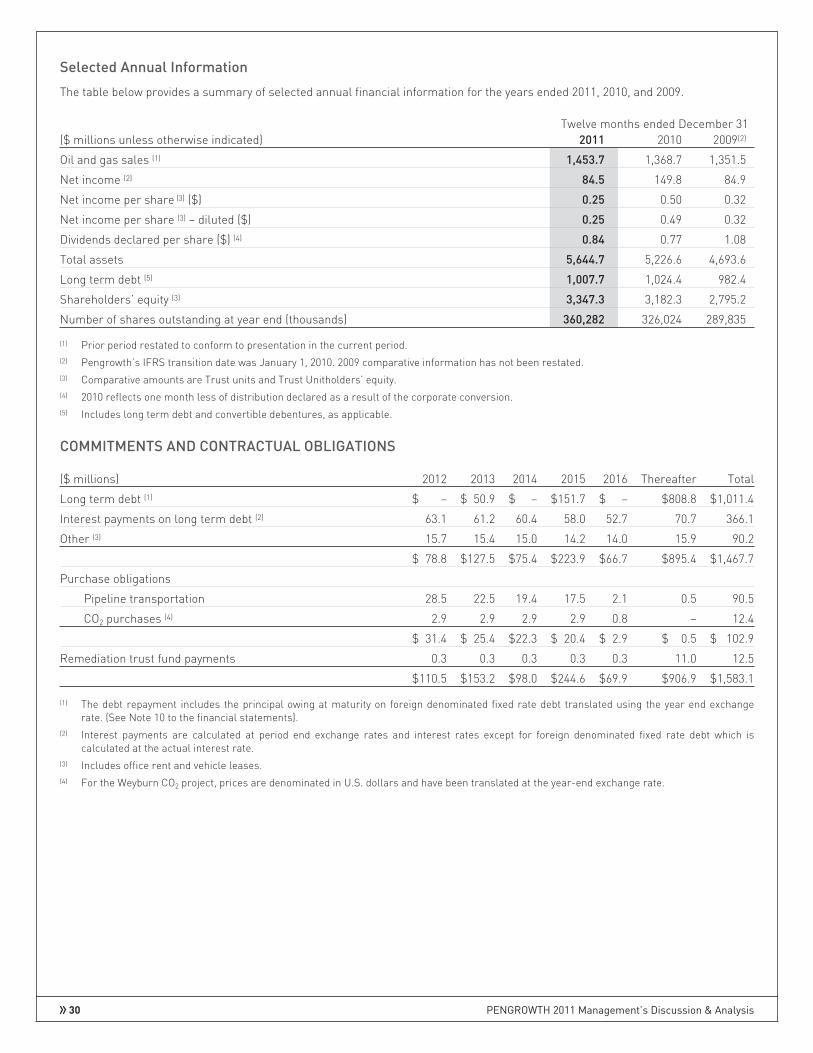
Selected Annual Information
The table below provides a summary of selected annual financial information for the years ended 2011, 2010, and 2009.
Twelve months ended December 31($ millions unless otherwise indicated) 2011 2010 2009(2)
Oil and gas sales (1) 1,453.7 1,368.7 1,351.5
Net income (2) 84.5 149.8 84.9
Net income per share (3) ($) 0.25 0.50 0.32
Net income per share (3) – diluted ($) 0.25 0.49 0.32
Dividends declared per share ($) (4) 0.84 0.77 1.08
Total assets 5,644.7 5,226.6 4,693.6
Long term debt (5) 1,007.7 1,024.4 982.4
Shareholders’ equity (3) 3,347.3 3,182.3 2,795.2
Number of shares outstanding at year end (thousands) 360,282 326,024 289,835
(1) Prior period restated to conform to presentation in the current period.(2) Pengrowth’s IFRS transition date was January 1, 2010. 2009 comparative information has not been restated.(3) Comparative amounts are Trust units and Trust Unitholders’ equity.(4) 2010 reflects one month less of distribution declared as a result of the corporate conversion.(5) Includes long term debt and convertible debentures, as applicable.
COMMITMENTS AND CONTRACTUAL OBLIGATIONS
($ millions) 2012 2013 2014 2015 2016 Thereafter Total
Long term debt (1) $ – $ 50.9 $ – $151.7 $ – $808.8 $1,011.4
Interest payments on long term debt (2) 63.1 61.2 60.4 58.0 52.7 70.7 366.1
Other (3) 15.7 15.4 15.0 14.2 14.0 15.9 90.2
$ 78.8 $127.5 $75.4 $223.9 $66.7 $895.4 $1,467.7
Purchase obligations
Pipeline transportation 28.5 22.5 19.4 17.5 2.1 0.5 90.5
CO2 purchases (4) 2.9 2.9 2.9 2.9 0.8 – 12.4
$ 31.4 $ 25.4 $22.3 $ 20.4 $ 2.9 $ 0.5 $ 102.9
Remediation trust fund payments 0.3 0.3 0.3 0.3 0.3 11.0 12.5
$110.5 $153.2 $98.0 $244.6 $69.9 $906.9 $1,583.1
(1) The debt repayment includes the principal owing at maturity on foreign denominated fixed rate debt translated using the year end exchangerate. (See Note 10 to the financial statements).
(2) Interest payments are calculated at period end exchange rates and interest rates except for foreign denominated fixed rate debt which iscalculated at the actual interest rate.
(3) Includes office rent and vehicle leases.(4) For the Weyburn CO2 project, prices are denominated in U.S. dollars and have been translated at the year-end exchange rate.
30 PENGROWTH 2011 Management’s Discussion & Analysis
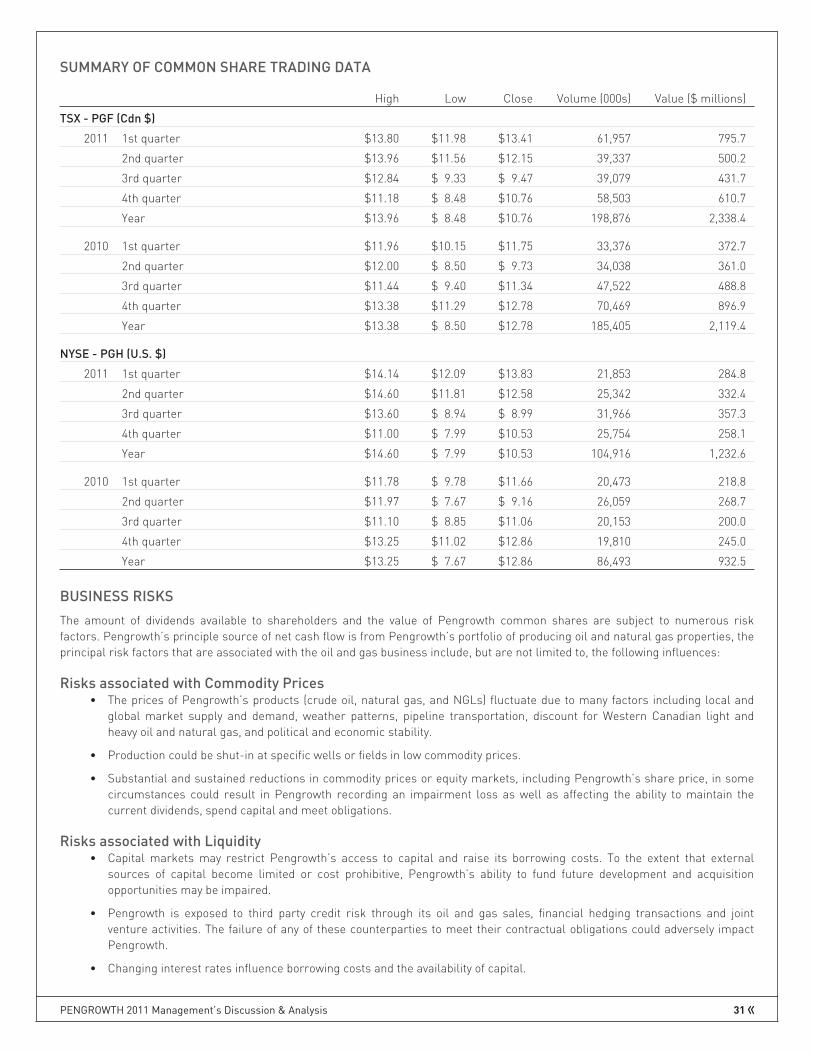
SUMMARY OF COMMON SHARE TRADING DATA
High Low Close Volume (000s) Value ($ millions)
TSX - PGF (Cdn $)
2011 1st quarter $13.80 $11.98 $13.41 61,957 795.7
2nd quarter $13.96 $11.56 $12.15 39,337 500.2
3rd quarter $12.84 $ 9.33 $ 9.47 39,079 431.7
4th quarter $11.18 $ 8.48 $10.76 58,503 610.7
Year $13.96 $ 8.48 $10.76 198,876 2,338.4
2010 1st quarter $11.96 $10.15 $11.75 33,376 372.7
2nd quarter $12.00 $ 8.50 $ 9.73 34,038 361.0
3rd quarter $11.44 $ 9.40 $11.34 47,522 488.8
4th quarter $13.38 $11.29 $12.78 70,469 896.9
Year $13.38 $ 8.50 $12.78 185,405 2,119.4
NYSE - PGH (U.S. $)
2011 1st quarter $14.14 $12.09 $13.83 21,853 284.8
2nd quarter $14.60 $11.81 $12.58 25,342 332.4
3rd quarter $13.60 $ 8.94 $ 8.99 31,966 357.3
4th quarter $11.00 $ 7.99 $10.53 25,754 258.1
Year $14.60 $ 7.99 $10.53 104,916 1,232.6
2010 1st quarter $11.78 $ 9.78 $11.66 20,473 218.8
2nd quarter $11.97 $ 7.67 $ 9.16 26,059 268.7
3rd quarter $11.10 $ 8.85 $11.06 20,153 200.0
4th quarter $13.25 $11.02 $12.86 19,810 245.0
Year $13.25 $ 7.67 $12.86 86,493 932.5
BUSINESS RISKS
The amount of dividends available to shareholders and the value of Pengrowth common shares are subject to numerous riskfactors. Pengrowth’s principle source of net cash flow is from Pengrowth’s portfolio of producing oil and natural gas properties, theprincipal risk factors that are associated with the oil and gas business include, but are not limited to, the following influences:
Risks associated with Commodity Prices• The prices of Pengrowth’s products (crude oil, natural gas, and NGLs) fluctuate due to many factors including local and
global market supply and demand, weather patterns, pipeline transportation, discount for Western Canadian light andheavy oil and natural gas, and political and economic stability.
• Production could be shut-in at specific wells or fields in low commodity prices.
• Substantial and sustained reductions in commodity prices or equity markets, including Pengrowth’s share price, in somecircumstances could result in Pengrowth recording an impairment loss as well as affecting the ability to maintain thecurrent dividends, spend capital and meet obligations.
Risks associated with Liquidity• Capital markets may restrict Pengrowth’s access to capital and raise its borrowing costs. To the extent that external
sources of capital become limited or cost prohibitive, Pengrowth’s ability to fund future development and acquisitionopportunities may be impaired.
• Pengrowth is exposed to third party credit risk through its oil and gas sales, financial hedging transactions and jointventure activities. The failure of any of these counterparties to meet their contractual obligations could adversely impactPengrowth.
• Changing interest rates influence borrowing costs and the availability of capital.
PENGROWTH 2011 Management’s Discussion & Analysis 31
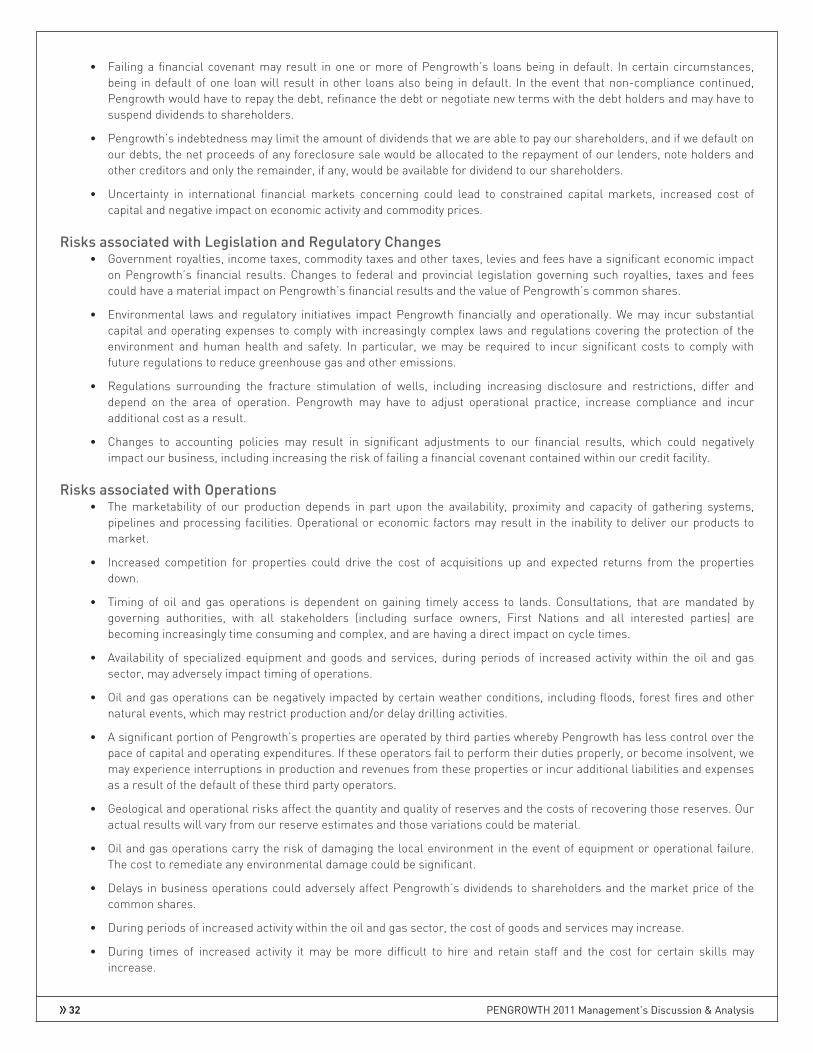
• Failing a financial covenant may result in one or more of Pengrowth’s loans being in default. In certain circumstances,being in default of one loan will result in other loans also being in default. In the event that non-compliance continued,Pengrowth would have to repay the debt, refinance the debt or negotiate new terms with the debt holders and may have tosuspend dividends to shareholders.
• Pengrowth’s indebtedness may limit the amount of dividends that we are able to pay our shareholders, and if we default onour debts, the net proceeds of any foreclosure sale would be allocated to the repayment of our lenders, note holders andother creditors and only the remainder, if any, would be available for dividend to our shareholders.
• Uncertainty in international financial markets concerning could lead to constrained capital markets, increased cost ofcapital and negative impact on economic activity and commodity prices.
Risks associated with Legislation and Regulatory Changes• Government royalties, income taxes, commodity taxes and other taxes, levies and fees have a significant economic impact
on Pengrowth’s financial results. Changes to federal and provincial legislation governing such royalties, taxes and feescould have a material impact on Pengrowth’s financial results and the value of Pengrowth’s common shares.
• Environmental laws and regulatory initiatives impact Pengrowth financially and operationally. We may incur substantialcapital and operating expenses to comply with increasingly complex laws and regulations covering the protection of theenvironment and human health and safety. In particular, we may be required to incur significant costs to comply withfuture regulations to reduce greenhouse gas and other emissions.
• Regulations surrounding the fracture stimulation of wells, including increasing disclosure and restrictions, differ anddepend on the area of operation. Pengrowth may have to adjust operational practice, increase compliance and incuradditional cost as a result.
• Changes to accounting policies may result in significant adjustments to our financial results, which could negativelyimpact our business, including increasing the risk of failing a financial covenant contained within our credit facility.
Risks associated with Operations• The marketability of our production depends in part upon the availability, proximity and capacity of gathering systems,
pipelines and processing facilities. Operational or economic factors may result in the inability to deliver our products tomarket.
• Increased competition for properties could drive the cost of acquisitions up and expected returns from the propertiesdown.
• Timing of oil and gas operations is dependent on gaining timely access to lands. Consultations, that are mandated bygoverning authorities, with all stakeholders (including surface owners, First Nations and all interested parties) arebecoming increasingly time consuming and complex, and are having a direct impact on cycle times.
• Availability of specialized equipment and goods and services, during periods of increased activity within the oil and gassector, may adversely impact timing of operations.
• Oil and gas operations can be negatively impacted by certain weather conditions, including floods, forest fires and othernatural events, which may restrict production and/or delay drilling activities.
• A significant portion of Pengrowth’s properties are operated by third parties whereby Pengrowth has less control over thepace of capital and operating expenditures. If these operators fail to perform their duties properly, or become insolvent, wemay experience interruptions in production and revenues from these properties or incur additional liabilities and expensesas a result of the default of these third party operators.
• Geological and operational risks affect the quantity and quality of reserves and the costs of recovering those reserves. Ouractual results will vary from our reserve estimates and those variations could be material.
• Oil and gas operations carry the risk of damaging the local environment in the event of equipment or operational failure.The cost to remediate any environmental damage could be significant.
• Delays in business operations could adversely affect Pengrowth’s dividends to shareholders and the market price of thecommon shares.
• During periods of increased activity within the oil and gas sector, the cost of goods and services may increase.
• During times of increased activity it may be more difficult to hire and retain staff and the cost for certain skills mayincrease.
32 PENGROWTH 2011 Management’s Discussion & Analysis

• Attacks by individuals against facilities and the threat of such attacks may have an adverse impact on Pengrowth and theimplementation of security measures as a precaution against possible attacks would result in increased cost toPengrowth’s business.
• Actual production and reserves will vary from estimates, and those variations could be material and may negatively affectthe market price of the common shares and dividends to our shareholders.
• Delays or failure to secure regulatory approvals for Steam Assisted Gravity Drainage (“SAGD”) projects may result incapital being spent with reduced economics, reduced or no further reserves being booked, and reduced or no associatedfuture production and cash flow.
• The performance and results of a SAGD project such as Lindbergh is dependent on the ability of the steam to access thereservoir and efficiently move additional heavy oil that would otherwise remain trapped within the reservoir rock. Theamount and cost of steam required, the additional oil recovered, the quality of the oil produced, the ability to recycleproduced water into steam and the ability to manage costs will determine the economic viability for a SAGD project.
Risks associated with Strategy• Capital re-investment on our existing assets may not yield the expected benefits and related value creation. Drilling
opportunities may prove to be more costly or less productive than anticipated. In addition, the dedication of a largerpercentage of our cash flow to such opportunities may reduce the funds available for dividend payment to shareholders. Insuch an event, the market value of the common shares may be adversely affected.
• Pengrowth’s oil and gas reserves will be depleted over time and our level of cash flow from operations and the value of ourcommon shares could be reduced if reserves and production are not replaced. The ability to replace production dependson the amount of capital invested and success in developing existing reserves, acquiring new reserves and financing thisdevelopment and acquisition activity within the context of the capital markets.
• Incorrect assessments of value at the time of acquisitions could adversely affect the value of our common shares anddividends to our shareholders.
• Our dividends and the market price of the common shares could be adversely affected by unforeseen title defects, whichcould reduce dividends to our shareholders.
General Business Risks• Investors’ interest in the oil and gas sector may change over time which would affect the availability of capital and the
value of Pengrowth common shares.
• Inflation may result in escalating costs, which could impact dividends and the value of Pengrowth common shares.
• Canadian / U.S. exchange rates influence revenues and, to a lesser extent, operating and capital costs. Pengrowth is alsoexposed to foreign currency fluctuations on the U.S. dollar denominated notes for both interest and principal payments.
• The ability of investors resident in the United States to enforce civil remedies may be negatively affected for a number ofreasons.
• As the unit of measure is smaller under IFRS, it may lead to more frequent impairments at the individual CGU level as asurplus from one asset will no longer shelter a deficit in another.
• Failure to receive regulatory approval or the expiry of the rights to explore for E&E assets could lead to the impairment ofE&E assets.
These factors should not be considered exhaustive. Additional risks are outlined in the AIF of the Corporation available on SEDAR atwww.sedar.com.
OUTLOOK
Pengrowth currently anticipates a 2012 capital program, excluding acquisitions, of $625 million, an increase of three percent from2011 net capital expenditures of $609.1 million. Pengrowth’s operated 2012 capital program is 100 percent focused on developmentof oil and liquids rich gas plays, with the majority of the capital to be spent in the three key areas of Swan Hills ($255 million), theOlds area ($85 million) and the Lindbergh SAGD ($59 million).
Execution of Pengrowth’s 2012 capital program is expected to generate full year average production of between 74,500 and 76,500boe per day, an increase of approximately two percent from our full year 2011 average production of 73,973 boe per day.Pengrowth’s average production estimate for 2012 excludes any production associated with the Lindbergh pilot project.
PENGROWTH 2011 Management’s Discussion & Analysis 33

2012 operating expenses are forecast to be $384 million, essentially flat to 2011, however Pengrowth expects operating costs perboe to decrease to $13.89 due to additional production volumes.
Total G&A costs are expected to decrease for 2012 to $2.68 per boe when compared to the full year 2011 costs of $2.79 per boe.Included in Pengrowth’s 2012 G&A forecast are non-cash G&A costs of approximately $0.49 per boe compared to $0.41 per boein 2011.
INTERNATIONAL FINANCIAL REPORTING STANDARDS (IFRS)
On January 1, 2011, Pengrowth adopted International Financial Reporting Standards (“IFRS”) for financial reporting purposes, usinga transition date of January 1, 2010. The financial statements for the year ended December 31, 2011 have been prepared inaccordance with IFRS. Required comparative information has been restated from the previously published financial statementswhich were prepared in accordance with Canadian Generally Accepted Accounting Principles (“previous GAAP”). The adoption ofIFRS has not had an impact on Pengrowth’s operations, capital expenditures and overall cash flows. The most significant changesunder IFRS relate to Pengrowth’s accounting policies on Property, Plant and Equipment (PP&E), Asset Retirement Obligations(ARO) and Deferred Income Taxes. Pengrowth also adopted certain presentation policies that differ from previous GAAP. Thefollowing discusses the significant differences on the balances as at and for the three months and twelve months endedDecember 31, 2010 under IFRS compared to the amounts published under previous GAAP.
• Property, Plant & Equipment (PP&E)
• Depletion
• Under previous GAAP, Pengrowth used total proved reserves in determining depletion. Under IFRS, the carryingamount of property, plant and equipment is depleted or amortized over the useful life of the assets. Pengrowth hasdetermined that depleting on a total proved plus probable reserves basis better approximates the useful life of theassets.
• Depletion was calculated using a unit of production method on the full cost pool of assets under previous GAAP.Under IFRS, depletion is calculated on a unit of production method at a field or group of fields.
• These changes resulted in a lower depletion expense under IFRS compared to previous GAAP by approximately $27million for the three months ended December 31, 2010 and $112 million for the year ended December 31, 2010.
• Divestitures
• Under previous GAAP, proceeds of divestitures of assets were deducted from the full cost pool without the recognitionof a gain or loss unless the divesture resulted in a change in the full cost depletion rate of 20 percent or more. UnderIFRS, gains or losses on disposition of assets are measured as the difference between the proceeds and carryingvalue of the assets divested.
• Pengrowth recorded a gain of approximately $7 million in the three months ended December 31, 2010 and $18 millionfor the year ended December 31, 2010.
• Under IFRS, the gain on equity investment was disclosed below the determination of operating income.
• Impairment testing
• Under IFRS, PP&E is grouped into Cash Generating Units (“CGU”) based on their ability to generate largelyindependent cash flows. Impairment is recognized if the carrying value of a CGU exceeds the greater of the fair valueof the CGU or its value in use.
• As CGUs are smaller groups of assets, impairments are expected to be recognized more frequently under IFRS. As ofJanuary 1, 2010 and December 31, 2010, no impairment was determined.
• Under previous GAAP, impairment was recognized if the aggregated carrying value of the full cost pool exceeded theundiscounted cash flows from proved reserves. The amount of the impairment was the excess of the carrying value ofthe assets over the fair value of the proved plus probable reserves and the cost of unproven properties.
• ARO
• Discount Rate
• Under previous GAAP, Pengrowth was required to use a credit adjusted discount rate in estimating the ARO, whichwas eight percent at the date of transition. Under IFRS, Pengrowth’s policy is to estimate the ARO using a risk freediscount rate on January 1, 2010.
34 PENGROWTH 2011 Management’s Discussion & Analysis

• The effect of using a risk free discount rate of four percent resulted in an increase of $360 million to the ARO liabilityas at January 1, 2010 which was partly offset by changes to timing and cost estimates of $198 million on transition toIFRS. Accretion of ARO has decreased by approximately $1 million per quarter in 2010 as a result of using a lowerdiscount rate.
• As of December 31, 2010, an inflation rate of one and one half percent per annum and a discount rate of three and onehalf percent per annum was used to calculate the ARO liability. Under previous GAAP, a credit adjusted discount rateof eight percent per annum and inflation rate of one and one half percent per annum was used. As a result, the AROliability under IFRS was $447 million as at December 31, 2010 as compared to $260 million as at December 31, 2010under previous GAAP. Expected future escalated costs related to ARO were increased to $1,823 million as atDecember 31, 2010 as compared to $1,790 million as at December 31, 2010 under previous GAAP.
• In addition, more frequent revisions of the ARO liability are expected due to fluctuations in the risk free rate.
• Deferred Income Taxes
• Each of the adjustments discussed above resulted in a change in deferred income taxes based on Pengrowth’seffective tax rate.
• In addition, taxable temporary differences in the legal entity financial statements of Pengrowth Energy Trust wererequired to be measured using the top marginal personal tax rate of 39 percent, resulting in a reduction to deferredincome tax liability of $164 million on transition on January 1, 2010. This IFRS adjustment, plus an additional $23million of temporary differences incurred during 2010, was reversed through deferred tax expense and shareholders’capital upon conversion to a corporation on December 31, 2010.
• Deferred tax expense of $35 million was recorded on IFRS adjustments to the 2010 income statement.
• Reclassifications
• Under previous GAAP, interest and financing charges, realized foreign exchange loss (gain), unrealized foreignexchange loss (gain), and accretion were disclosed as separate line items in the Statement of (Loss) Income. UnderIFRS, these amounts were unchanged, but reported below the determination of operating income.
• Under previous GAAP, amortization of injectants for miscible floods was disclosed separately; under IFRSamortization of injectants for miscible floods is included with depletion, depreciation and amortization. Interest paid isdisclosed as a financing item in the Statement of Cash Flow.
• Purchases of injectants are classified as a use of cash for investing activities under IFRS.
• The Statement of Cash Flow includes a subtotal for Funds Flow from Operations which is determined as cash flowfrom operations after interest and financing charges but before changes in working capital and expenditures onremediation. Management believes that in addition to cash provided by operations, Funds Flow from Operations is auseful supplemental measure as it demonstrates the company’s ability to generate cash flow necessary to funddividends and capital investments.
Pengrowth’s IFRS accounting policies are provided in Note 2 to the December 31, 2011 annual financial statements. In addition,Note 23 to the annual financial statements presents reconciliations between Pengrowth’s 2010 previous GAAP results and the 2010IFRS results. The reconciliations include January 1, 2010, and December 31, 2010 Balance Sheets as well as Statements of Incomeand Statements of Cash Flow for the year ended December 31, 2010.
FUTURE CHANGES IN ACCOUNTING POLICIES
IFRS 9: Financial Instruments (“IFRS 9”)
IFRS 9 is expected to be published in three parts. The first part, Phase 1—classification and measurement of financial instruments(“IFRS 9, Phase 1”), was published in October 2010.
IFRS 9, Phase 1, sets out the requirements for recognizing and measuring financial assets, financial liabilities and some contractsto buy or sell non-financial items. IFRS 9, Phase 1 simplifies measurement of financial asset by classifying all financial assets asthose being recorded at amortized cost or being recorded at fair value. For financial assets recorded at fair value, any change in thefair value would be recognized in profit or loss. IFRS 9, Phase 1, is required to be adopted for years beginning on or after January 1,2015 although earlier adoption is allowed. Pengrowth has not made any decision as to early adoption. Pengrowth is currentlyassessing the impact of this new standard.
PENGROWTH 2011 Management’s Discussion & Analysis 35
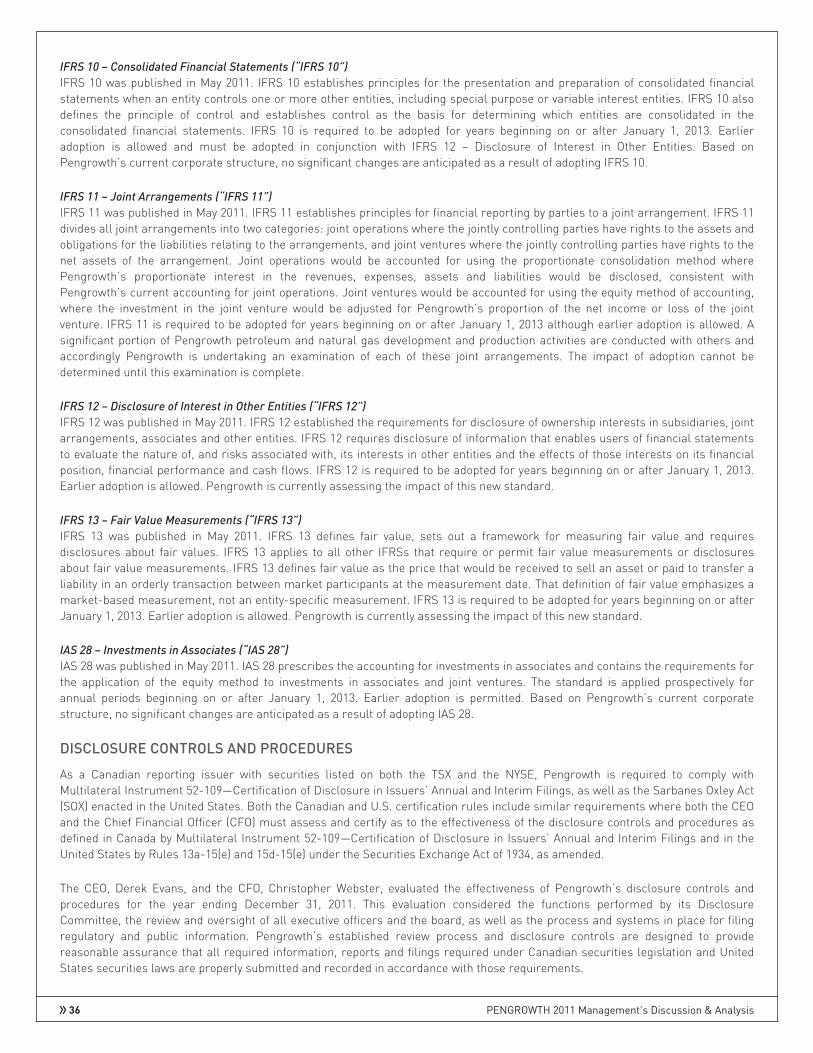
IFRS 10 – Consolidated Financial Statements (“IFRS 10”)
IFRS 10 was published in May 2011. IFRS 10 establishes principles for the presentation and preparation of consolidated financialstatements when an entity controls one or more other entities, including special purpose or variable interest entities. IFRS 10 alsodefines the principle of control and establishes control as the basis for determining which entities are consolidated in theconsolidated financial statements. IFRS 10 is required to be adopted for years beginning on or after January 1, 2013. Earlieradoption is allowed and must be adopted in conjunction with IFRS 12 – Disclosure of Interest in Other Entities. Based onPengrowth’s current corporate structure, no significant changes are anticipated as a result of adopting IFRS 10.
IFRS 11 – Joint Arrangements (“IFRS 11”)
IFRS 11 was published in May 2011. IFRS 11 establishes principles for financial reporting by parties to a joint arrangement. IFRS 11divides all joint arrangements into two categories: joint operations where the jointly controlling parties have rights to the assets andobligations for the liabilities relating to the arrangements, and joint ventures where the jointly controlling parties have rights to thenet assets of the arrangement. Joint operations would be accounted for using the proportionate consolidation method wherePengrowth’s proportionate interest in the revenues, expenses, assets and liabilities would be disclosed, consistent withPengrowth’s current accounting for joint operations. Joint ventures would be accounted for using the equity method of accounting,where the investment in the joint venture would be adjusted for Pengrowth’s proportion of the net income or loss of the jointventure. IFRS 11 is required to be adopted for years beginning on or after January 1, 2013 although earlier adoption is allowed. Asignificant portion of Pengrowth petroleum and natural gas development and production activities are conducted with others andaccordingly Pengrowth is undertaking an examination of each of these joint arrangements. The impact of adoption cannot bedetermined until this examination is complete.
IFRS 12 – Disclosure of Interest in Other Entities (“IFRS 12”)
IFRS 12 was published in May 2011. IFRS 12 established the requirements for disclosure of ownership interests in subsidiaries, jointarrangements, associates and other entities. IFRS 12 requires disclosure of information that enables users of financial statementsto evaluate the nature of, and risks associated with, its interests in other entities and the effects of those interests on its financialposition, financial performance and cash flows. IFRS 12 is required to be adopted for years beginning on or after January 1, 2013.Earlier adoption is allowed. Pengrowth is currently assessing the impact of this new standard.
IFRS 13 – Fair Value Measurements (“IFRS 13”)
IFRS 13 was published in May 2011. IFRS 13 defines fair value, sets out a framework for measuring fair value and requiresdisclosures about fair values. IFRS 13 applies to all other IFRSs that require or permit fair value measurements or disclosuresabout fair value measurements. IFRS 13 defines fair value as the price that would be received to sell an asset or paid to transfer aliability in an orderly transaction between market participants at the measurement date. That definition of fair value emphasizes amarket-based measurement, not an entity-specific measurement. IFRS 13 is required to be adopted for years beginning on or afterJanuary 1, 2013. Earlier adoption is allowed. Pengrowth is currently assessing the impact of this new standard.
IAS 28 – Investments in Associates (“IAS 28”)
IAS 28 was published in May 2011. IAS 28 prescribes the accounting for investments in associates and contains the requirements forthe application of the equity method to investments in associates and joint ventures. The standard is applied prospectively forannual periods beginning on or after January 1, 2013. Earlier adoption is permitted. Based on Pengrowth’s current corporatestructure, no significant changes are anticipated as a result of adopting IAS 28.
DISCLOSURE CONTROLS AND PROCEDURES
As a Canadian reporting issuer with securities listed on both the TSX and the NYSE, Pengrowth is required to comply withMultilateral Instrument 52-109—Certification of Disclosure in Issuers’ Annual and Interim Filings, as well as the Sarbanes Oxley Act(SOX) enacted in the United States. Both the Canadian and U.S. certification rules include similar requirements where both the CEOand the Chief Financial Officer (CFO) must assess and certify as to the effectiveness of the disclosure controls and procedures asdefined in Canada by Multilateral Instrument 52-109—Certification of Disclosure in Issuers’ Annual and Interim Filings and in theUnited States by Rules 13a-15(e) and 15d-15(e) under the Securities Exchange Act of 1934, as amended.
The CEO, Derek Evans, and the CFO, Christopher Webster, evaluated the effectiveness of Pengrowth’s disclosure controls andprocedures for the year ending December 31, 2011. This evaluation considered the functions performed by its DisclosureCommittee, the review and oversight of all executive officers and the board, as well as the process and systems in place for filingregulatory and public information. Pengrowth’s established review process and disclosure controls are designed to providereasonable assurance that all required information, reports and filings required under Canadian securities legislation and UnitedStates securities laws are properly submitted and recorded in accordance with those requirements.
36 PENGROWTH 2011 Management’s Discussion & Analysis

Based on that evaluation, the CEO and CFO concluded that the design and operation of our disclosure controls and procedures wereeffective at the reasonable assurance level as at December 31, 2011, to ensure that information required to be disclosed by us inreports that we file under Canadian and U.S. securities laws is gathered, recorded, processed, summarized and reported within thetime periods specified under Canadian and U.S. securities laws and is accumulated and communicated to the management ofPengrowth Energy Corporation, including the CEO and CFO, to allow timely decisions regarding required disclosure as requiredunder Canadian and U.S. securities laws.
It should be noted that while Pengrowth’s CEO and CFO believe that Pengrowth’s disclosure controls and procedures provide areasonable level of assurance that they are effective, they do not expect that Pengrowth’s disclosure controls and procedures orinternal control over financial reporting will prevent all errors and fraud. A control system, no matter how well conceived oroperated, can provide only reasonable, not absolute, assurance that the objectives of the control system are met.
INTERNAL CONTROL OVER FINANCIAL REPORTING
Our management is responsible for establishing and maintaining adequate internal control over financial reporting as defined inRules 13a-15(f) and 15d-15(f) under the Securities Exchange Act of 1934, as amended and in Canada as defined in MultilateralInstrument 52-109—Certification of Disclosure in Issuers’ Annual and Interim Filings. Our internal control over financial reporting isdesigned to provide reasonable assurance regarding the reliability of our financial reporting and the preparation of our financialstatements for external purposes in accordance with IFRS for note disclosure purposes. Our internal control over financialreporting includes those policies and procedures that: pertain to the maintenance of records that in reasonable detail accuratelyand fairly reflect our transactions and disposition of the assets; provide reasonable assurance that transactions are recorded asnecessary to permit preparation of our financial statements in accordance with generally accepted accounting principles and thatreceipts and expenditures of our assets are being made only in accordance with authorizations of our management and directors;and provide reasonable assurance regarding prevention or timely detection of unauthorized acquisition, use or disposition of ourassets that could have a material effect on our financial statements. Because of its inherent limitations, internal control overfinancial reporting may not prevent or detect misstatements. Also, projections of any evaluation of effectiveness to future periodsare subject to the risk that controls may become inadequate because of changes in conditions, or that the degree of compliancewith the policies or procedures may deteriorate.
Our management, with the participation of our principal executive officer and principal financial officer, evaluated the effectivenessof our internal control over financial reporting as of December 31, 2011. In making this evaluation, management used the criteriaset forth by the Committee of Sponsoring Organizations of the Treadway Commission (COSO) in Internal Control-IntegratedFramework.
Based on our evaluation, management concluded that our internal control over financial reporting was effective as of December 31,2011.
The effectiveness of internal control over financial reporting as of December 31, 2011 was audited by KPMG LLP, an independentregistered public accounting firm, as stated in their report, which is included with our audited consolidated financial statements forthe year ended December 31, 2011. No changes were made to our internal control over financial reporting during the year endingDecember 31, 2011 that have materially affected, or are reasonably likely to materially affect, the internal controls over financialreporting.
PENGROWTH 2011 Management’s Discussion & Analysis 37
MANAGEMENT’S REPORT TO SHAREHOLDERS
MANAGEMENT’S RESPONSIBILITY TO SHAREHOLDERS
The financial statements and the notes to the financial statements are the responsibility of the management of Pengrowth EnergyCorporation. They have been prepared in accordance with International Financial Reporting Standards (IFRS) as issued by theInternational Accounting Standards Board which have been adopted in Canada. Financial information that is presented in theManagement Discussion and Analysis is consistent with the financial statements.
In preparation of these statements, estimates are sometimes necessary because a precise determination of certain assets andliabilities is dependant on future events. Management believes such estimates have been based on careful judgments and havebeen properly reflected in the accompanying financial statements.
Management is responsible for the reliability and integrity of the financial statements, the notes to the financial statements, andother financial information contained in this report. In order to ensure that management fulfills its responsibilities for financialreporting we have established an organizational structure that provides appropriate delegation of authority, division ofresponsibilities, and selection and training of properly qualified personnel. Management is also responsible for the development ofinternal controls over the financial reporting process.
The Board of Directors (the Board) is assisted in exercising its responsibilities through the Audit and Risk Committee (theCommittee) of the Board, which is composed of four independent directors. The Committee meets regularly with management andthe independent auditors to satisfy itself that management’s responsibilities are properly discharged, to review the financialstatements and to recommend approval of the financial statements to the Board.
KPMG LLP, the independent auditors appointed by the shareholders, have audited Pengrowth Energy Corporation’s consolidatedfinancial statements in accordance with Canadian generally accepted auditing standards and the standards of the Public CompanyAccounting Oversight Board (United States) and provided an independent professional opinion. The auditors have full andunrestricted access to the Committee to discuss the audit and their related findings as to the integrity of the financial reportingprocess.
Derek W. Evans Christopher G. WebsterPresident and Chief Executive Officer Chief Financial Officer
February 28, 2012
38 PENGROWTH 2011 Financial Results

INDEPENDENT AUDITORS’ REPORT OF REGISTEREDPUBLIC ACCOUNTING FIRM
TO THE SHAREHOLDERS AND BOARD OF DIRECTORS OF PENGROWTH ENERGY CORPORATION
We have audited the accompanying financial statements of Pengrowth Energy Corporation (“the Corporation”), which comprise thebalance sheets as at December 31, 2011, December 31, 2010 and January 1, 2010, the statements of income, shareholders’ equityand cash flow for the years ended December 31, 2011 and December 31, 2010, and notes, comprising a summary of significantaccounting policies and other explanatory information.
MANAGEMENT’S RESPONSIBILITY FOR THE FINANCIAL STATEMENTS
Management is responsible for the preparation and fair presentation of these financial statements in accordance with InternationalFinancial Reporting Standards as issued by the International Accounting Standards Board, and for such internal control asmanagement determines is necessary to enable the preparation of financial statements that are free from material misstatement,whether due to fraud or error.
AUDITORS’ RESPONSIBILITY
Our responsibility is to express an opinion on these financial statements based on our audits. We conducted our audits inaccordance with Canadian generally accepted auditing standards and the standards of the Public Company Accounting OversightBoard (United States). Those standards require that we comply with ethical requirements and plan and perform the audit to obtainreasonable assurance about whether the financial statements are free from material misstatement.
An audit involves performing procedures to obtain audit evidence about the amounts and disclosures in the financial statements.The procedures selected depend on our judgment, including the assessment of the risks of material misstatement of the financialstatements, whether due to fraud or error. In making those risk assessments, we consider internal control relevant to the entity’spreparation and fair presentation of the financial statements in order to design audit procedures that are appropriate in thecircumstances. An audit also includes evaluating the appropriateness of accounting policies used and the reasonableness ofaccounting estimates made by management, as well as evaluating the overall presentation of the financial statements.
We believe that the audit evidence we have obtained in our audits is sufficient and appropriate to provide a basis for our auditopinion.
OPINION
In our opinion, the financial statements present fairly, in all material respects, the balance sheet of the Corporation as atDecember 31, 2011, December 31, 2010 and January 1, 2010, and its financial performance and its cash flow for the years endedDecember 31, 2011 and December 31, 2010 in accordance with International Financial Reporting Standards as issued by theInternational Accounting Standards Board.
OTHER MATTER
We also have audited, in accordance with the standards of the Public Company Accounting Oversight Board (United States), theCorporation’s internal control over financial reporting as of December 31, 2011, based on the criteria established in Internal Control– Integrated Framework issued by the Committee of Sponsoring Organizations of the Treadway Commission (COSO), and our reportdated February 28 , 2012 expressed an unqualified opinion on the effectiveness of the Corporation’s internal control over financialreporting.
Chartered AccountantsCalgary, CanadaFebruary 28, 2012
PENGROWTH 2011 Financial Results 39
REPORT OF INDEPENDENT REGISTEREDPUBLIC ACCOUNTING FIRM
TO THE SHAREHOLDERS AND BOARD OF DIRECTORS OF PENGROWTH ENERGY CORPORATION
We have audited Pengrowth Energy Corporation’s (the “Corporation”) internal control over financial reporting as of December 31,2011, based on the criteria established in Internal Control – Integrated Framework issued by the Committee of SponsoringOrganizations of the Treadway Commission (COSO). The Corporation’s management is responsible for maintaining effective internalcontrol over financial reporting and for its assessment of the effectiveness of internal control over financial reporting, included inthe accompanying Management’s Report to the Shareholders. Our responsibility is to express an opinion on the Corporation’sinternal control over financial reporting based on our audit.
We conducted our audit in accordance with the standards of the Public Company Accounting Oversight Board (United States). Thosestandards require that we plan and perform the audit to obtain reasonable assurance about whether effective internal control overfinancial reporting was maintained in all material respects. Our audit included obtaining an understanding of internal control overfinancial reporting, assessing the risk that a material weakness exists, and testing and evaluating the design and operatingeffectiveness of internal control based on the assessed risk. Our audit also included performing such other procedures as weconsidered necessary in the circumstances. We believe that our audit provides a reasonable basis for our opinion.
An entity’s internal control over financial reporting is a process designed to provide reasonable assurance regarding the reliabilityof financial reporting and the preparation of financial statements for external purposes in accordance with generally acceptedaccounting principles. An entity’s internal control over financial reporting includes those policies and procedures that (1) pertain tothe maintenance of records that, in reasonable detail, accurately and fairly reflect the transactions and dispositions of the assets ofthe entity; (2) provide reasonable assurance that transactions are recorded as necessary to permit preparation of financialstatements in accordance with generally accepted accounting principles, and that receipts and expenditures of the entity are beingmade only in accordance with authorizations of management and directors of the entity; and (3) provide reasonable assuranceregarding prevention or timely detection of unauthorized acquisition, use, or disposition of the entity’s assets that could have amaterial effect on the financial statements.
Because of its inherent limitations, internal control over financial reporting may not prevent or detect misstatements. Also,projections of any evaluation of effectiveness to future periods are subject to the risk that controls may become inadequate becauseof changes in conditions, or that the degree of compliance with the policies or procedures may deteriorate.
In our opinion, the Corporation maintained, in all material respects, effective internal control over financial reporting as ofDecember 31, 2011, based on the criteria established in Internal Control – Integrated Framework issued by the Committee ofSponsoring Organizations of the Treadway Commission (COSO).
We also have audited, in accordance with Canadian generally accepted auditing standards and the standards of the Public CompanyAccounting Oversight Board (United States), the balance sheet of the Corporation as of December 31, 2011, December 31, 2010 andJanuary 1, 2010, and the related statements of income, shareholders’ equity and cash flow for the years ended December 31, 2011and December 31, 2010, and our report dated February 28, 2012 expressed an unqualified opinion on those financial statements.
Chartered AccountantsCalgary, CanadaFebruary 28, 2012
40 PENGROWTH 2011 Financial Results
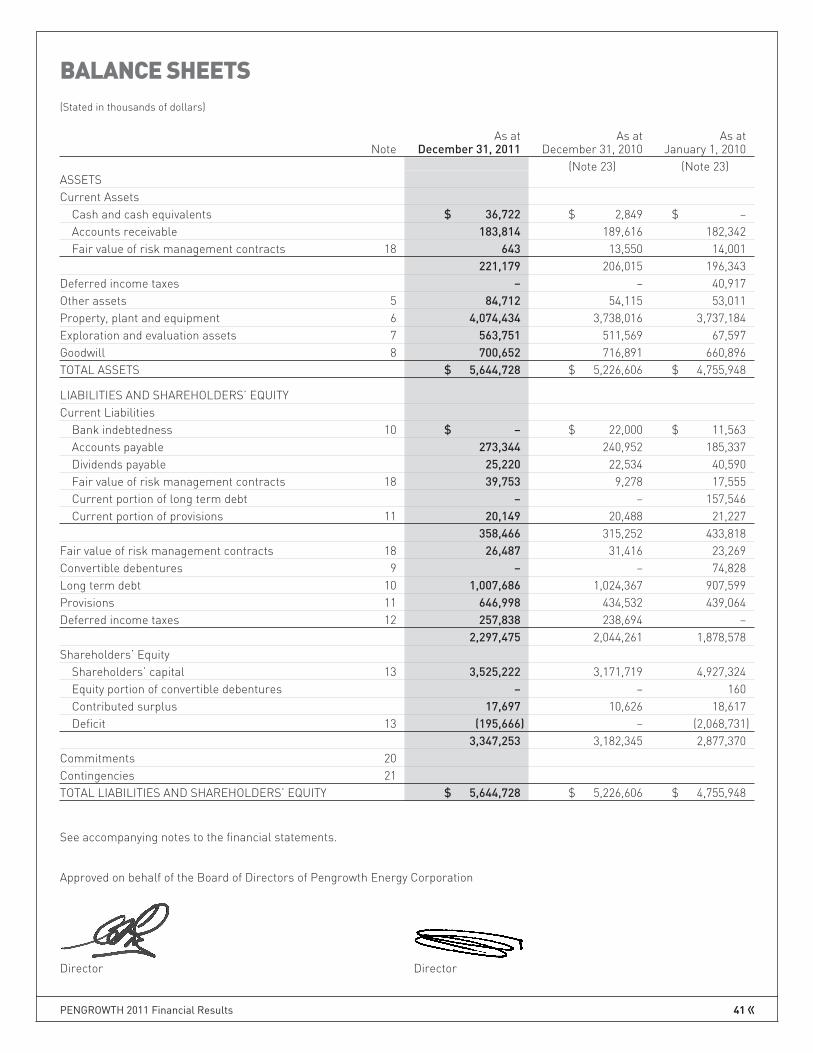
BALANCE SHEETS
(Stated in thousands of dollars)
As at As at As atNote December 31, 2011 December 31, 2010 January 1, 2010
(Note 23) (Note 23)ASSETSCurrent Assets
Cash and cash equivalents $ 36,722 $ 2,849 $ –Accounts receivable 183,814 189,616 182,342Fair value of risk management contracts 18 643 13,550 14,001
221,179 206,015 196,343Deferred income taxes – – 40,917Other assets 5 84,712 54,115 53,011Property, plant and equipment 6 4,074,434 3,738,016 3,737,184Exploration and evaluation assets 7 563,751 511,569 67,597Goodwill 8 700,652 716,891 660,896TOTAL ASSETS $ 5,644,728 $ 5,226,606 $ 4,755,948
LIABILITIES AND SHAREHOLDERS’ EQUITYCurrent Liabilities
Bank indebtedness 10 $ – $ 22,000 $ 11,563Accounts payable 273,344 240,952 185,337Dividends payable 25,220 22,534 40,590Fair value of risk management contracts 18 39,753 9,278 17,555Current portion of long term debt – – 157,546Current portion of provisions 11 20,149 20,488 21,227
358,466 315,252 433,818Fair value of risk management contracts 18 26,487 31,416 23,269Convertible debentures 9 – – 74,828Long term debt 10 1,007,686 1,024,367 907,599Provisions 11 646,998 434,532 439,064Deferred income taxes 12 257,838 238,694 –
2,297,475 2,044,261 1,878,578Shareholders’ Equity
Shareholders’ capital 13 3,525,222 3,171,719 4,927,324Equity portion of convertible debentures – – 160Contributed surplus 17,697 10,626 18,617Deficit 13 (195,666) – (2,068,731)
3,347,253 3,182,345 2,877,370Commitments 20Contingencies 21TOTAL LIABILITIES AND SHAREHOLDERS’ EQUITY $ 5,644,728 $ 5,226,606 $ 4,755,948
See accompanying notes to the financial statements.
Approved on behalf of the Board of Directors of Pengrowth Energy Corporation
Director Director
PENGROWTH 2011 Financial Results 41

STATEMENTS OF INCOME
(Stated in thousands of dollars, except per share amounts)
Year ended December 31Note 2011 2010
(Note 23)REVENUES
Oil and gas sales $ 1,453,735 $ 1,368,713
Royalties, net of incentives (277,945) (252,699)
1,175,790 1,116,014
Unrealized (loss) gain on commodity risk management 18 (39,951) 6,949
1,135,839 1,122,963
EXPENSES
Operating 382,024 357,178
Transportation 25,716 25,109
General and administrative 75,312 50,894
Depletion, depreciation and amortization 6 437,923 432,381
Impairment of assets 6, 8 27,360 –
948,335 865,562
OPERATING INCOME 187,504 257,401
Other (income) expense items
Gain on investments 4, 5 (23,000) (73,756)
Gain on disposition of properties (12,647) (18,425)
Unrealized foreign exchange loss (gain) 19 19,098 (49,918)
Realized foreign exchange loss 19 1,583 2,061
Interest and financing charges 75,924 70,464
Accretion 11 15,618 17,744
Other expense (income) 4,068 (11,926)
INCOME BEFORE TAXES 106,860 321,157
Deferred income tax expense 12 22,328 171,321
NET INCOME AND COMPREHENSIVE INCOME $ 84,532 $ 149,836
NET INCOME PER SHARE 16
Basic $ 0.25 $ 0.50
Diluted $ 0.25 $ 0.49
See accompanying notes to the financial statements.
42 PENGROWTH 2011 Financial Results
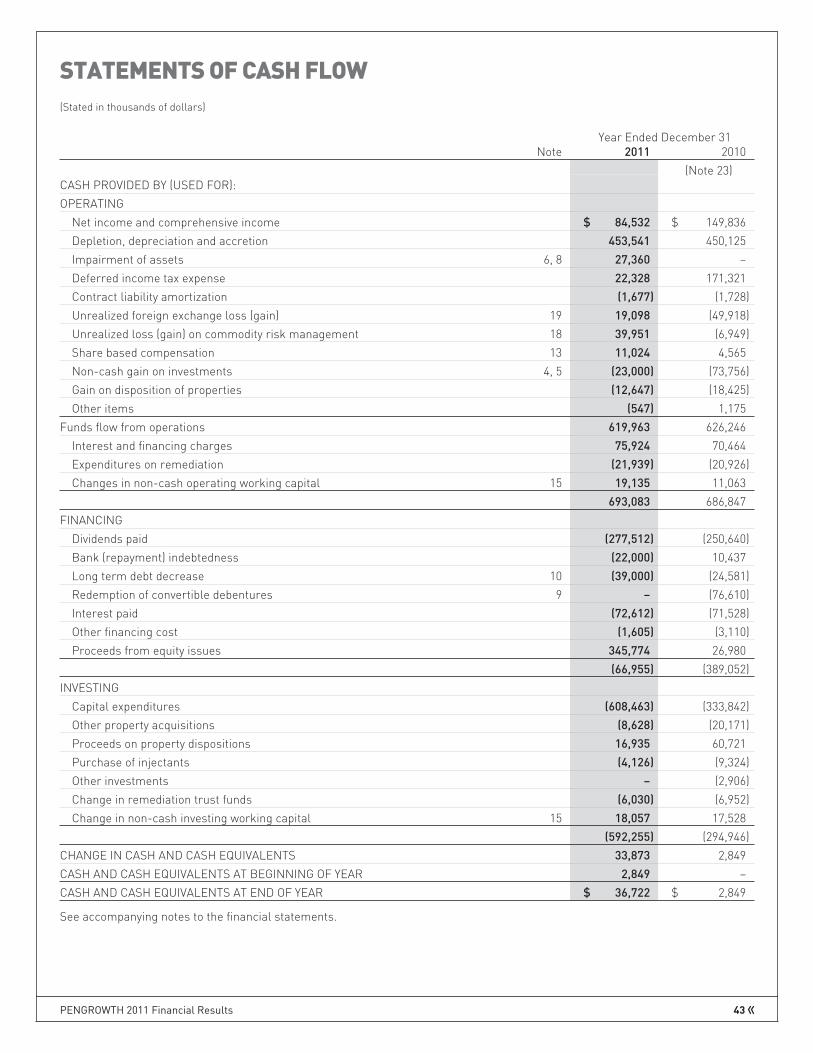
STATEMENTS OF CASH FLOW
(Stated in thousands of dollars)
Year Ended December 31Note 2011 2010
(Note 23)CASH PROVIDED BY (USED FOR):OPERATING
Net income and comprehensive income $ 84,532 $ 149,836Depletion, depreciation and accretion 453,541 450,125Impairment of assets 6, 8 27,360 –Deferred income tax expense 22,328 171,321Contract liability amortization (1,677) (1,728)Unrealized foreign exchange loss (gain) 19 19,098 (49,918)Unrealized loss (gain) on commodity risk management 18 39,951 (6,949)Share based compensation 13 11,024 4,565Non-cash gain on investments 4, 5 (23,000) (73,756)Gain on disposition of properties (12,647) (18,425)Other items (547) 1,175
Funds flow from operations 619,963 626,246Interest and financing charges 75,924 70,464Expenditures on remediation (21,939) (20,926)Changes in non-cash operating working capital 15 19,135 11,063
693,083 686,847FINANCING
Dividends paid (277,512) (250,640)Bank (repayment) indebtedness (22,000) 10,437Long term debt decrease 10 (39,000) (24,581)Redemption of convertible debentures 9 – (76,610)Interest paid (72,612) (71,528)Other financing cost (1,605) (3,110)Proceeds from equity issues 345,774 26,980
(66,955) (389,052)INVESTING
Capital expenditures (608,463) (333,842)Other property acquisitions (8,628) (20,171)Proceeds on property dispositions 16,935 60,721Purchase of injectants (4,126) (9,324)Other investments – (2,906)Change in remediation trust funds (6,030) (6,952)Change in non-cash investing working capital 15 18,057 17,528
(592,255) (294,946)CHANGE IN CASH AND CASH EQUIVALENTS 33,873 2,849CASH AND CASH EQUIVALENTS AT BEGINNING OF YEAR 2,849 –CASH AND CASH EQUIVALENTS AT END OF YEAR $ 36,722 $ 2,849
See accompanying notes to the financial statements.
PENGROWTH 2011 Financial Results 43

STATEMENTS OF SHAREHOLDERS’ EQUITY
(Stated in thousands of dollars)
Year ended December 31Note 2011 2010
SHAREHOLDERS’ CAPITALBalance, beginning of year $ 3,171,719 $ –Issued to trust unitholders – 5,270,631Issued to exchangable shareholders – 52,567Share based compensation 8,086 –Issued under Dividend Reinvestment Plan 54,698 –Issued for cash on equity issue 300,086 –Share issue cost, net of tax (9,367) –Elimination of deficit 1 – (2,151,479)Balance, end of year 3,525,222 3,171,719
TRUST UNITHOLDERS’ CAPITALBalance, beginning of year – 4,927,324Trust unit based compensation – 7,250Issued under Distribution Reinvestment Plan – 24,072Issued for the Monterey business combination – 307,648Issued on redemption of Exchangeable shares – 11,339Issue costs, net of tax – (623)Change in effective tax rate on issue costs 23 – (6,379)Trust units exchanged for common shares under the Arrangement 1 – (5,270,631)Balance, end of year – –
EXCHANGEABLE SHARESBalance, beginning of year – –Issued for the Monterey business combination – 54,939Redemptions at fair value of trust units or common shares – 8,967Redeemed for trust units – (11,339)Exchanged for common shared under the Agreement 1 – (52,567)Balance, end of year – –
CONTRIBUTED SURPLUSBalance, beginning of year 10,626 18,617Share based compensation 11,617 4,565Exercise of share based compensation awards (4,546) (3,589)Redemption of exchangable shares – (8,967)Balance, end of year 17,697 10,626
DEFICITBalance, beginning of year – (2,068,731)Net income 84,532 149,836Dividends declared (280,198) (232,584)Elimination of deficit 1 – 2,151,479Balance, end of year (195,666) –
TOTAL SHAREHOLDERS’ EQUITY $ 3,347,253 $ 3,182,345
See accompanying notes to the financial statements.
44 PENGROWTH 2011 Financial Results
NOTES TO FINANCIAL STATEMENTS
YEARS ENDED DECEMBER 31, 2011 AND 2010
(Tabular amounts are stated in thousands of dollars except per share amounts and as otherwise stated)
1. CORPORATE STRUCTURE
Pengrowth Energy Corporation (the “Corporation” or “Pengrowth”) is a Canadian resource company that is engaged in theproduction, development, exploration and acquisition of oil and natural gas assets. The Corporation was formed through aunitholder and Court approved reorganization involving Pengrowth Energy Trust (the “Trust”), Pengrowth Corporation, itssubsidiaries and the security holders of the Trust and Pengrowth Corporation pursuant to a Plan of Arrangement (the“Arrangement”) under the Business Corporations Act (Alberta).
On December 31, 2010 (the “Date of Conversion”), the Trust completed its conversion from an open-end investment trust to acorporation through a business combination resulting in the unitholders of the Trust and the exchangeable shareholders ofPengrowth Corporation owning all the common shares of the Corporation. Unitholders of the Trust received common shares in theCorporation on a one-for-one basis. Exchangeable shareholders of Pengrowth Corporation received 1.02308 common shares of theCorporation for each exchangeable share held. Pursuant to the Arrangement agreement, shareholders’ capital was reduced by theamount of the consolidated deficit of the Trust on December 31, 2010. The management team and Board of Directors of theCorporation were initially comprised of the former management team and elected members of the Board of Directors of the Trust.
The Corporation effected an internal reorganization subsequent to the date of conversion whereby, among other things, the Trustand its subsidiaries were dissolved and the Corporation received all the assets and assumed all the liabilities of the Trust.
The Arrangement was accounted for on a continuity of interest basis and accordingly, the consolidated financial statements forperiods prior to the date of conversion reflect the financial position, results of operations and cash flows as if the Corporation hadalways carried on the business formerly carried on by the Trust. These financial statements may at times refer to common shares,shareholders, shareholders’ capital and dividends which, prior to the Arrangement, were referred to as trust units, trustunitholders, trust unitholders’ capital and distributions, respectively. References made to trust units are those issued by the Trust.Comparative amounts in these financial statements will also reflect the history of the Trust and its subsidiaries.
2. SIGNIFICANT ACCOUNTING POLICIES
BASIS OF PRESENTATIONThese financial statements have been prepared in accordance with the International Financial Reporting Standards (“IFRS”) issuedby the International Accounting Standards Board (“IASB”) and International Financial Reporting Interpretations Committee(“IFRIC”).
These IFRS financial statements include comparative information for the year ended December 31, 2010 which has been preparedin accordance with IFRS. Previously, Pengrowth prepared and published its annual and interim consolidated financial statements inaccordance with Canadian Generally Accepted Accounting Principles (“previous GAAP”). Pengrowth has provided a reconciliation ofcomparative amounts to the previously released financial statements prepared under previous GAAP, see Note 23.
The financial statements were authorized for release by the Board of Directors on February 28, 2012.
PROPERTY, PLANT AND EQUIPMENT (“PP&E”) AND EXPLORATION AND EVALUATION ASSETS(“E&E ASSETS”)
Pengrowth capitalizes all costs of developing and acquiring oil and gas properties. These costs include lease acquisition costs,geological and geophysical expenditures, costs of drilling and completion of wells, plant and production equipment costs andrelated overhead charges. Pengrowth capitalizes a portion of general and administrative costs and stock based compensationexpense associated with exploration and development activities.
PENGROWTH 2011 Financial Results 45

Repairs and maintenance costs are expensed as incurred.
Exploration and Evaluation Assets
Costs of exploring for and evaluating oil and natural gas properties are capitalized within exploration and evaluation assets. Theseexploration and evaluation costs include lease acquisition costs, geological and geophysical expenditures, costs of drilling andcompletion of wells, plant and production equipment costs and related overhead charges. E&E Assets do not include costs ofgeneral prospecting, or evaluation costs incurred prior to having obtained the legal rights to explore an area, which are expensed asincurred. Interest is not capitalized on E&E Assets.
E&E Assets are not depleted or depreciated and are carried forward until technical feasibility and commercial viability is consideredto be determined. The technical feasibility and commercial viability is generally considered to be determined when proved plusprobable reserves are determined to exist and the commercial production of oil and gas has commenced. A review of eachexploration license or field is carried out, at least annually, to ascertain whether the project is technically feasible and commerciallyviable. Upon determination of technical feasibility and commercial viability, E&E Assets attributable to those reserves are firsttested for impairment and then reclassified from E&E Assets to PP&E.
Property, Plant and Equipment
PP&E is stated at cost, less accumulated depletion, depreciation and amortization, and accumulated impairment losses. The initialcost of an asset comprises its purchase price or construction cost, costs attributable to bringing the asset into operation, the initialestimate of asset retirement obligation and, for qualifying assets, borrowing costs. When significant parts of an item of PP&E,including oil and natural gas interests, have different useful lives, they are accounted for as separate items.
The cost of PP&E at January 1, 2010, the date of transition to IFRS, was determined in accordance with the deemed cost exemptionpermitted by IFRS 1 – First-time Adoption of International Financial Reporting Standards for full cost oil and gas entities. Under thismethod, the net book value of the oil and natural gas interests, as determined under previous GAAP was allocated to specific costitems based on the pro-rata share of proved plus probable reserve values as of January 1, 2010.
Subsequent Costs
Costs incurred subsequent to the determination of technical feasibility and commercial viability and the costs of replacing parts ofPP&E are recognized as oil and natural gas interests only when they increase the future economic benefits embodied in the specificasset to which they relate. Such capitalized oil and natural gas interests generally represent costs incurred in developing provedand/or probable reserves and bringing in or enhancing production from such reserves, and are accumulated on a field orgeotechnical area basis. The carrying amount of any replaced or sold component is derecognized. The costs of the day-to-dayservicing of PP&E are expensed as incurred.
Pengrowth capitalizes a portion of general and administrative costs directly associated with exploration and development activities.Pengrowth would capitalize interest incurred in construction of qualifying assets, if applicable. Qualifying assets are defined byPengrowth as capital projects that require capital expenditures over a period greater than one year, in order to produce oil or gasfrom a specific property.
Dispositions
Gains or losses are recognized in the Statement of Income on dispositions of PP&E and certain E&E assets, including asset swaps,farm-out transactions and property dispositions. The gain or loss is measured as the difference between the fair value of theproceeds received and the carrying value of the assets disposed, including capitalized future asset retirement obligations.
Depletion and Depreciation
The net carrying value of developed or producing fields or groups of fields is depleted using the unit of production method byreference to the ratio of production in the period to the related proved plus probable reserves, taking into account estimated futuredevelopment costs necessary to bring those reserves into production. Future development costs are estimated taking into accountthe level of development required to produce the reserves. These estimates are reviewed by independent reserve engineers at leastannually. Pengrowth’s total proved plus probable reserves are estimated by an independent reserve evaluator and represent the“best estimate” of quantities of oil, natural gas and related substances to be commercially recoverable from known accumulations,from a given date forward, based on geological and engineering data. It is equally likely that the actual remaining quantitiesrecovered will be greater than or less than the sum of the estimated proved plus probable reserves. Properties with no remainingproduction and reserves are fully depleted in the year that production ceases.
46 PENGROWTH 2011 Financial Results

For other assets, depreciation is recognized in profit or loss using either a straight line or declining balance basis over theestimated useful lives of each part of an item of PP&E. The estimated useful lives for other assets for the current and comparativeperiods are as follows:
• Office Equipment 60 months• Leasehold Improvements 120 months (lease term)• Computers 36 months• Deferred Hydrocarbon Injectants 24 months
Depreciation methods, useful lives and residual values are reviewed annually.
GOODWILL AND BUSINESS COMBINATIONS
Goodwill
Goodwill may arise on business combinations. Goodwill is stated at cost less accumulated impairment.
Acquisitions prior to January 1, 2010
As part of the transition to IFRS, the Corporation elected to not restate business combinations that occurred prior to January 1,2010. In respect of acquisitions prior to January 1, 2010, goodwill represents the amount recognized under the Corporation’sprevious GAAP.
Acquisitions on or after January 1, 2010
For acquisitions on or after January 1, 2010, goodwill as determined under IFRS represents the excess of the cost of the acquisitionover the net fair value of the identifiable assets, liabilities and contingent liabilities of the acquired assets or company. When theexcess is negative, it is recognized immediately in the Statement of Income.
IMPAIRMENT
Non-Financial Assets
Property, Plant and Equipment
For the purpose of impairment testing, PP&E is grouped together into the smallest group of assets that generate cash inflows fromcontinuing use that are largely independent of the cash inflows of other assets or groups of assets – cash generating unit (the“CGU”).
CGUs are assessed at least annually or when there is an indication of impairment, such as decreased commodity prices ordownward revisions in reserves volumes. If any such indication exists, the CGUs are tested for impairment. An impairment loss isrecognized to the extent the carrying value of the CGU exceeds its recoverable amount. Impairment losses are recognized in theStatement of Income.
The recoverable amount of a CGU is the higher of its value in use and the fair value less costs to sell. In determining the recoverableamount, the estimated future cash flows are discounted to their present value using a pre-tax discount rate that reflects currentmarket assessments of the cost of capital, which take into account the time value of money and the risks specific to the asset. Therecoverable amount is generally computed by reference to the present value of the future cash flows expected to be derived fromproduction of proved and probable reserves.
Impairment losses recognized in respect of CGUs are allocated first to reduce the carrying amount of any goodwill allocated to theunits and then to reduce the carrying amounts of the other assets in the unit on a pro rata basis.
An impairment loss in respect of goodwill cannot be reversed. In respect of other assets, impairment losses recognized in priorperiods are assessed at each reporting date for any indications that the loss has decreased or no longer exists. In suchcircumstances, the recoverable amount is determined and to the extent the loss is reduced, it is reversed. An impairment loss isreversed only to the lesser of the revised recoverable amount or the carrying amount that would have been determined, net ofdepletion and depreciation or amortization, if no impairment loss had been recognized.
Exploration and Evaluation Assets
E&E assets are tested for impairment where there is an indication that a particular E&E project may be impaired. Examples ofindicators of impairment include the decision to no longer pursue the E&E project, an expiry of the rights to explore in an area, or
PENGROWTH 2011 Financial Results 47

failure to receive regulatory approval. In addition, E&E assets are assessed for impairment upon their reclassification to producingassets (oil and natural gas interests in PP&E). In assessing the impairment of E&E assets, the carrying value of the E&E assetswould be compared to their estimated recoverable amount and, in certain circumstances, could include any surplus from PP&Eimpairment testing of related CGUs. The impairment of E&E assets and any eventual impairment thereof would be recognized in theStatement of Income.
Goodwill
For goodwill and other intangible assets that have indefinite lives or that are not yet available for use, an impairment test iscompleted each year at December 31. In assessing the impairment of goodwill, the carrying value of goodwill is compared to theexcess of the recoverable amount over the carrying amount of the PP&E and E&E assets, as applicable, within the CGU or groups ofCGUs where the acquired properties are grouped. An impairment loss is recognized if the carrying amount of the goodwill exceedsthe excess of the recoverable amount above the carrying amount of the CGU or CGUs. Any impairment of goodwill is recognized indepletion, depreciation and amortization expense in the Statement of Income.
Financial Assets
A financial asset is assessed at each reporting date to determine whether there is any objective evidence that it is impaired. Afinancial asset is considered to be impaired if objective evidence, including failure to pay on time, indicates that one or more eventshave had a negative effect on the estimated future cash flows of that asset.
An impairment loss in respect of a financial asset measured at amortized cost is calculated as the difference between its carryingamount and the present value of the estimated future cash flows discounted at the original effective interest rate. Significantfinancial assets are tested for impairment on an individual basis. The remaining financial assets are assessed collectively in groupsthat share similar credit risk characteristics.
All impairment losses are recognized in the Statement of Income. An impairment loss is reversed if the reversal can be relatedobjectively to an event occurring after the impairment loss was recognized. For financial assets measured at amortized cost, thereversal is recognized in the Statement of Income.
PROVISIONSA provision is recognized if, as a result of a past event, the Corporation has a present legal or constructive obligation that can beestimated reliably and it is probable that an outflow of economic benefits will be required to settle the obligation. Provisions aredetermined by discounting the expected future cash flows at a pre-tax rate that reflects current market assessments of the timevalue of money and the risks specific to the liability. Provisions are not permitted for future operating losses.
Asset Retirement Obligations (ARO)
Pengrowth initially recognizes the net present value of an ARO in the period in which it is incurred when a reasonable estimate ofthe net present value can be made. The net present value of the estimated ARO is recorded as a liability, with a correspondingincrease in the carrying amount of the related asset. The capitalized asset is depleted on the unit of production method based onproved plus probable reserves. The liability is increased each reporting period due to the passage of time and the amount of suchaccretion is expensed to income in the period. Actual costs incurred upon the settlement of the ARO are charged against the ARO.Management reviews the ARO estimate and changes, if any, are applied prospectively. Revisions made to the ARO estimate arerecorded as an increase or decrease to the ARO liability with a corresponding change made to the carrying amount of the relatedasset. The carrying amount of both the liability and the capitalized asset, net of accumulated depreciation, are derecognized if theasset is subsequently disposed.
Pengrowth has placed cash in segregated remediation trust fund accounts to fund certain ARO for the Judy Creek properties andthe Sable Offshore Energy Project (“SOEP”). These funds are reflected in Other Assets on the balance sheet.
Contract Liabilities Provision
Pengrowth assumed firm pipeline commitments in conjunction with certain prior period acquisitions. The fair values of thesecontracts were estimated on the date of acquisition and the amount recorded is reduced as the contracts settle.
48 PENGROWTH 2011 Financial Results

DEFERRED INCOME TAXESIncome tax expense is comprised of current and deferred tax. Income tax expense is recognized in the Statement of Income exceptto the extent that it relates to items recognized directly in equity.
Current tax is the expected tax payable on the taxable income for the year, using tax rates enacted or substantively enacted at thereporting date, and any adjustment to tax payable in respect of previous years.
Deferred tax is recognized using the asset and liability method of accounting for income taxes. Under this method, income taxliabilities and assets are recognized for the estimated tax consequences attributable to differences between the amounts reportedin the financial statements and their respective tax bases, using substantively enacted income tax rates. The effect of a change inincome tax rates on deferred income tax liabilities and assets is recognized in income in the period the change occurs. Deferred taxassets and liabilities are offset if there is a legally enforceable right to offset current tax liabilities and assets, and they relate toincome taxes levied by the same tax authority on the same taxable entity.
Pengrowth’s policy for income tax uncertainties is that tax benefits will be recognized only when it is more likely than not theposition will be sustained on examination.
SHARE BASED COMPENSATION PLANSPengrowth has share based compensation plans, which are described in Note 14. Compensation expense is based on the estimatedfair value of the share based compensation award at the date of grant. Compensation expense associated with the share basedcompensation plans are recognized in income over the vesting period of the plan with a corresponding increase to contributedsurplus. Pengrowth estimates the forfeiture rate for each type of share based award at the date of grant. Any consideration receivedupon the exercise of share unit rights and options together with the amount of non-cash compensation expense recognized incontributed surplus is recorded as an increase in shareholders’ capital at the time of exercise.
Pengrowth does not have any outstanding share based compensation plans that call for settlement in cash or other assets. Grantsof such items, if any, will be recorded as liabilities, with changes in the liabilities charged to net income, based on the estimated fairvalue.
FINANCIAL INSTRUMENTSFinancial instruments are utilized by Pengrowth to manage its exposure to commodity price fluctuations, foreign currency andinterest rate exposures. Pengrowth’s policy is not to utilize financial instruments for trading or speculative purposes.
Financial instruments are classified into one of five categories: (i) fair value through profit or loss, (ii) held to maturity investments,(iii) loans and receivables, (iv) available for sale financial assets or (v) other liabilities.
Accounts receivable are classified as loans and receivables which are measured at amortized cost.
Investments held in the remediation trust funds and other investments have been designated as fair value through profit or loss andare measured at fair value. Any change in the fair value is recognized in income as other income or expense.
Bank indebtedness, accounts payable, dividends payable and long term debt have been classified as other liabilities which aremeasured at amortized cost using the effective interest rate method.
All derivatives must be classified as held for trading and measured at fair value with changes in fair value over a reporting periodrecognized in net income. The receipts or payments arising from derivative commodity contracts are included in the realized gain(loss) on commodity risk management. Unrealized gains and losses on derivative commodity contracts are included in theunrealized gain (loss) on commodity risk management. The receipts or payments arising from derivative power contracts areincluded in operating expense. The unrealized gains and losses on derivative power contracts are included in other income(expense). The difference between the interest payments on the U.K. Pound Sterling denominated debt after the foreign exchangeswaps and the interest expense recorded at the average foreign exchange rate is included in interest expense. Unrealized gains(losses) on these swaps, covering the principal and interest on the U.K. Pound Sterling denominated debt, are included inunrealized foreign exchange gains (losses).
Transaction costs incurred in connection with the issuance of term debt instruments with a maturity of greater than one year arededucted against the carrying value of the debt and amortized to net income using the effective interest rate method over theexpected life of the debt.
PENGROWTH 2011 Financial Results 49

Pengrowth capitalizes transaction costs incurred in connection with the renewal of the revolving credit facility with a maturity dategreater than one year and amortizes the cost to net income on a straight line basis over the term of the facility.
FOREIGN CURRENCYThe functional and reporting currency of the Corporation is Canadian dollars. Transactions in foreign currencies are translated toCanadian dollars at the exchange rates on the date of the transactions. Monetary assets and liabilities denominated in foreigncurrencies are translated into Canadian dollars at the exchange rate in effect on the balance sheet date. Foreign exchange gainsand losses are recognized in income.
JOINTLY CONTROLLED OPERATIONSA significant proportion of Pengrowth’s petroleum and natural gas development and production activities are conducted throughjointly controlled operations with others and accordingly, the accounts reflect only Pengrowth’s interest in such activities.
RELATED PARTIESRelated parties are persons or entities that have control or significant influence over Pengrowth, as well as key managementpersonnel. A senior officer of Pengrowth was a member of the Board of Directors of Monterey Exploration Ltd (“Monterey”), acompany that was acquired in September 2010 (Note 4). Note 22 provides information on compensation expense related to keymanagement personnel. Pengrowth has no significant transactions with any other related parties.
REVENUE RECOGNITIONRevenue from the sale of oil and natural gas is recognized when the product is delivered and collection is reasonably assured.Revenue from processing and other miscellaneous sources is recognized upon completion of the relevant service.
EQUITY INVESTMENTPengrowth utilizes the equity method of accounting for investments subject to significant influence. Under this method, investmentsare initially recorded at cost and adjusted thereafter to include Pengrowth’s pro rata share of post-acquisition earnings. Anydividends received or receivable from the investee would reduce the carrying value of the investment.
ESTIMATESThe preparation of financial statements requires management to make estimates and assumptions that affect the reportedamounts of assets and liabilities, the disclosure of contingencies at the date of the financial statements, and revenues and expensesduring the reporting year. Actual results could differ from those estimated.
In particular, information about significant areas of estimation uncertainty and critical judgments in applying accounting policiesthat have the most significant effect on the amounts recognized in the financial statements are described below:
Estimating oil and gas reserves
Pengrowth engages a qualified, independent oil and gas reserves evaluator to perform an estimation of the Corporation’s oil andgas reserves at least annually. Reserves form the basis for the calculation of depletion charges and assessment of impairment ofoil and gas assets. Reserves are estimated using the reserve definitions and guidelines prescribed by National Instrument 51-101(NI 51-101) and the Canadian Oil and Gas Evaluation Handbook (COGEH).
Proved plus probable reserves are defined as the “best estimate” of quantities of oil, natural gas and related substances estimatedto be commercially recoverable from known accumulations, from a given date forward, based on drilling, geological, geophysicaland engineering data, the use of established technology and specified economic conditions. It is equally likely that the actualremaining quantities recovered will be greater than or less than the sum of the estimated proved plus probable reserves. Theestimates are made using all available geological and reservoir data as well as historical production data. Estimates are reviewedand revised as appropriate. Revisions occur as a result of changes in prices, costs, fiscal regimes and reservoir performance or achange in Pengrowth’s plans with respect to future development or operating practices.
Determination of CGUs
The recoverability of development and production asset carrying values are assessed at the CGU level. Determination of whatconstitutes a CGU is subject to management’s judgment. The asset composition of a CGU can directly impact the recoverability ofthe assets included therein. In assessing the recoverability of oil and gas properties, each CGU’s carrying value is compared to itsrecoverable amount, defined as the greater of fair value less costs to sell and value in use.
50 PENGROWTH 2011 Financial Results

Asset Retirement Obligation
Pengrowth estimates obligations under environmental regulations in respect of decommissioning and site restoration. Theseobligations are determined based on the expected present value of expenses required in the process of plugging and abandoningwells, dismantling of wellheads, production and transportation facilities and restoration of producing areas in accordance withrelevant legislation, discounted from the date when expenses are expected to be incurred. Most of the abandonment of futureexpenses, estimated logistics of performing abandonment work and the discount rate used to calculate the present value of futureexpenses would have a significant effect on the carrying amount of the decommissioning provision.
Impairment testing
The impairment testing of PP&E is completed for each CGU, and is based on estimates of proved plus probable reserves,production rates, oil and natural gas prices, future costs, discount rate and other relevant assumptions. The impairmentassessment of goodwill is based on the estimated fair value of Pengrowth’s CGUs. By their nature, these estimates are subject tomeasurement uncertainty and may impact the financial statements of future periods.
Valuation of trade and other receivables, and prepayments to suppliers
Management estimates the likelihood of the collection of trade and other receivables and recovery of prepayments based on ananalysis of individual accounts. Factors taken into consideration include the aging of receivables in comparison with the creditterms allowed to customers and the financial position and collection history with the customer. Should actual collections be lessthan estimates, Pengrowth would be required to record an additional expense.
NET INCOME PER SHAREBasic net income per share is calculated using the weighted average number of shares outstanding for the year. Diluted net incomeper share amounts includes the dilutive effect of common share rights and options, deferred entitlement share units and othershare units under the new long term incentive plans using the treasury stock method. The treasury stock method assumes that anyproceeds obtained on the exercise of in-the-money share unit rights and options would be used to purchase common shares at theaverage trading price during the period.
CASH AND TERM DEPOSITSCash and term deposits include demand deposits and term deposits with original maturities of less than 90 days.
COMPARATIVE FIGURESCertain comparative figures in the prior periods have been reclassified to conform to the presentation adopted in the current year,including the presentation of oil and gas sales, operating expenses, and transportation on the Statements of Income.
3. RECENT ACCOUNTING PRONOUNCEMENTS
IFRS 9: Financial Instruments (“IFRS 9”)
IFRS 9 is expected to be published in three parts. The first part, Phase 1—classification and measurement of financial instruments(“IFRS 9, Phase 1”), was published in October 2010.
IFRS 9, Phase 1, sets out the requirements for recognizing and measuring financial assets, financial liabilities and some contractsto buy or sell non-financial items. IFRS 9, Phase 1 simplifies measurement of financial asset by classifying all financial assets asthose being recorded at amortized cost or being recorded at fair value. For financial assets recorded at fair value, any change in thefair value would be recognized in profit or loss. IFRS 9, Phase 1, is required to be adopted for years beginning on or after January 1,2015 although earlier adoption is allowed. Pengrowth has not made any decision as to early adoption. Pengrowth is currentlyassessing the impact of this new standard.
IFRS 10 – Consolidated Financial Statements (“IFRS 10”)
IFRS 10 was published in May 2011. IFRS 10 establishes principles for the presentation and preparation of consolidated financialstatements when an entity controls one or more other entities, including special purpose or variable interest entities. IFRS 10 alsodefines the principle of control and establishes control as the basis for determining which entities are consolidated in theconsolidated financial statements. IFRS 10 is required to be adopted for years beginning on or after January 1, 2013. Earlieradoption is allowed and must be adopted in conjunction with IFRS 12 – Disclosure of Interest in Other Entities. Based onPengrowth’s current corporate structure, no significant changes are anticipated as a result of adopting IFRS 10.
PENGROWTH 2011 Financial Results 51

IFRS 11 – Joint Arrangements (“IFRS 11”)
IFRS 11 was published in May 2011. IFRS 11 establishes principles for financial reporting by parties to a joint arrangement. IFRS 11divides all joint arrangements into two categories: joint operations where the jointly controlling parties have rights to the assets andobligations for the liabilities relating to the arrangements, and joint ventures where the jointly controlling parties have rights to thenet assets of the arrangement. Joint operations would be accounted for using the proportionate consolidation method wherePengrowth’s proportionate interest in the revenues, expenses, assets and liabilities would be disclosed, consistent withPengrowth’s current accounting for joint operations. Joint ventures would be accounted for using the equity method of accounting,where the investment in the joint venture would be adjusted for Pengrowth’s proportion of the net income or loss of the jointventure. IFRS 11 is required to be adopted for years beginning on or after January 1, 2013 although earlier adoption is allowed. Asignificant portion of Pengrowth petroleum and natural gas development and production activities are conducted with others andaccordingly Pengrowth is undertaking an examination of each of these joint arrangements. The impact of adoption cannot bedetermined until this examination is complete.
IFRS 12 – Disclosure of Interest in Other Entities (“IFRS 12”)
IFRS 12 was published in May 2011. IFRS 12 established the requirements for disclosure of ownership interests in subsidiaries, jointarrangements, associates and other entities. IFRS 12 requires disclosure of information that enables users of financial statementsto evaluate the nature of, and risks associated with, its interests in other entities and the effects of those interests on its financialposition, financial performance and cash flows. IFRS 12 is required to be adopted for years beginning on or after January 1, 2013.Earlier adoption is allowed. Pengrowth is currently assessing the impact of this new standard.
IFRS 13 – Fair Value Measurements (“IFRS 13”)
IFRS 13 was published in May 2011. IFRS 13 defines fair value, sets out a framework for measuring fair value and requiresdisclosures about fair values. IFRS 13 applies to all other IFRSs that require or permit fair value measurements or disclosuresabout fair value measurements. IFRS 13 defines fair value as the price that would be received to sell an asset or paid to transfer aliability in an orderly transaction between market participants at the measurement date. That definition of fair value emphasizes amarket-based measurement, not an entity-specific measurement. IFRS 13 is required to be adopted for years beginning on or afterJanuary 1, 2013. Earlier adoption is allowed. Pengrowth is currently assessing the impact of this new standard.
IAS 28 – Investments in Associates
International Accounting Standard 28 (“IAS 28”) was published in May 2011. IAS 28 prescribes the accounting for investments inassociates, which are investments is entities over which the investor has significant influence but the investment is neither asubsidiary nor a joint venture, and contains the requirements for the application of the equity method to investments in associatesand joint ventures. The standard is applied prospectively for annual periods beginning on or after January 1, 2013. Earlier adoptionis permitted. Based on Pengrowth’s current corporate structure, no significant changes are anticipated as a result of adoptingIAS 28.
4. MONTEREY ACQUISITION
Pengrowth and Monterey completed a business combination (the “Combination”) on September 15, 2010 whereby each Montereysecurityholder elected to receive either: (i) 0.8298 of a trust unit or (ii) 0.8298 of an exchangeable share of Pengrowth Corporationwith each exchangeable share being exchangeable to a trust unit. The Combination resulted in Pengrowth acquiring 100% of thevoting interest in Monterey and the issuance of 28 million trust units and 5 million exchangeable shares of Pengrowth Corporationto the former Monterey securityholders.
The trust units and exchangeable shares issued in the Combination were valued at $11.00 per trust unit/exchangeable share basedon the closing trading price of the trust units on the date of the Combination. Prior to the Combination, Pengrowth heldapproximately nine million common shares or approximately 20 percent of the outstanding common shares of Monterey. Underaccounting standards for business combinations, Pengrowth was required to fair value its previously held equity investment inMonterey and, as a result, recorded a gain of $73.8 million arising from the difference between the fair value on closing date and thebook value of the investment prior to the Combination. The fair value of Pengrowth’s previously held equity investment in Montereywas included in the purchase consideration.
52 PENGROWTH 2011 Financial Results
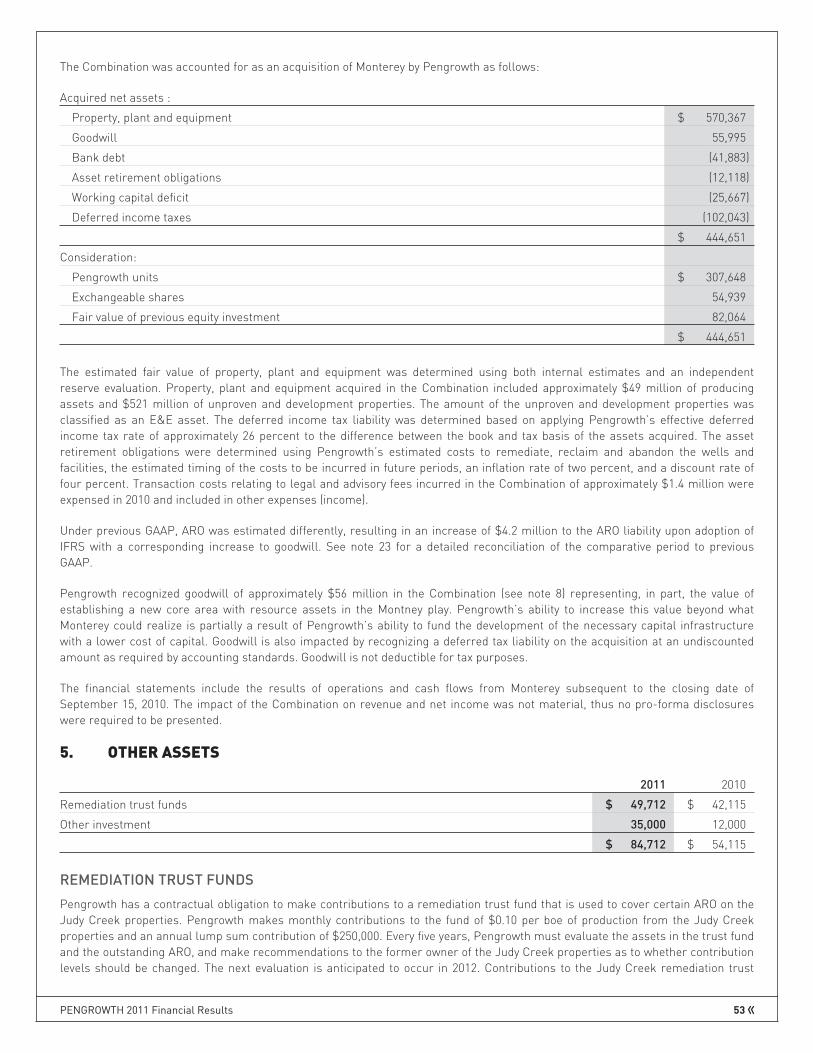
The Combination was accounted for as an acquisition of Monterey by Pengrowth as follows:
Acquired net assets :
Property, plant and equipment $ 570,367
Goodwill 55,995
Bank debt (41,883)
Asset retirement obligations (12,118)
Working capital deficit (25,667)
Deferred income taxes (102,043)
$ 444,651
Consideration:
Pengrowth units $ 307,648
Exchangeable shares 54,939
Fair value of previous equity investment 82,064
$ 444,651
The estimated fair value of property, plant and equipment was determined using both internal estimates and an independentreserve evaluation. Property, plant and equipment acquired in the Combination included approximately $49 million of producingassets and $521 million of unproven and development properties. The amount of the unproven and development properties wasclassified as an E&E asset. The deferred income tax liability was determined based on applying Pengrowth’s effective deferredincome tax rate of approximately 26 percent to the difference between the book and tax basis of the assets acquired. The assetretirement obligations were determined using Pengrowth’s estimated costs to remediate, reclaim and abandon the wells andfacilities, the estimated timing of the costs to be incurred in future periods, an inflation rate of two percent, and a discount rate offour percent. Transaction costs relating to legal and advisory fees incurred in the Combination of approximately $1.4 million wereexpensed in 2010 and included in other expenses (income).
Under previous GAAP, ARO was estimated differently, resulting in an increase of $4.2 million to the ARO liability upon adoption ofIFRS with a corresponding increase to goodwill. See note 23 for a detailed reconciliation of the comparative period to previousGAAP.
Pengrowth recognized goodwill of approximately $56 million in the Combination (see note 8) representing, in part, the value ofestablishing a new core area with resource assets in the Montney play. Pengrowth’s ability to increase this value beyond whatMonterey could realize is partially a result of Pengrowth’s ability to fund the development of the necessary capital infrastructurewith a lower cost of capital. Goodwill is also impacted by recognizing a deferred tax liability on the acquisition at an undiscountedamount as required by accounting standards. Goodwill is not deductible for tax purposes.
The financial statements include the results of operations and cash flows from Monterey subsequent to the closing date ofSeptember 15, 2010. The impact of the Combination on revenue and net income was not material, thus no pro-forma disclosureswere required to be presented.
5. OTHER ASSETS
2011 2010
Remediation trust funds $ 49,712 $ 42,115
Other investment 35,000 12,000
$ 84,712 $ 54,115
REMEDIATION TRUST FUNDS
Pengrowth has a contractual obligation to make contributions to a remediation trust fund that is used to cover certain ARO on theJudy Creek properties. Pengrowth makes monthly contributions to the fund of $0.10 per boe of production from the Judy Creekproperties and an annual lump sum contribution of $250,000. Every five years, Pengrowth must evaluate the assets in the trust fundand the outstanding ARO, and make recommendations to the former owner of the Judy Creek properties as to whether contributionlevels should be changed. The next evaluation is anticipated to occur in 2012. Contributions to the Judy Creek remediation trust
PENGROWTH 2011 Financial Results 53

fund may change based on future evaluations of the fund. The investment in the Judy Creek remediation trust fund is classified asfair value through profit or loss and are recorded at fair value. Interest income is recognized when earned and included in otherexpenses (income). As at December 31, 2011, the carrying value of the Judy Creek remediation trust fund was $8.2 million(December 31, 2010 – $8.7 million).
Pengrowth has a contractual obligation to make contributions to a remediation trust fund that will be used to fund the ARO of theSOEP properties and facilities. Pengrowth currently makes a monthly contribution to the fund of $0.52 per mmbtu of its share ofnatural gas production and $1.04 per bbl of its share of natural gas liquids production from SOEP. The SOEP remediation trust fundas at December 31, 2011 was $41.5 million (December 31, 2010 – $33.4 million). Investment income is recognized when earned andis recorded as other expense (income). The investments in the fund have been designated as fair value through profit or loss andare recorded at fair value.
The following reconciles Pengrowth’s investment in remediation trust funds for the periods noted below:
Remediation Trust Funds
Balance, January 1, 2010 $ 34,821
Contributions 7,019
Remediation expenditures from fund (696)
Investment income in period 629
Unrealized gain 342
Balance, December 31, 2010 $ 42,115
Contributions in period 5,136
Remediation expenditures from fund (1,095)
Investment income in period 1,989
Unrealized gain 1,567
Balance, December 31, 2011 $ 49,712
OTHER INVESTMENT
Pengrowth owns 1.0 million shares of a private corporation with an estimated fair value of $35 million. This investment wasdesignated to be carried at fair value upon adoption of IFRS. The fair value is based in part on the most recent private placementequity offerings closed by the private company. Pengrowth owns a minority interest in and does not have significant influence overthe private corporation. As the company is private, the estimated fair value is not based on observable market data and there arerestrictions on selling the shares, therefore it is uncertain if Pengrowth could realize this value in an open market and is thereforesubject to revision. The fair value has increased to $35 million as at December 31, 2011 (December 31, 2010 – $12 million), resultingin a gain of $23 million recognized in other income for the year ended December 31, 2011 (December 31, 2010 – NIL).
54 PENGROWTH 2011 Financial Results
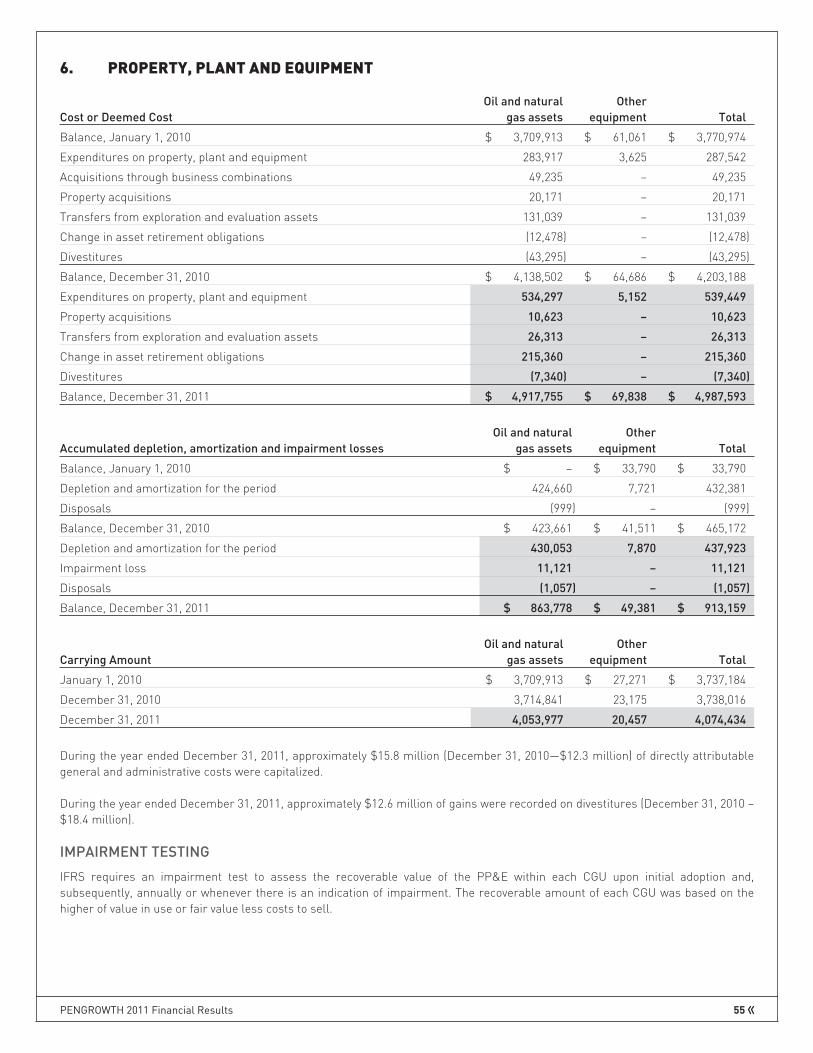
6. PROPERTY, PLANT AND EQUIPMENT
Cost or Deemed CostOil and natural
gas assetsOther
equipment Total
Balance, January 1, 2010 $ 3,709,913 $ 61,061 $ 3,770,974
Expenditures on property, plant and equipment 283,917 3,625 287,542
Acquisitions through business combinations 49,235 – 49,235
Property acquisitions 20,171 – 20,171
Transfers from exploration and evaluation assets 131,039 – 131,039
Change in asset retirement obligations (12,478) – (12,478)
Divestitures (43,295) – (43,295)
Balance, December 31, 2010 $ 4,138,502 $ 64,686 $ 4,203,188
Expenditures on property, plant and equipment 534,297 5,152 539,449
Property acquisitions 10,623 – 10,623
Transfers from exploration and evaluation assets 26,313 – 26,313
Change in asset retirement obligations 215,360 – 215,360
Divestitures (7,340) – (7,340)
Balance, December 31, 2011 $ 4,917,755 $ 69,838 $ 4,987,593
Accumulated depletion, amortization and impairment lossesOil and natural
gas assetsOther
equipment Total
Balance, January 1, 2010 $ – $ 33,790 $ 33,790
Depletion and amortization for the period 424,660 7,721 432,381
Disposals (999) – (999)
Balance, December 31, 2010 $ 423,661 $ 41,511 $ 465,172
Depletion and amortization for the period 430,053 7,870 437,923
Impairment loss 11,121 – 11,121
Disposals (1,057) – (1,057)
Balance, December 31, 2011 $ 863,778 $ 49,381 $ 913,159
Carrying AmountOil and natural
gas assetsOther
equipment Total
January 1, 2010 $ 3,709,913 $ 27,271 $ 3,737,184
December 31, 2010 3,714,841 23,175 3,738,016
December 31, 2011 4,053,977 20,457 4,074,434
During the year ended December 31, 2011, approximately $15.8 million (December 31, 2010—$12.3 million) of directly attributablegeneral and administrative costs were capitalized.
During the year ended December 31, 2011, approximately $12.6 million of gains were recorded on divestitures (December 31, 2010 –$18.4 million).
IMPAIRMENT TESTING
IFRS requires an impairment test to assess the recoverable value of the PP&E within each CGU upon initial adoption and,subsequently, annually or whenever there is an indication of impairment. The recoverable amount of each CGU was based on thehigher of value in use or fair value less costs to sell.
PENGROWTH 2011 Financial Results 55

The estimates of fair value less costs to sell was determined based on the following information:
(a) the net present value of each CGUs oil and gas reserves using;
i. proved plus probable reserves estimated by Pengrowth’s independent reserves evaluator,
ii. the year end commodity price forecast of our independent reserves evaluator, adjusted for commodity price differentialsspecific to Pengrowth
iii. discounted at an estimated market rate.
(b) the fair value of undeveloped land.
Key input estimates used in the determination of cash flows from oil and gas reserves include the following:
a) Reserves. Assumptions that are valid at the time of reserve estimation may change significantly when new informationbecomes available. Changes in forward price estimates, production costs or recovery rates may change the economic status ofreserves and may ultimately result in reserves being restated.
b) Oil and natural gas prices. Forward price estimates of the oil and natural gas prices are used in the cash flow model.Commodity prices have fluctuated widely in recent years due to global and regional factors including supply and demandfundamentals, inventory levels, exchange rates, weather, economic and geopolitical factors.
c) Discount rate. The discount rate used to calculate the net present value of cash flows is based on estimates of an approximatecost of capital for potential acquirers of Pengrowth or Pengrowth’s CGUs. Changes in the general economic environment couldresult in significant changes to this estimate.
d) Undeveloped land. The undeveloped land value is based on Pengrowth’s undeveloped land acreage and the current marketprices for undeveloped land.
Impairment tests carried out at December 31, 2011 on each CGU were based on fair value less costs to sell, using a discount rate ofeight per cent, an inflation rate of two percent, and the following forward commodity price estimates:
YearWTI Oil
(U.S.$/bbl)
ForeignExchange Rate
(U.S.$/Cdn$)
Edmonton LightCrude Oil
(Cdn$/bbl)AE CO Gas
(Cdn$/mmbtu)
2012 $ 97.00 0.980 $ 97.96 $ 3.49
2013 100.00 0.980 101.02 4.13
2014 100.00 0.980 101.02 4.59
2015 100.00 0.980 101.02 5.05
2016 100.00 0.980 101.02 5.51
2017 100.00 0.980 101.02 5.97
2018 101.35 0.980 102.40 6.21
2019 103.38 0.980 104.47 6.33
2020 105.45 0.980 106.58 6.46
2021 107.56 0.980 108.73 6.58
Thereafter + 2.0 percent/yr 0.980 + 2.0 percent/yr + 2.0 percent/yr
The carrying value of the producing Groundbirch CGU exceeded the fair value less costs to sell, and an impairment was recognizedfor approximately $27.4 million. As a result, the full amount of goodwill attributed to the producing Groundbirch CGU waseliminated, thereby reducing goodwill by $16.3 million and the PP&E was reduced by $11.1 million. The impairment of PP&E may bereversed if the fair value of the producing Groundbirch CGU increases in future periods, but the impairment of goodwill attributed tothe producing Groundbirch CGU cannot be reversed.
Pengrowth estimated the recoverable amount was greater than the net book value for each CGU at January 1, 2010, upon initialadoption of IFRS, and December 31, 2010, thus no impairment was recognized.
56 PENGROWTH 2011 Financial Results

SENSITIVITY OF RECOVERABLE AMOUNTAs at December 31, 2011, a one percent increase in the assumed discount rate would result in an additional impairment of PP&E of$19.8 million, while there would be no change to the impairment of goodwill attributed to the Groundbirch CGU. A five percentdecrease in the forward price estimates would result in an additional impairment of PP&E of $20.2 million, while there would be nochange to the impairment of goodwill attributed to the Groundbirch CGU. A one percent decrease in the assumed discount ratewould result in no impairment of assets and the impairment of goodwill being reduced by $11.8 million to $4.4 million. A fivepercent increase in the forward price estimates would result in no impairment of assets and the impairment of goodwill beingreduced by $9.0 million.
7. EXPLORATION AND EVALUATION ASSETS
Cost or Deemed Cost
Balance, January 1, 2010 $ 67,597
Additions 53,879
Acquisitions through business combinations 521,132
Transfers to property, plant and equipment (131,039)
Balance, December 31, 2010 $ 511,569
Additions 78,495
Transfers to property, plant and equipment (26,313)
Balance, December 31, 2011 $ 563,751
E&E assets consist of Pengrowth’s exploration and development projects which are pending the determination of proved plusprobable reserves and production. Additions represent Pengrowth’s share of costs incurred on E&E assets during the period. E&Eassets consist of costs associated with the Lindbergh Steam Assisted Gravity Drainage (“SAGD”) project, Horn River and theundeveloped portion of Groundbirch.
Upon achievement of commercial viability and technical feasibility assets are transferred to property, plant and equipment. Theamount transferred to property plant and equipment in the year ended December 31, 2011 and 2010 represent the producingsections of the Groundbirch property. The Lindbergh SAGD project is expected to remain in E&E Assets until Pengrowth hasachieved technical feasibility and demonstrated commercial viability, including receiving all of the necessary environmental andregulatory approvals. Thus, any production from the Lindbergh SAGD pilot project will not be included in production volumes andany revenue received from production will not be recognized in income while the project remains classified as an E&E Asset.
All of the expenditures on E&E Assets are classified as investing cash flows. All expenditures on E&E assets were capitalized.Liabilities associated with the E&E assets are related to the ARO liabilities of approximately $4.8 million.
During the year ended December 31, 2011, approximately $1.6 million (December 31, 2010 – $0.6 million) of directly attributablegeneral and administrative costs were capitalized.
8. GOODWILL
The following table reconciles Pengrowth’s Goodwill:
Cost or Deemed Cost
Balance, January 1, 2010 $ 660,896
Acquisitions through business combinations 55,995
Balance, December 31, 2010 $ 716,891
Impairment (16,239)
Balance, December 31, 2011 $ 700,652
Goodwill is stated at cost less accumulated impairment. Goodwill is assessed for impairment at each year end, or when there is anindication of impairment, in conjunction with the assessment for impairment of PP&E. At January 1, 2010 and December 31, 2010there was no impairment of Goodwill. At December 31, 2011 the carrying value of the Groundbirch CGU exceeded the fair value lesscosts to sell, and an impairment was recognized for approximately $27.4 million. As a result, goodwill attributed to the GroundbirchCGU was reduced by $16.3 million to NIL and the corresponding PP&E was reduced by $11.1 million. The impairment of goodwillattributed to Groundbirch cannot be reversed.
PENGROWTH 2011 Financial Results 57

The carrying value of the remaining goodwill is approximately $701 million. Approximately $130 million is attributable to the SwanHills area CGU as it relates directly to the purchase of the Carson Creek property in 2006. The remaining goodwill is not attributedto any specific CGU thus this value is supported by the excess recoverable amount over the carrying value of certain of Pengrowth’sCGUs.
9. CONVERTIBLE DEBENTURES
On January 14, 2010, Pengrowth redeemed all of the outstanding Convertible Unsecured Subordinated Debentures. The cashredemption amount was approximately $76.8 million, including accrued interest to the redemption date. The debentures boreinterest at 6.5% per annum and were convertible at $25.54 per share.
10. LONG TERM DEBT
2011 2010
U.S. dollar denominated senior unsecured notes:
50 million at 5.47 percent due April 2013 $ 50,799 $ 49,638
71.5 million at 4.67 percent due May 2015 72,423 70,731
400 million at 6.35 percent due July 2017 405,429 396,219
265 million at 6.98 percent due August 2018 268,452 262,354
115.5 million at 5.98 percent due May 2020 116,865 114,206
$ 913,968 $ 893,148
U.K. Pound Sterling denominated 50 million unsecured notes at 5.46 percent dueDecember 2015 78,718 77,219
Canadian dollar 15 million senior unsecured notes at 6.61 percent due August 2018 15,000 15,000
Canadian dollar revolving credit facility borrowings – 39,000
Total long term debt $ 1,007,686 $ 1,024,367
Pengrowth’s unsecured, covenant based revolving credit facility includes a committed value of $1.0 billion and a $250 millionexpansion feature providing $1.25 billion of credit capacity subject to the syndicate’s participation. The facility matures onNovember 29, 2015 and can be renewed at Pengrowth’s discretion any time prior to its maturity subject to syndicate approval. In theevent that the lenders do not agree to a renewal, the outstanding balance is due upon maturity. In conjunction with renewal of thisfacility in late 2011, Pengrowth incurred fees of $1.6 million which will be amortized to income over the term of the facility.
This facility carries floating interest rates that are expected to range between 2.00 percent and 3.25 percent over bankers’acceptance rates, depending on Pengrowth’s ratio of senior debt to earnings before interest, taxes and non-cash items. As atDecember 31, 2011, the facility was undrawn (December 31, 2010 – $39 million) and letters of credit in the amount of approximately$24 million (December 31, 2010 – $18 million) were outstanding.
Pengrowth also maintains a $50 million demand operating facility with one Canadian bank. As at December 31, 2011, this facilitywas undrawn (December 31, 2010 – $22 million) and letters of credit of approximately $1.5 million (December 31, 2010 – $5 million)were outstanding. Borrowings under this facility, as applicable, are included in bank indebtedness on the balance sheet.
As of December 31, 2011, an unrealized cumulative foreign exchange gain of $43 million (December 31, 2010 – $63 million gain) hasbeen recognized on the U.S. dollar term notes since the date of issuance. As of December 31, 2011, an unrealized cumulativeforeign exchange gain of $35 million (December 31, 2010 – $37 million gain) has been recognized on the U.K. Pound Sterlingdenominated term notes since Pengrowth ceased to designate existing foreign exchange swaps as a hedge on January 1, 2007. SeeNote 18 for additional information about foreign exchange risk management and the impact on the financial statements.
The five year schedule of long term debt repayment based on current maturity dates and assuming the revolving credit facility is notrenewed is as follows: 2012 – NIL, 2013 – $51 million, 2014 – NIL, 2015 – $152 million, 2016 – NIL.
58 PENGROWTH 2011 Financial Results

11. PROVISIONS
Provisions are comprised of Asset Retirement Obligations (ARO) and contract liabilities (see note 2 for details). The following tablereconciles the changes in ARO and contract liabilities:
Asset retirementobligations Contract Liabilities Total
Balance, January 1, 2010 $ 450,611 $ 9,680 $ 460,291
Assumed in business combination 12,117 – 12,117
Provisions made during the period 12,097 – 12,097
Provisions on dispositions (3,284) – (3,284)
Provisions settled (20,926) – (20,926)
Revisions due to inflation rate changes (94,797) – (94,797)
Revisions due to discount rate changes 90,854 – 90,854
Other revisions (17,348) – (17,348)
Accretion (amortization) 17,744 (1,728) 16,016
Balance, December 31, 2010 $ 447,068 $ 7,952 $ 455,020
Provisions made during the period 7,789 – 7,789
Provisions on dispositions (1,151) – (1,151)
Provisions settled (21,939) – (21,939)
Revisions due to discount rate changes 206,554 – 206,554
Other revisions 6,932 – 6,932
Accretion (amortization) 15,618 (1,676) 13,942
Balance, December 31, 2011 $ 660,871 $ 6,276 $ 667,147
As of December 31, 2010
Current $ 18,811 $ 1,677 $ 20,488
Non-current 428,257 6,275 434,532
$ 447,068 $ 7,952 $ 455,020
As of December 31, 2011
Current $ 18,500 $ 1,649 $ 20,149
Non-current 642,371 4,627 646,998
$ 660,871 $ 6,276 $ 667,147
ASSET RETIREMENT OBLIGATIONS (“ARO”)
Pengrowth has used the following assumptions to estimate the ARO liability as at December 31 for the following years:
2011 2010
Total escalated future costs ($ millions ) 1,845 1,823
Discount rate, per annum 2.5% 3.5%
Inflation rate, per annum 1.5% 1.5%
These costs are expected to be made over 65 years with the majority of the costs incurred between 2036 and 2077.
In 2011, the discount rate used to calculate the ARO was reduced from three and one half percent per annum to three percent perannum in the third quarter to two and one half percent per annum in the fourth quarter to reflect changes to the underlying longterm risk free rate. The change in the discount rates was made on a prospective basis with a $207 million increase made to theliability (2010 – $91 million) and a corresponding adjustment to PP&E.
PENGROWTH 2011 Financial Results 59

CONTRACT LIABILITIES
Pengrowth assumed firm transportation commitments in conjunction with prior period acquisitions. The fair values of thesecontracts were estimated on the date of acquisition and the amount recorded is reduced as the contracts settle.
12. INCOME TAXES
A reconciliation of tax expense calculated based on the income before taxes at the statutory tax rate to the actual provision forincome taxes is as follows:
2011 2010
Income before taxes 106,860 321,157
Combined federal and provincial tax rate 26.86% 28.40%
Expected income tax expense 28,703 91,209
Net income of the Trust (1) – (77,590)
Foreign exchange loss (gain) (2) 2,781 (8,320)
Effect of change in corporate tax rate (10,026) 185,274
Gains on investments (3,089) (20,949)
Change in deferred tax asset – (273)
Impairment on assets 4,362 –
Other (403) 1,970
Deferred income tax 22,328 171,321
(1) Relates to distributions of taxable income in Pengrowth Energy Trust for the year ended December 31, 2010 of $273.2 million x 28.40%, wherethe income tax liability was the responsibility of the trust unit holder.
(2) Reflects the 50% non-taxable portion of foreign exchange gains and losses.
The deferred income tax rate applied to the temporary differences in both 2011 and 2010 was 25.4 percent, compared to thecombined federal and provincial statutory rates of 26.9 percent for the 2011 taxation year and 28.4 percent for the 2010 taxationyear. The general combined federal and provincial tax rate decreased due to a reduction in the federal rate from 18.0 percent in2010 to 16.5 percent in 2011.
Under IFRS, taxable temporary differences in the stand alone financial statements of Pengrowth Energy Trust in 2010 weremeasured using the top marginal personal tax rate of 39 percent, as opposed to the corporate tax rate used under previous GAAP of25 percent. As Pengrowth Energy Trust had significant unutilized tax pools prior to conversion to a dividend paying corporation onDecember 31, 2010 this resulted in the recognition of a larger deferred tax asset of approximately $164 million at December 31,2010 (January 1, 2010 – $164 million). The offset to the deferred tax asset was recorded as an adjustment to the opening retainedearnings as of January 1, 2010. Upon conversion to a dividend paying corporation on December 31, 2010, this additional deferred taxasset was adjusted to the corporate tax rate of approximately 25 percent and then de-recognized through earnings on December 31,2010.
The net deferred income tax liability is comprised of:
2011 2010
Deferred tax liabilities:
Property, plant and equipment and exploration and evaluation assets (544,273) (470,796)
Long term debt (8,699) (19,820)
(552,972) (490,616)
Less deferred tax assets:
Non-capital losses 104,194 131,222
Share issue costs 5,106 5,163
Provisions 169,198 107,892
Risk management contracts 16,636 7,645
Net deferred tax liability (257,838) (238,694)
60 PENGROWTH 2011 Financial Results

In calculating the deferred income tax liability in 2011, Pengrowth included $420.9 million (2010 – $514.4 million) related tonon-capital losses available for carry forward to reduce taxable income in future years. These losses expire between 2015 and 2031.
Deferred tax assets have not been recognized with respect to the following items:
2011 2010
Deductible temporary differences 25,510 25,510
Tax losses 16,711 16,983
42,221 42,493
A continuity of the net deferred income tax asset (liability) for 2010 and 2011 is detailed in the following tables:
Movement in temporary differencesduring the year
BalanceJan 1, 2010
Recognized inprofit or loss
Recognizeddirectly in equity
Acquired inbusiness
combinationsBalance
Dec 31, 2010
Property, plant and equipment andexploration and evaluation assets (271,944) (96,809) – (102,043) (470,796)
Long term debt (12,402) (7,418) – – (19,820)
Share issue costs 9,994 1,416 (6,247) – 5,163
Non-capital losses 136,424 (5,202) – – 131,222
Provisions 171,533 (63,641) – – 107,892
Risk management contracts 7,312 333 – – 7,645
40,917 (171,321) (6,247) (102,043) (238,694)
Movement in temporary differences during the yearBalance
Jan 1, 2011Recognized inprofit or loss
Recognizeddirectly in equity
BalanceDec 31, 2011
Property, plant and equipment and exploration andevaluation assets (470,796) (73,477) – (544,273)
Long term debt (19,820) 11,121 – (8,699)
Share issue costs 5,163 (3,241) 3,184 5,106
Non-capital losses 131,222 (27,028) – 104,194
Provisions 107,892 61,306 – 169,198
Risk management contracts 7,645 8,991 – 16,636
(238,694) (22,328) 3,184 (257,838)
Deferred income tax is a non-cash item relating to the temporary differences between the accounting and tax basis of Pengrowth’sassets and liabilities and has no immediate impact on Pengrowth’s cash flows.
No current income taxes were paid by Pengrowth in 2011 and 2010.
PENGROWTH 2011 Financial Results 61

13. SHAREHOLDERS’ CAPITAL
Pengrowth is authorized to issue an unlimited number of common shares and up to 10 million preferred shares. No preferredshares have been issued. Pursuant to a Plan of Arrangement, shareholders’ capital was reduced by the amount of the consolidateddeficit upon conversion to a dividend paying corporation on December 31, 2010.
2011 2010
Common SharesNumber of
Common Shares AmountNumber of
Common Shares Amount
Balance, beginning of year 326,024,040 $ 3,171,719 – $ –
Issued to trust unitholders (1) – – 321,910,802 5,270,631
Issued to exchangeable shareholders (1) – – 4,113,238 52,567
Share based compensation (cash exercised) 542,083 3,540 – –
Share based compensation (non-cash exercised) 368,994 4,546 – –
Issued for cash under Dividend Reinvestment Plan(DR IP) 5,037,045 54,698 – –
Issued for cash on equity issue 28,310,000 300,086 – –
Issue costs net of tax of $3,184 – (9,367) – –
Elimination of the deficit – – – (2,151,479)
Balance, end of year 360,282,162 $ 3,525,222 326,024,040 $ 3,171,719
(1) As a result of the conversion to a dividend paying corporation, all outstanding trust units and exchangeable shares were converted to commonshares on December 31, 2010.
2011 2010
Trust Units IssuedNumber ofTrust Units Amount
Number of TrustUnits Amount
Balance, beginning of year – $ – 289,834,790 $ 4,927,324
Trust unit based compensation (cash exercised) – – 587,314 3,661
Trust unit based compensation (non-cash exercised) – – 257,607 3,589
Issued for cash under Distribution Reinvestment Plan(DRIP) – – 2,282,912 24,072
Issued for the Monterey business combination – – 27,967,959 307,648
Issued on redemption of Exchangeable shares – – 980,220 11,339
Issue costs net of tax – – – (623)
Change in effective tax rate on issue costs (Note 23) – – – (6,379)
Trust units exchanged for common shares under theArrangement – – (321,910,802) (5,270,631)
Balance, end of year – $ – – $ –
2011 2010
Exchangeable Shares
Number ofExchangeable
Shares Amount
Number ofExchangeable
Shares Amount
Balance, beginning of year – $ – – $ –
Issued for the Monterey business combination – – 4,994,426 54,939
Redemptions at fair value of trust units or commonshares (Note 23) – – – 8,967
Redeemed for trust units – – (973,980) (11,339)
Exchanged for common shares under theArrangement – – (4,020,446) (52,567)
Balance, end of year – $ – – $ –
62 PENGROWTH 2011 Financial Results

EXCHANGEABLE SHARES
Pengrowth issued exchangeable shares in the Monterey acquisition described in Note 4. These exchangeable shares were classifiedas a minority interest under IFRS, as opposed to being included in equity under previous GAAP. The exchange ratio increased witheach cash distribution and was calculated by multiplying the distribution per trust unit by the opening exchange ratio and dividing bythe ten day weighted average trading price of the trust units on the Toronto Stock Exchange prior to the distribution record date.
On December 31, 2010, all outstanding exchangeable shares were exchanged into 1.02308 common shares of the Corporation foreach exchangeable share held, thus there was no minority interest as at December 31, 2010.
DIVIDEND REINVESTMENT PLAN
In conjunction with the conversion, Pengrowth revised its Dividend Reinvestment Plan (“DRIP”). DRIP entitles the shareholder toreinvest cash dividends in additional shares of Pengrowth. Under the revised DRIP, the shares were issued from treasury at a fivepercent discount to the weighted average closing price of all shares traded on the TSX for the five trading days preceding a dividendpayment date.
Previously, the Trust had a similar program where unitholders were entitled to reinvest cash distributions in additional trust units ofthe Trust. The trust units under this plan were issued from treasury at a five percent discount to the weighted average closing priceof all trust units traded on the TSX for the twenty trading days preceding a distribution payment date.
On January 3, 2012, Pengrowth announced that it has introduced a Premium Dividend™ program in addition to the DRIP, effectiveFebruary 2012.
14. SHARE BASED COMPENSATION PLANS
Pengrowth has several share based compensation plans. The Long Term Incentive Plan (“LTIP”) as described below is used to grantawards of share based compensation on or after January 1, 2011. The long term incentive plans that were used prior to conversionto a corporate entity are being phased out with no new awards to be issued under the previous incentive plans. A rolling maximumof four and one half percent of the issued and outstanding common shares, in aggregate, may be reserved for issuance under theshare based compensation plans, as approved by shareholders.
LONG TERM INCENTIVE PLAN (“LTIP”)
Effective January 1, 2011, the following plans under the LTIP were implemented:
(a) Performance Share Units (“PSUs”)PSUs entitle the holder to a number of common shares to be issued in the third year after grant. PSUs are awarded toemployees, officers and special consultants. The number of shares issued will be subject to a performance factor ranging fromzero to two times the aggregate of the number of shares granted plus the amount of reinvested notional dividends.
(b) Restricted Share Units (“RSUs”)RSUs are awarded to employees, officers and special consultants and entitle the holder to a number of common shares plusreinvested notional dividends to be issued at vesting over three years. The RSUs generally vest on the first, second and thirdanniversary date from the date of grant.
(c) Deferred Share Units (“DSUs”)The DSU plan is currently only issued to members of the Board of Directors. Each DSU entitles the holder to a number ofcommon shares plus reinvested notional dividends. The DSUs vest upon grant but can only be converted to common sharesupon the holder ceasing to be a Director of Pengrowth. The number of common shares ultimately issued will be equal to thenumber of DSUs initially granted to the holder plus the amount of reinvested notional dividends accruing during the term of theDSUs.
PENGROWTH 2011 Financial Results 63
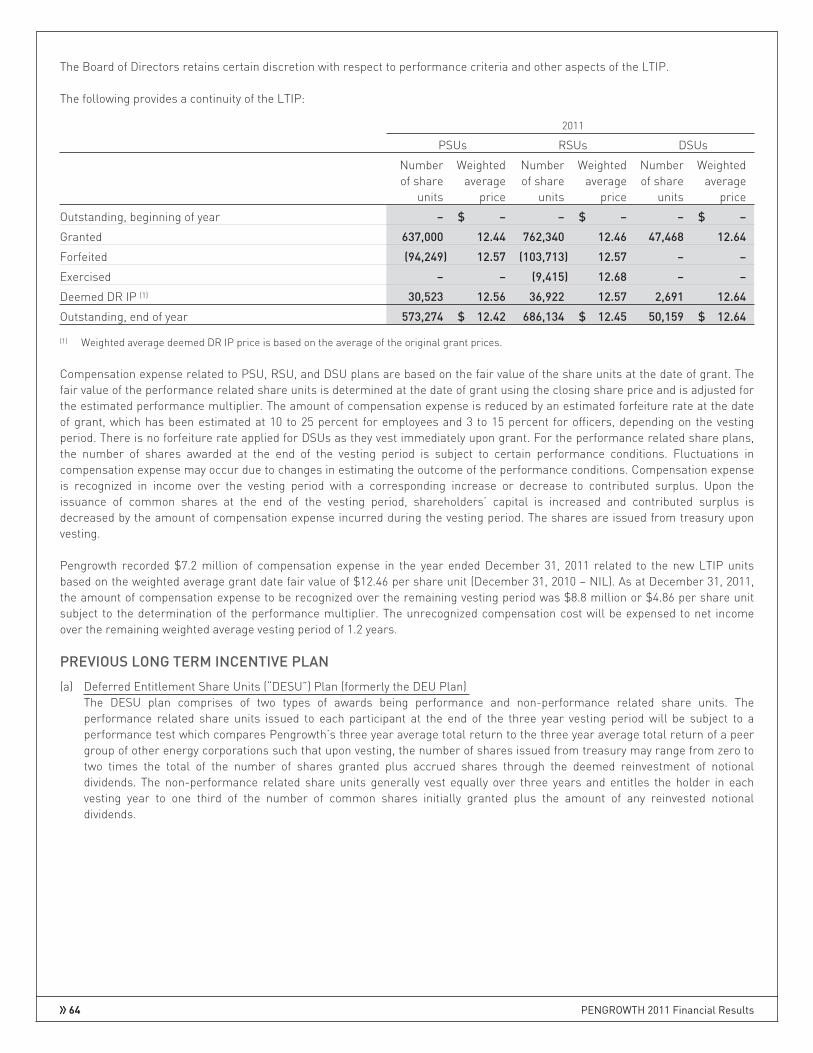
The Board of Directors retains certain discretion with respect to performance criteria and other aspects of the LTIP.
The following provides a continuity of the LTIP:
2011
PSUs RSUs DSUs
Numberof share
units
Weightedaverage
price
Numberof share
units
Weightedaverage
price
Numberof share
units
Weightedaverage
price
Outstanding, beginning of year – $ – – $ – – $ –
Granted 637,000 12.44 762,340 12.46 47,468 12.64
Forfeited (94,249) 12.57 (103,713) 12.57 – –
Exercised – – (9,415) 12.68 – –
Deemed DR IP (1) 30,523 12.56 36,922 12.57 2,691 12.64
Outstanding, end of year 573,274 $ 12.42 686,134 $ 12.45 50,159 $ 12.64
(1) Weighted average deemed DR IP price is based on the average of the original grant prices.
Compensation expense related to PSU, RSU, and DSU plans are based on the fair value of the share units at the date of grant. Thefair value of the performance related share units is determined at the date of grant using the closing share price and is adjusted forthe estimated performance multiplier. The amount of compensation expense is reduced by an estimated forfeiture rate at the dateof grant, which has been estimated at 10 to 25 percent for employees and 3 to 15 percent for officers, depending on the vestingperiod. There is no forfeiture rate applied for DSUs as they vest immediately upon grant. For the performance related share plans,the number of shares awarded at the end of the vesting period is subject to certain performance conditions. Fluctuations incompensation expense may occur due to changes in estimating the outcome of the performance conditions. Compensation expenseis recognized in income over the vesting period with a corresponding increase or decrease to contributed surplus. Upon theissuance of common shares at the end of the vesting period, shareholders’ capital is increased and contributed surplus isdecreased by the amount of compensation expense incurred during the vesting period. The shares are issued from treasury uponvesting.
Pengrowth recorded $7.2 million of compensation expense in the year ended December 31, 2011 related to the new LTIP unitsbased on the weighted average grant date fair value of $12.46 per share unit (December 31, 2010 – NIL). As at December 31, 2011,the amount of compensation expense to be recognized over the remaining vesting period was $8.8 million or $4.86 per share unitsubject to the determination of the performance multiplier. The unrecognized compensation cost will be expensed to net incomeover the remaining weighted average vesting period of 1.2 years.
PREVIOUS LONG TERM INCENTIVE PLAN
(a) Deferred Entitlement Share Units (“DESU”) Plan (formerly the DEU Plan)The DESU plan comprises of two types of awards being performance and non-performance related share units. Theperformance related share units issued to each participant at the end of the three year vesting period will be subject to aperformance test which compares Pengrowth’s three year average total return to the three year average total return of a peergroup of other energy corporations such that upon vesting, the number of shares issued from treasury may range from zero totwo times the total of the number of shares granted plus accrued shares through the deemed reinvestment of notionaldividends. The non-performance related share units generally vest equally over three years and entitles the holder in eachvesting year to one third of the number of common shares initially granted plus the amount of any reinvested notionaldividends.
64 PENGROWTH 2011 Financial Results

The following provides a continuity of the DESUs:
2011 2010
DESUsNumber of
DESUsWeighted
average priceNumber
of DESUsWeighted
average priceOutstanding, beginning of year 2,948,588 $10.95 2,291,469 $ 12.38Granted – – 1,469,536 11.21Forfeited (363,889) 9.34 (548,323) 11.12Exercised (249,504) 11.14 (459,074) 18.82Vested, no shares issued (1) (472,308) 16.81 – –Deemed DRIP (2) 161,255 9.99 194,980 11.20Outstanding, end of year 2,024,142 $ 9.78 2,948,588 $ 10.95Comprised of:Performance related DESUs 1,307,474 $ 8.44 1,957,660 $ 10.47Non-Performance related DESUs 716,668 12.21 990,928 11.91Outstanding, end of year 2,024,142 $ 9.78 2,948,588 $ 10.95
(1) 2008 DEU grant vested in 2011 with performance multiplier of zero percent.(2) Weighted average deemed DR IP price is based on the average of the original grant prices.
Pengrowth recorded $3.6 million of compensation expense in the year ended December 31, 2011 related to the DESUs (December31, 2010 – $3.4 million). As at December 31, 2011, the amount of compensation expense to be recognized over the remaining vestingperiod was approximately $3.6 million (December 31, 2010 – $10.0 million) or $2.21 per DESU (December 31, 2010 – $4.26 perDESU), subject to the determination of the performance multiplier. The unrecognized compensation cost will be expensed to netincome over the remaining weighted average vesting period of 1.0 year (December 31, 2010 – 1.6 years).
(b) Common Share Rights Incentive Plan (formerly the Trust Unit Rights Incentive Plan)The Trust Unit Rights Incentive Plan that was effective under the Trust was renamed on conversion to the Common ShareRights Incentive Plan. This plan consists of two types of awards being share unit options exercisable at a fixed price and shareunit rights exercisable at the original grant price or at a reduced price that is calculated in accordance with the plan. TheCommon Share Rights Incentive Plan provides the holder the right to purchase common shares over a five year period. Duringthe years ended December 31, 2011 and for 2010 there were no exercise price reductions under this plan.
2011 2010
Numberoutstanding
Weightedaverage price
Numberoutstanding
Weightedaverage price
Outstanding, beginning of year 3,583,766 $12.70 5,455,598 $12.23
Granted (1) – – 30,144 11.22
Expired (319,174) 19.40 (231,763) 13.31
Forfeited (505,235) 14.27 (1,082,899) 13.59
Exercised (542,083) 6.53 (587,314) 6.23
Outstanding, end of year 2,217,274 $12.96 3,583,766 $12.70
(1) Weighted average exercise price of rights granted are based on the exercise price at the date of grant.
Comprised of:
Share Unit Options 932,994 $ 6.98 1,646,445 $ 7.02
Share Unit Rights 1,284,280 17.30 1,937,321 17.53
Outstanding, end of year 2,217,274 $12.96 3,583,766 12.70
Exercisable, end of year 2,216,221 $12.96 3,028,860 $13.74
PENGROWTH 2011 Financial Results 65

The following table summarizes information about share unit rights and options outstanding and exercisable at December 31, 2011:
OptionsRange of exercise prices
Numberoutstanding
Weightedaverage
remainingcontractual life
(years )
Weightedaverage
exercise priceNumber
exercisable
Weightedaverage
exercise price
$6.00 to $8.99 692,708 2.2 $6.11 692,708 $6.11
$9.00 to $11.99 240,286 2.5 9.52 239,233 9.51
932,994 2.3 $6.98 931,941 $6.98
RightsRange of exercise prices
Numberoutstanding
Weightedaverage
remainingcontractual life
(years )
Weightedaverage
exercise priceNumber
exercisable
Weightedaverage
exercise price
$13.00 to $17.99 1,269,406 0.8 $17.27 1,269,406 $17.27
$18.00 to $25.99 14,874 1.4 19.37 14,874 19.37
1,284,280 0.8 $17.30 1,284,280 $17.30
Pengrowth recorded $0.2 million of compensation expense related to the common share rights incentive plan during the year endedDecember 31, 2011 (December 31, 2010 – $1.2 million). As at December 31, 2011, there was no remaining compensation expense tobe recognized over the remaining vesting period (December 31, 2010 – $0.2 million or $0.04 per share unit right). Common shareoptions were exercised regularly over the year, the weighted average share price over the year ended December 31, 2011 was$11.76 (2010 – $11.43).
The total share based compensation expense for the year ended December 31, 2011 was $11.0 million which is comprised of$7.2 million, $3.6 million and $0.2 million related to the new LTIP, DESUs and rights, respectively (2010 – $4.6 million comprised ofNil, $3.4 million, and $1.2 million, respectively).
EMPLOYEE SAVINGS PLANS
Pengrowth has savings plans whereby it will match contributions by qualifying employees of one to 12 percent of their annual basesalary, less any of Pengrowth’s contributions to the Group Registered Retirement Savings Plan (“Group RRSP”), to purchase sharesin the open market. Participants in the Group RRSP can make contributions from one to 12 percent and Pengrowth will matchcontributions to a maximum of six percent of their annual basic salary. Pengrowth’s share of contributions to the Share PurchasePlan and Group RRSP in 2011 were $4.5 million and $1.4 million, respectively (2010 – $4.2 million and $1.2 million, respectively).
15. OTHER CASH FLOW DISCLOSURES
RECLASSIFICATIONS
Pengrowth made certain presentation changes under IFRS that differ from previous GAAP. Under IFRS, the amount of cash interestpaid is presented as a use of cash in financing activities and hydrocarbon injectant purchases are presented as a use of cash ininvesting activities. These items were presented as a use of cash in operating activities under previous GAAP (see Note 23).
66 PENGROWTH 2011 Financial Results
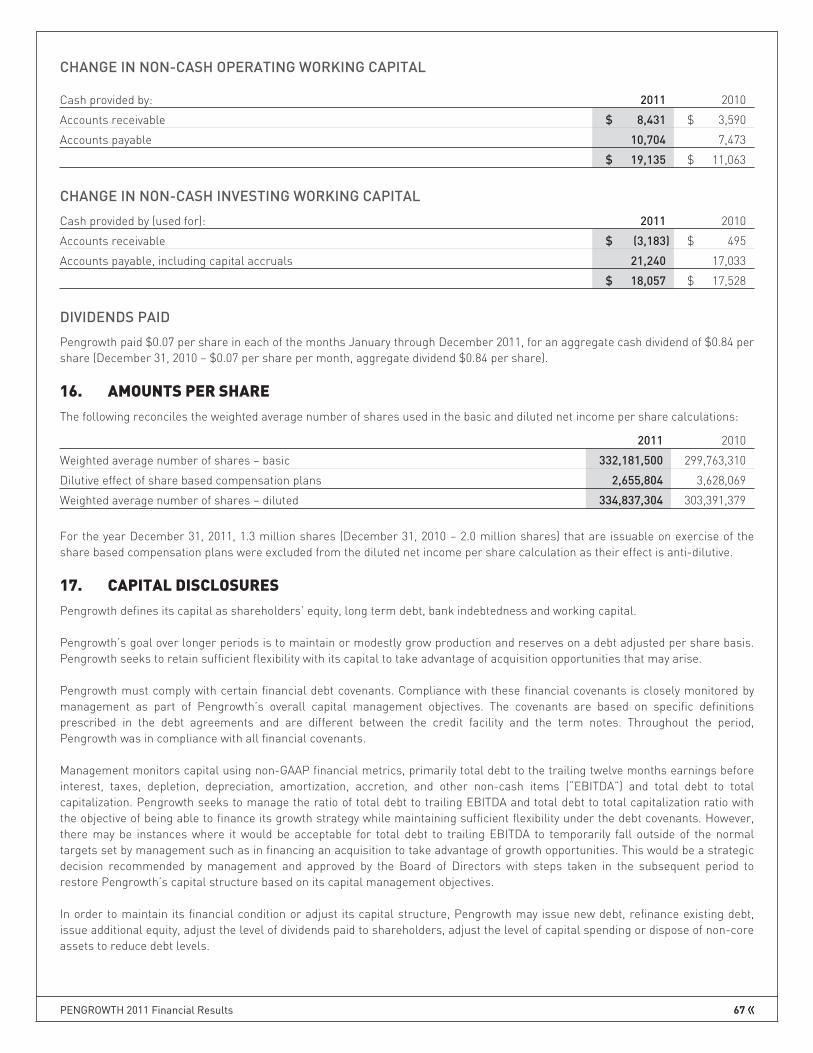
CHANGE IN NON-CASH OPERATING WORKING CAPITAL
Cash provided by: 2011 2010
Accounts receivable $ 8,431 $ 3,590
Accounts payable 10,704 7,473
$ 19,135 $ 11,063
CHANGE IN NON-CASH INVESTING WORKING CAPITAL
Cash provided by (used for): 2011 2010
Accounts receivable $ (3,183) $ 495
Accounts payable, including capital accruals 21,240 17,033
$ 18,057 $ 17,528
DIVIDENDS PAID
Pengrowth paid $0.07 per share in each of the months January through December 2011, for an aggregate cash dividend of $0.84 pershare (December 31, 2010 – $0.07 per share per month, aggregate dividend $0.84 per share).
16. AMOUNTS PER SHARE
The following reconciles the weighted average number of shares used in the basic and diluted net income per share calculations:
2011 2010
Weighted average number of shares – basic 332,181,500 299,763,310
Dilutive effect of share based compensation plans 2,655,804 3,628,069
Weighted average number of shares – diluted 334,837,304 303,391,379
For the year December 31, 2011, 1.3 million shares (December 31, 2010 – 2.0 million shares) that are issuable on exercise of theshare based compensation plans were excluded from the diluted net income per share calculation as their effect is anti-dilutive.
17. CAPITAL DISCLOSURES
Pengrowth defines its capital as shareholders’ equity, long term debt, bank indebtedness and working capital.
Pengrowth’s goal over longer periods is to maintain or modestly grow production and reserves on a debt adjusted per share basis.Pengrowth seeks to retain sufficient flexibility with its capital to take advantage of acquisition opportunities that may arise.
Pengrowth must comply with certain financial debt covenants. Compliance with these financial covenants is closely monitored bymanagement as part of Pengrowth’s overall capital management objectives. The covenants are based on specific definitionsprescribed in the debt agreements and are different between the credit facility and the term notes. Throughout the period,Pengrowth was in compliance with all financial covenants.
Management monitors capital using non-GAAP financial metrics, primarily total debt to the trailing twelve months earnings beforeinterest, taxes, depletion, depreciation, amortization, accretion, and other non-cash items (“EBITDA”) and total debt to totalcapitalization. Pengrowth seeks to manage the ratio of total debt to trailing EBITDA and total debt to total capitalization ratio withthe objective of being able to finance its growth strategy while maintaining sufficient flexibility under the debt covenants. However,there may be instances where it would be acceptable for total debt to trailing EBITDA to temporarily fall outside of the normaltargets set by management such as in financing an acquisition to take advantage of growth opportunities. This would be a strategicdecision recommended by management and approved by the Board of Directors with steps taken in the subsequent period torestore Pengrowth’s capital structure based on its capital management objectives.
In order to maintain its financial condition or adjust its capital structure, Pengrowth may issue new debt, refinance existing debt,issue additional equity, adjust the level of dividends paid to shareholders, adjust the level of capital spending or dispose of non-coreassets to reduce debt levels.
PENGROWTH 2011 Financial Results 67

Pengrowth’s objectives, policies and processes for managing capital have remained substantially consistent from the prior year.Management believes that current total debt to trailing EBITDA and total debt to total capitalization are within reasonable limits.
The following is a summary of Pengrowth’s capital structure, excluding shareholders’ equity:
2011 2010
Term credit facilities $ – $ 39,000
Senior unsecured notes 1,007,686 985,367
Working capital deficiency 137,287 109,237
$ 1,144,973 $ 1,133,604
18. FINANCIAL INSTRUMENTS
Pengrowth’s financial instruments are composed of accounts receivable, accounts payable, fair value of risk management assetsand liabilities, remediation trust funds, other investments in another entity, dividends payable to shareholders, bank indebtednessand long term debt.
Details of Pengrowth’s significant accounting policies for recognition and measurement of financial instruments are disclosed inNote 2.
RISK MANAGEMENT OVERVIEWPengrowth has exposure to certain market risks related to volatility in commodity prices, interest rates and foreign exchange rates.Derivative instruments are used to manage exposure to these risks. Pengrowth’s policy is not to utilize financial instruments fortrading or speculative purposes.
The Board of Directors and management have overall responsibility for the establishment of risk management strategies andobjectives. Pengrowth’s risk management policies are established to identify the risks faced by Pengrowth, to set appropriate risklimits, and to monitor adherence to risk limits. Risk management policies are reviewed regularly to reflect changes in marketconditions and Pengrowth’s activities.
MARKET RISK
Market risk is the risk that the fair value, or future cash flows of financial assets and liabilities, will fluctuate due to movements inmarket prices. Market risk is composed of commodity price risk, foreign currency risk and interest rate risk.
Commodity Price Risk
Pengrowth is exposed to commodity price risk as prices for oil and gas products fluctuate in response to many factors includinglocal and global supply and demand, weather patterns, pipeline transportation, political stability and economic factors. Commodityprice fluctuations are an inherent part of the oil and gas business. While Pengrowth does not consider it prudent to entirelyeliminate this risk, it does mitigate some of the exposure to commodity price risk to protect the return on acquisitions and provide alevel of stability to operating cash flow which enables Pengrowth to fund its capital development program and dividends. Pengrowthutilizes financial contracts to fix the commodity price associated with a portion of its future production. The use of forward andfutures contracts are governed by formal policies and is subject to limits established by the Board of Directors. The Board ofDirectors and management may re-evaluate these limits as needed in response to specific events such as market activity,additional leverage, acquisitions or other transactions where Pengrowth’s capital structure may be subject to more risk fromcommodity prices.
As at December 31, 2011, Pengrowth had fixed the price applicable to future production as follows:
Crude Oil:
Reference Point Volume (bbl/d) Term Price per bbl
Financial:
WTI (1) 17,000 Jan 1, 2012 - Dec 31, 2012 $ 93.23 Cdn
WTI (1) 3,500 Jan 1, 2013 - Dec 31, 2013 $ 95.29 Cdn
(1) Associated Cdn $/U.S. $ foreign exchange rate has been fixed.
68 PENGROWTH 2011 Financial Results
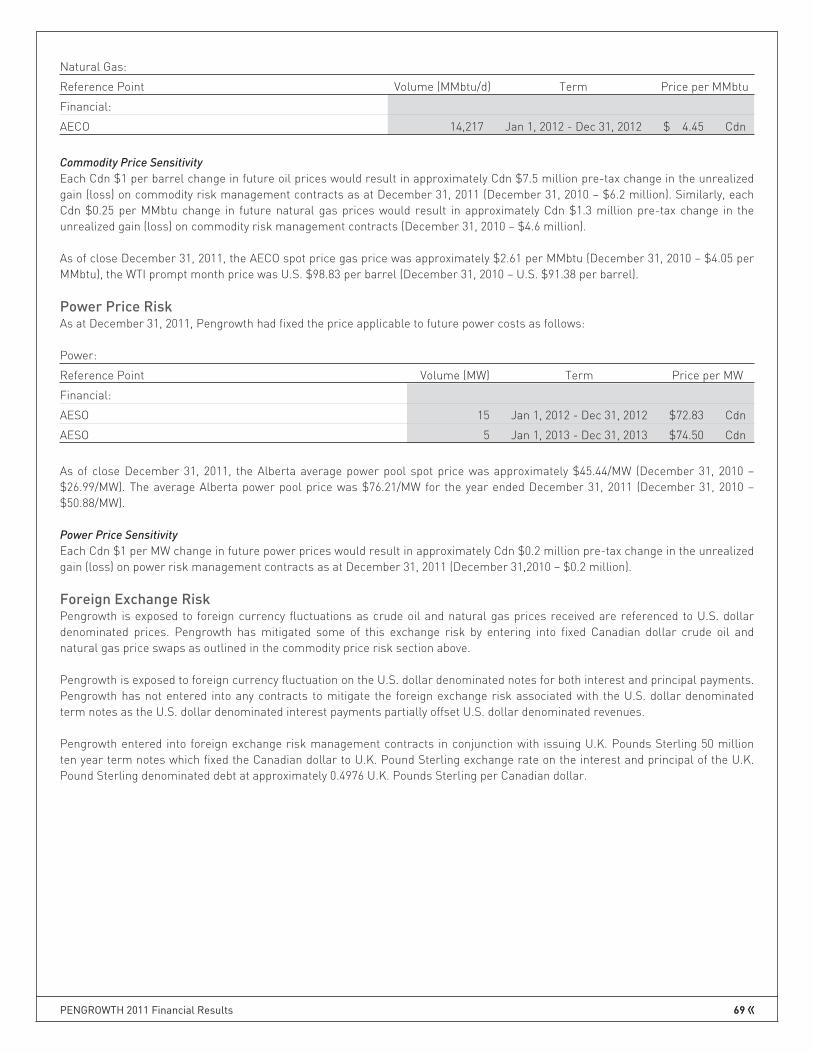
Natural Gas:
Reference Point Volume (MMbtu/d) Term Price per MMbtu
Financial:
AECO 14,217 Jan 1, 2012 - Dec 31, 2012 $ 4.45 Cdn
Commodity Price Sensitivity
Each Cdn $1 per barrel change in future oil prices would result in approximately Cdn $7.5 million pre-tax change in the unrealizedgain (loss) on commodity risk management contracts as at December 31, 2011 (December 31, 2010 – $6.2 million). Similarly, eachCdn $0.25 per MMbtu change in future natural gas prices would result in approximately Cdn $1.3 million pre-tax change in theunrealized gain (loss) on commodity risk management contracts (December 31, 2010 – $4.6 million).
As of close December 31, 2011, the AECO spot price gas price was approximately $2.61 per MMbtu (December 31, 2010 – $4.05 perMMbtu), the WTI prompt month price was U.S. $98.83 per barrel (December 31, 2010 – U.S. $91.38 per barrel).
Power Price RiskAs at December 31, 2011, Pengrowth had fixed the price applicable to future power costs as follows:
Power:
Reference Point Volume (MW) Term Price per MW
Financial:
AESO 15 Jan 1, 2012 - Dec 31, 2012 $72.83 Cdn
AESO 5 Jan 1, 2013 - Dec 31, 2013 $74.50 Cdn
As of close December 31, 2011, the Alberta average power pool spot price was approximately $45.44/MW (December 31, 2010 –$26.99/MW). The average Alberta power pool price was $76.21/MW for the year ended December 31, 2011 (December 31, 2010 –$50.88/MW).
Power Price Sensitivity
Each Cdn $1 per MW change in future power prices would result in approximately Cdn $0.2 million pre-tax change in the unrealizedgain (loss) on power risk management contracts as at December 31, 2011 (December 31,2010 – $0.2 million).
Foreign Exchange RiskPengrowth is exposed to foreign currency fluctuations as crude oil and natural gas prices received are referenced to U.S. dollardenominated prices. Pengrowth has mitigated some of this exchange risk by entering into fixed Canadian dollar crude oil andnatural gas price swaps as outlined in the commodity price risk section above.
Pengrowth is exposed to foreign currency fluctuation on the U.S. dollar denominated notes for both interest and principal payments.Pengrowth has not entered into any contracts to mitigate the foreign exchange risk associated with the U.S. dollar denominatedterm notes as the U.S. dollar denominated interest payments partially offset U.S. dollar denominated revenues.
Pengrowth entered into foreign exchange risk management contracts in conjunction with issuing U.K. Pounds Sterling 50 millionten year term notes which fixed the Canadian dollar to U.K. Pound Sterling exchange rate on the interest and principal of the U.K.Pound Sterling denominated debt at approximately 0.4976 U.K. Pounds Sterling per Canadian dollar.
PENGROWTH 2011 Financial Results 69

Foreign Exchange Rate Sensitivity
The following summarizes the sensitivity on a pre-tax basis of a change in the foreign exchange rate on unrealized foreign exchangegains (losses) related to the translation of the foreign denominated term debt and on unrealized gains (losses) related to the changein the fair value of the foreign exchange risk management contracts, holding all other variables constant:
Cdn $0.01 Exchange RateChange
Foreign Exchange Sensitivity as at December 31, 2011 Cdn - U.S. Cdn - U.K.
Unrealized foreign exchange gain or loss on foreign denominated debt $ 9,020 $ 500
Unrealized foreign exchange risk management gain or loss – 593
Cdn $0.01 Exchange RateChange
Foreign Exchange Sensitivity as at December 31, 2010 Cdn - U.S. Cdn - U.K.
Unrealized foreign exchange gain or loss on foreign denominated debt $ 9,020 $ 500
Unrealized foreign exchange risk management gain or loss – 578
Interest Rate Risk
Pengrowth is exposed to interest rate risk on the Canadian dollar revolving credit facility as the interest is based on floating interestrates.
Interest Rate Sensitivity
As at December 31, 2011, Pengrowth has approximately $1.0 billion of long term debt (December 31, 2010 – $1.0 billion) with noamounts outstanding which are based on floating interest rates (December 31, 2010 – $39 million). A one percent increase ininterest rates would have no impact on 2011 pre-tax interest expense (2010 $0.4 million increase).
Summary of Risk Management Contracts
Pengrowth’s risk management contracts are recorded on the balance sheet at their estimated fair value and split between currentand non-current assets and liabilities on a contract by contract bases. Realized and unrealized gains and losses are included in theStatement of Income.
The following tables provide details of the fair value of risk management contracts and the unrealized and realized gains and losseson risk management recorded in the Statement of Income:
As at and for the year ended December 31, 2011
Commodity riskmanagement
contracts (1)
Power riskmanagement
contracts (2)
Foreign exchangerisk management
contracts (3) Total
Current portion of risk management assets $ – $ 643 $ – $ 643
Current portion of risk management liabilities (38,574) – (1,179) (39,753)
Non-current portion of risk management liabilities (3,462) (107) (22,918) (26,487)
Risk management assets (liabilities), end of year (42,036) 536 (24,097) (65,597)
Less: Risk management (liabilities) assets at beginning of year (2,085) 870 (25,929) (27,144)
Unrealized (loss) gain on risk management contracts for theyear (39,951) (334) 1,832 (38,453)
Realized gain (loss) on risk management contracts for the year 16,843 6,543 (593) 22,793
Total unrealized and realized (loss) gain on risk managementcontracts for the year $ (23,108) $ 6,209 $ 1,239 $ (15,660)
70 PENGROWTH 2011 Financial Results

As at and for the year ended December 31, 2010
Commodity riskmanagement
contracts (1)
Power riskmanagement
contracts (2)
Foreign exchangerisk management
contracts (3) Total
Current portion of risk management assets (liabilities) $ 12,680 $ 870 $ – $ 13,550
Current portion of risk management liabilities (8,029) – (1,249) (9,278)
Non-current portion of risk management liabilities (6,736) – (24,680) (31,416)
Risk management assets (liabilities), end of year (2,085) 870 (25,929) (27,144)
Less: Risk management (liabilities) assets at beginning ofyear (9,034) – (17,789) (26,823)
Unrealized gain (loss) on risk management contracts for theyear 6,949 870 (8,140) (321)
Realized gain (loss) on risk management contracts for theyear 75,065 565 (586) 75,044
Total unrealized and realized gain (loss) on risk managementcontracts for the year $ 82,014 $ 1,435 $ (8,726) $ 74,723
(1) Unrealized gains and losses are presented as a separate caption in revenue. Realized gains and losses are included in oil and gas sales.(2) Unrealized gains and losses are included in other expenses (income). Realized gains and losses are included in operating expenses.(3) Unrealized gains and losses are presented as a separate caption in expenses. Realized gains and losses are included in interest expense.
FAIR VALUEThe fair value of accounts receivable, accounts payable, bank indebtedness, and dividends payable approximate their carryingamount due to the short-term nature of those instruments. The fair value of the Canadian dollar revolving credit facility is equal toits carrying amount as the facility bears interest at floating rates and credit spreads within the facility are indicative of market rates.The fair value of the remediation trust funds and investment in a private company are equal to their carrying amount as theseassets are classified as fair value through profit or loss and carried at fair value.
The following tables provide fair value measurement information for financial assets and liabilities as of December 31, 2011 and2010.
Fair Value Measurements Using:
As at December 31, 2011 Carrying Amount Fair Value
Quoted Prices inActive Markets
(Level 1)
Significant OtherObservable Inputs
(Level 2)
SignificantUnobservable Inputs
(Level 3)
Financial Assets
Remediation trust funds $ 49,712 $ 49,712 $ 49,712 $ – $ –
Fair value of risk managementcontracts 643 643 – 643 –
Investment in Private Corporation 35,000 35,000 – – 35,000
Financial Liabilities
U.S. dollar denominated seniorunsecured notes 913,968 1,075,196 – 1,075,196 –
Cdn dollar senior unsecured notes 15,000 16,836 – 16,836 –
U.K. Pound Sterling denominatedunsecured notes 78,718 89,786 – 89,786 –
Fair value of risk managementcontracts 66,240 66,240 – 66,240 –
PENGROWTH 2011 Financial Results 71

Fair Value Measurements Using:
As at December 31, 2010 Carrying Amount Fair Value
Quoted Prices inActive Markets
(Level 1)
Significant OtherObservable Inputs
(Level 2)
SignificantUnobservable Inputs
(Level 3)
Financial Assets
Remediation trust funds $ 42,114 $ 42,115 $ 42,115 $ – $ –
Fair value of risk managementcontracts 13,550 13,550 – 13,550 –
Investment in Private Corporation 12,000 12,000 – – 12,000
Financial Liabilities
U.S. dollar denominated seniorunsecured notes 893,148 988,949 – 988,949 –
Cdn dollar senior unsecured notes 15,000 15,735 – 15,735 –
U.K. Pound Sterling denominatedunsecured notes 77,219 84,599 – 84,599 –
Fair value of risk managementcontracts 40,694 40,694 – 40,694 –
Level 1 Fair Value Measurements
Financial assets and liabilities are recorded at fair value based on quoted prices in active markets.
Level 2 Fair Value Measurements
Risk management contracts – the fair value of the risk management contracts is based on commodity and foreign exchange curvesthat are readily available or, in their absence, third-party market indications and forecasts priced on the last trading day of theapplicable period.
Term notes – the fair value of the term notes is determined based on the risk free interest rate on government debt instruments ofsimilar maturities, adjusted for estimated credit risk, industry risk and market risk premiums.
Level 3 Fair Value Measurements
Investment in Private Corporation – the fair value of the investment in Private Corporation is determined by considering severalfactors, particularly the issue price of the shares in the most recent private placement. The fair value of the investment hasincreased to $35 million as at December 31, 2011 (December 31, 2010—$12 million), resulting in an unrealized gain of $23 million in2011 (December 31, 2010 – NIL).
CREDIT RISKCredit risk is the risk of financial loss to Pengrowth if a counterparty to a financial instrument fails to meet its contractualobligations. A significant portion of Pengrowth’s accounts receivable are with customers in the oil and gas industry and are subjectto normal industry credit risks. Uncertainty in the credit markets, should it exist, may restrict the ability of Pengrowth’s normalbusiness counterparties to meet their obligations to Pengrowth. Additional credit risk could exist where little or none previouslyexisted. Pengrowth manages its credit risk by performing a credit review on each marketing counterparty and following a creditpractice that limits transactions according to the counterparty’s credit rating as assessed by Pengrowth. In addition, Pengrowthmay require letters of credit or parental guarantees from certain counterparties to mitigate some of the credit risk associated withthe amounts owing by the counterparty. The use of financial swap agreements involves a degree of credit risk that Pengrowthmanages through its credit policies which are designed to limit eligible counterparties to those with investment grade credit ratingsor better. The carrying value of accounts receivable and risk management assets represents Pengrowth’s maximum creditexposure.
Pengrowth sells a significant portion of its oil and gas to a limited number of counterparties. Pengrowth has three counterpartiesthat individually account for more than ten percent of annual revenue. All of these counterparties are large, well-establishedcompanies supported by investment grade credit ratings.
72 PENGROWTH 2011 Financial Results
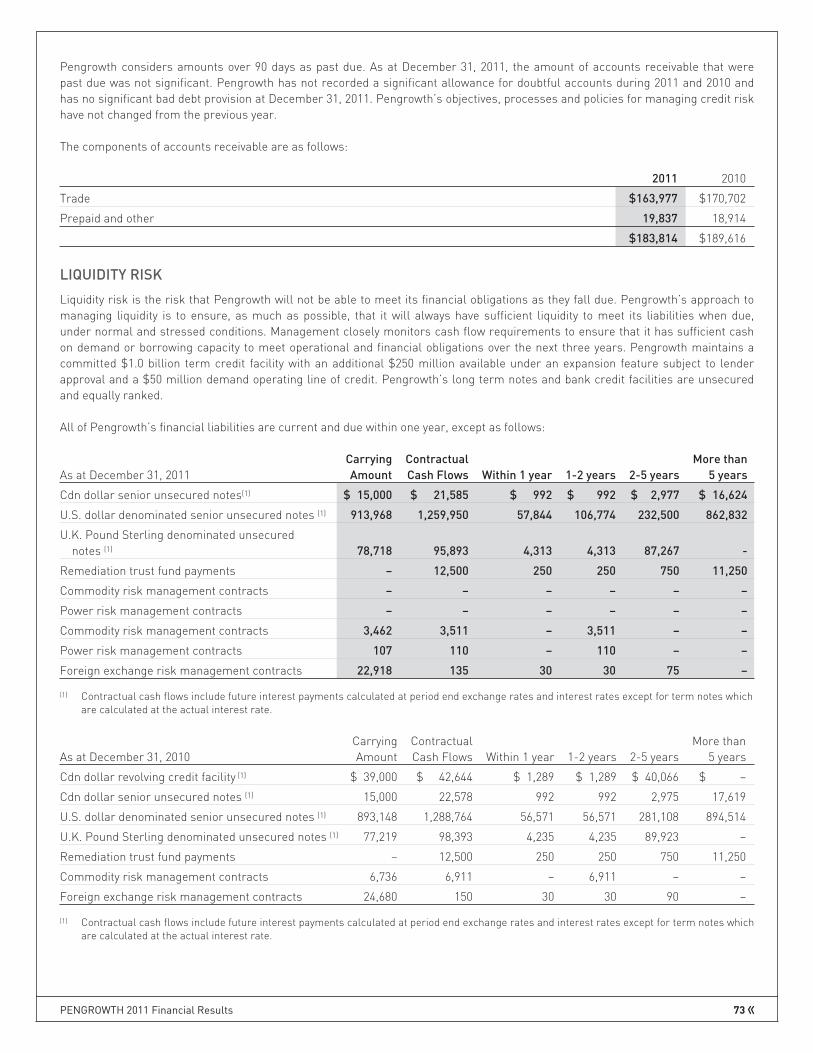
Pengrowth considers amounts over 90 days as past due. As at December 31, 2011, the amount of accounts receivable that werepast due was not significant. Pengrowth has not recorded a significant allowance for doubtful accounts during 2011 and 2010 andhas no significant bad debt provision at December 31, 2011. Pengrowth’s objectives, processes and policies for managing credit riskhave not changed from the previous year.
The components of accounts receivable are as follows:
2011 2010
Trade $163,977 $170,702
Prepaid and other 19,837 18,914
$183,814 $189,616
LIQUIDITY RISK
Liquidity risk is the risk that Pengrowth will not be able to meet its financial obligations as they fall due. Pengrowth’s approach tomanaging liquidity is to ensure, as much as possible, that it will always have sufficient liquidity to meet its liabilities when due,under normal and stressed conditions. Management closely monitors cash flow requirements to ensure that it has sufficient cashon demand or borrowing capacity to meet operational and financial obligations over the next three years. Pengrowth maintains acommitted $1.0 billion term credit facility with an additional $250 million available under an expansion feature subject to lenderapproval and a $50 million demand operating line of credit. Pengrowth’s long term notes and bank credit facilities are unsecuredand equally ranked.
All of Pengrowth’s financial liabilities are current and due within one year, except as follows:
As at December 31, 2011CarryingAmount
ContractualCash Flows Within 1 year 1-2 years 2-5 years
More than5 years
Cdn dollar senior unsecured notes(1) $ 15,000 $ 21,585 $ 992 $ 992 $ 2,977 $ 16,624
U.S. dollar denominated senior unsecured notes (1) 913,968 1,259,950 57,844 106,774 232,500 862,832
U.K. Pound Sterling denominated unsecurednotes (1) 78,718 95,893 4,313 4,313 87,267 -
Remediation trust fund payments – 12,500 250 250 750 11,250
Commodity risk management contracts – – – – – –
Power risk management contracts – – – – – –
Commodity risk management contracts 3,462 3,511 – 3,511 – –
Power risk management contracts 107 110 – 110 – –
Foreign exchange risk management contracts 22,918 135 30 30 75 –
(1) Contractual cash flows include future interest payments calculated at period end exchange rates and interest rates except for term notes whichare calculated at the actual interest rate.
As at December 31, 2010CarryingAmount
ContractualCash Flows Within 1 year 1-2 years 2-5 years
More than5 years
Cdn dollar revolving credit facility (1) $ 39,000 $ 42,644 $ 1,289 $ 1,289 $ 40,066 $ –
Cdn dollar senior unsecured notes (1) 15,000 22,578 992 992 2,975 17,619
U.S. dollar denominated senior unsecured notes (1) 893,148 1,288,764 56,571 56,571 281,108 894,514
U.K. Pound Sterling denominated unsecured notes (1) 77,219 98,393 4,235 4,235 89,923 –
Remediation trust fund payments – 12,500 250 250 750 11,250
Commodity risk management contracts 6,736 6,911 – 6,911 – –
Foreign exchange risk management contracts 24,680 150 30 30 90 –
(1) Contractual cash flows include future interest payments calculated at period end exchange rates and interest rates except for term notes whichare calculated at the actual interest rate.
PENGROWTH 2011 Financial Results 73

19. FOREIGN EXCHANGE (GAIN) LOSS
2011 2010
Unrealized foreign exchange loss (gain) on U.S. dollar denominated debt $19,553 $(50,692)
Unrealized foreign exchange loss (gain) on U.K. pound sterling denominated debt 1,377 (7,366)
$20,930 $(58,058)
Unrealized (gain) loss on foreign exchange risk management contracts (1,832) 8,140
Unrealized foreign exchange loss (gain) $19,098 $(49,918)
Realized foreign exchange loss $ 1,583 $ 2,061
20. COMMITMENTS
2012 2013 2014 2015 2016 Thereafter Total
Long term debt (1) $ – $ 50,850 $ – $151,711 $ – $808,769 $1,011,330
Interest payments on long term debt (2) 63,149 61,229 60,371 58,002 52,660 70,687 366,098
Operating leases (3) 15,732 15,445 14,994 14,211 14,003 15,911 90,296
$ 78,881 $127,524 $75,365 $223,924 $66,663 $895,367 $1,467,724
Purchase obligations
Pipeline transportation 28,527 22,473 19,395 17,535 2,113 506 90,549
CO2 purchases (4) 2,874 2,891 2,907 2,924 836 – 12,432
$ 31,401 $ 25,364 $22,302 $ 20,459 $ 2,949 $ 506 $ 102,981Remediation trust fund payments 250 250 250 250 250 11,250 12,500
$110,532 $153,138 $97,917 $244,633 $69,862 $907,123 $1,583,205
(1) The debt repayment includes the principal owing at maturity on foreign denominated fixed rate debt translated using the year end exchangerate.
(2) Interest payments are calculated at period end exchange rates and interest rates except for foreign denominated fixed rate debt which iscalculated at the actual interest rate.
(3) Includes office rent and vehicle leases.(4) For the Weyburn CO2 project, prices are denominated in U.S. dollars and have been translated at the year-end exchange rate.
21. CONTINGENCIES
Pengrowth is sometimes named as a defendant in litigation. The nature of these claims is usually related to settlement of normaloperational issues and labour issues. The outcome of such claims against Pengrowth is not determinable at this time; however,their ultimate resolution is not expected to have a materially adverse effect on Pengrowth as a whole.
22. SUPPLEMENTARY DISCLOSURES
INCOME STATEMENT PRESENTATION
Pengrowth’s statement of income is prepared primarily by the nature of expense, with the exception of employee compensationcosts which are included in both operating and general and administrative expense line items.
The following table details the amount of total employee compensation costs included in the operating and general andadministrative expense line items in the statement of income.
2011 2010
Operating $54,382 $54,142
General and administrative 38,908 27,852
Total employee compensation costs $93,290 $81,994
74 PENGROWTH 2011 Financial Results
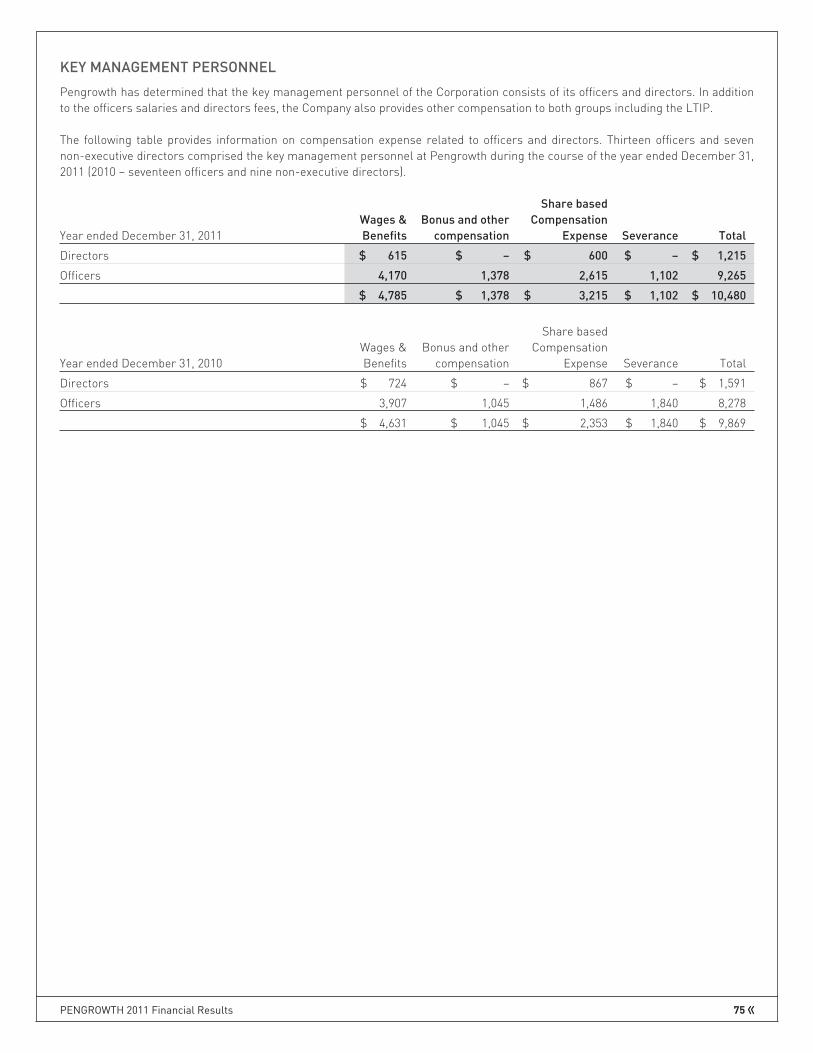
KEY MANAGEMENT PERSONNEL
Pengrowth has determined that the key management personnel of the Corporation consists of its officers and directors. In additionto the officers salaries and directors fees, the Company also provides other compensation to both groups including the LTIP.
The following table provides information on compensation expense related to officers and directors. Thirteen officers and sevennon-executive directors comprised the key management personnel at Pengrowth during the course of the year ended December 31,2011 (2010 – seventeen officers and nine non-executive directors).
Year ended December 31, 2011Wages &Benefits
Bonus and othercompensation
Share basedCompensation
Expense Severance Total
Directors $ 615 $ – $ 600 $ – $ 1,215
Officers 4,170 1,378 2,615 1,102 9,265
$ 4,785 $ 1,378 $ 3,215 $ 1,102 $ 10,480
Year ended December 31, 2010Wages &Benefits
Bonus and othercompensation
Share basedCompensation
Expense Severance Total
Directors $ 724 $ – $ 867 $ – $ 1,591
Officers 3,907 1,045 1,486 1,840 8,278
$ 4,631 $ 1,045 $ 2,353 $ 1,840 $ 9,869
PENGROWTH 2011 Financial Results 75

23. RECONCILIATION FROM PREVIOUS GAAP TO IFRS
RECONCILIATION OF BALANCE SHEET FROM PREVIOUS GAAP TO IFRS
AT THE DATE OF IFRS TRANSITION – JANUARY 1, 2010
Note Previous GAAP
Reclassificationupon transition
to IFRS
Effect oftransition to
IFRS IFRSASSETSCurrent Assets
Accounts receivable $ 182,342 $ – $ – $ 182,342Fair value of risk management contracts 14,001 14,001Future income taxes (e) 969 (969) –
197,312 (969) – 196,343Other assets (d) 46,027 6,984 53,011Deferred income taxes (e) – (180,671) 221,588 40,917Property, plant and equipment (a) 3,789,369 (67,597) 15,412 3,737,184Exploration and evaluation assets (a) – 67,597 67,597Goodwill (c) 660,896 660,896TOTAL ASSETS $ 4,693,604 $ (181,640) $ 243,984 $ 4,755,948
LIABILITIES AND UNITHOLDERS’ EQUITYCurrent Liabilities
Bank indebtedness $ 11,563 $ – $ – $ 11,563Accounts payable 185,337 185,337Distributions payable to unitholders 40,590 40,590Fair value of risk management contracts 17,555 17,555Contract liabilities (b) 1,728 (1,728) –Current portion of long-term debt 157,546 157,546Current portion of provisions (b) – 21,227 21,227
414,319 19,499 – 433,818Fair value of risk management contracts 23,269 23,269Contract liabilities (b) 7,952 (7,952) –Convertible debentures 74,828 74,828Long term debt 907,599 907,599Provisions (b) – 277,249 161,815 439,064Asset retirement obligations (b) 288,796 (288,796) –Future income taxes (e) 181,640 (181,640) –
1,898,403 (181,640) 161,815 1,878,578Trust Unitholders’ Equity
Trust unitholders’ capital (f) 4,920,945 6,379 4,927,324Equity portion of convertible debentures 160 160Contributed surplus 18,617 18,617Deficit (f) (2,144,521) 75,790 (2,068,731)
2,795,201 – 82,169 2,877,370TOTAL LIABILITIES AND UNITHOLDERS’ EQUITY $ 4,693,604 $ (181,640) $ 243,984 $ 4,755,948
76 PENGROWTH 2011 Financial Results

23. RECONCILIATION FROM PREVIOUS GAAP TO IFRS (continued)
RECONCILIATION OF BALANCE SHEET FROM PREVIOUS GAAP TO IFRS
AS AT DECEMBER 31, 2010
NotePrevious
GAAP
Reclassificationupon transition to
IFRS
Effect oftransition to
IFRS IFRS
ASSETS
Current Assets
Cash and cash equivalents $ 2,849 $ – $ – $ 2,849
Accounts receivable 189,616 189,616
Fair value of risk management contracts 13,550 13,550
206,015 – – 206,015
Other assets (d) 47,114 7,001 54,115
Property, plant and equipment (a) 4,076,976 (511,569) 172,609 3,738,016
Exploration and evaluation assets (a) 511,569 511,569
Goodwill (c) 712,661 4,230 716,891
TOTAL ASSETS $ 5,042,766 $ – $ 183,840 $ 5,226,606
LIABILITIES AND SHAREHOLDERS’ EQUITY
Current Liabilities
Bank indebtedness $ 22,000 $ – $ – $ 22,000
Accounts payable 240,952 240,952
Dividends payable 22,534 22,534
Fair value of risk management contracts 9,278 9,278
Future income taxes 1,203 (1,203) –
Contract liabilities (b) 1,677 (1,677) –
Current portion of provisions (b) – 20,488 20,488
297,644 17,608 – 315,252
Fair value of risk management contracts 31,416 31,416
Contract liabilities (b) 6,275 (6,275) –
Long term debt 1,024,367 1,024,367
Asset retirement obligations 259,538 (259,538) –
Provisions (b) 247,002 187,530 434,532
Deferred income taxes (e) 237,753 941 238,694
Future income taxes (e) 236,550 (236,550) –
$ 1,855,790 $ – $ 188,471 $ 2,044,261
SHAREHOLDERS’ EQUITY
Shareholders’ capital (f) 3,167,383 (4,631) 8,967 3,171,719
Contributed surplus 19,593 (8,967) 10,626
Deficit (f) – 4,631 (4,631) –
3,186,976 – (4,631) 3,182,345
TOTAL LIABILITIES AND SHAREHOLDERS’ EQUITY $ 5,042,766 $ – $ 183,840 $ 5,226,606
PENGROWTH 2011 Financial Results 77
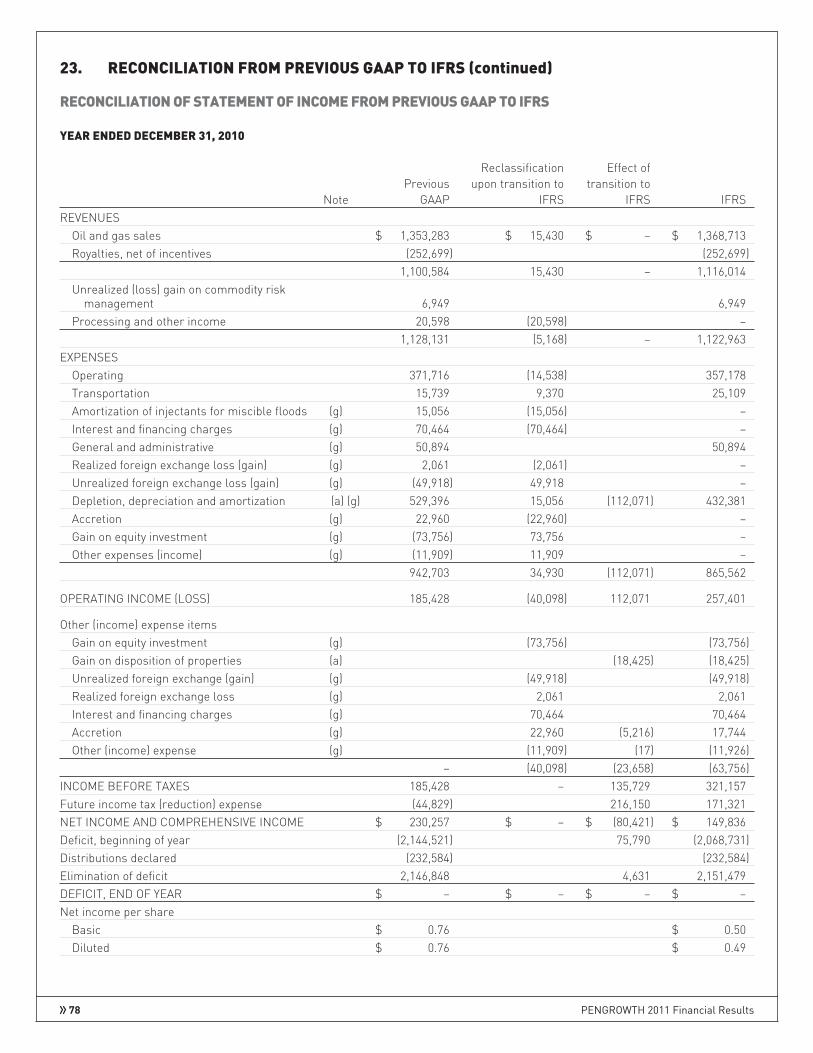
23. RECONCILIATION FROM PREVIOUS GAAP TO IFRS (continued)
RECONCILIATION OF STATEMENT OF INCOME FROM PREVIOUS GAAP TO IFRS
YEAR ENDED DECEMBER 31, 2010
NotePrevious
GAAP
Reclassificationupon transition to
IFRS
Effect oftransition to
IFRS IFRSREVENUES
Oil and gas sales $ 1,353,283 $ 15,430 $ – $ 1,368,713Royalties, net of incentives (252,699) (252,699)
1,100,584 15,430 – 1,116,014Unrealized (loss) gain on commodity risk
management 6,949 6,949Processing and other income 20,598 (20,598) –
1,128,131 (5,168) – 1,122,963EXPENSES
Operating 371,716 (14,538) 357,178Transportation 15,739 9,370 25,109Amortization of injectants for miscible floods (g) 15,056 (15,056) –Interest and financing charges (g) 70,464 (70,464) –General and administrative (g) 50,894 50,894Realized foreign exchange loss (gain) (g) 2,061 (2,061) –Unrealized foreign exchange loss (gain) (g) (49,918) 49,918 –Depletion, depreciation and amortization (a) (g) 529,396 15,056 (112,071) 432,381Accretion (g) 22,960 (22,960) –Gain on equity investment (g) (73,756) 73,756 –Other expenses (income) (g) (11,909) 11,909 –
942,703 34,930 (112,071) 865,562
OPERATING INCOME (LOSS) 185,428 (40,098) 112,071 257,401
Other (income) expense itemsGain on equity investment (g) (73,756) (73,756)Gain on disposition of properties (a) (18,425) (18,425)Unrealized foreign exchange (gain) (g) (49,918) (49,918)Realized foreign exchange loss (g) 2,061 2,061Interest and financing charges (g) 70,464 70,464Accretion (g) 22,960 (5,216) 17,744Other (income) expense (g) (11,909) (17) (11,926)
– (40,098) (23,658) (63,756)INCOME BEFORE TAXES 185,428 – 135,729 321,157Future income tax (reduction) expense (44,829) 216,150 171,321NET INCOME AND COMPREHENSIVE INCOME $ 230,257 $ – $ (80,421) $ 149,836Deficit, beginning of year (2,144,521) 75,790 (2,068,731)Distributions declared (232,584) (232,584)Elimination of deficit 2,146,848 4,631 2,151,479DEFICIT, END OF YEAR $ – $ – $ – $ –Net income per share
Basic $ 0.76 $ 0.50Diluted $ 0.76 $ 0.49
78 PENGROWTH 2011 Financial Results
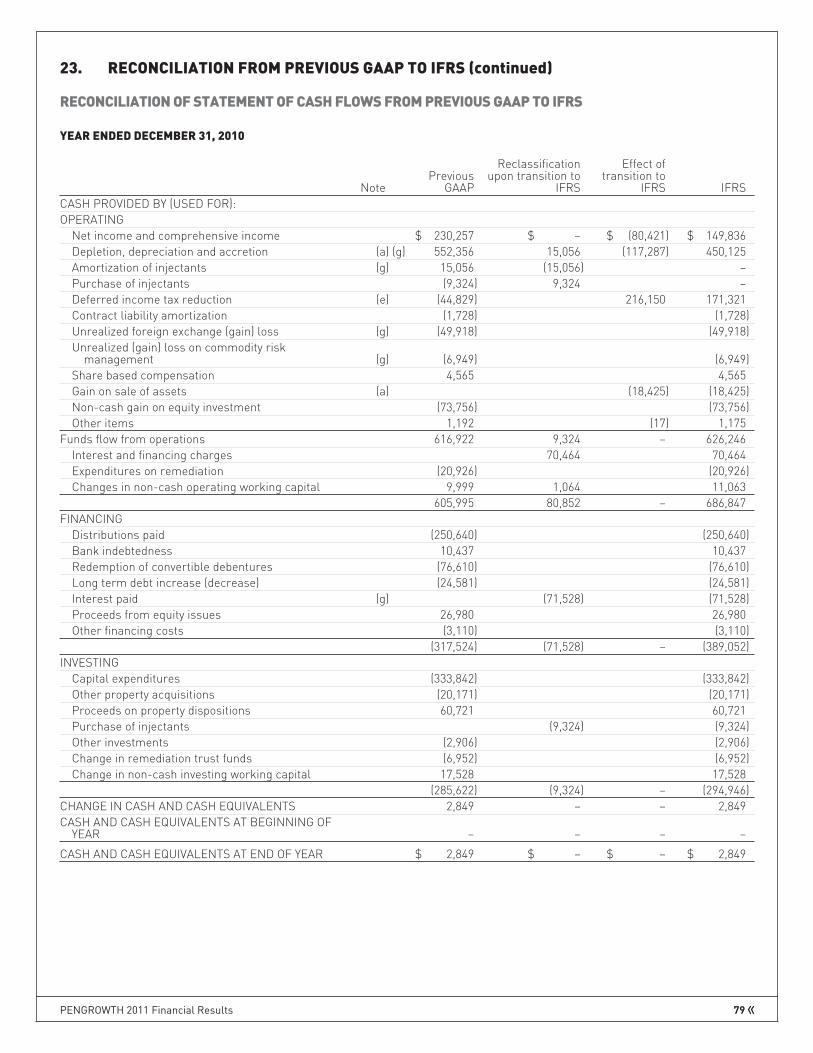
23. RECONCILIATION FROM PREVIOUS GAAP TO IFRS (continued)
RECONCILIATION OF STATEMENT OF CASH FLOWS FROM PREVIOUS GAAP TO IFRS
YEAR ENDED DECEMBER 31, 2010
NotePrevious
GAAP
Reclassificationupon transition to
IFRS
Effect oftransition to
IFRS IFRSCASH PROVIDED BY (USED FOR):OPERATING
Net income and comprehensive income $ 230,257 $ – $ (80,421) $ 149,836Depletion, depreciation and accretion (a) (g) 552,356 15,056 (117,287) 450,125Amortization of injectants (g) 15,056 (15,056) –Purchase of injectants (9,324) 9,324 –Deferred income tax reduction (e) (44,829) 216,150 171,321Contract liability amortization (1,728) (1,728)Unrealized foreign exchange (gain) loss (g) (49,918) (49,918)Unrealized (gain) loss on commodity risk
management (g) (6,949) (6,949)Share based compensation 4,565 4,565Gain on sale of assets (a) (18,425) (18,425)Non-cash gain on equity investment (73,756) (73,756)Other items 1,192 (17) 1,175
Funds flow from operations 616,922 9,324 – 626,246Interest and financing charges 70,464 70,464Expenditures on remediation (20,926) (20,926)Changes in non-cash operating working capital 9,999 1,064 11,063
605,995 80,852 – 686,847FINANCING
Distributions paid (250,640) (250,640)Bank indebtedness 10,437 10,437Redemption of convertible debentures (76,610) (76,610)Long term debt increase (decrease) (24,581) (24,581)Interest paid (g) (71,528) (71,528)Proceeds from equity issues 26,980 26,980Other financing costs (3,110) (3,110)
(317,524) (71,528) – (389,052)INVESTING
Capital expenditures (333,842) (333,842)Other property acquisitions (20,171) (20,171)Proceeds on property dispositions 60,721 60,721Purchase of injectants (9,324) (9,324)Other investments (2,906) (2,906)Change in remediation trust funds (6,952) (6,952)Change in non-cash investing working capital 17,528 17,528
(285,622) (9,324) – (294,946)CHANGE IN CASH AND CASH EQUIVALENTS 2,849 – – 2,849CASH AND CASH EQUIVALENTS AT BEGINNING OF
YEAR – – – –
CASH AND CASH EQUIVALENTS AT END OF YEAR $ 2,849 $ – $ – $ 2,849
PENGROWTH 2011 Financial Results 79

23. RECONCILIATION FROM PREVIOUS GAAP TO IFRS (continued)
Notes to reconciliations
(a) Property, Plant and Equipment and Exploration and Evaluation Assets
IFRS 1 election for full cost oil and gas entities
Pengrowth elected to utilize an IFRS 1 exemption whereby the full cost pool using previous GAAP was measured upon transition toIFRS as follows:
(i) E&E assets were reclassified from the full cost pool to E&E assets at the amount that was recorded under previous GAAP;and
(ii) The remaining full cost pool was allocated to the producing/development assets and components pro rata using total provedplus probable reserve values at January 1, 2010.
This resulted in a $68 million at January 1, 2010 (December 31, 2010—$512 million) increase in E&E assets with a correspondingdecrease in PP&E, with no impact on deferred taxes. The increase in E&E assets during 2010 is due to capitalization of ongoingexploration and evaluation expenditures and the acquisition of significant E&E assets in the Monterey acquisition in the thirdquarter of 2010.
Depletion
Under IFRS, depletion is calculated on a unit of production basis using total proved plus probable reserves as compared to totalproved reserves under previous GAAP. As a result of this change, the depletion expense decreased by approximately $112 millionfor the year ended December 31, 2010.
Gains on disposition
Pengrowth recorded a gain on disposition of approximately $18 million for the year ended December 31, 2010. Of this, disposition ofnon-core properties accounted for approximately $15 million for the year ended December 31, 2010. The remaining gain ondisposition of approximately $3 million for the year ended December 31, 2010 relate to asset swaps.
Gain on Equity Investment
Under the IFRS accounting standards for business combinations adopted on January 1, 2010, Pengrowth was required to fair valueits previously held equity investment in Monterey and, as a result, recorded a gain of $73.8 million arising from the differencebetween the fair value and the book value of the investment prior to the Combination. The fair value of Pengrowth’s previously heldequity investment in Monterey was included in the purchase consideration.
Other
The IFRS opening balance sheet at January 1, 2010 was adjusted to correct for an immaterial amount related to previouslyexpensed general and administrative costs and operating costs that should have been capitalized. This resulted in an increase of$15.4 million to PP&E over the amount recorded under previous GAAP as at January 1, 2010.
80 PENGROWTH 2011 Financial Results

23. RECONCILIATION FROM PREVIOUS GAAP TO IFRS (continued)
The following summarized the change to PP&E and the related effect on the deficit, net of tax, as a result of adopting IFRS:
As atJanuary 1, 2010
As atDecember 31, 2010
Increase to property, plant and equipment due to:
Costs previously expensed $15,412 $ 15,412
Gain on dispositions – 18,425
Depletion – 112,071
Changes in asset retirement obligations – 26,701
15,412 172,609Amounts not affecting deficit
Changes in asset retirement obligations – (26,701)
15,412 145,908
Tax Effect (4,403) (38,313)
Decrease to deficit $11,009 $107,595
Reclassification of E&E assets from PP&E under previous GAAP can be summarized as follows:
As atJanuary 1, 2010
As atDecember 31, 2010
Decrease to Property Plant and Equipment $ (67,597) $ (511,569)
Tax Effect – –
Increase to exploration and evaluation assets $ 67,597 $ 511,569
Net income increased approximately $97 million for the year ended December 31, 2010 as a result of these changes, as follows:
Year endedDecember 31, 2010
Increase to net income due to:
Gain on dispositions $ 18,425
Depletion 112,071
$ 130,496
Tax Effect (33,910)
Increase to net income $ 96,586
(b) Provisions
Under IFRS, contract liabilities and ARO are classified as provisions.
Accounting for contract liabilities remains unchanged under IFRS.
ARO is calculated using a risk free discount rate of four percent and an inflation rate of two percent under IFRS, at January 1, 2010(December 31, 2010 – three and one-half percent discount rate and one and one-half percent inflation rate) as compared to a creditadjusted risk free rate of eight percent and a two percent inflation rate under previous GAAP. The effect of using a risk free discountrate of four percent resulted in an increase of $360 million to the ARO liability which was partially offset by changes to timing andcost estimates of $198 million on transition to IFRS. Due to the use of the aforementioned IFRS 1 election for full cost oil and gasentities, the offset to the increase to the ARO is required to be recognized directly in the opening deficit at the date of transition.
In the third quarter of 2010, the inflation rate used to calculate the ARO was reduced from two percent per annum to one and onehalf percent per annum based on historical price inflation. The inflation rate is based on current expectations and experience. Thechange in estimate was made on a prospective basis and, in conjunction with the June 30, 2010 adjustment to the discount ratefrom four percent to three and one half percent, resulted in a net adjustment to the ARO liability of $21 million as at December 31,2010. Pengrowth has estimated the net present value of its total ARO to be $447 million as at December 31, 2010 (January 1, 2010 –$451 million), based on a total escalated future liability of $1.8 billion (January 1, 2010 – $2.2 billion). These costs are expected to beincurred over 50 years with the majority of the costs incurred between 2041 and 2076.
PENGROWTH 2011 Financial Results 81

23. RECONCILIATION FROM PREVIOUS GAAP TO IFRS (continued)
Use of the risk free discount rate of three and one-half percent and inflation rate of two percent resulted in an increase to the AROassumed upon the acquisition of Monterey of $4 million, which is offset by an increase to goodwill.
The accretion of ARO decreased approximately $5 million for the year ended December 31, 2010 compared to previous GAAP, due tothe use of the different discount rates.
The effect on the Balance Sheet as a result of changes to Provisions upon the implementation of IFRS can be quantified as follows:
As atJanuary 1, 2010
As atDecember 31, 2010
Increase to ARO due to:
Initial change in discount rate $ 359,884 $ 359,884
Initial change in timing and cost assumptions (198,069) (198,069)
ARO additions – 6,025
ARO accretion – (5,216)
ARO revisions – 20,676
ARO assumed in business combinations – 4,230
$ 161,815 $ 187,530
Amounts not affecting deficit
ARO additions $ – $ (6,025)
ARO revisions – (20,676)
ARO assumed in business combinations – (4,230)
161,815 156,599
Tax Effect (63,108) (38,259)
Increase to deficit $ 98,707 $ 118,340
The effect on the Statement of Income as a result of changes to Provisions upon the implementation of IFRS can be quantified asfollows:
Year endedDecember 31, 2010
Increase to net income due to accretion $ 5,216
Tax Effect (1,399)
Increase to net income due to accretion $ 3,817
(c) Goodwill
Under IFRS, the asset retirement obligation assumed upon acquisition of Monterey Exploration in the third quarter of 2010 is valuedusing the above noted IFRS discount and inflation rate. All other assets and liabilities assumed, as well as consideration paid, in thisbusiness combination is unchanged under IFRS as compared to previous GAAP. As a result, the increase in the asset retirementobligation assumed results in a corresponding increase in goodwill of $4 million at December 31, 2010.
(d) Other assets
Pengrowth re-designated the Judy Creek Remediation Trust Fund and the Private Company Investment as fair-value-through-profit-or-loss upon transition to IFRS and recorded these assets at fair value. Changes in the fair value are recognized in income.The effect of the transition to IFRS was a $7 million increase to other assets at January 1, 2010 (December 31, 2010 – $7 million)with a corresponding increase to opening retained earnings upon transition to IFRS.
82 PENGROWTH 2011 Financial Results

23. RECONCILIATION FROM PREVIOUS GAAP TO IFRS (continued)
The effect on Other Assets of the implementation of IFRS can be quantified as follows:
As atJanuary 1, 2010
As atDecember 31, 2010
Increase in other assets due to:
Increase in private company investment $7,000 $7,000
Increase (decrease) in remediation funds (16) 1
$6,984 $7,001
Tax Effect (891) (887)
Decrease to deficit $6,093 $6,114
(e) Deferred income taxes
Under IFRS, deferred income taxes are reported as a non-current liability resulting in a reclassification of the $1 million deferredtax asset to be netted against long term deferred tax liabilities at January 1, 2010 and a reclassification of $1 million of currentdeferred tax liability to long term deferred tax liability as of December 31, 2010.
Under IFRS, taxable temporary differences in the legal entity financial statements of Pengrowth Energy Trust must be measuredusing the top marginal personal tax rate of 39%, as opposed to the effective corporate tax rate used under previous GAAP of 25% atJanuary 1, 2010 and December 31, 2010. As Pengrowth Energy Trust had significant unutilized tax pools prior to conversion to adividend paying corporation, this resulted in the recognition of a deferred tax asset of approximately $164 million at January 1, 2010(December 31, 2010 – $164 million). Approximately $158 million of the deferred tax asset recognized on transition was recorded asa decrease to the opening deficit as of January 1, 2010. Approximately $6 million of the deferred tax asset resulted in an increase totrust unit holders’ capital at January 1, 2010 related to equity issue costs (December 31, 2010 – $6 million). Upon conversion to adividend paying corporation on December 31, 2010, the deferred tax asset was adjusted to the corporate tax rate of approximately25% and eliminated through earnings, resulting in a deferred tax expense at December 31, 2010 of $158 million and a decrease toshareholders’ capital of $6 million.
The effect on the Balance Sheet of changes in deferred income taxes can be quantified as follows:
As atJanuary 1, 2010
As atDecember 31, 2010
Increase in tax liability due to increase in property, plant and equipment $ (4,403) $(38,313)
Decrease in tax liability due to increase in provisions 63,108 38,259
Increase in tax liability due to increase in other assets (891) (887)
Decrease in tax liability due to changes to carrying value of net assets $ 57,814 $ (941)
Decrease in tax liability due to changes in effective tax rate 163,774 –
Decrease (increase) in deferred tax liability $221,588 $ (941)
As atJanuary 1, 2010
As atDecember 31, 2010
Previous GAAP tax liability $(180,671) $(237,753)
Decrease (increase) in deferred tax liability 221,588 (941)
IFRS deferred tax asset (liability) $ 40,917 $(238,694)
PENGROWTH 2011 Financial Results 83

23. RECONCILIATION FROM PREVIOUS GAAP TO IFRS (continued)
The effect on the Statement of Income of changes in deferred income tax expense (reduction) can be quantified as follows:
Year endedDecember 31, 2010
Increase to deferred income tax expense due to:
Increase in tax expense due to increase in property, plant and equipment 33,910
Increase in tax expense due to decrease in ARO accretion expense 1,399
Increase in tax expense due to increase in other assets 4
Increase in tax expense due to change in ARO liability 23,442
Reversal of decrease in tax liability due to changes in effective tax rate 157,395
Increase in tax expense $216,150
(f) Shareholder’s capital
Under IFRS, the tax benefits of trust unit issue costs are measured at the top marginal rate, as per Note 23 (e). This results in anincrease to the Trust Unitholders’ Capital of $6 million on transition to IFRS on January 1, 2010 (December 31, 2010 – $6 million).This amount is reversed upon conversion to a dividend paying corporation on December 31, 2010.
Under IFRS, the redemption of the exchangeable shares issued in the Monterey business combination was measured at the fairvalue of the trust units or common shares on the date of issue. Under previous GAAP, the redemption of the exchangeable shareswas measured at the carrying value of the shares. As a result of this difference, the value of shareholders’ capital increased by $9million at December 31, 2010 (January 1, 2010 – NIL) with a corresponding decrease to contributed surplus.
Under IFRS, changes to the January 1, 2010 opening balance sheet, other than reclassifications, are offset against the openingdeficit. In addition, as a result of the transition to IFRS, net income in 2010 differs from the amounts reported under previous GAAP.
Pursuant to a Plan of Arrangement, shareholders’ capital was reduced by the amount of the consolidated deficit upon conversion toa dividend paying corporation on December 31, 2010. As the deficit was measured differently under IFRS compared to previousGAAP, the amount of the deficit eliminated and the corresponding reduction to shareholders’ capital differed under IFRS.
The effect on the deficit of the implementation of IFRS can be quantified as follows:
As atJanuary 1, 2010
As atDecember 31, 2010
Increase due to provisions $ (98,707) $ (118,340)
Decrease due to change in property, plant and equipment 11,009 107,595
Decrease due to change in other assets 6,093 6,114
Decrease due to change in tax liability for change in tax rate applied to the Trust 157,395 –
Decrease (increase) in deficit $ 75,790 $ (4,631)
Previous GAAP deficit (2,144,521) –
Elimination of deficit – 4,631
IFRS deficit $(2,068,731) $ –
Previous GAAP shareholders‘ capital $ 4,920,945 $3,167,383
Increase to shareholders‘ capital due to change in effective tax rate 6,379 –
Increase to shareholders‘ capital due to redemption of exchangeable shares – 8,967
Elimination of deficit – (4,631)
IFRS shareholders‘ capital $ 4,927,324 $3,171,719
84 PENGROWTH 2011 Financial Results

23. RECONCILIATION FROM PREVIOUS GAAP TO IFRS (continued)
(g) Reclassifications
Under previous GAAP, interest and financing charges, realized foreign exchange loss (gain), unrealized foreign exchange loss (gain),accretion and the gain on equity investment were disclosed as separate line items in the statement of income. Under IFRS, theseamounts were unchanged, but reported below the determination of operating income. Under previous GAAP, amortization ofinjectants for miscible floods were disclosed separately; under IFRS amortization of miscible floods is included with depletion,depreciation and amortization. Under previous GAAP, certain transportation costs were recorded as a reduction of oil and gas sales;under IFRS these costs are unchanged, but reported as transportation costs.
Interest paid is disclosed as a financing item in the statement of cash flows resulting in an increase in cash flow provided byoperating activities and a corresponding increase in cash used for financing activities of $72 million for the year endedDecember 31, 2010.
Purchases of injectants are classified as a use of cash for investing under IFRS as the costs are capitalized to PP&E, resulting in a$9 million increase in the cash provided by operating activities and a corresponding increase in the cash used in investing activitiesfor the year ended December 31, 2010.
The statement of cash flows includes a subtotal for funds flow from operations which is determined as cash flow from operationsafter interest and financing charges but before changes in working capital and expenditures on remediation.
PENGROWTH 2011 Financial Results 85
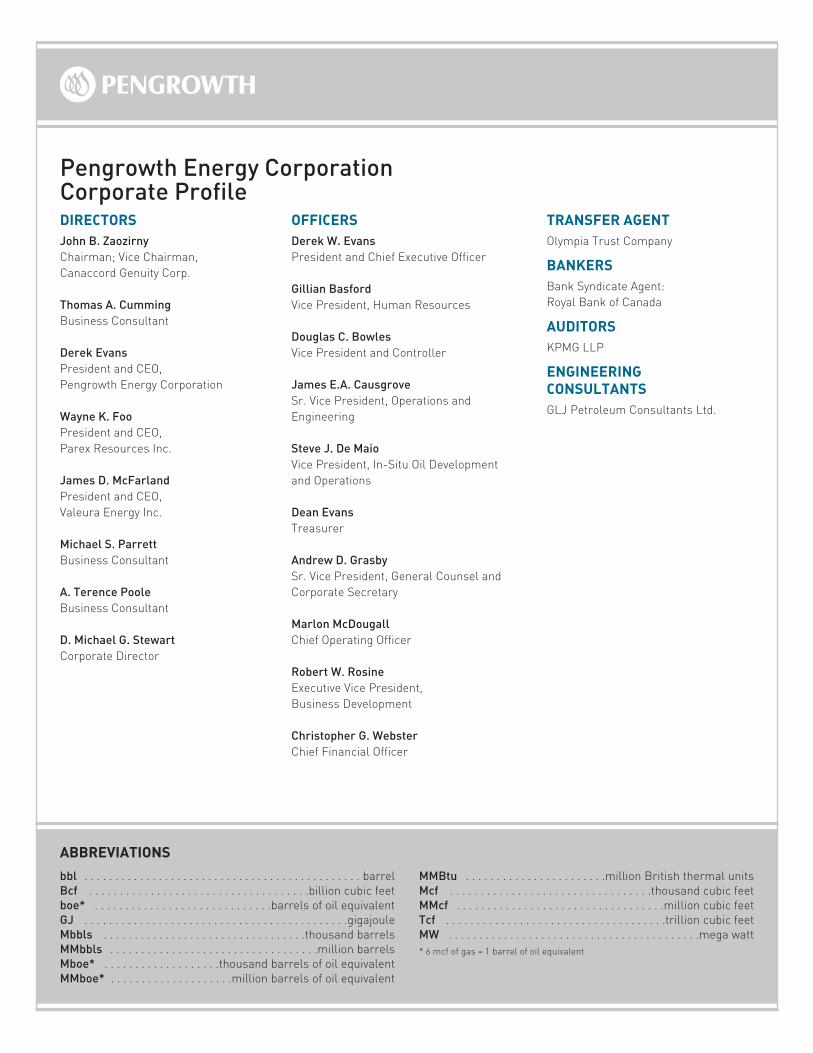
Pengrowth Energy CorporationCorporate ProfileDIRECTORSJohn B. ZaozirnyChairman; Vice Chairman,Canaccord Genuity Corp.
Thomas A. CummingBusiness Consultant
Derek EvansPresident and CEO,Pengrowth Energy Corporation
Wayne K. FooPresident and CEO,Parex Resources Inc.
James D. McFarlandPresident and CEO,Valeura Energy Inc.
Michael S. ParrettBusiness Consultant
A. Terence PooleBusiness Consultant
D. Michael G. StewartCorporate Director
OFFICERSDerek W. EvansPresident and Chief Executive Officer
Gillian BasfordVice President, Human Resources
Douglas C. BowlesVice President and Controller
James E.A. CausgroveSr. Vice President, Operations andEngineering
Steve J. De MaioVice President, In-Situ Oil Developmentand Operations
Dean EvansTreasurer
Andrew D. GrasbySr. Vice President, General Counsel andCorporate Secretary
Marlon McDougallChief Operating Officer
Robert W. RosineExecutive Vice President,Business Development
Christopher G. WebsterChief Financial Officer
TRANSFER AGENTOlympia Trust Company
BANKERSBank Syndicate Agent:Royal Bank of Canada
AUDITORSKPMG LLP
ENGINEERINGCONSULTANTSGLJ Petroleum Consultants Ltd.
ABBREVIATIONSbbl . . . . . . . . . . . . . . . . . . . . . . . . . . . . . . . . . . . . . . . . . . . . . barrelBcf . . . . . . . . . . . . . . . . . . . . . . . . . . . . . . . . . . . .billion cubic feetboe* . . . . . . . . . . . . . . . . . . . . . . . . . . . . .barrels of oil equivalentGJ . . . . . . . . . . . . . . . . . . . . . . . . . . . . . . . . . . . . . . . . . . .gigajouleMbbls . . . . . . . . . . . . . . . . . . . . . . . . . . . . . . . . .thousand barrelsMMbbls . . . . . . . . . . . . . . . . . . . . . . . . . . . . . . . . . .million barrelsMboe* . . . . . . . . . . . . . . . . . . .thousand barrels of oil equivalentMMboe* . . . . . . . . . . . . . . . . . . . .million barrels of oil equivalent
MMBtu . . . . . . . . . . . . . . . . . . . . . . .million British thermal unitsMcf . . . . . . . . . . . . . . . . . . . . . . . . . . . . . . . . .thousand cubic feetMMcf . . . . . . . . . . . . . . . . . . . . . . . . . . . . . . . . . .million cubic feetTcf . . . . . . . . . . . . . . . . . . . . . . . . . . . . . . . . . . . .trillion cubic feetMW . . . . . . . . . . . . . . . . . . . . . . . . . . . . . . . . . . . . . . . . .mega watt* 6 mcf of gas = 1 barrel of oil equivalent
Pengrowth Energy Corporation Head Office: 2100, 222 Third Avenue SW, Calgary, Alberta, Canada T2P 0B4
Phone: 403.233.0224 | Toll free: 800.223.4122Fax: 403.265.6251www.pengrowth.com
For investor relations enquiries, please contact:
Investor RelationsPhone: 403.233.0224 | Toll free: 888.744.1111Email: [email protected]
Stock Exchange Listings Toronto Stock Exchange: PGFNew York Stock Exchange: PGH