Embed Size (px)
Citation preview

2011 Approved operAting Budget
BUDGET APPROVED BY CITY COUNCIL ON DECEMBER 9, 2010
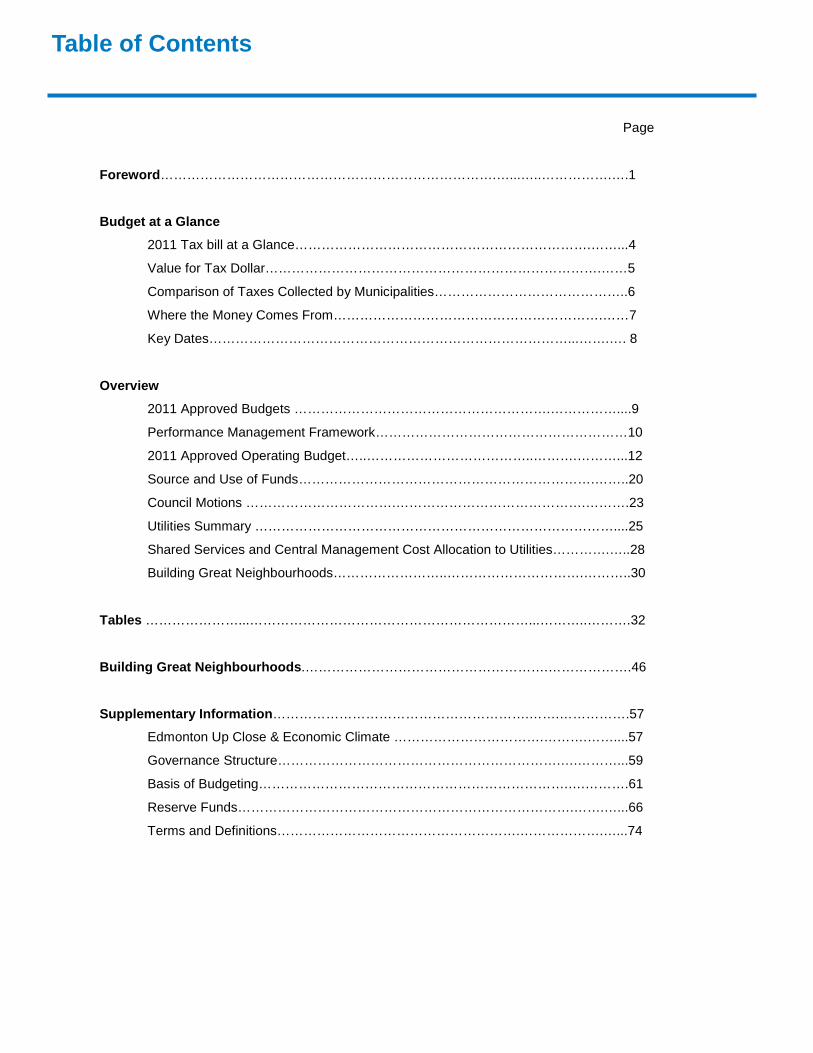
Table of Contents
Page
Foreword………………………………………………………………….…...…..…………….….1
Budget at a Glance
2011 Tax bill at a Glance………………………………………………………….……...4
Value for Tax Dollar………………………………………………………………….……5
Comparison of Taxes Collected by Municipalities……………………………………..6
Where the Money Comes From…………………………………………………….……7
Key Dates………………………………………………………………………...…….…. 8
Overview
2011 Approved Budgets ………………………………………………….……………....9
Performance Management Framework…………………………………………………10
2011 Approved Operating Budget…..………………………………..……….………...12
Source and Use of Funds………………………………………………………….……..20
Council Motions …………………………….…………………………………….……….23
Utilities Summary ………………………………………………………………………....25
Shared Services and Central Management Cost Allocation to Utilities………….…..28
Building Great Neighbourhoods……………………..………………………….………..30
Tables …………………...………………………………………………………...………..……….32
Building Great Neighbourhoods.……………………………………………….……………….46
Supplementary Information………………………………………………….…….…………….57
Edmonton Up Close & Economic Climate …………………………….……….……....57
Governance Structure……………………………………………………….….………...59
Basis of Budgeting…………………………………………………………….….……….61
Reserve Funds………………………………………………………………….…….…...66
Terms and Definitions……………………………………………….……………….…...74 f n………………………………….
Foreword
Unless otherwise stated, all amounts are shown in thousands of dollars.
This volume provide a summary of the 2011 approved operating budget as approved by City Council on December 9, 2010. Detailed program overview sections have not been reproduced in this volume, how-ever, are available upon request. The approved operating budget document is available for download from the City’s website.
Budget at a Glance
The purpose of this section is to provide a quick look at the 2011 approved operating budget and how it impacts a typical homeowner, where the money comes from, how the tax dollars are spent and the value that Edmontonians receive for each tax dollar.
Overview
The Overview discusses the budget process followed for the year, including alignment of department op-erations with Council Goals. The Overview also provides a summary of sources and uses of funds as well as year over year changes in sources and uses of funds, and a list of service packages funded within the approved budget.
Tables
Included in the section are:
• Net operating requirement, expenditures, and revenues for Tax-supported Operations
• Revenues, expenditures, and net income for Municipal Enterprises
• Full-time equivalents
• Highlights of the approved 2011 user fees
• Program revenue changes for Civic Programs, Boards & Commissions
• Amortization and contributed assets
Building Great Neighbourhoods
This section in the budget document discusses the background of the program, 2010 accomplishments and the 2011 approved program.
- 1 -

Foreword
Supplementary Information
Included in this section is additional information about the City of Edmonton:
• Edmonton Up Close and Economic Climate
• Governance and Corporate Structure
• Basis of Budgeting
• Reserve Funds
• Terms and Definitions
Access to Approved 2011 Budget Document
The approved 2011 Budget document is available to the general public, for reference purposes at all branches of the Edmonton Public Library
The approved 2011 Budget document is also available on the City’s Website http://www.edmonton.ca
The approved 2011 Budget document can be obtained in hard copy at: Finance and Treasury, 5th floor, Chancery Hall, 3 Sir Winston Churchill Square NW, Edmonton. A fee equivalent to the cost of producing the document will be charged.
- 2 -

Foreword
BUDGET PRINCIPLES
In developing the 2011 budget, Administration adhered to the following budget principles that City Council ap-proved as part of the 2011 Operating Budget Guideline on June 26, 2010:
a. The program service levels included in the base budget will be reviewed for alignment with Council’s goals and priorities and any possible reallocations of budgets or efficiencies will be identified.
b. Administration will identify service level impacts for any reduction strategies necessary to achieve the prescribed tax levy targets.
c. On-going revenue may fund on-going or one-time expenditures where one-time revenue may only fund one-time expenditures.
d. Service packages that are funded in the approved year must include the full year budget requirements. Funds not required until the following year will be used to fund one-time initiatives.
e. Budgets will reflect department’s operational plans, performance measures and progress toward Council’s strategic goals and priorities.
f. Capital budgets submitted for approval will include details of the obligation on future tax levy to cover the operating costs upon completion of the project.
g. All mid-year operating and capital budget requests require a source of funding and should be considered in light of other corporate priorities.
- 3 -

Bud
get a
t a G
lanc
e
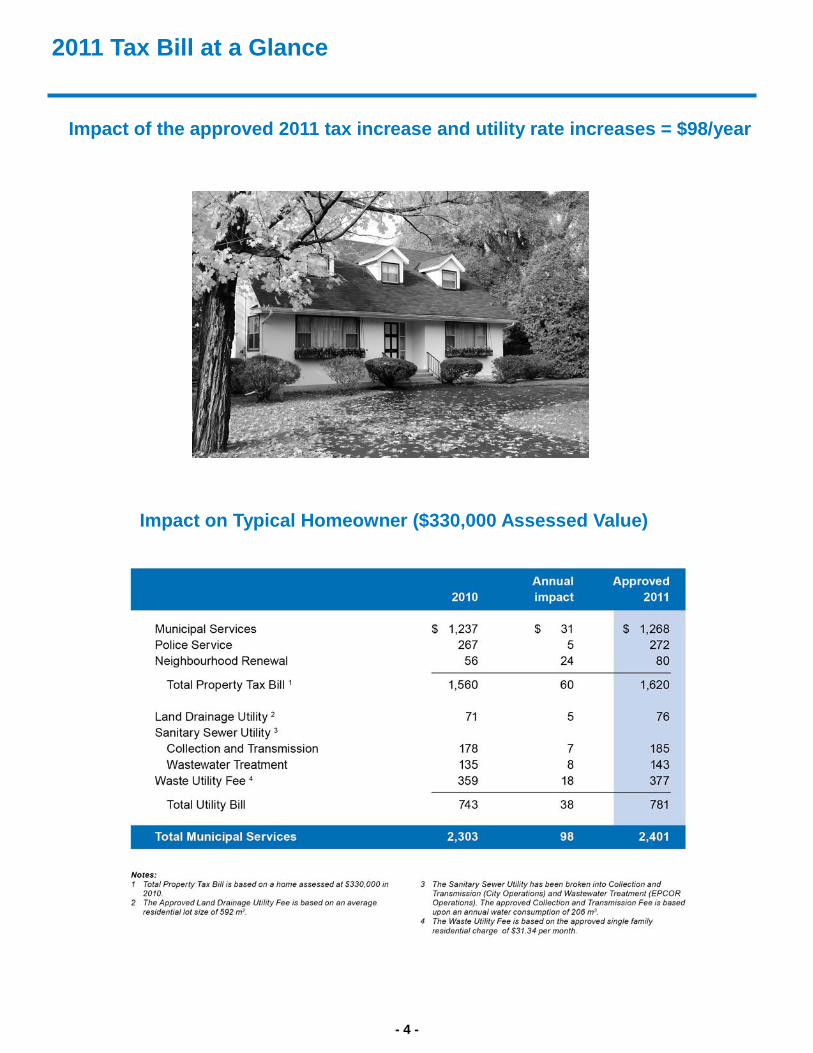
2011 Tax Bill at a Glance
Impact on Typical Homeowner ($330,000 Assessed Value)
Impact of the approved 2011 tax increase and utility rate increases = $98/year
- 4 -
Value for Tax Dollar
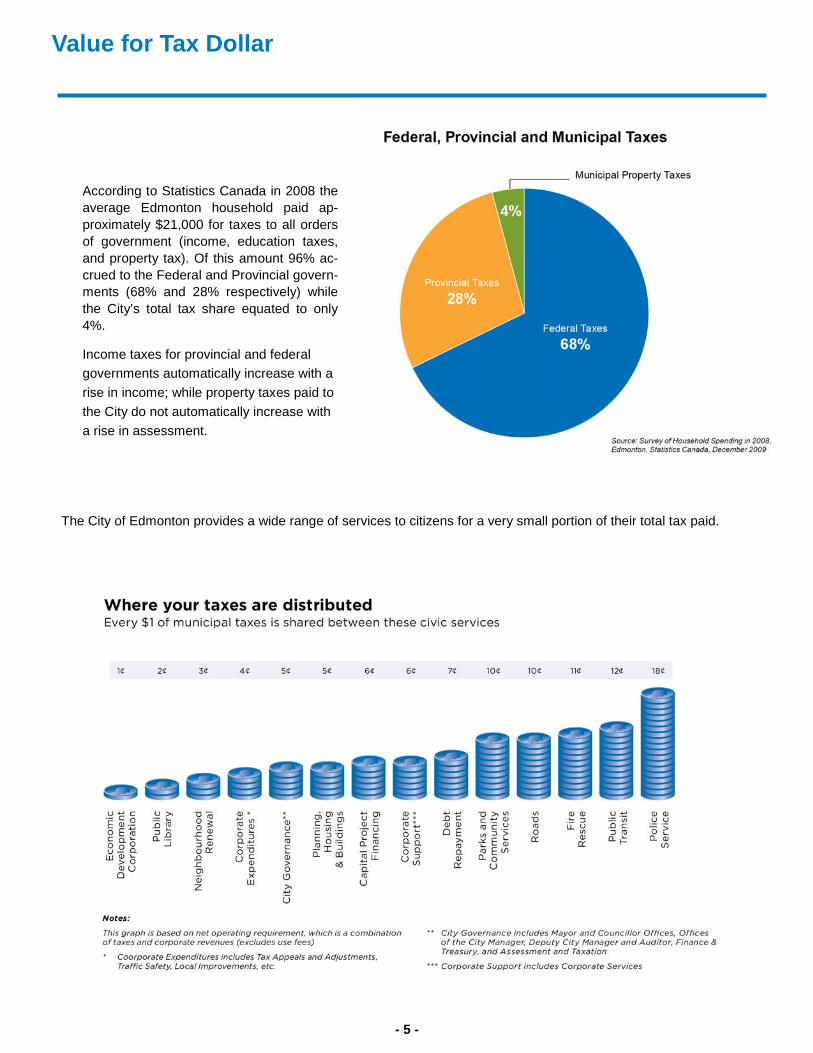
The City of Edmonton provides a wide range of services to citizens for a very small portion of their total tax paid.
According to Statistics Canada in 2008 the average Edmonton household paid ap-proximately $21,000 for taxes to all orders of government (income, education taxes, and property tax). Of this amount 96% ac-crued to the Federal and Provincial govern-ments (68% and 28% respectively) while the City’s total tax share equated to only 4%.
Income taxes for provincial and federal governments automatically increase with a rise in income; while property taxes paid to the City do not automatically increase with a rise in assessment.
- 5 -

Comparison of Taxes Collected by Municipalities
The City of Edmonton Planning and Development department conducted a 2009 Residential Property Taxes and Utility Charges Survey. The survey collected information from Edmonton Capital Region as well as from major cities across Canada.
Edmonton’s municipal taxes per person compares favorably with other jurisdictions. The chart below provides a compari-son of total municipal taxes per person in 2009 among Canadian major cities as well as Edmonton Capital Region.
- 6 -

Where the Money Comes From
The chart below shows the breakdown of the 2011 approved operating budget revenues. The majority of the City’s revenues come from taxation. The total taxation revenues equate to 53% and include nearly 3% to fund the Neighbourhood Renewal program.
Other revenue sources account for 47% of the City’s revenues and come from user fees, investment income , fran-chise fees and dividends.
- 7 -
Key Dates
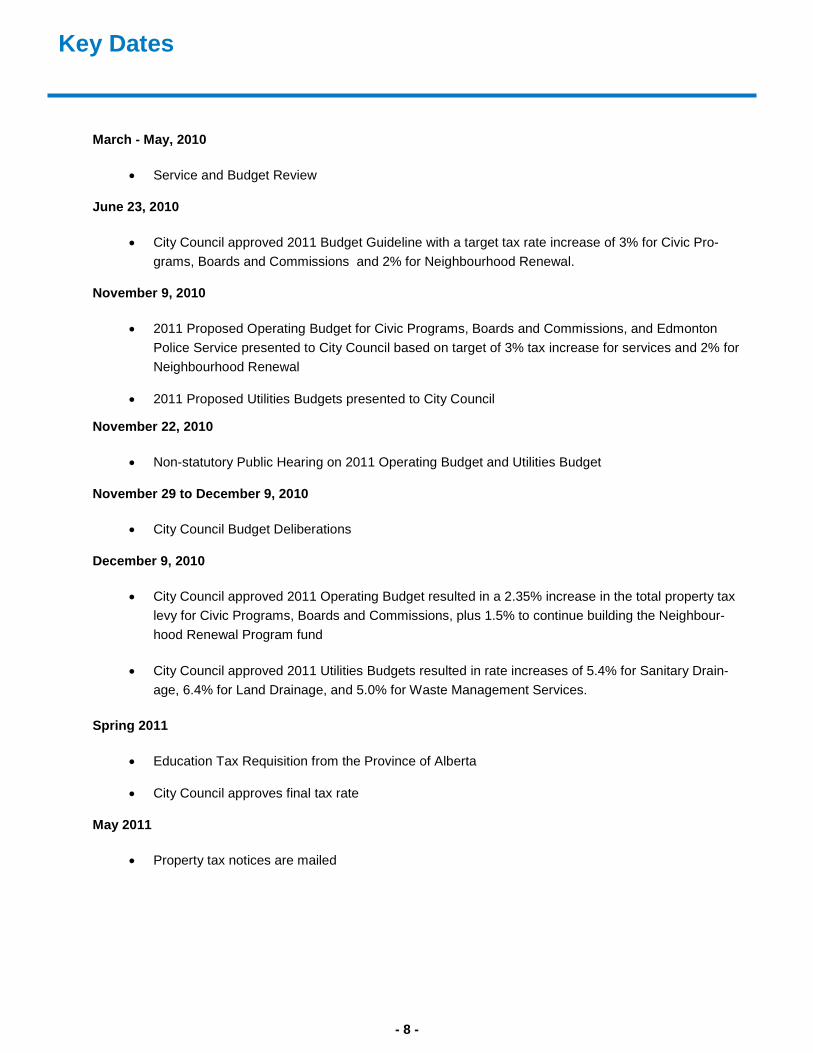
March - May, 2010
• Service and Budget Review
June 23, 2010
• City Council approved 2011 Budget Guideline with a target tax rate increase of 3% for Civic Pro-grams, Boards and Commissions and 2% for Neighbourhood Renewal.
November 9, 2010
• 2011 Proposed Operating Budget for Civic Programs, Boards and Commissions, and Edmonton Police Service presented to City Council based on target of 3% tax increase for services and 2% for Neighbourhood Renewal
• 2011 Proposed Utilities Budgets presented to City Council
November 22, 2010
• Non-statutory Public Hearing on 2011 Operating Budget and Utilities Budget
November 29 to December 9, 2010
• City Council Budget Deliberations
December 9, 2010
• City Council approved 2011 Operating Budget resulted in a 2.35% increase in the total property tax levy for Civic Programs, Boards and Commissions, plus 1.5% to continue building the Neighbour-hood Renewal Program fund
• City Council approved 2011 Utilities Budgets resulted in rate increases of 5.4% for Sanitary Drain-age, 6.4% for Land Drainage, and 5.0% for Waste Management Services.
Spring 2011
• Education Tax Requisition from the Province of Alberta
• City Council approves final tax rate
May 2011
• Property tax notices are mailed
- 8 -

Ove
rvie
w
2011 Approved Budgets
Tax-Supported Operations The budgets of most civic programs, boards and commissions included in this document are primarily sup-ported by tax levy, user fees, return on investment, and grants from other orders of government.
The 2011 Approved Edmonton Police Service budget totals are included in the Tax-supported Operations Summaries found in the Tables tab, as well as any charts and graphs related to City services.
Enterprise Operations
Current Planning, and Land Enterprise are included in this document, but do not require any funding from the tax levy. These are business enterprise operations within the corporation that are self-supporting. Current Planning is funded by service fees charged to developers and business owners. Land Enterprise is funded through the development and sale of land for profit. Fleet Services is funded mainly through internal transfers for services provided to other tax-supported departments in the City
City-Managed Utilities
The 2011 approved budget totals for the City-managed utilities of Sanitary Drainage, Land Drainage and Waste Management are included in the Tables tab. Funded through user fees and requiring separate ap-proval of utility rate bylaws, these budgets were brought forward separately. A brief overview of the City –managed Utilities and summary of the approved rates are included later in this section. The Sanitary and Land Drainage Utilities are part of the Drainage Services Branch. The Drainage Services Branch also includes Drainage Design and Construction which is an enterprise operation that is self-supporting. Drainage Design and Construction is funded through operating as a for-profit construction company with a specialty in under-ground (tunnel) work, and providing services both inside and outside the organization. This budget is included with the utilities.
2011 Capital Budgets
A three year capital budget for 2009-11 was approved by City Council in December 2008. To date, City Coun-cil has approved four adjustments to the 2009-11 Capital Budget as follows:
• May 2009 Supplemental Capital Budget Adjustment 2009FTB005 (approved May 27, 2009),
• October 2009 Supplementary Capital budget Adjustment 2009FTB010 (approved October 14, 2009),
• May 2010 Supplemental Capital Budget Adjustment 2010FTB004 (approved May 26, 2010).
• November 2010 Supplemental Capital Budget Adjustment 2010FTB008 (approved November 9, 2010).
- 9 -

Performance Management Framework
Transformative Planning
Established by City Council in 2008, The Way Ahead—The City’s Strategic Plan—has been used to guide decisions that move us towards the achievement of 10-year goals and the City Vision for Edmonton in 2040.
Never before has the City of Edmonton embarked on such a bold vision for transforming Edmonton into a community that reflects Edmontonian’s long-term priorities, based on concrete, measurable goals.
Long-term goals based on Edmontonian’s priorities
Based on extensive public input, this long-term plan is already focusing the City’s efforts to deliver the greatest value for ser-vices and infrastructure that are most important to Edmonto-nians.
Directional plans that guide the City’s work to achieve each of the goals are: The Way We Green, The Way We Live, The Way We Grow, The Way We Move, The Way We Finance and The Way We Prosper. The Organizational Excellence T.E.A.M. (Transforming Edmonton and Me) is the framework for the op-erational environment - the way City employees work—that will deliver on the promise to citizens: the achievement of the goals and the Vision.
City operations are being aligned to the strategic plan through corporate outcomes set by Council in July 2010. These state-ments describe what the successful accomplishment of the 10-year goals would look like. In identifying the desired results of the City’s actions, these outcomes define the approach to ad-vancing the goals.
Transparent progress measurement
Measuring progress towards the goals is a vital next step in the City’s strategic planning. Performance measures indicate how well the City is progressing towards the outcomes. Council has set measures for five of the six 10-year goals and will finalize the outcomes and measures for the final goal (Diversify Edmonton’s Economy) in early 2011. The type of measures selected to track progress further defines the City’s method for operational focus. Performance measurement, with transparent reporting starting in mid-2011, will be used to adjust planning and budgeting, to en-sure we keep on track towards the Council goals.
Plans drive resource allocation
Work will begin shortly to establish targets for each of the performance measures. The targets will clearly identify how far and how fast the City will proceed to deliver on each of the priorities. This will determine the level of re-sources and strategies needed for advancing towards the goals each year.
Combined, the goals, outcomes, performance measures and targets create a roadmap that will be used to integrate strategic planning with budgeting and support better evaluation and reporting. This roadmap will enhance organiza-tional accountability and transparency and ensure resources are aligned with the goals, aspirations and needs of the community.
- 10 -

Performance Management Framework
- 11 -

2011 Approved Operating Budget
NEW APPROACH
City Council approved the 2011 Operating Budget on December 9, 2010. The 2011 Approved Operating Budget results in a 2.35% tax increase for Civic Programs, Boards and Commissions, plus 1.5% tax rate in-crease to continue to build Neighbourhood Renewal Program fund.
City Council has made its vision for the future clear through setting the 10-year strategic goals in The Way Ahead. Administration has been working diligently to create the City that Council envisions.
City Council’s 10-year strategic goals combined with delivering core services have guided development of the 2011 budget. The 2011 Proposed Operating Budget achieved the guideline approved by City Council on June 23, 2010. The guideline directed Administration to prepare the draft 2011 Proposed Operating Budget on the basis of a 3% tax increase for Civic Programs, Boards and Commissions, in addition to the 2% tax rate increase already earmarked for Neighbourhood Renewal.
Administration took a new approach to achieving the 3% tax increase target. It started with the Corporate Leadership Team (CLT) setting corporate and department revenue and cost reduction targets for civic and corporate programs. The target setting exercise also included an allowance to provide a source of funding for Advancing the Ways packages.
A multi-disciplinary team was appointed by CLT to lead a service and budget review process. The team was charged with identifying, analyzing and prioritizing corporate and department strategies that would meet the increased revenue and cost reduction targets for 2011 and help balance the budgets in 2012 and 2013. The team reviewed and recommended corporate-wide strategies and changes that all departments could make to the way they do business while minimizing the impact on services. The service and budget review strategies approved in the 2011 approved budget result in a reduction in the Net Operating Requirement of $50.6 million as shown in the table below:
2011 Service and Budget Review Summary
($millions) Rev Exp Net FTEs
Corporate Strategies - Gas and EPCOR Franchise Fees 10.0$ -$ (10.0)$ - Photo enforcement 2.1 - (2.1) - Parking Fine Revenue 0.5 - (0.5) - Current Planning 3.0 3.0 - 15.0 Other Corporate Opportunities - (3.8) (3.8) -
15.6 (0.8) (16.4) 15.0
Department StrategiesService and Revenue Adjustments 7.5 (7.3) (14.8) (18.4) Operating/Capital Transfers 3.1 (3.4) (6.5) (2.8) Organizational & operational changes - (10.6) (10.6) (26.2)
10.6 (21.3) (31.9) (47.4)
Police 0.9 (1.4) (2.3) -
Total Service and Budget Review 27.1$ (23.5)$ (50.6)$ (32.4)
- 12 -

Corporate Strategies • 2011 corporate strategies include a proposed increase in Gas and EPCOR Franchise Fees of $10.0 million.
This strategy is consistent with balancing the City’s sources of revenue to reduce the pressure on tax levy increases. City Council approved a report on November 9, 2010 in order to meet the notification require-ments of ATCO and EPCOR.
• The 2011 increase in photo enforcement revenue has been allocated to Edmonton Police Service to cover increased Traffic Safety costs.
• Current Planning is phasing-in a new business model with the goal of fully recovering costs from revenues. In 2011 the expenditures include $1.5 million for additional current planning staff to meet workload demands and a $1.5 million increase in shared service costs that reduces the support required from tax levy by $1.5 million.
• Other corporate opportunities include corporate-wide reductions to reflect efficiencies from strategic sourcing and contract initiatives as well as rationalization of computer, telecommunication equipment, contracting, advertising and personnel discounts.
Department Strategies 2011 department strategies are classified into the following three categories:
• Service and revenue adjustments of $14.8 million
Strategies in this category relate to changes in current revenue and service levels or standards, substitution or deferral of services. Revenue strategies in this category result in an increase of $7.5 million in Transit fares and advertising revenue, parking meter revenue, Fire Inspection fees, Community Facility Service fees and Parks Planning Inspection fees.
Expenditure reduction strategies of $7.3 million are mainly due to elimination of vacant posi-tions, reduction in consultants and a reduction in the Transit fuel budget due to stabilized fuel prices.
• Operating/capital transfers of $6.5 million
This category relates to realignment of funding and/or costs between the operating and capital programs. The total amount in this category represents the transfers that will occur in 2011 re-sulting from work done to identify operating costs that relate to capital projects or are eligible for grants.
• Organizational and operational changes of $10.6 million
Strategies identified in this category are associated with changes to internal business conditions and internal operational efficiencies. Expenditure reduction strategies in this category cover a range of department specific adjustments that include elimination of vacant positions and ration-alization of budgets by line item.
Edmonton Police Service also contributed a reduction to the Net Operating Requirement of $2.3 million.
The revenue and expenditure changes related to the service and budget review are shown separately in the fi-nancial summaries in the program overviews that are available upon request.
2011 Approved Operating Budget
- 13 -

2011 Approved Operating Budget
The table below summarizes the major drivers that contribute to the increased costs of operating the City as well as the strategies to balance the 2011 approved budget.
Program and Services Costs:
Program and Service Cost increases are mainly due to annualization of Special Forces Pension Plan (SFPP), annualization of 2010 service additions for transit and fire rescue services, increases in employer contributions to Local Authorities Pension Plan, higher power costs for streetlights, transfer of costs for the capital city clean up program from Waste Management and non-personnel inflation.
Debt Charges:
The increase in debt charges relates to the following approved projects: Terwillegar Community Recreation Cen-ter, North Light Rail Transit (downtown to NAIT), Multi–purpose Recreation Centers, Clareview Branch Library, Great Neighbourhoods Initiative, Valley Zoo Master Plan Implementation, Jasper Place Branch Library Renewal & Expansion, Heritage Valley Park and Ride, Replace LRT Signal System, and Eaux Claires & Lewis Estates Phase II Transit Centers.
Impact of Capital Projects:
The 2011 Approved Budget includes funding for the operating costs of capital projects and contributed assets for the building and facility maintenance, Ellerslie and Heritage Valley Fire stations, roadway maintenance and traffic inventory growth, Eaux Claires Transit Center, park projects, Commonwealth Stadium, Queen Elizabeth Outdoor
2011 Approved Net Operating Requirement Tax Rate Increase, %
Program and Services Costs 54.7$ 6.08%
Debt Charges 14.0 1.55%
Impact of Capital Projects 7.7 0.86%
Other Funded Packages 19.5 2.17%
User Fees and Other Revenue Changes (9.2) -1.02%
Growth in Assessment Revenue (15.0) -1.67%
71.7 7.97%Service and Budget Review
Departments & Corporate Opportunities (48.3) Police (2.3) (50.6) -5.62%
21.1 2.35%
Neighbourhood Renewal Program 13.5 1.50%
Total Net Operating Requirement Increase 34.6$ 3.85%
$millions
- 14 -

2011 Approved Operating Budget
Pool, John Janzen Nature Center renovation and other projects. The listing of the operating impacts of capital projects is included later in this section.
Other funded packages:
The service and budget review strategies for 2011 provided a source of funding for new service packages that advance the Ways. During the budget deliberations City Council approved a number of additional service pack-ages. The detailed list of all service packages approved in the 2011 budget is included later in this section.
User Fee Increase and Other Revenue Changes:
User fees and other revenue changes includes revenue changes over and above the service and budget review revenue changes.
Overall revenue from User fees results from a volume increase of 5.5% and a rate increase of 2.8%. The detailed revenue analysis for tax-supported revenue changes is presented in a separate section called “Tables” . The de-tailed analysis also includes the revenue opportunities that were identified during the Service and Budget Review.
Growth in Assessment Revenue:
Growth in assessment revenue is due to new construction and development. It is based on a medium scenario using August 2010 information. The strong numbers of residential starts in the last part of 2009 and the first half of 2010 was a positive sign for real assessment growth. However, expectations should be tempered as the second half of 2010 has shown lower than average residential starts as well as low non-residential permit numbers for all of 2010.
- 15 -

2011 Approved Operating Budget
FUNDED SERVICE PACKAGES
The 2011 Approved Budget includes funding for operating costs of capital projects, contributed assets and other service packages. These packages are listed in the table below:
- 16 -

2011 Approved Operating Budget
- 17 -
2011 Approved Operating Budget
Debt-Financing
The City uses debt financing as a source of funding for investments in capital projects. The Municipal Gov-ernment Act (The Act) provides restrictions on the debt and debt servicing costs that municipalities in Al-berta can take on. The City manages its debt further under principles and more conservative limits as out-lined in City Policy C203C—Debt Management Fiscal Policy (DMFP).
The Policy Statement:
The debt limits set by both The Act and the DMFP are based on a percentage of the City’s total budgeted revenues. As revenues increase, so does the level of borrowing the City can undertake. Also, the avail-able limit increases as debt is repaid.
The City segregates debt between self-liquidating and tax-supported.
Self-liquidating debt servicing costs, interest only, are included in the 2011 Approved Utilities Budgets which are prepared on an accrual basis.
Tax-supported debt servicing costs, including both principal and interest are included in the 2011 Approved Operating Budget which is prepared on a cash basis. The debt servicing budget is included as part of Capital Project Financing Program and can be found in the Corporate Revenue and Expenditures tab.
Debt charges related to the South Light Rail Transit (SLRT) are shown separately, as these are financed primarily by the federal fuel tax transfer as well as a small amount of tax revenues directed to Light Rail Transit.
1. Debt is an ongoing component of the City’s capital financing structure and is integrated into the City’s long-term plans and strategies.
2. Debt must be Affordable and Sustainable. The City must maintain flexibility to issue Debt in response to emerging financing needs.
3. Debt must be structured in a way that is fair and equitable to those who pay and benefit from the underlying assets over time.
4. Debt decisions must contribute to a sustainable and vibrant City by balancing quality of life and financial considerations.
5. The issuance of new Debt must be approved by City Council.
6. Debt must be managed, monitored and reported upon.
- 18 -
2011 Approved Operating Budget
Debt-Financing
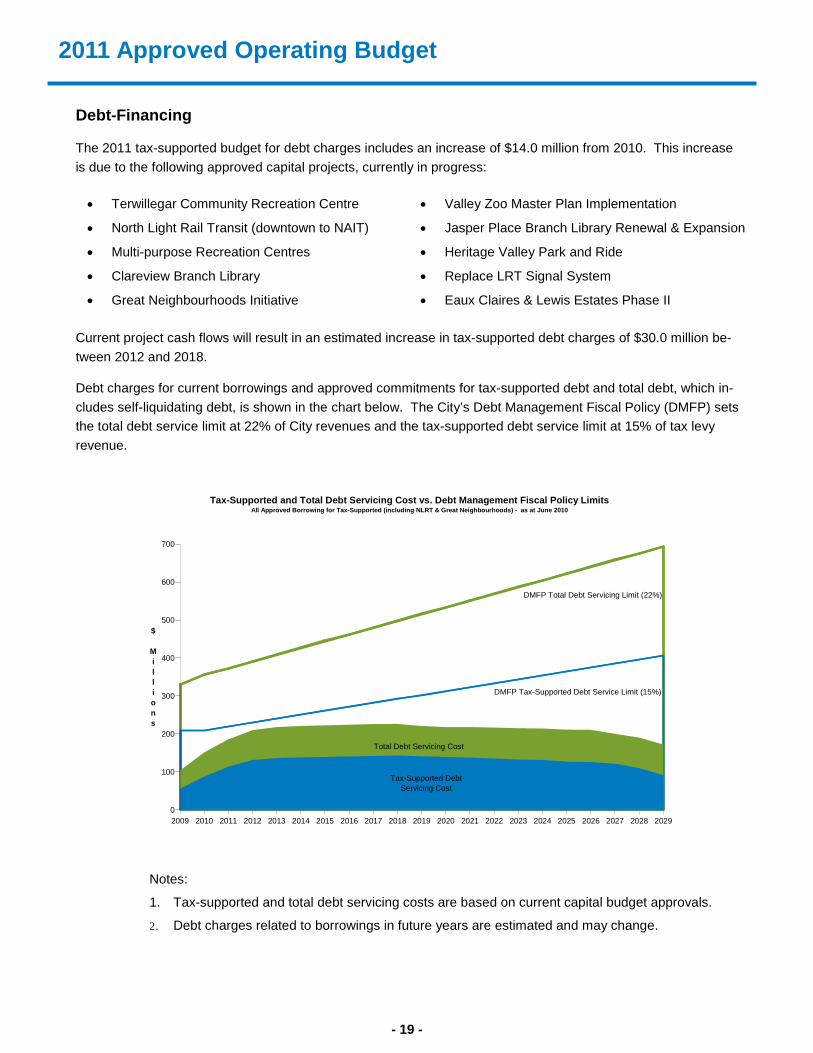
The 2011 tax-supported budget for debt charges includes an increase of $14.0 million from 2010. This increase is due to the following approved capital projects, currently in progress:
Current project cash flows will result in an estimated increase in tax-supported debt charges of $30.0 million be-tween 2012 and 2018.
Debt charges for current borrowings and approved commitments for tax-supported debt and total debt, which in-cludes self-liquidating debt, is shown in the chart below. The City’s Debt Management Fiscal Policy (DMFP) sets the total debt service limit at 22% of City revenues and the tax-supported debt service limit at 15% of tax levy revenue.
• Terwillegar Community Recreation Centre
• North Light Rail Transit (downtown to NAIT)
• Multi-purpose Recreation Centres
• Clareview Branch Library
• Great Neighbourhoods Initiative
• Valley Zoo Master Plan Implementation
• Jasper Place Branch Library Renewal & Expansion
• Heritage Valley Park and Ride
• Replace LRT Signal System
• Eaux Claires & Lewis Estates Phase II
2009 2010 2011 2012 2013 2014 2015 2016 2017 2018 2019 2020 2021 2022 2023 2024 2025 2026 2027 2028 2029
Total Debt Servicing Cost
Tax-Supported Debt Servicing Cost
0
100
200
300
400
500
600
700
$
Millions
Tax-Supported and Total Debt Servicing Cost vs. Debt Management Fiscal Policy LimitsAll Approved Borrowing for Tax-Supported (including NLRT & Great Neighbourhoods) - as at June 2010
DMFP Total Debt Servicing Limit (22%)
DMFP Tax-Supported Debt Service Limit (15%)
Notes:
1. Tax-supported and total debt servicing costs are based on current capital budget approvals.
2. Debt charges related to borrowings in future years are estimated and may change.
- 19 -

Source and Use of Funds
The table below provides the year over year changes in source and use of funds.
2010 Budget2011
Approved Budget
$ Change
Source of Funds
Property Taxes 829.8$ 907.1$ 77.3$
Business Taxes 32.7 - (32.7)
Payment-in-lieu 23.4 28.5 5.1 885.9 935.6 49.7
User Fees, Fines & Permits 318.6 345.0 26.4
EPCOR Dividends 135.8 138.5 2.7
Grants 123.8 116.7 (7.1)
Franchise Fees 100.5 113.1 12.6
Investment Earnings & Dividends for Capital Financing 65.8 68.2 2.4
Transfers from Reserves 29.9 16.8 (13.1)
Utility & Land Dividends 6.6 4.5 (2.1)
Other Revenues 56.2 31.1 (25.1)
Total Source of Funds 1,723.1$ 1,769.5$ 46.4$
Use of Funds
Civic Programs 1,061.1$ 1,074.7$ 13.6$
Police Service 293.5 303.4 9.9
Corporate Programs 209.7 244.1 34.4
Boards & Commissions 96.4 101.6 5.2
Neighbourhood Renewal 32.2 45.7 13.5
One-time Items 30.2 - (30.2)
Total Use of Funds 1,723.1$ 1,769.5$ 46.4$
2011 Approved Source and Use of Funds($millions)
- 20 -
Source and Use of Funds
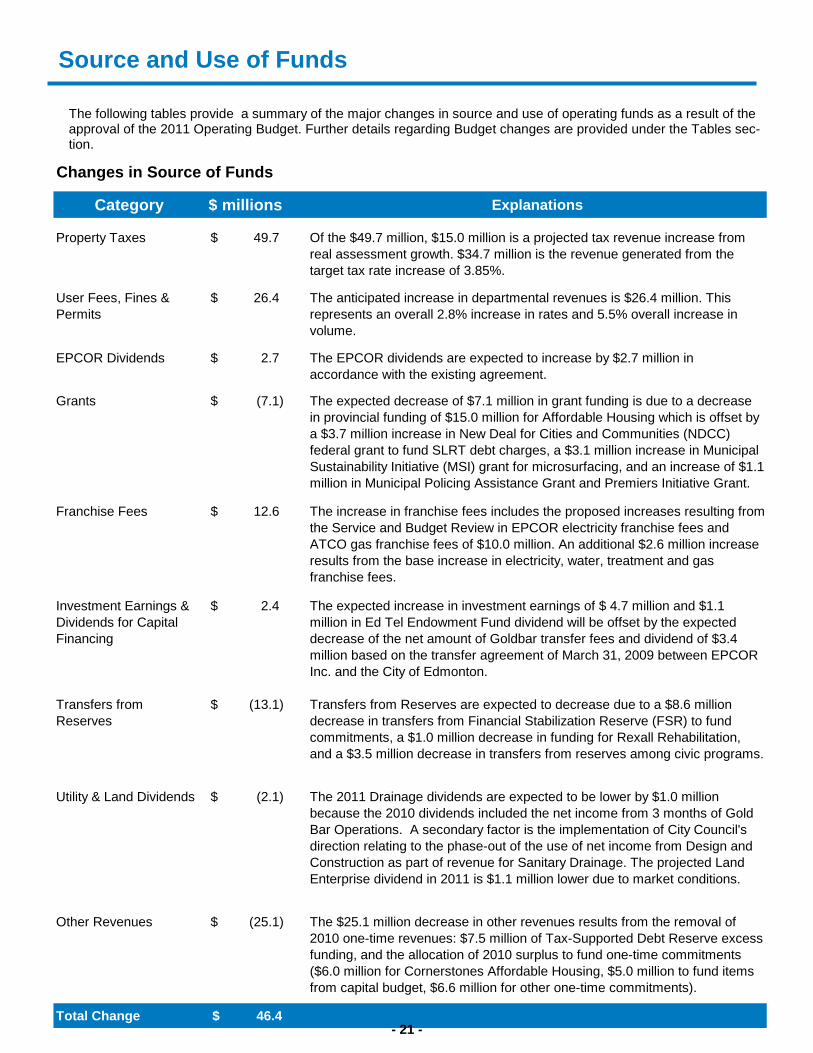
The following tables provide a summary of the major changes in source and use of operating funds as a result of the approval of the 2011 Operating Budget. Further details regarding Budget changes are provided under the Tables sec-tion.
Changes in Source of Funds
Category $ millions Explanations
Property Taxes 49.7$ Of the $49.7 million, $15.0 million is a projected tax revenue increase from real assessment growth. $34.7 million is the revenue generated from the target tax rate increase of 3.85%.
User Fees, Fines & Permits
26.4$ The anticipated increase in departmental revenues is $26.4 million. This represents an overall 2.8% increase in rates and 5.5% overall increase in volume.
EPCOR Dividends 2.7$ The EPCOR dividends are expected to increase by $2.7 million in accordance with the existing agreement.
Grants (7.1)$ The expected decrease of $7.1 million in grant funding is due to a decrease in provincial funding of $15.0 million for Affordable Housing which is offset by a $3.7 million increase in New Deal for Cities and Communities (NDCC) federal grant to fund SLRT debt charges, a $3.1 million increase in Municipal Sustainability Initiative (MSI) grant for microsurfacing, and an increase of $1.1 million in Municipal Policing Assistance Grant and Premiers Initiative Grant.
Franchise Fees 12.6$ The increase in franchise fees includes the proposed increases resulting from the Service and Budget Review in EPCOR electricity franchise fees and ATCO gas franchise fees of $10.0 million. An additional $2.6 million increase results from the base increase in electricity, water, treatment and gas franchise fees.
Investment Earnings & Dividends for Capital Financing
2.4$ The expected increase in investment earnings of $ 4.7 million and $1.1 million in Ed Tel Endowment Fund dividend will be offset by the expected decrease of the net amount of Goldbar transfer fees and dividend of $3.4 million based on the transfer agreement of March 31, 2009 between EPCOR Inc. and the City of Edmonton.
Transfers from Reserves
(13.1)$ Transfers from Reserves are expected to decrease due to a $8.6 million decrease in transfers from Financial Stabilization Reserve (FSR) to fund commitments, a $1.0 million decrease in funding for Rexall Rehabilitation, and a $3.5 million decrease in transfers from reserves among civic programs.
Utility & Land Dividends (2.1)$ The 2011 Drainage dividends are expected to be lower by $1.0 million because the 2010 dividends included the net income from 3 months of Gold Bar Operations. A secondary factor is the implementation of City Council's direction relating to the phase-out of the use of net income from Design and Construction as part of revenue for Sanitary Drainage. The projected Land Enterprise dividend in 2011 is $1.1 million lower due to market conditions.
Other Revenues (25.1)$ The $25.1 million decrease in other revenues results from the removal of 2010 one-time revenues: $7.5 million of Tax-Supported Debt Reserve excess funding, and the allocation of 2010 surplus to fund one-time commitments ($6.0 million for Cornerstones Affordable Housing, $5.0 million to fund items from capital budget, $6.6 million for other one-time commitments).
Total Change $ 46.4 - 21 -

Source and Use of Funds
Changes in Use of Funds
Category $ millions Explanations
Civic Programs $ 13.6 Civic Programs increase in use of funds is due to:- Program Cost increases of $34.0 million;- Impact of Capital Projects of $7.3 million;- Other funded service packages of $14.6million- Offset mainly by $22.1 million reduction in expenditures due to Service and Budget Review and $20.2 reduction in Cornerstones Project Expenditures.
Police Service $ 9.9 The increase of $9.9 million is mainly due to an increase in annualization of the Special Forces Pension Plan, 2010 collective agreements and 2010 approved positions.
Corporate Programs $ 34.4 The Corporate Programs increase is mainly due to the additional debt charges and various other corporate expenditures.
Boards & Commissions $ 5.2 The increase of $5.2 million is due to a $2.1 million increase in Federation of Community Leagues, a $2.0 million increase in Arts Council, a $1.3 million increase in Public Library, a $0.6 million increase in Homeless Commission, as well as $0.6 million increase among other boards and commissions offset by a $1.4 million reduction undertaken by Edmonton Economic Development Corporation.
Neighbourhood Renewal $ 13.5 The increase of $13.5 million is equivalent to a 1.5% increase in tax rate for the Neighbourhood Renewal program.
One-time Items $ (30.2) The $30.2 million decrease results from the removal of 2010 one-time items ($6.0 million for Cornerstones Affordable Housing, $4.0 million for Trolley Decommissioning, $3.5 million for 2010 Municipal Election and $16.7 million in other one-time commitments).
Total Change $ 46.4
- 22 -
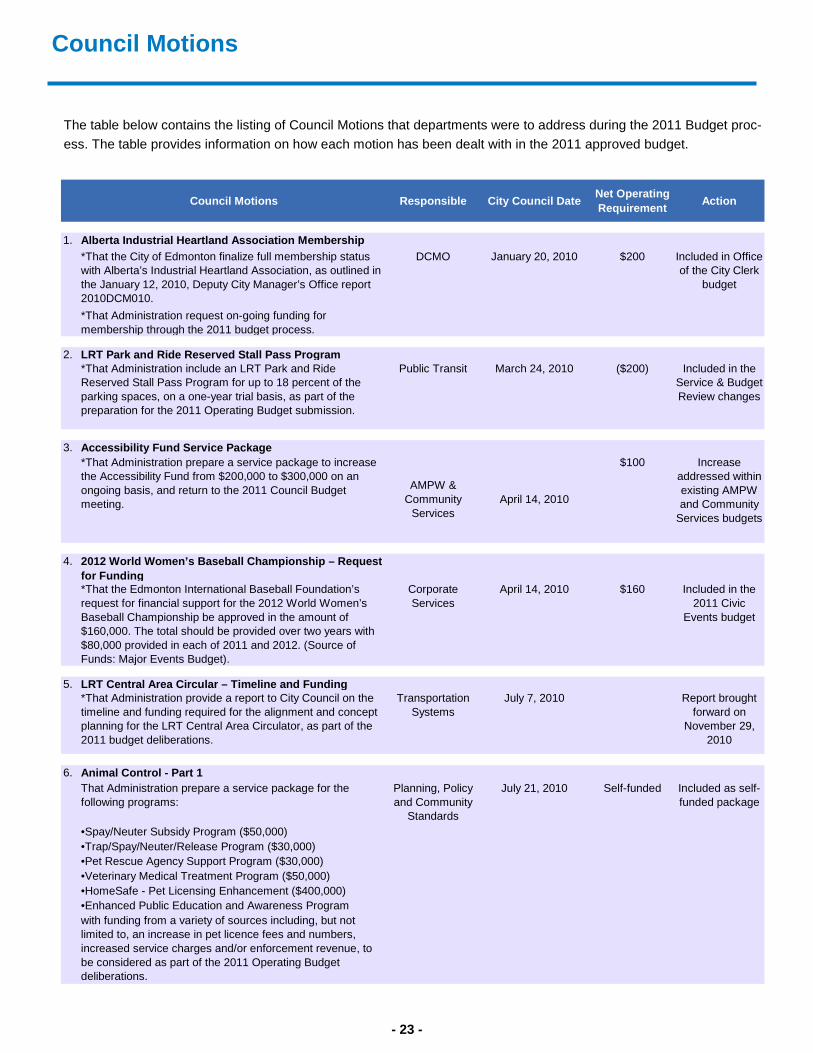
Council Motions
The table below contains the listing of Council Motions that departments were to address during the 2011 Budget proc-ess. The table provides information on how each motion has been dealt with in the 2011 approved budget.
Council Motions Responsible City Council Date Net Operating Requirement Action
1. Alberta Industrial Heartland Association Membership *That the City of Edmonton finalize full membership status
with Alberta’s Industrial Heartland Association, as outlined in the January 12, 2010, Deputy City Manager’s Office report 2010DCM010.
DCMO January 20, 2010 $200 Included in Office of the City Clerk
budget
*That Administration request on-going funding for membership through the 2011 budget process.
2. LRT Park and Ride Reserved Stall Pass Program *That Administration include an LRT Park and Ride
Reserved Stall Pass Program for up to 18 percent of the parking spaces, on a one-year trial basis, as part of the preparation for the 2011 Operating Budget submission.
Public Transit March 24, 2010 ($200) Included in the Service & Budget Review changes
3. Accessibility Fund Service Package *That Administration prepare a service package to increase
the Accessibility Fund from $200,000 to $300,000 on an ongoing basis, and return to the 2011 Council Budget meeting.
AMPW & Community
ServicesApril 14, 2010
$100 Increase addressed within existing AMPW and Community
Services budgets
4. 2012 World Women’s Baseball Championship – Request for Funding
*That the Edmonton International Baseball Foundation’s request for financial support for the 2012 World Women’s Baseball Championship be approved in the amount of $160,000. The total should be provided over two years with $80,000 provided in each of 2011 and 2012. (Source of Funds: Major Events Budget).
Corporate Services
April 14, 2010 $160 Included in the 2011 Civic
Events budget
5. LRT Central Area Circular – Timeline and Funding*That Administration provide a report to City Council on the timeline and funding required for the alignment and concept planning for the LRT Central Area Circulator, as part of the 2011 budget deliberations.
Transportation Systems
July 7, 2010 Report brought forward on
November 29, 2010
6. Animal Control - Part 1That Administration prepare a service package for the following programs:
Planning, Policy and Community
Standards
July 21, 2010 Self-funded Included as self-funded package
•Spay/Neuter Subsidy Program ($50,000) •Trap/Spay/Neuter/Release Program ($30,000)•Pet Rescue Agency Support Program ($30,000)•Veterinary Medical Treatment Program ($50,000)•HomeSafe - Pet Licensing Enhancement ($400,000)•Enhanced Public Education and Awareness Program
with funding from a variety of sources including, but not limited to, an increase in pet licence fees and numbers, increased service charges and/or enforcement revenue, to be considered as part of the 2011 Operating Budget deliberations.
- 23 -

Council Motions
Council Motions Responsible City Council Date Net Operating Requirement Action
7. Edmonton Federation of Community Leagues – Tripartite Agreement
That Administration, in collaboration with Edmonton Federation of Community Leagues, prepare a service package for a proposed Capital Grant Program increase of $2,905,000 and with an increase of $1,336,000 in the Operating Grant Program, split over two years, as outlined in Attachment 1 of the July 5, 2010, Community Services Department report 2010CSW005, using funding from a reallocation of funds within the existing budget, to be included in the 2011 Operating Budget deliberations.
Edmonton Federation of Community
Leagues
July 21, 2010 $2,121 Funded service packages
8. Bylaw 13567 – Amendments to Emergency Response Fees and Charges
*That Administration prepare amendments to Emergency Response Fees and Charges Bylaw 13567, to reflect the revised proposed fee structure, as outlined in Attachment 1 of the August 3, 2010, Community Services Department report 2010CSF005rev.
Community Services, Fire
Services
August 30, 2010 ($500) Included in the Service & Budget Review changes
Special Event Inspections – Additional Information*That Administration provide additional information at budget time about the Special Event Inspections, including divisions between non-profit and for-profit organizations, when the amendments to Bylaw 13567 are before Council.
Proposed Fee Structure for Federal and Provincial Government Bodies
*That Administration provide a report on the feasibility of a proposed fee structure for fire inspections, for federal and provincial government bodies.
9. Update on Scona Pool
That Administration develop a service package to fund Scona Pool operations for 2011, in the amount of $300,000 on a one-time basis, for consideration during the 2011 Operating Budget deliberations.
Community Facility Services
Funded service packageSeptember 15, 2010 $300
- 24 -
Utilities Summary Works
Overview of the City Managed Utilities
The City of Edmonton owns and operates three utilities: Sanitary Drainage, Land Drainage, and Waste Management.
Operating under a utility cost model, the revenues generated from each of the utilities cover the daily operating costs as well as the long term capital requirements. Under a purely public utility model, the goal is to provide the best possible service at the lowest cost to the customers and return on investment generated from the operation is not a primary consideration. Under a private utility model, utility rates for the services provided are based upon a reasonable, sustainable rate of return on capital investment, governed under regulations of the Alberta Utilities Commission. The City of Edmonton Utilities generally operate under a public utility model.
The Sanitary Utility is the most mature of the three utilities, having operated as a full utility since 1956. Land Drainage became a utility in January 2003, and Waste Management became a full utility in January 2009.
Governance and Regulation
Currently, City Council acts as both the governor and regulator, approving both operating and capital budgets and utility customer rates. A recently adopted practice has meant that utility budgets and rates are set by Council in advance of their tax levy budget decision. However, due to the 2010 election, the 2011 budget and rate deliberation occurred in November and December, during the same timeframe as the tax levy discussion.
As noted in a City of Edmonton internal legal memo dated December 7, 2009, the Municipal Government Act (MGA) provides Council with the authority to pass bylaws and otherwise regulate municipal public utilities. The MGA does not provide for any specific guidance for Council regarding municipal utility governance. To that end, the regulation of the municipal public utilities would be subject to the same duty of good faith that applies to general municipal governance.
The role of Administration is to operate the utilities within the Council-approved budget, and determine the “means” to achieve the “ends” that Council sets out by way of their strategic goals. As identified in a July 2009 Review of the Drainage and Waste Management Utilities by HDR Engineering Inc. the utilities are multi-million dollar enterprises that should be run in a business-like manner, operated on a “stand-alone” basis and have adequate written financial and rate setting policies to guide management in their day-to-day operating decisions in a manner that best serves the interest of the City and the public. The utilities must have a financial and rate setting framework in place to allow for the proper and adequate investment in infrastructure; be it replacement, growth or regulatory-related. In addition, it must have a governance and oversight “process” that is consistent in both timing and approach and results in prudent and rational decisions concerning each utility.
In June of 2010, City Council hired an external Utility Advisor. Since that time, the Utility Advisor has attended two meetings of the Transportation and Public Works Committee (TPW). On July 13, Administration provided TPW with proposed fiscal policies for the utilities, as well as a proposed 2011 budget guideline. The Committee asked that supplementary information be provided in order to both help them, and their Utility Advisor better understand the utility finances. This supplementary information came back to TPW in September, along with the original fiscal policy and budget guideline recommendations. The Utility Advisor made a presentation at this meeting. One of his recommendations was that a different format of financial information be provided to him. Included within this package, is the information Administration provided to the Utility Advisor, as well as the report the Utility Advisor wrote for City Council in response to his review of this information. A 2011 budget guideline was not provided to Administration by TPW, and the fiscal policy discussion was deferred to early 2011.
- 25 -
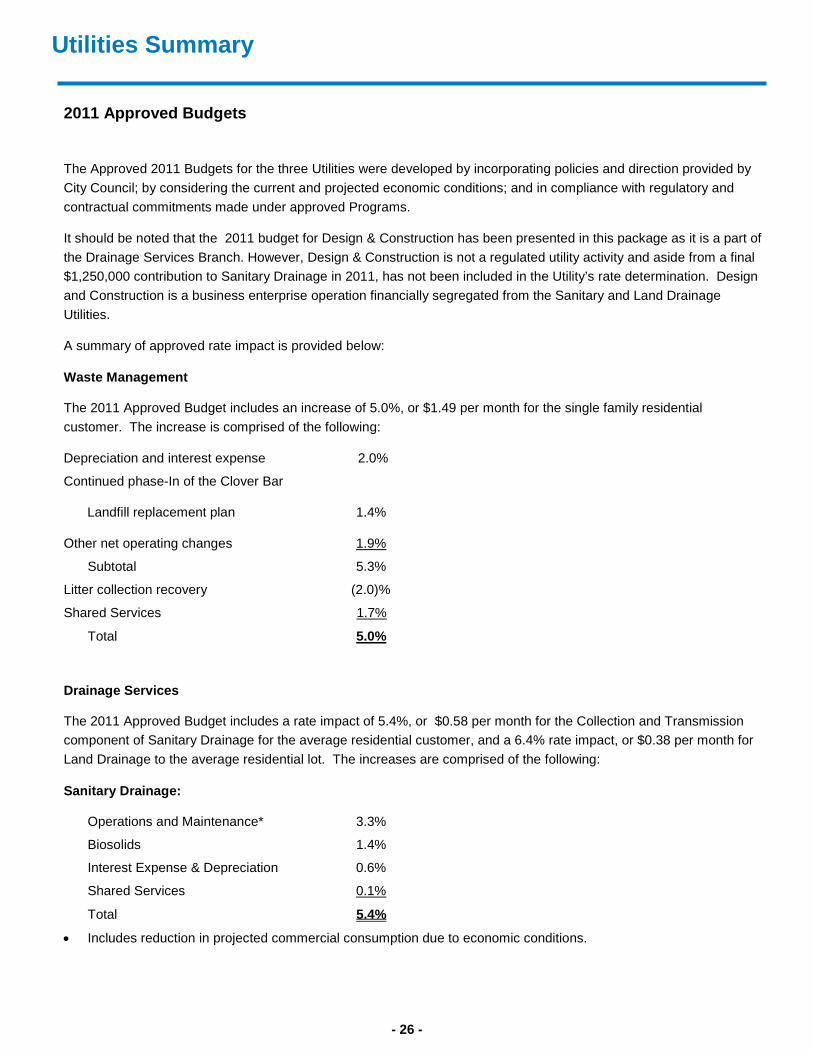
2011 Approved Budgets
The Approved 2011 Budgets for the three Utilities were developed by incorporating policies and direction provided by City Council; by considering the current and projected economic conditions; and in compliance with regulatory and contractual commitments made under approved Programs.
It should be noted that the 2011 budget for Design & Construction has been presented in this package as it is a part of the Drainage Services Branch. However, Design & Construction is not a regulated utility activity and aside from a final $1,250,000 contribution to Sanitary Drainage in 2011, has not been included in the Utility’s rate determination. Design and Construction is a business enterprise operation financially segregated from the Sanitary and Land Drainage Utilities.
A summary of approved rate impact is provided below:
Waste Management
The 2011 Approved Budget includes an increase of 5.0%, or $1.49 per month for the single family residential customer. The increase is comprised of the following:
Depreciation and interest expense 2.0%
Continued phase-In of the Clover Bar
Landfill replacement plan 1.4%
Other net operating changes 1.9%
Subtotal 5.3%
Litter collection recovery (2.0)%
Shared Services 1.7%
Total 5.0%
Drainage Services
The 2011 Approved Budget includes a rate impact of 5.4%, or $0.58 per month for the Collection and Transmission component of Sanitary Drainage for the average residential customer, and a 6.4% rate impact, or $0.38 per month for Land Drainage to the average residential lot. The increases are comprised of the following:
Sanitary Drainage:
Operations and Maintenance* 3.3%
Biosolids 1.4%
Interest Expense & Depreciation 0.6%
Shared Services 0.1%
Total 5.4%
• Includes reduction in projected commercial consumption due to economic conditions.
Utilities Summary Works
- 26 -
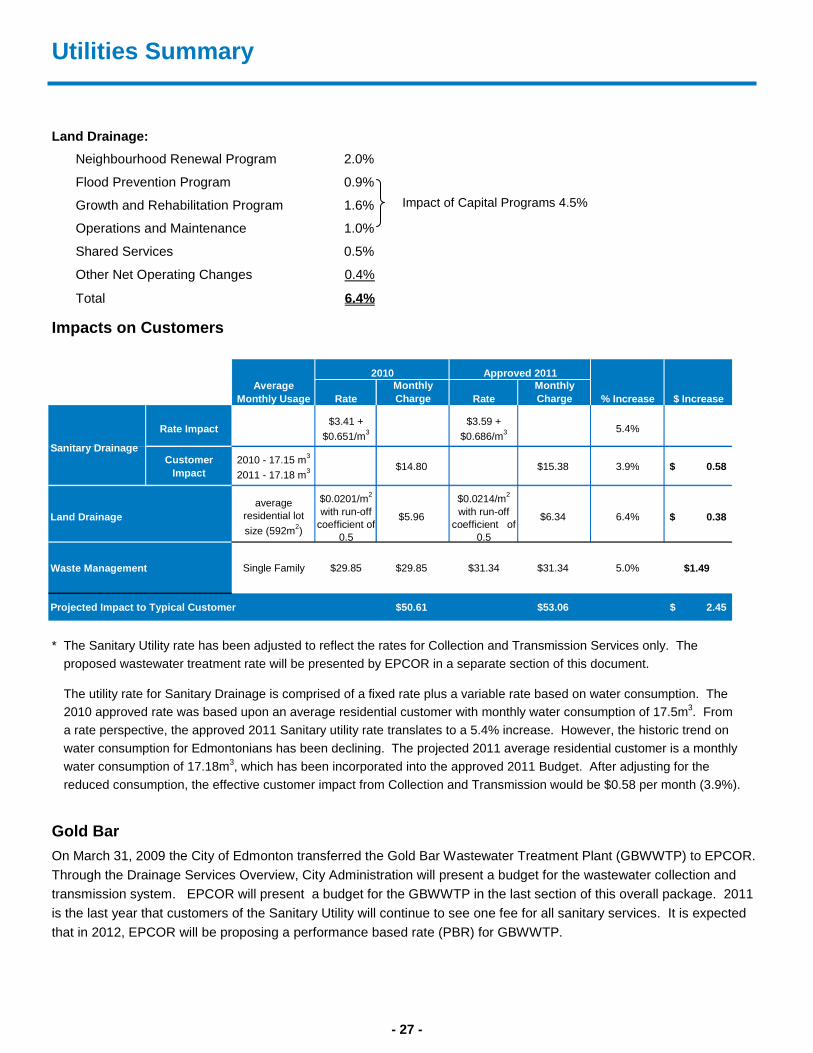
Land Drainage: Neighbourhood Renewal Program 2.0%
Flood Prevention Program 0.9%
Growth and Rehabilitation Program 1.6%
Operations and Maintenance 1.0%
Shared Services 0.5%
Other Net Operating Changes 0.4%
Total 6.4%
Impacts on Customers
Gold Bar On March 31, 2009 the City of Edmonton transferred the Gold Bar Wastewater Treatment Plant (GBWWTP) to EPCOR. Through the Drainage Services Overview, City Administration will present a budget for the wastewater collection and transmission system. EPCOR will present a budget for the GBWWTP in the last section of this overall package. 2011 is the last year that customers of the Sanitary Utility will continue to see one fee for all sanitary services. It is expected that in 2012, EPCOR will be proposing a performance based rate (PBR) for GBWWTP.
Utilities Summary Works
Impact of Capital Programs 4.5%
RateMonthly Charge Rate
Monthly Charge % Increase $ Increase
Rate Impact$3.41 +
$0.651/m3$3.59 +
$0.686/m3 5.4%
Customer Impact
2010 - 17.15 m3
2011 - 17.18 m3 $14.80 $15.38 3.9% 0.58$
Land Drainageaverage
residential lot size (592m2)
$0.0201/m2
with run-off coefficient of
0.5
$5.96
$0.0214/m2
with run-off coefficient of
0.5
$6.34 6.4% 0.38$
Waste Management Single Family $29.85 $29.85 $31.34 $31.34 5.0% $1.49
Projected Impact to Typical Customer $50.61 $53.06 2.45$
Average Monthly Usage
2010 Approved 2011
Sanitary Drainage
* The Sanitary Utility rate has been adjusted to reflect the rates for Collection and Transmission Services only. The proposed wastewater treatment rate will be presented by EPCOR in a separate section of this document.
The utility rate for Sanitary Drainage is comprised of a fixed rate plus a variable rate based on water consumption. The 2010 approved rate was based upon an average residential customer with monthly water consumption of 17.5m3. From a rate perspective, the approved 2011 Sanitary utility rate translates to a 5.4% increase. However, the historic trend on water consumption for Edmontonians has been declining. The projected 2011 average residential customer is a monthly water consumption of 17.18m3, which has been incorporated into the approved 2011 Budget. After adjusting for the reduced consumption, the effective customer impact from Collection and Transmission would be $0.58 per month (3.9%).
- 27 -

Shared Services and Central Management Cost Allocation to Utilities
Background
The City has historically followed a practice of fully costing utility operations (Sanitary and Land Drainage) in order for all costs of delivering a service to be paid by the utility user. This includes the direct operating costs of delivering services (operations and maintenance, customer billing, depreciation, interest expenses), as well as the direct and indirect support costs such as Shared Services (Human Resources, Finance, Information Technology etc.) and Central Management costs (corporate decision-making processes like Mayor and Coun-cil, City Manager etc.). Allocation of Shared Services and other corporate costs is a common utility industry practice but not as common for public utilities. Charges to the Drainage Utilities have been in place for many years. Charges to the Waste Management Util-ity began with creation of the Utility in 2009, on a phased-in basis. In addition, Shared Services costs are allo-cated Fleet Services and Current Planning. 2011 Utilities Budgets Through the 2011 Operating Budget, the Shared Services and Central Management allocation to the Drainage Utility increased by $1.3 million to $11.3 million. This represents the full cost of these services. For the Waste Management Utility, the increase is $2.2 million, to $5.6 million, representing the second year of the phase-in to full costing. A further $1.8 million of Shared Services and Central Management costs to Waste Manage-ment will be phased in over subsequent years. These increases have been built into the 2011 Budget for the Utilities. In addition, there is an offsetting tax levy reduction in the Shared Services areas. Allocation Methodology
This level of allocation for 2011 is consistent with the costing methodology employed in 2010. For the 2011 Budget, the cost allocation process for Shared Services and Central Management costs was reviewed and revised to simplify and ensure a common methodology for all services. However, the 2011 Budget increase is not arising from the change in methodology but rather from increased accuracy in application. Shared Services costs can be classified as direct and indirect. Direct service costs represent those costs that can be directly attributable to a user (e.g., Finance FTEs dedicated to delivering service to a client area, square feet of office space used, etc.). Indirect costs represent costs that cannot easily or directly be attribut-able to the resources provided to a client area (e.g., city wide services such as corporate budget development or human resources). For indirect services, a reasonable cost driver is used to allocate the cost (e.g., % of client area expenditures to total corporation expenditures). Central Management costs are considered an indi-rect cost.
- 28 -
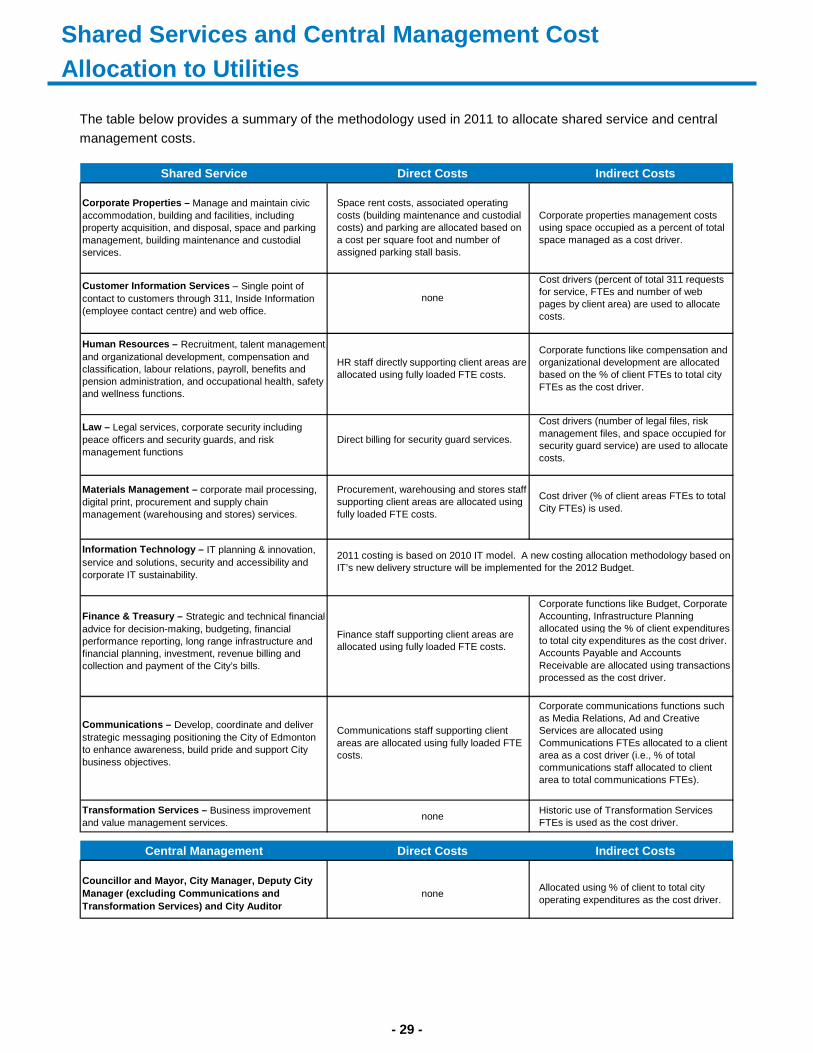
The table below provides a summary of the methodology used in 2011 to allocate shared service and central management costs.
Shared Services and Central Management Cost Allocation to Utilities
Shared Service Direct Costs Indirect Costs
Corporate Properties – Manage and maintain civic accommodation, building and facilities, including property acquisition, and disposal, space and parking management, building maintenance and custodial services.
Space rent costs, associated operating costs (building maintenance and custodial costs) and parking are allocated based on a cost per square foot and number of assigned parking stall basis.
Corporate properties management costs using space occupied as a percent of total space managed as a cost driver.
Customer Information Services – Single point of contact to customers through 311, Inside Information (employee contact centre) and web office.
none
Cost drivers (percent of total 311 requests for service, FTEs and number of web pages by client area) are used to allocate costs.
Human Resources – Recruitment, talent management and organizational development, compensation and classification, labour relations, payroll, benefits and pension administration, and occupational health, safety and wellness functions.
HR staff directly supporting client areas are allocated using fully loaded FTE costs.
Corporate functions like compensation and organizational development are allocated based on the % of client FTEs to total city FTEs as the cost driver.
Law – Legal services, corporate security including peace officers and security guards, and risk management functions
Direct billing for security guard services.
Cost drivers (number of legal files, risk management files, and space occupied for security guard service) are used to allocate costs.
Materials Management – corporate mail processing, digital print, procurement and supply chain management (warehousing and stores) services.
Procurement, warehousing and stores staff supporting client areas are allocated using fully loaded FTE costs.
Cost driver (% of client areas FTEs to total City FTEs) is used.
Information Technology – IT planning & innovation, service and solutions, security and accessibility and corporate IT sustainability.
Finance & Treasury – Strategic and technical financial advice for decision-making, budgeting, financial performance reporting, long range infrastructure and financial planning, investment, revenue billing and collection and payment of the City’s bills.
Finance staff supporting client areas are allocated using fully loaded FTE costs.
Corporate functions like Budget, Corporate Accounting, Infrastructure Planning allocated using the % of client expenditures to total city expenditures as the cost driver. Accounts Payable and Accounts Receivable are allocated using transactions processed as the cost driver.
Communications – Develop, coordinate and deliver strategic messaging positioning the City of Edmonton to enhance awareness, build pride and support City business objectives.
Communications staff supporting client areas are allocated using fully loaded FTE costs.
Corporate communications functions such as Media Relations, Ad and Creative Services are allocated using Communications FTEs allocated to a client area as a cost driver (i.e., % of total communications staff allocated to client area to total communications FTEs).
Transformation Services – Business improvement and value management services. none Historic use of Transformation Services
FTEs is used as the cost driver.
Central Management Direct Costs Indirect Costs
Councillor and Mayor, City Manager, Deputy City Manager (excluding Communications and Transformation Services) and City Auditor
none Allocated using % of client to total city operating expenditures as the cost driver.
2011 costing is based on 2010 IT model. A new costing allocation methodology based on IT’s new delivery structure will be implemented for the 2012 Budget.
- 29 -

Building Great Neighbourhoods
Great neighbourhoods are the building blocks of a great city. Over the past few years, the City has enhanced its investments in the physical and social infrastructure of our communities.
The primary objective is to improve the long-term livability of Edmonton’s neighbourhoods and the lives of the people who live, work and visit them. Through this corporate initiative, the City of Edmonton is:
• Investing in the physical and social infrastructure of neighbourhoods;
• Building community capacity by working with residents and supporting their efforts to create the place they want their neighbourhood to be; and
• Corporately coordinating City services and improving collaboration with other organizations to deliver services in neighbourhoods more efficiently.
Coordinated Infrastructure Investment
In the late 1980s and ‘90s, Edmonton went through a period of providing minimal support to the roads and side-walks in the heart of our community. Over time, the condition of roads, sidewalks and sewers deteriorated, result-ing in more frequent collapsed sewers, increased sidewalk trip hazards, and dramatically increased maintenance needs for pothole repairs. The City is turning that around with three main programs that renew the physical infra-structure of our neighbourhoods through sustainable, effective investment that will reach all areas of the city.
1. The Neighbourhood Renewal Program began in 2009 to provide an ongoing and sustainable fund for the reconstruction and preventative maintenance of streets, sidewalks and street lighting in neighbourhoods across the city. Implemented by the Transportation Department, the program first allocates funding from Provincial capital grants (AMIP and MSI) and continues to build the fund through a dedicated tax levy. In 2008, City Council established the increase in tax levy of 2% allocated to this fund for the years 2009 and 2010. City Council approved a 1.5% tax levy increase in the 2011 Operating Budget.
The Neighbourhood Renewal Program has five types of renewal work:
• Total reconstruction of roads, curbs and sidewalks and replacement of streetlights in about five to seven neighbourhoods per year;
• Residential paving overlay for roads and sidewalks
• Preventative maintenance to extend the life of infrastructure through reseal microsurfacing
• Resurfacing of collector roadways and alley renewal
• Replacement of roads with special drainage enhancements, selective concrete repair in areas with soft subgrade conditions
By effectively combining reconstruction, rehabilitation and preventative maintenance, all Edmonton neighbourhoods can receive improvements within 30 years.
Combined with funding from the Province and other sources, more than 20 neighbourhoods received re-newal work in 2009. In 2010, 24 neighbourhoods are scheduled to benefit. The 2011 program plans to provide renewal work in more than 20 neighbourhoods.
- 30 -

Building Great Neighbourhoods
2. The Great Neighbourhoods Capital Program was established in the 10-year capital plan to invest about $15 mil-
lion per year in 2009-11 to spur development and deliver on community-identified priorities. Funded through tax-supported debt, the program invests in three integrated areas:
• Revitalization projects in struggling neighbourhoods, through work such as streetscape improvements, struc-tural repairs to buildings and arterial road revisions;
• Business development, targeting commercial infrastructure and aesthetics enhancements; and
• Redevelopment and improvements, such as paving pathways that improve access to neighbourhood parks or community league buildings, adding pathways to neighbourhood parks and creating sidewalks to connect people in a neighbourhood.
Coordinated by the Great Neighbourhoods Office, 2009-11 programs benefit 14 distinct neighbourhoods. Pro-jects underway include substantial reconstruction for Alberta Avenue, McCauley revitalization design, and Jas-per Place/Stony Plain Road land use redesign. Proposed projects include $13 million in extensive improvements on Capital Boulevard (108 St. from the Alberta Legislature to MacEwan University), Redevelopment and Im-provements in six neighbourhoods, and Phase 4 work in the McCauley revitalization.
3. Drainage Renewal is closely coordinated with above-ground infrastructure Renewal and Revitalization. Imple-mented by the Asset Management and Public Works Department and funded through utility fees, the work on the underground infrastructure involves either relining sewer lines or replacing pipes. The work occurs in three main ways:
• Coordinating with the Neighbourhood Renewal work on roads and sidewalks,
• Renewal work in coordination with other franchised utilities such as ATCO gas, and
• Work where sewers are the only infrastructure in need of immediate renewal.
In 2010, Drainage Renewal work benefited 16 neighbourhoods. In 2011, there are already six neighbourhoods scheduled for Drainage Renewal, in coordination with Transportation projects. Drainage work will also occur in other neighbourhoods to coincide with other franchise utility repairs.
Neighbourhood Engagement
The recently established Office of Great Neighbourhoods coordinates civic activity planned for any particular neighbourhood. Once areas are identified for Neighbourhood Renewal, the Office of Great Neighbourhoods takes on a corporate coordination role, providing one voice to citizens on behalf of all City departments involved. With a steer-ing committee that involves all City departments and services such as the Edmonton Police Service and Edmonton Public Libraries, the Great Neighbourhoods initiative engages the residents of a neighbourhood to identify invest-ments in projects that improve the livability of the community.
For social infrastructure, the Great Neighbourhoods initiative will facilitate better two-way communication with resi-dents and other organizations to plan opportunities that Edmontonians want at the local level. In 2010, Great Neighbourhoods directly managed investment in 15 neighbourhoods in community-initiated projects. In 2011, Great Neighbourhoods will coordinate all civic consultation in a neighbourhood, making a community’s interaction with the City more streamlined and more effective.
- 31 -

Tabl
es
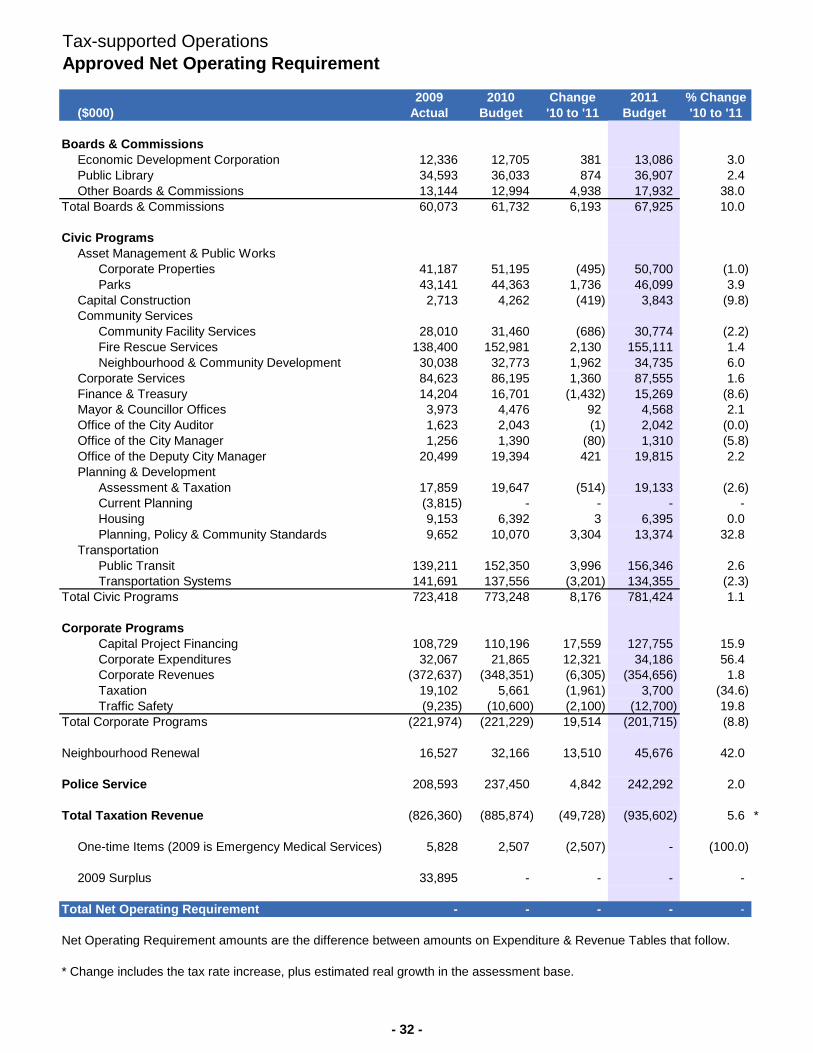
Tax-supported OperationsApproved Net Operating Requirement
2009 2010 Change 2011 % Change($000) Actual Budget '10 to '11 Budget '10 to '11
Boards & CommissionsEconomic Development Corporation 12,336 12,705 381 13,086 3.0 Public Library 34,593 36,033 874 36,907 2.4 Other Boards & Commissions 13,144 12,994 4,938 17,932 38.0
Total Boards & Commissions 60,073 61,732 6,193 67,925 10.0
Civic ProgramsAsset Management & Public Works
Corporate Properties 41,187 51,195 (495) 50,700 (1.0) Parks 43,141 44,363 1,736 46,099 3.9
Capital Construction 2,713 4,262 (419) 3,843 (9.8) Community Services
Community Facility Services 28,010 31,460 (686) 30,774 (2.2) Fire Rescue Services 138,400 152,981 2,130 155,111 1.4Neighbourhood & Community Development 30,038 32,773 1,962 34,735 6.0
Corporate Services 84,623 86,195 1,360 87,555 1.6Finance & Treasury 14,204 16,701 (1,432) 15,269 (8.6)Mayor & Councillor Offices 3,973 4,476 92 4,568 2.1 Office of the City Auditor 1,623 2,043 (1) 2,042 (0.0) Office of the City Manager 1,256 1,390 (80) 1,310 (5.8) Office of the Deputy City Manager 20,499 19,394 421 19,815 2.2 Planning & Development
Assessment & Taxation 17,859 19,647 (514) 19,133 (2.6) Current Planning (3,815) - - - - Housing 9,153 6,392 3 6,395 0.0 Planning, Policy & Community Standards 9,652 10,070 3,304 13,374 32.8
TransportationPublic Transit 139,211 152,350 3,996 156,346 2.6 Transportation Systems 141,691 137,556 (3,201) 134,355 (2.3)
Total Civic Programs 723,418 773,248 8,176 781,424 1.1
Corporate ProgramsCapital Project Financing 108,729 110,196 17,559 127,755 15.9 Corporate Expenditures 32,067 21,865 12,321 34,186 56.4 Corporate Revenues (372,637) (348,351) (6,305) (354,656) 1.8 Taxation 19,102 5,661 (1,961) 3,700 (34.6) Traffic Safety (9,235) (10,600) (2,100) (12,700) 19.8
Total Corporate Programs (221,974) (221,229) 19,514 (201,715) (8.8)
Neighbourhood Renewal 16,527 32,166 13,510 45,676 42.0
Police Service 208,593 237,450 4,842 242,292 2.0
Total Taxation Revenue (826,360) (885,874) (49,728) (935,602) 5.6 *
One-time Items (2009 is Emergency Medical Services) 5,828 2,507 (2,507) - (100.0)
2009 Surplus 33,895 - - - -
Total Net Operating Requirement - - - - -
Net Operating Requirement amounts are the difference between amounts on Expenditure & Revenue Tables that follow.
* Change includes the tax rate increase, plus estimated real growth in the assessment base.
- 32 -
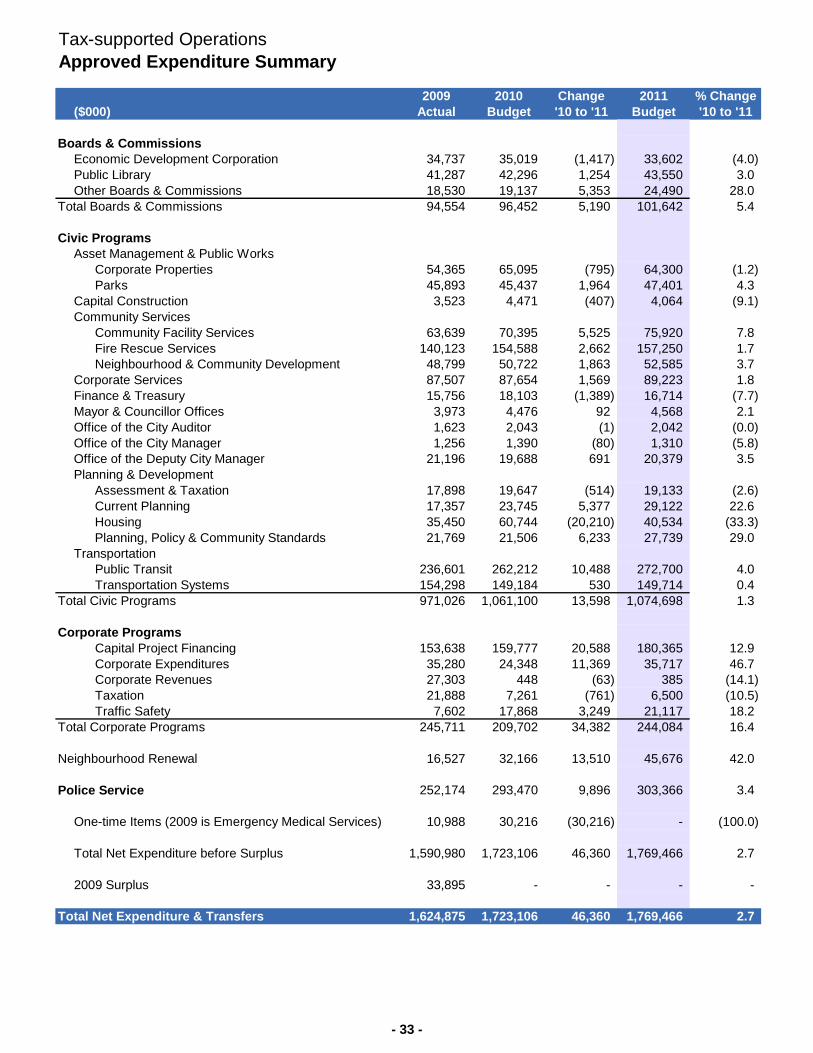
Tax-supported OperationsApproved Expenditure Summary
2009 2010 Change 2011 % Change($000) Actual Budget '10 to '11 Budget '10 to '11
Boards & CommissionsEconomic Development Corporation 34,737 35,019 (1,417) 33,602 (4.0)Public Library 41,287 42,296 1,254 43,550 3.0Other Boards & Commissions 18,530 19,137 5,353 24,490 28.0
Total Boards & Commissions 94,554 96,452 5,190 101,642 5.4
Civic ProgramsAsset Management & Public Works
Corporate Properties 54,365 65,095 (795) 64,300 (1.2)Parks 45,893 45,437 1,964 47,401 4.3
Capital Construction 3,523 4,471 (407) 4,064 (9.1)Community Services
Community Facility Services 63,639 70,395 5,525 75,920 7.8Fire Rescue Services 140,123 154,588 2,662 157,250 1.7Neighbourhood & Community Development 48,799 50,722 1,863 52,585 3.7
Corporate Services 87,507 87,654 1,569 89,223 1.8Finance & Treasury 15,756 18,103 (1,389) 16,714 (7.7)Mayor & Councillor Offices 3,973 4,476 92 4,568 2.1Office of the City Auditor 1,623 2,043 (1) 2,042 (0.0)Office of the City Manager 1,256 1,390 (80) 1,310 (5.8)Office of the Deputy City Manager 21,196 19,688 691 20,379 3.5Planning & Development
Assessment & Taxation 17,898 19,647 (514) 19,133 (2.6)Current Planning 17,357 23,745 5,377 29,122 22.6Housing 35,450 60,744 (20,210) 40,534 (33.3)Planning, Policy & Community Standards 21,769 21,506 6,233 27,739 29.0
TransportationPublic Transit 236,601 262,212 10,488 272,700 4.0Transportation Systems 154,298 149,184 530 149,714 0.4
Total Civic Programs 971,026 1,061,100 13,598 1,074,698 1.3
Corporate ProgramsCapital Project Financing 153,638 159,777 20,588 180,365 12.9Corporate Expenditures 35,280 24,348 11,369 35,717 46.7Corporate Revenues 27,303 448 (63) 385 (14.1) Taxation 21,888 7,261 (761) 6,500 (10.5) Traffic Safety 7,602 17,868 3,249 21,117 18.2
Total Corporate Programs 245,711 209,702 34,382 244,084 16.4
Neighbourhood Renewal 16,527 32,166 13,510 45,676 42.0
Police Service 252,174 293,470 9,896 303,366 3.4
One-time Items (2009 is Emergency Medical Services) 10,988 30,216 (30,216) - (100.0)
Total Net Expenditure before Surplus 1,590,980 1,723,106 46,360 1,769,466 2.7
2009 Surplus 33,895 - - - -
Total Net Expenditure & Transfers 1,624,875 1,723,106 46,360 1,769,466 2.7
- 33 -
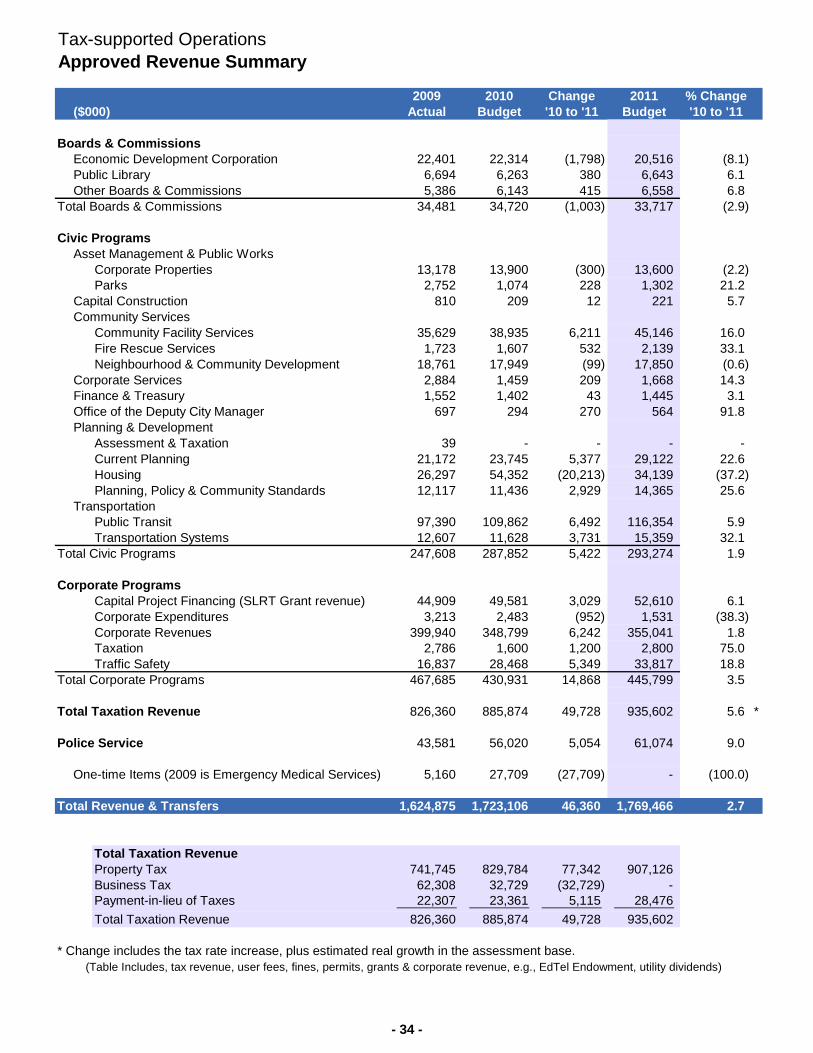
Tax-supported OperationsApproved Revenue Summary
2009 2010 Change 2011 % Change($000) Actual Budget '10 to '11 Budget '10 to '11
Boards & CommissionsEconomic Development Corporation 22,401 22,314 (1,798) 20,516 (8.1) Public Library 6,694 6,263 380 6,643 6.1 Other Boards & Commissions 5,386 6,143 415 6,558 6.8
Total Boards & Commissions 34,481 34,720 (1,003) 33,717 (2.9)
Civic ProgramsAsset Management & Public Works
Corporate Properties 13,178 13,900 (300) 13,600 (2.2) Parks 2,752 1,074 228 1,302 21.2
Capital Construction 810 209 12 221 5.7 Community Services
Community Facility Services 35,629 38,935 6,211 45,146 16.0Fire Rescue Services 1,723 1,607 532 2,139 33.1 Neighbourhood & Community Development 18,761 17,949 (99) 17,850 (0.6)
Corporate Services 2,884 1,459 209 1,668 14.3 Finance & Treasury 1,552 1,402 43 1,445 3.1 Office of the Deputy City Manager 697 294 270 564 91.8 Planning & Development
Assessment & Taxation 39 - - - - Current Planning 21,172 23,745 5,377 29,122 22.6 Housing 26,297 54,352 (20,213) 34,139 (37.2) Planning, Policy & Community Standards 12,117 11,436 2,929 14,365 25.6
TransportationPublic Transit 97,390 109,862 6,492 116,354 5.9 Transportation Systems 12,607 11,628 3,731 15,359 32.1
Total Civic Programs 247,608 287,852 5,422 293,274 1.9
Corporate ProgramsCapital Project Financing (SLRT Grant revenue) 44,909 49,581 3,029 52,610 6.1 Corporate Expenditures 3,213 2,483 (952) 1,531 (38.3) Corporate Revenues 399,940 348,799 6,242 355,041 1.8 Taxation 2,786 1,600 1,200 2,800 75.0 Traffic Safety 16,837 28,468 5,349 33,817 18.8
Total Corporate Programs 467,685 430,931 14,868 445,799 3.5
Total Taxation Revenue 826,360 885,874 49,728 935,602 5.6 *
Police Service 43,581 56,020 5,054 61,074 9.0
One-time Items (2009 is Emergency Medical Services) 5,160 27,709 (27,709) - (100.0)
Total Revenue & Transfers 1,624,875 1,723,106 46,360 1,769,466 2.7
Total Taxation RevenueProperty Tax 741,745 829,784 77,342 907,126 Business Tax 62,308 32,729 (32,729) - Payment-in-lieu of Taxes 22,307 23,361 5,115 28,476 Total Taxation Revenue 826,360 885,874 49,728 935,602
* Change includes the tax rate increase, plus estimated real growth in the assessment base.(Table Includes, tax revenue, user fees, fines, permits, grants & corporate revenue, e.g., EdTel Endowment, utility dividends)
- 34 -

Approved Municipal Enterprises
$000 2009 2010 Change 2011 % ChangeActual Budget '10 to '11 Budget '10 to '11
Land Enterprise - Land DevelopmentRevenues & Transfers 10,353 39,510 (7,271) 32,239 (18.4) Less: Expenditure & Transfers 6,665 24,832 (1,582) 23,250 (6.4)
Net Income 3,688 14,678 (5,689) 8,989 (38.8)
Fleet ServicesRevenues & Recoveries 135,216 142,062 7,689 149,751 5.4 Less: Expenditure & Transfers 143,342 141,246 8,608 149,854 6.1
Net Income (8,126) 816 (919) (103) (112.6)
Approved Utility Operations
$000 2009 2010 Change 2011 % ChangeActual Budget '10 to '11 Budget '10 to '11
Sanitary Drainage UtilityRevenues & Transfers 81,946 72,858 2,846 75,704 3.9 Less: Expenditures & Transfers 63,403 62,961 5,609 68,570 8.9
Net Income 18,543 9,897 (2,763) 7,134 (27.9)
Land Drainage UtilityRevenues & Transfers 24,991 26,449 2,787 29,236 10.5 Less: Expenditures & Transfers 14,808 18,086 3,343 21,429 18.5
Net Income 10,183 8,363 (556) 7,807 (6.6)
Drainage Design and ConstructionRevenues & Transfers 7,133 5,568 5,568 11,136 100.0 Less: Expenditures & Transfers 1,906 1,356 5,868 7,224 432.7
Net Income 5,227 4,212 (300) 3,912 (7.1)
Waste ManagementRevenues & Transfers 118,035 129,590 15,443 145,033 11.9 Less: Expenditures & Transfers 118,035 129,590 15,443 145,033 11.9
Net Income - - - - -
- 35 -
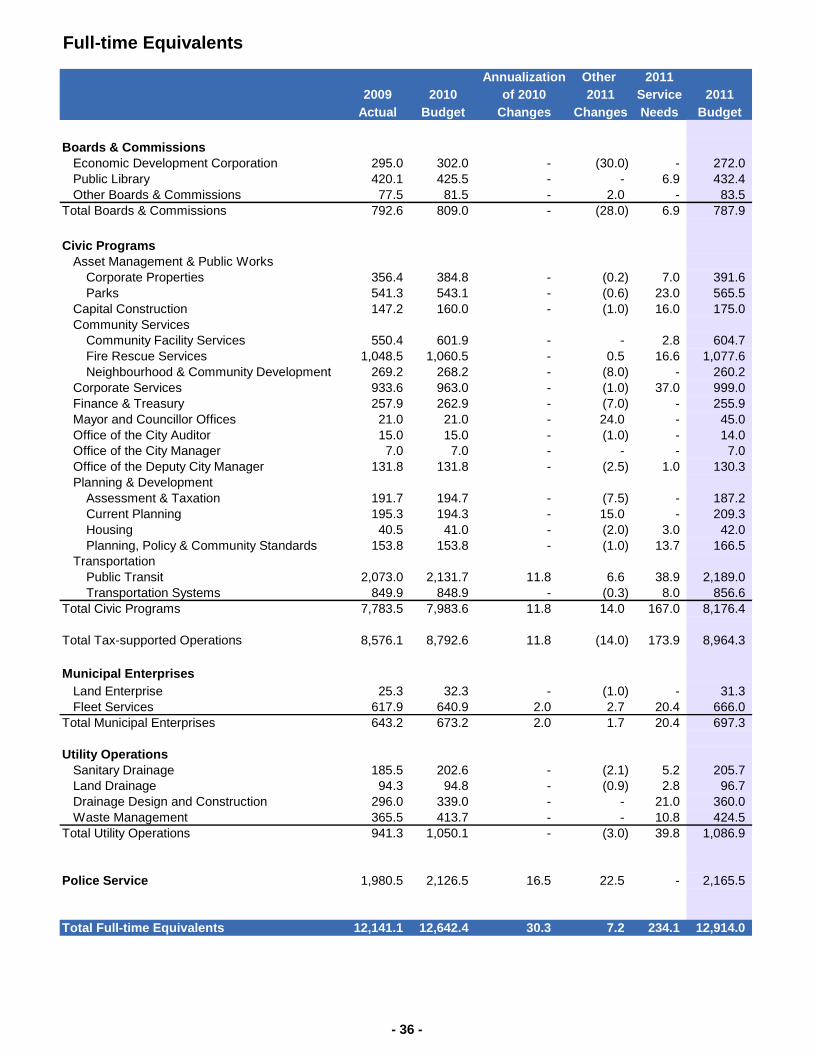
Full-time Equivalents
Annualization Other 20112009 2010 of 2010 2011 Service 2011
Actual Budget Changes Changes Needs Budget
Boards & CommissionsEconomic Development Corporation 295.0 302.0 - (30.0) - 272.0 Public Library 420.1 425.5 - - 6.9 432.4 Other Boards & Commissions 77.5 81.5 - 2.0 - 83.5
Total Boards & Commissions 792.6 809.0 - (28.0) 6.9 787.9
Civic ProgramsAsset Management & Public Works
Corporate Properties 356.4 384.8 - (0.2) 7.0 391.6 Parks 541.3 543.1 - (0.6) 23.0 565.5
Capital Construction 147.2 160.0 - (1.0) 16.0 175.0 Community Services
Community Facility Services 550.4 601.9 - - 2.8 604.7 Fire Rescue Services 1,048.5 1,060.5 - 0.5 16.6 1,077.6 Neighbourhood & Community Development 269.2 268.2 - (8.0) - 260.2
Corporate Services 933.6 963.0 - (1.0) 37.0 999.0 Finance & Treasury 257.9 262.9 - (7.0) - 255.9 Mayor and Councillor Offices 21.0 21.0 - 24.0 - 45.0 Office of the City Auditor 15.0 15.0 - (1.0) - 14.0 Office of the City Manager 7.0 7.0 - - - 7.0 Office of the Deputy City Manager 131.8 131.8 - (2.5) 1.0 130.3 Planning & Development
Assessment & Taxation 191.7 194.7 - (7.5) - 187.2 Current Planning 195.3 194.3 - 15.0 - 209.3 Housing 40.5 41.0 - (2.0) 3.0 42.0 Planning, Policy & Community Standards 153.8 153.8 - (1.0) 13.7 166.5
TransportationPublic Transit 2,073.0 2,131.7 11.8 6.6 38.9 2,189.0 Transportation Systems 849.9 848.9 - (0.3) 8.0 856.6
Total Civic Programs 7,783.5 7,983.6 11.8 14.0 167.0 8,176.4
Total Tax-supported Operations 8,576.1 8,792.6 11.8 (14.0) 173.9 8,964.3
Municipal EnterprisesLand Enterprise 25.3 32.3 - (1.0) - 31.3 Fleet Services 617.9 640.9 2.0 2.7 20.4 666.0
Total Municipal Enterprises 643.2 673.2 2.0 1.7 20.4 697.3
Utility OperationsSanitary Drainage 185.5 202.6 - (2.1) 5.2 205.7 Land Drainage 94.3 94.8 - (0.9) 2.8 96.7 Drainage Design and Construction 296.0 339.0 - - 21.0 360.0 Waste Management 365.5 413.7 - - 10.8 424.5
Total Utility Operations 941.3 1,050.1 - (3.0) 39.8 1,086.9
Police Service 1,980.5 2,126.5 16.5 22.5 - 2,165.5
Total Full-time Equivalents 12,141.1 12,642.4 30.3 7.2 234.1 12,914.0
- 36 -
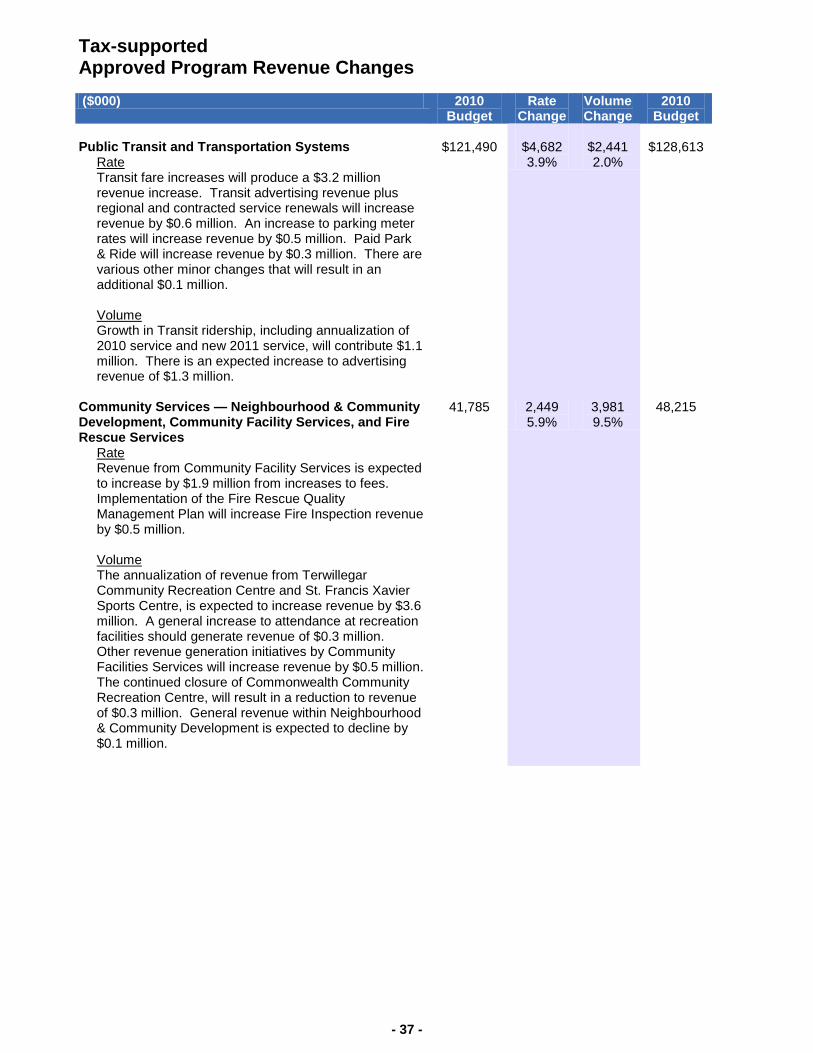
Tax-supported Approved Program Revenue Changes
($000) 2010
Budget Rate
Change Volume Change
2010 Budget
Public Transit and Transportation Systems
Rate Transit fare increases will produce a $3.2 million revenue increase. Transit advertising revenue plus regional and contracted service renewals will increase revenue by $0.6 million. An increase to parking meter rates will increase revenue by $0.5 million. Paid Park & Ride will increase revenue by $0.3 million. There are various other minor changes that will result in an additional $0.1 million. Volume Growth in Transit ridership, including annualization of 2010 service and new 2011 service, will contribute $1.1 million. There is an expected increase to advertising revenue of $1.3 million.
$121,490
$4,682 3.9%
$2,441 2.0%
$128,613
Community Services — Neighbourhood & Community Development, Community Facility Services, and Fire Rescue Services
Rate Revenue from Community Facility Services is expected to increase by $1.9 million from increases to fees. Implementation of the Fire Rescue Quality Management Plan will increase Fire Inspection revenue by $0.5 million. Volume The annualization of revenue from Terwillegar Community Recreation Centre and St. Francis Xavier Sports Centre, is expected to increase revenue by $3.6 million. A general increase to attendance at recreation facilities should generate revenue of $0.3 million. Other revenue generation initiatives by Community Facilities Services will increase revenue by $0.5 million. The continued closure of Commonwealth Community Recreation Centre, will result in a reduction to revenue of $0.3 million. General revenue within Neighbourhood & Community Development is expected to decline by $0.1 million.
41,785 2,449 5.9%
3,981 9.5%
48,215
- 37 -

Tax-supported Approved Program Revenue Changes
($000) 2010 Budget
Rate Change
Volume Change
2011 Budget
Planning and Development – Current Planning and
Planning, Policy & Community Standards Rate A comprehensive review of all Current Planning fees will result in rate increases that generate $0.8 million. Community Standards fees will be increased by CPI (2%), and additional revenue will be generated by increases to pet licences and kennel fees related to the Animal Care and Control Community Support Programs. The increase from these two areas is expected to be $0.6 million. Volume Increased development activity in Current Planning will produce an additional $4.3 million. An expected increase to participation in the Animal Care and Control Community Support Programs will generate an additional $0.4 million.
35,181
1,376 3.9%
4,690 13.3%
41,247
Police Service Rate An increase of $1.00 to the per day storage rate at the Tow Lot will increase revenue by $0.2 million.
Volume Secondment revenue is expected to increase by $2.6 million. (This revenue is directly offset by related expenses.) Traffic Safety Act revenue is expected to increase by $0.5 million. Other revenue, including special event policing, bylaw fines and security clearances, is expected to increase by $0.7 million.
33,876 158 0.5%
3,846 11.4%
37,880
Traffic Safety Volume Photo Enforcement revenue is expected to increase by $5.3 million from additional monitoring.
28,468 -- 5,349 18.8%
33,817
Economic Development Corporation Volume An expected change in the mix of events at the Shaw Conference Centre will decrease revenue by $2.1 million. Normal regional cycles will see a lower number of conventions. The timing of additional space coming online at the Research Park and continued risk in the economy lead to a reduction in the Research Park’s expected revenue by $0.3 million. Tourism will see an increase of $0.6 million, but will face challenges from the economic pressures on partner agencies.
22,314 --
(1,798) (8.1%)
20,516
- 38 -

Tax-supported Approved Program Revenue Changes
($000) 2010 Budget
Rate Change
Volume Change
2011 Budget
Asset Management & Public Works – Corporate Properties
Rate A 2.0% rate increase for leasing and property management, plus an increase of $10 per month per parking stall will produce an additional $0.1 million in revenue. Volume A reduction to parkade usage will decrease revenue by $0.4 million.
13,900
146
1.1%
(446)
(3.2%)
13,600
Other (Includes: Capital Construction; Corporate Services; Finance & Treasury; Housing; Office of the Deputy City Manager; Parks; Combative Sports Commission; Public Library; Edmonton Space & Science Foundation; Vehicle for Hire; Traffic Tags; 2010 One-time revenue) Rate The rate increase relates mostly to Parks increasing its charge out rates. Volume Traffic Tag revenue is expected to increase by $0.5 million. Revenues increase by $0.5 million with the inclusion of the Combative Sports Commission for the first time in the budget of the City of Edmonton. Billings from Civic Events are expected to increase Office of the Deputy City Manager revenues by $0.3 million. This change will make the budget reflect actual experience. Public Library revenues are expected to increase by $0.2 million. Parks revenues from inspection fees are expected to increase by $0.2 million. 2010 one-time revenues of $2.3 million are removed ($1.4 for the 2010 Election, $0.6 for dispatch services for Alberta Health Services and $0.3 million for 2010 Grey Cup game).
21,645 36 0.2%
(574) (2.7%)
21,107
Total User Fees, Licenses, Permits and Fines
$318,659
8,847 2.8%
17,489 5.5%
344,995
- 39 -

2010 Fee $ Increase % IncreaseApproved 2011 Fee
ArenasWinter Ice (Good Time) - Adults $234.00 $15.00 6% $249.00Winter Ice (Good Time) - Minor $117.00 $7.50 6% $124.50
Sports FieldsStandard Fields - Adult (per hour) $4.50 $0.00 0% $4.50Standard Fields - Minor (per hour) $0.00 no change no change $0.00
Muttart ConservatorySingle Admission - Adult $10.50 $1.00 10% $11.50Single Admission - Child $5.25 $0.50 10% $5.75
Valley ZooSingle Admission - Adult (summer) $10.50 $1.00 10% $11.50Single Admission - Child (summer) $5.25 $0.50 10% $5.75
Golf Courses (Riverside/Victoria)Green Fees - 18 Holes - Weekend $52.00 $1.00 2% $53.00
Aquatic & Fitness (Community Pools & Leisure Facilities)Single Admission - Adult $6.00 $0.00 0% $6.00Single Admission - Child $3.00 $0.00 0% $3.00
Public LibraryChildren Under 18 free no change no change freeFirst Adult Per Household $12.00 no change no change $12.00Other Adults Per Household $8.00 no change no change $8.00Household Maximum 4 adults no change no change 4 adults
Parking FeesLibrary & Canada Place Parkades
Half Hour Rate (Monday to Friday) $2.50 no change no change $2.50Day Maximum Rate (24 hrs from midnight to midnight) $28.00 no change no change $28.00First Three Hours (Weekends) $1.00 no change no change $1.00Monthly Parking $285.00 $10.00 4% $295.00
City Hall Parkade Meter Rate6:00 a.m. to 6:00 p.m. (Monday to Friday) per half hour $2.00 no change no change $2.006:00 p.m. to 12:00 Midnight (evenings) per hour $1.00 no change no change $1.0012:00 Midnight to 6:00 a.m. (Monday to Friday) per hour $0.50 no change no change $0.50
Highlights of Approved 2011 User Fees
- 40 -
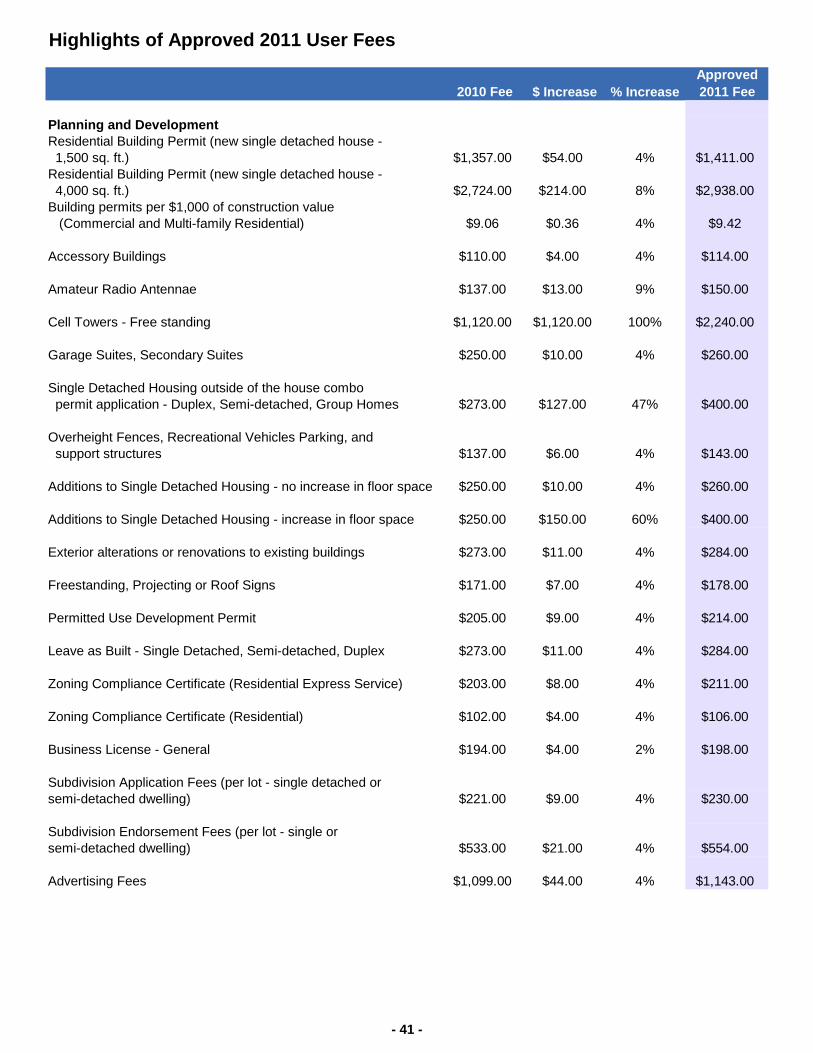
2010 Fee $ Increase % IncreaseApproved 2011 Fee
Planning and DevelopmentResidential Building Permit (new single detached house - 1,500 sq. ft.) $1,357.00 $54.00 4% $1,411.00Residential Building Permit (new single detached house - 4,000 sq. ft.) $2,724.00 $214.00 8% $2,938.00Building permits per $1,000 of construction value (Commercial and Multi-family Residential) $9.06 $0.36 4% $9.42
Accessory Buildings $110.00 $4.00 4% $114.00
Amateur Radio Antennae $137.00 $13.00 9% $150.00
Cell Towers - Free standing $1,120.00 $1,120.00 100% $2,240.00
Garage Suites, Secondary Suites $250.00 $10.00 4% $260.00
Single Detached Housing outside of the house combo permit application - Duplex, Semi-detached, Group Homes $273.00 $127.00 47% $400.00
Overheight Fences, Recreational Vehicles Parking, and support structures $137.00 $6.00 4% $143.00
Additions to Single Detached Housing - no increase in floor space $250.00 $10.00 4% $260.00
Additions to Single Detached Housing - increase in floor space $250.00 $150.00 60% $400.00
Exterior alterations or renovations to existing buildings $273.00 $11.00 4% $284.00
Freestanding, Projecting or Roof Signs $171.00 $7.00 4% $178.00
Permitted Use Development Permit $205.00 $9.00 4% $214.00
Leave as Built - Single Detached, Semi-detached, Duplex $273.00 $11.00 4% $284.00
Zoning Compliance Certificate (Residential Express Service) $203.00 $8.00 4% $211.00
Zoning Compliance Certificate (Residential) $102.00 $4.00 4% $106.00
Business License - General $194.00 $4.00 2% $198.00
Subdivision Application Fees (per lot - single detached orsemi-detached dwelling) $221.00 $9.00 4% $230.00
Subdivision Endorsement Fees (per lot - single orsemi-detached dwelling) $533.00 $21.00 4% $554.00
Advertising Fees $1,099.00 $44.00 4% $1,143.00
Highlights of Approved 2011 User Fees
- 41 -
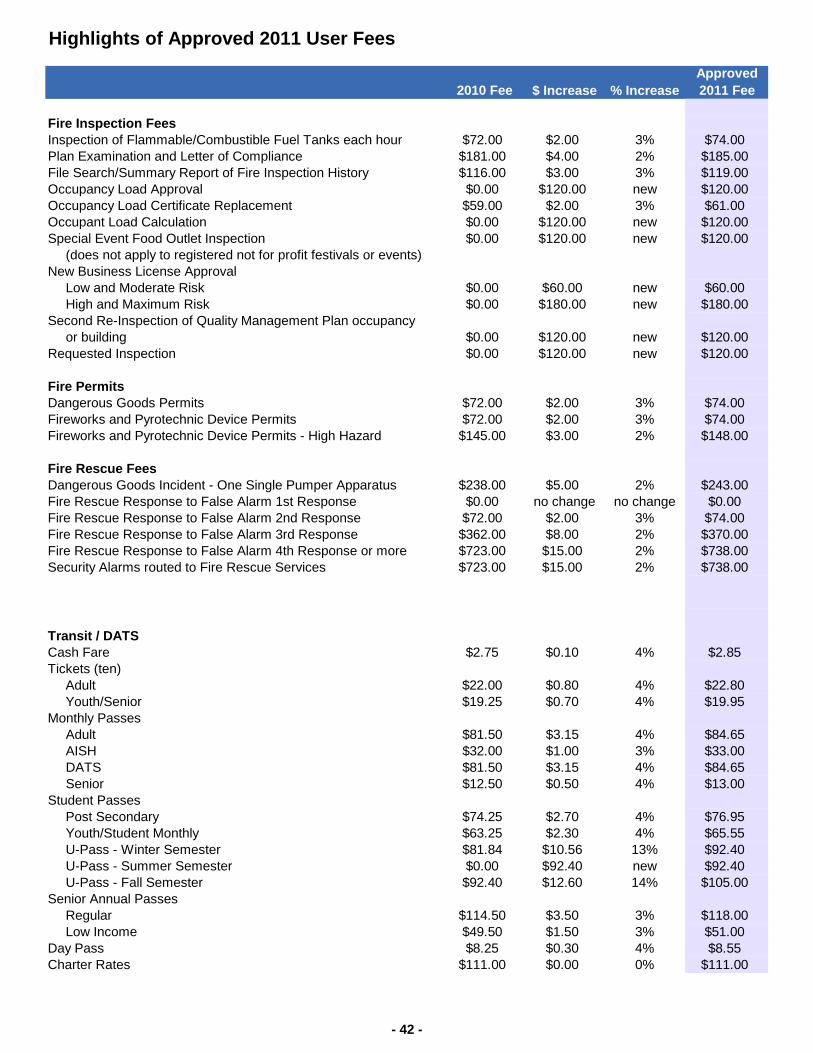
2010 Fee $ Increase % IncreaseApproved 2011 Fee
Fire Inspection FeesInspection of Flammable/Combustible Fuel Tanks each hour $72.00 $2.00 3% $74.00Plan Examination and Letter of Compliance $181.00 $4.00 2% $185.00File Search/Summary Report of Fire Inspection History $116.00 $3.00 3% $119.00Occupancy Load Approval $0.00 $120.00 new $120.00Occupancy Load Certificate Replacement $59.00 $2.00 3% $61.00Occupant Load Calculation $0.00 $120.00 new $120.00Special Event Food Outlet Inspection $0.00 $120.00 new $120.00
(does not apply to registered not for profit festivals or events)New Business License Approval
Low and Moderate Risk $0.00 $60.00 new $60.00High and Maximum Risk $0.00 $180.00 new $180.00
Second Re-Inspection of Quality Management Plan occupancyor building $0.00 $120.00 new $120.00
Requested Inspection $0.00 $120.00 new $120.00
Fire PermitsDangerous Goods Permits $72.00 $2.00 3% $74.00Fireworks and Pyrotechnic Device Permits $72.00 $2.00 3% $74.00Fireworks and Pyrotechnic Device Permits - High Hazard $145.00 $3.00 2% $148.00
Fire Rescue FeesDangerous Goods Incident - One Single Pumper Apparatus $238.00 $5.00 2% $243.00Fire Rescue Response to False Alarm 1st Response $0.00 no change no change $0.00Fire Rescue Response to False Alarm 2nd Response $72.00 $2.00 3% $74.00Fire Rescue Response to False Alarm 3rd Response $362.00 $8.00 2% $370.00Fire Rescue Response to False Alarm 4th Response or more $723.00 $15.00 2% $738.00Security Alarms routed to Fire Rescue Services $723.00 $15.00 2% $738.00
Transit / DATSCash Fare $2.75 $0.10 4% $2.85Tickets (ten)
Adult $22.00 $0.80 4% $22.80Youth/Senior $19.25 $0.70 4% $19.95
Monthly PassesAdult $81.50 $3.15 4% $84.65AISH $32.00 $1.00 3% $33.00DATS $81.50 $3.15 4% $84.65Senior $12.50 $0.50 4% $13.00
Student PassesPost Secondary $74.25 $2.70 4% $76.95Youth/Student Monthly $63.25 $2.30 4% $65.55U-Pass - Winter Semester $81.84 $10.56 13% $92.40U-Pass - Summer Semester $0.00 $92.40 new $92.40U-Pass - Fall Semester $92.40 $12.60 14% $105.00
Senior Annual PassesRegular $114.50 $3.50 3% $118.00Low Income $49.50 $1.50 3% $51.00
Day Pass $8.25 $0.30 4% $8.55Charter Rates $111.00 $0.00 0% $111.00
Highlights of Approved 2011 User Fees
- 42 -
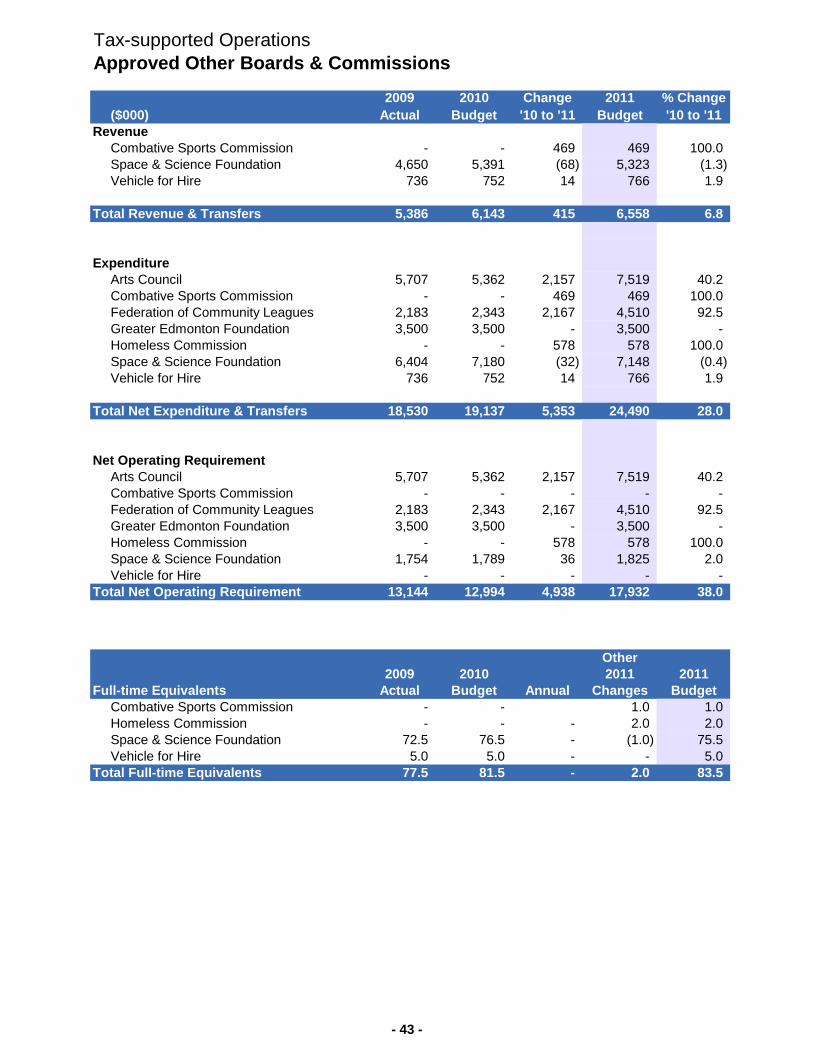
Tax-supported Operations Approved Other Boards & Commissions
2009 2010 Change 2011 % Change($000) Actual Budget '10 to '11 Budget '10 to '11
RevenueCombative Sports Commission - - 469 469 100.0 Space & Science Foundation 4,650 5,391 (68) 5,323 (1.3) Vehicle for Hire 736 752 14 766 1.9
Total Revenue & Transfers 5,386 6,143 415 6,558 6.8
ExpenditureArts Council 5,707 5,362 2,157 7,519 40.2 Combative Sports Commission - - 469 469 100.0 Federation of Community Leagues 2,183 2,343 2,167 4,510 92.5 Greater Edmonton Foundation 3,500 3,500 - 3,500 - Homeless Commission - - 578 578 100.0 Space & Science Foundation 6,404 7,180 (32) 7,148 (0.4) Vehicle for Hire 736 752 14 766 1.9
Total Net Expenditure & Transfers 18,530 19,137 5,353 24,490 28.0
Net Operating RequirementArts Council 5,707 5,362 2,157 7,519 40.2 Combative Sports Commission - - - - - Federation of Community Leagues 2,183 2,343 2,167 4,510 92.5 Greater Edmonton Foundation 3,500 3,500 - 3,500 - Homeless Commission - - 578 578 100.0 Space & Science Foundation 1,754 1,789 36 1,825 2.0 Vehicle for Hire - - - - -
Total Net Operating Requirement 13,144 12,994 4,938 17,932 38.0
Other2009 2010 2011 2011
Full-time Equivalents Actual Budget Annual Changes BudgetCombative Sports Commission - - 1.0 1.0 Homeless Commission - - - 2.0 2.0 Space & Science Foundation 72.5 76.5 - (1.0) 75.5 Vehicle for Hire 5.0 5.0 - - 5.0
Total Full-time Equivalents 77.5 81.5 - 2.0 83.5
- 43 -
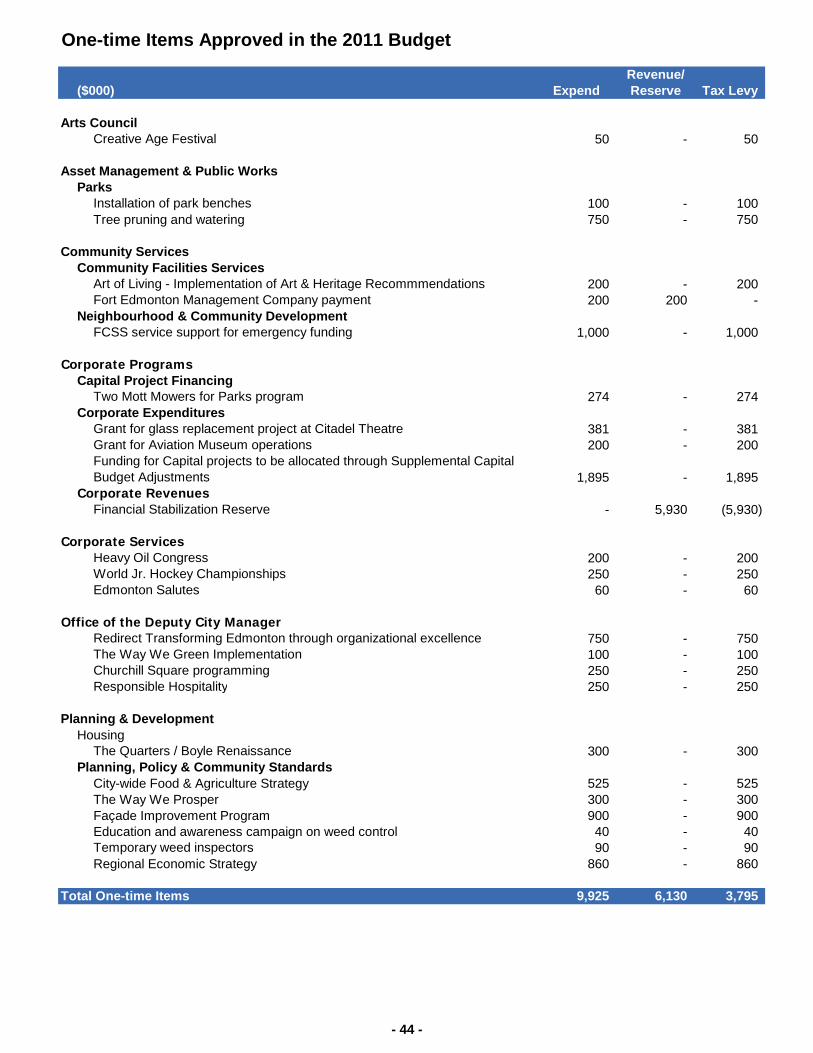
One-time Items Approved in the 2011 Budget
Revenue/($000) Expend Reserve Tax Levy
Arts CouncilCreative Age Festival 50 - 50
Asset Management & Public WorksParks
Installation of park benches 100 - 100 Tree pruning and watering 750 - 750
Community ServicesCommunity Facilities Services
Art of Living - Implementation of Art & Heritage Recommmendations 200 - 200 Fort Edmonton Management Company payment 200 200 -
Neighbourhood & Community DevelopmentFCSS service support for emergency funding 1,000 - 1,000
Corporate ProgramsCapital Project Financing
Two Mott Mowers for Parks program 274 - 274 Corporate Expenditures
Grant for glass replacement project at Citadel Theatre 381 - 381 Grant for Aviation Museum operations 200 - 200 Funding for Capital projects to be allocated through Supplemental Capital Budget Adjustments 1,895 - 1,895
Corporate RevenuesFinancial Stabilization Reserve - 5,930 (5,930)
Corporate ServicesHeavy Oil Congress 200 - 200 World Jr. Hockey Championships 250 - 250 Edmonton Salutes 60 - 60
Office of the Deputy City ManagerRedirect Transforming Edmonton through organizational excellence 750 - 750 The Way We Green Implementation 100 - 100 Churchill Square programming 250 - 250 Responsible Hospitality 250 - 250
Planning & DevelopmentHousing
The Quarters / Boyle Renaissance 300 - 300 Planning, Policy & Community Standards
City-wide Food & Agriculture Strategy 525 - 525 The Way We Prosper 300 - 300 Façade Improvement Program 900 - 900 Education and awareness campaign on weed control 40 - 40 Temporary weed inspectors 90 - 90 Regional Economic Strategy 860 - 860
Total One-time Items 9,925 6,130 3,795
- 44 -

Amortization and Contributed Assets
2009 2010 2011 2010 2011($000) Actual Budget Budget Budget Budget
Boards & CommissionsPolice Service 8,443 9,203 10,360 - - Public Library 9,135 9,668 11,285 - -
Civic ProgramsAsset Management & Public Works
Corporate Properties 15,360 19,742 26,109 - - Parks 11,993 12,208 13,416 84 4,200
Community ServicesCommunity Facility Services 3,049 3,063 2,722 - - Fire Rescue Services 1,553 1,295 1,176 - - Neighbourhood & Community Development - 234 314 - -
Corporate Services 19,937 21,432 20,969 - - Finance & Treasury 279 234 189 - - Mayor and Councillor Offices 9 8 6 - - Office of the City Auditor 11 9 8 - - Office of the City Manager 15 13 10 - - Planning & Development
Housing 669 669 669 - - Planning, Policy & Community Standards 310 260 209 - -
TransportationPublic Transit 18,215 39,569 50,120 - - Transportation Systems 126,403 203,293 221,419 2,316 115,806
Total 215,381 320,900 358,981 2,400 120,006
Amortization Contributed Assets
Notes:
The 2011 non-cash budget for amortization and contributed assets is summarized in the table above.
The amortization and contributed assets budget is a non-cash budget and is administrative in nature. This budget is necessary to comply with legislative requirements and does not impact tax-levy requirements.
- 45 -

Nei
ghbo
urho
odR
enew
al

Building Great Neighbourhoods Works
BACKGROUND Almost all municipalities across Canada face a large infrastructure deficit due to inadequate sustained fund-ing for renewal work. Edmonton is no different. Neighbourhood renewal occurred sporadically with funding from other orders of government, yet it failed to address the full life-cycle requirements of preventative maintenance, rehabilitation, and reconstruction. Over time, the condition of roads, sidewalks and sewers de-teriorated, resulting in more frequent collapsed sewers, increased sidewalk trip hazards, and dramatically in-creased maintenance needs like pothole repairs.
The Office of Infrastructure and Funding Strategy high-lighted the need for ongoing funding for neighbourhood infrastructure to overcome an anticipated $2.2 billion1 funding gap in neighbourhood roads and related infra-structure.
CITY OF EDMONTON APPROACH
Edmonton has three main funding programs for infra-structure support in local neighbourhoods.
1) City Council established a Neighbourhood Renewal Program, first by allocating funds from Provincial fund-ing programs (AMIP and MSI), and secondly by the establishment of a funding pool developed from a dedi-cated tax levy from 2009 to 2011. This secondary source of ongoing funding is required because long-term funding commitments from other orders of gov-ernment are inconsistent.
2) As part of the City’s ongoing investment in the physical and social infrastructure of Edmonton neighbourhoods, Edmonton City Council approved the Great Neighbourhoods Capital Program, a 10-year $150 million capital budget. These funds (approximately $30 to $50 million in 2010-2011 and funded through tax-supported debt) are invested in addition to the core Neighbourhood Renewal invest-ments in each of the selected neighbourhood renewal locations.
Once areas are identified for Neighbourhood Renewal, the Office of Great Neighbourhoods takes on a corpo-rate coordination role providing one voice to citizens on behalf of all departments involved. Work continues with the residents to identify investments that move neighbourhoods closer to the vision for that commu-nity. These are usually unique to the neighbourhood and fall outside of the scope of the Neighbourhood Renewal Program. These additional investments in-clude infrastructure such as paving pathways that im-prove access to neighbourhood parks or community league buildings, adding pathways to neighbourhood parks and creating sidewalks to further connect people in the neighbourhood.
3) A Drainage Renewal Program also supports neighbourhood infrastructure rehabilitation. With the approval of the Neighbourhood Renewal Program to augment above-ground renewal, Asset Management and Public Works must deliver a proportionate in-crease in the corresponding investment in under-ground infrastructure. The three components of Drain-age Renewal are a) coordinating with the Neighbour-hood Renewal work on roads and sidewalks, b) re-newal work in coordination with other franchised utili-ties such as ATCO gas, and c) work where sewers are the only infrastructure in need of immediate renewal.
¹ City of Edmonton. 2008-2017 Preliminary 10 Year Capital Investment Agenda.
- 46 -

Building Great Neighbourhoods Works
Yr 1 Yr 2 Yr 3 Yr 4
CCTV
Drainage Construction
Transportation Reconstruction
COORDINATED NEIGHBOUR-HOOD INVESTMENT
Asset Management and Public Works (Drainage Ser-vices), Transportation, Community Services (Office of Great Neighbourhoods) and Planning and Develop-ment are integrating and aligning the planning and im-plementation of the City’s investments in neighbour-hood improvement. City staff also work with the com-munity to identify neighbourhood-specific needs. This meets City Council’s 10-year strategic goal of improv-ing Edmonton’s livability and transforming Edmonton’s urban form.
It is essential to the effectiveness of the Neighbour-hood Renewal Program that the renewal of under-ground infrastructure (storm and sanitary sewers) be integrated into the planning and funding of the above ground infrastructure (roads, sidewalks, streetlights, etc.) To this end, Drainage Services is working closely with the Transportation Department in the ad-ministration of the program.
Coordination between Drainage Services and Trans-portation under the Neighbourhood Renewal Program means that for neighbourhoods that are targeted for reconstruction, Drainage Services goes into those neighbourhoods first. Drainage completes CCTV in-spection of the sewers, and then starts renewal work (generally using a re-lining method) ahead of the scheduled roadway reconstruction work. This drain-age work will often start 2 years prior to the road work, and finish in the same year the road work be-gins. This timing sequence is shown in the following chart.
GREAT NEIGHBOURHOODS CAPITAL PROGRAM UPDATE
Scope and Funding Sources
The 2009 – 2011 Great Neighbourhoods Capital Pro-gram allocates $15 million per year of funding in three areas:
a) Revitalization (e.g. Alberta Avenue),
b) Coordinated Neighbourhood Redevelopment and Improvements (addressing priorities that fall out-side of the Neighbourhood Renewal Program), and
c) Neighbourhood Business Development (supporting rehabilitation related to business and commercial opportunities locally).
2011 Program (In Progress)
• Alberta Avenue Revitalization Initiative - Comple-tion of Phase 3 (92 St to 97 St) and construction commencing on phase 4 (78 St. to 83 St.) which includes streetscape and arterial road improve-ments. Also part of the revitalization work is ad-dressing building code deficiencies with the for-mer Alberta Cycle Building.
• Construction to commence on 108 Street (Capital Boulevard) from 99 Avenue to Jasper Avenue and 99 Ave from 107 St to 109 St.
• Capital Investments are also being constructed in neighbourhoods undergoing programs such as Neighbourhood Renewal in the following neighbourhoods: Belvedere, Fulton Place, Mead-owlark Park, Park Allen, Sherbrooke and Strath-cona.
• McCauley Revitalization Strategy - Urban Design, which focuses on creating valuable and vibrant public spaces. This involves engaging the com-munity and the Business Revitalization Zone to create detailed designs for public realm enhance-ments that will maximize the viability of McCauley
Typical Timing of Neighbourhood Renewal Activities
- 47 -

Building Great Neighbourhoods Works
by providing the necessary infrastructure to grow residential and commercial investments in this community.
• Jasper Place Revitalization Strategy – In 2011, complete the following for the Stony Plain Road Corridor:
• Urban Design Vision - update for the area from 149 Street to 170 Street, bounded by 100 Avenue to the south and 102 Avenue to the north;
• Statutory Plan - with accompanying zoning changes for the Stony Plain Road Corridor.
• Streetscape Improvement Plan - including concept plan, preliminary plan and detailed design drawings. Construction to commence in 2012.
NEIGHBOURHOOD RENEWAL PROGRAM UPDATE
Scope and Funding Sources
Coordinated by the Transportation Department, the Neighbourhood Renewal Program delivers a cost-effective, long-term strategic approach to renew and rebuild Edmonton’s roads, sidewalks, and streetlights in existing neighbourhoods and collector roadways throughout Edmonton. The Neighbourhood Renewal Program balances the immediate need to rebuild some neighbourhoods with an ongoing need to provide pre-ventative maintenance and rehabilitation supporting long-term asset management. Neighbourhood renewal work includes:
• Microsurfacing (road sealant application)
• Neighbourhood Overlay (including removal of sidewalk trip hazards)
• Neighbourhood Reconstruction (replacement of road, curb and gutter, sidewalk and street light-ing)
• Collector Renewal (with priority on bus routes)
• Northeast road reconstruction (replacement of road with special drainage enhancement, selec-tive concrete repair due to soft subgrade condi-tions that exist in the area)
By effectively combining reconstruction, rehabilitation, and preventative maintenance, all Edmonton neighbourhoods can receive improvements within 30 years, whereas a total reconstruction only program would take many more years to complete, at a signifi-cantly higher cost.
The 2009 – 2011 Capital Budget includes the ap-proval for additional neighbourhood work in 2011. The department funds its contribution towards the Neighbourhood Renewal Program from a number of funding sources: the dedicated tax levy, grants (AMIP and MSI), local improvement fees, and General Capi-tal Financing.
The pie charts depicted in Appendix 1 outline the growth of the overall funding for neighbourhood re-newal from 2009 through 2011 budgets and the share of the funding contributed by the tax levy source.
2010 Program
The 2010 program is depicted in Appendix 2 and in-cludes the following neighbourhood renewal projects:
• 6 reconstruction neighbourhoods
• 10 overlay/sidewalk trip hazard repair neighbour-hoods
• 7 microsurfacing neighbourhoods
• Approximately 28 kilometres (of mainly collector) renewal
• Approximately 1 kilometre of residential roads was reconstructed under the Northeast Soft Sub-grade Mitigation project
- 48 -
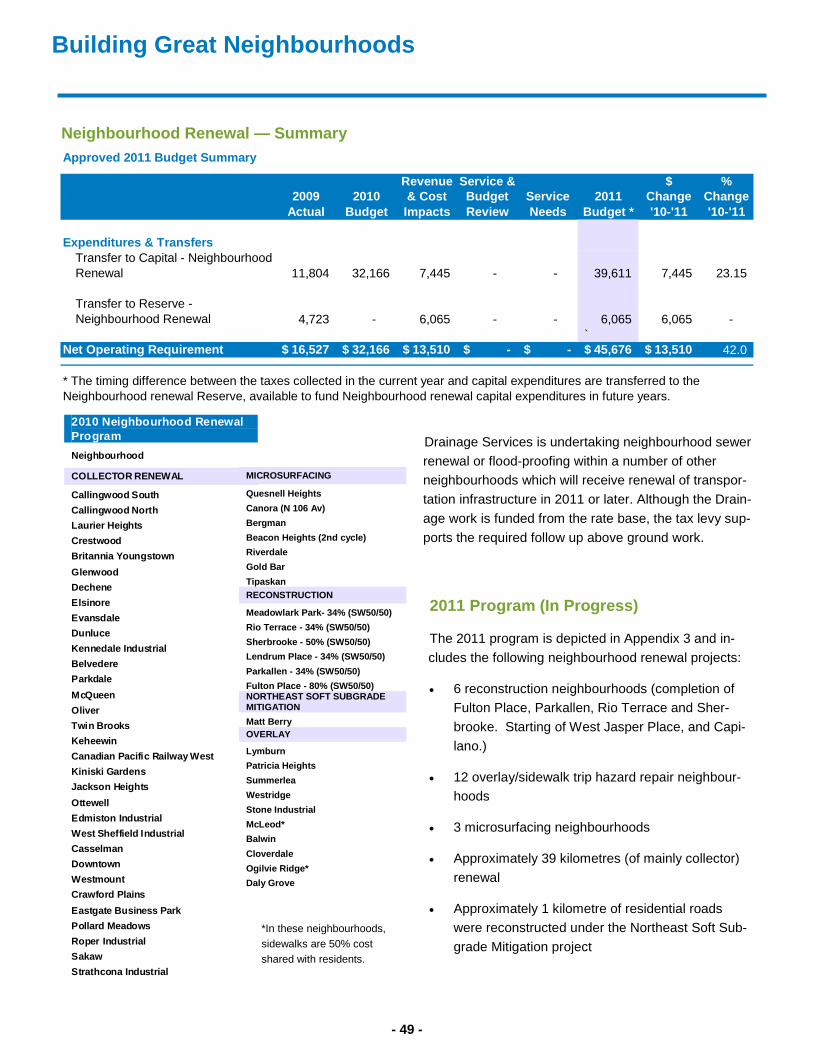
Building Great Neighbourhoods Works
Drainage Services is undertaking neighbourhood sewer renewal or flood-proofing within a number of other neighbourhoods which will receive renewal of transpor-tation infrastructure in 2011 or later. Although the Drain-age work is funded from the rate base, the tax levy sup-ports the required follow up above ground work.
2011 Program (In Progress)
The 2011 program is depicted in Appendix 3 and in-cludes the following neighbourhood renewal projects:
• 6 reconstruction neighbourhoods (completion of Fulton Place, Parkallen, Rio Terrace and Sher-brooke. Starting of West Jasper Place, and Capi-lano.)
• 12 overlay/sidewalk trip hazard repair neighbour-hoods
• 3 microsurfacing neighbourhoods
• Approximately 39 kilometres (of mainly collector) renewal
• Approximately 1 kilometre of residential roads were reconstructed under the Northeast Soft Sub-grade Mitigation project
Neighbourhood Renewal — Summary
*In these neighbourhoods, sidewalks are 50% cost shared with residents.
2010 Neighbourhood Renewal Program Neighbourhood
COLLECTOR RENEWAL
Callingwood South Callingwood North Laurier Heights Crestwood Britannia Youngstown Glenwood Dechene Elsinore Evansdale Dunluce Kennedale Industrial Belvedere Parkdale McQueen Oliver Twin Brooks Keheewin Canadian Pacific Railway West Kiniski Gardens Jackson Heights Ottewell Edmiston Industrial West Sheffield Industrial Casselman Downtown Westmount Crawford Plains Eastgate Business Park Pollard Meadows Roper Industrial Sakaw Strathcona Industrial
Approved 2011 Budget Summary
Revenue Service & $ %2009 2010 & Cost Budget Service 2011 Change Change
Actual Budget Impacts Review Needs Budget * '10-'11 '10-'11
Expenditures & TransfersTransfer to Capital - Neighbourhood Renewal 11,804 32,166 7,445 - - 39,611 7,445 23.15
Transfer to Reserve - Neighbourhood Renewal 4,723 - 6,065 - - 6,065 6,065 -
`Net Operating Requirement 16,527$ 32,166$ 13,510$ -$ -$ 45,676$ 13,510$ 42.0
* The timing difference between the taxes collected in the current year and capital expenditures are transferred to the Neighbourhood renewal Reserve, available to fund Neighbourhood renewal capital expenditures in future years.
MICROSURFACING
Quesnell Heights Canora (N 106 Av) Bergman Beacon Heights (2nd cycle) Riverdale Gold Bar Tipaskan RECONSTRUCTION
Meadowlark Park- 34% (SW50/50) Rio Terrace - 34% (SW50/50) Sherbrooke - 50% (SW50/50) Lendrum Place - 34% (SW50/50) Parkallen - 34% (SW50/50) Fulton Place - 80% (SW50/50) NORTHEAST SOFT SUBGRADE MITIGATION Matt Berry OVERLAY
Lymburn Patricia Heights Summerlea Westridge Stone Industrial McLeod* Balwin Cloverdale Ogilvie Ridge* Daly Grove
- 49 -
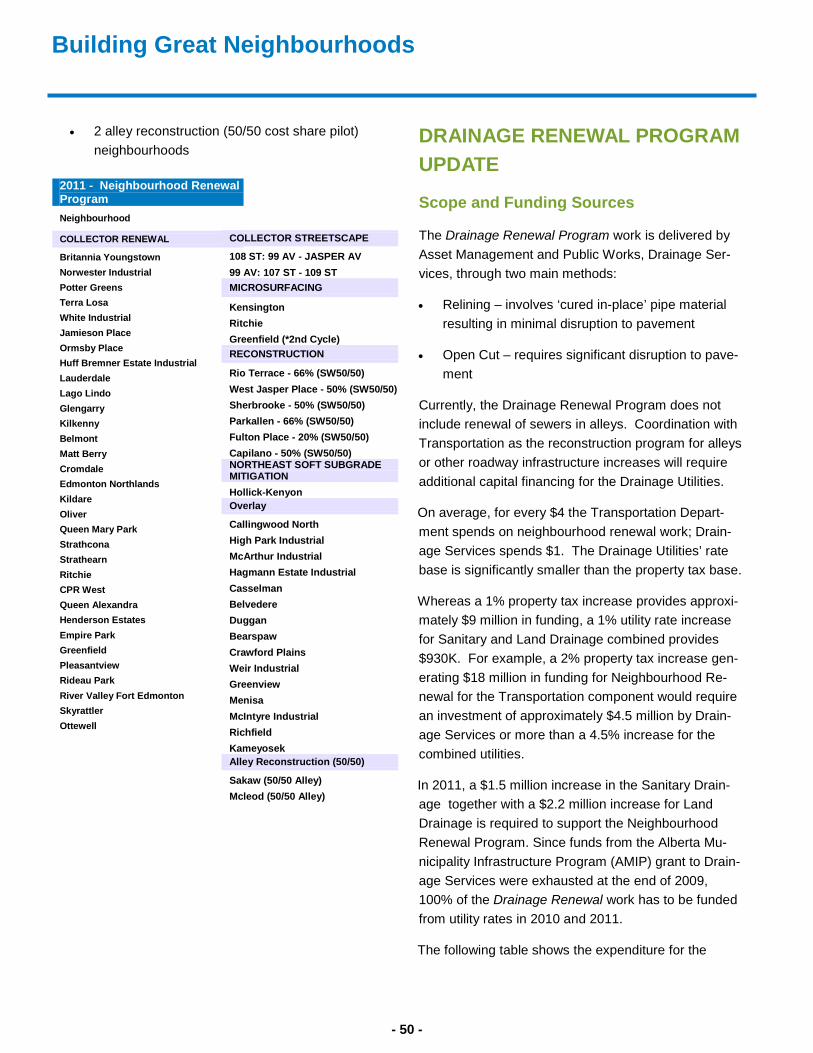
Building Great Neighbourhoods Works
• 2 alley reconstruction (50/50 cost share pilot) neighbourhoods
DRAINAGE RENEWAL PROGRAM UPDATE
Scope and Funding Sources
The Drainage Renewal Program work is delivered by Asset Management and Public Works, Drainage Ser-vices, through two main methods:
• Relining – involves ‘cured in-place’ pipe material resulting in minimal disruption to pavement
• Open Cut – requires significant disruption to pave-ment
Currently, the Drainage Renewal Program does not include renewal of sewers in alleys. Coordination with Transportation as the reconstruction program for alleys or other roadway infrastructure increases will require additional capital financing for the Drainage Utilities.
On average, for every $4 the Transportation Depart-ment spends on neighbourhood renewal work; Drain-age Services spends $1. The Drainage Utilities’ rate base is significantly smaller than the property tax base.
Whereas a 1% property tax increase provides approxi-mately $9 million in funding, a 1% utility rate increase for Sanitary and Land Drainage combined provides $930K. For example, a 2% property tax increase gen-erating $18 million in funding for Neighbourhood Re-newal for the Transportation component would require an investment of approximately $4.5 million by Drain-age Services or more than a 4.5% increase for the combined utilities.
In 2011, a $1.5 million increase in the Sanitary Drain-age together with a $2.2 million increase for Land Drainage is required to support the Neighbourhood Renewal Program. Since funds from the Alberta Mu-nicipality Infrastructure Program (AMIP) grant to Drain-age Services were exhausted at the end of 2009, 100% of the Drainage Renewal work has to be funded from utility rates in 2010 and 2011.
The following table shows the expenditure for the
2011 - Neighbourhood Renewal Program Neighbourhood
COLLECTOR RENEWAL
Britannia Youngstown Norwester Industrial Potter Greens Terra Losa White Industrial Jamieson Place Ormsby Place Huff Bremner Estate Industrial Lauderdale Lago Lindo Glengarry Kilkenny Belmont Matt Berry Cromdale Edmonton Northlands Kildare Oliver Queen Mary Park Strathcona Strathearn Ritchie CPR West Queen Alexandra Henderson Estates Empire Park Greenfield Pleasantview Rideau Park River Valley Fort Edmonton Skyrattler Ottewell
COLLECTOR STREETSCAPE
108 ST: 99 AV - JASPER AV 99 AV: 107 ST - 109 ST MICROSURFACING
Kensington Ritchie Greenfield (*2nd Cycle) RECONSTRUCTION
Rio Terrace - 66% (SW50/50) West Jasper Place - 50% (SW50/50)Sherbrooke - 50% (SW50/50) Parkallen - 66% (SW50/50) Fulton Place - 20% (SW50/50) Capilano - 50% (SW50/50) NORTHEAST SOFT SUBGRADE MITIGATION Hollick-Kenyon Overlay
Callingwood North High Park Industrial McArthur Industrial Hagmann Estate Industrial Casselman Belvedere Duggan Bearspaw Crawford Plains Weir Industrial Greenview Menisa McIntyre Industrial Richfield Kameyosek Alley Reconstruction (50/50)
Sakaw (50/50 Alley) Mcleod (50/50 Alley)
- 50 -
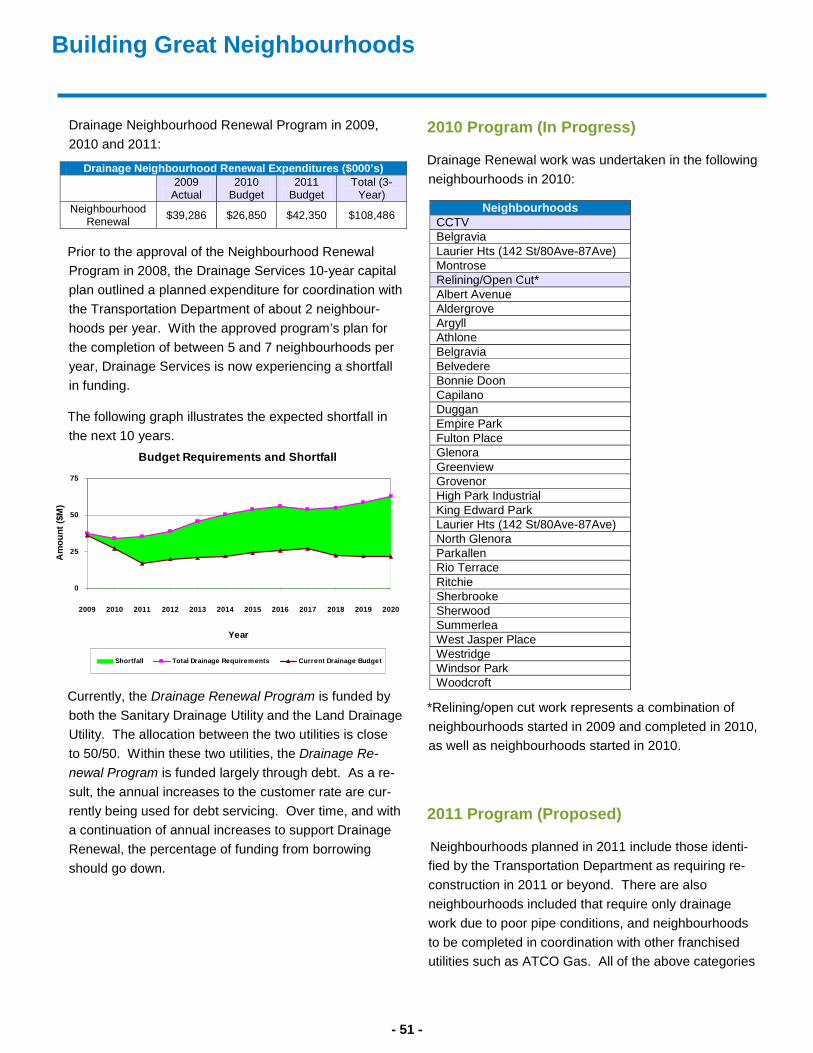
Building Great Neighbourhoods Works
Drainage Neighbourhood Renewal Program in 2009, 2010 and 2011:
Prior to the approval of the Neighbourhood Renewal Program in 2008, the Drainage Services 10-year capital plan outlined a planned expenditure for coordination with the Transportation Department of about 2 neighbour-hoods per year. With the approved program’s plan for the completion of between 5 and 7 neighbourhoods per year, Drainage Services is now experiencing a shortfall in funding.
The following graph illustrates the expected shortfall in the next 10 years.
Currently, the Drainage Renewal Program is funded by both the Sanitary Drainage Utility and the Land Drainage Utility. The allocation between the two utilities is close to 50/50. Within these two utilities, the Drainage Re-newal Program is funded largely through debt. As a re-sult, the annual increases to the customer rate are cur-rently being used for debt servicing. Over time, and with a continuation of annual increases to support Drainage Renewal, the percentage of funding from borrowing should go down.
2010 Program (In Progress)
Drainage Renewal work was undertaken in the following neighbourhoods in 2010:
*Relining/open cut work represents a combination of neighbourhoods started in 2009 and completed in 2010, as well as neighbourhoods started in 2010.
2011 Program (Proposed)
Neighbourhoods planned in 2011 include those identi-fied by the Transportation Department as requiring re-construction in 2011 or beyond. There are also neighbourhoods included that require only drainage work due to poor pipe conditions, and neighbourhoods to be completed in coordination with other franchised utilities such as ATCO Gas. All of the above categories
Budget Requirements and Shortfall
0
25
50
75
2009 2010 2011 2012 2013 2014 2015 2016 2017 2018 2019 2020
Year
Am
ount
($M
)
Shortfall Total Drainage Requirements Current Drainage Budget
Drainage Neighbourhood Renewal Expenditures ($000’s)
2009 Actual
2010 Budget
2011 Budget
Total (3-Year)
Neighbourhood Renewal $39,286 $26,850 $42,350 $108,486 Neighbourhoods
CCTV Belgravia Laurier Hts (142 St/80Ave-87Ave) Montrose Relining/Open Cut* Albert Avenue Aldergrove Argyll Athlone Belgravia Belvedere Bonnie Doon Capilano Duggan Empire Park Fulton Place Glenora Greenview Grovenor High Park Industrial King Edward Park Laurier Hts (142 St/80Ave-87Ave) North Glenora Parkallen Rio Terrace Ritchie Sherbrooke Sherwood Summerlea West Jasper Place Westridge Windsor Park Woodcroft
- 51 -
Building Great Neighbourhoods Works
of neighbourhoods are shown on the map in Appendix 4. There are also several neighbourhoods that began con-struction in 2009 or 2010 that will be carried forward to and completed in 2011. These neighbourhoods are Ar-gyll, Alberta Avenue, Aldergrove, Athlone, Belgravia, Belvedere, Bonnie Doon, Duggan, Empire Park, Glenora, Greenview, High Park Industrial, Laurier Heights (142 St/80Ave-87Ave), North Glenora, Park Al-len, Ritchie, Sherwood, Summerlea, Westridge and Win-dsor Park.
SUMMARY The property tax dedicated to the Neighbourhood Re-newal Program as a strategy to address infrastructure renewal in neighbourhoods will continue into 2011 and be reviewed and re-evaluated for the subsequent 3-Year Capital Budget (2012 to 2014). The Great Neighbour-hood Capital Program is a ten-year program that will provide approximately $45 million in funding for the 2012 to 2014 capital budget. A pre-determined, consistent and predictable dedicated tax provides significant bene-fits to the citizens and the City as part of a long-term sustainable financial strategy to address neighbourhood priorities.
As identified in the 2011 Approved Drainage Utilities budgets, an increase of $1.5 million for the Sanitary Util-ity and $2.2 million for the Land Drainage Utility is re-quired to match the Neighbourhood Renewal Program. Increases in utility rates beyond 2011 to align with the dedicated tax for the Neighbourhood Renewal Program work will be identified in future Drainage Utilities Budget Submissions.
The dedicated property tax levy for Transportation Neighbourhood Renewal with corresponding proportion-ate increases to fund Drainage Renewal can provide a consistent predictable and stable long term flow of reve-nue for investment in Edmonton neighbourhood infra-structure if continued for a number of years. This in turn creates accountability and transparency.
- 52 -

Building Great Neighbourhoods Works
Appendix 1 Funding Sources 2009 – 2011 Transportation Capital Budget
Funding Sources Proposed 2012 Transportation Capital Budget
2009 Funding by Source
09-66-1055 LI, $4,199 , 9%
09-66-1055 General Financing, $3,809 , 8%
09-66-1056 NRP Tax Levy, $11,804 , 25%
09-66-1055 MSI, $17,664 , 36%
09-66-1055 AMIP, $10,555 , 22%
2009 Where the Budget was spent ($000s)
Neighbourhood Renew al Program (Tax Levy),
$11,804 , 25%
Neighbourhood Renew al Program (Other), $36,227
, 75%
2011 Where the Budget will be spent ($000s)
Neighbourhood Renew al Program (Tax Levy),
$47,337 , 30%
Neighbourhood Renew al Program (Other), $109,181 , 70%
2011 Funding by Source
09-66-1056 LI, $5,160 , 3%
09-66-1055 General Financing, $4,736 , 3%09-66-1056 NRP Tax
Levy, $47,337 , 30%
09-66-1056 MSI, $93,012 , 60%
09-66-1056 AMIP, $6,272 , 4%
2012 Where the Budget will be spent ($000s)
Neighbourhood Renew al Program (Tax Levy),
$66,376 , 52%
Neighbourhood Renew al Program (Other), $61,958
, 48%
2012 Funding by Source
09-66-1056 AMIP, $- , 0%
09-66-1056 MSI, $49,115 , 38%
09-66-1056 NRP Tax Levy, $66,376 , 52%
09-66-1055 General Financing, $7,961 , 6%
09-66-1056 LI, $4,882 , 4%
- 53 -

Building Great Neighbourhoods Works
Appendix 2 2010 Neighbourhood Renewal Program – Neighbourhoods and Collector Roads
- 54 -
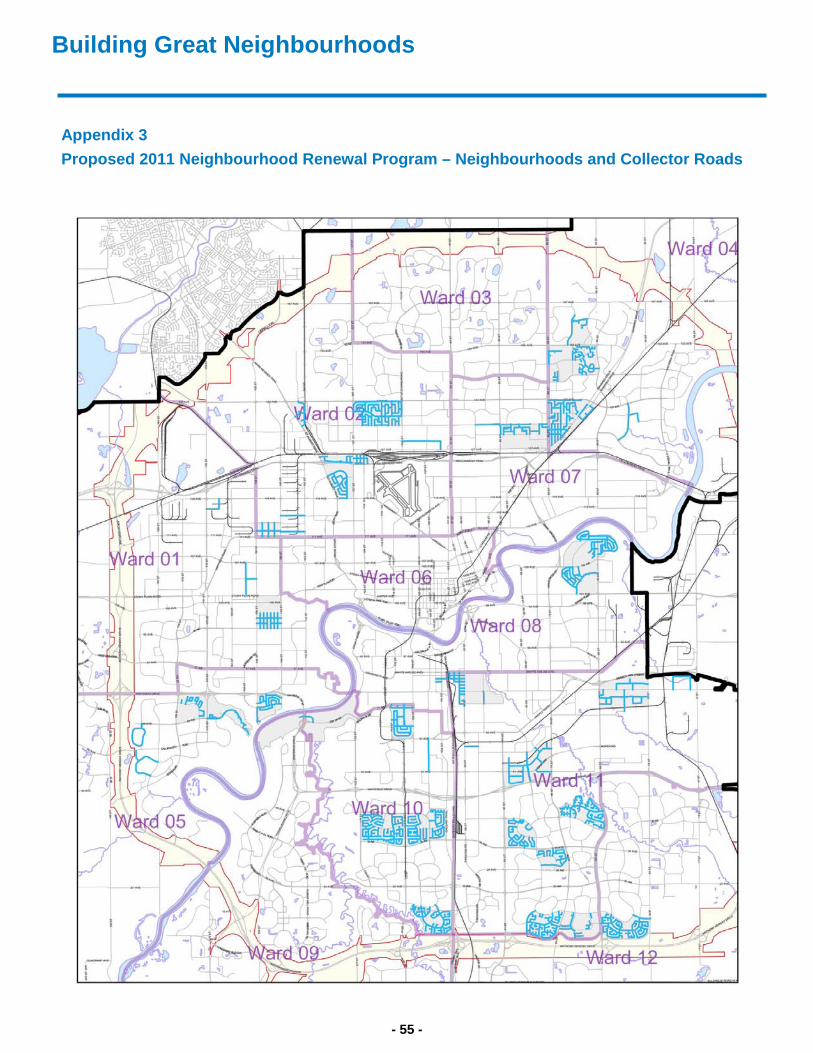
Building Great Neighbourhoods Works
Appendix 3 Proposed 2011 Neighbourhood Renewal Program – Neighbourhoods and Collector Roads
- 55 -
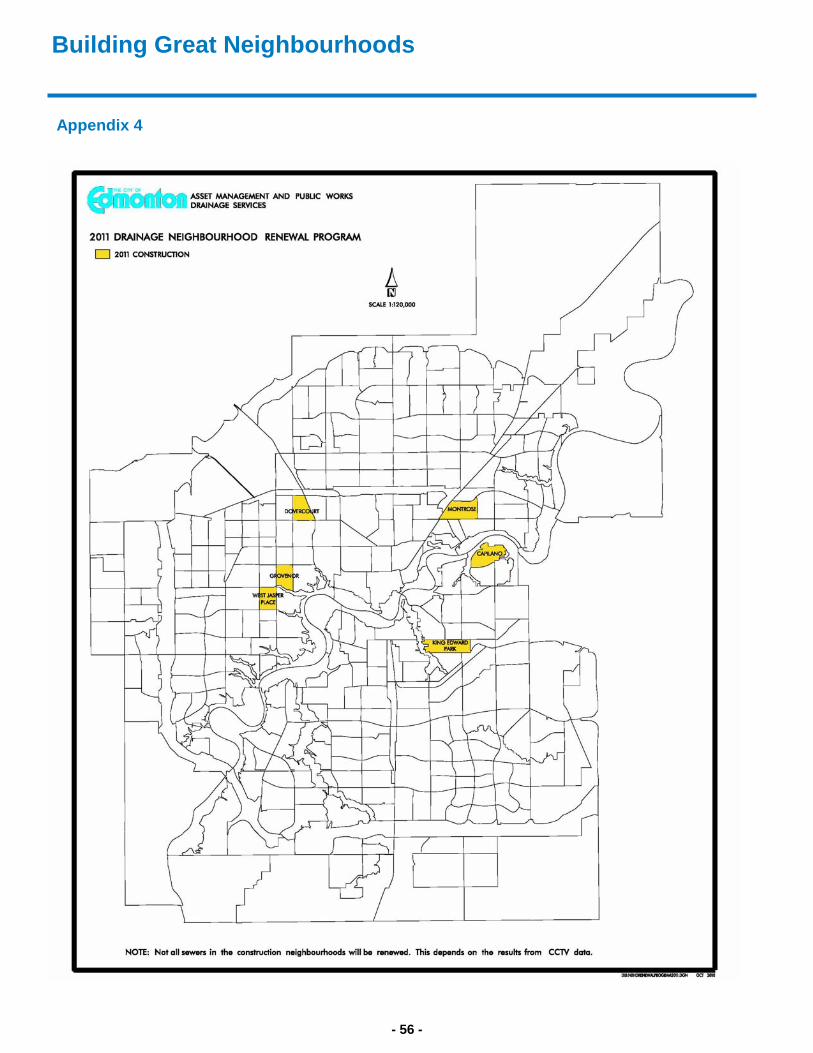
Building Great Neighbourhoods Works
Appendix 4
- 56 -

Supp
lem
enta
ryIn
form
atio
n
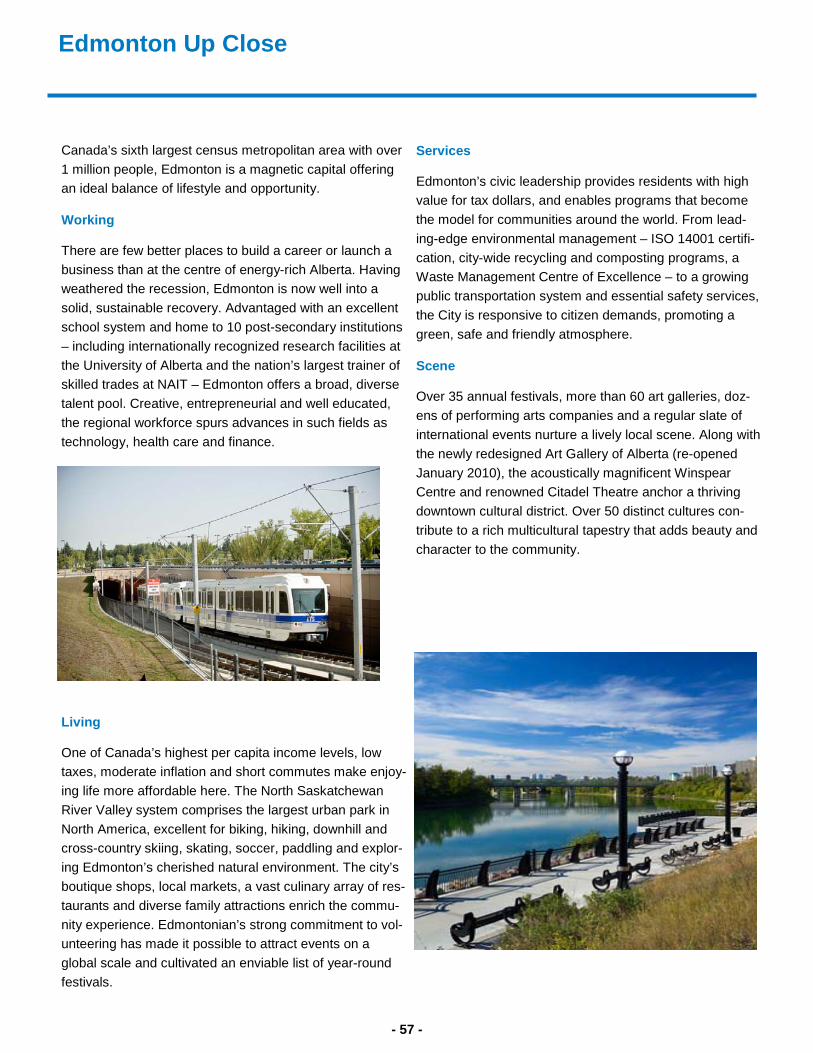
Edmonton Up Close
Canada’s sixth largest census metropolitan area with over 1 million people, Edmonton is a magnetic capital offering an ideal balance of lifestyle and opportunity.
Working
There are few better places to build a career or launch a business than at the centre of energy-rich Alberta. Having weathered the recession, Edmonton is now well into a solid, sustainable recovery. Advantaged with an excellent school system and home to 10 post-secondary institutions – including internationally recognized research facilities at the University of Alberta and the nation’s largest trainer of skilled trades at NAIT – Edmonton offers a broad, diverse talent pool. Creative, entrepreneurial and well educated, the regional workforce spurs advances in such fields as technology, health care and finance.
Living
One of Canada’s highest per capita income levels, low taxes, moderate inflation and short commutes make enjoy-ing life more affordable here. The North Saskatchewan River Valley system comprises the largest urban park in North America, excellent for biking, hiking, downhill and cross-country skiing, skating, soccer, paddling and explor-ing Edmonton’s cherished natural environment. The city’s boutique shops, local markets, a vast culinary array of res-taurants and diverse family attractions enrich the commu-nity experience. Edmontonian’s strong commitment to vol-unteering has made it possible to attract events on a global scale and cultivated an enviable list of year-round festivals.
Services
Edmonton’s civic leadership provides residents with high value for tax dollars, and enables programs that become the model for communities around the world. From lead-ing-edge environmental management – ISO 14001 certifi-cation, city-wide recycling and composting programs, a Waste Management Centre of Excellence – to a growing public transportation system and essential safety services, the City is responsive to citizen demands, promoting a green, safe and friendly atmosphere.
Scene
Over 35 annual festivals, more than 60 art galleries, doz-ens of performing arts companies and a regular slate of international events nurture a lively local scene. Along with the newly redesigned Art Gallery of Alberta (re-opened January 2010), the acoustically magnificent Winspear Centre and renowned Citadel Theatre anchor a thriving downtown cultural district. Over 50 distinct cultures con-tribute to a rich multicultural tapestry that adds beauty and character to the community.
- 57 -

Like the rest of the world, Edmonton has been challenged to make the necessary adjustments to remain prosperous and competitive in the current economic environment. Business fundamentals remain strong and the region’s resilient economy has outpaced Alberta in the speed of its recovery from the events of 2008 and 2009. The Con-ference Board of Canada sees Edmonton’s growth ranking among major Canadian urban centres rising from last place in 2009 to 2nd place by 2011. Edmonton’s census recorded confidence in our city. Census results as of April 1, 2009 showed the city continued to be a choice destina-tion for newcomers, with Edmonton’s population increas-ing by 30,000 between April 1, 2008 and the same time the following year. Many were 25 to 34 year olds, drawn to the opportunities of Edmonton’s diverse economy and quality of life. In 2009, per capita personal income was 20 per cent higher than the Canadian average . The Real Es-tate Investment Network affirmed Edmonton’s potential, proclaiming it the “best place to invest in real estate” in North America.
After a nearly decade-long boom that strained local labour capacity and inflated costs, the recent recession allowed the regional economy to refuel, refocus and get a grip on price escalation. With the region’s GDP predicted to grow at a very healthy and moderate rate of 3.8 per cent in 2011, development will proceed at a sustainable pace as major investment projects are stretched over a longer time horizon.
The regional economy remains a driving force internation-ally, with over $30 billion being invested in major projects planned, underway or scheduled for completion in greater
Edmonton. With oil prices stabilized in the $80 per barrel range, the energy sector is now moving ahead at a meas-ured pace. Strengths in other key sectors including finan-cial services, health care, technology and education will help maintain economic growth at levels above the na-tional average in the coming years.
With responsible fiscal policy, innovative management and a business-friendly ethic, the City of Edmonton re-mains on firm footing with an AA (high) credit rating. This is higher than any other similar-sized city in Canada and matched only by Calgary. Wise investments in major infra-structure projects such as LRT extension, bridge re-development and multi-purpose recreation centres are enhancing the region’s already high standard of living.
In an increasingly competitive, interconnected and often volatile global market, sound fiscal and regulatory prac-tices have shown Canada to be a model to the world. This robust national frame work has served Edmonton’s entre-preneurs and established businesses well. Further, as part of a wealthy western province with abundant resources and low taxes, Edmonton is embedded in the geographic core of Canada’s economic future. Combine these advan-tages with an increasingly diverse, knowledge based economy and a young, highly skilled population, means Edmonton can claim an enviably strong position as one of the world’s great emerging urban centres.
Economic Climate
- 58 -
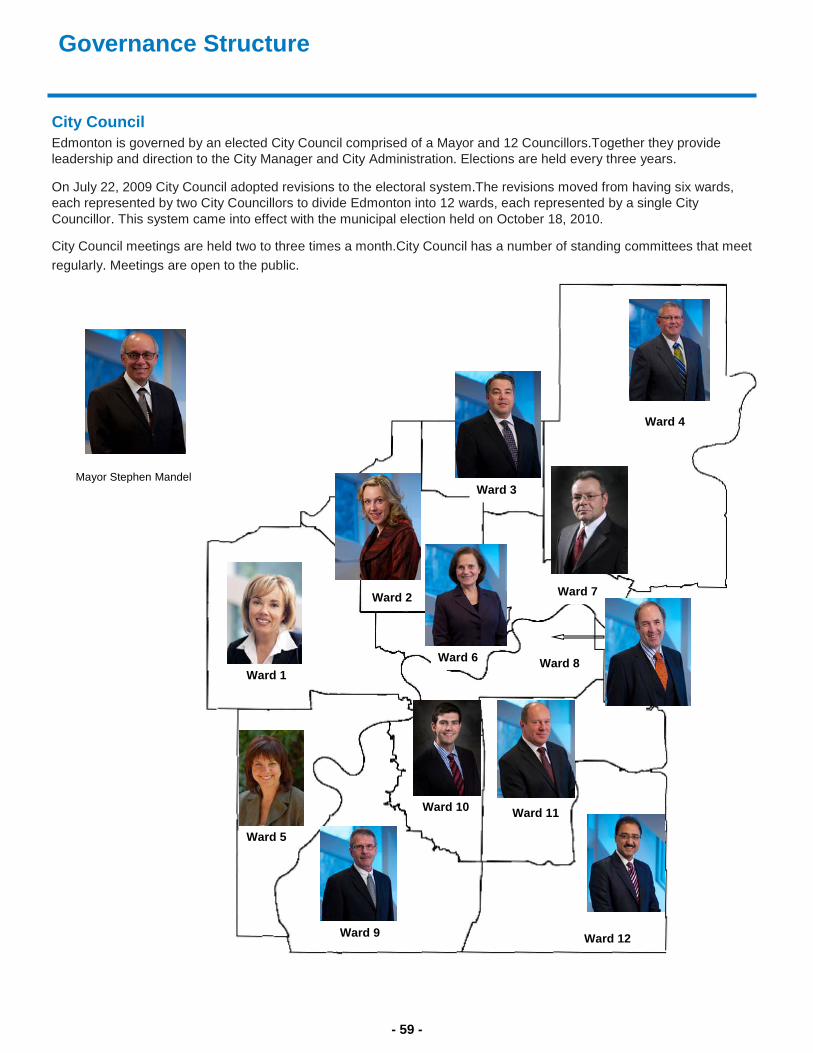
Governance Structure
Ward 1
Ward 2
Ward 3
Ward 4
Ward 5
Ward 6
Ward 7
Ward 8
Ward 9
Ward 10 Ward 11
Ward 12
Mayor Stephen Mandel
City Council Edmonton is governed by an elected City Council comprised of a Mayor and 12 Councillors.Together they provide leadership and direction to the City Manager and City Administration. Elections are held every three years.
On July 22, 2009 City Council adopted revisions to the electoral system.The revisions moved from having six wards, each represented by two City Councillors to divide Edmonton into 12 wards, each represented by a single City Councillor. This system came into effect with the municipal election held on October 18, 2010.
City Council meetings are held two to three times a month.City Council has a number of standing committees that meet regularly. Meetings are open to the public.
- 59 -

In order to deliver services to the citizens of Edmonton, the City of Edmonton is organized into the legislative and administrative structure shown below:
Governance Structure
- 60 -
Basis of Budgeting
OVERIVEW
The City of Edmonton has prepared the 2011 budget on a modified accrual basis however, it is funded on a tax levy basis. The major differences between the basis of budgeting and the basis of accounting are the treatment of amortization, contributed assets and the gain/loss on asset disposals. This means that:
• revenues are accounted for in the period in which the transactions or events occurred that gave rise to the revenues
• government transfers are recognized as revenues in the period in which events giving rise to the transfer occur, providing the transfers are authorized, any eligibility criteria have been met, and reasonable estimates of the amounts can be made
• funds from external parties and earnings thereon restricted by agreement or legislation are accounted for as deferred revenue until used for the purpose specified
• expenses are recognized in the period the goods and services are acquired and a liability is incurred or transfers are due.
This is in accordance with Canadian generally accepted accounting principles for governments as recommended by the Public Sector Accounting Board (PSAB) of the Canadian Institute of Chartered Accountants.
The new financial statement presentation, effective for fiscal years beginning on or after January 1, 2009, re-quires municipalities to adopt the full accrual basis of accounting and record and amortize all tangible capital assets.
A non-cash budget for amortization and contributed as-sets is part of the 2011 budget and is presented under the section called “Tables”.
Tax Levy Supported Operations
Tax Supported Operations includes all operating activi-ties provided through Civic Programs, Boards & Com-missions, and Corporate Programs. These activities are primarily supported by a combination of property taxa-tion, business tax, user fees, return on investment, and grants from other orders of government.
Land Enterprise
Land Enterprise is a self-sustaining operation and is not funded by Tax-supported Operations. The Fund is es-tablished for the purpose of managing the land require-ments of the corporation and to position the City of Ed-monton in a manner that can actively promote develop-ment from the perspectives of sustainability, revitaliza-tion, and urban form. The operations of the Land Enter-prise are governed by City Policy C511- Land Develop-ment Policy. Annual surplus or deficits are added to or reduced from the Land Enterprise Fund Balance.
Fleet Services
Fleet Services (previously Mobile Equipment Services ) also operates as a self-sustaining operation that is not funded directly by property taxes. Fleet Services con-sists of activities associated with integrated fleet man-agement (acquisition, management, maintenance, and salvage) for all vehicles, equipment, transit buses, and emergency units (fire and police) used by the City of Edmonton. In addition, the branch provides these ser-vices to external related parties such as EPCOR Utilities Inc.
Fleet Services generates revenues by charging fixed and variable rates to user departments, many which are tax-supported, for the services provided. The objective of the rates is to ultimately provide full life cycle costing of the City’s fleet and equipment. Fixed fees are trans-ferred to the Fleet Services Replacement Reserve, with any annual surplus remaining in the Fleet Services ac-cumulated surplus.
- 61 -

Basis of Budgeting
Drainage Services
Drainage Services provides for the management of Sanitary Utility and Land Drainage Utility for the residen-tial, commercial, industrial, and institutional customers of Edmonton. The program operates based upon the prin-ciples provided in the regulations of the Alberta Utilities Commission (AUC). Utility rates are established to pro-vide for the operating and capital requirements of the drainage systems. Both Utilities are operated as public utilities under a full cost recovery model without subsidy from Property Taxes. The Sanitary Utility provides a divi-dend to the City of Edmonton based on its prior year's actual net income.
The operations of the Utilities are governed by the City of Edmonton’s Utility Fiscal Policy (C304B).
Waste Management Services
The Waste Management Utility was established under a public utility model in January 2009. Major services (collection, processing and disposal) are delivered as a fully integrated waste management system. Funding for the services is moving towards the principles provided in the regulations of the Alberta Utilities Commission (AUC). The 2011 utility rates do not currently include a return on rate base, and the full Shared Services and Corporate Overhead costs are being phased-in over 2011-2014. Aside from Shared Services, the Waste Management Utility operates without subsidy from Prop-erty Tax.
The operations of Waste Management Utility are gov-erned by the Waste Management Strategic Plan and the Waste Management Policy (C527).
Ed Tel Endowment Fund
The Ed Tel Endowment Fund was established to man-age the proceeds from the sale of the municipal tele-
phone utility in 1995. Earnings from the Fund are ap-plied to support municipal operations. The Fund is gov-erned by City Bylaw #11713.
Reserves
The reserve balances give the City of Edmonton finan-cial sustainability and the flexibility to address emerging items. Reserve funds are governed by City Policy C217B which states that the establishment and transfers to and from these accounts require Council approval through the Budget. Accordingly, tables showing the approved transfers for each individual Reserve are pro-vided following this section. Brief explanations of the purpose of the individual reserves are also included.
Debt
The MGA provides limits for debt and debt service costs within a Regulation under section 271. Within that legis-lative framework, the City further manages its debt un-der principles and more conservative limits established within the Debt Management Fiscal Policy (DMFP). The policy is intended to support the City’s long-term capital plans and strategies, while maintaining long-term finan-cial affordability, flexibility and sustainability. The policy also provides for approval of multi-year debt guidelines with a corresponding debt repayment funding strategy, and added flexibility for the use of freed up debt servic-ing funding once debt is retired.
Reporting Entity
The City of Edmonton is organized into various business areas, each responsible for managing the delivery of program services in accordance with the resources allo-cated to those programs. The City utilizes a shared ser-vices model for finance and treasury services. All busi-ness areas reporting to the City Manager share a com-mon accounting and reporting system, and financial and accounting services are administered within Finance &
- 62 -

Basis of Budgeting
Treasury and delivered to each business area based on their needs.
The Edmonton Public Library Board, Edmonton Police Services, Non-Profit Housing, and Vehicle for Hire Com-mission utilize the common accounting system but re-port through their Board or Commission. EPCOR and Edmonton Economic Development Corporation each have independent accounting systems and report through their respective Boards.
FINANCIAL REPORTING
Accounting and Reporting Changes
Effective for fiscal years beginning on or after January 1, 2009, the City of Edmonton has implemented PSAB 1200 Financial Statement Presentation and 3150 Tan-gible Capital Assets. Section 1200 establishes general reporting principles and standards for the disclosure of information in government financial statements. PSAB 3150 requires governments to record and amortize their tangible capital assets in their financial state-ments.
This change has been applied retroactively and prior periods have been restated. The intention of the re-porting changes is to provide a more complete view of the City’s financial condition and support a more com-prehensive set of financial indicators.
Differences between the basis used for budgetary pur-poses and financial reporting requirements are de-scribed below:
The Edmonton Police Commission
The Edmonton Police Commission is committed to making Edmonton a safe and vibrant city and includes seven citizens, appointed by City Coun-cil, and two City Councillors. The Police Commis-sion oversees the Edmonton Police Service, in-cluding allocating funds provided in its annual op-erating budget to maximize the Police Service’s
community-based approach to enhancing safety and combating crime.
For budget purposes, the Edmonton Police Ser-vice (EPS) operations are provided to Council for information with the amount requested from the City of Edmonton shown as net operating require-ment. City Council approves the total EPS budget – expenses, revenues, and net operating require-ment.
For financial reporting purposes, the EPS’s revenues, expenses, assets and liabilities are consolidated with the City of Edmonton’s financial statements consistent with any other tax-supported operation. Inter-organizational transac-tions are eliminated.
The Edmonton Public Library
The Edmonton Public Library operates under the au-thority of the Libraries Act of Alberta. The operations are administered by an independent board (The Ed-monton Public Library Board) which reports to Edmon-ton City Council.
For budget purposes, the Library’s operations are pro-vided to Council for information, with the amount re-quested from the City of Edmonton shown as net oper-ating requirement.
For financial reporting purposes, the Library’s reve-nues, expenses, assets, liabilities, and accumulated surplus are consolidated with the City of Edmonton’s financial statements. Inter-organizational transactions are eliminated.
The Edmonton Economic Development Corporation (EEDC)
EEDC is established under Part 9 of the Companies
- 63 -

Act (Alberta) to promote economic development and tourism in the City of Edmonton. In addition, EEDC operates and maintains the Shaw Conference Centre and the Edmonton Research Park. The corporation is wholly owned by the City of Edmonton and its funding, in part, is from an annual grant provided by the City of Edmonton.
For budget purposes, the EEDC’s operations are pro-vided to Council for information, with the amount re-quested from the City of Edmonton shown as net oper-ating requirement.
For financial reporting purposes, the EEDC’s reve-nues, expenses assets, liabilities, and accumulated surplus are consolidated with the City of Edmonton’s financial statements. Inter-organizational transactions are eliminated.
EPCOR Utilities Inc. (EPCOR)
EPCOR Utilities Inc. (EPCOR) is a wholly owned sub-sidiary governed by an independent Board of Direc-tors. Headquartered in Edmonton, EPCOR builds, owns and operates electrical transmission and distri-bution networks, and water and wastewater treatment facilities and infrastructure in Canada. The Gold Bar Wastewater Treatment Facility operation was trans-ferred from the City to EPCOR effective March 31, 2009.
The Board submits its budget directly to City Council and accordingly, its budget is not included in this docu-ment.
For budget purposes, only the amount paid by EP-COR to the City of Edmonton is shown.
For financial reporting purposes, the results of the subsidiary’s operations are reported in the annual fi-nancial statements using the modified equity method of accounting.
The City of Edmonton Non-Profit Housing Corporation
The City of Edmonton Non-Profit Housing Corporation is a wholly owned subsidiary of the City of Edmonton. It was established for the purpose of providing non-profit housing for the citizens of Edmonton, with assis-tance from the Canadian Mortgage Housing Corpora-tion (CMHC) and from the Provincial Ministry of Hous-ing and Urban Affairs.
There is no budgetary impact of the corporation on the City of Edmonton. This is based upon the assumption that the corporation receives continued operating as-sistance from CMHC and Alberta Seniors to achieve a level of operations sufficient to fund future operations.
For financial reporting purposes, the results of the sub-sidiary’s operations are reported in the annual financial statements.
Debt principal repayments are accounted for as ex-penditures for budgetary purposes and as reductions on long-term debt liability for financial reporting pur-poses.
Basis of Budgeting
- 64 -
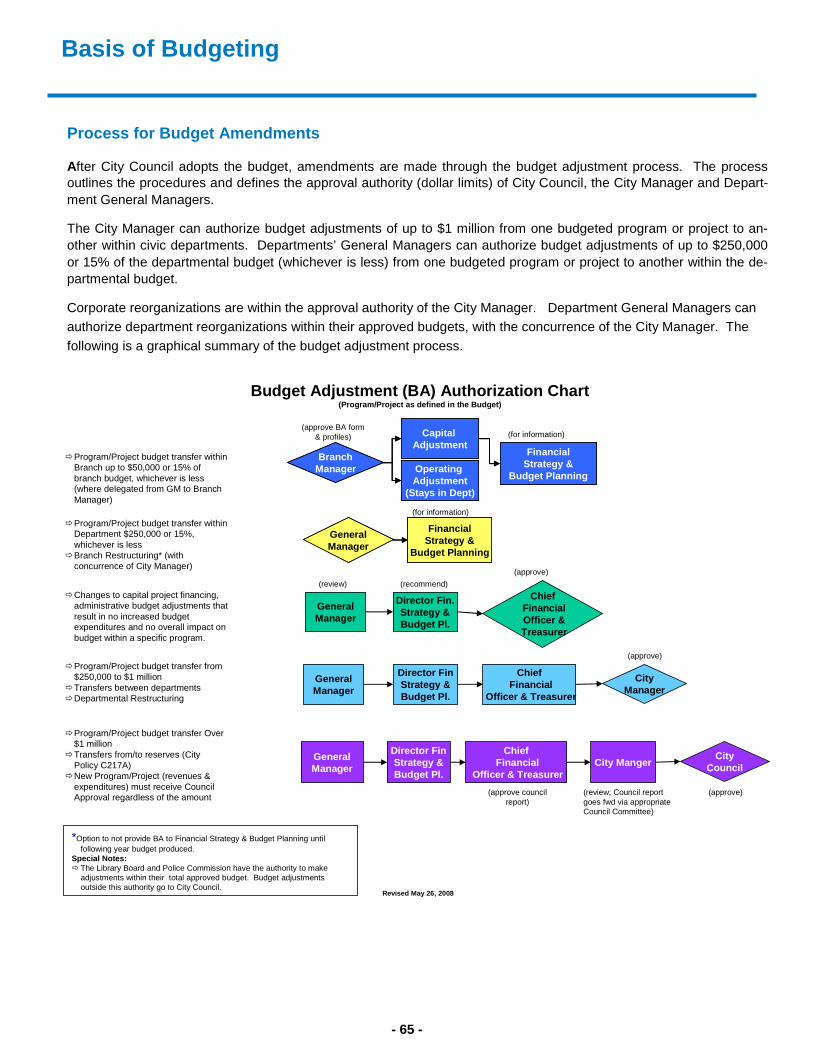
Basis of Budgeting
Process for Budget Amendments
After City Council adopts the budget, amendments are made through the budget adjustment process. The process outlines the procedures and defines the approval authority (dollar limits) of City Council, the City Manager and Depart-ment General Managers.
The City Manager can authorize budget adjustments of up to $1 million from one budgeted program or project to an-other within civic departments. Departments’ General Managers can authorize budget adjustments of up to $250,000 or 15% of the departmental budget (whichever is less) from one budgeted program or project to another within the de-partmental budget.
Corporate reorganizations are within the approval authority of the City Manager. Department General Managers can authorize department reorganizations within their approved budgets, with the concurrence of the City Manager. The following is a graphical summary of the budget adjustment process.
Budget Adjustment (BA) Authorization Chart(Program/Project as defined in the Budget)
Changes to capital project financing, administrative budget adjustments that result in no increased budgetexpenditures and no overall impact on budget within a specific program.
Program/Project budget transfer from $250,000 to $1 millionTransfers between departmentsDepartmental Restructuring
Program/Project budget transfer Over $1 millionTransfers from/to reserves (City Policy C217A)New Program/Project (revenues & expenditures) must receive Council Approval regardless of the amount
Program/Project budget transfer within Department $250,000 or 15%, whichever is lessBranch Restructuring* (with concurrence of City Manager)
*Option to not provide BA to Financial Strategy & Budget Planning until following year budget produced.
Special Notes:The Library Board and Police Commission have the authority to make adjustments within their total approved budget. Budget adjustments outside this authority go to City Council.
(for information)(approve BA form
& profiles)
Revised May 26, 2008
BranchManager
FinancialStrategy &
Budget Planning
Capital Adjustment
Operating Adjustment
(Stays in Dept)
BranchManager
FinancialStrategy &
Budget Planning
Capital Adjustment
Operating Adjustment
(Stays in Dept)
GeneralManager
FinancialStrategy &
Budget Planning
GeneralManager
FinancialStrategy &
Budget Planning
(for information)
GeneralManager
Director Fin.Strategy &Budget Pl.
ChiefFinancialOfficer &Treasurer
(recommend)(approve)
(review)
(review; Council report goes fwd via appropriate Council Committee)
(approve)(approve council report)
GeneralManager
Director FinStrategy &Budget Pl.
CityCouncil
ChiefFinancial
Officer & TreasurerCity Manger
Program/Project budget transfer within Branch up to $50,000 or 15% of branch budget, whichever is less (where delegated from GM to Branch Manager)
(approve)
GeneralManager
Director FinStrategy &Budget Pl.
CityManager
ChiefFinancial
Officer & Treasurer
- 65 -

Reserve Funds
The City of Edmonton maintains reserves designated for specific purposes as ap-proved by City Council and the Edmonton Public Library Board. Effective January 1, 2009, reserve funds will be reported as part of the accumulated surplus on the State-ment of Financial Position. This change is in accordance with section PS-1200 of the CICA Public Sector Accounting Handbook.
The following pages provide details on the Approved changes to each individual reserve. Reserves are listed in alphabetic order.
Approved 2011 Reserves Budget
2010 2011Actual Approved
Opening balance, ($000) 196,506$ 213,932$ Transfer (to) operating budget (43,722) (16,247) Transfer from operating budget 48,631 14,364 Transfer (to) from capital budget (21,603) (12,148) Transfer from surplus 33,895 5,680 Interest 225 250 Net change in reserve balances 17,426 (8,101) Projected ending balance 213,932 205,831$
2010 2011Actual Approved
Opening balance 834$ 1,183$ Transfer (to) operating budget - - Transfer from operating budget 612 536 Transfer (to) from capital budget (270) (480) Interest 7 9 Ending balance 1,183$ 1,248$
Aggregate Site Development
The purpose of the reserve is to cover the costs associated with aggregate site preparation; gravel pit equipment replacement; reclaiming and maintaining lands presently used for material recycling; and to purchase land for future site locations. A surcharge may be assessed on recycled aggregates (gravel, concrete, asphalt, and sand from snow dumpsites) to cover expenditures for replacement of equipment and site preparation. A gravel production surcharge between $3.00—$3.50 per tonne is levied.
2010 2011Actual Approved
Opening balance 4,723$ 2,586$ Transfer (to) operating budget - - Transfer from operating budget 2,586 6,065 Transfer (to) from capital budget (4,723) (4,389) Interest - - Ending balance 2,586$ 4,262$
2% Neighbourhood Renewal
Approved at the March 11, 2009 City Council meeting, the Neighbourhood Renewal Reserve will contain the timing difference between the tax funding dedicated to the Neighbourhood Renewal Program (2% per year in 2009 & 2010 and 1.5% in 2011) as approved through the City Budget process and the amount spent on the program within the year.
2010 2011Actual Approved
Opening balance 14,782$ 14,744$ Transfer (to) operating budget (9,538) (7,885) Transfer from operating budget 9,500 1,750 Transfer (to) from capital budget - - Interest - - Ending balance 14,744$ 8,609$
Affordable Housing
The Housing Reserve was established to assist the Housing branch to deliver affordable housing units as outlined in the Council approved "Road Map" for Cornerstones Plan implementation. Any unspent City funding resulting from the staging of committed projects is transferred to the reserve annually and used to cover the City's portion of future obiligations.
- 66 -

Reserve Funds
2010 2011Actual Approved
Opening balance 2,706$ 1,605$ Transfer (to) operating budget (502) (237)Transfer from operating budget 1,777 301Transfer (to) from capital budget (2,393) (200)Interest 17 3 Ending balance 1,605$ 1,472$
Commonwealth Stadium The City of Edmonton and the Edmonton Eskimos Football Club entered into an agreement to operate the Commonwealth Stadium on an entrepreneurial basis which also established this reserve on May 15, 1995. $750,000 was transferred from Mobile Equipment Services to establish this reserve. Expenditures from this reserve are dedicated to capital improvements and business development investments at Joe Clarke Athletic Grounds. Interest earnings from investment of the reserve balance are applied back to this reserve as they are earned.
2010 2011Actual Approved
Opening balance -$ 6,314$ Transfer (to) operating budget - (250) Transfer from operating budget 6,314 1,250 Transfer (to) from capital budget - - Interest - - Ending balance 6,314$ 7,314$
Current Planning Enterprise ReserveOn June 23, 2010, City Council approved the Current Planning Branch - Revised Business Model Policy C557. This included the establishment of the Current Planning Enterprise Reserve. The new business model will provide enhanced accountability, full cost recovery and a financial reserve. The reserve will be used to provide revenue levelling, stabilize resources across extended periods of time and fund initiatives to enhance planning services.
2010 2011Actual Approved
Opening balance -$ 1,942$ Transfer (to) operating budget - (250) Transfer from operating budget 1,942 - Transfer (to) from capital budget - - Interest - - Ending balance 1,942$ 1,692$
Development Incentive ReserveThe Development Fund Program provides a mechanism by which City Council, upon the recommendation of the Administration, may approve applications for funding in targeted areas (Enterprise Areas) within eligible Business Revitalization Zones. The purpose of the program is to support the revitalization of Main Street Commercial Areas in need of added support. This policy is intended to encourage property owners in these areas to invest in higher density residential and / or retail and commercial development through financial incentives to assist in the revitalization of these areas. The program is structured in the form of grant payments to property owners that are paid once approved projects are completed. Any unspent operating budget funding will be transferred into this reserve until December 31, 2013.
- 67 -
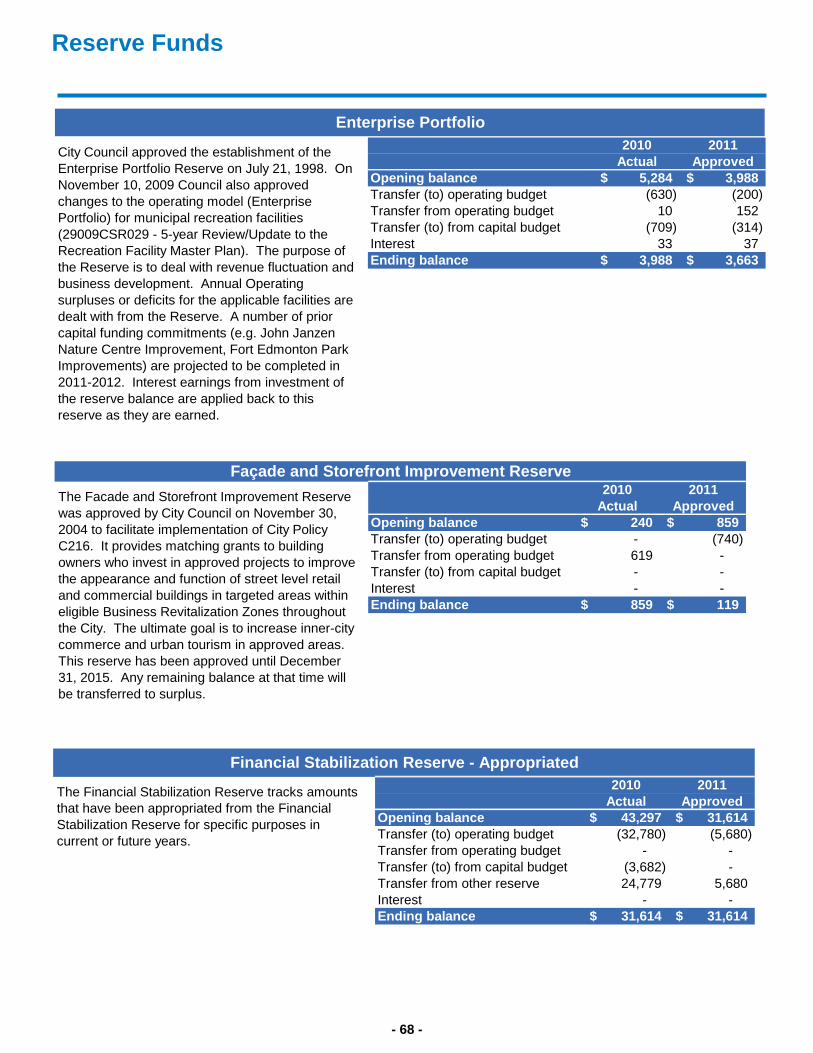
Reserve Funds
2010 2011Actual Approved
Opening balance 5,284$ 3,988$ Transfer (to) operating budget (630) (200) Transfer from operating budget 10 152 Transfer (to) from capital budget (709) (314) Interest 33 37 Ending balance 3,988$ 3,663$
Enterprise Portfolio
City Council approved the establishment of the Enterprise Portfolio Reserve on July 21, 1998. On November 10, 2009 Council also approved changes to the operating model (Enterprise Portfolio) for municipal recreation facilities (29009CSR029 - 5-year Review/Update to the Recreation Facility Master Plan). The purpose of the Reserve is to deal with revenue fluctuation and business development. Annual Operating surpluses or deficits for the applicable facilities are dealt with from the Reserve. A number of prior capital funding commitments (e.g. John Janzen Nature Centre Improvement, Fort Edmonton Park Improvements) are projected to be completed in 2011-2012. Interest earnings from investment of the reserve balance are applied back to this reserve as they are earned.
2010 2011Actual Approved
Opening balance 240$ 859$ Transfer (to) operating budget - (740) Transfer from operating budget 619 - Transfer (to) from capital budget - - Interest - - Ending balance 859$ 119$
Façade and Storefront Improvement ReserveThe Facade and Storefront Improvement Reserve was approved by City Council on November 30, 2004 to facilitate implementation of City Policy C216. It provides matching grants to building owners who invest in approved projects to improve the appearance and function of street level retail and commercial buildings in targeted areas within eligible Business Revitalization Zones throughout the City. The ultimate goal is to increase inner-city commerce and urban tourism in approved areas. This reserve has been approved until December 31, 2015. Any remaining balance at that time will be transferred to surplus.
2010 2011Actual Approved
Opening balance 43,297$ 31,614$ Transfer (to) operating budget (32,780) (5,680) Transfer from operating budget - - Transfer (to) from capital budget (3,682) - Transfer from other reserve 24,779 5,680 Interest - - Ending balance 31,614$ 31,614$
Financial Stabilization Reserve - Appropriated
The Financial Stabilization Reserve tracks amounts that have been appropriated from the Financial Stabilization Reserve for specific purposes in current or future years.
- 68 -

Reserve Funds
2010 2011Actual Approved
Opening balance 8,254$ 11,419$ Transfer (to) operating budget - - Transfer from operating budget 1,888 - Transfer (to) from capital budget 1,215 (6,168) Interest 62 65 Ending balance 11,419$ 5,316$
Funds in Lieu - ResidentialApproved in 1985, with Council direction to separate the residential portion from the commercial/industrial portion in the Parkland Purchase Reserve. Funds received from developers and the sale of parkland in residential areas is used to purchase and develop parkland in residential areas. The funds are generated as a result of the 10% parkland dedication required in accordance with the Municipal Government Act (MGA). The MGA requires that such funds must be used for "a public park, a public recreation area, school authority purposes, or to separate areas of land that are used for different purposes". The funds collected are restricted by Council policy to usage within the same neighbourhood. There is no requirement under the MGA or through Council direction that interest earnings be accumulated by neighbourhood, but rather accrue to the reserve in total.
2010 2011Actual Approved
Opening balance 71,366$ 95,127$ Transfer (to) operating budget - - Transfer from operating budget 14,645 - Transfer (to) from capital budget - - Transfer (to) other reserve (24,779) (5,680) Transfer from surplus 33,895 5,680 Interest - - Ending balance 95,127$ 95,127$
Financial Stabilization Reserve - Unappropriated
The Financial Stabilization Reserve (FSR) was established in 1997 to provide flexibility in addressing financial risks associated with revenue instability and unforeseen costs on a transitional basis, and to ensure the orderly provision of services to citizens. As per policy C217B - Reserve and Equity Accounts, a minimum balance of 5% with a target balance of 8.3% of current general government expenses (excluding non-cash amortization) has been established. The source of funding for the FSR has generally been tax-supported operating surplus. Therefore, it is primarily in positive economic times that the reserve has increased.
2010 2011Actual Approved
Opening balance 163$ 169$ Transfer (to) operating budget - (5) Transfer from operating budget 5 5 Transfer (to) from capital budget - - Transfer (to) other reserve - - Interest 1 1 Ending balance 169$ 170$
Fort Edmonton Train Maintenance
This reserve was established August 14, 1992 as a condition of an ongoing agreement between the City of Edmonton and Fort Edmonton Historical Foundation. A maximum of $5,000 annually from Fort Edmonton Park operations is contributed to this reserve to fund unusual, unexpected and necessary repairs of the steam railway system at the facility. Interest earnings from investment of the reserve balance are applied back to this reserve as they are earned.
- 69 -

Reserve Funds
2010 2011Actual Approved
Opening balance 2,924$ 2,722$ Transfer (to) operating budget (202) (1,000) Transfer from operating budget - - Transfer (to) from capital budget - - Interest - - Ending balance 2,722$ 1,722$
Heritage Conservation
The purpose of the Heritage Conservation Reserve is to implement City Policy C450B - Policy to Encourage the Designation and Rehabilitation of Municipal Historic Resources in Edmonton. This reserve will provide funding through the designation of historically significant structures and the payment of required compensation such as grants, tax cancellation, rebate of property taxes, or a payment equal to the value of the amount of taxes payable on the designated historic building and substantial rehabilitation. This reserve will also provide funding for maintenance grants, promoting heritage, and special heritage projects including limited demonstrative restoration projects. No interest earnings are applied to this reserve.
2010 2011Actual Approved
Opening balance 14,924$ 10,035$ Transfer (to) operating budget - - Transfer from operating budget 5,111 3,750 Transfer (to) from capital budget (10,000) - Interest - - Ending balance 10,035$ 13,785$
LRT
Funding set up to mitigate the risks associated with the use of the Federal Fuel Tax program to fund the SLRT debenture borrowing. The federal program was approved for a five year period, with consideration for a five year extension. Council approved the strategy of placing in this reserve the accumulating annual tax levy increase of 0.25% per year for 3 years commencing in 2006. In April 2008 with the Federal Gas Tax program being made permanent, Council approved that the reserve be made available for city-wide LRT expansion.
2010 2011Actual Approved
Opening balance 2,500$ 2,500$ Transfer (to) operating budget - - Transfer from operating budget - - Transfer (to) from capital budget - - Interest - - Ending balance 2,500$ 2,500$
Motor Vehicle Insurance
The City self-insures the first $1.0 million of each automobile liability claim with any amount in excessof this self-insured retention amount being insured by external commercial insurers. Pursuant to Section 825, Part 7 of the Alberta Insurance Act, the Corporation must maintain a separate insurance fund. The amount is approved annually by the Superintendent of Insurance for the Province, and the City is required to sign a statutory declaration indicating that a separate insurance fund of the required amount is maintained. The amount of $2.5 million, in addition to the amount set aside to satisfy third party liability and accident benefit claims is the current approved requirement. Since the City records an ongoing liability for claim estimates, the established limit in the reserve has remained stable. The reserve balance is invested in the Balanced Fund. Interest earnings on the investments form part of the corporate investment earnings budget.
- 70 -

Reserve Funds
2010 2011Actual Approved
Opening balance 5,058$ 6,124$ Transfer (to) operating budget - - Transfer from operating budget 1,000 1,000 Transfer (to) from capital budget 32 - Interest 34 38 Ending balance 6,124$ 7,162$
Natural Areas
Approved March 2, 1999, the Natural Area reserve was established to facilitate the acquisition and conservation of environmentally sensitive natural areas. Bylaw 15164, approved July 22, 2009, changes the purpose of the reserve to facilitate the repayment of debt incurred in the purchase of natural areas. The expected sources of financing are from general financing and $1 million transferred annually from tax levy through the budget process. Interest earnings are applied to the reserve.
2010 2011Actual Approved
Opening balance 683$ 1,078$ Transfer (to) operating budget - - Transfer from operating budget 388 (500) Transfer (to) from capital budget - - Transfer to reserve - - Interest 7 3 Ending balance 1,078$ 581$
Northlands Capital
As provided by the agreement (January 1, 2004 - December 31, 2013) between the City of Edmonton and Edmonton Northlands, the City is entitled to share in certain operating profits of Rexall Place, under a formula as outlined in the agreement. The profits are to be held in the reserve to assist in funding facility capital improvements as defined in the agreement.
2010 2011Actual Approved
Opening balance 12,683$ 12,069$ Transfer (to) operating budget - - Transfer from operating budget 192 - Transfer (to) from capital budget (866) (597) Interest 60 60 Ending balance 12,069$ 11,532$
Parkland Reserve
Starting in 1974, the reserve receives funds fromdeveloper levies, the sale of municipal reserve land in industrial and commercial areas, proceeds from the sale of municipal reserve land and in the river valley communities (where land was originally purchased with Parkland Reserve Funds) and the rental of City property on Parks land.The Municipal Government Act (MGA) requires that such funds must be used for "a public park, a public recreation area, school authority purposes, or to separate areas of land that are used for different purposes". The funds collected can be used anywhere in the City for the required purposes. Interest earnings are applied to the reserve.
- 71 -

Reserve Funds
2010 2011Actual Approved
Opening balance 4,041$ 4,775$ Transfer (to) operating budget - - Transfer from operating budget 734 - Transfer (to) from capital budget - - Interest - 34 Ending balance 4,775$ 4,809$
Perpetual Care
The Perpetual Care Reserve was established July 21, 1960 to comply with provincial legislation requiring a portion of funds received from sales of plots, crypts and niches to be saved for future site care. Later legislation rescinded the requirement for municipalities to maintain this reserve. City of Edmonton continued the practice to ensure funds will be available for the long term care of City owned Cemeteries. Interest is applied monthly to the cemetery operating program.
2010 2011Actual Approved
Opening balance 250$ 250$ Transfer (to) operating budget - - Transfer from operating budget - - Transfer (to) from capital budget - - Interest - - Ending balance 250$ 250$
Public Works Local Improvements
Based on policy C204 - Public Works Reserve and noted in policy C200B - Financing of Local Improvements, an accumulated reserve of $250,000 will be maintained to provide for future losses on local improvement construction. Any accumulated excess over $250,000 will be used to finance the City's share of local improvement costs. Should losses on local improvements exceed the reserve balance then they are to be
2010 2011Actual Approved
Opening balance 66$ -$ Transfer (to) operating budget (70) - Transfer from operating budget - - Transfer (to) from capital budget - - Interest 4 Ending balance -$ -$
Storm Redevelopment
City Council cancelled all outstanding levies for the Combined Sewer Relief Program effective January, 1 1995. The Sewer Redevelopment Surcharge continued until 2002 and was placed in this reserve to fund the combined sewer relief charges scheduled until 2010.
- 72 -
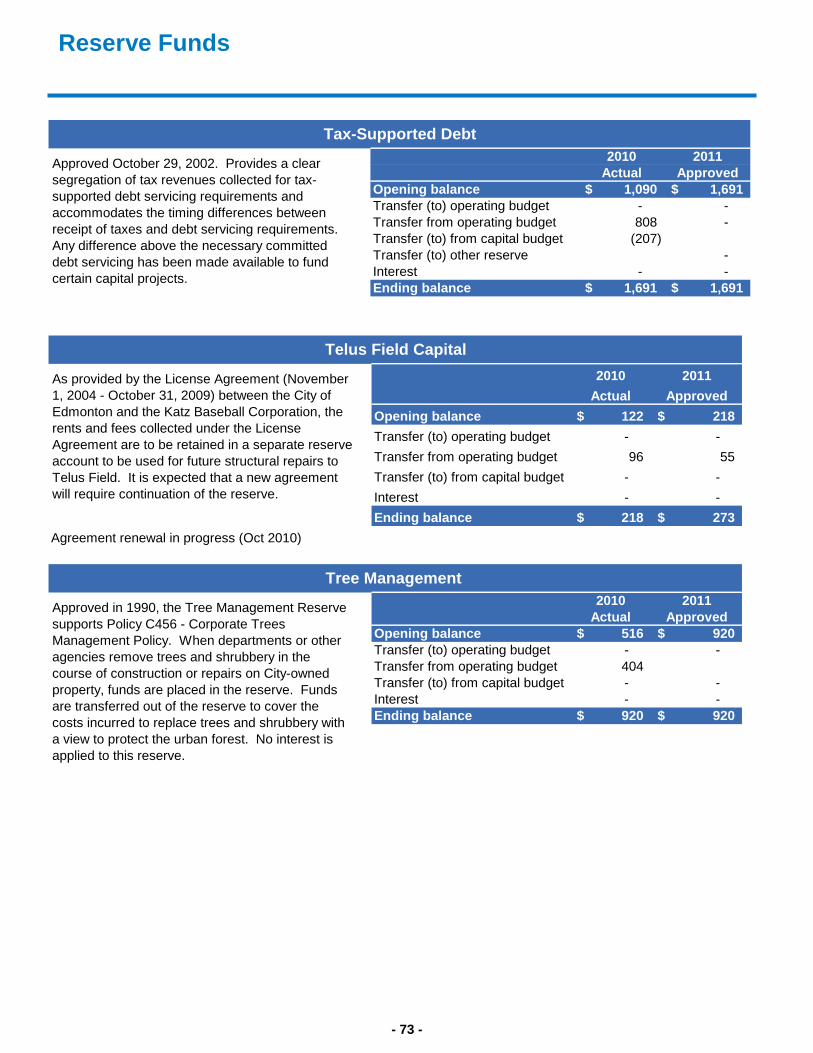
Reserve Funds
2010 2011Actual Approved
Opening balance 1,090$ 1,691$ Transfer (to) operating budget - - Transfer from operating budget 808 - Transfer (to) from capital budget (207) Transfer (to) other reserve - Interest - - Ending balance 1,691$ 1,691$
Tax-Supported Debt
Approved October 29, 2002. Provides a clear segregation of tax revenues collected for tax-supported debt servicing requirements and accommodates the timing differences between receipt of taxes and debt servicing requirements. Any difference above the necessary committed debt servicing has been made available to fund certain capital projects.
2010 2011Actual Approved
Opening balance 122$ 218$ Transfer (to) operating budget - - Transfer from operating budget 96 55 Transfer (to) from capital budget - - Interest - - Ending balance 218$ 273$
Agreement renewal in progress (Oct 2010)
Telus Field Capital
As provided by the License Agreement (November 1, 2004 - October 31, 2009) between the City of Edmonton and the Katz Baseball Corporation, the rents and fees collected under the License Agreement are to be retained in a separate reserve account to be used for future structural repairs to Telus Field. It is expected that a new agreement will require continuation of the reserve.
2010 2011Actual Approved
Opening balance 516$ 920$ Transfer (to) operating budget - - Transfer from operating budget 404 Transfer (to) from capital budget - - Interest - - Ending balance 920$ 920$
Tree Management
Approved in 1990, the Tree Management Reserve supports Policy C456 - Corporate Trees Management Policy. When departments or other agencies remove trees and shrubbery in the course of construction or repairs on City-owned property, funds are placed in the reserve. Funds are transferred out of the reserve to cover the costs incurred to replace trees and shrubbery with a view to protect the urban forest. No interest is applied to this reserve.
- 73 -

Terms and Definitions
Accrual Basis. Revenues are accounted for in the pe-riod in which the transactions or events occurred that gave rise to the revenues. Externally restricted earnings are accounted for as deferred revenue until used for the purpose specified. Expenditures are recognized in the period the goods and services are acquired and a liability is incurred or transfers are due.
Activity. A subdivision of an operating budget program, usually a major administrative or functional unit.
Alberta Municipal Infrastructure Program (AMIP). A grant from the Province of Alberta to assist municipali-ties in addressing their core infrastructure backlog and longer term infrastructure requirements. Core infrastruc-ture is strictly defined as municipal roads, bridges, public transit vehicles and facilities, water and waste water sys-tems and facilities, storm drainage systems and facilities, emergency service vehicles and facilities and infrastruc-ture management systems. Funding is a per capita amount beginning in 2005 with funding over a five-year period, and project completion over a ten year period.
Annualization. Represents the financial impact of im-plementing an approved service package over the full fiscal year.
Appropriate. To approve funds for specific purpose or project.
Assessment. The valuation of a property for property taxation purposes. Property Taxes are calculated by multiplying the property assessment by the tax rate ex-pressed in terms of mills (thousands).
Assessment Classes. All assessed property within the City of Edmonton is divided into the following assess-ment classes:
• Residential Property - single family and other residential
• Non-residential Property
• Farmland
• Machinery and Equipment
Authorities. Autonomous organizations with separate boards or commission, but related to the City of Edmon-ton through operating agreements, which usually include financial obligations.
Bond Rating. This is a measure of the City’s capacity to repay debt.
Budget. A financial plan and a service delivery guide for a given period of time.
Budget Adjustment. Amendments to the approved op-erating and capital budgets are made through the budget adjustment process, which outlines the procedures and defines the approval authority of City Council, the City Manager, and General Managers.
Budget Guidelines. Overall parameters set by City Council that must be followed in the preparation of the budget.
Business Tax. Revenue generated through the collec-tion of taxes levied on the net annual rental values of premises occupied or entered for the purpose of doing business. On May 8th, 2007, City Council passed a mo-tion to shift business tax revenue to the non-residential property tax class over a four-year period (2008 - 2011).
Bylaws. Legislation enacted by City Council under the provisions of the Municipal Government Act.
Capital Budget. Provides the statutory approval to ex-pend funds in the undertaking of specified capital im-provements or developments and to appropriate the re-quired financing. Approval is granted on a three-year basis for projects beginning the first year of the planned period.
Capital Financing. The funding provided to capital pro-jects through operating budget contributions, reserves, debt, and grants from other orders of government or other sources.
Capital Priorities Plan Committee (CPPC). A team of Branch Managers assigned with the responsibilities of allocating financing to the Capital Priorities Plan, review-ing and approving capital projects and providing advice/direction for overall infrastructure requirements.
- 74 -
Terms and Definitions
Capital Priorities Plan (CPP). The CPP represents the City’s five year plan for capital investment in existing in-frastructure and new growth.
Capital Project. Expenditures relating to the acquisition, construction, upgrade or rehabilitation of a City’s asset that is prioritized through the Capital Priorities Plan proc-ess.
Census. An official enumeration of a population.
Census Metropolitan Area (C.M.A.). The threshold as defined by Statistics Canada where census data is being gathered for an agglomeration that has an urban core of 100,000 people.
City Council. A group of elected representatives with powers given by the Provincial Government to provide good government to a community.
City Manager. An individual appointed by City Council to serve as the Chief Administrative Officer of the munici-pality.
Civic Program. Civic departments report directly to the City Manager. Each Civic Department is comprised of one or more programs for budgetary purposes.
Committed. Committed fund balances and reserves designates funding that has been earmarked or set-aside for a specific project or operating program.
Committees. A group of individuals delegated to per-form a specific function or functions.
Consumer Price Index (CPI). Reflects the impact of inflation on the purchasing power for goods and services.
Core Infrastructure. Refers to municipal roads, bridges, public transit vehicles and facilities, water and wastewater systems and facilities, emergency service vehicles and facilities, and infrastructure management systems.
Corporate Expenditures. Expenditures which cannot be directly associated with a specific program/department and therefore are budgeted under the Corpo-rate Program.
Corporate Leadership Team (CLT). Refers to the working team consisting of the City Manager and the
eight General Managers.
Corporate Revenues. Revenues which cannot be di-rectly associated with a specific program/department and therefore are budgeted under the Corporate Program.
Cost Impacts. Cost increases due to inflation, person-nel contract settlements, annualization, and historical performance. It represents the re-costing of the current year’s budget in terms of next year’s dollars.
Debt. An obligation resulting from the borrowing of money. The City of Edmonton categorizes debt as fol-lows:
• Tax-supported debt refers to debt issued to provide funding for capital expenditures, the re-tirement of which is being paid for using tax levy revenues.
• Self-liquidating debt refers to debt issued, gen-erally for municipal enterprise operations that is repaid through the fees generated from the op-erations.
Debenture. The sale of a municipal bond to the Alberta Capital Financing Authority.
Debt Limit. The Provincially-legislated limit by which a municipality may incur debt. The debt limit is defined as two times revenue net of capital government transfers. Incurring debt beyond these limits requires approval by the Minister of Municipal Affairs.
Debt Service Limit. The Provincially-legislated borrow-ing limit by which a municipality may incur. The debt service limit is calculated at 0.35 times of the revenue net of capital government transfers. Incurring debt be-yond these limits requires approval by the Minister of Municipal Affairs.
Demographics. Various statistics used to characterize human populations.
Duplex/Triplex. A house with two or three dwelling units sharing common walls or floors.
Expenditures. Costs associated with the provision of municipal services.
- 75 -
Terms and Definitions
Edmonton Socio-Economic Outlook. A report pre-pared by the Economic Trends and Research, produced twice a year, with forecasts of major economic and social indicators over the next five years. Civic departments use this forecast in preparing their capital priority plans and operating budgets. They also use it in their strategic and business planning.
Effectiveness. Is (1) the ratio of standard, estimated or budgeted performance to actual performance expressed as a percentage; (2) the outcome or output received from an approach or program. Ideally it is a quantitative meas-ure which can be used to evaluate the level of perform-ance in relation to some standard, set of criteria, or end objective; (3) the actual accomplishment of delivering acceptable outputs, on time, within the quality require-ments specified. It is the ratio of Actual Output (A.O.) divided by Expected Output (E.O.). Note: Effectiveness may be stated in terms of outcomes in place of outputs.
Efficiency. Is the relationship between the planned re-source requirements, such as labour or machine time, for task(s) and the actual resource time charged to the task(s). It is the ratio of the Resources Expected or fore-casted to be Consumed (R.E.C.) divided by Resources Actually Consumed (R.A.C.).
EPCOR. Edmonton Power Corporation, a wholly owned subsidiary of the City of Edmonton.
Franchise Fees. Fees in lieu of taxes or compensation for exclusive rights, based on an agreement with the holder of a special franchise. e.g. ATCO Gas.
Full-Time Equivalents (FTEs). The hours and associ-ated costs one full-time employee would work in a year.
General Financing. As approved by Council in June 2009, the funding source for Capital Budget general fi-nancing is changed from tax levy to investments earn-ings, the Ed Tel Endowment Fund dividends and the EP-COR Goldbar transfer fee/dividends.
General Managers. Department heads of civic pro-grams.
Grants. Funding provided by a senior order of govern-ment.
Infrastructure. Facilities on which the continuance and growth of a community depends (e.g. roads, sew-ers, public buildings, parks, storm sewers, etc.).
Infrastructure Canada Alberta Program (ICAP). A body set up to administer the Federal Infrastructure Program (FIP) called Strengthening Federal, Provincial and Municipal infrastructure. Funding is shared 1/3 from each order of government: Canada, Alberta, and the City of Edmonton.
Infrastructure Gap. A term used to described the funding shortfall between capital investment require-ments and funding availability.
Local Improvements. The construction or replace-ment of roads, sidewalks, lanes and underground ser-vices for which a portion is paid by the abutting prop-erty owner.
Market Value Assessment. Provincial government legislation requires that properties must be assessed on an annual basis to reflect current market conditions. Starting in 1999, all properties were assessed at mar-ket or on the basis of provincial regulations and were taxed on this value by the City of Edmonton.
Municipal Enterprise Operations. Refers to those activities for which tax dollars are not anticipated to be required to fund the operations. They are financially self-funded operations established to provide manage-ment and control of major activities of the City. Land Enterprise and Fleet Services are Municipal Enter-prises.
Municipal Equity. The amount calculated as the ex-cess of Total Assets less Total Liabilities and any fund-ing set aside for specific purposes in Reserves.
Municipal Government Act (MGA). Provincial legisla-tion setting out the powers and responsibilities of Alberta municipalities.
- 76 -
Terms and Definitions
Municipal Sustainability Initiative (MSI). Grant fund-ing from the Province of Alberta for capital projects, in-cluding municipal roads, bridges, public transit vehicles and facilities, water and waste water systems and facili-ties, storm drainage systems and facilities, emergency service vehicles and facilities, infrastructure manage-ment systems and solid-waste management systems and facilities. MSI grants end 2017.
Non-Residential Construction Price Index. Measures the cost of construction materials and labour used for commercial, industrial, and institutional development.
One-time Items. Expenditures associated with a limited term (typically one operating period) that will not become an ongoing part of the base budget in future years.
Operating Budget. Planned revenues and expenditures that are consumed in the delivery of services during an annual operating cycle (January through December).
Outcome. Outputs quantify the amount of work com-pleted, while outcomes (or effectiveness) report the re-sults achieved as expressed in the eyes of the customer, or in the case of the City of Edmonton, Citizens.
Output. Are goods or services created by inputs. Exam-ples of Outputs are units produced and hours of service provided.
Payment-in-Lieu of Taxes. Payments equivalent to municipal property taxes, made by the federal and pro-vincial governments for Crown-owned properties.
Performance Measures. Qualitative or quantitative measures or indicators of progress toward specified out-comes or goals. A means for determining how a pro-gram is accomplishing its mission through the delivery of products, services, or processes by measuring quantity, effectiveness, and/or efficiency.
Program. A program represents a group of like services or activities in delivering a service, with a definable client and a clear benefit or outcome.
Project. A single project is a non-routine capital work with a “singular” identity. The location, time and design of a single project are clearly identifiable. A composite project is the grouping of routine capital improvements.
Property Tax. Revenue generated through the collec-tion of taxes levied on real property assessment, includ-ing residential and commercial properties.
Reserves. Represent amounts appropriated from sur-plus for designated requirements.
Retained Earnings. Equity accounts that represent the accumulated surpluses from operations, that are not for general distribution, but rather are used to fund capital projects, leverage debt, or are reinvested in service de-livery.
Revenue. Funds the City receives and records as in-come. Revenue is broken down by major sources as follows: user fees, fines, permits, grants from other or-ders of government, utility dividends, franchise fees, Ed Tel Endowment fund, and investment earnings.
Self-liquidating Debentures. Debt issued by municipal enterprise operations that is repaid through the fees gen-erated by operations.
Service Package. New service or service increased from growth that require funds are presented to Council for their approval through the annual budget process.
Sinking Fund. The City of Edmonton makes annual payments into the Sinking Fund as required by each de-benture issue. These funds are invested by the Sinking Fund in securities as approved by existing legislation. The annual rate of return required by the issue is allo-cated to meet the future debt requirements. Earnings in excess of those requirements are maintained within the Fund as unappropriated surplus, which may be used as approved by Council.
- 77 -

Terms and Definitions
Tangible Capital Asset. Tangible capital assets are non-financial assets having physical substance that meet all of the following criteria:
(a) are held for use in the production or supply of goods and services, for rental to others, for administrative purposes or for the devel-opment, construction, maintenance or repair of other tangible capital assets;
(b) have useful economic lives extending beyond an accounting period;
(c) have been acquired to be used on a continu-ing basis; and
(d) are not intended for sale in the ordinary course of business.
Tax Rate. Municipal property tax revenue is calculated by applying the tax rate to the projected assessment base. The tax rate is expressed in terms of mills. One mill is one thousandth of the assessment base. Addi-tional property tax revenue is generated through an in-crease in the tax rate and/or growth in the assessment base.
Tax-Supported Operations. Civic Departments, Com-missions, Boards, and Authorities are funded in whole or in part through revenue from property tax, business tax, and payment-in-lieu of taxes.
Uncommitted. Uncommitted Operating Fund balances and reserves designates funding that is not earmarked or set aside for a specific capital project or operating pro-gram initiative and is available for allocation.
Unconditional Operating Grants. An amount provided by other orders of government to municipalities for oper-ating purposes, without any requirements as to the area in which the fund is used.
Utility Operations. Refers to Drainage Services (include Sanitary Utility and Land Drainage Utility) and Waste Management Services where tax dollars are not needed to support the operations. The operations of the Drainage services are governed by the City of Edmon-ton’s Utility Fiscal Policy (C304B). The operations of
Waste Management Utility are governed by the Waste Management Strategic Plan and the Waste Management Policy (C527).
- 78 -