Embed Size (px)
Citation preview
●TSMC’s shares are listed on the Taiwan Stock Exchange (TSE) under the code 2330.●Depositary receipts of the common shares are listed on the New York Stock Exchange (NYSE) under the symbol TSM.

II 1
TSMC VISION & CORE VALUES
TSMC’s VisionOur vision is to be the most advanced and largest technology and foundry services provider to fabless
companies and IDMs, and in partnership with them, to forge a powerful competitive force in the
semiconductor industry.
To realize our vision, we must have a trinity of strengths:
(1) be a technology leader, competitive with the leading IDMs
(2) be the manufacturing leader
(3) be the most reputable, service-oriented and maximum-total-benefits silicon foundry.
TSMC Core ValuesIntegrity – Integrity is our most basic and most important core value. We tell the truth. We believe the
record of our accomplishments is the best proof of our merit. Hence, we do not brag. We do not make
commitments lightly. Once we make a commitment, we devote ourselves completely to meeting that
commitment. We compete to our fullest within the law, but we do not slander our competitors and we
respect the intellectual property rights of others. With vendors, we maintain an objective, consistent, and
impartial attitude. We do not tolerate any form of corrupt behavior or politicking. When selecting new
employees, we place emphasis on the candidates’ qualifications and character, not connections or access.
Commitment – TSMC is committed to the welfare of customers, suppliers, employees, shareholders, and
society. These stakeholders all contribute to TSMC’s success, and TSMC is dedicated to serving their best
interests. In return, TSMC hopes all these stakeholders will make a mutual commitment to the Company.
Innovation – Innovation is the wellspring of TSMC’s growth, and is a part of all aspects of our business,
from strategic planning, marketing and management, to technology and manufacturing. At TSMC,
innovation means more than new ideas, it means putting ideas into practice.
Customer Trust – At TSMC, customers come first. Their success is our success, and we value their ability to
compete as we value our own. We strive to build deep and enduring relationships with our customers, who
trust and rely on us to be part of their success over the long term.
1. Letter to Shareholders 2
2. Introduction to TSMC and Market Overview 6
3. Corporate Governance 14
4. Operational Highlights 18
5. Corporate Social Responsibility 22
6. Financial Statements 28
TABLE OF CONTENTS
2 3
Dear Shareholders,
2011 was a challenging year as the global semiconductor market growth was close to zero, and the
outlook for the year continuously worsened as the year progressed. TSMC achieved revenue growth of 9.2
percent in US dollars and gained market share from the 2010 level. Our growth was mainly fueled by our
technology leadership and the wide adoption of our advanced technologies, which became more critical in
the face of the high growth of mobile computing products. Despite the challenging operating environment,
the Company successfully enlarged its business offerings, rapidly grew our share of 40-nanometer, achieved
volume production in 28-nanometer, and developed 20-nanometer capability. More specifically,
● �Our total wafer shipments reached 12.55 million 8”-equivalent wafers.● �Our advanced technologies (65-nanometer and beyond) reached 55 percent of total wafer revenue.● �We became the first foundry to offer volume production of 28-nanometer, with the first-to-market
28-nanometer high-k/metal gate (HKMG) technology portfolio.
Financial Performance
Consolidated revenue for 2011 totaled NT$427.08 billion, an increase of 1.8 percent over NT$419.54
billion in 2010. Net income was NT$134.20 billion and diluted earnings per share were NT$5.18, both of
which were 17 percent below the previous year level of NT$161.61 billion net income and NT$6.23 diluted
earnings per share registered in 2010.
In US dollars, TSMC generated net income of US$4.57 billion on consolidated revenue of US$14.54 billion,
compared with net income of US$5.13 billion on consolidated revenue of US$13.32 billion for 2010.
Gross profit margin was 45.4 percent compared with 49.4 percent in 2010, with an Operating Profit
Margin of 33.1 percent compared with 37.9 percent a year earlier. Net Profit Margin reached 31.4 percent,
a decrease of 7.1 percentage points from the 2010 level.
1. Letter to Shareholders

4 5
Technological Developments
Based on a record number of customer product tape-outs, TSMC entered volume production of superior
28-nanometer Gate-Last HKMG logic technology. Revenue from the 28-nanometer node contributed 2% of
fourth quarter 2011 wafer revenue, and is expected to contribute approximately 10% wafer revenue in 2012.
Our 20-nanometer technology development is on track for risk production in the second half of 2012. In third
quarter 2011, we completed the world’s first tape-out of 20-nanometer ARM-Cortex A15 MP core processor
which is high performance for future mobile computing products. In second half of 2011, we also started full
scale 14-nanometer development, after completing three years of path-finding and demonstrated excellent 3D
FinFET transistor capabilities in 28-nanometer and 20-nanometer.
As we forge ahead in IC development, we are also trying to realize the potential of sub-system integration by
3D chip stacking that will enable future mobile applications. In 2011, we demonstrated a fully functional
sub-system, having logic chip with built-in passive components, and bumps, all manufactured and assembled
at TSMC, using our proprietary Chip on Wafer on Substrate (CoWoSTM) technology. Our CoWoSTM scheme is
fundamentally better than other 3D chip stacking schemes in terms of cost, yield, reliability, and end-to-end
sub-system integration. We have been collaborating with early development partners to enable CoWoSTM
products for qualification in 2012 and initial production in 2013. We expect CoWoSTM to start at
28-nanometer and become a significant factor at 20-nanometer and below.
Corporate Developments
In August 2011, we formed two wholly owned subsidiaries of TSMC: TSMC Solar Ltd. and TSMC Solid State
Lighting Ltd., in order to encourage entrepreneurialism in these new businesses. Both Solar and Solid State
Lighting are making very good progress in technology development and pilot production.
Honors and Awards
During 2011, TSMC was the recipient of numerous honors and awards for our efforts in corporate
governance, investor relations, sustainability, innovation, and overall corporate excellence. TSMC received
awards from Corporate Governance Asia, Institutional Investors, the IR Magazine, and IR Global Ranking.
TSMC was also honored with the Top Corporate Citizen Award, and Most Admired Company Award, from
CommonWealth Magazine, and the National Industrial Innovation Award, and the Green Classic Awards for
corporate social responsibilities, from Taiwan government. 2011 also marked the 11th consecutive year that
TSMC was included in the Dow Jones Sustainability Index.
In an honor that reflects the efforts of all TSMC employees over many years, I was grateful to accept the 2011
IEEE Medal of Honor in August 2011 for pioneering the concepts of dedicated IC foundry, ”fabless” IC design
and virtual fabrication services in the semiconductor industry.
Outlook
We believe that mobile computing products, such as smartphones and tablets, will continue to be the killer
app for semiconductor industry in the forthcoming decade. These new devices, along with the communication
infrastructure that enables their wide-spread usage, will require the development of more sophisticated
semiconductor technologies. We believe we are well positioned to enjoy continued success and business
growth with our customers in these markets because we have the right technology and manufacturing
capacity. Our trinity of strengths: technology leadership, manufacturing excellence and customer trust, will
continue to enable TSMC to be the most advanced, innovative, and largest provider of foundry services for
years to come.
Morris Chang
Chairman and Chief Executive Officer
6 7
2.1 An Introduction to TSMC
TSMC is the world’s largest pure-play semiconductor foundry. Founded on February 21, 1987 and headquartered in
Hsinchu, Taiwan, TSMC pioneered the business model of focusing solely on manufacturing customers’ semiconductor
designs. As a pure-play semiconductor foundry, the Company does not design, manufacture, or market semiconductor
products under its own brand name, ensuring that TSMC does not compete directly with its customers.
With a diverse global customer base, TSMC-manufactured microchips are used in a broad variety of applications that
cover various segments of the computer, communications, consumer, and other electronics markets.
Total capacity of the manufacturing facilities managed by TSMC, including subsidiaries and joint ventures, totaled 13.22
million 8-inch equivalent wafers in 2011. In Taiwan, TSMC operates three advanced 12-inch wafer fabs, four 8-inch
wafer fabs, and one 6-inch wafer fab. TSMC also manages two 8-inch fabs at wholly owned subsidiaries: WaferTech in
the United States and TSMC China Company Limited. In addition, TSMC obtains 8-inch wafer capacity from other
companies in which the Company has an equity interest.
TSMC provides customer service through its account management and engineering services offices in North America,
Europe, Japan, China, South Korea, and India. The Company employed more than 33,000 people worldwide as of the
end of 2011.
TSMC continued to lead the foundry segment of the semiconductor industry in both advanced and “More-than-Moore”
process technologies. Already the first foundry to provide 65nm and 40nm production capacity, TSMC in 2011 also
reached full volume production of 28nm featuring 28HP & 28HPM for high performance and 28LP & 28HPL for low
power, and began the initial tape out of 20nm technology late in the year. In addition to general-purpose logic process
technology, TSMC supports the wide-ranging needs of its customers with embedded non-volatile memory, embedded
DRAM, Mixed Signal/RF, high voltage, CMOS image sensor, color filter, MEMS, silicon germanium technologies and
automotive service packages.
2. Introduction to TSMC and Market Overview

8 9
In August 2011, TSMC transferred its Solar and Solid State Lighting businesses to its two new subsidiaries, “TSMC Solar
Ltd.” and “TSMC Solid State Lighting Ltd.”, respectively.
The Company is listed on the Taiwan Stock Exchange (TWSE) under ticker number 2330, and its American Depositary Shares
trade on the New York Stock Exchange (NYSE) under the symbol “TSM”.
TSMC’s leadership position is based on a trinity of key differentiating strengths: technology leadership, manufacturing
excellence, and customer trust. As a technology leader, TSMC has consistently been first among pure-play foundries in
developing the next generation of leading-edge technologies. As a manufacturing leader, TSMC is renowned for its yield
management, and offers best-in-class designer/developer support services to expedite time-to-market and time-to-volume.
And, as to customer trust, TSMC works closely with its customers on end-to-end collaboration to optimize design and
manufacturing efficiencies. TSMC continually builds on this trinity of strengths to provide the best overall value to its
customers.
2.2 TSMC Achievements
In 2011, TSMC maintained its leading position in the total foundry segment of the global semiconductor industry, with an
estimated market segment share of 48%. TSMC achieved this result amid intense competition from both established players
and relatively new entrants to the business.
Leadership in advanced process technologies is a key factor in TSMC’s strong market position. In 2011, 73% of TSMC’s
wafer revenue came from manufacturing processes with geometries of 0.13μm and below. By August 2011, TSMC shipped
its millionth 45/40nm 12-inch wafer. TSMC also piloted the leading-edge 28nm process with its foundry customers. As of
fourth quarter 2011, 59% of TSMC’s wafer revenue came from 65nm processes and below.
With TSMC’s focus on customer trust, the Company continuously strengthens Open Innovation Platform® (OIP) in 2011 with
additional innovative services. During the 2011 TSMC Technology Symposium and the 2011 Design Automation Conference
(DAC) of IEEE/ACM, the Company revealed TSMC Reference Flow 12.0, the 3rd revision of radio frequency (RF) reference
design kit, and the 2nd revision of Analog Mixed-Signal Reference Flow, to highlight the success of design enablement
through OIP. A two-day OIP Ecosystem Forum was held in October 2011 at San Jose, California, which was well attended by
both customers and ecosystem partners to demonstrate the value of collaboration through OIP to foster innovations.
Furthermore, the OIP business model was recognized by Taiwan Government in its 1st National Industrial/Enterprise
Innovations Award in December 2011, to fortify OIP’s benefits to the semiconductor industry.
TSMC continued to advance the semiconductor roadmap in 2011. Examples of technologies the Company either developed
or rolled out include:● �20nm technology is under development to provide best speed/power value for both performance driven products like CPU
(Central Processing Unit), GPU (Graphics Processing Unit), APU (Accelerated Processing Unit), FPGA (Field-Programmable
Gate Array) and mobile computing applications including smartphones, tablets and high-end SoC (System-on-a-Chip).● �28nm High Performance (28HP) technology for performance driven markets like CPU, GPU, APU, FPGA & high-speed
networking applications.
● �28nm High Performance Mobile computing (28HPM) technology for tablets, smartphones, and high-end SoC applications.● �28nm Low Power (28LP & 28HPL) and RF (28HPL-RF) technology for mainstream smartphones, application processors,
tablets, home entertainment and digital consumer applications.● �40nm general purpose technology for performance-driven markets like CPU, GPU, FPGA, HDD (Hard Disk Drive), game
console & Gigabit Ethernet applications.● �40nm low power and RF technology for cellular baseband, application processor, DTV (Digital Television), STB
(Set-Top-Box), game and wireless connectivity applications.● �40nm and 65nm eFlash for non-volatile memory technologies under joint development for high-end automotive
application.● �55nm low power RF technology for WLAN (Wireless Local Area Network), cellular baseband, DTV, STB, Bluetooth, PMP
(Personal Media Player), MID (Mobile Internet Devices) and other handheld applications.● �55nm & 65nm technology for WLAN, cellular baseband, DTV, STB, Bluetooth, Blue-Ray DVD Player and HDD applications.● �55nm and 85nm low power technology for flash controller application.● �80nm high voltage process for fully integrated HD720 display driver which could achieve “RETINA” display quality in
smartphones.● �90nm eFlash technology qualified and in production for ASIC and microcontroller applications.● �0.18μm Extreme Low Leakage (eLL, reduced 98% leakage current from 0.18μm generic technology) eFlash technology
qualified for extremely power sensitive applications.● �0.18μm and 0.25μm qualified OTP (One-Time Programmable) solution for automotive application.● �0.18μm and 0.25μm high precision analog process fully release for performance driven mixed-signal applications.● �0.18μm BCD new generation for digital power management is now in Beta site release stage that offers worldwide
competitive Rdson performance to optimize IC cost structure.
In addition, TSMC further strengthened its comprehensive development of specialty technologies in 2011, including Backside
Illumination CMOS image sensor (BSI CIS), 90/55nm embedded flash, 0.5μm ultra high voltage power IC and 0.13μm
analog technologies. In 2011, TSMC offered a motion sensor 3D MEMS (Micro Electro Mechanical Systems) platform with
30μm thick MEMS structure and wafer level bonding for hermetic seal of MEMS device to the first wave fabless customers.
These first wave customers have adapted the platform structure with separate ASIC driver chip for accelerometer application.
TSMC will offer fully integrated CMOS 3D MEMS platform with design rule in first quarter 2012 as a general offering. These
specialty technologies are key differentiators from our competitors and provide customers more value-added.
As the leader in the semiconductor foundry segment, TSMC commanded a 48% share of this segment in 2011, with total
consolidated revenue of US$14.5 billion. In terms of geographic distribution of net sales, 69% came from companies
headquartered in North America; 14% from the Asia Pacific region, excluding China and Japan; 9% from Europe, and 4%
from China and 4% from Japan. By end product application, 22% of TSMC’s wafer revenue came from the computer sector,
49% from communications, 10% from consumer products, and 19% from other categories, such as industrial products.
10 11
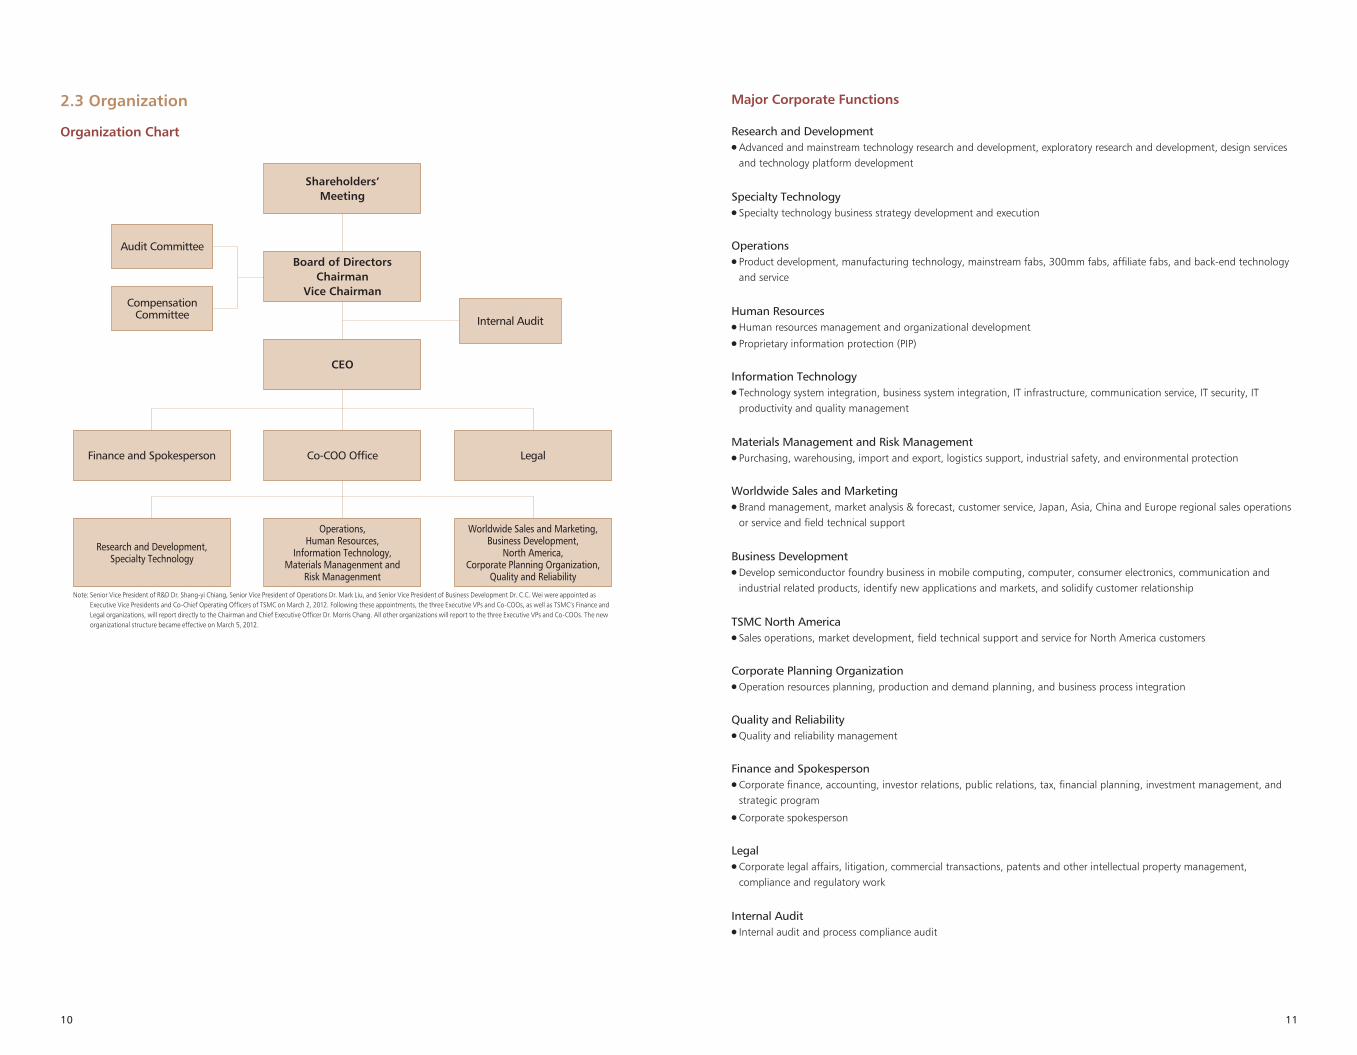
2.3 Organization
Organization Chart
Major Corporate Functions
Research and Development● �Advanced and mainstream technology research and development, exploratory research and development, design services
and technology platform development
Specialty Technology● �Specialty technology business strategy development and execution
Operations● �Product development, manufacturing technology, mainstream fabs, 300mm fabs, affiliate fabs, and back-end technology
and service
Human Resources● �Human resources management and organizational development● �Proprietary information protection (PIP)
Information Technology● �Technology system integration, business system integration, IT infrastructure, communication service, IT security, IT
productivity and quality management
Materials Management and Risk Management● �Purchasing, warehousing, import and export, logistics support, industrial safety, and environmental protection
Worldwide Sales and Marketing● �Brand management, market analysis & forecast, customer service, Japan, Asia, China and Europe regional sales operations
or service and field technical support
Business Development● �Develop semiconductor foundry business in mobile computing, computer, consumer electronics, communication and
industrial related products, identify new applications and markets, and solidify customer relationship
TSMC North America● �Sales operations, market development, field technical support and service for North America customers
Corporate Planning Organization● �Operation resources planning, production and demand planning, and business process integration
Quality and Reliability● �Quality and reliability management
Finance and Spokesperson● �Corporate finance, accounting, investor relations, public relations, tax, financial planning, investment management, and
strategic program● �Corporate spokesperson
Legal● �Corporate legal affairs, litigation, commercial transactions, patents and other intellectual property management,
compliance and regulatory work
Internal Audit● �Internal audit and process compliance audit
Shareholders’Meeting
CEO
Audit Committee
Compensation Committee
Board of DirectorsChairman
Vice Chairman
Internal Audit
Co-COO Office LegalFinance and Spokesperson
Operations, Human Resources,
Information Technology, Materials Managenment and
Risk Managenment
Worldwide Sales and Marketing,Business Development,
North America,Corporate Planning Organization,
Quality and Reliability
Research and Development,Specialty Technology
Note: Senior Vice President of R&D Dr. Shang-yi Chiang, Senior Vice President of Operations Dr. Mark Liu, and Senior Vice President of Business Development Dr. C.C. Wei were appointed as Executive Vice Presidents and Co-Chief Operating Officers of TSMC on March 2, 2012. Following these appointments, the three Executive VPs and Co-COOs, as well as TSMC’s Finance and Legal organizations, will report directly to the Chairman and Chief Executive Officer Dr. Morris Chang. All other organizations will report to the three Executive VPs and Co-COOs. The new organizational structure became effective on March 5, 2012.
12 13
2.4 Market Overview
We estimate that world-wide semiconductor market reached US$300 billion of revenue in 2011, a 0.4% increase compared
to 2010. Total foundry, a manufacturing sub-segment of the semiconductor industry, generated total revenues of US$28
billion in 2011, or 4% YoY growth. In 2011, the largest geographic market (based on the location of customers’ corporate
headquarters) for foundry services was North America, accounting for 61% of overall foundry revenue. The second largest
geographic market was Asia Pacific (excluding Japan), which accounted for 28% of foundry revenue. European-based
customers accounted for 8%, and orders from companies based in Japan contributed 3%.
Industry Outlook, Opportunities and Threats
Industry Demand and Supply OutlookAfter 2010 with 45% growth, foundry segment growth slowed down significantly to only 4% in 2011 compared to 2010.
Sluggish end-demand and cautious inventory management caused by the softening global macro economy, supply-chain
disruption post Japan earthquake and flooding in Thailand were among the factors that contributed to the weak
semiconductor growth, hence impacting the foundry segment.
We forecast total semiconductor market to grow at 2% YoY in 2012. Longer term, increasing semiconductor content in
electronics devices, continuing market share gain of fabless and increasing IDM outsourcing, foundry sales are expected to
display stronger growth than the 4% compound annual growth rate (CAGR) for the total semiconductor industry from 2011
through 2016.
As an upstream supplier in the semiconductor supply chain, the condition of the foundry segment is tightly correlated with
the market health of the 3Cs: communications, computer and consumer.
● �CommunicationsThe communications sector, particularly the handset segment, posted a robust result of 10% growth in unit shipment for
2011. Smartphones, which have much higher semiconductor content, have been leading the growth of the sector.
The continuing transition to 3G and 4G/LTE handsets will bring positive momentum to the market. Smartphones with
increasing performance, lower power and more intelligent features will continue to propel the buying interest of new
handsets in the coming 2012. The growing popularity of low-end smartphones in the emerging countries is also a new
catalyst driving the growth of the sector.
Low power IC is an essential requirement among handset manufacturers. The System-on-Chip (SoC) design for more
optimized cost, power and form-factor plus the appetite for higher performance to run complicated software will continue
to accelerate the migration to advanced process technologies in which TSMC is already the leader.
● �ComputerThe computer sector posted a relatively weak unit shipment growth of 2% YoY in 2011 after a double-digit growth year in
2010 Cautious spending in developed countries and budget competition from tablet products are among the factors
causing the weak demand.
PC growth is expected to remain modest in 2012. While pessimism regarding the economic outlook will overhang the
sector, emerging countries with relatively low installed base could be the primary growth driver. New innovative features
and form-factors such as thin-and-light “Ultrabook” and new OS (Operating System) introduction are expected to instill
buying interest.
Requirements of lower power, higher performance, and integration for key computer components such as CPU, GPU,
Chipset, etc., should drive product design demand for leading process technologies.
● �ConsumerAfter encouraging sales in 2010, the consumer sector lost momentum in 2011 with aggregated unit shipment growth of
1% YoY. Economic uncertainties have stifled buyers’ appetite for consumer electronics products, resulting in segments like
DTV to suffer from high inventory level throughout the year.
Moving forward, new product launches such as new console introduction will stimulate new interest in video game.
Government regulation and subsidy programs such as analog-switch-off that are taking place in several countries should
drive the adoption of set-top boxes. Feature enhancements complemented by aggressive price declines should also spur
demand for DTV, Blu-ray DVD and digital single-lens reflex (DSLR) camera.
Meanwhile, increasing innovations in the consumer sector have also encouraged new usage models, such as integration of
touch sensing, motion recognition, high-resolution and 3D display. Besides the need for advanced technologies,
“More-than-Moore” technologies such as CMOS Image Sensor (CIS), High-Voltage (HV) drivers, embedded memory and
MEMS are becoming prominent requirements. With its comprehensive technology portfolio, TSMC will be able to capitalize
on these trends.
Emerging ApplicationsEmerging new applications such as tablets are increasing contributions to foundry segment revenue. Led by Apple’s iPad,
around 60 million tablets shipped in 2011 compared with 17 million units the previous year. The strong sales momentum
will continue in 2012 as more models are introduced by other OEMs. We forecast the tablet market will grow with 34%
CAGR from 2011 to 2016, and become a strong growth driver for both the semiconductor and foundry segments.
Supply ChainThe electronics industry comprises a long and complex supply chain, the elements of which are highly dependent and
correlated with each other. At the upstream IC manufacturing stage, it is important for IC vendors to have sufficient and
flexible supply to support the dynamic market situation. The foundry vendors are playing an important role to ensure the
health of the supply chain. As a leader in the foundry segment, TSMC provides leading technologies and large-scale capacity
to complement the innovations created along the downstream chain.
14 15
3.1 Board of Directors
In 2011, TSMC increased the number of directors from seven to nine and elected two additional independent directors at
TSMC’s 2011 Annual Shareholders’ Meeting. TSMC’s Board of Directors now consists of nine distinguished members
with a great breadth of experience as world-class business leaders or scholars. Five of the nine members are independent
directors: former British Telecommunications Chief Executive Officer, Sir Peter Bonfield; former Acer Group Chairman, Mr.
Stan Shih; former Texas Instrument Inc. Chairman of the Board, Mr. Thomas J. Engibous; Professor of Princeton
University, Gregory C. Chow; and an advisor to the Taiwan Executive Yuan and the Taipei City Government, Ms.
Kok-Choo Chen. The number of Independent Directors is more than 50% of the total numbers of Directors. Under the
leadership of Chairman Morris Chang, TSMC’s Board of Directors takes a serious and forthright approach to its duties
and is a dedicated, competent and independent Board.
In the spirit of Chairman Chang’s approach to corporate governance, a board of directors’ primary duty is to supervise.
The Board should supervise the Company’s: compliance with relevant laws and regulations; financial transparency; timely
disclosure of material information, and maintaining of the highest integrity within the Company. TSMC’s Board of
Directors strives to perform through the Audit Committee and the Compensation Committee, the hiring of a financial
expert for the Audit Committee, coordination with the Internal Audit department, and through the ombudsman
reporting system.
3. Corporate Governance
16 17
The second duty of the Board of Directors is to provide guidance to the management team of the Company. Quarterly,
TSMC’s management reports to the Board on a variety of subjects. The management also reviews the Company’s business
strategies with the Board. Furthermore, the management often reviews with and updates TSMC’s Board on the progress of
the strategies, obtaining Board guidance as appropriate.
The third duty of the Board of Directors is to evaluate the management’s performance and to dismiss officers of the
Company when necessary. TSMC’s management has maintained a healthy and functional communication with the Board of
Directors, has been devoted in executing guidance of the Board, and is dedicated in running the business operations, all to
achieve the best interests for TSMC shareholders.
Audit Committee and Compensation Committee
The Audit Committee assists the Board in carrying out its financial oversight responsibilities and other duties as set forth in
the Company Act, the Securities and Exchange Act, and other applicable laws and regulations. Matters required to be
reviewed by the Audit Committee include the Company’s: financial reports; auditing and accounting policies and
procedures; internal control systems; material asset or derivatives transactions; offering or issuance of any equity-type
securities; hiring or dismissal of an attesting CPA, or the compensation given thereto; and appointment or discharge of
financial, accounting, or internal auditing officers.
TSMC’s Audit Committee is empowered by its Charter to conduct any study or investigation it deems appropriate to fulfill its
responsibilities. It has direct access to TSMC’s internal auditors, the Company’s independent auditors, and all employees of
the Company. The Committee is authorized to retain and oversee special legal, accounting, or other consultants as it deems
appropriate to fulfill its mandate.
As of February 2012, the Audit Committee is comprised of all five independent directors and had engaged a financial expert
consultant. The Audit Committee Charter is available on TSMC’s corporate website.
The Compensation Committee assists the Board in discharging its responsibilities related to TSMC’s compensation and
benefits policies, plans and programs, and in the evaluation and compensation of TSMC’s directors of the Board and
executives.
As of February 2012, the Compensation Committee is comprised of all five independent directors; the Chairman of the
Board, Dr. Morris Chang, shall be invited by the Committee to attend all meeting and is excused from the Committee’s
discussion of his own compensation. The Compensation Committee Charter is available on TSMC’s corporate website.
3.2 Major Resolutions of Shareholders’ Meeting and Board Meetings
Major Resolutions of Shareholders’ Meeting and Implementation Status
TSMC’s 2011 Annual Shareholders’ Meeting was held in Hsinchu, Taiwan on June 9, 2011. At the meeting, shareholders
present in person or by proxy approved the following resolutions:
(1) The 2010 Business Report and Financial Statements;
(2) The distribution of 2010 profits;
(3) The revisions to internal rules as follows:● �Procedures for Lending Funds to Other Parties● �Procedures for Endorsement and Guarantee
(4) The transfer of TSMC’s solar business and solid state lighting business into two new TSMC wholly owned companies
respectively, and the ”Solar Business Transfer Plan” and ”Solid State Lighting Business Transfer Plan”.
(5) Election of two additional independent directors
Implementation Status:All the resolutions of the Shareholders’ Meeting have been fully implemented in accordance with the resolutions.
The two newly elected independent directors are Mr. Gregory C. Chow and Ms. Kok-Choo Chen.
Major Resolutions of Board MeetingsDuring the 2011 calendar year, and through the period of January 1 to February 29, 2012, five regular board meetings and
two special board meetings were convened. Major resolutions approved at these meetings are summarized below:
(1) Regular Board Meeting of February 14 & 15, 2011:● �approving 2010 business report and financial statements;● �approving distribution of 2010 profits, and cash dividends, employee cash bonus and employee profit sharing;● �approving capital appropriations of US$2.9 billion;● �approving a capital injection of US$5 million into TSMC Solar North America;● �convening the 2011 Annual Shareholders’ Meeting;● �determining the number of Directors to be nine, and approving the election of two additional independent directors at
TSMC’s 2011 Annual Shareholders’ Meeting; and● �approving the promotion of Dr. Burn Lin as Vice President.
(2) Special Board Meeting of April 27, 2011:● �listing two qualified candidates for independent directors to stand for election at TSMC’s 2011 Annual Shareholders’
Meeting; and● �approving the transfer of TSMC’s solar and solid state lighting businesses into two wholly owned subsidiaries to be
established.
(3) Regular Board Meeting of May 9 & 10, 2011:● �approving capital appropriations of US$1,599.2 million.
(4) Regular Board Meeting of August 8 & 9, 2011:● �approving adjustments to the amounts of the respective business values to be transferred to TSMC Solar Ltd. and TSMC
Solid State Lighting Ltd.;● �approving issuance of an unsecured straight corporate bond in the domestic market for an amount not exceeding NT$35
billion;● �approving the promotion of Dr. Y. J. Mii as Vice President of R&D;● �approving the promotion of Dr. Cliff Hou as Vice President of Design and Technology Platform; and● �approving the appointment of Mr. Stan Shih, Sir Peter Leahy Bonfield, Mr. Thomas J. Engibous, Mr. Gregory C. Chow and
Ms. Kok-Choo Chen as members of the compensation committee.
(5) Regular Board Meeting of November 7 & 8, 2011:● �approving capital appropriations of US$1,061.4 million; and● �approving R&D capital appropriations and 2012 sustaining capital appropriations totaling US$233.9 million.
(6) Regular Board Meeting of February 13 & 14, 2012:● �approving 2011 business report and financial statements;● �approving distribution of 2011 profits, and cash dividends, employee cash bonus and employee profit sharing;● �approving capital appropriations of US$1,395.5 million;● �approving R&D capital appropriations of US$239.6 million; and● �convening the 2012 Annual Shareholders’ Meeting, at which shareholders will hold an election for TSMC’s nine-member
Board of Directors, including five independent directors.
18 19
As the founder and a leader of the dedicated semiconductor foundry segment, TSMC has built its reputation by offering
advanced and “More-than-Moore” wafer production processes and unparalleled manufacturing efficiency. TSMC strives
to provide the best overall value to its customers, and the success of TSMC’s business is manifested in the success of its
customers.
In May 2009, TSMC established the New Businesses organization to explore non-foundry related business opportunities.
In August 2011, the New Businesses organization was formally separated from the main TSMC organization as two
subsidiaries, TSMC Solid State Lighting Ltd. and TSMC Solar Ltd., responsible for solid state lighting and solar business
activities, respectively.
Over the past 24 years, more than 600 customers worldwide have relied on TSMC to manufacture chips that are used
across the entire spectrum of electronic applications, including computers and peripherals, information appliances, wired
and wireless communications systems, automotive and industrial equipment, consumer electronics such as DVDs, digital
TVs, game consoles, digital still cameras (DSCs), and many other applications.
The rapid evolution of end products drives our customers to utilize TSMC’s innovative technologies and services, while at
the same time spurring TSMC’s own development of technology. As always, success depends on leading rather than
following industry trends.
4.1 Technology Leadership
TSMC further expanded many aspects of Research and Development in 2011 to strengthen our Technology Leadership.
An R&D Process Center (RDPC) was established to provide timely and reliable access to fabrication facilities by Technology
Platform teams.
In 2011 the total R&D budget was 7.9% of total revenue. This level of R&D investment is equal to or more than that of
many leading edge technology companies. Along with the budget increase, the R&D organization increased staffing by
over 13.3%.
4. Operational Highlights
20 21
TSMC recognizes that the technology challenge required to extend Moore’s Law, the business law behind CMOS scaling, is
getting increasingly difficult. R&D Vice Presidents bring their rich industry experiences to lead the strengthening of the R&D
team and to navigate through the technological and competitive challenges ahead. In 2011, TSMC offered the foundry
segment’s first 28nm technology in volume production and production wafers have been shipped to customers. After
intense work on ramping this technology, 28nm contributed close to 2% of fourth quarter 2011 revenue and will
significantly increase in 2012.
TSMC further accelerated the development of advanced transistors, especially 3-D transistors using FinFET structure for
14nm process node, embedded memories, and copper (Cu)/low-K interconnect technologies. During 2011, the R&D
organization once again proved its capabilities by offering a first-to-market 28nm high-K/metal gate (HKMG) foundry
technology portfolio, developing 20nm technology as well as establishing 14nm transistor leadership capabilities.
TSMC has also expanded its external R&D partnerships and alliances with world-class research institutions. For example,
TSMC is a core partner of IMEC in Belgium, the respected European R&D consortium. TSMC also has strategic agreements
with IP providers to enable the development of physical IPs through the advanced technology nodes. In addition, TSMC
strengthened its collaborations with key development partners on design-process optimization. TSMC provides funding for
nanotechnology researches at leading research universities worldwide to promote innovations and the advancement of
technology.
These research efforts enable the Company to continuously offer its customers the foundry-leading, first-to-market
technologies and design solutions that contribute to their product success in today’s complex and challenging market
environment.
TSMC will continue working closely with international consortia and lithography equipment suppliers to ensure the timely
development of 193nm high-NA scanner technology, EUV lithography, and massively parallel E-Beam direct-write
technologies. These technologies are now fundamental to TSMC’s process development efforts at the 14nm and 10nm
nodes and beyond.
4.2 Manufacturing Excellence
GIGAFABTM Fabrications
TSMC’s 12-inch fabs are a key part of its manufacturing strategy. TSMC currently operates three 12-inch GIGAFABTM
fabrication facilities – Fab 12, Fab 14, and Fab 15 – whose combined capacity reached 3,261,000 12-inch wafers in 2011.
Production within these three facilities supports 0.13μm, 90nm, 65nm, 40nm, and 28nm process technologies, and their
sub-nodes. Part of the capacity is reserved for research and development work and currently supports 20nm, 14nm and
beyond technology development. TSMC has developed a centralized fab manufacturing management for the customers’
benefit of same quality and reliability performance, greater flexibility of demand fluctuations, faster yield learning and
time-to-volume, and minimized costly product re-qualification.
Engineering Performance Optimization
Highly sophisticated information technology (IT) solutions, such as advanced equipment control, fault detection and
diagnosis are implemented to optimize TSMC equipment performance and improve production efficiency, effectiveness, and
engineering capability via information integration, workflow optimization and automation.
Advanced analytical methods identify critical equipment and process parameters that are linked to device performance.
Methodologies such as virtual metrology, yield dissection and management integrate Advanced Process Control (APC), Fault
Detection Classification (FDC), Statistical Process Control (SPC), and Circuit Probe data in order to optimize equipment
performance to match device performance.
Accurate modeling and control at each process stage drives intelligent module loop control. The process control hierarchy
dispatched via sophisticated computer-integrated manufacturing system enable optimization from equipment to end
product, which achieves precision and lean operation in a high product-mix semiconductor manufacturing environment.
Precision and Lean Operations
TSMC’s unique manufacturing infrastructure is tailored for a high product mix foundry environment. Following its
commitment to manufacturing excellence, TSMC has equipped a sophisticated scheduling and dispatching system,
implemented industry-leading automated materials handling systems, and employed Lean Manufacturing approaches to
provide customers with on-time-delivery and best-in-class cycle time. Real-time equipment productivity monitoring, analysis,
diagnosis and control minimize production interruption and maximize cost effectiveness.
Raw Materials and Supply Chain Risk Management
In 2011, TSMC continued Supply Chain Risk Management meetings periodically to integrate Company resources from materials
management, fab operations, risk management and quality management. TSMC worked with its suppliers to enhance the
performance of quality, delivery, risk management, and to support Green procurement, environmental protection and safety.
4.3 Customer Trust
Customers
TSMC’s worldwide customers have diverse product specialties and excellent performance records in various segments of the
semiconductor industry. Fabless customers include: Altera Corporation, Advanced Micro Devices, Inc., Broadcom
Corporation, Marvell Semiconductor Inc., NVIDIA Corporation, Qualcomm Inc. and MediaTek Inc., etc. IDM customers
include: Analog Devices Inc., Freescale Semiconductor Inc., NXP Semiconductors, and Texas Instruments Inc., etc.
Customer Service
TSMC believes that providing superior customer service is critical to enhancing customer satisfaction and loyalty, which is the
path to retaining existing customers, attracting new customers, and strengthening customer relationships. With a dedicated
customer service team as a main contact window for coordination and facilitation, TSMC strives to provide world-class,
high-quality, efficient and professional services in design support, masking, manufacturing, and backend to achieve
optimum experience for our customers and, in return, to gain customer’s trust and sustain Company profitability.
To facilitate customer interaction and information access on a real-time basis, TSMC’s EFOUNDRY® services offer a suite of
web-based applications that provide a more active role in design, engineering, and logistics. Designers have 24-hour a day,
seven-day-a-week access to critical information and are able to create custom reports through EFOUNDRY® online services.
Design Collaboration focuses on content availability and accessibility, with close attention to complete, accurate, and current
information at each level of the wafer design life cycle. Engineering Collaboration includes online access to pilot lots, wafer
yields, wafer acceptance test (WAT) analysis, and quality reliability data. Logistics Collaboration provides access to data updated
three times a day on any given wafer lot’s status in fabrication, assembly and testing, final testing, order and shipping.
Customer Satisfaction
To assess customer satisfaction and to ensure that customers’ needs and wants are adequately addressed, TSMC conducts
an annual customer satisfaction survey (ACSS) with all active customers, either by web or interview survey, through an
independent consultancy.
Complementary with ACSS, quarterly-based business reviews (QBRs) are also performed by the customer service team to
survey customers’ satisfaction during their visits on technical and business related services offered. Through both surveys and
intensive interaction with customers by account team, TSMC is able to maintain close touch with customers for better
service and collaboration.
All customer feedback is routinely reviewed by executives and developed into improvement plans to become an integral part of
this survey process with a complete closed-loop. TSMC has maintained a focus on customer survey data as one key indicator of
corporate performance – not just of past performance, but also as a leading indicator of future performance. TSMC has acted
on the belief that satisfaction leads to loyalty, and customer loyalty leads to higher levels of retention and expansion.
22 23
TSMC believes there are many dimensions to corporate social responsibility. We both practice and push ourselves to
improve our performance in the seven dimensions of “morals, business ethics, economy, rule of law, work/life balance,
caring for the earth and the next generation, and philanthropy” in order to carry out the responsibilities that a good
corporate citizen should bear. By doing our part in these seven dimensions, we can act as a stabilizing force in society,
and inspire others to follow, and make society better.
We firmly believe that a corporation’s social responsibility is to act as an uplifting force in society to realize our vision of a
society that works together towards sustainable development, equality and justice, and a harmonious environment to live
and work. Our ten principles of corporate social responsibility are our criteria for continuing to bring positive change to
society.
1. We insist on honesty and integrity. We are honest to our shareholders, employees, and to the public alike.
2. We respect the rule of law and always obey the law.
3. We oppose corruption and reject cronyism. We do not bribe, and do not curry favor with the government or any
government official.
4. We practice good corporate governance, and balance the interests of shareholders, employees, and all stakeholders in
the company.
5. We do not engage in politics.
6. We provide good job opportunities with a safe, comfortable, and intellectually challenging environment to give our
employees both physical comfort and mental stimulation.
7. We contribute our part to controlling global climate change and place great importance on protecting the
environment.
8. We emphasize and reward innovation, and manage the risks that innovation may bring.
9. We actively invest in green businesses such as solid state lighting and solar power to contribute to environmental
protection and conservation.
10. We provide long-term care to communities and continue to support educational and cultural activities.
5. Corporate Social Responsibility

24 25
In the area of morals, TSMC insists on integrity, opposes corruption, and does not seek favor with government officials. In
terms of business ethics, besides the principles above, TSMC maintains good corporate governance, transparent operations,
meets commitments to all stakeholders, and encourages innovation to drive progress and prosperity in industry.
Along the economic dimension, TSMC’s good corporate governance, outstanding operations, and promotion of innovation
allows us to offer good job opportunities and an excellent return to shareholders, creating added value for society. In terms
of rule of law, we do more than obey the law and oppose corruption; we hold ourselves to the highest standards of morality
and business ethics.
In work/life balance, TSMC offers its employees good compensation and a high-quality work environment, and at the same
time pays close attention to our employees’ work/life balance. We advocate eliminating unnecessary meetings, improving
work flows, raising efficiency, and ask managers to lead by example to reduce working hours and to give employees a
balanced and healthy work environment.
We care for the earth and the next generation by providing a healthy living environment. Industry has an especially strong
responsibility to protect the environment and care for the earth’s resources, and TSMC is no exception. TSMC’s new factories
and office buildings all meet green building standards and use environmentally friendly equipment, and office areas also
make use of many energy-saving measures.
While caring for the earth and the next generation, TSMC also does its part in corporate philanthropy. Our employees
formed the TSMC Volunteer Society out of their own initiative to engage with society, including acting as docents at the
National Museum of Natural Science, reading to schoolchildren, and acting as energy-saving volunteers to share their power
conservation know-how with schools. Besides helping society, these volunteer activities also bring happiness and balance to
our employees. In addition, the company also established the TSMC Education and Culture Foundation to actively engage in
social welfare, encourage scholarship, and support community and cultural activities.
TSMC will continue to redouble its efforts in the dimensions above to act as a positive force in society. While creating value
for all our stakeholders, we hold firm to our commitments in environmental sustainability, and aspire to act as a benchmark
for others. Through the hard work of all our employees at TSMC, we have won acclaim for our corporate governance,
operations, investor relations, employee benefits, environmental protection, and other fields. Looking ahead, TSMC will
persist in strengthening our performance and commitment in our principles to benefit all our stakeholders and build a better
future for our society.
Corporate Social Responsibility: Uplift Society
TSMC/Society Morality Business Ethics Economy Rule of Law SustainabilityWork/Life Balance
HappinessPhilanthropy
Integrity V V
Law Compliance V
Anti-Corruption Anti-Bribery Anti-Cronyism
V V V
Environmental Protection Climate Control Energy Conservation
V
Corporate Governance V V
Provide Well-paying Jobs V V
Good Shareholder Return V
Employees’ Work-life Balance V
Encourage Innovation V V
Good Work Environment V
Volunteers Organization V V V
Education and Cultural Foundation V
5.1 Environmental, Safety and Health (ESH) Management
TSMC believes its environmental, safety and health practices should not only comply with legal requirements, but also
measure up to recognized international practices. In 2010, our ESH policy was renewed and endorsed by Chairman and
Chief Executive Officer Dr. Morris Chang. The policy aims to reach the goals of “zero incident” and “sustainable
development”, and to make TSMC a world-class company in environmental, safety and health management. Our strategies
for reaching these goals are to comply with regulations, promote safety and health, strengthen recycling and pollution
prevention, manage ESH risks, instill an ESH culture, establish a green supply chain, and fulfill our related corporate social
responsibilities.
TSMC was honored to be included in the Dow Jones Sustainability Index for the eleventh consecutive year in 2011.
All TSMC manufacturing facilities have received ISO 14001:2004 certification for environmental management systems and
OHSAS 18001:2007 certification for occupational safety and health management systems. All fabs in Taiwan have also been
TOSHMS (Taiwan Occupational Safety and Health Management System) certified since 2009.
TSMC strives for continuous improvement and actively seeks to enhance pollution prevention, power and resource
conservation, waste reduction, safety and health management, fire and explosion prevention and minimize the impact of
other risks, such as earthquakes, in order to reduce the overall environmental, safety and health risk.

26 27
In 2006, TSMC began to adopt the IECQ QC 080000 Hazardous Substance Process Management (HSPM) System in order to
meet regulatory and customer needs for the management of hazardous materials. All TSMC manufacturing facilities have
been QC 080000 certified since 2007. By practicing QC 080000, TSMC ensures that its products comply with regulatory and
customer requirements, including the European Union’s Restriction of Hazardous Substances (RoHS) Directive, EU REACH
(Registration, Evaluation, Authorization and Restriction of Chemicals), Montreal Protocol on substances that deplete the
ozone layer, halogen free in electronic products, and Perfluorooctane Sulfonates (PFOS) restriction standards.
In 2011, TSMC adopted ISO 50001 Energy Management System for the continuous improvement of energy conservation.
TSMC, represented by Fab 12 Phase 4 data center, has become Taiwan’s first company to earn the ISO 50001 certification
for a high density computing data center.
TSMC plans to extend the ISO 50001 Energy Management System to its manufacturing facilities in addition to data centers.
TSMC communicates with suppliers and contractors regarding environmental, safety and health issues and encourages them
to improve their ESH performance. In line with this policy, TSMC uses priority work management and self-management to
govern work performed by contractors. TSMC requires contractors performing high-risk operations to complete certification
for technicians, and to establish their own OHSAS 18001 safety and health management system before bidding on
contracts. This self-management is aimed at increasing the sense of responsibility of our contractors, with the goal of
promoting safety awareness and technical improvement for all contractors in the industry.
TSMC collaborates with suppliers to improve the sustainability of our supply chain regarding ESH-related issues such as
carbon and water footprinting, and conflict mineral management. We not only perform on-site ESH audits at our suppliers
manufacturing sites, but also proactively assist them with improving ESH performance.
Reducing the carbon and water footprints of our supply chain is essential to our green supply chain ideals. Since 2009,
TSMC has required our suppliers to set up carbon inventory procedures. In 2010 TSMC led 15 selected suppliers to join the
carbon footprint development project, which was sponsored by the Taiwan Industrial Development Bureau and assisted by
the Industrial Technology Research Institute. In this project, we completed a carbon footprint of both TSMC and suppliers’
products. In February 2011, we passed the 12-inch wafer and packaged integrated circuit products third-party certification
based on the British PAS2050 product carbon footprint standard, and became the first enterprise in Taiwan to lead
upstream and downstream partners to complete a product carbon footprint.
TSMC also began monitoring potential water shortages in the supply chain and investigating the supply chain’s water
inventory. TSMC is also preparing to work with suppliers on water footprinting and conservation plans. The ESH
management programs of TSMC suppliers are tied to a sustainability index that includes three components: the Green Index,
the Social Index and the Risk Index. The “Green Index” includes environmental management systems, regulatory compliance,
hazardous substance management, conflict mineral investigation, greenhouse gas inventory, carbon footprinting, water
footprinting and other green activities. The “Social Index” includes labor and ethical conducts and participation in social
activities. The “Risk Index” includes safety and health management, fire prevention, natural disaster mitigation, IT
interruption recovery, transportation reliability, supply chain management, pandemic response planning and a business
continuity plan. This sustainability index is applied to TSMC’s critical suppliers. In 2011, we held our 11th annual Supply
Chain Management Forum to show appreciation for the support and contributions of our suppliers, and to recognize several
outstanding equipment suppliers for environmental excellence.
TSMC launched an e-ESH management system called Total ESH Management (TSM). This web-based platform integrates
over 20 ESH IT sub-systems covering the four sectors of “Plan”, “Do”, “Check”, and “Act”, and information, such as risk
assessment, safety management of change, contractor management, training/testing, accident/incident corrective action
requests (CAR), ESH indicators and others. The TSM system serves as the backbone of ESH KPI management and facilitates
the comparison between fabs and their ability to take business decisions and improve operational efficiency. TSMC aims to
reduce both costs and risks while improving ESH management efficiency and effectiveness through the cross-fab
implementation of this platform.
5.2 TSMC Education and Culture Foundation
The TSMC Education and Culture Foundation, established in 1998 to coordinate the Company’s sponsorship as part of its
efforts in corporate social responsibility, continues to devote its resources towards education, community building,
promotion of art and culture events, and the employee volunteer program.
In 2011, to promote art and education, the TSMC Foundation continued to infuse resources to build up a “Children’s Art
Education Center” at Taipei Fine Arts Museum, “Lifting the Ability of High School Physics Experiments,” the sponsorship of
the Berliner Philharmoniker’s concert, and the launching a new broadcast program “Chung-tzu in Hsin’s View.” Aside from
financial sponsorships, TSMC Foundation supports TSMC Volunteer Society, organizing the employees to devote themselves
to the caring of the underprivileged of the communities.
5.3 TSMC Volunteer Program
Fulfilling our corporate social responsibility, in addition to our core business, is an important part of TSMC’s contribution to
society. In particular, TSMC employees possess high professional ability and training, and many serve as volunteers in their
personal time to apply their knowledge and passion to helping others. The TSMC Foundation is dedicated to promoting
education and culture, providing aid for the underprivileged, advocating environmental protection, and caring for
communities, and at the same time encourages employees to engage with society. In 2003, the TSMC Foundation launched
an employee volunteer program to coordinate volunteer activities and invite employees and their family members to make a
long-term commitment to education and culture and combine their individual contributions to make a difference.
28 29
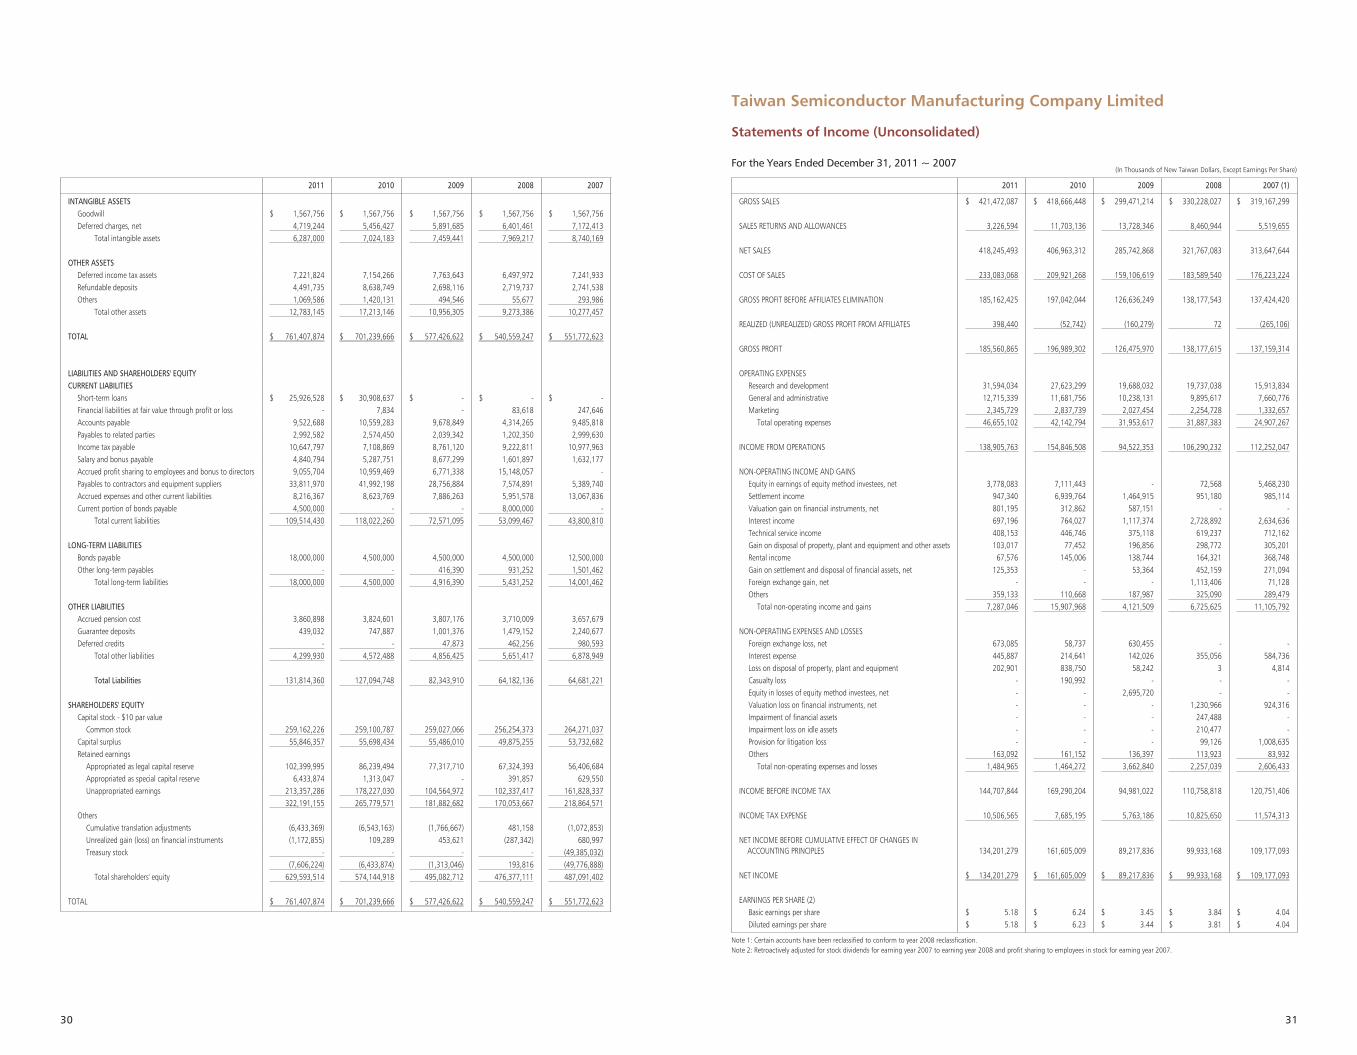
Taiwan Semiconductor Manufacturing Company Limited
Balance Sheets (Unconsolidated)
December 31, 2011~2007
6. Financial Statements
2011 2010 2009 2008 2007
ASSETSCURRENT ASSETS
Cash and cash equivalents $ 85,262,521 $ 109,511,130 $ 117,043,543 $ 138,208,360 $ 72,422,102 Financial assets at fair value through profit or loss 14,925 - 181,743 42,460 42,083 Available-for-sale financial assets 2,617,134 3,918,274 - - 22,267,223 Held-to-maturity financial assets 701,136 4,796,589 9,944,843 5,881,999 11,526,946 Receivables from related parties 24,777,534 25,733,974 22,541,773 11,728,204 26,701,648 Notes and accounts receivable 19,894,386 22,250,905 19,884,520 11,441,176 17,911,328 Allowance for doubtful receivables (485,120) (488,000) (431,000) (436,746) (688,972)Allowance for sales returns and others (4,887,879) (7,341,444) (8,583,632) (5,868,582) (3,856,685)Other receivables from related parties 188,028 1,302,281 246,003 489,742 525,308 Other financial assets 122,010 418,206 1,104,072 711,755 331,698 Inventories 22,853,397 25,646,348 18,830,216 12,807,936 20,987,142 Deferred income tax assets 5,779,544 5,133,775 4,063,410 3,650,700 5,268,000 Prepaid expenses and other current assets 1,725,736 1,352,244 1,006,046 1,192,475 861,465
Total current assets 158,563,352 192,234,282 185,831,537 179,849,479 174,299,286
LONG-TERM INVESTMENTSInvestments accounted for using equity method 128,200,718 114,977,174 104,660,098 109,871,178 113,048,081 Available-for-sale financial assets - 1,033,049 1,046,672 2,032,658 1,397,186 Held-to-maturity financial assets 702,291 1,405,698 12,219,055 11,761,325 8,697,726 Financial assets carried at cost 497,835 497,835 501,988 519,502 748,160
Total long-term investments 129,400,844 117,913,756 118,427,813 124,184,663 123,891,153
PROPERTY, PLANT AND EQUIPMENTCost
Buildings 149,495,478 128,646,942 124,522,047 114,014,588 101,907,892 Machinery and equipment 984,978,666 852,733,592 713,426,126 635,008,261 589,131,625 Office equipment 13,824,434 11,730,537 10,781,099 9,748,869 9,167,107
1,148,298,578 993,111,071 848,729,272 758,771,718 700,206,624 Accumulated depreciation (804,740,797) (706,605,445) (627,764,323) (557,247,254) (486,725,019)Advance payments and construction in progress 110,815,752 80,348,673 33,786,577 17,758,038 21,082,953
Net property, plant and equipment 454,373,533 366,854,299 254,751,526 219,282,502 234,564,558
(In Thousands of New Taiwan Dollars)
30 31
2011 2010 2009 2008 2007
INTANGIBLE ASSETSGoodwill $ 1,567,756 $ 1,567,756 $ 1,567,756 $ 1,567,756 $ 1,567,756 Deferred charges, net 4,719,244 5,456,427 5,891,685 6,401,461 7,172,413
Total intangible assets 6,287,000 7,024,183 7,459,441 7,969,217 8,740,169
OTHER ASSETSDeferred income tax assets 7,221,824 7,154,266 7,763,643 6,497,972 7,241,933 Refundable deposits 4,491,735 8,638,749 2,698,116 2,719,737 2,741,538 Others 1,069,586 1,420,131 494,546 55,677 293,986
Total other assets 12,783,145 17,213,146 10,956,305 9,273,386 10,277,457
TOTAL $ 761,407,874 $ 701,239,666 $ 577,426,622 $ 540,559,247 $ 551,772,623
LIABILITIES AND SHAREHOLDERS' EQUITYCURRENT LIABILITIES
Short-term loans $ 25,926,528 $ 30,908,637 $ - $ - $ - Financial liabilities at fair value through profit or loss - 7,834 - 83,618 247,646 Accounts payable 9,522,688 10,559,283 9,678,849 4,314,265 9,485,818 Payables to related parties 2,992,582 2,574,450 2,039,342 1,202,350 2,999,630 Income tax payable 10,647,797 7,108,869 8,761,120 9,222,811 10,977,963 Salary and bonus payable 4,840,794 5,287,751 8,677,299 1,601,897 1,632,177 Accrued profit sharing to employees and bonus to directors 9,055,704 10,959,469 6,771,338 15,148,057 - Payables to contractors and equipment suppliers 33,811,970 41,992,198 28,756,884 7,574,891 5,389,740 Accrued expenses and other current liabilities 8,216,367 8,623,769 7,886,263 5,951,578 13,067,836 Current portion of bonds payable 4,500,000 - - 8,000,000 -
Total current liabilities 109,514,430 118,022,260 72,571,095 53,099,467 43,800,810
LONG-TERM LIABILITIESBonds payable 18,000,000 4,500,000 4,500,000 4,500,000 12,500,000 Other long-term payables - - 416,390 931,252 1,501,462
Total long-term liabilities 18,000,000 4,500,000 4,916,390 5,431,252 14,001,462
OTHER LIABILITIESAccrued pension cost 3,860,898 3,824,601 3,807,176 3,710,009 3,657,679 Guarantee deposits 439,032 747,887 1,001,376 1,479,152 2,240,677 Deferred credits - - 47,873 462,256 980,593
Total other liabilities 4,299,930 4,572,488 4,856,425 5,651,417 6,878,949
Total Liabilities 131,814,360 127,094,748 82,343,910 64,182,136 64,681,221
SHAREHOLDERS' EQUITYCapital stock - $10 par value
Common stock 259,162,226 259,100,787 259,027,066 256,254,373 264,271,037 Capital surplus 55,846,357 55,698,434 55,486,010 49,875,255 53,732,682 Retained earnings
Appropriated as legal capital reserve 102,399,995 86,239,494 77,317,710 67,324,393 56,406,684 Appropriated as special capital reserve 6,433,874 1,313,047 - 391,857 629,550 Unappropriated earnings 213,357,286 178,227,030 104,564,972 102,337,417 161,828,337
322,191,155 265,779,571 181,882,682 170,053,667 218,864,571 Others
Cumulative translation adjustments (6,433,369) (6,543,163) (1,766,667) 481,158 (1,072,853)Unrealized gain (loss) on financial instruments (1,172,855) 109,289 453,621 (287,342) 680,997 Treasury stock - - - - (49,385,032)
(7,606,224) (6,433,874) (1,313,046) 193,816 (49,776,888)Total shareholders' equity 629,593,514 574,144,918 495,082,712 476,377,111 487,091,402
TOTAL $ 761,407,874 $ 701,239,666 $ 577,426,622 $ 540,559,247 $ 551,772,623
2011 2010 2009 2008 2007 (1)
GROSS SALES $ 421,472,087 $ 418,666,448 $ 299,471,214 $ 330,228,027 $ 319,167,299
SALES RETURNS AND ALLOWANCES 3,226,594 11,703,136 13,728,346 8,460,944 5,519,655
NET SALES 418,245,493 406,963,312 285,742,868 321,767,083 313,647,644
COST OF SALES 233,083,068 209,921,268 159,106,619 183,589,540 176,223,224
GROSS PROFIT BEFORE AFFILIATES ELIMINATION 185,162,425 197,042,044 126,636,249 138,177,543 137,424,420
REALIZED (UNREALIZED) GROSS PROFIT FROM AFFILIATES 398,440 (52,742) (160,279) 72 (265,106)
GROSS PROFIT 185,560,865 196,989,302 126,475,970 138,177,615 137,159,314
OPERATING EXPENSESResearch and development 31,594,034 27,623,299 19,688,032 19,737,038 15,913,834 General and administrative 12,715,339 11,681,756 10,238,131 9,895,617 7,660,776 Marketing 2,345,729 2,837,739 2,027,454 2,254,728 1,332,657
Total operating expenses 46,655,102 42,142,794 31,953,617 31,887,383 24,907,267
INCOME FROM OPERATIONS 138,905,763 154,846,508 94,522,353 106,290,232 112,252,047
NON-OPERATING INCOME AND GAINSEquity in earnings of equity method investees, net 3,778,083 7,111,443 - 72,568 5,468,230 Settlement income 947,340 6,939,764 1,464,915 951,180 985,114 Valuation gain on financial instruments, net 801,195 312,862 587,151 - - Interest income 697,196 764,027 1,117,374 2,728,892 2,634,636 Technical service income 408,153 446,746 375,118 619,237 712,162 Gain on disposal of property, plant and equipment and other assets 103,017 77,452 196,856 298,772 305,201 Rental income 67,576 145,006 138,744 164,321 368,748 Gain on settlement and disposal of financial assets, net 125,353 - 53,364 452,159 271,094 Foreign exchange gain, net - - - 1,113,406 71,128 Others 359,133 110,668 187,987 325,090 289,479
Total non-operating income and gains 7,287,046 15,907,968 4,121,509 6,725,625 11,105,792
NON-OPERATING EXPENSES AND LOSSESForeign exchange loss, net 673,085 58,737 630,455 - - Interest expense 445,887 214,641 142,026 355,056 584,736 Loss on disposal of property, plant and equipment 202,901 838,750 58,242 3 4,814 Casualty loss - 190,992 - - - Equity in losses of equity method investees, net - - 2,695,720 - - Valuation loss on financial instruments, net - - - 1,230,966 924,316 Impairment of financial assets - - - 247,488 - Impairment loss on idle assets - - - 210,477 - Provision for litigation loss - - - 99,126 1,008,635 Others 163,092 161,152 136,397 113,923 83,932
Total non-operating expenses and losses 1,484,965 1,464,272 3,662,840 2,257,039 2,606,433
INCOME BEFORE INCOME TAX 144,707,844 169,290,204 94,981,022 110,758,818 120,751,406
INCOME TAX EXPENSE 10,506,565 7,685,195 5,763,186 10,825,650 11,574,313
NE T INCOME BEFORE CUMULATIVE EFFECT OF CHANGES IN ACCOUNTING PRINCIPLES 134,201,279 161,605,009 89,217,836 99,933,168 109,177,093
NET INCOME $ 134,201,279 $ 161,605,009 $ 89,217,836 $ 99,933,168 $ 109,177,093
EARNINGS PER SHARE (2)Basic earnings per share $ 5.18 $ 6.24 $ 3.45 $ 3.84 $ 4.04 Diluted earnings per share $ 5.18 $ 6.23 $ 3.44 $ 3.81 $ 4.04
Note 1: Certain accounts have been reclassified to conform to year 2008 reclassfication.Note 2: Retroactively adjusted for stock dividends for earning year 2007 to earning year 2008 and profit sharing to employees in stock for earning year 2007.
Taiwan Semiconductor Manufacturing Company Limited
Statements of Income (Unconsolidated)
For the Years Ended December 31, 2011 ~ 2007(In Thousands of New Taiwan Dollars, Except Earnings Per Share)
32 33
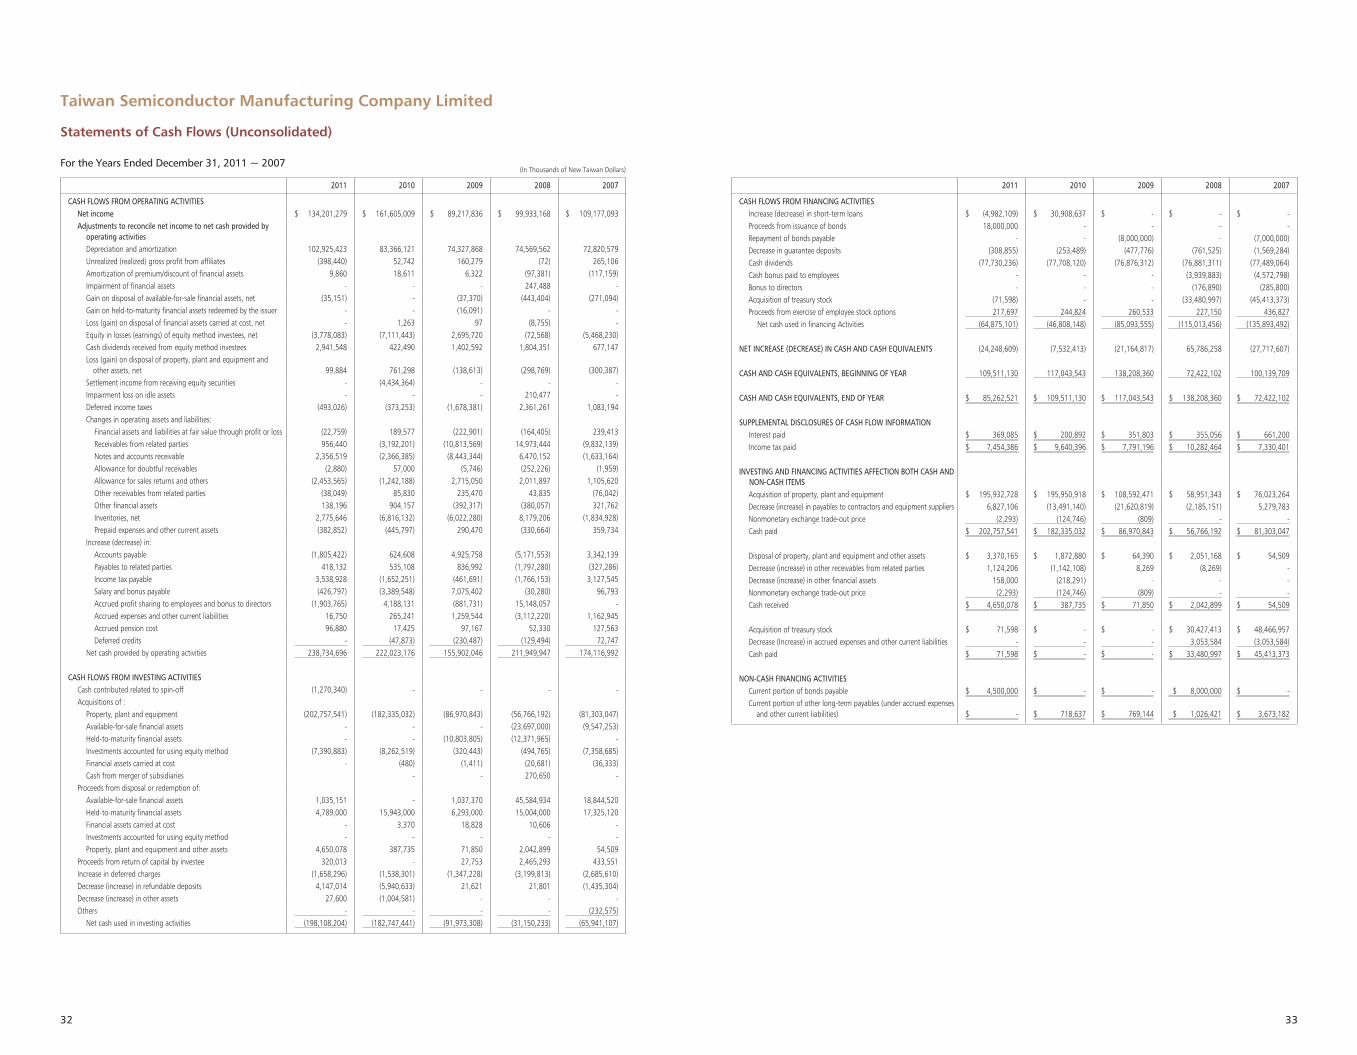
2011 2010 2009 2008 2007
CASH FLOWS FROM OPERATING ACTIVITIESNet income $ 134,201,279 $ 161,605,009 $ 89,217,836 $ 99,933,168 $ 109,177,093 Ad justments to reconcile net income to net cash provided by
operating activitiesDepreciation and amortization 102,925,423 83,366,121 74,327,868 74,569,562 72,820,579 Unrealized (realized) gross profit from affiliates (398,440) 52,742 160,279 (72) 265,106 Amortization of premium/discount of financial assets 9,860 18,611 6,322 (97,381) (117,159)Impairment of financial assets - - - 247,488 - Gain on disposal of available-for-sale financial assets, net (35,151) - (37,370) (443,404) (271,094)Gain on held-to-maturity financial assets redeemed by the issuer - - (16,091) - - Loss (gain) on disposal of financial assets carried at cost, net - 1,263 97 (8,755) - Equity in losses (earnings) of equity method investees, net (3,778,083) (7,111,443) 2,695,720 (72,568) (5,468,230)Cash dividends received from equity method investees 2,941,548 422,490 1,402,592 1,804,351 677,147 Lo ss (gain) on disposal of property, plant and equipment and
other assets, net 99,884 761,298 (138,613) (298,769) (300,387)Settlement income from receiving equity securities - (4,434,364) - - - Impairment loss on idle assets - - - 210,477 - Deferred income taxes (493,026) (373,253) (1,678,381) 2,361,261 1,083,194 Changes in operating assets and liabilities:
Financial assets and liabilities at fair value through profit or loss (22,759) 189,577 (222,901) (164,405) 239,413 Receivables from related parties 956,440 (3,192,201) (10,813,569) 14,973,444 (9,832,139)Notes and accounts receivable 2,356,519 (2,366,385) (8,443,344) 6,470,152 (1,633,164)Allowance for doubtful receivables (2,880) 57,000 (5,746) (252,226) (1,959)Allowance for sales returns and others (2,453,565) (1,242,188) 2,715,050 2,011,897 1,105,620 Other receivables from related parties (38,049) 85,830 235,470 43,835 (76,042)Other financial assets 138,196 904,157 (392,317) (380,057) 321,762 Inventories, net 2,775,646 (6,816,132) (6,022,280) 8,179,206 (1,834,928)Prepaid expenses and other current assets (382,852) (445,797) 290,470 (330,664) 359,734
Increase (decrease) in:Accounts payable (1,805,422) 624,608 4,925,758 (5,171,553) 3,342,139 Payables to related parties 418,132 535,108 836,992 (1,797,280) (327,286)Income tax payable 3,538,928 (1,652,251) (461,691) (1,766,153) 3,127,545 Salary and bonus payable (426,797) (3,389,548) 7,075,402 (30,280) 96,793 Accrued profit sharing to employees and bonus to directors (1,903,765) 4,188,131 (881,731) 15,148,057 - Accrued expenses and other current liabilities 16,750 265,241 1,259,544 (3,112,220) 1,162,945 Accrued pension cost 96,880 17,425 97,167 52,330 127,563 Deferred credits - (47,873) (230,487) (129,494) 72,747
Net cash provided by operating activities 238,734,696 222,023,176 155,902,046 211,949,947 174,116,992
CASH FLOWS FROM INVESTING ACTIVITIESCash contributed related to spin-off (1,270,340) - - - - Acquisitions of :
Property, plant and equipment (202,757,541) (182,335,032) (86,970,843) (56,766,192) (81,303,047)Available-for-sale financial assets - - - (23,697,000) (9,547,253)Held-to-maturity financial assets - - (10,803,805) (12,371,965) - Investments accounted for using equity method (7,390,883) (8,262,519) (320,443) (494,765) (7,358,685)Financial assets carried at cost - (480) (1,411) (20,681) (36,333)Cash from merger of subsidiaries - - 270,650 -
Proceeds from disposal or redemption of:Available-for-sale financial assets 1,035,151 - 1,037,370 45,584,934 18,844,520 Held-to-maturity financial assets 4,789,000 15,943,000 6,293,000 15,004,000 17,325,120 Financial assets carried at cost - 3,370 18,828 10,606 - Investments accounted for using equity method - - - - - Property, plant and equipment and other assets 4,650,078 387,735 71,850 2,042,899 54,509
Proceeds from return of capital by investee 320,013 - 27,753 2,465,293 433,551 Increase in deferred charges (1,658,296) (1,538,301) (1,347,228) (3,199,813) (2,685,610)Decrease (increase) in refundable deposits 4,147,014 (5,940,633) 21,621 21,801 (1,435,304)Decrease (increase) in other assets 27,600 (1,004,581) - - - Others - - - - (232,575)
Net cash used in investing activities (198,108,204) (182,747,441) (91,973,308) (31,150,233) (65,941,107)
Taiwan Semiconductor Manufacturing Company Limited
Statements of Cash Flows (Unconsolidated)
For the Years Ended December 31, 2011 ~ 2007(In Thousands of New Taiwan Dollars)
2011 2010 2009 2008 2007
CASH FLOWS FROM FINANCING ACTIVITIESIncrease (decrease) in short-term loans $ (4,982,109) $ 30,908,637 $ - $ - $ - Proceeds from issuance of bonds 18,000,000 - - - - Repayment of bonds payable - - (8,000,000) - (7,000,000)Decrease in guarantee deposits (308,855) (253,489) (477,776) (761,525) (1,569,284)Cash dividends (77,730,236) (77,708,120) (76,876,312) (76,881,311) (77,489,064)Cash bonus paid to employees - - - (3,939,883) (4,572,798)Bonus to directors - - - (176,890) (285,800)Acquisition of treasury stock (71,598) - - (33,480,997) (45,413,373)Proceeds from exercise of employee stock options 217,697 244,824 260,533 227,150 436,827
Net cash used in financing Activities (64,875,101) (46,808,148) (85,093,555) (115,013,456) (135,893,492)
NET INCREASE (DECREASE) IN CASH AND CASH EQUIVALENTS (24,248,609) (7,532,413) (21,164,817) 65,786,258 (27,717,607)
CASH AND CASH EQUIVALENTS, BEGINNING OF YEAR 109,511,130 117,043,543 138,208,360 72,422,102 100,139,709 CASH AND CASH EQUIVALENTS, END OF YEAR $ 85,262,521 $ 109,511,130 $ 117,043,543 $ 138,208,360 $ 72,422,102
SUPPLEMENTAL DISCLOSURES OF CASH FLOW INFORMATIONInterest paid $ 369,085 $ 200,892 $ 351,803 $ 355,056 $ 661,200 Income tax paid $ 7,454,386 $ 9,640,396 $ 7,791,196 $ 10,282,464 $ 7,330,401
INVESTING AND FINANCING ACTIVITIES AFFECTION BOTH CASH AND NON-CASH ITEMS
Acquisition of property, plant and equipment $ 195,932,728 $ 195,950,918 $ 108,592,471 $ 58,951,343 $ 76,023,264 Decrease (increase) in payables to contractors and equipment suppliers 6,827,106 (13,491,140) (21,620,819) (2,185,151) 5,279,783 Nonmonetary exchange trade-out price (2,293) (124,746) (809) - - Cash paid $ 202,757,541 $ 182,335,032 $ 86,970,843 $ 56,766,192 $ 81,303,047
Disposal of property, plant and equipment and other assets $ 3,370,165 $ 1,872,880 $ 64,390 $ 2,051,168 $ 54,509 Decrease (increase) in other receivables from related parties 1,124,206 (1,142,108) 8,269 (8,269) - Decrease (increase) in other financial assets 158,000 (218,291) - - - Nonmonetary exchange trade-out price (2,293) (124,746) (809) - - Cash received $ 4,650,078 $ 387,735 $ 71,850 $ 2,042,899 $ 54,509
Acquisition of treasury stock $ 71,598 $ - $ - $ 30,427,413 $ 48,466,957 Decrease (Increase) in accrued expenses and other current liabilities - - - 3,053,584 (3,053,584)Cash paid $ 71,598 $ - $ - $ 33,480,997 $ 45,413,373
NON-CASH FINANCING ACTIVITIESCurrent portion of bonds payable $ 4,500,000 $ - $ - $ 8,000,000 $ - Cu rrent portion of other long-term payables (under accrued expenses
and other current liabilities) $ - $ 718,637 $ 769,144 $ 1,026,421 $ 3,673,182
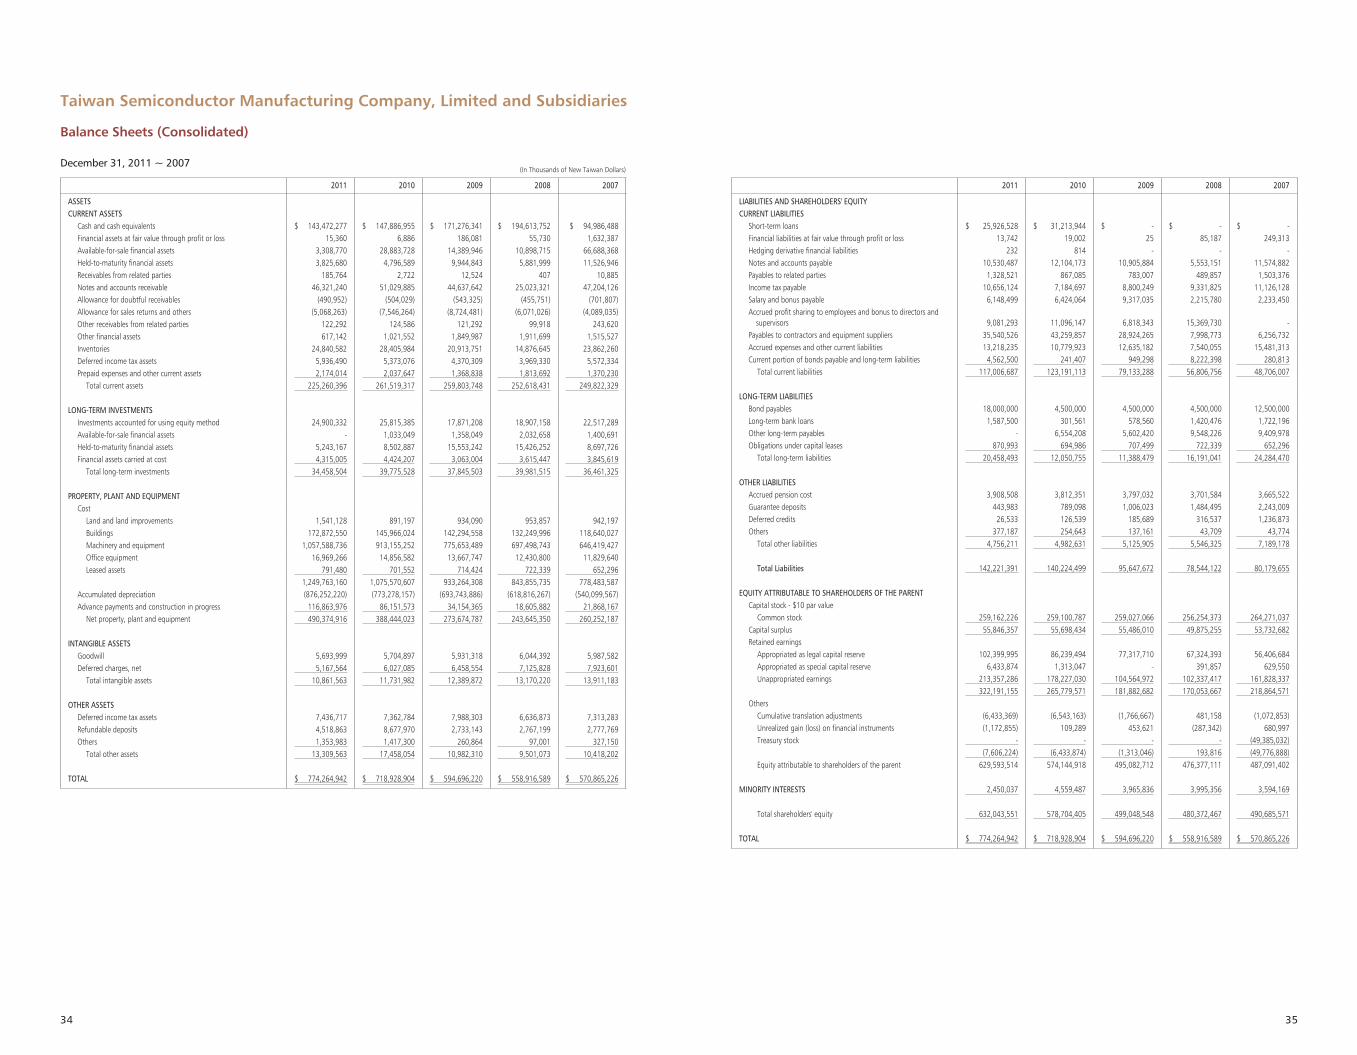
34 35
2011 2010 2009 2008 2007
ASSETS CURRENT ASSETS
Cash and cash equivalents $ 143,472,277 $ 147,886,955 $ 171,276,341 $ 194,613,752 $ 94,986,488 Financial assets at fair value through profit or loss 15,360 6,886 186,081 55,730 1,632,387 Available-for-sale financial assets 3,308,770 28,883,728 14,389,946 10,898,715 66,688,368 Held-to-maturity financial assets 3,825,680 4,796,589 9,944,843 5,881,999 11,526,946 Receivables from related parties 185,764 2,722 12,524 407 10,885 Notes and accounts receivable 46,321,240 51,029,885 44,637,642 25,023,321 47,204,126 Allowance for doubtful receivables (490,952) (504,029) (543,325) (455,751) (701,807)Allowance for sales returns and others (5,068,263) (7,546,264) (8,724,481) (6,071,026) (4,089,035)Other receivables from related parties 122,292 124,586 121,292 99,918 243,620 Other financial assets 617,142 1,021,552 1,849,987 1,911,699 1,515,527 Inventories 24,840,582 28,405,984 20,913,751 14,876,645 23,862,260 Deferred income tax assets 5,936,490 5,373,076 4,370,309 3,969,330 5,572,334 Prepaid expenses and other current assets 2,174,014 2,037,647 1,368,838 1,813,692 1,370,230
Total current assets 225,260,396 261,519,317 259,803,748 252,618,431 249,822,329
LONG-TERM INVESTMENTS Investments accounted for using equity method 24,900,332 25,815,385 17,871,208 18,907,158 22,517,289 Available-for-sale financial assets - 1,033,049 1,358,049 2,032,658 1,400,691 Held-to-maturity financial assets 5,243,167 8,502,887 15,553,242 15,426,252 8,697,726 Financial assets carried at cost 4,315,005 4,424,207 3,063,004 3,615,447 3,845,619
Total long-term investments 34,458,504 39,775,528 37,845,503 39,981,515 36,461,325
PROPERTY, PLANT AND EQUIPMENT Cost
Land and land improvements 1,541,128 891,197 934,090 953,857 942,197 Buildings 172,872,550 145,966,024 142,294,558 132,249,996 118,640,027 Machinery and equipment 1,057,588,736 913,155,252 775,653,489 697,498,743 646,419,427 Office equipment 16,969,266 14,856,582 13,667,747 12,430,800 11,829,640 Leased assets 791,480 701,552 714,424 722,339 652,296
1,249,763,160 1,075,570,607 933,264,308 843,855,735 778,483,587 Accumulated depreciation (876,252,220) (773,278,157) (693,743,886) (618,816,267) (540,099,567)Advance payments and construction in progress 116,863,976 86,151,573 34,154,365 18,605,882 21,868,167
Net property, plant and equipment 490,374,916 388,444,023 273,674,787 243,645,350 260,252,187
INTANGIBLE ASSETSGoodwill 5,693,999 5,704,897 5,931,318 6,044,392 5,987,582 Deferred charges, net 5,167,564 6,027,085 6,458,554 7,125,828 7,923,601
Total intangible assets 10,861,563 11,731,982 12,389,872 13,170,220 13,911,183
OTHER ASSETSDeferred income tax assets 7,436,717 7,362,784 7,988,303 6,636,873 7,313,283 Refundable deposits 4,518,863 8,677,970 2,733,143 2,767,199 2,777,769 Others 1,353,983 1,417,300 260,864 97,001 327,150
Total other assets 13,309,563 17,458,054 10,982,310 9,501,073 10,418,202
TOTAL $ 774,264,942 $ 718,928,904 $ 594,696,220 $ 558,916,589 $ 570,865,226
Taiwan Semiconductor Manufacturing Company, Limited and Subsidiaries
Balance Sheets (Consolidated)
December 31, 2011 ~ 2007(In Thousands of New Taiwan Dollars)
2011 2010 2009 2008 2007
LIABILITIES AND SHAREHOLDERS' EQUITYCURRENT LIABILITIES
Short-term loans $ 25,926,528 $ 31,213,944 $ - $ - $ - Financial liabilities at fair value through profit or loss 13,742 19,002 25 85,187 249,313 Hedging derivative financial liabilities 232 814 - - - Notes and accounts payable 10,530,487 12,104,173 10,905,884 5,553,151 11,574,882 Payables to related parties 1,328,521 867,085 783,007 489,857 1,503,376 Income tax payable 10,656,124 7,184,697 8,800,249 9,331,825 11,126,128 Salary and bonus payable 6,148,499 6,424,064 9,317,035 2,215,780 2,233,450 Ac crued profit sharing to employees and bonus to directors and
supervisors 9,081,293 11,096,147 6,818,343 15,369,730 - Payables to contractors and equipment suppliers 35,540,526 43,259,857 28,924,265 7,998,773 6,256,732 Accrued expenses and other current liabilities 13,218,235 10,779,923 12,635,182 7,540,055 15,481,313 Current portion of bonds payable and long-term liabilities 4,562,500 241,407 949,298 8,222,398 280,813
Total current liabilities 117,006,687 123,191,113 79,133,288 56,806,756 48,706,007
LONG-TERM LIABILITIESBond payables 18,000,000 4,500,000 4,500,000 4,500,000 12,500,000 Long-term bank loans 1,587,500 301,561 578,560 1,420,476 1,722,196 Other long-term payables - 6,554,208 5,602,420 9,548,226 9,409,978 Obligations under capital leases 870,993 694,986 707,499 722,339 652,296
Total long-term liabilities 20,458,493 12,050,755 11,388,479 16,191,041 24,284,470
OTHER LIABILITIESAccrued pension cost 3,908,508 3,812,351 3,797,032 3,701,584 3,665,522 Guarantee deposits 443,983 789,098 1,006,023 1,484,495 2,243,009 Deferred credits 26,533 126,539 185,689 316,537 1,236,873 Others 377,187 254,643 137,161 43,709 43,774
Total other liabilities 4,756,211 4,982,631 5,125,905 5,546,325 7,189,178
Total Liabilities 142,221,391 140,224,499 95,647,672 78,544,122 80,179,655
EQUITY ATTRIBUTABLE TO SHAREHOLDERS OF THE PARENTCapital stock - $10 par value
Common stock 259,162,226 259,100,787 259,027,066 256,254,373 264,271,037 Capital surplus 55,846,357 55,698,434 55,486,010 49,875,255 53,732,682 Retained earnings
Appropriated as legal capital reserve 102,399,995 86,239,494 77,317,710 67,324,393 56,406,684 Appropriated as special capital reserve 6,433,874 1,313,047 - 391,857 629,550 Unappropriated earnings 213,357,286 178,227,030 104,564,972 102,337,417 161,828,337
322,191,155 265,779,571 181,882,682 170,053,667 218,864,571 Others
Cumulative translation adjustments (6,433,369) (6,543,163) (1,766,667) 481,158 (1,072,853)Unrealized gain (loss) on financial instruments (1,172,855) 109,289 453,621 (287,342) 680,997 Treasury stock - - - - (49,385,032)
(7,606,224) (6,433,874) (1,313,046) 193,816 (49,776,888)Equity attributable to shareholders of the parent 629,593,514 574,144,918 495,082,712 476,377,111 487,091,402
MINORITY INTERESTS 2,450,037 4,559,487 3,965,836 3,995,356 3,594,169
Total shareholders' equity 632,043,551 578,704,405 499,048,548 480,372,467 490,685,571
TOTAL $ 774,264,942 $ 718,928,904 $ 594,696,220 $ 558,916,589 $ 570,865,226
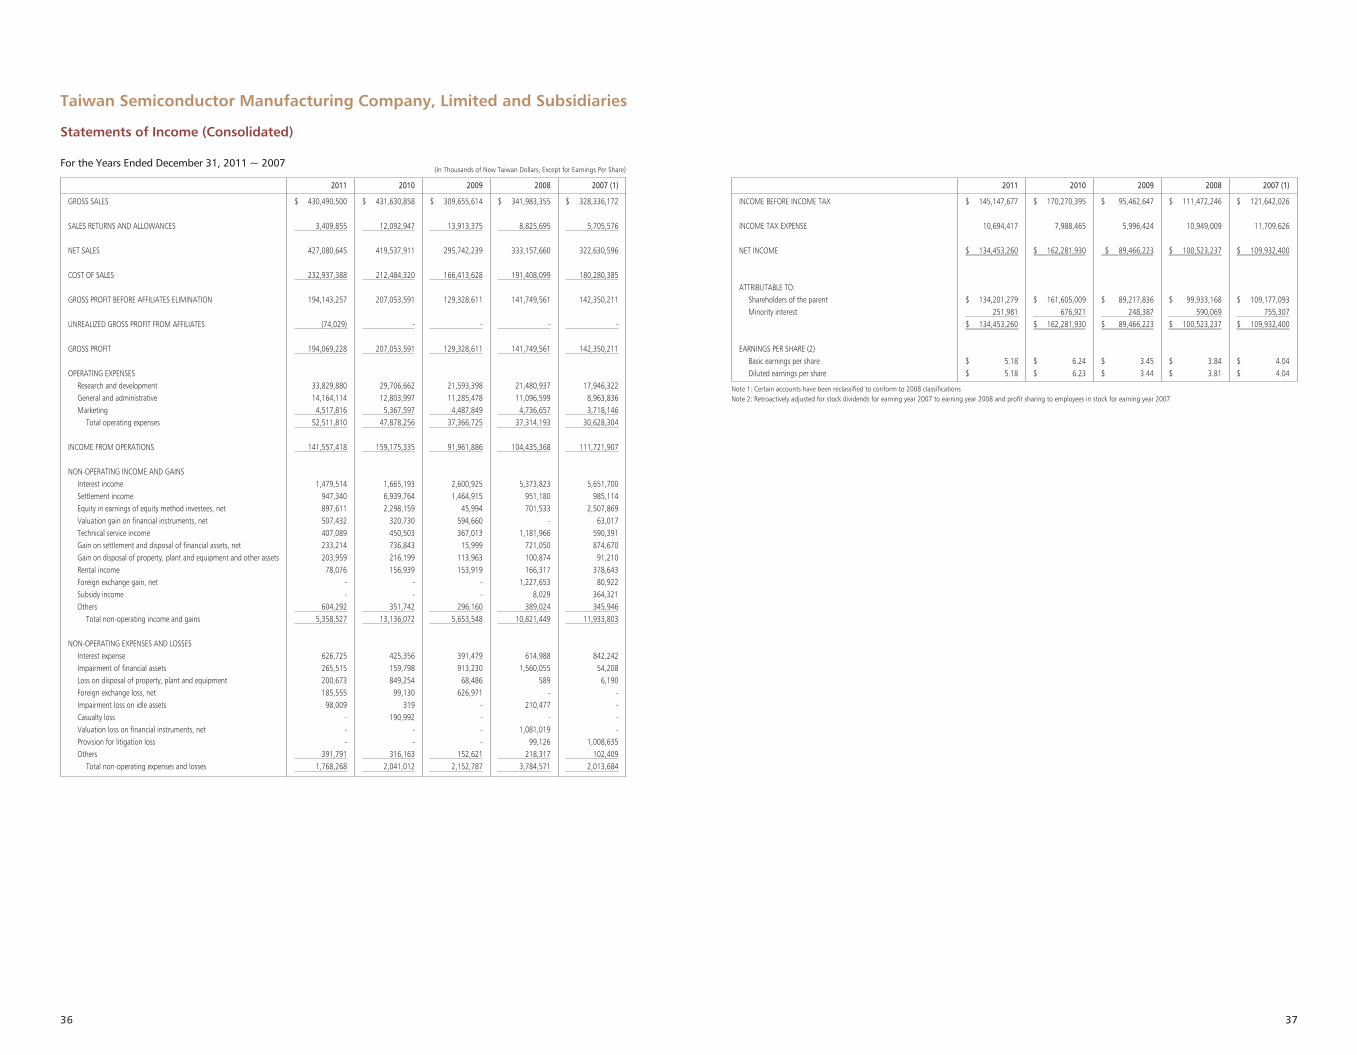
36 37
2011 2010 2009 2008 2007 (1)
GROSS SALES $ 430,490,500 $ 431,630,858 $ 309,655,614 $ 341,983,355 $ 328,336,172
SALES RETURNS AND ALLOWANCES 3,409,855 12,092,947 13,913,375 8,825,695 5,705,576
NET SALES 427,080,645 419,537,911 295,742,239 333,157,660 322,630,596
COST OF SALES 232,937,388 212,484,320 166,413,628 191,408,099 180,280,385
GROSS PROFIT BEFORE AFFILIATES ELIMINATION 194,143,257 207,053,591 129,328,611 141,749,561 142,350,211
UNREALIZED GROSS PROFIT FROM AFFILIATES (74,029) - - - -
GROSS PROFIT 194,069,228 207,053,591 129,328,611 141,749,561 142,350,211
OPERATING EXPENSESResearch and development 33,829,880 29,706,662 21,593,398 21,480,937 17,946,322 General and administrative 14,164,114 12,803,997 11,285,478 11,096,599 8,963,836 Marketing 4,517,816 5,367,597 4,487,849 4,736,657 3,718,146
Total operating expenses 52,511,810 47,878,256 37,366,725 37,314,193 30,628,304
INCOME FROM OPERATIONS 141,557,418 159,175,335 91,961,886 104,435,368 111,721,907
NON-OPERATING INCOME AND GAINSInterest income 1,479,514 1,665,193 2,600,925 5,373,823 5,651,700 Settlement income 947,340 6,939,764 1,464,915 951,180 985,114 Equity in earnings of equity method investees, net 897,611 2,298,159 45,994 701,533 2,507,869 Valuation gain on financial instruments, net 507,432 320,730 594,660 - 63,017 Technical service income 407,089 450,503 367,013 1,181,966 590,391 Gain on settlement and disposal of financial assets, net 233,214 736,843 15,999 721,050 874,670 Gain on disposal of property, plant and equipment and other assets 203,959 216,199 113,963 100,874 91,210 Rental income 78,076 156,939 153,919 166,317 378,643 Foreign exchange gain, net - - - 1,227,653 80,922 Subsidy income - - - 8,029 364,321 Others 604,292 351,742 296,160 389,024 345,946
Total non-operating income and gains 5,358,527 13,136,072 5,653,548 10,821,449 11,933,803
NON-OPERATING EXPENSES AND LOSSESInterest expense 626,725 425,356 391,479 614,988 842,242 Impairment of financial assets 265,515 159,798 913,230 1,560,055 54,208 Loss on disposal of property, plant and equipment 200,673 849,254 68,486 589 6,190 Foreign exchange loss, net 185,555 99,130 626,971 - - Impairment loss on idle assets 98,009 319 - 210,477 - Casualty loss - 190,992 - - - Valuation loss on financial instruments, net - - - 1,081,019 - Provision for litigation loss - - - 99,126 1,008,635 Others 391,791 316,163 152,621 218,317 102,409
Total non-operating expenses and losses 1,768,268 2,041,012 2,152,787 3,784,571 2,013,684
Taiwan Semiconductor Manufacturing Company, Limited and Subsidiaries
Statements of Income (Consolidated)
For the Years Ended December 31, 2011 ~ 2007(In Thousands of New Taiwan Dollars, Except for Earnings Per Share)
2011 2010 2009 2008 2007 (1)
INCOME BEFORE INCOME TAX $ 145,147,677 $ 170,270,395 $ 95,462,647 $ 111,472,246 $ 121,642,026
INCOME TAX EXPENSE 10,694,417 7,988,465 5,996,424 10,949,009 11,709,626
NET INCOME $ 134,453,260 $ 162,281,930 $ 89,466,223 $ 100,523,237 $ 109,932,400
ATTRIBUTABLE TO:Shareholders of the parent $ 134,201,279 $ 161,605,009 $ 89,217,836 $ 99,933,168 $ 109,177,093 Minority interest 251,981 676,921 248,387 590,069 755,307
$ 134,453,260 $ 162,281,930 $ 89,466,223 $ 100,523,237 $ 109,932,400
EARNINGS PER SHARE (2)Basic earnings per share $ 5.18 $ 6.24 $ 3.45 $ 3.84 $ 4.04 Diluted earnings per share $ 5.18 $ 6.23 $ 3.44 $ 3.81 $ 4.04
Note 1: Certain accounts have been reclassified to conform to 2008 classificationsNote 2: Retroactively adjusted for stock dividends for earning year 2007 to earning year 2008 and profit sharing to employees in stock for earning year 2007
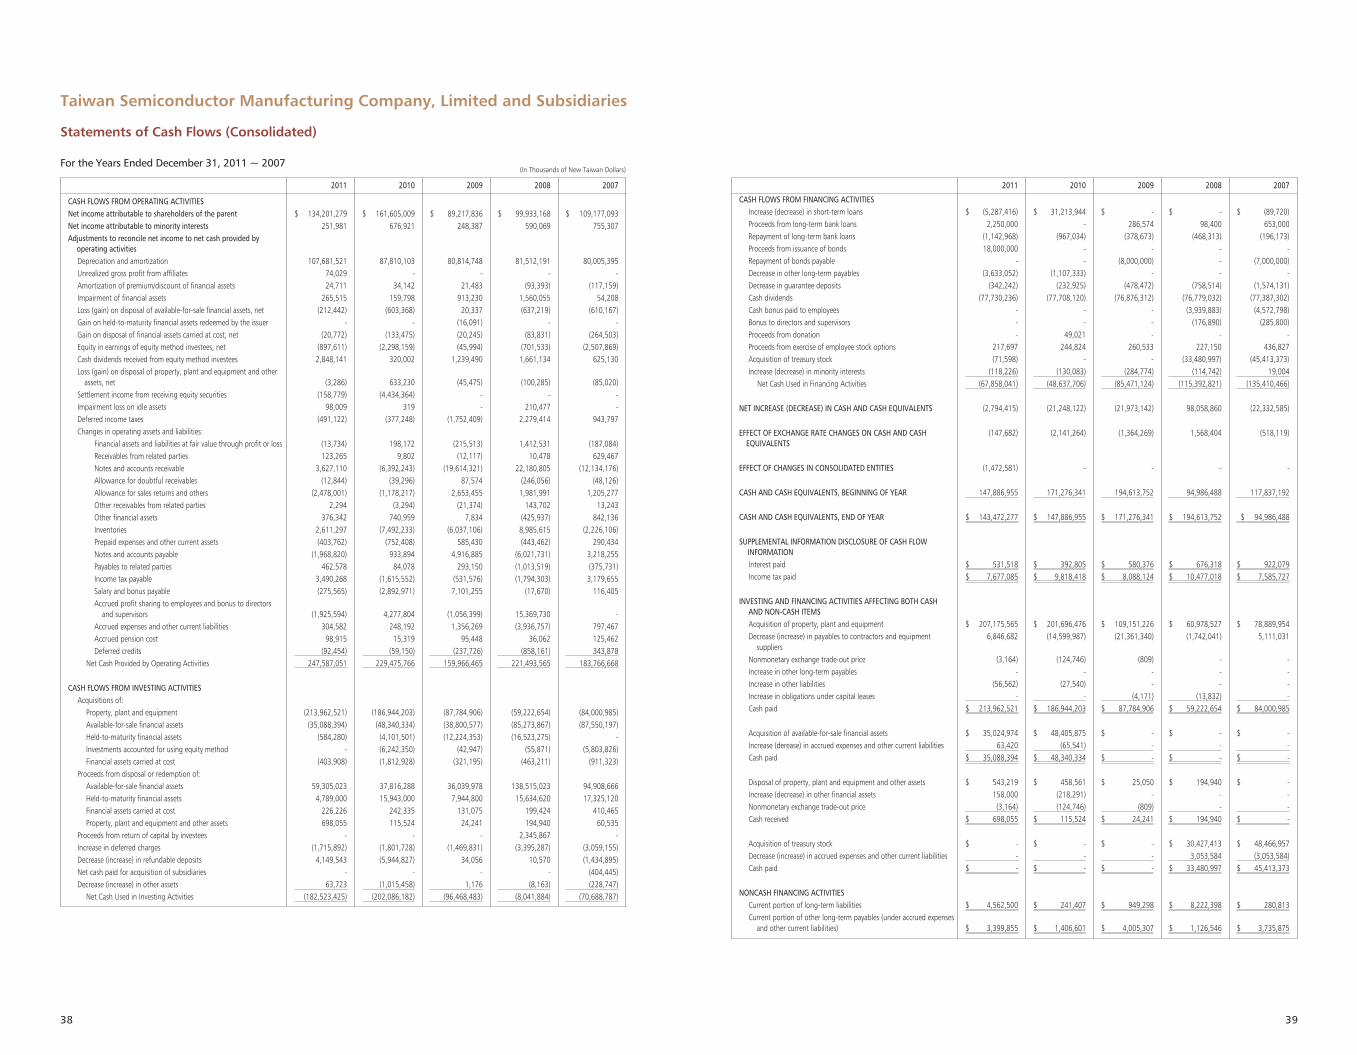
38 39
2011 2010 2009 2008 2007
CASH FLOWS FROM OPERATING ACTIVITIESNet income attributable to shareholders of the parent $ 134,201,279 $ 161,605,009 $ 89,217,836 $ 99,933,168 $ 109,177,093 Net income attributable to minority interests 251,981 676,921 248,387 590,069 755,307 Ad justments to reconcile net income to net cash provided by
operating activitiesDepreciation and amortization 107,681,521 87,810,103 80,814,748 81,512,191 80,005,395 Unrealized gross profit from affiliates 74,029 - - - - Amortization of premium/discount of financial assets 24,711 34,142 21,483 (93,393) (117,159)Impairment of financial assets 265,515 159,798 913,230 1,560,055 54,208 Loss (gain) on disposal of available-for-sale financial assets, net (212,442) (603,368) 20,337 (637,219) (610,167)Gain on held-to-maturity financial assets redeemed by the issuer - - (16,091) - - Gain on disposal of financial assets carried at cost, net (20,772) (133,475) (20,245) (83,831) (264,503)Equity in earnings of equity method investees, net (897,611) (2,298,159) (45,994) (701,533) (2,507,869)Cash dividends received from equity method investees 2,848,141 320,002 1,239,490 1,661,134 625,130 Lo ss (gain) on disposal of property, plant and equipment and other
assets, net (3,286) 633,230 (45,475) (100,285) (85,020)Settlement income from receiving equity securities (158,779) (4,434,364) - - - Impairment loss on idle assets 98,009 319 - 210,477 - Deferred income taxes (491,122) (377,248) (1,752,409) 2,279,414 943,797 Changes in operating assets and liabilities:
Financial assets and liabilities at fair value through profit or loss (13,734) 198,172 (215,513) 1,412,531 (187,084)Receivables from related parties 123,265 9,802 (12,117) 10,478 629,467 Notes and accounts receivable 3,627,110 (6,392,243) (19,614,321) 22,180,805 (12,134,176)Allowance for doubtful receivables (12,844) (39,296) 87,574 (246,056) (48,126)Allowance for sales returns and others (2,478,001) (1,178,217) 2,653,455 1,981,991 1,205,277 Other receivables from related parties 2,294 (3,294) (21,374) 143,702 13,243 Other financial assets 376,342 740,959 7,834 (425,937) 842,136 Inventories 2,611,297 (7,492,233) (6,037,106) 8,985,615 (2,226,106)Prepaid expenses and other current assets (403,762) (752,408) 585,430 (443,462) 290,434 Notes and accounts payable (1,968,820) 933,894 4,916,885 (6,021,731) 3,218,255 Payables to related parties 462,578 84,078 293,150 (1,013,519) (375,731)Income tax payable 3,490,268 (1,615,552) (531,576) (1,794,303) 3,179,655 Salary and bonus payable (275,565) (2,892,971) 7,101,255 (17,670) 116,405 Ac crued profit sharing to employees and bonus to directors
and supervisors (1,925,594) 4,277,804 (1,056,399) 15,369,730 - Accrued expenses and other current liabilities 304,582 248,192 1,356,269 (3,936,757) 797,467 Accrued pension cost 98,915 15,319 95,448 36,062 125,462 Deferred credits (92,454) (59,150) (237,726) (858,161) 343,878
Net Cash Provided by Operating Activities 247,587,051 229,475,766 159,966,465 221,493,565 183,766,668
CASH FLOWS FROM INVESTING ACTIVITIESAcquisitions of:
Property, plant and equipment (213,962,521) (186,944,203) (87,784,906) (59,222,654) (84,000,985)Available-for-sale financial assets (35,088,394) (48,340,334) (38,800,577) (85,273,867) (87,550,197)Held-to-maturity financial assets (584,280) (4,101,501) (12,224,353) (16,523,275) - Investments accounted for using equity method - (6,242,350) (42,947) (55,871) (5,803,826)Financial assets carried at cost (403,908) (1,812,928) (321,195) (463,211) (911,323)
Proceeds from disposal or redemption of:Available-for-sale financial assets 59,305,023 37,816,288 36,039,978 138,515,023 94,908,666 Held-to-maturity financial assets 4,789,000 15,943,000 7,944,800 15,634,620 17,325,120 Financial assets carried at cost 226,226 242,335 131,075 199,424 410,465 Property, plant and equipment and other assets 698,055 115,524 24,241 194,940 60,535
Proceeds from return of capital by investees - - - 2,345,867 - Increase in deferred charges (1,715,892) (1,801,728) (1,469,831) (3,395,287) (3,059,155)Decrease (increase) in refundable deposits 4,149,543 (5,944,827) 34,056 10,570 (1,434,895)Net cash paid for acquisition of subsidiaries - - - - (404,445)Decrease (increase) in other assets 63,723 (1,015,458) 1,176 (8,163) (228,747)
Net Cash Used in Investing Activities (182,523,425) (202,086,182) (96,468,483) (8,041,884) (70,688,787)
Taiwan Semiconductor Manufacturing Company, Limited and Subsidiaries
Statements of Cash Flows (Consolidated)
For the Years Ended December 31, 2011 ~ 2007(In Thousands of New Taiwan Dollars)
2011 2010 2009 2008 2007
CASH FLOWS FROM FINANCING ACTIVITIESIncrease (decrease) in short-term loans $ (5,287,416) $ 31,213,944 $ - $ - $ (89,720)Proceeds from long-term bank loans 2,250,000 - 286,574 98,400 653,000 Repayment of long-term bank loans (1,142,968) (967,034) (378,673) (468,313) (196,173)Proceeds from issuance of bonds 18,000,000 - - - - Repayment of bonds payable - - (8,000,000) - (7,000,000)Decrease in other long-term payables (3,633,052) (1,107,333) - - - Decrease in guarantee deposits (342,242) (232,925) (478,472) (758,514) (1,574,131)Cash dividends (77,730,236) (77,708,120) (76,876,312) (76,779,032) (77,387,302)Cash bonus paid to employees - - - (3,939,883) (4,572,798)Bonus to directors and supervisors - - - (176,890) (285,800)Proceeds from donation - 49,021 - - - Proceeds from exercise of employee stock options 217,697 244,824 260,533 227,150 436,827 Acquisition of treasury stock (71,598) - - (33,480,997) (45,413,373)Increase (decrease) in minority interests (118,226) (130,083) (284,774) (114,742) 19,004
Net Cash Used in Financing Activities (67,858,041) (48,637,706) (85,471,124) (115,392,821) (135,410,466)
NET INCREASE (DECREASE) IN CASH AND CASH EQUIVALENTS (2,794,415) (21,248,122) (21,973,142) 98,058,860 (22,332,585)
EF FECT OF EXCHANGE RATE CHANGES ON CASH AND CASH EQUIVALENTS
(147,682) (2,141,264) (1,364,269) 1,568,404 (518,119)
EFFECT OF CHANGES IN CONSOLIDATED ENTITIES (1,472,581) - - - -
CASH AND CASH EQUIVALENTS, BEGINNING OF YEAR 147,886,955 171,276,341 194,613,752 94,986,488 117,837,192 CASH AND CASH EQUIVALENTS, END OF YEAR $ 143,472,277 $ 147,886,955 $ 171,276,341 $ 194,613,752 $ 94,986,488
SU PPLEMENTAL INFORMATION DISCLOSURE OF CASH FLOW INFORMATIONInterest paid $ 531,518 $ 392,805 $ 580,376 $ 676,318 $ 922,079 Income tax paid $ 7,677,085 $ 9,818,418 $ 8,088,124 $ 10,477,018 $ 7,585,727
INVESTING AND FINANCING ACTIVITIES AFFECTING BOTH CASH AND NON-CASH ITEMSAcquisition of property, plant and equipment $ 207,175,565 $ 201,696,476 $ 109,151,226 $ 60,978,527 $ 78,889,954 De crease (increase) in payables to contractors and equipment
suppliers6,846,682 (14,599,987) (21,361,340) (1,742,041) 5,111,031
Nonmonetary exchange trade-out price (3,164) (124,746) (809) - - Increase in other long-term payables - - - - - Increase in other liabilities (56,562) (27,540) - - - Increase in obligations under capital leases - - (4,171) (13,832) - Cash paid $ 213,962,521 $ 186,944,203 $ 87,784,906 $ 59,222,654 $ 84,000,985
Acquisition of available-for-sale financial assets $ 35,024,974 $ 48,405,875 $ - $ - $ - Increase (derease) in accrued expenses and other current liabilities 63,420 (65,541) - - - Cash paid $ 35,088,394 $ 48,340,334 $ - $ - $ -
Disposal of property, plant and equipment and other assets $ 543,219 $ 458,561 $ 25,050 $ 194,940 $ - Increase (decrease) in other financial assets 158,000 (218,291) - - - Nonmonetary exchange trade-out price (3,164) (124,746) (809) - - Cash received $ 698,055 $ 115,524 $ 24,241 $ 194,940 $ -
Acquisition of treasury stock $ - $ - $ - $ 30,427,413 $ 48,466,957 Decrease (increase) in accrued expenses and other current liabilities - - - 3,053,584 (3,053,584)Cash paid $ - $ - $ - $ 33,480,997 $ 45,413,373
NONCASH FINANCING ACTIVITIESCurrent portion of long-term liabilities $ 4,562,500 $ 241,407 $ 949,298 $ 8,222,398 $ 280,813 Cu rrent portion of other long-term payables (under accrued expenses
and other current liabilities) $ 3,399,855 $ 1,406,601 $ 4,005,307 $ 1,126,546 $ 3,735,875
Corporate Headquarters & Fab 128, Li-Hsin Rd. 6, Hsinchu Science Park, Hsinchu 300-78 Taiwan, R.O.C.Tel: 886-3-5636688 Fax: 886-3-5637000
Fab 2, Fab 5121, Park Ave. 3, Hsinchu Science Park, Hsinchu 300-77 Taiwan, R.O.C.Tel: 886-3-5636688 Fax: 886-3-5781546
Fab 39, Creation Rd. 1, Hsinchu Science Park, Hsinchu 300-77 Taiwan, R.O.C.Tel: 886-3-5636688 Fax: 886-3-5781548
Fab 61, Nan-Ke North Rd., Tainan Science Park, Tainan 741-44 Taiwan, R.O.C.Tel: 886-6-5056688 Fax: 886-6-5052057
Fab 825, Li-Hsin Rd., Hsinchu Science Park, Hsinchu 300-78 Taiwan, R.O.C.Tel: 886-3-5636688 Fax: 886-3-5662051
Fab 141-1, Nan-Ke North Rd., Tainan Science Park, Tainan 741-44 Taiwan R.O.C.Tel: 886-6-5056688 Fax: 886-6-5051262
Fab 151, Keya Rd. 6., Daya Dist., Taichung 428-81, Taiwan, R.O.C.Tel: 886-4-27026688 Fax: 886-4-25607548
TSMC North America2585 Junction Avenue, San Jose, CA 95134, U.S.A.Tel: 408-3828000 Fax: 408-3828008
TSMC Europe B.V.World Trade Center, Zuidplein 60, 1077 XV Amsterdam The NetherlandsTel: 31-20-3059900 Fax: 31-20-3059911
TSMC Japan Limited21F, Queen’s Tower C, 2-3-5, Minatomirai, Nishi-ku Yokohama Kanagawa, 220-6221, JapanTel: 81-45-6820670 Fax: 81-45-6820673
TSMC China Company Limited4000, Wen Xiang Road, Songjiang, Shanghai, ChinaPostcode: 201616Tel: 86-21-57768000 Fax: 86-21-57762525
TSMC Korea Limited15F, AnnJay Tower, 718-2, Yeoksam-dong, Gangnam-gu Seoul 135-080, KoreaTel: 82-2-20511688 Fax: 82-2-20511669
TSMC Liaison Office in India1st Floor, Pine Valley, Embassy Golf-Links Business Park Bangalore-560071, IndiaTel: 91-80-41768615 Fax: 91-80-41764568
TSMC Design Technology Canada Inc.535 Legget Dr, Suite 600, Kanata, ON K2K 3B8, CanadaTel: 1-613-576-1990 Fax: 1-613-576-1999
TSMC SpokespersonName: Lora HoTitle: Senior Vice President & CFOTel: 886-3-5054602 Fax: 886-3-5670121Email: [email protected]
Deputy Spokesperson/ TSMC Investor RelationsName: Elizabeth SunTitle: Director, TSMC Corporate Communication DivisionTel: 886-3-5682085 Fax: 886-3-5670121Email: [email protected]
AuditorsCompany: Deloitte & ToucheAuditors: Hung-Peng Lin, Shu-Chieh HuangAddress: 12F, 156, Sec. 3, Min-Sheng E. Rd., Taipei 105-96 Taiwan R.O.C.Tel: 886-2-25459988 Fax: 886-2-25459966Website: http://www.deloitte.com.tw
Common Share Transfer Agent and RegistrarCompany: The Transfer Agency Department of ChinatrustCommercial BankAddress: 5F, 83, Sec. 1, Chung-Ching S. Rd., Taipei 100-08 Taiwan R.O.C.Tel: 886-2-21811911 Fax: 886-2-23116723Website: http://www.chinatrust.com.tw
ADR Depositary BankCompany: Citibank, N.A.Depositary Receipts ServicesAddress: 388 Greenwich Street, New York, NY 10013, U.S.A.Website: http://www.citigroup.com/adrTel: 1-877-2484237 (toll free)Tel: 1-781-5754555 (out of US)Fax: 1-201-3243284E-mail: [email protected]’s depositary receipts of the common shares are listed on New York Stock Exchange (NYSE) under the symbol TSM. The information relating to TSM is available at http://www.nyse.com and http://newmops.tse.com.tw
CONTACT INFORMATION
Copyright © 2012 by Taiwan Semiconductor Manufacturing Company, Ltd. All rights reserved.
Safe Harbor Notice:The statements included in this business overview that are not historical in nature are “forward-looking statements” within the meaning of the “safe harbor” provisions of the Private Securities Litigation Reform Act of 1995. TSMC cautions readers that forward-looking statements are subject to significant risks and uncertainties and are based on TSMC’s current expectations. Actual results may differ materially from those contained in such forward-looking statements for a variety of reasons including, among others, risks associated with cyclicality and market conditions in the semiconductor industry; demand and supply for TSMC’s foundry manufacturing capacity in particular and for foundry manufacturing capacity in general; intense competition; the failure of one or more significant customers to continue to place the same level of orders with us; TSMC’s ability to remain a technological leader in the semiconductor industry; TSMC’s ability to manage its capacity; TSMC’s ability to obtain, preserve and defend its intellectual property rights; natural disasters and other unexpected events which may disrupt production; and exchange rate fluctuations. Additional information as to these and other risk factors that may cause TSMC’s actual results to differ materially from TSMC’s forward-looking statements may be found in TSMC’s Annual Report on Form 20-F, filed with the United States Securities and Exchange Commission (the “SEC”) on April 15, 2012, and such other documents as TSMC may file with, or submit to, the SEC from time to time. Except as required by law, we undertake no obligation to update any forward-looking statement, whether as a result of new information, future events, or otherwise.