Embed Size (px)
Citation preview
2011 CensusJoint Intelligence Group
3 April 2013
Presentation outline
Part 1
Results so far for Bristol
Part 2
Geography
Getting hold of the data
What data is coming next?
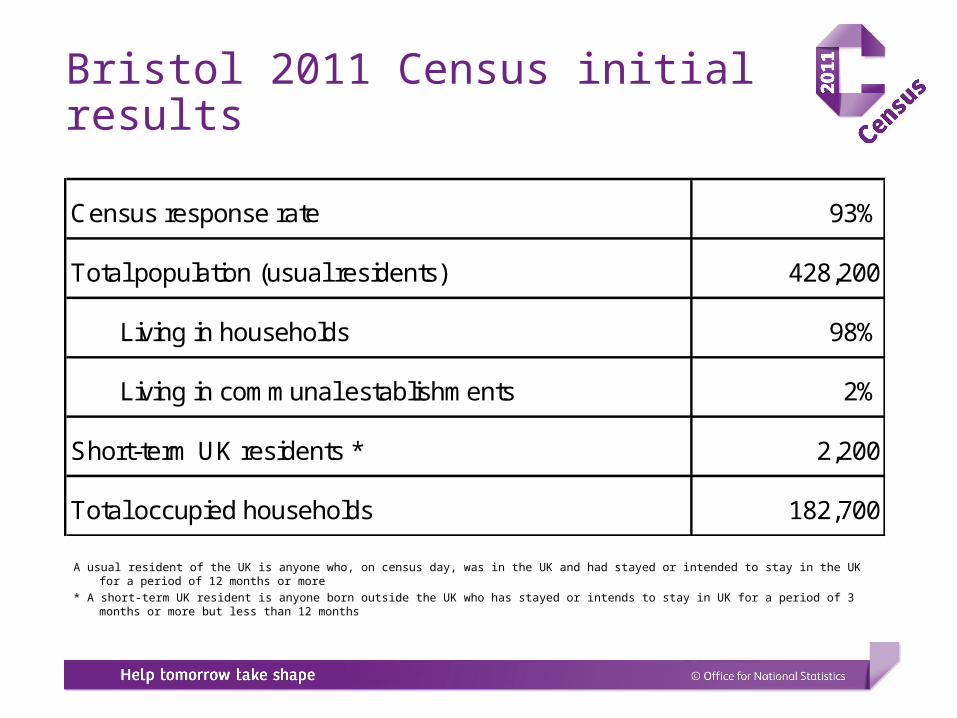
Bristol 2011 Census initial results
A usual resident of the UK is anyone who, on census day, was in the UK and had stayed or intended to stay in the UK for a period of 12 months or more
* A short-term UK resident is anyone born outside the UK who has stayed or intends to stay in UK for a period of 3 months or more but less than 12 months
Census response rate 93%
Total population (usual residents) 428,200
Living in households 98%
Living in communal establishments 2%
Short-term UK residents * 2,200
Total occupied households 182,700
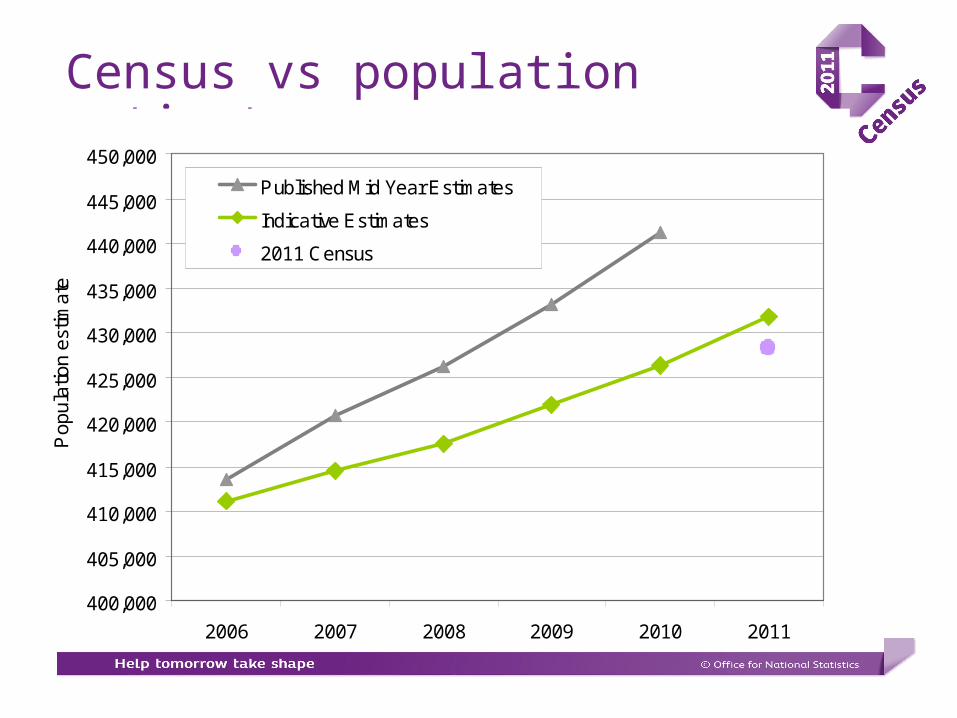
Census vs population estimates
400,000
405,000
410,000
415,000
420,000
425,000
430,000
435,000
440,000
445,000
450,000
2006 2007 2008 2009 2010 2011
Pop
ulat
ion
estim
ate
Published Mid Year Estimates
Indicative Estimates
2011 Census
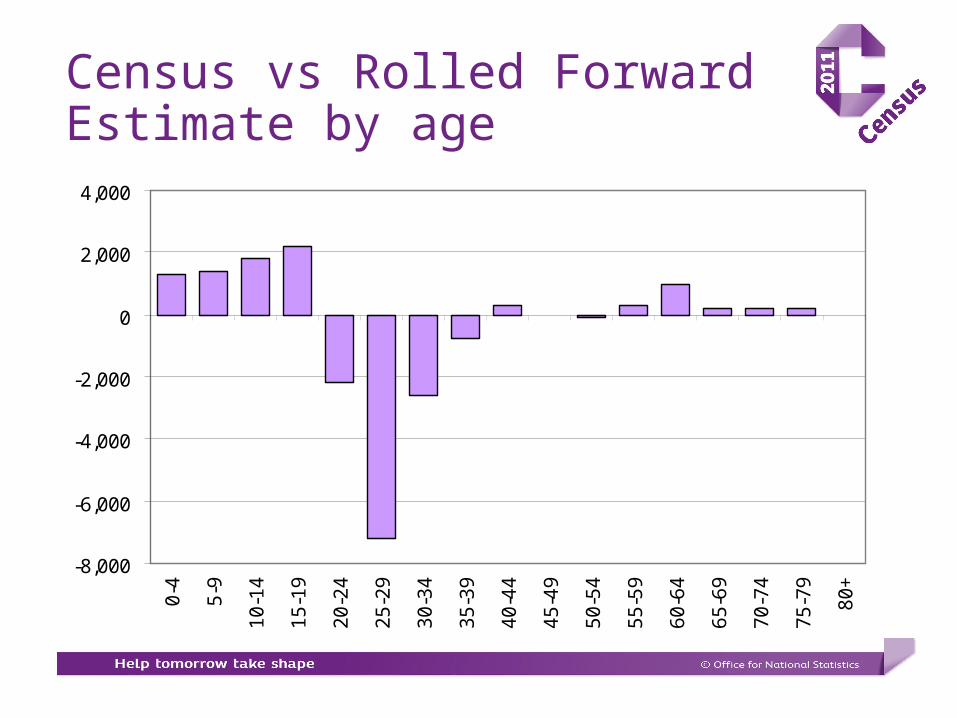
Census vs Rolled Forward Estimate by age
-8,000
-6,000
-4,000
-2,000
0
2,000
4,0000
-4
5-9
10
-14
15
-19
20
-24
25
-29
30
-34
35
-39
40
-44
45
-49
50
-54
55
-59
60
-64
65
-69
70
-74
75
-79
80
+
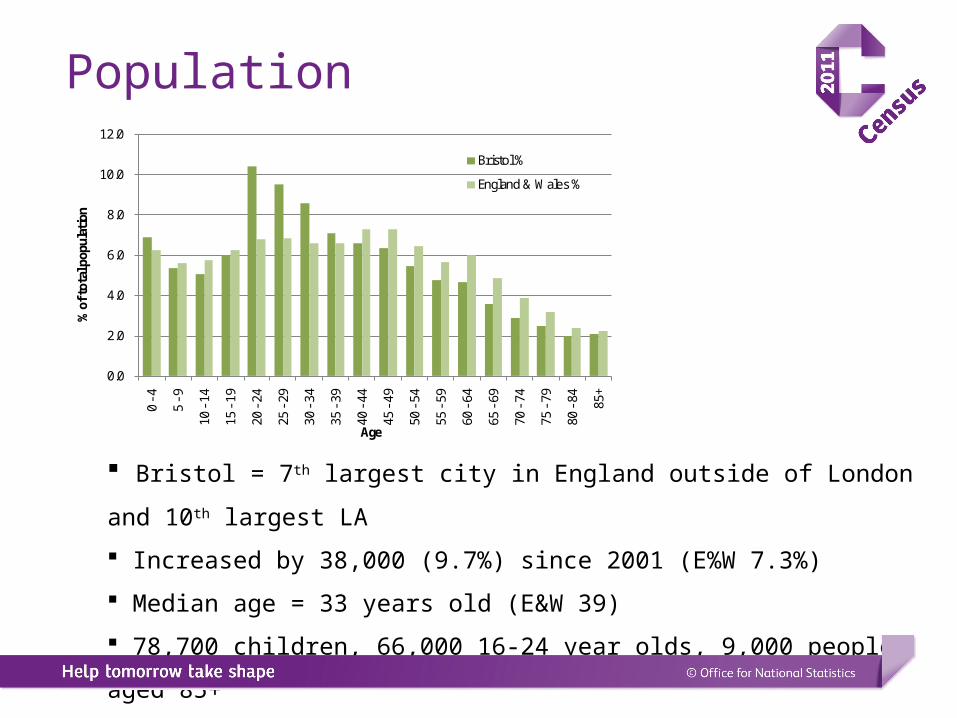
Population
Bristol = 7th largest city in England outside of London and 10th largest LA
Increased by 38,000 (9.7%) since 2001 (E%W 7.3%)
Median age = 33 years old (E&W 39)
78,700 children, 66,000 16-24 year olds, 9,000 people aged 85+
0.0
2.0
4.0
6.0
8.0
10.0
12.0 0
-4
5 -9
10 -
14
15 -
19
20 -
24
25 -
29
30 -
34
35 -
39
40 -
44
45 -
49
50 -
54
55 -
59
60 -
64
65 -
69
70 -
74
75 -
79
80 -
84 85+
% o
f tot
al p
opul
ation
Age
Bristol %
England & Wales %
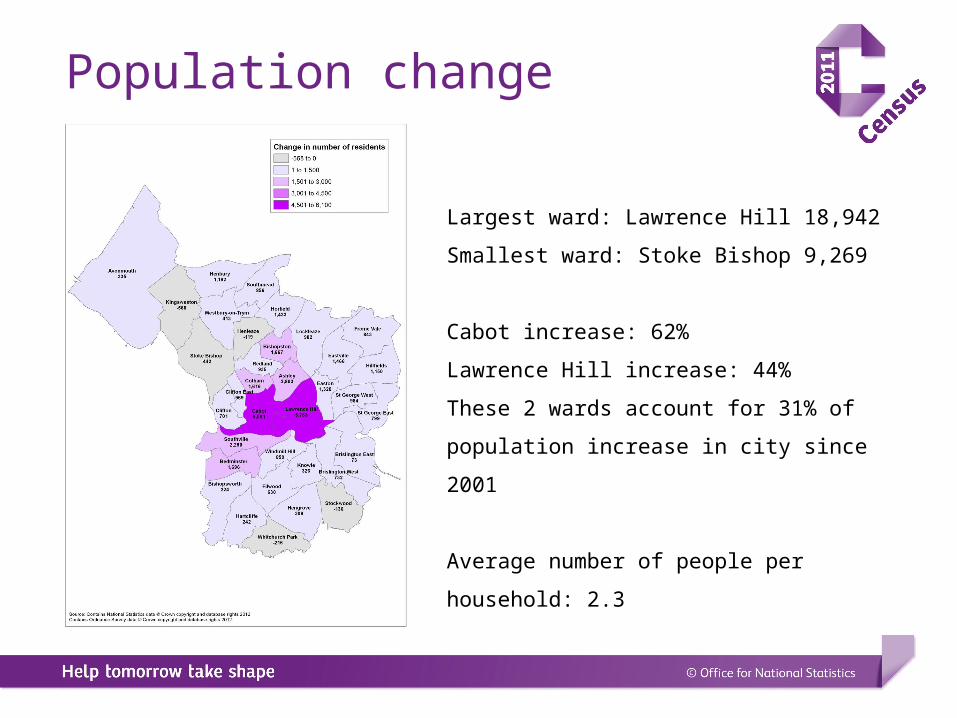
Population change
Largest ward: Lawrence Hill 18,942
Smallest ward: Stoke Bishop 9,269
Cabot increase: 62%
Lawrence Hill increase: 44%
These 2 wards account for 31% of population
increase in city since 2001
Average number of people per household: 2.3
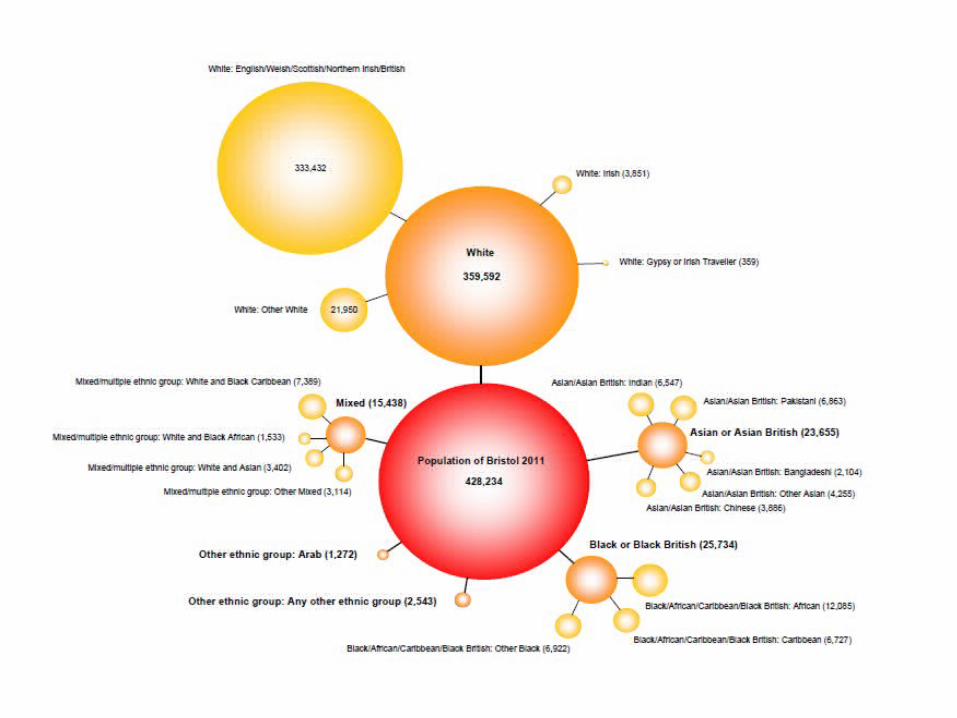
Ethnicity
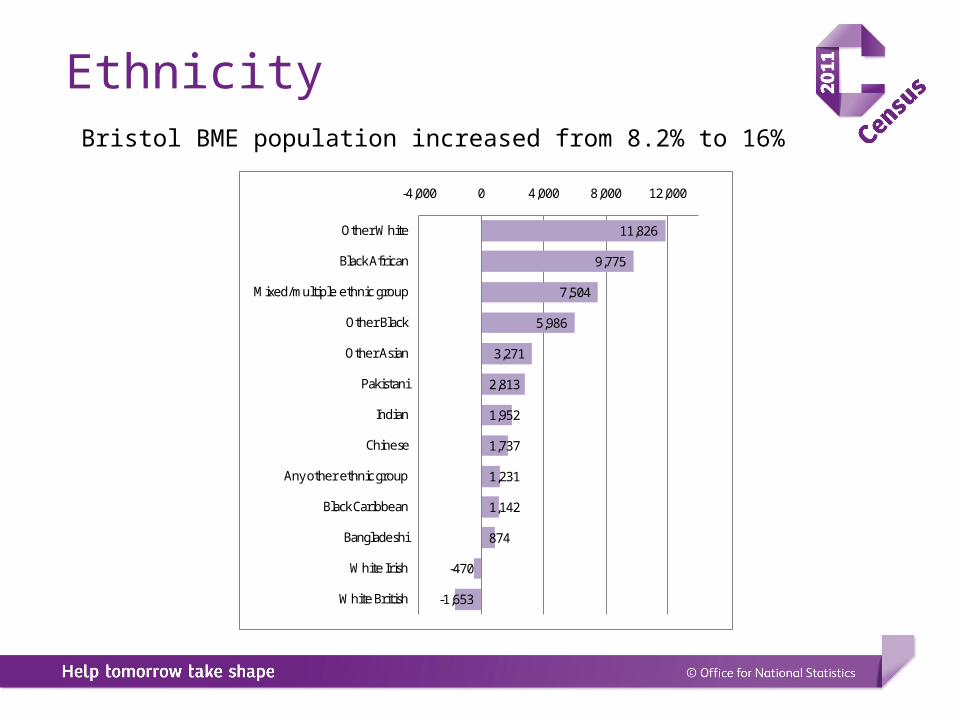
EthnicityBristol BME population increased from 8.2% to 16%
11,826
9,775
7,504
5,986
3,271
2,813
1,952
1,737
1,231
1,142
874
-470
-1,653
-4,000 0 4,000 8,000 12,000
Other White
Black African
Mixed/multiple ethnic group
Other Black
Other Asian
Pakistani
Indian
Chinese
Any other ethnic group
Black Caribbean
Bangladeshi
White Irish
White British
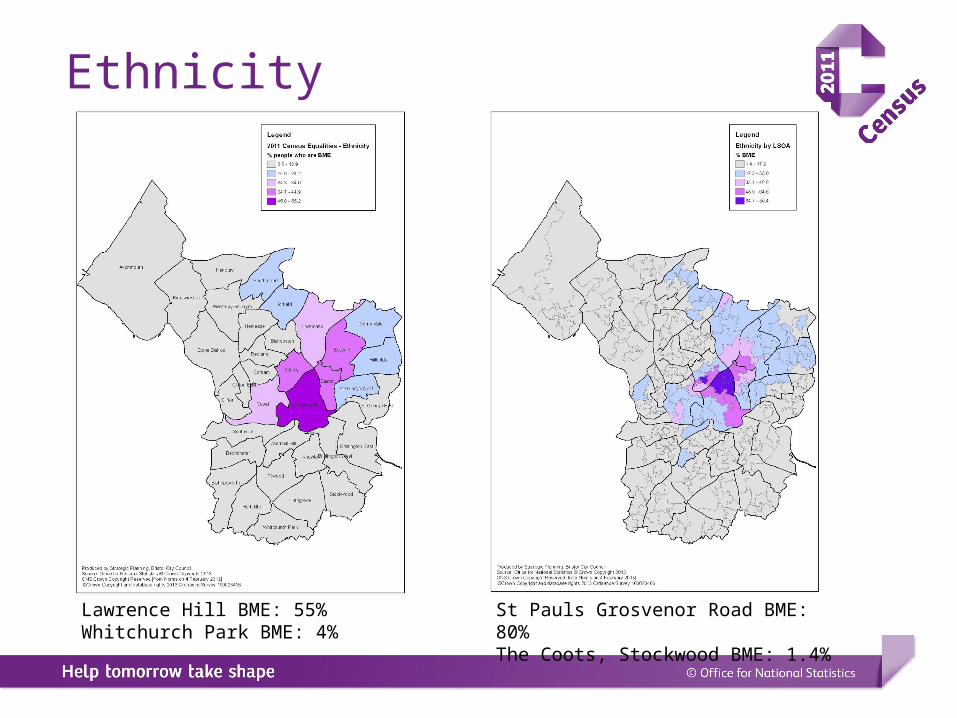
Ethnicity
Lawrence Hill BME: 55%Whitchurch Park BME: 4%
St Pauls Grosvenor Road BME: 80%The Coots, Stockwood BME: 1.4%
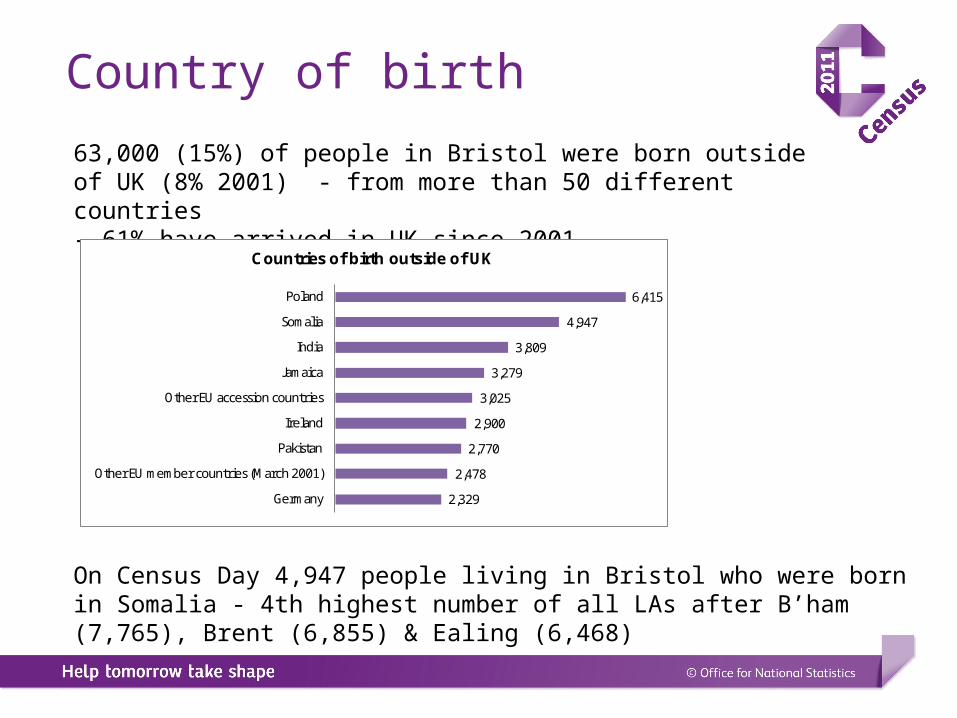
Country of birth
On Census Day 4,947 people living in Bristol who were born in Somalia - 4th highest number of all LAs after B’ham (7,765), Brent (6,855) & Ealing (6,468)
63,000 (15%) of people in Bristol were born outside of UK (8% 2001) - from more than 50 different countries- 61% have arrived in UK since 2001
6,415
4,947
3,809
3,279
3,025
2,900
2,770
2,478
2,329
Poland
Somalia
India
Jamaica
Other EU accession countries
Ireland
Pakistan
Other EU member countries (March 2001)
Germany
Countries of birth outside of UK
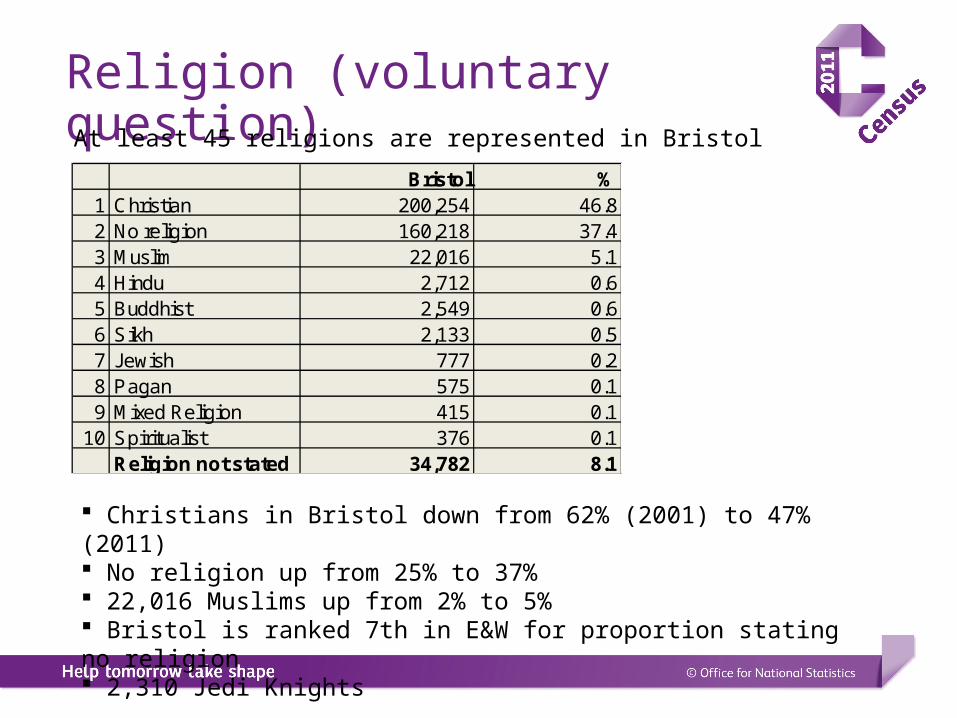
Religion (voluntary question)At least 45 religions are represented in Bristol
Bristol %1 Christian 200,254 46.82 No religion 160,218 37.43 Muslim 22,016 5.14 Hindu 2,712 0.65 Buddhist 2,549 0.66 Sikh 2,133 0.57 Jewish 777 0.28 Pagan 575 0.19 Mixed Religion 415 0.1
10 Spiritualist 376 0.1Religion not stated 34,782 8.1
Christians in Bristol down from 62% (2001) to 47% (2011) No religion up from 25% to 37% 22,016 Muslims up from 2% to 5% Bristol is ranked 7th in E&W for proportion stating no religion 2,310 Jedi Knights
Main Language
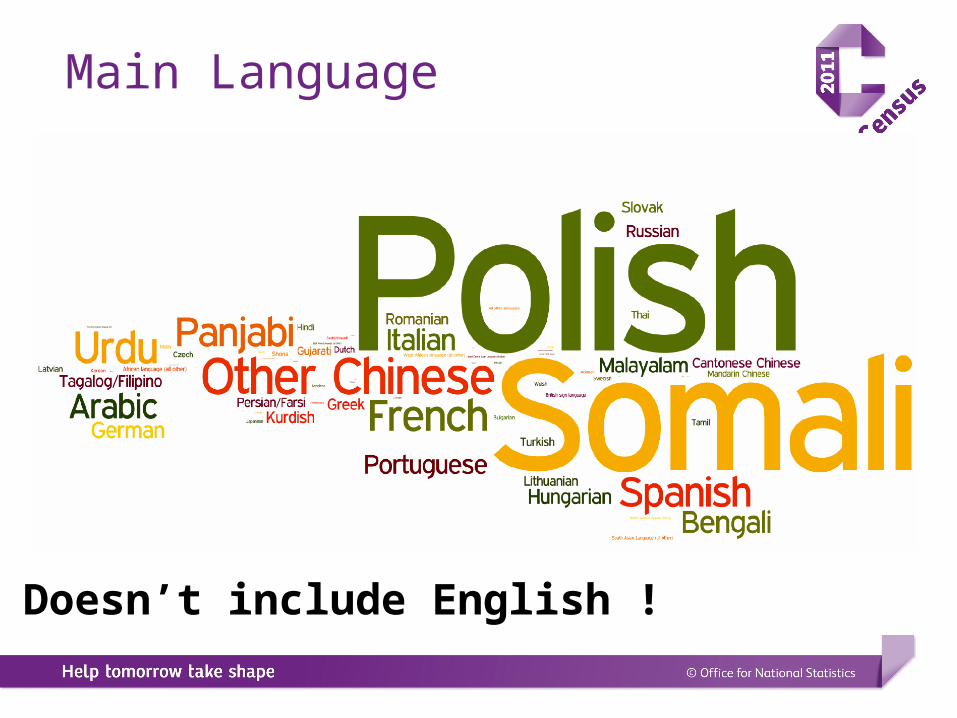
Main Language
Doesn’t include English !
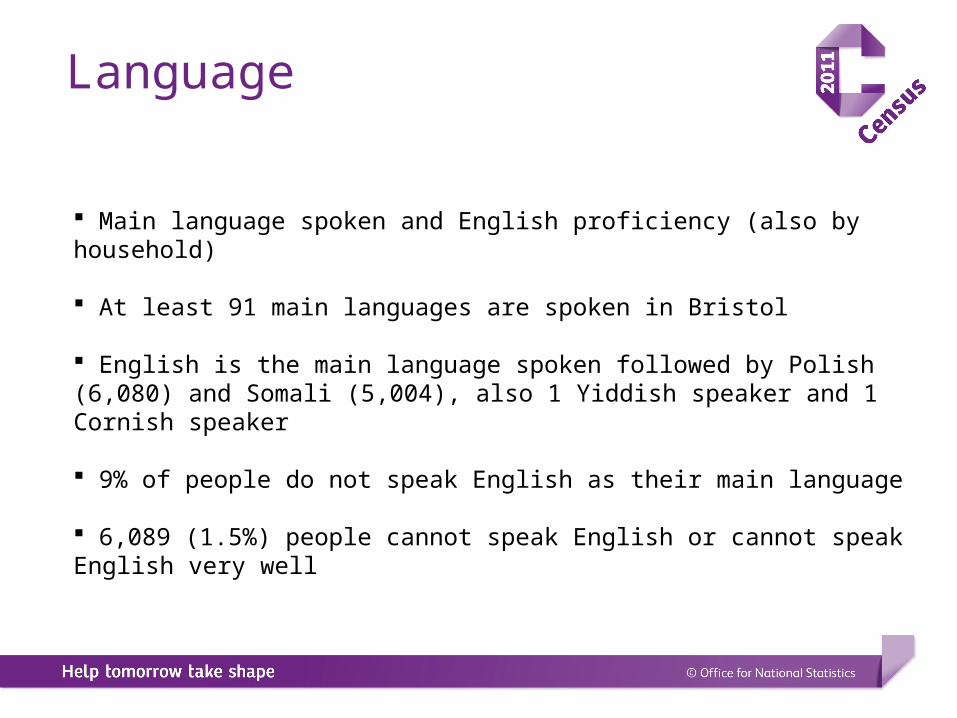
Language
Main language spoken and English proficiency (also by household)
At least 91 main languages are spoken in Bristol
English is the main language spoken followed by Polish (6,080) and Somali (5,004), also 1 Yiddish speaker and 1 Cornish speaker
9% of people do not speak English as their main language
6,089 (1.5%) people cannot speak English or cannot speak English very well

Language by ward
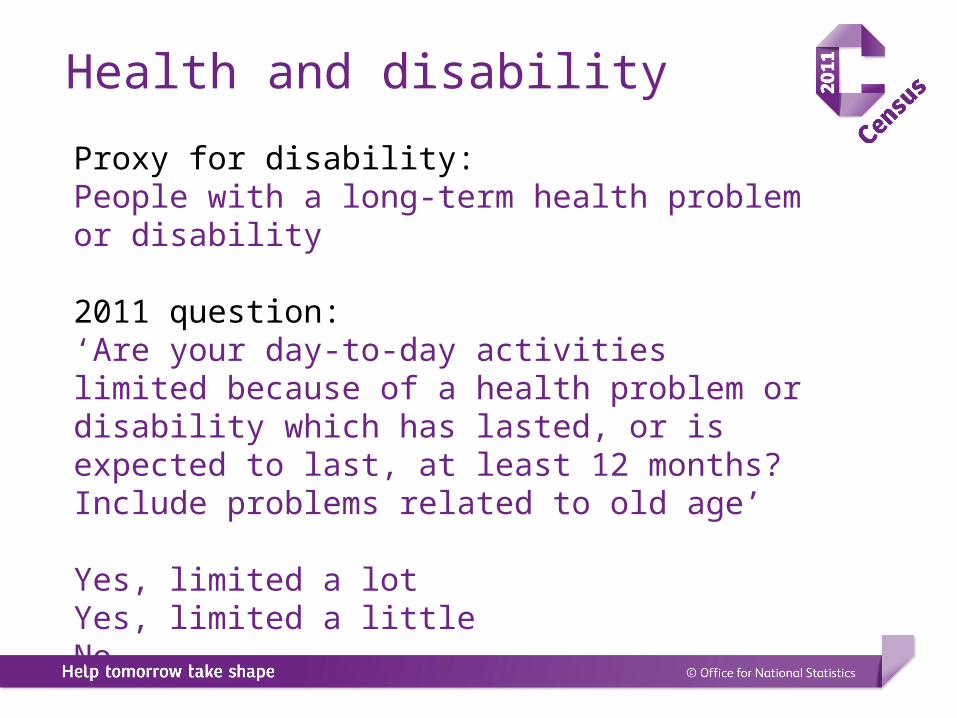
Health and disability
Proxy for disability:People with a long-term health problem or disability
2011 question:‘Are your day-to-day activities limited because of a health problem or disability which has lasted, or is expected to last, at least 12 months?Include problems related to old age’
Yes, limited a lotYes, limited a littleNo
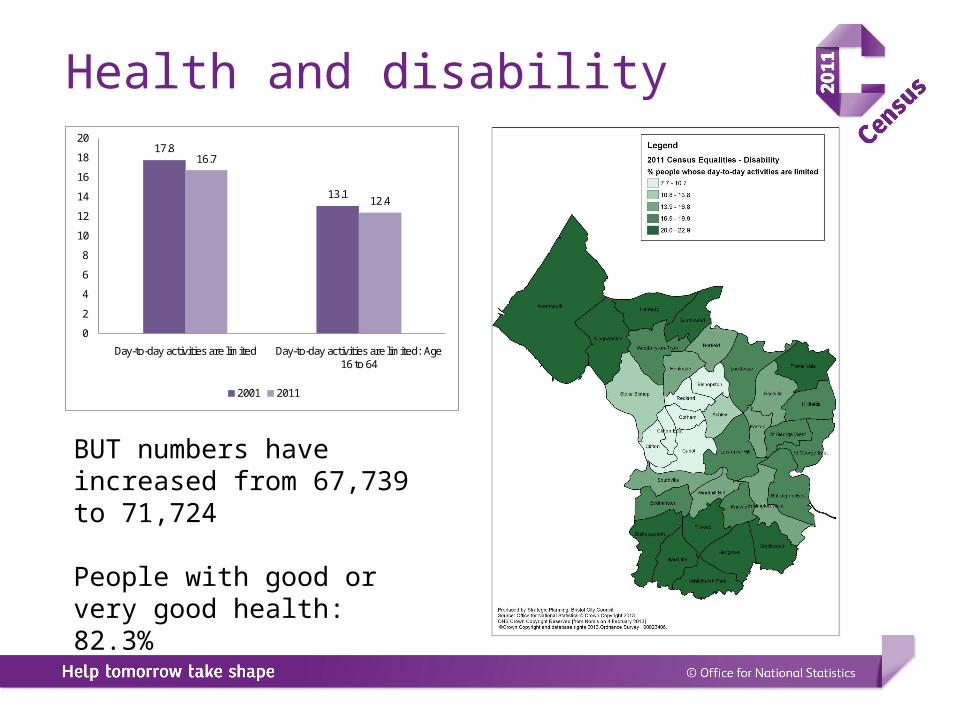
Health and disability
BUT numbers have increased from 67,739 to 71,724
People with good or very good health: 82.3%
17.8
13.1
16.7
12.4
0
2
4
6
8
10
12
14
16
18
20
Day-to-day activities are limited Day-to-day activities are limited: Age 16 to 64
2001 2011
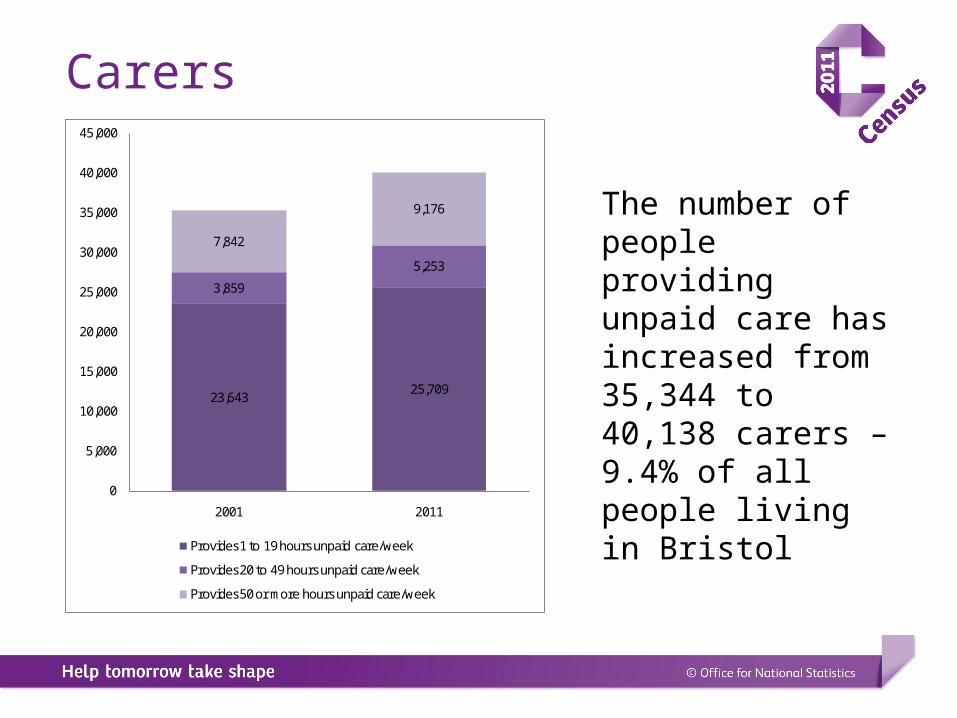
Carers
The number of people providing unpaid care has increased from 35,344 to 40,138 carers – 9.4% of all people living in Bristol
23,64325,709
3,859
5,253
7,842
9,176
0
5,000
10,000
15,000
20,000
25,000
30,000
35,000
40,000
45,000
2001 2011
Provides 1 to 19 hours unpaid care/week
Provides 20 to 49 hours unpaid care/week
Provides 50 or more hours unpaid care/week
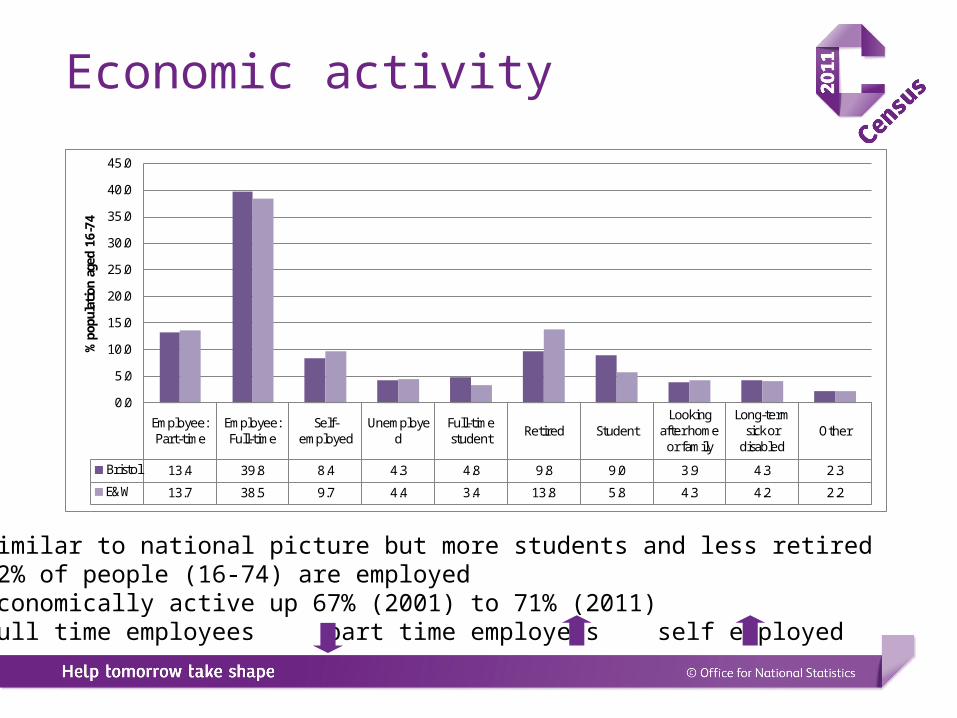
Economic activity
Employee: Part-time
Employee: Full-time
Self-employed
Unemployed
Full-time student Retired Student
Looking after home
or family
Long-term sick or
disabledOther
Bristol 13.4 39.8 8.4 4.3 4.8 9.8 9.0 3.9 4.3 2.3
E&W 13.7 38.5 9.7 4.4 3.4 13.8 5.8 4.3 4.2 2.2
0.0
5.0
10.0
15.0
20.0
25.0
30.0
35.0
40.0
45.0
% p
opul
ation
age
d 16
-74
Similar to national picture but more students and less retired 62% of people (16-74) are employed Economically active up 67% (2001) to 71% (2011) Full time employees part time employees self employed
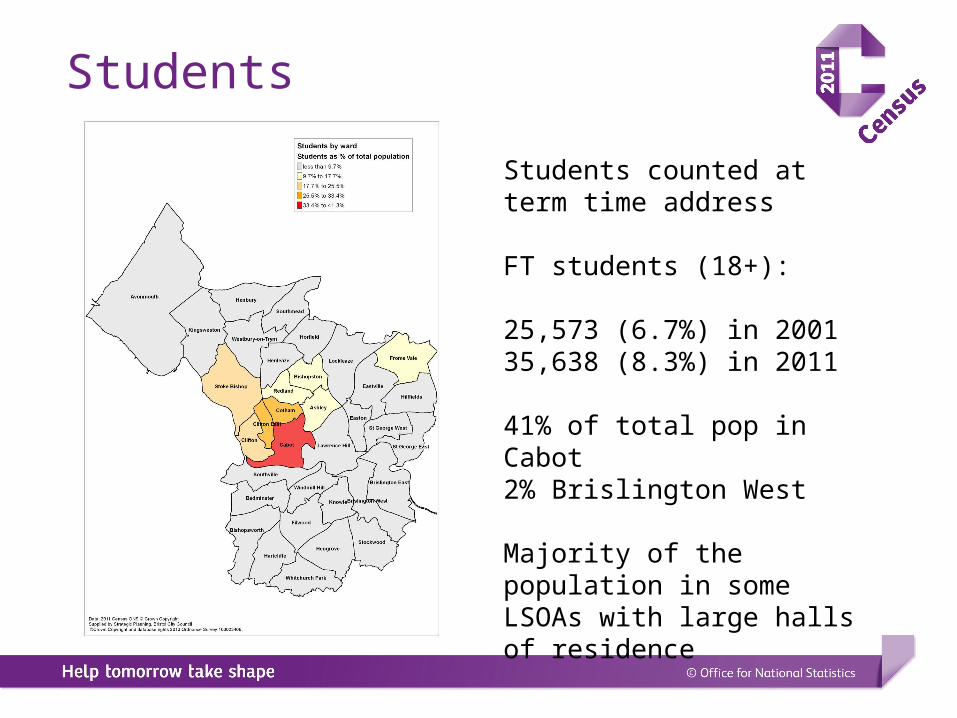
Students
Students counted at term time address
FT students (18+):
25,573 (6.7%) in 200135,638 (8.3%) in 2011
41% of total pop in Cabot2% Brislington West
Majority of the population in some LSOAs with large halls of residence
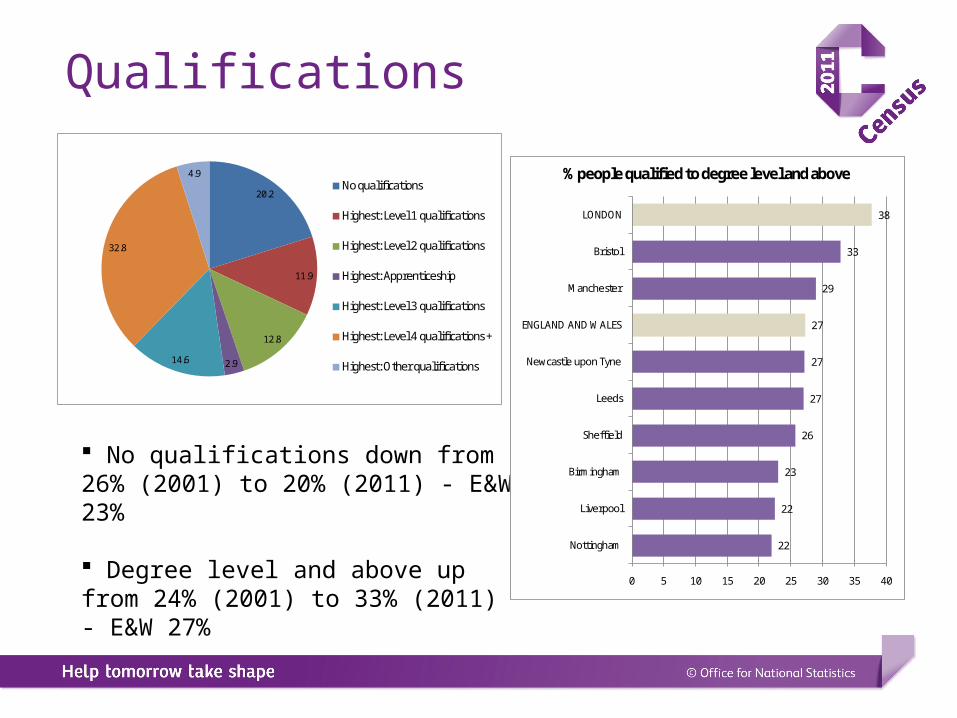
Qualifications
No qualifications down from 26% (2001) to 20% (2011) - E&W 23%
Degree level and above up from 24% (2001) to 33% (2011) - E&W 27%
22
22
23
26
27
27
27
29
33
38
0 5 10 15 20 25 30 35 40
Nottingham
Liverpool
Birmingham
Sheffield
Leeds
Newcastle upon Tyne
ENGLAND AND WALES
Manchester
Bristol
LONDON
% people qualified to degree level and above20.2
11.9
12.8
2.914.6
32.8
4.9No qualifications
Highest: Level 1 qualifications
Highest: Level 2 qualifications
Highest: Apprenticeship
Highest: Level 3 qualifications
Highest: Level 4 qualifications +
Highest: Other qualifications

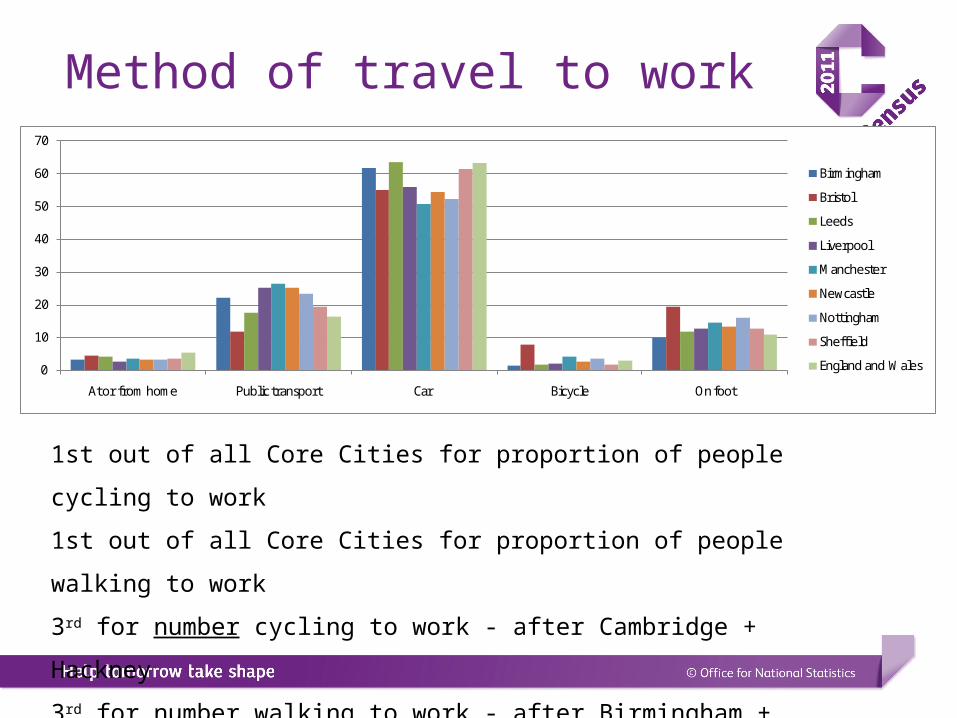
Method of travel to work
Work mainly at or from home
5%
Public transport12%
Car driver or passenger
(including taxi)55%
Motorcycle, scooter or moped
1%
Bicycle/on foot27%
Other0%
Method of travel to work
0
10
20
30
40
50
60
70
At or from home Public transport Car Bicycle On foot
Birmingham
Bristol
Leeds
Liverpool
Manchester
Newcastle
Nottingham
Sheffield
England and Wales
1st out of all Core Cities for proportion of people cycling to work
1st out of all Core Cities for proportion of people walking to work
3rd for number cycling to work - after Cambridge + Hackney
3rd for number walking to work - after Birmingham + Leeds
12th for proportion of people cycling to work
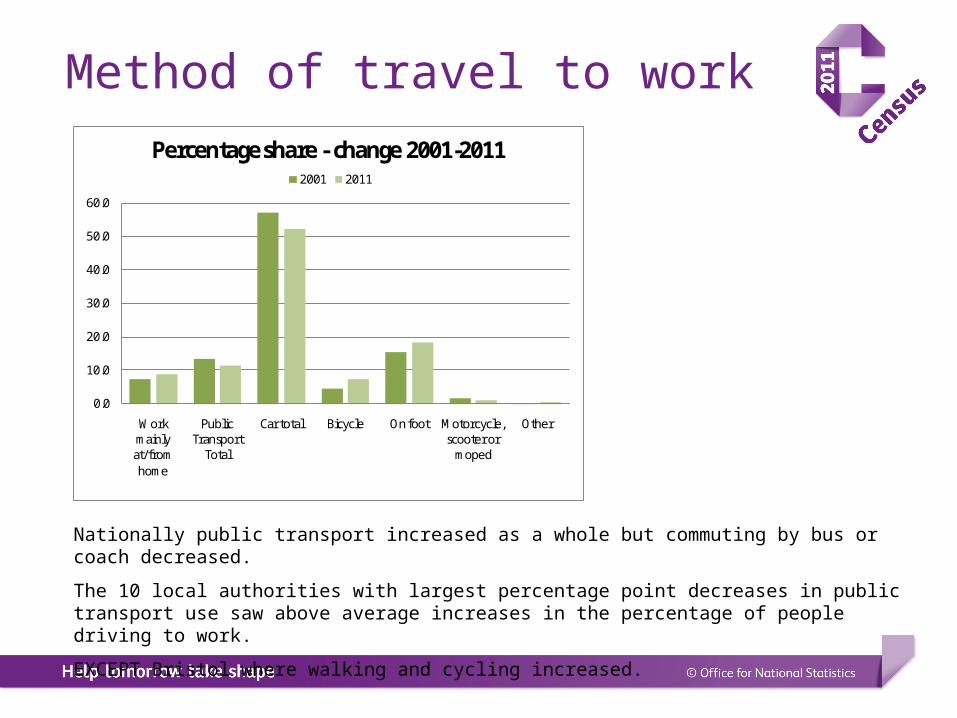
Method of travel to work
0.0
10.0
20.0
30.0
40.0
50.0
60.0
Work mainly
at/from home
Public Transport
Total
Car total Bicycle On foot Motorcycle, scooter or
moped
Other
Percentage share - change 2001-20112001 2011
Nationally public transport increased as a whole but commuting by bus or coach decreased.
The 10 local authorities with largest percentage point decreases in public transport use saw above average increases in the percentage of people driving to work.
EXCEPT Bristol where walking and cycling increased.
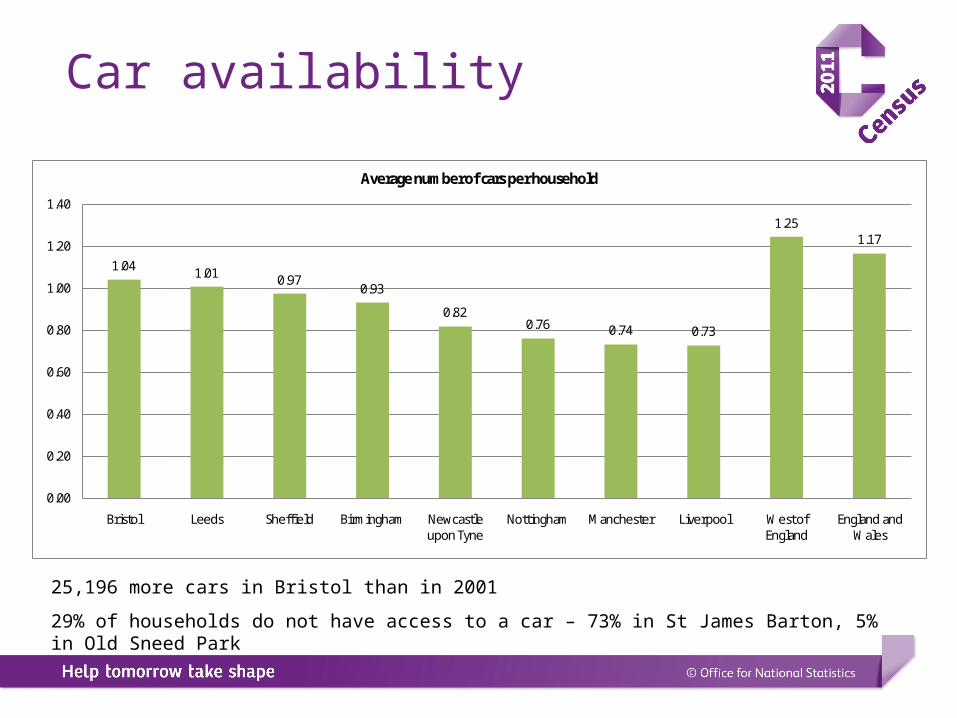
Car availability
25,196 more cars in Bristol than in 2001
29% of households do not have access to a car – 73% in St James Barton, 5% in Old Sneed Park
1.04 1.01 0.970.93
0.820.76 0.74 0.73
1.251.17
0.00
0.20
0.40
0.60
0.80
1.00
1.20
1.40
Bristol Leeds Sheffield Birmingham Newcastle upon Tyne
Nottingham Manchester Liverpool West of England
England and Wales
Average number of cars per household
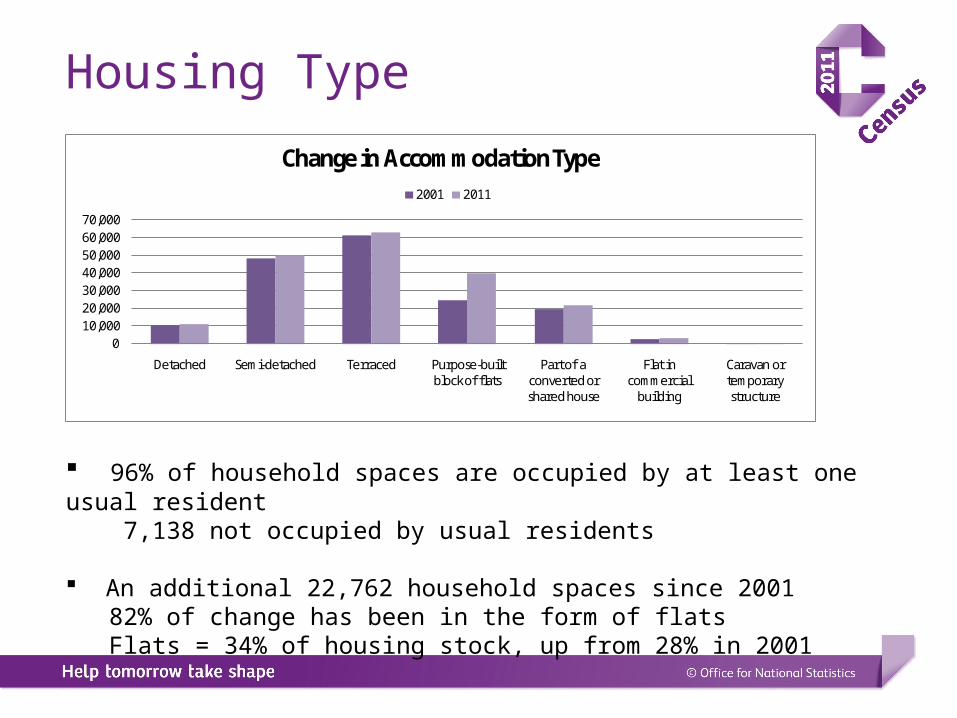
Housing Type
010,00020,00030,00040,00050,00060,00070,000
Detached Semi-detached Terraced Purpose-built block of flats
Part of a converted or shared house
Flat in commercial
building
Caravan or temporary structure
Change in Accommodation Type2001 2011
96% of household spaces are occupied by at least one usual resident 7,138 not occupied by usual residents
An additional 22,762 household spaces since 2001 82% of change has been in the form of flats Flats = 34% of housing stock, up from 28% in 2001
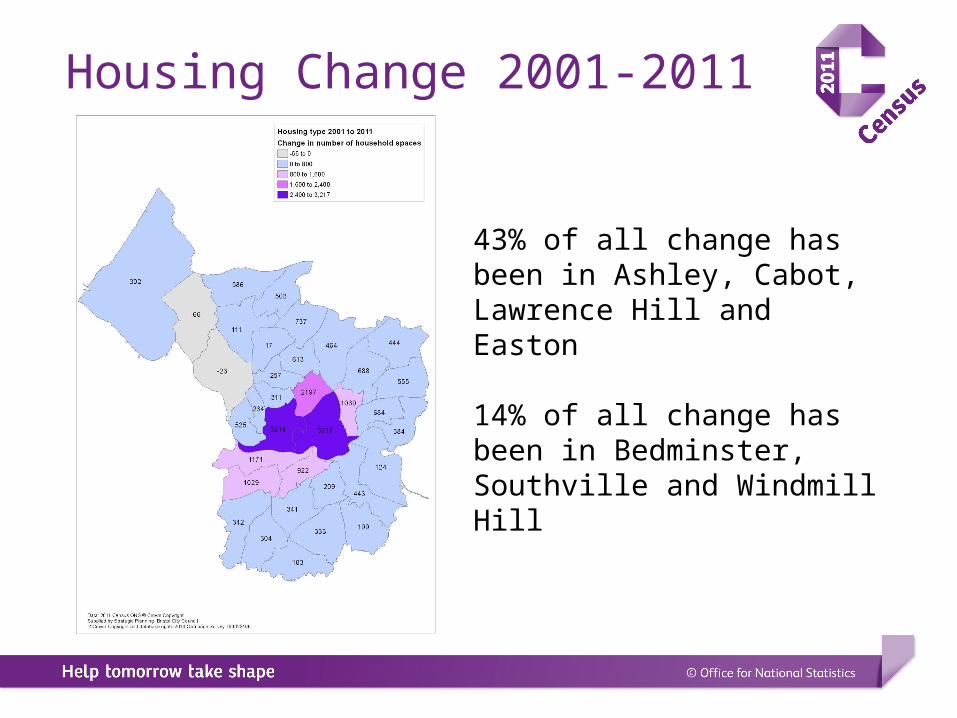
Housing Change 2001-2011
43% of all change has been in Ashley, Cabot, Lawrence Hill and Easton
14% of all change has been in Bedminster, Southville and Windmill Hill
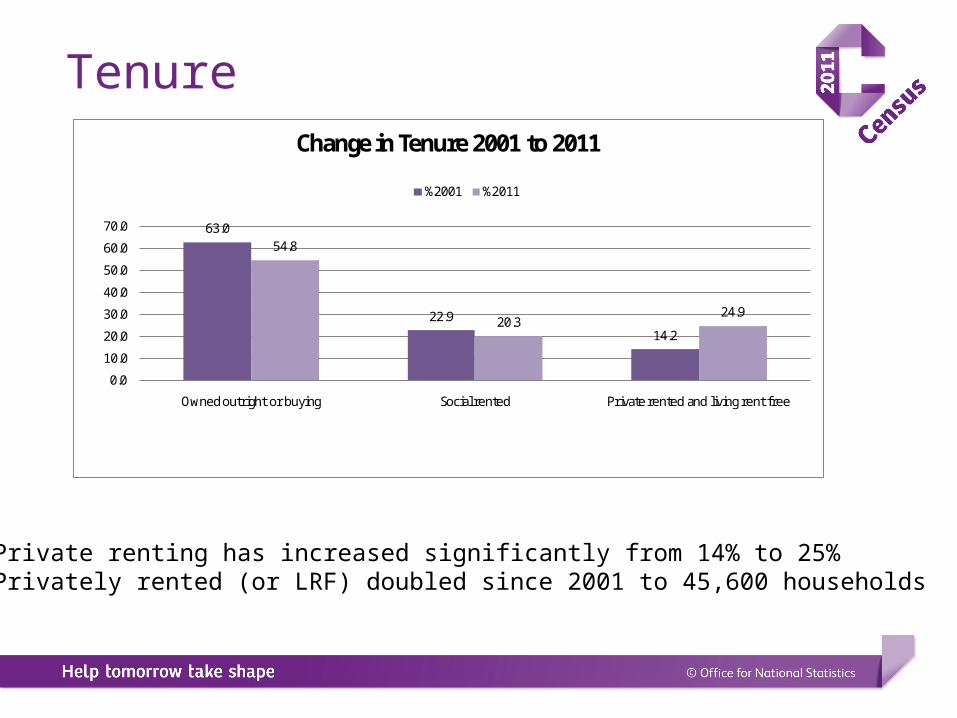
Tenure
Private renting has increased significantly from 14% to 25%Privately rented (or LRF) doubled since 2001 to 45,600 households
63.0
22.914.2
54.8
20.324.9
0.0
10.0
20.0
30.0
40.0
50.0
60.0
70.0
Owned outright or buying Social rented Private rented and living rent free
Change in Tenure 2001 to 2011
%2001 %2011

Tenure
OwnedStoke Bishop 83%Lawrence Hill 20%
Social RentedLawrence Hill 48%Stoke Bishop 3%
Private Rented or LRFClifton East 56%Whitchurch Park 7%
Household size
• Average household size: 2.3 people
• Average number of rooms/household: 5.0
• Average number of bedrooms/household: 2.6
• 13% of households overcrowded - occupancy rating of -1 rooms
• 33% of households overcrowded in Lawrence Hill
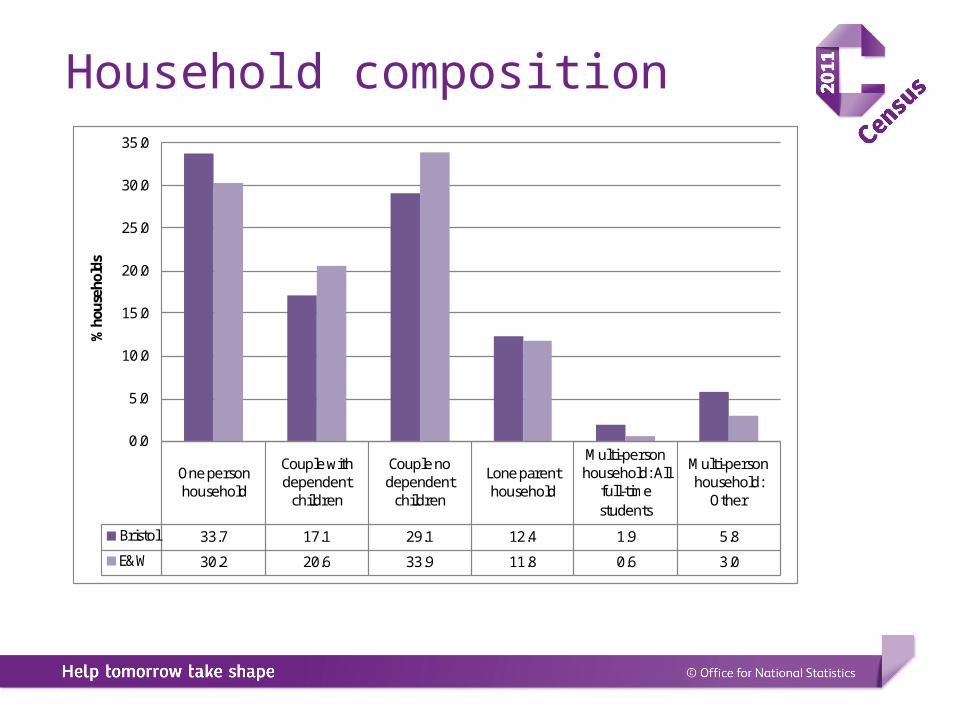
Household composition
One person household
Couple with dependent
children
Couple no dependent
children
Lone parent household
Multi-person household: All
full-time students
Multi-person household:
Other
Bristol 33.7 17.1 29.1 12.4 1.9 5.8
E&W 30.2 20.6 33.9 11.8 0.6 3.0
0.0
5.0
10.0
15.0
20.0
25.0
30.0
35.0
% h
ouse
hold
s

Part 2
GeographyGetting hold of the dataBristol analysisWhat data is coming next?
Census geography
Changes in OA and SOA boundaries in Bristol have taken place when:
i. significant population change has occurred since the 2001 Census
ii. areas have been independently assessed as lacking social homogeneity
Data sources may be for different geographies eg Indices of Deprivation 2010
by 2001 LSOA but 2011 Census by 2011 LSOAs.
Example: ‘St Pauls’ LSOA split into
i. ‘St Pauls City Road’
ii. ‘St Pauls Grovsenor Road’
iii. ‘St Pauls Portland Square’
For more information and maps see ‘2011 Geographies for 2011 Census data in Bristol’
Where to get the data: 1
BCC census web page www.bristol.gov.uk/census
Currently includes (PDFs!):
Briefing notes Change since 2001 Data by topic themes for Bristol LA Data for wards and Lower Super Output Areas Maps 2011 Census Profiles by ward and link to tool.………
2011 Census Selected Statistics Tool
Excel tool for creating area profiles
Tool available on BCC 2011 Census web pagehttp://www.bristol.gov.uk/page/census-2011
Demo >>>>>>>>>
Where to get the data: 2
NOMIS https://www.nomisweb.co.uk/
Key Statistics and Quick StatisticsDetailed Statistics and Local Characteristics to comeWizard query toolDownload one table at a time but for several areas
Where to get the data: 3
Neighbourhood Statistics http://neighbourhood.statistics.gov.uk/
Data by topic for downloadPostcode search for profilesNo crosstabulations!
Where to get the data: 4
Office for National Statistics (ONS)http://www.ons.gov.uk/census/
Census ProspectusTopic ReportsData visualisationsData Explorer Tool – available summer 2013
Planned analysis & reports - Bristol
2011 Census Atlas and/or series of ‘Topic Reports’
in discussion with individual teams including:
National and Core City comparisons Change 2001-2011 LSOA maps Topics: equalities communities, community cohesion,
housing, health, travel and transport, workforce and jobs, students etc…..
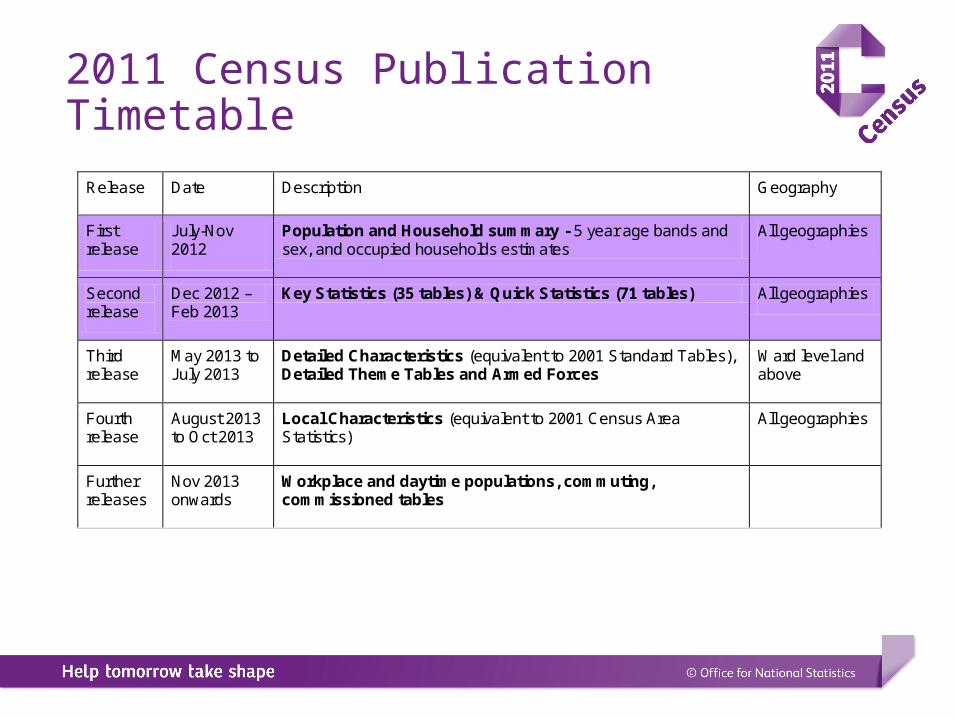
2011 Census Publication Timetable
Release Date Description Geography
First release
July-Nov 2012
Population and Household summary - 5 year age bands and sex, and occupied households estimates
All geographies
Second release
Dec 2012 – Feb 2013
Key Statistics (35 tables) & Quick Statistics (71 tables) All geographies
Third release
May 2013 to July 2013
Detailed Characteristics (equivalent to 2001 Standard Tables), Detailed Theme Tables and Armed Forces
Ward level and above
Fourth release
August 2013 to Oct 2013
Local Characteristics (equivalent to 2001 Census Area Statistics)
All geographies
Further releases
Nov 2013 onwards
Workplace and daytime populations, commuting, commissioned tables

ONS Population TimetableRelease Date Description Geography
30 April 2013 2002-2010 MYE revised time series LA and higher LA Mid Year Estimates
June/July 2013 2012 Mid Year Estimate LA and higher
11 April 2013 Mid-2011 SAPE LSOA and higher
August/Sept 2013
2002-2010 SAPE revised time series LSOA and higher
Small Area Population Estimates
Sept/Oct 2013 Mid-2012 SAPE LSOA and higher
May 2014 2012-based Sub-national Population Projections
LA and higher Population Projections
Autumn 2014 2012-based CLG Household projections LA and higher
Contact details
Jayne MillsStrategic PlanningNeighbourhoods and City DevelopmentBristol City Council
T: 0117 90 36873E: [email protected]: http://www.bristol.gov.uk/census