Embed Size (px)
Citation preview
2011 Detroit 3–UAW
Labor Contract Negotiations
CAR Breakfast Briefing Schoolcraft Community College
Livonia, Michigan 29 November 2011
Sean McAlinden, Ph.D. Kristin Dziczek Art Schwartz, Ph.D. Executive Vice President, Research Director, Labor and Industry Group President, Labor and Economics Associates Chief Economist Director, Program for Automotive Former General Director, Labor Relations, GM Labor and Education
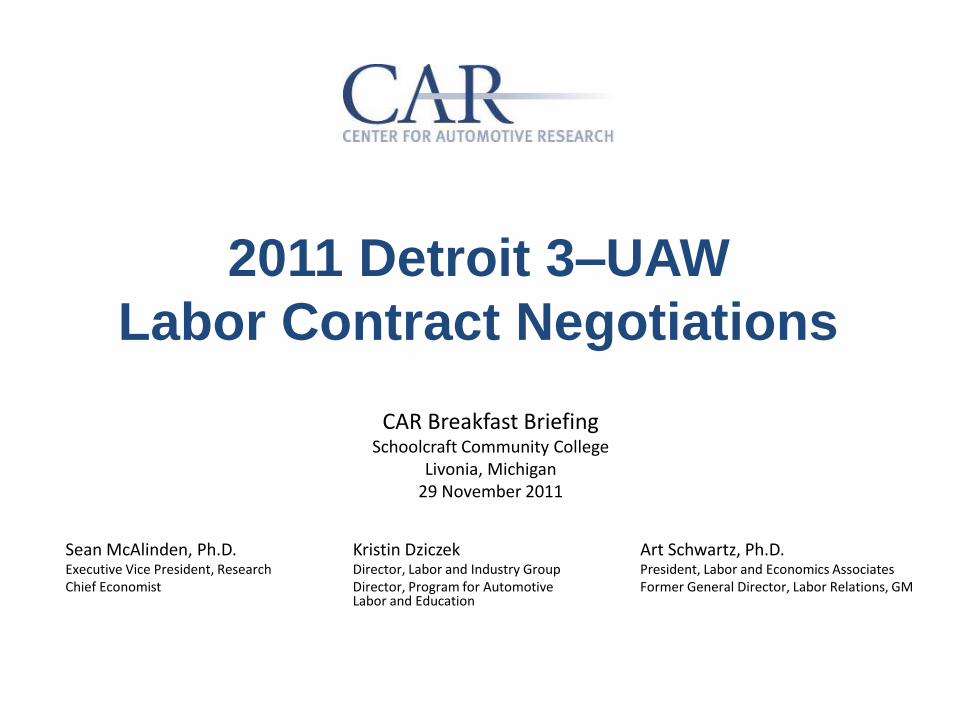
Agenda
8:30 Welcome and Introduction
−Sean McAlinden, CAR
“What’s in the Agreements?”
−Kristin Dziczek, CAR
“A Look Back and a Look Forward”
−Art Schwartz, Labor & Economics
Associates
9:30 Break
9:50 “Well, Who Won?”
−Sean McAlinden, CAR
Panel Discussion
11:00 Adjourn
What’s In the 2011 Detroit 3–UAW
Labor Contracts
CAR Breakfast Briefing Schoolcraft Community College
Livonia, Michigan 29 November 2011
Kristin Dziczek Director, Labor and Industry Group
Director, Program for Automotive Labor and Education
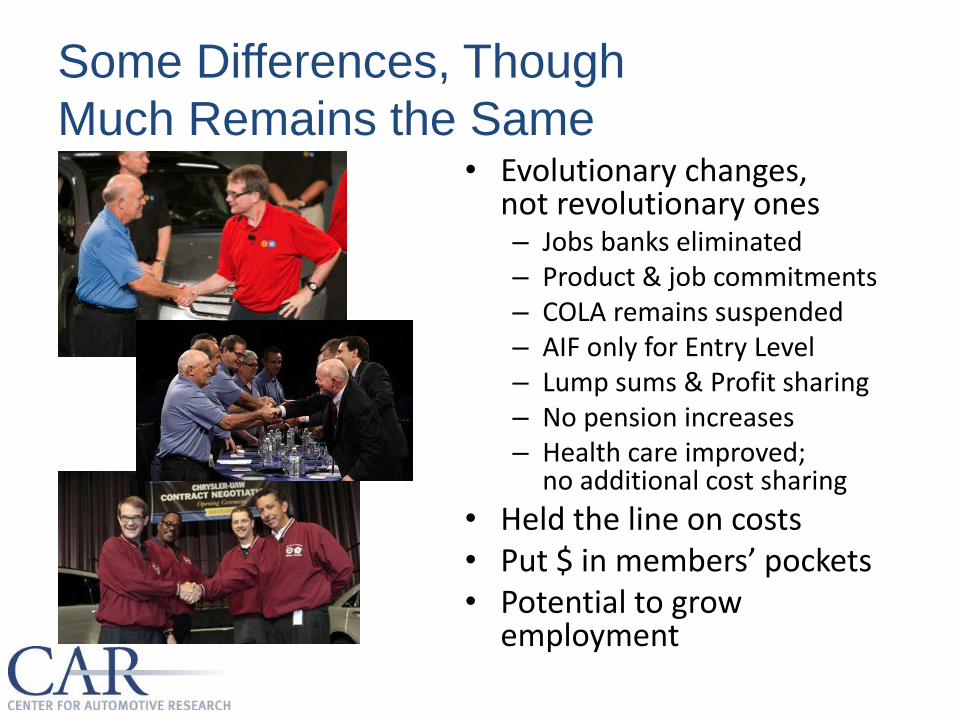
Some Differences, Though
Much Remains the Same • Evolutionary changes,
not revolutionary ones – Jobs banks eliminated – Product & job commitments – COLA remains suspended – AIF only for Entry Level – Lump sums & Profit sharing – No pension increases – Health care improved;
no additional cost sharing
• Held the line on costs • Put $ in members’ pockets • Potential to grow
employment
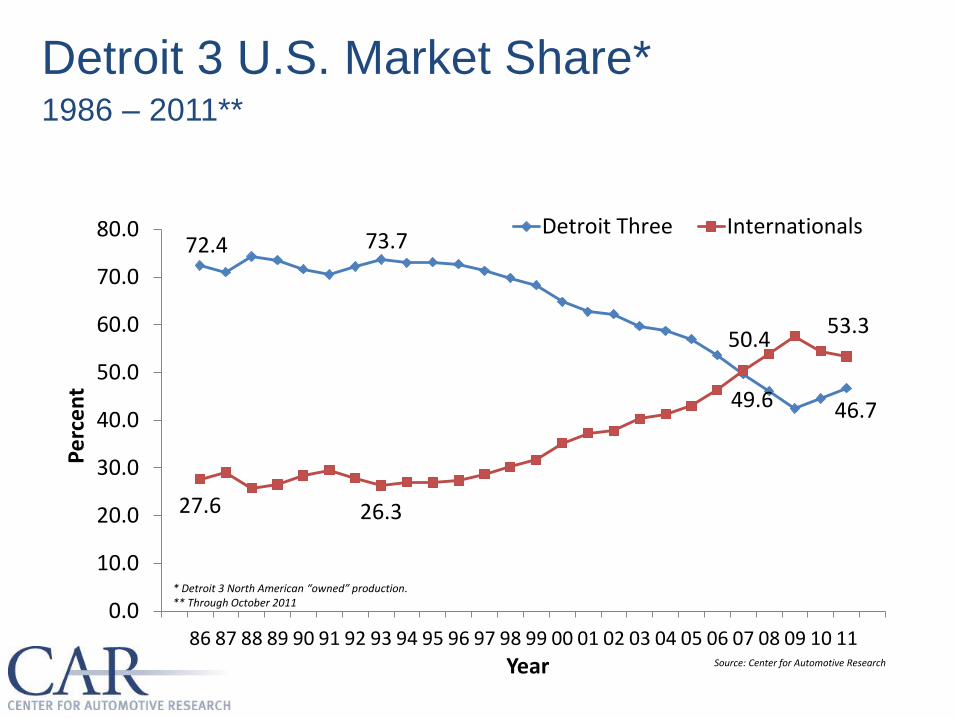
Detroit 3 U.S. Market Share* 1986 – 2011**
72.4 73.7
49.6 46.7
27.6 26.3
50.4 53.3
0.0
10.0
20.0
30.0
40.0
50.0
60.0
70.0
80.0
86 87 88 89 90 91 92 93 94 95 96 97 98 99 00 01 02 03 04 05 06 07 08 09 10 11
Pe
rce
nt
Year
Detroit Three Internationals
* Detroit 3 North American “owned” production. ** Through October 2011
Source: Center for Automotive Research
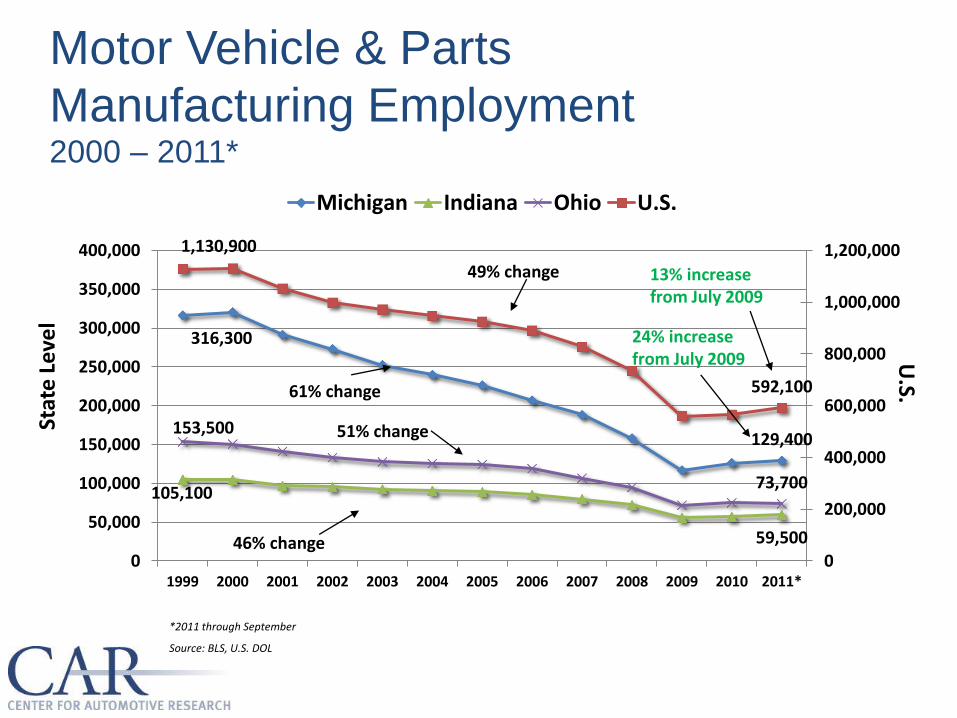
Motor Vehicle & Parts
Manufacturing Employment 2000 – 2011*
316,300
129,400
105,100
59,500
153,500
73,700
1,130,900
592,100
0
200,000
400,000
600,000
800,000
1,000,000
1,200,000
0
50,000
100,000
150,000
200,000
250,000
300,000
350,000
400,000
1999 2000 2001 2002 2003 2004 2005 2006 2007 2008 2009 2010 2011*
U.S.
Stat
e L
eve
l
Michigan Indiana Ohio U.S.
49% change
61% change
51% change
46% change
*2011 through September
Source: BLS, U.S. DOL
13% increase from July 2009
24% increase from July 2009
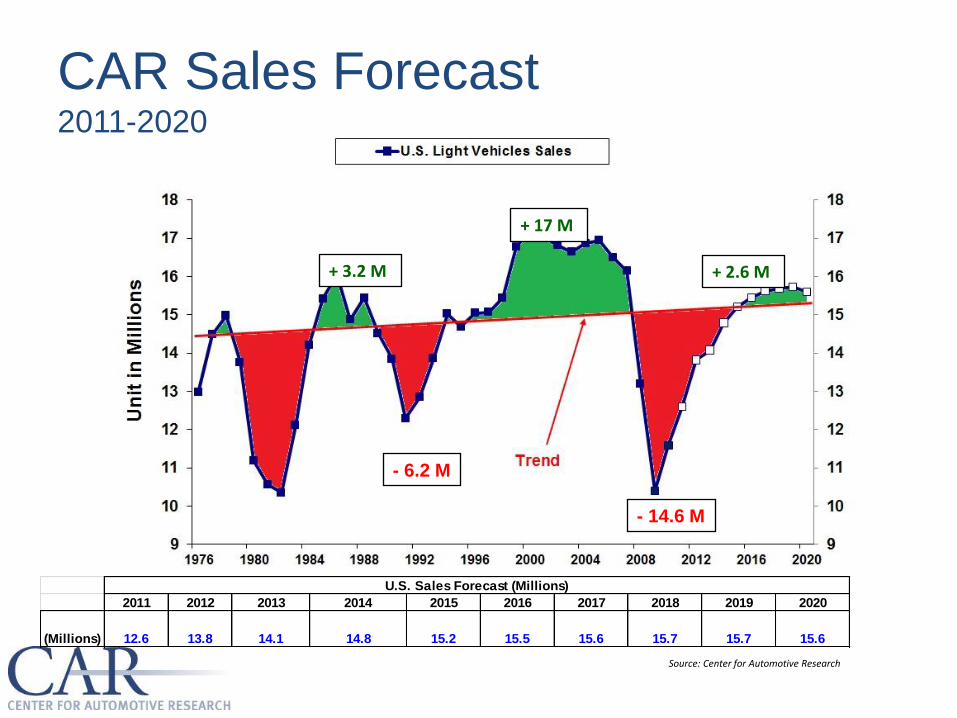
CAR Sales Forecast 2011-2020
+ 17 M
+ 3.2 M
- 6.2 M
- 14.6 M
+ 2.6 M
2011 2012 2013 2014 2015 2016 2017 2018 2019 2020
(Millions) 12.6 13.8 14.1 14.8 15.2 15.5 15.6 15.7 15.7 15.6
U.S. Sales Forecast (Millions)
Source: Center for Automotive Research

Factors Driving Hiring:
• Profitability & Market
– Market recovery and production rebound
– Profitable at lower volumes
• Labor
– Underlying workforce demographics
– Labor cost parity possible under recent UAW agreements
– New job commitments
• Faster cadence of new products and introduction of advanced vehicle technologies
• Technological changes
– Need to meet new fuel economy and GHG mandates
– Improved safety
– Increased electronics content for safety, connectivity and entertainment
• Investment
– Corporate investment >$17.4B in U.S. and Canada in 2010-2011
– Government investment incentives (DOE $9.1B, ARRA)
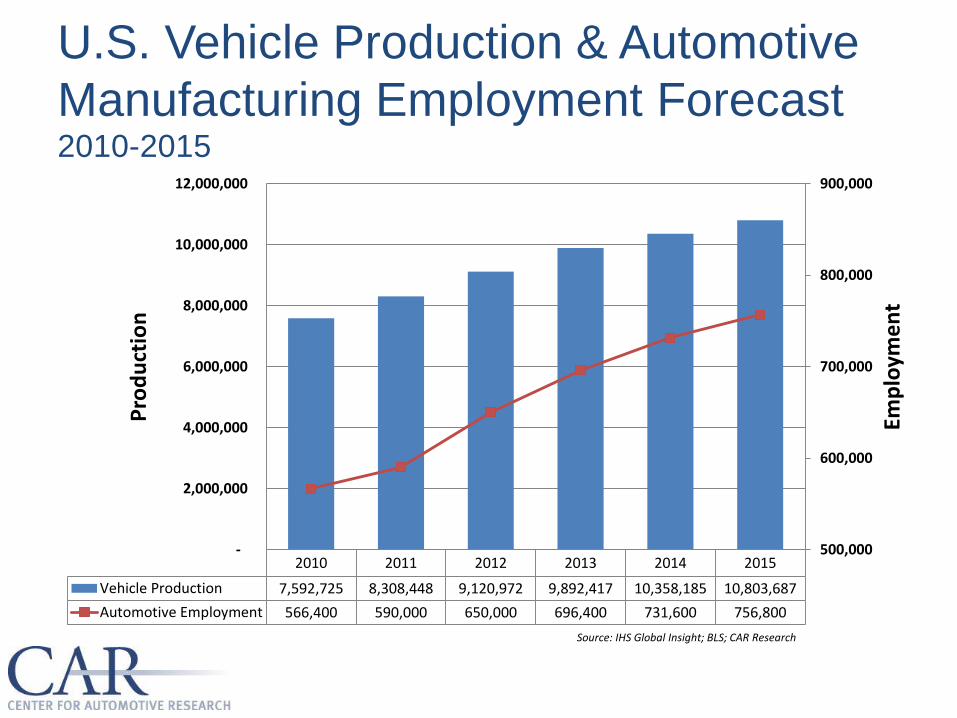
U.S. Vehicle Production & Automotive
Manufacturing Employment Forecast 2010-2015
2010 2011 2012 2013 2014 2015
Vehicle Production 7,592,725 8,308,448 9,120,972 9,892,417 10,358,185 10,803,687
Automotive Employment 566,400 590,000 650,000 696,400 731,600 756,800
500,000
600,000
700,000
800,000
900,000
-
2,000,000
4,000,000
6,000,000
8,000,000
10,000,000
12,000,000
Emp
loym
en
t
Pro
du
ctio
n
Source: IHS Global Insight; BLS; CAR Research
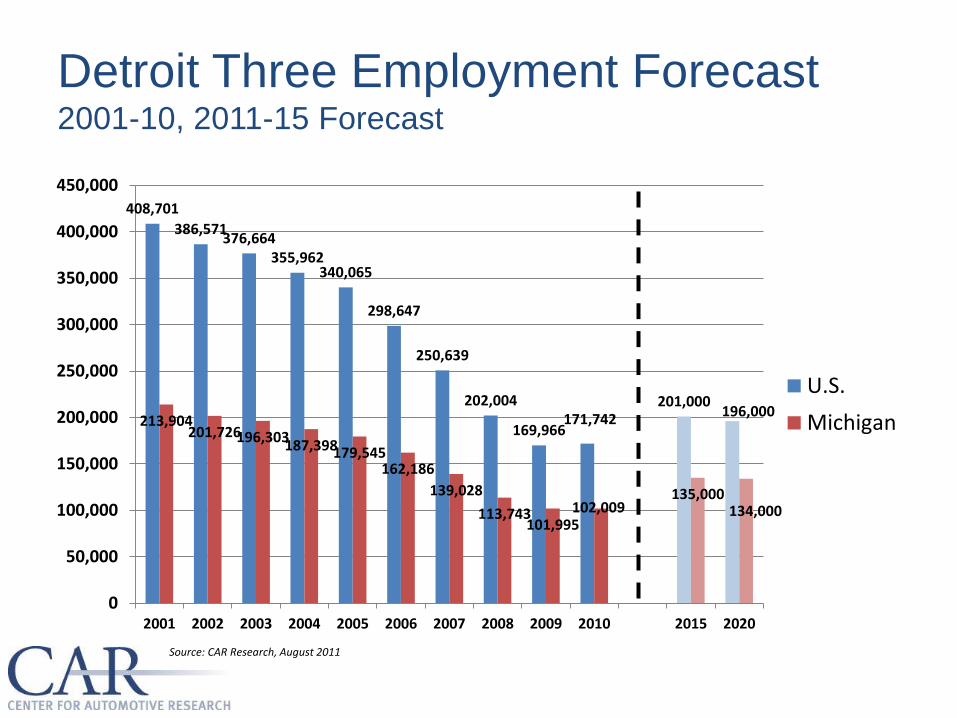
Detroit Three Employment Forecast 2001-10, 2011-15 Forecast
408,701
386,571 376,664
355,962 340,065
298,647
250,639
202,004
169,966 171,742
201,000 196,000
213,904 201,726 196,303
187,398 179,545 162,186
139,028
113,743 101,995
102,009 135,000
134,000
0
50,000
100,000
150,000
200,000
250,000
300,000
350,000
400,000
450,000
2001 2002 2003 2004 2005 2006 2007 2008 2009 2010 2015 2020
U.S.
Michigan
Source: CAR Research, August 2011
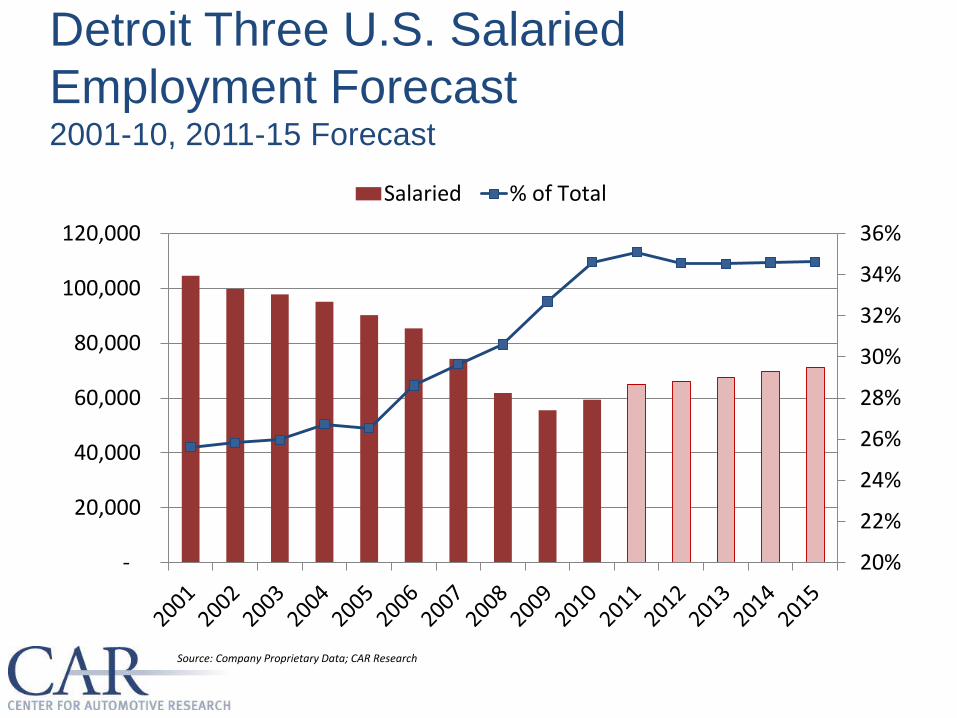
Detroit Three U.S. Salaried
Employment Forecast 2001-10, 2011-15 Forecast
20%
22%
24%
26%
28%
30%
32%
34%
36%
-
20,000
40,000
60,000
80,000
100,000
120,000
Salaried % of Total
Source: Company Proprietary Data; CAR Research
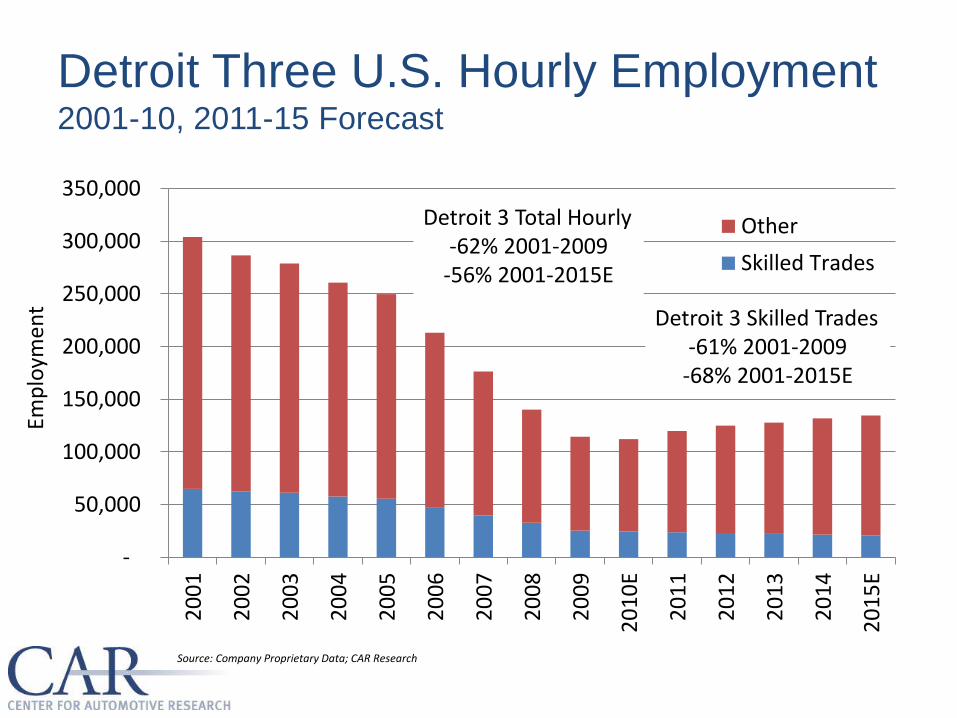
Detroit Three U.S. Hourly Employment 2001-10, 2011-15 Forecast
-
50,000
100,000
150,000
200,000
250,000
300,000
350,0002
00
1
20
02
20
03
20
04
20
05
20
06
20
07
20
08
20
09
20
10
E
20
11
20
12
20
13
20
14
20
15
E
Other
Skilled Trades
Emp
loym
ent
Detroit 3 Total Hourly -62% 2001-2009
-56% 2001-2015E
Detroit 3 Skilled Trades -61% 2001-2009
-68% 2001-2015E
Source: Company Proprietary Data; CAR Research

Chrysler Ford GM
Signing
bonus
$3,500 ($1,750 paid in 2011) $6,000 ($5,000 for <1 year seniority) $5,000
Wages Entry level $15.78-19.28, four year progression;
no change for first tier
Entry level $14.78-19.28, four year
progression; no change for first tier
Jobs Promises 2,100 new entry-level
jobs; 10,000 retained
Promises 5,750 new entry-level
jobs; 6,250 previously announced
job creation/retention
Promises 6,400 new entry-level
jobs; 11,800 previously announced
job creation/retention
Buyouts None $100,000 for skilled trades and
$50,000 for production workers who
retire by 3/31/12
$75,000 for skilled trades who retire
by 3/31/12; $10,000 for any workers
who leave by 2013
Profit-
sharing
$1 for every $1 million profit based
on 85% of worldwide profit; capped
at $12,000 per year
$1 for every $1 million in North
American profit (Avg. $3,752 payout
in November based on Q1-2 2011);
capped at $12,000 per year
$1 for every $1 million in North
American profit; capped at $12,000
per year
Retirees No change to pensions and no bonuses; health care trust may get 10% of workers' profit-sharing
COLA None
Other
bonuses
Four annual payments of $500-
1,000; $500-1,000 annual quality
bonus; $300 one-time attendance
bonus for perfect attendance
Four annual payments of $1,500 for
inflation protection; and four annual
payments up to $250 per year for
competitiveness bonus
Three annual payments of $1,000
for inflation protection (2012-2014);
and four annual payments up to
$250 per year quality bonus
Health care No change to worker contribution;
$20 co-pay for unlimited office visits
No change to worker contribution;
$20 co-pay for unlimited office visits
No change to worker contribution;
$25 co-pay for unlimited office visits
New 2011 UAW Contracts and Jobs
Source: Center for Automotive Research, UAW-Chrysler, UAW-Ford, and UAW-GM White Books
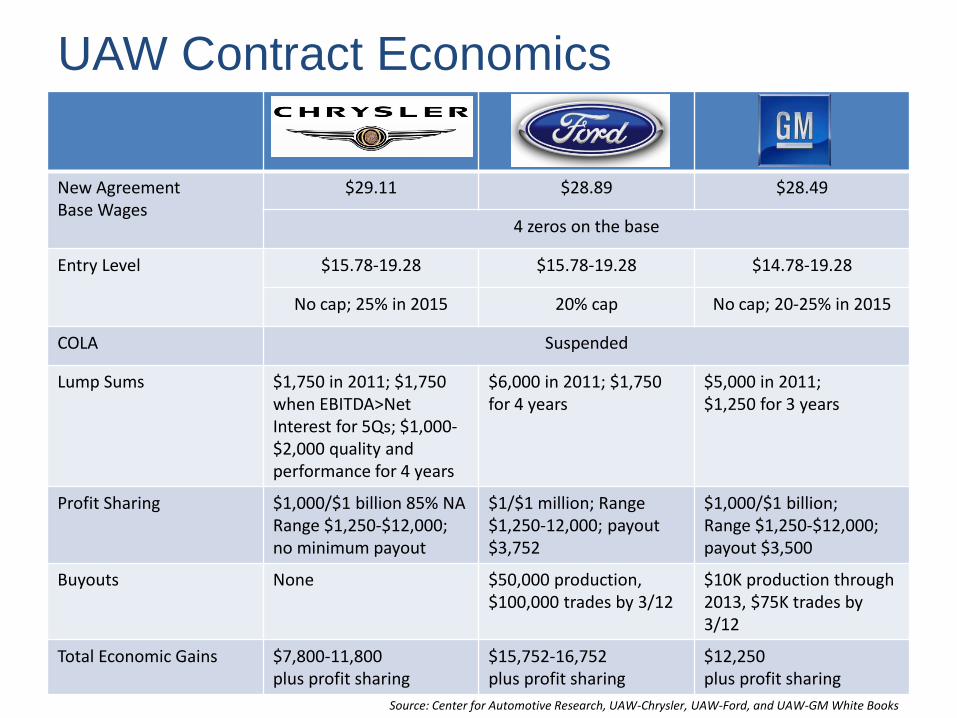
UAW Contract Economics
New Agreement Base Wages
$29.11 $28.89 $28.49
4 zeros on the base
Entry Level $15.78-19.28 $15.78-19.28 $14.78-19.28
No cap; 25% in 2015 20% cap No cap; 20-25% in 2015
COLA Suspended
Lump Sums $1,750 in 2011; $1,750 when EBITDA>Net Interest for 5Qs; $1,000-$2,000 quality and performance for 4 years
$6,000 in 2011; $1,750 for 4 years
$5,000 in 2011; $1,250 for 3 years
Profit Sharing $1,000/$1 billion 85% NA Range $1,250-$12,000; no minimum payout
$1/$1 million; Range $1,250-12,000; payout $3,752
$1,000/$1 billion; Range $1,250-$12,000; payout $3,500
Buyouts None $50,000 production, $100,000 trades by 3/12
$10K production through 2013, $75K trades by 3/12
Total Economic Gains $7,800-11,800 plus profit sharing
$15,752-16,752 plus profit sharing
$12,250 plus profit sharing
Source: Center for Automotive Research, UAW-Chrysler, UAW-Ford, and UAW-GM White Books
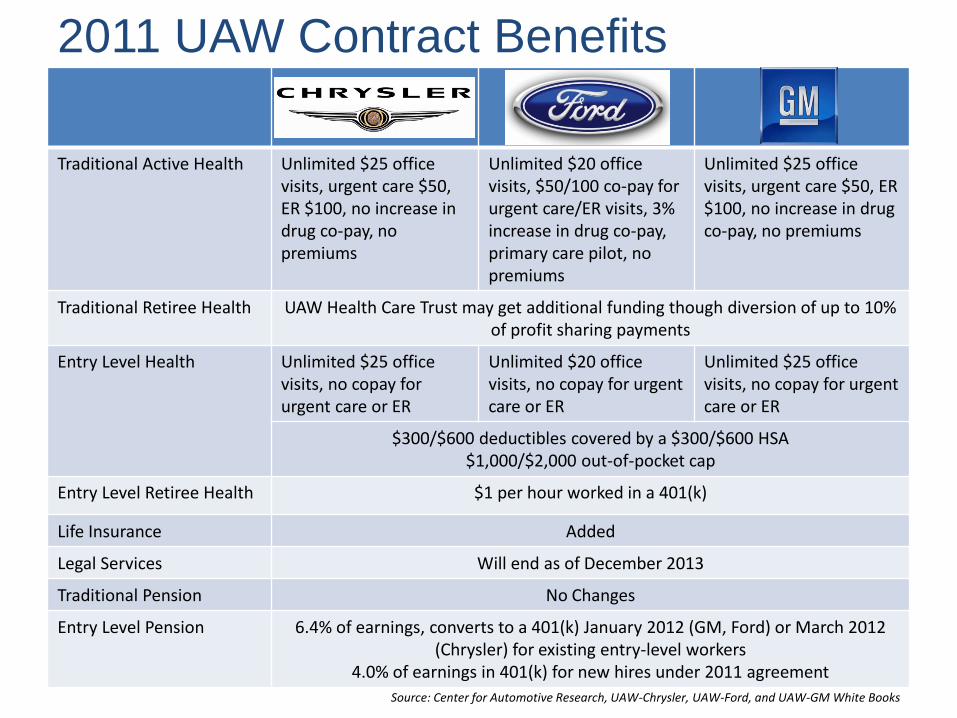
2011 UAW Contract Benefits
Traditional Active Health Unlimited $25 office visits, urgent care $50, ER $100, no increase in drug co-pay, no premiums
Unlimited $20 office visits, $50/100 co-pay for urgent care/ER visits, 3% increase in drug co-pay, primary care pilot, no premiums
Unlimited $25 office visits, urgent care $50, ER $100, no increase in drug co-pay, no premiums
Traditional Retiree Health UAW Health Care Trust may get additional funding though diversion of up to 10% of profit sharing payments
Entry Level Health Unlimited $25 office visits, no copay for urgent care or ER
Unlimited $20 office visits, no copay for urgent care or ER
Unlimited $25 office visits, no copay for urgent care or ER
$300/$600 deductibles covered by a $300/$600 HSA $1,000/$2,000 out-of-pocket cap
Entry Level Retiree Health $1 per hour worked in a 401(k)
Life Insurance Added
Legal Services Will end as of December 2013
Traditional Pension No Changes
Entry Level Pension 6.4% of earnings, converts to a 401(k) January 2012 (GM, Ford) or March 2012 (Chrysler) for existing entry-level workers
4.0% of earnings in 401(k) for new hires under 2011 agreement
Source: Center for Automotive Research, UAW-Chrysler, UAW-Ford, and UAW-GM White Books
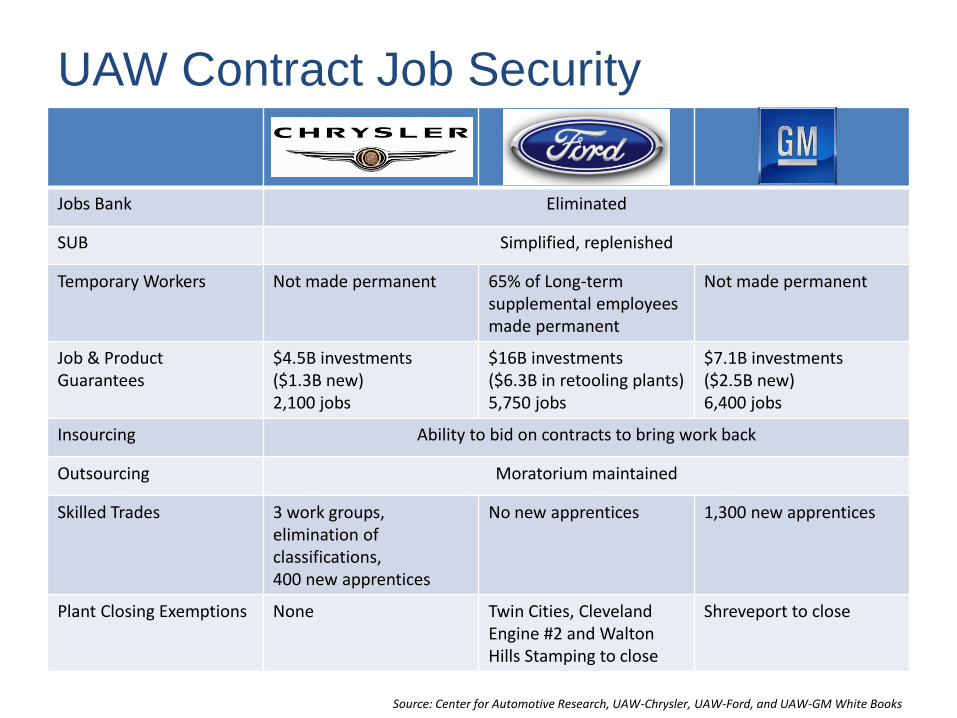
UAW Contract Job Security
Jobs Bank Eliminated
SUB Simplified, replenished
Temporary Workers Not made permanent 65% of Long-term supplemental employees made permanent
Not made permanent
Job & Product Guarantees
$4.5B investments ($1.3B new) 2,100 jobs
$16B investments ($6.3B in retooling plants) 5,750 jobs
$7.1B investments ($2.5B new) 6,400 jobs
Insourcing Ability to bid on contracts to bring work back
Outsourcing Moratorium maintained
Skilled Trades 3 work groups, elimination of classifications, 400 new apprentices
No new apprentices 1,300 new apprentices
Plant Closing Exemptions None Twin Cities, Cleveland Engine #2 and Walton Hills Stamping to close
Shreveport to close
Source: Center for Automotive Research, UAW-Chrysler, UAW-Ford, and UAW-GM White Books
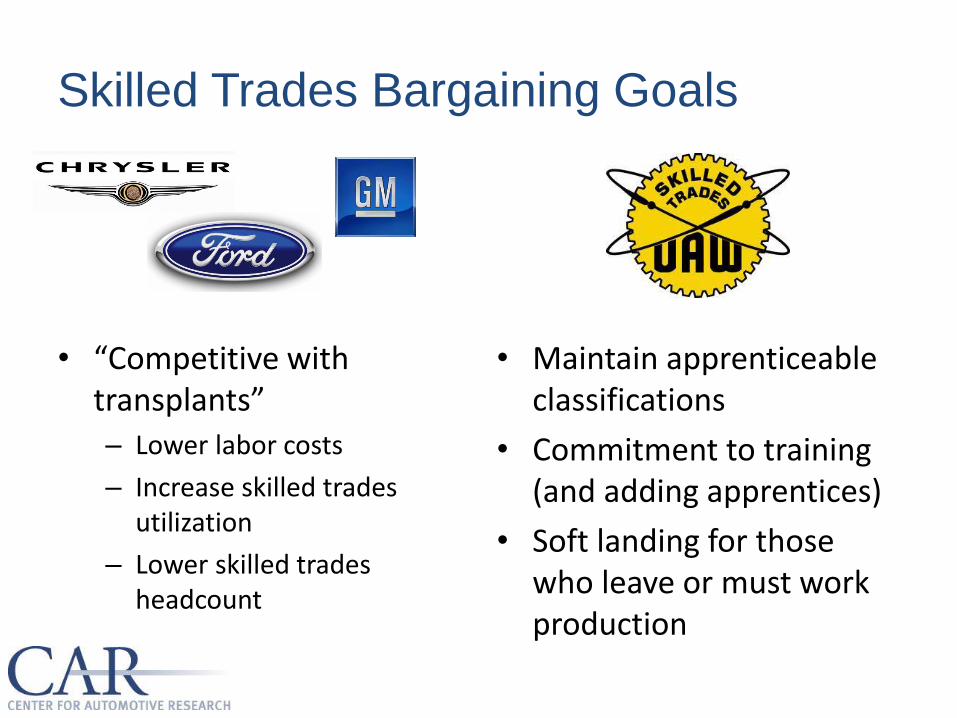
Skilled Trades Bargaining Goals
• “Competitive with transplants”
– Lower labor costs
– Increase skilled trades utilization
– Lower skilled trades headcount
• Maintain apprenticeable classifications
• Commitment to training (and adding apprentices)
• Soft landing for those who leave or must work production

Skilled Trades Teams
and Classifications
• Three teams: Mechanical, Electrical and Tool & Die
• Classifications have been reduced
– Designated “core” classifications that are apprenticable
– Grandfathered a number of classifications
– Eliminated unpopulated classifications
• Cross training for classifications
• 2007, 2009 and 2011 changes (an ongoing process)

Skilled Trades 2011 Contract Changes
• Work Rules – Can volunteer to work
production (Ford: $50K buydown)
– Can be forced to work production (at trades rate, no buydowns)
• Training – Continued cross-training to
new classifications – GM: Journeyperson-in-Training
classification
• Apprentices – Chrysler: 400* – Ford: None – GM: 1,300
• Rates – Frozen – GMCH cut to GM rates ($5 over
6 months)
• Insourcing – Bid on previously outsourced
work when up for contract renewal and new work
• Special Attrition Programs – Chrysler: No program – Ford: $100,000 to leave by
March 2012 – GM: $75,000 to leave by March
2012 – Return laid-off trades to trades
positions, where available
*Trenton South Technical Specialists will have opportunity if/when apprenticeships become available.

A Capacity Issue?
• Will have 28 U.S. assembly plants operating
• Unlikely to build new bricks and mortar
• In a 15-16 million+ market, capacity may be an issue
• More captive imports?
• More alternative work schedules (AWS)?
• AWS enabled by national language, determined by local agreements
• AWS includes a range of schedules: – Compressed
(4 10-hour shifts)
– Flexible (3/2/120— 3 crew, 2 10-hour shifts, no OT = adds 49 days/year)
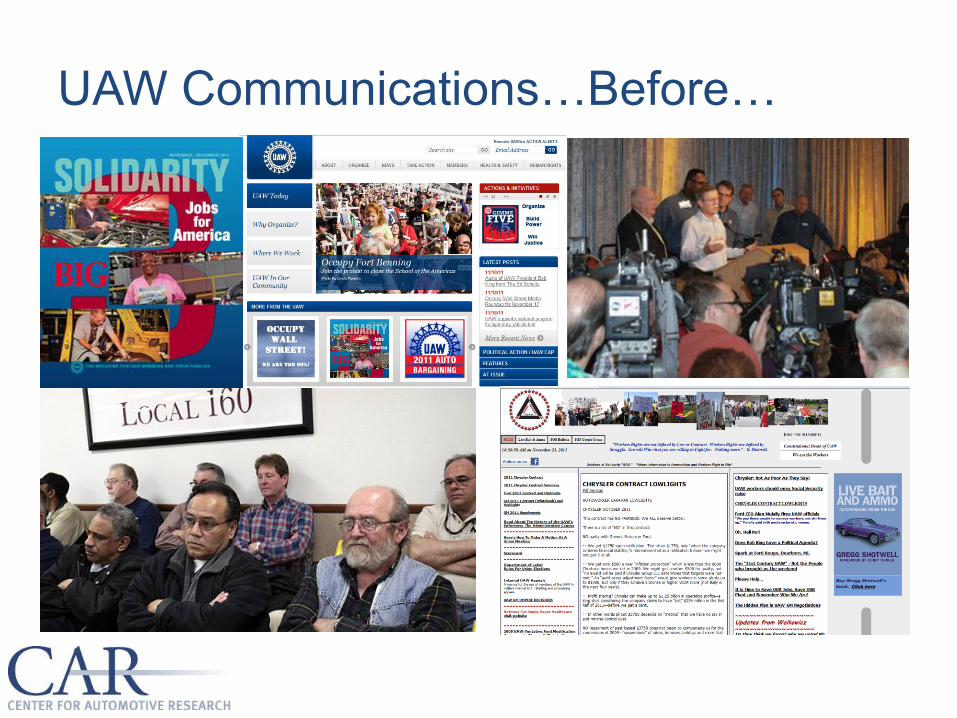
UAW Communications…Before…
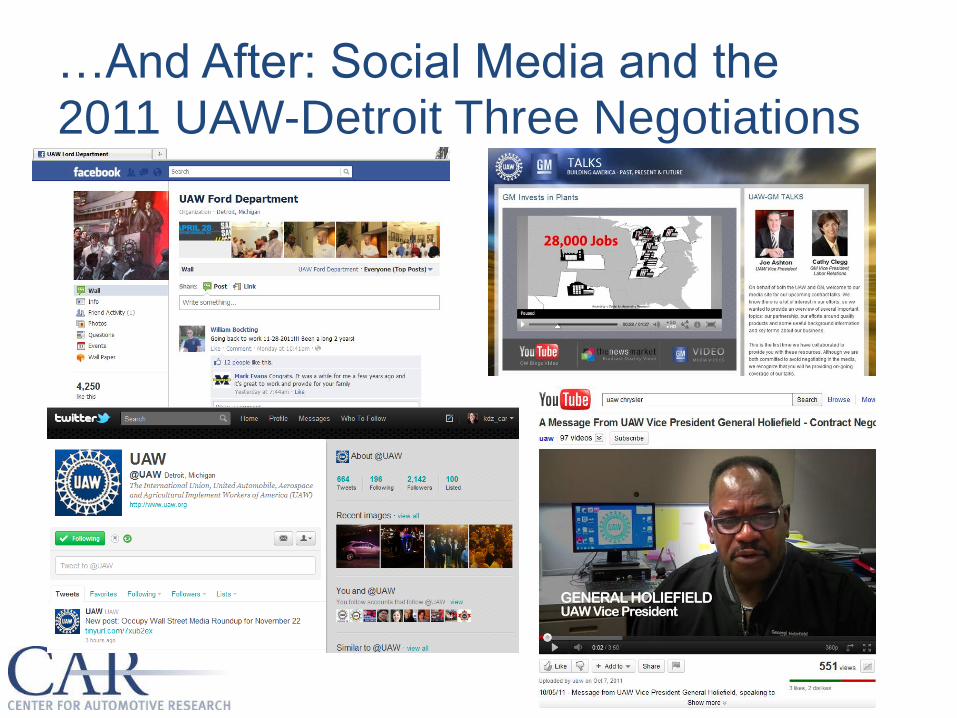
…And After: Social Media and the 2011 UAW-Detroit Three Negotiations
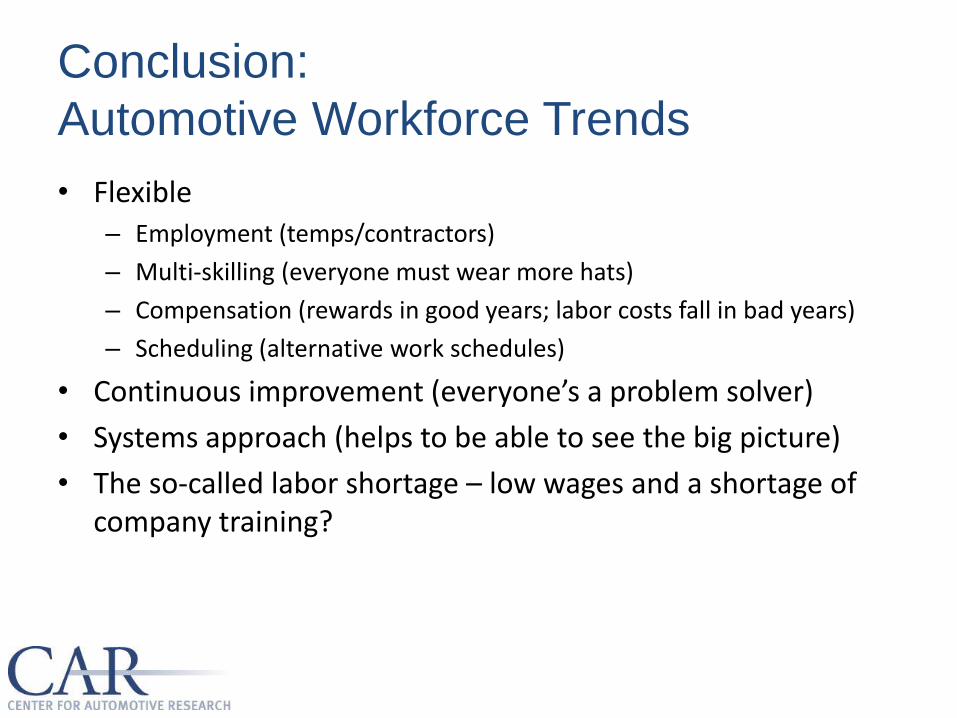
Conclusion:
Automotive Workforce Trends
• Flexible – Employment (temps/contractors)
– Multi-skilling (everyone must wear more hats)
– Compensation (rewards in good years; labor costs fall in bad years)
– Scheduling (alternative work schedules)
• Continuous improvement (everyone’s a problem solver)
• Systems approach (helps to be able to see the big picture)
• The so-called labor shortage – low wages and a shortage of company training?
A Look Back and
A Look Forward
CAR Breakfast Briefing Schoolcraft Community College
Livonia, Michigan 29 November 2011
Art Schwartz, Ph.D. President, Labor and Economics Associates
Former General Director, Labor Relations, General Motors
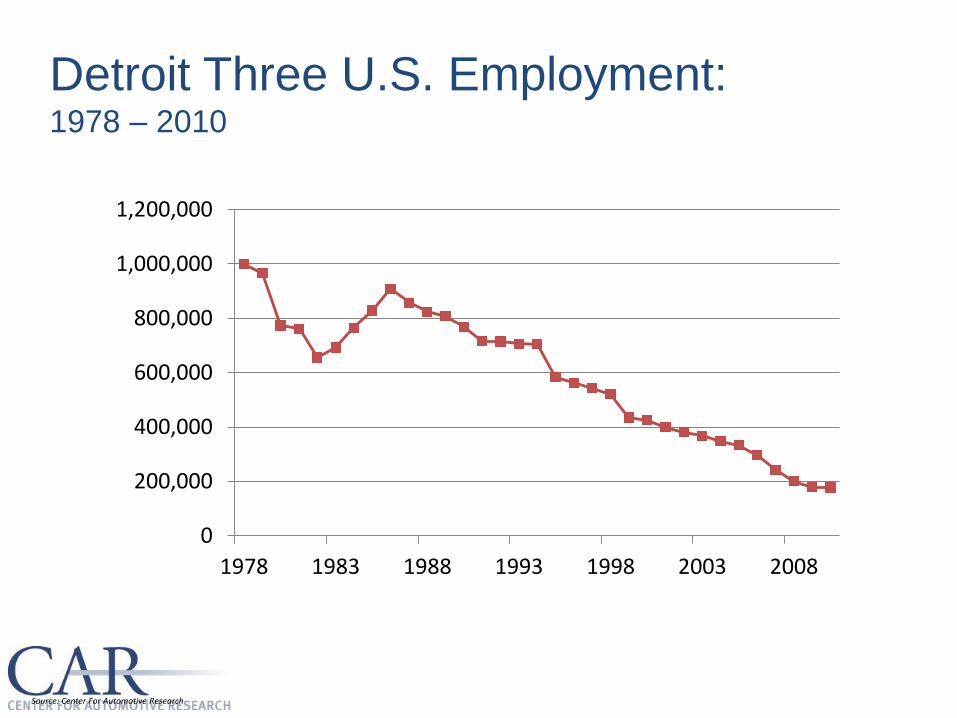
Detroit Three U.S. Employment: 1978 – 2010
0
200,000
400,000
600,000
800,000
1,000,000
1,200,000
1978 1983 1988 1993 1998 2003 2008
Source: Center For Automotive Research
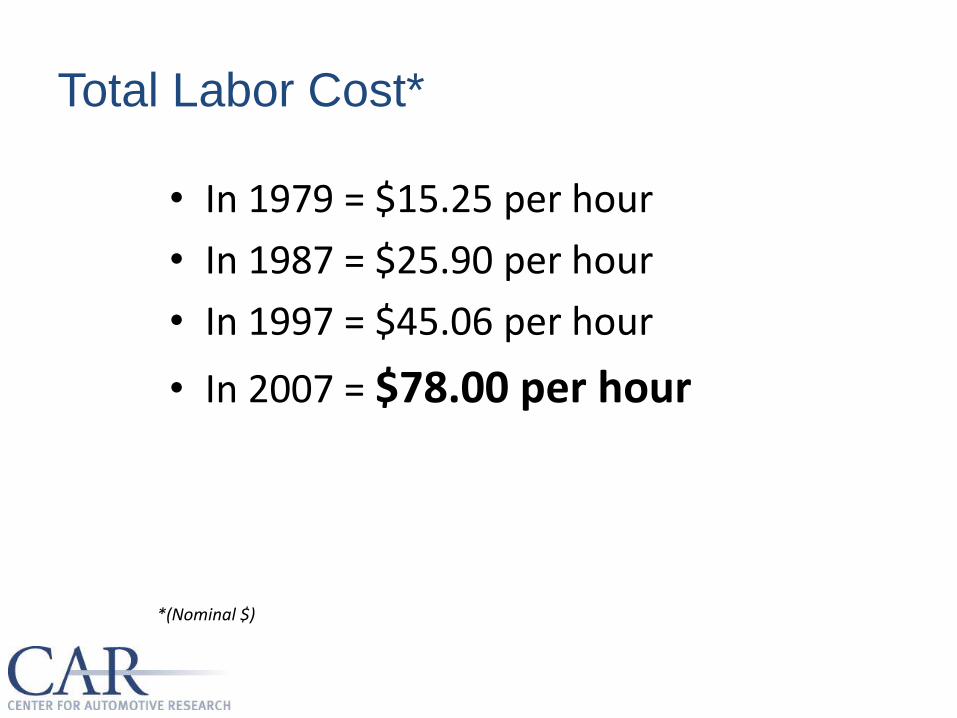
Total Labor Cost*
• In 1979 = $15.25 per hour
• In 1987 = $25.90 per hour
• In 1997 = $45.06 per hour
• In 2007 = $78.00 per hour
*(Nominal $)
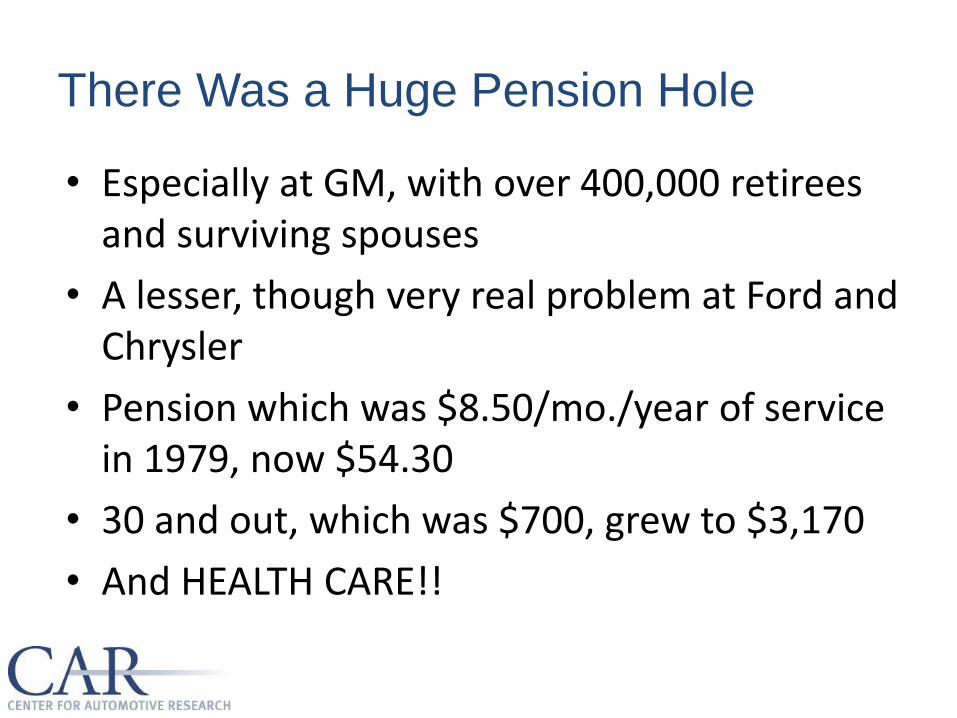
There Was a Huge Pension Hole
• Especially at GM, with over 400,000 retirees and surviving spouses
• A lesser, though very real problem at Ford and Chrysler
• Pension which was $8.50/mo./year of service in 1979, now $54.30
• 30 and out, which was $700, grew to $3,170
• And HEALTH CARE!!
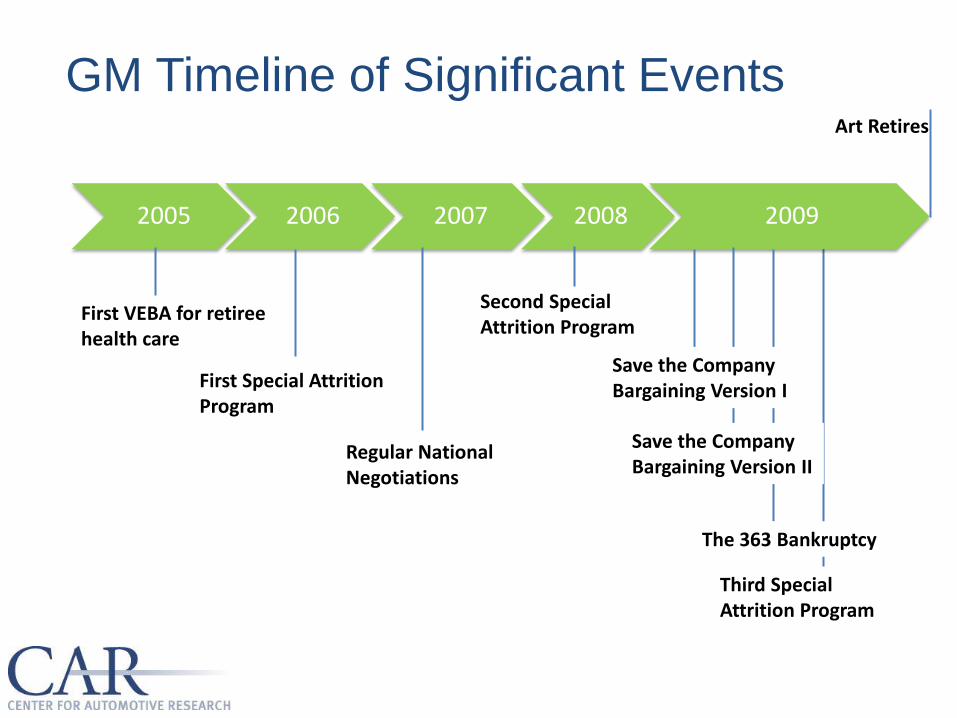
GM Timeline of Significant Events
2005 2006 2007 2008 2009
Second Special Attrition Program
Regular National Negotiations
First VEBA for retiree health care
First Special Attrition Program
Save the Company Bargaining Version II
Save the Company Bargaining Version I
Third Special Attrition Program
The 363 Bankruptcy
Art Retires

2007 Contract: A Game Changer
• VEBA
• Entry level wages ($14)
• No pay increase, BUT – Signing bonus of $3,000
– Lump sums of 3%, 3%, 4% (last two were suspended in 2009)
– COLA (suspended in 2009)
– Pensions increased
– Product guarantees (not fulfilled)

How GM Went from
$78 to $56 per Hour
Source: Company reports, CAR research
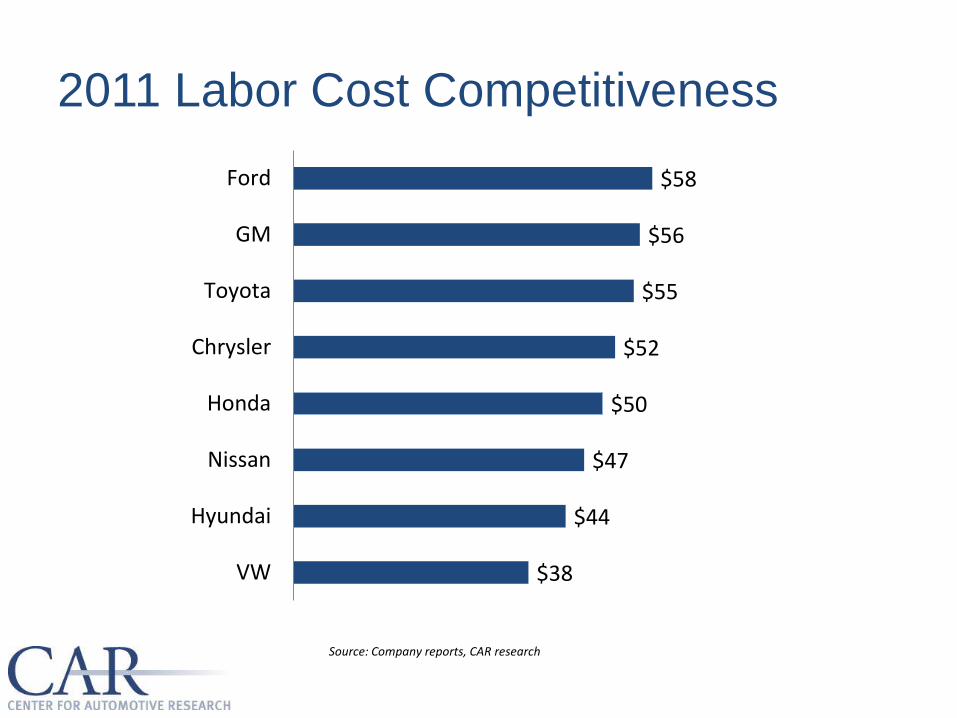
2011 Labor Cost Competitiveness
$58
$56
$55
$52
$50
$47
$44
$38
Ford
GM
Toyota
Chrysler
Honda
Nissan
Hyundai
VW
Source: Company reports, CAR research
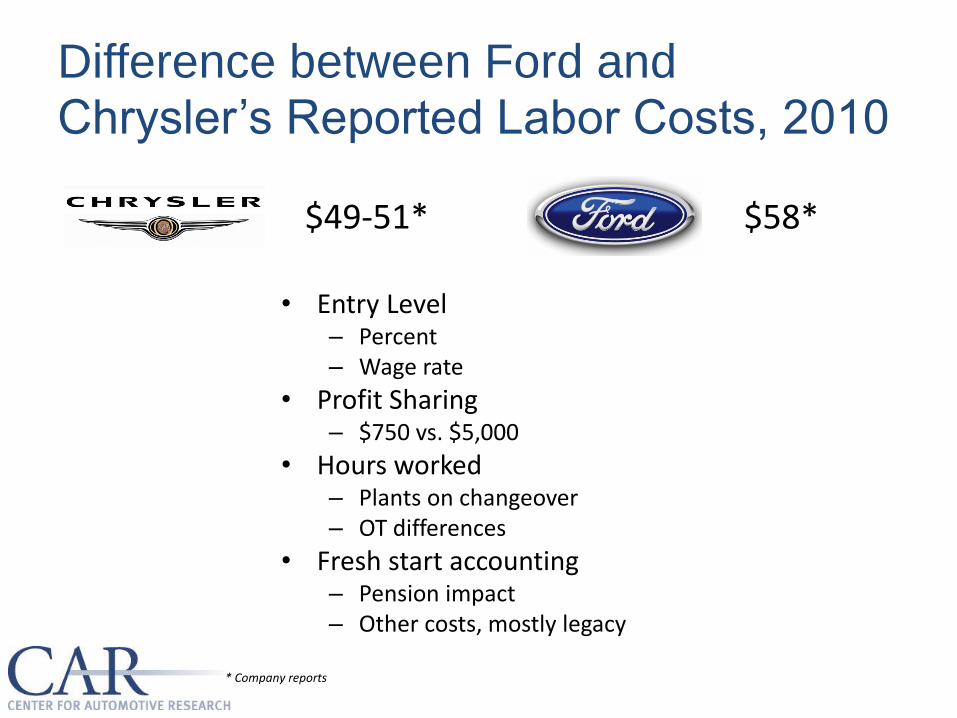
Difference between Ford and Chrysler’s Reported Labor Costs, 2010
• Entry Level – Percent – Wage rate
• Profit Sharing – $750 vs. $5,000
• Hours worked – Plants on changeover – OT differences
• Fresh start accounting – Pension impact – Other costs, mostly legacy
$49-51* $58*
* Company reports
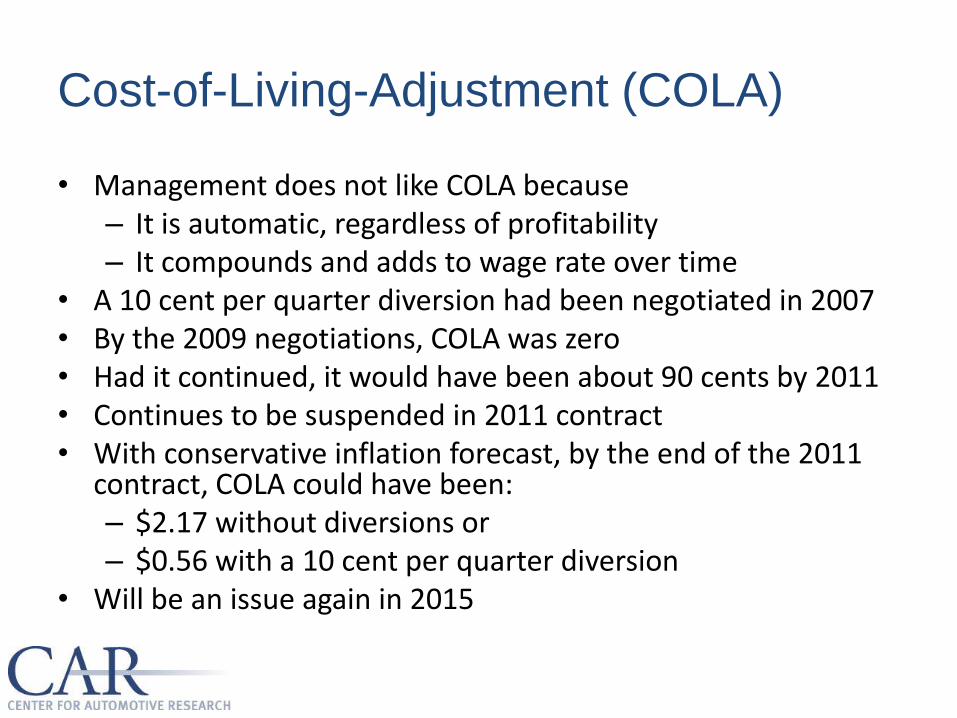
Cost-of-Living-Adjustment (COLA)
• Management does not like COLA because – It is automatic, regardless of profitability – It compounds and adds to wage rate over time
• A 10 cent per quarter diversion had been negotiated in 2007 • By the 2009 negotiations, COLA was zero • Had it continued, it would have been about 90 cents by 2011 • Continues to be suspended in 2011 contract • With conservative inflation forecast, by the end of the 2011
contract, COLA could have been: – $2.17 without diversions or – $0.56 with a 10 cent per quarter diversion
• Will be an issue again in 2015
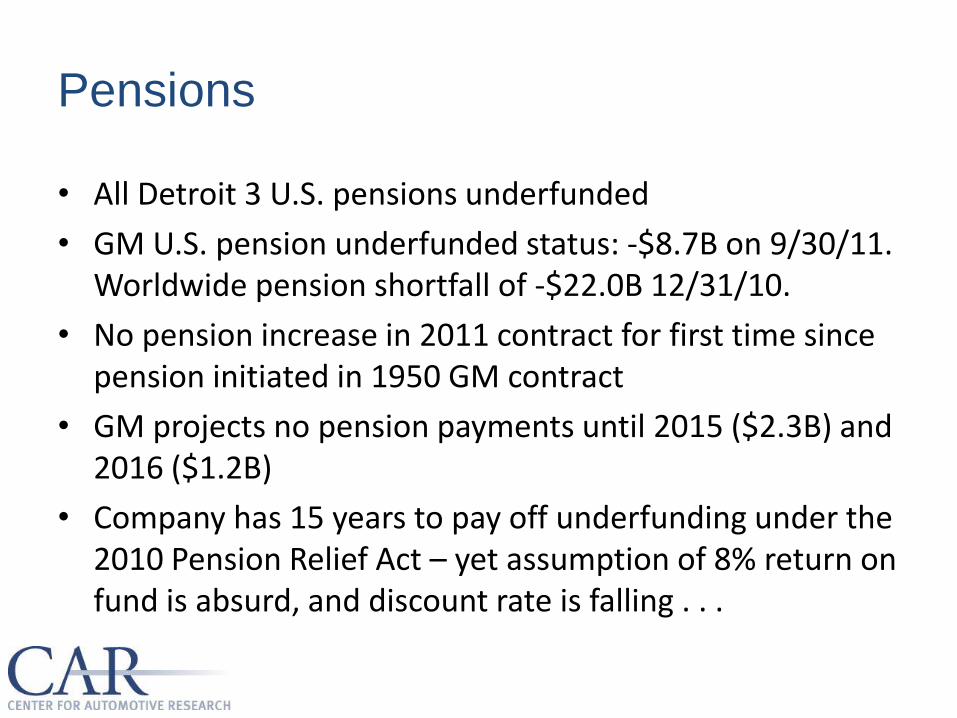
Pensions
• All Detroit 3 U.S. pensions underfunded
• GM U.S. pension underfunded status: -$8.7B on 9/30/11. Worldwide pension shortfall of -$22.0B 12/31/10.
• No pension increase in 2011 contract for first time since pension initiated in 1950 GM contract
• GM projects no pension payments until 2015 ($2.3B) and 2016 ($1.2B)
• Company has 15 years to pay off underfunding under the 2010 Pension Relief Act – yet assumption of 8% return on fund is absurd, and discount rate is falling . . .
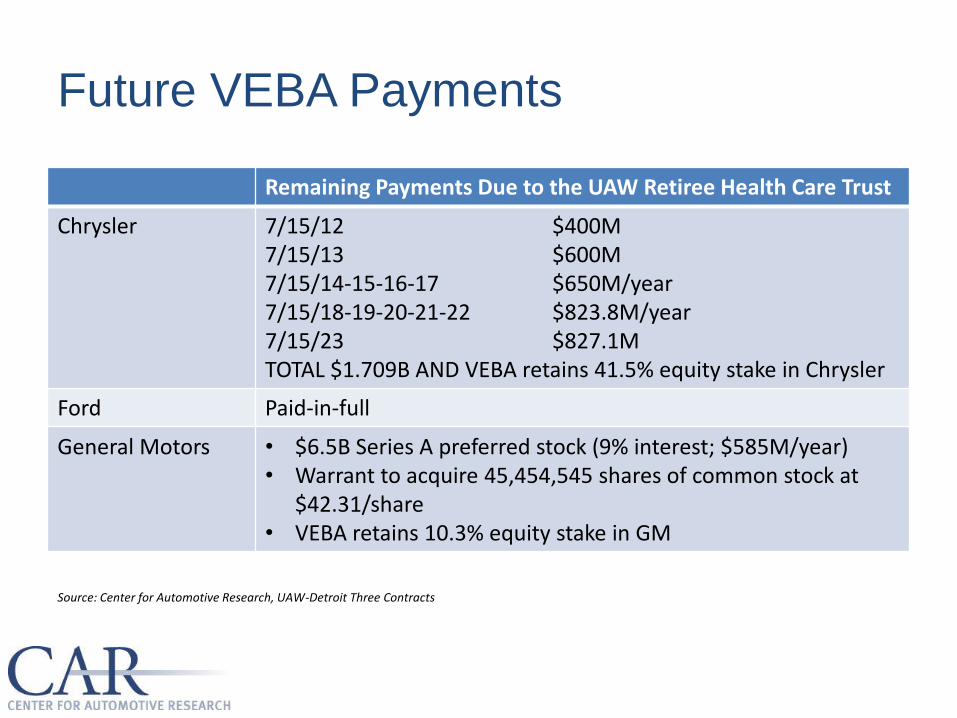
Future VEBA Payments
Remaining Payments Due to the UAW Retiree Health Care Trust
Chrysler 7/15/12 $400M 7/15/13 $600M 7/15/14-15-16-17 $650M/year 7/15/18-19-20-21-22 $823.8M/year 7/15/23 $827.1M TOTAL $1.709B AND VEBA retains 41.5% equity stake in Chrysler
Ford Paid-in-full
General Motors • $6.5B Series A preferred stock (9% interest; $585M/year) • Warrant to acquire 45,454,545 shares of common stock at
$42.31/share • VEBA retains 10.3% equity stake in GM
Source: Center for Automotive Research, UAW-Detroit Three Contracts
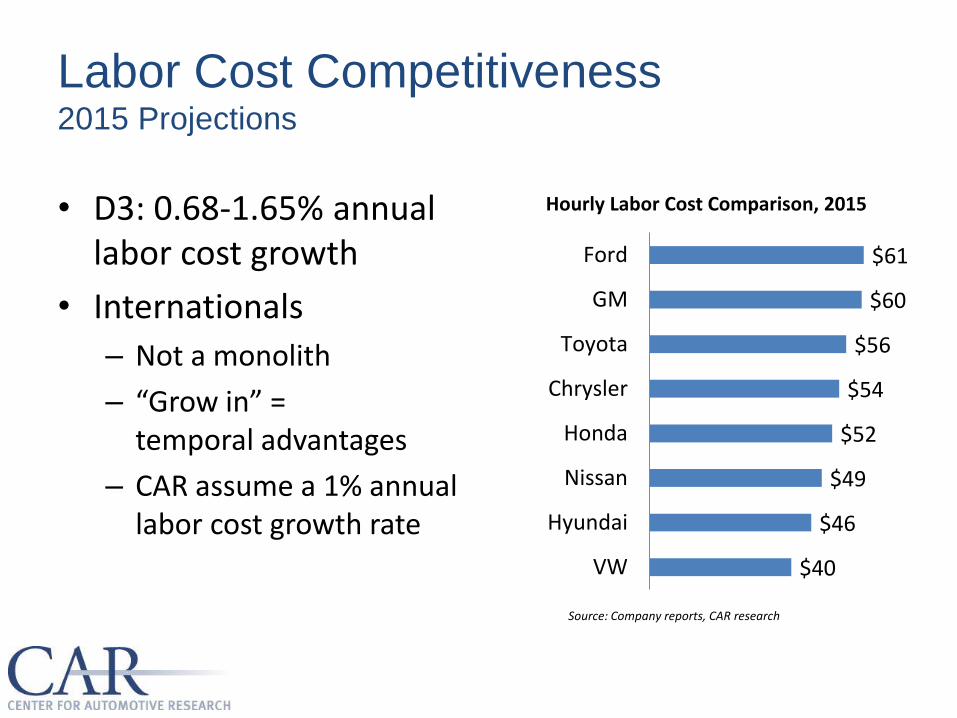
Labor Cost Competitiveness 2015 Projections
• D3: 0.68-1.65% annual labor cost growth
• Internationals
– Not a monolith
– “Grow in” = temporal advantages
– CAR assume a 1% annual labor cost growth rate
$61
$60
$56
$54
$52
$49
$46
$40
Ford
GM
Toyota
Chrysler
Honda
Nissan
Hyundai
VW
Hourly Labor Cost Comparison, 2015
Source: Company reports, CAR research

Effect on Suppliers
• Detroit 3 will not “get into” the component business again – but some parts of production will be insourced.
– Higher entry level will slow down some insourcing
– Parts and components that require intensive R&D or large CAPEX will not come back
• Non-manufacturing will continue to be contracted out.
• UAW will want U.S. last stage supply to be from union supplier facilities.

What to Look For in 2015 Negotiations
• Keep entry level cap to provide bridge to tier 1
• Raise entry level pay, and reduce the gap again
• Need something for retirees, especially if VEBA begins to run out of money
• Will have pressure from rank and file for a pay increase and restored COLA
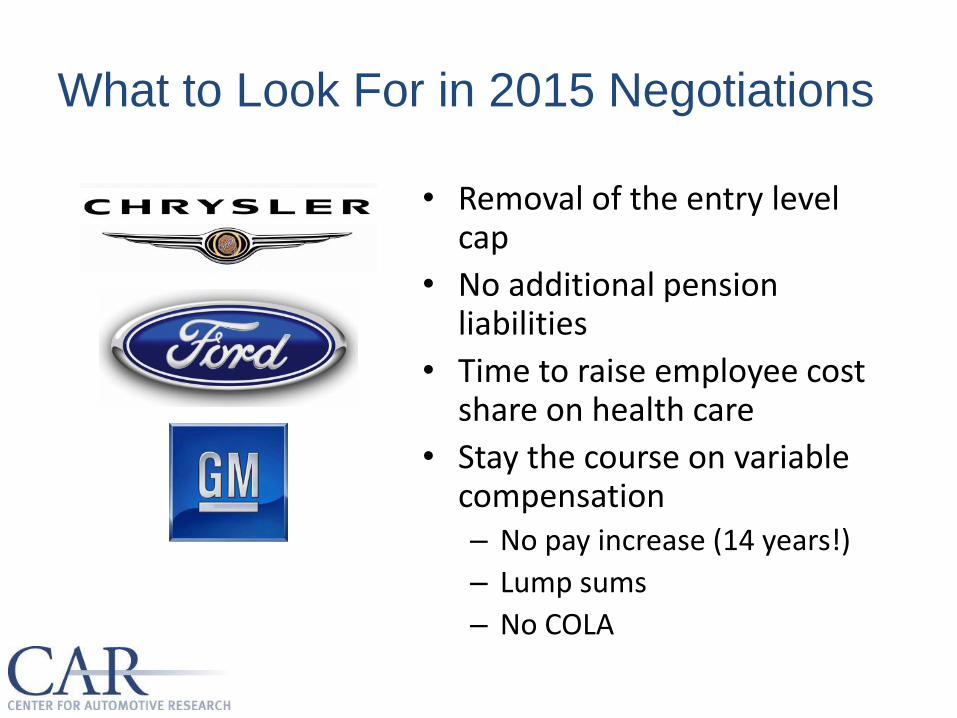
What to Look For in 2015 Negotiations
• Removal of the entry level cap
• No additional pension liabilities
• Time to raise employee cost share on health care
• Stay the course on variable compensation – No pay increase (14 years!)
– Lump sums
– No COLA
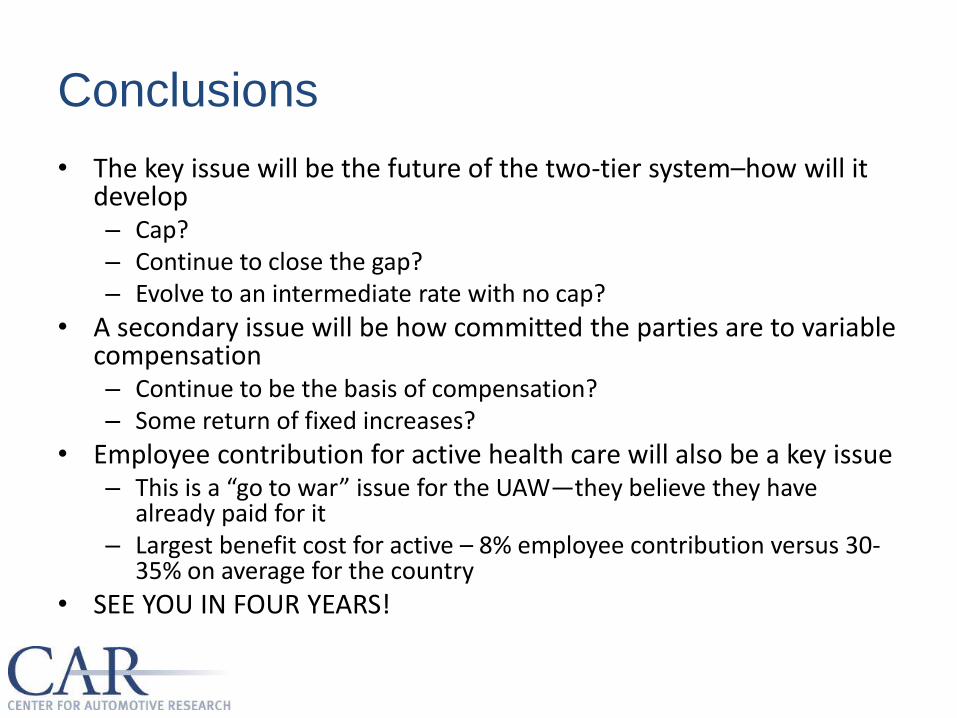
Conclusions
• The key issue will be the future of the two-tier system–how will it develop – Cap? – Continue to close the gap? – Evolve to an intermediate rate with no cap?
• A secondary issue will be how committed the parties are to variable compensation – Continue to be the basis of compensation? – Some return of fixed increases?
• Employee contribution for active health care will also be a key issue – This is a “go to war” issue for the UAW—they believe they have
already paid for it – Largest benefit cost for active – 8% employee contribution versus 30-
35% on average for the country
• SEE YOU IN FOUR YEARS!

BREAK
Well, Who Won?
2011 Detroit 3–UAW
Labor Contract Negotiations
CAR Breakfast Briefing Schoolcraft Community College
Livonia, Michigan 29 November 2011
Sean McAlinden, Ph.D. Executive Vice President Research, and
Chief Economist
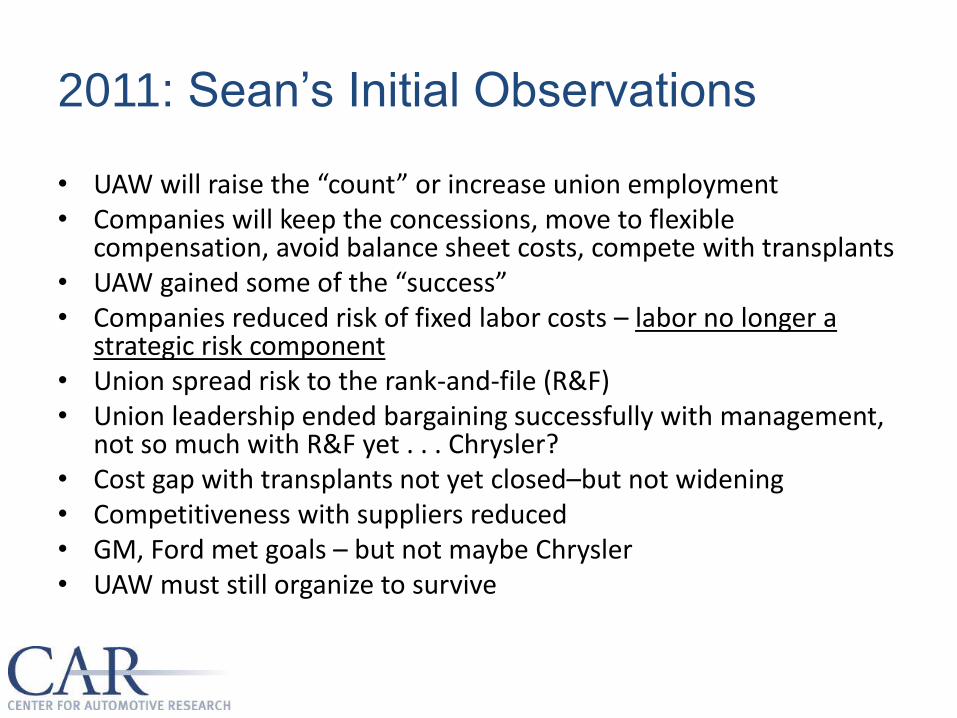
2011: Sean’s Initial Observations
• UAW will raise the “count” or increase union employment • Companies will keep the concessions, move to flexible
compensation, avoid balance sheet costs, compete with transplants • UAW gained some of the “success” • Companies reduced risk of fixed labor costs – labor no longer a
strategic risk component • Union spread risk to the rank-and-file (R&F) • Union leadership ended bargaining successfully with management,
not so much with R&F yet . . . Chrysler? • Cost gap with transplants not yet closed–but not widening • Competitiveness with suppliers reduced • GM, Ford met goals – but not maybe Chrysler • UAW must still organize to survive
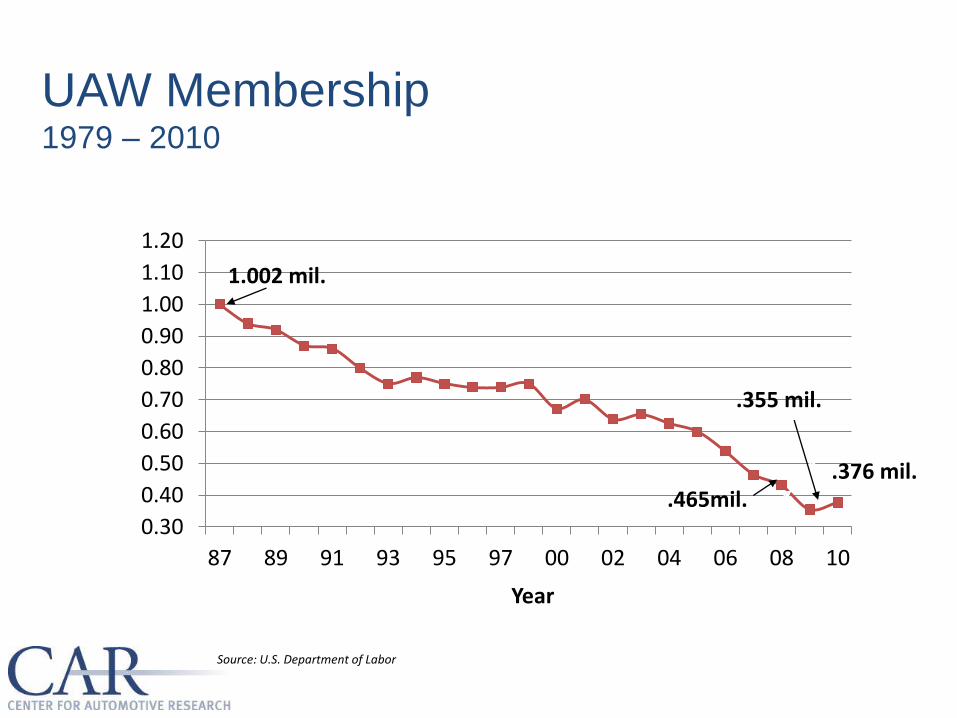
UAW Membership 1979 – 2010
0.30
0.40
0.50
0.60
0.70
0.80
0.90
1.00
1.10
1.20
87 89 91 93 95 97 00 02 04 06 08 10
Year
.465mil.
.355 mil.
1.002 mil.
.376 mil.
Source: U.S. Department of Labor
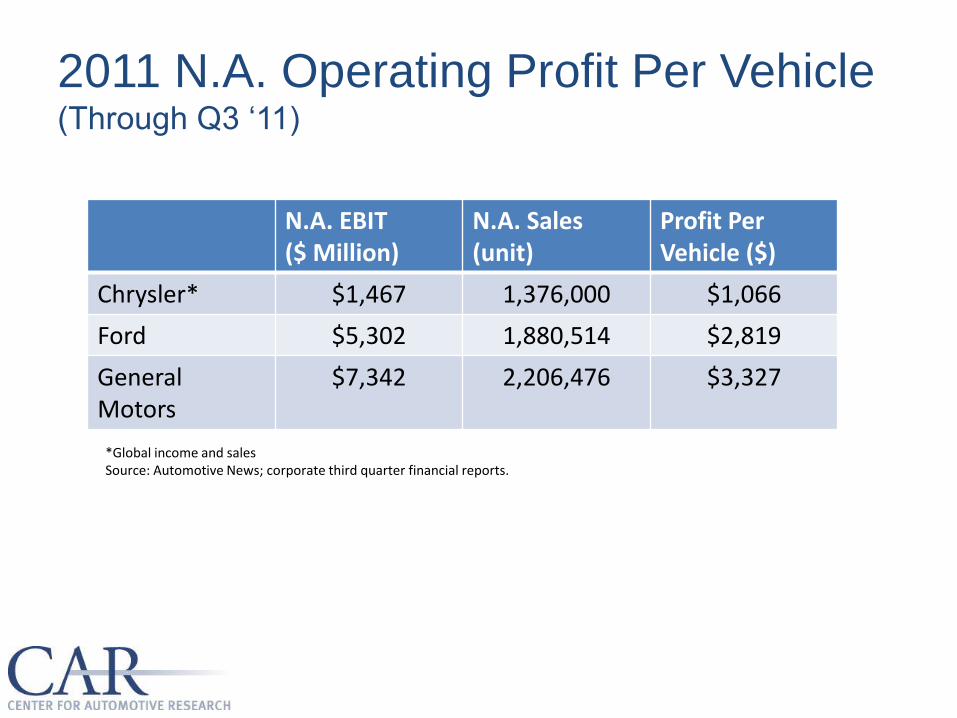
2011 N.A. Operating Profit Per Vehicle (Through Q3 ‘11)
N.A. EBIT ($ Million)
N.A. Sales (unit)
Profit Per Vehicle ($)
Chrysler* $1,467 1,376,000 $1,066
Ford $5,302 1,880,514 $2,819
General Motors
$7,342 2,206,476 $3,327
*Global income and sales Source: Automotive News; corporate third quarter financial reports.
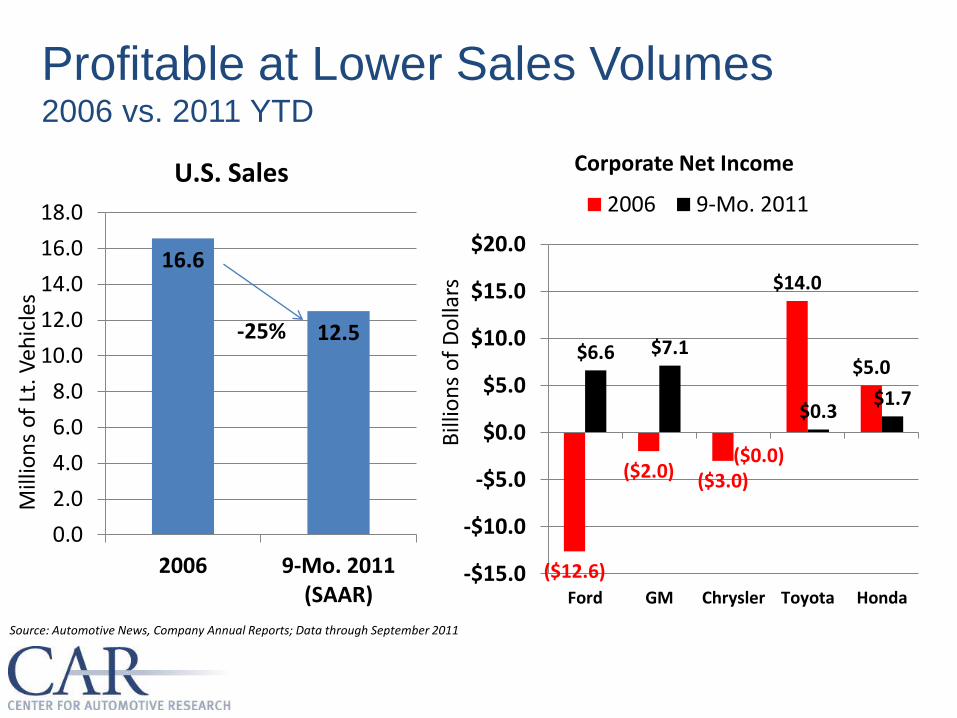
Profitable at Lower Sales Volumes 2006 vs. 2011 YTD
16.6
12.5
0.0
2.0
4.0
6.0
8.0
10.0
12.0
14.0
16.0
18.0
2006 9-Mo. 2011(SAAR)
U.S. Sales
Mill
ion
s o
f Lt
. Veh
icle
s
($12.6)
($2.0) ($3.0)
$14.0
$5.0 $6.6 $7.1
($0.0)
$0.3 $1.7
-$15.0
-$10.0
-$5.0
$0.0
$5.0
$10.0
$15.0
$20.0
Ford GM Chrysler Toyota Honda
2006 9-Mo. 2011
Bill
ion
s o
f D
olla
rs
Source: Automotive News, Company Annual Reports; Data through September 2011
-25%
Corporate Net Income
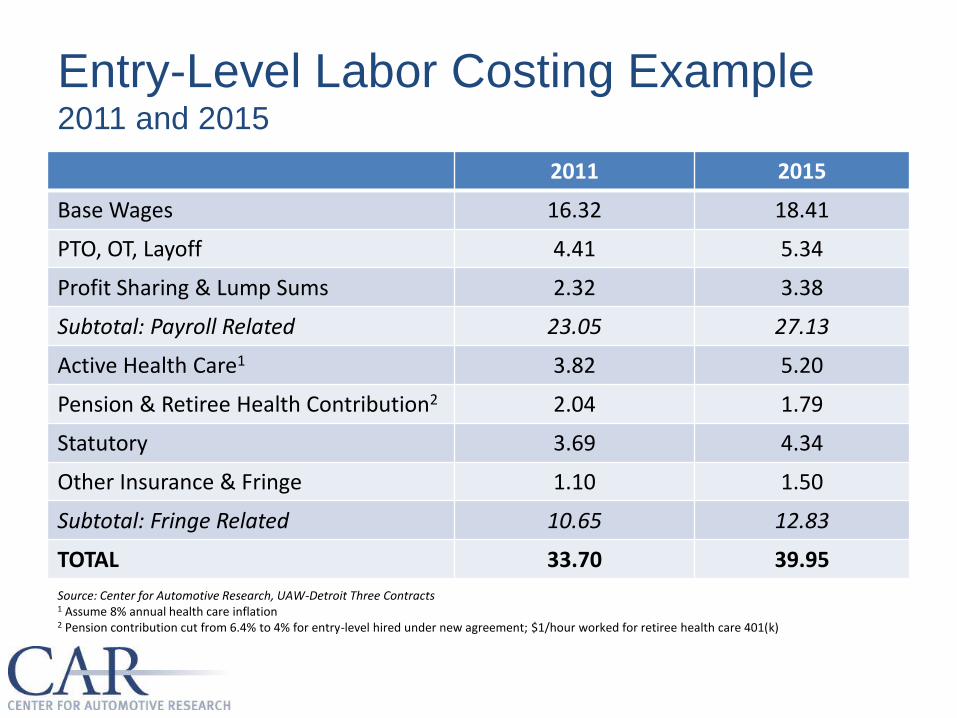
Entry-Level Labor Costing Example 2011 and 2015
2011 2015
Base Wages 16.32 18.41
PTO, OT, Layoff 4.41 5.34
Profit Sharing & Lump Sums 2.32 3.38
Subtotal: Payroll Related 23.05 27.13
Active Health Care1 3.82 5.20
Pension & Retiree Health Contribution2 2.04 1.79
Statutory 3.69 4.34
Other Insurance & Fringe 1.10 1.50
Subtotal: Fringe Related 10.65 12.83
TOTAL 33.70 39.95
Source: Center for Automotive Research, UAW-Detroit Three Contracts 1 Assume 8% annual health care inflation 2 Pension contribution cut from 6.4% to 4% for entry-level hired under new agreement; $1/hour worked for retiree health care 401(k)
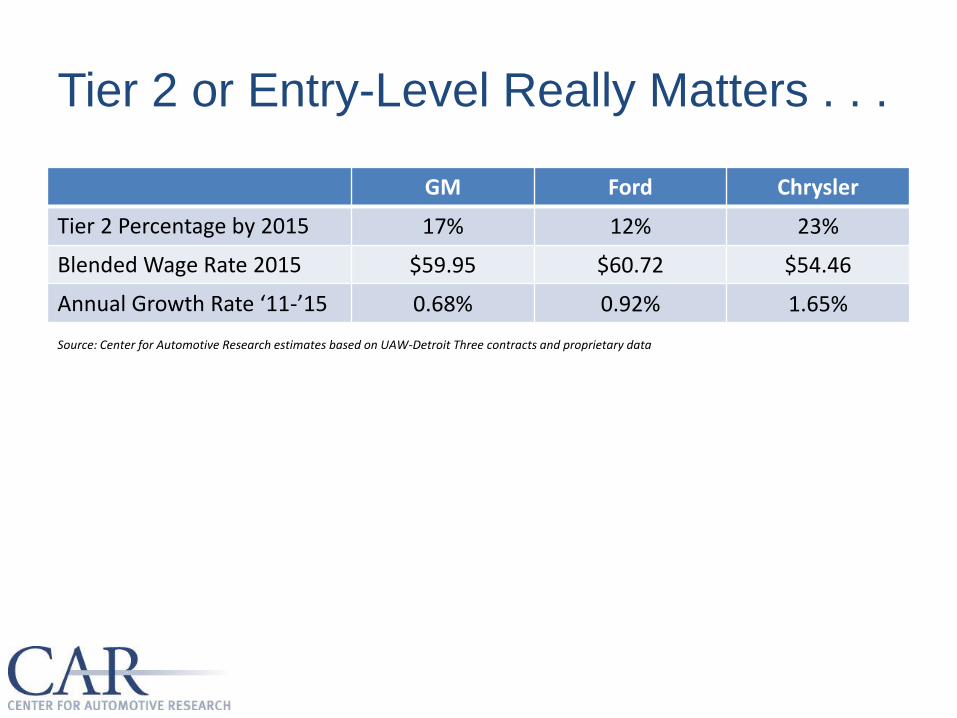
Tier 2 or Entry-Level Really Matters . . .
GM Ford Chrysler
Tier 2 Percentage by 2015 17% 12% 23%
Blended Wage Rate 2015 $59.95 $60.72 $54.46
Annual Growth Rate ‘11-’15 0.68% 0.92% 1.65%
Source: Center for Automotive Research estimates based on UAW-Detroit Three contracts and proprietary data
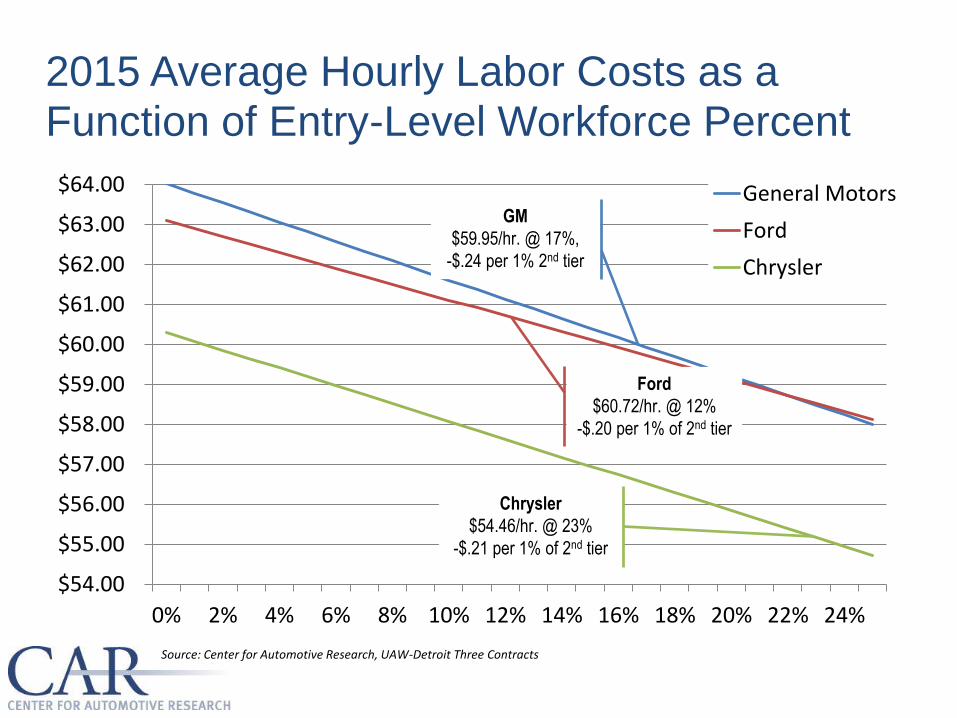
2015 Average Hourly Labor Costs as a Function of Entry-Level Workforce Percent
$54.00
$55.00
$56.00
$57.00
$58.00
$59.00
$60.00
$61.00
$62.00
$63.00
$64.00
0% 2% 4% 6% 8% 10% 12% 14% 16% 18% 20% 22% 24%
General Motors
Ford
Chrysler
GM
$59.95/hr. @ 17%,
-$.24 per 1% 2nd tier
Chrysler
$54.46/hr. @ 23%
-$.21 per 1% of 2nd tier
Ford
$60.72/hr. @ 12%
-$.20 per 1% of 2nd tier
Source: Center for Automotive Research, UAW-Detroit Three Contracts
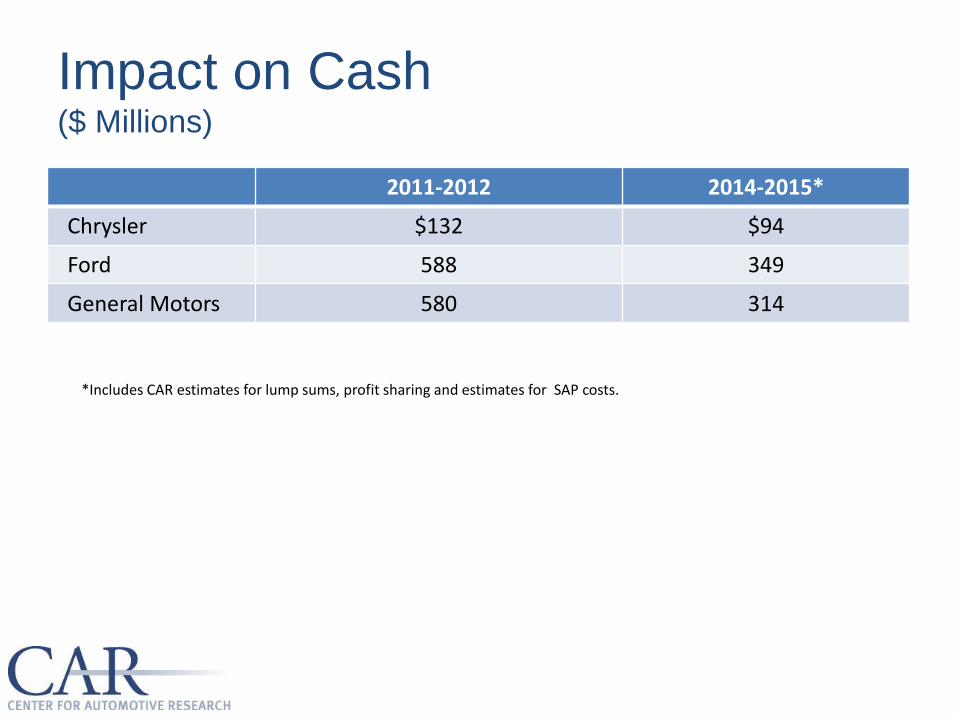
Impact on Cash ($ Millions)
2011-2012 2014-2015*
Chrysler $132 $94
Ford 588 349
General Motors 580 314
*Includes CAR estimates for lump sums, profit sharing and estimates for SAP costs.
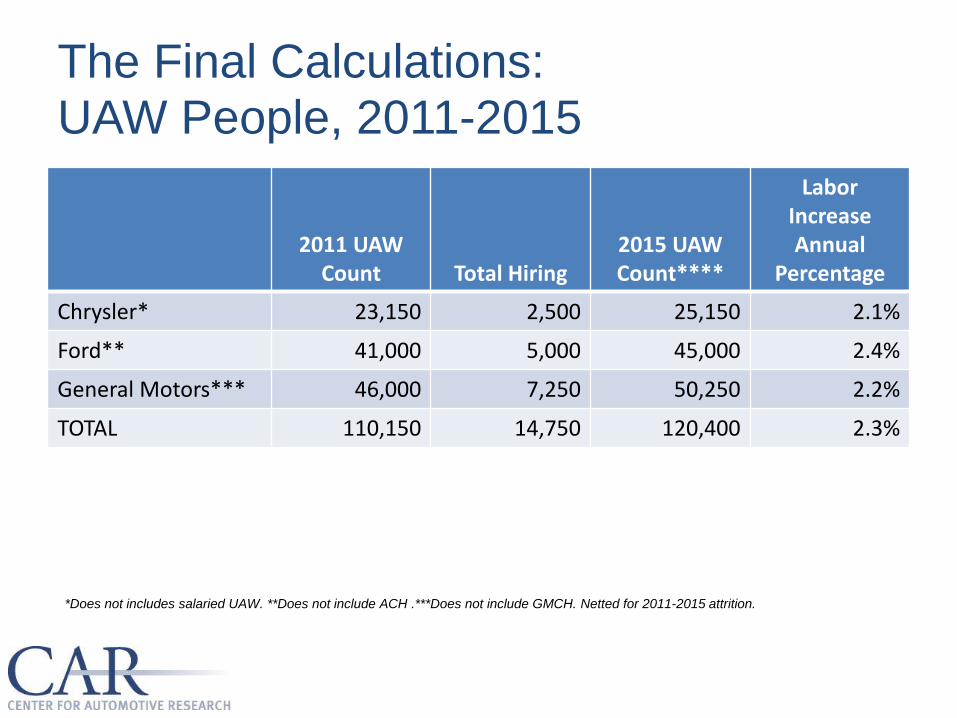
The Final Calculations: UAW People, 2011-2015
2011 UAW Count Total Hiring
2015 UAW Count****
Labor Increase Annual
Percentage
Chrysler* 23,150 2,500 25,150 2.1%
Ford** 41,000 5,000 45,000 2.4%
General Motors*** 46,000 7,250 50,250 2.2%
TOTAL 110,150 14,750 120,400 2.3%
*Does not includes salaried UAW. **Does not include ACH .***Does not include GMCH. Netted for 2011-2015 attrition.
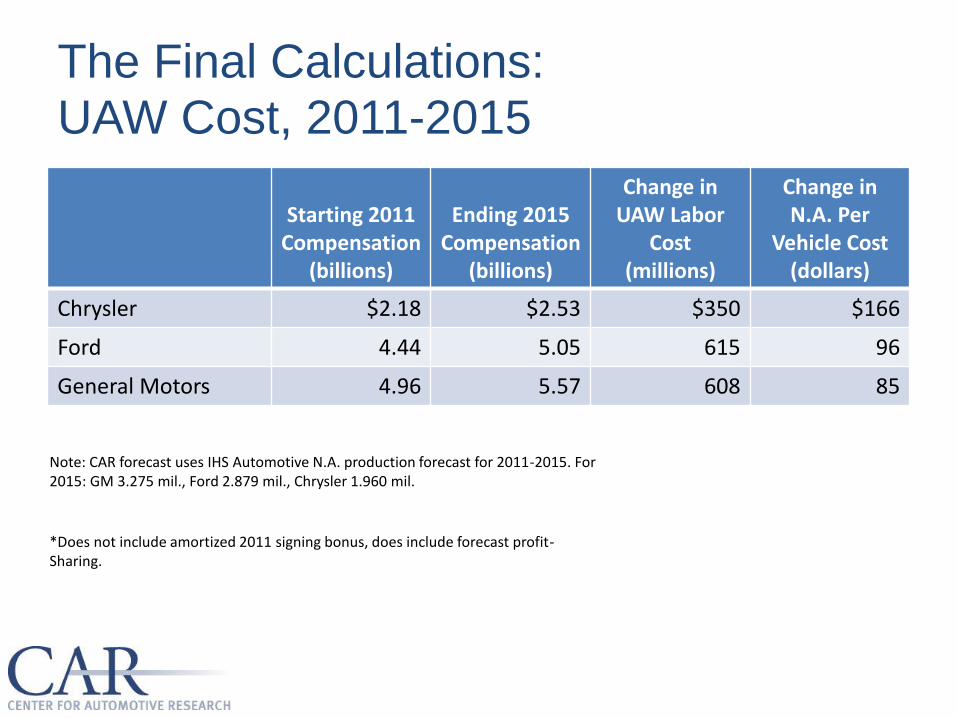
The Final Calculations: UAW Cost, 2011-2015
Starting 2011 Compensation
(billions)
Ending 2015 Compensation
(billions)
Change in UAW Labor
Cost (millions)
Change in N.A. Per
Vehicle Cost (dollars)
Chrysler $2.18 $2.53 $350 $166
Ford 4.44 5.05 615 96
General Motors 4.96 5.57 608 85
Note: CAR forecast uses IHS Automotive N.A. production forecast for 2011-2015. For 2015: GM 3.275 mil., Ford 2.879 mil., Chrysler 1.960 mil.
*Does not include amortized 2011 signing bonus, does include forecast profit- Sharing.
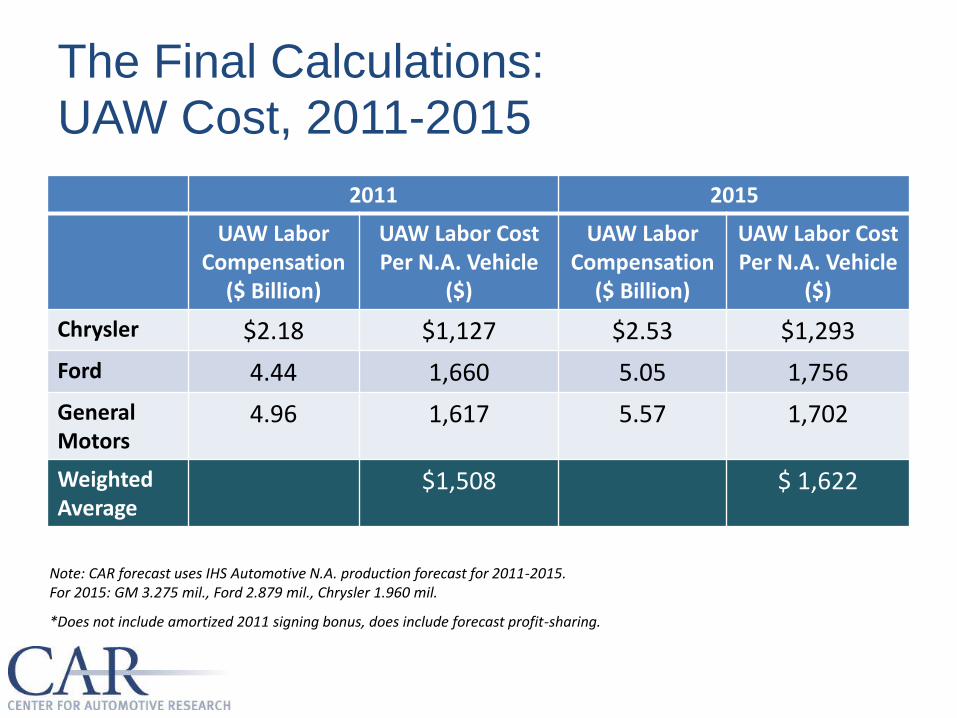
The Final Calculations: UAW Cost, 2011-2015
2011 2015
UAW Labor Compensation
($ Billion)
UAW Labor Cost Per N.A. Vehicle
($)
UAW Labor Compensation
($ Billion)
UAW Labor Cost Per N.A. Vehicle
($)
Chrysler $2.18 $1,127 $2.53 $1,293
Ford 4.44 1,660 5.05 1,756
General Motors
4.96 1,617 5.57 1,702
Weighted Average
$1,508 $ 1,622
Note: CAR forecast uses IHS Automotive N.A. production forecast for 2011-2015. For 2015: GM 3.275 mil., Ford 2.879 mil., Chrysler 1.960 mil.
*Does not include amortized 2011 signing bonus, does include forecast profit-sharing.
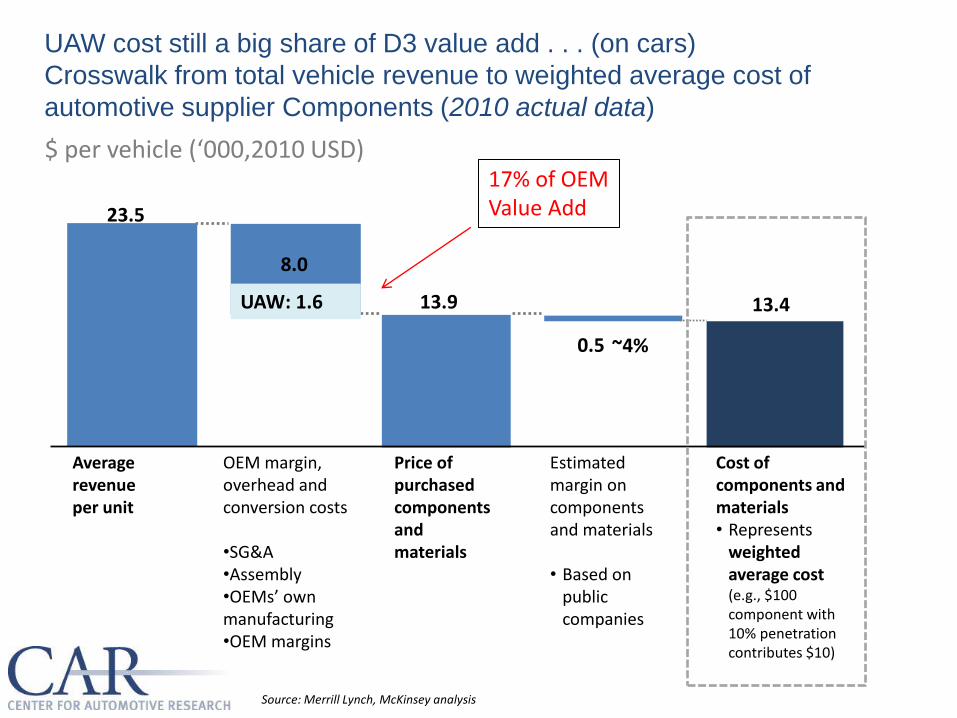
0.5 ~4%
23.5
8.0
13.9 13.4
Cost of components and materials • Represents
weighted average cost (e.g., $100 component with 10% penetration contributes $10)
Estimated margin on components and materials • Based on
public companies
Price of purchased components and materials
OEM margin, overhead and conversion costs •SG&A •Assembly •OEMs’ own manufacturing •OEM margins
Average revenue per unit
$ per vehicle (‘000,2010 USD)
UAW cost still a big share of D3 value add . . . (on cars)
Crosswalk from total vehicle revenue to weighted average cost of
automotive supplier Components (2010 actual data)
Source: Merrill Lynch, McKinsey analysis
UAW: 1.6
17% of OEM Value Add
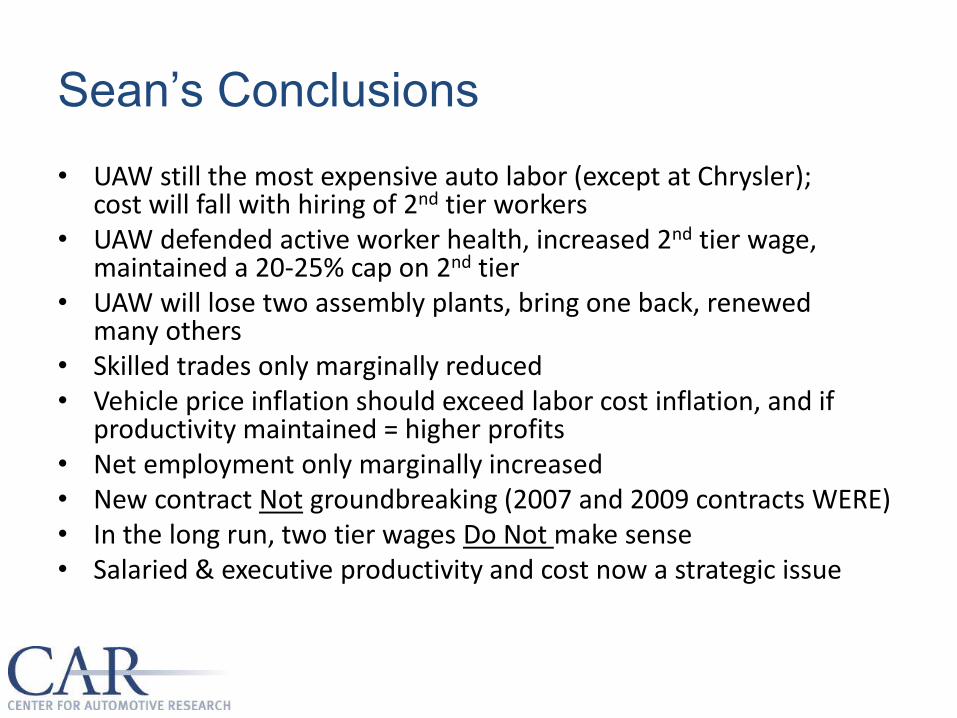
Sean’s Conclusions
• UAW still the most expensive auto labor (except at Chrysler); cost will fall with hiring of 2nd tier workers
• UAW defended active worker health, increased 2nd tier wage, maintained a 20-25% cap on 2nd tier
• UAW will lose two assembly plants, bring one back, renewed many others
• Skilled trades only marginally reduced • Vehicle price inflation should exceed labor cost inflation, and if
productivity maintained = higher profits • Net employment only marginally increased • New contract Not groundbreaking (2007 and 2009 contracts WERE) • In the long run, two tier wages Do Not make sense • Salaried & executive productivity and cost now a strategic issue

Sean’s Other Conclusions
• UAW leadership has committed to the competitiveness of it’s employers–at some considerable political risk . . . This will last.
• Transplants should consider UAW representation as a collective voice efficient necessity, and as a positive political economic alternative . . . All vehicles built here would be “American.”
• Transplants now pay a much higher cost for market cyclicality than the D3. Employee relations cost higher as well.
• A “Grand Bargain” eliminates labor cost as a competitive factor.

PANEL DISCUSSION
Sean McAlinden—Moderator
Kristin Dziczek
Art Schwartz
Please Mark Your Calendar:
CAR Management Briefing Seminars
August 6-9, 2012
Traverse City, Michigan
Additional information is available at CAR’s
website: www.cargroup.org
Thank you for attending!