Embed Size (px)
Citation preview

Northeastern University Consolidated Financial Statements June 30, 2011 and 2010

Northeastern University Index June 30, 2011 and 2010
Page(s)
Report of Independent Auditors ............................................................................................................... 1
Consolidated Financial Statements
Consolidated Statements of Financial Position............................................................................................ 2
Consolidated Statement of Activities ........................................................................................................... 3
Consolidated Statements of Cash Flows ..................................................................................................... 4
Notes to Consolidated Financial Statements ......................................................................................... 5–22

PricT: (
To t
Nor
In o
stat
Nor
then
The
Our
The
201
unq
stat
Tho
whe
exa
stat
and
reas
Oct
cewaterhouseC(617) 530 5000
the Board of T
rtheastern Un
our opinion, th
tements of ac
rtheastern Un
n ended in co
ese consolida
r responsibilit
e prior year su
0 consolidate
qualified opini
tements in ac
ose standards
ether the cons
amining, on a
tements, asse
d evaluating th
sonable basis
tober 18, 201
Coopers LLP, 12, F: (617) 530 5
Trustees of
niversity
he accompany
ctivities and ca
niversity at Ju
onformity with
ated financial s
ty is to expres
ummarized co
ed financial st
on on those c
ccordance wit
s require that
solidated fina
test basis, ev
essing the acc
he overall fina
s for our opin
1
25 High Street,5001, www.pw
Repor
ying consolid
ash flows pre
ne 30, 2011,
h accounting p
statements a
ss an opinion
omparative in
tatements, an
consolidated f
h auditing sta
we plan and
ancial stateme
vidence suppo
counting prin
ancial statem
ion.
, Boston, MA 0wc.com/us
rt of Indepen
ated stateme
esent fairly, in
and the chan
principles gen
re the respon
on these con
nformation has
nd in our repo
financial state
andards gene
perform the a
ents are free o
orting the am
ciples used a
ent presentat
02110
ndent Audito
ent of financia
all material r
nges in its net
nerally accept
nsibility of Nor
nsolidated fina
s been derive
ort dated Octo
ements. We
rally accepted
audit to obtain
of material mi
ounts and dis
and significant
tion. We belie
rs
l position and
espects, the f
t assets and it
ted in the Uni
rtheastern Un
ancial stateme
ed from North
ober 29, 2010
conducted ou
d in the Unite
n reasonable
isstatement.
sclosures in th
t estimates m
eve that our a
d the related c
financial posi
ts cash flows
ted States of
niversity’s man
ents based o
eastern Unive
0, we express
ur audit of the
ed States of A
assurance ab
An audit inclu
he consolidat
made by mana
audit provides
consolidated
tion of
for the year
America.
nagement.
n our audit.
ersity’s
ed an
ese
America.
bout
udes
ted financial
agement,
s a

Northeastern University Consolidated Statements of Financial Position June 30, 2011 and 2010
The accompanying notes are an integral part of these consolidated financial statements.
2
(in thousands of dollars) 2011 2010
AssetsCash and cash equivalents 204,905$ 195,515$ Accounts and other receivables, net 42,318 40,659Prepaids and other assets 20,844 14,950Pledges receivable, net (Note 4) 43,629 46,306Student and other loans receivable, net 35,489 35,208Deposits with trustees (Notes 3 and 5) 1,087 2,810Investments (Notes 3 and 6) 688,132 548,315Property, plant and equipment, net (Note 7) 984,615 960,120
Total assets 2,021,019$ 1,843,883$
Liabilities and Net AssetsLiabilities
Accounts payable and accrued liabilities 117,815$ 117,229$ Accounts payable on construction projects 11,762 6,198Deferred revenue and student deposits 56,875 46,692Refundable advances 33,104 33,981Interest rate swap agreements (Notes 3 and 9) 32,428 41,159Capital lease obligations (Note 8) 32,149 33,036Long-term debt (Notes 3 and 9) 750,456 766,774
Total liabilities 1,034,589 1,045,069
Net assetsEndowment and similar funds (Note 13) 371,208 322,971Net investment in plant 145,144 102,629Other unrestricted 174,504 114,409
Total unrestricted 690,856 540,009
Endowment and similar funds (Note 13) 101,027 82,315Other temporarily restricted 55,304 49,289
Total temporarily restricted 156,331 131,604
Permanently restricted endowment and similar funds (Note 13) 139,243 127,201
Total net assets 986,430 798,814
Total liabilities and net assets 2,021,019$ 1,843,883$

Northeastern University Consolidated Statement of Activities Year Ended June 30, 2011 (with summarized financial information for the year ended June 30, 2010)
The accompanying notes are an integral part of these consolidated financial statements.
3
Temporarily Permanently(in thousands of dollars) Unrestricted Restricted Restricted 2011 2010
OperatingRevenues and other support
Tuition and fees 766,476$ -$ -$ 766,476$ 686,107$ Less: Financial aid (201,669) (201,669) (181,416)
Net student-related revenues 564,807 - - 564,807 504,691
Contributions available for operations 3,235 14,867 18,102 13,869Grants and contracts 69,218 69,218 60,977Indirect cost recovery 18,273 18,273 15,152Auxiliary enterprises 113,817 113,817 108,177Endowment spending available for operations (Note 13) 16,822 6,958 23,780 7,808Other investment income available for operations 1,918 1,918 960Other 32,348 32,348 33,809
Total operating revenues 820,438 21,825 - 842,263 745,443
Net assets released for operations 10,835 (10,835) -
Total operating revenues and other support 831,273 10,990 - 842,263 745,443
ExpensesInstruction 281,586 281,586 253,179Research 80,178 80,178 74,769Academic support 85,617 85,617 73,199Student services 79,976 79,976 79,068Institutional support 93,338 93,338 83,042Other student aid 5,693 5,693 6,007Cooperative education 9,899 9,899 9,577Auxiliary enterprises 101,783 101,783 92,979Other 6,655 6,655 4,994
Total operating expenses (Notes 7 and 9) 744,725 - - 744,725 676,814
Increase in net assets from operating activities 86,548 10,990 - 97,538 68,629
NonoperatingContributions 5,379 18,082 11,424 34,885 29,575Contributions available for operations (3,235) (14,867) (18,102) (13,869)Endowment and other investment return (Note 6) 60,645 32,575 310 93,530 31,846Endowment spending available for operations (Note 13) (16,822) (6,958) (23,780) (7,808)Other investment return available for operations (1,918) (1,918) (960)Change in annuity and life income funds (592) (592) (620)Net realized and change in unrealized gain/(loss) on interest rate swaps (Note 9) 1,225 1,225 (24,702)Loss on extinguishment of debt (Note 9) - - (3,284)Gain on sale of property, net 4,830 4,830 -Net assets released from restrictions 14,195 (14,503) 308 - -
Change in net assets 150,847 24,727 12,042 187,616 78,807
Net assets at beginning of year 540,009 131,604 127,201 798,814 720,007
Net assets at end of year 690,856$ 156,331$ 139,243$ 986,430$ 798,814$

Northeastern University Consolidated Statements of Cash Flows Years Ended June 30, 2011 and 2010
The accompanying notes are an integral part of these consolidated financial statements.
4
(in thousands of dollars) 2011 2010
Cash flows from operating activitiesCash received from student-related revenues 682,157$ 600,643$ Cash received from sponsored programs 83,365 69,500Cash received from donors 13,206 10,850Cash received from endowment and other investment income 8,649 1,542Cash received from auxiliary enterprises other than student housing 10,674 10,887Cash received from other income 30,790 31,262Cash paid to employees and vendors (658,856) (604,668)Interest and other debt payments (42,992) (29,709)
Cash flow before interest rate swaps termination payment and premium on bonds 126,993 90,307
Net cash paid to terminate swaps - (5,023)Cash received from premium on bonds - 15,285
Net cash provided by operating activities 126,993 100,569
Cash flows from investing activitiesAcquisition of property, plant and equipment (65,345) (59,755)Decrease in deposits with trustees 1,723 34,208Proceeds from sale or maturities of investments 178,186 307,684Purchases of investments (225,916) (249,419)Student loans and other loans issued (6,643) (6,598)Proceeds from student and other loans 6,178 5,286Proceeds from sale of property 6,365 -
Net cash (used in) provided by investing activities (105,452) 31,406
Cash flows from financing activities(Decrease) increase in refundable advances (877) 2,396Interest and dividends restricted for long-term investments 310 2,726Outstanding checks (13,203) 13,203Payment to annuitants and life income funds (747) (714)Contributions for long-term investments 16,842 3,466Payments on capital lease obligations (869) (731)Net proceeds from issuance of long term debt - 327,395Debt refinancing - (295,090)Payments on long-term debt (13,607) (11,511)Bond issuance costs on new financing - (2,271)Net cash paid to terminate swaps - (39,974)Cash settlement paid on remarketed swaps - (8,899)
Net cash used in financing activities (12,151) (10,004)
Increase in cash and cash equivalents 9,390 121,971
Cash and cash equivalents at beginning of year 195,515 73,544
Cash and cash equivalents at end of year 204,905$ 195,515$

Northeastern University Notes to Consolidated Financial Statements June 30, 2011 and 2010
5
1. Background
Founded in 1898, Northeastern University (“the University”) is one of the largest private urban universities in the United States. It is a world leader in experiential education, an academic approach that integrates study and practice to provide a more powerful learning experience. The University is also a leader in the production of use-inspired research that meets societal needs. Northeastern grants associate, bachelor, master and doctoral degrees. The University attracts students from all 50 states within the United States and more than 125 countries.
2. Summary of Significant Accounting Policies
The significant accounting policies followed by the University are set forth below.
A. Basis of Presentation The accompanying consolidated financial statements have been prepared on the accrual basis and in accordance with the reporting standards for not-for-profit organizations and include the University and its subsidiaries, principally real estate holding entities.
The consolidated financial statements include certain prior-year summarized comparative information in total but not by net asset classification. Such information does not include sufficient detail to constitute a presentation in conformity with generally accepted accounting principles. Accordingly, such information should be read in conjunction with the University’s consolidated financial statements for the year ended June 30, 2010, from which the summarized information was derived.
Generally Accepted Accounting Principles (GAAP) require classification of net assets and revenues, expenses, gains and losses into three categories, based on the existence or absence of donor or legal restrictions. The categories, unrestricted, temporarily restricted, and permanently restricted net assets, are defined as follows:
Unrestricted - Net assets not subject to donor-imposed stipulations. Unrestricted net assets may be designated for specific purposes by management or the Board of Trustees.
Temporarily Restricted - Net assets whose use is limited by law or donor-imposed stipulations that will either expire with the passage of time or be fulfilled or removed by actions of the University.
Permanently Restricted - Reflects the original amount of gifts and in some cases the income there from which are required by the donor to be invested in perpetuity to produce income for general or specific purposes.
Revenues are reported as increases in unrestricted net assets unless use of the related assets is limited by donor-imposed restrictions. Expenses are reported as decreases in unrestricted net assets. Net realized and change in unrealized gains and losses on investments and other assets or liabilities are reported as increases or decreases in unrestricted net assets unless their use is restricted by explicit donor stipulation or by law.

Northeastern University Notes to Consolidated Financial Statements June 30, 2011 and 2010
6
Unconditional promises to give (pledges) are recognized as temporarily or permanently restricted revenues in the period received. Pledges are recorded at the present value of expected future cash flows. Conditional promises to give are not recognized until the conditions on which they depend are substantially met. Gifts of noncash assets are recorded at their fair market value at the date of contribution.
The University has received an irrevocable charitable remainder trust, for which the University does not serve as trustee. For this trust, the University recorded its beneficial interest in those assets as contributions revenue and pledges receivable at the present value of the expected future cash inflows. Trusts are recorded at the date the University has been notified of the trust’s existence and sufficient information regarding the trust has been accumulated to form the basis for an accrual. Changes in the value of these assets are recorded as a nonoperating change in the valuation of pledges receivable of either temporarily or permanently restricted net assets.
Expirations of temporary restrictions on net assets are reported as reclassifications between the applicable classes of net assets in the statement of activities. Gifts with donor-imposed restrictions, which are reported as temporarily restricted revenues, are released to unrestricted net assets when appropriated for an expenditure that satisfies the donor-imposed restriction. Gifts restricted for the purchase of land, buildings, and equipment are reported as temporarily restricted nonoperating revenues and are released to unrestricted net assets when the assets are placed into service.
Net tuition and fees reflect student financial aid funded by the University’s operating budget, restricted endowment funds, and federal and state student assistance programs. Compensation of students for services provided and tuition benefits for employees are presented as expenses.
Revenues associated with research and other contracts and grants are recognized when related costs are incurred. Indirect cost recovery by the University on U.S. Government contracts and grants is based upon a negotiated rate and are recorded as unrestricted revenue.
Federally funded operating grants and contracts for the year ended June 30, 2011 and 2010 were $67,454,000 and $59,646,000, respectively, including indirect costs of $14,149,000 and $11,466,000.
Auxiliary enterprises include the operation of student housing and dining services, conference centers, the daycare center and the Renaissance Park office building.
Nonoperating revenues include all contributions, endowment and other investment return, change in annuity and life income funds, realized and changes in unrealized gains and losses on interest rate swap agreements, loss on extinguishment of debt, net gain on sale of property and net assets released from restrictions during the period used for current operations. Nonoperating revenues also include the portion of the endowment return in connection with the University’s spending policy and other investment return. Contributions available for operations are presented as reductions of nonoperating activities. All other activity is classified as operating.
Expenses incurred in carrying out the fund-raising activities of the University, amounted to $13,137,000 and $11,903,000 for the years ended June 30, 2011 and 2010, respectively.

Northeastern University Notes to Consolidated Financial Statements June 30, 2011 and 2010
7
Certain 2010 amounts have been reclassified to conform to the current year presentation.
B. Cash and Cash Equivalents Cash and cash equivalents consist primarily of cash management accounts and money market funds with maturities when purchased of three months or less.
C. Accounts and Loans Receivable Accounts receivable are stated net of allowance for doubtful accounts of $9,009,000 at June 30, 2011, and $6,759,000 at June 30, 2010. Loans receivable are stated net of allowance for doubtful accounts of $687,000 at June 30, 2011 and 2010. Loans receivable are principally amounts due from students under Federally Sponsored Loan Programs, which are subject to significant restrictions; accordingly, it is not practical to determine the fair value of such amounts.
The University records an allowance for doubtful accounts for student and other loans receivables including those under the Federal Perkins Loan Program. Management regularly assesses the adequacy of the allowance for credit losses by performing evaluations on the student loan portfolio, current economic environment, and level of delinquent loans. The allowance is adjusted based on the results of these evaluations. Loans disbursed under the Federal Perkins Loan Program are able to be assigned to the Federal government in certain nonrepayment situations. Management believes that this allowance at June 30, 2011 is adequate to absorb credit losses inherent in the portfolio as of that date.
D. Investments Investments include cash and cash equivalents which are designated for long term investment by the University. They also include fixed income and equity portfolios with broadly defined investment strategies. Managers of these portfolios may utilize hedging strategies, invest in securities denominated in foreign currencies, or invest in options, futures, forward contracts, or other financial instruments whose value and performance are derived, at least in part, from the performance of an underlying asset or index and the creditworthiness of the counterparty to the transactions. The University also invests in a number of limited partnerships which sell securities short and which use leverage.
All investments are carried at estimated fair value as indicated in Note 3.
Gains and losses upon sale of certain investments are calculated using average cost at trade date.
E. Property, Plant and Equipment Property, plant and equipment are stated at cost on the date of acquisition, net of accumulated depreciation. Plant assets donated to the University are stated at fair market value on the date of the gift, net of subsequent accumulated depreciation.
Depreciation is calculated using the straight-line method, with a half-year convention over the following estimated useful lives:
Building and improvements 50 yearsFurniture and equipment 5-20 yearsSoftware 4-7 years

Northeastern University Notes to Consolidated Financial Statements June 30, 2011 and 2010
8
Expenditures for maintenance and repairs are charged to operations as incurred; significant renewals and betterments are capitalized.
F. Conditional Asset Retirement Obligations The University recognizes the fair value of a liability for legal obligations associated with asset retirements in the period in which the obligation is incurred. When the liability is initially recorded, the cost of the asset retirement obligation is capitalized by increasing the carrying amount of the related long-lived asset. The liability is accreted to its present value each period, and the capitalized cost associated with the retirement obligation is depreciated over the useful life of the related asset. Upon settlement of the obligation, any difference between the cost to settle the asset retirement obligation and the liability recorded is recognized as a gain or loss in the consolidated statement of activities.
The University recognized $1,012,000 and $976,000 of operating expenses related to the accretion of liabilities recorded for the years ended June 30, 2011 and 2010, respectively. Conditional asset retirement obligations of $19,388,000 and $19,127,000 at June 30, 2011 and 2010, respectively, are included in accounts payable and accrued liabilities on the consolidated statement of financial position.
G. Net Investment in Plant Net investment in plant includes the net book value of all capital assets offset by outstanding liabilities associated with those capital assets. Capital assets include prepaid assets, unamortized debt issuance costs and discounts, and property, plant and equipment (net of accumulated depreciation). Outstanding liabilities include the conditional asset retirement obligation, accounts payable associated with construction projects, premiums on long-term debt, capital lease obligations and outstanding long-term debt, including amounts of the associated interest rate swap agreements.
H. Endowment The endowment includes both donor-restricted funds and funds designated by the Board of Trustees (the Board) to function as endowments. The net assets associated with endowment funds including funds designated by the Board to function as endowments, are classified and reported based on existence or absence of donor imposed restrictions.
The University has adopted endowment investment and spending policies that attempt to provide a predictable stream of funding to programs supported by its endowment while seeking to maintain the purchasing power of endowment assets. To achieve its long-term rate of return objectives, the University relies on a total return strategy in which investment returns are achieved through both capital appreciation (realized and unrealized gains) and current yield (interest and dividends). The University expects its endowment funds, over time, to provide an average real rate of return of approximately 5.0% annually.
The University’s endowment spending policy uses the lesser of a percentage of December 2009’s market value or a five year moving average of the endowment fund’s market value, which is distributed to the appropriate funds and treated as revenue in the statement of activities. These distributions consist of dividends, interest and, if necessary, a portion of accumulated investment gains. The amount distributed each year is subject to the Board’s approval. During fiscal year 2011, the full payout amount was resumed and distributed based on a percentage of the December 2009 market value. For fiscal year 2010, in order to preserve the endowment, the Board suspended the full payout amount distributed from unrestricted sources.

Northeastern University Notes to Consolidated Financial Statements June 30, 2011 and 2010
9
From time to time, the fair value of assets associated with individual donor-restricted endowment funds may fall below the value of the initial and subsequent donor gift amounts (deficit). When donor endowment fund deficits exist, they are classified as a reduction of unrestricted net assets. These deficits resulted from unfavorable market fluctuations that occurred shortly after the investment of recently established endowments.
I. Tax Status The University is a tax-exempt organization as described in section 501(c) (3) of the Internal Revenue Code.
J. Use of Estimates The preparation of consolidated financial statements in accordance with generally accepted accounting principles requires management to make estimates and assumptions that affect reported amounts and disclosures. Actual results could differ from those estimates.
3. Fair Value Measurements
The University values its financial assets and liabilities at fair value in accordance with GAAP. GAAP defines fair value, establishes a framework for measuring fair value, and delineates the disclosures required about fair value measurements. Assets consist primarily of the endowment and other investments. Additionally, GAAP allows the University the use of estimates to fair value alternative investments at the measurement date using net asset values (NAV) reported by the investment managers without further adjustment, provided that the University does not expect to sell the alternative investments at a value other than the NAV. The University performs due diligence procedures on its alternative investments to determine the values are appropriate.
GAAP clarifies that fair value is an exit price, representing the amount that would be received to sell an asset or paid to transfer a liability in an orderly transaction between market participants. As such, fair value is a market-based measurement that should be determined based on assumptions that market participants would use in pricing an asset or liability. As a basis for considering assumptions, this standard establishes a three-tier fair value hierarchy, which prioritizes the inputs used in measuring fair value as follows:
Level 1 – Observable inputs such as quoted prices in active markets;
Level 2 – Inputs, other than the quoted prices in active markets, that are observable either directly or indirectly; and
Level 3 – Unobservable inputs for which there is little or no market data, which require the reporting entity to develop its own assumptions.

Northeastern University Notes to Consolidated Financial Statements June 30, 2011 and 2010
10
The following tables present information about assets and liabilities that are measured at fair value on a recurring basis as of June 30, 2011, and indicate the fair value hierarchy utilized to determine such fair value:
QuotedPrices
in ActiveMarkets Significant
for Other Significant Fair Value Fair ValueIdentical Observable Unobservable as of as ofAssets Inputs Inputs June 30, June 30,
(in thousands) Level 1 Level 2 Level 3 2011 2010
Beneficial interest in charitable remainder trust -$ -$ 3,345$ 3,345$ 2,842$
Deposits with trustees 1,087 - - 1,087 2,810
Endowment investmentsCash and cash equivalents 11,718 - - 11,718 38,672Fixed income 53,220 - - 53,220 77,861Domestic equity 75,293 - - 75,293 39,096International equity 107,301 - - 107,301 54,825Private equity - - 124,458 124,458 101,273Hedge funds - 52,000 128,364 180,364 166,360Other alternative investments - 29,629 10,800 40,429 37,587Other investments 8,243 - - 8,243 5,532
Total endowment investments 255,775 81,629 263,622 601,026 521,206
Other investmentsCash & cash equivalents 132 - - 132 -Fixed income 60,941 - - 60,941 -Domestic equity 410 - - 410 -Auction rate securities and other - - 25,623 25,623 27,109
Total other investments 61,483 - 25,623 87,106 27,109
Total investments 317,258 81,629 289,245 688,132 548,315
Total assets 318,345$ 81,629$ 292,590$ 692,564$ 553,967$
Interest rate swap agreements – liability -$ (32,428)$ -$ (32,428)$ (41,159)$
Total liabilities -$ (32,428)$ -$ (32,428)$ (41,159)$
All financial instruments are valued using a market approach involving identical or comparable assets or liabilities except for auction rate securities which are valued using an income approach.

Northeastern University Notes to Consolidated Financial Statements June 30, 2011 and 2010
11
The change in the fair value of financial instruments valued using significant unobservable inputs (Level 3) is shown below:
BeneficialInterest in
Other Auction Rate CharitablePrivate Hedge Alternative Securities Remainder
(in thousands) Equity Funds Investments and Other Trust Total
Fair value recorded at July 1, 2010 101,273$ 108,415$ 26,491$ 27,109$ 2,842$ 266,130$
Reclassification to Level 2 - (2,500) (16,629) - - (19,129)Purchases 24,566 10,000 - - - 34,566Sales (24,343) (4,635) - (1,775) - (30,753)Net realized/change in unrealized gains 24,278 17,084 938 289 501 43,090Adjustment to record reduction in estimated fair value (1,316) - - - 2 (1,314)
Fair value recorded at June 30, 2011 124,458$ 128,364$ 10,800$ 25,623$ 3,345$ 292,590$
The fair values of marketable domestic and international equities and fixed income instruments are determined generally based on quoted market prices in active markets. Alternative investments include private equity, hedge funds and other alternative investments. Private equity investments may consist of commitments in a limited partnership that invests in private companies or properties. Hedge funds may include investments that are publicly traded and may be subject to redemption restrictions.
The University’s investments classified as Level 2 and 3 primarily consist of alternative investments. Limited partnerships’ interest with quarterly redemption provisions are classified as Level 2, others with redemption provisions exceeding three months are classified as Level 3. In fiscal year 2011, $19,129,000 was reclassified out of Level 3 to Level 2 in accordance with that policy.
The University holds auction rate securities that are rated AAA by a major credit rating agency and are guaranteed by the Federal Family Education Loan Program, and believes current market conditions present liquidity issues rather than credit issues; therefore, the University has a reserve related to these securities. During fiscal year 2011, the University liquidated $1,775,000 of the securities and released $289,000 of the reserve. The reserve is $7,373,000 at June 30, 2011. The estimated fair value of the auction rate securities was determined by management based upon a discounted cash flow methodology.
Deposits with trustees are carried at fair market value.
At June 30, 2011, the approximate fair value of outstanding long-term debt on the statement of financial position is $771,091,000 based on estimates using current interest rates available for long-term debt with similar remaining maturities.
The estimated fair value of the interest rate swap agreement is based on an independent third party valuation. The fair value of swap instruments represents the estimated cost to the University to cancel the agreements at the reporting date. The University has performed due diligence on fair value of its interest rate swap agreement to determine fair value at June 30, 2011 and 2010.

Northeastern University Notes to Consolidated Financial Statements June 30, 2011 and 2010
12
At June 30, 2011, redemption terms for Level 1, Level 2 and Level 3 consist of the following:
30-60 Days 30-90 Days 30-180 DaysWithin 30 Prior Written Prior Written Prior Written
Redemption Terms Days Notice Notice Notice 1-5 Years 6-10 Years Total(in thousands)
Cash equivalents 11,850$ -$ -$ -$ -$ -$ 11,850$ Fixed income 114,161 - - - - - 114,161Equity-domestic 75,703 - - - - - 75,703Equity-international 107,301 - - - - - 107,301Private equity - - - - - 124,458 124,458Hedge funds - - 51,600 42,900 85,864 - 180,364Other alternative investments 13,001 - 16,629 - 10,777 22 40,429Other investments 8,243 - - - - 25,623 33,866
330,259$ -$ 68,229$ 42,900$ 96,641$ 150,103$ 688,132$
4. Pledges Pledges receivable as of June 30 are expected to be realized in the following time periods:
(in thousands) 2011 2010
One year or less 15,170$ 20,586$ Between one and five years 27,981 24,736Greater than five years 7,417 8,078
50,568 53,400
Less: Discount (4,439) (4,694)Allowance for doubtful pledges (2,500) (2,400)
43,629$ 46,306$
At June 30, 2011, the University has $16,200,000 of conditional pledges that are not reflected in the consolidated financial statements due to their conditional nature.
5. Deposits with Trustees
Funds established in accordance with the various resolutions and loan agreements pertain to the Mass Development Bonds and other long-term debt. These funds are used for construction, debt service reserve, and repair and replacement reserve.
Northeastern University Notes to Consolidated Financial Statements June 30, 2011 and 2010
13
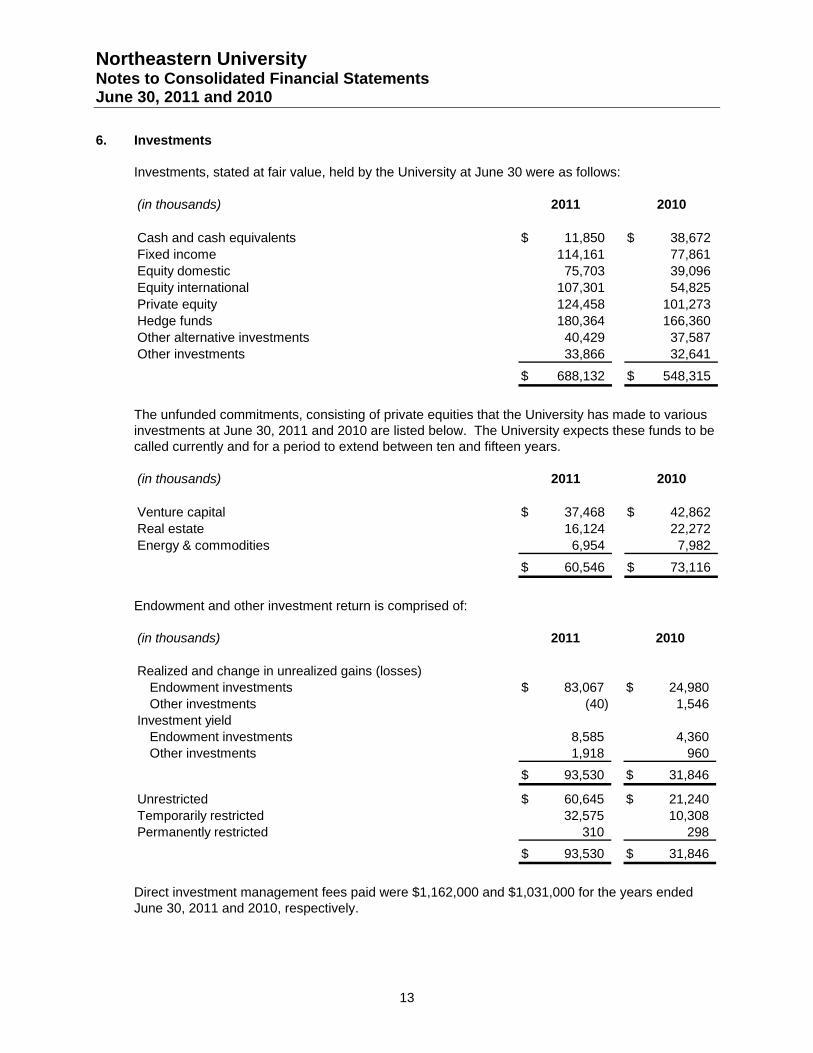
6. Investments
Investments, stated at fair value, held by the University at June 30 were as follows:
(in thousands) 2011 2010
Cash and cash equivalents 11,850$ 38,672$ Fixed income 114,161 77,861Equity domestic 75,703 39,096Equity international 107,301 54,825Private equity 124,458 101,273Hedge funds 180,364 166,360Other alternative investments 40,429 37,587Other investments 33,866 32,641
688,132$ 548,315$
The unfunded commitments, consisting of private equities that the University has made to various investments at June 30, 2011 and 2010 are listed below. The University expects these funds to be called currently and for a period to extend between ten and fifteen years.
(in thousands) 2011 2010
Venture capital 37,468$ 42,862$ Real estate 16,124 22,272Energy & commodities 6,954 7,982
60,546$ 73,116$
Endowment and other investment return is comprised of:
(in thousands) 2011 2010
Realized and change in unrealized gains (losses)Endowment investments 83,067$ 24,980$ Other investments (40) 1,546
Investment yieldEndowment investments 8,585 4,360Other investments 1,918 960
93,530$ 31,846$
Unrestricted 60,645$ 21,240$ Temporarily restricted 32,575 10,308Permanently restricted 310 298
93,530$ 31,846$
Direct investment management fees paid were $1,162,000 and $1,031,000 for the years ended June 30, 2011 and 2010, respectively.

Northeastern University Notes to Consolidated Financial Statements June 30, 2011 and 2010
14
7. Property, Plant and Equipment
Property, plant and equipment at June 30 consisted of the following:
(in thousands) 2011 2010
Land 24,856$ 25,346$ Building and improvements 1,100,257 1,073,206Capitalized lease 38,410 38,428Furniture and equipment 293,626 284,331Library books 41,087 38,890Construction in progress 21,390 353
1,519,626 1,460,554
Less: Accumulated depreciation (535,011) (500,434)
984,615$ 960,120$
Depreciation expense amounted to $45,298,000 and $43,623,000 for the years ended June 30, 2011 and 2010, respectively, and is allocated in the consolidated statement of activities to functional expenses based on specific use of the related facilities. Operation, maintenance, and security of plant expense totaled $54,619,000 and $53,210,000 for the years ended June 30, 2011 and 2010, respectively, and is allocated to functional expense categories based on salary expense in the consolidated statement of activities.
8. Capitalized Lease
The University entered into capital lease agreements for certain equipment, and for the construction of two student resident halls, which was completed in fiscal year 2002. The University commenced the residence hall lease in July 2001. The rent, over the 30-year term of the lease, will be equal to the actual debt service plus customary fees payable with respect to the $37,928,000 original principal amount of the bonds being issued to finance the building. The annual lease commitments for future years range from $2,913,000 in 2012 to $2,855,000 in 2031.
Approximate future annual principal requirements as of June 30, 2011 are as follows:
Principal(in thousands) Payments
Year2012 922$ 2013 9792014 9382015 9992016 1,0632017-2031 27,248
32,149$

Northeastern University Notes to Consolidated Financial Statements June 30, 2011 and 2010
15
9. Long-Term Debt
Long-term debt consists of the following at June 30:
(in thousands)Rate Maturity 2011 2010
Massachusetts Health and EducationalFacilities Authority Revenue Bonds (HEFA)Series G 5.50% 2013 4,830$ 6,275$ Series R 4.00%-5.00% 2033 85,110 87,080Series S 3.50%-4.00% 2013 57,975 57,975Series T -1 4.13% 2037 70,000 70,000Series T -2 4.10% 2037 70,000 70,000Series T -3 2.70% 2037 70,000 70,000Series Y-1 3.00%-5.00% 2029 36,445 37,560Series Y-2 3.00%-5.50% 2024 16,790 21,250Series 2010A 2.00%-5.00% 2035 247,220 251,635
Taxable Revenue BondsSeries 2010B 3.35%-6.43% 2035 75,460 75,460
United States Department of Education (1)Various Mortgage Notes 3.00% 2018 1,345 1,515Chartwells Division of Compass, Inc. 4.25%-5.00% 2010 - 31
735,175 748,781
Add: Unamortized Premium on Bonds 15,281 17,993
750,456$ 766,774$
Name
(1) Bonds are collateralized by mortgages on the related properties.
Approximate future annual principal requirements are below:
Principal(in thousands) Payments
Year2012 154,460$ 2013 73,1362014 84,9862015 15,7022016 16,378Thereafter 390,513
735,175$
Interest expense totaled $30,870,000 and $22,519,000 for the years ended June 30, 2011 and 2010, respectively, of which $0 and $381,000, respectively, was capitalized in connection with construction in progress. Interest expense has been allocated to each functional expense category based on specific identification on the consolidated statement of activities. Total amounts paid in 2011 and 2010, were $40,832,000 and $36,764,000, respectively, to meet interest costs including settlement costs on the related interest rate swap agreements.

Northeastern University Notes to Consolidated Financial Statements June 30, 2011 and 2010
16
In February 2010, Series T-3 bonds for $70,000,000 were remarketed as one year tender bonds with a maturity date in February 2011. In February 2011, T-3 bonds for $70,000,000 were remarketed as three-year tender bonds with a maturity date in February 2014.
In March 2010, the University issued $251,635,000 in Massachusetts Health and Educational Facilities Authority (MHEFA) Revenue Bonds Series 2010A for the purpose of the refunding of MHEFA Series I, Q, U, and W Bonds as well as funding termination payments in connection with the interest rate swap agreements relating to these series. The Series 2010A Bonds consist of term and serial bonds in the amount of $174,860,000, maturing in October 2030, paying interest ranging from 2% to 4.68%, and term bonds in the amount of $76,775,000, maturing in October 2035, paying interest ranging from 4.875% to 5%. At the same time the University issued $75,460,000 in MHEFA Federally Taxable Revenue Bonds Series 2010B for the purpose of the refunding of MHEFA Federally Taxable Series V and X Bonds as well as funding termination payments in connection with the interest rate swap agreements relating to these series. Bond issuance costs of $2,033,000 incurred on Series 2010A and 2010B are recorded in prepaids and other assets and will be amortized over the life of the respective bonds. The Series 2010A bonds were issued with an original issue premium totaling $15,286,000 which is recorded in long-term debt. The premium will be amortized using the effective interest method over the life of the respective bonds.
Due to the refunding of Series Q, U, V, W and X Bonds, the supporting letter of credit arrangements were terminated. A loss on extinguishment of debt of $3,284,000 representing the write-off of all unamortized bond issuance costs on the Series I, Q, U, W, V and X Bonds has been reflected in the 2010 consolidated statement of activities.
The University has entered into an interest rate swap agreement to manage the interest cost and variable rate risk associated with its outstanding debt. The interest rate swap agreement was not entered into for trading or speculative purposes. Under the terms of the agreement, the University pays a fixed rate, determined at inception, to a third party who in turn pays the University a variable rate on these respective notional principal amounts.
The University records the interest rate swap at fair value as indicated in Note 3. Net payments or receipts under the swap agreement along with the change in fair value of the swap are included in the nonoperating section on the consolidated statement of activities.
In March 2010, the University terminated its interest rate swaps with Barclays, Deutsche Bank, and Wells Fargo for $44,997,000.
The University has adopted guidance related to the Disclosures about Derivative Instruments and Hedging Activity. Under this guidance, the University is required to disclose the location and amounts of derivatives within the consolidated financial statements. The tables below depict the impact the derivative has on both the consolidated statement of financial position and consolidated statement of activities.
June 30, 2011 June 30, 2010(in thousands) Fair Value Fair Value
Interest rate swap agreement (32,428)$ (41,159)$

Northeastern University Notes to Consolidated Financial Statements June 30, 2011 and 2010
17
Net realized and unrealized gain/(loss) on the interest rate swap recorded in the consolidated statement of activities as nonoperating was as follows for the years ended June 30, 2011 and 2010:
(in thousands) 2011 2010
Realized (loss) (7,506)$ (17,052)$ Change in unrealized gain (loss) 8,731 (11,858)Realized gain (loss) on interest rate swap terminations - 4,208
1,225$ (24,702)$
The following schedule presents the notional principal amounts and fair value of the University’s interest rate swap agreement at June 30, 2011:
(in thousands)Date Fair Value
Trade Notional Expiration at June 30,Counterparty Type Amount October 1, 2011
MHEFA Series T AIG Swap 210,000$ 2037 (32,428)$
Bond Issue
There is no collateral posting requirement for the University related to the swap with AIG.
The University maintained a line of credit with a bank in the amount of $50,000,000 for years ended June 30, 2011 and 2010. There were no amounts outstanding on the line of credit at June 30, 2011 and 2010.
10. Retirement Plan
The University sponsors a retirement plan under which full-time faculty and staff may elect to contribute an amount of their eligible compensation up to the Internal Revenue Service published limit toward the purchase of contracts with Teachers Insurance and Annuity Association of America and College Retirement Equities Fund and/or Fidelity Management Trust Company. After two years of employment, the University contributes 10% of the participants’ eligible compensation to each participant’s account providing that the participants contribute a minimum of 5% of their eligible compensation to the plan. The cost of the University’s contribution to this plan was $19,392,000 and $18,234,000 for the years ended June 30, 2011 and 2010, respectively.

Northeastern University Notes to Consolidated Financial Statements June 30, 2011 and 2010
18
11. Post Retirement Medical Plan
For the year ended June 30, 2011 and 2010, net periodic postretirement medical benefits cost includes the following:
2011 2010
Service cost 735,000$ 563,000$ Interest cost 813,000 834,000Amortization of Prior service cost - 700,000
Actuarial loss 585,000 455,000
These expenses are allocated to the functional expense categories on the statement of activities based on salary expense. The accrued postretirement benefit obligation was $14,838,000 and $16,743,000 at June 30, 2011 and 2010, respectively, and is included in accounts payable and accrued liabilities on the consolidated statement of financial position. The plan does not hold assets and is funded as benefits are paid.
For measurement purposes, the assumed annual rate of increase in the per capita cost of covered medical benefits was 10%, 8%, 7%, and 6% for the years ended 2011, 2012, 2013 and 2014, graded down to 5% for fiscal year 2015 and thereafter. A discount rate of 5% was assumed at July 1, 2010, to determine the net periodic benefit cost for fiscal years 2011 and 2010 and the benefit obligation at June 30, 2011 and 2010.
Assumed health care cost trend rates have a significant effect on the amounts reported for the health care plan. A one percentage point change in assumed health care cost trend rates would have the following effect:
2011 2010
Impact of 1% increase in health care cost trendon interest cost plus service during the past year 165,000$ 138,000$ on accumulated postretirement benefit obligation 1,145,000 1,273,000
Impact of 1% decrease in health care cost trendon interest cost plus service during the past year (145,000) (122,000)on accumulated postretirement benefit obligation (1,024,000) (1,150,000)

Northeastern University Notes to Consolidated Financial Statements June 30, 2011 and 2010
19
Expected future benefit payments and cash contributions to the plan are as follows:
FutureBenefit
(in thousands) Payments
Year2012 949$ 2013 1,1532014 1,2422015 1,3412016 1,3462017-2021 6,849
12,880$
12. Self-Insurance
The University is self-insured for certain employee health benefits, workers’ compensation, a portion of property and casualty coverage and a student health plan. The self-insurance reserve balances were $3,829,000 and $4,617,000 at June 30, 2011 and 2010, respectively.
13. Endowment and Similar Net Assets
Endowment and Similar Net Assets composition by type of fund as of June 30, 2011:
Temporarily Permanently(in thousands) Unrestricted Restricted Restricted Total
Donor-restricted endowment funds (1,038)$ (1) 101,027$ 139,243$ 239,232$ Board-designated endowment funds 372,246 - - 372,246
371,208$ 101,027$ 139,243$ 611,478$
Endowment and Similar Net Assets composition by type of fund as of June 30, 2010:
Temporarily Permanently(in thousands) Unrestricted Restricted Restricted Total
Donor-restricted endowment funds (7,057)$ (1) 82,315$ 127,201$ 202,459$ Board-designated endowment funds 330,028 - - 330,028
322,971$ 82,315$ 127,201$ 532,487$
(1) The $1,038,000 and $7,057,000 deficits in unrestricted net assets represent the amounts by which the fair values of certain donor-restricted endowment funds were below the amount required to be retained permanently.

Northeastern University Notes to Consolidated Financial Statements June 30, 2011 and 2010
20
Changes in Endowment and Similar Net Assets for the fiscal year ended June 30, 2011:
Temporarily Permanently(in thousands) Unrestricted Restricted Restricted Total
Endowment and similar net assets at July 1, 2010 322,971$ 82,315$ 127,201$ 532,487$
Investment income 5,459 3,024 102 8,585Net appreciation (realized and change in unrealized) 59,341 23,533 208 83,082
Total endowment return 64,800 26,557 310 91,667
Contributions 59 222 11,424 11,705Endowment spending for operations and reinvestment (16,822) (6,958) - (23,780)Other expenses and transfers 200 (1,109) 308 (601)
Endowment and similar net assets at June 30, 2011 371,208$ 101,027$ 139,243$ 611,478$
Changes in Endowment and Similar Net Assets for the fiscal year ended June 30, 2010:
Temporarily Permanently(in thousands) Unrestricted Restricted Restricted Total
Endowment and similar net assets at July 1, 2009 302,702$ 82,053$ 122,591$ 507,346$
Investment income 2,778 1,556 26 4,360Net appreciation (realized and change in unrealized) 17,202 7,506 272 24,980
Total endowment return 19,980 9,062 298 29,340
Contributions 368 311 4,697 5,376Endowment spending for operations and reinvestment (542) (7,266) - (7,808)Other expenses and transfers 463 (1,845) (385) (1,767)
Endowment and similar net assets at June 30, 2010 322,971$ 82,315$ 127,201$ 532,487$
Endowment and similar net assets classified as unrestricted net assets include unrestricted gifts from donors and other funds designated by the University as quasi-endowment for the long-term support of the University, including any accumulated income and appreciation thereon. Temporarily restricted endowment net assets include accumulated income and appreciation on permanently restricted endowment funds, life income, annuities and trust funds (net of actuarial liability). Permanently restricted endowment and similar net assets consist of those funds designated by donors to be invested in perpetuity to provide a permanent source of income. Endowment and similar net assets are primarily used to fund scholarships and professorships.

Northeastern University Notes to Consolidated Financial Statements June 30, 2011 and 2010
21
14. Lease Commitments and Contingencies
The University is subject to certain legal proceedings and claims which arise in the normal course of operations. In the opinion of management, the ultimate outcome of these actions will not have a material effect on the University’s financial position.
The University leases property, plant and equipment for terms ranging from one to five years. The annual operating minimum lease commitments through the year 2016 are approximated below:
MinimumLease
(in thousands) Commitments
Year2012 12,806$ 2013 8,5852014 5,1802015 5,0552016 5,050
36,676$
Total rental expense for the University was $16,528,000 and $15,212,000 for the years ended June 30, 2011 and 2010, respectively.
The University has entered into contracts for various maintenance and renovation projects for which a balance of $23,174,000 is committed at June 30, 2011.
Northeastern University Notes to Consolidated Financial Statements June 30, 2011 and 2010
22
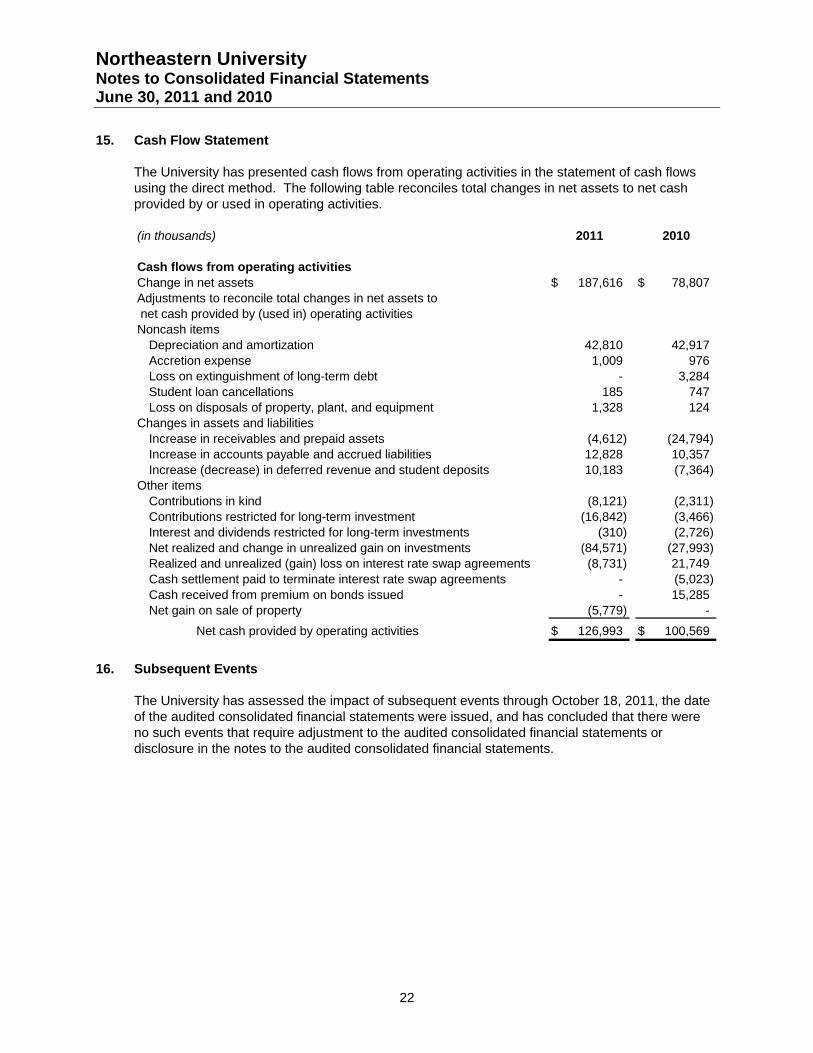
15. Cash Flow Statement
The University has presented cash flows from operating activities in the statement of cash flows using the direct method. The following table reconciles total changes in net assets to net cash provided by or used in operating activities.
(in thousands) 2011 2010
Cash flows from operating activitiesChange in net assets 187,616$ 78,807$ Adjustments to reconcile total changes in net assets to net cash provided by (used in) operating activitiesNoncash items
Depreciation and amortization 42,810 42,917Accretion expense 1,009 976Loss on extinguishment of long-term debt - 3,284Student loan cancellations 185 747Loss on disposals of property, plant, and equipment 1,328 124
Changes in assets and liabilitiesIncrease in receivables and prepaid assets (4,612) (24,794)Increase in accounts payable and accrued liabilities 12,828 10,357Increase (decrease) in deferred revenue and student deposits 10,183 (7,364)
Other itemsContributions in kind (8,121) (2,311)Contributions restricted for long-term investment (16,842) (3,466)Interest and dividends restricted for long-term investments (310) (2,726)Net realized and change in unrealized gain on investments (84,571) (27,993)Realized and unrealized (gain) loss on interest rate swap agreements (8,731) 21,749Cash settlement paid to terminate interest rate swap agreements - (5,023)Cash received from premium on bonds issued - 15,285Net gain on sale of property (5,779) -
Net cash provided by operating activities 126,993$ 100,569$
16. Subsequent Events
The University has assessed the impact of subsequent events through October 18, 2011, the date of the audited consolidated financial statements were issued, and has concluded that there were no such events that require adjustment to the audited consolidated financial statements or disclosure in the notes to the audited consolidated financial statements.