Embed Size (px)
Citation preview
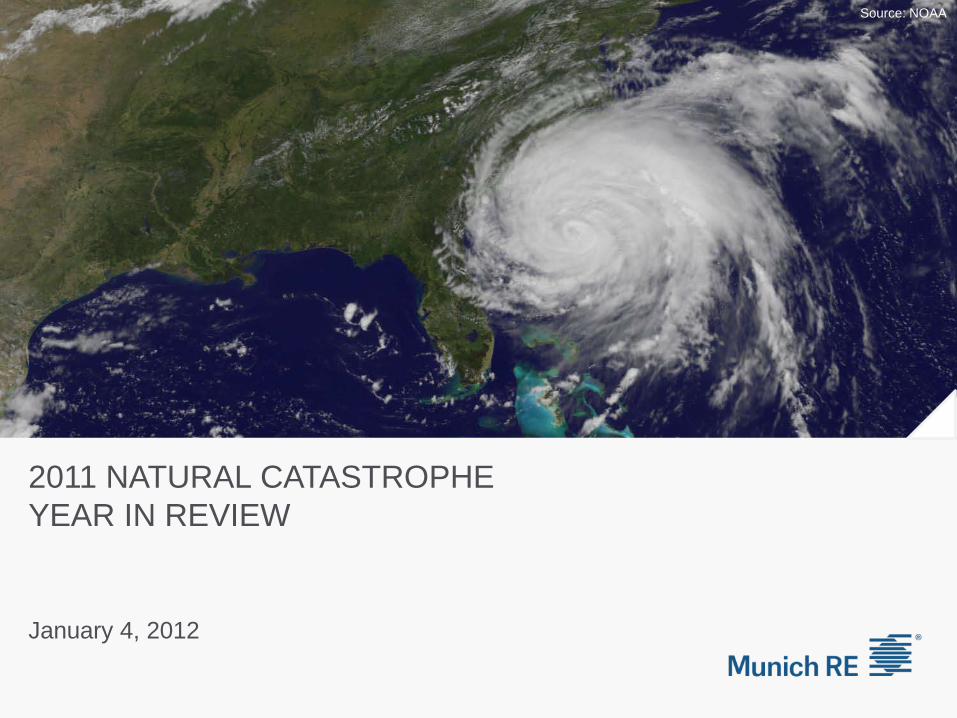
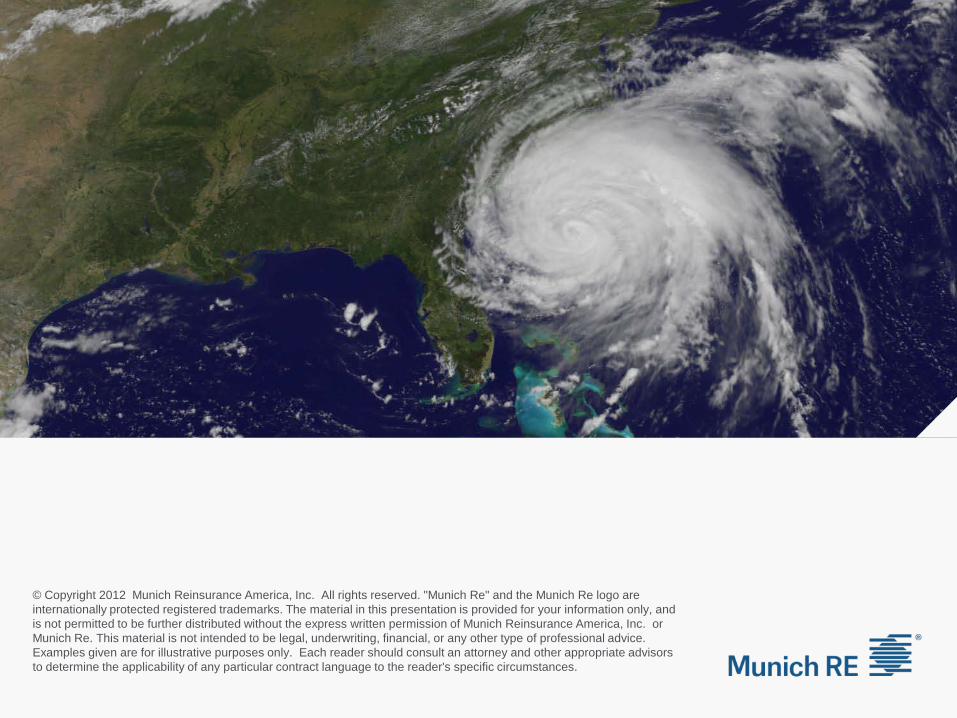
2011 NATURAL CATASTROPHE YEAR IN REVIEW
January 4, 2012
Source: NOAA
Questions and Answers
Welcome/Introduction Terese Rosenthal
U.S. Natural Catastrophe Update Carl Hedde
Global Natural Catastrophe Update Ernst Rauch
Economic Implications of Natural Catastrophe Losses Dr. Robert Hartwig
Agenda
2
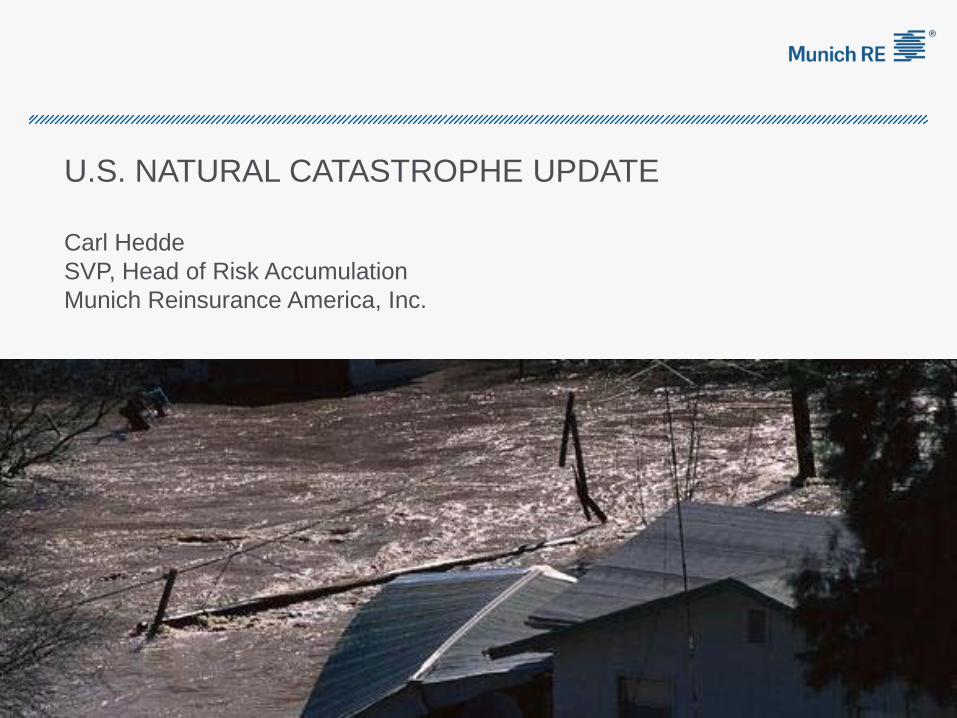
U.S. NATURAL CATASTROPHE UPDATE Carl Hedde SVP, Head of Risk Accumulation Munich Reinsurance America, Inc.
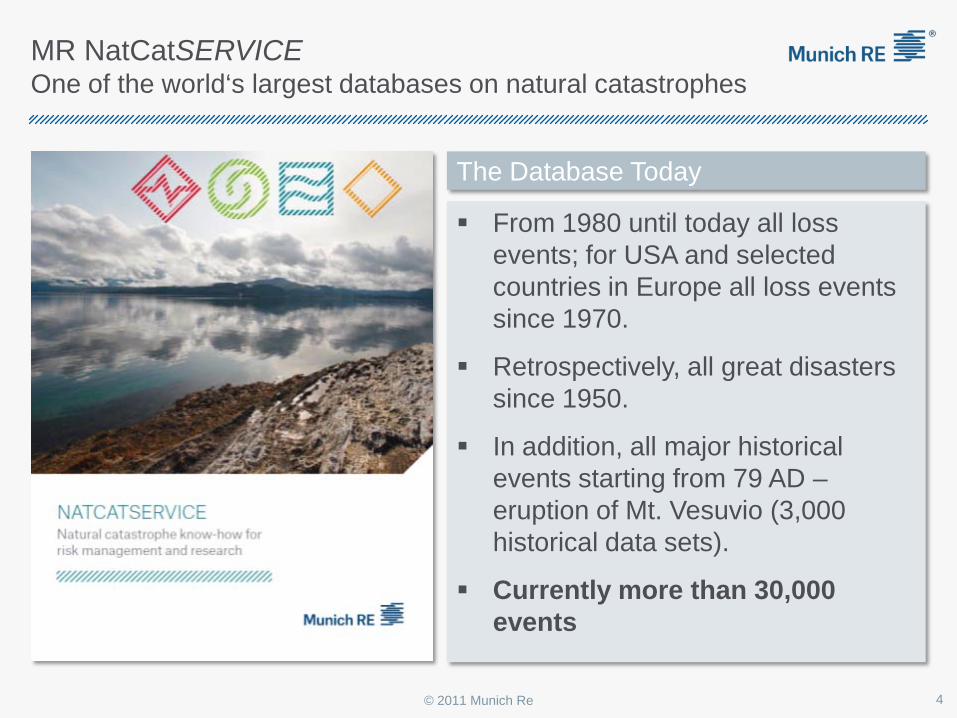
From 1980 until today all loss events; for USA and selected countries in Europe all loss events since 1970.
Retrospectively, all great disasters since 1950.
In addition, all major historical events starting from 79 AD – eruption of Mt. Vesuvio (3,000 historical data sets).
Currently more than 30,000 events
4
The Database Today
MR NatCatSERVICE
One of the world‘s largest databases on natural catastrophes
© 2011 Munich Re
U.S. Natural Catastrophes 2011 Headlines
U.S. Natural Catastrophe Update
5 © 2011 Munich Re
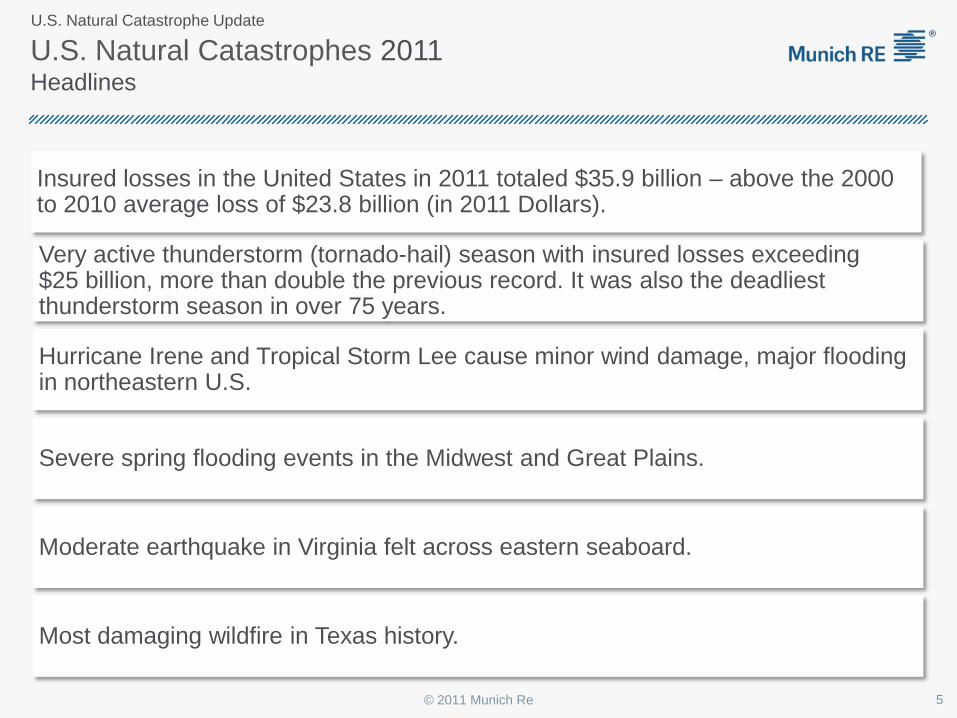
Most damaging wildfire in Texas history.
Moderate earthquake in Virginia felt across eastern seaboard.
Severe spring flooding events in the Midwest and Great Plains.
Hurricane Irene and Tropical Storm Lee cause minor wind damage, major flooding in northeastern U.S.
Very active thunderstorm (tornado-hail) season with insured losses exceeding $25 billion, more than double the previous record. It was also the deadliest thunderstorm season in over 75 years.
Insured losses in the United States in 2011 totaled $35.9 billion – above the 2000 to 2010 average loss of $23.8 billion (in 2011 Dollars).
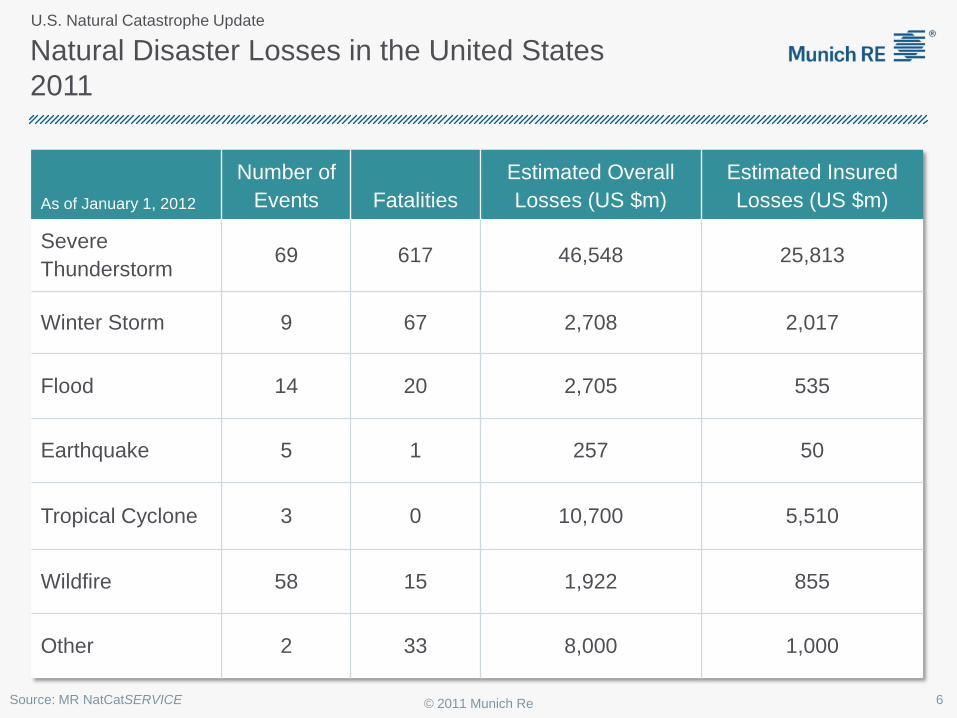
As of January 1, 2012
Number of Events Fatalities
Estimated Overall Losses (US $m)
Estimated Insured Losses (US $m)
Severe Thunderstorm 69 617 46,548 25,813
Winter Storm 9 67 2,708 2,017
Flood 14 20 2,705 535
Earthquake 5 1 257 50
Tropical Cyclone 3 0 10,700 5,510
Wildfire 58 15 1,922 855
Other 2 33 8,000 1,000
Natural Disaster Losses in the United States 2011
6 © 2011 Munich Re Source: MR NatCatSERVICE
U.S. Natural Catastrophe Update
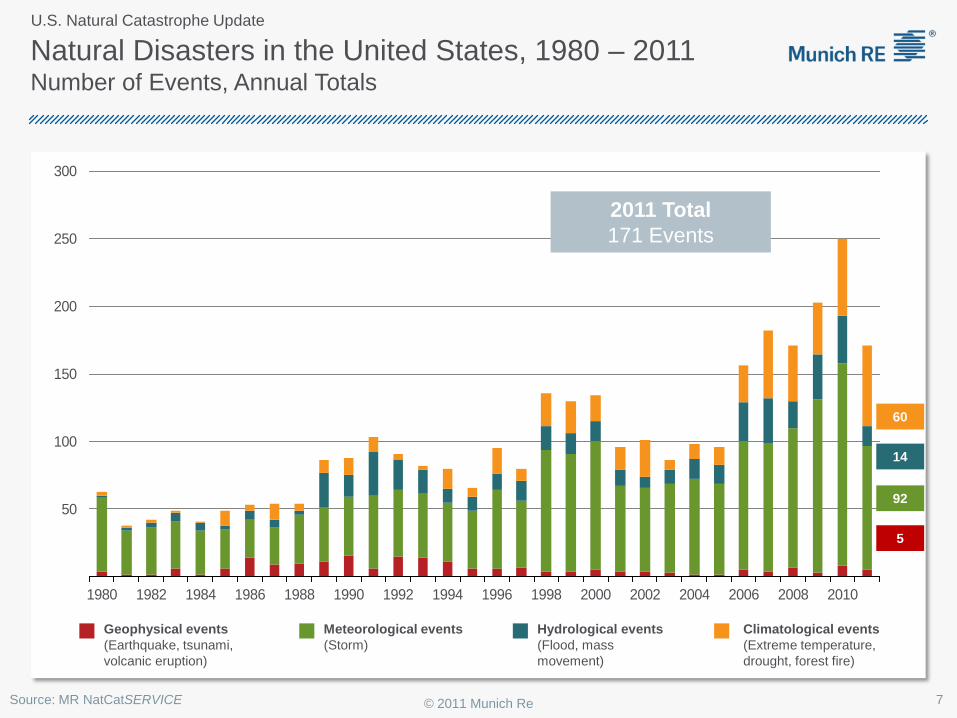
Natural Disasters in the United States, 1980 – 2011 Number of Events, Annual Totals
Meteorological events (Storm)
Hydrological events (Flood, mass movement)
Climatological events (Extreme temperature, drought, forest fire)
Geophysical events (Earthquake, tsunami, volcanic eruption)
50
100
150
200
250
300
1980 1982 1984 1986 1988 1990 1992 1994 1996 1998 2000 2002 2004 2006 2008 2010
2011 Total 171 Events
5
92
14
60
© 2011 Munich Re Source: MR NatCatSERVICE
U.S. Natural Catastrophe Update
7
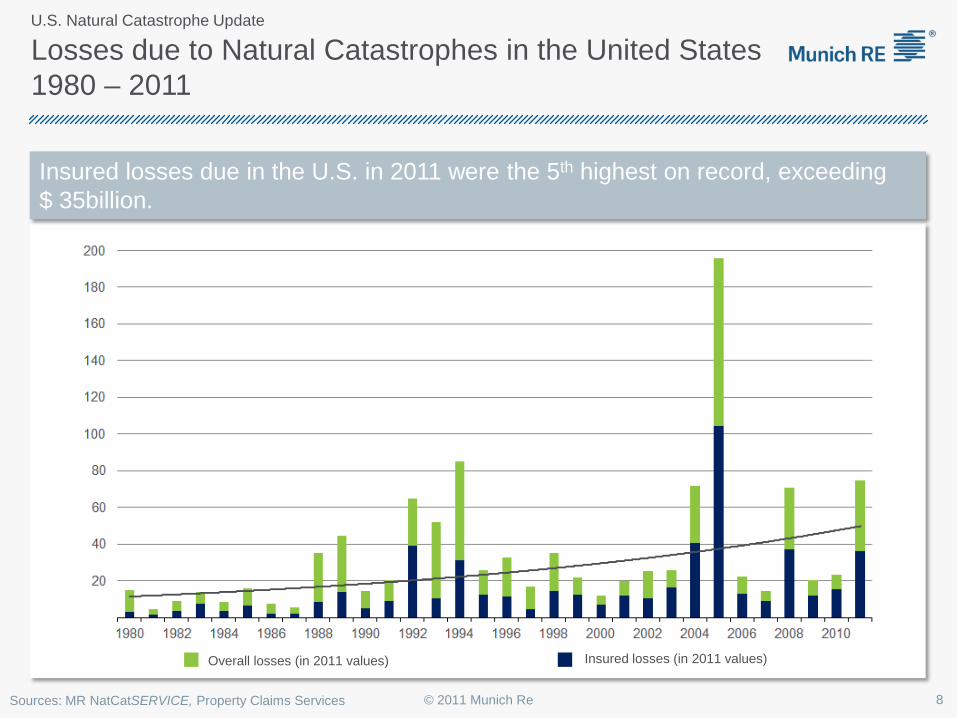
Insured losses due in the U.S. in 2011 were the 5th highest on record, exceeding $ 35billion.
Losses due to Natural Catastrophes in the United States 1980 – 2011
Sources: MR NatCatSERVICE, Property Claims Services 8 © 2011 Munich Re
Overall losses (in 2011 values) Insured losses (in 2011 values)
U.S. Natural Catastrophe Update
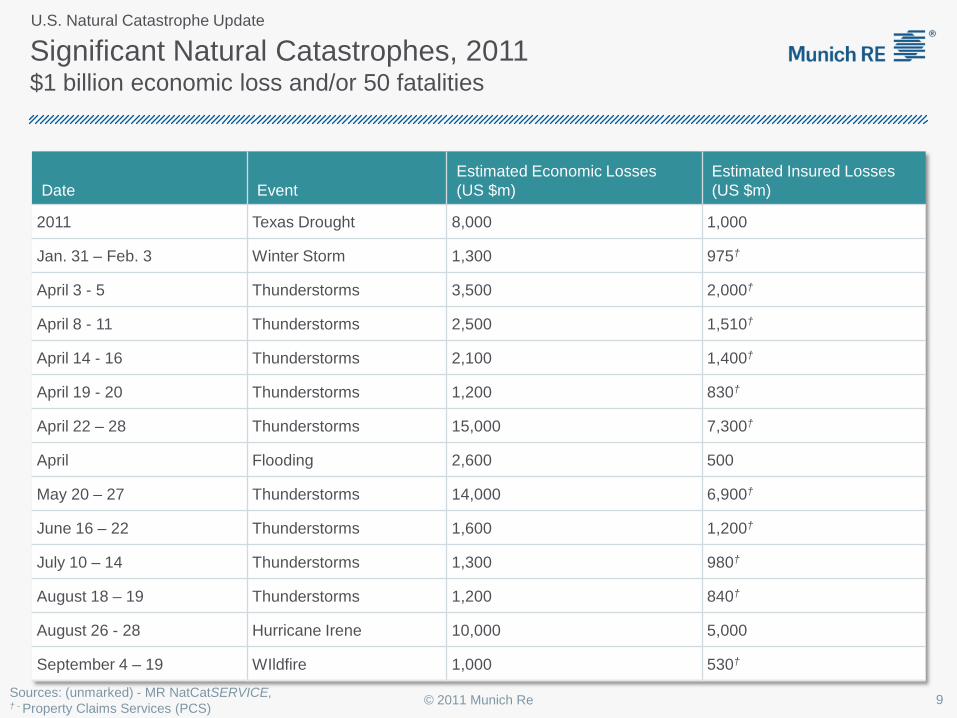
Significant Natural Catastrophes, 2011 $1 billion economic loss and/or 50 fatalities
Date Event Estimated Economic Losses (US $m)
Estimated Insured Losses (US $m)
2011 Texas Drought 8,000 1,000
Jan. 31 – Feb. 3 Winter Storm 1,300 975†
April 3 - 5 Thunderstorms 3,500 2,000†
April 8 - 11 Thunderstorms 2,500 1,510†
April 14 - 16 Thunderstorms 2,100 1,400†
April 19 - 20 Thunderstorms 1,200 830†
April 22 – 28 Thunderstorms 15,000 7,300†
April Flooding 2,600 500
May 20 – 27 Thunderstorms 14,000 6,900†
June 16 – 22 Thunderstorms 1,600 1,200†
July 10 – 14 Thunderstorms 1,300 980†
August 18 – 19 Thunderstorms 1,200 840†
August 26 - 28 Hurricane Irene 10,000 5,000
September 4 – 19 WIldfire 1,000 530†
Sources: (unmarked) - MR NatCatSERVICE, † - Property Claims Services (PCS) 9 © 2011 Munich Re
U.S. Natural Catastrophe Update
2011 U.S. THUNDERSTORM SEASON
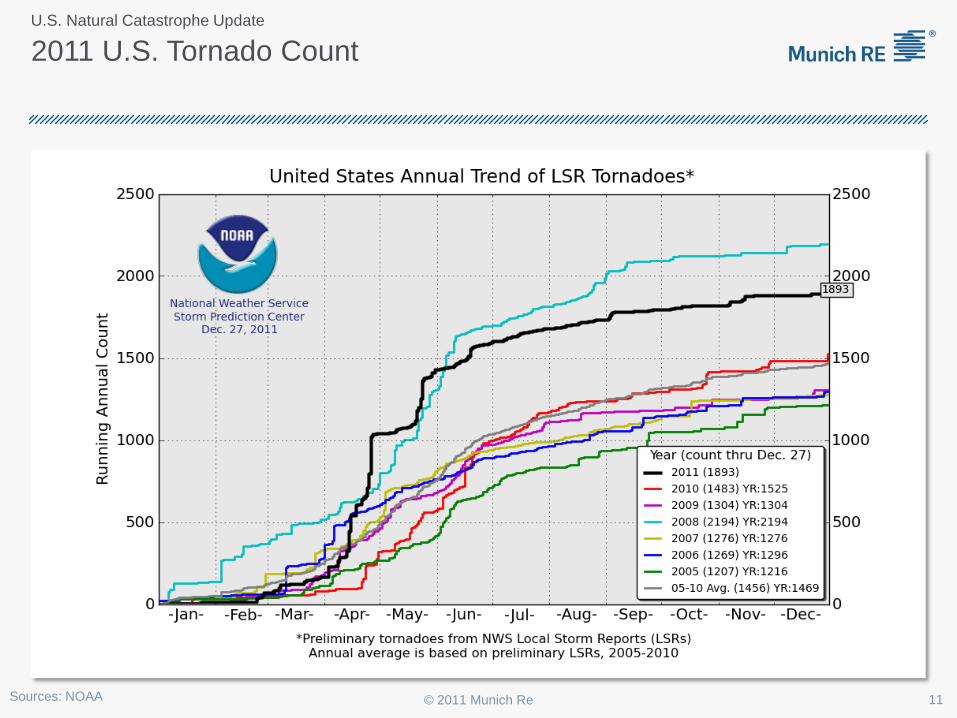
2011 U.S. Tornado Count
11 © 2011 Munich Re Sources: NOAA
U.S. Natural Catastrophe Update
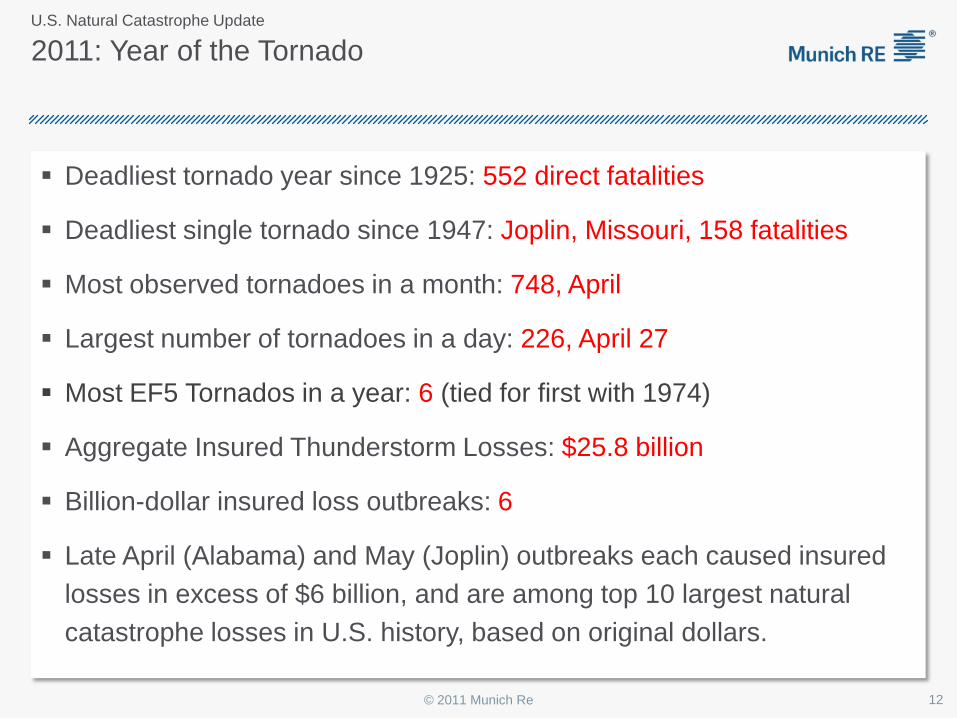
Deadliest tornado year since 1925: 552 direct fatalities
Deadliest single tornado since 1947: Joplin, Missouri, 158 fatalities
Most observed tornadoes in a month: 748, April
Largest number of tornadoes in a day: 226, April 27
Most EF5 Tornados in a year: 6 (tied for first with 1974)
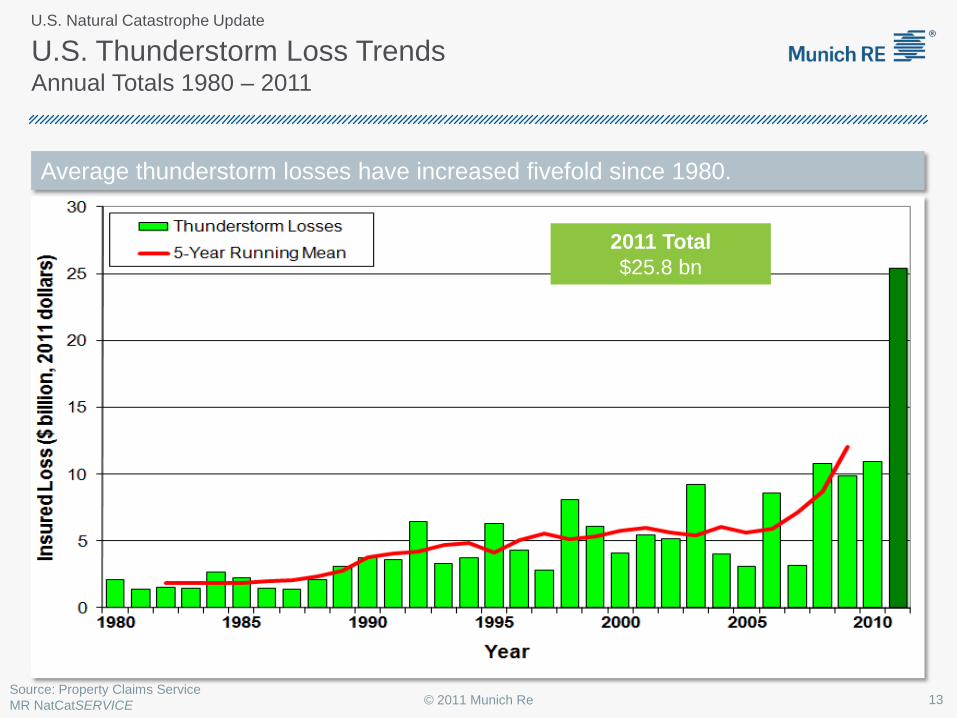
Aggregate Insured Thunderstorm Losses: $25.8 billion
Billion-dollar insured loss outbreaks: 6
Late April (Alabama) and May (Joplin) outbreaks each caused insured losses in excess of $6 billion, and are among top 10 largest natural catastrophe losses in U.S. history, based on original dollars.
2011: Year of the Tornado
12 © 2011 Munich Re
U.S. Natural Catastrophe Update
Source: Property Claims Service MR NatCatSERVICE
U.S. Thunderstorm Loss Trends Annual Totals 1980 – 2011
Average thunderstorm losses have increased fivefold since 1980.
13 © 2011 Munich Re
2011 Total $25.8 bn
U.S. Natural Catastrophe Update
U.S. TROPICAL CYCLONES 2011
Photo: NASA
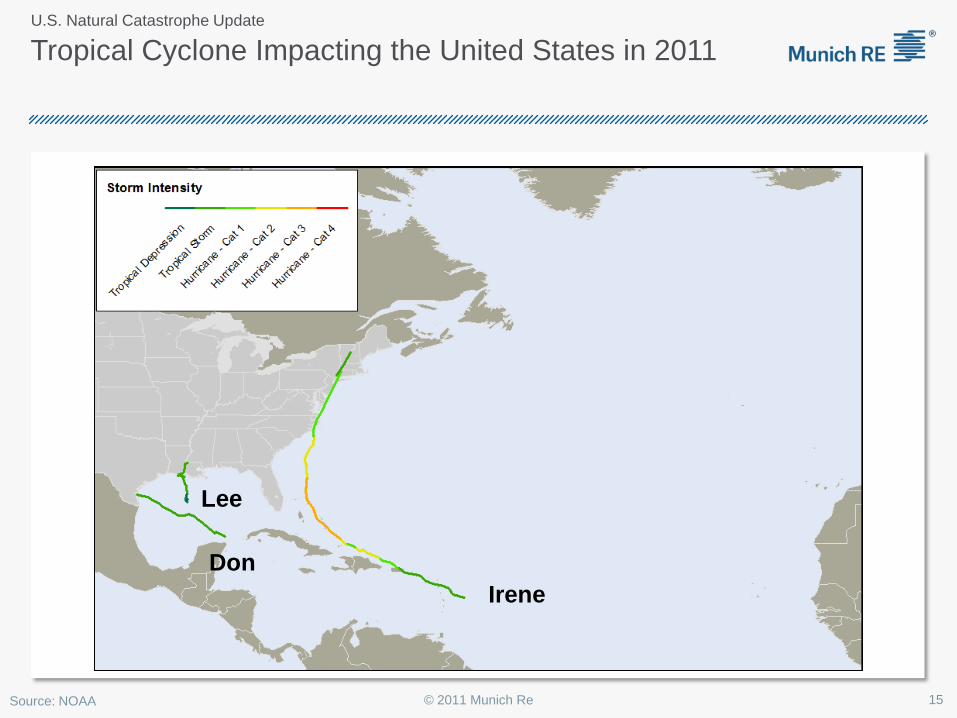
Tropical Cyclone Impacting the United States in 2011
Source: NOAA
Irene Don
Lee
15 © 2011 Munich Re
U.S. Natural Catastrophe Update
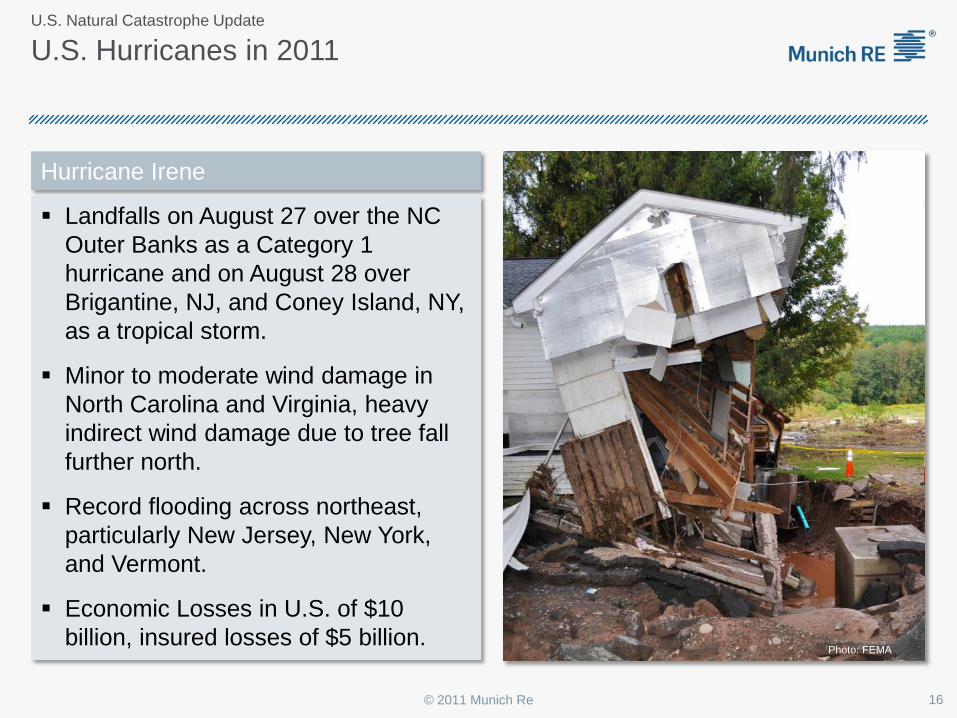
U.S. Hurricanes in 2011
Landfalls on August 27 over the NC Outer Banks as a Category 1 hurricane and on August 28 over Brigantine, NJ, and Coney Island, NY, as a tropical storm.
Minor to moderate wind damage in North Carolina and Virginia, heavy indirect wind damage due to tree fall further north.
Record flooding across northeast, particularly New Jersey, New York, and Vermont.
Economic Losses in U.S. of $10 billion, insured losses of $5 billion.
Photo: FEMA
16 © 2011 Munich Re
Hurricane Irene
U.S. Natural Catastrophe Update
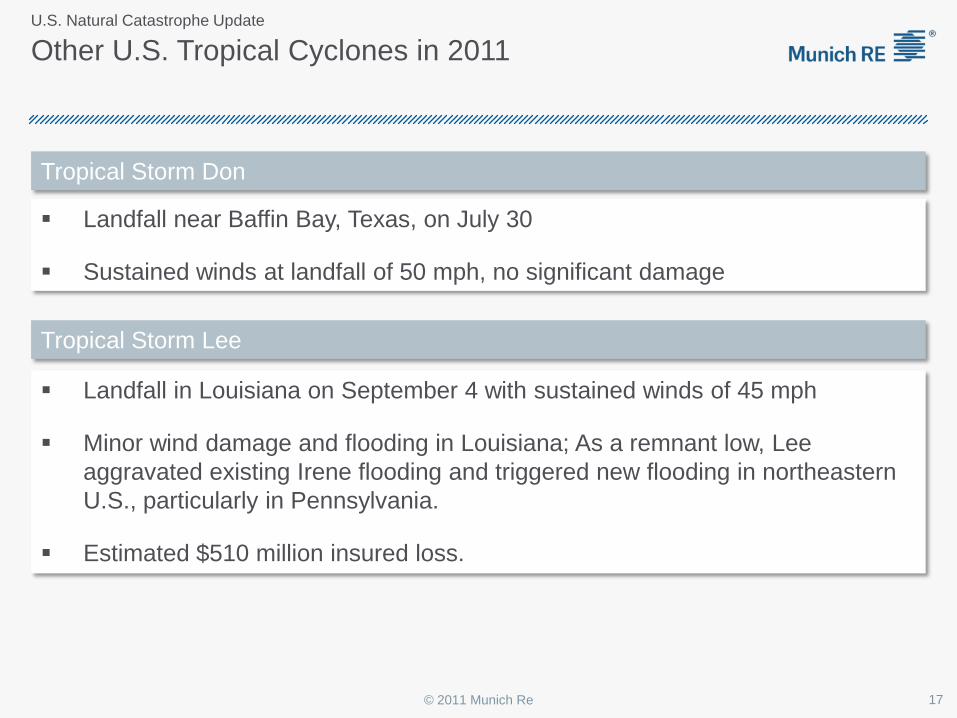
Other U.S. Tropical Cyclones in 2011
Landfall in Louisiana on September 4 with sustained winds of 45 mph
Minor wind damage and flooding in Louisiana; As a remnant low, Lee aggravated existing Irene flooding and triggered new flooding in northeastern U.S., particularly in Pennsylvania.
Estimated $510 million insured loss.
Tropical Storm Don
Landfall near Baffin Bay, Texas, on July 30
Sustained winds at landfall of 50 mph, no significant damage
Tropical Storm Lee
17 © 2011 Munich Re
U.S. Natural Catastrophe Update
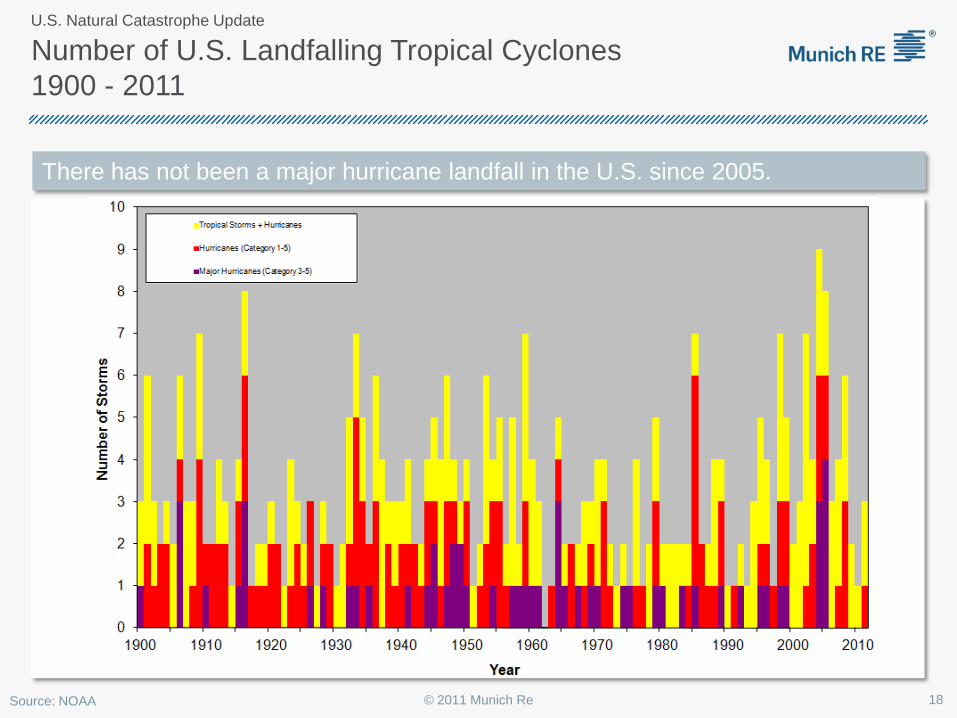
There has not been a major hurricane landfall in the U.S. since 2005.
Number of U.S. Landfalling Tropical Cyclones 1900 - 2011
Source: NOAA 18 © 2011 Munich Re
U.S. Natural Catastrophe Update
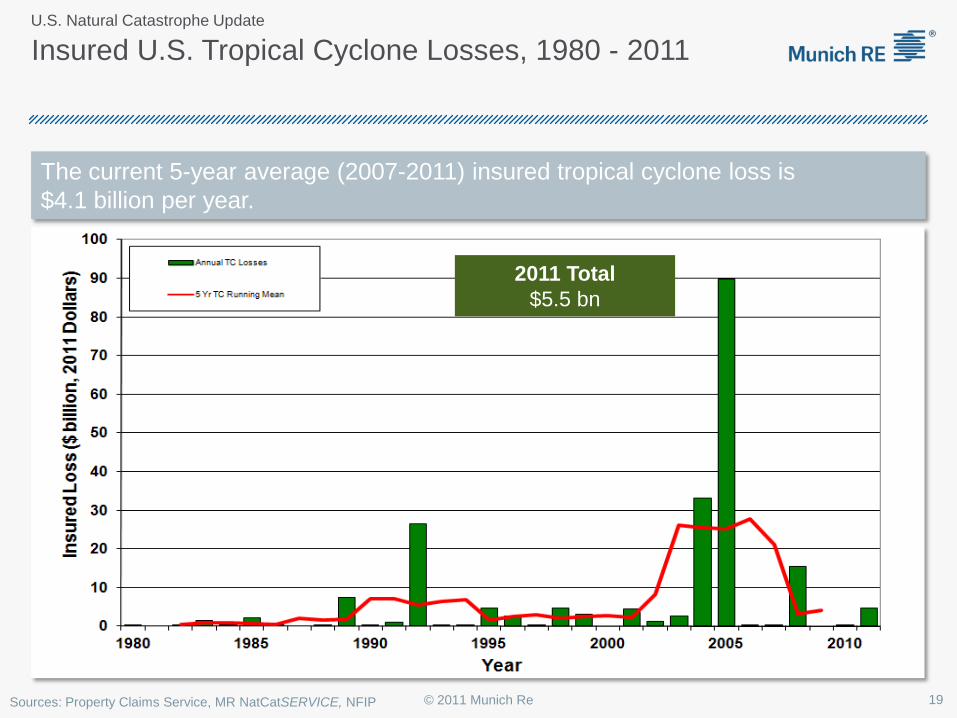
The current 5-year average (2007-2011) insured tropical cyclone loss is $4.1 billion per year.
Insured U.S. Tropical Cyclone Losses, 1980 - 2011
Sources: Property Claims Service, MR NatCatSERVICE, NFIP 19 © 2011 Munich Re
U.S. Natural Catastrophe Update
2011 Total $5.5 bn
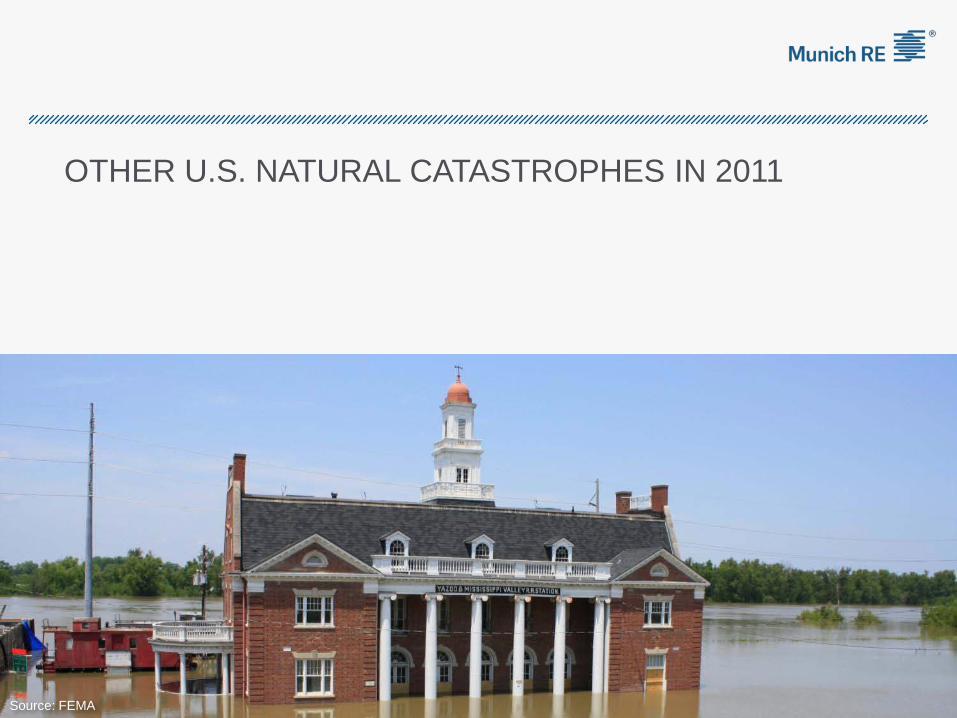
OTHER U.S. NATURAL CATASTROPHES IN 2011
Source: FEMA
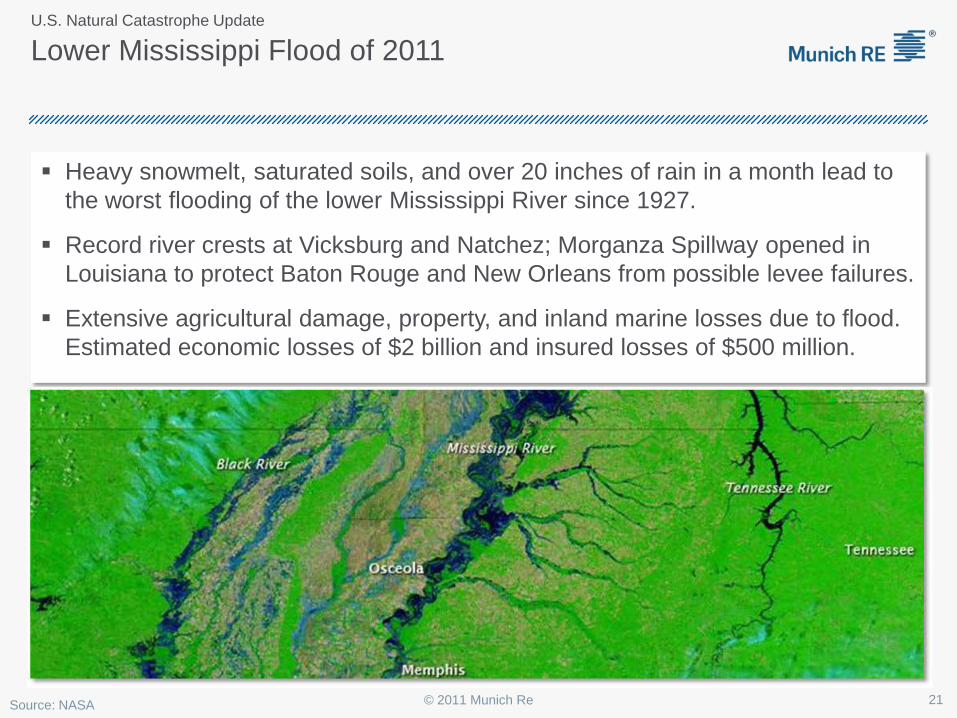
Lower Mississippi Flood of 2011
Heavy snowmelt, saturated soils, and over 20 inches of rain in a month lead to the worst flooding of the lower Mississippi River since 1927.
Record river crests at Vicksburg and Natchez; Morganza Spillway opened in Louisiana to protect Baton Rouge and New Orleans from possible levee failures.
Extensive agricultural damage, property, and inland marine losses due to flood. Estimated economic losses of $2 billion and insured losses of $500 million.
Source: NASA 21 © 2011 Munich Re
U.S. Natural Catastrophe Update
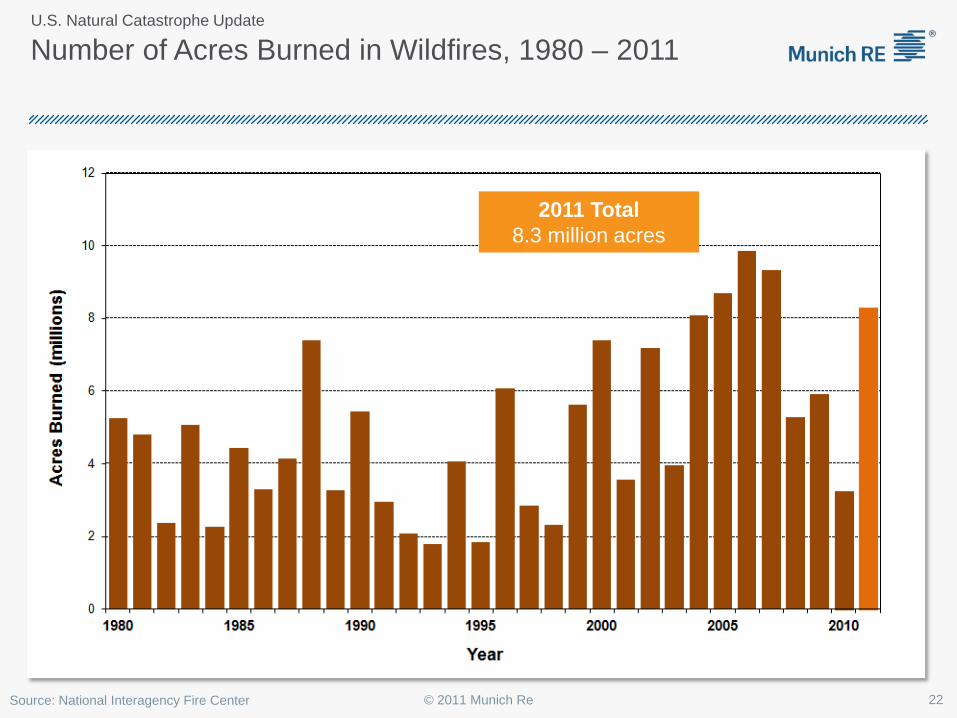
Number of Acres Burned in Wildfires, 1980 – 2011
Source: National Interagency Fire Center © 2011 Munich Re 22
U.S. Natural Catastrophe Update
2011 Total 8.3 million acres
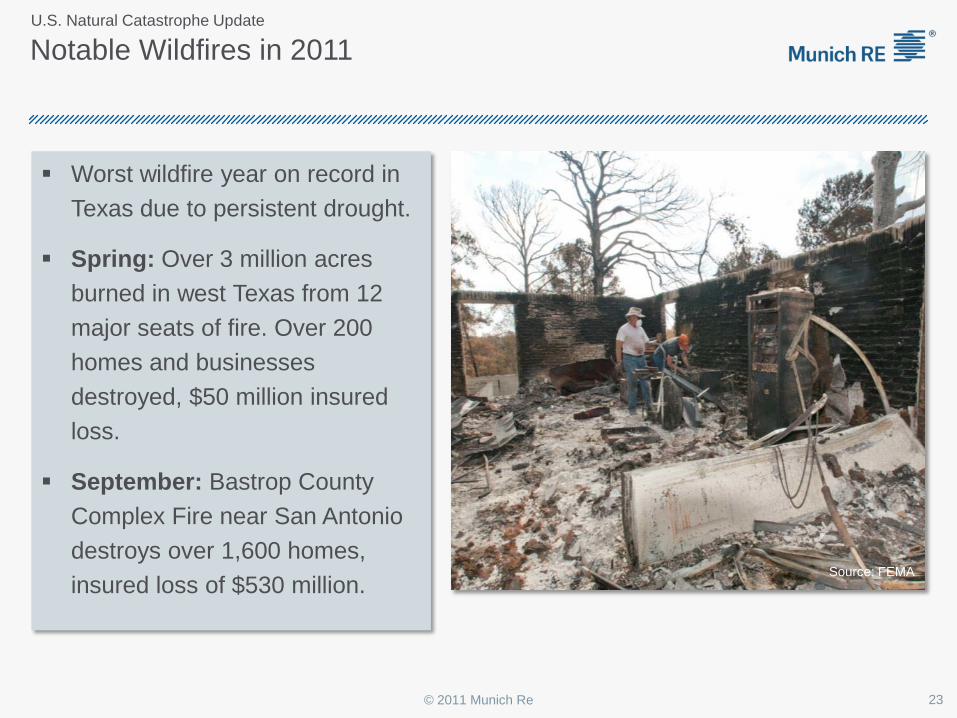
Notable Wildfires in 2011
Worst wildfire year on record in Texas due to persistent drought.
Spring: Over 3 million acres burned in west Texas from 12 major seats of fire. Over 200 homes and businesses destroyed, $50 million insured loss.
September: Bastrop County Complex Fire near San Antonio destroys over 1,600 homes, insured loss of $530 million.
Source: FEMA
23 © 2011 Munich Re
U.S. Natural Catastrophe Update
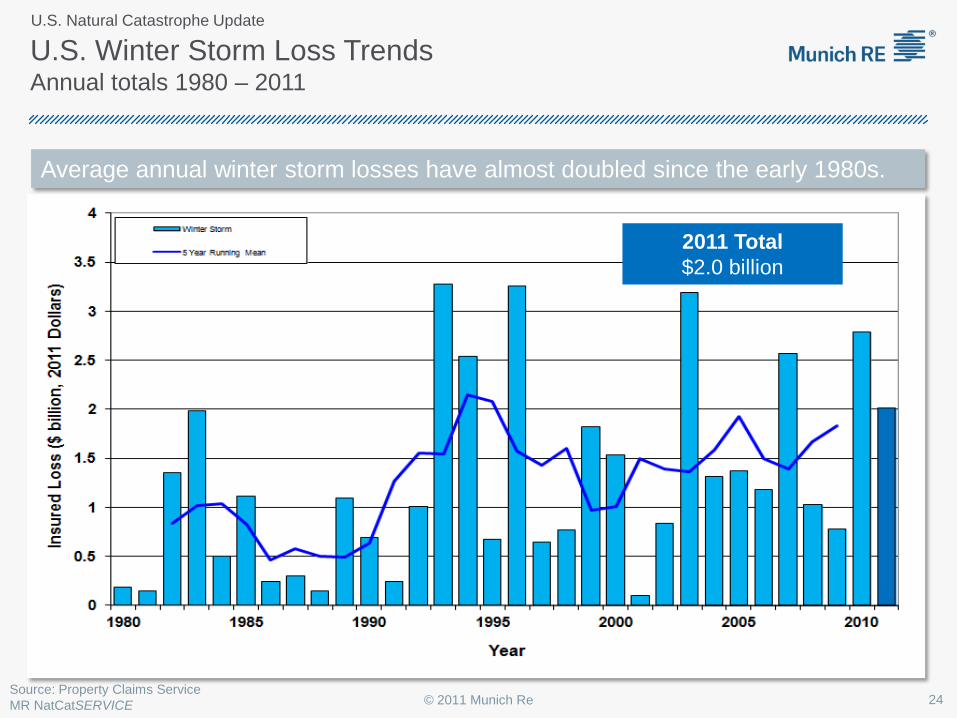
Average annual winter storm losses have almost doubled since the early 1980s.
Source: Property Claims Service MR NatCatSERVICE © 2011 Munich Re
U.S. Winter Storm Loss Trends Annual totals 1980 – 2011
2011 Total $2.0 billion
U.S. Natural Catastrophe Update
24
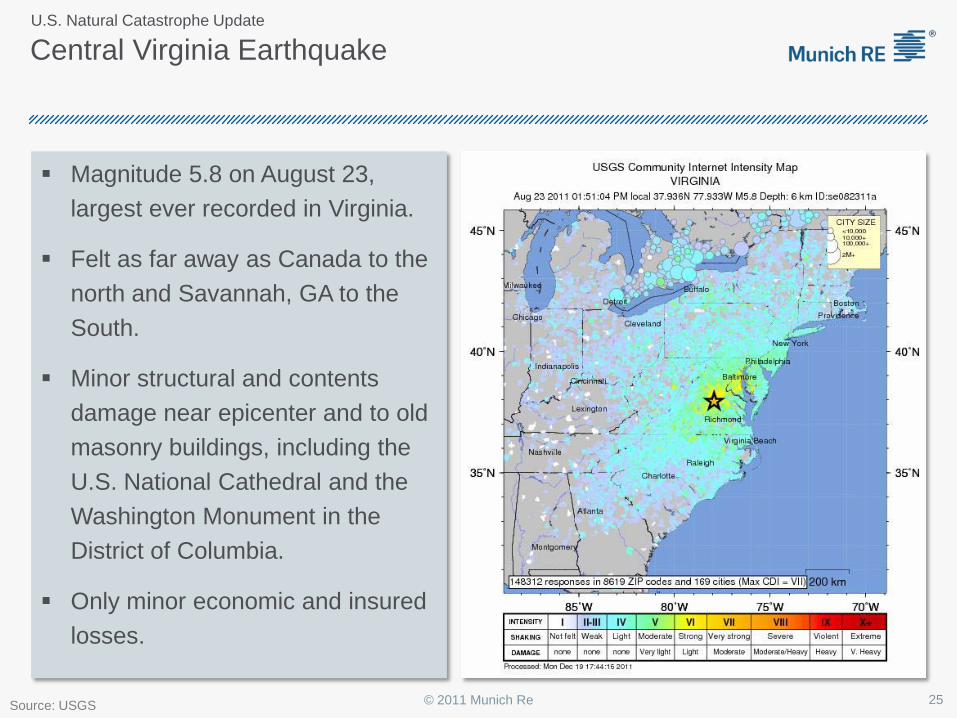
Central Virginia Earthquake
Magnitude 5.8 on August 23, largest ever recorded in Virginia.
Felt as far away as Canada to the north and Savannah, GA to the South.
Minor structural and contents damage near epicenter and to old masonry buildings, including the U.S. National Cathedral and the Washington Monument in the District of Columbia.
Only minor economic and insured losses. Source: FEMA
Source: USGS © 2011 Munich Re 25
U.S. Natural Catastrophe Update
GLOBAL NATURAL CATASTROPHE UPDATE Ernst Rauch Head of Corporate Climate Center Munich Re
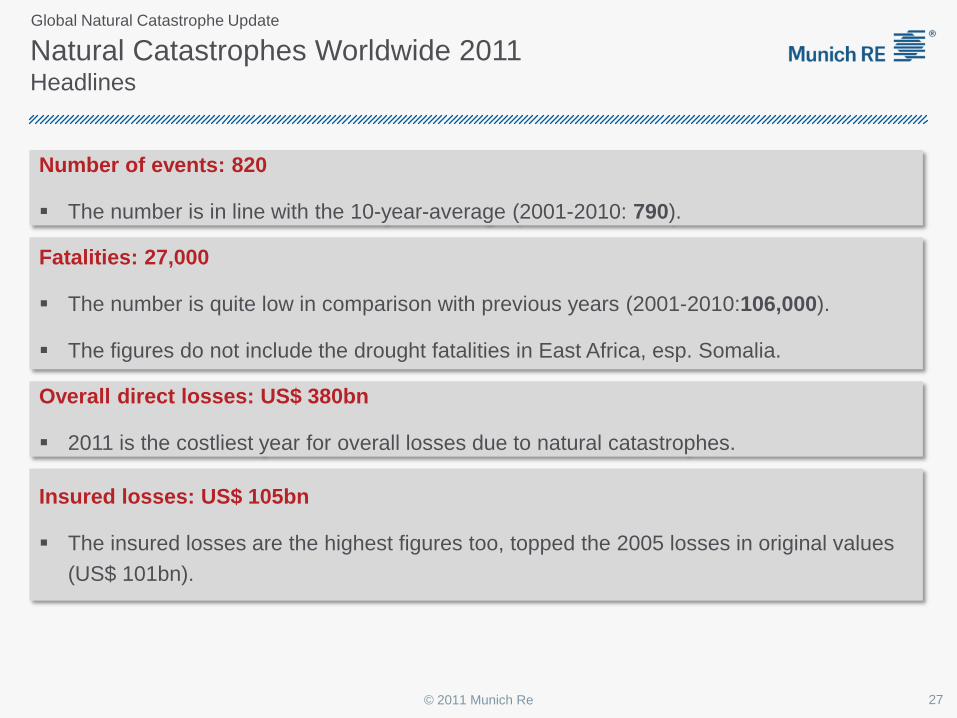
Natural Catastrophes Worldwide 2011 Headlines
Number of events: 820
The number is in line with the 10-year-average (2001-2010: 790).
Overall direct losses: US$ 380bn
2011 is the costliest year for overall losses due to natural catastrophes.
Insured losses: US$ 105bn
The insured losses are the highest figures too, topped the 2005 losses in original values (US$ 101bn).
Fatalities: 27,000
The number is quite low in comparison with previous years (2001-2010:106,000).
The figures do not include the drought fatalities in East Africa, esp. Somalia.
Global Natural Catastrophe Update
© 2011 Munich Re 27
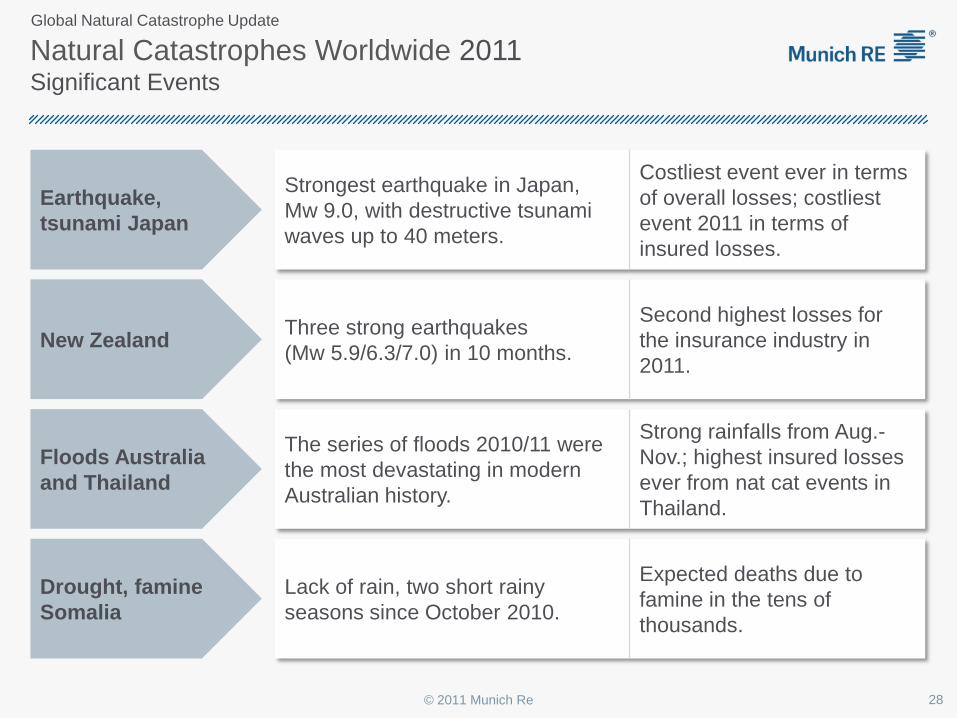
Natural Catastrophes Worldwide 2011 Significant Events
Earthquake, tsunami Japan
New Zealand
Floods Australia and Thailand
Drought, famine Somalia
Strongest earthquake in Japan, Mw 9.0, with destructive tsunami waves up to 40 meters.
Costliest event ever in terms of overall losses; costliest event 2011 in terms of insured losses.
Three strong earthquakes (Mw 5.9/6.3/7.0) in 10 months.
Second highest losses for the insurance industry in 2011.
The series of floods 2010/11 were the most devastating in modern Australian history.
Strong rainfalls from Aug.- Nov.; highest insured losses ever from nat cat events in Thailand.
Lack of rain, two short rainy seasons since October 2010.
Expected deaths due to famine in the tens of thousands.
Global Natural Catastrophe Update
© 2011 Munich Re 28
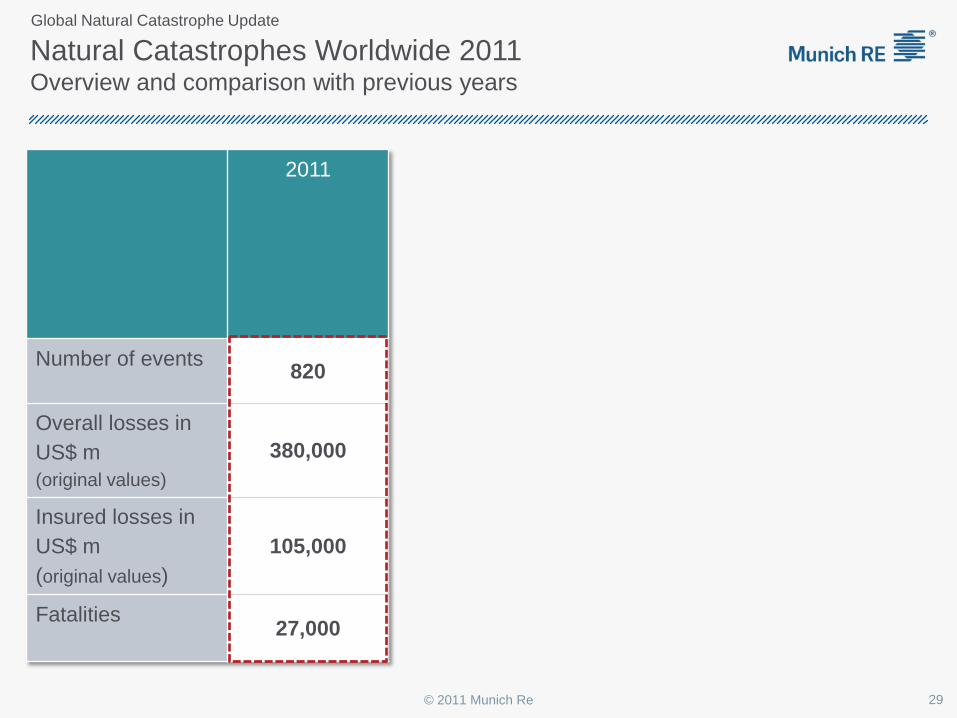
2011
Number of events 820
Overall losses in US$ m (original values)
380,000
Insured losses in US$ m (original values)
105,000
Fatalities 27,000
Natural Catastrophes Worldwide 2011 Overview and comparison with previous years
Global Natural Catastrophe Update
© 2011 Munich Re 29
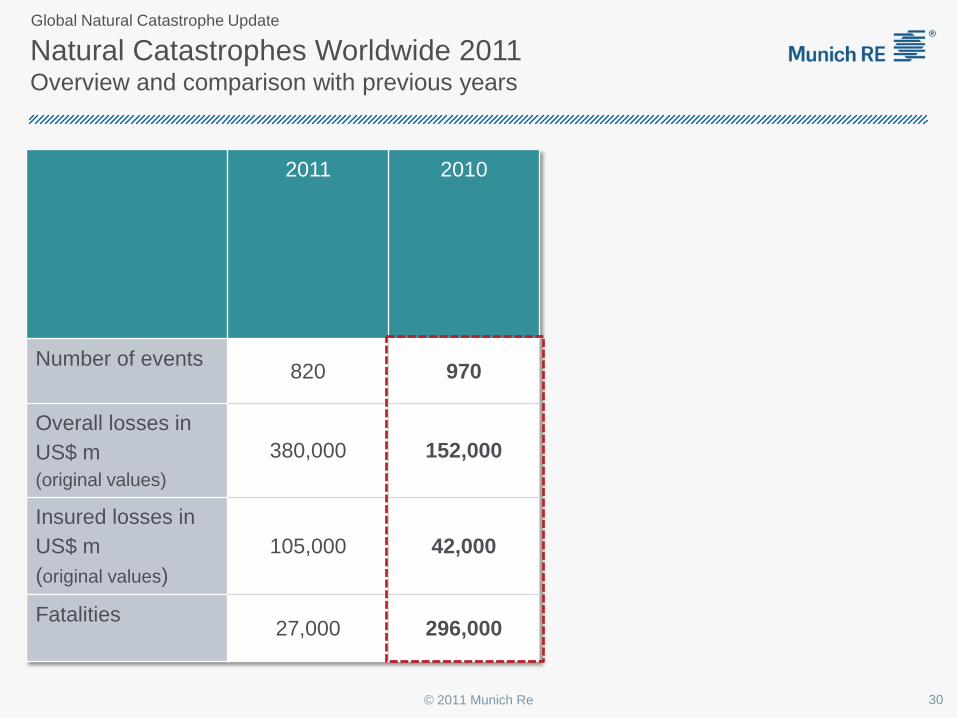
2011 2010
Number of events 820 970
Overall losses in US$ m (original values)
380,000 152,000
Insured losses in US$ m (original values)
105,000 42,000
Fatalities 27,000 296,000
Natural Catastrophes Worldwide 2011 Overview and comparison with previous years
Global Natural Catastrophe Update
© 2011 Munich Re 30
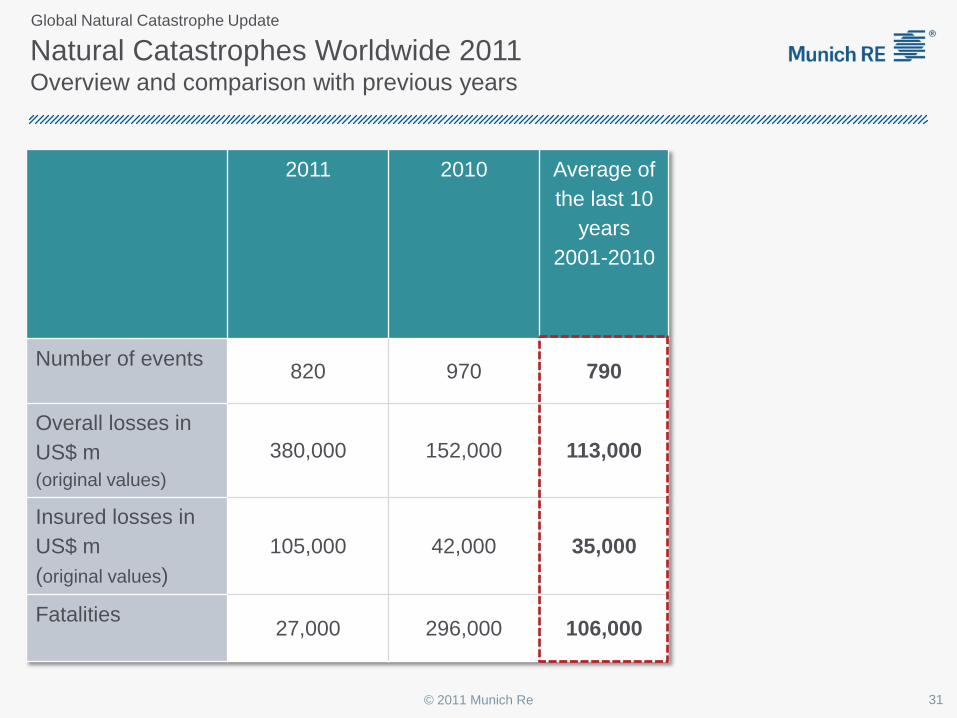
2011 2010 Average of the last 10
years 2001-2010
Number of events 820 970 790
Overall losses in US$ m (original values)
380,000 152,000 113,000
Insured losses in US$ m (original values)
105,000 42,000 35,000
Fatalities 27,000 296,000 106,000
Natural Catastrophes Worldwide 2011 Overview and comparison with previous years
Global Natural Catastrophe Update
© 2011 Munich Re 31
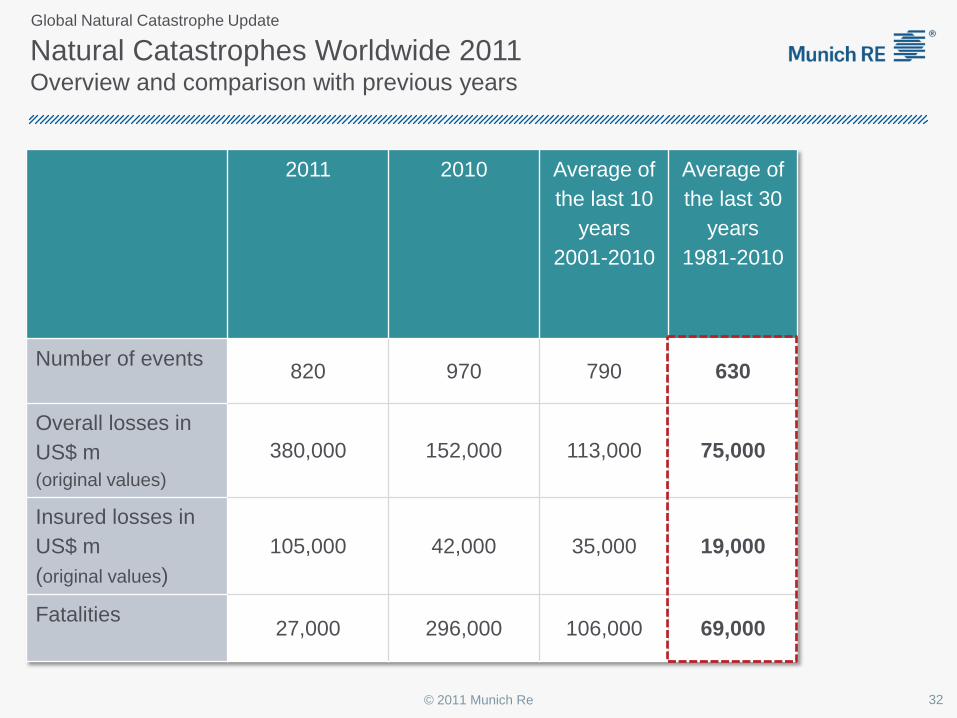
2011 2010 Average of the last 10
years 2001-2010
Average of the last 30
years 1981-2010
Number of events 820 970 790 630
Overall losses in US$ m (original values)
380,000 152,000 113,000 75,000
Insured losses in US$ m (original values)
105,000 42,000 35,000 19,000
Fatalities 27,000 296,000 106,000 69,000
Natural Catastrophes Worldwide 2011 Overview and comparison with previous years
Global Natural Catastrophe Update
© 2011 Munich Re 32
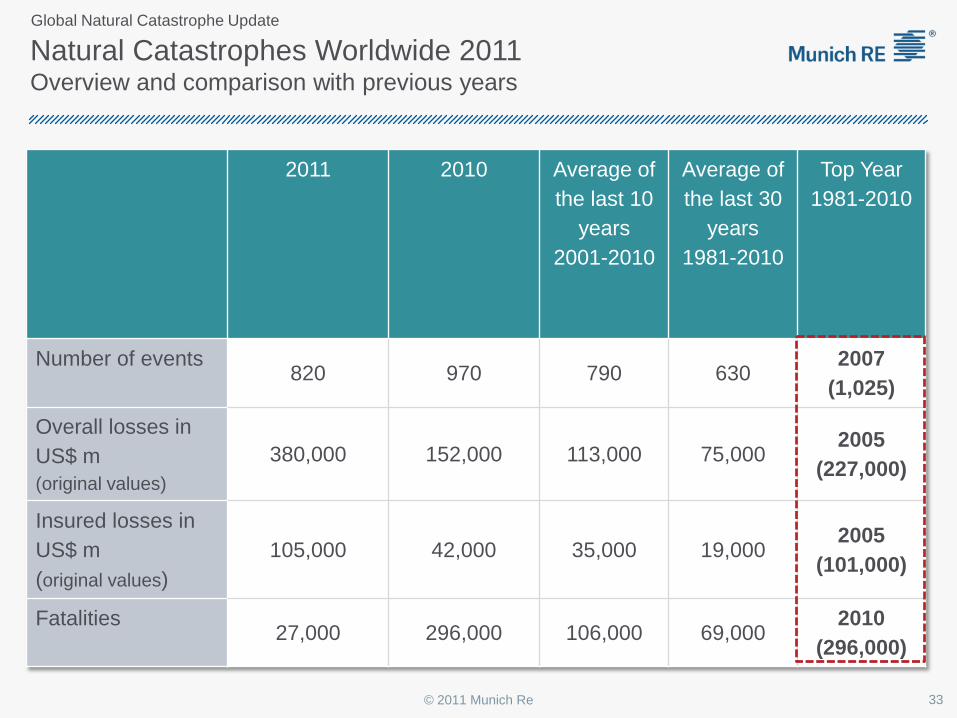
2011 2010 Average of the last 10
years 2001-2010
Average of the last 30
years 1981-2010
Top Year 1981-2010
Number of events 820 970 790 630
2007 (1,025)
Overall losses in US$ m (original values)
380,000 152,000 113,000 75,000 2005
(227,000)
Insured losses in US$ m (original values)
105,000 42,000 35,000 19,000 2005
(101,000)
Fatalities 27,000 296,000 106,000 69,000
2010 (296,000)
Natural Catastrophes Worldwide 2011 Overview and comparison with previous years
Global Natural Catastrophe Update
© 2011 Munich Re 33
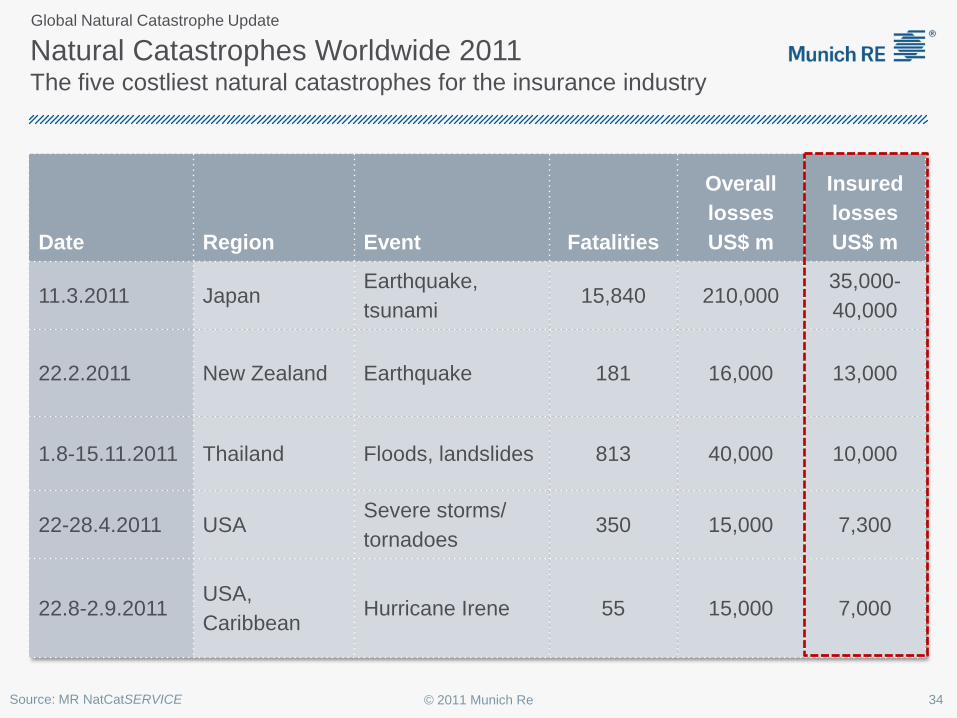
Natural Catastrophes Worldwide 2011 The five costliest natural catastrophes for the insurance industry
Date Region Event Fatalities
Overall losses US$ m
Insured losses US$ m
11.3.2011 Japan Earthquake, tsunami
15,840 210,000 35,000-40,000
22.2.2011 New Zealand Earthquake 181 16,000 13,000
1.8-15.11.2011 Thailand Floods, landslides 813 40,000 10,000
22-28.4.2011 USA Severe storms/ tornadoes
350 15,000 7,300
22.8-2.9.2011 USA, Caribbean
Hurricane Irene 55 15,000 7,000
Source: MR NatCatSERVICE
Global Natural Catastrophe Update
© 2011 Munich Re 34
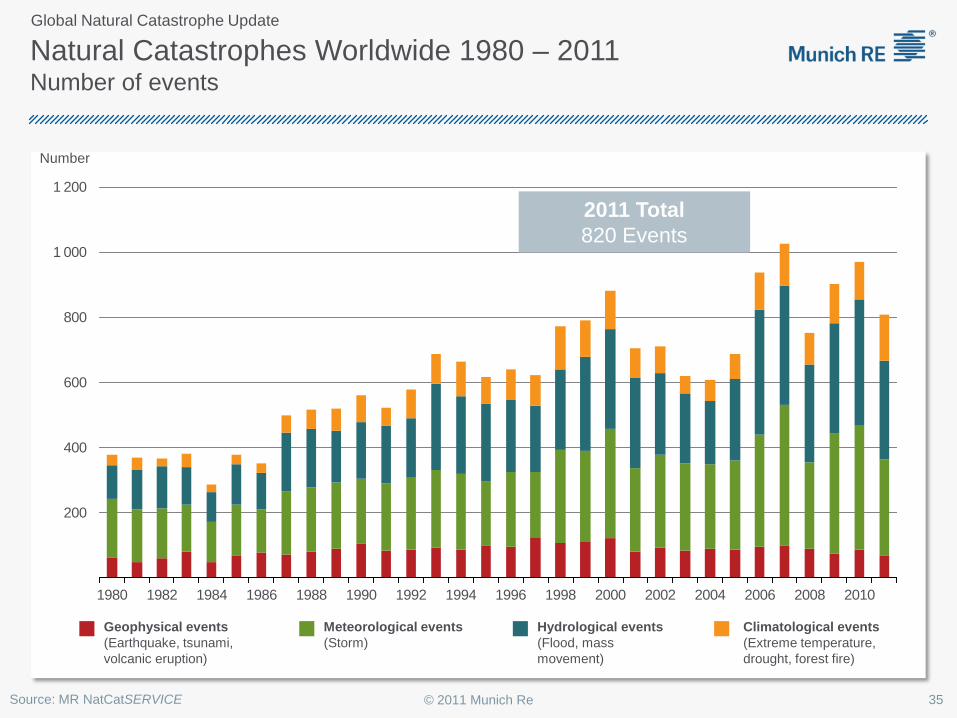
Natural Catastrophes Worldwide 1980 – 2011 Number of events
Number
Meteorological events (Storm)
Hydrological events (Flood, mass movement)
Climatological events (Extreme temperature, drought, forest fire)
Geophysical events (Earthquake, tsunami, volcanic eruption)
200
400
600
800
1 000
1 200
1980 1982 1984 1986 1988 1990 1992 1994 1996 1998 2000 2002 2004 2006 2008 2010
Source: MR NatCatSERVICE
2011 Total 820 Events
© 2011 Munich Re
Global Natural Catastrophe Update
35
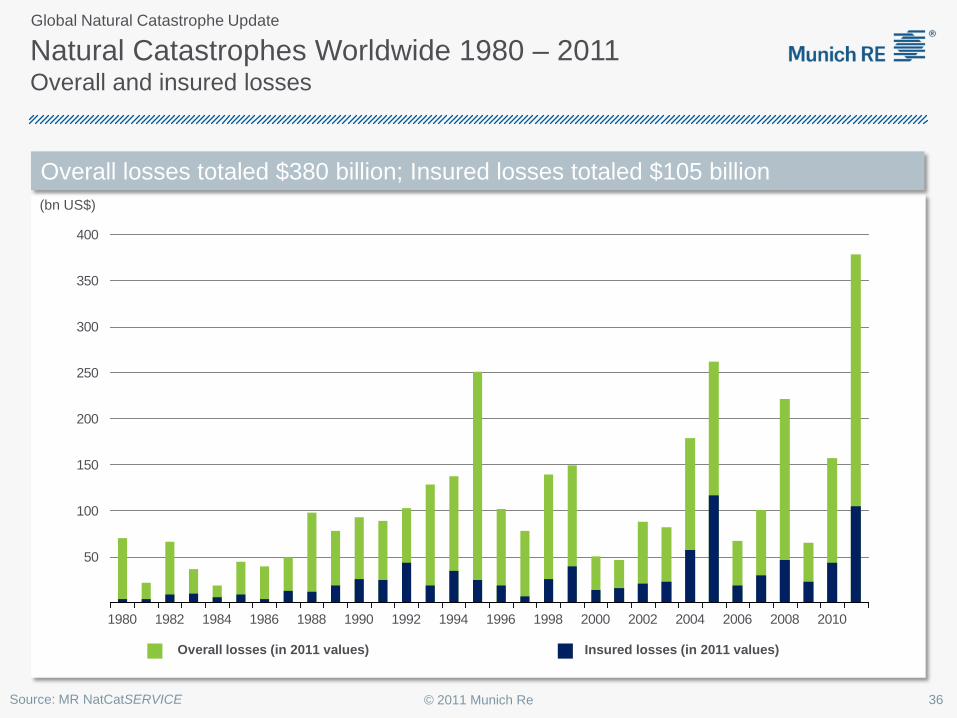
Natural Catastrophes Worldwide 1980 – 2011 Overall and insured losses
(bn US$)
Overall losses (in 2011 values) Insured losses (in 2011 values)
50
100
150
200
250
300
350
400
1980 1982 1984 1986 1988 1990 1992 1994 1996 1998 2000 2002 2004 2006 2008 2010
Overall losses totaled $380 billion; Insured losses totaled $105 billion
© 2011 Munich Re 36 Source: MR NatCatSERVICE
Global Natural Catastrophe Update
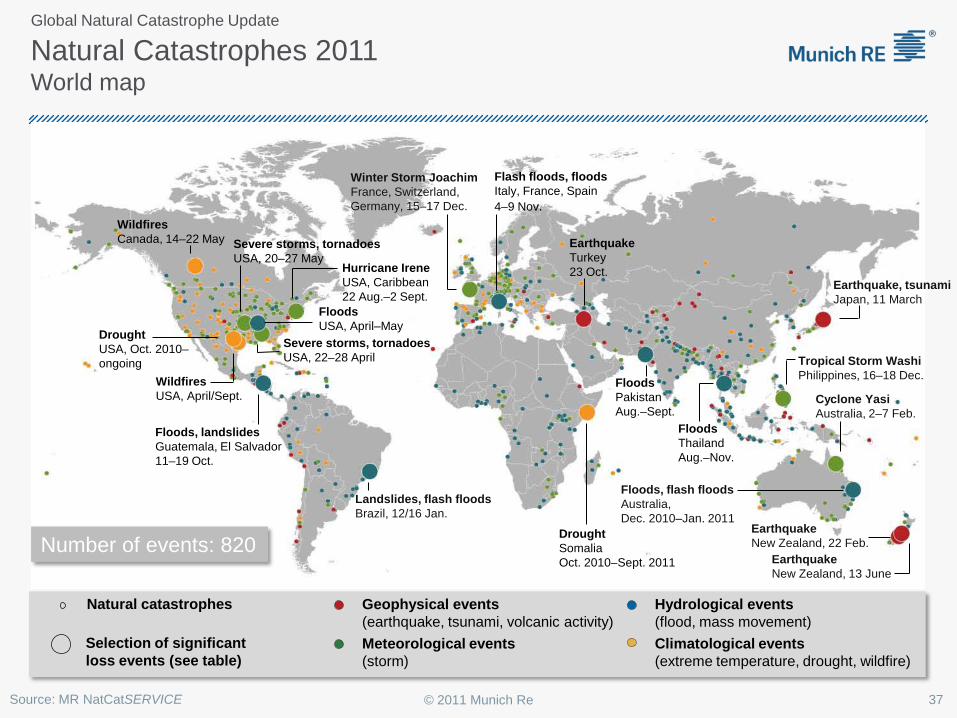
Geophysical events (earthquake, tsunami, volcanic activity) Meteorological events (storm)
Hydrological events (flood, mass movement)
Selection of significant loss events (see table)
Natural catastrophes
Earthquake, tsunami Japan, 11 March
Earthquake New Zealand, 22 Feb.
Cyclone Yasi Australia, 2–7 Feb.
Landslides, flash floods Brazil, 12/16 Jan.
Floods, flash floods Australia, Dec. 2010–Jan. 2011
Severe storms, tornadoes USA, 22–28 April
Severe storms, tornadoes USA, 20–27 May
Wildfires USA, April/Sept.
Earthquake New Zealand, 13 June
Floods USA, April–May
Climatological events (extreme temperature, drought, wildfire)
Number of events: 820
Drought USA, Oct. 2010– ongoing
Hurricane Irene USA, Caribbean 22 Aug.–2 Sept.
Wildfires Canada, 14–22 May
Drought Somalia Oct. 2010–Sept. 2011
Floods Pakistan Aug.–Sept. Floods
Thailand Aug.–Nov.
Earthquake Turkey 23 Oct.
Flash floods, floods Italy, France, Spain 4–9 Nov.
Floods, landslides Guatemala, El Salvador 11–19 Oct.
Tropical Storm Washi Philippines, 16–18 Dec.
Winter Storm Joachim France, Switzerland, Germany, 15–17 Dec.
Global Natural Catastrophe Update
© 2011 Munich Re 37 Source: MR NatCatSERVICE
Natural Catastrophes 2011 World map
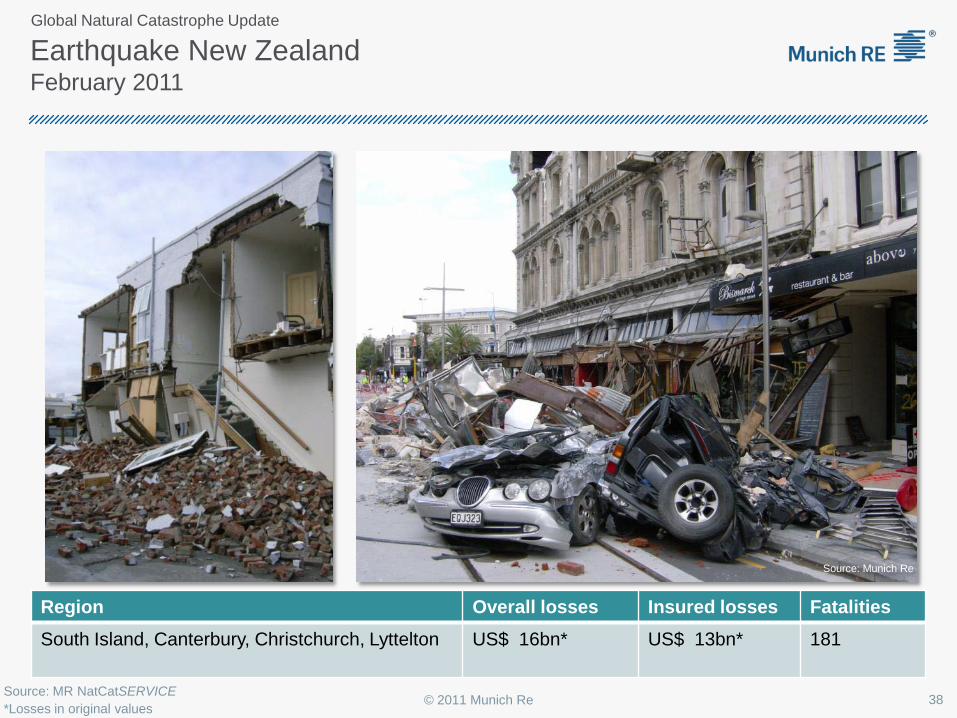
Earthquake New Zealand February 2011
Source: MR NatCatSERVICE *Losses in original values
Region Overall losses Insured losses Fatalities South Island, Canterbury, Christchurch, Lyttelton
US$ 16bn*
US$ 13bn*
181
Source: Munich Re
Global Natural Catastrophe Update
© 2011 Munich Re 38
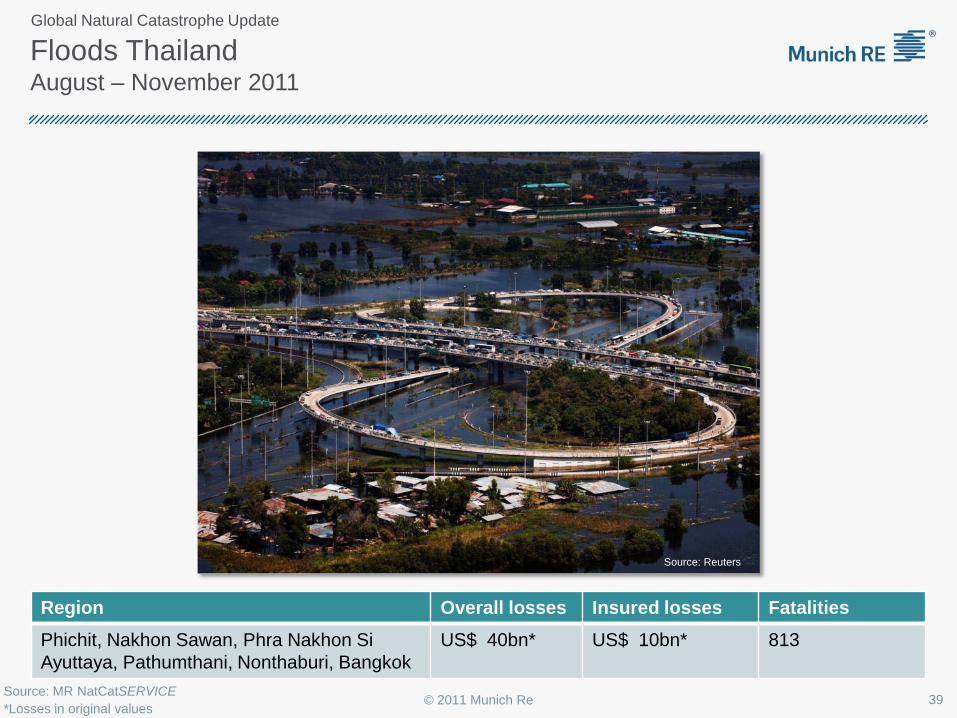
Floods Thailand August – November 2011
Region Overall losses Insured losses Fatalities Phichit, Nakhon Sawan, Phra Nakhon Si Ayuttaya, Pathumthani, Nonthaburi, Bangkok
US$ 40bn*
US$ 10bn*
813
Source: MR NatCatSERVICE *Losses in original values
Source: Reuters
Global Natural Catastrophe Update
© 2011 Munich Re 39
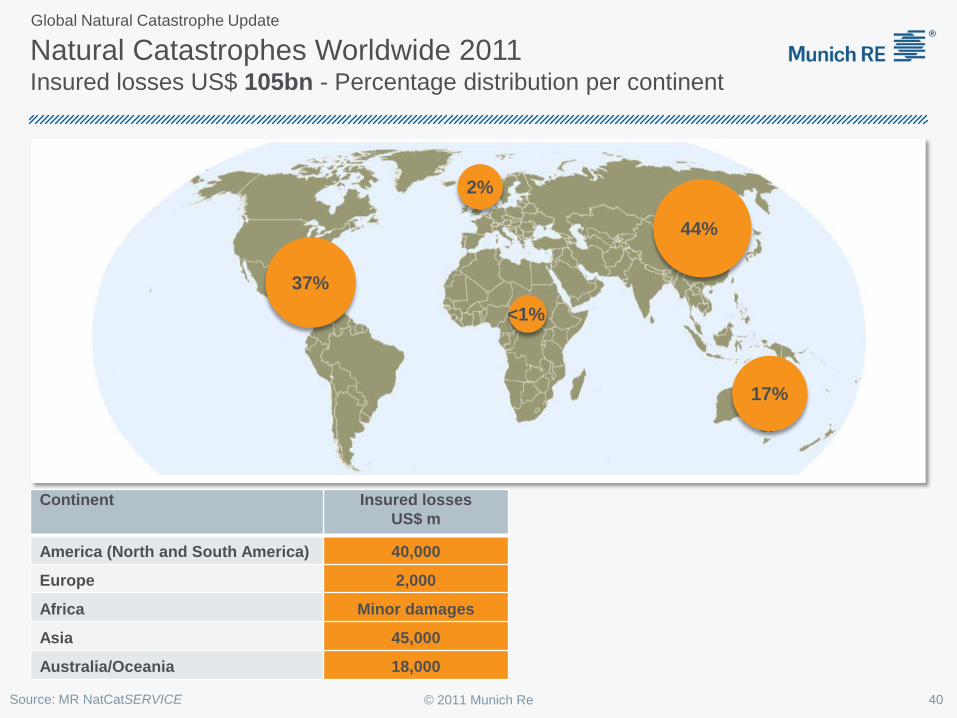
Natural Catastrophes Worldwide 2011 Insured losses US$ 105bn - Percentage distribution per continent
Continent Insured losses US$ m
America (North and South America) 40,000
Europe 2,000
Africa Minor damages
Asia 45,000
Australia/Oceania 18,000
37%
2%
44%
17%
<1%
Global Natural Catastrophe Update
© 2011 Munich Re 40 Source: MR NatCatSERVICE
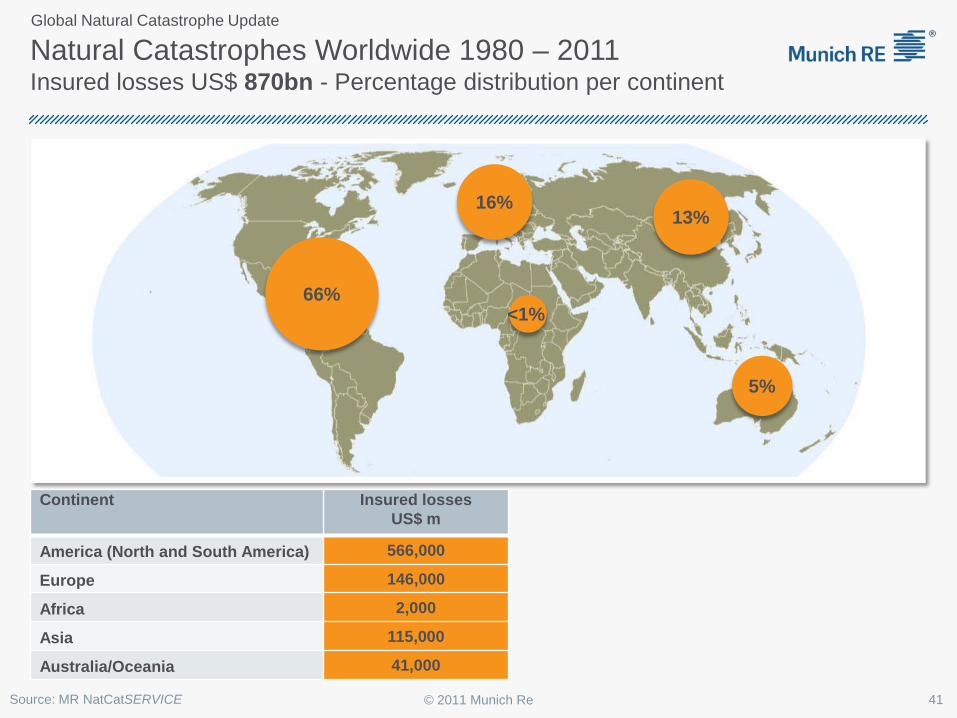
Natural Catastrophes Worldwide 1980 – 2011 Insured losses US$ 870bn - Percentage distribution per continent
Continent Insured losses US$ m
America (North and South America) 566,000
Europe 146,000
Africa 2,000
Asia 115,000
Australia/Oceania 41,000
66%
16%
<1%
13%
5%
Global Natural Catastrophe Update
© 2011 Munich Re 41 Source: MR NatCatSERVICE
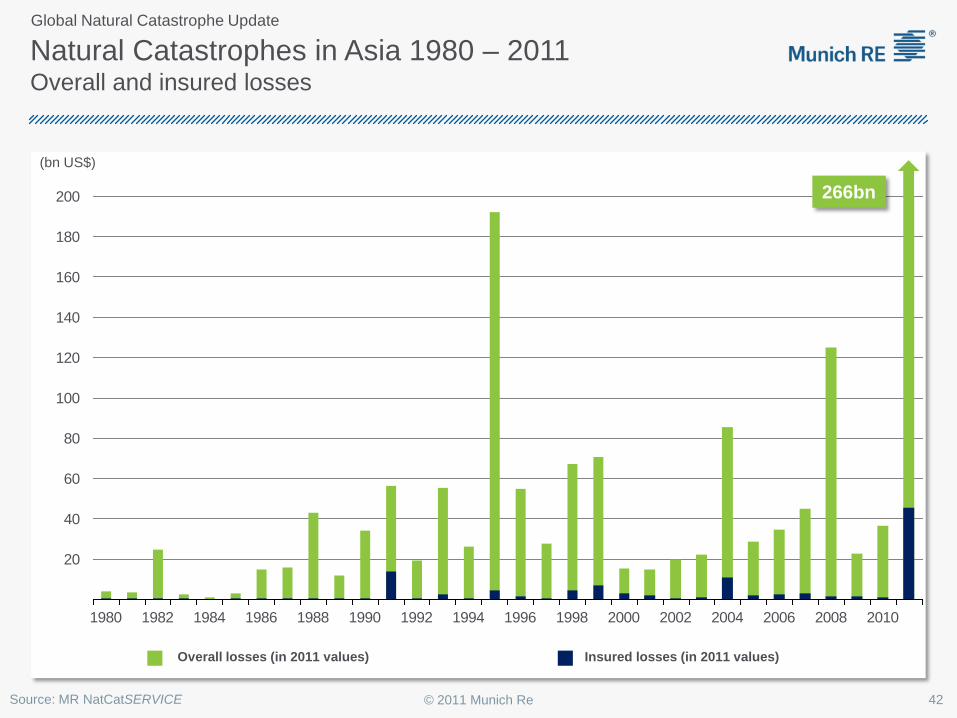
20
40
60
80
100
120
140
160
180
200
1980 1982 1984 1986 1988 1990 1992 1994 1996 1998 2000 2002 2004 2006 2008 2010
Natural Catastrophes in Asia 1980 – 2011 Overall and insured losses
(bn US$)
Overall losses (in 2011 values) Insured losses (in 2011 values)
266bn
Global Natural Catastrophe Update
© 2011 Munich Re 42 Source: MR NatCatSERVICE
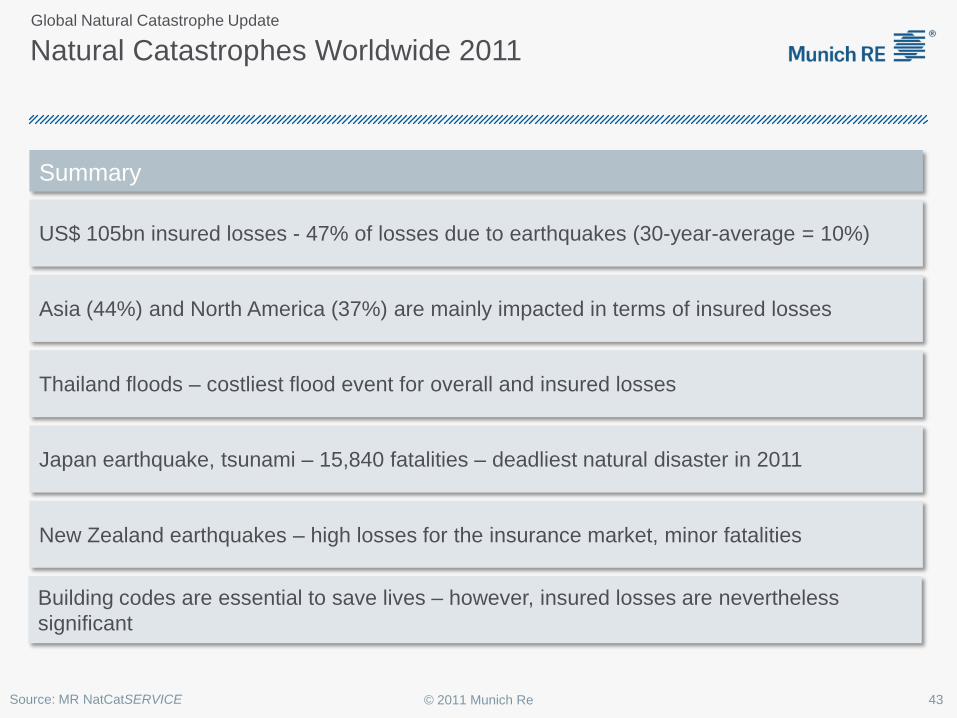
Natural Catastrophes Worldwide 2011
Summary
US$ 105bn insured losses - 47% of losses due to earthquakes (30-year-average = 10%)
Asia (44%) and North America (37%) are mainly impacted in terms of insured losses
Japan earthquake, tsunami – 15,840 fatalities – deadliest natural disaster in 2011
New Zealand earthquakes – high losses for the insurance market, minor fatalities
Thailand floods – costliest flood event for overall and insured losses
Building codes are essential to save lives – however, insured losses are nevertheless significant
Global Natural Catastrophe Update
© 2011 Munich Re 43 Source: MR NatCatSERVICE
Market and Financial Impact of 2011 Catastrophe Losses
Insurance Information Institute January 4, 2012
Robert P. Hartwig, Ph.D., CPCU, President & Economist Insurance Information Institute ♦ 110 William Street ♦ New York, NY 10038
Tel: 212.346.5520 ♦ Cell: 917.453.1885 ♦ [email protected] ♦ www.iii.org

45
2011: Nowhere to Run, Nowhere to Hide
Most of the Country East of the Rockies Suffered Severe Weather in 2011, Impacting
Most Insurers
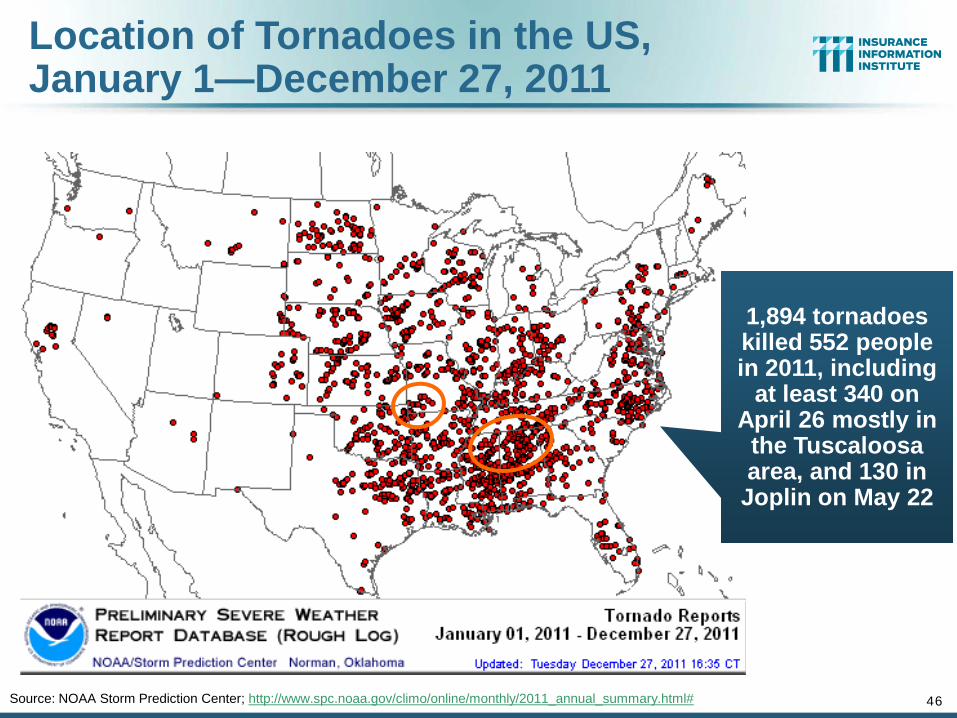
Location of Tornadoes in the US, January 1—December 27, 2011
Source: NOAA Storm Prediction Center; http://www.spc.noaa.gov/climo/online/monthly/2011_annual_summary.html# 46
1,894 tornadoes killed 552 people in 2011, including
at least 340 on April 26 mostly in
the Tuscaloosa area, and 130 in Joplin on May 22
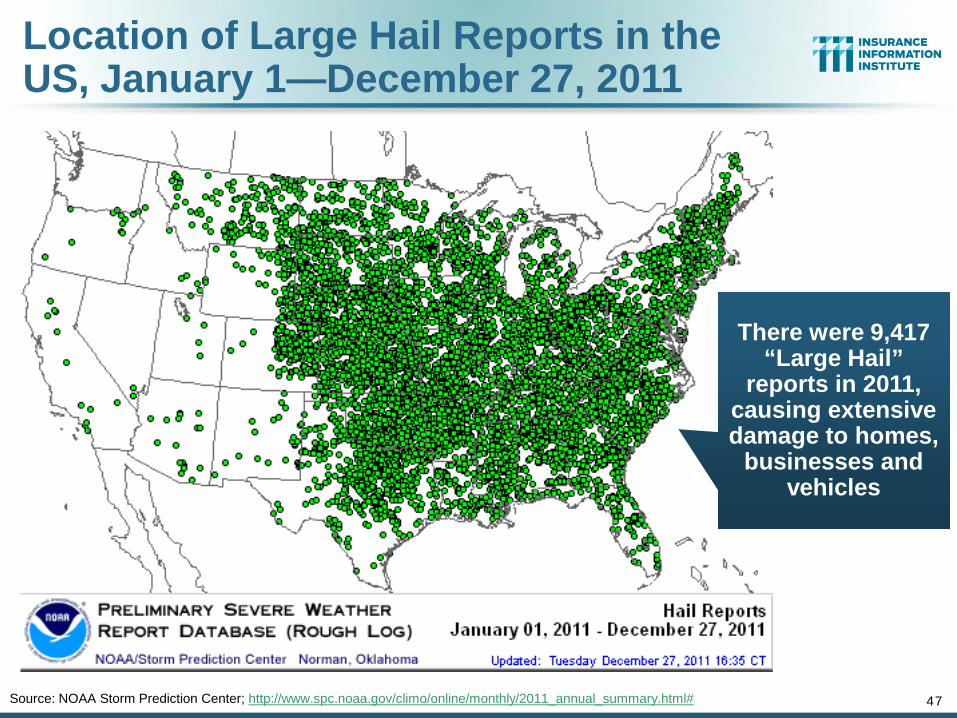
Location of Large Hail Reports in the US, January 1—December 27, 2011
Source: NOAA Storm Prediction Center; http://www.spc.noaa.gov/climo/online/monthly/2011_annual_summary.html# 47
There were 9,417 “Large Hail”
reports in 2011, causing extensive damage to homes,
businesses and vehicles
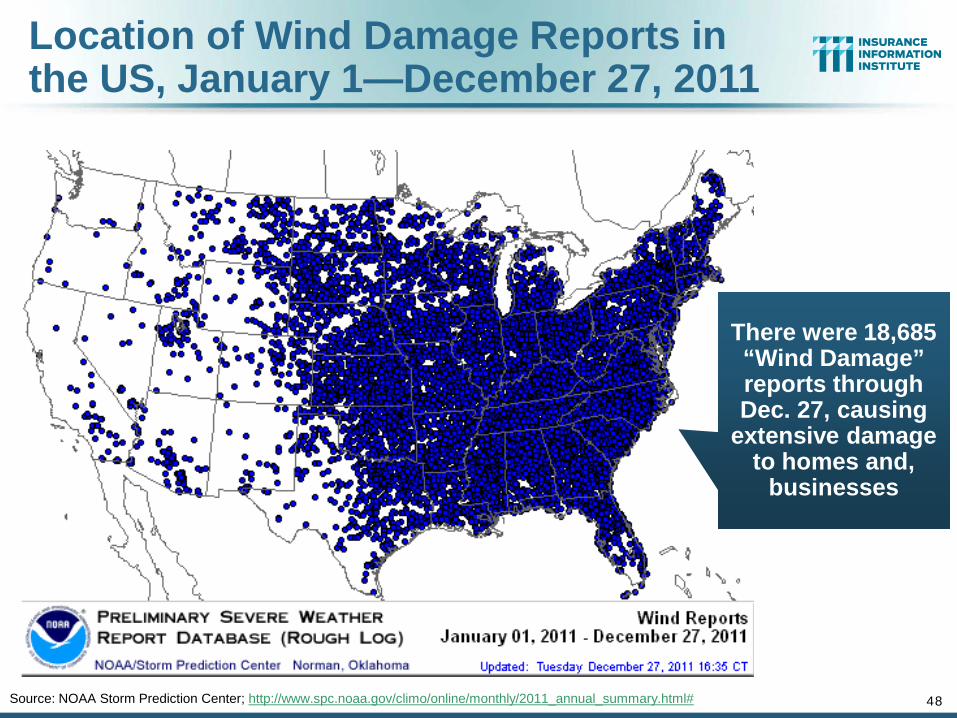
Location of Wind Damage Reports in the US, January 1—December 27, 2011
Source: NOAA Storm Prediction Center; http://www.spc.noaa.gov/climo/online/monthly/2011_annual_summary.html# 48
There were 18,685 “Wind Damage” reports through Dec. 27, causing
extensive damage to homes and,
businesses
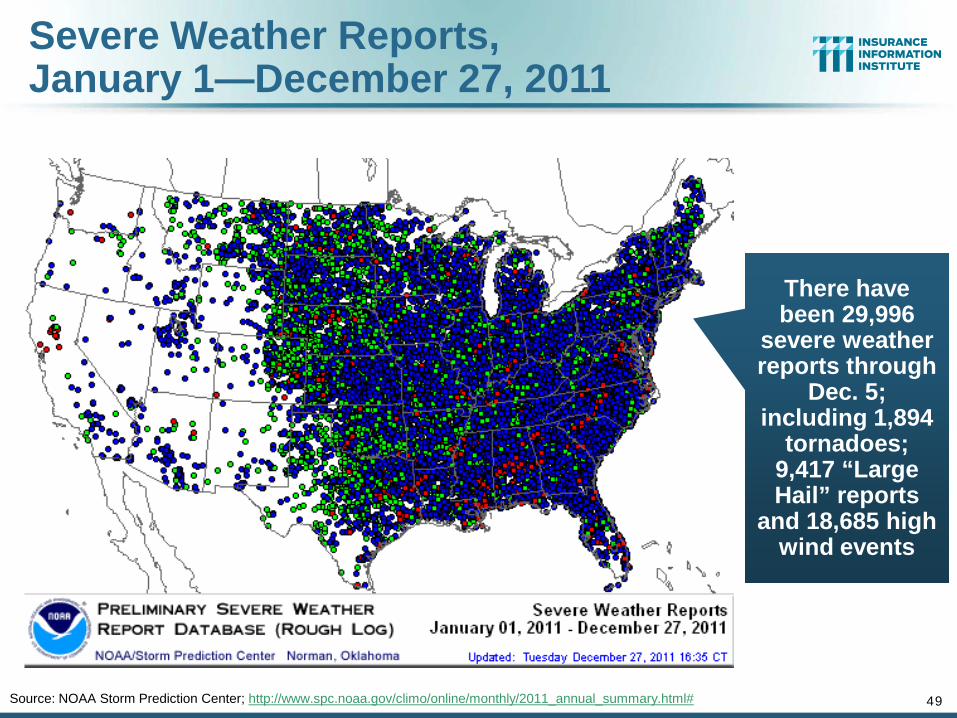
Severe Weather Reports, January 1—December 27, 2011
49 Source: NOAA Storm Prediction Center; http://www.spc.noaa.gov/climo/online/monthly/2011_annual_summary.html#
There have been 29,996
severe weather reports through
Dec. 5; including 1,894
tornadoes; 9,417 “Large Hail” reports
and 18,685 high wind events
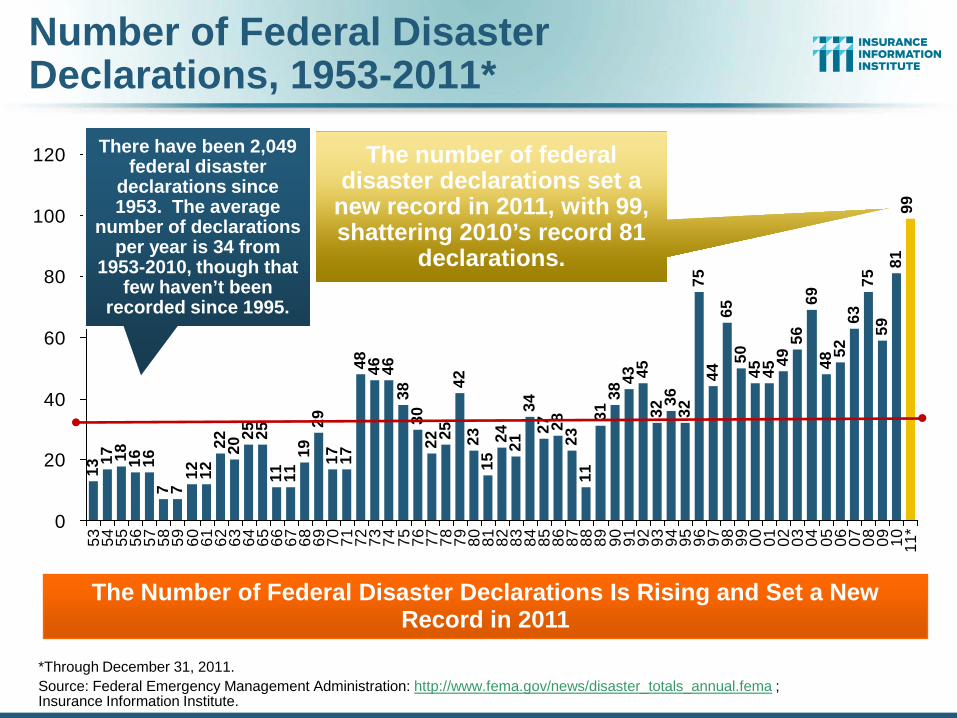
Number of Federal Disaster Declarations, 1953-2011*
1317 18 16 16
7 712 12
22 2025 25
11 1119
2917 17
48 46 4638
3022 25
4223
1524 21
3427 28
2311
3138
4532
3632
7544
6550
45 4549
5669
4852
6375
5981
99
43
0
20
40
60
80
100
120
53 54 55 56 57 58 59 60 61 62 63 64 65 66 67 68 69 70 71 72 73 74 75 76 77 78 79 80 81 82 83 84 85 86 87 88 89 90 91 92 93 94 95 96 97 98 99 00 01 02 03 04 05 06 07 08 09 10 11*
*Through December 31, 2011. Source: Federal Emergency Management Administration: http://www.fema.gov/news/disaster_totals_annual.fema ; Insurance Information Institute.
The Number of Federal Disaster Declarations Is Rising and Set a New Record in 2011
The number of federal disaster declarations set a
new record in 2011, with 99, shattering 2010’s record 81
declarations.
There have been 2,049 federal disaster
declarations since 1953. The average
number of declarations per year is 34 from
1953-2010, though that few haven’t been
recorded since 1995.
51
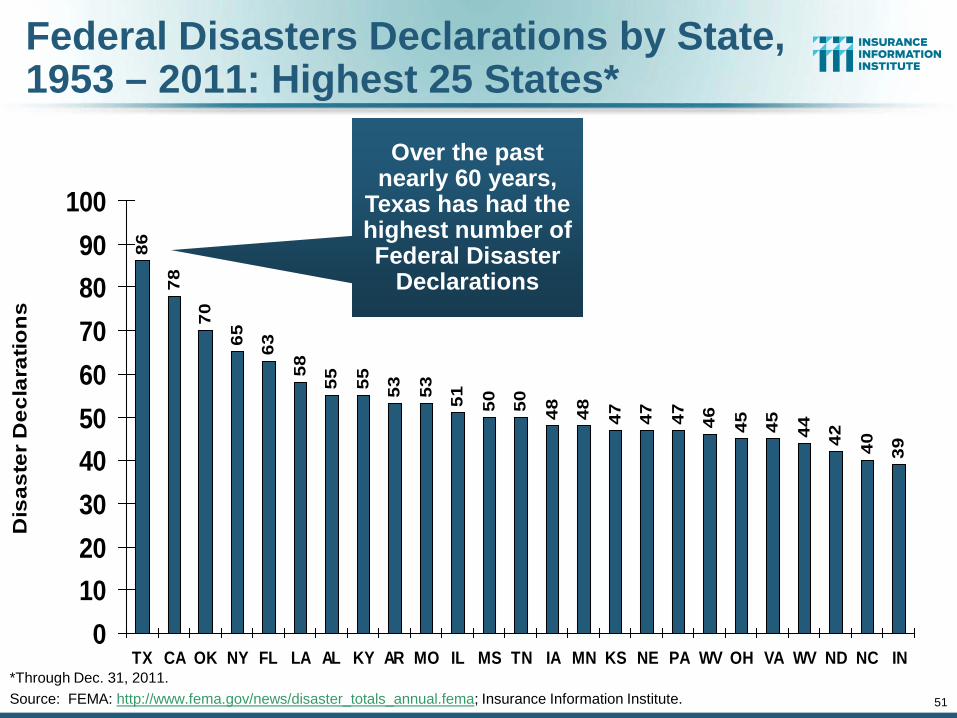
Federal Disasters Declarations by State, 1953 – 2011: Highest 25 States*
86
78
70
65 63
58
55 55 53 53 51 50 50 48 48 47 47 47 46 45 45 44 42 40 39
0102030405060708090
100
TX CA OK NY FL LA AL KY AR MO IL MS TN IA MN KS NE PA WV OH VA WV ND NC IN
Dis
aste
r D
ecla
ratio
ns
*Through Dec. 31, 2011. Source: FEMA: http://www.fema.gov/news/disaster_totals_annual.fema; Insurance Information Institute.
Over the past nearly 60 years,
Texas has had the highest number of Federal Disaster
Declarations
52
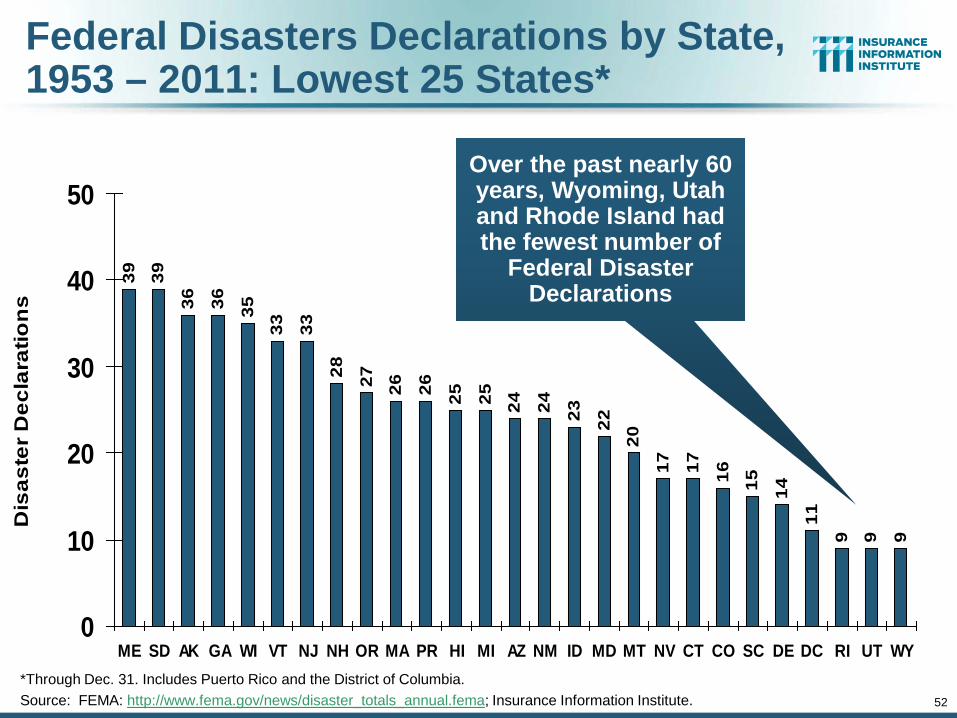
Federal Disasters Declarations by State, 1953 – 2011: Lowest 25 States*
39 39
36 36 35
33 33
28 27 26 26 25 25 24 24 23 22
20
17 17 16 15 14
11
9 9 9
0
10
20
30
40
50
ME SD AK GA WI VT NJ NH OR MA PR HI MI AZ NM ID MD MT NV CT CO SC DE DC RI UT WY
Dis
aste
r D
ecla
ratio
ns
*Through Dec. 31. Includes Puerto Rico and the District of Columbia. Source: FEMA: http://www.fema.gov/news/disaster_totals_annual.fema; Insurance Information Institute.
Over the past nearly 60 years, Wyoming, Utah and Rhode Island had the fewest number of
Federal Disaster Declarations
53
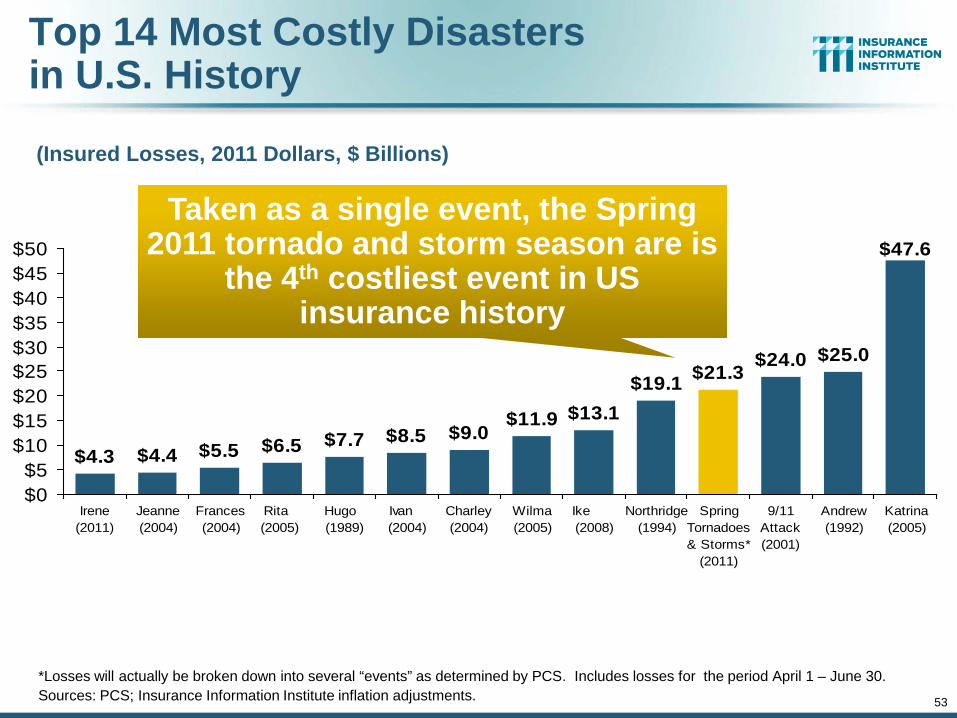
Top 14 Most Costly Disasters in U.S. History
(Insured Losses, 2011 Dollars, $ Billions)
*Losses will actually be broken down into several “events” as determined by PCS. Includes losses for the period April 1 – June 30. Sources: PCS; Insurance Information Institute inflation adjustments.
$9.0$11.9 $13.1
$19.1 $21.3 $24.0 $25.0
$47.6
$8.5$7.7$6.5$5.5$4.4$4.3
$0$5
$10$15$20$25$30$35$40$45$50
Irene(2011)
Jeanne(2004)
Frances(2004)
Rita (2005)
Hugo (1989)
Ivan (2004)
Charley(2004)
Wilma(2005)
Ike (2008)
Northridge(1994)
SpringTornadoes& Storms*
(2011)
9/11Attack(2001)
Andrew(1992)
Katrina(2005)
Taken as a single event, the Spring 2011 tornado and storm season are is
the 4th costliest event in US insurance history

54
P/C Insurance Industry Financial Overview
Profit Recovery Was Set Back in 2011 by High Catastrophe
Loss & Other Factors
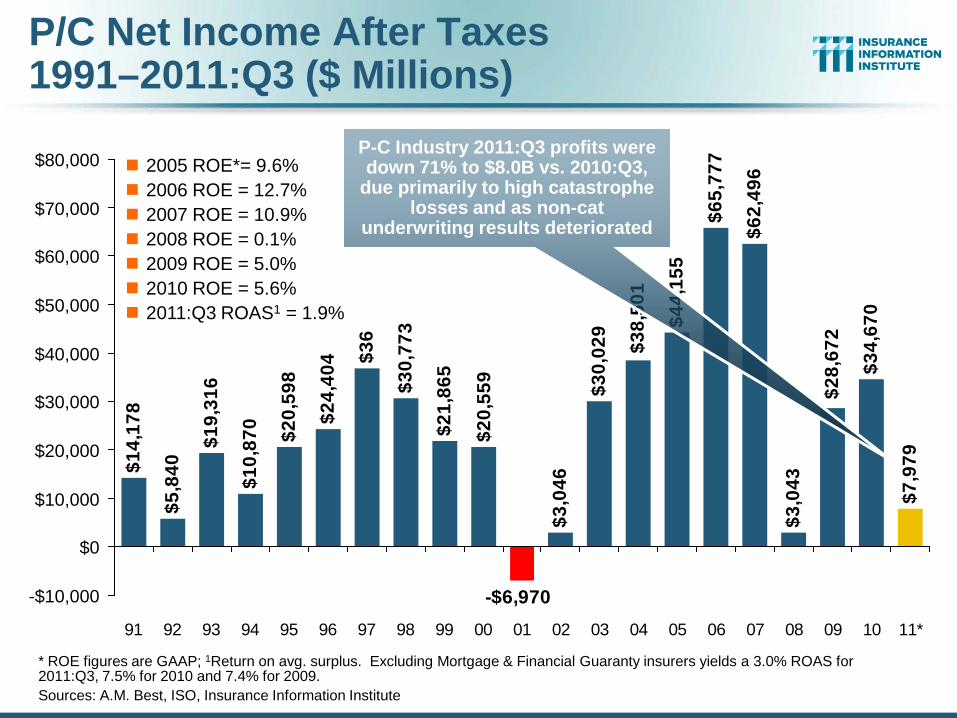
P/C Net Income After Taxes 1991–2011:Q3 ($ Millions)
$14,
178
$5,8
40
$19,
316
$10,
870 $20,
598
$24,
404 $3
6,81
9
$30,
773
$21,
865
$3,0
46
$30,
029
$62,
496
$3,0
43
$34,
670
$7,9
79
$28,
672
-$6,970
$65,
777
$44,
155
$20,
559
$38,
501
-$10,000
$0
$10,000
$20,000
$30,000
$40,000
$50,000
$60,000
$70,000
$80,000
91 92 93 94 95 96 97 98 99 00 01 02 03 04 05 06 07 08 09 10 11*
2005 ROE*= 9.6% 2006 ROE = 12.7% 2007 ROE = 10.9% 2008 ROE = 0.1% 2009 ROE = 5.0% 2010 ROE = 5.6% 2011:Q3 ROAS1 = 1.9%
P-C Industry 2011:Q3 profits were down 71% to $8.0B vs. 2010:Q3,
due primarily to high catastrophe losses and as non-cat
underwriting results deteriorated
* ROE figures are GAAP; 1Return on avg. surplus. Excluding Mortgage & Financial Guaranty insurers yields a 3.0% ROAS for 2011:Q3, 7.5% for 2010 and 7.4% for 2009. Sources: A.M. Best, ISO, Insurance Information Institute
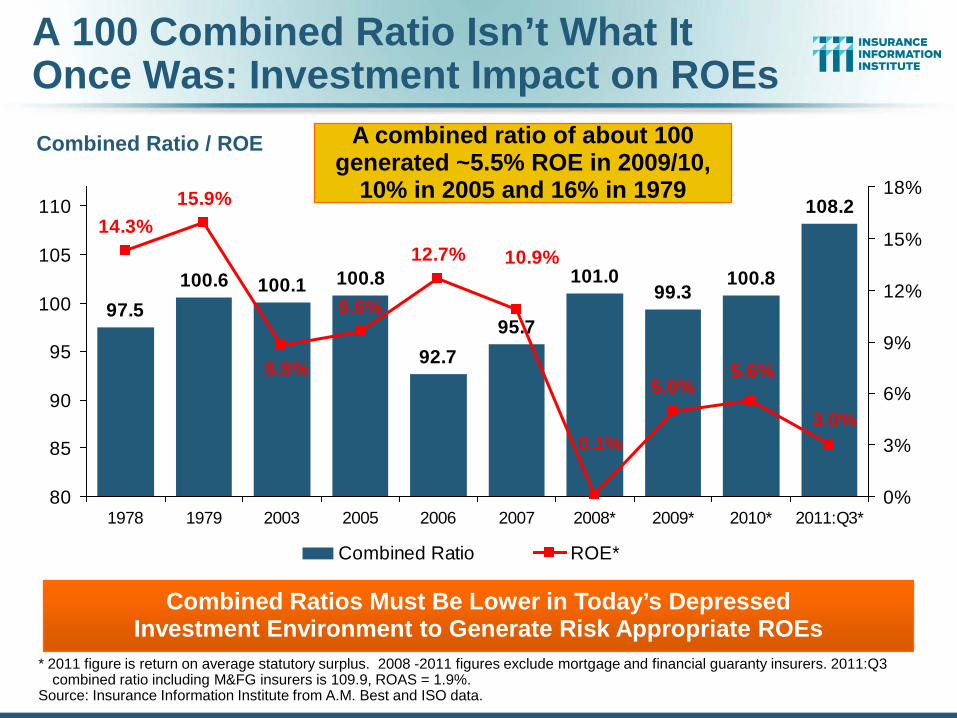
A 100 Combined Ratio Isn’t What It Once Was: Investment Impact on ROEs Combined Ratio / ROE
* 2011 figure is return on average statutory surplus. 2008 -2011 figures exclude mortgage and financial guaranty insurers. 2011:Q3 combined ratio including M&FG insurers is 109.9, ROAS = 1.9%.
Source: Insurance Information Institute from A.M. Best and ISO data.
97.5100.6 100.1 100.8
92.7
101.099.3
100.8
108.2
95.7
3.0%
5.6%5.0%
0.1%
9.6%
15.9%14.3%
12.7% 10.9%
8.8%
80
85
90
95
100
105
110
1978 1979 2003 2005 2006 2007 2008* 2009* 2010* 2011:Q3*0%
3%
6%
9%
12%
15%
18%
Combined Ratio ROE*
Combined Ratios Must Be Lower in Today’s Depressed Investment Environment to Generate Risk Appropriate ROEs
A combined ratio of about 100 generated ~5.5% ROE in 2009/10,
10% in 2005 and 16% in 1979
-5%
0%
5%
10%
15%
20%
25%
75 76 77 78 79 80 81 82 83 84 85 86 87 88 89 90 91 92 93 94 95 96 97 98 99 00 01 02 03 04 05 06 07 08 09 10 11*
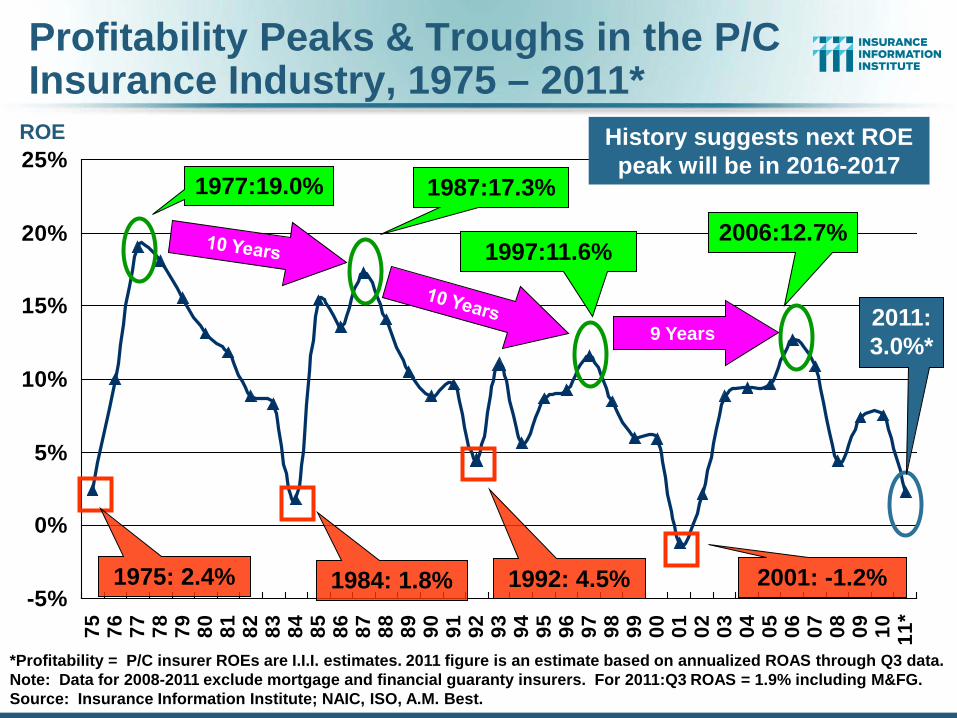
Profitability Peaks & Troughs in the P/C Insurance Industry, 1975 – 2011*
*Profitability = P/C insurer ROEs are I.I.I. estimates. 2011 figure is an estimate based on annualized ROAS through Q3 data. Note: Data for 2008-2011 exclude mortgage and financial guaranty insurers. For 2011:Q3 ROAS = 1.9% including M&FG. Source: Insurance Information Institute; NAIC, ISO, A.M. Best.
1977:19.0% 1987:17.3%
1997:11.6% 2006:12.7%
1984: 1.8% 1992: 4.5% 2001: -1.2%
9 Years 2011:3.0%*
History suggests next ROE peak will be in 2016-2017
ROE
1975: 2.4%
58
-5%
0%
5%
10%
15%
20%
25%
71 72 73 74 75 76 77 78 79 80 81 82 83 84 85 86 87 88 89 90 91 92 93 94 95 96 97 98 99 00 01 02 03 04 05 06 07 08 09 10 11*
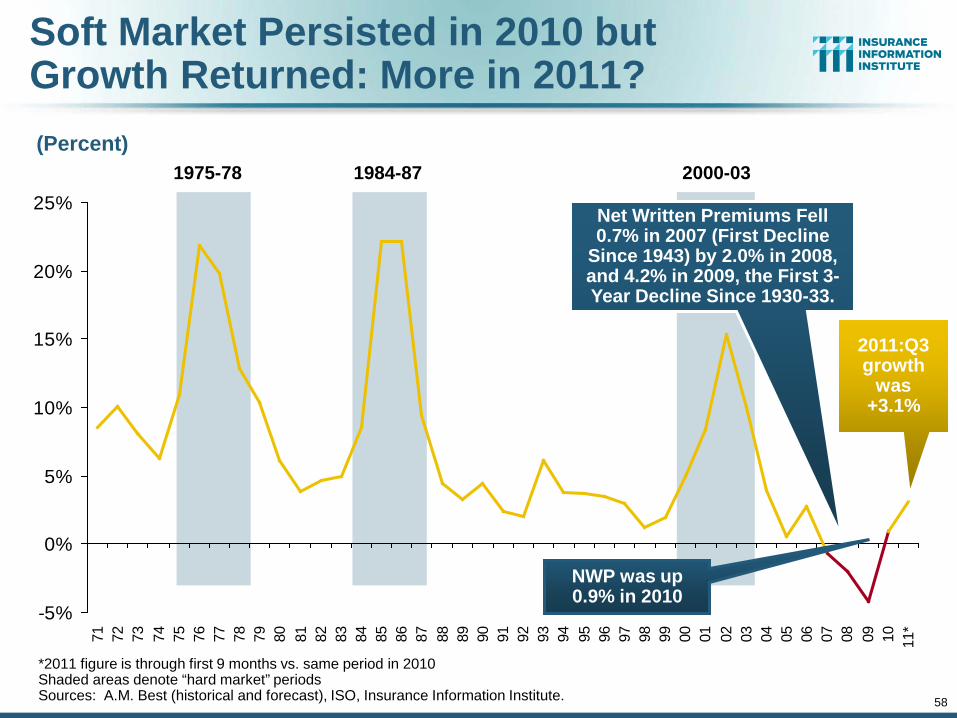
Soft Market Persisted in 2010 but Growth Returned: More in 2011? (Percent)
1975-78 1984-87 2000-03
*2011 figure is through first 9 months vs. same period in 2010 Shaded areas denote “hard market” periods Sources: A.M. Best (historical and forecast), ISO, Insurance Information Institute.
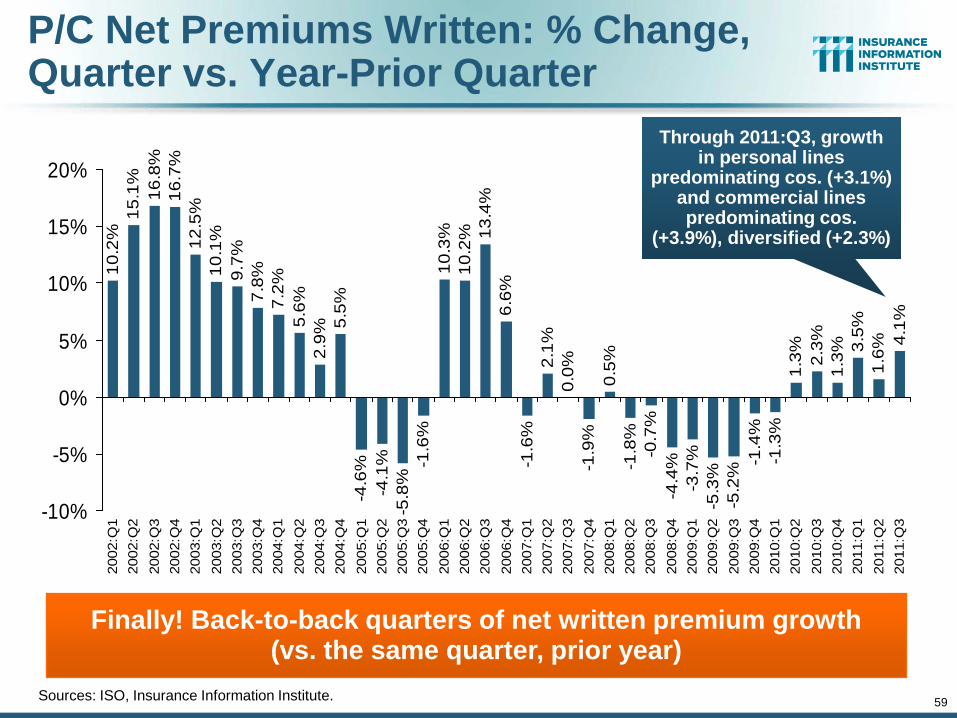
Net Written Premiums Fell 0.7% in 2007 (First Decline
Since 1943) by 2.0% in 2008, and 4.2% in 2009, the First 3-Year Decline Since 1930-33.
NWP was up 0.9% in 2010
2011:Q3 growth
was +3.1%
59
P/C Net Premiums Written: % Change, Quarter vs. Year-Prior Quarter
Sources: ISO, Insurance Information Institute.
Finally! Back-to-back quarters of net written premium growth (vs. the same quarter, prior year)
10.2
%15
.1%
16.8
%16
.7%
12.5
%10
.1%
9.7%
7.8%
7.2%
5.6%
2.9%
5.5%
-4.6
%-4
.1%
-5.8
%-1
.6%
10.3
%10
.2% 13
.4%
6.6%
-1.6
%2.
1%0.
0%-1
.9%
0.5%
-1.8
%-0
.7%
-4.4
%-3
.7%
-5.3
%-5
.2%
-1.4
%-1
.3%
1.3% 2.
3%1.
3% 3.5%
1.6%
4.1%
-10%
-5%
0%
5%
10%
15%
20%
2002
:Q1
2002
:Q2
2002
:Q3
2002
:Q4
2003
:Q1
2003
:Q2
2003
:Q3
2003
:Q4
2004
:Q1
2004
:Q2
2004
:Q3
2004
:Q4
2005
:Q1
2005
:Q2
2005
:Q3
2005
:Q4
2006
:Q1
2006
:Q2
2006
:Q3
2006
:Q4
2007
:Q1
2007
:Q2
2007
:Q3
2007
:Q4
2008
:Q1
2008
:Q2
2008
:Q3
2008
:Q4
2009
:Q1
2009
:Q2
2009
:Q3
2009
:Q4
2010
:Q1
2010
:Q2
2010
:Q3
2010
:Q4
2011
:Q1
2011
:Q2
2011
:Q3
Through 2011:Q3, growth in personal lines
predominating cos. (+3.1%) and commercial lines predominating cos.
(+3.9%), diversified (+2.3%)
60
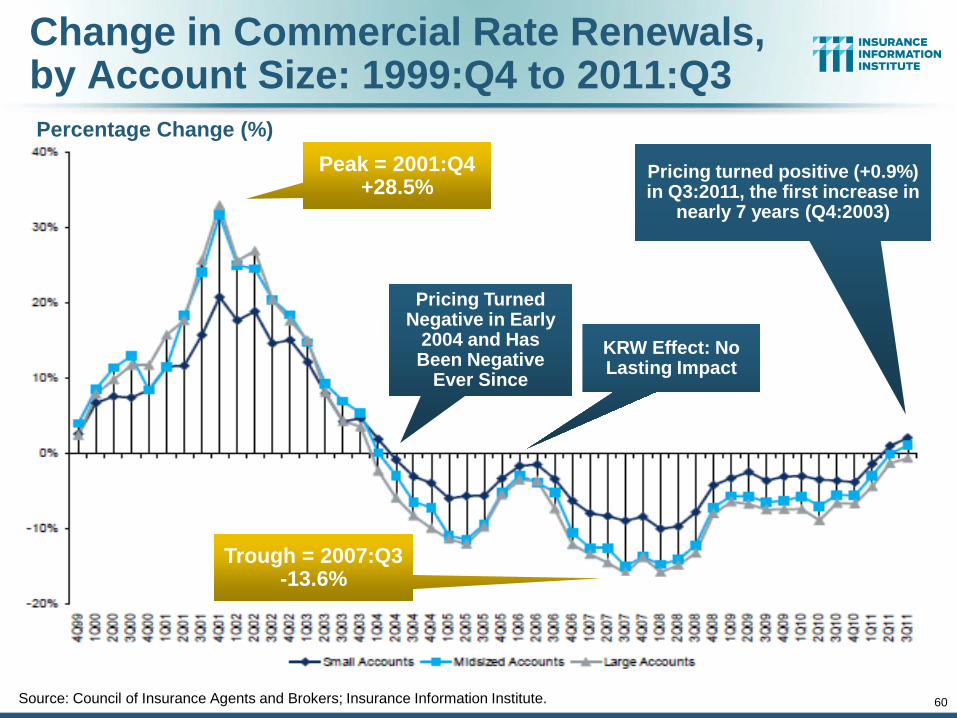
Change in Commercial Rate Renewals, by Account Size: 1999:Q4 to 2011:Q3
Source: Council of Insurance Agents and Brokers; Insurance Information Institute.
Percentage Change (%) Peak = 2001:Q4
+28.5%
Pricing Turned Negative in Early
2004 and Has Been Negative
Ever Since
Pricing turned positive (+0.9%) in Q3:2011, the first increase in
nearly 7 years (Q4:2003)
KRW Effect: No Lasting Impact
Trough = 2007:Q3 -13.6%
61
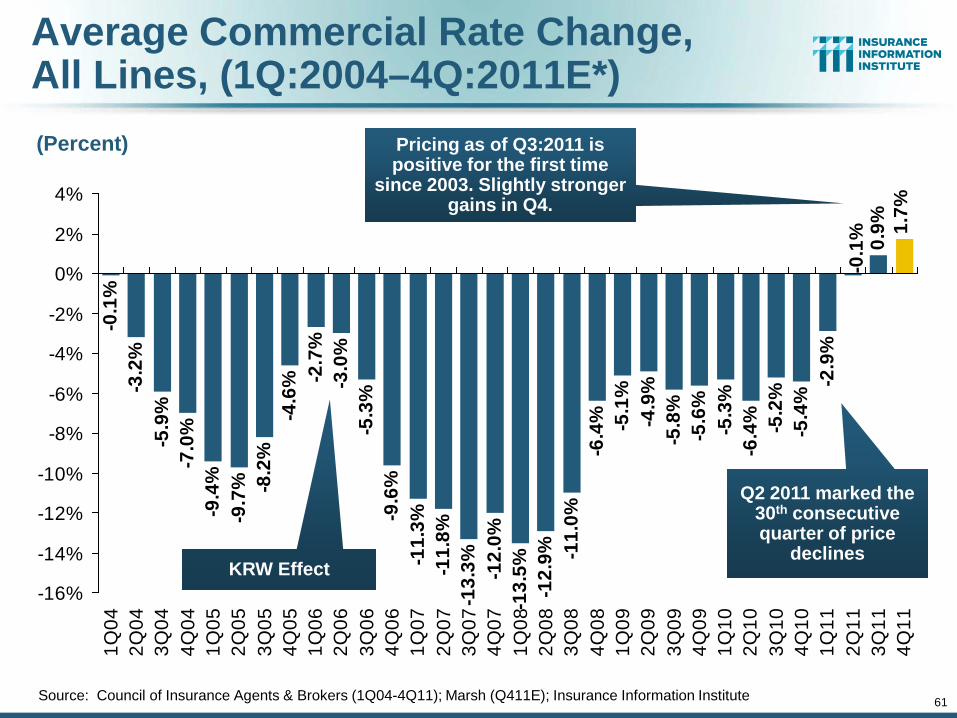
Average Commercial Rate Change, All Lines, (1Q:2004–4Q:2011E*)
-3.2
%-5
.9%
-7.0
%-9
.4%
-9.7
% -8.2
%-4
.6% -2
.7%
-3.0
%-5
.3%
-9.6
%-1
1.3%
-11.
8%-1
3.3% -12.
0%-1
3.5%
-12.
9% -11.
0%-6
.4% -5.1
%-4
.9%
-5.8
%-5
.6%
-5.3
%-6
.4% -5.2
%-5
.4%
-2.9
%
1.7%
-0.1
% 0.9%
-0.1
%
-16%
-14%
-12%
-10%
-8%
-6%
-4%
-2%
0%
2%
4%
1Q04
2Q04
3Q04
4Q04
1Q05
2Q05
3Q05
4Q05
1Q06
2Q06
3Q06
4Q06
1Q07
2Q07
3Q07
4Q07
1Q08
2Q08
3Q08
4Q08
1Q09
2Q09
3Q09
4Q09
1Q10
2Q10
3Q10
4Q10
1Q11
2Q11
3Q11
4Q11
Source: Council of Insurance Agents & Brokers (1Q04-4Q11); Marsh (Q411E); Insurance Information Institute
KRW Effect
Pricing as of Q3:2011 is positive for the first time
since 2003. Slightly stronger gains in Q4.
(Percent)
Q2 2011 marked the 30th consecutive quarter of price
declines
62
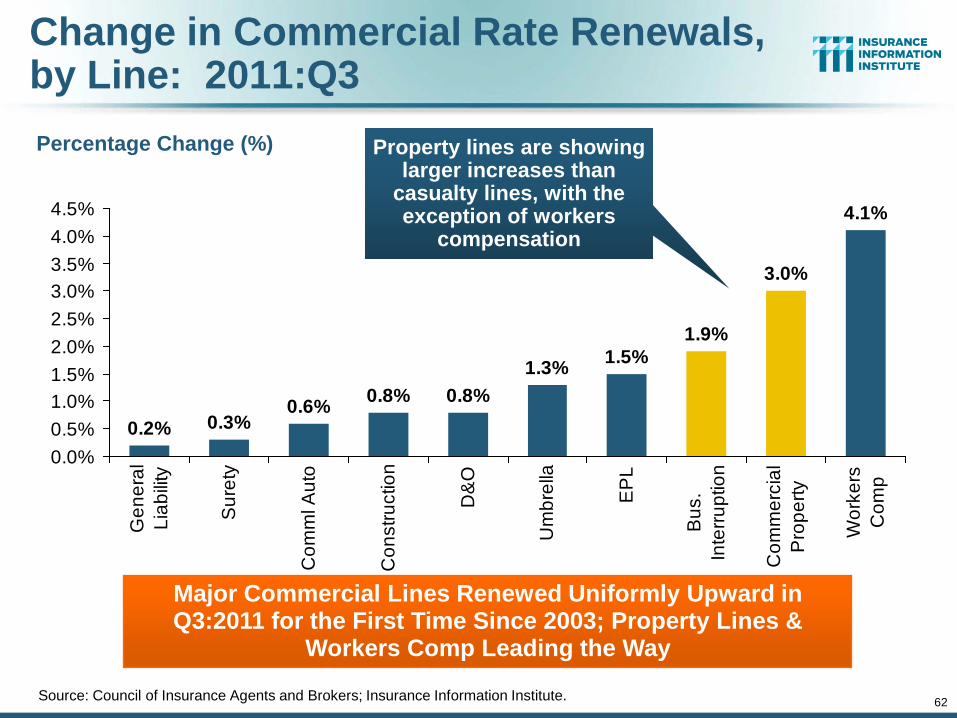
Change in Commercial Rate Renewals, by Line: 2011:Q3
Source: Council of Insurance Agents and Brokers; Insurance Information Institute.
Major Commercial Lines Renewed Uniformly Upward in Q3:2011 for the First Time Since 2003; Property Lines &
Workers Comp Leading the Way
Percentage Change (%)
1.5%1.9%
3.0%
4.1%
0.2% 0.3%0.6% 0.8% 0.8%
1.3%
0.0%0.5%1.0%1.5%2.0%2.5%3.0%3.5%4.0%4.5%
Gen
eral
Liab
ility
Sur
ety
Com
ml A
uto
Con
stru
ctio
n
D&
O
Um
brel
la
EP
L
Bus
.In
terru
ptio
n
Com
mer
cial
Pro
perty
Wor
kers
Com
p
Property lines are showing larger increases than
casualty lines, with the exception of workers
compensation
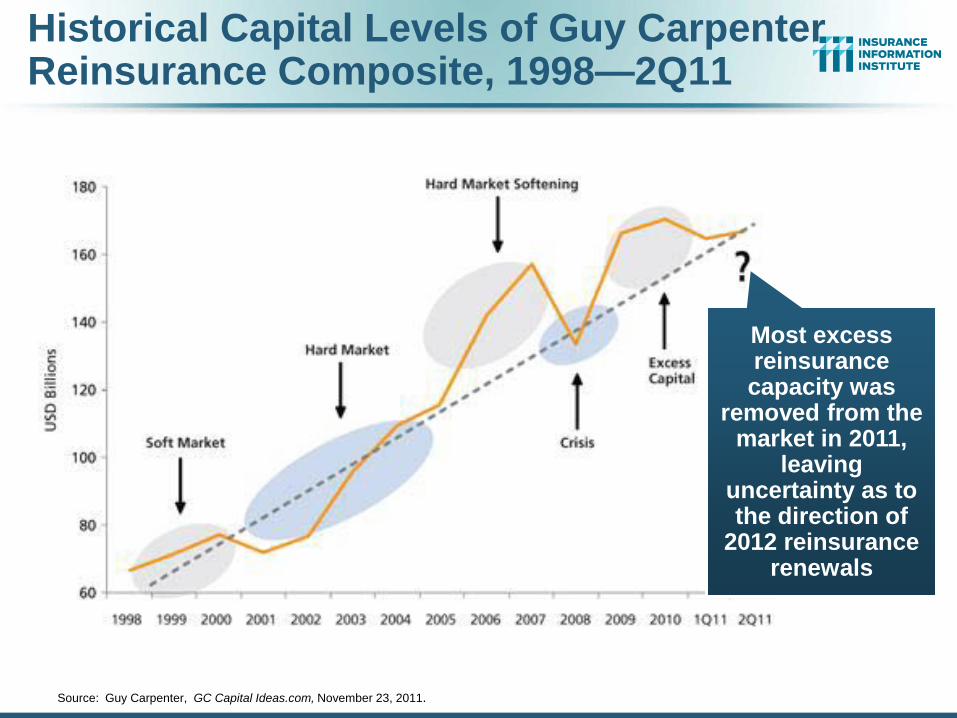
Source: Guy Carpenter, GC Capital Ideas.com, November 23, 2011.
Most excess reinsurance capacity was
removed from the market in 2011,
leaving uncertainty as to the direction of
2012 reinsurance renewals
Historical Capital Levels of Guy Carpenter Reinsurance Composite, 1998—2Q11

UNDERWRITING
64
Catastrophes Will Lead Insurers their Largest
Underwriting Loss in a Decade
65
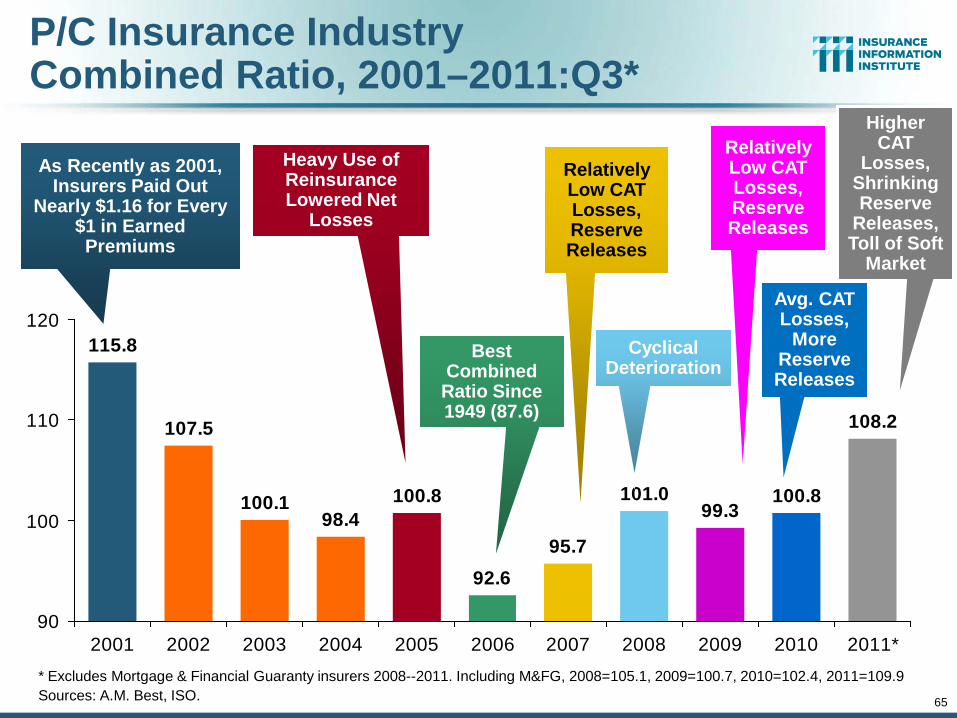
P/C Insurance Industry Combined Ratio, 2001–2011:Q3*
* Excludes Mortgage & Financial Guaranty insurers 2008--2011. Including M&FG, 2008=105.1, 2009=100.7, 2010=102.4, 2011=109.9 Sources: A.M. Best, ISO.
95.7
99.3100.8
108.2
101.0
92.6
100.898.4
100.1
107.5
115.8
90
100
110
120
2001 2002 2003 2004 2005 2006 2007 2008 2009 2010 2011*
Best Combined Ratio Since 1949 (87.6)
As Recently as 2001, Insurers Paid Out
Nearly $1.16 for Every $1 in Earned Premiums
Relatively Low CAT Losses, Reserve Releases
Cyclical Deterioration
Heavy Use of Reinsurance Lowered Net
Losses
Relatively Low CAT Losses, Reserve Releases
Avg. CAT Losses,
More Reserve Releases
Higher CAT
Losses, Shrinking Reserve
Releases, Toll of Soft
Market
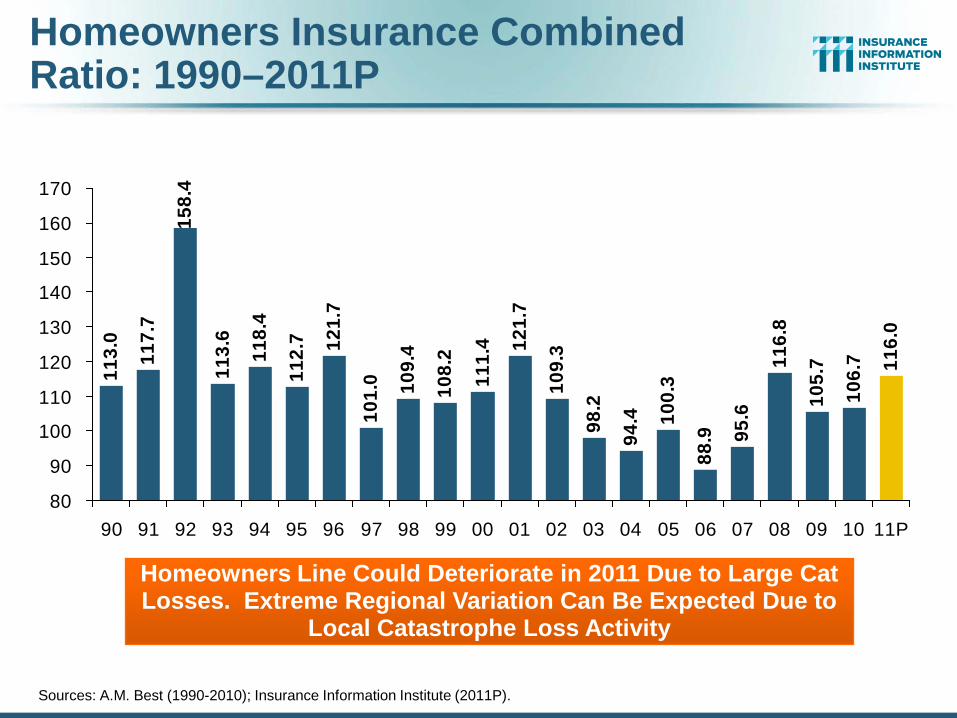
Homeowners Insurance Combined Ratio: 1990–2011P
113.
0
117.
7
158.
4
113.
6
101.
0 109.
4
108.
2
111.
4 121.
7
109.
3
98.2
94.4 10
0.3
88.9 95
.6
116.
8
105.
7
106.
7 116.
0
118.
4
112.
7 121.
7
80
90
100
110
120
130
140
150
160
170
90 91 92 93 94 95 96 97 98 99 00 01 02 03 04 05 06 07 08 09 10 11P
Homeowners Line Could Deteriorate in 2011 Due to Large Cat Losses. Extreme Regional Variation Can Be Expected Due to
Local Catastrophe Loss Activity
Sources: A.M. Best (1990-2010); Insurance Information Institute (2011P).
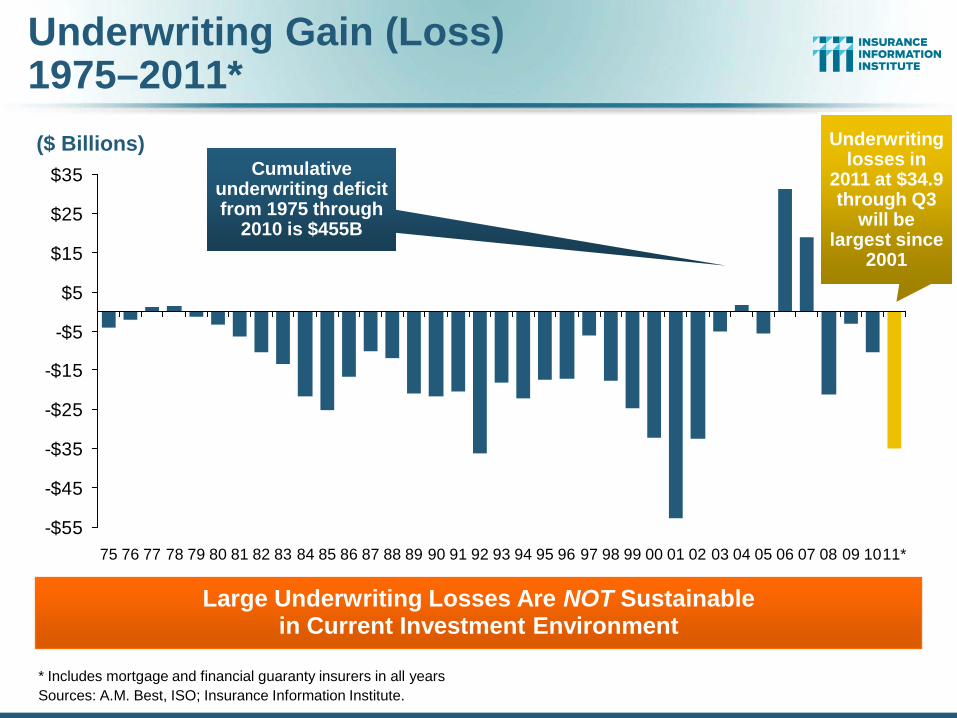
Underwriting Gain (Loss) 1975–2011*
* Includes mortgage and financial guaranty insurers in all years Sources: A.M. Best, ISO; Insurance Information Institute.
Large Underwriting Losses Are NOT Sustainable in Current Investment Environment
-$55
-$45
-$35
-$25
-$15
-$5
$5
$15
$25
$35
75 76 77 78 79 80 81 82 83 84 85 86 87 88 89 90 91 92 93 94 95 96 97 98 99 00 01 02 03 04 05 06 07 08 09 1011*
Cumulative underwriting deficit from 1975 through
2010 is $455B
($ Billions) Underwriting losses in
2011 at $34.9 through Q3
will be largest since
2001
68
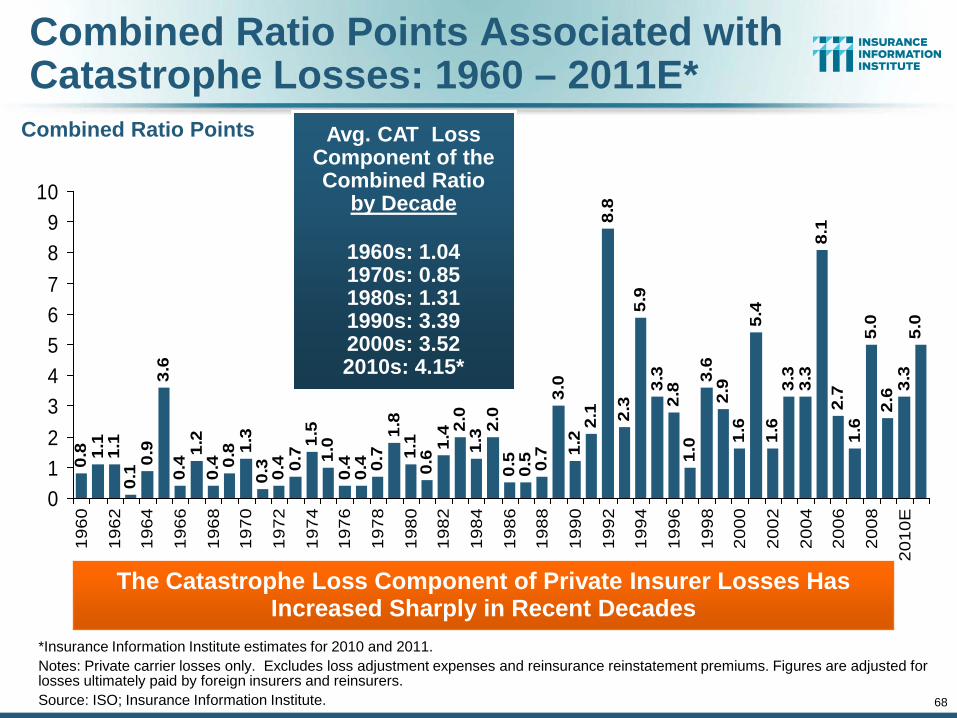
Combined Ratio Points Associated with Catastrophe Losses: 1960 – 2011E*
*Insurance Information Institute estimates for 2010 and 2011. Notes: Private carrier losses only. Excludes loss adjustment expenses and reinsurance reinstatement premiums. Figures are adjusted for losses ultimately paid by foreign insurers and reinsurers. Source: ISO; Insurance Information Institute.
0.4 1.
20.
4 0.8 1.
30.
30.
4 0.7 1.
51.
00.
40.
4 0.7
1.8
1.1
0.6 1.
4 2.0
1.3 2.
00.
50.
5 0.7
3.0
1.2
2.1
8.8
2.3
5.9
3.3
2.8
1.0
3.6
2.9
1.6
5.4
1.6
3.3
3.3
8.1
2.7
1.6
5.0
2.6 3.
35.
0
3.6
0.9
0.1
1.1
1.1
0.8
0123456789
10
1960
1962
1964
1966
1968
1970
1972
1974
1976
1978
1980
1982
1984
1986
1988
1990
1992
1994
1996
1998
2000
2002
2004
2006
2008
2010
E
The Catastrophe Loss Component of Private Insurer Losses Has Increased Sharply in Recent Decades
Avg. CAT Loss Component of the Combined Ratio
by Decade
1960s: 1.04 1970s: 0.85 1980s: 1.31 1990s: 3.39 2000s: 3.52 2010s: 4.15*
Combined Ratio Points

Financial Strength & Underwriting
69
Cyclical Pattern in P-C Impairment History is Directly Tied to
Underwriting, Reserving & Pricing
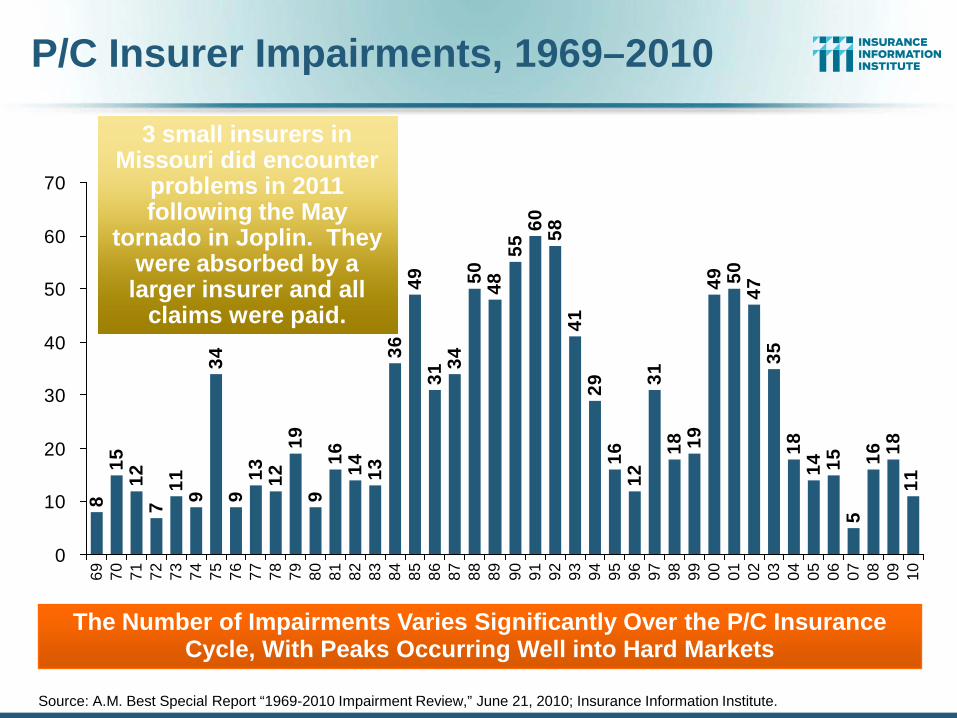
P/C Insurer Impairments, 1969–2010 8
1512
711 9
349
13 1219
916 14 13
3649
3134
50 4855
60 5841
2916
1231
18 1949 50
4735
1814 15 16 18
11
5
0
10
20
30
40
50
60
70
69 70 71 72 73 74 75 76 77 78 79 80 81 82 83 84 85 86 87 88 89 90 91 92 93 94 95 96 97 98 99 00 01 02 03 04 05 06 07 08 09 10
Source: A.M. Best Special Report “1969-2010 Impairment Review,” June 21, 2010; Insurance Information Institute.
The Number of Impairments Varies Significantly Over the P/C Insurance Cycle, With Peaks Occurring Well into Hard Markets
3 small insurers in Missouri did encounter
problems in 2011 following the May
tornado in Joplin. They were absorbed by a
larger insurer and all claims were paid.
71
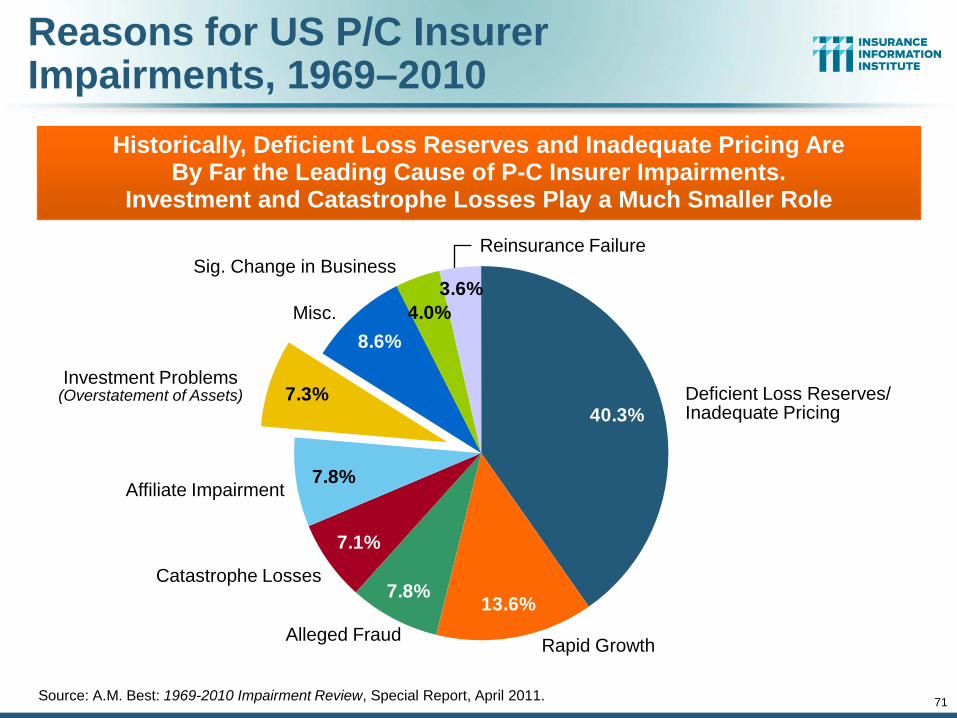
Reasons for US P/C Insurer Impairments, 1969–2010
3.6%4.0%
8.6%
7.3%
7.8%
7.1%
7.8% 13.6%
40.3%
Source: A.M. Best: 1969-2010 Impairment Review, Special Report, April 2011.
Historically, Deficient Loss Reserves and Inadequate Pricing Are By Far the Leading Cause of P-C Insurer Impairments.
Investment and Catastrophe Losses Play a Much Smaller Role
Deficient Loss Reserves/ Inadequate Pricing
Reinsurance Failure
Rapid Growth Alleged Fraud
Catastrophe Losses
Affiliate Impairment
Investment Problems (Overstatement of Assets)
Misc.
Sig. Change in Business

SURPLUS/CAPITAL/CAPACITY
72
Have Large Global Losses Reduced Capacity in the Industry, Setting
the Stage for a Market Turn?
73
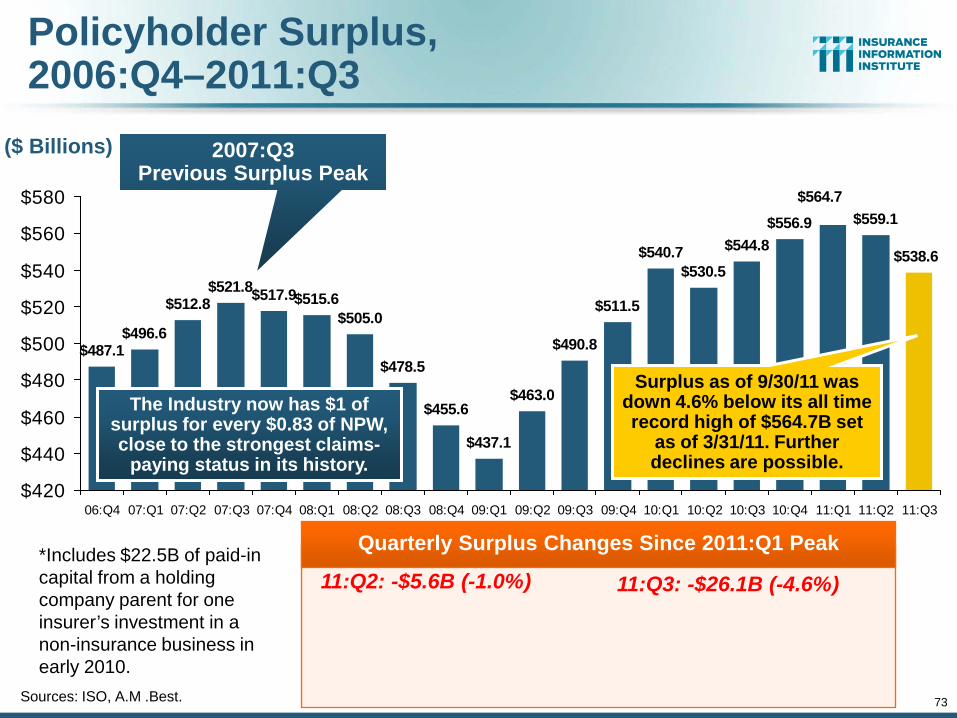
Policyholder Surplus, 2006:Q4–2011:Q3
Sources: ISO, A.M .Best.
($ Billions)
$487.1$496.6
$512.8$521.8
$478.5
$455.6
$437.1
$463.0
$490.8
$511.5
$540.7$530.5
$544.8$556.9 $559.1
$538.6
$564.7
$505.0$515.6$517.9
$420
$440
$460
$480
$500
$520
$540
$560
$580
06:Q4 07:Q1 07:Q2 07:Q3 07:Q4 08:Q1 08:Q2 08:Q3 08:Q4 09:Q1 09:Q2 09:Q3 09:Q4 10:Q1 10:Q2 10:Q3 10:Q4 11:Q1 11:Q2 11:Q3
2007:Q3 Previous Surplus Peak
Quarterly Surplus Changes Since 2011:Q1 Peak
11:Q2: -$5.6B (-1.0%)
11:Q3: -$26.1B (-4.6%)
Surplus as of 9/30/11 was down 4.6% below its all time record high of $564.7B set
as of 3/31/11. Further declines are possible.
*Includes $22.5B of paid-in capital from a holding company parent for one insurer’s investment in a non-insurance business in early 2010.
The Industry now has $1 of surplus for every $0.83 of NPW, close to the strongest claims-
paying status in its history.

www.iii.org
Thank you for your time and your attention!
Twitter: twitter.com/bob_hartwig Download at www.iii.org/presentations
Insurance Information Institute Online:

More Information
Press Inquiries Terese Rosenthal Phone: 609.243.4339 E-mail: [email protected]
© 2011 Munich Re 75

More Information
Connect with Munich Re Connect with the I.I.I.
Twitter @Munichre_US @Munichre
@iiiorg
LinkedIn munich-reinsurance-america-inc. Insurance Information Institute
Google+ Munich Re (US) Munich Re
Insurance Information Institute
YouTube MunichReUs MunichReVideo
iiivideo
Facebook InsuranceInformationInstitute
Flickr iiiorg
© 2011 Munich Re 76

THANK YOU FOR ATTENDING TODAY’S WEBINAR.
© Copyright 2012 Munich Reinsurance America, Inc. All rights reserved. "Munich Re" and the Munich Re logo are internationally protected registered trademarks. The material in this presentation is provided for your information only, and is not permitted to be further distributed without the express written permission of Munich Reinsurance America, Inc. or Munich Re. This material is not intended to be legal, underwriting, financial, or any other type of professional advice. Examples given are for illustrative purposes only. Each reader should consult an attorney and other appropriate advisors to determine the applicability of any particular contract language to the reader's specific circumstances.