Embed Size (px)
Citation preview
DISCLAIMER Reference herein to any specific commercial product, process, or service by trade name, trademark, manufacturer, or otherwise, does not necessarily constitute or imply its endorsement, recommendation, or favoring by the U.S. Government or any agency thereof. Available for sale to the public from:
U.S. Department of Commerce National Technical Information Service 5301 Shawnee Road Alexandria, VA 22312 Telephone: 1-800-553-6847 Fax: 703-605-6900 E-mail: [email protected] Online ordering: http://www.ntis.gov/help/ordermethods.aspx
Available electronically at http://www.osti.gov/bridge Available for a processing fee to the U.S. Department of Energy and its contractors, in paper, from: U.S. Department of Energy Office of Scientific and Technical Information P.O. Box 62 Oak Ridge, TN 37831-0062 Telephone: 865-576-8401 Fax: 865-576-5728 E-mail: [email protected]
National Emission Standards for Hazardous Air Pollutants –
Radionuclide Emissions Calendar Year 2011
June 2012
Work Performed Under Contract No. DE-AC52-06NA25946
Prepared for: U.S. Department of Energy
National Nuclear Security Administration Nevada Site Office
Prepared by: National Security Technologies, LLC
P.O. Box 98521 Las Vegas, Nevada 89193-8521
DOE/NV/25946--1530

ii
This page intentionally left blank
National Emission Standards for Hazardous Air Pollutants – Radionuclide Emissions Calendar Year 2011
iii
EXECUTIVE SUMMARY 2011 RADIOLOGICAL DOSE TO THE PUBLIC BELOW FEDERAL STANDARD
The U.S. Department of Energy, National Nuclear Security Administration Nevada Site Office operates the Nevada National Security Site (NNSS) and North Las Vegas Facility (NLVF). From 1951 through 1992, the NNSS was the continental testing location for U.S. nuclear weapons. The release of radionuclides from NNSS activities has been monitored since the initiation of atmospheric testing. Limitation to underground detonations after 1962 greatly reduced radiation exposure to the public surrounding the NNSS. After nuclear testing ended in 1992, NNSS radiation monitoring focused on detecting airborne radionuclides from historically contaminated soils. These radionuclides are derived from re-suspension of soil (primarily by wind) and emission of tritium-contaminated soil moisture through evapotranspiration. Low amounts of legacy-related tritium are also emitted to air at the NLVF, an NNSS support complex in North Las Vegas.
To protect the public from harmful levels of man-made radiation, the Clean Air Act, National Emission Standards for Hazardous Air Pollutants (NESHAP) (Title 40 Code of Federal Regulations [CFR] Part 61 Subpart H) (CFR, 2010a) limits the release of radioactivity from a U.S. Department of Energy (DOE) facility to that which would cause 10 millirem per year (mrem/yr) effective dose equivalent to any member of the public. This limit does not include radiation unrelated to NNSS activities. Unrelated doses could come from naturally occurring radioactive elements, from sources such as medically or commercially used radionuclides, or from sources outside of the United States, such as the damaged Fukushima nuclear power plant in Japan. Radionuclides from the Fukushima nuclear power plant were detected at the NNSS in March 2011 and are discussed further in Section III.
The NNSS demonstrates compliance with the NESHAP limit by using environmental measurements of radionuclide air concentrations at critical receptor locations (U.S. Environmental Protection Agency [EPA] and DOE, 1995). This method was approved by the EPA for use on the NNSS in 2001 (EPA, 2001a) and has been the sole method used since 2005. Six locations on the NNSS have been established to act as critical receptor locations to demonstrate compliance with the NESHAP limit. These locations are actually pseudo-critical receptor stations, because no member of the public actually resides at these onsite locations. Compliance is demonstrated if the measured annual average concentration is less than the NESHAP Concentration Levels (CLs) for Environmental Compliance listed in 40 CFR 61, Appendix E, Table 2 (CFR, 2010a). For multiple radionuclides, compliance is demonstrated when the sum of the fractions (determined by dividing each radionuclide’s concentration by its CL and then adding the fractions together) is less than 1.0.
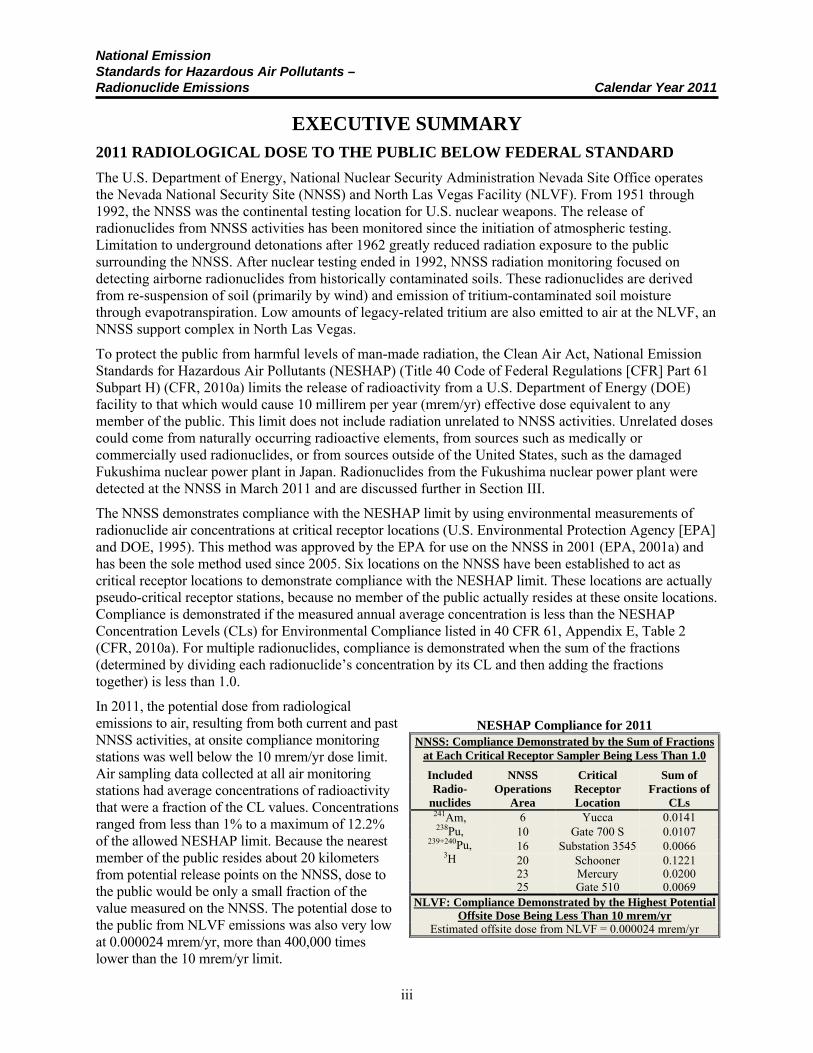
In 2011, the potential dose from radiological emissions to air, resulting from both current and past NNSS activities, at onsite compliance monitoring stations was well below the 10 mrem/yr dose limit. Air sampling data collected at all air monitoring stations had average concentrations of radioactivity that were a fraction of the CL values. Concentrations ranged from less than 1% to a maximum of 12.2% of the allowed NESHAP limit. Because the nearest member of the public resides about 20 kilometers from potential release points on the NNSS, dose to the public would be only a small fraction of the value measured on the NNSS. The potential dose to the public from NLVF emissions was also very low at 0.000024 mrem/yr, more than 400,000 times lower than the 10 mrem/yr limit.
NESHAP Compliance for 2011
NNSS: Compliance Demonstrated by the Sum of Fractions at Each Critical Receptor Sampler Being Less Than 1.0
Included Radio-
nuclides
NNSS Operations
Area
Critical Receptor Location
Sum of Fractions of
CLs 241Am, 238Pu,
239+240Pu, 3H
6 Yucca 0.014110 Gate 700 S 0.010716 Substation 3545 0.006620 Schooner 0.122123 Mercury 0.020025 Gate 510 0.0069
NLVF: Compliance Demonstrated by the Highest Potential Offsite Dose Being Less Than 10 mrem/yr
Estimated offsite dose from NLVF = 0.000024 mrem/yr
National Emission Standards for Hazardous Air Pollutants – Radionuclide Emissions Calendar Year 2011
iv
This page intentionally left blank
National Emission Standards for Hazardous Air Pollutants – Radionuclide Emissions Calendar Year 2011
v
Table of Contents
EXECUTIVE SUMMARY ......................................................................................................................... iii
List of Acronyms and Abbreviations .......................................................................................................... vii
Report Information ....................................................................................................................................... ix
SECTION I FACILITY INFORMATION ................................................................................................... 1 Site Description ...................................................................................................................................... 1 Source Description ................................................................................................................................. 1
SECTION II AIR EMISSIONS DATA ........................................................................................................ 7
SECTION III DOSE ASSESSMENTS ....................................................................................................... 15 Dose Assessment Method .................................................................................................................... 15 Compliance Assessment ....................................................................................................................... 16
SECTION IV ADDITIONAL INFORMATION ........................................................................................ 23 Dose Evaluations Conducted during Calendar Year (CY) 2011 .......................................................... 23 Unplanned Releases ............................................................................................................................. 25
Certification .............................................................................................................................................. 27
REFERENCES ........................................................................................................................................... 29
Appendix A Potential National Emission Standards for Hazardous Air Pollutants (NESHAP) Sources ... A-1
Appendix B Tritium Emissions Estimated from Air Sampling Data ....................................................... B-1
Appendix C Emissions of Americium and Plutonium from Diffuse Legacy Sites Based on Historical Soil Survey Data and Soil Re-suspension Model .............................................. C-1
Appendix D Calculation of Tritium Emissions from Contaminated Groundwater Discharges ............... D-1
Appendix E Potential Radionuclide Emissions and Dose from the North Las Vegas Facility ................ E-1
Appendix F Identification and Justification for the Development of Meteorological Data used as Input to Clean Air Package 1988 (CAP88-PC) .................................................................. F-1
Appendix G Supplemental Information ................................................................................................... G-1
National Emission Standards for Hazardous Air Pollutants – Radionuclide Emissions Calendar Year 2011
vi
List of Figures Figure 1. NNSS and Surrounding Populated Area ....................................................................................... 2 Figure 2. Distribution of Elevated Exposure Rates from Radionuclides in NNSS Soils .............................. 4 Figure 3. Primary Facilities for Key NNSA/NSO Missions ......................................................................... 6 Figure 4. Sources of Radiological Air Emissions on the NNSS in CY 2011 ............................................. 11 Figure 5. Air Sampling Network on the NNSS .......................................................................................... 17 Figure 6. Cesium-137 in Air Samples from Critical Receptor Stations on the NNSS in CY 2011 ............ 20 Figure 7. Schooner Critical Receptor Air Sampling Station ....................................................................... 21 Figure 8. Fraction of the 10 mrem/yr Air Pathway Dose Limit for CAP88 modeled MEI Dose and
Highest Critical Receptor Station Monitoring Results ............................................................. 22 Figure 9. Wildland fires on the NNSS, CY 2011 ........................................................................................ 26 Figure F.1 Locations of MEDA Stations on the NNSS in CY 2011 ......................................................... F-2 Figure G.1 CEDE to Populations within 80 km (50 miles) of Emission Sources ..................................... G-1 Figure G.2 CAP88-PC Predicted Air Concentration versus Ratio of Distance-to-Source/Diameter of
Source ..................................................................................................................................... G-2
List of Tables Table 1. Inventory of 241Am, 238Pu, and 239+240Pu in Surface Soil(a) at the NNSS ......................................... 3 Table 2. CY 2011 Radionuclide Emission Sources and Distance to Offsite Locations .............................. 10 Table 3. Summary of CY 2011 Air Emissions Data by Source .................................................................. 12 Table 4. Total Estimated NNSS Emissions for CY 2011 ........................................................................... 13 Table 5. Total Estimated NLVF Emissions for CY 2011 ........................................................................... 13 Table 6. Distance of Critical Receptor Air Monitoring Stations to Nearest Points of Interest ................... 18 Table 7. Average Radionuclide Concentrations at NNSS Critical Receptor Stations and Fraction of
Concentration Level (CL), CY 2011 ............................................................................................ 19 Table 8. NESHAP dose evaluations conducted during CY 2011 ............................................................... 24 Table A.1 Facilities or Areas from which Radionuclides were Released to Air in Calendar Year (CY)
2011 ........................................................................................................................................ A-1 Table A.2 Locations with Potential to have Unsealed Radioactive Material But Had No Known Emissions
in CY 2011 .............................................................................................................................. A-6 Table B.1 Tritium Emissions from Airborne Tritium Sampling Results during CY 2011 ....................... B-2 Table C.1 Calculated Emissions from Inventories(a) of 238Pu, 239+240Pu, and 241Am in NNSS Ops Areas . C-2 Table D.1 Tritium Concentrations, Water Volumes, and Estimated Tritium Emissions from Contaminated
Groundwater Brought to the Surface ...................................................................................... D-1 Table E.1. Comparison of Tritium Emission Rates from Building A-01, NLVF from 1995 to 2011 ...... E-2 Table F.1 Meteorological Data Acquisition System Locations Used to Create STAR Files for Use in
Determining Radiological Emissions from the NNSS (Appendix B). .................................... F-3
National Emission Standards for Hazardous Air Pollutants – Radionuclide Emissions Calendar Year 2011
vii
List of Acronyms and Abbreviations Am americium ARL/SORD Air Resources Laboratory, Special Operations and Research Division BEEF Big Explosives Experimental Facility °C degrees Celsius CAP88-PC Clean Air Package 1988 (EPA software program for estimating doses) CDE collective dose equivalent CFR Code of Federal Regulations Ci curie(s) CL Concentration Level cm centimeter(s) Co cobalt Cs cesium CY calendar year DAF Device Assembly Facility DOE U.S. Department of Energy DPF Dense Plasma Focus DRA Desert Rock Meteorological Observatory DU depleted uranium E east EDE effective dose equivalent EPA U.S. Environmental Protection Agency Eu europium ft3/min cubic feet per minute 3H tritium HTO tritiated water JASPER Joint Actinide Shock Physics Experimental Research km kilometer(s) km2 square kilometer(s) L liter(s) LINAC electron linear accelerator LATF Los Alamos Technical Facility LLW low-level waste m meter(s) mCi millicurie(s) mCi/yr millicurie(s)/year MEDA Meteorological Data Acquisition MEI maximally exposed individual MIDNET Meteorological Integrated Data Network MLLW mixed low-level waste mrem/yr millirem per year µrem/yr microrem per year m/s meter(s) per second N north NCERC National Criticality Experiments Research Center NESHAP National Emission Standards for Hazardous Air Pollutants NLVF North Las Vegas Facility
National Emission Standards for Hazardous Air Pollutants – Radionuclide Emissions Calendar Year 2011
viii
List of Acronyms and Abbreviations (continued) NNSA/NSO U.S. Department of Energy, National Nuclear Security Administration Nevada Site Office NNSS Nevada National Security Site NOAA National Oceanic and Atmospheric Administration NPTEC Nonproliferation Test and Evaluation Complex NTTR Nevada Test and Training Range Ops Operations pCi picocurie(s) pCi/L picocurie(s) per liter pCi/m3 picocurie(s) per cubic meter Pu plutonium rem roentgen equivalent man RNCTEC Radiological/Nuclear Countermeasures Test and Evaluation Complex RWMC Radioactive Waste Management Complex RWMS Radioactive Waste Management Site s second(s) S south Sr strontium STAR Stability Array (grouping of meteorological data) TRU transuranic (nuclides with atomic numbers greater than uranium) UCC Yucca Flat Meteorological Observatory UGTA Underground Test Area W west yr year(s)
National Emission Standards for Hazardous Air Pollutants – Radionuclide Emissions Calendar Year 2011
ix
Report Information
U.S. Department of Energy National Nuclear Security Administration
Nevada Site Office Air Emissions Annual Report
(under Subpart H, Title 40 Code of Federal Regulations [CFR] 61.94) Calendar Year (CY) 2011
Site Name: Nevada National Security Site Office Information Office: U.S. Department of Energy, National Nuclear Security Administration
Nevada Site Office Address: P.O. Box 98518
Las Vegas, NV 89193-8518 Contact: Scott Wade Phone: (702) 295-4111
Assistant Manager for Environmental Management Site Information Operator: National Security Technologies, LLC Address: P.O. Box 98521
Las Vegas, NV 89193-8521 Contact: Teri Browdy Phone: (702) 295-6003 Director, Environmental Management

National Emission Standards for Hazardous Air Pollutants – Radionuclide Emissions Calendar Year 2011
x
This page intentionally left blank
National Emission Standards for Hazardous Air Pollutants – Radionuclide Emissions Calendar Year 2011
1
SECTION I FACILITY INFORMATION
SITE DESCRIPTION
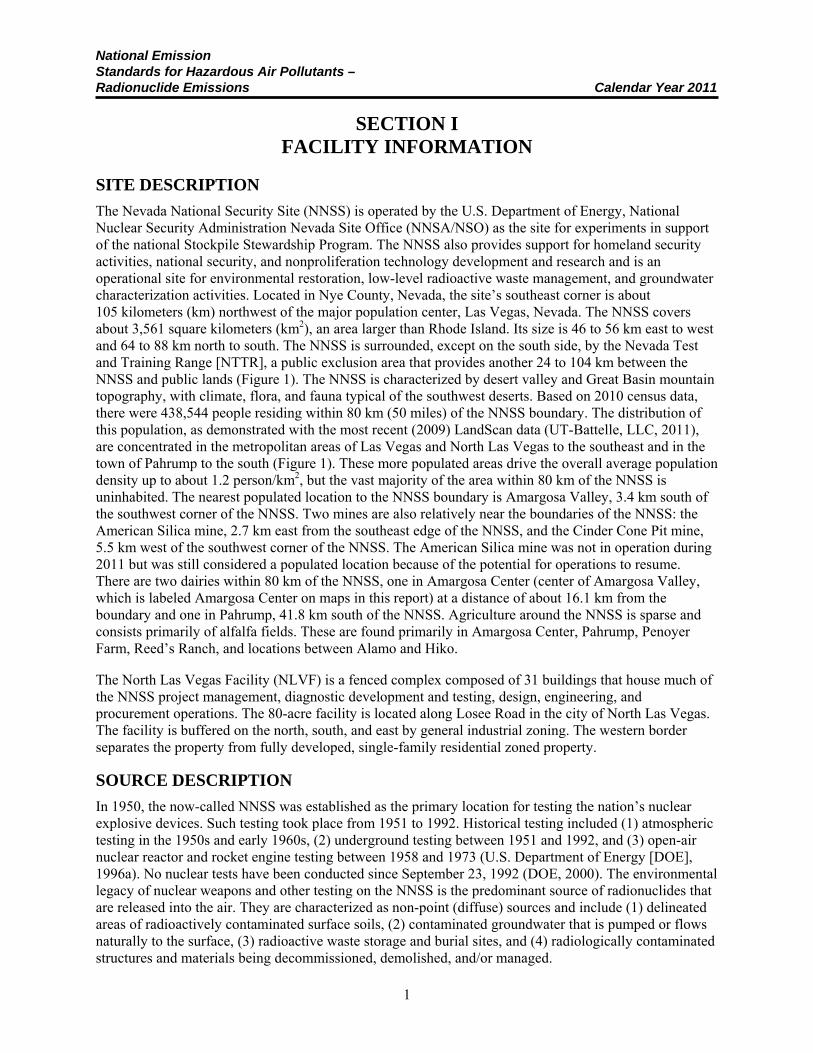
The Nevada National Security Site (NNSS) is operated by the U.S. Department of Energy, National Nuclear Security Administration Nevada Site Office (NNSA/NSO) as the site for experiments in support of the national Stockpile Stewardship Program. The NNSS also provides support for homeland security activities, national security, and nonproliferation technology development and research and is an operational site for environmental restoration, low-level radioactive waste management, and groundwater characterization activities. Located in Nye County, Nevada, the site’s southeast corner is about 105 kilometers (km) northwest of the major population center, Las Vegas, Nevada. The NNSS covers about 3,561 square kilometers (km2), an area larger than Rhode Island. Its size is 46 to 56 km east to west and 64 to 88 km north to south. The NNSS is surrounded, except on the south side, by the Nevada Test and Training Range [NTTR], a public exclusion area that provides another 24 to 104 km between the NNSS and public lands (Figure 1). The NNSS is characterized by desert valley and Great Basin mountain topography, with climate, flora, and fauna typical of the southwest deserts. Based on 2010 census data, there were 438,544 people residing within 80 km (50 miles) of the NNSS boundary. The distribution of this population, as demonstrated with the most recent (2009) LandScan data (UT-Battelle, LLC, 2011), are concentrated in the metropolitan areas of Las Vegas and North Las Vegas to the southeast and in the town of Pahrump to the south (Figure 1). These more populated areas drive the overall average population density up to about 1.2 person/km2, but the vast majority of the area within 80 km of the NNSS is uninhabited. The nearest populated location to the NNSS boundary is Amargosa Valley, 3.4 km south of the southwest corner of the NNSS. Two mines are also relatively near the boundaries of the NNSS: the American Silica mine, 2.7 km east from the southeast edge of the NNSS, and the Cinder Cone Pit mine, 5.5 km west of the southwest corner of the NNSS. The American Silica mine was not in operation during 2011 but was still considered a populated location because of the potential for operations to resume. There are two dairies within 80 km of the NNSS, one in Amargosa Center (center of Amargosa Valley, which is labeled Amargosa Center on maps in this report) at a distance of about 16.1 km from the boundary and one in Pahrump, 41.8 km south of the NNSS. Agriculture around the NNSS is sparse and consists primarily of alfalfa fields. These are found primarily in Amargosa Center, Pahrump, Penoyer Farm, Reed’s Ranch, and locations between Alamo and Hiko.
The North Las Vegas Facility (NLVF) is a fenced complex composed of 31 buildings that house much of the NNSS project management, diagnostic development and testing, design, engineering, and procurement operations. The 80-acre facility is located along Losee Road in the city of North Las Vegas. The facility is buffered on the north, south, and east by general industrial zoning. The western border separates the property from fully developed, single-family residential zoned property.
SOURCE DESCRIPTION
In 1950, the now-called NNSS was established as the primary location for testing the nation’s nuclear explosive devices. Such testing took place from 1951 to 1992. Historical testing included (1) atmospheric testing in the 1950s and early 1960s, (2) underground testing between 1951 and 1992, and (3) open-air nuclear reactor and rocket engine testing between 1958 and 1973 (U.S. Department of Energy [DOE], 1996a). No nuclear tests have been conducted since September 23, 1992 (DOE, 2000). The environmental legacy of nuclear weapons and other testing on the NNSS is the predominant source of radionuclides that are released into the air. They are characterized as non-point (diffuse) sources and include (1) delineated areas of radioactively contaminated surface soils, (2) contaminated groundwater that is pumped or flows naturally to the surface, (3) radioactive waste storage and burial sites, and (4) radiologically contaminated structures and materials being decommissioned, demolished, and/or managed.
National Emission Standards for Hazardous Air Pollutants – Radionuclide Emissions Calendar Year 2011
2
Figure 1. NNSS and Surrounding Populated Area
National Emission Standards for Hazardous Air Pollutants – Radionuclide Emissions Calendar Year 2011
3
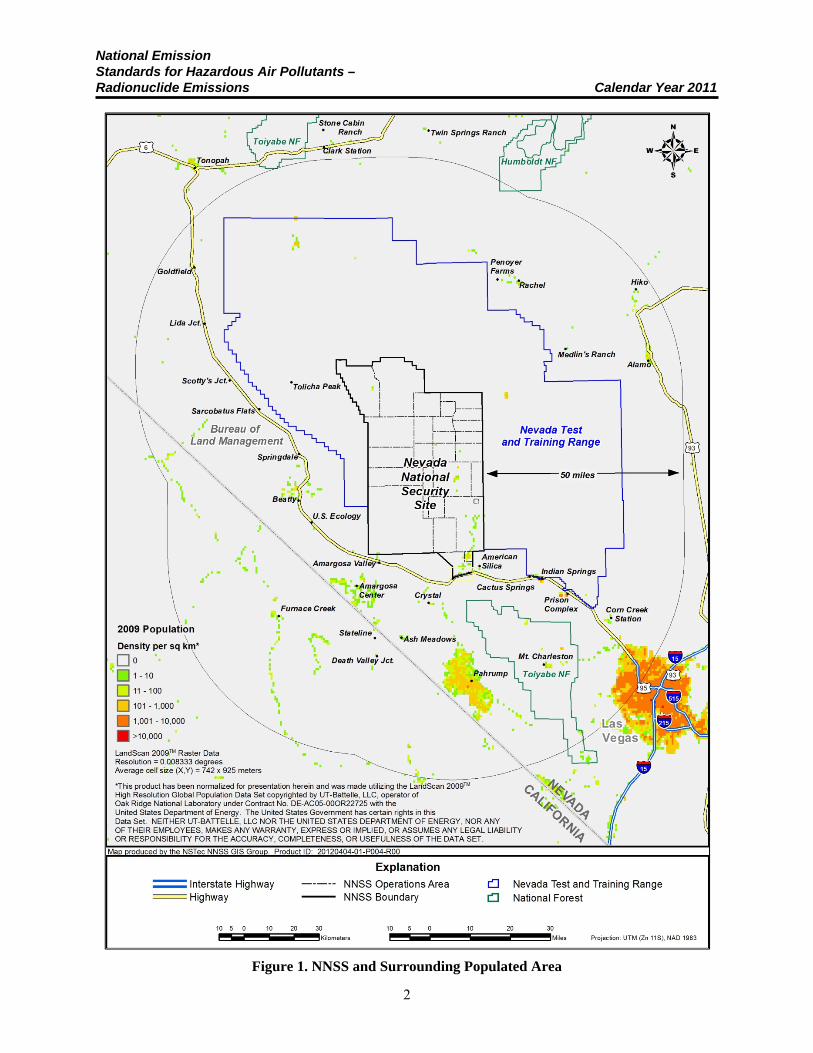
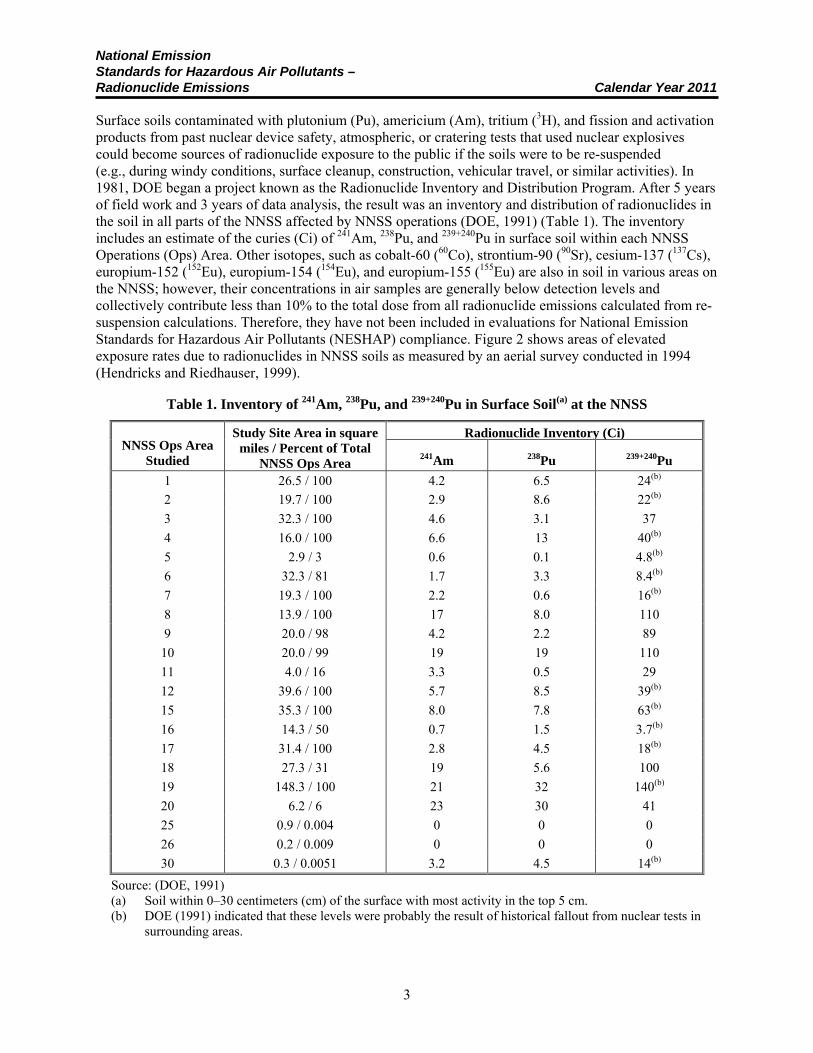
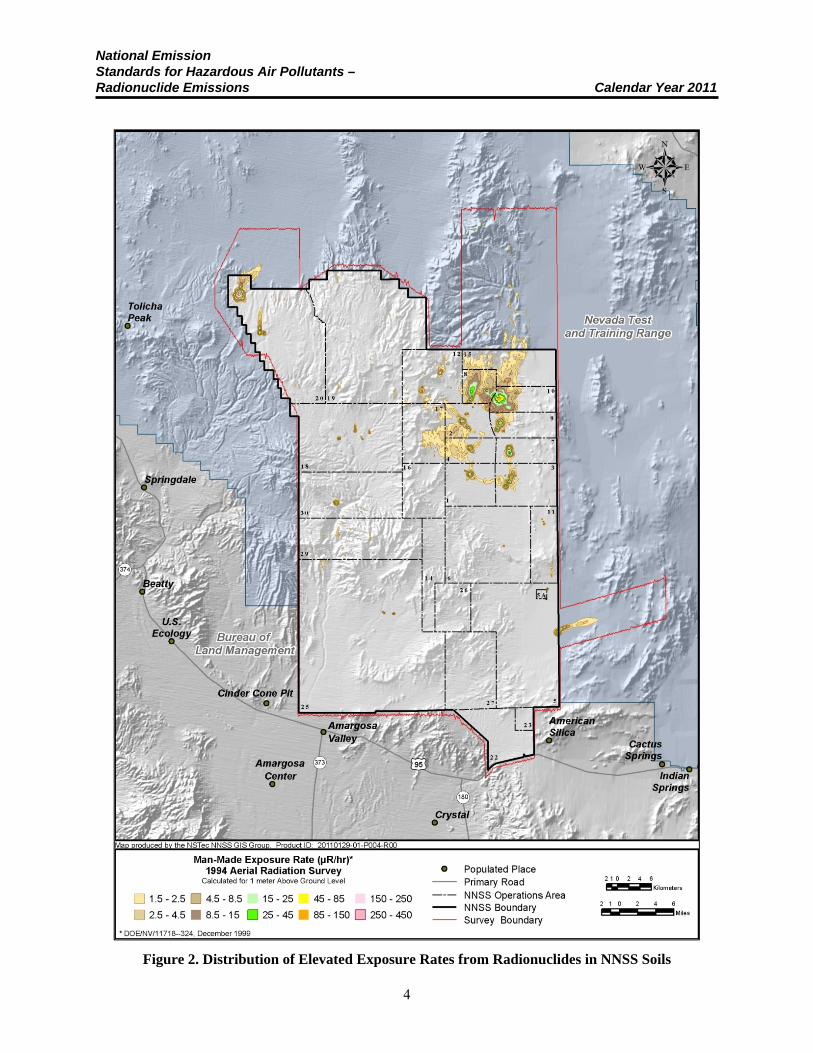
Surface soils contaminated with plutonium (Pu), americium (Am), tritium (3H), and fission and activation products from past nuclear device safety, atmospheric, or cratering tests that used nuclear explosives could become sources of radionuclide exposure to the public if the soils were to be re-suspended (e.g., during windy conditions, surface cleanup, construction, vehicular travel, or similar activities). In 1981, DOE began a project known as the Radionuclide Inventory and Distribution Program. After 5 years of field work and 3 years of data analysis, the result was an inventory and distribution of radionuclides in the soil in all parts of the NNSS affected by NNSS operations (DOE, 1991) (Table 1). The inventory includes an estimate of the curies (Ci) of 241Am, 238Pu, and 239+240Pu in surface soil within each NNSS Operations (Ops) Area. Other isotopes, such as cobalt-60 (60Co), strontium-90 (90Sr), cesium-137 (137Cs), europium-152 (152Eu), europium-154 (154Eu), and europium-155 (155Eu) are also in soil in various areas on the NNSS; however, their concentrations in air samples are generally below detection levels and collectively contribute less than 10% to the total dose from all radionuclide emissions calculated from re-suspension calculations. Therefore, they have not been included in evaluations for National Emission Standards for Hazardous Air Pollutants (NESHAP) compliance. Figure 2 shows areas of elevated exposure rates due to radionuclides in NNSS soils as measured by an aerial survey conducted in 1994 (Hendricks and Riedhauser, 1999).
Table 1. Inventory of 241Am, 238Pu, and 239+240Pu in Surface Soil(a) at the NNSS
NNSS Ops Area Studied
Study Site Area in square miles / Percent of Total
NNSS Ops Area
Radionuclide Inventory (Ci)
241Am 238Pu 239+240Pu
1 26.5 / 100 4.2 6.5 24(b)
2 19.7 / 100 2.9 8.6 22(b)
3 32.3 / 100 4.6 3.1 37
4 16.0 / 100 6.6 13 40(b)
5 2.9 / 3 0.6 0.1 4.8(b)
6 32.3 / 81 1.7 3.3 8.4(b)
7 19.3 / 100 2.2 0.6 16(b)
8 13.9 / 100 17 8.0 110
9 20.0 / 98 4.2 2.2 89
10 20.0 / 99 19 19 110
11 4.0 / 16 3.3 0.5 29
12 39.6 / 100 5.7 8.5 39(b)
15 35.3 / 100 8.0 7.8 63(b)
16 14.3 / 50 0.7 1.5 3.7(b)
17 31.4 / 100 2.8 4.5 18(b)
18 27.3 / 31 19 5.6 100
19 148.3 / 100 21 32 140(b)
20 6.2 / 6 23 30 41
25 0.9 / 0.004 0 0 0
26 0.2 / 0.009 0 0 0
30 0.3 / 0.0051 3.2 4.5 14(b)
Source: (DOE, 1991) (a) Soil within 0–30 centimeters (cm) of the surface with most activity in the top 5 cm. (b) DOE (1991) indicated that these levels were probably the result of historical fallout from nuclear tests in
surrounding areas.
National Emission Standards for Hazardous Air Pollutants – Radionuclide Emissions Calendar Year 2011
4
Figure 2. Distribution of Elevated Exposure Rates from Radionuclides in NNSS Soils
National Emission Standards for Hazardous Air Pollutants – Radionuclide Emissions Calendar Year 2011
5
Collectively, these diffuse NNSS sources have air emissions with potential to result in an effective dose equivalent (EDE) exceeding 0.1 millirem per year (mrem/yr), which is greater than 1% of the standard (Grossman, 2005). Per requirements set forth in Title 40 Code of Federal Regulations (CFR) Section 61.93(b) (U.S. Environmental Protection Agency [EPA] and DOE, 1995; CFR, 2010a), these are considered a major source, requiring continuous monitoring (termed monitored source in this report). Sources that result in a potential EDE less than 0.1 mrem/yr are considered minor release points (EPA and DOE, 1995).
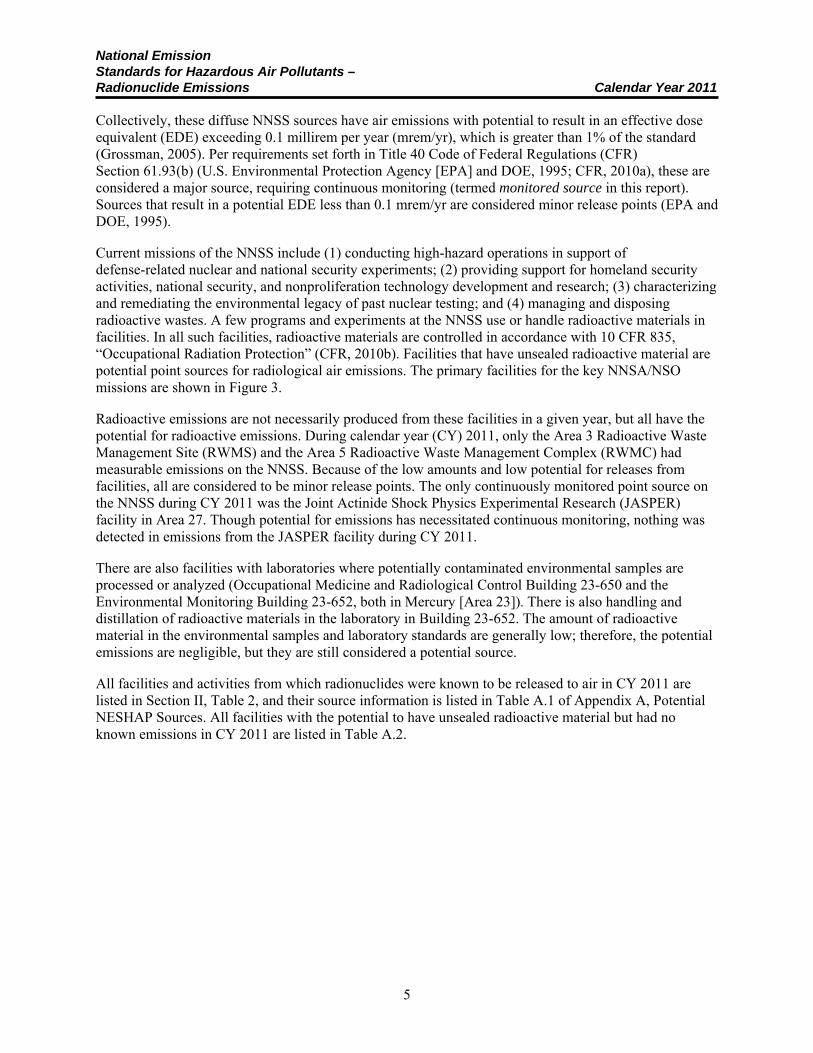
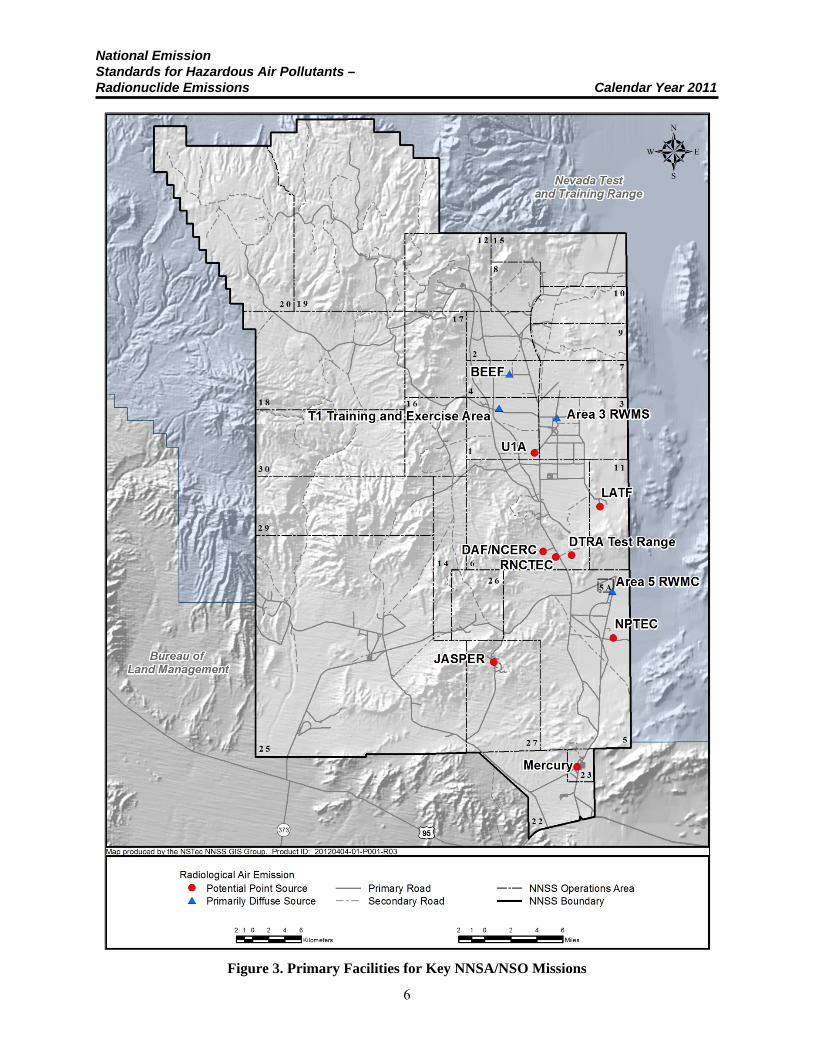
Current missions of the NNSS include (1) conducting high-hazard operations in support of defense-related nuclear and national security experiments; (2) providing support for homeland security activities, national security, and nonproliferation technology development and research; (3) characterizing and remediating the environmental legacy of past nuclear testing; and (4) managing and disposing radioactive wastes. A few programs and experiments at the NNSS use or handle radioactive materials in facilities. In all such facilities, radioactive materials are controlled in accordance with 10 CFR 835, “Occupational Radiation Protection” (CFR, 2010b). Facilities that have unsealed radioactive material are potential point sources for radiological air emissions. The primary facilities for the key NNSA/NSO missions are shown in Figure 3.
Radioactive emissions are not necessarily produced from these facilities in a given year, but all have the potential for radioactive emissions. During calendar year (CY) 2011, only the Area 3 Radioactive Waste Management Site (RWMS) and the Area 5 Radioactive Waste Management Complex (RWMC) had measurable emissions on the NNSS. Because of the low amounts and low potential for releases from facilities, all are considered to be minor release points. The only continuously monitored point source on the NNSS during CY 2011 was the Joint Actinide Shock Physics Experimental Research (JASPER) facility in Area 27. Though potential for emissions has necessitated continuous monitoring, nothing was detected in emissions from the JASPER facility during CY 2011.
There are also facilities with laboratories where potentially contaminated environmental samples are processed or analyzed (Occupational Medicine and Radiological Control Building 23-650 and the Environmental Monitoring Building 23-652, both in Mercury [Area 23]). There is also handling and distillation of radioactive materials in the laboratory in Building 23-652. The amount of radioactive material in the environmental samples and laboratory standards are generally low; therefore, the potential emissions are negligible, but they are still considered a potential source.
All facilities and activities from which radionuclides were known to be released to air in CY 2011 are listed in Section II, Table 2, and their source information is listed in Table A.1 of Appendix A, Potential NESHAP Sources. All facilities with the potential to have unsealed radioactive material but had no known emissions in CY 2011 are listed in Table A.2.
National Emission Standards for Hazardous Air Pollutants – Radionuclide Emissions Calendar Year 2011
6
Figure 3. Primary Facilities for Key NNSA/NSO Missions
National Emission Standards for Hazardous Air Pollutants – Radionuclide Emissions Calendar Year 2011
7
SECTION II AIR EMISSIONS DATA
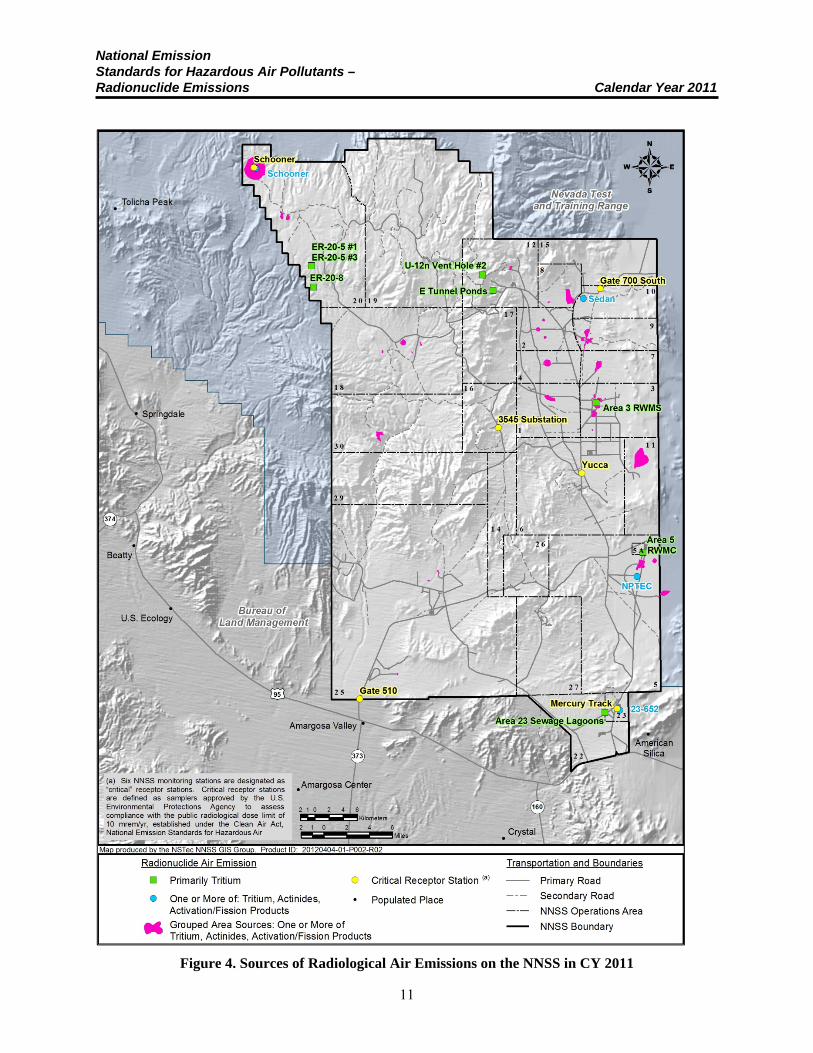
Facilities and operations from which radionuclides were released to the atmosphere during CY 2011 are listed in Table 2, and their source information is listed in Table A.1 of Appendix A. Their locations are displayed in Figure 4. Releases for the year are grouped into six general source categories: (1) legacy weapon test and plowshare soil contamination sites; (2) defense, security, and stockpile stewardship; (3) groundwater characterization/control and remediation activities; (4) radioactive waste management; (5) support facility operations; and (6) emanation from contaminated building materials. Descriptions of CY 2011 emission sources by category are described below.
Legacy Weapon Test and Plowshare Soil Contamination Sites
Three general soil contamination locations are listed for emission sources in this category. Two of them, Sedan and Schooner, are craters from the Plowshare program, which used nuclear devices to demonstrate their ability to excavate large amounts of earth. They are specifically listed separately from other test locations because they dominate the NNSS for 3H emissions. The derivation of 3H emission estimates from these locations is described in Appendix B, Tritium Emissions Estimated from Air Sampling Data. The third general location, referred to as “Grouped Area Sources,” is a grouping of all nuclear weapon and plowshare test locations from all areas on the NNSS. This grouping is used to report 238Pu, 239+240Pu, and 241Am emissions, the derivation of which is described in Appendix C, Emissions of Americium and Plutonium from Diffuse Legacy Sites Based on Historical Soil Survey Data and Soil Re-suspension Model.
Defense, Security, and Stockpile Stewardship
This category consists of activities making up the bulk of the mission for the NNSS.
The Defense Experimentation and Stockpile Stewardship directorate has a vital mission for national defense to maintain the integrity of the United States nuclear weapons stockpile. Certain experiments conducted under the Missions and Projects program have potential for radioactive emissions. Primary facilities for this are U1a, Big Explosives Experimental Facility (BEEF), JASPER, Device Assembly Facility (DAF), National Criticality Experiments Research Center (NCERC), Dense Plasma Focus (DPF) located at the Los Alamos Technical Facility (LATF), and tunnel facilities.
The Homeland Security and Defense Applications directorate conducts work to strengthen national security by providing real-world testing, evaluation, and training venues. Certain work conducted under the Test and Evaluation program has potential for radioactive emissions. The primary facilities for this are the T1 Training and Exercise Area, the Radiological/Nuclear Countermeasures Test and Evaluation Complex (RNCTEC), and the Nonproliferation Test and Evaluation Complex (NPTEC).
Of facilities in this category, radionuclides were only known to be released from BEEF and NPTEC during CY 2011. Radionuclides associated with the T1 Training and Exercise area are diffuse soil contamination associated with historical testing and are therefore included with the soil sites in the category mentioned above, Legacy Weapon Test and Plowshare Soil Contamination Sites. Operations involving radioactive materials at NPTEC during CY 2011 were the same as during CY 2010, so potential radionuclide emissions remained the same. Details on the calculation of potential radionuclide emissions from NPTEC are described in the NESHAP report for CY 2010 (National Security Technologies, LLC, 2011). Potential radionuclide emissions from BEEF are described in Section IV of this report.
National Emission Standards for Hazardous Air Pollutants – Radionuclide Emissions Calendar Year 2011
8
Groundwater Characterization/Control and Remediation Activities
Groundwater containing radionuclides associated with legacy contamination can be brought to the surface through either groundwater flow through fissures and man-made tunnels or through active pumping.
Environmental Restoration Corrective Action Site 12-59-01, E-Tunnels, has a component consisting of water contaminated from historical nuclear weapons testing flowing into collections ponds (E-Tunnel Ponds). The only radiological contaminant that produces a measurable air emission is 3H evaporating as tritiated water (HTO). Calculation of this emission source for CY 2011 is described in Appendix D, Calculation of Tritium Emissions from Contaminated Groundwater Discharges.
The Underground Test Area (UGTA) Activity (formerly known as the UGTA Sub-Project) has the task of characterizing the aquifers at sites of past underground nuclear tests. To characterize the groundwater regime, suitable wells are drilled and existing wells re-completed and sampled as determined by hydrologists. During these drilling and sampling operations, water is pumped to the surface. This water is then available for evaporation. Again, the only contaminant producing a measurable air emission from this evaporating water is 3H as HTO. During CY 2011, water containing 3H was pumped from the following wells:
ER-20-5 #1 (Area 20) ER-20-5 #3 (Area 20) ER-20-8 (Upper zone) (Area 20) U-12n Vent Hole #2 (Area 12)
These well locations are displayed in Figure 4. Calculation of the 3H emission from water pumped from them is described in Appendix D.
At the NLVF, parts of the Building A-01 basement were contaminated with 3H in 1995. This affected a vacant radiation source well that had since been filling with water due to the soil bottom in the well and a rise in groundwater. This source well was sealed in 2001 and a pump was installed to remove the residual 3H contaminated water. The State of Nevada approved the disposal of this water by using it in evaporative coolers outside the north side of Building A-01 and by disposing of it in the Area 23 Sewage Lagoons at the NNSS when the evaporative coolers are not effective. During CY 2011, water from this source was only disposed of in the Area 23 Sewage Lagoons. Calculation of the 3H emission from NLVF water disposed of at the NNSS sewage lagoons is described in Appendix D.
There were no Environmental Restoration demolition projects conducted during CY 2011 that resulted in radionuclide emissions to air.
Radioactive Waste Management
The Area 3 RWMS and the Area 5 RWMC are used for the disposal of packaged, dry, low-level waste (LLW) in pits and trenches. The Area 5 RWMC also has facilities for waste examination and repackaging activities, the accumulation of mixed waste, and the storage of transuranic (TRU) and mixed TRU wastes. Concrete pads are used for temporary storage of these wastes. The only radioactive emission detected by the various types of samplers located downwind of these sites and attributed to waste operations was 3H as HTO in atmospheric moisture. The calculation of the 3H source term for these emissions in CY 2011 is described in Appendix B.
Support Facility Operations
Facilities with laboratories as described at the end of Section I have the potential to emit low quantities of radionuclides from contaminated environmental samples when they are handled or from the preparation of 3H standards that are used for quality assurance purposes. Also, the Radiological Control Department has responsibilities to conduct receipt surveys of any radioactive materials
National Emission Standards for Hazardous Air Pollutants – Radionuclide Emissions Calendar Year 2011
9
arriving at the NNSS. If packaging is damaged, materials must be handled during repackaging, which creates the potential for low levels of air emissions. These activities generally take place at Radioactive Materials Control, Building 23-180. Of these support facilities, only the laboratory in Building 23-652 was known to use unsealed radioactive materials (standard solutions) regularly in CY 2011; therefore, it is the only facility in this category listed as being an emission source in CY 2011.
Emanation from Building Materials
The 1995 3H contamination of the NLVF Building A-01 basement mentioned above also resulted in contamination of the basement building materials. Emanation of HTO from these building materials has persisted at continually decreasing levels. These emissions are exhausted from the building through the ventilation system. A description of the incident and the potential EDE for offsite exposure during CY 2011 are presented in Appendix E, Potential Radionuclide Emissions and Dose from the North Las Vegas Facility.
Each potential source of NNSS emissions for CY 2011 was characterized by one of the following methods:
Measuring the radionuclide inventory and identifying losses of radionuclides that were released to the environment
Measuring the HTO concentrations in liquid effluents discharged and proceeding as if all the effluent evaporates over the course of the year to become an air emission
Using re-suspension calculations
Using a combination of environmental measurements and the Clean Air Package 1988 (CAP88-PC) air dispersion model (EPA, 2006) to calculate the emissions
In accordance with 40 CFR 61.93(b)(4)(ii) (CFR, 2010a), no credit was taken for pollution control equipment in determining potential air emissions.
Distances and directions from all CY 2011 emission sources to nearest offsite locations of interest are listed in Table 2. Distances ranged from 6 to 80 km from NNSS emission sources and from 0.1 to 0.85 km from the NLVF emission source. The source type, emission control, and description of the nature of each emission are listed in Table A.1 of Appendix A.
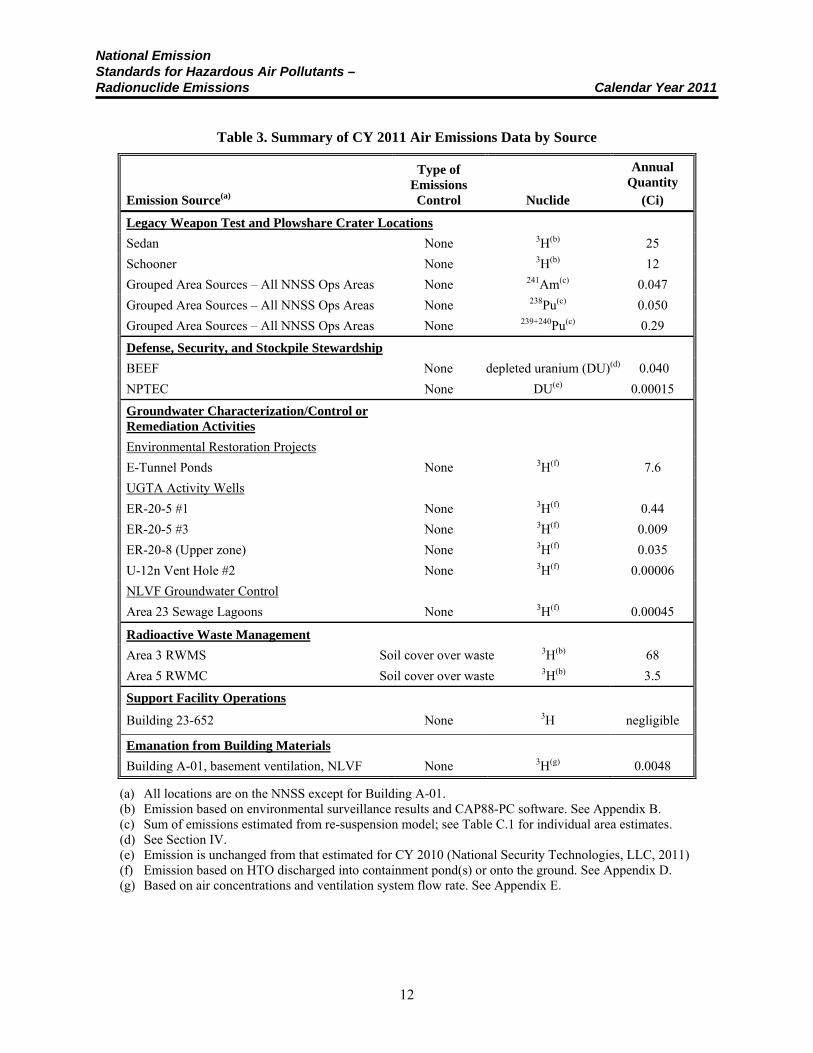
A summary of the CY 2011 emissions for NESHAP reporting by source is shown in Table 3. A summary of the NNSS total CY 2011 emissions for NESHAP reporting by radionuclide is shown in Table 4. A summary of the NLVF total CY 2011 emissions is provided in Table 5. The source type, emission control, and description of the nature of each emission are listed in Table A.1 of Appendix A. Appendices B through E describe the methods used to determine the CY 2011 emissions.
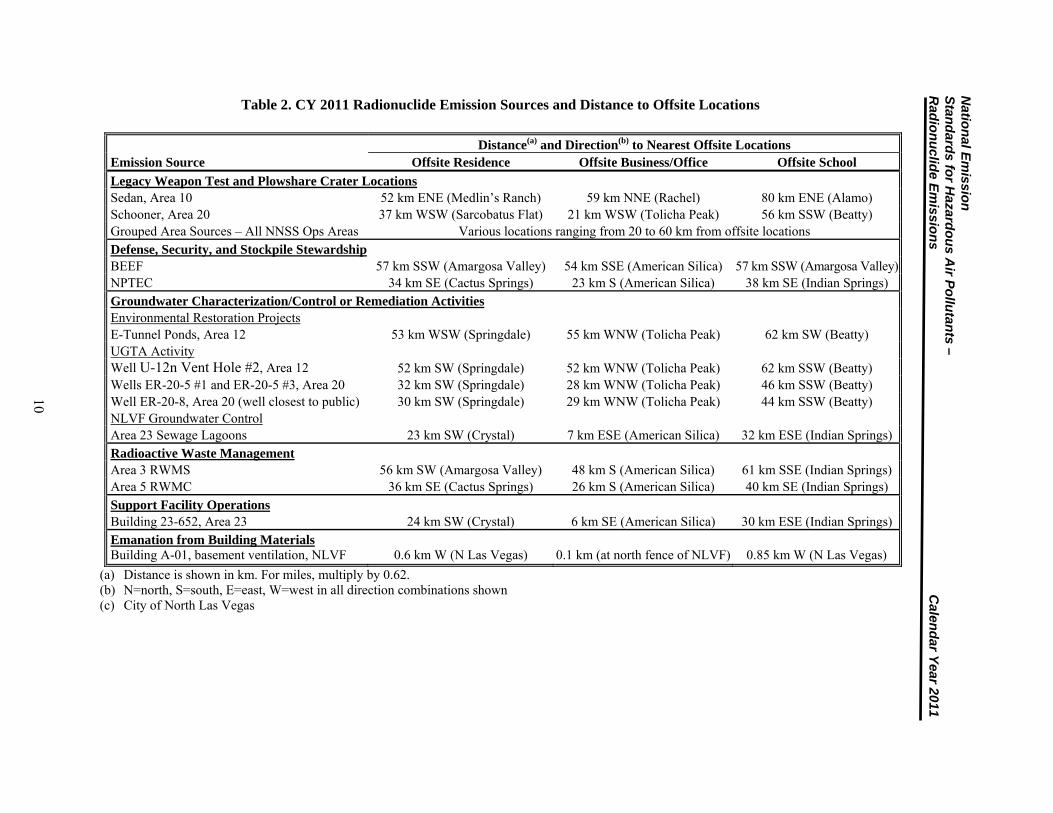
Table 2. CY 2011 Radionuclide Emission Sources and Distance to Offsite Locations
(a) Distance is shown in km. For miles, multiply by 0.62. (b) N=north, S=south, E=east, W=west in all direction combinations shown (c) City of North Las Vegas
Distance(a) and Direction(b) to Nearest Offsite Locations Emission Source Offsite Residence Offsite Business/Office Offsite School
Legacy Weapon Test and Plowshare Crater Locations Sedan, Area 10 52 km ENE (Medlin’s Ranch) 59 km NNE (Rachel) 80 km ENE (Alamo) Schooner, Area 20 37 km WSW (Sarcobatus Flat) 21 km WSW (Tolicha Peak) 56 km SSW (Beatty) Grouped Area Sources – All NNSS Ops Areas Various locations ranging from 20 to 60 km from offsite locations Defense, Security, and Stockpile Stewardship
BEEF 57 km SSW (Amargosa Valley) 54 km SSE (American Silica) 57 km SSW (Amargosa Valley)NPTEC 34 km SE (Cactus Springs) 23 km S (American Silica) 38 km SE (Indian Springs)Groundwater Characterization/Control or Remediation Activities
Environmental Restoration Projects E-Tunnel Ponds, Area 12 53 km WSW (Springdale) 55 km WNW (Tolicha Peak) 62 km SW (Beatty) UGTA Activity Well U-12n Vent Hole #2, Area 12 52 km SW (Springdale) 52 km WNW (Tolicha Peak) 62 km SSW (Beatty) Wells ER-20-5 #1 and ER-20-5 #3, Area 20 32 km SW (Springdale) 28 km WNW (Tolicha Peak) 46 km SSW (Beatty) Well ER-20-8, Area 20 (well closest to public) 30 km SW (Springdale) 29 km WNW (Tolicha Peak) 44 km SSW (Beatty) NLVF Groundwater Control Area 23 Sewage Lagoons 23 km SW (Crystal) 7 km ESE (American Silica) 32 km ESE (Indian Springs) Radioactive Waste Management
Area 3 RWMS 56 km SW (Amargosa Valley) 48 km S (American Silica) 61 km SSE (Indian Springs) Area 5 RWMC 36 km SE (Cactus Springs) 26 km S (American Silica) 40 km SE (Indian Springs) Support Facility Operations Building 23-652, Area 23 24 km SW (Crystal) 6 km SE (American Silica) 30 km ESE (Indian Springs) Emanation from Building Materials Building A-01, basement ventilation, NLVF 0.6 km W (N Las Vegas) 0.1 km (at north fence of NLVF) 0.85 km W (N Las Vegas)
Natio
nal E
missio
n
Stan
dard
s for H
azardo
us A
ir Po
llutan
ts – R
adio
nu
clide E
missio
ns
Calen
dar Y
ear 2011
10
National Emission Standards for Hazardous Air Pollutants – Radionuclide Emissions Calendar Year 2011
11
Figure 4. Sources of Radiological Air Emissions on the NNSS in CY 2011
National Emission Standards for Hazardous Air Pollutants – Radionuclide Emissions Calendar Year 2011
12
Table 3. Summary of CY 2011 Air Emissions Data by Source
Emission Source(a)
Type of Emissions Control Nuclide
Annual Quantity
(Ci)
Legacy Weapon Test and Plowshare Crater Locations
Sedan None 3H(b) 25
Schooner None 3H(b) 12
Grouped Area Sources – All NNSS Ops Areas None 241Am(c) 0.047
Grouped Area Sources – All NNSS Ops Areas None 238Pu(c) 0.050
Grouped Area Sources – All NNSS Ops Areas None 239+240Pu(c) 0.29
Defense, Security, and Stockpile Stewardship
BEEF None depleted uranium (DU)(d) 0.040
NPTEC None DU(e) 0.00015
Groundwater Characterization/Control or Remediation Activities
Environmental Restoration Projects
E-Tunnel Ponds None 3H(f) 7.6
UGTA Activity Wells
ER-20-5 #1 None 3H(f) 0.44
ER-20-5 #3 None 3H(f) 0.009
ER-20-8 (Upper zone) None 3H(f) 0.035
U-12n Vent Hole #2 None 3H(f) 0.00006
NLVF Groundwater Control
Area 23 Sewage Lagoons None 3H(f) 0.00045
Radioactive Waste Management
Area 3 RWMS Soil cover over waste 3H(b) 68
Area 5 RWMC Soil cover over waste 3H(b) 3.5
Support Facility Operations
Building 23-652 None 3H negligible
Emanation from Building Materials
Building A-01, basement ventilation, NLVF None 3H(g) 0.0048
(a) All locations are on the NNSS except for Building A-01. (b) Emission based on environmental surveillance results and CAP88-PC software. See Appendix B. (c) Sum of emissions estimated from re-suspension model; see Table C.1 for individual area estimates. (d) See Section IV. (e) Emission is unchanged from that estimated for CY 2010 (National Security Technologies, LLC, 2011) (f) Emission based on HTO discharged into containment pond(s) or onto the ground. See Appendix D. (g) Based on air concentrations and ventilation system flow rate. See Appendix E.
National Emission Standards for Hazardous Air Pollutants – Radionuclide Emissions Calendar Year 2011
13
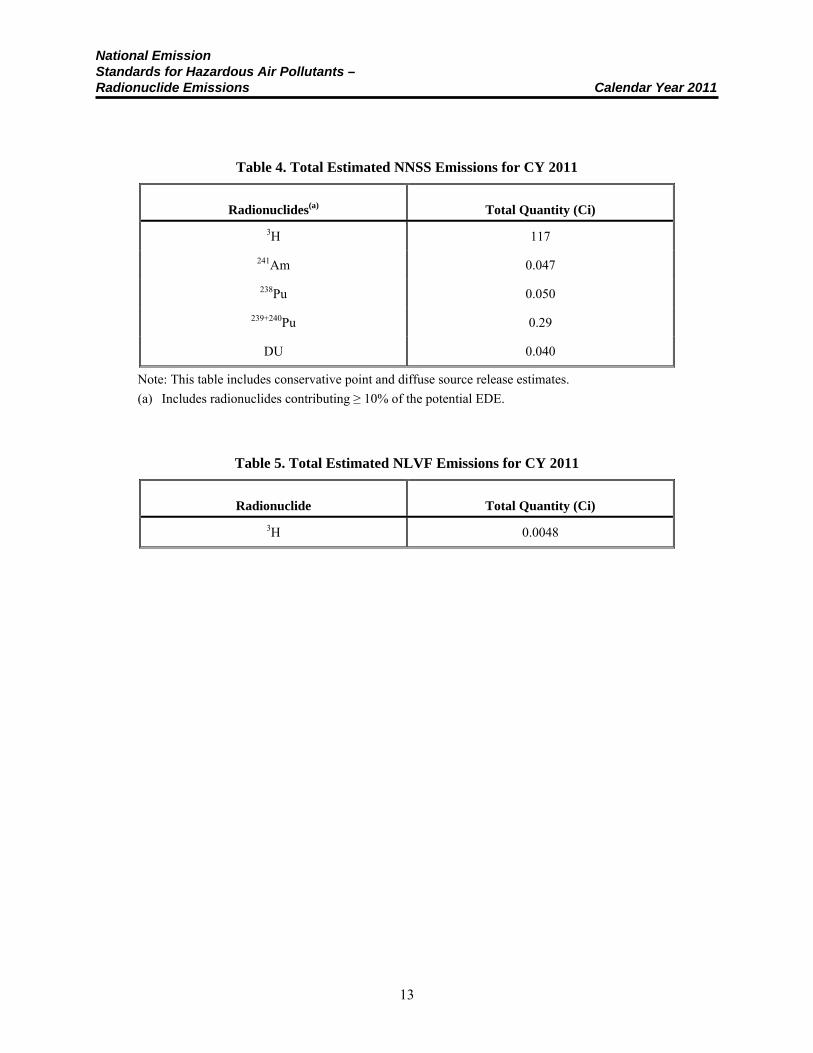
Table 4. Total Estimated NNSS Emissions for CY 2011
Radionuclides(a) Total Quantity (Ci)
3H 117
241Am 0.047
238Pu 0.050
239+240Pu 0.29
DU 0.040
Note: This table includes conservative point and diffuse source release estimates.
(a) Includes radionuclides contributing ≥ 10% of the potential EDE.
Table 5. Total Estimated NLVF Emissions for CY 2011
Radionuclide Total Quantity (Ci)
3H 0.0048

National Emission Standards for Hazardous Air Pollutants – Radionuclide Emissions Calendar Year 2011
14
This page intentionally left blank
National Emission Standards for Hazardous Air Pollutants – Radionuclide Emissions Calendar Year 2011
15
SECTION III DOSE ASSESSMENTS
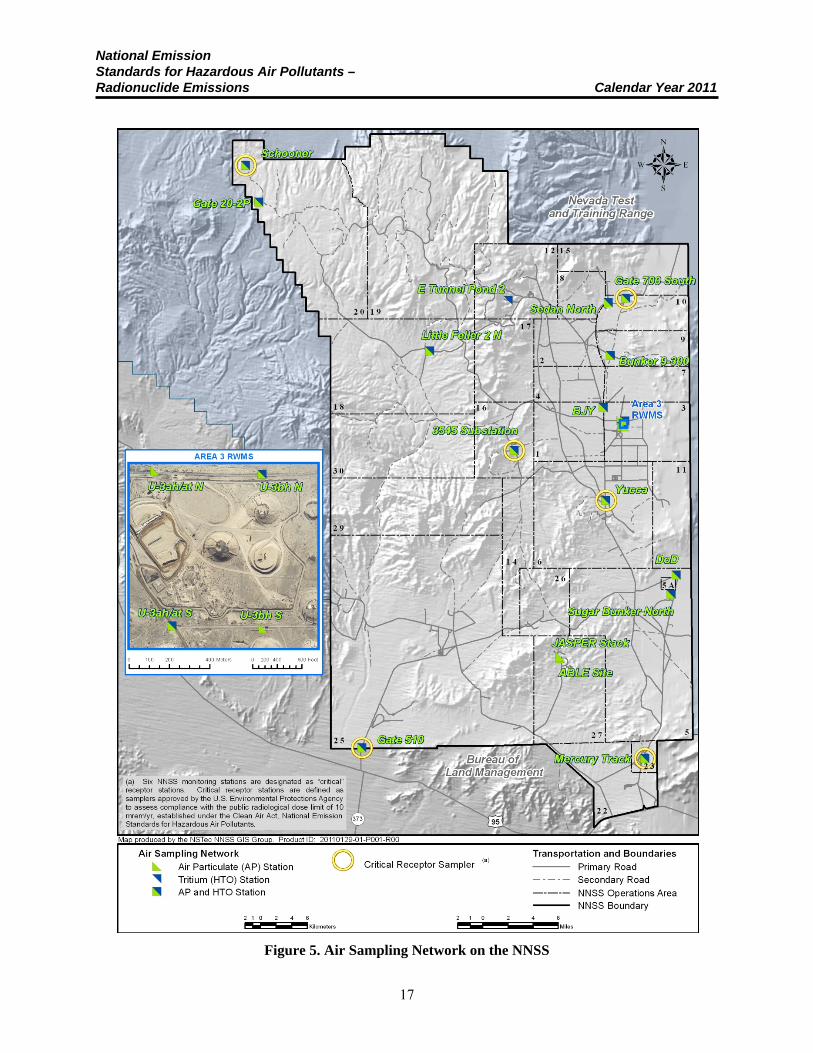
DOSE ASSESSMENT METHOD The NNSS demonstrates compliance with dose limits using environmental measurements of radionuclide air concentrations near the NNSS borders and near areas of known potential sources of radionuclide emissions. This critical receptor method was approved by EPA Region 9 for use on the NNSS in 2001 (EPA, 2001a) and has been the sole method used to demonstrate compliance since 2005. The six approved critical receptor locations are listed below and displayed in Figure 4 with NNSS emission locations and in Figure 5 along with the entire NNSS air sampling network.
Area 6, Yucca Area 10, Gate 700 Area 16, Substation 3545 Area 20, Schooner Area 23, Mercury Track Area 25, Gate 510
These can be thought of as pseudo-critical receptor locations because no person actually resides at these onsite locations. They are used as such to conservatively represent hypothetical offsite critical receptors. Table 6 displays the distances between the critical receptor monitoring stations and points of interest offsite as well as their distance from the closest onsite emission location.
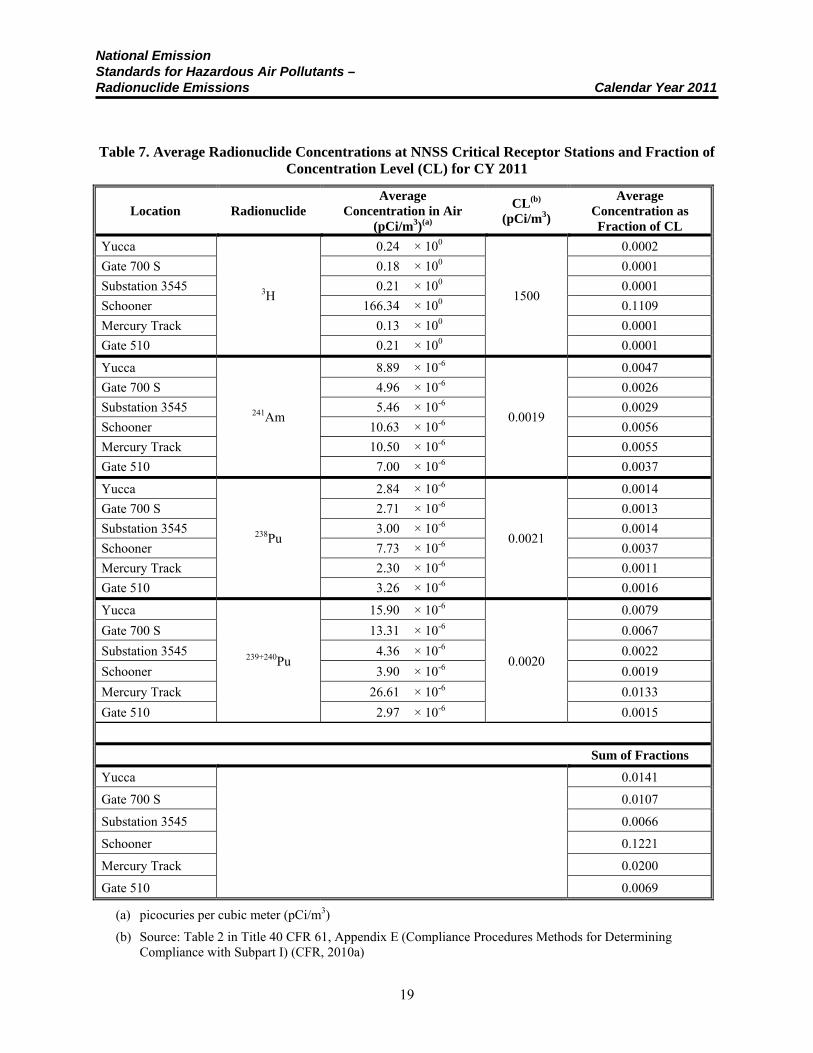
Compliance with the NESHAP inhalation dose limit to the public of 10 mrem/yr is demonstrated if the measured annual average concentration of each detected radionuclide at each of these six locations is less than the NESHAP Concentration Levels (CLs) for Environmental Compliance. The CLs represent the annual average concentration of each radionuclide that would result in an EDE of 10 mrem/yr (see Table 7). For multiple radionuclides, compliance with NESHAP is demonstrated when the sum of the fractions (determined by dividing each radionuclide’s concentration by its CL and then adding the fractions together) is less than 1.0. The CY 2011 air sampling results from the six compliance stations are presented in Table 7.
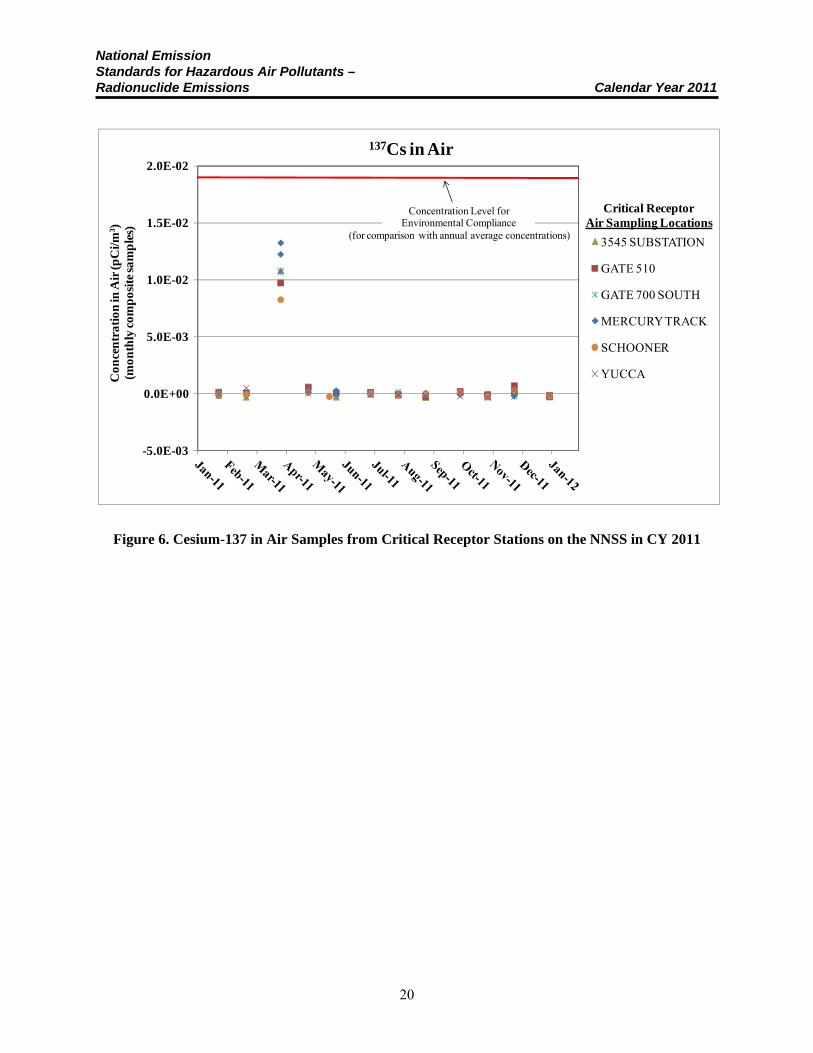
On March 11, 2011, a large earthquake and resulting tsunami caused extensive damage to the Fukushima Daiichi nuclear power plant in Japan (Institute of Nuclear Power Operations, 2011). A relatively large release of fission products resulted from this accident. Radionuclides from this release were detected in air samples throughout the northern hemisphere (Bolsunovsky and Dementyev, 2011; Carvalho et al., in press; Thakur et al., 2012) including southern Nevada. These Japan-based radionuclides (131I, 134Cs, and 137Cs) were observed consistently across the entire NNSS during the last 2 weeks of March (Figure 6), which agrees well with the timing of other detections across the western United States (Leon et al., 2011), including those made by the EPA (2011) and the Desert Research Institute (Community Environmental Monitoring Program, 2011). In addition, because the only detections of 131I, 134Cs, and 137Cs on the NNSS were during the month of March, it is determined that these radionuclides originated solely from the Fukushima Daiichi nuclear power plant in Japan and not from operations on the NNSS; these radionuclides are therefore not included in the compliance assessment summarized in Table 7.
National Emission Standards for Hazardous Air Pollutants – Radionuclide Emissions Calendar Year 2011
16
COMPLIANCE ASSESSMENT
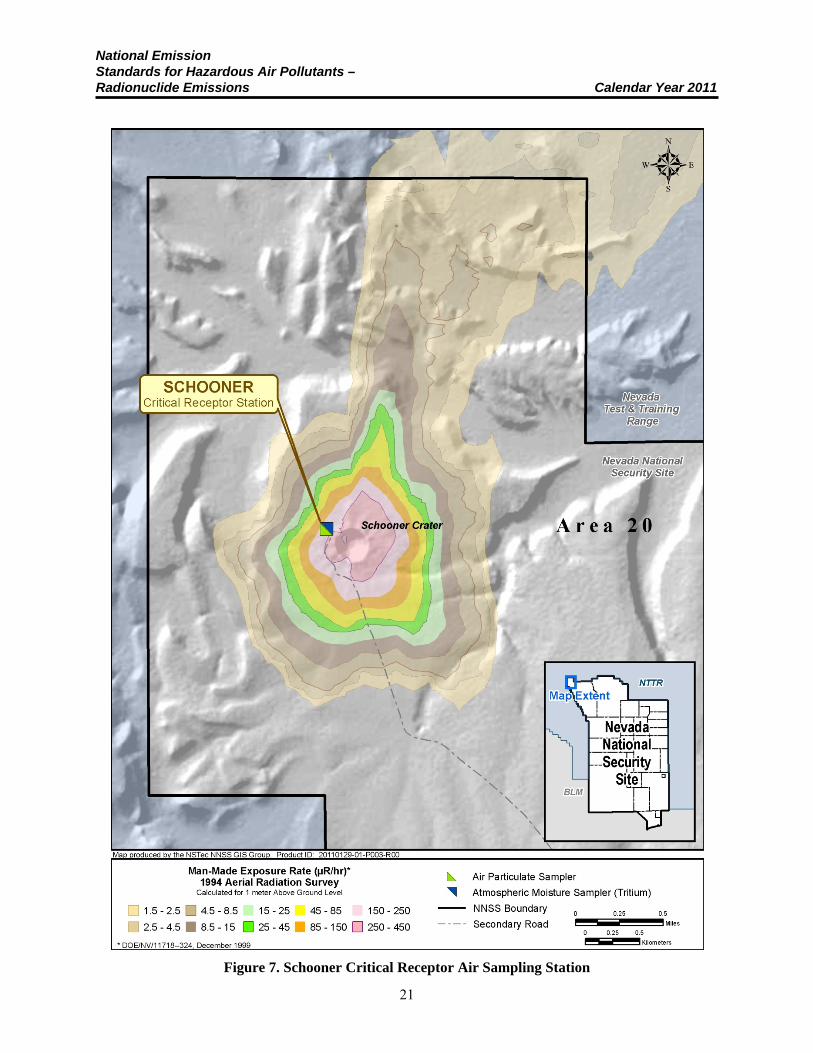
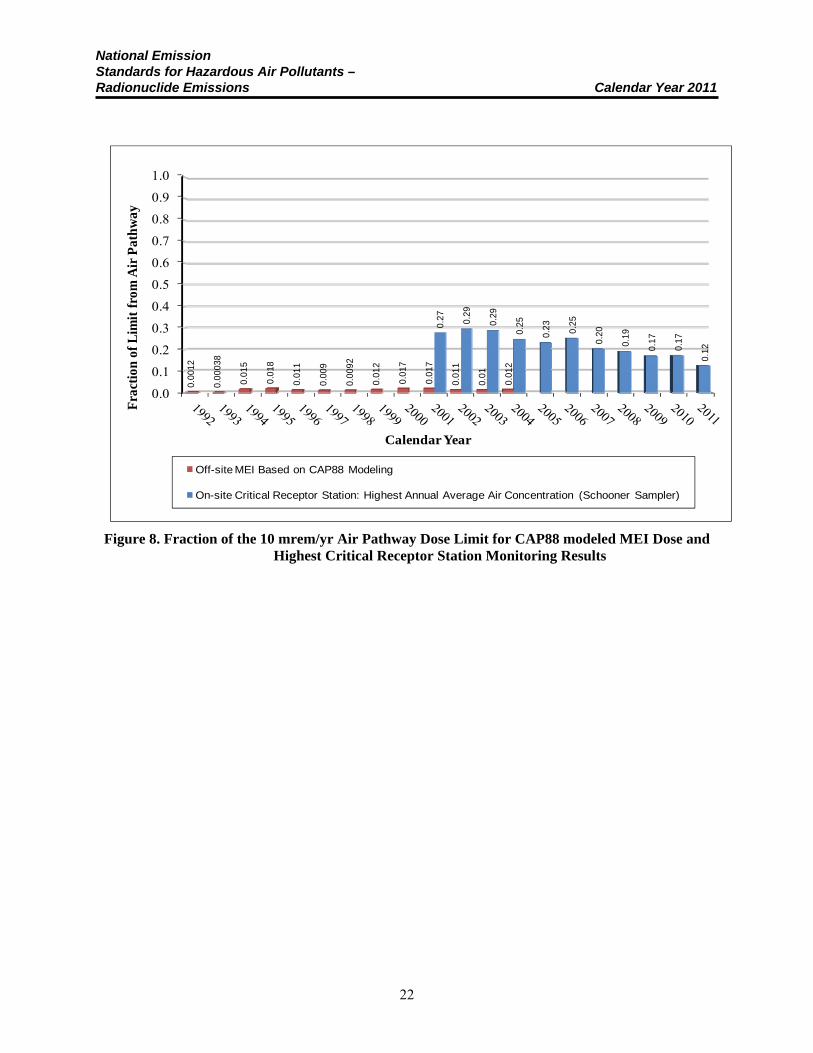
Table 7 lists the average concentrations of detected radionuclides and their fraction of the NESHAP compliance level for each of the six NNSS critical receptor stations. The concentration average for each detected man-made radionuclide was below 2% of the CLs except for the 3H average at the Schooner sampler station, which was about 11% of the CL. The average concentration of 3H is high at Schooner because the air sampler is only 269 meters (m) from the center of the crater and located within the area that received ejecta from the cratering experiment (Figure 7). At the Schooner station, the highest sum of the fractions of measured annual concentrations divided by the NESHAP CL for each radionuclide was 0.122, well below 1.0 and therefore in compliance. Scaling this 0.122 sum of fractions for the Schooner station to the 10 mrem/yr limit gives an estimated EDE of 1.2 mrem/yr from the air pathway for a hypothetical individual living year-round at this station. A more realistic estimate of dose to the maximally exposed individual (MEI) would be from the Gate 510 station, which is the closest to a public receptor (about 3.5 km). Scaling the 0.0069 sum of fractions for the Gate 510 station to the 10 mrem/yr limit gives an estimated EDE of about 0.07 mrem/yr from air emissions for a hypothetical individual living year-round at the Gate 510 station. For comparison, the fraction of the 10 mrem/yr air pathway dose limit from CAP-88 modeled MEI dose estimates from CY 1992 to CY 2004 are displayed in Figure 8 along with the highest critical receptor station monitoring results (Schooner) from CY 2005 to CY 2011.
National Emission Standards for Hazardous Air Pollutants – Radionuclide Emissions Calendar Year 2011
17
Figure 5. Air Sampling Network on the NNSS
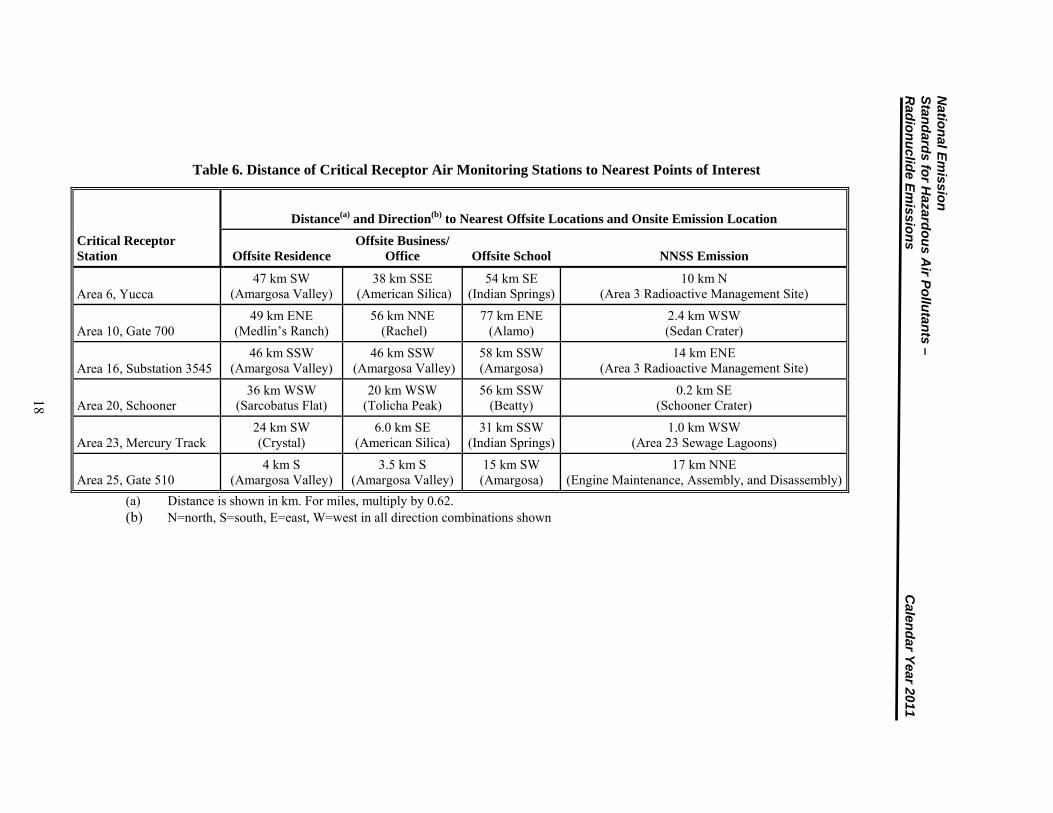
Table 6. Distance of Critical Receptor Air Monitoring Stations to Nearest Points of Interest
(a) Distance is shown in km. For miles, multiply by 0.62. (b) N=north, S=south, E=east, W=west in all direction combinations shown
Natio
nal E
missio
n
Stan
dard
s for H
azardo
us A
ir Po
llutan
ts – R
adio
nu
clide E
missio
ns
Calen
dar Y
ear 2011
18
Distance(a) and Direction(b) to Nearest Offsite Locations and Onsite Emission Location
Critical Receptor Station Offsite Residence
Offsite Business/ Office Offsite School NNSS Emission
Area 6, Yucca 47 km SW
(Amargosa Valley) 38 km SSE
(American Silica) 54 km SE
(Indian Springs)10 km N
(Area 3 Radioactive Management Site)
Area 10, Gate 700 49 km ENE
(Medlin’s Ranch) 56 km NNE
(Rachel) 77 km ENE
(Alamo) 2.4 km WSW (Sedan Crater)
Area 16, Substation 3545 46 km SSW
(Amargosa Valley) 46 km SSW
(Amargosa Valley)58 km SSW (Amargosa)
14 km ENE (Area 3 Radioactive Management Site)
Area 20, Schooner 36 km WSW
(Sarcobatus Flat) 20 km WSW
(Tolicha Peak) 56 km SSW
(Beatty) 0.2 km SE
(Schooner Crater)
Area 23, Mercury Track 24 km SW (Crystal)
6.0 km SE (American Silica)
31 km SSW (Indian Springs)
1.0 km WSW (Area 23 Sewage Lagoons)
Area 25, Gate 510 4 km S
(Amargosa Valley) 3.5 km S
(Amargosa Valley) 15 km SW (Amargosa)
17 km NNE (Engine Maintenance, Assembly, and Disassembly)
National Emission Standards for Hazardous Air Pollutants – Radionuclide Emissions Calendar Year 2011
19
Table 7. Average Radionuclide Concentrations at NNSS Critical Receptor Stations and Fraction of Concentration Level (CL) for CY 2011
Location Radionuclide Average
Concentration in Air (pCi/m3)(a)
CL(b) (pCi/m3)
Average Concentration as Fraction of CL
Yucca
3H
0.24 × 100
1500
0.0002
Gate 700 S 0.18 × 100 0.0001
Substation 3545 0.21 × 100 0.0001
Schooner 166.34 × 100 0.1109
Mercury Track 0.13 × 100 0.0001
Gate 510 0.21 × 100 0.0001
Yucca
241Am
8.89 × 10⁻⁶
0.0019
0.0047
Gate 700 S 4.96 × 10⁻⁶ 0.0026
Substation 3545 5.46 × 10⁻⁶ 0.0029
Schooner 10.63 × 10⁻⁶ 0.0056
Mercury Track 10.50 × 10⁻⁶ 0.0055
Gate 510 7.00 × 10⁻⁶ 0.0037
Yucca
238Pu
2.84 × 10⁻⁶
0.0021
0.0014
Gate 700 S 2.71 × 10⁻⁶ 0.0013
Substation 3545 3.00 × 10⁻⁶ 0.0014
Schooner 7.73 × 10⁻⁶ 0.0037
Mercury Track 2.30 × 10⁻⁶ 0.0011
Gate 510 3.26 × 10⁻⁶ 0.0016
Yucca
239+240Pu
15.90 × 10⁻⁶
0.0020
0.0079
Gate 700 S 13.31 × 10⁻⁶ 0.0067
Substation 3545 4.36 × 10⁻⁶ 0.0022
Schooner 3.90 × 10⁻⁶ 0.0019
Mercury Track 26.61 × 10⁻⁶ 0.0133
Gate 510 2.97 × 10⁻⁶ 0.0015
Sum of Fractions
Yucca
0.0141
Gate 700 S 0.0107
Substation 3545 0.0066
Schooner 0.1221
Mercury Track 0.0200
Gate 510 0.0069
(a) picocuries per cubic meter (pCi/m3)
(b) Source: Table 2 in Title 40 CFR 61, Appendix E (Compliance Procedures Methods for Determining Compliance with Subpart I) (CFR, 2010a)
National Emission Standards for Hazardous Air Pollutants – Radionuclide Emissions Calendar Year 2011
20
Figure 6. Cesium-137 in Air Samples from Critical Receptor Stations on the NNSS in CY 2011
-5.0E-03
0.0E+00
5.0E-03
1.0E-02
1.5E-02
2.0E-02
Con
cen
trat
ion
in A
ir (p
Ci/m
3 )(m
onth
ly c
omp
osit
e sa
mp
les)
137Cs in Air
3545 SUBSTATION
GATE 510
GATE 700 SOUTH
MERCURY TRACK
SCHOONER
YUCCA
Critical ReceptorAir Sampling Locations
Concentration Level forEnvironmental Compliance
(for comparison with annual average concentrations)
National Emission Standards for Hazardous Air Pollutants – Radionuclide Emissions Calendar Year 2011
21
Figure 7. Schooner Critical Receptor Air Sampling Station
National Emission Standards for Hazardous Air Pollutants – Radionuclide Emissions Calendar Year 2011
22
Figure 8. Fraction of the 10 mrem/yr Air Pathway Dose Limit for CAP88 modeled MEI Dose and Highest Critical Receptor Station Monitoring Results
0.0
0.1
0.2
0.3
0.4
0.5
0.6
0.7
0.8
0.9
1.00.
0012
0.00
038
0.01
5
0.01
8
0.01
1
0.00
9
0.00
92
0.01
2
0.01
7
0.01
7
0.01
1
0.01
0.01
2
0.27 0.29
0.29
0.25
0.23 0.25
0.20
0.19
0.17
0.17
0.12
Fra
ctio
n of
Lim
it f
rom
Air
Pat
hway
Calendar Year
Off-site MEI Based on CAP88 Modeling
On-site Critical Receptor Station: Highest Annual Average Air Concentration (Schooner Sampler)
National Emission Standards for Hazardous Air Pollutants – Radionuclide Emissions Calendar Year 2011
23
SECTION IV ADDITIONAL INFORMATION
DOSE EVALUATIONS CONDUCTED DURING CALENDAR YEAR (CY) 2011 This section summarizes radionuclide NESHAP evaluations conducted during CY 2011 for potential radionuclide releases and radiation dose estimates from new projects, construction, modifications, or periodic confirmatory assessments of existing activities. Theses evaluations were performed in accordance with 40 CFR 61, Subpart H , and are separated into the following general categories; Environmental Restoration Projects, Waste Management Projects, Construction Projects, Research Projects, and Periodic Confirmatory Measurements. If a dose estimate to the MEI offsite was less than 0.1 mrem/yr, the emission is considered a minor source, and no additional monitoring or regulatory approval prior to the commencement of the project was required. All of the radiation dose assessments performed during CY 2011 were performed with CAP88-PC modeling software, in accordance with 40 CFR 61.93, using conservative assumptions in the software input parameters to maximize dose estimates.
ENVIRONMENTAL RESTORATION PROJECTS Under the Federal Facility Agreement and Consent Order, as amended (March 2010) between DOE, the U.S. Department of Defense, and the State of Nevada, radioactive soil contamination generated by historical NNSS activities is addressed. NNSS Environmental Restoration projects that involve the removal and haulage of materials and soil containing low concentrations of radioactivity are evaluated for potential radionuclide emissions to air and potential dose offsite. No environmental restoration activities with potential for radionuclide air emissions were conducted during CY 2011; therefore, no radiation dose assessments were performed in this category.
WASTE MANAGEMENT PROJECTS
No construction/modification activities took place at waste management facilities during CY 2011. Radionuclide emission from waste management sites are discussed in Appendix B, Tritium Emissions Estimated from Air Sampling Data.
CONSTRUCTION PROJECTS
No construction projects with potential for radionuclide emissions were initiated during CY 2011.
RESEARCH PROJECTS
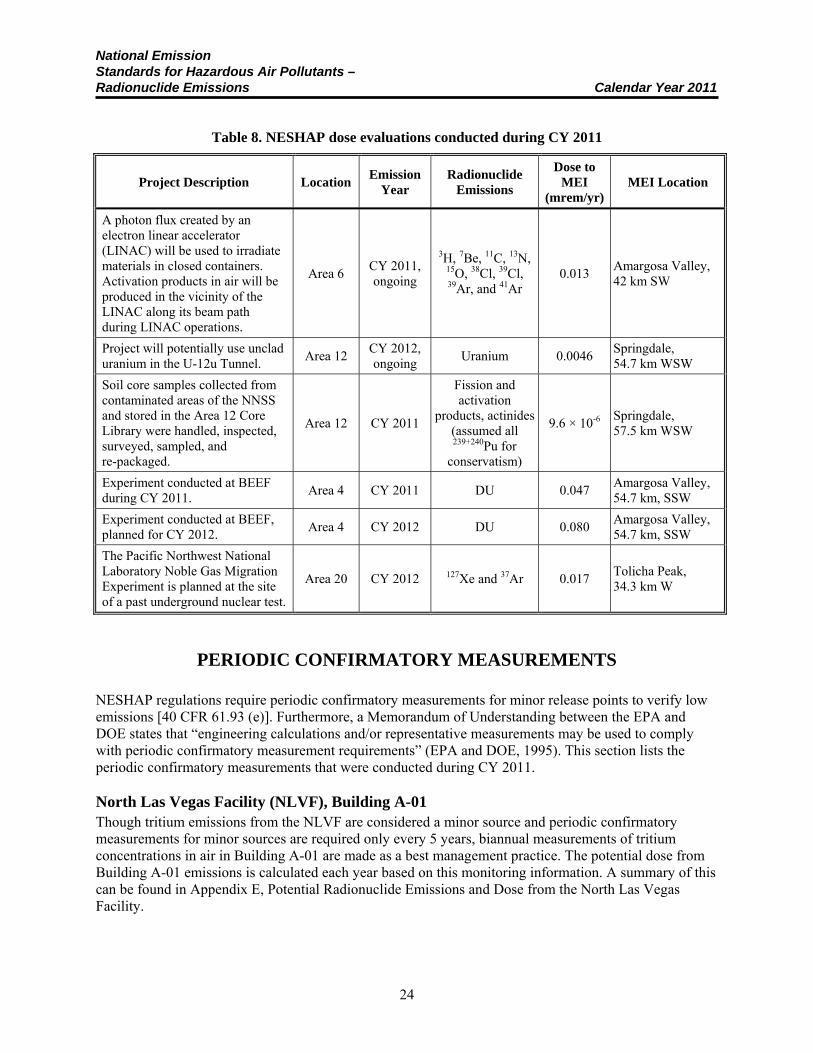
NESHAP dose evaluations were conducted for six research projects during CY 2011. Some of these projects were conducted during CY 2011 and some are for future work. A summary of each evaluation is listed in Table 8. All projects evaluated were determined to be minor emission sources.
National Emission Standards for Hazardous Air Pollutants – Radionuclide Emissions Calendar Year 2011
24
Table 8. NESHAP dose evaluations conducted during CY 2011
Project Description Location Emission
Year Radionuclide
Emissions
Dose to MEI
(mrem/yr) MEI Location
A photon flux created by an electron linear accelerator (LINAC) will be used to irradiate materials in closed containers. Activation products in air will be produced in the vicinity of the LINAC along its beam path during LINAC operations.
Area 6 CY 2011, ongoing
3H, 7Be, 11C, 13N, 15O, 38Cl, 39Cl, 39Ar, and 41Ar
0.013 Amargosa Valley, 42 km SW
Project will potentially use unclad uranium in the U-12u Tunnel.
Area 12 CY 2012, ongoing
Uranium 0.0046 Springdale, 54.7 km WSW
Soil core samples collected from contaminated areas of the NNSS and stored in the Area 12 Core Library were handled, inspected, surveyed, sampled, and re-packaged.
Area 12 CY 2011
Fission and activation
products, actinides (assumed all 239+240Pu for
conservatism)
9.6 × 10⁻⁶ Springdale, 57.5 km WSW
Experiment conducted at BEEF during CY 2011.
Area 4 CY 2011 DU 0.047 Amargosa Valley, 54.7 km, SSW
Experiment conducted at BEEF, planned for CY 2012.
Area 4 CY 2012 DU 0.080 Amargosa Valley, 54.7 km, SSW
The Pacific Northwest National Laboratory Noble Gas Migration Experiment is planned at the site of a past underground nuclear test.
Area 20 CY 2012 127Xe and 37Ar 0.017 Tolicha Peak, 34.3 km W
PERIODIC CONFIRMATORY MEASUREMENTS NESHAP regulations require periodic confirmatory measurements for minor release points to verify low emissions [40 CFR 61.93 (e)]. Furthermore, a Memorandum of Understanding between the EPA and DOE states that “engineering calculations and/or representative measurements may be used to comply with periodic confirmatory measurement requirements” (EPA and DOE, 1995). This section lists the periodic confirmatory measurements that were conducted during CY 2011. North Las Vegas Facility (NLVF), Building A-01 Though tritium emissions from the NLVF are considered a minor source and periodic confirmatory measurements for minor sources are required only every 5 years, biannual measurements of tritium concentrations in air in Building A-01 are made as a best management practice. The potential dose from Building A-01 emissions is calculated each year based on this monitoring information. A summary of this can be found in Appendix E, Potential Radionuclide Emissions and Dose from the North Las Vegas Facility.
National Emission Standards for Hazardous Air Pollutants – Radionuclide Emissions Calendar Year 2011
25
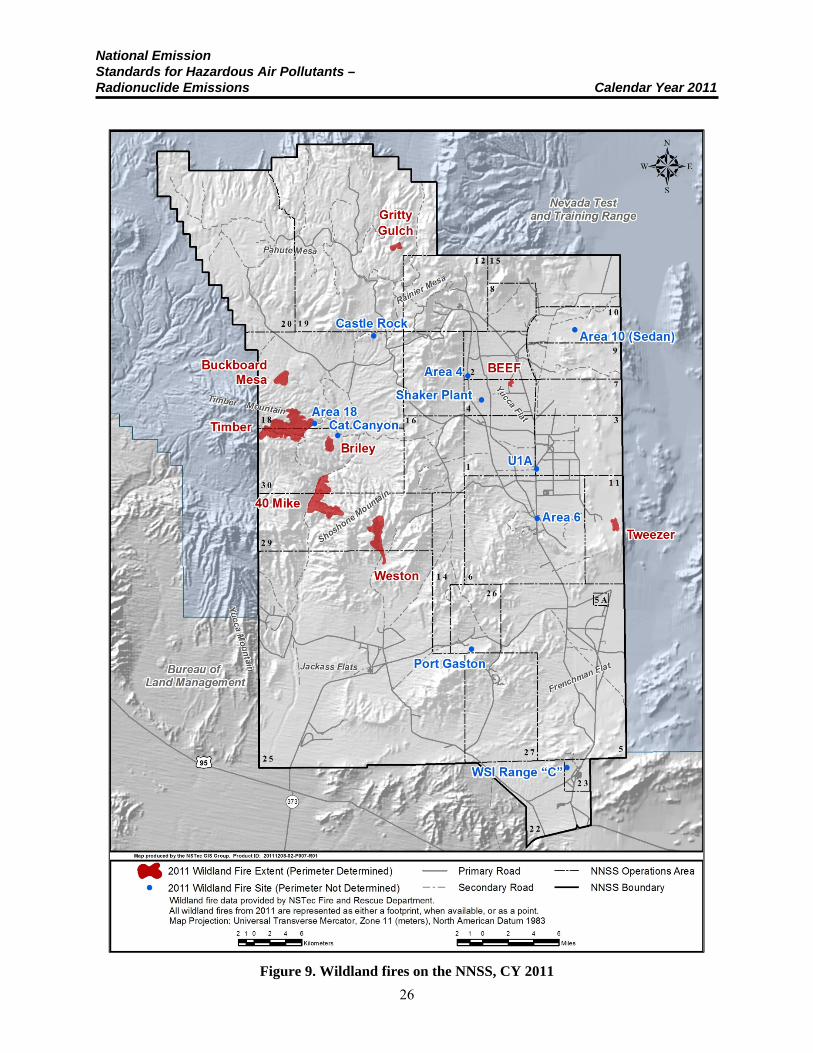
UNPLANNED RELEASES There were no unplanned radionuclide releases during CY 2011. Multiple wildland fires did occur on the NNSS during CY 2011 (Figure 9), but results from high volume (approximately 30 cubic foot per minute) air samplers deployed to monitor the Timber and Weston fires did not indicate any man-made radionuclides present. Also, routine air monitoring results throughout the year were not significantly elevated so radionuclide emissions from these fires were negligible.
National Emission Standards for Hazardous Air Pollutants – Radionuclide Emissions Calendar Year 2011
26
Figure 9. Wildland fires on the NNSS, CY 2011

National Emission Standards for Hazardous Air Pollutants – Radionuclide Emissions Calendar Year 2011
28
This page intentionally left blank
National Emission Standards for Hazardous Air Pollutants – Radionuclide Emissions Calendar Year 2011
29
REFERENCES Bolsunovsky, A., and D. Dementyev, 2011. Evidence of the radioactive fallout in the center of Asia
(Russia) following the Fukushima Nuclear Accident. Journal of Environmental Radioactivity, 102 (11), 1062–1064.
Carvalho, F. P., M. C. Reis, J. M. Oliveira, M. Malta, and L. Silva. In Press. Radioactivity from Fukushima nuclear accident detected in Lisbon, Portugal. Journal of Environmental Radioactivity (accessed online, May 7, 2012, at http://www.sciencedirect.com/science/article/pii/S0265931X12000707).
CFR, see Code of Federal Regulations.
Code of Federal Regulations, 2010a. National Emission Standards for Hazardous Air Pollutants: Radionuclides, Title 40, Part 61, U.S. Environmental Protection Agency, Washington, D.C.
Code of Federal Regulations, 2010b. Occupational Radiation Protection, Title 10, Part 835, U.S. Environmental Protection Agency, Washington, D.C.
Community Environmental Monitoring Program, 2011. Desert Research Institute. http://www.cemp.dri.edu/japan_response.html (accessed May 7, 2012).
DOE, see U.S. Department of Energy.
EPA, see U.S. Environmental Protection Agency.
Grossman, R. F., 2005. National Emission Standards for Hazardous Air Pollutants Calendar Year 2004, DOE/NV/11718--1065, U.S. Department of Energy, National Nuclear Security Administration Nevada Site Office, Las Vegas, NV.
Hendricks, T. J., and S. R. Riedhauser, 1999. An Aerial Radiological Survey of the Nevada Test Site, DOE/NV/11718--324, U.S. Department of Energy, Nevada Operations Office, Las Vegas, NV.
Institute of Nuclear Power Operations, 2011. Special Report on the Nuclear Accident at the Fukushima Daiichi Nuclear Power Station. INPO 11-005. Institute of Nuclear Power Operations, Atlanta, GA.
Leon, J. D., D. A. Jaffe, J. Kaspar, A. Knecht, M. L. Miller, R. G. H. Robertson, and A. G. Schubert, 2011. Arrival time and magnitude of airborne fission products from the Fukushima, Japan, reactor incident as measured in Seattle, WA, USA. Journal of Environmental Radioactivity 102 (11), 1032–1038.
National Security Technologies, LLC, 2010. 2009 Waste Management Monitoring Report, Area 3 and Area 5 Radioactive Waste Management Sites, DOE/NV/25946--1009, U.S. Department of Energy, National Nuclear Security Administration Nevada Site Office, Las Vegas, NV.
National Security Technologies, LLC, 2011. National Emission Standards for Hazardous Air Pollutants – Radionuclide Emissions Calendar Year 2010, DOE/NV/25946--1243, U.S. Department of Energy, National Nuclear Security Administration Nevada Site Office, Las Vegas, NV.
Shott, G. J., L. E. Barker, S. E. Rawlinson, M. J. Sully, and B. A. Moore, 1998. Performance Assessment for the Area 5 Radioactive Waste Management Site at the Nevada Test Site, Nye County, Nevada, Revision 2.1, DOE/NV/11718--176, Bechtel Nevada, Las Vegas, NV.
National Emission Standards for Hazardous Air Pollutants – Radionuclide Emissions Calendar Year 2011
30
Thakur, P., S. Ballard, and R. Nelson, 2012. Radioactive fallout in the United States due to the Fukushima nuclear plant accident. Journal of Environmental Monitoring, 5(14), 1317-1324.
U.S. Department of Energy, 1991. Radionuclides in Surface Soil at the Nevada Test Site, DOE/NV/10845--02, Water Resources Center, Desert Research Institute, University of Nevada System, Las Vegas, NV.
U.S. Department of Energy, 1992. Summary of the Nevada Applied Ecology Group and Correlative Programs, DOE/NV--357, Raytheon Services Nevada, Las Vegas, NV.
U.S. Department of Energy, 1996a. Final Environmental Impact Statement for the Nevada Test Site and Off-Site Locations in the State of Nevada, DOE/EIS 0243, U.S. Department of Energy, Nevada Operations Office, Las Vegas, NV.
U.S. Department of Energy, 1996b. National Emission Standards for Hazardous Air Pollutants Submittal - 1995, DOE/NV/11718--032, U.S. Department of Energy, Nevada Operations Office, Las Vegas, NV.
U.S. Department of Energy, 1999a. Radioactive Waste Management, DOE O 435.1, Office of Environmental Management, Washington, D.C.
U.S. Department of Energy, 1999b. Radioactive Waste Management Manual, DOE M 435.1-1, Office of Environmental Management, Washington, D.C.
U.S. Department of Energy, 2000. United States Nuclear Tests: July 1945 through September 1992, DOE/NV--209 (Revision 15), Nevada Operations Office, Las Vegas, NV.
U.S. Department of Energy, 2003. Routine Radiological Environmental Monitoring Plan, DOE/NV/11718--804, U.S. Department of Energy, Nevada Operations Office, Las Vegas, NV.
U.S. Department of Energy, 2004. Email from Gustavo Vazquez, DOE/EH-41, to Bruce W. Hurley, NNSA/NSO, dated April 1, 2004.
U.S. Department of Energy, 2005. Quality Assurance, DOE O 414.1C, June 17, 2005, Washington, D.C.
U.S. Environmental Protection Agency, 2001a. Approval Letter for the NNSS Use of Critical Receptor Monitoring. Letter from Jack P. Broadbent, EPA Region IX Director, Air Division, to Kenneth A. Hoar, DOE Nevada Field Office, Environmental, Safety & Health Division, July 23, 2001.
U.S. Environmental Protection Agency, 2001b. Test Methods for Measuring Radionuclide Emissions from Stationary Sources, Title 40 Code of Regulations, Part 61, Appendix B, Method 114, July 1, 2001 Edition.
U.S. Environmental Protection Agency, 2006. Updated User’s Guide for CAP88-PC, Version 3.0, Office of Radiation and Indoor Air, Washington, D.C.
U.S. Environmental Protection Agency, 2011. Japanese Nuclear Emergency: EPA’s Radiation Monitoring. http://www.epa.gov/japan2011/ (accessed May 7, 2012).
U.S. Environmental Protection Agency and U.S. Department of Energy, 1995. U.S. Memorandum of Understanding Between the U.S. Environmental Protection Agency and the U.S. Department of Energy Concerning the Clean Air Act Emission Standards for Radionuclides 40 CFR Part 61,
National Emission Standards for Hazardous Air Pollutants – Radionuclide Emissions Calendar Year 2011
31
Including Subparts H, I, Q & T. Signed by Mary D. Nichols, EPA Assistant Administrator for Air and Radiation, September 29, 1994. Signed by Tara O’Toole, DOE Assistant Secretary for Environment, Safety, and Health, April 5, 1995.
U.S. Nuclear Regulatory Commission, 1983. Radiological Assessment, NUREG/CR-3332, Till, J. E., and H. R. Meyer, Editors, Office of Nuclear Reactor Regulation, Washington, D.C.
UT-Battelle, LLC, 2011. LandScan Ambient Population Distribution Dataset. UT-Battelle, LLC, Oak Ridge, TN.

National Emission Standards for Hazardous Air Pollutants – Radionuclide Emissions Calendar Year 2011
32
This page intentionally left blank
National Emission Standards for Hazardous Air Pollutants – Radionuclide Emissions Calendar Year 2011
APPENDICES

National Emission Standards for Hazardous Air Pollutants – Radionuclide Emissions Calendar Year 2011
This page intentionally left blank
Appendix A
Potential National Emission Standards for Hazardous Air Pollutants (NESHAP) Sources
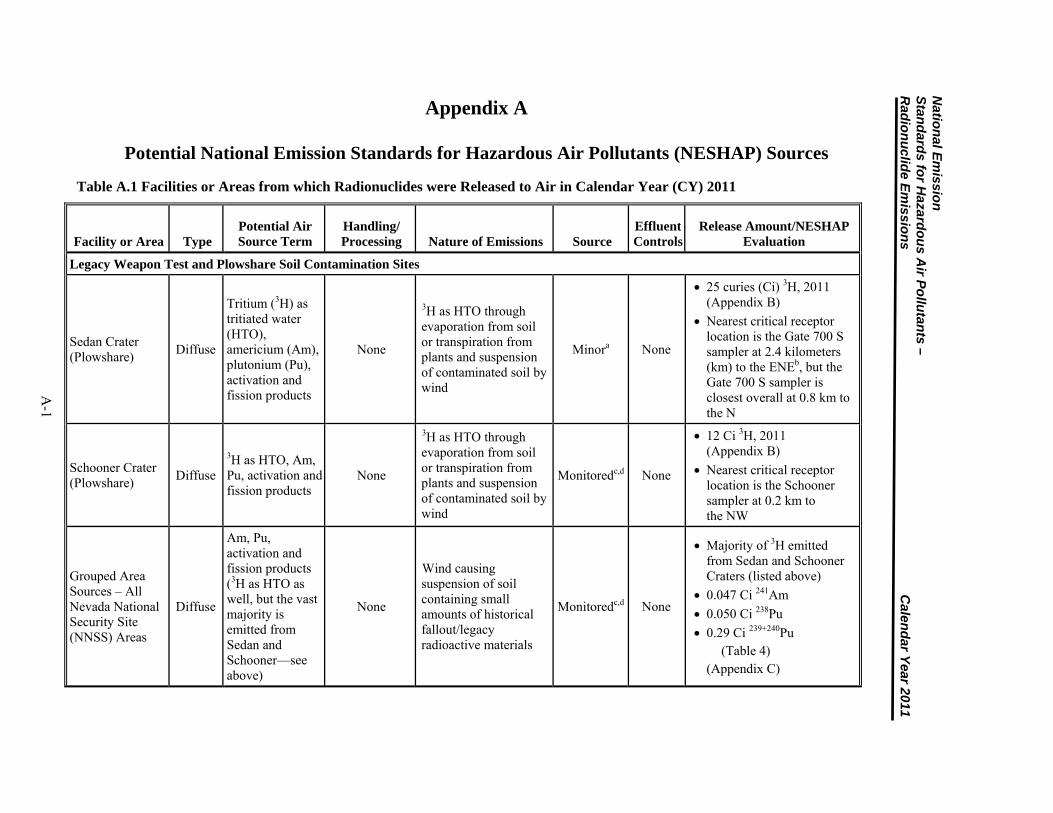
Table A.1 Facilities or Areas from which Radionuclides were Released to Air in Calendar Year (CY) 2011
Facility or Area Type Potential Air Source Term
Handling/ Processing Nature of Emissions Source
Effluent Controls
Release Amount/NESHAP Evaluation
Legacy Weapon Test and Plowshare Soil Contamination Sites
Sedan Crater (Plowshare)
Diffuse
Tritium (3H) as tritiated water (HTO), americium (Am), plutonium (Pu), activation and fission products
None
3H as HTO through evaporation from soil or transpiration from plants and suspension of contaminated soil by wind
Minora None
25 curies (Ci) 3H, 2011 (Appendix B)
Nearest critical receptor location is the Gate 700 S sampler at 2.4 kilometers (km) to the ENEb, but the Gate 700 S sampler is closest overall at 0.8 km to the N
Schooner Crater (Plowshare)
Diffuse
3H as HTO, Am, Pu, activation and fission products
None
3H as HTO through evaporation from soil or transpiration from plants and suspension of contaminated soil by wind
Monitoredc,d None
12 Ci 3H, 2011 (Appendix B)
Nearest critical receptor location is the Schooner sampler at 0.2 km to the NW
Grouped Area Sources – All Nevada National Security Site (NNSS) Areas
Diffuse
Am, Pu, activation and fission products (3H as HTO as well, but the vast majority is emitted from Sedan and Schooner—see above)
None
Wind causing suspension of soil containing small amounts of historical fallout/legacy radioactive materials
Monitoredc,d None
Majority of 3H emitted from Sedan and Schooner Craters (listed above)
0.047 Ci 241Am
0.050 Ci 238Pu
0.29 Ci 239+240Pu (Table 4) (Appendix C)
A-1
Natio
nal E
missio
n
Stan
dard
s for H
azardo
us A
ir Po
llutan
ts – R
adio
nu
clide E
missio
ns
Calen
dar Y
ear 2011
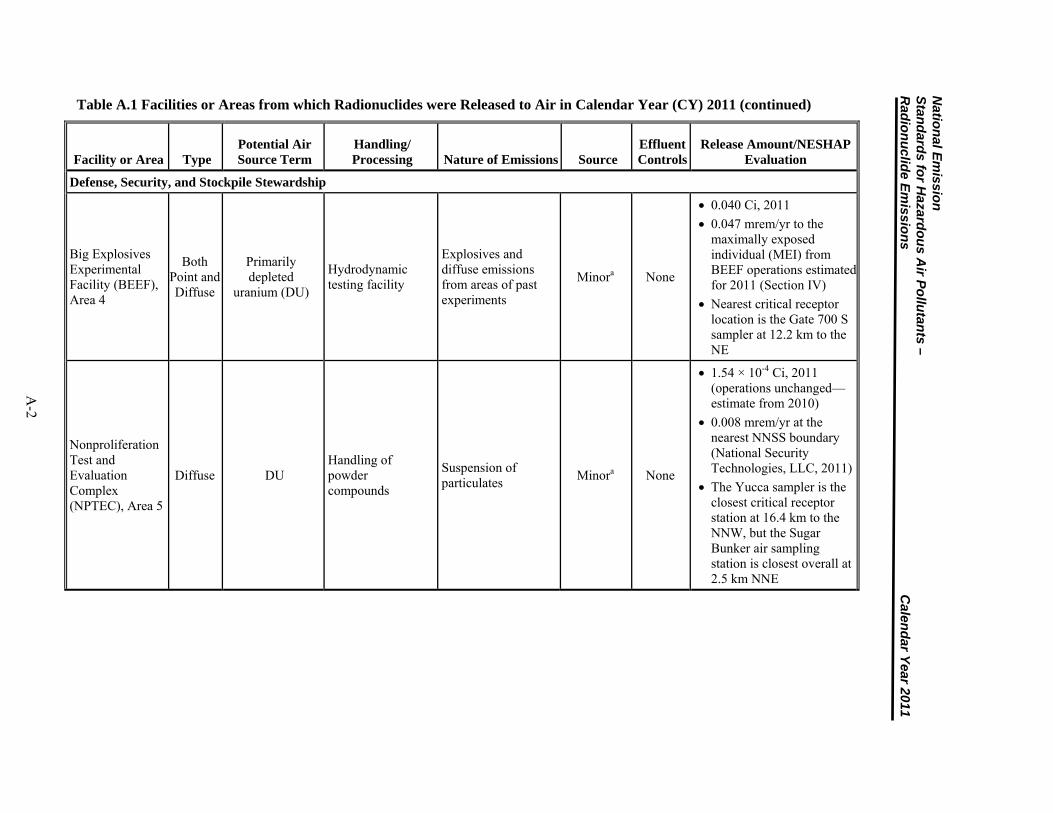
Table A.1 Facilities or Areas from which Radionuclides were Released to Air in Calendar Year (CY) 2011 (continued)
Facility or Area Type Potential Air Source Term
Handling/ Processing Nature of Emissions Source
Effluent Controls
Release Amount/NESHAP Evaluation
Defense, Security, and Stockpile Stewardship
Big Explosives Experimental Facility (BEEF), Area 4
Both Point and Diffuse
Primarily depleted
uranium (DU)
Hydrodynamic testing facility
Explosives and diffuse emissions from areas of past experiments
Minora None
0.040 Ci, 2011
0.047 mrem/yr to the maximally exposed individual (MEI) from BEEF operations estimated for 2011 (Section IV)
Nearest critical receptor location is the Gate 700 S sampler at 12.2 km to the NE
Nonproliferation Test and Evaluation Complex (NPTEC), Area 5
Diffuse DU Handling of powder compounds
Suspension of particulates
Minora None
1.54 × 10⁻⁴ Ci, 2011 (operations unchanged—estimate from 2010)
0.008 mrem/yr at the nearest NNSS boundary (National Security Technologies, LLC, 2011)
The Yucca sampler is the closest critical receptor station at 16.4 km to the NNW, but the Sugar Bunker air sampling station is closest overall at 2.5 km NNE
Natio
nal E
missio
n
Stan
dard
s for H
azardo
us A
ir Po
llutan
ts – R
adio
nu
clide E
missio
ns
Calen
dar Y
ear 2011
A-2
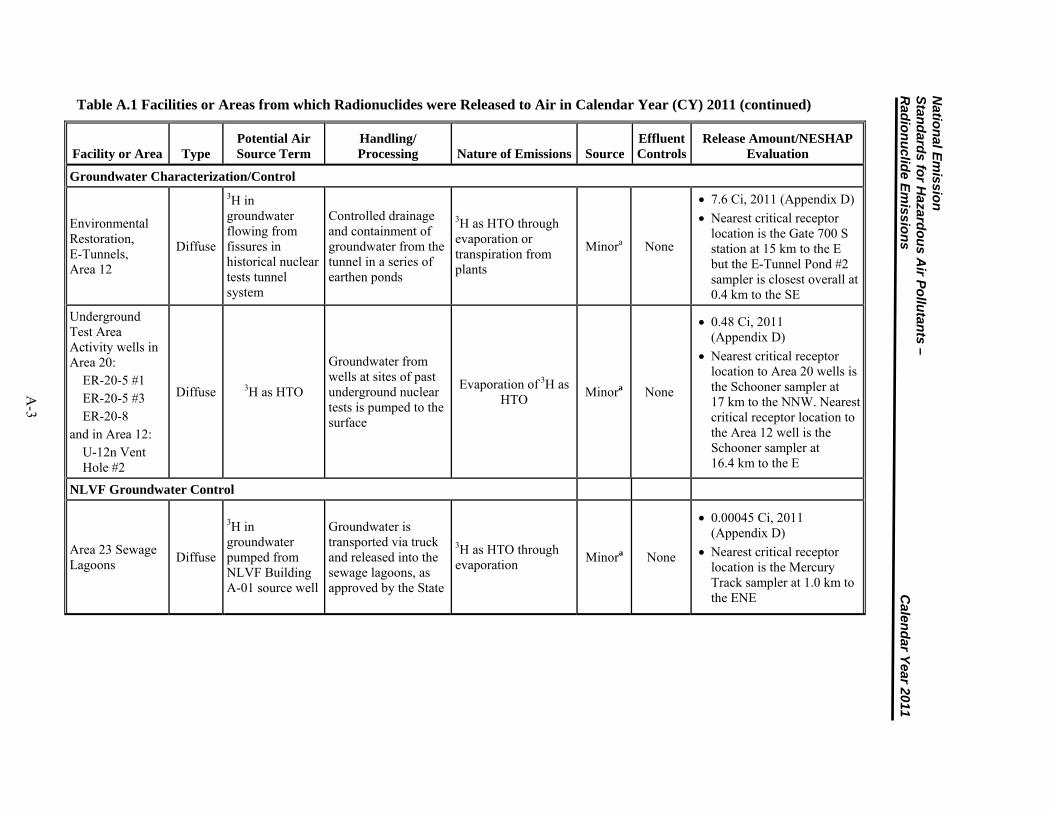
Table A.1 Facilities or Areas from which Radionuclides were Released to Air in Calendar Year (CY) 2011 (continued)
Facility or Area Type Potential Air Source Term
Handling/ Processing Nature of Emissions Source
Effluent Controls
Release Amount/NESHAP Evaluation
Groundwater Characterization/Control
Environmental Restoration, E-Tunnels, Area 12
Diffuse
3H in groundwater flowing from fissures in historical nuclear tests tunnel system
Controlled drainage and containment of groundwater from the tunnel in a series of earthen ponds
3H as HTO through evaporation or transpiration from plants
Minora None
7.6 Ci, 2011 (Appendix D)
Nearest critical receptor location is the Gate 700 S station at 15 km to the E but the E-Tunnel Pond #2 sampler is closest overall at 0.4 km to the SE
Underground Test Area Activity wells in Area 20:
ER-20-5 #1 ER-20-5 #3 ER-20-8
and in Area 12: U-12n Vent Hole #2
Diffuse 3H as HTO
Groundwater from wells at sites of past underground nuclear tests is pumped to the surface
Evaporation of 3H as HTO
Minora None
0.48 Ci, 2011 (Appendix D)
Nearest critical receptor location to Area 20 wells is the Schooner sampler at 17 km to the NNW. Nearest critical receptor location to the Area 12 well is the Schooner sampler at 16.4 km to the E
NLVF Groundwater Control
Area 23 Sewage Lagoons
Diffuse
3H in groundwater pumped from NLVF Building A-01 source well
Groundwater is transported via truck and released into the sewage lagoons, as approved by the State
3H as HTO through evaporation
Minora None
0.00045 Ci, 2011 (Appendix D)
Nearest critical receptor location is the Mercury Track sampler at 1.0 km to the ENE
A-3
Natio
nal E
missio
n
Stan
dard
s for H
azardo
us A
ir Po
llutan
ts – R
adio
nu
clide E
missio
ns
Calen
dar Y
ear 2011
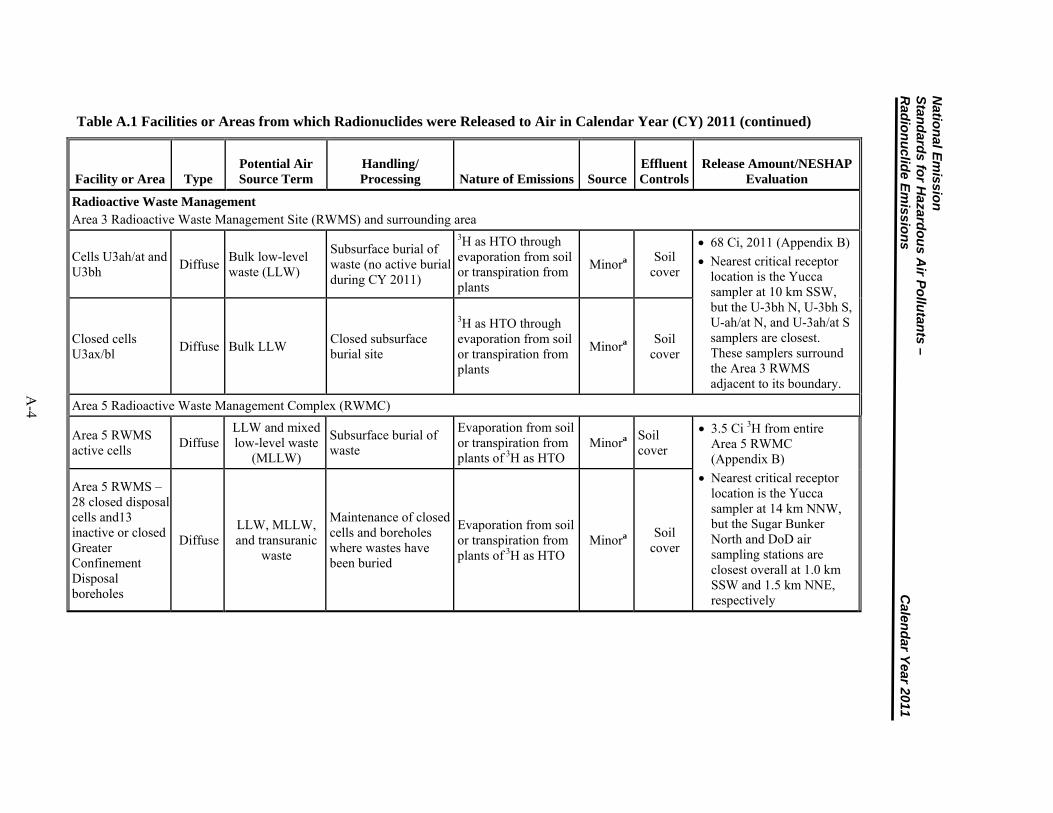
Table A.1 Facilities or Areas from which Radionuclides were Released to Air in Calendar Year (CY) 2011 (continued)
Facility or Area Type Potential Air Source Term
Handling/ Processing Nature of Emissions Source
Effluent Controls
Release Amount/NESHAP Evaluation
Radioactive Waste Management Area 3 Radioactive Waste Management Site (RWMS) and surrounding area
Cells U3ah/at and U3bh
Diffuse Bulk low-level waste (LLW)
Subsurface burial of waste (no active burial during CY 2011)
3H as HTO through evaporation from soil or transpiration from plants
Minora Soil
cover
68 Ci, 2011 (Appendix B)
Nearest critical receptor location is the Yucca sampler at 10 km SSW, but the U-3bh N, U-3bh S, U-ah/at N, and U-3ah/at S samplers are closest. These samplers surround the Area 3 RWMS adjacent to its boundary.
Closed cells U3ax/bl
Diffuse Bulk LLW Closed subsurface burial site
3H as HTO through evaporation from soil or transpiration from plants
Minora Soil
cover
Area 5 Radioactive Waste Management Complex (RWMC)
Area 5 RWMS active cells
Diffuse LLW and mixed low-level waste
(MLLW)
Subsurface burial of waste
Evaporation from soil or transpiration from plants of 3H as HTO
Minora Soil cover
3.5 Ci 3H from entire Area 5 RWMC (Appendix B)
Nearest critical receptor location is the Yucca sampler at 14 km NNW, but the Sugar Bunker North and DoD air sampling stations are closest overall at 1.0 km SSW and 1.5 km NNE, respectively
Area 5 RWMS – 28 closed disposal cells and13 inactive or closed Greater Confinement Disposal boreholes
Diffuse LLW, MLLW, and transuranic
waste
Maintenance of closed cells and boreholes where wastes have been buried
Evaporation from soil or transpiration from plants of 3H as HTO
Minora Soil
cover
A-4
Natio
nal E
missio
n
Stan
dard
s for H
azardo
us A
ir Po
llutan
ts – R
adio
nu
clide E
missio
ns
Calen
dar Y
ear 2011
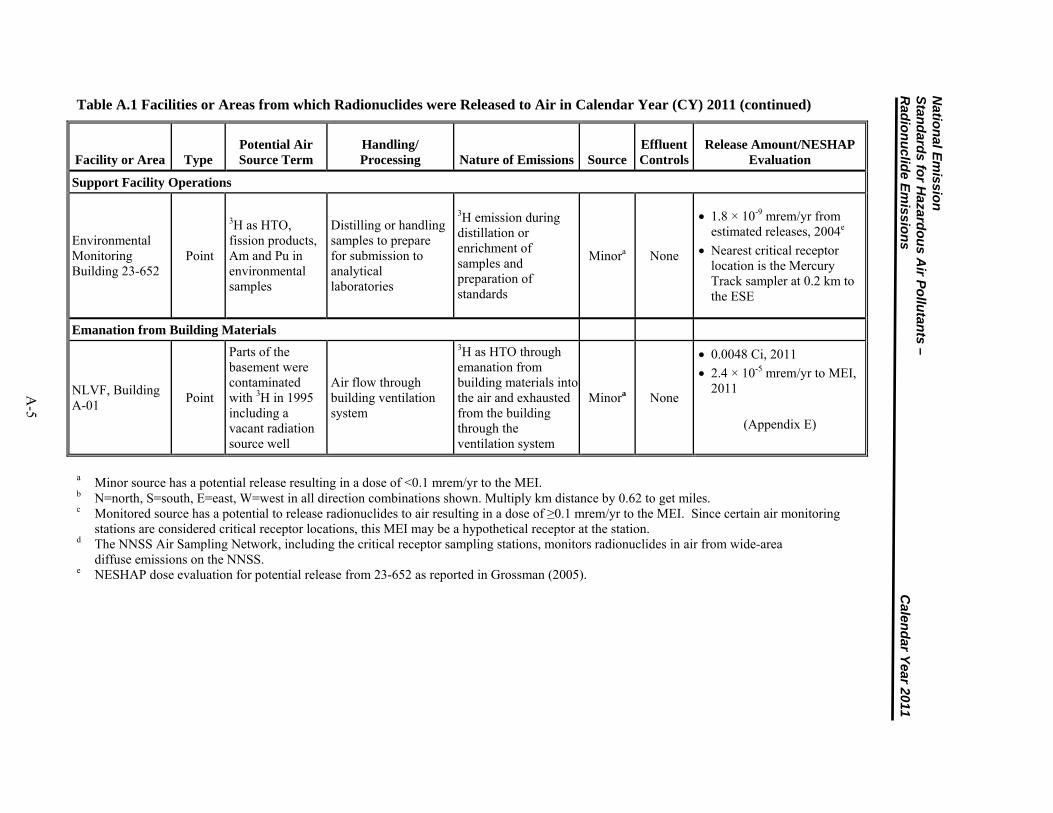
Table A.1 Facilities or Areas from which Radionuclides were Released to Air in Calendar Year (CY) 2011 (continued)
Facility or Area Type Potential Air Source Term
Handling/ Processing Nature of Emissions Source
Effluent Controls
Release Amount/NESHAP Evaluation
Support Facility Operations
Environmental Monitoring Building 23-652
Point
3H as HTO, fission products, Am and Pu in environmental samples
Distilling or handling samples to prepare for submission to analytical laboratories
3H emission during distillation or enrichment of samples and preparation of standards
Minora None
1.8 × 10⁻⁹ mrem/yr from estimated releases, 2004e
Nearest critical receptor location is the Mercury Track sampler at 0.2 km to the ESE
Emanation from Building Materials
NLVF, Building A-01
Point
Parts of the basement were contaminated with 3H in 1995 including a vacant radiation source well
Air flow through building ventilation system
3H as HTO through emanation from building materials into the air and exhausted from the building through the ventilation system
Minora None
0.0048 Ci, 2011
2.4 × 10⁻⁵ mrem/yr to MEI, 2011
(Appendix E)
a Minor source has a potential release resulting in a dose of <0.1 mrem/yr to the MEI. b N=north, S=south, E=east, W=west in all direction combinations shown. Multiply km distance by 0.62 to get miles. c Monitored source has a potential to release radionuclides to air resulting in a dose of ≥0.1 mrem/yr to the MEI. Since certain air monitoring
stations are considered critical receptor locations, this MEI may be a hypothetical receptor at the station. d The NNSS Air Sampling Network, including the critical receptor sampling stations, monitors radionuclides in air from wide-area diffuse emissions on the NNSS. e NESHAP dose evaluation for potential release from 23-652 as reported in Grossman (2005).
A-5
Natio
nal E
missio
n
Stan
dard
s for H
azardo
us A
ir Po
llutan
ts – R
adio
nu
clide E
missio
ns
Calen
dar Y
ear 2011
National Emission Standards for Hazardous Air Pollutants – Radionuclide Emissions Calendar Year 2011
A-6
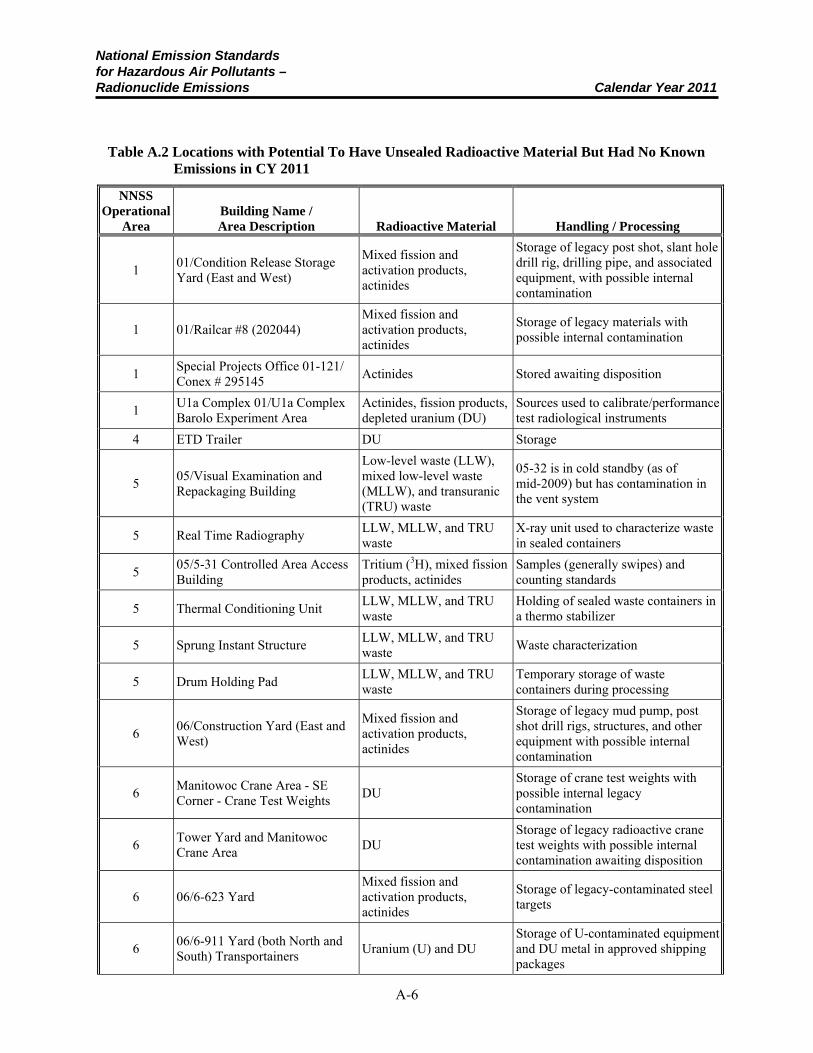
Table A.2 Locations with Potential To Have Unsealed Radioactive Material But Had No Known Emissions in CY 2011
NNSS Operational
Area Building Name / Area Description Radioactive Material Handling / Processing
1 01/Condition Release Storage Yard (East and West)
Mixed fission and activation products, actinides
Storage of legacy post shot, slant hole drill rig, drilling pipe, and associated equipment, with possible internal contamination
1 01/Railcar #8 (202044) Mixed fission and activation products, actinides
Storage of legacy materials with possible internal contamination
1 Special Projects Office 01-121/ Conex # 295145
Actinides Stored awaiting disposition
1 U1a Complex 01/U1a Complex Barolo Experiment Area
Actinides, fission products, depleted uranium (DU)
Sources used to calibrate/performance test radiological instruments
4 ETD Trailer DU Storage
5 05/Visual Examination and Repackaging Building
Low-level waste (LLW), mixed low-level waste (MLLW), and transuranic (TRU) waste
05-32 is in cold standby (as of mid-2009) but has contamination in the vent system
5 Real Time Radiography LLW, MLLW, and TRU waste
X-ray unit used to characterize waste in sealed containers
5 05/5-31 Controlled Area Access Building
Tritium (3H), mixed fission products, actinides
Samples (generally swipes) and counting standards
5 Thermal Conditioning Unit LLW, MLLW, and TRU waste
Holding of sealed waste containers in a thermo stabilizer
5 Sprung Instant Structure LLW, MLLW, and TRU waste
Waste characterization
5 Drum Holding Pad LLW, MLLW, and TRU waste
Temporary storage of waste containers during processing
6 06/Construction Yard (East and West)
Mixed fission and activation products, actinides
Storage of legacy mud pump, post shot drill rigs, structures, and other equipment with possible internal contamination
6 Manitowoc Crane Area - SE Corner - Crane Test Weights
DU Storage of crane test weights with possible internal legacy contamination
6 Tower Yard and Manitowoc Crane Area
DU Storage of legacy radioactive crane test weights with possible internal contamination awaiting disposition
6 06/6-623 Yard Mixed fission and activation products, actinides
Storage of legacy-contaminated steel targets
6 06/6-911 Yard (both North and South) Transportainers
Uranium (U) and DU Storage of U-contaminated equipment and DU metal in approved shipping packages
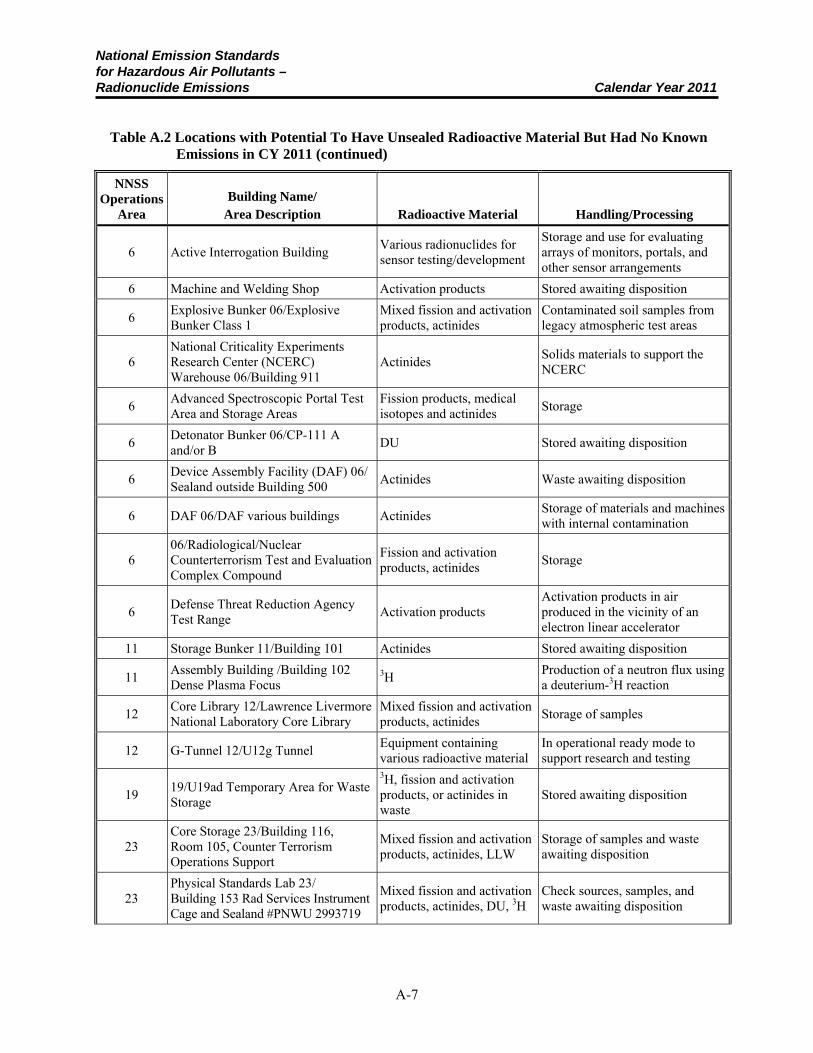
National Emission Standards for Hazardous Air Pollutants – Radionuclide Emissions Calendar Year 2011
A-7
Table A.2 Locations with Potential To Have Unsealed Radioactive Material But Had No Known Emissions in CY 2011 (continued)
NNSS Operations
Area Building Name/
Area Description Radioactive Material Handling/Processing
6 Active Interrogation Building Various radionuclides for sensor testing/development
Storage and use for evaluating arrays of monitors, portals, and other sensor arrangements
6 Machine and Welding Shop Activation products Stored awaiting disposition
6 Explosive Bunker 06/Explosive Bunker Class 1
Mixed fission and activation products, actinides
Contaminated soil samples from legacy atmospheric test areas
6 National Criticality Experiments Research Center (NCERC) Warehouse 06/Building 911
Actinides Solids materials to support the NCERC
6 Advanced Spectroscopic Portal Test Area and Storage Areas
Fission products, medical isotopes and actinides
Storage
6 Detonator Bunker 06/CP-111 A and/or B
DU Stored awaiting disposition
6 Device Assembly Facility (DAF) 06/ Sealand outside Building 500
Actinides Waste awaiting disposition
6 DAF 06/DAF various buildings Actinides Storage of materials and machines with internal contamination
6 06/Radiological/Nuclear Counterterrorism Test and Evaluation Complex Compound
Fission and activation products, actinides
Storage
6 Defense Threat Reduction Agency Test Range
Activation products Activation products in air produced in the vicinity of an electron linear accelerator
11 Storage Bunker 11/Building 101 Actinides Stored awaiting disposition
11 Assembly Building /Building 102 Dense Plasma Focus
3H Production of a neutron flux using a deuterium-3H reaction
12 Core Library 12/Lawrence Livermore National Laboratory Core Library
Mixed fission and activation products, actinides
Storage of samples
12 G-Tunnel 12/U12g Tunnel Equipment containing various radioactive material
In operational ready mode to support research and testing
19 19/U19ad Temporary Area for Waste Storage
3H, fission and activation products, or actinides in waste
Stored awaiting disposition
23 Core Storage 23/Building 116, Room 105, Counter Terrorism Operations Support
Mixed fission and activation products, actinides, LLW
Storage of samples and waste awaiting disposition
23 Physical Standards Lab 23/ Building 153 Rad Services Instrument Cage and Sealand #PNWU 2993719
Mixed fission and activation products, actinides, DU, 3H
Check sources, samples, and waste awaiting disposition
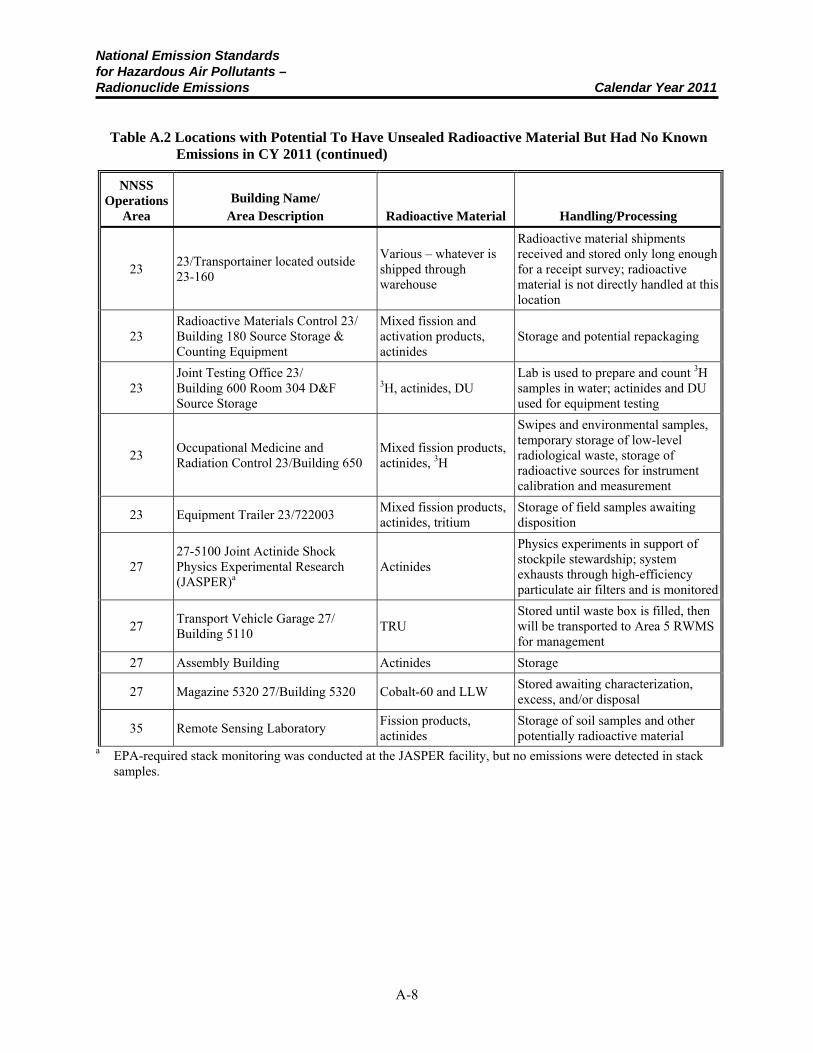
National Emission Standards for Hazardous Air Pollutants – Radionuclide Emissions Calendar Year 2011
A-8
Table A.2 Locations with Potential To Have Unsealed Radioactive Material But Had No Known Emissions in CY 2011 (continued)
NNSS Operations
Area Building Name/
Area Description Radioactive Material Handling/Processing
23 23/Transportainer located outside 23-160
Various – whatever is shipped through warehouse
Radioactive material shipments received and stored only long enough for a receipt survey; radioactive material is not directly handled at this location
23 Radioactive Materials Control 23/ Building 180 Source Storage & Counting Equipment
Mixed fission and activation products, actinides
Storage and potential repackaging
23 Joint Testing Office 23/ Building 600 Room 304 D&F Source Storage
3H, actinides, DU Lab is used to prepare and count 3H samples in water; actinides and DU used for equipment testing
23 Occupational Medicine and Radiation Control 23/Building 650
Mixed fission products, actinides, 3H
Swipes and environmental samples, temporary storage of low-level radiological waste, storage of radioactive sources for instrument calibration and measurement
23 Equipment Trailer 23/722003 Mixed fission products, actinides, tritium
Storage of field samples awaiting disposition
27 27-5100 Joint Actinide Shock Physics Experimental Research (JASPER)a
Actinides
Physics experiments in support of stockpile stewardship; system exhausts through high-efficiency particulate air filters and is monitored
27 Transport Vehicle Garage 27/ Building 5110
TRU Stored until waste box is filled, then will be transported to Area 5 RWMS for management
27 Assembly Building Actinides Storage
27 Magazine 5320 27/Building 5320 Cobalt-60 and LLW Stored awaiting characterization, excess, and/or disposal
35 Remote Sensing Laboratory Fission products, actinides
Storage of soil samples and other potentially radioactive material
a EPA-required stack monitoring was conducted at the JASPER facility, but no emissions were detected in stack samples.
National Emission Standards for Hazardous Air Pollutants – Radionuclide Emissions Calendar Year 2011
B-1
Appendix B
Tritium Emissions Estimated from Air Sampling Data BACKGROUND INFORMATION
Diffuse emissions of tritiated water (HTO) from the Nevada National Security Site (NNSS) include evaporation from containment ponds, evapotranspiration of soil moisture diffusing through waste covers at the Area 3 Radioactive Waste Management Site (RWMS), the Area 5 Radioactive Waste Management Complex (RWMC), and evapotranspiration of HTO from soil contaminated by atmospheric, or near surface, nuclear weapon testing. Locations that make up the majority of diffuse tritium (3H) emissions on the NNSS are the Schooner and Sedan nuclear test areas, the Area 3 RWMS, the Area 5 RWMC, and the containment ponds at E-Tunnel. Emissions from the E-Tunnel ponds were not estimated from air sampling data because the total volume of water and 3H concentration of the water was known, allowing for an estimate described in Appendix D. For the remaining sites listed, emissions were estimated by scaling concentrations of 3H in air predicted by a modeled unit release to those measured at nearby sampling stations.
There are 19 sampling stations referred to as environmental samplers on the NNSS. They include 3 stations that have exclusively low-volume air particulate samplers, 1 that has exclusively an HTO sampler, and 15 that have both air particulate and HTO samplers, 6 of which are designated as critical receptor locations. They are located throughout the NNSS in or near the highest diffuse radiation sources. Figure 5 of this report shows the current NNSS air sampling station locations, and Table B.1 lists the samplers near the major diffuse 3H emission locations.
SOURCE TERM ESTIMATES
For each major 3H emission location, the Clean Air Package 1988 (CAP88-PC) model was used to estimate the 3H concentration that would be expected at nearby air samplers if 1 curie (Ci) of 3H were released from the center of the source location. The total annual emission from each source was then calculated by dividing the annual average concentration of 3H measured at each sampling location by the predicted CAP88-PC concentration for a 1 Ci release. Table B.1 lists the estimated emissions for each source location.
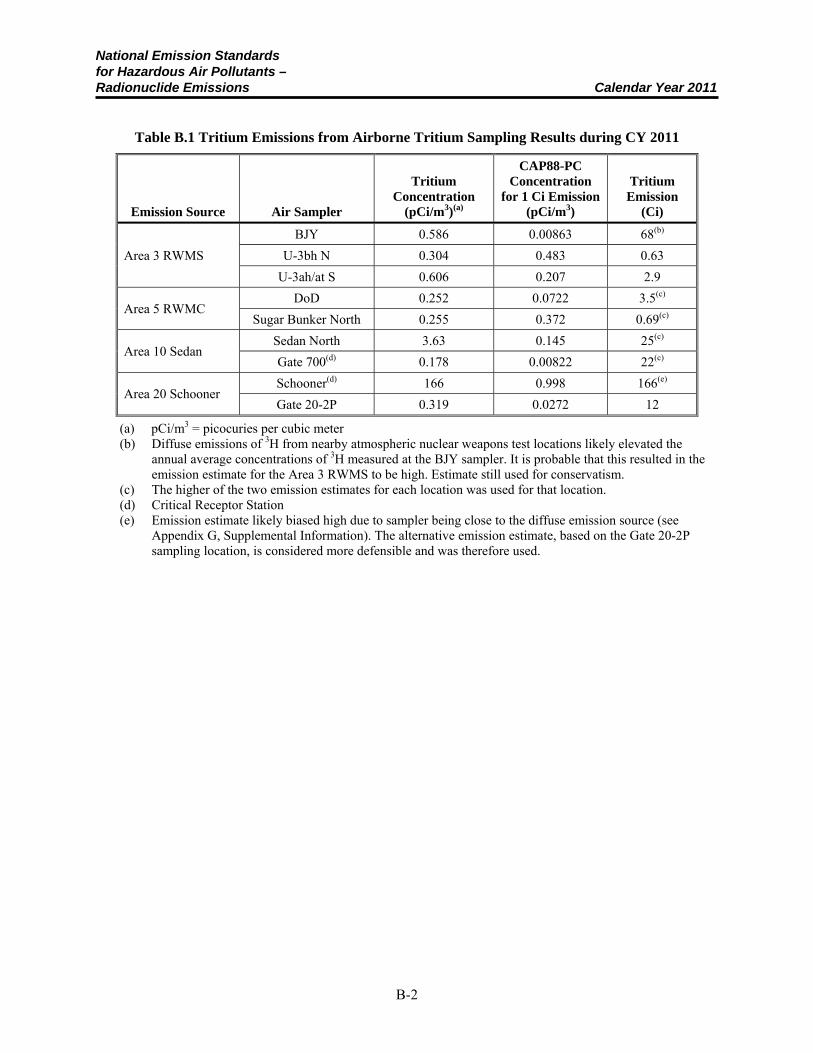
National Emission Standards for Hazardous Air Pollutants – Radionuclide Emissions Calendar Year 2011
B-2
Table B.1 Tritium Emissions from Airborne Tritium Sampling Results during CY 2011
Emission Source Air Sampler
Tritium Concentration
(pCi/m3)(a)
CAP88-PC Concentration
for 1 Ci Emission (pCi/m3)
Tritium Emission
(Ci)
Area 3 RWMS
BJY 0.586 0.00863 68(b)
U-3bh N 0.304 0.483 0.63
U-3ah/at S 0.606 0.207 2.9
Area 5 RWMC DoD 0.252 0.0722 3.5(c)
Sugar Bunker North 0.255 0.372 0.69(c)
Area 10 Sedan Sedan North 3.63 0.145 25(c)
Gate 700(d) 0.178 0.00822 22(c)
Area 20 Schooner Schooner(d) 166 0.998 166(e)
Gate 20-2P 0.319 0.0272 12
(a) pCi/m3 = picocuries per cubic meter (b) Diffuse emissions of 3H from nearby atmospheric nuclear weapons test locations likely elevated the
annual average concentrations of 3H measured at the BJY sampler. It is probable that this resulted in the emission estimate for the Area 3 RWMS to be high. Estimate still used for conservatism.
(c) The higher of the two emission estimates for each location was used for that location. (d) Critical Receptor Station (e) Emission estimate likely biased high due to sampler being close to the diffuse emission source (see
Appendix G, Supplemental Information). The alternative emission estimate, based on the Gate 20-2P sampling location, is considered more defensible and was therefore used.
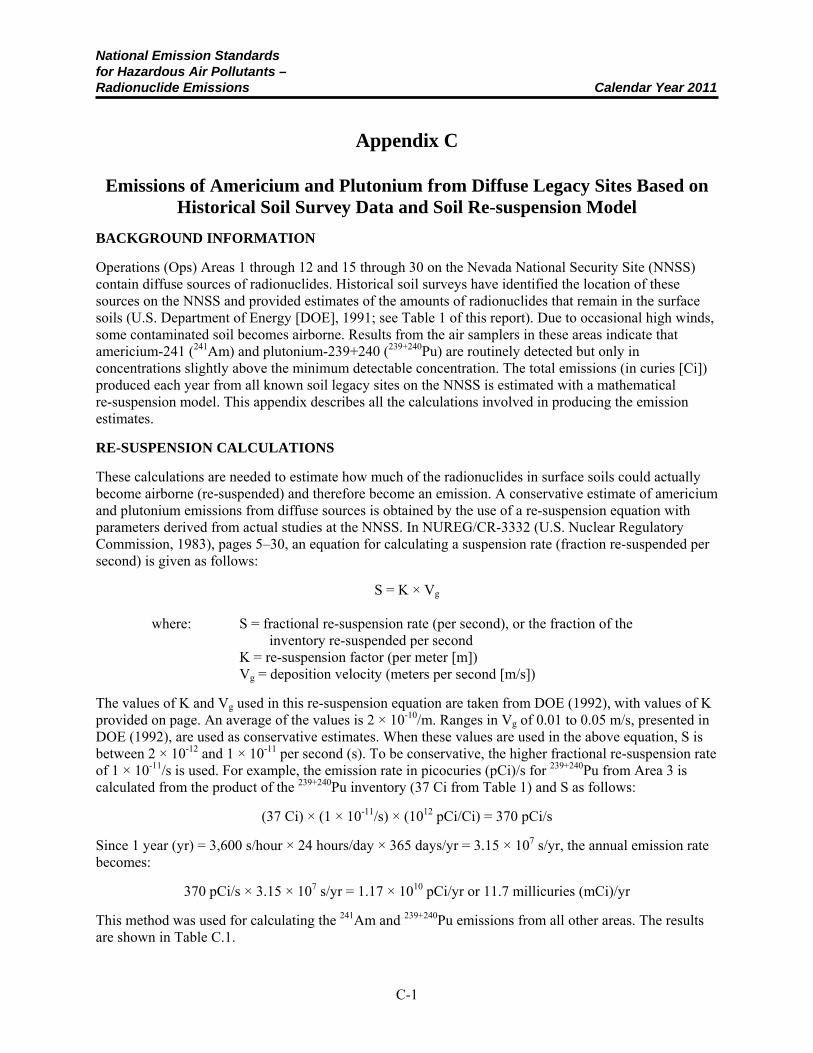
National Emission Standards for Hazardous Air Pollutants – Radionuclide Emissions Calendar Year 2011
C-1
Appendix C
Emissions of Americium and Plutonium from Diffuse Legacy Sites Based on Historical Soil Survey Data and Soil Re-suspension Model
BACKGROUND INFORMATION
Operations (Ops) Areas 1 through 12 and 15 through 30 on the Nevada National Security Site (NNSS) contain diffuse sources of radionuclides. Historical soil surveys have identified the location of these sources on the NNSS and provided estimates of the amounts of radionuclides that remain in the surface soils (U.S. Department of Energy [DOE], 1991; see Table 1 of this report). Due to occasional high winds, some contaminated soil becomes airborne. Results from the air samplers in these areas indicate that americium-241 (241Am) and plutonium-239+240 (239+240Pu) are routinely detected but only in concentrations slightly above the minimum detectable concentration. The total emissions (in curies [Ci]) produced each year from all known soil legacy sites on the NNSS is estimated with a mathematical re-suspension model. This appendix describes all the calculations involved in producing the emission estimates.
RE-SUSPENSION CALCULATIONS
These calculations are needed to estimate how much of the radionuclides in surface soils could actually become airborne (re-suspended) and therefore become an emission. A conservative estimate of americium and plutonium emissions from diffuse sources is obtained by the use of a re-suspension equation with parameters derived from actual studies at the NNSS. In NUREG/CR-3332 (U.S. Nuclear Regulatory Commission, 1983), pages 5–30, an equation for calculating a suspension rate (fraction re-suspended per second) is given as follows:
S = K × Vg
where: S = fractional re-suspension rate (per second), or the fraction of the inventory re-suspended per second K = re-suspension factor (per meter [m]) Vg = deposition velocity (meters per second [m/s])
The values of K and Vg used in this re-suspension equation are taken from DOE (1992), with values of K provided on page. An average of the values is 2 × 10⁻¹⁰/m. Ranges in Vg of 0.01 to 0.05 m/s, presented in DOE (1992), are used as conservative estimates. When these values are used in the above equation, S is between 2 × 10-12 and 1 × 10-11 per second (s). To be conservative, the higher fractional re-suspension rate of 1 × 10-11/s is used. For example, the emission rate in picocuries (pCi)/s for 239+240Pu from Area 3 is calculated from the product of the 239+240Pu inventory (37 Ci from Table 1) and S as follows:
(37 Ci) × (1 × 10-11/s) × (1012 pCi/Ci) = 370 pCi/s
Since 1 year (yr) = 3,600 s/hour × 24 hours/day × 365 days/yr = 3.15 × 10⁷ s/yr, the annual emission rate becomes:
370 pCi/s × 3.15 × 10⁷ s/yr = 1.17 × 10¹⁰ pCi/yr or 11.7 millicuries (mCi)/yr
This method was used for calculating the 241Am and 239+240Pu emissions from all other areas. The results are shown in Table C.1.
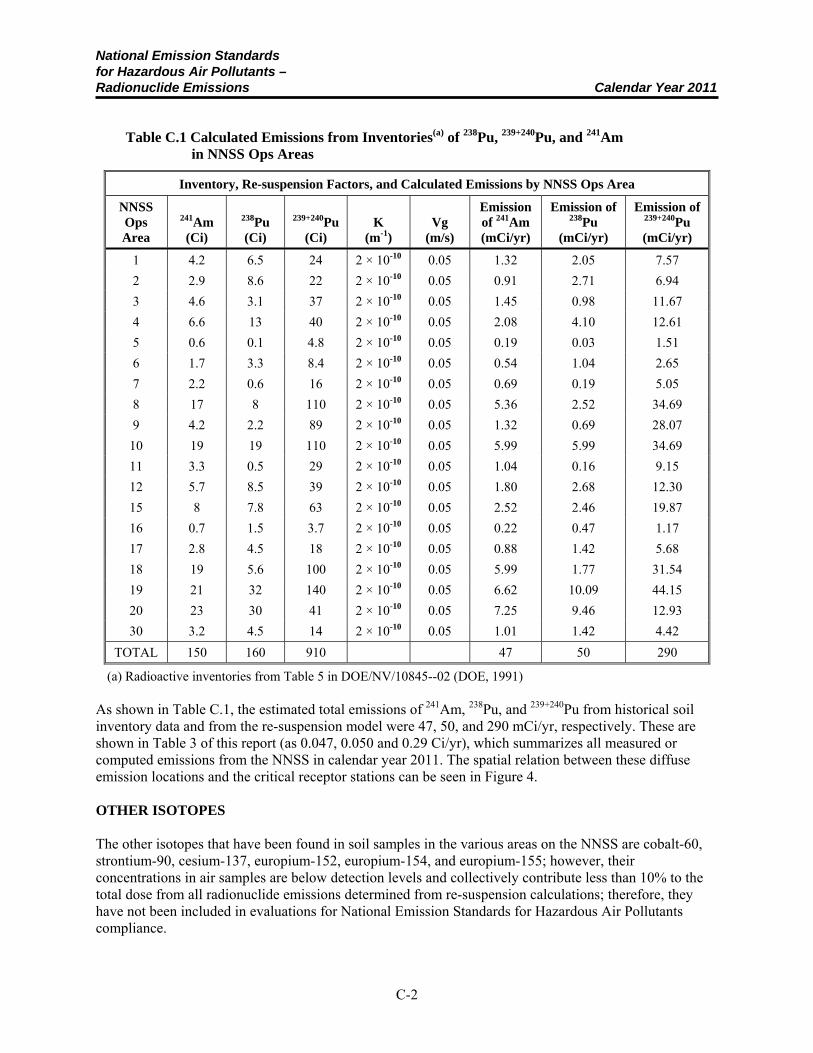
National Emission Standards for Hazardous Air Pollutants – Radionuclide Emissions Calendar Year 2011
C-2
Table C.1 Calculated Emissions from Inventories(a) of 238Pu, 239+240Pu, and 241Am in NNSS Ops Areas
Inventory, Re-suspension Factors, and Calculated Emissions by NNSS Ops Area
NNSS Ops Area
241Am (Ci)
238Pu (Ci)
239+240Pu (Ci)
K (m-1)
Vg (m/s)
Emission of 241Am (mCi/yr)
Emission of 238Pu
(mCi/yr)
Emission of 239+240Pu (mCi/yr)
1 4.2 6.5 24 2 × 10⁻¹⁰ 0.05 1.32 2.05 7.57
2 2.9 8.6 22 2 × 10⁻¹⁰ 0.05 0.91 2.71 6.94
3 4.6 3.1 37 2 × 10⁻¹⁰ 0.05 1.45 0.98 11.67
4 6.6 13 40 2 × 10⁻¹⁰ 0.05 2.08 4.10 12.61
5 0.6 0.1 4.8 2 × 10⁻¹⁰ 0.05 0.19 0.03 1.51
6 1.7 3.3 8.4 2 × 10⁻¹⁰ 0.05 0.54 1.04 2.65
7 2.2 0.6 16 2 × 10⁻¹⁰ 0.05 0.69 0.19 5.05
8 17 8 110 2 × 10⁻¹⁰ 0.05 5.36 2.52 34.69
9 4.2 2.2 89 2 × 10⁻¹⁰ 0.05 1.32 0.69 28.07
10 19 19 110 2 × 10⁻¹⁰ 0.05 5.99 5.99 34.69
11 3.3 0.5 29 2 × 10⁻¹⁰ 0.05 1.04 0.16 9.15
12 5.7 8.5 39 2 × 10⁻¹⁰ 0.05 1.80 2.68 12.30
15 8 7.8 63 2 × 10⁻¹⁰ 0.05 2.52 2.46 19.87
16 0.7 1.5 3.7 2 × 10⁻¹⁰ 0.05 0.22 0.47 1.17
17 2.8 4.5 18 2 × 10⁻¹⁰ 0.05 0.88 1.42 5.68
18 19 5.6 100 2 × 10⁻¹⁰ 0.05 5.99 1.77 31.54
19 21 32 140 2 × 10⁻¹⁰ 0.05 6.62 10.09 44.15
20 23 30 41 2 × 10⁻¹⁰ 0.05 7.25 9.46 12.93
30 3.2 4.5 14 2 × 10⁻¹⁰ 0.05 1.01 1.42 4.42
TOTAL 150 160 910 47 50 290
(a) Radioactive inventories from Table 5 in DOE/NV/10845--02 (DOE, 1991) As shown in Table C.1, the estimated total emissions of 241Am, 238Pu, and 239+240Pu from historical soil inventory data and from the re-suspension model were 47, 50, and 290 mCi/yr, respectively. These are shown in Table 3 of this report (as 0.047, 0.050 and 0.29 Ci/yr), which summarizes all measured or computed emissions from the NNSS in calendar year 2011. The spatial relation between these diffuse emission locations and the critical receptor stations can be seen in Figure 4. OTHER ISOTOPES The other isotopes that have been found in soil samples in the various areas on the NNSS are cobalt-60, strontium-90, cesium-137, europium-152, europium-154, and europium-155; however, their concentrations in air samples are below detection levels and collectively contribute less than 10% to the total dose from all radionuclide emissions determined from re-suspension calculations; therefore, they have not been included in evaluations for National Emission Standards for Hazardous Air Pollutants compliance.
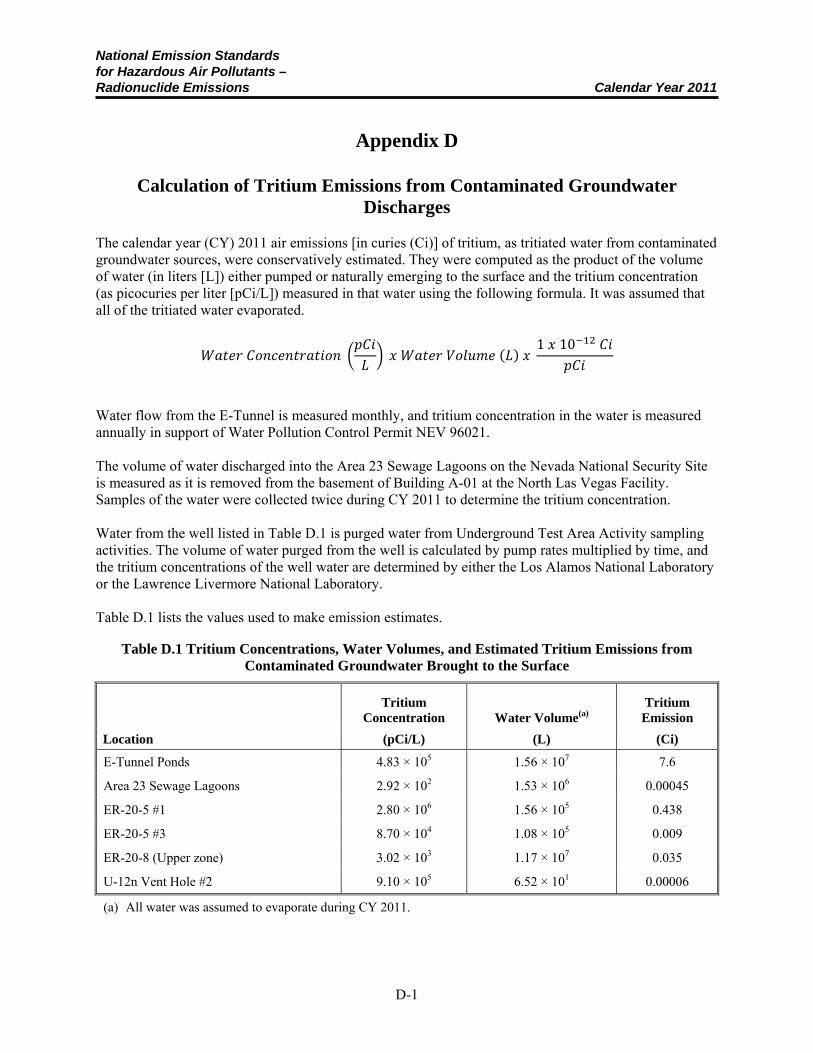
National Emission Standards for Hazardous Air Pollutants – Radionuclide Emissions Calendar Year 2011
D-1
Appendix D
Calculation of Tritium Emissions from Contaminated Groundwater Discharges
The calendar year (CY) 2011 air emissions [in curies (Ci)] of tritium, as tritiated water from contaminated groundwater sources, were conservatively estimated. They were computed as the product of the volume of water (in liters [L]) either pumped or naturally emerging to the surface and the tritium concentration (as picocuries per liter [pCi/L]) measured in that water using the following formula. It was assumed that all of the tritiated water evaporated.
1 10
Water flow from the E-Tunnel is measured monthly, and tritium concentration in the water is measured annually in support of Water Pollution Control Permit NEV 96021. The volume of water discharged into the Area 23 Sewage Lagoons on the Nevada National Security Site is measured as it is removed from the basement of Building A-01 at the North Las Vegas Facility. Samples of the water were collected twice during CY 2011 to determine the tritium concentration. Water from the well listed in Table D.1 is purged water from Underground Test Area Activity sampling activities. The volume of water purged from the well is calculated by pump rates multiplied by time, and the tritium concentrations of the well water are determined by either the Los Alamos National Laboratory or the Lawrence Livermore National Laboratory. Table D.1 lists the values used to make emission estimates.
Table D.1 Tritium Concentrations, Water Volumes, and Estimated Tritium Emissions from Contaminated Groundwater Brought to the Surface
Location
Tritium Concentration Water Volume(a)
Tritium Emission
(pCi/L) (L) (Ci)
E-Tunnel Ponds 4.83 × 10⁵ 1.56 × 10⁷ 7.6
Area 23 Sewage Lagoons 2.92 × 10² 1.53 × 10⁶ 0.00045
ER-20-5 #1 2.80 × 10⁶ 1.56 × 10⁵ 0.438
ER-20-5 #3 8.70 × 10⁴ 1.08 × 10⁵ 0.009
ER-20-8 (Upper zone) 3.02 × 10³ 1.17 × 10⁷ 0.035
U-12n Vent Hole #2 9.10 × 10⁵ 6.52 × 101 0.00006
(a) All water was assumed to evaporate during CY 2011.

National Emission Standards for Hazardous Air Pollutants – Radionuclide Emissions Calendar Year 2011
D-2
This page intentionally left blank
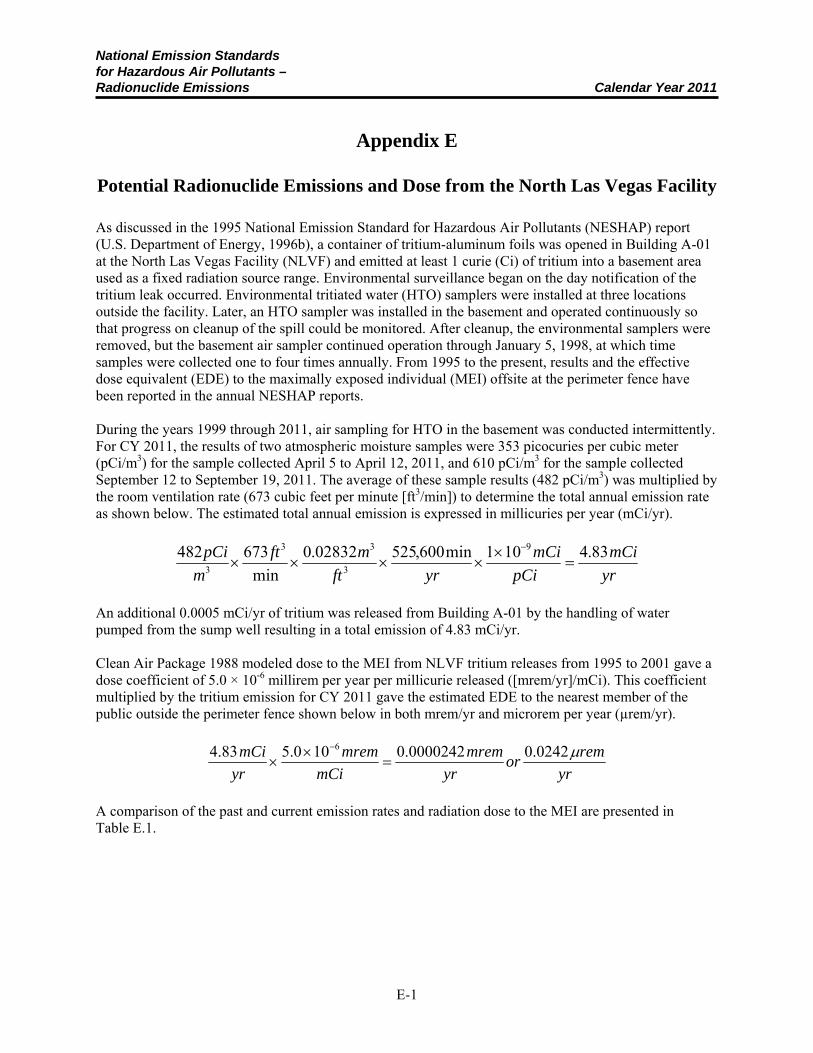
National Emission Standards for Hazardous Air Pollutants – Radionuclide Emissions Calendar Year 2011
E-1
Appendix E
Potential Radionuclide Emissions and Dose from the North Las Vegas Facility
As discussed in the 1995 National Emission Standard for Hazardous Air Pollutants (NESHAP) report (U.S. Department of Energy, 1996b), a container of tritium-aluminum foils was opened in Building A-01 at the North Las Vegas Facility (NLVF) and emitted at least 1 curie (Ci) of tritium into a basement area used as a fixed radiation source range. Environmental surveillance began on the day notification of the tritium leak occurred. Environmental tritiated water (HTO) samplers were installed at three locations outside the facility. Later, an HTO sampler was installed in the basement and operated continuously so that progress on cleanup of the spill could be monitored. After cleanup, the environmental samplers were removed, but the basement air sampler continued operation through January 5, 1998, at which time samples were collected one to four times annually. From 1995 to the present, results and the effective dose equivalent (EDE) to the maximally exposed individual (MEI) offsite at the perimeter fence have been reported in the annual NESHAP reports. During the years 1999 through 2011, air sampling for HTO in the basement was conducted intermittently. For CY 2011, the results of two atmospheric moisture samples were 353 picocuries per cubic meter (pCi/m3) for the sample collected April 5 to April 12, 2011, and 610 pCi/m3 for the sample collected September 12 to September 19, 2011. The average of these sample results (482 pCi/m3) was multiplied by the room ventilation rate (673 cubic feet per minute [ft3/min]) to determine the total annual emission rate as shown below. The estimated total annual emission is expressed in millicuries per year (mCi/yr).
yr
mCi
pCi
mCi
yrft
mft
m
pCi 83.4101min600,52502832.0
min
673482 9
3
33
3
An additional 0.0005 mCi/yr of tritium was released from Building A-01 by the handling of water pumped from the sump well resulting in a total emission of 4.83 mCi/yr. Clean Air Package 1988 modeled dose to the MEI from NLVF tritium releases from 1995 to 2001 gave a dose coefficient of 5.0 × 10⁻⁶ millirem per year per millicurie released ([mrem/yr]/mCi). This coefficient multiplied by the tritium emission for CY 2011 gave the estimated EDE to the nearest member of the public outside the perimeter fence shown below in both mrem/yr and microrem per year (µrem/yr).
yr
remor
yr
mrem
mCi
mrem
yr
mCi 0242.00000242.0100.583.4 6
A comparison of the past and current emission rates and radiation dose to the MEI are presented in Table E.1.
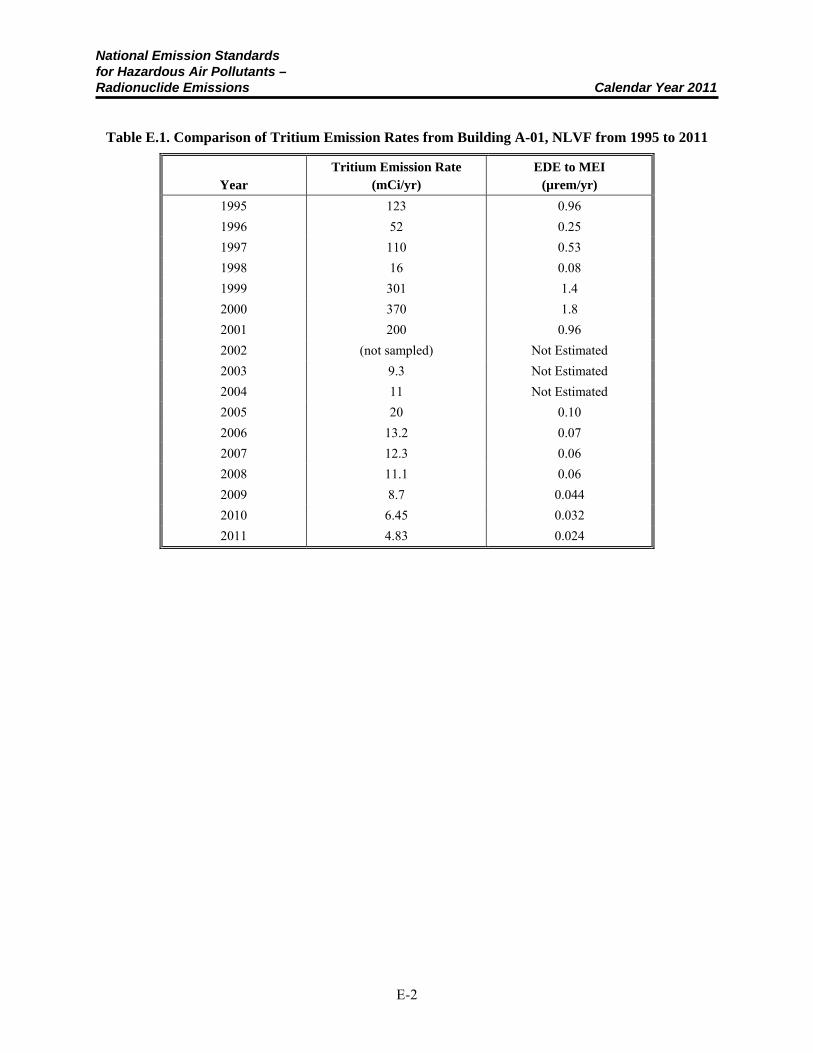
National Emission Standards for Hazardous Air Pollutants – Radionuclide Emissions Calendar Year 2011
E-2
Table E.1. Comparison of Tritium Emission Rates from Building A-01, NLVF from 1995 to 2011
Year Tritium Emission Rate
(mCi/yr) EDE to MEI
(µrem/yr)
1995 123 0.96
1996 52 0.25
1997 110 0.53
1998 16 0.08
1999 301 1.4
2000 370 1.8
2001 200 0.96
2002 (not sampled) Not Estimated
2003 9.3 Not Estimated
2004 11 Not Estimated
2005 20 0.10
2006 13.2 0.07
2007 12.3 0.06
2008 11.1 0.06
2009 8.7 0.044
2010 6.45 0.032
2011 4.83 0.024
National Emission Standards for Hazardous Air Pollutants – Radionuclide Emissions Calendar Year 2011
F-1
Appendix F
Identification and Justification for the Development of Meteorological Data used as Input to Clean Air Package 1988 (CAP88-PC)
Meteorological support, observations, and climatological services for the Nevada National Security Site (NNSS) are provided to the U.S. Department of Energy, National Nuclear Security Administration Nevada Site Office (NNSA/NSO) by the Air Resources Laboratory, Special Operations and Research Division (ARL/SORD). The ARL/SORD is a National Oceanic and Atmospheric Administration (NOAA) office and supports NNSA/NSO programs under the authority of an Interagency Agreement between NOAA and NNSA/NSO.
METEOROLOGICAL OBSERVATIONS
The ARL/SORD manages, operates, and maintains a meteorological monitoring program that is designed and used to support the NNSA/NSO-authorized activities on the NNSS. This vital program consists of many meteorological monitoring systems that have been brought together under the Meteorological Integrated Data Network (MIDNET). The MIDNET includes a Meteorological Data Acquisition (MEDA) network of 19 meteorological towers located on the NNSS (Figure F.1) and one on Yucca Mountain. The MIDNET consists of communications systems, local area networks, and surface-based instrumentation used to measure wind direction and speed, temperature, relative humidity, and pressure and precipitation at a subset of stations. The MIDNET has been operated on the NNSS for more than 40 years, has undergone several modernizations and upgrades, and serves as a solid basis for deriving climatological information.
Upper air observations (radiosondes) were taken twice daily from Desert Rock Meteorological Observatory (DRA; elevation 1007 meters [m], located 4.8 km southwest of Mercury, Nevada [Station 23 in Figure F.1]) but were discontinued in October 2010. Upper-air data are currently collected at the National Weather Service office in Las Vegas. DRA had been in operation since May 1978 and was built to replace a similar observatory that was located at the Yucca Flat Meteorological Observatory (UCC; elevation 1,196 m) from January 1962 through mid-May 1978. Consequently, surface and upper-air observations are also available from UCC for 1962–1978.
A key component of the MIDNET system is the MEDA station. A MEDA station consists of a 10 m tower, a microprocessor, meteorological sensors, and a radio transmitter. The 20 MEDA stations located on or near the NNSS (Figure F.1) provide surface weather data, and weather data for weather forecasts and warnings for NNSS operations and emergency response activities. MEDA station locations were selected based on criteria to support NNSS consequence assessment activities, compliance reporting requirements, and general weather and forecasting needs.
Wind and temperature data have been collected on the NNSS for more than 40 years. These and other meteorological data have been compiled into a comprehensive climatological database for the NNSS. The MEDA data are especially useful in assessing boundary layer flow regimes on the NNSS.
The wind speed and direction sensor is located 10 m above the ground. Wind direction is measured to ±5 degrees of azimuth, and wind speed is accurate to 0.5 knots. Wind data are collected as 10 or 15 minute averages and are transmitted via radio and sent over the NNSS intranet to a central processor every 10 or 15 minutes. These data are checked by ARL/SORD and are stored and archived for climatological purposes.
Ambient temperature and relative humidity sensors are located at approximately 1.5 m above ground level. MEDA temperature data are accurate to ±0.2 degrees Celsius (°C) (absolute range for the NNSS is −29°C to 46°C). Temperature and relative humidity measurements are 10 or 15 minute averages and are also transmitted via radio to a computer for processing, checking, displaying, and archiving.
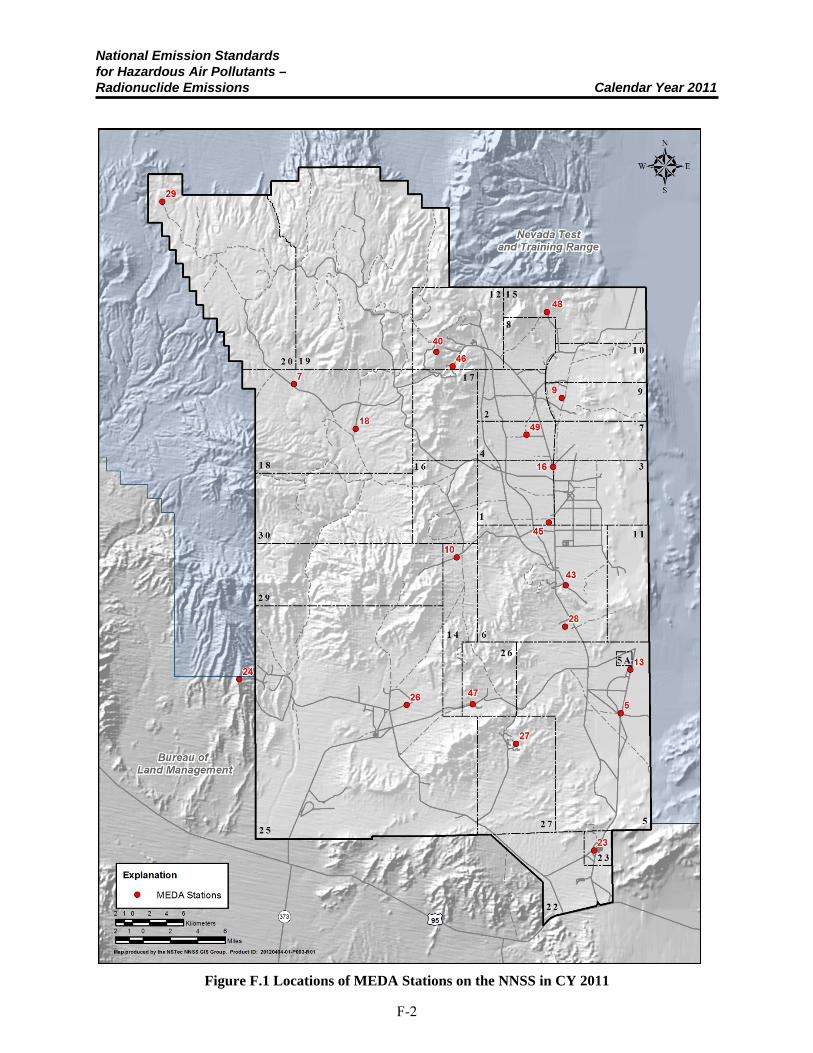
National Emission Standards for Hazardous Air Pollutants – Radionuclide Emissions Calendar Year 2011
F-2
Figure F.1 Locations of MEDA Stations on the NNSS in CY 2011
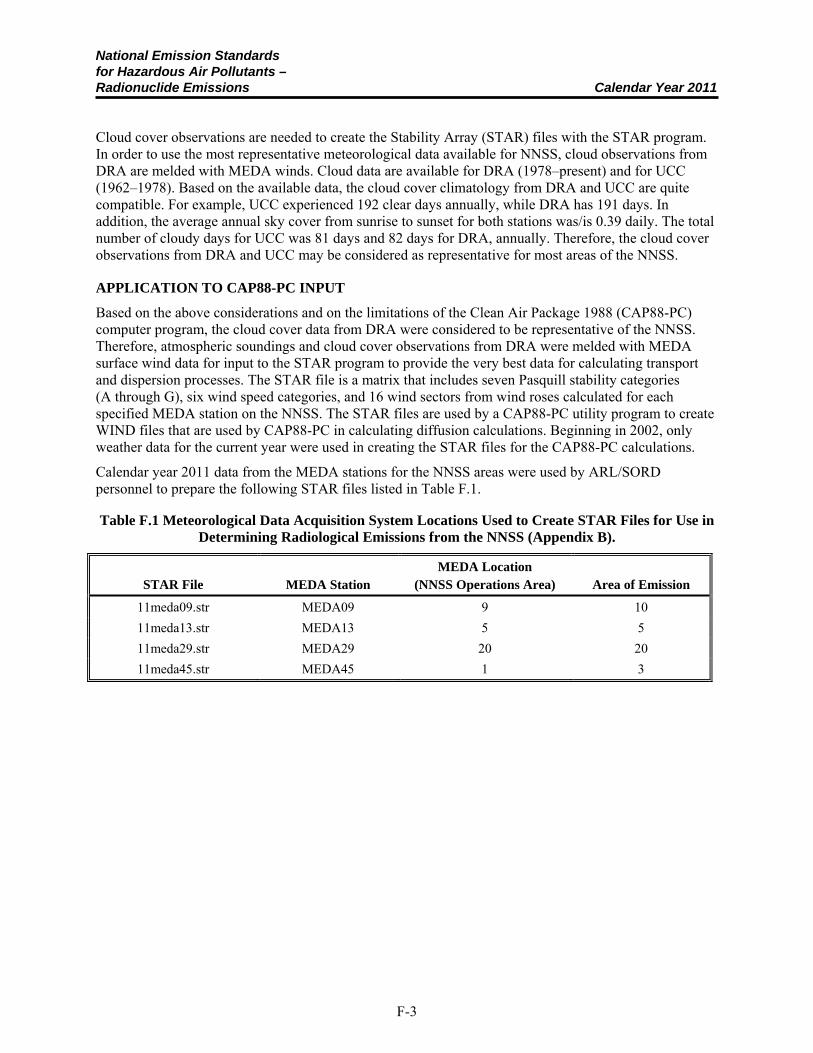
National Emission Standards for Hazardous Air Pollutants – Radionuclide Emissions Calendar Year 2011
F-3
Cloud cover observations are needed to create the Stability Array (STAR) files with the STAR program. In order to use the most representative meteorological data available for NNSS, cloud observations from DRA are melded with MEDA winds. Cloud data are available for DRA (1978–present) and for UCC (1962–1978). Based on the available data, the cloud cover climatology from DRA and UCC are quite compatible. For example, UCC experienced 192 clear days annually, while DRA has 191 days. In addition, the average annual sky cover from sunrise to sunset for both stations was/is 0.39 daily. The total number of cloudy days for UCC was 81 days and 82 days for DRA, annually. Therefore, the cloud cover observations from DRA and UCC may be considered as representative for most areas of the NNSS.
APPLICATION TO CAP88-PC INPUT
Based on the above considerations and on the limitations of the Clean Air Package 1988 (CAP88-PC) computer program, the cloud cover data from DRA were considered to be representative of the NNSS. Therefore, atmospheric soundings and cloud cover observations from DRA were melded with MEDA surface wind data for input to the STAR program to provide the very best data for calculating transport and dispersion processes. The STAR file is a matrix that includes seven Pasquill stability categories (A through G), six wind speed categories, and 16 wind sectors from wind roses calculated for each specified MEDA station on the NNSS. The STAR files are used by a CAP88-PC utility program to create WIND files that are used by CAP88-PC in calculating diffusion calculations. Beginning in 2002, only weather data for the current year were used in creating the STAR files for the CAP88-PC calculations.
Calendar year 2011 data from the MEDA stations for the NNSS areas were used by ARL/SORD personnel to prepare the following STAR files listed in Table F.1.
Table F.1 Meteorological Data Acquisition System Locations Used to Create STAR Files for Use in Determining Radiological Emissions from the NNSS (Appendix B).
STAR File MEDA Station
MEDA Location (NNSS Operations Area)
Area of Emission
11meda09.str MEDA09 9 10
11meda13.str MEDA13 5 5
11meda29.str MEDA29 20 20
11meda45.str MEDA45 1 3

National Emission Standards for Hazardous Air Pollutants – Radionuclide Emissions Calendar Year 2011
F-4
This page intentionally left blank
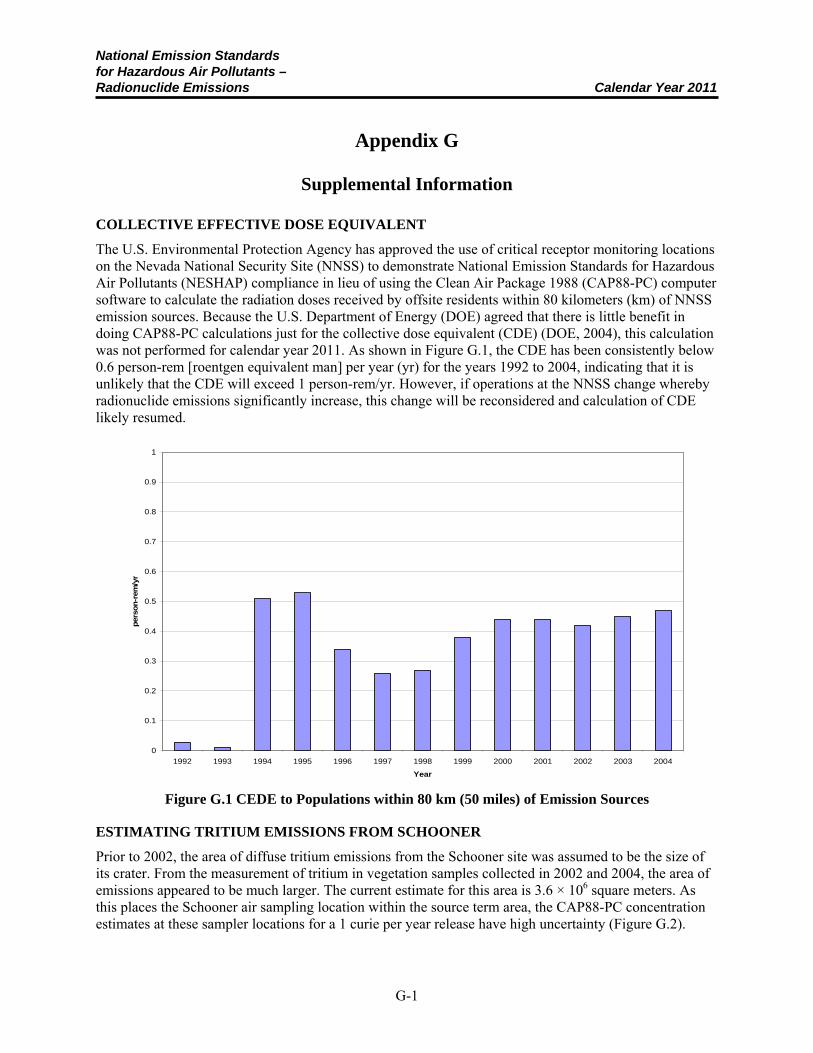
National Emission Standards for Hazardous Air Pollutants – Radionuclide Emissions Calendar Year 2011
G-1
Appendix G
Supplemental Information
COLLECTIVE EFFECTIVE DOSE EQUIVALENT
The U.S. Environmental Protection Agency has approved the use of critical receptor monitoring locations on the Nevada National Security Site (NNSS) to demonstrate National Emission Standards for Hazardous Air Pollutants (NESHAP) compliance in lieu of using the Clean Air Package 1988 (CAP88-PC) computer software to calculate the radiation doses received by offsite residents within 80 kilometers (km) of NNSS emission sources. Because the U.S. Department of Energy (DOE) agreed that there is little benefit in doing CAP88-PC calculations just for the collective dose equivalent (CDE) (DOE, 2004), this calculation was not performed for calendar year 2011. As shown in Figure G.1, the CDE has been consistently below 0.6 person-rem [roentgen equivalent man] per year (yr) for the years 1992 to 2004, indicating that it is unlikely that the CDE will exceed 1 person-rem/yr. However, if operations at the NNSS change whereby radionuclide emissions significantly increase, this change will be reconsidered and calculation of CDE likely resumed.
Figure G.1 CEDE to Populations within 80 km (50 miles) of Emission Sources
ESTIMATING TRITIUM EMISSIONS FROM SCHOONER
Prior to 2002, the area of diffuse tritium emissions from the Schooner site was assumed to be the size of its crater. From the measurement of tritium in vegetation samples collected in 2002 and 2004, the area of emissions appeared to be much larger. The current estimate for this area is 3.6 × 10⁶ square meters. As this places the Schooner air sampling location within the source term area, the CAP88-PC concentration estimates at these sampler locations for a 1 curie per year release have high uncertainty (Figure G.2).
0
0.1
0.2
0.3
0.4
0.5
0.6
0.7
0.8
0.9
1
1992 1993 1994 1995 1996 1997 1998 1999 2000 2001 2002 2003 2004
Year
per
son-r
em/y
r
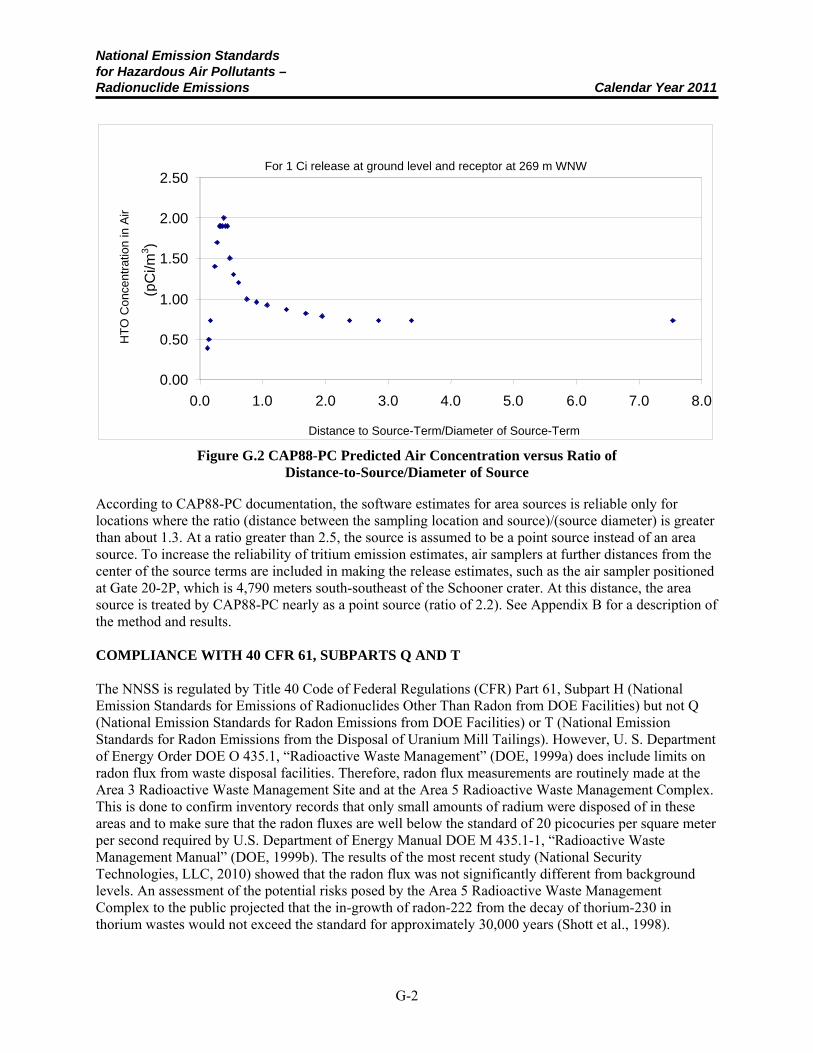
National Emission Standards for Hazardous Air Pollutants – Radionuclide Emissions Calendar Year 2011
G-2
Figure G.2 CAP88-PC Predicted Air Concentration versus Ratio of Distance-to-Source/Diameter of Source
According to CAP88-PC documentation, the software estimates for area sources is reliable only for locations where the ratio (distance between the sampling location and source)/(source diameter) is greater than about 1.3. At a ratio greater than 2.5, the source is assumed to be a point source instead of an area source. To increase the reliability of tritium emission estimates, air samplers at further distances from the center of the source terms are included in making the release estimates, such as the air sampler positioned at Gate 20-2P, which is 4,790 meters south-southeast of the Schooner crater. At this distance, the area source is treated by CAP88-PC nearly as a point source (ratio of 2.2). See Appendix B for a description of the method and results. COMPLIANCE WITH 40 CFR 61, SUBPARTS Q AND T The NNSS is regulated by Title 40 Code of Federal Regulations (CFR) Part 61, Subpart H (National Emission Standards for Emissions of Radionuclides Other Than Radon from DOE Facilities) but not Q (National Emission Standards for Radon Emissions from DOE Facilities) or T (National Emission Standards for Radon Emissions from the Disposal of Uranium Mill Tailings). However, U. S. Department of Energy Order DOE O 435.1, “Radioactive Waste Management” (DOE, 1999a) does include limits on radon flux from waste disposal facilities. Therefore, radon flux measurements are routinely made at the Area 3 Radioactive Waste Management Site and at the Area 5 Radioactive Waste Management Complex. This is done to confirm inventory records that only small amounts of radium were disposed of in these areas and to make sure that the radon fluxes are well below the standard of 20 picocuries per square meter per second required by U.S. Department of Energy Manual DOE M 435.1-1, “Radioactive Waste Management Manual” (DOE, 1999b). The results of the most recent study (National Security Technologies, LLC, 2010) showed that the radon flux was not significantly different from background levels. An assessment of the potential risks posed by the Area 5 Radioactive Waste Management Complex to the public projected that the in-growth of radon-222 from the decay of thorium-230 in thorium wastes would not exceed the standard for approximately 30,000 years (Shott et al., 1998).
For 1 Ci release at ground level and receptor at 269 m WNW
0.00
0.50
1.00
1.50
2.00
2.50
0.0 1.0 2.0 3.0 4.0 5.0 6.0 7.0 8.0
Distance to Source-Term/Diameter of Source-Term
(pC
i/m3 )
HT
O C
once
ntra
tion
in A
ir
National Emission Standards for Hazardous Air Pollutants – Radionuclide Emissions Calendar Year 2011
G-3
NON-DISPOSAL/NON-STORAGE SOURCES OF RADON EMISSIONS
None of these sources exist on the NNSS.
QUALITY ASSURANCE PROGRAM FOR NESHAP COMPLIANCE The quality assurance program for samples collected and analyzed for NESHAP compliance is documented in an environmental monitoring plan (DOE, 2003). The applicable requirements of 40 CFR 61, Appendix B, Method 114, “Test Methods for Measuring Radionuclide Emissions from Stationary Sources” (U.S. Environmental Protection Agency, 2001b), and of DOE O 414.1D, “Quality Assurance” (DOE, 2005) have been implemented in this plan.

National Emission Standards for Hazardous Air Pollutants – Radionuclide Emissions Calendar Year 2011
G-4
This page intentionally left blank