Embed Size (px)
Citation preview
8/7/2019 2011 Quality Education for All Poll Results
http://slidepdf.com/reader/full/2011-quality-education-for-all-poll-results 1/15
What citizens and parents think about
school quality, school leadership
and school funding.
Duval County Public Schools

8/7/2019 2011 Quality Education for All Poll Results
http://slidepdf.com/reader/full/2011-quality-education-for-all-poll-results 2/15
Dr. Raymond K.OldakowskiDepartment of Social Science
Jacksonville University
8/7/2019 2011 Quality Education for All Poll Results
http://slidepdf.com/reader/full/2011-quality-education-for-all-poll-results 3/15
About the Survey
1,100 adult residents of Duval County, Florida.
February 2 through February 8, 2011.
Patterned to compare resident views with those from a similar survey taken in February2006.
Includes a statistically valid subset of parents with students in Duval County Public Schools.
The margin for error +/- 3 percentage points.
8/7/2019 2011 Quality Education for All Poll Results
http://slidepdf.com/reader/full/2011-quality-education-for-all-poll-results 4/15
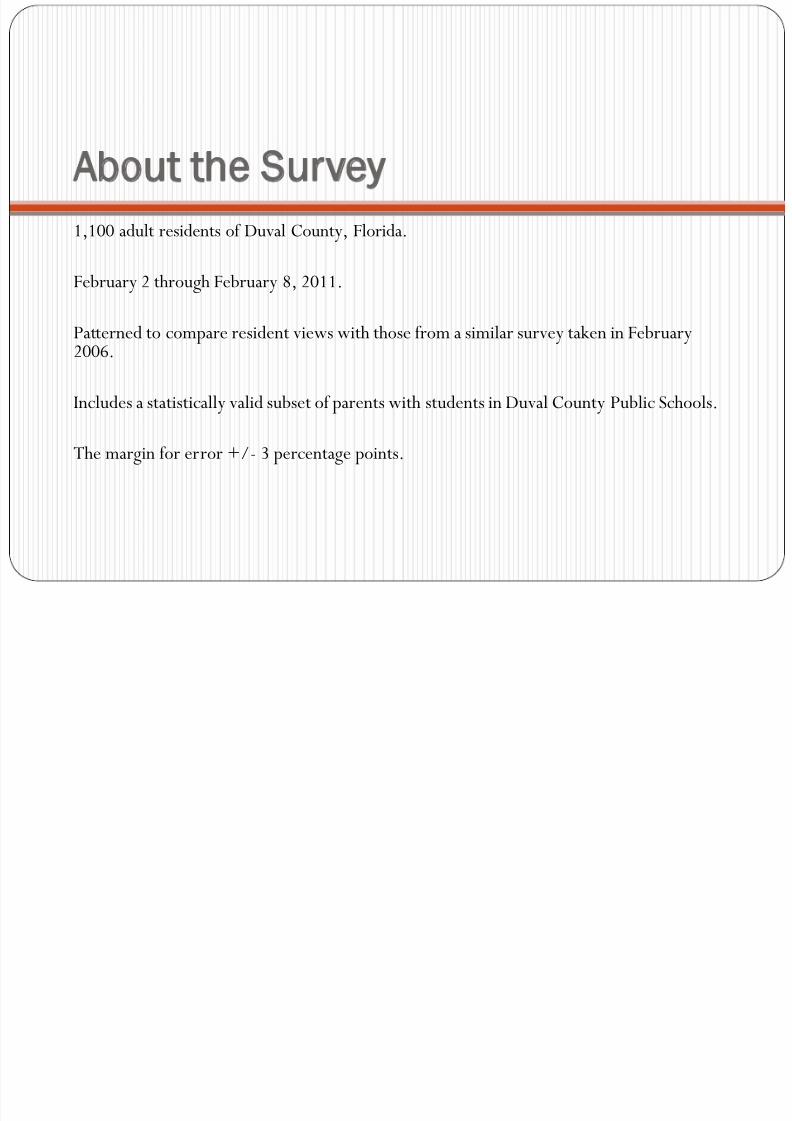
The Challenge Facing Duval County
Residents of Jacksonville think education is the most critical issue facing the
community -- more important than it was five years ago when a similar poll wasconducted.
The existing school system receives low ratings from residents, particularly
parents of Duval County public school students.
The majority of residents, parents, non-parents, blacks, whites and virtually every
subgroup, believes it will take increased funding to improve the school
system.
But half of the respondents feel their taxes are too high already and half of those
expressing an opinion are opposed to paying any additional taxes.
8/7/2019 2011 Quality Education for All Poll Results
http://slidepdf.com/reader/full/2011-quality-education-for-all-poll-results 5/15
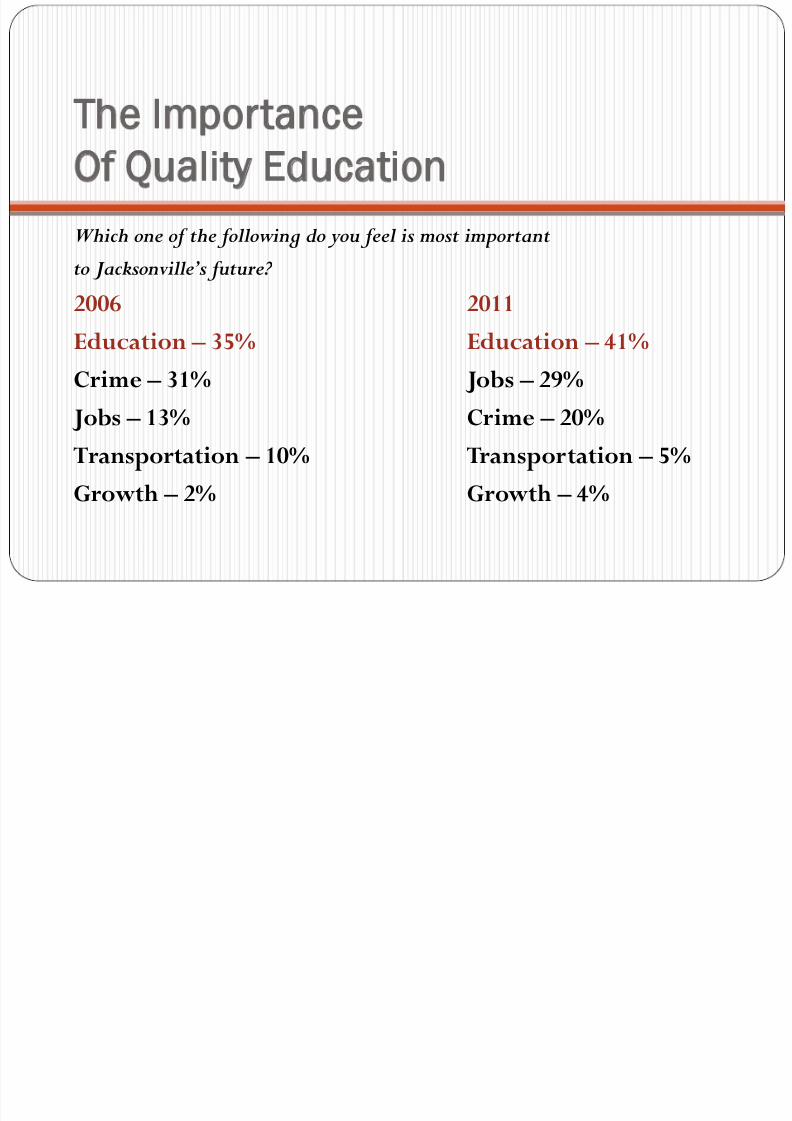
The Importance
Of Quality Education
Which one of the following do you feel is most important
to Jacksonville’s future? 2006 2011
Education – 35% Education – 41%
Crime – 31% Jobs – 29%
Jobs – 13% Crime – 20%
Transportation – 10% Transportation – 5%
Growth – 2% Growth – 4%
8/7/2019 2011 Quality Education for All Poll Results
http://slidepdf.com/reader/full/2011-quality-education-for-all-poll-results 6/15
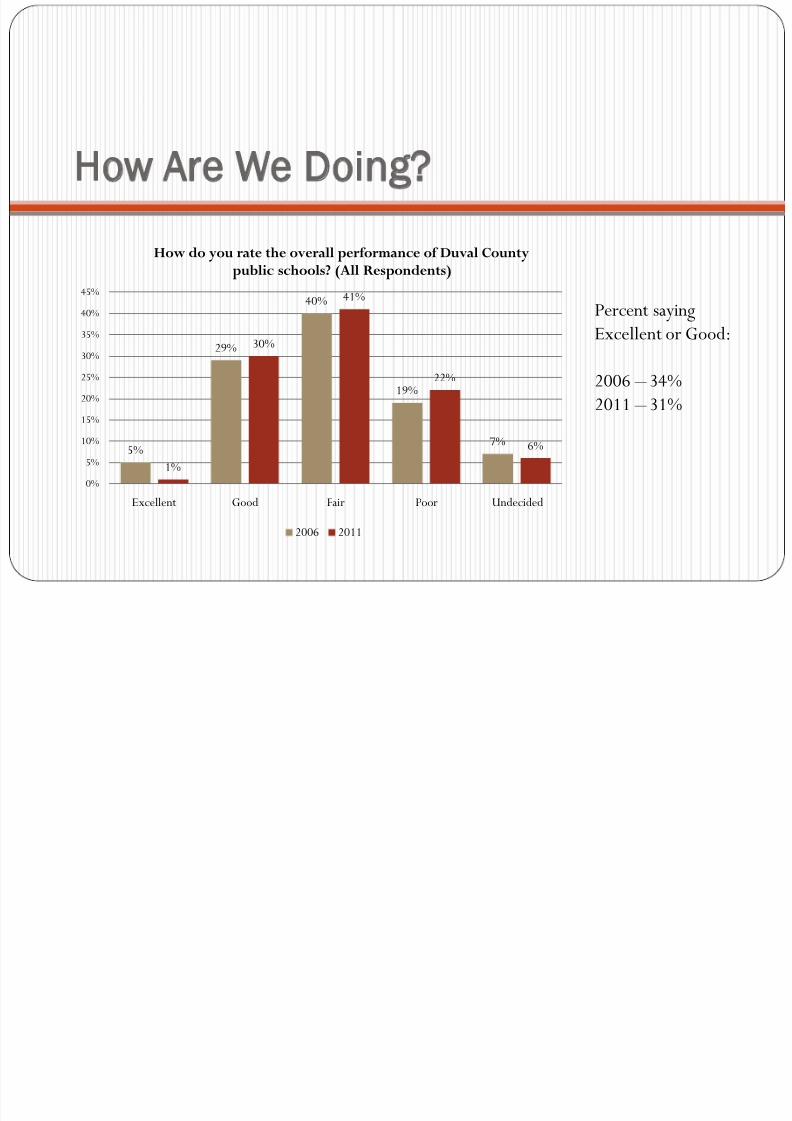
How Are We Doing?
Percent saying
Excellent or Good:
2006 – 34%
2011–
31%
5%
29%
40%
19%
7%
1%
30%
41%
22%
6%
0%
5%
10%
15%
20%
25%
30%
35%
40%
45%
Excellent Good Fair Poor Undecided
How do you rate the overall performance of Duval County
public schools? (All Respondents)
2006 2011
8/7/2019 2011 Quality Education for All Poll Results
http://slidepdf.com/reader/full/2011-quality-education-for-all-poll-results 7/15
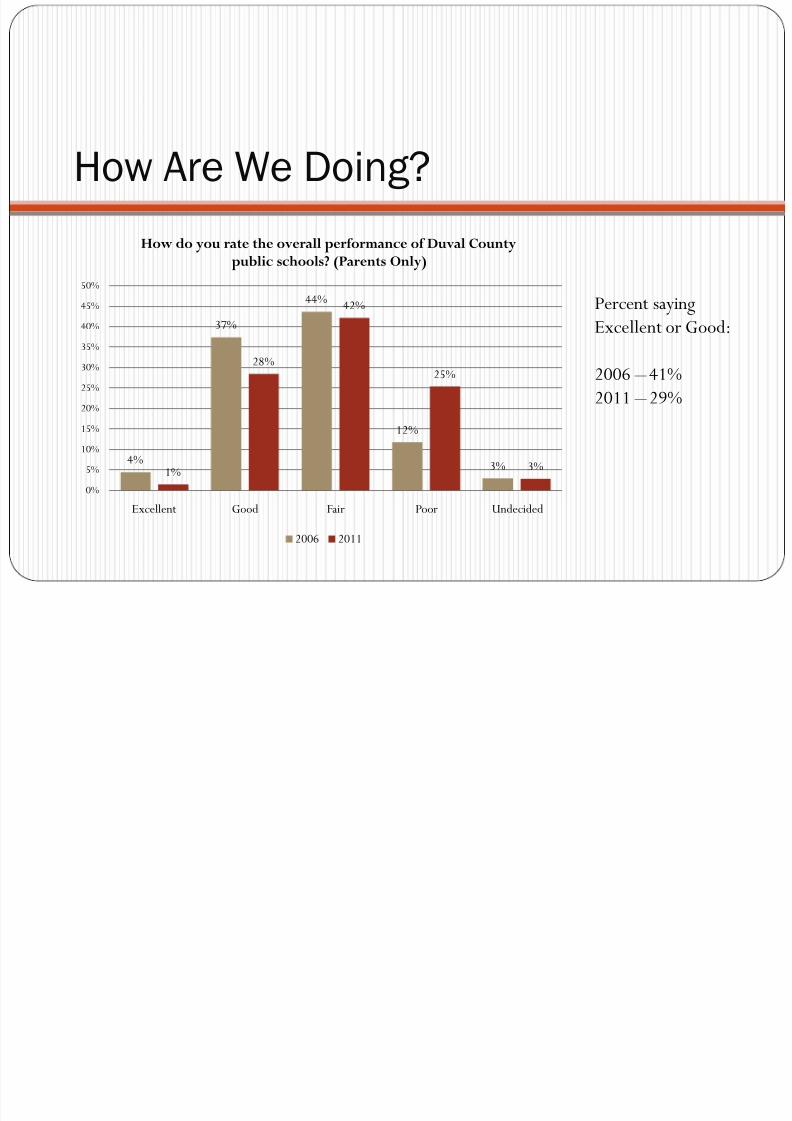
How Are We Doing?
Percent saying
Excellent or Good:
2006 – 41%
2011 – 29%
4%
37%
44%
12%
3%1%
28%
42%
25%
3%
0%
5%
10%
15%
20%
25%
30%
35%
40%
45%
50%
Excellent Good Fair Poor Undecided
How do you rate the overall performance of Duval Countypublic schools? (Parents Only)
2006 2011
8/7/2019 2011 Quality Education for All Poll Results
http://slidepdf.com/reader/full/2011-quality-education-for-all-poll-results 8/15
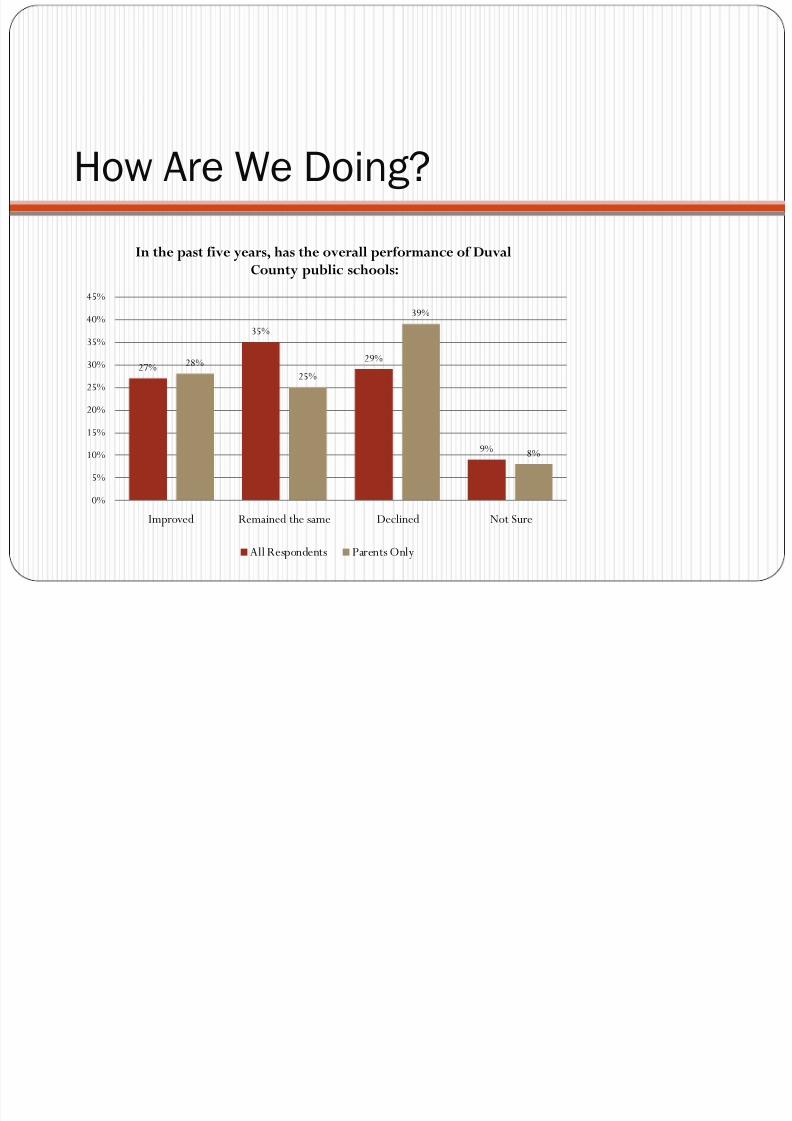
How Are We Doing?
27%
35%
29%
9%
28%
25%
39%
8%
0%
5%
10%
15%
20%
25%
30%
35%
40%
45%
Improved Remained the same Declined Not Sure
In the past five years, has the overall performance of Duval
County public schools:
All Respondents Parents Only
8/7/2019 2011 Quality Education for All Poll Results
http://slidepdf.com/reader/full/2011-quality-education-for-all-poll-results 9/15
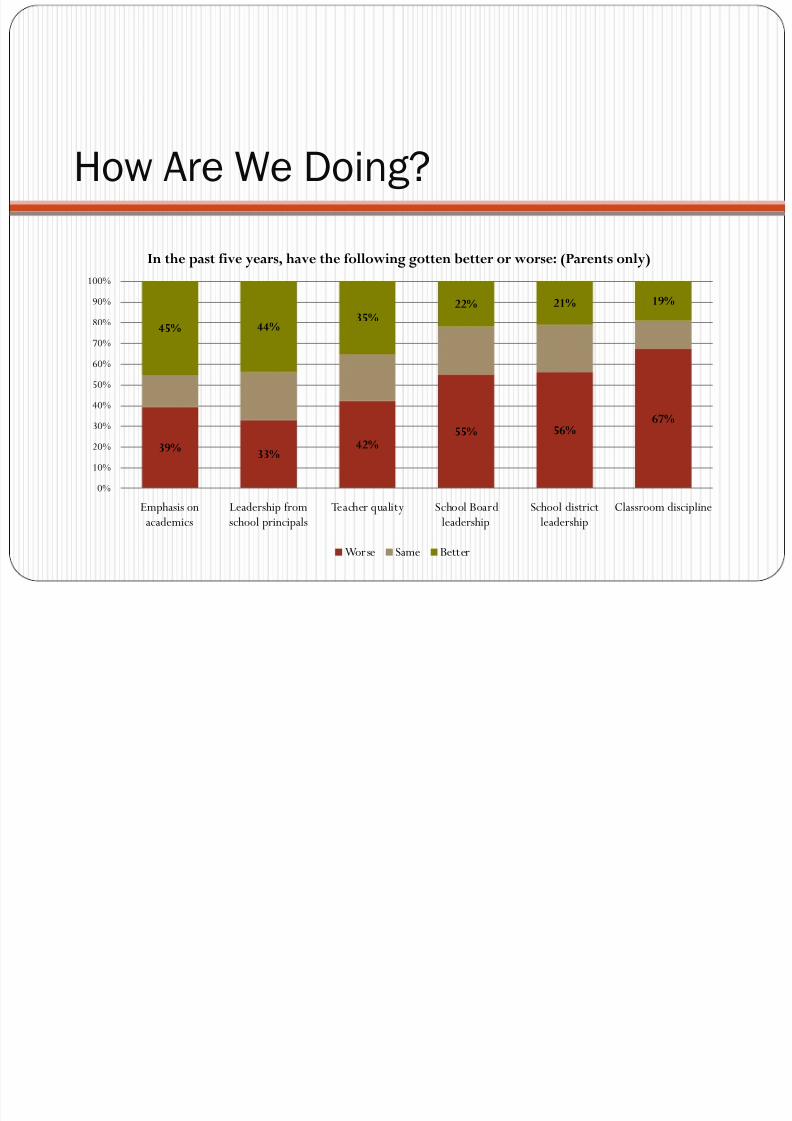
How Are We Doing?
39%33%
42%55% 56%
67%
45% 44%35%
22% 21% 19%
0%
10%
20%
30%
40%
50%
60%
70%
80%
90%
100%
Emphasis onacademics
Leadership fromschool principals
Teacher quality School Boardleadership
School districtleadership
Classroom discipline
In the past five years, have the following gotten better or worse: (Parents only)
Worse Same Better
8/7/2019 2011 Quality Education for All Poll Results
http://slidepdf.com/reader/full/2011-quality-education-for-all-poll-results 10/15
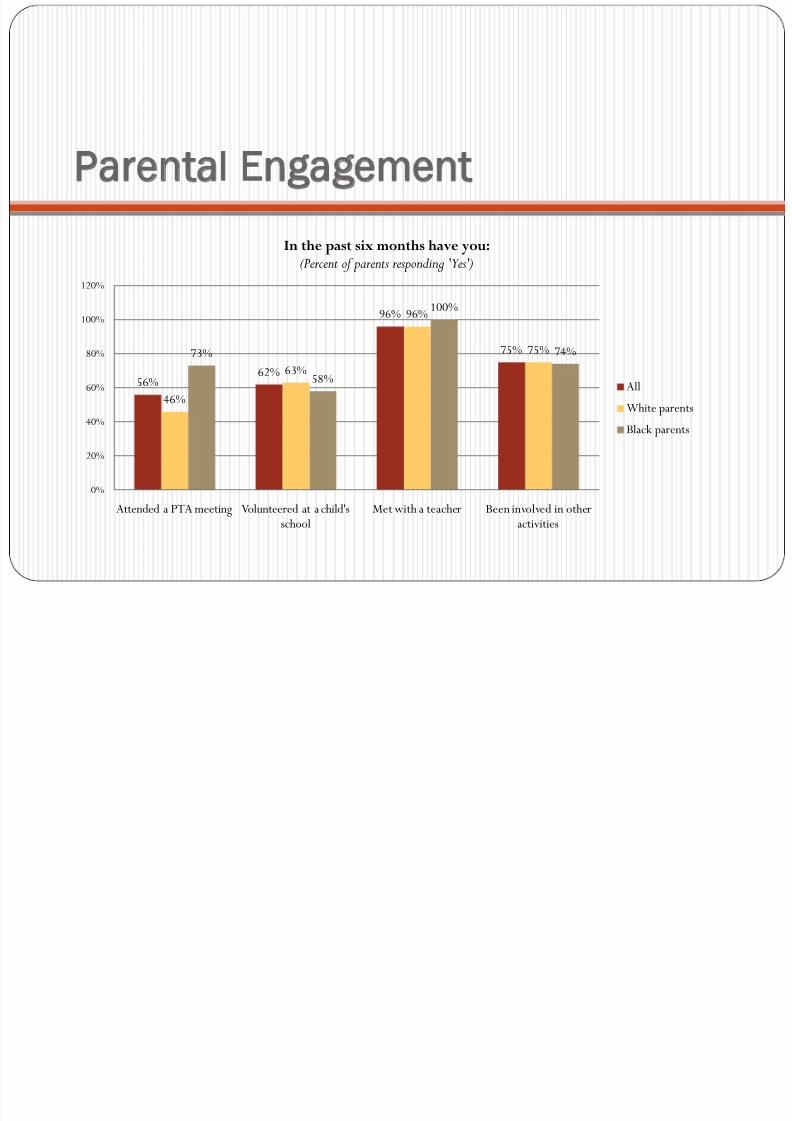
Parental Engagement
56%62%
96%
75%
46%
63%
96%
75%73%
58%
100%
74%
0%
20%
40%
60%
80%
100%
120%
Attended a PTA meeting Volunteered at a child'sschool
Met with a teacher Been involved in otheractivities
In the past six months have you:(Percent of parents responding 'Yes')
All
White parentsBlack parents
8/7/2019 2011 Quality Education for All Poll Results
http://slidepdf.com/reader/full/2011-quality-education-for-all-poll-results 11/15
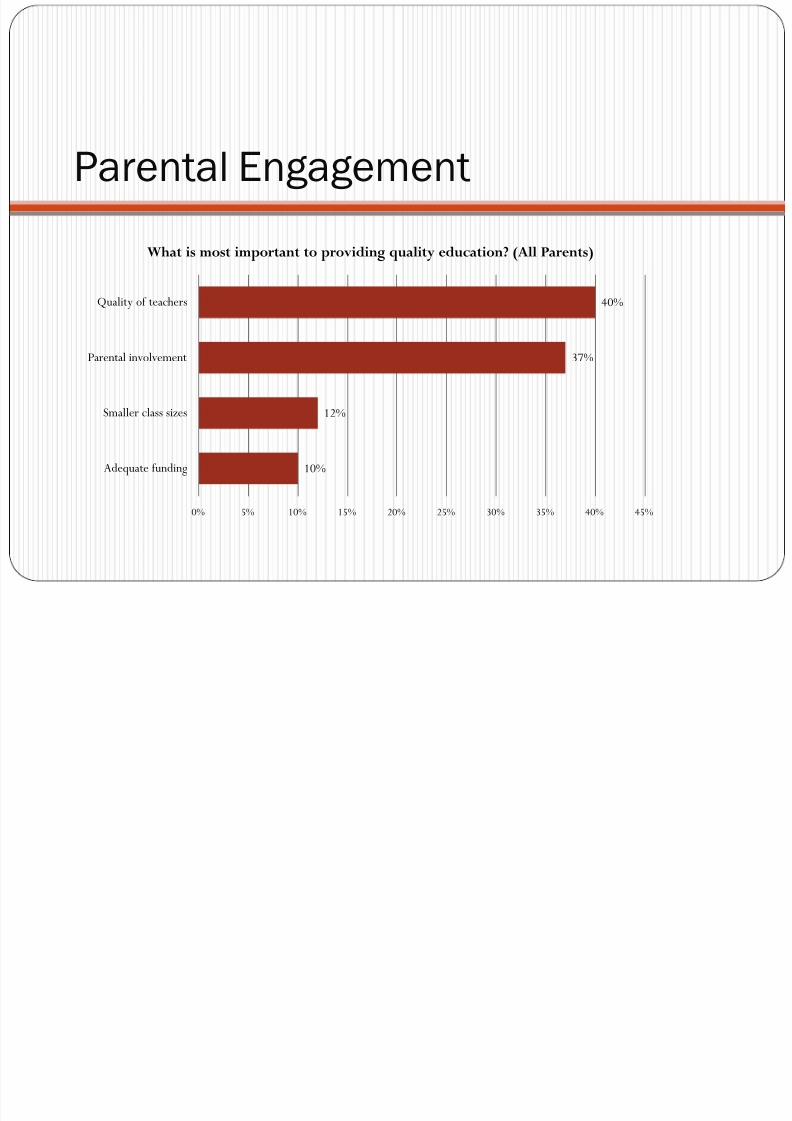
Parental Engagement
10%
12%
37%
40%
0% 5% 10% 15% 20% 25% 30% 35% 40% 45%
Adequate funding
Smaller class sizes
Parental involvement
Quality of teachers
What is most important to providing quality education? (All Parents)
8/7/2019 2011 Quality Education for All Poll Results
http://slidepdf.com/reader/full/2011-quality-education-for-all-poll-results 12/15
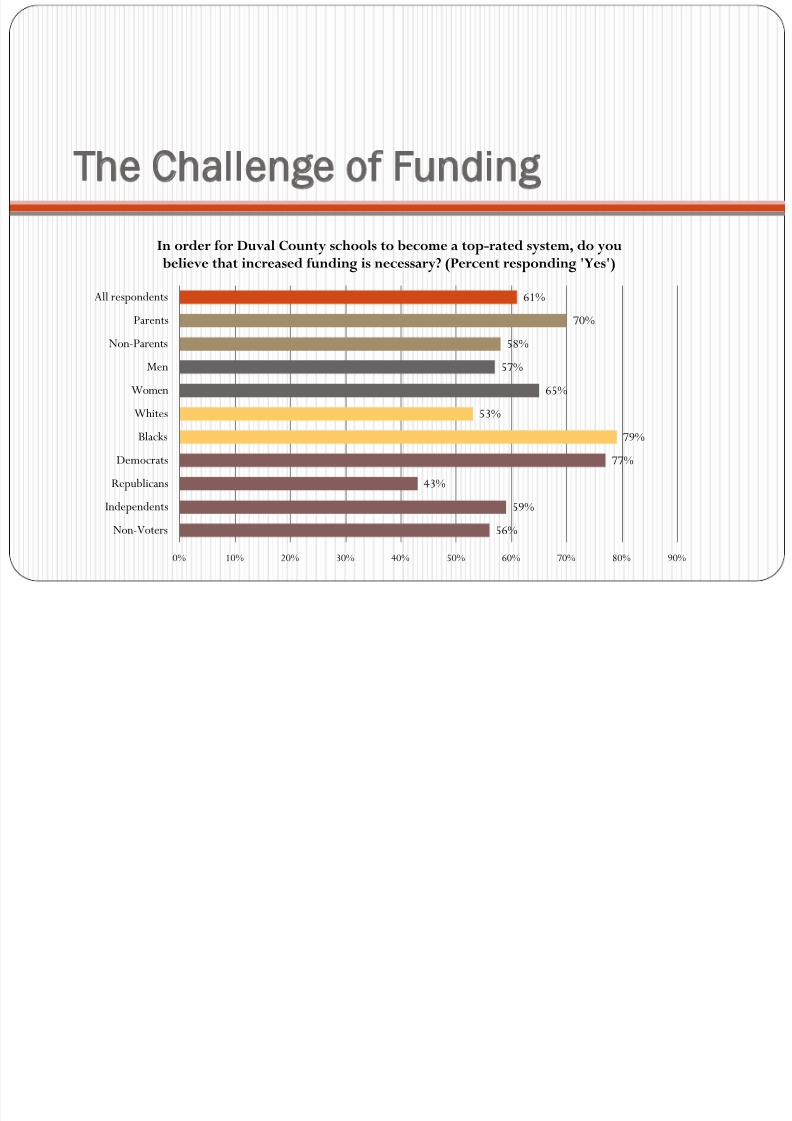
The Challenge of Funding
56%
59%
43%
77%
79%
53%
65%
57%
58%
70%
61%
0% 10% 20% 30% 40% 50% 60% 70% 80% 90%
Non-Voters
Independents
Republicans
Democrats
Blacks
Whites
Women
Men
Non-Parents
Parents
All respondents
In order for Duval County schools to become a top-rated system, do youbelieve that increased funding is necessary? (Percent responding 'Yes')
8/7/2019 2011 Quality Education for All Poll Results
http://slidepdf.com/reader/full/2011-quality-education-for-all-poll-results 13/15
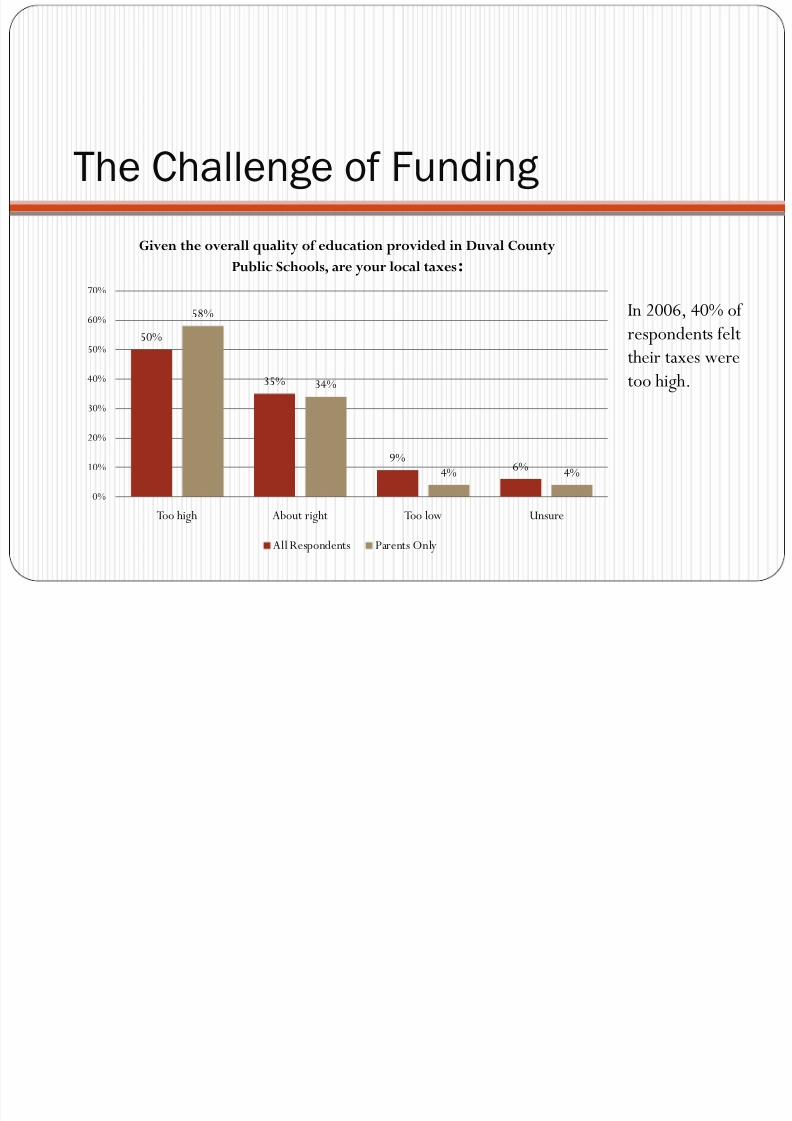
The Challenge of Funding
In 2006, 40% of
respondents felt
their taxes were
too high.
50%
35%
9%6%
58%
34%
4% 4%
0%
10%
20%
30%
40%
50%
60%
70%
Too high About right Too low Unsure
Given the overall quality of education provided in Duval County
Public Schools, are your local taxes:
All Respondents Parents Only
8/7/2019 2011 Quality Education for All Poll Results
http://slidepdf.com/reader/full/2011-quality-education-for-all-poll-results 14/15
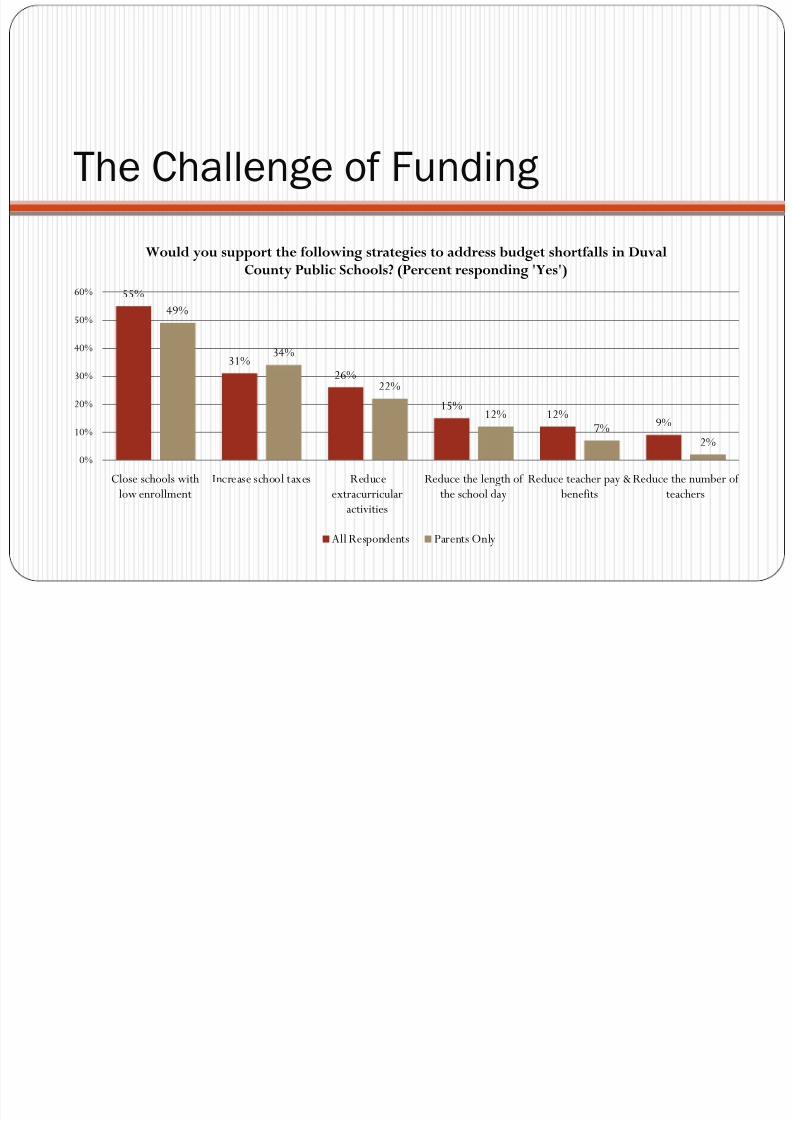
The Challenge of Funding
55%
31%26%
15%12% 9%
49%
34%
22%
12%7%
2%
0%
10%
20%
30%
40%
50%
60%
Close schools withlow enrollment
Increase school taxes Reduceextracurricular
activities
Reduce the length of the school day
Reduce teacher pay &benefits
Reduce the number of teachers
Would you support the following strategies to address budget shortfalls in Duval
County Public Schools? (Percent responding 'Yes')
All Respondents Parents Only
8/7/2019 2011 Quality Education for All Poll Results
http://slidepdf.com/reader/full/2011-quality-education-for-all-poll-results 15/15
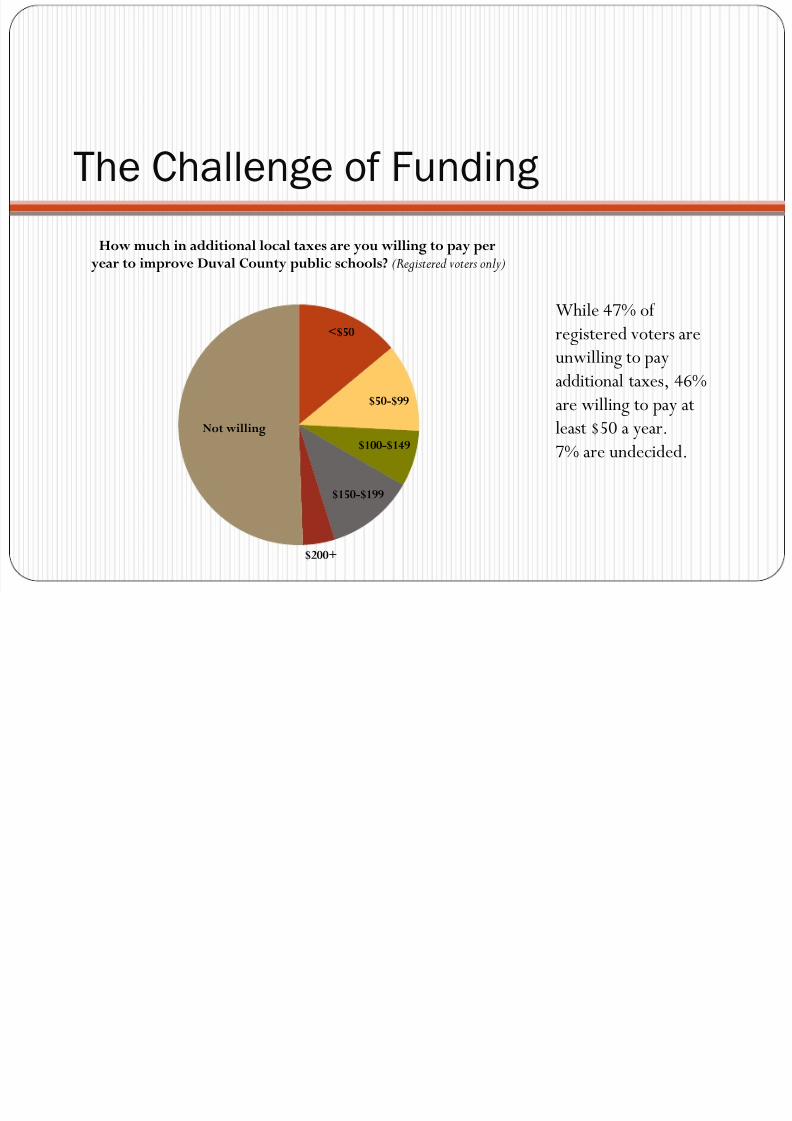
The Challenge of Funding
<$50
$50-$99
$100-$149
$150-$199
$200+
Not willing
How much in additional local taxes are you willing to pay peryear to improve Duval County public schools? (Registered voters only)
While 47% of
registered voters are
unwilling to pay
additional taxes, 46%
are willing to pay at
least $50 a year.
7% are undecided.