Embed Size (px)
Citation preview

Statement of Basis
Construction Deadline Extension Request
for the
Prevention of Significant Deterioration
Permit #28.0701-PSD
Hyperion Energy Center
Near Elk Point
Union County, South Dakota
South Dakota Department of Environment and Natural Resources

Table of Contents Page #
ii
1.0 Background .....................................................................................................1
2.0 Extending Construction Deadline Requirements ........................................2
3.0 Re-analysis of the Best Available Control Technology ...............................4 3.1 Process Heaters........................................................................................................5 3.2 Catalyst Regenerators .............................................................................................7 3.3 Sulfur Recovery Plant .............................................................................................7 3.4 IGCC Combustion Turbines ..................................................................................8 3.5 IGCC Startup Burners..........................................................................................11 3.6 IGCC Power Island Acid Gas Removal System .................................................12 3.7 Storage Buildings...................................................................................................12 3.8 Generators and Fire Pumps .................................................................................13 3.9 Refinery and Gasification Flares .........................................................................13 3.10 Cooling Tower........................................................................................................15 3.11 Wastewater Treatment Plant ...............................................................................16 3.12 Coke Drum Steam Vents.......................................................................................17 3.13 Tank Farm and Tank Farm Thermal Oxidizer..................................................18 3.14 Loading Racks .......................................................................................................18 3.15 Fugitive Sources.....................................................................................................19 3.16 Coker Quench Water Handling System..............................................................19
4.0 Re-analysis of the Ambient Air Quality Analysis ......................................22 4.1 Ambient Background Data...................................................................................22 4.2 Emission Source Inventory...................................................................................23 4.3 Proposed Changes at Hyperion............................................................................24 4.4 New National Ambient Air Quality Standards...................................................24
4.4.1 Model Accuracy ........................................................................................26 4.4.2 Modeling Assumptions .............................................................................28 4.4.3 Results of Modeling Analysis ...................................................................30 4.4.4 Revised Limits Based on Modeling Analysis ..........................................31
4.5 New PM2.5 Increment Regulation.......................................................................31
5.0 Evaluate New Regulations............................................................................32 5.1 Supreme Court Ruling in Massachusetts v. EPA...............................................33 5.2 Endangerment Finding .........................................................................................33 5.3 Motor Vehicle Regulations ...................................................................................33 5.4 Tailoring Rule Regulations...................................................................................34 5.5 U.S. Senate Proposals ............................................................................................34 5.6 Greenhouse Gas BACT Analysis .........................................................................35
5.6.1 GHG BACT for Process Heaters ................................................................35 5.6.2 GHG BACT for Coke Drum Steam Vents .................................................45

Table of Contents Page #
iii
5.6.3 GHG BACT for Power Island Acid Gas Removal System (CO2 Vent) ..46 5.6.4 GHG BACT for Combined Cycle Gas Turbines .......................................50 5.6.5 GHG BACT for Small Combustion Sources..............................................54 5.6.6 GHG BACT for Equipment Leaks .............................................................58
6.0 EPA Correspondence....................................................................................59 6.1 Issue #1 – Final VOC BACT Limits for Refinery Process Heaters ..................59 6.2 Issue #2 – BACT Analysis for Coker Drum Overhead Steam Vents................60 6.3 Issue #3 – BACT Analysis for Startup, Shutdown, and Malfunction...............60 6.4 Issue #4 – Detailed Cost Estimates for Refinery Process Heaters.....................62 6.5 Issue #5 – Additional Information on Modeling Input Data .............................65 6.6 Issue #6 – BACT Analysis for Refinery and IGCC Flares ................................66 6.7 Issue #7 – BACT Analysis for Coker Quench Tank...........................................68 6.8 Issue #8 – Consideration of Leakless Technology as BACT..............................69

1
1.0 Background On December 20, 2007, RTP Environmental Associates Inc., on behalf of Hyperion Refining LLC, submitted a Prevention Significant Deterioration (PSD) air quality permit application to construct and operate a petroleum refinery, an integrated gasification combined cycle (IGCC) power plant, and ancillary equipment. Hyperion Refining and/or the Hyperion Energy Center project will be referred to as “Hyperion” in this document. On September 11, 2008, DENR public noticed the draft PSD air quality permit. The public comment period ran until November 14, 2008. DENR received approximately 3,000 comments during the public comment period. Two parties (e.g., Hyperion and Jenner & Block, representing Citizens Opposed to Oil Pollution, Save Union County, and the Sierra Club) submitted petitions for a contested case hearing in front of the Board of Minerals and Environment. On August 20, 2009, the Board of Minerals and Environment approved and issued Hyperion’s PSD air quality permit #28.0701-PSD. In September 2009, both Hyperion and Jenner & Block submitted appeals of the Board of Minerals and Environment’s decision to South Dakota’s Circuit Court. On June 23, 2010, South Dakota’s Circuit Court Judge Mark Barnett issued an order requiring the Board of Minerals and Environment take additional evidence under SDCL 1-26-34 “including at least the issues resulting from: Hyperion’s request for extension of the construction commencement date established in the permit; the Primary National Ambient Air Quality Standards for Nitrogen Dioxide Final Rule; the Primary National Ambient Air Quality Standard for Sulfur Dioxide Final Rule; the coker quench water tank; any final greenhouse gas rules; and any additional evidence regarding Best Available Control Technology (BACT) determinations, applicable as a result of Hyperion’s request for extension of the construction commencement date.” On June 23, 2010, RTP Environmental Associates, on behalf of Hyperion, submitted a request to extend the construction deadline. Hyperion requests the deadline be extended from February 20, 2011, to August 20, 2012. DENR submitted several letters to RTP Environmental Associates indicating the request to extend the construction deadline was incomplete and additional supporting information or documentation needed to be submitted. RTP Environmental Associates has submitted responses to DENR’s requests for additional information and addendums to its initial submittals. The following is a summary of the information submitted:
1. September 8, 2010 – Hyperion provides supplemental information on coker quench water handling system, a review EPA’s proposed National Emission Standard for Hazardous Air Pollutants for combustion sources, a discussion on greenhouse gases, and modeling

2
for the new 1-hour sulfur dioxide and the new 1-hour nitrogen dioxide National Ambient Air Quality Standards;
2. October 18, 2010 – Hyperion provides a greenhouse gas Best Available Control Technology review and documentation on the nitrogen dioxide to nitrogen oxide in-stack ratio used in the modeling;
3. November 1, 2010 – Hyperion provides revised modeling files and a modeling report; 4. November 22, 2010 – Hyperion provides a revised greenhouse gas Best Available
Control Technology review; 5. January 18, 2011 – Hyperion provides a discussion on the averaging periods representing
the greenhouse gas Best Available Control Technology; 6. January 24, 2011 – Hyperion provides revised modeling files and information supporting
the greenhouse gas Best Available Control Technology review; 7. January 26, 2011 – Hyperion provides additional information supporting the greenhouse
gas Best Available Control Technology review; 8. January 31, 2011 – Hyperion provides revised modeling files and a modeling report; and 9. February 4, 2011 – Hyperion provides revised modeling files and a modeling report;
2.0 Extending Construction Deadline Requirements Administrative Rules of South Dakota (ARSD) § 74:36:09:02, as referenced to 40 CFR § 52.21(r)(2), states “approval to construct shall become invalid if construction is not commenced within 18 months after receipt of such approval, if construction is discontinued for a period of 18 months or more, or if construction is not completed within a reasonable time. The Administrator may extend the 18-month period upon a satisfactory showing that an extension is justified.” ARSD § 74:36:09:02(1) specifies the term administrator means the Secretary of the Department of Environment and Natural Resources. Permit condition 2.1 of permit #28.0701-PSD states “the owner or operator shall commence construction within 18 months of the effective date of this permit. If construction is delayed or interrupted for a period of 18 months or more this permit becomes invalid. The owner or operator may apply, before the end of the 18-month period, to the Secretary for an extension. The Secretary may grant an extension after the owner or operator satisfactorily demonstrates that an extension is justified.” The federal regulation does not specify what information or what criteria must be used for the Administrator to grant an extension. EPA has made similar statements in memos and draft policies it has developed over the years which are listed below:
1) November 26, 1980, EPA memo from Walter C. Barber, Director Office of Air Quality Planning and Standards to Sandra S. Gardbring, Director Enforcement Division, Region V. This memo states that “this is a sensitive issue, especially since the existing
3
regulatory language does not provide explicit guidance regarding how such requests would be treated, or what constitutes sufficient justification for an extension.”
2) July 5, 1985, EPA memo from Darryl D. Tyler, Director Control programs to Directors, Air Division Regions I-X. The draft policy attachment to the memo (page 26) notes “the showing which a source must make in order to receive a permit extension has been a longstanding problem.”
DENR reviewed several documents to determine what it should consider before granting an extension. The following documents were reviewed and are summarized below:
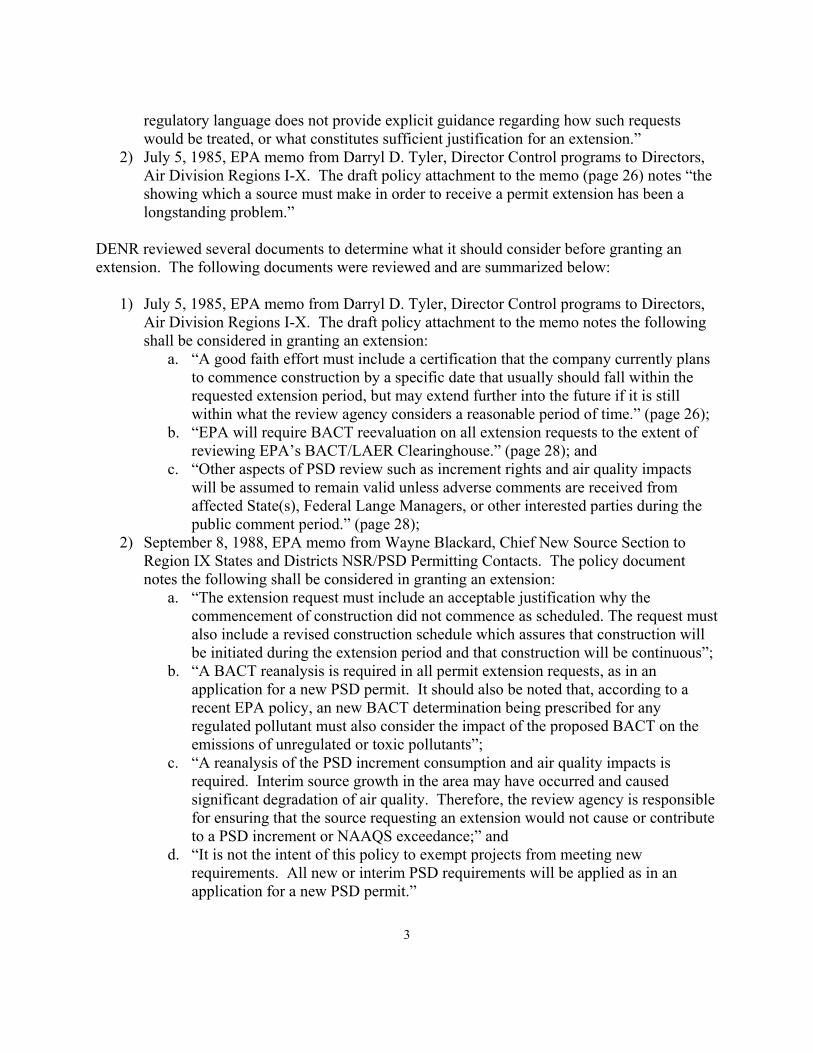
1) July 5, 1985, EPA memo from Darryl D. Tyler, Director Control programs to Directors, Air Division Regions I-X. The draft policy attachment to the memo notes the following shall be considered in granting an extension:
a. “A good faith effort must include a certification that the company currently plans to commence construction by a specific date that usually should fall within the requested extension period, but may extend further into the future if it is still within what the review agency considers a reasonable period of time.” (page 26);
b. “EPA will require BACT reevaluation on all extension requests to the extent of reviewing EPA’s BACT/LAER Clearinghouse.” (page 28); and
c. “Other aspects of PSD review such as increment rights and air quality impacts will be assumed to remain valid unless adverse comments are received from affected State(s), Federal Lange Managers, or other interested parties during the public comment period.” (page 28);
2) September 8, 1988, EPA memo from Wayne Blackard, Chief New Source Section to Region IX States and Districts NSR/PSD Permitting Contacts. The policy document notes the following shall be considered in granting an extension:
a. “The extension request must include an acceptable justification why the commencement of construction did not commence as scheduled. The request must also include a revised construction schedule which assures that construction will be initiated during the extension period and that construction will be continuous”;
b. “A BACT reanalysis is required in all permit extension requests, as in an application for a new PSD permit. It should also be noted that, according to a recent EPA policy, an new BACT determination being prescribed for any regulated pollutant must also consider the impact of the proposed BACT on the emissions of unregulated or toxic pollutants”;
c. “A reanalysis of the PSD increment consumption and air quality impacts is required. Interim source growth in the area may have occurred and caused significant degradation of air quality. Therefore, the review agency is responsible for ensuring that the source requesting an extension would not cause or contribute to a PSD increment or NAAQS exceedance;” and
d. “It is not the intent of this policy to exempt projects from meeting new requirements. All new or interim PSD requirements will be applied as in an application for a new PSD permit.”

4
3) May 15, 2002, Texas Natural Resources Conservation Commission memo from John Steib, Director to Air Permits Division. The policy document notes that “you will need to review the permit to make sure that it still meets current best available control technology (BACT) and that off-property impacts are still acceptable.”
4) January 10, 2005, the state of Washington filed regulation WAC 173-400-730. The regulation specifies the following be submitted:
a. A written request for the extension, submitted by the PSD permit holder, as soon as possible prior to the expiration of the current PSD permit; and
b. An evaluation of BACT and an updated ambient impact, including an increment analysis, for all pollutants subject to the approval conditions in the PSD permit.
It should be noted EPA’s policies, Texas’ policy and Washington’s regulations noted above are not legally binding requirements for South Dakota’s PSD air quality permit program. Taken this information into account, DENR considered three technical areas in reviewing Hyperion’s request to extend the construction deadline. Those three technical areas are:
1) Re-evaluate the Best Available Control Technology; 2) Re-evaluate the Ambient Air Quality Analysis (modeling); and 3) Evaluate any new regulations applicable to the PSD program.
3.0 Re-analysis of the Best Available Control Technology In accordance with 40 CFR § 52.21(j)(2), a new major source shall apply best available control technology for each pollutant subject to regulation under the federal Clean Air Act for which it would result in significant net emissions at the source. The BACT requirement applies to each individual new or modified affected emissions unit and pollutant emitting activity at which a net emissions increase would occur. The BACT analysis consists of determining the best available controls and establishing an emissions limit (including a visible emission standard) based on the maximum degree of reduction achievable for each pollutant subject to a regulation under the federal Clean Air Act. The BACT analysis is determined on a case-by-case basis taking into account energy, environmental, and economic impacts, and other costs. BACT is achievable through application of production processes or available methods, systems, and techniques, including fuel cleaning, treatment or innovative fuel combustion techniques for control of such pollutant. In no case shall application of BACT result in an emission limit for any pollutant that would be greater than the emission limit allowed by any applicable standard under 40 CFR Parts 60 and 61. Hyperion conducted and DENR reviewed a BACT analysis for particulate matter, sulfur dioxide, nitrogen oxide, ozone (measured as volatile organic compounds), carbon monoxide, sulfuric acid mist, hydrogen sulfide, total reduced sulfur and reduced sulfur compounds. The determination of BACT approved by the Board of Minerals and Environment is outlined in Hyperion’s PSD air quality permit #28.0701-PSD.

5
As part of this extension request, DENR required Hyperion to re-analyze these BACT determinations. DENR reviewed Hyperion’s re-analysis by focusing on new information not previously reviewed or discussed prior to and during the contested case hearing in front of the Board of Minerals and Environment that may change the previous BACT determination. DENR did not conduct a full analysis of all available options, rank those options, etc. because that was conducted during the initial determination. DENR considered the following sources of information in conducting its review of Hyperion’s re-analysis of BACT:
1) EPA’s Reasonably Available Control Technology, Best Available Control Technology and Lowest Achievable Emission Rate Clearinghouse (generally referred to as the RACT/BACT/LAER Clearinghouse or RBLC);
2) Permits issued to other petroleum refineries and/or IGCC power plants in other states; 3) PSD permit applications; 4) Rules and regulations in other states; 5) Databases from other government resources; and 6) EPA’s proposed and finalized rules and technical documents.
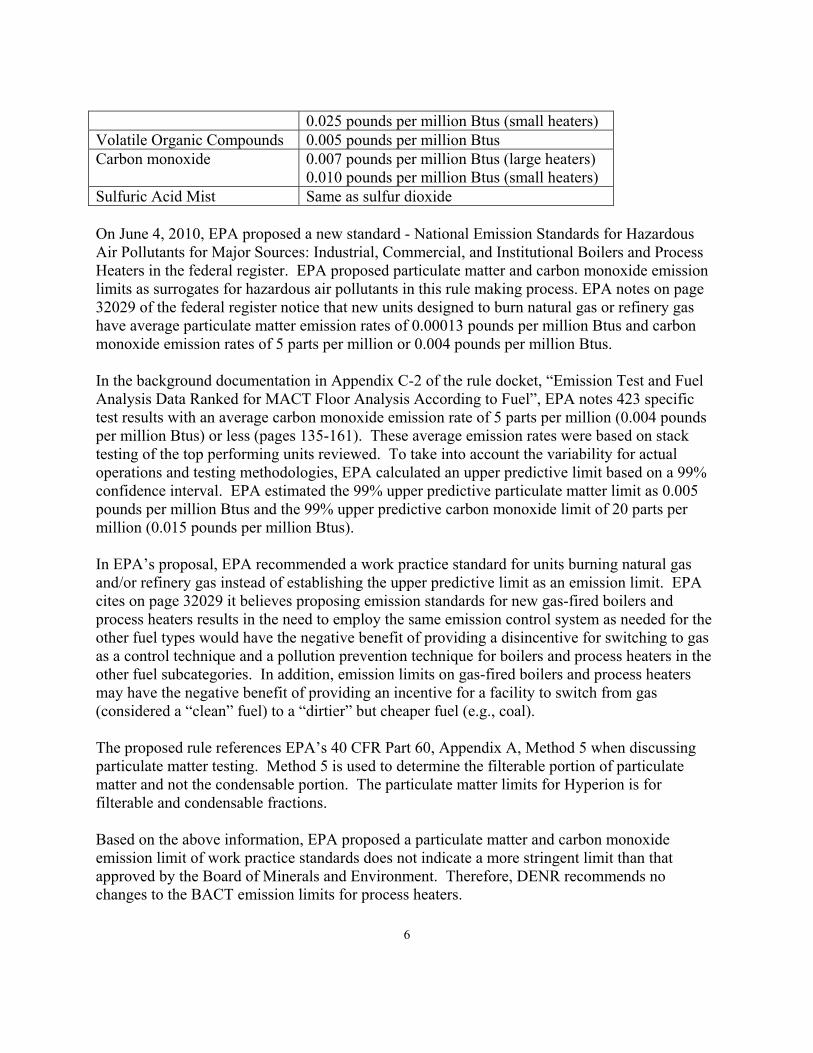
DENR identified in the next subsections on if it determined an equivalent or more stringent limit for each type of unit then that determined in Hyperion’s PSD air quality permit based on the above sources of information. The existing BACT limits are identified as pounds per million Btus, parts per million, pounds per hour, etc. The pound per hour emission limit represents a case-by-case emission limit specific to an emission unit and is difficult to compare between similar units that vary in size. Whereas, a parts per million or pounds per million Btu emission limit may be compared between similar units that vary in size. DENR did not summarize the results of its review if the above sources of information resulted in a BACT emission limit less stringent to what is currently in Hyperion’s PSD air quality permit. 3.1 Process Heaters The BACT limits in the existing PSD permit for the process heaters are in pounds per hour and pounds per million Btus or parts per million. Table 3-1 lists the part per million or pound per million Btu BACT emission limits for the process heaters in the existing PSD permit. RTP Environmental Associates did not recommend any changes to the BACT emission limits for process heaters. Table 3-1 – Process Heater BACT (Units #1 through #30) Regulated Pollutant BACT Emission Limits Particulate matter 0.0075 pounds per million Btus Sulfur dioxide 25 parts per million total sulfur by volume Nitrogen oxide 0.006 pounds per million Btus (large heaters)
6
0.025 pounds per million Btus (small heaters) Volatile Organic Compounds 0.005 pounds per million Btus Carbon monoxide 0.007 pounds per million Btus (large heaters)
0.010 pounds per million Btus (small heaters) Sulfuric Acid Mist Same as sulfur dioxide On June 4, 2010, EPA proposed a new standard - National Emission Standards for Hazardous Air Pollutants for Major Sources: Industrial, Commercial, and Institutional Boilers and Process Heaters in the federal register. EPA proposed particulate matter and carbon monoxide emission limits as surrogates for hazardous air pollutants in this rule making process. EPA notes on page 32029 of the federal register notice that new units designed to burn natural gas or refinery gas have average particulate matter emission rates of 0.00013 pounds per million Btus and carbon monoxide emission rates of 5 parts per million or 0.004 pounds per million Btus. In the background documentation in Appendix C-2 of the rule docket, “Emission Test and Fuel Analysis Data Ranked for MACT Floor Analysis According to Fuel”, EPA notes 423 specific test results with an average carbon monoxide emission rate of 5 parts per million (0.004 pounds per million Btus) or less (pages 135-161). These average emission rates were based on stack testing of the top performing units reviewed. To take into account the variability for actual operations and testing methodologies, EPA calculated an upper predictive limit based on a 99% confidence interval. EPA estimated the 99% upper predictive particulate matter limit as 0.005 pounds per million Btus and the 99% upper predictive carbon monoxide limit of 20 parts per million (0.015 pounds per million Btus). In EPA’s proposal, EPA recommended a work practice standard for units burning natural gas and/or refinery gas instead of establishing the upper predictive limit as an emission limit. EPA cites on page 32029 it believes proposing emission standards for new gas-fired boilers and process heaters results in the need to employ the same emission control system as needed for the other fuel types would have the negative benefit of providing a disincentive for switching to gas as a control technique and a pollution prevention technique for boilers and process heaters in the other fuel subcategories. In addition, emission limits on gas-fired boilers and process heaters may have the negative benefit of providing an incentive for a facility to switch from gas (considered a “clean” fuel) to a “dirtier” but cheaper fuel (e.g., coal). The proposed rule references EPA’s 40 CFR Part 60, Appendix A, Method 5 when discussing particulate matter testing. Method 5 is used to determine the filterable portion of particulate matter and not the condensable portion. The particulate matter limits for Hyperion is for filterable and condensable fractions. Based on the above information, EPA proposed a particulate matter and carbon monoxide emission limit of work practice standards does not indicate a more stringent limit than that approved by the Board of Minerals and Environment. Therefore, DENR recommends no changes to the BACT emission limits for process heaters.
7
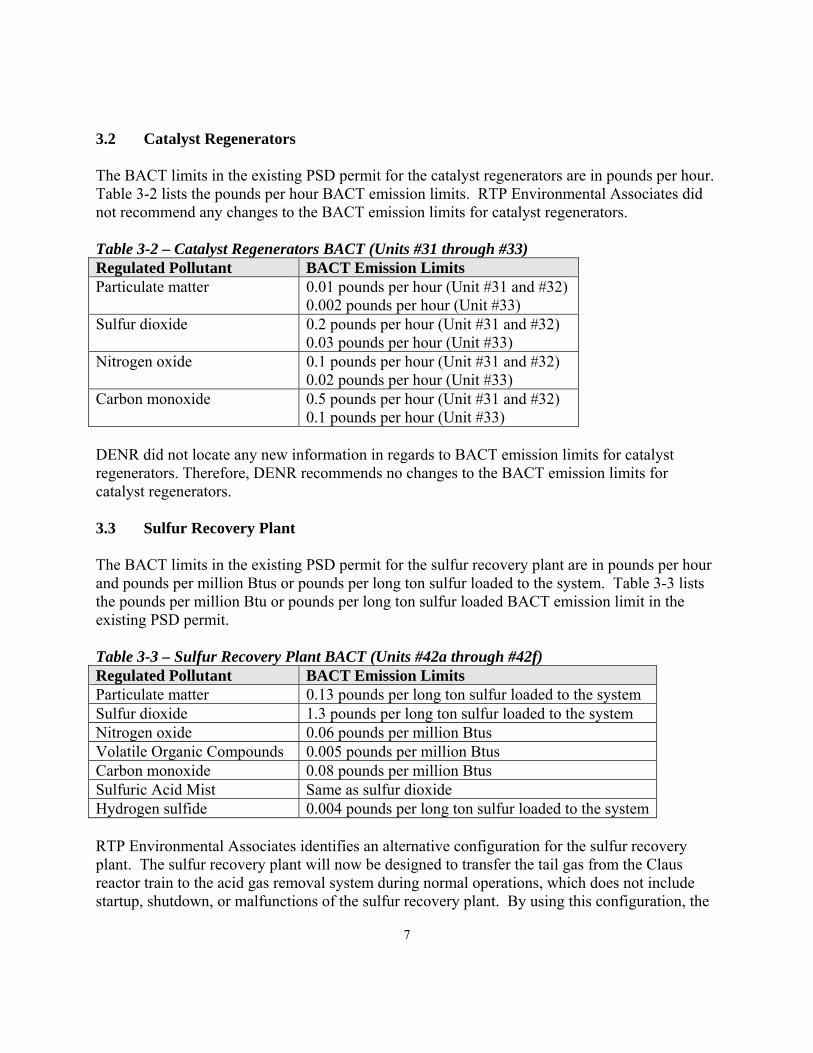
3.2 Catalyst Regenerators The BACT limits in the existing PSD permit for the catalyst regenerators are in pounds per hour. Table 3-2 lists the pounds per hour BACT emission limits. RTP Environmental Associates did not recommend any changes to the BACT emission limits for catalyst regenerators. Table 3-2 – Catalyst Regenerators BACT (Units #31 through #33) Regulated Pollutant BACT Emission Limits Particulate matter 0.01 pounds per hour (Unit #31 and #32)
0.002 pounds per hour (Unit #33) Sulfur dioxide 0.2 pounds per hour (Unit #31 and #32)
0.03 pounds per hour (Unit #33) Nitrogen oxide 0.1 pounds per hour (Unit #31 and #32)
0.02 pounds per hour (Unit #33) Carbon monoxide 0.5 pounds per hour (Unit #31 and #32)
0.1 pounds per hour (Unit #33) DENR did not locate any new information in regards to BACT emission limits for catalyst regenerators. Therefore, DENR recommends no changes to the BACT emission limits for catalyst regenerators. 3.3 Sulfur Recovery Plant The BACT limits in the existing PSD permit for the sulfur recovery plant are in pounds per hour and pounds per million Btus or pounds per long ton sulfur loaded to the system. Table 3-3 lists the pounds per million Btu or pounds per long ton sulfur loaded BACT emission limit in the existing PSD permit. Table 3-3 – Sulfur Recovery Plant BACT (Units #42a through #42f) Regulated Pollutant BACT Emission Limits Particulate matter 0.13 pounds per long ton sulfur loaded to the system Sulfur dioxide 1.3 pounds per long ton sulfur loaded to the system Nitrogen oxide 0.06 pounds per million Btus Volatile Organic Compounds 0.005 pounds per million Btus Carbon monoxide 0.08 pounds per million Btus Sulfuric Acid Mist Same as sulfur dioxide Hydrogen sulfide 0.004 pounds per long ton sulfur loaded to the system RTP Environmental Associates identifies an alternative configuration for the sulfur recovery plant. The sulfur recovery plant will now be designed to transfer the tail gas from the Claus reactor train to the acid gas removal system during normal operations, which does not include startup, shutdown, or malfunctions of the sulfur recovery plant. By using this configuration, the

8
sulfur recovery plant will require just two thermal oxidizers instead of the six thermal oxidizers currently permitted. In addition, only one of the two thermal oxidizers would be in operation at any given time. DENR did not locate any new information in regards to BACT emission limits for sulfur recovery plants. Based on the alternative configuration, DENR recommends the following changes to the Hyperion’s PSD air quality permit #28.0701-PSD issued August 20, 2009:
1) Remove the description and requirements of four of the six thermal oxidizers; 2) Change the language to allow the two thermal oxidizers to operate only during startup,
shutdown, and malfunctions; 3) Revise the hourly particulate matter and sulfur dioxide emission limits to reflect that
there are only two thermal oxidizers now instead of six; 4) Remove the BACT emissions limit in pounds per long ton because the pound per long
ton BACT emissions limit was established for normal operations. Since the new configuration will not operate during normal operations, this limit is no longer required;
5) Remove the BACT emissions limit in pounds per million British thermal units because the BACT emissions limit was established for normal operations. Since the new configuration will not operate during normal operations and the system will not operate more than 240 hours per year, this limit is no longer required.
6) Include an operational limit of 240 hours per 12-month rolling period for startup, shutdown, and malfunction periods;
7) Remove the particulate matter, volatile organic compounds, and hydrogen sulfide stack testing requirements because the testing requirements are not to be conducted during startup, shutdown, or malfunctions; and
8) Include any applicable monitoring, recordkeeping, and reporting. 3.4 IGCC Combustion Turbines The BACT limits in the existing PSD permit for the IGCC combustion turbines are in pounds per hour and pounds per million Btus or parts per million. Table 3-4 lists the part per million or pounds per million Btu BACT emission limit. RTP Environmental Associates did not recommend any changes to the BACT emission limits for the IGCC combustion turbines. Table 3-4 – IGCC Combustion Turbine BACT (Units #60 through #64) Regulated Pollutant BACT Emission Limits Particulate matter Burning a combination of syngas and pressure swing adsorption
tail gas: 0.009 pounds per million Btus (filterable); 0.022 and pounds per million Btus (filterable and condensable)
Burning a combination of pressure swing adsorption tail gas and natural gas: 0.006 pounds per million Btus (filterable); and 0.011pounds per million Btus (filterable and condensable)
Burning a distillate oil: 0.015 pounds per million Btus

9
Regulated Pollutant BACT Emission Limits (filterable) and 0.022 pounds per million Btus (filterable and condensable)
Sulfur dioxide Burning a combination of syngas, pressure swing adsorption tail gas, and ultra low sulfur distillate oil: 1.0 part per million by volume sulfur in the syngas; 0.5 parts per million by volume sulfur in the pressure swing adsorption tail gas; 1.0 part per million by volume sulfur in the pressure swing adsorption tail gas; 15.0 parts per million by weight sulfur in the ultra low sulfur distillate oil; and 2.5 pounds of sulfur dioxide per hour in the exhaust stream (all fuels)
Burning a combination of pressure swing adsorption tail gas, natural gas, and ultra low sulfur distillate oil: 0.5 parts per million by volume sulfur in the pressure swing adsorption tail gas; 1.0 part per million by volume sulfur in the pressure swing adsorption tail gas; 9.0 part per million by volume sulfur in the natural gas; 15.0 parts per million by weight sulfur in the ultra low sulfur distillate oil; and 2.5 pounds per hour in the exhaust stream (all fuels)
Nitrogen oxide Burning a combination of syngas, pressure swing adsorption tail gas, and ultra low sulfur distillate oil: 3.0 parts per million by volume nitrogen oxide, corrected to 15% oxygen, in the exhaust stream when burning syngas and/or pressure swing adsorption tail gas; 6.0 parts per million by volume nitrogen oxide, corrected to 15% oxygen, in the exhaust stream when burning ultra low sulfur distillate oil; 3.0 parts per million by volume nitrogen oxide, corrected to 15% oxygen, in the exhaust stream when burning syngas, pressure swing adsorption tail gas and/or ultra low sulfur distillate oil; and 29.8 pounds per hour (all fuels)
Burning a combination of pressure swing adsorption tail gas, natural gas, and ultra low sulfur distillate oil: 2.0 parts per million by volume nitrogen oxide, corrected to 15% oxygen, in the exhaust stream when burning pressure swing adsorption tail gas and/or natural gas; 6.0 parts per million by volume nitrogen oxide, corrected to 15% oxygen, in the exhaust stream when burning ultra low sulfur distillate oil; 2.0 parts per million by volume nitrogen oxide, corrected to 15% oxygen, in the exhaust stream when burning syngas, pressure adsorption tail gas, and/or ultra low sulfur distillate oil; and 29.8 pounds per hour (all fuels)
Volatile Organic Compounds 0.0017 pounds of volatile organic compounds, reported as propane, per million Btus, heat input, high heating value; and
10
Regulated Pollutant BACT Emission Limits 2.9 pounds per hour; and 3.0 parts per million by volume carbon monoxide, corrected to 15% oxygen
Carbon monoxide Burning a combination of syngas, pressure swing adsorption tail gas, and ultra low sulfur distillate oil: 3.0 parts per million by volume in the exhaust gas corrected to 15% oxygen; and 11.1 pounds per hour
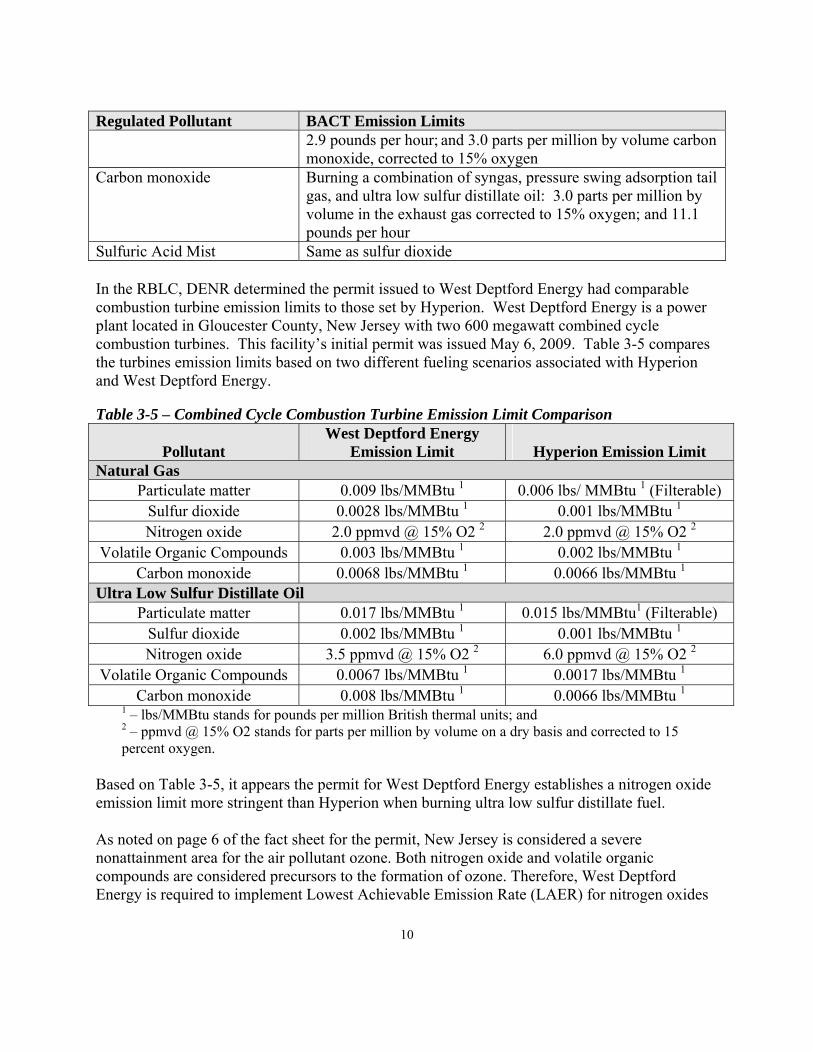
Sulfuric Acid Mist Same as sulfur dioxide In the RBLC, DENR determined the permit issued to West Deptford Energy had comparable combustion turbine emission limits to those set by Hyperion. West Deptford Energy is a power plant located in Gloucester County, New Jersey with two 600 megawatt combined cycle combustion turbines. This facility’s initial permit was issued May 6, 2009. Table 3-5 compares the turbines emission limits based on two different fueling scenarios associated with Hyperion and West Deptford Energy. Table 3-5 – Combined Cycle Combustion Turbine Emission Limit Comparison
Pollutant
West Deptford Energy Emission Limit
Hyperion Emission Limit
Natural Gas Particulate matter 0.009 lbs/MMBtu 1 0.006 lbs/ MMBtu 1 (Filterable)
Sulfur dioxide 0.0028 lbs/MMBtu 1 0.001 lbs/MMBtu 1
Nitrogen oxide 2.0 ppmvd @ 15% O2 2 2.0 ppmvd @ 15% O2 2
Volatile Organic Compounds 0.003 lbs/MMBtu 1 0.002 lbs/MMBtu 1
Carbon monoxide 0.0068 lbs/MMBtu 1 0.0066 lbs/MMBtu 1
Ultra Low Sulfur Distillate Oil Particulate matter 0.017 lbs/MMBtu 1 0.015 lbs/MMBtu1 (Filterable)
Sulfur dioxide 0.002 lbs/MMBtu 1 0.001 lbs/MMBtu 1
Nitrogen oxide 3.5 ppmvd @ 15% O2 2 6.0 ppmvd @ 15% O2 2
Volatile Organic Compounds 0.0067 lbs/MMBtu 1 0.0017 lbs/MMBtu 1
Carbon monoxide 0.008 lbs/MMBtu 1 0.0066 lbs/MMBtu 11 – lbs/MMBtu stands for pounds per million British thermal units; and 2 – ppmvd @ 15% O2 stands for parts per million by volume on a dry basis and corrected to 15 percent oxygen.
Based on Table 3-5, it appears the permit for West Deptford Energy establishes a nitrogen oxide emission limit more stringent than Hyperion when burning ultra low sulfur distillate fuel. As noted on page 6 of the fact sheet for the permit, New Jersey is considered a severe nonattainment area for the air pollutant ozone. Both nitrogen oxide and volatile organic compounds are considered precursors to the formation of ozone. Therefore, West Deptford Energy is required to implement Lowest Achievable Emission Rate (LAER) for nitrogen oxides

11
and volatile organic compounds. In addition, page 8 of the fact sheet notes the 3.5 parts per million by volume LAER emission limit is applicable for normal operations (e.g., greater than 70% load). The limit does not appear to be established for the turbine to continually operate at loads less than 70%. Hyperion is required to install the Best Available Control Technology for nitrogen oxides and not the Lowest Achievable Emission Rate for nitrogen oxides. The West Deptford Energy’s turbines are designed to burn natural gas and ultra low sulfur distillate oil. Hyperion’s turbines are designed to burn natural gas, syngas, pressure swing adsorption gas, and ultra low sulfur distillate oil. Hyperion has to meet several BACT emission limits depending on the fuel being burned. In addition, Hyperion must meet the emission limit of 29.8 pounds per hour regardless of the fuel being burned. While burning the ultra low sulfur distillate oil, the 29.8 pounds per hour emission limit is more stringent than the 6.0 parts per million limit when the turbine is operating at greater than approximately 80% capacity. The West Deptford Energy turbines are designed to meet the parts per million limit at capacities greater than 70%. Whereas, Hyperion parts per million limit is established more for capacities less than 80%. Therefore, the emission limits for ultra low sulfur distillate oil are not directly comparable. Also in the RBLC, a permit issued to Associated Electric Cooperative, Inc. on March 31, 2010, established a nitrogen oxide BACT emission limit for a combustion turbine while burning ultra low sulfur distillate oil as 6.0 parts per million by volume on a dry basis corrected to 15 percent oxygen. Based on the above information, DENR did not find a more stringent limit for the IGCC combustion turbines than that approved by the Board of Minerals and Environment. DENR does not recommended any changes to the BACT emission limits for the IGCC combustion turbines. 3.5 IGCC Startup Burners The BACT limits in the existing PSD permit for the IGCC startup burners are in pounds per hour and pounds per million Btus. Table 3-6 lists the pounds per million Btu BACT emission limit in the existing PSD permit. RTP Environmental Associates did not recommend any changes to the BACT emission limits for the IGCC startup burners. Table 3-6 – IGCC Startup Burners BACT (Units #51 through #58) Regulated Pollutant BACT Emission Limits Particulate matter 0.006 pounds per million Btus Sulfur dioxide 0.006 pounds per million Btus Nitrogen oxide 0.07 pounds per million Btus Volatile Organic Compounds 0.14 pounds per million Btus Carbon monoxide 0.37 pounds per million Btus
12
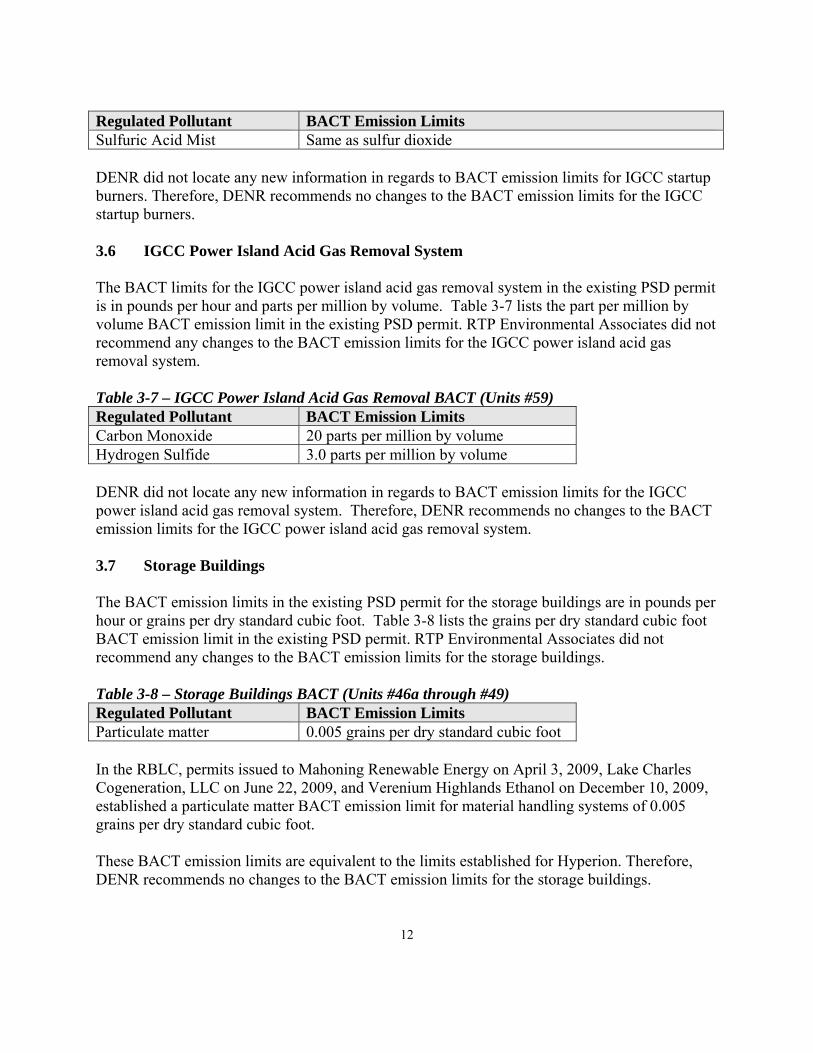
Regulated Pollutant BACT Emission Limits Sulfuric Acid Mist Same as sulfur dioxide DENR did not locate any new information in regards to BACT emission limits for IGCC startup burners. Therefore, DENR recommends no changes to the BACT emission limits for the IGCC startup burners. 3.6 IGCC Power Island Acid Gas Removal System The BACT limits for the IGCC power island acid gas removal system in the existing PSD permit is in pounds per hour and parts per million by volume. Table 3-7 lists the part per million by volume BACT emission limit in the existing PSD permit. RTP Environmental Associates did not recommend any changes to the BACT emission limits for the IGCC power island acid gas removal system. Table 3-7 – IGCC Power Island Acid Gas Removal BACT (Units #59) Regulated Pollutant BACT Emission Limits Carbon Monoxide 20 parts per million by volume Hydrogen Sulfide 3.0 parts per million by volume DENR did not locate any new information in regards to BACT emission limits for the IGCC power island acid gas removal system. Therefore, DENR recommends no changes to the BACT emission limits for the IGCC power island acid gas removal system. 3.7 Storage Buildings The BACT emission limits in the existing PSD permit for the storage buildings are in pounds per hour or grains per dry standard cubic foot. Table 3-8 lists the grains per dry standard cubic foot BACT emission limit in the existing PSD permit. RTP Environmental Associates did not recommend any changes to the BACT emission limits for the storage buildings. Table 3-8 – Storage Buildings BACT (Units #46a through #49) Regulated Pollutant BACT Emission Limits Particulate matter 0.005 grains per dry standard cubic foot In the RBLC, permits issued to Mahoning Renewable Energy on April 3, 2009, Lake Charles Cogeneration, LLC on June 22, 2009, and Verenium Highlands Ethanol on December 10, 2009, established a particulate matter BACT emission limit for material handling systems of 0.005 grains per dry standard cubic foot. These BACT emission limits are equivalent to the limits established for Hyperion. Therefore, DENR recommends no changes to the BACT emission limits for the storage buildings.

13
3.8 Generators and Fire Pumps The BACT emission limits in the existing PSD permit for the generators and fire pumps (Units #65 through #70) were those specified in to 40 CFR Part 60, Subpart IIII. The permits in the RBLC database issued after January 1, 2009, identified the BACT emission limits for generators and fire pumps as the emission limits and requirements specified in 40 CFR Part 60, Subpart IIII. These BACT emission limits are equivalent to the limits established for Hyperion. Therefore, DENR recommends no changes to the BACT emission limits for generators and fire pumps. 3.9 Refinery and Gasification Flares The BACT limits in the existing PSD permit for the flares (Units #36 through #40 and Unit #50) is primarily a work practice standard. The work practice standard specified the refinery flares may only be used during a malfunction and the IGCC flares may be used during startup, shutdown, and malfunctions, required a flare minimization plan, required a root cause analysis of specific flaring events and specified the flare design had to meet the requirements in 40 CFR § 60.18. EPA requested, in its June 11, 2010, letter to Hyperion, Hyperion’s position on whether or not the modeled startup and shutdown emissions for the IGCC flares should be included as emission limits in the permit? EPA notes its position and policy is that startup, shutdown, and malfunction emissions must be strictly prohibited or included in the potential to emit. EPA references its October 16, 2009, Order Responding to Petitioners Request that the Administrator Object to Issuance of State Operating Permit from the EPA Administrator regarding BP Products North America, Inc., Whiting Business Unit Permit #089-25488-00453 and 1999 Excess Emission’s Policy. DENR agrees emissions during startup and shutdown should be included in the potential to emit and evaluated under the BACT analysis. DENR disagrees with the inclusion of malfunctions in the potential to emit and the evaluation of malfunction under the Best Available Control Technology analysis. DENR’s position is based on the decision in two court cases. The first court case was Alabama Power Company vs. EPA decided December 14, 1979. This case specified the potential to emit must be based on the “design” of the facility. The court ruled the potential to emit would not hypothesize the projected emissions of a facility in absence of air pollution control equipment as suggested by EPA. A source is not designed to operate with malfunctioning equipment. The second court case was U.S. vs. Louisiana-Pacific Corporation. This case specifies “The broad holding of Alabama Power is that potential to emit does not refer to the maximum emissions that can be generated by a source hypothesizing the worst conceivable operation. Rather, the concept contemplates the maximum emissions that can be generated while operating

14
the source as it is intended to be operated and as it is normally operated.” This case also specified “conditions that are knowingly and regularly violated” should be included in the potential to emit. If a source continual and frequently operates its equipment while it is malfunctioning, then those emissions should be included in the potential to emit. As Hyperion’s PSD air quality permit is written, the flares used for the refineries may not be operated during normal operation of the facility, including periods of startup and shutdown. The flares may only be operated during a malfunction. The term malfunction is narrowly defined as any sudden and unavoidable failure of air pollution control equipment, process equipment, or a process to operate in a normal or usual manner. A failure caused entirely or in part by poor maintenance, careless operation, preventable equipment breakdown, or any other cause within the control of the owner or operator of the source is not a malfunction. As such, Hyperion is required to design the refinery so there is no flaring from its refining operations. The permit is crafted to enforce that design. EPA references two decisions made by the Environmental Appeals Board (e.g., RockGen Energy Center and Prairie State Energy) that indicate that the flare minimization plans must be part of the Prevention of Significant Deterioration permit. DENR disagrees that these Environmental Appeals Board decisions require the finalized plans to be included. In the RockGen Energy Center decision, it was stated that the “provision authorizing the plan does not specify what conditions might be included in a plan or indicate what criteria the State will use in approving the plan.” In addition, the decision states that “the State may also require that once the facility is operational any permit provisions designed to reduce emissions during startup and shutdown be refined overtime so as to increase their efficiency and effectiveness. Hyperion’s Prevention of Significant Deterioration permit requires specific items to be included in the plan, including recordkeeping and reporting requirements. In addition, Hyperion must review the plan on an annual basis and revise it, if appropriate. In the Prairie State Energy case, referenced by EPA in its letter, it notes the narrative requirement was in addition to and not in lieu of the secondary emission limits and rejected the implied contention this narrative requirement is the only limit applicable during startup and shutdown. EPA appears to imply there are no numerical limits associated with the flares outside of the flare minimization plan. DENR disagrees that there are no numerical limits associated with the flares. Examples of those numerical limits are as follows:
1) The flares must meet design and operational requirements of 40 CFR § 60.18. This section requires no visible emissions (numerical number), a net heating value requirement (numerical number) and an exit velocity requirement (numerical number);
2) The flares associated with the refinery may only be used when there is a malfunction. There may be no emissions (numerical number) due to flaring associated with normal operations, startup, and shutdown; and
3) The flare associated with the integrated gasification combined cycle system may only flare gases that have a sulfur content of 40 parts per million or less (numerical number).

15
The reason the above requirements were identified is because there is no direct method such as a performance test to demonstrate compliance with a numerical limit for a flare. One of the requirements for conducting a performance test is to locate the probe a specific distance from a disturbance, such as a bend in the stack or the top of the stack. In the case of the flares, one is unable to meet this requirement. In addition, it is not recommended to place a probe into an open flame as that will not meet the requirements of the performance tests. As discussed, DENR believes it is meeting the intentions specified by both the RockGen Energy Center’s decision and the Prairie State Energy decision. The current PSD air quality permit requires Hyperion to operate within the representation in its application, including the modeled emissions from the IGCC flares. In addition, the current permit requires Hyperion to calculate particulate matter, sulfur dioxide, nitrogen oxide, volatile organic compounds, and carbon monoxide emissions from the IGCC flares based on the gas flow, higher heating value of the gas, and sulfur content of the gas. However, the current permit does not specifically list a numerical limit for the IGCC flares. DENR recommends adding numerical limits for the startup and shutdown emissions associated with the IGCC flares which were used in the modeling analysis to demonstrate compliance with the National Ambient Air Quality Standards and PSD increments. The current permit does not allow Hyperion to use the refinery flares during startup or shutdown of the process units. Therefore, DENR does not recommend a numerical limit for the startup and shutdown periods for the refinery flares. 3.10 Cooling Tower The BACT limits in the existing PSD permit for the cooling tower are a combination of work practice standards and numerical limits. The cooling tower required a design limit, a pound per hour limit, and leak detection and repair requirements. The pound per hour emission limit represents a case-by-case emission limit specific to an emission unit and is difficult to compare between similar units that vary in size. Whereas, the design limitation and leak and detection level limits may be compared between similar units that vary in size. Table 3-9 lists the part per million BACT emission limit and design limit in the existing PSD permit. RTP Environmental Associates did not recommend any changes to the BACT emission limits for the cooling tower. Table 3-9 – Cooling Tower BACT (Unit #41) Regulated Pollutant BACT limit Particulate matter 0.0005 efficient drift eliminators Volatile Organic Compounds 3.1 parts per million Several permits have been issued to facilities with cooling towers since January 2009. The RBLC includes permits issued to a natural gas-fired combined cycle turbine facility in Oklahoma

16
and a wood-fired boiler in Texas, a facility converting petroleum coke to natural gas and sulfuric acid and a new polyvinyl chloride production plant in Louisiana, a coal-fired electric generating facility in Massachusetts, a Kraft pulp and paper mill in Minnesota, a steel production facility in Ohio, a chemical plant in Oklahoma, and a coke/petroleum coke gasification plant in Idaho, along with refineries in Alabama and Ohio. The RBLC notes that a permit was issued to Hunt Refinery Company for a permit modification for an existing petroleum refinery in Tuscaloosa, Alabama, on September 28, 2009. The permitted emission limit was 0.4 tons per year for particulate matter less than 10 microns and 1.1 tons per year for volatile organic compounds. The emission limits were the projected emissions from the PSD permit application. A permit was issued to Sunoco, Inc. for a refinery in Toledo, Ohio, on February 23, 2009. The emission limits were given as 0.12 pound per hour for filterable particulate matter and 0.084 pound per hour for volatile organic compounds. Because the emission limits are determined for the operating parameter of a specific emission unit (e.g., water circulation rates, total dissolved solids), a direct comparison of emission limits in tons per year or pounds per hour for units of varying size is difficult. Where drift eliminators were specified, none of the permits were issued with drift efficiency lower than 0.0005%. Therefore, DENR recommends no changes to the BACT emission limits for the cooling tower. 3.11 Wastewater Treatment Plant The BACT limits in the existing PSD permit for the wastewater treatment plant are a combination of work practice standards and numerical limits. The wastewater treatment plant is required to meet design, pounds per hour, pounds per million Btus, parts per million, and efficiency limits. Table 3-10 lists the pound per million Btu, part per million, pounds per hour, and efficiency BACT limits in the existing PSD permit. RTP Environmental Associates did not recommend any changes to the BACT emission limits for the wastewater treatment plant. Table 3-10 – Wastewater Treatment Plant BACT (Unit #45a, #45b, and #45c) Regulated Pollutant BACT limit Particulate matter 0.0075 pounds per million Btus (#45a) Sulfur dioxide 25 parts per million total sulfur (#45a) Nitrogen oxide 5.0 pounds per hour (#45a) Volatile Organic Compounds 98% efficiency or 20 parts per million (#45a)
Design standards in 40 CFR §61.349 (#45b) Design standards in 40 CFR §61.351 (#45c)
Carbon monoxide 0.08 pounds per million Btus (#45a) DENR reviewed the RBLC and new air quality permits issued such as Valero Refining – New Orleans (November 17, 2009), etc. Valero Refining’s permit (page 16 of the file) requires the wastewater collection and conveyance meet the federal Refinery Maximum Achievable Control

17
Technology requirements. In addition to the requirements in Table 3-10, Hyperion must also meet this federal standard. DENR did not locate any new information that would change its previous recommendation in regards to wastewater treatment facilities. Therefore, DENR recommends no changes to the BACT emission limits for the wastewater treatment facilities. 3.12 Coke Drum Steam Vents The BACT limits in the existing PSD permit for the coke drum steam vents (Unit #34a through #35d) are established as a work practice standard. The work practice standard requires each coke drum be depressurized to 5 pounds per square inch gauge pressure before the exhaust gases can be vented to atmosphere. RTP Environmental Associates identified new BACT limits associated with the coke drum steam vents and proposed a work practice standard limit of 2 pounds per square inch gauge pressure and numerical limits of 127.8 pounds per drum cycle for volatile organic compounds, 70.9 pounds per drum cycle for hydrogen sulfide, and 30.3 pounds per drum cycle for particulate matter. The RBLC still does not note any BACT limit more stringent than the current limit for the Hyperion facility or as stringent as the one currently being proposed by RTP Environmental Associates. RTP Environmental Associates based the new BACT emission limit on the permit issued to Chevron on July 2, 2010. The Chevron permit requires the coke drum be tested for carbon monoxide, volatile organic compounds and particulate matter (page 884 of document file) and requires the coke drum to meet the pressure of 2 pounds per square inch gauge pressure before venting the emissions to the atmosphere (page 939 of document file). Based on this new information, DENR recommends the following changes to the Hyperion’s PSD air quality permit #28.0701-PSD issued August 20, 2009:
1) Revise the work practice standard limit of 5 pounds per square inch gauge pressure identified in 40 CFR Part 60, Subpart Ja (permit condition 6.3) to 2 pounds per square inch gauge pressure;
2) Include the numerical limits proposed by RTP Environmental Associates for volatile organic compounds, particulate matter, and hydrogen sulfide;
3) Include an initial testing requirement for volatile organic compounds, particulate matter, and hydrogen sulfide;
4) Include an operational limit of 2,190 drum cycles per coke drum per 12-month rolling period; and
5) Include any applicable monitoring, recordkeeping, and reporting.

18
3.13 Tank Farm and Tank Farm Thermal Oxidizer The BACT limits in the existing PSD permit for the tank farm was both a work practice standard and numerical limits. Hyperion was given the option of routing the emissions from the storage tanks to a thermal oxidizer or install a floating roof on the storage tank for any storage tank storing a liquid with a vapor pressure greater than or equal to 0.3 pounds per square inch. The thermal oxidizer was required to meet BACT limits in parts per million, control efficiency or pounds per million Btus. Table 3-11 lists the parts per million by volume or the pounds per million Btu BACT emission limit in the existing PSD permit. RTP Environmental Associates did not recommend any changes to the BACT emission limits for the tank farm and tank farm thermal oxidizer. Table 3-11 – Tank Farm Thermal Oxidizer BACT (Unit #175 and #176) Regulated Pollutant BACT limit Particulate matter 0.0075 pounds per million Btus Sulfur dioxide 25 parts per million total sulfur by volume Nitrogen oxide 0.04 pounds per million Btus Volatile Organic Compounds 20 parts per million by volume Carbon monoxide 0.08 pounds per million Btus DENR did not locate any new information in regards to BACT emission limits for the Tank Farm and Tank Farm Thermal Oxidizer. Therefore, DENR recommends no changes to the BACT emission limits for the Tank Farm and Tank Farm Thermal Oxidizer. 3.14 Loading Racks The BACT limits in the existing PSD permit were established in different numerical units or work practice standards for the loading racks. The volatile organic compound BACT limit for the loading racks (Unit #43 and #45) was established as a numerical limit of 1.25 pounds of volatile organic compounds as carbon per million gallons of product loaded. RTP Environmental Associates did not recommend any changes to the BACT emission limits for the loading racks. DENR reviewed EPA’s RBLC for permits issued after January 1, 2009, California’s BACT clearinghouse, California regulations, new air quality permits issued to oil refineries, and new regulations recently promulgated. 40 CFR Part 63, Subpart BBBBBB, Gasoline Distribution Bulk Terminal, Bulk Plants and Pipeline Facilities was promulgated by EPA January 10, 2008, and adopted by South Dakota on June 28, 2010. This subpart sets regulations for bulk gasoline terminals that have a throughput capacity greater than 250,000 gallons per day. Hyperion’s railcar and truck loading racks each have a capacity of 672,000 gallons per day (16,000 barrels per day). For a gasoline flow greater than 250,000 gallons per day, the facility must reduce total organic compound emissions to 670 pounds per million gallons of gasoline loaded. The volatile organic compound limit for Hyperion is 1.25 pounds per million gallons gasoline loaded, which

19
is less than the required limit in Subpart BBBBBB; therefore, Hyperion has accepted a more stringent limit on their loading racks and is not subject to Subpart BBBBBB. An amendment to California’s Bay Area Air Quality Management District’s Regulation Rule 33 – Gasoline Bulk Terminals and Gasoline Cargo Tank Index on April 15, 2009 sets additional limits on organic compounds emissions from gasoline bulk terminals. Standard 8-33-301.2, effective January 10, 2011, limits emissions of non-methane organic compounds from a vapor recovery system to 40 pounds per million gallons of gasoline loaded. The current volatile organic compound emission limit for the facility is 1.25 pounds per million gallons of gasoline loaded, which is significantly less than the California’s amended standard. DENR recommends no changes. 3.15 Fugitive Sources The BACT limit(s) in the existing PSD permit were established in different numerical units or work practice standards for fugitive sources. The BACT limit for equipment leaks was established as a leak, detection and repair program. This program included but was not limited to the following: defining the threshold for determining a leak, required monitoring to test for leaking equipment, limitation on how long equipment may leak before it must be repaired, and the development of a hydrogen sulfide monitoring system. RTP Environmental Associates did not recommend any changes to the BACT limits for fugitive sources. DENR reviewed EPA’s RBLC for permits issued after January 1, 2009, new air quality permits issued, California’s BACT clearinghouse, California regulations, and EPA’s June 14, 2010, letter. DENR did not locate any new information in regards to emissions from the equipment leaks. However, DENR did note a typographical error. The leak detection thresholds for the connectors should be 100 parts per million as identified in Hyperion’s application and not the 500 parts per million listed in the permit. Therefore, DENR recommends updating this threshold. In addition, this threshold will correspond with the threshold recommended by Hyperion for greenhouse gas BACT review noted below. 3.16 Coker Quench Water Handling System Hyperion’s original application did not identify the coker quench water tank system as a significant air emission unit. The coker quench water tank system consists of a surge tank and water pump pit and clarifier. In its original review of refinery operations, DENR did not identify any refinery operations that permitted the coker quench water tank system. In addition, none of the comments received from EPA, environmental groups, etc. during the original review identified the coker quench water tank system as a significant air emission unit. As such, DENR did not conduct a BACT review for this emission unit in the original evaluation.

20
Not until after the PSD permit was issued did DENR become aware that air emissions from the coker quench water tank system may be significant enough to warrant a BACT review. In EPA’s June 11, 2010, letter to Hyperion, EPA noted in its attachment the coker quench water tank system would have potential uncontrolled volatile organic compound emissions in excess of 1,700 tons per year. In the extension request, Hyperion determined the potential uncontrolled volatile organic compound emissions from the coker quench water tank system as approximately 8 tons per year. DENR requested emission data for the coker quench water tank system from EPA to verify EPA’s and Hyperion’s estimates. EPA submitted stack test data from the Whiting Refinery Modernization Project in Whiting, Indiana (January 2010) and Marathon Petroleum Company, in Robinson Illinois (March 2010). The stack test data indicates the potential uncontrolled volatile organic compound emissions from the Whiting Refinery ranged from 3.9 to 18.9 tons per year. The stack test data from the Marathon Petroleum Company ranged from 0.3 to 2.7 tons per year. Therefore, Hyperion’s estimate on the potential uncontrolled volatile organic compound emissions is reasonable. Hyperion identified in its extension submittal the BACT options for the coker quench water handling system are similar to those discussed in detail for storage tanks and the wastewater treatment facility. Table 3-12 identifies the options reviewed for the coker quench water handling system and the options Hyperion considered feasible to install. DENR reviewed these options and agrees with the BACT options and the feasibility of those options. Table 3-12 –Options and Feasibility for Coker Quench Water Handling System
Unit
Description
BACT Options
Feasible Options
#177 Surge Tank Internal floating roof plus thermal oxidizer Yes Thermal oxidizer Yes Internal or external floating roof Yes No controls Yes Water pump pit and Internal floating roof plus thermal oxidizer No clarifier Closed vent and thermal oxidizer Yes Internal floating roof No No controls Yes
Table 3-13 identifies the options Hyperion and DENR considers feasible, the estimated control efficiencies by DENR, and rank for each option based on the control efficiency. Table 3-13 – Top BACT Control Options for Coker Quench Water Handling System
Unit
Description
BACT Options
Control Efficiency
Rank
#177 Surge Tank Internal floating roof plus thermal oxidizer
99+% #1
Thermal oxidizer 98% #2 Internal or external floating roof 89% 1 #3

21
Unit
Description
BACT Options
Control Efficiency Rank
No controls 0% #4 Water pump pit Closed vent and thermal oxidizer 98% #1 and clarifier No controls 0% #2
1 – Control efficiency was estimated using EPA’s Tanks 4.0 assuming the tank contents were a mixture of benzene, xylene, toluene, and naphthalene by comparing the emission rates with and without a floating roof.
Hyperion notes the top control option (e.g., internal floating roof and a thermal oxidizer) for the surge tank is not cost effective; and in fact, none of the control options are cost effective if you consider just the coker quench water handling system, except no controls. Hyperion specifies the cost of the internal floating roof would be around $800,000. Based on the size of the tank and the range Hyperion has previously stated for internal floating roof costs, DENR believes the cost provided for the internal floating roof on the surge tank is considered reasonable. If one assumes 100 percent of the volatile organic compound emissions from the surge tank is controlled (e.g., 2.4 tons per year based on EPA’s stack test data) and the floating roof’s capital cost of $800,000, the cost effectiveness for the internal floating roof would be cost prohibitive as demonstrated in Equation 3-1. Equation 3-1 – Cost per ton for floating roof
ton333,31$
4.2094.0000,800$
=⎟⎠⎞
⎜⎝⎛ ×
Where: $800,000 = the capital cost of the floating roof; 0.094 = the capital recovery factor based on 7% interest for 20 years; and 2.4 = potential uncontrolled volatile organic compound emissions, in tons per year. Hyperion agreed to route the volatile organic compound emissions from the surge tank and the water pump pit and clarifier to the thermal oxidizer associated with Unit #175 or #176. Table 3-14 identifies Hyperion’s proposed control option, the rank of the control option, and the proposed emission limit. Hyperion’s proposed emission limit is actually what has already been established for Unit #175 and #176, which means the addition of the coker quench water handling system will not increase the potential emissions from Unit #175 or #176. Table 3-14 – Proposed BACT Control and Limit for Coker Quench Water Handling Unit Description Proposed Control Rank Proposed Limit #177 Surge Tank Thermal oxidizer
(Unit #175 or #176) #2 98% or 20 parts per million,
whichever is less Water pump pit
and clarifier Closed vent and thermal oxidizer (Unit #175 or #176)
#1 98% or 20 parts per million, whichever is less

22
DENR agrees with using the existing thermal oxidizers to control volatile organic compound emissions from the coker quench water handling system. DENR recommends revising the permit to include the coker quench water handling system (Unit #177). 4.0 Re-analysis of the Ambient Air Quality Analysis In accordance with 40 CFR § 52.21(k)(2), a new major source shall demonstrate the allowable emission increases from the proposed source in conjunction with all other applicable emission increases would not cause or contribute to air pollution in violation of 1) any national ambient air quality standard in any air quality control region; or 2) any applicable maximum allowable increase over the baseline concentration in any area (PSD Class I or II increments). As noted in the Board of Minerals and Environment’s Findings of Facts and Conclusions of Law, the Board of Minerals and Environment found the “methodology and data for modeling appropriate, reasonable, and representative of the HEC site and finds that all modeling conducted by Hyperion and DENR was conducted in accordance with modeling regulations and guidance.” DENR required Hyperion to re-analyze its ambient air quality analysis to determine if the BACT emission limits will maintain compliance with any new National Ambient Air Quality Standards and PSD increments. DENR review of Hyperion’s modeling analyses focused on new information not previously reviewed or discussed prior to and during the contested case hearing in front of the Board of Minerals and Environment that may change the previous modeling analysis determination. 4.1 Ambient Background Data In January 2009, three new sites started collecting air monitoring data in Union County. All three sites are located north of Elk Point around Hyperion’s proposed site. UC #1 is located about 3 miles south of Hyperion and monitors particulate matter 10 microns in diameter (PM10) and particulate matter 2.5 microns in diameter (PM2.5), sulfur dioxide, nitrogen dioxide, carbon monoxide, air toxics, and meteorological parameters. UC #2 is located about 1 ½ miles north northwest of Hyperion and monitors for particulate matter (PM10 and PM2.5), sulfur dioxide, and nitrogen dioxide. UC #3 is located about 3 ½ miles north and 2 ¼ miles west of Hyperion and monitors for ozone. The monitored background values from Union County were compared to the Sioux Falls monitored background values used in Hyperion’s original ambient air quality analysis to determine if Hyperion’s original ambient air quality analysis is still valid. The comparison may be observed in Table 4-1.

23
Table 4-1 – Monitored Value Comparison Sioux Falls Union County #1 Union County #2 Monitored
Background 1Monitored
Background 2Monitored
Background 2Pollutant (ug/m3) (ug/m3) (ug/m3)
PM2.5 (24-hour) 23 21 23 (21) 3
PM2.5 (annual) 9 7 9 (8) 3
PM10 (24-hour) 49 4 49 PM10 (annual) 19 4 16 SO2 (3-hour) 21 19 11 SO2 (24-hour) 5 9 3 SO2 (Annual) 3 3 3 NO2 (Annual) 10 4 4
1 – The monitored background is based on data collected in calendar year 2006 from the Hilltop monitoring site in Sioux Falls; 2– The monitored background is based on data collected in Union County during the calendar year 2009; 3 – The Union County monitoring station #2 has both a continuous and manual monitor. The concentration noted in parenthesis is from the continuous monitor and the other is from the manual monitor. The manual monitor is considered the federal reference method monitor; 4 – DENR did not collect enough data during the calendar year to compare to the standard; and 5 – The monitored background is based on data collected in calendar year 2006 from the Lowell School monitoring station in Sioux City.
Based on Table 4-1, the comparison indicates Union County monitored background data for particulate matter is equivalent to or less than the Sioux Falls monitored background data used in Hyperion’s original ambient air quality analysis. The data for the remaining pollutants are comparable with the Sioux Falls site measuring higher values except for the 24-hour sulfur dioxide concentrations which was higher at the UC #1 Site. The 24-hour concentrations for both sites are slightly higher than the detection level for the analyzer so the difference between sites is not significant. DENR believes the original ambient air quality analysis is still representative from this perspective with modeling results biased high in favor of public health. 4.2 Emission Source Inventory The original ambient air quality analysis modeled several off-site sources. Table 4-2 lists those off-site sources and the state where they are located.

24
Table 4-2 – Off-Site Sources Facility Name State University of South Dakota South Dakota NorthWestern Public Service South Dakota Basin Electric Power South Dakota Midwest Ready Mix South Dakota Vermillion Fertilizer and Grain South Dakota Southeast Farmers Elevator South Dakota Standard Ready Mix South Dakota MidAmerican George Neal – North Iowa MidAmerican George Neal – South Iowa Terra Nitrogen Port Neal Iowa Siouxland Ethanol Nebraska Tyson-Dakota City Nebraska Since Hyperion’s permit was issued, DENR issued one other PSD permit. That PSD permit was issued to Basin Electric’s proposed Deer Creek facility located near White, South Dakota. This project is greater than 100 miles (160 kilometers) away from Hyperion. Since Hyperion’s permit was issued, DENR has issued several new non-PSD air quality permits. The closest “new” source would be Lectrus (formerly DTS, Inc.) in Tea, South Dakota. This facility is approximately 50 miles (80 kilometers) away from Hyperion. The significant impact area (e.g. less than 1 microgram per cubic meter on an annual basis) is within a mile of the facility. None of these new sources are close enough in proximity to affect the original ambient air quality analysis. Therefore, the original ambient air quality is still representative from this perspective. 4.3 Proposed Changes at Hyperion The original ambient air quality analysis modeled several emission point sources to be located at Hyperion. In Hyperion’s request for extension, Hyperion identified BACT should be revised for two emission sources (e.g., coke drum steam vents and sulfur recovery plant), addition of the coker quench water handling system, and only one emergency generator at a time is allowed to operate at any one time. The two revised BACT and use of only one emergency generator will decrease the emissions for particulate matter, sulfur dioxide, nitrogen oxide, and carbon monoxide. Therefore, the original ambient air quality analysis would overestimate the impacts of the revised changes to Hyperion. The addition of the coker quench water handling system will not increase air emissions because the emissions will be routed to either Unit #175 or #176 and the emission limits for these two units are not being changed. Therefore, the original ambient air quality analysis is still representative from this perspective. 4.4 New National Ambient Air Quality Standards On February 9, 2010, EPA promulgated a new 1-hour nitrogen dioxide National Ambient Air Quality Standard, which became effective April 12, 2010. The new nitrogen dioxide standard is

25
100 parts per billion, based on the 3-year average of the 98th percentile of the yearly distribution of 1-hour daily maximum concentrations. On June 22, 2010, EPA promulgated a new 1-hour sulfur dioxide National Ambient Air Quality Standard, which became effective August 23, 2010. The new sulfur dioxide standard is 75 parts per billion, based on the 3-year average of the 99th percentile of the yearly distribution of 1-hour daily maximum concentrations. Hyperion modeled its proposed operations to compare to these two new National Ambient Air Quality Standards using the same stack heights, emission rates, off-site sources, etc. identified in the original analysis with the following exceptions:
1) Hyperion used the emission rates associated with the revised BACT for the sulfur recovery plant;
2) Hyperion added the coker quench water handling system (e.g., no emission increase); and 3) Hyperion modeled only one of the emergency generators since they will only be allowed
to operate one at a time.
Hyperion modeled using the following four separate surface meteorological data sets:
1) Calendar years 2000 through 2004 from Sioux Falls, South Dakota; 2) Calendar years 2002 through 2006 for Sioux City, Iowa; 3) April 1, 2009 through March 31, 2010 for Union County augmented with corresponding
Sioux Falls data; and 4) April 1, 2009 through March 31, 2010 for Union County augmented with corresponding
Sioux City data. The reason the Union County meteorological data was augmented is because the Union County meteorological monitor did not collect all of the required modeling parameters. Each surface data set was processed with corresponding upper air data from the Omaha, Nebraska upper air station. In the original analysis, Hyperion modeled using the Sioux Falls metrological data set. For sulfur dioxide, Hyperion used the fourth highest (99th percentile) modeled concentration for the Sioux Falls and Sioux City meteorological data sets from the proposed project and off-site sources. Hyperion is being conservative in this respect since the standard is based on the fourth highest daily 1-hour concentration. The fourth highest modeled concentration was added to the fourth highest daily 1-hour monitored concentration from Union County and compared to the new 1-hour sulfur dioxide National Ambient Air Quality Standards (see Table 4-3). For the Union County meteorological data sets, the 1-hour monitored values from Union County were added to the highest concurrent modeled 1-hour value in the modeling domain. The fourth highest value daily 1-hour value was used to compare to the new 1-hour sulfur dioxide National Ambient Air Quality Standard.

26
For nitrogen dioxide, the eighth highest (98th percentile) modeled concentration for all four of the meteorological data sets from the proposed project and off-site sources was added to the eighth highest monitored concentration from Union County and compared to the new 1-hour nitrogen dioxide National Ambient Air Quality Standards (see Table 4-3). Hyperion is being conservative in this respect since the standard is based on the eighth highest daily 1-hour concentration and the modeled results is based on the eighth highest 1-hour concentration. Table 4-3 displays the comparison of the modeled impacts to the National Ambient Air Quality Standards. Table 4-3 –National Ambient Air Quality Standards Comparison
Modeled Monitored Total NAAQS NAAQS Pollutant (ug/m3) (ug/m3) (ug/m3) (ug/m3) Exceedance
Sioux Falls Data Set SO2 (1-hour) 129 28 157 196 No NO2 (1-hour) 103 45 158 188 No
Sioux City Data Set SO2 (1-hour) 136 28 164 196 No NO2 (1-hour) 88 45 133 188 No
Union County Data Set Sioux Falls Augmented SO2 (1-hour) 192 196 No NO2 (1-hour) 131 45 176 188 No
Union County Data Set Sioux City Augmented SO2 (1-hour) 171 196 No NO2 (1-hour) 132 45 177 188 No
Based on Tables 4-3, the modeling analysis indicates Hyperion would not cause or contribute to a violation of the new 1-hour nitrogen dioxide or the new 1-hour sulfur dioxide National Ambient Air Quality Standards. 4.4.1 Model Accuracy The modeling analysis indicates Hyperion will not cause or contribute to a violation of the new 1-hour sulfur dioxide National Ambient Air Quality Standard; but the analysis does show the modeled concentration plus the background monitoring concentration is within 2 percent of the new 1-hour sulfur dioxide National Ambient Air Quality Standard. Therefore, DENR considered several factors involving how realistic the models predict the concentration and what facility or facilities is contributing to the modeling concentration.
27
The high modeled sulfur dioxide concentrations are located in the southeast corner of the modeling domain. The facility contributing to the high modeled concentration for sulfur dioxide (greater than 90% contribution) is the MidAmerican George Neal facilities in Iowa. During these periods when MidAmerican George Neal is the majority contributor, Hyperion’s contribution is less than 1%. In accordance with 40 CFR Part 51, Appendix W, uncertainties and accuracy of the models are discussed. As noted in section 9.1.2, Studies of Model Accuracy, “(1) Models are more reliable for estimating longer time-averaged concentrations than for estimating short-term concentrations at specific locations; and (2) the models are reasonably reliable in estimating the magnitude of highest concentrations occurring sometime, somewhere within an area. For example, errors in highest estimated concentrations of ± 10 to 40 percent are found to be typical, i.e., certainly well within the often quoted factor-of-two accuracy that has long been recognized for these models. However, estimates of concentrations that occur at a specific time and site, are poorly correlated with actually observed concentrations and are much less reliable.” To determine if the AERMOD is correctly quantifying the sulfur dioxide concentration, DENR conducted a screening test to determine if AERMOD would meet a minimum operational performance for the 1-hour sulfur dioxide National Ambient Air Quality Standard. DENR used the fractional bias procedure identified in EPA’s Protocol for Determining the Best Performing Model (EPA – 454/R-92-025). DENR modeled MidAmerican George Neal facilities actual emissions from March 31, 2009 through March 31, 2010, at two receptor points in South Dakota using the two meteorological data sets for Union County. The two receptor points used were the location of the two sulfur dioxide monitoring stations currently being operated by DENR in Union County. The modeled results were then compared to the monitored results using the screening approach specified in EPA’s protocol. Since the new 1-hour sulfur dioxide National Ambient Air Quality standard represents a new form of a standard, DENR compared both the highest 25 hourly readings and the highest 25 readings representing the form of the standard (e.g., highest 25 daily 1-hour values). Figure 4-1 shows a graphical representation of the screening test. As identified in the protocol “Models that plot close to the center (0,0) are relatively free from bias, while models that plot further away from the center tend to over or under-predict. Values equal to -0.67 are equivalent to over-predictions by a factor of two while values equal to +0.67 are equivalent to under-predictions by a factor of two. As the graph indicates, AERMOD over-predicts the concentrations of sulfur dioxide with five of the eight scenarios indicating the model would over-predict the concentrations greater than a factor of two.

28
Figure 4-1 – Screening Test
-2
-1.5
-1
-0.5
0
0.5
1
1.5
2
-2 -1.5 -1 -0.5 0 0.5 1 1.5 2
Bias of Average
Bia
s of
STD
Dev
iatio
n
UCSF #1 Standard UCSF #1 Hourly UCSF #2 Standard UCSF #2 HourlyUCSC #1 Standard UCSC #1 Hourly UCSC #2 Standard UCSC #2 Hourly
Under-predicts impacts
Over-predicts Impacts
Based on the analysis, the model is over-predicting the impact MidAmerican George Neal will have on the sulfur dioxide concentrations in the modeling domain. If it is over-predicting MidAmerican George Neal it is also likely over-predicting all of the sources in the area including Hyperion. Since the approved models are inherently conservative, DENR believes actual monitoring data will be lower then what is being predicted by the models. 4.4.2 Modeling Assumptions The modeling should have a proper balance between adequately representing the potential emission concentrations to determine if a facility will cause or contribute to a violation of a National Ambient Air Quality Standard and the potential to overestimate impacts. DENR reviewed several assumptions that were considered in the model to determine how those assumptions would impact the modeling. 4.4.2-1 Modeling Off-Site Sources EPA discusses in a memorandum (June 28, 2010, Tyler Fox Leader of Air Quality Modeling Group to Regional Air Division Directors – page 19) what emission sources should be included in a model; “The professional judgments that are required in developing an appropriate inventory

29
of background sources should strive toward the proper balance between adequately characterizing the potential for cumulative impacts of emission sources within the study area to cause or contribute to violation of the NAAQS, while minimizing the potential to overestimate impacts by double-counting of modeled source impacts that are also reflected in the ambient monitoring data.” The analysis modeled several existing sources. Each of those existing source’s emissions is contributing currently in some degree to a portion of the concentration being monitored in Union County. Therefore, by modeling the emissions from these sources and adding the results to the actual monitoring data, some degree of double-counting occurs. This process contributes to a conservative analysis of the potential impact by overestimating the potential impact. 4.4.2-2 Modeling Potential to Emit 40 CFR Part 51, Appendix W specifies the recommended modeling input data in Section 8.0. Appendix W recommends using a sources maximum allowable emission limit or federally enforceable permit limit for both Hyperion and the off-site sources. However, section 8.2.3(c) notes, “when modeling a nearby source that does not have a permit and the emission limit contained in the SIP for a particular source category is greater than the emissions possible given the source's maximum physical capacity to emit, the “maximum allowable emission limit” for such a nearby source may be calculated as the emission rate representative of the nearby source's maximum physical capacity to emit, considering its design specifications and allowable fuels and process materials.” DENR reviewed the hourly sulfur dioxide emission data from EPA’s Clean Air Markets database for the MidAmerican George Neal facility in Iowa for calendar years 2006 through 2009 to determine how often it operated near the maximum allowable emission limits in its permit. Table 4-5 lists the highest hourly emission rate, the percentage of time a unit operated within 90% and 75% of its maximum allowable emission limits. Table 4-5 – MidAmerican George Neal Actual SO2 Emission 2006 – 2009 George Neal - North Limit (lbs/hour) Highest Actual (lbs/hour) > 90% >75%
Unit #1 1,635.6 1,511.5 0.01% 1.1% Unit #2 3,697.2 3,560.8 0.01% 0.2% Unit #3 6,025.2 5,633.9 0.02% 1.7% George Neal – South Limit (lbs/hour) Highest Actual (lbs/hour) > 90% >75% Unit #4 8,280 7,668.5 0.01% 0.1% The modeling is conducted assuming each unit operates at its maximum allowable emissions on a continuous basis. This assumption is overly conservative and overestimates the concentrations because the modeling assumes a unit operates at its highest emission rate at the same time all other modeled units operate at there highest emission rate at the same time the worse case meteorological conditions would occur. To illustrate the likely hood these assumptions may
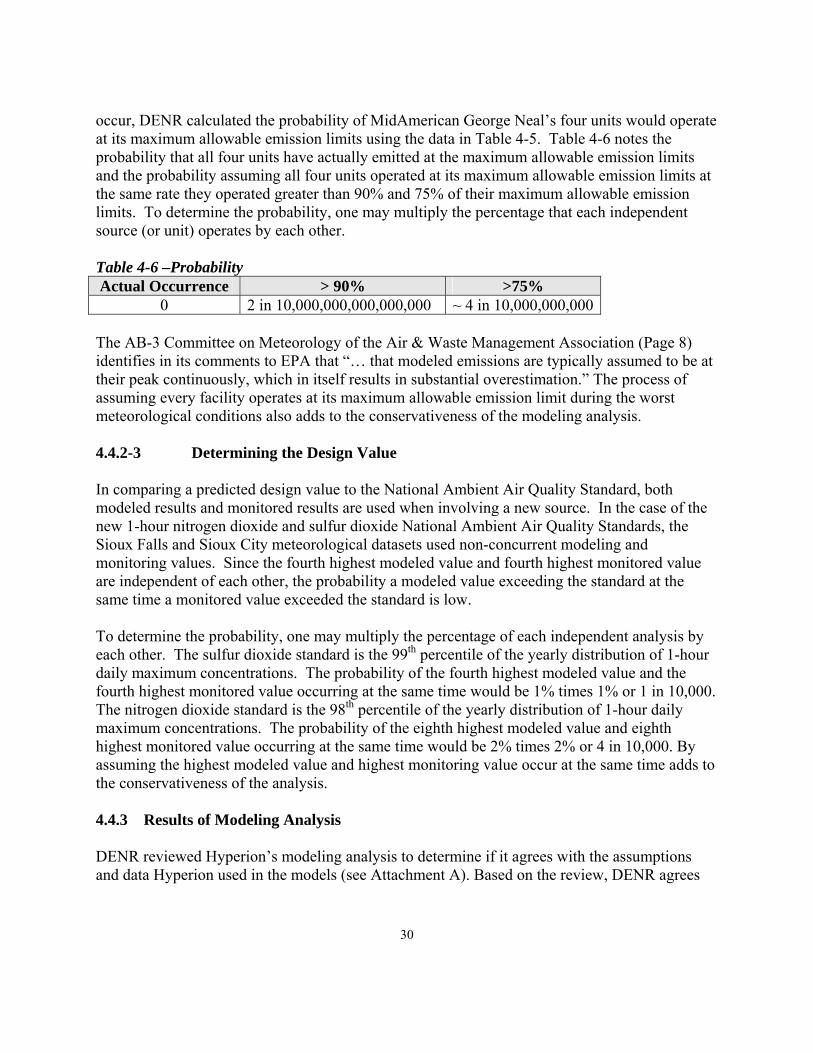
30
occur, DENR calculated the probability of MidAmerican George Neal’s four units would operate at its maximum allowable emission limits using the data in Table 4-5. Table 4-6 notes the probability that all four units have actually emitted at the maximum allowable emission limits and the probability assuming all four units operated at its maximum allowable emission limits at the same rate they operated greater than 90% and 75% of their maximum allowable emission limits. To determine the probability, one may multiply the percentage that each independent source (or unit) operates by each other. Table 4-6 –Probability Actual Occurrence > 90% >75%
0 2 in 10,000,000,000,000,000 ~ 4 in 10,000,000,000 The AB-3 Committee on Meteorology of the Air & Waste Management Association (Page 8) identifies in its comments to EPA that “… that modeled emissions are typically assumed to be at their peak continuously, which in itself results in substantial overestimation.” The process of assuming every facility operates at its maximum allowable emission limit during the worst meteorological conditions also adds to the conservativeness of the modeling analysis. 4.4.2-3 Determining the Design Value In comparing a predicted design value to the National Ambient Air Quality Standard, both modeled results and monitored results are used when involving a new source. In the case of the new 1-hour nitrogen dioxide and sulfur dioxide National Ambient Air Quality Standards, the Sioux Falls and Sioux City meteorological datasets used non-concurrent modeling and monitoring values. Since the fourth highest modeled value and fourth highest monitored value are independent of each other, the probability a modeled value exceeding the standard at the same time a monitored value exceeded the standard is low. To determine the probability, one may multiply the percentage of each independent analysis by each other. The sulfur dioxide standard is the 99th percentile of the yearly distribution of 1-hour daily maximum concentrations. The probability of the fourth highest modeled value and the fourth highest monitored value occurring at the same time would be 1% times 1% or 1 in 10,000. The nitrogen dioxide standard is the 98th percentile of the yearly distribution of 1-hour daily maximum concentrations. The probability of the eighth highest modeled value and eighth highest monitored value occurring at the same time would be 2% times 2% or 4 in 10,000. By assuming the highest modeled value and highest monitoring value occur at the same time adds to the conservativeness of the analysis. 4.4.3 Results of Modeling Analysis DENR reviewed Hyperion’s modeling analysis to determine if it agrees with the assumptions and data Hyperion used in the models (see Attachment A). Based on the review, DENR agrees

31
with Hyperion’s assumptions and data. DENR agrees Hyperion will not cause or contribute to a violation of the existing and new federal National Ambient Air Quality Standards. 4.4.4 Revised Limits Based on Modeling Analysis The new 1-hour nitrogen dioxide and 1-hour sulfur dioxide National Ambient Air Quality Standards are based on the 8th or 4th highest daily one hour reading averaged over a three year period, respectively. This type of averaging period is not suitable for developing a specific averaging time to be specified for the nitrogen oxides and sulfur dioxide emission limits. DENR considers a 1-hour period not a viable averaging period due to the criteria for conducting performance tests and the standard is based on 8th or 4th highest daily value averaged over a three year period. The 3-hour rolling average represents the averaging time used for most performance tests. DENR considers a 24-hour period or longer as not a viable averaging period due to the new national ambient air quality standards are intended to protect shorter time periods. Based on the new standards DENR is proposing the pound per hour BACT limits should be based on a 3-hour rolling average. Therefore, the permit will be revised to reduce the 24-hour average period for sulfur dioxide pounds per hour limits to a 3-hour rolling average and to reduce the annual average period for nitrogen oxides pounds per hour limits to a 3-hour rolling average. In addition, DENR is proposing the following to reflect the new modeling:
1) Add a sulfur dioxide pounds per hour limit for the wastewater treatment plant oxidizer; 2) Add an operational limit that only one of the six emergency generators and fire pumps may operate at any given time; and 3) Add the nitrogen dioxide emission limit for the six emergency generators and fire pumps that represents the nitrogen dioxide to nitrogen oxide ratio used in the modeling. The nitrogen oxide emission rate used in the modeling was multiplied by the ratio to obtain the emission limit. Compliance with this threshold will be a tiered approach by obtaining manufacturer data, testing the generators, or revising the modeling analysis to incorporate a higher ratio.
4.5 New PM2.5 Increment Regulation On October 20, 2010, EPA promulgated new increments for particulate matter less than or equal to 2.5 microns (PM2.5). The Class II increments are 4 micrograms per cubic meter on an annual basis and 9 micrograms per cubic meter on a 24-hour basis. As noted on page 64898 the federal register notice (Volume 75, No. 202, Wednesday, October 20, 2010), the applicability date for implementing the increment is October 20, 2011. In addition, South Dakota has until July 20, 2012, to submit revisions to its State Implementation Plan to incorporate these increments. On page 64899, EPA notes that an “area subject to the Federal PSD program for PM2.5 … will not be required to submit a PM2.5 increment analysis as part of a complete PSD permit application

32
for a Federal PSD permit unless the application is submitted on or after October 20, 2011.” As such, Hyperion is not required to conduct a PM2.5 modeling analysis. As discussed during the previous Board of Minerals and Environment hearing, there are technical issues in trying to model PM2.5 emissions to determine if Hyperion causes or contributes to a violation of the PM2.5 national ambient air quality standard. EPA reiterates these issues by stating on page 64886 that “the technical tools needed to complete a comprehensive analysis of all emissions that contribute to ambient concentrations of PM2.5 are only in the developmental stage” Even though a modeling analysis was conducted to determine compliance with the PM2.5 national ambient air quality standards, there are several assumptions and changes since that review that will decrease the modeled PM2.5 impacts. A few of the assumption and changes are as follows:
1) In the initial modeling analysis, DENR required Hyperion to model particulate matter less than or equal to 10 microns (PM10) emissions for the emission point sources at Hyperion instead of PM2.5 emissions. The PM10 emissions include more than just PM2.5 emissions;
2) In the initial modeling analysis, the generators and fire pumps were modeled as if each operated 8,760 hours per year, even though they were limited to 300 hours per year of operation;
3) In the initial modeling analysis, the fugitive control measures for paved areas was not considered in the modeling;
4) The draft permit changes limit the operation of only one generator and/or fire pump at one time; and
5) The alternative configuration of the sulfur recovery plant, which eliminated four of the six emission points (thermal oxidizers). In addition, the two remaining emission points (thermal oxidizers) would operate just 240 hours per year instead of 8,760 hours per year.
If at some point a PM2.5 increment analysis is required and the tools are available, these changes among any others would need to be incorporated into the review. 5.0 Evaluate New Regulations DENR identified one of the areas it would consider in reviewing Hyperion’s request to extend the construction deadline is any new regulations applicable to the PSD program. In the re-analysis of the BACT standards, DENR already considered the new regulations under the New Source Performance Standards and National Emission Standards for Hazardous Air Pollutants, such as the new standard for Gasoline Distribution Bulk Terminal, Bulk Plants and Pipeline facilities. In the re-analysis of the ambient air quality analysis, DENR already considered the

33
new 1-hour nitrogen dioxide and 1-hour sulfur dioxide National Ambient Air Quality Standards. Therefore, DENR will not re-discuss those items in this section. 5.1 Supreme Court Ruling in Massachusetts v. EPA Recent activity at EPA to regulate greenhouse gases began following the U.S. Supreme Court April 2, 2007, ruling in Massachusetts v. EPA. This case found carbon dioxide and other greenhouse gas emissions meet the definition of “air pollutants” under the Clean Air Act. With the definition confirmed, EPA was then required to determine whether or not emissions of greenhouse gases from new motor vehicles (the specific sector cited in the law suit) cause or contribute to air pollution, which may reasonably be anticipated to endanger public health or welfare or if the science is too uncertain to make a reasoned decision. 5.2 Endangerment Finding On December 7, 2009, EPA made a broad determination that greenhouse gas emissions did endanger public health and welfare (e.g., endangerment finding). It also ruled emissions from motor vehicles would cause or contribute to the atmospheric concentrations of these key greenhouse gases and hence to the threat of climate change. With the endangerment finding released, EPA was required to regulate greenhouse gas emissions from motor vehicles, under Section 202(a) of the Clean Air Act. On February 17, 2010, Alabama, Texas and Virginia filed separate petitions challenging EPA’s finding. Several other groups, including members of Congress, trade groups, nongovernmental organizations, and industries also filed challenges. The District of Columbia Circuit Court consolidated all of these cases. On March 19, 2010, South Dakota joined the request to intervene. In addition, eleven other states have also joined or filed petitions - Florida, Hawaii, Indiana, Kentucky, Louisiana, Mississippi, Nebraska, North Dakota, Oklahoma, South Carolina, and Utah. 5.3 Motor Vehicle Regulations Under the Clean Air Act, California has the ability to implement stricter vehicle emission standards than the national standards set by EPA, but must get a waiver from EPA to do so. A waiver request by California to implement greenhouse gas emissions standards for motor vehicles was granted in 2009, and other states also indicated they were interested in adopting the more stringent standards proposed by California. In order to avoid having three sets of vehicle standards, in May 2009, President Obama, with the support of EPA, DOT, California, environmental organizations and the auto industry, announced an agreement that would create the harmonized Corporate Average Fuel Efficiency (CAFE) standards and greenhouse gas emissions standards for motor vehicles at the Federal level, with California agreeing to adopt the Federal standards from 2012-2016. These regulations of greenhouse gas emissions from motor

34
vehicles were proposed in September 2009 and finalized in March 2010. EPA’s final endangerment rule was a necessary prerequisite for finalizing its greenhouse gas standard for motor vehicles. 5.4 Tailoring Rule Regulations According to the Clean Air Act, once a pollutant is regulated under any part of the Act, (as was the case with greenhouse gas emissions after the motor vehicle regulations were finalized in March 2010) major new sources or modifications are subject to the PSD program and to Title V operating permits. In the PSD program, major new or modified stationary sources (e.g., power plants and manufacturing facilities) are required to implement “best available control technologies” for pollution abatement. Under the Act, PSD and Title V operating permits are required for all sources that emit a regulated pollutant above 100 or 250 tons per year, depending on the source. Because this threshold, if applied to greenhouse gases, would greatly increase the number of facilities requiring PSD review or Title V permitting, based on administrative necessity, EPA has proposed to increase these thresholds through the “Tailoring Rule.” On May 13, 2010, EPA issued the final version of the “tailoring rule” for greenhouse gas emissions. The final rule states that starting on January 2, 2011, new or modified sources already subject to New Source Review requirements for other pollutants will be required to meet the requirements for greenhouse gases if they increase greenhouse gas emissions by more than 75,000 tons of carbon dioxide equivalent annually. On July 1, 2011, New Source Review requirements will apply to new sources that emit at least 100,000 tons of carbon dioxide equivalent annually and to major sources that modify their operations and emit 75,000 tons of carbon dioxide equivalent annually, even if they do not meet the New Source Review threshold for other pollutants. In July 2012, the requirements will begin applying to Title V operating permit requirements for existing sources that emit 100,000 tons of carbon dioxide equivalent annually. EPA will finalize another rulemaking by July 1, 2012 on the phase-in of additional sources and according to the May 13, 2010 rule, no sources emitting less than 50,000 tons of carbon dioxide equivalent annually will be subject to permitting requirements until at least April 30, 2016. On August 2, 2010, Texas sent a letter to EPA stating they do not have the intention of interpreting or amending their state laws in order to compel the permitting of greenhouse gas emissions. Texas requested EPA to stay the final rule until the endangerment finding challenge is resolved in Circuit Court. South Dakota is also appealing the greenhouse gas tailoring rule regulations. 5.5 U.S. Senate Proposals In January 2010, Senator Murkowski introduced S. J. Res. 26 - a joint resolution to override the Endangerment Finding, under the Congressional Review Act of 1996. If passed and signed into law, the Joint Resolution would overturn EPA’s endangerment finding and prevent the Agency
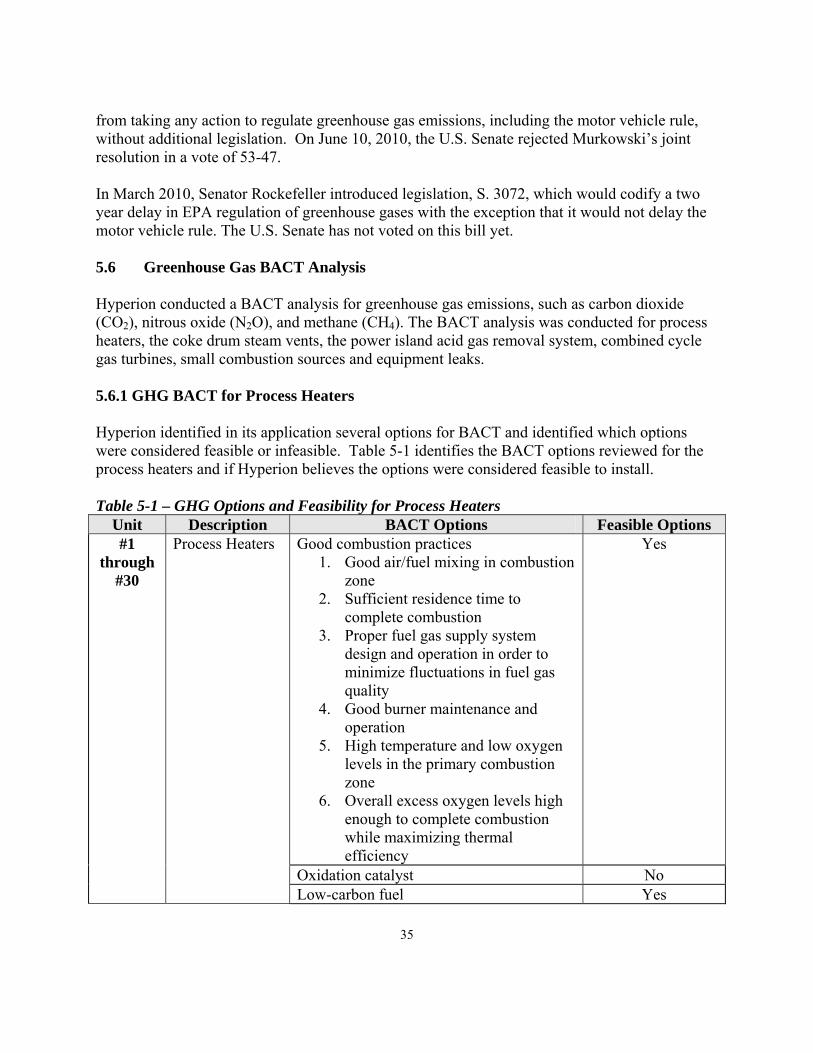
35
from taking any action to regulate greenhouse gas emissions, including the motor vehicle rule, without additional legislation. On June 10, 2010, the U.S. Senate rejected Murkowski’s joint resolution in a vote of 53-47. In March 2010, Senator Rockefeller introduced legislation, S. 3072, which would codify a two year delay in EPA regulation of greenhouse gases with the exception that it would not delay the motor vehicle rule. The U.S. Senate has not voted on this bill yet. 5.6 Greenhouse Gas BACT Analysis Hyperion conducted a BACT analysis for greenhouse gas emissions, such as carbon dioxide (CO2), nitrous oxide (N2O), and methane (CH4). The BACT analysis was conducted for process heaters, the coke drum steam vents, the power island acid gas removal system, combined cycle gas turbines, small combustion sources and equipment leaks. 5.6.1 GHG BACT for Process Heaters Hyperion identified in its application several options for BACT and identified which options were considered feasible or infeasible. Table 5-1 identifies the BACT options reviewed for the process heaters and if Hyperion believes the options were considered feasible to install. Table 5-1 – GHG Options and Feasibility for Process Heaters
Unit Description BACT Options Feasible Options #1
through #30
Process Heaters Good combustion practices 1. Good air/fuel mixing in combustion
zone 2. Sufficient residence time to
complete combustion 3. Proper fuel gas supply system
design and operation in order to minimize fluctuations in fuel gas quality
4. Good burner maintenance and operation
5. High temperature and low oxygen levels in the primary combustion zone
6. Overall excess oxygen levels high enough to complete combustion while maximizing thermal efficiency
Yes
Oxidation catalyst No Low-carbon fuel Yes

36
Unit Description BACT Options Feasible Options Energy efficient design:
1. Combustion air preheat; 2. Use process heat to generate steam; 3. Process integration and heat
recovery; 4. Continuous excess air monitoring
and control; and 5. Cogeneration.
Yes
Geologic formations carbon capture and storage:
1. Depleted oil and gas reservoirs; 2. Non-mine-able coal seams; 3. Saline formations; and 4. Basalt formations.
Yes
Terrestrial ecosystems carbon capture and storage
No
Eliminating the selective catalyst reduction system
Yes
DENR reviewed EPA’s October 2010 document titled “Available and Emerging Technologies for Reducing Greenhouse Gas Emissions from the Petroleum Refining Industry”. On page 16 of the document, EPA notes for process heaters one could consider the following:
1) Combustion Air Controls – Limitations on Excess Air. Oxygen monitors and intake air flow monitors can be used to optimize the fuel/air mixture and limit excess air; and
2) Air Preheater. An air preheater package consists of a compact air-to-air heat exchanger installed at grade level through which the hot stack gases from the convective section exchange heat with the incoming combustion air.
Hyperion’s submittal identified and expanded on the types of good combustion and energy efficient designs EPA specifies. Hyperion explains the process heater temperatures are not optimal for an oxidation catalyst and the presence of sulfur dioxide and sulfates will cause excessive corrosion. Therefore, Hyperion states the oxidation catalyst is technically infeasible. Hyperion notes there are three fuels (e.g., syngas, pressure swing adsorption “PSA” tail gas, and natural gas) with lower carbon dioxide formation potential than the refinery gas proposed to be used in the process heaters. Hyperion explains if the refinery fuel gas, which is produced during the refining process, is not used in the process heaters than the refinery fuel gas will need to be burned elsewhere, such as flaring the refinery fuel gas. Overall, requiring the process heaters to switch to one of these other fuels would increase greenhouse gas emissions. Therefore, Hyperion states switching to these fuels is technically infeasible. The refinery fuel gas has a

37
lower carbon dioxide formation potential than burning diesel fuel, residual oil, coal, and petroleum coke. Therefore, Hyperion will be burning a low carbon fuel. Hyperion notes the storing of carbon dioxide in a geological formation has occurred; therefore, this option is considered technically feasible. However, Hyperion does not identify if any of the geological formations noted are commercially accepting and/or currently prepared to accept and store the carbon dioxide. In researching this concept, DENR determined the noted locations were not actively seeking or even trying to develop an underground storage location. DENR does not fully agree this is a technologically feasible option at this time. However, DENR will agree the technology is technically feasible for the sake of discussion. Hyperion notes due to the undemonstrated cost and effectiveness of terrestrial ecosystems sequestration options, this option is considered technically infeasible. DENR disagrees with Hyperion and believes it is technically feasible for Hyperion to plant trees or other vegetation to reduce greenhouse gas emissions. DENR ranked the feasible options, which are displayed in Table 5-2. Hyperion notes the good combustion practices, low carbon fuels, and energy efficiency design are inherently part of the design of the facility and represent the baseline for control efficiency. Therefore, the baseline control efficiency for these options is listed with a 0% control. Table 5-2 – Top GHG Control Options for Process Heaters
Unit Description Feasible Options Rank #1
through Process Heaters Geologic formations carbon capture and
storage (≥ 90%) 1#1
#30 Eliminating the selective catalyst reduction system (0.05%) 2
#2
Terrestrial ecosystems carbon capture and storage (0.01%) 3
#3
Good combustion practices, low carbon fuels and energy efficient design (0%)
#4
1 – Hyperion notes the geological formation capture and storage would have arbitrary control efficiency of 93%; 2 – The eliminating of the selective catalytic reduction efficiency is based on the carbon equivalent emission rate of 2,400 tons per year and the 4.9 million carbon dioxide potential emissions from the process heaters: {(2,400) / (4,900,000) x (100)} = 0.05 percent; and 3 – The terrestrial ecosystem carbon capture and storage efficiency is based on the average EPA sequestration rate of 1.2 metric tons (1.3 tons) carbon dioxide per acre per year, the proposed project (non refinery) acreage of 1,800 acres, and the 16.9 million carbon dioxide potential emissions from the refinery {(1.3 x 1,800) / (16,900,000) x (100)} = 0.01 percent
Hyperion indicates Option #1 should be eliminated due to unacceptable and adverse environmental impacts. Hyperion notes to dry, compress, and transport the approximately 4.5 million tons of greenhouse gases, Hyperion would need approximately 800 megawatts worth of

38
electrical and steam production. The analysis Hyperion used identifies the 800 megawatts as a fuel input and not an output rate. Generally, megawatts when referencing electrical production is based on an output rate. The analysis Hyperion used specifies the efficiency of the electrical unit as approximately 50%. For consistency, DENR converted the 800 megawatt heat input rate to an output basis using the 50% efficiency, which results in an output of approximately 400 megawatts. As noted on page 8 of Hyperion’s 2007 application, the proposed IGCC system would have a gross electrical output in the range of 450 to 530 megawatts. The carbon capture system requirement of approximately 400 megawatts of electrical and steam production would require approximately 75% of the proposed IGCC power plant. The same IGCC power plant is designed to operate the 400,000 barrel per day refinery. Therefore, Hyperion would need to increase the size of the IGCC power plant or install a separate electric power plant to produce the electricity needed for the carbon capture system. The amount of energy required for the carbon capture system is much higher than other control systems designated as best available control technology or best available retrofit technology for other criteria pollutants. For example, in reviewing the best available retrofit technology for Otter Tail Power Company’s Big Stone I power plant, it was estimated that installing a selective catalytic reduction system to control nitrogen oxide emissions and a flue gas desulphurization system to control sulfur dioxide emissions would increase the electrical demand between 4 and 11 megawatts at the 450 megawatt coal fired power plant. At this power plant, this electrical demand equates to less than 3% of its 450 megawatt electrical load. Hyperion estimates Option #1 would increase the emissions of particulate matter less than 2.5 microns in diameter by 268 tons per year, nitrogen oxides by 132 tons per year, sulfur dioxide by 77 tons per year, carbon monoxide by 81 tons per year, and volatile organic compounds by 21 tons per year. Table 5-3 compares the current estimated tons per year emissions for the Hyperion facility to the increase of emissions associated with the carbon capture system. Table 5-3 – Emission Comparison Pollutant Hyperion as Proposed 1 Carbon Capture Increase Percentage Increase PM10 1,001 268 ~ 27% PM2.5 1,001 268 ~ 27% SO2 365 77 ~ 21% NOx 656 132 ~ 20% VOC 406 21 ~ 5% CO 1,860 81 ~ 4%
1 – The proposed estimated emissions are based on the estimated annual emissions noted in the revised Table 1.4-1 of the original application and then updated to take into account the reduction in emissions for the tank farm thermal oxidizer and the proposed changes to the sulfur recovery plant identified in the re-analysis of BACT for the sulfur recovery plant.
39
Unlike greenhouse gases, there are National Ambient Air Quality Standards for particulate matter less than 10 microns in diameter, particulate matter less than 2.5 microns in diameter, nitrogen oxides, sulfur dioxide, carbon monoxide, and ozone (volatile organic compounds is a precursor). The increase of the criteria pollutants will increase to some degree the estimated modeled concentrations. Based on the modeling previously submitted and submitted in the extension request, Hyperion proposed project is within 90 plus percent of the 24-hour particulate matter less than 2.5 microns in diameter standard, the new 1-hour sulfur dioxide standard and the new 1-hour nitrogen oxide standard. Therefore, increasing these criteria pollutant emissions is considered a greater risk to an ambient air quality standard than requiring a certain type of BACT for controlling greenhouse gas emissions. In addition to the increase in the emissions of criteria pollutants, the energy needed to operate the carbon capture system will also increase carbon dioxide emissions by 1.5 million tons per year. The process heaters are estimated to produce 4.9 million tons of carbon dioxide per year. As such the carbon capture system is being designed to reduce 6.4 million tons of carbon dioxide. Therefore, the carbon capture system emits approximately 23 percent of the emissions it is designed to control. Hyperion determined the carbon capture system for the process heaters would have an estimated annual cost effectiveness of $104 per ton of carbon dioxide sequestered. In reviewing Hyperion’s cost analysis, it appears the studies referenced by Hyperion are underestimating the cost of these systems. Hyperion estimates the capital cost of the carbon capture system, which is to cover the cost of capturing, compressing, transporting and injecting the carbon dioxide, is approximately $307 million. As discussed above, the carbon capture system will require an electrical power plant of approximately 400 megawatts. The Basin Deer Creak’s 300 megawatt combined cycle combustion project near White, South Dakota is estimated to cost approximately $400 million to construct. Therefore, the cost of just the extra power is more than what Hyperion is estimating it will cost to capture, compress, transport, and inject carbon dioxide. Hyperion notes the closest geological formation the carbon dioxide could be sequestered at is approximately 200 to 300 miles from the proposed facility. The Keystone Pipeline projects were estimated to cost approximately $1,400,000 to $2,900,000 per mile of pipeline. Dakota Gasification Company constructed a 205 mile long pipeline to transport compressed carbon dioxide to Canada for enhance oil recovery (sequestration) beginning in calendar year 2000. Representatives from Dakota Gasification Company noted the rule of thumb for the cost of the pipeline was approximately 1,000,000 per mile of pipeline. Updating the cost of this pipeline to 2010 using a 3% inflation rate, the cost of the pipeline is estimated to be approximately $1,400,000 per mile of pipeline. This rate is comparable to the lower rate estimated by the Keystone Pipeline projects. At this rate, the cost of just a pipeline for Hyperion would be estimated to cost $280 million to $420 million to construct.

40
Hyperion notes operations and maintenance cost for capturing, compressing, transporting and injecting the carbon dioxide for the process heaters would be $15 million per year. On December 10, 2010, EPA finalized regulations for Underground Injection Control Program for Carbon Dioxide Geologic Sequestration Wells. In the rule docket on page 77,279, EPA estimates the operation of just the injection well would be approximately $28 to $50 million per year. In reviewing EPA’s October 2010 document titled “Available and Emerging Technologies for Reducing Greenhouse Gas Emissions from the Petroleum Refining Industry”, EPA generally did not specify a $ per ton of carbon dioxide reduced. However, EPA does note on pages 14 through 19 that several of the control measures would see a financial return on the investment due to the improvements in energy efficiency. Based on the data provided, a carbon capture and sequestration system for the Hyperion project will not see a financial return on the capital cost. DENR agrees with Hyperion that carbon capture and sequestration in a geologic formation does not represent Best Available Control Technology for greenhouse gas emissions due to the adverse environmental, energy and associated cost of the system. Hyperion notes that Option #2 should be eliminated due to unacceptable and adverse environmental impacts. Eliminating the selective catalytic reduction system may reduce the production of greenhouse gas emissions but it increases nitrogen oxide emissions, which leads to the formation of nitrogen dioxide. As discussed in the modeling discussion, there is a National Ambient Air Quality Standard for nitrogen dioxide. However, there is currently no National Ambient Air Quality Standard for greenhouse gases. Therefore, DENR is placing more emphasis on reducing nitrogen oxide emissions than reducing greenhouse gases. As such, DENR agrees that Option #2 is not BACT. Hyperion noted Option #3 was technically infeasible due to undemonstrated cost and effectiveness to make a determination. As noted above, DENR considers planting trees or other vegetation as technically feasible. The noted control efficiency in Table 5-2 for Terrestrial Ecosystems Carbon Capture and Storage is not based on the greenhouse gas emissions from just the process heaters but all the greenhouse gas emissions generated from Hyperion. Unlike, the other control options, planting vegetation is not specific to a piece of equipment but to the emissions generated as a whole in the surrounding area. The reduction in greenhouse gas emissions is estimated to be 0.01% of the greenhouse emission generated by the proposed Hyperion facility. This percentage is considered negligible and not justifiable to require the non-refining area to be planted with specific vegetation. Hyperion is proposing to implement the #4 option for the process heaters. Table 5-4 identifies Hyperion’s proposed greenhouse gas BACT for the process heaters. Table 5-4 – Proposed GHG BACT Control and Limit for Process Heaters
Unit Description Proposed Control Proposed Limit
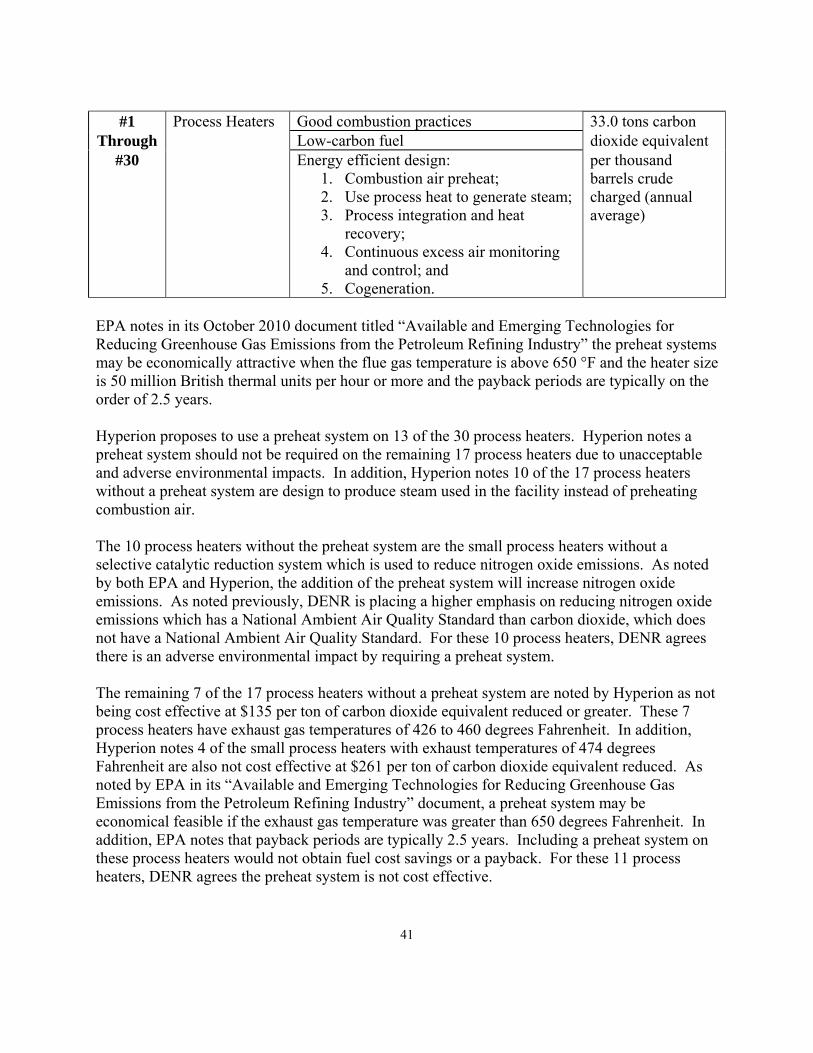
41
#1 Process Heaters Good combustion practices 33.0 tons carbon Through Low-carbon fuel dioxide equivalent
#30 Energy efficient design: 1. Combustion air preheat; 2. Use process heat to generate steam; 3. Process integration and heat
recovery; 4. Continuous excess air monitoring
and control; and 5. Cogeneration.
per thousand barrels crude charged (annual average)
EPA notes in its October 2010 document titled “Available and Emerging Technologies for Reducing Greenhouse Gas Emissions from the Petroleum Refining Industry” the preheat systems may be economically attractive when the flue gas temperature is above 650 °F and the heater size is 50 million British thermal units per hour or more and the payback periods are typically on the order of 2.5 years. Hyperion proposes to use a preheat system on 13 of the 30 process heaters. Hyperion notes a preheat system should not be required on the remaining 17 process heaters due to unacceptable and adverse environmental impacts. In addition, Hyperion notes 10 of the 17 process heaters without a preheat system are design to produce steam used in the facility instead of preheating combustion air. The 10 process heaters without the preheat system are the small process heaters without a selective catalytic reduction system which is used to reduce nitrogen oxide emissions. As noted by both EPA and Hyperion, the addition of the preheat system will increase nitrogen oxide emissions. As noted previously, DENR is placing a higher emphasis on reducing nitrogen oxide emissions which has a National Ambient Air Quality Standard than carbon dioxide, which does not have a National Ambient Air Quality Standard. For these 10 process heaters, DENR agrees there is an adverse environmental impact by requiring a preheat system. The remaining 7 of the 17 process heaters without a preheat system are noted by Hyperion as not being cost effective at $135 per ton of carbon dioxide equivalent reduced or greater. These 7 process heaters have exhaust gas temperatures of 426 to 460 degrees Fahrenheit. In addition, Hyperion notes 4 of the small process heaters with exhaust temperatures of 474 degrees Fahrenheit are also not cost effective at $261 per ton of carbon dioxide equivalent reduced. As noted by EPA in its “Available and Emerging Technologies for Reducing Greenhouse Gas Emissions from the Petroleum Refining Industry” document, a preheat system may be economical feasible if the exhaust gas temperature was greater than 650 degrees Fahrenheit. In addition, EPA notes that payback periods are typically 2.5 years. Including a preheat system on these process heaters would not obtain fuel cost savings or a payback. For these 11 process heaters, DENR agrees the preheat system is not cost effective.

42
DENR agrees for 17 of the 30 process heaters, a preheat system is not Best Available Control Technology for greenhouse gas emissions due to adverse economic and environmental impacts. Generically, DENR would generally review other permit limits imposed by other facilities and if available performance data conducted under the terms of those permits. However, DENR is not aware of another refinery that has greenhouse gas BACT emission limits established in a permit. Therefore, there is limited performance data to provide a basis that specifies a lower emission limit is achievable. However, DENR did consider two sources of data for its review in determining if a lower limit was achievable. The first is the greenhouse gas emission inventory for refineries in California as provided by the California Environmental Protection Agency Air Resources Board. The second set of data is the operational capacity and utilization rates for the United States as provided by the U.S. Energy Information Administration. By combining the two sets of data, DENR was able to derive the amount of greenhouse gas emissions emitted per gallon of crude oil processed by the facility. However this calculated emission rate is for the entire refining facility and not specific to emissions from the process heaters. Since each refinery is designed differently compared to Hyperion, an accurate direct comparison of greenhouse gas emissions per gallon of crude oil processed by the facility is not available. For example, the refineries in California do not have an integrated IGCC power plant associated with their operations. DENR compared the amount of greenhouse gas emissions emitted per gallon of crude oil processed for the refineries operating in California with operating capacities of 100,000 barrels per day to the amount of greenhouse gas emission emitted per gallon of crude oil processed by just Hyperion’s refinery portion of the facility. Table 5-5 compares Hyperion’s proposed emission rate for the refining section of the facility to those refineries operating in California. Table 5-5 – GHG Refinery Operational Capacity Comparison
Company Name
Site Location
Operating Capacity
(Barrels/Day)
Calendar Year 2008 CO2equiv
(tons/year)
Calendar Year 2009 CO2equiv
(tons/year) Average 1
(tons /barrel) Chevron El Segundo 265,500 3,701,364 3,533,870 0.037 Chevron Richmond 245,271 5,282,333 4,985,074 0.057 Tesoro Martinez 166,000 2,979,707 2,424,495 0.045 Royal Dutch Martinez 156,400 5,038,086 4,764,401 0.086 Exxon Mobil Torrance 149,500 - 2,970,259 0.054 Valero Benicia 144,000 3,082,125 3,205,460 0.060 Conoco Phillips Wilmington 139,000 2,221,975 1,951,633 0.041 Conoco Phillips Rodeo 120,200 2,082,150 1,904,971 0.045 Hyperion 2 Elk Point 400,000 4,852,326 4,852,326 0.033
1 – The average was calculated by the following equation: [(2008 emissions + 2009 emissions) / (2)] / (barrels per day) / 365 days per year); and

43
2 – The emissions identified for Hyperion does not include the carbon dioxide for the acid gas removal vent and combustion turbines which are part of the IGCC portion of the facility.
Based on Table 5-5, Hyperion would produce less greenhouse gases per barrel of oil refined than the refineries in operation. However, some of the refineries also produce some of its own electricity and steam production by burning natural gas, propane, etc. To account for this, DENR added in a portion of the emissions from the combustion turbines and compare it to the Chevron El Segundo facility. The Chevron El Segundo facility was chosen because it had the lowest average greenhouse gas emissions per barrel of crude oil processed rate. DENR does not consider adding all of the emissions from the IGCC power plant into the comparison as reasonable because the Chevron El Segundo facility is not gasifying petroleum coke to produce electricity and is not producing electricity to operate an IGCC power plant. Therefore, where Hyperion is producing greenhouse gas emissions from acid gas removal system and from generating electricity to run the IGCC power plan, Chevron El Segundo is not. Another issue with this comparison is the fuels being burned to produce the electricity and steam is different. The amount of carbon dioxide emissions is dependent upon the carbon content of the fuel being burned. Chevron El Segundo electrical power plant has a design capacity of 2,097 million British thermal units (MMBtus) per hour. Therefore, the Chevron El Segundo produces approximately 0.19 MMBtus of electricity per barrel of crude oil processed. Using this rate, the amount of greenhouse gases from Hyperion’s combustion turbines that will be contributed to the refinery is 1,644,726 tons of carbon dioxide equivalent emissions. This number is derived by Equation 5-1. Equation 5-1 (ER) x (RC) / (hours per day) / (TC) x (Turbine CO2 Emissions) Where:
• ER = Electricity Rate of 0.19 MMBtus per barrel • RC = Refinery Capacity of 400,000 barrels per day • Hours per day = 24 • TC = Turbine Capacity of 6,708 MMBtus per hour • Turbine CO2 Emissions = 3,483,683 tons of carbon dioxide equivalent emissions
In addition to the changes to the rate for Hyperion, the rate for Chevron El Segundo will be revised to account for the utilization rate of the refinery. This will allow the average tons per barrel for the Chevron El Segundo facility to more closely represent its actual operations. The rate noted in Table 5-5 is a combination of actual emissions and potential operational capacity. To more accurately reflect the rate for the Chevron El Segundo facility, the utilization rates of 88.1 percent for calendar year 2008, and 80.1 percent for calendar year 2009 will be used. These rates were obtained from the United States Energy Information Administration website. Table 5-6 compares Hyperion’s proposed emission rate for the refining section of the facility to Chevron El Segundo.

44
Table 5-6 – GHG Refinery Operational Capacity Comparison
Company Name
Site Location
Operating Capacity
(Barrels/Day)
Calendar Year 2008 CO2equiv
(tons/year)
Calendar Year 2009 CO2equiv
(tons/year) Average
(tons /barrel) Chevron El Segundo 265,500 3,701,364 3,533,870 0.0444 1
Hyperion 2 Elk Point 400,000 6,497,052 6,497,052 0.0445 3
1 – The average was calculated by the following equation: [{(2008 emissions) / (0.881) + (2009 emissions) / (0.801)} / (2)] / (barrels per day) / 365 days per year); 2 – The emissions identified for Hyperion does not include the carbon dioxide for the acid gas removal vent and combustion turbines which are part of the IGCC portion of the facility; and 3 – The average was calculated by the following equation: [{(2008 emissions) + (2009 emissions)} / (2)] / (barrels per day) / 365 days per year).
Based on the above table, Hyperion would potentially produce the same amount of greenhouse gases per barrel of crude oil processed as the most efficient refinery currently in operation. Therefore, DENR considers the basis for Hyperion’s proposed BACT limit as GHG BACT for Hyperion. Generally and historically, the case-by-case BACT limits have been established on an emission unit basis and not as a system or facility wide basis. However, greenhouse gases are not typical air pollutant being reviewed. There is no National Ambient Air Quality Standard for greenhouse gases used as a basis for an averaging period. Since EPA notes the environmental concern for greenhouse gases is the cumulative impact to the environment an not localized impacts, the averaging period should focus on using a long term average (365-day rolling average) instead of a short term average (3-hour). EPA also identifies this concept on page 47 of its PSD and Title V Permitting Guidance for Greenhouse Gases. Therefore, DENR agrees a 365-day rolling average is an appropriate averaging period. DENR concludes BACT is good combustion and energy efficient design, to account for these technologies, a typical emission limit by emission unit may not be appropriate. Hyperion’s project is a combination of an oil refinery and power plant, each of the processes are interconnected. Therefore, the energy efficiency of one system is dependent upon the operation of another operation. Therefore, establishing a system wide emission limit allows Hyperion flexibility in its operations and at the same time requires the entire system to be energy efficient. Therefore, DENR agrees a greenhouse gas emissions limit by system is a valid approach. On page 46 of EPA’s PSD and Title V Permitting Guidance for Greenhouse Gases, EPA encourages permitting authorities to consider establishing an output-based BACT emission limit. In the case of Hyperion, it is producing several different products (gasoline, diesel fuel, jet fuel, etc.). Therefore, a single output metric is not available for a system wide approach. However, using the crude oil input into the entire facility allows for a single operational metric to be used.
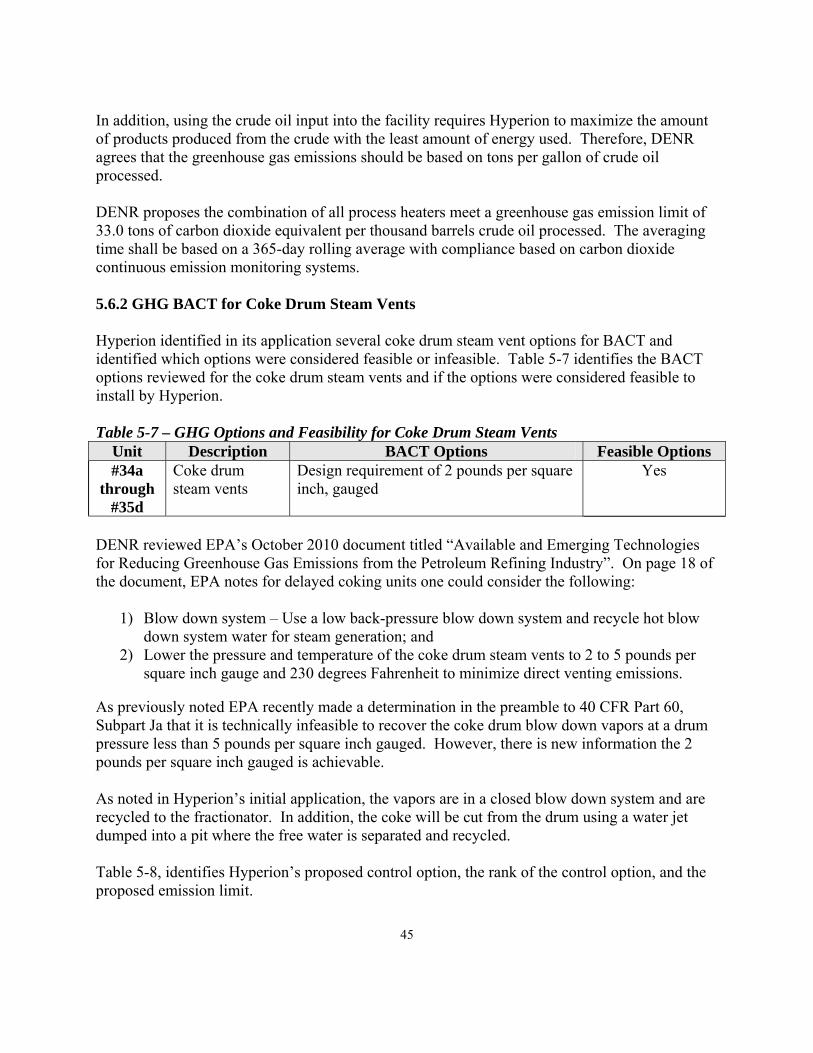
45
In addition, using the crude oil input into the facility requires Hyperion to maximize the amount of products produced from the crude with the least amount of energy used. Therefore, DENR agrees that the greenhouse gas emissions should be based on tons per gallon of crude oil processed. DENR proposes the combination of all process heaters meet a greenhouse gas emission limit of 33.0 tons of carbon dioxide equivalent per thousand barrels crude oil processed. The averaging time shall be based on a 365-day rolling average with compliance based on carbon dioxide continuous emission monitoring systems. 5.6.2 GHG BACT for Coke Drum Steam Vents Hyperion identified in its application several coke drum steam vent options for BACT and identified which options were considered feasible or infeasible. Table 5-7 identifies the BACT options reviewed for the coke drum steam vents and if the options were considered feasible to install by Hyperion. Table 5-7 – GHG Options and Feasibility for Coke Drum Steam Vents
Unit Description BACT Options Feasible Options #34a
through#35d
Coke drum steam vents
Design requirement of 2 pounds per square inch, gauged
Yes
DENR reviewed EPA’s October 2010 document titled “Available and Emerging Technologies for Reducing Greenhouse Gas Emissions from the Petroleum Refining Industry”. On page 18 of the document, EPA notes for delayed coking units one could consider the following:
1) Blow down system – Use a low back-pressure blow down system and recycle hot blow down system water for steam generation; and
2) Lower the pressure and temperature of the coke drum steam vents to 2 to 5 pounds per square inch gauge and 230 degrees Fahrenheit to minimize direct venting emissions.
As previously noted EPA recently made a determination in the preamble to 40 CFR Part 60, Subpart Ja that it is technically infeasible to recover the coke drum blow down vapors at a drum pressure less than 5 pounds per square inch gauged. However, there is new information the 2 pounds per square inch gauged is achievable. As noted in Hyperion’s initial application, the vapors are in a closed blow down system and are recycled to the fractionator. In addition, the coke will be cut from the drum using a water jet dumped into a pit where the free water is separated and recycled. Table 5-8, identifies Hyperion’s proposed control option, the rank of the control option, and the proposed emission limit.

46
Table 5-8 – Proposed GHG BACT Control and Limit for Coke Drum Steam Vents
Unit Description Proposed Control Rank Proposed Limit #34a
through#35d
Coke drum steam vents
Design requirement of 2 pounds per square inch gauged
#1 Work design practice standards in accordance with 40 CFR Part 60, Subpart Ja but the standard is 2 psig instead of 5 psig
In the data EPA submitted to DENR on the Coke Drums, EPA did not submit temperature data profiles that correspond to the estimated emissions. As such, DENR was unable to locate temperature data that could be used to identify an achievable work practice limit. Therefore, DENR does not recommend a temperature limit of 230 degrees Fahrenheit. Based on DENR’s review, there are no facilities with equivalent or more stringent limitations than those proposed by Hyperion for the proposed controls. 5.6.3 GHG BACT for Power Island Acid Gas Removal System (CO2 Vent) Hyperion identified in its application several power island acid gas removal system options for BACT and identified which options were considered feasible or infeasible. Table 5-9 identifies the BACT options reviewed for the power island acid gas removal system and if the options were considered feasible to install by Hyperion. Table 5-9 – GHG Options and Feasibility for Power Island Acid Gas Removal System Unit Description BACT Options Feasible Options #59 Power island Proper design Yes
acid gas removal Thermal oxidation No system Catalytic oxidation No Geologic formations carbon capture and storage
1. Depleted oil and gas reservoirs 2. Non-mine-able coal seams 3. Saline formations 4. Basalt formations
Yes
Terrestrial ecosystems carbon capture and storage
No
Hyperion explains due to the gas stream characteristics, using thermal oxidation or catalytic oxidation would produce more greenhouse gases than they would decrease. Therefore Hyperion states the thermal oxidation or catalytic oxidation is technically infeasible. DENR agrees a thermal oxidation and catalytic oxidation system would produce more greenhouse gases than they would decrease.

47
Hyperion notes that storing carbon dioxide in geological formation has occurred, therefore, this option is considered technically feasible. However, Hyperion does not identify if any of the geological formations noted are commercially accepting and/or currently prepared to accept and store the carbon dioxide. In researching this concept, DENR determined the noted locations were not actively seeking or even trying to develop an underground storage location. DENR does not fully agree this is a technologically feasible option at this time. However, DENR will list the technology as technically feasible for the sake of discussion. Hyperion notes due to the undemonstrated cost and effectiveness of terrestrial ecosystems sequestration options, this option is considered technically infeasible. DENR disagrees with Hyperion and believes it is technically feasible for Hyperion to plant trees or other vegetation to reduce greenhouse gas emissions. DENR ranked the feasible options, which are displayed in Table 5-10. Hyperion notes the good proper design is inherently part of the design of the facility and represents the baseline for control efficiency. Therefore, the baseline control efficiency for these options is listed with a 0%. Table 5-10 – Top GHG Control Options for Power Island Acid Gas Removal System Unit Description Feasible Options Rank #59 Power island acid gas
removal system Geologic formations carbon capture and storage (≥ 90%) 1
#1
Terrestrial ecosystems carbon capture and storage (0.01%) 2
#2
Proper design (0%) #3 1 – Hyperion notes the geological formation capture and storage would have an arbitrary control efficiency of 100%; and 2 – The terrestrial ecosystem carbon capture and storage efficiency is based on the average EPA sequestration rate of 1.2 metric tons (1.3 tons) carbon dioxide per acre per year, the proposed project (non refinery) acreage of 1,800 acres, and the 16.9 million carbon dioxide potential emissions from the refinery {(1.3 x 1,800) / (16,900,000) x (100)} = 0.01 percent.
Hyperion is proposing to implement the #3 option for the power island acid gas removal system. Hyperion notes Option #1 should be eliminated due to unacceptable and adverse environmental impacts. Hyperion notes to dry, compress, and transport the approximately 8.5 million tons of greenhouse gases, Hyperion would need approximately 267 megawatts worth of electrical and steam production. The quantity of electrical and steam production in this case is lower than proposed for the process heater because the power island acid gas removal system has already isolated a relatively pure carbon dioxide stream.
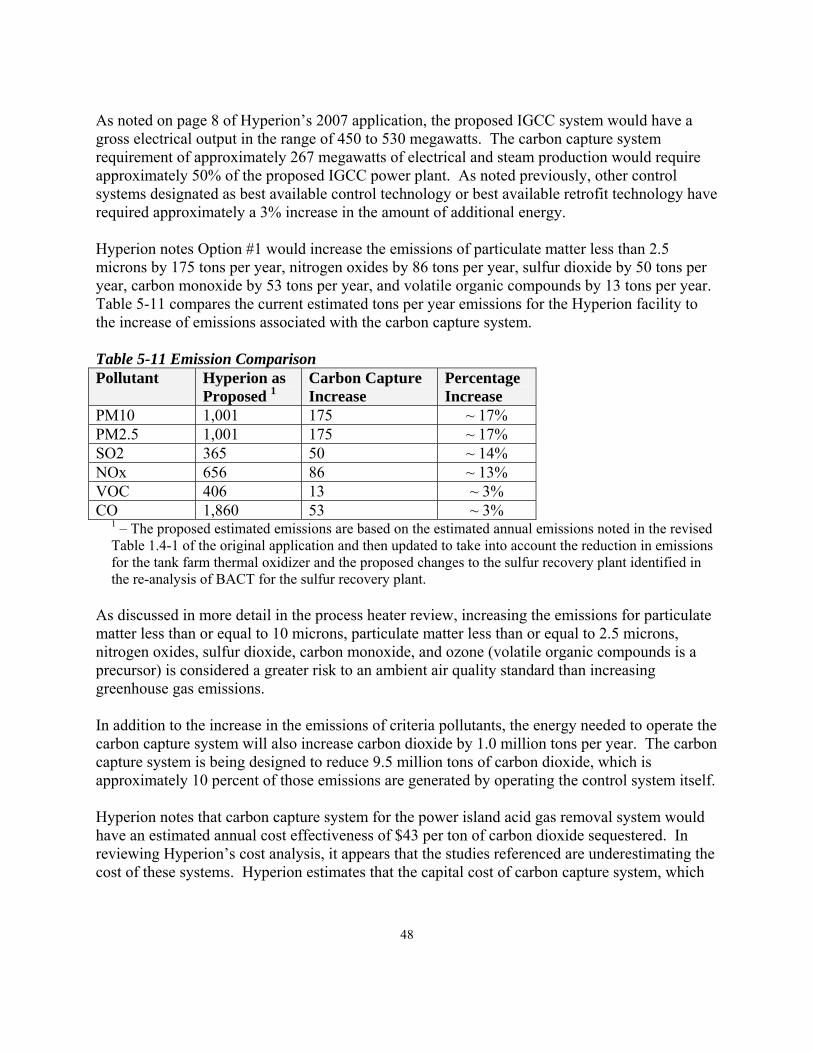
48
As noted on page 8 of Hyperion’s 2007 application, the proposed IGCC system would have a gross electrical output in the range of 450 to 530 megawatts. The carbon capture system requirement of approximately 267 megawatts of electrical and steam production would require approximately 50% of the proposed IGCC power plant. As noted previously, other control systems designated as best available control technology or best available retrofit technology have required approximately a 3% increase in the amount of additional energy. Hyperion notes Option #1 would increase the emissions of particulate matter less than 2.5 microns by 175 tons per year, nitrogen oxides by 86 tons per year, sulfur dioxide by 50 tons per year, carbon monoxide by 53 tons per year, and volatile organic compounds by 13 tons per year. Table 5-11 compares the current estimated tons per year emissions for the Hyperion facility to the increase of emissions associated with the carbon capture system. Table 5-11 Emission Comparison Pollutant Hyperion as
Proposed 1Carbon Capture Increase
Percentage Increase
PM10 1,001 175 ~ 17% PM2.5 1,001 175 ~ 17% SO2 365 50 ~ 14% NOx 656 86 ~ 13% VOC 406 13 ~ 3% CO 1,860 53 ~ 3%
1 – The proposed estimated emissions are based on the estimated annual emissions noted in the revised Table 1.4-1 of the original application and then updated to take into account the reduction in emissions for the tank farm thermal oxidizer and the proposed changes to the sulfur recovery plant identified in the re-analysis of BACT for the sulfur recovery plant.
As discussed in more detail in the process heater review, increasing the emissions for particulate matter less than or equal to 10 microns, particulate matter less than or equal to 2.5 microns, nitrogen oxides, sulfur dioxide, carbon monoxide, and ozone (volatile organic compounds is a precursor) is considered a greater risk to an ambient air quality standard than increasing greenhouse gas emissions. In addition to the increase in the emissions of criteria pollutants, the energy needed to operate the carbon capture system will also increase carbon dioxide by 1.0 million tons per year. The carbon capture system is being designed to reduce 9.5 million tons of carbon dioxide, which is approximately 10 percent of those emissions are generated by operating the control system itself. Hyperion notes that carbon capture system for the power island acid gas removal system would have an estimated annual cost effectiveness of $43 per ton of carbon dioxide sequestered. In reviewing Hyperion’s cost analysis, it appears that the studies referenced are underestimating the cost of these systems. Hyperion estimates that the capital cost of carbon capture system, which

49
is to cover the cost of capturing, compressing, transporting and injecting the carbon dioxide, is approximately $650 million. As discussed in the BACT review for the process heaters, the capital cost for the electrical power plant and pipeline is more likely to cost between $680 million to $820 million. Hyperion notes that operations and maintenance cost for capturing, compressing, transporting and injecting the carbon dioxide for the power island acid gas removal system would be $32 million per year. On December 10, 2010, EPA finalized regulations for Underground Injection Control Program for Carbon Dioxide Geologic Sequestration Wells. In the rule docket on page 77,279, EPA estimates that the operation of just the injection well would be approximately $28 to $50 million per year. As noted above, DENR considers Hyperion’s cost estimate as underestimating the true cost of a carbon capture system. In reviewing EPA’s October 2010 document titled “Available and Emerging Technologies for Reducing Greenhouse Gas Emissions from the Petroleum Refining Industry”, EPA generally did not specify a $ per ton of carbon dioxide reduced. However, EPA does note on pages 14 through 19 that several of the control measures would see a financial return on the investment due to the improvements in energy efficiency. Based on the data provided, a carbon capture and sequestration system for the Hyperion project will not see a financial return on the capital cost. DENR agrees with Hyperion that carbon capture and sequestration in a geologic formation does not represent Best Available Control Technology for greenhouse gas emissions due to the adverse environmental, energy and associated cost of the system. Hyperion noted Option #2 was technically infeasible due to undemonstrated cost and effectiveness to make a determination. As noted above, DENR considers planting trees or other vegetation as technically feasible. However, DENR considered the estimated greenhouse gas reduction of 0.01% not justifiable to require the non-refining area to be planted with specification vegetation. Table 5-12 identifies Hyperion’s proposed greenhouse gas BACT for the power island acid gas removal system. Table 5-12 – Proposed GHG BACT Control and Limit for Power Island Acid Gas Removal System
Unit Description Proposed Control Proposed Limit #59 Power island
acid gas removal system
Proper design 58.6 tons carbon dioxide equivalent per thousand barrels crude charged (annual average)
Generically, DENR would review other permit limits imposed by other facilities and if available performance data conducted under the terms of those permits. However, DENR is not aware of another refinery or IGCC system that has greenhouse gas BACT emission limits established in a

50
permit. Therefore, DENR is unaware of any performance data that would provide a basis that specifies that a lower emission limit is achievable. Generally and historically, the case-by-case BACT limits have been established on an emission unit basis and not as a system or facility wide basis. However, greenhouse gases are not typical air pollutant being reviewed. As discussed in more detail the process heater review, DENR is proposing a system wide greenhouse gas limit of 58.6 tons carbon dioxide equivalent per thousand barrels crude charged. The averaging time shall be based on a 365-day rolling average with compliance based on carbon dioxide continuous emission monitoring systems. 5.6.4 GHG BACT for Combined Cycle Gas Turbines Hyperion identified in its application several options for BACT and identified which options were considered feasible or infeasible. Table 5-13 identifies the BACT options reviewed for the combined cycle gas turbines and if the options were considered feasible to install by Hyperion. Table 5-13 – GHG Options and Feasibility for Combined Cycle Gas Turbine
Unit Description BACT Options Feasible Options #60
through #64
Combined Cycle Gas Turbines
Good combustion practices 1. Good air/fuel mixing in combustion
zone 2. Sufficient residence time to
complete combustion 3. Proper fuel gas supply system
design and operation in order to minimize fluctuations in fuel gas quality
4. Good burner maintenance and operation
5. High temperature and low oxygen levels in the primary combustion zone
6. Overall excess oxygen levels high enough to complete combustion while maximizing thermal efficiency
Yes
Oxidation catalyst Yes Low-carbon fuel Yes Energy efficient design
1. Continuous excess air monitoring and control
2. Cogeneration
Yes
Geologic formations carbon capture and Yes
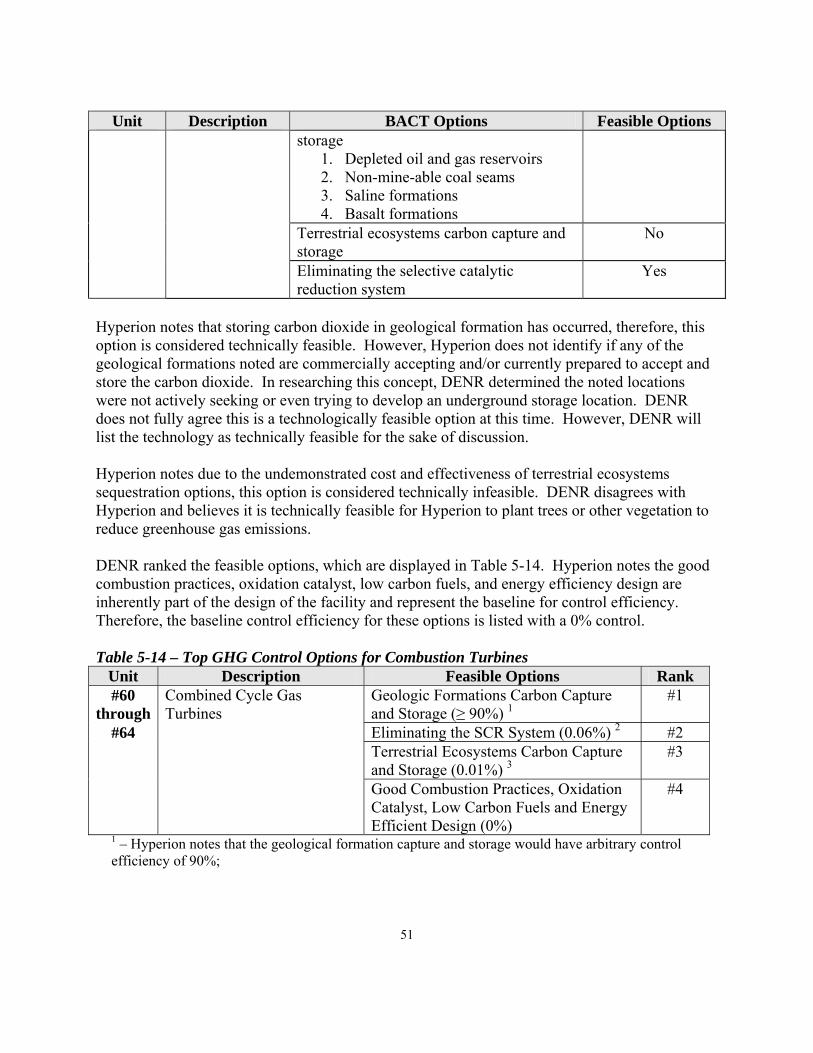
51
Unit Description BACT Options Feasible Options storage
1. Depleted oil and gas reservoirs 2. Non-mine-able coal seams 3. Saline formations 4. Basalt formations
Terrestrial ecosystems carbon capture and storage
No
Eliminating the selective catalytic reduction system
Yes
Hyperion notes that storing carbon dioxide in geological formation has occurred, therefore, this option is considered technically feasible. However, Hyperion does not identify if any of the geological formations noted are commercially accepting and/or currently prepared to accept and store the carbon dioxide. In researching this concept, DENR determined the noted locations were not actively seeking or even trying to develop an underground storage location. DENR does not fully agree this is a technologically feasible option at this time. However, DENR will list the technology as technically feasible for the sake of discussion. Hyperion notes due to the undemonstrated cost and effectiveness of terrestrial ecosystems sequestration options, this option is considered technically infeasible. DENR disagrees with Hyperion and believes it is technically feasible for Hyperion to plant trees or other vegetation to reduce greenhouse gas emissions. DENR ranked the feasible options, which are displayed in Table 5-14. Hyperion notes the good combustion practices, oxidation catalyst, low carbon fuels, and energy efficiency design are inherently part of the design of the facility and represent the baseline for control efficiency. Therefore, the baseline control efficiency for these options is listed with a 0% control. Table 5-14 – Top GHG Control Options for Combustion Turbines
Unit Description Feasible Options Rank #60
through Combined Cycle Gas Turbines
Geologic Formations Carbon Capture and Storage (≥ 90%) 1
#1
#64 Eliminating the SCR System (0.06%) 2 #2 Terrestrial Ecosystems Carbon Capture
and Storage (0.01%) 3#3
Good Combustion Practices, Oxidation Catalyst, Low Carbon Fuels and Energy Efficient Design (0%)
#4
1 – Hyperion notes that the geological formation capture and storage would have arbitrary control efficiency of 90%;

52
2 – The eliminating the selective catalytic reduction efficiency is based on the carbon equivalent emission rate of 2,000 tons per year and the 3.5 million carbon dioxide potential emissions from the combustion turbines {(2,000) / (3,500,000) x (100)} = 0.06 percent; and 3 – The terrestrial ecosystem carbon capture and storage efficiency is based on the average EPA sequestration rate of 1.2 metric tons (1.3 tons) carbon dioxide per acre per year, the proposed project (non refinery) acreage of 1,800 acres, the 16.9 million carbon dioxide potential emissions from the refinery {(1.3 x 1,800) / (16,900,000) x (100)} = 0.01 percent.
Hyperion is proposing to implement the #4 option for the combusting turbines. Hyperion noted Option #3 was technically infeasible due to undemonstrated cost and effectiveness to make a determination. As noted above, DENR considers planting trees or other vegetation as technically feasible. However, DENR considered the estimated greenhouse gas reduction of 0.01% not justifiable to require the non-refining area to be planted with specification vegetation. Hyperion notes that Option #2 should be eliminated due to unacceptable and adverse environmental impacts. Eliminating the selective catalytic reduction system may reduce the production of greenhouse gas emissions but it increases nitrogen oxide emissions, which leads to the formation of nitrogen dioxide. As previously discussed, DENR is placing more emphasis on reducing nitrogen oxide emissions than reducing greenhouse gases. As such, DENR agrees that Option #3 is not BACT. Hyperion notes that Option #1 should be eliminated due to unacceptable and adverse environmental impacts. Hyperion notes that to dry, compress, and transport the approximately 3.5 million tons of greenhouse gases, Hyperion would need approximately 226 megawatts worth of electrical and steam production. As noted on page 8 of Hyperion’s 2007 application, the proposed IGCC system would have a gross electrical output in the range of 450 to 530 megawatts. The carbon capture system requirement of approximately 226 megawatts of electrical and steam production would require approximately 40% of the proposed IGCC power plant. As noted previously, other control systems that have been designated as best available control technology or best available retrofit technology have required approximately a 3% increase in the amount of additional energy. Hyperion notes that Option #1 would increase the emissions of particulate matter less than 2.5 microns by 148 tons per year, nitrogen oxides by 73 tons per year, sulfur dioxide by 42 tons per year, carbon monoxide by 44 tons per year, and volatile organic compounds by 11 tons per year. Table 5-15 compares the current estimated tons per year emissions for the Hyperion facility to the increase of emissions associated with the carbon capture system. Table 5-15 Emission Comparison
Pollutant Hyperion as Proposed 1
Carbon Capture Increase
Percentage Increase

53
PM10 1,001 148 ~ 15% PM2.5 1,001 148 ~ 15% SO2 365 42 ~ 12% NOx 656 73 ~ 11% VOC 406 11 ~ 3% CO 1,860 44 ~ 2%
1 – The proposed estimated emissions are based on the estimated annual emissions noted in the revised Table 1.4-1 of the original application and then updated to take into account the reduction in emissions for the tank farm thermal oxidizer and the proposed changes to the sulfur recovery plant identified in the re-analysis of BACT for the sulfur recovery plant.
As discussed in more detail in the process heater review, increasing the emissions for particulate matter less than or equal to 10 microns, particulate matter less than or equal to 2.5 microns, nitrogen oxides, sulfur dioxide, carbon monoxide, and ozone (volatile organic compounds is a precursor) is considered a greater risk to an ambient air quality standard than increasing greenhouse gas emissions. In addition to the increase in the emissions of criteria pollutants, the energy needed to operate the carbon capture system will also increase carbon dioxide by 0.8 million tons per year. The carbon capture system is being designed to reduce 4.3 million tons of carbon dioxide, which approximately 19 percent of those emissions are generated by operating the control system itself. Hyperion notes that carbon capture system for the combustion turbines would have an estimated annual cost effectiveness of $124 per ton of carbon dioxide sequestered. In reviewing Hyperion’s cost analysis, it appears that the studies referenced are underestimating the cost of these systems. Hyperion estimates that the capital cost of carbon capture system, which is to cover the cost of capturing, compressing, transporting and injecting the carbon dioxide, is approximately $637 million. As discussed in the BACT review for the process heaters, the capital cost for the electrical power plant and pipeline is more likely to cost between $680 million to $820 million. As noted above, DENR considers Hyperion’s cost estimate as underestimating the true cost of a carbon capture system. In reviewing EPA’s October 2010 document titled “Available and Emerging Technologies for Reducing Greenhouse Gas Emissions from the Petroleum Refining Industry”, EPA generally did not specify a $ per ton of carbon dioxide reduced. However, EPA does note on pages 14 through 19 that several of the control measures would see a financial return on the investment due to the improvements in energy efficiency. Based on the data provided, a carbon capture and sequestration system for the Hyperion project will not see a financial return on the capital cost. DENR agrees with Hyperion that carbon capture and sequestration in a geologic formation does not represent Best Available Control Technology for greenhouse gas emissions due to the adverse environmental, energy, and associated cost of the system.

54
Table 5-16 identifies Hyperion’s proposed greenhouse gas BACT for the combustion turbines. Table 5-16 – Proposed GHG BACT Control and Limit for Gas Turbines
Unit Description Proposed Control Proposed Limit #60
through #64
Combined Cycle Gas Turbines
Good Combustion Practices, Oxidation Catalyst, Low Carbon Fuels and Energy Efficient Design
23.9 tons carbon dioxide equivalent per thousand barrels crude charged (annual average)
On February 3, 2010, the Bay Area Air Quality Management District in California issued a PSD permit to the Russell City Energy Company for its combined cycle combustion plant. This permit contained voluntary GHG BACT limits. The Russell City Energy Company project and Hyperion project are not fully comparable because the Russell City Energy Company is limited to burning just natural gas whereas Hyperion’s turbines may burn syngas, pressure swing adsorption tail gas, natural gas, and/or ultra low sulfur distillate oil. The Bay Area Air Quality Management District established limits on an hourly basis, daily basis and annually basis using the typical units of tons per hour, tons per day, and tons per year limitations. The Bay Area Air Quality Management District also established a non typical limit using thermal efficiency with units of Btus per kilowatt hour. The intention of thermal efficiency limit is to maximize the amount of electricity generated per amount of fuel used. The Bay Area Air Quality Management District used an emission factor of 118.9 pounds per million Btus to develop the amount of greenhouse gas emissions while burning natural gas (page 29 of additional statement of basis). Hyperion used the emission factor of 117 pounds per million Btus to develop its amount of greenhouse gas emissions while burning natural gas. Therefore, the emission rate and factors for greenhouse gas for all practical purposes are the same. The reason these numbers are similar in nature is that the amount of carbon dioxide emissions are dependent upon the carbon in the fuel source being burned. The carbon content of natural gas is fairly constant. Generally and historically, the case-by-case BACT limits have been established on an emission unit basis and not as a system or facility wide basis. However, greenhouse gases are not typical air pollutant being reviewed. As discussed in more detail in the process heater review, DENR is proposing a system wide greenhouse gas limit of 23.9 tons carbon dioxide equivalent per thousand barrels crude charged. The averaging time shall be based on a 365-day rolling average with compliance based on carbon dioxide continuous emission monitoring systems. 5.6.5 GHG BACT for Small Combustion Sources

55
Hyperion identified in its application several options for BACT for small combustion sources and identified which options were considered feasible or infeasible. Table 5-17 identifies the BACT options reviewed for the small combustion sources (e.g., flares, emergency generators, fire water pumps, thermal oxidizers, and the gasifier startup burners or as listed as Units #36, #37, #38, #39, #40, #42a, #42b, #50, #51, #52, #53, #54, #55, #56, #57, #58, #65, #66, #67, #68, #69, #70, #175 and #176), and if the options were considered feasible to install. Table 5-17 – GHG Options and Feasibility for Small Combustion Sources
Description BACT Options Feasible Options Small Proper Design Yes Combustion Oxidation Catalyst No Sources Geologic Formations Carbon Capture and
Storage 1. Depleted oil and gas reservoirs 2. Non-mine-able coal seams 3. Saline Formations 4. Basalt Formations
Yes
Terrestrial Ecosystems Carbon Capture and Storage
Yes
DENR reviewed EPA’s October 2010 document titled “Available and Emerging Technologies for Reducing Greenhouse Gas Emissions from the Petroleum Refining Industry”. On page 17 of the document file, EPA notes that for flares that one could consider the following:
1. Flare Gas Recovery – Install flare gas recovery compressor system to recover flare gas to the fuel gas system;
2. Proper Flare Operation – Maintain combustion efficiency of the flare by controlling heating content of flare gas and steam or air-assist rates; and
3. Refrigerated Condensers – Use refrigerated condensers to increase product recovery and reduce excess fuel gas production
Hyperion’s submittal did not specifically identify these options for the flares. However, Hyperion’s design does take into account these items. In regards to the refinery flares, Hyperion is being designed with a sufficient gas flare system (compressor and condenser system) that no flaring will be needed during normal operation of the refinery. The PSD permit for Hyperion does not allow flaring during normal operations, including startup and shutdown of the process units. In regards to the IGCC flare, it was determined during startup and shutdown of the gasifiers it was not technically feasible to collect and burn in the combustion sources all of the produced gas. Therefore, the flare gas recovery system during these periods was not considered technically feasible for the IGCC flare. The PSD permit also requires the refinery flares and IGCC flare to meet the requirements of 40 CFR 60.18, which establish the requirements for proper operation of the flares.

56
Hyperion notes in one portion of its review that an oxidation catalyst is not technically feasible for the small combustion sources. However, in a separate portion of its submittal, Hyperion also notes that the oxidation catalyst would be feasible for application to the gasifier startup burners and emergency engines. Oxidation catalysts need to meet and maintain a minimum temperature requirement for an oxidation catalyst to work effectively. The small combustion sources are intermittent and infrequent operations. Therefore, these sources do not meet the requirement for stable temperatures. In addition, some of the sources such as the gasifier startup burners do not have the optimal temperature for an oxidation catalyst without the use of additional heat. Other sources will be in the presence of sulfur dioxide and/or sulfates which cause excessive corrosion. Therefore, the oxidation catalyst is technically infeasible. Hyperion notes that storing carbon dioxide in geological formation has occurred, therefore, this option is considered technically feasible. However, Hyperion does not identify if any of the geological formations noted are commercial accepting and/or currently prepared to accept and store the carbon dioxide. In researching this concept, DENR determined the noted locations were not actively seeking or even trying to develop an underground storage location. DENR does not fully agree that this is a technologically feasible option at this time. However, DENR will list the technology as technically feasible for the sake of discussion. Hyperion notes due to the undemonstrated cost and effectiveness of terrestrial ecosystems sequestration options, that this option is considered technically infeasible. DENR disagrees with Hyperion and believes it is technically feasible for Hyperion to plant trees or other vegetation to reduce greenhouse gas emissions. DENR ranked the feasible options, which are displayed in Table 5-18. Hyperion notes the proper designs are inherently part of the design of the facility and represent the baseline for control efficiency. Therefore, the baseline control efficiency for these options is listed with a 0% control. Table 5-18 – Top GHG Control Options for Small Combustion Sources
Description Feasible Options Rank Small Combustion Sources Geologic Formations Carbon
Capture and Storage (≥ 90%) 1#1
Terrestrial Ecosystems Carbon Capture and Storage (0.01%) 2
#2
Proper Design (0%) #3 1 – Hyperion notes the geological formation capture and storage would have arbitrary control efficiency of 93%; and 2 – The terrestrial ecosystem carbon capture and storage efficiency is based on the average EPA sequestration rate of 1.2 metric tons (1.3 tons) carbon dioxide per acre per year, the proposed project (non refinery) acreage of 1,800 acres, the 16.9 million carbon dioxide potential emissions from the refinery {(1.3 x 1,800) / (16,900,000) x (100)} = 0.01 percent.

57
Hyperion is proposing to implement the #3 option for the small combustion sources. Hyperion noted Option #2 was technically infeasible due to undemonstrated cost and effectiveness to make a determination. As noted above, DENR considers planting trees or other vegetation as technically feasible. However, DENR considered the estimated greenhouse gas reduction of 0.01% not justifiable to require the non-refining area to be planted with specification vegetation. Hyperion notes that Option #1 should be eliminated due to unacceptable and adverse environmental impacts. Hyperion does not provide specific information but references the carbon capture and sequestration discussion for the process heaters as its basis. In reviewing the carbon capture and sequestration systems for the power island acid gas removal system, process heaters, and the combustion turbines, the same adverse concepts were prevalent such as increasing the emissions of particulate matter less than 10 microns, particulate matter less than 2.5 microns, nitrogen oxides, sulfur dioxide, carbon monoxide, and ozone (volatile organic compounds is a precursor) and the increase of energy use. These issues will arise in implementing this control for small process heaters. In EPA’s October 2010 document titled “Available and Emerging Technologies for Reducing Greenhouse Gas Emissions from the Petroleum Refining Industry”, on page 28 of the document, EPA notes that the “consideration of CO2 capture and control at a refinery would likely be limited to the larger CO2 emitting stacks, such as the FCCU, the fluid coking unit, the hydrogen plant, and large boilers or process heaters.” The small combustion sources contribute less than 0.13% of all the greenhouse gas emissions. DENR agrees with Hyperion that carbon capture and sequestration in a geologic formation does not represent Best Available Control Technology for greenhouse gas emissions due to the adverse environmental, energy, and associated cost of the system. Table 5-19 identifies Hyperion’s proposed greenhouse gas BACT for the small combustion sources. Table 5-19 – Proposed GHG BACT Control and Limit for the small combustion sources
Description Proposed Control Proposed Limit Small Combustion Sources
Proper Design 0.2 tons carbon dioxide equivalent per thousand barrels crude charged (annual average)
Generically, DENR would generally review other permit limits imposed by other facilities and if available performance data conducted under the terms of those permits. However, DENR is not aware of another refinery that has greenhouse gas BACT emission limits established in a permit. Therefore, there is limited performance data to provide a basis that specifies that a lower emission limit is achievable. However, DENR did consider proper design and energy efficiency

58
of operating a refinery as discussed the process heater section. That discussion includes the carbon dioxide emissions associated with the small combustion sources. Generally and historically, the case-by-case BACT limits have been established on an emission unit basis and not as a system or facility wide basis. However, greenhouse gases are not typical air pollutant being reviewed. As discussed in more detail in the process heater review, DENR is proposing a system wide greenhouse gas limit of 0.2 tons carbon dioxide equivalent per thousand barrels crude charged. The averaging time shall be based on a 365-day rolling average with compliance based on emission calculations. Since the small combustion sources constitute a small fraction of the total carbon dioxide emissions and several of the sources operate on an intermittent basis, requiring a carbon dioxide continuous emission monitoring systems on each unit is not justified. Therefore, compliance is recommended to be based on emission calculations using a given emission factor and the amount of fuel burned 5.6.6 GHG BACT for Equipment Leaks Hyperion identified in its application several options for BACT for equipment leaks and identified which options were considered feasible or infeasible. Table 5-20 identifies the BACT options reviewed for the leaking equipment (pumps, valves, pressures relief devices, connectors, agitators, etc), and if the options were considered feasible to install by Hyperion. Table 5-20 – GHG Options and Feasibility for Equipment Leaks
Description BACT Options Feasible Options Equipment Leaks Leak detection and repair program Yes DENR reviewed EPA’s October 2010 document titled “Available and Emerging Technologies for Reducing Greenhouse Gas Emissions from the Petroleum Refining Industry”. On page 17 of the document file, EPA notes under options for fuel gas systems that one could consider a leak and detection program Since there is only one option, the top option is a leak detection and repair program. Table 5-21, identifies the proposed control option, the rank of the control option, and the proposed emission limit. Table 5-21 – Proposed GHG BACT Control and Limit for Equipment Leaks
Description Proposed Control Rank Proposed Limit Equipment Leaks Leak detection and repair
program #1 Work practice and design
requirements DENR agrees that a leak detection and repair program is BACT for fugitive greenhouse gas emissions. Hyperion does not discuss or define what would be considered in greenhouse gas service. As such DENR is proposing that equipment in greenhouse gas service is a piece of equipment that contains a liquid (gas or liquid) that is at least 5 percent by weight of methane.

59
The percent value is based on the percent value deemed to be in organic hazardous air pollutant service as defined in 40 CFR 63.161. In addition, DENR is recommended the existing leak and detection repair program identified in the permit be updated to include greenhouse gases. 6.0 EPA Correspondence On June 11, 2010, Callie Videtich, Director of the Air Quality Program, U.S. EPA Region VIII submitted a letter to Preston Phillips, Vice President for Hyperion (see Attachment B). EPA’s letter identified several questions under eight specific issues involving the Prevention of Significant Deterioration air quality permit issued to Hyperion. 6.1 Issue #1 – Final VOC BACT Limits for Refinery Process Heaters EPA states the volatile organic compound BACT limit for the refinery process heaters were relaxed from the draft permit limit of 0.0015 to a final limit of 0.005 pounds per million Btus in the permit issued by the Board of Minerals and Environment. EPA asked if Hyperion would accept the draft permit limit of 0.0015 pounds per million Btus with the option to relax such limit if and when performance tests confirm the limit is not achievable. DENR disagrees with EPA’s interpretation of the BACT limit being relaxed since the final BACT limit was not decided until DENR had completed the permitting process established in South Dakota’s State Implementation Plan approved by EPA. In the original application, Hyperion did not propose a volatile organic compound emission limit for the process heaters. As noted on page 58 of Hyperion’s December 2007 application, Hyperion determined BACT was good combustion practices and recommended using carbon monoxide as a surrogate emission limit to demonstrate compliance. As noted in DENR’s statement of basis on page 100, DENR agreed BACT for volatile organic compounds was good combustion practices but disagreed that a volatile organic compound emission limit should not be established. DENR identified BACT limits for volatile organic compounds ranged from 0.001 to 0.006 pounds per million Btus for process heaters. DENR proposed a BACT limit for volatile organic compounds of 0.0015 pounds per million Btus determined as carbon. As noted in Hyperion’s comments on page 5 to DENR on its draft volatile organic compound limit, Hyperion specified the 0.0015 pounds of volatile organic compound per million Btus limit was not achievable. In DENR’s response on page 50, DENR identified that “In reviewing stack testing data in South Dakota for new boilers burning natural gas, the volatile organic compound as carbon emission rates in pounds per million Btus ranged from 0.0012 to 0.004 pounds per million Btus. It appears the 0.0015 pounds per million Btu limit while burning natural gas is not achievable. In light of the submitted information, DENR agrees the BACT limit for volatile organic compounds for the process heaters should be 0.005 pounds per million Btus ...”

60
DENR also disagrees with establishing a lower limit in hopes the facility can meet it. This permitting scenario puts both the facility at risk of operating in compliance with its permit and DENR at risk when trying to raise a limit already established in a final permit. The public comment period is designed to receive comments on DENR’s review and draft permit. If there are valid reasons for changing the draft permit, DENR as well as EPA should be open to such changes. DENR followed its permitting process and established the final BACT limits in the PSD air quality permit issued to Hyperion by the Board of Minerals and Environment. Therefore, DENR does not recommend any changes to the volatile organic compound BACT emission limits for process heaters based on EPA’s comment. 6.2 Issue #2 – BACT Analysis for Coker Drum Overhead Steam Vents EPA is concerned with the BACT limit for the coker drum overhead steam vents. The final BACT limit for the coker drum overhead steam vents is a work practice standard limit of 5 pounds per square inch. EPA emphasizes that a work practice standard limit of 2 pounds per square inch is technically feasible even though the May 14, 2007, federal register notice for New Source Performance Standards, Subpart Ja states it is not feasible. EPA references some information that became publicly available after DENR made its final recommendation. For example, EPA references test data for a coker at the HOVENSA refinery. This test was conducted in June 2008, the report was prepared in September 2008 and was posted on EPA’s webpage on December 22, 2008. Hyperion submitted its application in December 2007, DENR public noticed its draft recommendation for Hyperion in September 2008, and DENR made its final recommendation on December 18, 2008. At the time, DENR considered the 5 pounds per square inch was BACT for coke drum steam vents. The technology and emission limits representing BACT changes over time as new information becomes available. Based on the new information as discussed in the re-analysis of BACT for the coke drum steam vents in section 3.12, DENR recommends revising the work practice standard limit from 5 to 2 pounds per square inch gauge pressure for the coke drum steam vents. 6.3 Issue #3 – BACT Analysis for Startup, Shutdown, and Malfunction EPA is asking Hyperion questions on how Hyperion interprets compliance with permit conditions. For example, EPA asks, “EPA is aware that Hyperion’s statement that emissions limitations can have exceptions (Transcript 4, 448:2-448:20). What are such exceptions?” The answer to this question from Hyperion is irrelevant in the fact that Hyperion does not decide if it is in compliance with the permit or not. DENR determines compliance. Therefore, EPA should be asking DENR compliance questions.

61
EPA appears to have concerns there is not a BACT limit covering startup and shutdown periods and the permit exempts startup, shutdown, and malfunction periods from numerical BACT limits. In this case, the questions should be directed to DENR since DENR made the final determination on what the BACT limits are and how to demonstrate compliance. DENR disagrees there is not a numerical limit that covers startup and shutdown period and disagrees the permit exempts startup and shutdown periods from BACT requirements. DENR discussed several items involving startup, shutdown, and malfunctions in its statement of basis such as on page 137 and in its response to comments such as pages 53, and 77 through 82. If you read the definition for BACT in its entirety, the federal regulations give DENR the latitude to determine if BACT is a numerical emission limit or a limit that provides BACT and the method of determining compliance is enforceable in a practical manner. The definition does not state what units a numerical limit must have or what requirements a work practice standard must have. Therefore DENR disagrees with EPA that there is not a numerical limit or a work practice standard that covers startup and shutdown operations in the permit. In the permit (pages 24 and 42), DENR established numerical BACT emission limits for particulate matter and volatile organic compound in pounds per million Btus and pounds per hour emission that applies at all times. However, the compliance methodology for these limits is based on performance test during non-startup and non-shutdown periods and on a startup, shutdown, and malfunction plan for startup and shutdown periods. The reason for the different compliance methods was due to technical issues in conducting a valid performance test during startup and shutdown of the emission units. In the permit (pages 30 and 45), DENR established numerical BACT emission limits for sulfur dioxide and carbon monoxide in pounds per hour that applies at all times. DENR also established numerical BACT emission limits for sulfur dioxide and carbon monoxide in pounds per million Btus that depending on the averaging period included or excluded startup and shutdown periods. The compliance methodology for these emissions limits is based on continuous emission monitoring systems. In the permit (page 36), DENR established numerical BACT emission limits for nitrogen oxide in pounds per million Btus and pounds per hour that exclude and include startup and shutdown periods. The compliance methodology for these emissions limits is based on continuous emission monitoring systems. The averaging periods that cover startup and shutdown periods is based on a 365-day rolling average. At the time the permit was issued, the national ambient air quality standard for nitrogen dioxide was an annual standard. DENR established appropriate BACT limits in the permit that covers startup and shutdown periods. Therefore, DENR does not recommend any changes based on EPA’s comment. DENR will continue to work with EPA on any questions they have on how compliance with the permit is interpreted.

62
6.4 Issue #4 – Detailed Cost Estimates for Refinery Process Heaters EPA has concerns that not enough cost information was provided to justify why a selective catalytic reduction system was not required for nitrogen oxide control for the small process heaters and why the Rectisol and Selexol systems were not required for sulfur dioxide control for the process heaters. As noted in DENR’s response to comments (page 14), DENR disagrees the costs submitted in the application are unsupported. There are several methods in determining if a control technology is cost effective. One method DENR used to determine if Hyperion’s cost estimates were reasonable was to compare it to available documentation related to costs or other applications from similar facilities that evaluated the same type of control technology. Another method DENR uses is to locate a similar type facility to determine if the facility implemented the control technology. If the facility implemented the control technology, then there is some justification the control technology is cost effective under some circumstances. EPA’s comments refers to this concept when it asks why it is cost prohibitive for Hyperion to install a selective catalytic reduction system on the small process heaters when it was cost effective for Arizona Clean Fuels. As discussed in DENR’s statement of basis (page 88), DENR looked at the Arizona Clean Fuels permit and determined large process heaters were required to meet a nitrogen oxide limit of 0.006 pounds per million Btus, which the large process heaters used selective catalytic reduction system to meet while the small process heaters were required to meet a nitrogen oxide limit of 0.025 pounds per million Btus, which the small process heaters used low NOx burners and not a selective catalytic reduction system to meet. The Arizona Clean Fuels permit required selective catalytic reduction system as BACT for nitrogen oxide on process heaters that had the heat input of 101, 122, 129, 192, 222, 322, 346, and 1,435 million Btus per hour, respectively. Arizona did not require selective catalytic reduction system as BACT for nitrogen oxide on process heaters that had a heat input of 21.4, 23.2, 25, 70, 99.5, 99.5, 117, and 211 million Btus per hour, respectively. As such Arizona did not require a selective catalytic reduction system on small process heaters. As noted in DENR’s statement of basis (page 88), DENR did find one permitted small process heater that was required to install a selective catalytic reduction system, which was in the South Coast Air Quality Management District’s permit to Ceneco Refining Company for its Santa Fe Springs Refinery issued on November 17, 2000. As noted in DENR’s response to comments (page 54), Ceneco Refining Company never installed or operated the selective catalytic reduction system. In addition, Ceneco Refining Company went through bankruptcy and did not begin operations again as a refinery. DENR does not believe a PSD air quality permit for a facility that went bankrupt sets precedence or demonstrates the selective catalytic reduction system is a cost effective method for small process heaters. DENR compared the capital, installation, and operating costs identified by Hyperion for the selective catalytic reduction system from California’s BACT determination for a small process
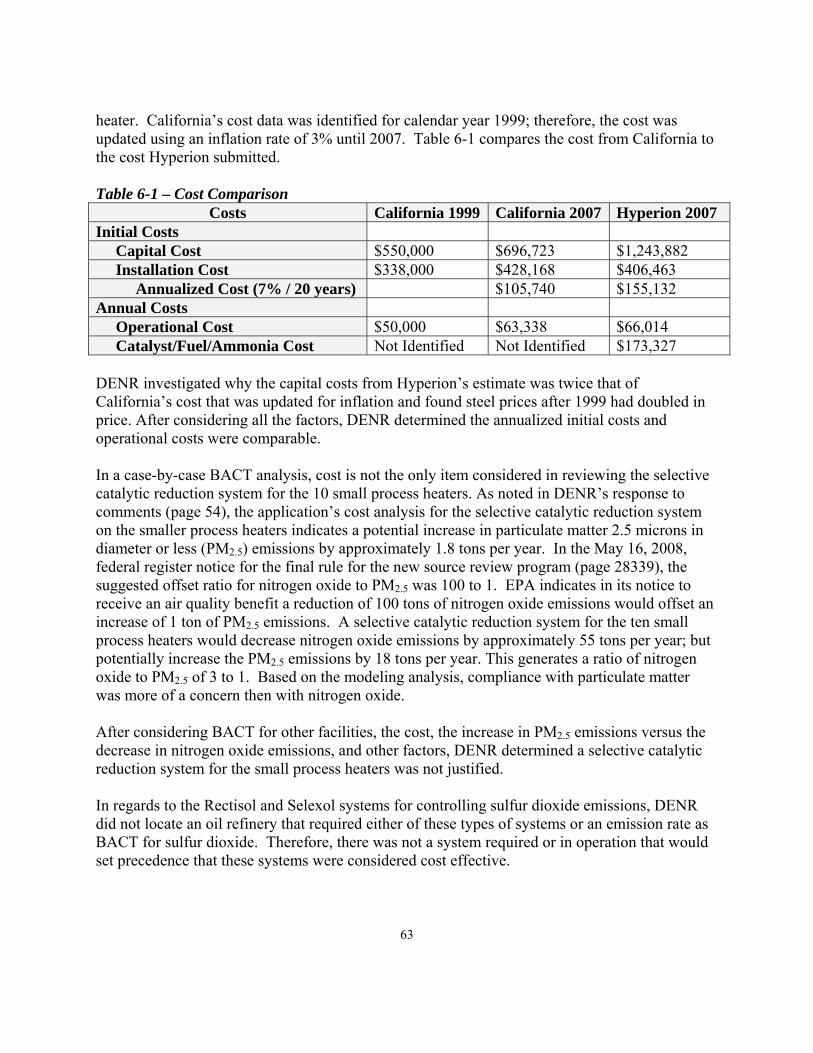
63
heater. California’s cost data was identified for calendar year 1999; therefore, the cost was updated using an inflation rate of 3% until 2007. Table 6-1 compares the cost from California to the cost Hyperion submitted. Table 6-1 – Cost Comparison
Costs California 1999 California 2007 Hyperion 2007 Initial Costs Capital Cost $550,000 $696,723 $1,243,882 Installation Cost $338,000 $428,168 $406,463 Annualized Cost (7% / 20 years) $105,740 $155,132 Annual Costs Operational Cost $50,000 $63,338 $66,014 Catalyst/Fuel/Ammonia Cost Not Identified Not Identified $173,327 DENR investigated why the capital costs from Hyperion’s estimate was twice that of California’s cost that was updated for inflation and found steel prices after 1999 had doubled in price. After considering all the factors, DENR determined the annualized initial costs and operational costs were comparable. In a case-by-case BACT analysis, cost is not the only item considered in reviewing the selective catalytic reduction system for the 10 small process heaters. As noted in DENR’s response to comments (page 54), the application’s cost analysis for the selective catalytic reduction system on the smaller process heaters indicates a potential increase in particulate matter 2.5 microns in diameter or less (PM2.5) emissions by approximately 1.8 tons per year. In the May 16, 2008, federal register notice for the final rule for the new source review program (page 28339), the suggested offset ratio for nitrogen oxide to PM2.5 was 100 to 1. EPA indicates in its notice to receive an air quality benefit a reduction of 100 tons of nitrogen oxide emissions would offset an increase of 1 ton of PM2.5 emissions. A selective catalytic reduction system for the ten small process heaters would decrease nitrogen oxide emissions by approximately 55 tons per year; but potentially increase the PM2.5 emissions by 18 tons per year. This generates a ratio of nitrogen oxide to PM2.5 of 3 to 1. Based on the modeling analysis, compliance with particulate matter was more of a concern then with nitrogen oxide. After considering BACT for other facilities, the cost, the increase in PM2.5 emissions versus the decrease in nitrogen oxide emissions, and other factors, DENR determined a selective catalytic reduction system for the small process heaters was not justified. In regards to the Rectisol and Selexol systems for controlling sulfur dioxide emissions, DENR did not locate an oil refinery that required either of these types of systems or an emission rate as BACT for sulfur dioxide. Therefore, there was not a system required or in operation that would set precedence that these systems were considered cost effective.

64
DENR also compared the costs Hyperion submitted for the Rectisol and Selexol system to the costs for these types of systems at the proposed Integrated Gasification Combined Cycle Systems from Mesaba Energy and Cash Creek. Table 6-2 compares the cost from the two facilities to the cost Hyperion submitted. Table 6-2 – Cost Comparison Mesaba Energy Cash Creek Hyperion Annualized Rectisol Cost Not Available $19,797,825 $9,605,549 Rectisol $ per ton Reduction Not Available $20,524 $56,698 Annualized Selexol Cost $5,000,000 $16,070,591 $3,618,166 Selexol $ per ton Reduction $25,200 $19,715 $29,045 There are differences in the two sets of systems, the Mesaba Energy and Cash Creek systems are removing sulfur compounds from a synthetic gas where as Hyperion is removing sulfur compounds from a refinery gas. The synthetic gas has a heat content of approximately 320 Btus per cubic foot whereas the refinery gas has a heat content of approximately 1,255 Btus per cubic foot. As such, the Mesaba Energy facility is cleaning approximately 17.4 million cubic feet of syngas, the Cash Creek facility is cleaning approximately 23.3 million cubic feet of syngas, and Hyperion’s refinery is cleaning approximately 6.9 million cubic feet of refinery gas. This identifies why the annualized cost of these systems are higher for Mesaba Energy and Cash Creek compared to Hyperion’s The reviews considered different levels of controls for each of the processes, Hyperion noted that the Rectisol system and Selexol systems could achieve emission rates of approximately 0.0005 pounds per million Btus and 0.005 pounds per million Btus, respectively. Whereas, the reviews for Cash Creek considered the Rectisol system and Selexol systems could achieve emission rates of 0.006 and 0.01 pounds per million Btus, respectively and for Mesaba Energy considered the Selexol system could achieve an emission rate of 0.01 pounds per million Btus. Each of the reviews considered a MDEA system as a baseline. Each of the reviews considered different level of achievable emission rates for this baseline system. Hyperion identified an emission rate of 35 parts per million (~ 0.02 pounds per million Btus), whereas the Mesaba Energy identified an emission rate of 50 parts per million (~ 0.026 pounds per million Btus) and Cash Creek identified an emission rate of 0.0436 pounds per million Btus (~ 80 parts per million). Even though Hyperion’s review results in a lower emission rate and BACT requirement, the reviews for Mesaba Energy and Cash Creek note a higher emission reduction which results in a lower effective cost based on dollar per ton of emission reduced. After considering all the factors, the incremental costs for sulfur dioxide reduction using fuel gas cleanup by chemical absorption were comparable. After conducting a case-by-case BACT review, DENR determined fuel cleanup by chemical absorption was BACT and as noted in DENR’s statement of basis (page 75), DENR lowered

65
Hyperion’s proposed BACT emission limit for sulfur dioxide from 35 parts per million to 25 parts per million sulfur in the refinery gas prior to being burned in the process heater. As demonstrated in DENR’s statement of basis and clarified in the response to comments, DENR verified through several methods in determining if the cost estimates Hyperion submitted were reasonable. In some cases we determined they were not and used what DENR believed were reasonable cost estimates in the BACT analysis. DENR does not recommend any changes based on EPA’s comments. 6.5 Issue #5 – Additional Information on Modeling Input Data Since the modeling conducted for particulate matter 10 microns in diameter or less (PM10) was near the standard, EPA is concerned that all of the particulate matter sources at the facility were not considered in the modeling analysis such as unpaved roads, employee vehicles, idling locomotives, and startup and shutdown periods. DENR disagrees with EPA’s request for additional information. The highest modeled PM10 concentration Hyperion modeled was 19.9 micrograms per cubic meter, which is approximately 67% of the 30 microgram per cubic meter increment standard as noted in the original modeling files and DENR’s statement of basis (page 151). The modeled concentration EPA is concerned with occurred in the southeast quadrant of the modeling domain. At this receptor point, Hyperion is a minor contributor. The main contribution was from existing sources as noted in DENR’s statement of basis (page 156). In addition, the PSD regulations do not require vehicle emissions or locomotive idling (train emissions) to be included in the modeling analysis. In accordance with 40 CFR §52.21(k), the owner or operator shall demonstrate the allowable emission increases from the proposed source in conjunction with all other applicable emissions increases or reductions (including secondary emission) would not cause or contribute to air pollution in violation of any national ambient air quality standard or applicable maximum allowable increase over the baseline concentration in any area. In accordance with 40 CFR §52.21(b)(18), secondary emissions are defined as emissions which would occur as a result of the construction or operation of a major stationary source, but do not come from the major stationary source itself. Secondary emissions include emissions from any offsite support facility which would not be constructed or increase its emissions except as a result of the construction or operation of the major stationary source. Secondary emissions do not include any emissions which come directly from a mobile source, such as emissions from the tailpipe of a motor vehicle, from a train, or from a vessel. Hyperion’s permit (page 53) specifies that all roads and parking lots must be paved prior to initial startup of the refinery. Therefore, once operations begin, Hyperion will not have unpaved roads or parking lots. Hyperion’s permit (page 92) specifies that particulate matter must be minimized on the paved roads and parking lots by using a mechanical sweeper, vacuum sweeper

66
or by flushing the road with water. These control measures were not taken into account when the initial modeling was conducted. In regards to startup and shutdown emissions, Hyperion modeled short term emission rates in pounds per hour. As noted in the finalized permit, the pounds per hour limits apply at all times including periods of startup and shutdown. Therefore, the modeling did take into account the emissions that would occur during startup and shutdown. DENR determined that Hyperion conducted appropriate modeling to demonstrate compliance with the National Ambient Air Quality Standards and PSD increments. Therefore, DENR does not recommend any changes based on EPA’s comment. 6.6 Issue #6 – BACT Analysis for Refinery and IGCC Flares EPA is concerned with the BACT limit for the refinery and IGCC flares. EPA indicates its position and policy is startup, shutdown, and malfunction emissions must be strictly prohibited or included in the potential to emit. EPA references its October 16, 2009, Order Responding to Petitioners Request that the Administrator Object to Issuance of State Operating Permit from the EPA Administrator regarding BP Products North America, Inc., Whiting Business Unit Permit #089-25488-00453 and 1999 Excess Emission’s Policy as the basis for its position. DENR agrees emissions during startup and shutdown should be included in the potential to emit and evaluated under the Best Available Control Technology analysis. DENR disagrees with the inclusion of malfunctions in the potential to emit and BACT. DENR’s position is based on the decision in two court cases. The first court case was Alabama Power Company vs. EPA decided December 14, 1979. This case specified the potential to emit must be based on the “design” of the facility. The court ruled the potential to emit would not hypothesize the projected emissions of a facility in absence of air pollution control equipment as suggested by EPA. A source is not designed to operate with equipment that is malfunctioning. The second court case was U.S. vs. Louisiana-Pacific Corporation. This case specifies that “The broad holding of Alabama Power is that potential to emit does not refer to the maximum emissions that can be generated by a source hypothesizing the worst conceivable operation. Rather, the concept contemplates the maximum emissions that can be generated while operating the source as it is intended to be operated and as it is normally operated.” This case also specified that “conditions that are knowingly and regularly violated” should be included in the potential to emit. If a source continual and frequently operates its equipment while it is malfunctioning, then those emissions should be included in the potential to emit. EPA also requested Hyperion justify how it will design sufficient compression to ensure only malfunction emissions will be combusted in the refinery flare and never have a fuel gas imbalance at the refinery that would necessitate the burning of fuel gas in the refinery flares. As Hyperion’s PSD air quality permit specifies, flares used for the refineries may not be operated

67
during normal operation of the facility, including periods of startup and shutdown. The flares may only be operated during a malfunction. The term malfunction is narrowly defined as any sudden and unavoidable failure of air pollution control equipment, process equipment, or a process to operate in a normal or usual manner. A failure caused entirely or in part by poor maintenance, careless operation, preventable equipment breakdown, or any other cause within the control of the owner or operator of the source is not a malfunction. Typically, facilities are able to use designs and information from existing facilities to demonstrate they are able to comply with certain conditions they agree to in their permit. Existing facilities are evaluating there flaring operations and are looking at ways to minimize flaring emissions. Therefore, Hyperion has appropriate data that may be used to design a compression system to capture fuel gas during normal operation, including startup and shutdown and only flare during a malfunction. The permit is crafted to enforce that design. EPA also implies there are no numerical limits associated with the flares outside of the flare minimization plan. DENR disagrees there are no numerical limits associated with the flares. Examples of those numerical limits are as follows: 1. The flares must meet design and operational requirements of 40 CFR §60.18. This section
requires no visible emissions (numerical number), a net heating value requirement (numerical number) and an exit velocity requirement (numerical number);
2. The flares associated with the refinery may only be used when there is a malfunction. That means there will be no emissions (numerical number) due to refinery flaring associated with normal operations, startup, and shutdown; and
3. The flare associated with the integrated gasification combined cycle system may only flare gases that have a sulfur content of 40 parts per million or less (numerical number).
The reason the above requirements were identified is because there is no direct method such as a performance test to demonstrate compliance with a numerical limit for a flare. One of the requirements for conducting a performance test is to locate the probe a specific distance from a disturbance, such as a bend in the stack or the top of the stack. In the case of the flares, one is unable to meet this requirement. In addition, it is not recommended to place a probe into an open flame as that will not meet the requirements of the performance tests. In addition, EPA is concerned with the flare minimization plan not being part of the PSD air quality permit. EPA references two decisions made by the Environmental Appeals Board (RockGen Energy Center and Prairie State Energy) that indicate the flare minimization plan must be part of the PSD permit. DENR disagrees that these Environmental Appeals Board decisions require the finalized plans be included. In the RockGen Energy Center decision, the startup/shutdown plan would allow exceedances of established emission limits and that Wisconsin did not consider the emissions and/or BACT during periods of startup and shutdown. As noted above, the refinery flares are not allowed to be used during startup and shutdown periods. For the IGCC flare, the permit contains several other numerical limits that cover periods of startup and shutdown. The flare minimization plan is in addition to these numerical

68
limits. The RockGen Energy Center makes specific statements in regards to a plan such as it states the “provision authorizing the plan does not specify what conditions might be included in a plan or indicate what criteria the State will use in approving the plan.” In addition, the decision states “the State may also require that once the facility is operational any permit provisions designed to reduce emissions during startup and shutdown be refined overtime so as to increase their efficiency and effectiveness.” Hyperion’s PSD permit requires specific items to be included in the plan, including recordkeeping and reporting requirements. In addition, Hyperion must review the plan on an annual basis and revise it, if appropriate. Both the initial flare minimization plan and revisions are required to be approved by DENR. In the Prairie State Energy case it notes the narrative requirement was in addition to, and not in lieu, of the secondary emission limits and rejected the implied contention that this narrative requirement is the only limit applicable during startup and shutdown. As noted above, there are several numerical limits that apply to the flaring to be conducted at the refinery. As such the plans are not in lieu of numerical limits but an additional requirement. As discussed, DENR believes it is meeting the intentions specified by both the RockGen Energy Center’s decision and the Prairie State Energy decision. The current PSD air quality permit requires Hyperion to operate within the representation in its application, including the modeled emissions from the IGCC flares. In addition, the current permit requires Hyperion to calculate particulate matter, sulfur dioxide, nitrogen oxide, volatile organic compounds, and carbon monoxide emissions from the IGCC flares based on the gas flow, higher heating value of the gas, and sulfur content of the gas. However, the current permit does not specifically list a numerical limit for the IGCC flares. DENR recommends adding numerical limits for the startup and shutdown emissions associated with the IGCC flares which were used in the modeling analysis to demonstrate compliance with the National Ambient Air Quality Standards and PSD increments. Compliance with these emission limits will be based on engineering calculations and data collected as part of the flare minimization plan. The current permit does not allow Hyperion to use the refinery flares during startup or shutdown of the process units. Therefore, DENR does not recommend a numerical limit for the startup and shutdown periods for the refinery flares. 6.7 Issue #7 – BACT Analysis for Coker Quench Tank After the comment period was over and the hearing in front of the Board of Minerals and Environment was concluded, EPA identified the coker quench tank as an emission point of volatile organic compounds, total reduced sulfur, and hydrogen sulfide. On June 23, 2010, South Dakota’s Circuit Court Judge Mark Barnett issued an order requiring the Board of Minerals and Environment take additional evidence under SDCL 1-26-34 on the coker quench tank among other items.

69
On September 18, 2010, RTP Environmental Associates submitted a BACT analysis for the coker quench tank. DENR reviewed this analysis and is proposing revisions to the permit to incorporate the coker quench tank (see Section 3.16). 6.8 Issue #8 – Consideration of Leakless Technology as BACT EPA is concerned that “leakless” technology was not considered in the BACT analysis for process equipment. DENR disagrees that “leakless” technology was not considered during the BACT analysis. The topic was acutely discussed in Hyperion’s application, DENR’s statement of basis starting on page 118, DENR’s response to comments on page 13 and during the Board of Minerals and Environment hearing. One question that arose during the permitting process was what does “leakless” technology mean? As discussed, all valves, pumps, and other process equipment will not be 100% leak free. Valves, pumps, and other process equipment will leak at some given point in time, which means there is no truly leakless process equipment. Once that was determined, the next question is at what concentration is a leak considered “leakless”? DENR considered several EPA regulations to determine what is considered a leak. In 1983, EPA promulgated 40 CFR Part 60 Subpart VV – Standards of Performance for Equipment leaks of VOC in the Synthetic Organic Chemicals Manufacturing Industry for which Construction, Reconstruction, or Modification Commenced after January 5, 1981, and on or before November 7, 2006. This standard established a leak detection level of 10,000 parts per million. This standard required monitoring for a leak and repair of that leak. In 1994, EPA promulgated 40 CFR Part 63, Subpart H – National Emission Standards for Organic Hazardous Air Pollutants for Equipment Leaks. This standard established a tiered leak detection level by phases. In phase I, the leak detection level was 10,000 parts per million and drops in phase III to 500 parts per million for valves and 1,000 parts per million for pumps. This standard also required monitoring for a leak and repair of that leak. In 2007, EPA promulgated 40 CFR Part 60 Subpart VVa – Standards of Performance for Equipment leaks of VOC in the Synthetic Organic Chemicals Manufacturing Industry for which Construction, Reconstruction, or Modification Commenced after November 7, 2006. This standard established a leak detection level of 500 parts per million for valves and 2,000 parts per million for pumps. This standard also required monitoring for a leak and repair of that leak. DENR also considered other state’s rules such as California’s Bay Area Air Management District’s Regulation 8 Rule 18 – Equipment Leaks. This regulation established a leak detection level of 100 parts per million for valves and 500 parts per million for pumps. The rule also required monitoring for a leak and repair of that leak.
70
There were references that “leakless” technology refers to using specific types of equipment such as bellow valves. A bellow valve is designed to minimize one of several leak paths a valve may have. These valves still would have potential leaks paths such as the valve bonnet joint, valve closure element (e.g., seat, disc, gate), valve flanged or threaded connections, valve socket welded or built welded connections, or valve pressure boundary parts (e.g., castings, forgings, bar stock). These types of valves were being designed to meet leak detection levels of 500 parts per million. Based on this information, it appears EPA has defined “leakless” technology as anything less than 500 parts per million and California defines “leakless” as 100 parts per million for valves and 500 parts per million for pumps. Both required a monitoring program to check for leaks and repair any leaks that were found. DENR established “leakless” technology as BACT by establishing 100 parts per million for valves and 500 parts per million for other process equipment as leaks. DENR also required a monthly monitoring program to ensure leaks are discovered and repaired as quickly as possible. DENR does not recommend any changes based on EPA’s comments.
Attachment A
DENR’s Modeling Review

A-1
DENR reviewed Hyperion’s modeling by performing its own AERMOD modeling and comparing the results to Hyperion’s. The AERMOD model is an EPA-approved, steady state, air dispersion model that is designed to estimate downwind concentrations from single or multiple industrial sources. There are three primary preprocessors that are run first before AERMOD model is run to estimate the potential ambient air quality impacts. Those preprocessors are AERMET, AERSURFACE and AERMAP. A.1 AERMET AERMET is the EPA developed meteorological preprocessor for organizing different available meteorological data sets into a format suitable for use in AERMOD. National Weather Service (NWS) hourly surface observations, NWS twice-daily upper air soundings and data collected from a site-specific meteorological measurement program can be processed in AERMET. There are three stages to processing the data. The first stage extracts meteorological data from archive data files and processes the data through various quality assessment checks. The second stage merges all data available for 24-hour periods (NWS and site-specific data) and stores these data together in a single file. The third stage reads the merged meteorological data and estimates the necessary boundary layer parameters used by AERMOD. Two files are written for input into AERMOD: 1) a file of hourly boundary layer parameter estimates; and 2) a file of multiple-level observations of wind speed and direction, temperature, and standard deviation of the fluctuating components of the wind. A.1.1 Upper Air Data The temperature structure of the atmosphere prior to sunrise is required by AERMET to estimate the growth of the convective boundary layer for each day. AERMET uses upper air soundings from the nearest upper air observing station for this purpose. Concurrent data from the National Weather Service upper air station in Omaha, Nebraska for the each modeling scenarios were used by DENR in this analysis. Table A-1 lists the details of the met stations used in the modeling. Table A-1 – Met Station Details
Station WBAN ID
Degrees North
Latitude
Degrees West
Longitude
Elevation(m)
AnemometerHeight
(m)
Time Zone
Union County #1 Not Applicable 42.752 96.707 353 10 6
Sioux Falls Surface Station (KFSD) 14944 43.588 96.730 435 10 6
Sioux City Surface Station (KSUX) 14943 42.391 96.379 334 10 6
Omaha Upper Air Station (KOAX) 94980 41.320 96.366 350 Not
Applicable 6
A-2
A.1.2 Surface Stations DENR operates a meteorological station at the Union County #1 (UC#1) Site that collects wind speed, wind direction, and temperature data approximately 4 miles due south of the proposed facility location. The data period processed was March 31, 2009 through March 31, 2010. The data recovery of wind speed and direction was better than 97%. Isolated periods of missing data where replaced per EPA’s memo, “Procedures for Substituting Values for Missing NWS Meteorological Data for Use in Regulatory Air Quality Models”, Dennis Atkinson and Russell F. Lee, 7/07/92. Extended periods of missing data where augmented with NWS data as described below. Two meteorological scenario data sets were processed by AERMET and modeled for the onsite 2009-2010 data. One set augmented extended periods of missing onsite Union County data and cloud cover data with data from the Sioux City (KSUX) NWS surface station. The other scenario augmented extended periods of missing data and cloud cover data with data from the Sioux Falls (KFSD) National Weather Service surface station. In both cases the data used was derived from the corresponding hour. A.1.3 AERSURFACE AERMET requires input of three surface characteristics: 1) surface roughness length (zo); 2) albedo (r); and 3) Bowen ratio (Bo). Surface roughness length is a factor in the mechanical turbulence or stability of the boundary layer. The daytime Bowen ratio, together with albedo and other meteorological observations, determines boundary layer parameters for convective conditions driven by sensible heat flux. The determination of appropriate albedo, Bowen ratio, and surface roughness lengths for input to AERMET, was identified as an important issue in the implementation of the AERMOD model. The AERSURFACE tool was developed to provide objective and reproducible values of these variables from publicly available data. In AERMET, one can specify monthly variations of three surface characteristics for up to 12 different contiguous non-overlapping wind sectors. These surface characteristics are listed below. Each wind sector can have a unique noon-time albedo, Bowen ratio, and surface roughness value. Values range from less than 0.001 meter over calm water surface to 1 meter or more over a forest or urban area. 1. Noon-time Albedo (r): the fraction of total incoming solar radiation reflected by the surface.
Typical values range from 0.1 for thick forests to almost 1.0 for fresh snow; 2. Bowen Ratio (Bo): the ratio of the sensible heat flux to the latent (evaporative) heat flux;
and 3. Surface Roughness Length (Zo): the height at which the mean horizontal wind speed is
zero. The tool uses national land cover datasets from the U.S. Geological Survey (USGS) National Land Cover Data 1992 archives (NLCD92) and look-up tables of surface characteristics that vary
A-3
by land cover type and season. DENR downloaded and used the South Dakota .tif file available at http://edcftp.cr.usgs.gov/pub/data/landcover/states/. AERSURFACE asks the user to enter the coordinates to be used for the center of the study area site. The AERSURFACE users guide states the center of the study area be the location of the surface station meteorological tower (measurement site). AERSURFACE uses these coordinates to extract land cover data for the area of interest from the NLCD92 data file. Per the guidance cited above, DENR used the surface station coordinates shown in Table A-1. Land cover categories in the NLCD92 data file are linked within AERSURFACE to a set of seasonal surface characteristics. AERSURFACE provides the option of choosing which months belong to which seasonal category for the site specific climate. DENR used the program’s default setting which assigns the months of March, April, and May to seasonal category 5 (“Transitional spring with partial green coverage or short annuals”); June, July, and August to seasonal category 1 (“Midsummer with lush vegetation”); September, October, and November to seasonal category 2 (“Autumn with unharvested cropland”); and December, January, and February to seasonal category 4 (“Winter with continuous snow on ground”). Because the land cover classifications of the NLCD92 data file are applied across the continental U.S., there are instances where the surface characteristic values for two areas of the U.S. may differ, although the land cover type is the same. To address the issue AERSURFACE asks the user to specify three characteristics of the meteorological station where the surface data was recorded. The questions and DENR response for the surface meteorological station explained below: 1. “Is this site at an airport?” If the site is at an airport, AERSURFACE will use surface
characteristics that reflect an area more dominated by transportation land cover. If the user answers “No” to the above question, AERSURFACE will choose higher surface roughness values that are more representative of an area dominated by buildings associated with commercial and industrial land cover. DENR identified the Sioux Falls/Foss Field and Sioux City met stations as being located at airports. The Union County #2 monitoring location is not an airport and is located in a rural area dominated by grasslands and crops. DENR did not identify the Union County met station as an airport;
2. “Is this site in an arid region?” If the user answers “Yes” AERSURFACE uses the seasonal surface characteristics for the Shrubland and Bare Rock/Sand/Clay categories that are more representative of a desert area. The met stations are located in eastern South Dakota, which is not an arid region based on AERSURACE’s listed characteristics. Therefore, DENR identified the region as non-arid for this analysis; and
3. “Characterize the surface moisture condition at the site relative to climatological normal, to be applied for all periods. Enter ‘A’ for Average, ‘W’ for Wet, or ‘D’ for Dry.” The answer to this question affects the value of the Bowen ratio. The surface moisture condition is determined by comparing precipitation for the period of met data to be processed to the 30-year climatological record, selecting “wet” conditions if precipitation is in the upper 30th-percentile, “dry” conditions if precipitation is in the lower 30th-percentile, and “average” conditions if precipitation is in the middle 40th-percentile.The surface moisture condition for the met tower site may vary throughout the data collection period and the current version of

A-4
AERSURFACE applies the user input for surface moisture condition across the entire data period. The AERSURFACE User’s Guide recommends running AERSURFACE multiple times if the surface moisture condition varies significantly across the data period. DENR ran AERMET for each met station under wet, average, and dry conditions to get monthly values of Bowen, Albedo, and surface roughness for each sector. DENR then determined the surface moisture condition for each month of the Union County #1 met data period (April 2009 through March 2010) and each year for the Sioux Falls and Sioux City 5-year data periods by comparing precipitation recorded at the met station for the data period to the 30-year climatological record and input the appropriate value for each month into AERMET to create the surface and profile files for AERMOD. The surface moisture designations are summarized in Table A-2.
Table A-2 – Met Station Moisture Conditions
Met Data Set Average Wet Dry
Sioux Falls 2000 – 2004 2000, 2001, 2002, 2003 2004 NA
Sioux City 2002 -2006 2002, 2003, 2004, 2005, 2006 NA NA
Union County #1 April 2009 – March 2010 (Based on Vermillion weather data – COOP ID 398622)
Apr 09, Jun 09, Aug 09, Sep 09, Feb 10, Mar 10
Jul 09, Oct 09, Dec 09, Jan 10
May 09, Nov 09
The user is given the option of defining the surface roughness length for multiple wind directions, up to a maximum of 12. DENR selected the maximum of 12 sectors or wind directions for this analysis.
4. “Distance from site location for surface roughness length.” The user must enter a distance of 0.1 to 5.0 kilometers from the center of the site location to be used in calculating the effective surface roughness length. AERSURFACE uses this information, along with the coordinates of the center of the study area, to extract a subsection of land cover data from the NLCD92 data file. Based on recommendations in the AERSURFACE User’s Guide published January 2008, DENR used a radius of 1 kilometer in this analysis; and
5. “Does the site experience continuous snow cover in the winter months?” Because the surface characteristics are affected by snow cover, this question is asked of the user to determine whether surface characteristics for continuous snow cover should be used. This option will allow a more state-specific estimate, and in many cases be more reflective of the true nature of the site. According to the National Weather Service monthly climate reports for Vermillion, Sioux Falls, and Sioux City during the 2009 through 2010 snow season indicate the region had continuous snow on the ground through the months of December, January, and February. Therefore, DENR selected “Yes” to this question.
Using the above inputs, DENR ran AERMET to produce the AERMOD ready data sets listed in Table. A-3 displays
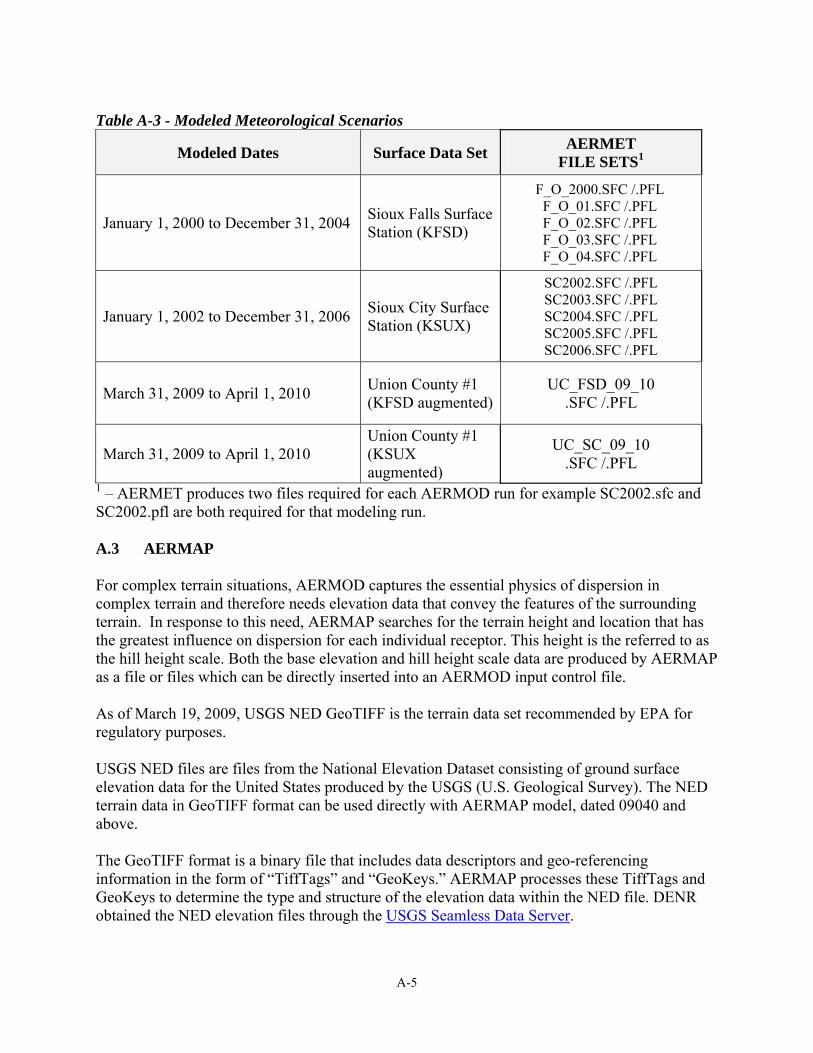
A-5
Table A-3 - Modeled Meteorological Scenarios
Modeled Dates Surface Data Set AERMET FILE SETS1
January 1, 2000 to December 31, 2004 Sioux Falls Surface Station (KFSD)
F_O_2000.SFC /.PFL F_O_01.SFC /.PFL F_O_02.SFC /.PFL F_O_03.SFC /.PFL F_O_04.SFC /.PFL
January 1, 2002 to December 31, 2006 Sioux City Surface Station (KSUX)
SC2002.SFC /.PFL SC2003.SFC /.PFL SC2004.SFC /.PFL SC2005.SFC /.PFL SC2006.SFC /.PFL
March 31, 2009 to April 1, 2010 Union County #1 (KFSD augmented)
UC_FSD_09_10 .SFC /.PFL
March 31, 2009 to April 1, 2010 Union County #1 (KSUX augmented)
UC_SC_09_10 .SFC /.PFL
1 – AERMET produces two files required for each AERMOD run for example SC2002.sfc and SC2002.pfl are both required for that modeling run. A.3 AERMAP For complex terrain situations, AERMOD captures the essential physics of dispersion in complex terrain and therefore needs elevation data that convey the features of the surrounding terrain. In response to this need, AERMAP searches for the terrain height and location that has the greatest influence on dispersion for each individual receptor. This height is the referred to as the hill height scale. Both the base elevation and hill height scale data are produced by AERMAP as a file or files which can be directly inserted into an AERMOD input control file. As of March 19, 2009, USGS NED GeoTIFF is the terrain data set recommended by EPA for regulatory purposes. USGS NED files are files from the National Elevation Dataset consisting of ground surface elevation data for the United States produced by the USGS (U.S. Geological Survey). The NED terrain data in GeoTIFF format can be used directly with AERMAP model, dated 09040 and above. The GeoTIFF format is a binary file that includes data descriptors and geo-referencing information in the form of “TiffTags” and “GeoKeys.” AERMAP processes these TiffTags and GeoKeys to determine the type and structure of the elevation data within the NED file. DENR obtained the NED elevation files through the USGS Seamless Data Server.

A-6
For some modeling runs DENR used Hyperion’s receptor grid, however, in order to optimize efficiency, for other runs DENR used a receptor grid containing 4,075 receptors versus the 9,583 receptors used by Hyperion. DENR placed receptors at 50 meter intervals at the fence line, 100 meter intervals starting 20 meters from the fence line out to 1 kilometer, 500 meter intervals from 1 kilometer to 4 kilometers past the fence line, and 1 kilometer intervals from 4 kilometers out to 8 kilometers past fence line. DENR believes this receptor grid is more than adequate to identify the maximum concentrations and it consumes approximately half the time as the runs using 9,583 receptors. A.4 AERMOD On January 22, 2010, EPA announced a new 1-hour nitrogen dioxide National Ambient Air Quality Standard (NAAQS) of 100 parts per billion (ppb) or 188 micrograms per cubic meter (ug/m3) and on June 2, 2010 announced a new 1-hour sulfur dioxide standard of 75 ppb (196 ug/m3). Compliance with both short-term standards is based on a 3-year average of annual distribution of 1-hour daily maximums (the 98th-percentile (8th highest) for nitrogen dioxide and the 99th-percentile (4th highest) for sulfur dioxide). AERMOD results cannot be directly compared to the NAAQS because of the form of the standard. Several EPA guidance memos were released in spring and summer of 2010 on the required post processing steps to calculate the value for comparison with the NAAQS as follows:
1. Run AERMOD for the selected meteorological data period, retaining hourly concentrations at each receptor for each hour within the modeled period using the hourly POSTFILE option (Note: PLOTFILEs will not provide the required data); 2. From hourly AERMOD POSTFILE (.pst file), for each receptor, determine the maximum 1-hour concentration for each day of the data period; 3. At each receptor, for each year modeled, determine the Nth-highest daily (8th highest for nitrogen dioxide and 4th highest for sulfur dioxide), 1-hour maximum concentration from the distribution of 365 or 366 daily 1-hour maximum concentrations. The 8th highest concentration represents the 98th percentile (nitrogen dioxide) and the 4th highest concentration represents the 99th percentile (sulfur dioxide) concentration from the distribution of daily 1-hour maximum values; 4. At each receptor, average the Nth-highest daily 1-hour maximum concentrations across the modeled years; and 5. The highest of the average Nth-highest concentrations across all receptors, based on the length of the meteorological data period, represents the modeled 1-hour value based on the form of the standards.
In order to streamline the modeling process, DENR used the following tiered approach to analyzing the new 1-hour standards to allow modeling to be done as before and allow for more refined techniques and post processing if needed to demonstrate compliance with the NAAQS. DENR added to the highest monitored nitrogen dioxide and sulfur dioxide concentration measured at the Union County monitors to the average (for each year in met data set) AERMOD predicted highest fourth high modeled sulfur dioxide and highest eighth high modeled nitrogen dioxide values for comparison to the NAAQS. The highest fourth high sulfur dioxide and
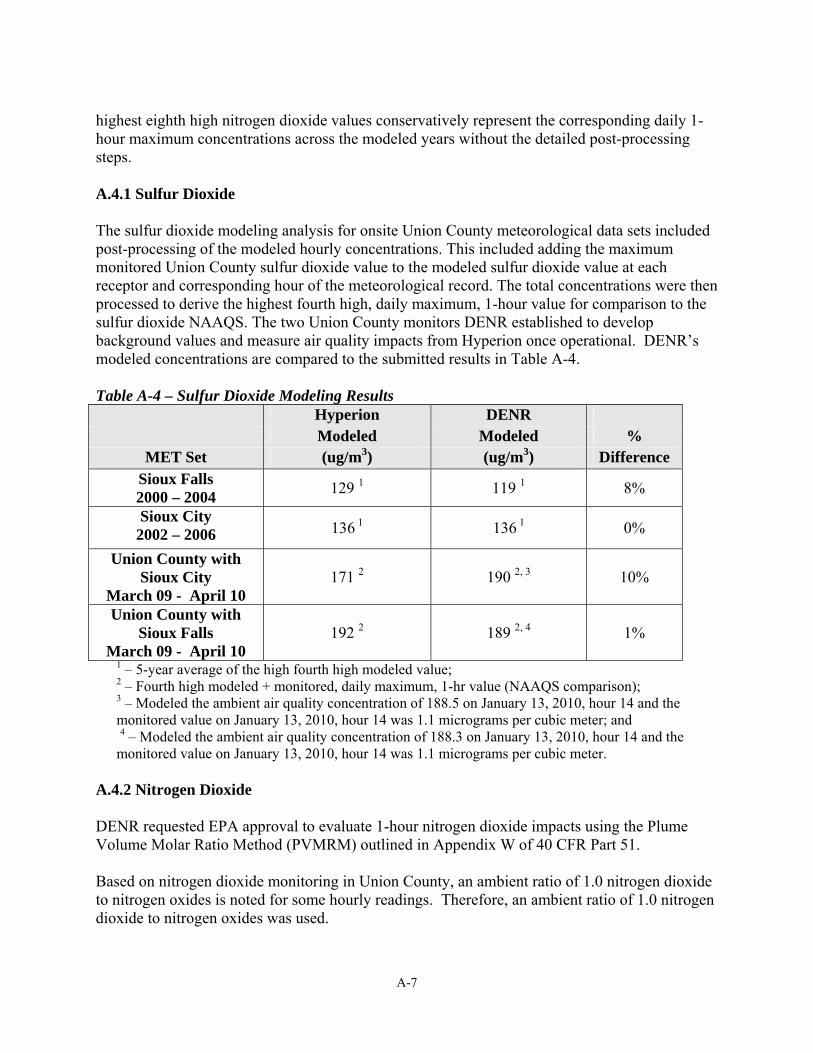
A-7
highest eighth high nitrogen dioxide values conservatively represent the corresponding daily 1-hour maximum concentrations across the modeled years without the detailed post-processing steps. A.4.1 Sulfur Dioxide The sulfur dioxide modeling analysis for onsite Union County meteorological data sets included post-processing of the modeled hourly concentrations. This included adding the maximum monitored Union County sulfur dioxide value to the modeled sulfur dioxide value at each receptor and corresponding hour of the meteorological record. The total concentrations were then processed to derive the highest fourth high, daily maximum, 1-hour value for comparison to the sulfur dioxide NAAQS. The two Union County monitors DENR established to develop background values and measure air quality impacts from Hyperion once operational. DENR’s modeled concentrations are compared to the submitted results in Table A-4. Table A-4 – Sulfur Dioxide Modeling Results
Hyperion DENR Modeled Modeled %
MET Set (ug/m3) (ug/m3) Difference Sioux Falls 2000 – 2004 129 1 119 1 8%
Sioux City 2002 – 2006 136 1 136 1 0%
Union County with Sioux City
March 09 - April 10 171 2 190 2, 3 10%
Union County with Sioux Falls
March 09 - April 10 192 2 189 2, 4 1%
1 – 5-year average of the high fourth high modeled value; 2 – Fourth high modeled + monitored, daily maximum, 1-hr value (NAAQS comparison); 3 – Modeled the ambient air quality concentration of 188.5 on January 13, 2010, hour 14 and the monitored value on January 13, 2010, hour 14 was 1.1 micrograms per cubic meter; and 4 – Modeled the ambient air quality concentration of 188.3 on January 13, 2010, hour 14 and the monitored value on January 13, 2010, hour 14 was 1.1 micrograms per cubic meter.
A.4.2 Nitrogen Dioxide DENR requested EPA approval to evaluate 1-hour nitrogen dioxide impacts using the Plume Volume Molar Ratio Method (PVMRM) outlined in Appendix W of 40 CFR Part 51. Based on nitrogen dioxide monitoring in Union County, an ambient ratio of 1.0 nitrogen dioxide to nitrogen oxides is noted for some hourly readings. Therefore, an ambient ratio of 1.0 nitrogen dioxide to nitrogen oxides was used.

A-8
Ozone data files where created and used in the PVMRM runs as specified in the AERMOD Users Guide. Ozone data for Sioux Falls is being used for the Sioux City Met modeling runs because there is no ozone data available for the Sioux City area. The ozone data from the Hilltop monitoring station in Sioux Falls, South Dakota for calendar years 2000 through 2006 is being used. This ozone data corresponds with the calendar years for the meteorological data sets used in the modeling. Ozone values for calendar years 2002 through 2004 at the Hilltop monitoring station were only collected during the ozone season (May through September). As recommended by EPA, the hourly values monitored for each month in calendar years 2000, 2001, 2005, and 2006 were averaged and the highest monthly average of the four years was used to substitute any missing data strings (a string is more than three consecutive hours) in the corresponding month. Isolated hours of missing data were substituted using the methods in “Procedures for Substituting Values for Missing NWS Meteorological Data for Use in Regulatory Air Quality Models”. An in-stack nitrogen dioxide to nitrogen oxides ratio of 1.0 (conservatively assumes all nitrogen dioxide in exhaust) was used for all sources except the diesel fired generators. For the diesel fired generators, an in-stack nitrogen dioxide to nitrogen oxides ratio of 0.32 was used. This ratio is based on the report “Diesel Exhaust Oxidant Potential Assessed by the NO2/NO Concentration Ratio”. DENR’s modeled concentrations are compared to the submitted results in Table A-5. Table A-5 – Nitrogen Dioxide Modeling Results
Hyperion DENR Modeled Impact Modeled Impact %
MET Set (ug/m3) (ug/m3) Difference Sioux Falls 2000 – 2004
103 1
Source group Generator 3 129 1
Source group Generator 3 20%
Sioux City
2002 – 2006
88 1
Source group Generator 4 851
Source group Generator 3 4%
Union County with Sioux City
March 09 - April 10 132 2, 3 132 2, 3 0%
Union County with Sioux Falls
March 09 - April 10 131 2, 4 131 2, 4 0%
1 – Highest 5-year average of the annual eighth high modeled values for each source group; 2 – Highest eighth high modeled value – Source group G2 (generator 2 operating); 3 – The concentration was modeled on August 18, 2009, hour 6 at receptor point 686,542.40 by 4,743,385.40; and 4 – The concentration was modeled on June 17, 2009, hour 5 at receptor point 686,542.40 by 4,743,385.40.

A-9
A.4.3 Summary of Results The nitrogen dioxide modeling results using the Sioux Falls met data showed the biggest difference between Hyperion’s submitted modeling. As some modeling inputs are based on judgment of the user, slight differences in modeling results are expected. DENR believes the differences are primarily due to a combination of the following: • Receptor Grid: Hyperion placed receptors at 50 meter intervals around the fence line, 100
meters intervals out to approximately 2,500 meters from the fence in all directions, 250 meters intervals from 2,500 meters to 5,000 meters, and 1,000 meters intervals from 5,000 meters to 10,000 meters. For a total receptor count of 9,583, while DENR used 4,075 receptors at the spacing discussed in the AERMAP section above for these runs.
• AERMAP inputs: According to the December 2007 application, Hyperion’s receptor
elevations were obtained from the 30-meter, United States Geological Survey (USGS) 7.5-minute DEM data files. DENR used USGS NED GeoTIFF 1-arc second elevation files obtained through the USGS Seamless Data Server. The resulting hill height plots of each processed terrain set, shown in Figure A-1, show slight differences.
• AERMET inputs: A link to a list of anemometer heights for National Weather Service
stations available from the US Department of Agriculture at the following website: http://www.wcc.nrcs.usda.gov/climate/windrose.html, indicates the Sioux Falls surface station anemometer height was set to 10 meters in 1996. DENR used the 10 meter height in its AERMET processing, while Hyperion processed its data using 6.1 meters.
Regardless of the differences identified, both Hyperion and DENR’s modeling runs indicate that Hyperion’s project will comply with the new 1-hour sulfur dioxide and new 1-hour nitrogen dioxide National Ambient Air Quality Standard.

A-10
Figure A-1 - AERMAP produced Hill Heights: DENR’s Modeling
Hyperion’s Modeling