Embed Size (px)
Citation preview

.06
Motorola, Inc. 2006 Annual Report

Motorola is known around the world for innovation and leadership in wireless and broadband communications.Inspired by our vision of Seamless Mobility, the people of Motorola are committed to helping you get and stayconnected simply and seamlessly to the people, information, and entertainment that you want and need. Wedo this by designing and delivering “must have” products, “must do” experiences and powerful networks – along with a full complement of support services. A Fortune 100 company with global presence and impact,Motorola had sales of US $42.9 billion in 2006. For more information about our company, our people and ourinnovations, please visit www.motorola.com.

March 2007
Dear fellow stockholders,
2006 was a year of progress and challenges for Motorola. It was a year in which we achievednew highs in sales and shipments and added substantial talent and intellectual property.However, while our Networks & Enterprise and Connected Home Solutions businesses Ñnished2006 strong, we were disappointed that our Mobile Devices business did not meet expectationsin the latter half of the year.
We remain conÑdent in our vision of seamless mobility Ó building simple and seamlessconnections to people, information, and entertainment Ó and the opportunity it brings to ourbusiness. As we focus on proÑtable growth and more selective pursuit of market share, we willcontinue to make investments for the future of Motorola.
2006 Ì Overview
In 2006, sales grew 22% to a record $42.9 billion Ó the third consecutive year of double-digitrevenue growth. Net earnings were $3.7 billion, or 8.5% of sales. We generated operating cashÖow of $3.5 billion, and maintained a strong balance sheet. We shipped a record 217 millionhandsets, had a record year in public safety, and a record year in digital entertainment devices.
Additionally last year, we:
‚ Shipped our 75 millionth MOTORAZRTM and our 50 millionth digital video set-top.
‚ Launched Öagship stores and retail outlets throughout Asia, Latin America and parts of Europe,including more than 150 in China.
‚ Sharpened our focus on our core markets by divesting our automotive electronics business andmerging our networks and public safety businesses.
‚ Increased brand value by 18% according to an Interbrand survey.
We completed a $4 billion common stock repurchase program and authorized another program torepurchase an additional $4.5 billion. We increased our dividend by 25%, and have now paid ourshareholders a dividend for 239 consecutive quarters.
We continue to operate ethically and support critical community needs. This past October, morethan 9,000 employees in 75 cities in 40 countries gave their time, talent and energy to theircommunities during our Ñrst Global Day of Service.
Investing for the Future
In 2006, we made several investments that will drive future growth for this company:
Wireless Broadband Ó As a leading proponent of the mobile Internet, Motorola is well-positionedto capitalize on the potential of WiMAX, the next generation wireless broadband technology.
continued Ó

We're pleased to be engaged in over 20 trials globally with this advanced solution, and to haveinvested in leading technologies:
‚ Motorola Ventures invested $300 million in Clearwire, a high-speed wireless broadbandservices provider.
‚ NextNet Wireless adds leading non-line-of-sight wireless broadband infrastructure equipment toour portfolio.
Enterprise Mobility Ó We are focused on extending mobility beyond the traditional oÇceenvironment Ó out into the Ñeld, in the factory, at retail locations and across the supply chain. Ourtwo recent acquisitions enable us to take a leadership position in this growing opportunity.
‚ Symbol Technologies joined Motorola in January 2007 in the second-largest acquisition in ourhistory. Symbol is an innovator whose world-class product portfolio, intellectual property andvertical market expertise strengthens our presence in the burgeoning enterprise mobilitymarket.
‚ Good Technology joined Motorola in January 2007 and extends our mobile computingcapabilities and enterprise client base through wireless messaging, data access and handheldsecurity oÅerings.
Internet Protocol TV (IPTV) Ó We are an early leader in the emerging opportunity for productsfor providers of IP-based video entertainment, having already shipped close to 1 million set-topsworldwide. We have also invested in key technologies that will bring our leading video deliveryexpertise to this area.
‚ Kreatel AG gives us IP set-tops with features and functions that address the needs of telecomservice providers worldwide.
‚ Netopia, Inc. extends our home gateway portfolio with products and technologies that delivertriple-play services to virtually any connected device in the home.
‚ Broadbus Technologies brings new capabilities that address the emerging content-on-demandmarketplace.
Today, Motorola serves the right markets with the right assets, brand, and intellectual property.Yet these markets are highly competitive and subject to rapid change. We are committed tomeeting the challenges ahead, making the right investments, and executing more consistentlywhile increasing our proÑtability and shareholder value.
Ed Zander
Chairman and CEO
Motorola, Inc.

MOTOROLA, INC.2006
FORM 10-K

(This page intentionally left blank)

UNITED STATESSECURITIES AND EXCHANGE COMMISSION
Washington, D.C. 20549
FORM 10-K
¥ ANNUAL REPORT PURSUANT TO SECTION 13 OR 15(d) OF THE SECURITIESEXCHANGE ACT OF 1934
For the fiscal year ended December 31, 2006or
n TRANSITION REPORT PURSUANT TO SECTION 13 OR 15(d) OF THE SECURITIESEXCHANGE ACT OF 1934
For the transition period from to
Commission File number 1-7221
MOTOROLA, INC.(Exact name of registrant as specified in its charter)
DELAWARE 36-1115800(State of Incorporation) (I.R.S. Employer Identification No.)
1303 East Algonquin Road, Schaumburg, Illinois 60196(Address of principal executive offices)
(847) 576-5000(Registrant's telephone number)
Securities registered pursuant to Section 12(b) of the Act:Title of Each Class Name of Each Exchange on Which Registered
Common Stock, $3 Par Value per Share New York Stock ExchangeChicago Stock Exchange
Securities registered pursuant to Section 12(g) of the Act:None
Indicate by check mark if the registrant is a well-known seasoned issuer, as defined in Rule 405 of the Securities Act. Yes ¥ No n
Indicate by check mark if the registrant is not required to file reports pursuant to Section 13 or 15(d) of the Securities Exchange Act of1934. Yes n No ¥
Indicate by check mark whether the registrant (1) has filed all reports required to be filed by Section 13 or 15(d) of the Securities Exchange Act of1934 during the preceding 12 months (or for such shorter period that the registrant was required to file such reports), and (2) has been subject to suchfiling requirements for the past 90 days. Yes ¥ No n
Indicate by check mark if disclosure of delinquent filers pursuant to Item 405 of Regulation S-K is not contained herein, and will not be contained, tothe best of registrant's knowledge, in definitive proxy or information statements incorporated by reference in Part III of this Form 10-K or any amendmentto this Form 10-K. n
Indicate by check mark whether the registrant is a large accelerated filer, an accelerated filer, or a non-accelerated filer. See definition of ""acceleratedfiler and large accelerated filer'' in Rule 12b-2 of the Exchange Act.
Large accelerated filer ¥ Accelerated filer n Non-accelerated filer n
Indicate by check mark whether the registrant is a shell company (as defined in Rule 12b-2 of the Exchange Act). Yes n No ¥
The aggregate market value of voting and non-voting common equity held by non-affiliates of the registrant as of July 1, 2006 (the last business dayof the Registrant's most recently completed second quarter) was approximately $49.2 billion (based on closing sale price of $20.15 per share as reportedfor the New York Stock Exchange-Composite Transactions).
The number of shares of the registrant's Common Stock, $3 par value per share, outstanding as of January 31, 2007 was 2,390,406,528.
DOCUMENTS INCORPORATED BY REFERENCEPortions of the registrant's definitive Proxy Statement to be delivered to stockholders in connection with its Annual Meeting of Stockholders, which
Proxy Statement will be filed no later than April 30, 2007, are incorporated by reference into Part III.
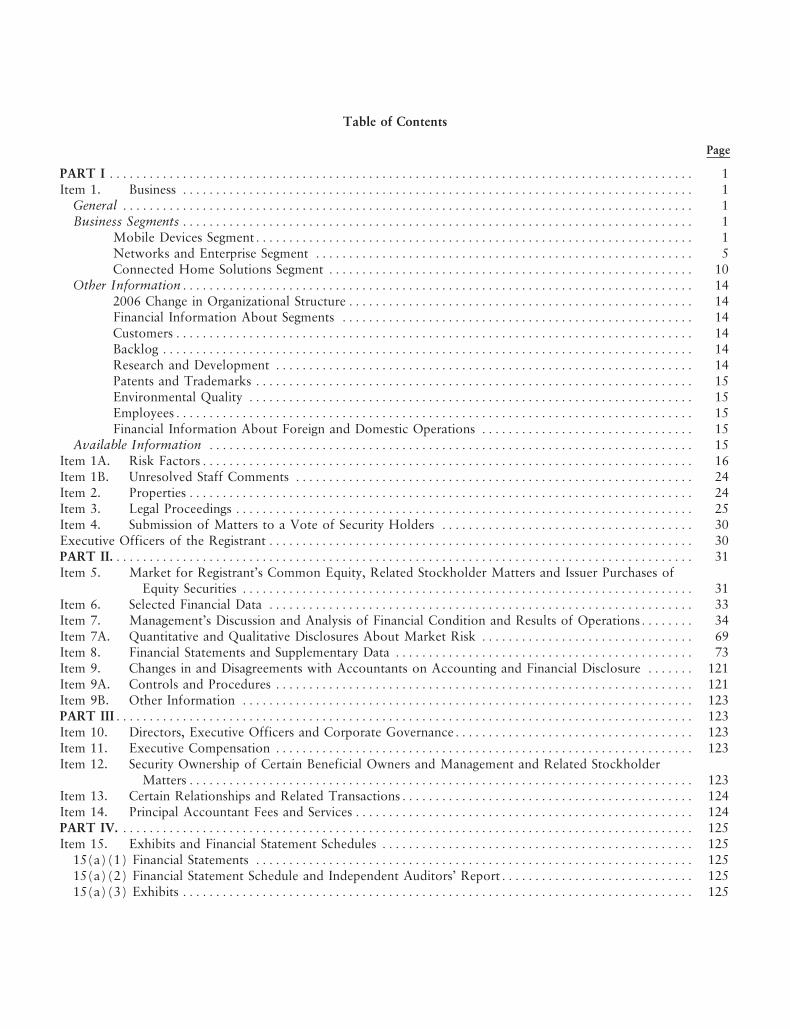
Table of Contents
Page
PART I ÏÏÏÏÏÏÏÏÏÏÏÏÏÏÏÏÏÏÏÏÏÏÏÏÏÏÏÏÏÏÏÏÏÏÏÏÏÏÏÏÏÏÏÏÏÏÏÏÏÏÏÏÏÏÏÏÏÏÏÏÏÏÏÏÏÏÏÏÏÏÏÏÏÏÏÏÏÏÏÏÏÏÏÏÏÏÏÏ 1Item 1. Business ÏÏÏÏÏÏÏÏÏÏÏÏÏÏÏÏÏÏÏÏÏÏÏÏÏÏÏÏÏÏÏÏÏÏÏÏÏÏÏÏÏÏÏÏÏÏÏÏÏÏÏÏÏÏÏÏÏÏÏÏÏÏÏÏÏÏÏÏÏÏÏÏÏÏÏÏÏ 1
General ÏÏÏÏÏÏÏÏÏÏÏÏÏÏÏÏÏÏÏÏÏÏÏÏÏÏÏÏÏÏÏÏÏÏÏÏÏÏÏÏÏÏÏÏÏÏÏÏÏÏÏÏÏÏÏÏÏÏÏÏÏÏÏÏÏÏÏÏÏÏÏÏÏÏÏÏÏÏÏÏÏÏÏÏÏÏ 1Business Segments ÏÏÏÏÏÏÏÏÏÏÏÏÏÏÏÏÏÏÏÏÏÏÏÏÏÏÏÏÏÏÏÏÏÏÏÏÏÏÏÏÏÏÏÏÏÏÏÏÏÏÏÏÏÏÏÏÏÏÏÏÏÏÏÏÏÏÏÏÏÏÏÏÏÏÏÏÏ 1
Mobile Devices SegmentÏÏÏÏÏÏÏÏÏÏÏÏÏÏÏÏÏÏÏÏÏÏÏÏÏÏÏÏÏÏÏÏÏÏÏÏÏÏÏÏÏÏÏÏÏÏÏÏÏÏÏÏÏÏÏÏÏÏÏÏÏÏÏÏÏÏ 1Networks and Enterprise Segment ÏÏÏÏÏÏÏÏÏÏÏÏÏÏÏÏÏÏÏÏÏÏÏÏÏÏÏÏÏÏÏÏÏÏÏÏÏÏÏÏÏÏÏÏÏÏÏÏÏÏÏÏÏÏÏÏÏ 5Connected Home Solutions Segment ÏÏÏÏÏÏÏÏÏÏÏÏÏÏÏÏÏÏÏÏÏÏÏÏÏÏÏÏÏÏÏÏÏÏÏÏÏÏÏÏÏÏÏÏÏÏÏÏÏÏÏÏÏÏÏ 10
Other InformationÏÏÏÏÏÏÏÏÏÏÏÏÏÏÏÏÏÏÏÏÏÏÏÏÏÏÏÏÏÏÏÏÏÏÏÏÏÏÏÏÏÏÏÏÏÏÏÏÏÏÏÏÏÏÏÏÏÏÏÏÏÏÏÏÏÏÏÏÏÏÏÏÏÏÏÏÏ 142006 Change in Organizational StructureÏÏÏÏÏÏÏÏÏÏÏÏÏÏÏÏÏÏÏÏÏÏÏÏÏÏÏÏÏÏÏÏÏÏÏÏÏÏÏÏÏÏÏÏÏÏÏÏÏÏÏÏ 14Financial Information About Segments ÏÏÏÏÏÏÏÏÏÏÏÏÏÏÏÏÏÏÏÏÏÏÏÏÏÏÏÏÏÏÏÏÏÏÏÏÏÏÏÏÏÏÏÏÏÏÏÏÏÏÏÏÏ 14CustomersÏÏÏÏÏÏÏÏÏÏÏÏÏÏÏÏÏÏÏÏÏÏÏÏÏÏÏÏÏÏÏÏÏÏÏÏÏÏÏÏÏÏÏÏÏÏÏÏÏÏÏÏÏÏÏÏÏÏÏÏÏÏÏÏÏÏÏÏÏÏÏÏÏÏÏÏÏÏ 14Backlog ÏÏÏÏÏÏÏÏÏÏÏÏÏÏÏÏÏÏÏÏÏÏÏÏÏÏÏÏÏÏÏÏÏÏÏÏÏÏÏÏÏÏÏÏÏÏÏÏÏÏÏÏÏÏÏÏÏÏÏÏÏÏÏÏÏÏÏÏÏÏÏÏÏÏÏÏÏÏÏÏ 14Research and Development ÏÏÏÏÏÏÏÏÏÏÏÏÏÏÏÏÏÏÏÏÏÏÏÏÏÏÏÏÏÏÏÏÏÏÏÏÏÏÏÏÏÏÏÏÏÏÏÏÏÏÏÏÏÏÏÏÏÏÏÏÏÏÏ 14Patents and Trademarks ÏÏÏÏÏÏÏÏÏÏÏÏÏÏÏÏÏÏÏÏÏÏÏÏÏÏÏÏÏÏÏÏÏÏÏÏÏÏÏÏÏÏÏÏÏÏÏÏÏÏÏÏÏÏÏÏÏÏÏÏÏÏÏÏÏÏ 15Environmental Quality ÏÏÏÏÏÏÏÏÏÏÏÏÏÏÏÏÏÏÏÏÏÏÏÏÏÏÏÏÏÏÏÏÏÏÏÏÏÏÏÏÏÏÏÏÏÏÏÏÏÏÏÏÏÏÏÏÏÏÏÏÏÏÏÏÏÏÏ 15EmployeesÏÏÏÏÏÏÏÏÏÏÏÏÏÏÏÏÏÏÏÏÏÏÏÏÏÏÏÏÏÏÏÏÏÏÏÏÏÏÏÏÏÏÏÏÏÏÏÏÏÏÏÏÏÏÏÏÏÏÏÏÏÏÏÏÏÏÏÏÏÏÏÏÏÏÏÏÏÏ 15Financial Information About Foreign and Domestic Operations ÏÏÏÏÏÏÏÏÏÏÏÏÏÏÏÏÏÏÏÏÏÏÏÏÏÏÏÏÏÏÏÏ 15
Available Information ÏÏÏÏÏÏÏÏÏÏÏÏÏÏÏÏÏÏÏÏÏÏÏÏÏÏÏÏÏÏÏÏÏÏÏÏÏÏÏÏÏÏÏÏÏÏÏÏÏÏÏÏÏÏÏÏÏÏÏÏÏÏÏÏÏÏÏÏÏÏÏÏÏ 15Item 1A. Risk FactorsÏÏÏÏÏÏÏÏÏÏÏÏÏÏÏÏÏÏÏÏÏÏÏÏÏÏÏÏÏÏÏÏÏÏÏÏÏÏÏÏÏÏÏÏÏÏÏÏÏÏÏÏÏÏÏÏÏÏÏÏÏÏÏÏÏÏÏÏÏÏÏÏÏÏ 16Item 1B. Unresolved Staff Comments ÏÏÏÏÏÏÏÏÏÏÏÏÏÏÏÏÏÏÏÏÏÏÏÏÏÏÏÏÏÏÏÏÏÏÏÏÏÏÏÏÏÏÏÏÏÏÏÏÏÏÏÏÏÏÏÏÏÏÏÏ 24Item 2. Properties ÏÏÏÏÏÏÏÏÏÏÏÏÏÏÏÏÏÏÏÏÏÏÏÏÏÏÏÏÏÏÏÏÏÏÏÏÏÏÏÏÏÏÏÏÏÏÏÏÏÏÏÏÏÏÏÏÏÏÏÏÏÏÏÏÏÏÏÏÏÏÏÏÏÏÏÏ 24Item 3. Legal Proceedings ÏÏÏÏÏÏÏÏÏÏÏÏÏÏÏÏÏÏÏÏÏÏÏÏÏÏÏÏÏÏÏÏÏÏÏÏÏÏÏÏÏÏÏÏÏÏÏÏÏÏÏÏÏÏÏÏÏÏÏÏÏÏÏÏÏÏÏÏÏ 25Item 4. Submission of Matters to a Vote of Security Holders ÏÏÏÏÏÏÏÏÏÏÏÏÏÏÏÏÏÏÏÏÏÏÏÏÏÏÏÏÏÏÏÏÏÏÏÏÏÏ 30Executive Officers of the Registrant ÏÏÏÏÏÏÏÏÏÏÏÏÏÏÏÏÏÏÏÏÏÏÏÏÏÏÏÏÏÏÏÏÏÏÏÏÏÏÏÏÏÏÏÏÏÏÏÏÏÏÏÏÏÏÏÏÏÏÏÏÏÏÏÏ 30PART II.ÏÏÏÏÏÏÏÏÏÏÏÏÏÏÏÏÏÏÏÏÏÏÏÏÏÏÏÏÏÏÏÏÏÏÏÏÏÏÏÏÏÏÏÏÏÏÏÏÏÏÏÏÏÏÏÏÏÏÏÏÏÏÏÏÏÏÏÏÏÏÏÏÏÏÏÏÏÏÏÏÏÏÏÏÏÏÏ 31Item 5. Market for Registrant's Common Equity, Related Stockholder Matters and Issuer Purchases of
Equity Securities ÏÏÏÏÏÏÏÏÏÏÏÏÏÏÏÏÏÏÏÏÏÏÏÏÏÏÏÏÏÏÏÏÏÏÏÏÏÏÏÏÏÏÏÏÏÏÏÏÏÏÏÏÏÏÏÏÏÏÏÏÏÏÏÏÏÏÏÏ 31Item 6. Selected Financial Data ÏÏÏÏÏÏÏÏÏÏÏÏÏÏÏÏÏÏÏÏÏÏÏÏÏÏÏÏÏÏÏÏÏÏÏÏÏÏÏÏÏÏÏÏÏÏÏÏÏÏÏÏÏÏÏÏÏÏÏÏÏÏÏÏ 33Item 7. Management's Discussion and Analysis of Financial Condition and Results of OperationsÏÏÏÏÏÏÏÏ 34Item 7A. Quantitative and Qualitative Disclosures About Market Risk ÏÏÏÏÏÏÏÏÏÏÏÏÏÏÏÏÏÏÏÏÏÏÏÏÏÏÏÏÏÏÏÏ 69Item 8. Financial Statements and Supplementary Data ÏÏÏÏÏÏÏÏÏÏÏÏÏÏÏÏÏÏÏÏÏÏÏÏÏÏÏÏÏÏÏÏÏÏÏÏÏÏÏÏÏÏÏÏÏ 73Item 9. Changes in and Disagreements with Accountants on Accounting and Financial Disclosure ÏÏÏÏÏÏÏ 121Item 9A. Controls and Procedures ÏÏÏÏÏÏÏÏÏÏÏÏÏÏÏÏÏÏÏÏÏÏÏÏÏÏÏÏÏÏÏÏÏÏÏÏÏÏÏÏÏÏÏÏÏÏÏÏÏÏÏÏÏÏÏÏÏÏÏÏÏÏÏ 121Item 9B. Other Information ÏÏÏÏÏÏÏÏÏÏÏÏÏÏÏÏÏÏÏÏÏÏÏÏÏÏÏÏÏÏÏÏÏÏÏÏÏÏÏÏÏÏÏÏÏÏÏÏÏÏÏÏÏÏÏÏÏÏÏÏÏÏÏÏÏÏÏÏ 123PART IIIÏÏÏÏÏÏÏÏÏÏÏÏÏÏÏÏÏÏÏÏÏÏÏÏÏÏÏÏÏÏÏÏÏÏÏÏÏÏÏÏÏÏÏÏÏÏÏÏÏÏÏÏÏÏÏÏÏÏÏÏÏÏÏÏÏÏÏÏÏÏÏÏÏÏÏÏÏÏÏÏÏÏÏÏÏÏÏ 123Item 10. Directors, Executive Officers and Corporate GovernanceÏÏÏÏÏÏÏÏÏÏÏÏÏÏÏÏÏÏÏÏÏÏÏÏÏÏÏÏÏÏÏÏÏÏÏÏ 123Item 11. Executive Compensation ÏÏÏÏÏÏÏÏÏÏÏÏÏÏÏÏÏÏÏÏÏÏÏÏÏÏÏÏÏÏÏÏÏÏÏÏÏÏÏÏÏÏÏÏÏÏÏÏÏÏÏÏÏÏÏÏÏÏÏÏÏÏÏ 123Item 12. Security Ownership of Certain Beneficial Owners and Management and Related Stockholder
MattersÏÏÏÏÏÏÏÏÏÏÏÏÏÏÏÏÏÏÏÏÏÏÏÏÏÏÏÏÏÏÏÏÏÏÏÏÏÏÏÏÏÏÏÏÏÏÏÏÏÏÏÏÏÏÏÏÏÏÏÏÏÏÏÏÏÏÏÏÏÏÏÏÏÏÏÏ 123Item 13. Certain Relationships and Related TransactionsÏÏÏÏÏÏÏÏÏÏÏÏÏÏÏÏÏÏÏÏÏÏÏÏÏÏÏÏÏÏÏÏÏÏÏÏÏÏÏÏÏÏÏÏ 124Item 14. Principal Accountant Fees and Services ÏÏÏÏÏÏÏÏÏÏÏÏÏÏÏÏÏÏÏÏÏÏÏÏÏÏÏÏÏÏÏÏÏÏÏÏÏÏÏÏÏÏÏÏÏÏÏÏÏÏÏ 124PART IV. ÏÏÏÏÏÏÏÏÏÏÏÏÏÏÏÏÏÏÏÏÏÏÏÏÏÏÏÏÏÏÏÏÏÏÏÏÏÏÏÏÏÏÏÏÏÏÏÏÏÏÏÏÏÏÏÏÏÏÏÏÏÏÏÏÏÏÏÏÏÏÏÏÏÏÏÏÏÏÏÏÏÏÏÏÏÏ 125Item 15. Exhibits and Financial Statement Schedules ÏÏÏÏÏÏÏÏÏÏÏÏÏÏÏÏÏÏÏÏÏÏÏÏÏÏÏÏÏÏÏÏÏÏÏÏÏÏÏÏÏÏÏÏÏÏÏ 125
15(a)(1) Financial Statements ÏÏÏÏÏÏÏÏÏÏÏÏÏÏÏÏÏÏÏÏÏÏÏÏÏÏÏÏÏÏÏÏÏÏÏÏÏÏÏÏÏÏÏÏÏÏÏÏÏÏÏÏÏÏÏÏÏÏÏÏÏÏÏÏÏÏ 12515(a)(2) Financial Statement Schedule and Independent Auditors' ReportÏÏÏÏÏÏÏÏÏÏÏÏÏÏÏÏÏÏÏÏÏÏÏÏÏÏÏÏÏ 12515(a)(3) Exhibits ÏÏÏÏÏÏÏÏÏÏÏÏÏÏÏÏÏÏÏÏÏÏÏÏÏÏÏÏÏÏÏÏÏÏÏÏÏÏÏÏÏÏÏÏÏÏÏÏÏÏÏÏÏÏÏÏÏÏÏÏÏÏÏÏÏÏÏÏÏÏÏÏÏÏÏÏÏ 125

1
PART I
Throughout this 10-K report we ""incorporate by reference'' certain information in parts of other documentsfiled with the Securities and Exchange Commission (the ""SEC''). The SEC allows us to disclose importantinformation by referring to it in that manner. Please refer to such information.
We are making forward-looking statements in this report. In ""Item 1A: Risk Factors'' we discuss some of therisk factors that could cause actual results to differ materially from those stated in the forward-looking statements.
""Motorola'' (which may be referred to as the ""Company,'' ""we,'' ""us,'' or ""our'') means Motorola, Inc. orMotorola, Inc. and its subsidiaries, or one of our segments, as the context requires. ""Motorola'' is a registeredtrademark of Motorola, Inc.
Item 1: Business
General
We build, market and sell products, services and applications that make simple and seamless connections topeople, information and entertainment possible through broadband, embedded systems and wireless networks. Ourvision is to provide cutting-edge technologies that empower mobile consumers to go anywhere and do anythingwithout sacrificing connectivity. This is seamless mobility.
Motorola is a market leader in the following businesses:
‚ Mobile Devices: We are one of the world's premier providers of wireless handsets, which transmit andreceive voice, text, images, multimedia and other forms of information, communication and entertainment.
‚ Networks and Enterprise: We are a leading provider of wireless communications systems and services forgovernment, enterprise and commercial mobile service providers around the world. We deliver high-availability network infrastructure systems to commercial mobile service providers and mission-criticalend-to-end wireless communications networks, primarily for the government and public safety markets.Through our recent acquisition of Symbol Technologies, Inc. coupled with our existing enterprise productportfolio, we will deliver leading-edge mobile computing, mobile office and enterprise wireless local accessnetwork solutions. We are also an industry leader in the development of next-generation IP wirelessbroadband mobility technologies, offering an entire suite of end-to-end WiMAX infrastructure and customerpremises equipment products. In addition, we offer a family of point-to-point and point-to-multipointwireless broadband products to serve WiFi and wireless DSL operators.
‚ Connected Home: We are a global leader in developing end-to-end broadband systems that deliverentertainment, communication and information systems into the home. We offer consumer products,including digital video, voice-over-IP, and wireless data gateway devices, and service provider products,including video encoding and distribution systems, content protection solutions, data edge routers, opticalnetworking equipment and remote management software solutions.
Motorola is a corporation organized under the laws of the State of Delaware as the successor to an Illinoiscorporation organized in 1928. Motorola's principal executive offices are located at 1303 East Algonquin Road,Schaumburg, Illinois 60196.
Business Segments
Motorola reports financial results for the following three operating business segments:
Mobile Devices Segment
The Mobile Devices segment (""Mobile Devices'' or the ""segment'') designs, manufactures, sells and serviceswireless handsets with integrated software and accessory products, and licenses intellectual property. In 2006, thesegment's net sales represented 66% of the Company's consolidated net sales.

2
Principal Products and Services
Our wireless subscriber products include wireless handsets with related software and accessory products. Wealso sell and license our intellectual property. We market our products worldwide to carriers and consumersthrough direct sales, distributors, dealers, retailers and, in certain markets, through licensees.
Our Industry
We believe that total industry shipments of wireless handsets (also referred to as industry ""sell-in'') increasedto approximately 980 million units in 2006, an increase of approximately 20% compared to 2005. Demand fromnew subscribers was strong in emerging markets, particularly India and China. Replacement sales in highly-penetrated markets were also strong due to generally favorable economic conditions, as well as compelling newhandset designs, attractive handset features and the increased roll-out of high-speed data networks, all creating agreater opportunity for personalization. In this environment, we were able to increase our unit shipments faster thanthe market and we believe we increased our overall market share to approximately 22%.
Industry forecasters predict that the wireless handset industry will continue to grow over the next several years,although the annual rate of growth is expected to be in the 10% range as opposed to the annual growth in the 20%range the industry has experienced over each of the last four years. Continued growth will be driven by demandfrom new subscribers in emerging markets and replacement sales from the current subscriber base.
Our Strategy
The Mobile Devices segment is focused on profitable and sustainable growth while maintaining a strongcommitment to quality and an unrelenting focus on technology and innovation. We recognize the role the mobiledevice plays in digital convergence by breaking down the boundaries between work, home, business, entertainmentand leisure. A central theme to Mobile Devices' strategy is our vision of seamless mobility, which leverages thetrends in digital convergence by enabling the consumer to enjoy simple, rich, compelling experiences regardless ofenvironment, device or network.
We continue to invest in our popular MOTORAZR franchise by refreshing the product line with new designs,cobranding, new features and network extensions. New flagship additions to the franchise were introduced in 2006with the launch of MOTOKRZR and MOTORIZR Z3, our first quad-band, globally available slider designed forGSM-based networks. The franchise was expanded into 3G technologies with the launch of MOTORAZR V3xwhich earned ""Best 3GSM Handset'' at the 2006 3GSM World Congress in February. Further extensions of thefranchise into high-speed downlink packet access (""HSDPA'') were accomplished with the launch of MOTORAZRxx and MOTORAZR maxx. We launched the MOTO Q, our first iconic ""qwerty''-based device on NorthAmerica's largest CDMA EV-DO network. We also introduced the MOTOFONE handset, a value-priced handsetthat strengthens Motorola's drive to connect ""the next billion'' mobile phone users. Across technologies, price tiersand geographies, our objective is to unite ""must have'' design with ""must have'' experiencesÌwithoutcompromising quality of design, quality of experience or quality of product performance.
We play an active role in the development of next-generation technologies and believe a strong intellectualproperty portfolio is critical to our long-term success. We have a substantial investment in UMTS, WiMAX andHSDPA technologies and chipset designs to ensure that we maintain a favorable strategic position in these emergingtechnologies. We will continue to identify opportunities to generate licensing revenue from these investments.
Our approach to providing rich experiences involves both partnerships and in-house initiatives. To delivercompelling experiences to the mobile user in the productivity, imaging and music categories, it is critical to have theright partners. To that end, we have partnered with Google, Kodak, Microsoft, Warner Music, Yahoo! and otherleading brands to create simple and unique rich experiences. Additionally, during 2006, the segment completed theacquisition of TTP Communications plc, a developer of intellectual property used in the design and manufacture ofwireless communication terminals and a leading provider of protocol stack software that offers rapid customizationof handsets through its AJAR applications framework. In early 2007, Motorola completed the acquisition of GoodTechnology, Inc. to strengthen our enterprise-productivity offering. Good's end-to-end content delivery platformexpands not only our enterprise and prosumer portfolio but also accelerates the development and richness of ourmultimedia offering
Delivering advanced services to consumers requires a highly-capable software platform with a large base ofdevelopment support. In 2006, we continued to invest in our Linux-based platform. Through the formation of the

3
LiMo (Linux Mobile) Foundation, Motorola along with other mobile industry leaders, pledged to create theworld's first globally adopted open mobile Linux platform. We expect this platform to provide cost advantages tous, flexibility to carriers, and access to the world's community of application and software developers.
Customers
Mobile Devices continues to focus on strengthening relationships with our top customers. The segment hasseveral large customers worldwide, the loss of one or more of which could have a material adverse effect on thesegment's business.
The largest of the segment's end customers (including sales through distributors) are China Mobile, Verizon,Sprint Nextel, Cingular and T-Mobile. Sales to these five largest customers represented approximately 39% of thesegment's net sales in 2006. In addition to selling directly to carriers and operators, Mobile Devices also sellsproducts through a variety of third-party distributors and retailers, which account for approximately 38% of thesegment's net sales. The largest of these distributors is Brightstar Corporation.
Although the U.S. market continued to be the segment's largest individual market, many of our customers, andapproximately 65% of our net sales, are outside the U.S. The largest of these international markets are China,Brazil, the United Kingdom, Mexico and Hong Kong. Compared to 2005, the segment experienced sales growth in:High Growth markets (defined as countries in the Middle East, Africa, Southeast Asia and India), North Asia,North America and Latin America. Sales grew as a result of an improved product portfolio, including continueddemand worldwide for the MOTORAZR family, continued strong market growth in emerging markets, and highreplacement sales in more mature markets.
Competition
The segment believes it increased its overall market share to approximately 22% in 2006 and remains thesecond-largest worldwide supplier of wireless handsets. The segment experiences intense competition in worldwidemarkets from numerous global competitors, including some of the world's largest companies, such as Nokia,Samsung, Sony Ericsson and LG. The wireless handset industry continues to consolidate and, in 2006, the fivelargest participants together held an aggregate market share of approximately 86%.
Our strategy of driving our seamless mobility vision, creating valuable differentiation of our products throughdesign, and providing compelling, rich experiences to consumers and carriers is intended to further enhance ourmarket position. Establishing and expanding a strong position in the fastest-growing segments, such as emergingmarkets and 3G/UMTS, will be necessary to retain and enhance our competitiveness. We also believe that it iscritical to invest in research and development (""R&D'') of cutting-edge technologies and services to remaincompetitive. In 2006, the segment's total investment in R&D again increased to support new product development.
General competitive factors in the market for our products include: design; time-to-market; brand awareness;technology offered; price; product proposition, performance, quality, delivery and warranty; the quality andavailability of service; and relationships with key customers.
Payment Terms
The segment's customers and distributors buy from us regularly with payment terms that are competitive withcurrent industry practices. These terms vary globally and generally range from cash-with-order to 60 days. Extendedpayment terms beyond 60 days are provided to customers on a limited basis. Payment terms allow the customer ordistributor to purchase products from us on a periodic basis and pay for those products at the end of the agreedterm applicable to each purchase. A customer's outstanding credit at any point in time is limited to a predeterminedamount as established by management.
Regulatory Matters
Radio frequencies are required to provide wireless services. The allocation of frequencies is regulated in theU.S. and other countries, and limited spectrum space is allocated to wireless services. The growth of the wirelessand personal communications industry may be affected if adequate frequencies are not allocated or, alternatively, ifnew technologies are not developed to better utilize the frequencies currently allocated for such use. Industry

4
growth may also be affected by the cost of the new licenses required to use frequencies and any related frequencyrelocation costs.
The U.S. leads the world in spectrum deregulation, allowing new wireless communications technologies to bedeveloped and offered for sale. Examples include wireless local area network systems, such as WiFi, and wide areanetwork systems, such as WiMAX. Other countries have also deregulated portions of the available spectrum toallow these and other new technologies, which can be offered without spectrum license costs. Deregulation mayintroduce new competition and new opportunities for Motorola and our customers.
Backlog
The segment's backlog was $1.4 billion at December 31, 2006, compared to $3.0 billion at December 31,2005. The 2006 backlog is believed to be generally firm and 100% of that amount is expected to be recognized asrevenue in 2007. The forward-looking estimate of the firmness of such orders is subject to future events that maycause the amount recognized to change. The decrease in backlog at December 31, 2006, compared toDecember 31, 2005, is primarily due to an unusually high level of backlog at December 31, 2005 resulting fromstrong customer demand for new products during the fourth quarter of 2005, certain of which were unable to beshipped in significant quantities due to supply constraints for select components.
Intellectual Property Matters
Patent protection is extremely important to the segment's operations. The segment has an extensive portfolioof patents relating to its products, technologies and manufacturing processes. The segment licenses certain of itspatents to third parties and generates revenue from these licenses. Motorola is also licensed to use certain patentsowned by others. Royalty and licensing fees vary from year to year and are subject to the terms of the agreementsand sales volumes of the products subject to licenses. The protection of these licenses is also important to thesegment's operations. Reference is made to the material under the heading ""Other Information'' for additionalinformation relating to patents and trademarks and research and development activities with respect to this segment.
Inventory, Raw Materials, Right of Return and Seasonality
The segment's practice is to carry reasonable amounts of inventory in manufacturing and distribution centers inorder to meet customer delivery requirements in a manner consistent with industry standards. At the end of 2006,the segment had a higher inventory balance than at the end of 2005. The increase reflects a growth in inventory inthe fourth quarter of 2006, primarily due to slower than expected initial customer demand for certain products.
Availability of materials and components required by the segment is relatively dependable, but fluctuations insupply and market demand could cause selective shortages and affect results. We currently source certain materialsand components from single vendors. Any material disruption from a single-source vendor may have a materialadverse impact on our results of operations.
Energy necessary for the segment's manufacturing facilities consists primarily of electricity and natural gas,which are currently in generally adequate supply for the segment's operations. In addition, the cost to operate ourfacilities and freight costs are dependent on world oil prices. A substantial increase in worldwide oil prices couldhave a negative impact on our results of operations. Labor is generally available in reasonable proximity to thesegment's manufacturing facilities. However, difficulties in obtaining any of the aforementioned items or asignificant cost increase could affect the segment's results.
The segment permits returns under limited circumstances to remain competitive with current industry practices.
The segment typically experiences higher sales in the fourth calendar quarter and lower sales in the firstcalendar quarter of each year.
Our Facilities/Manufacturing
Our headquarters are located in Libertyville, Illinois. Our other major facilities are located in Plantation,Florida; Flensburg, Germany; Singapore; Beijing and Tianjin, China; Jaguariuna, Brazil; and Basingstoke, England.We also maintain an interest in a joint venture in Hangzhou, China.

5
We also use several electronics manufacturing suppliers (""EMS'') and original design manufacturers (""ODM'')to enhance our ability to lower our costs and deliver products that meet consumer demands in the rapidly-changingtechnological environment. A portion of our handsets are manufactured either completely or substantially by non-affiliated EMS and ODM manufacturers and the percentage of total manufactured unit volume with thesemanufacturers increased moderately from 2005 to 2006.
In 2006, our handsets were primarily manufactured in Asia. We expect this to continue in 2007. Our largestmanufacturing facilities are located in China, Singapore and Brazil. Each of these facilities serves multiple countriesand regions of the world.
Networks and Enterprise Segment
The Networks and Enterprise segment (the ""segment'') designs, manufactures, sells, installs and services:(i) cellular infrastructure systems and wireless broadband systems to public carriers and other wireless serviceproviders (referred to as the ""public networks'' market), and (ii) analog and digital two-way radio, voice and datacommunications products and systems, as well as wireless broadband systems, to a wide range of public safety,government, utility, transportation and other worldwide enterprise markets (referred to as the ""private networks''market). In January 2007, the segment completed the acquisition of Symbol Technologies, Inc. (""Symbol''), aleader in providing products and systems used in end-to-end enterprise mobility solutions. Symbol will become thecornerstone of the segment's enterprise mobility strategy. In 2006, the segment's net sales represented 26% of theCompany's consolidated net sales.
Principal Products and Services
In the public networks market, the segment provides end-to-end cellular networks, including radio basestations, base station controllers, associated software and services, application platforms and third-party switchingfor CDMA, GSM, iDEN» and UMTS technologies. The segment also offers a portfolio of products, collectivelyknown as Motorola MOTOwi4, which includes WiMAX, to create mobile Internet Protocol (""IP'') broadbandaccess. These technologies, especially WiMAX, have the potential to make mobile bandwidth more affordable andaccessible for mainstream consumer adoption, yet profitable for the segment's service provider customers. Thesegment also provides access points, subscriber modules and backhaul modules for wireless broadband systems, aswell as advanced telecommunications architecture (""TCA'') and micro TCA communications servers. Theseproducts and services are marketed to wireless service providers worldwide through a direct sales force, licenseesand agents.
In the private networks market, the segment primarily designs, manufactures, sells, installs and services two-wayradio, voice and data communications products and systems to a wide range of public safety and governmentcustomers worldwide.
The segment also serves the enterprise space by providing business-critical wireless mobility devices, networksand applications that enable an enterprise customer to seamlessly connect its people, assets and information.Enterprise customers include utility, courier, transportation, field services and other companies with disseminatedworkforces. Offerings include mobile office devices, rugged mobile computing handhelds, private and publicbusiness communication networks, enterprise-grade wireless security systems, and end-to-end systems andapplications that deliver enterprise mobility. The January 2007 acquisition of Symbol unites the two companies'industry-leading enterprise products.
The segment's products are sold directly through its own distribution force or through independent authorizeddistributors and dealers, service operators and independent commission sales representatives. The segment'sdistribution organization provides systems engineering and installation and other technical and systems managementservices to meet its customers' particular needs. The customer may also choose to install and maintain theequipment with its own employees, or may obtain installation, service and parts from a network of the segment'sauthorized service stations (most of whom are also authorized dealers) or from other non-Motorola servicestations.

6
Our Industry
We participate in multiple global markets within the mobile segment of the communications industry,providing wireless equipment and services to public carriers and other wireless service providers, as well as publicsafety, government and enterprise customers.
Within our public networks market, we primarily provide radio access cellular infrastructure systems. Thismarket grew approximately 5% in 2006, compared to 10% in 2005 and we expect this market to experience flat tolow single digit growth in 2007. We are also an early leader in the emerging market for next-generation wirelessbroadband networks, including WiMAX technology.
The majority of installed cellular infrastructure systems are based upon CDMA, GSM, UMTS and iDENtechnologies. We supply systems based on each of these technologies and are the sole supplier of proprietary iDENnetworks. Advanced infrastructure systems based on these technologies include GPRS, CDMA-1X and EDGE. Inaddition, some segments of the cellular infrastructure industry have installed, or are in the process of migrating to,third-generation (""3G'') networks, which are high-capacity radio access wireless networks providing enhanced dataservices, improved Internet access and increased voice capacity. The primary 3G technologies are W-CDMA (basedon either UMTS or Freedom of Mobile Multimedia Access (""FOMA'') technologies) and CDMA2000 1xEVDO.An additional 3G technology standard is TD-SCDMA, driven primarily by the Chinese government and localChinese vendors. We now expect 3G licenses to be awarded in China during 2008. We supply systems based onUMTS and CDMA 2000 1xEVDO technologies. Advanced infrastructure systems based on 3G technologies includehigh-speed downlink packet access (""HSDPA'') and high-speed uplink packet access (""HSUPA''). Commercialservice of 3G technologies was first introduced in Asia and has expanded to Western Europe and North America.
Industry standards bodies are in the process of defining the next generation of wireless broadband systems after3G. The Institute of Electrical and Electronics Engineers (""IEEE'') is currently developing fixed and mobilebroadband standards (802.16d and 802.16e) based on orthogonal frequency division multiplexing (""OFDM'')technology, which offer systems performance utilizing wider channels enabling triple play services (voice, data,video). Based upon developments in the 802.16e standard, we expect to see the WiMAX market begin tomaterialize in 2008 as several WiMAX networks come on-line and devices utilizing these networks become widelyavailable. We are an early leader in next-generation wireless broadband products, including WiMAX technology.
The International Telecommunications Union (""ITU'') is also developing next-generation cellular wirelessaccess standards (""4G'') for the cellular infrastructure industry, also anticipated to be based upon OFDMtechnology.
Within our private networks business, homeland security remains an important issue at the local, state andnational levels. We expect this industry to grow in the mid-to-high single digit percentage range in 2007, consistentwith industry growth in 2006. We provide solutions for each of the major standards based private networktechnologies, APCO (Association for Public Safety Communications Officials) 25 and TETRA (terrestrial trunkedradio). We expect product sales to continue to grow worldwide as demand for intersystem, interoperable publicsafety communications grows. As both technologies mature, better frequency utilization has increased the demandand potential for data applications and we expect to see increased demand for data-based products in 2007 andbeyond.
In addition, Motorola recognizes a significant market opportunity in the next several years as enterprisesincrease their deployment of mobile technologies. The enterprise markets in which Motorola competes includeenterprise wireless infrastructure, mobile computing solutions, bar code scanning, radio frequency identification(""RFID'') solutions and mobile management platforms. Organizations that are looking to increase productivity andderive benefits from mobilizing their applications and workforce are driving the enterprise mobility market. Weexpect the overall enterprise mobility market to grow in the high single digits in 2007. With the completion of theSymbol acquisition in January 2007, Motorola's new enterprise mobility business offers a broad device portfoliowhich will enable us to compete more effectively in these markets.
Our Strategy
The Networks and Enterprise segment is executing on a strategy to become a category leader in next-generation mobile solutions, thereby enabling seamless mobility for public carriers and their customers, governmentsand enterprises. It executes on this strategy by offering multiple technologies across several customer sectors.
7
Public Networks. The segment is investing to be the leader in next-generation wireless broadbandtechnologies with its MOTOwi4 portfolio of offerings, such as WiMAX. Because of its projected early availability,lower cost and superior performance, wireless broadband technology, such as WiMAX, based on the IEEE standard802.16e represents a compelling offering for existing and new providers. Potential customers in this space rangefrom traditional mobile providers to wireline operators, such as cable companies, who are moving to enhance theirofferings to new customers or launch offerings based on wireless broadband. In 2006, the segment announcedarrangements for WiMAX networks based on 802.16e technologies with Wateen Telecom in Pakistan and SprintNextel and Clearwire in the United States. In addition, at the end of 2006 the segment was participating in 22WiMAX trials globally.
The segment also has a comprehensive investment strategy to migrate its customers from 2G (second-generation) to next-generation wireless technologies, including 3G (third-generation) technologies. The cellularnetwork technologies, based on protocols developed through the ITU, have advanced from 2G to 3G enablingservice providers to move to higher-capacity bandwidth technologies which enable the providers to offer engaging,new and exciting applications that can broaden their revenue stream. Many cellular operators, particularly inemerging markets, have not begun their migration to next-generation access technologies. In 2006, the segmentannounced a collaboration with Huawei Technologies, Co., Ltd. to bring an enhanced and extensive portfolio ofUMTS and HSDPA/HSUPA infrastructure equipment to customers worldwide.
Private Networks. The segment is the leading provider of mission-critical systems worldwide, with more than65 years of experience in custom, rugged devices; public safety-grade private networks; sophisticated encryptiontechnology; interoperable voice and broadband data; and complex network design, optimization andimplementation. Key elements in the segment's strategy include: (i) providing next-generation integrated voice, dataand broadband over wireless systems at the local, state and national levels; (ii) continuing to invest in the ongoingmigration from analog to digital end-to-end radio systems; (iii) providing APCO 25 and TETRA standards-basedvoice and data networking systems around the world; and (iv) implementing interoperable communications andinformation systems, especially related to global homeland security. In January 2007, the segment completed theacquisition of Symbol, a leader in designing, developing, manufacturing and servicing products and systems used inend-to-end enterprise mobility solutions. Symbol's offerings feature rugged mobile computing, advanced datacapture, RFID, wireless infrastructure and mobility management. Recognized as an industry leader in technologyinnovation, with a world-class product portfolio and valuable intellectual property, Symbol will be the cornerstoneof the segment's strategy to enable the mobile enterprise in 2007 and beyond. The acquisition unites the twocompanies' adjacent assets, expertise, customer bases, supplier bases and industry-leading products. Key elements inthe segment's enterprise mobility strategy include offering a comprehensive portfolio of products and services tohelp businesses: (i) streamline their supply chains, (ii) improve customer service in the field, (iii) increase datacollection accuracy, and (iv) enhance worker productivity.
Customers
Due to the nature of the segment's business, many of the agreements we enter into are long-term contracts thatrequire sizeable investments by our customers. In 2006, sales to our top five commercial customers (Sprint Nextel;KDDI, a service provider in Japan; China Mobile; Verizon; and Alltel), plus the U.S. government and its publicsafety agencies, represented approximately 34% of the segment's net sales. The loss of any of the segment's largecustomers, in particular these customers, could have a material adverse effect on the segment's business. Further,because many of these contracts are long-term, the loss of a major customer would impact revenue and earningsover several quarters.
Sprint Nextel is our largest customer and the segment has been Sprint Nextel's sole supplier of iDEN networkinfrastructure equipment for more than ten years. Sprint Nextel uses Motorola's proprietary iDEN technology tosupport a critical part of its nationwide wireless service business. Motorola is currently operating under supplyagreements for iDEN infrastructure equipment that cover the period from January 1, 2005 through December 31,2007. The segment's iDEN revenues decreased in 2006 compared to 2005, and we expect iDEN sales to declinefurther in 2007.
Competition
The segment experiences widespread competition from numerous competitors, ranging from some of theworld's largest diversified companies to foreign, state-owned telecommunications companies to many small,specialized firms. In the public networks industry, Ericsson is the market leader, followed by Nokia and four

8
vendors with similar market share positions, including Motorola, Siemens, Alcatel-Lucent and Nortel. Samsung,NEC and local Chinese vendors are also significant competitors. In the private networks industry, the segmentprovides communications and information systems compliant with both existing industry digital standards, TETRAand APCO 25. Major competitors include: M/A-Com, EADS Telecommunications, Kenwood, EF Johnson andlarge system integrators. The segment may also act as a subcontractor to a large system integrator based on anumber of competitive factors and customer requirements. As demand for fully-integrated voice, data andbroadband over wireless systems at the local, state and national government levels continues, the segment may faceadditional competition from public telecommunications carriers. In the enterprise market, the segment experiencescompetition from Cisco, Nokia, and Intermec.
Competitive factors in the market for the segment's products include: technology offered; price; paymentterms; availability of vendor financing; product and system performance; product features, quality, delivery,availability and warranty; the quality and availability of service; company image; relationship with key customers;and time-to-market. Price is a major area of competition and often impacts margins for initial system bids,particularly in emerging markets. Time-to-market has also been an important competitive factor, especially for newsystems and technologies.
The segment's public networks business is confronting several factors that could impact its business, includingthe consolidation among telecommunications equipment providers and unclear timing for the granting of newlicenses for providers in countries like China. In addition, the segment does not believe future iDEN technologyrevenues are likely to match 2006 levels. In the private networks space, the segment is managing the impact ofsystem integrators seeking to move farther into the public safety area. In the enterprise market, a number ofcompetitors deliver products in certain segments of the enterprise mobility market. The segment believes it has aunique portfolio to seamlessly connect people, assets and information to enable customers to grow their business,increase efficiency and improve customer satisfaction. Security and manageability are common throughout theportfolio.
Payment Terms
Payment terms vary worldwide, depending on the arrangement. Contracts for communication systems typicallyinclude implementation milestones, such as delivery, installation and system acceptance, which can take 30 to180 days to complete. Invoicing the customer is dependent on the completion of the milestone. Customer paymentsare generally due 30 to 60 days from the invoice date.
As required for competitive reasons, we may provide or work with third-party lenders to arrange for long-termfinancing in connection with equipment purchases. Financing may cover all or a portion of the purchase price. Thesegment's payment terms are consistent with industry practice as many of our contracts are awarded through acompetitive bid process.
Regulatory Matters
The use of wireless voice and data communications systems is regulated by a variety of governmental and otherregulatory agencies throughout the world. In the U.S., non-Federal users of these systems are licensed by theFederal Communications Commission (""FCC''), which has broad authority to make rules and regulations andprescribe restrictions and conditions to carry out the provisions of the Communications Act of 1934. Similarly,Federal agency operation of wireless communications systems is regulated by the National Telecommunications andInformation Agency (""NTIA''). Regulatory agencies in other countries have similar types of authority.Consequently, the business and results of this segment could be affected by the rules and regulations adopted bythe FCC, NTIA or regulatory agencies in other countries from time to time. Motorola has developed productsusing trunking and data communications technologies to enhance spectral efficiencies. The growth and results ofthe wireless communications industry may be affected by the regulations of the FCC, NTIA or other regulatoryagencies relating to the access to allocated spectrum for wireless communications users, especially in urban areaswhere spectrum is heavily used.
The U.S. leads the world in spectrum deregulation, allowing new wireless communications technologies to bedeveloped and offered for sale. Examples include wireless local area network systems, such as WiFi, meshtechnologies and wide area network systems, such as Motorola's Wi4 portfolio, including WiMAX. Other countrieshave also deregulated portions of the available spectrum to allow the deployment of these and other technologies.Deregulation may introduce new competition and new opportunities for Motorola and our customers.

9
In early 2005, Sprint Nextel agreed to a plan by federal regulators designed to address interference from iDENphones with hundreds of public safety communications systems in the U.S. According to the FCC, the agreementshould dramatically reduce the likelihood of interference. Sprint Nextel is required to fund certain costs necessaryto relocate those impacted users onto alternate channels in the 800MHz spectrum. Motorola will continue to workwith our customers that are impacted by this plan and expects that this will have a neutral to positive impact onthe segment's business over the next several years. However, the short-term impact remains uncertain and is yet tobe quantified, as the plan is still being implemented throughout most of the country.
In February 2006, federal legislation was adopted setting February 17, 2009 as the date by which a portion ofthe spectrum historically used for broadcast television must be cleared throughout the U.S. Segments of thisspectrum have been designated for public safety use and other segments for commercial operations, both marketsegments in which Motorola participates. This spectrum was designated for public safety and commercial use in1997, however, prior to this new legislation, there was no certainty as to when it actually would be cleared for usein major markets. Clearing broadcast television from this band will significantly increase the spectrum public safetyand commercial entities have available for communications systems. The new spectrum is configured to supportboth voice and data and the FCC has also opened additional rulemaking proceedings to help enable futurebroadband operations for public safety. Motorola already has public safety infrastructure and mobiles/portablesshipping for deployment of voice and data systems in this band and we anticipate the availability of broadbandequipment in the future.
Backlog
The segment's backlog was $4.4 billion as of December 31, 2006, compared to $4.1 billion as of December 31,2005. The 2006 order backlog is believed to be generally firm and approximately 85% of that amount is expectedto be recognized as revenue during 2007. The forward-looking estimate of the firmness of such orders is subject tofuture events that may cause the amount recognized to change.
Intellectual Property Matters
Patent protection is extremely important to the segment's operations. The segment has an extensive portfolioof patents relating to its products, systems, technologies and manufacturing processes.
The segment licenses some of its patents to third parties and generates modest revenue from these licenses.Motorola is also licensed to use certain patents owned by others. Royalty and licensing fees vary from year to yearand are subject to the terms of the agreements and sales volumes of the products subject to licenses. Reference ismade to the material under the heading ""Other Information'' for information relating to patents and trademarksand research and development activities with respect to this segment.
We actively participate in the development of open standards for interoperable, mission-critical digital two-wayradio systems. We have published our technology and licensed patents to signatories of the industry's two primarymemorandums of understanding defined by the Telecommunications Industry Association (""TIA'') Project 25 andEuropean Telecommunications Standards Institute (""ETSI'') Terrestrial Trunked Radio (""TETRA''). Royaltiesassociated with these licenses are not expected to be material to the segment's financial results.
Inventory, Raw Materials, Right of Return and Seasonality
The segment's practice is to carry reasonable amounts of inventory in order to meet customer deliveryrequirements in a manner consistent with industry standards. At the end of 2006, the segment had a higherinventory balance than at the end of 2005, primarily due to a larger amount of inventory to fulfill longer-termprojects.
Our private networks business provides custom products based on assembling basic units into a large variety ofmodels or combinations. This requires the stocking of inventories and large varieties of piece parts and replacementparts, as well as a variety of basic level assemblies in order to meet delivery requirements. Relatively short deliveryrequirements and historical trends determine the amounts of inventory to be stocked. To the extent suppliers'product life cycles are shorter than the segment's, stocking of lifetime buy inventories is required. In addition,replacement parts are stocked for delivery on customer demand within a short delivery cycle.

10
Availability of materials and components required by the segment is relatively dependable, but fluctuations insupply and market demand could cause selective shortages and affect results. We currently source certain materialsand components from single vendors. Any material disruption from a single-source vendor may have a materialadverse impact on our results of operations.
Natural gas, electricity and, to a lesser extent, oil are the primary sources of energy for the segment'soperations, which are currently in generally adequate supply for the segment's operations. In addition, the cost tooperate our facilities and freight costs are dependent on world oil prices. A substantial increase in worldwide oilprices could have a negative impact on our results of operations. Labor is generally available in reasonableproximity to the segment's manufacturing facilities. However, difficulties in obtaining any of these items or asignificant cost increase could affect the segment's results.
Generally the segment's contracts do not include a right of return, other than for standard warranty provisions.For new product introductions, we may enter into milestone contracts providing that the product could be returnedif we do not achieve the milestones.
Due to government buying patterns, private networks sales tend to be somewhat higher in the fourth quarter.The business does not have seasonal patterns in the public networks market.
Our Facilities/Manufacturing
Our headquarters are located in Arlington Heights, Illinois. Major design, integration, manufacturing anddistribution centers are located in: Arlington Heights and Schaumburg, Illinois; Chandler and Tempe, Arizona;Fort Worth, Texas; Swindon, England; Arad, Israel; Hangzhou and Tianjin, China; Munich, Taunusstein and Berlin,Germany; and Penang, Malaysia. In addition to our own manufacturing, we utilize EMS manufacturers, primarily inAsia, in order to enhance our ability to lower costs and deliver products that meet consumer demands.
Connected Home Solutions Segment
The Connected Home Solutions segment (the ""segment'') designs, manufactures, sells and services: (i) cabletelevision, Internet Protocol (""IP'') video and broadcast network set-top boxes (""digital entertainment devices''),(ii) end-to-end digital video system solutions, (iii) broadband access networks, and (iv) IP-based data and voiceproducts (including modems). In 2006, the segment's net sales represented 8% of the Company's consolidated netsales.
Principal Products and Services
The segment is a leading provider of end-to-end networks used for the delivery of video, voice and dataservices over hybrid fiber coaxial networks. We also provide products for IP television (""IPTV'') Ì multichanneltelevision service using IP-based fiber-to-the premises and fiber-to-the-node access networks Ì to wireline carriers.
Our products are marketed primarily to cable television operators, satellite television programmers, telephonecarriers and other communications providers worldwide and are sold primarily by our skilled sales personnel. Wehave also expanded our traditional distribution channels by selling directly to consumers in a variety of retailmarkets. Through retail, we market and sell primarily cable modems and cordless telephones.
Our Industry
Demand for our products depends primarily on: (i) capital spending by providers of broadband services forconstructing, rebuilding or upgrading their communications systems, and (ii) the marketing of advancedcommunications services by those providers. The amount of spending by these providers, and therefore a majorityof our sales and profitability, are affected by a variety of factors, including: (i) the continuing trend ofconsolidation within the cable and telecommunications industries, (ii) the financial condition of cable televisionsystem operators and alternative communications providers, including their access to financing, (iii) the rate ofdigital penetration, (iv) technological developments, (v) standardization efforts that impact the deployment of newequipment, (vi) new legislation and regulations affecting the equipment sold by the segment, and (vii) generaleconomic conditions. In 2006, the business benefited from increased spending by cable television operators on ourproducts, due to the increase in digital video and data subscribers and the deployment of advanced video platformsby cable operators for high-definition television (""HD'') and digital video recording (""DVR'') (together ""HD/

11
DVR'') applications, as well as from spending by telephone companies upgrading their networks and adding videoservices.
Our Strategy
The Connected Home Solutions segment is focused on becoming the global leader in broadband connectedhome solutions and services, enabling customers to be seamlessly informed, connected and entertained. Keyelements in the segment's strategy include: (i) providing for convergence of services and applications across deliveryplatforms within the home and across mobile applications, (ii) innovating and enhancing our end-to-end networkportfolio, and (iii) developing new services that leverage our platforms.
We are focused on accelerating the rate of digital penetration by broadband operators in North Americathrough the introduction of an enhanced suite of digital set-top boxes. Our product offerings include more cost-effective products designed to increase the number of set-top boxes per household, as well as higher-end productsfor advanced services, including supporting the growing HD/DVR markets. During 2006, we shipped our50 millionth digital entertainment device for broadband cable networks, approximately 10 years after shipment ofour first such device.
We are capitalizing upon the introduction of IPTV by telecommunication operators to their subscribers withproducts that support delivery of video content using both copper-outside-plant and fiber-to-the-premises (""FTTP'')networks. During the year, the segment provided end-to-end video equipment and FTTP access network equipmentfor the launch of Verizon's FiOS service and is supplying IP interactive set-top boxes to leading telecommunicationcompanies around the world, including AT&T, Telefonica S.A., KPN International, Lyse Energi AS, and ViaSat, Inc.
We are expanding our position in end-to-end video networks as well as increasing our offerings to wirelinecarriers through several strategic acquisitions. During 2006, we acquired Kreatel Communications AB to enhanceour portfolio of IPTV set-top boxes and software and extend our customer relationships with leading IPTVproviders in Europe. We grew our presence in the video core network through the acquisitions of: (i) BroadbusTechnologies, Inc., a leading supplier of content-on-demand technologies, also called video on demand (""VOD''),and (ii) Vertasent LLC, a software developer for managing technology elements for switched digital videonetworks. In February 2007, we completed the acquisition of Netopia, Inc. (""Netopia''), a leading provider of datagateways and subscriber equipment management technology. We also announced our intention to acquire TutSystems, Inc. (""Tut Systems''), a leading developer of edge routing and video encoders. Together, Netopia and TutSystems will enhance our position with global carriers as they deploy advanced services. We expect theseacquisitions to: (i) enhance our capability to provide complete solutions to cable television operators as they growtheir on-demand content offerings and deploy switched digital video (""SDV'') technology, which deliversprogramming only when and where requested by subscribers versus delivering programming to all subscribers all thetime, and (ii) provide end-to-end video solutions to telephone companies as they add video to their serviceofferings.
We are focused on enhancing and expanding our voice and data offerings to offer end-to-end solutions forfixed-mobile convergence and next-generation converged IP-based voice, data and video delivery. These solutionsinclude: (i) stand-alone and integrated voice/data/WiFi gateways with support for handing off a mobile voice ordata call to a WiFi access point and a carrier's VoIP network, and (ii) next-generation infrastructure products inthe cable modem termination system (""CMTS'') and fiber optic network markets which expand the bandwidthdelivered to a home or business. We introduced our first seamless mobility voice gateway in 2006, which enablesour customers to support handoff of voice traffic between wireline networks and wireless networks using dualmode handsets.
We also continue to focus on growing our business in regions outside of North America, including thedevelopment of digital video products compliant with technology required in these regions. During 2006, thesegment launched digital video in Argentina with Cablevision; launched video on demand in the Netherlands withUPC; and provided video set-top boxes to a number of operators in China. Although sales in North Americaaccounted for 83% of the segment's sales in 2006, shipments to markets outside North America have grown over60% the last three years.

12
Customers
The vast majority of our sales are in the U.S., where a small number of large cable television multiple systemoperators (""MSOs'') own a large portion of the cable systems and account for a significant portion of the totalcapital spending in the industry. We are dependent upon a small number of customers for a significant portion ofour sales. Comcast Corporation (""Comcast'') accounted for approximately 29% of the segment's net sales in 2006.Collectively, our five largest customers represented 54% of the segment's net sales in 2006. The loss of business inthe future from Comcast or any of the other major MSOs could have a material adverse effect on the segment'sbusiness. Sales of video headend equipment and set-top boxes to telephone carriers accounted for approximately11% of our revenue in 2006. The opportunity in this market segment is expected to continue to grow as carriersaround the world expand to offer video services.
Competition
The businesses in which we operate are highly competitive. The rapid technological changes occurring in eachof the markets in which we compete are expected to lead to the entry of many new competitors. Competitivefactors for our products and systems include: technology offered; product and system performance; features;quality; delivery and availability; and price. We believe that we enjoy a strong competitive position because of ourstrong relationships with major communication system operators worldwide, technological leadership and newproduct development capabilities.
We compete worldwide in the market for digital set-top boxes for broadband and satellite networks. Based on2006 annual sales, we believe we are the leading provider of digital cable set-top boxes in North America. Ourdigital cable set-top boxes compete with products from a number of different companies, including: (i) those thatdevelop and sell products that are distributed by direct broadcast satellite (""DBS'') service providers through retailchannels, (ii) those that develop, manufacture and sell products of their own design, and (iii) those that licensetechnology from us or other competitors. In North America, our largest competitor is Cisco, which completed theacquisition of Scientific-Atlanta in 2006. Other competitors in North America include ARRIS, Harmonic andC-COR. Outside of North America, where we have a smaller market position, we compete with many equipmentsuppliers, including several consumer electronics companies.
The traditional competitive environment in the North American cable market continues to evolve. As furtherdescribed below, the FCC has enacted regulations requiring separation of security functionality from set-top boxesby July 1, 2007 to increase competition and encourage the sale of set-top boxes in the retail market. To meet thisrequirement, we have developed security modules for sale to cable operators for use with our own and third-partyset-top boxes. As a step towards this implementation, in 2002, the cable industry and consumer electronicmanufacturers agreed to a uni-directional security interface that allows third-party devices to access broadcastprogramming (not pay-per-view or VOD) with a security device. These devices became widely available in 2004and to date have seen limited use. The limited use of the devices has not had a significant impact on our business.A full two-way security interface specification continues to be refined. These changes are expected to increasecompetition and encourage the sale of set-top boxes to consumers in the retail market. Traditionally, cable serviceproviders have leased the set-top box to their customers.
We also compete worldwide in the market for broadband data and voice products. We believe that we are theleading provider of cable modems worldwide, competing with a number of consumer electronic companies andvarious original design manufacturers worldwide.
Payment Terms
Generally, our payment terms are consistent with the industry and range from 30 to 60 days in North America,and are typically limited to 90 days in regions outside North America. Extended payment terms are provided tocustomers from time to time on a limited basis. Such extended terms are isolated in nature and historically have notrelated to a significant portion of our revenues.
Regulatory Matters
Many of our products are subject to regulation by the FCC or other communications regulatory agencies. Inaddition, our customers and their networks, into which our products are incorporated, are subject to governmentregulation. Government regulatory policies affecting either the willingness or the ability of cable operators and
13
telephone carriers to offer certain services, or the terms on which the companies offer the services and conducttheir business, may affect the segment's results.
Currently, reception of digital television programming from the cable broadband network requires a set-topbox with certain technology. This security technology has limited the availability of set-top boxes to thosemanufactured by a few cable network manufacturers, including Motorola. The FCC has enacted regulationsrequiring separation of security functionality from set-top boxes to increase competition and encourage the sale ofset-top boxes in the retail market by July 1, 2007. Traditionally, cable service providers sold or leased the set-topbox to their customer. As the retail market develops for set-top boxes and televisions capable of accepting thesecurity modules, sales of our set-top boxes may be negatively impacted. In addition, we risk lost sales ifcompetitors bring set-top boxes with separable security to market before we do.
Backlog
The segment's backlog was $792 million at December 31, 2006, compared to $430 million at December 31,2005. The increase in backlog and related orders primarily reflects increased orders from our customers for digitaland HD/DVR set-top boxes. The 2006 order backlog is believed to be generally firm and 100% of that amount isexpected to be recognized as revenue in 2007. The forward-looking estimates of the firmness of such orders issubject to future events, which may cause the amount recognized to change.
Intellectual Property Matters
We seek to build upon our core enabling technologies, such as digital compression, encryption and conditionalaccess systems, in order to lead worldwide growth in the market for broadband communications networks. Ourpolicy is to protect our proprietary position by, among other methods, filing U.S. and foreign patent applications toprotect technology and improvements that we consider important to the development of our business. We also relyon our proprietary knowledge and ongoing technological innovation to develop and maintain our competitiveposition, and will periodically seek to include our proprietary technologies in certain patent pools that support theimplementation of standards. We were a founder of MPEG LA, the patent licensing authority established to fosterbroad deployment of MPEG-2 compliant systems. We have also licensed our digital conditional access technology,DigiCipher(R) II, to other equipment suppliers and have formed joint ventures with Comcast for development andlicensing of conditional access technology. We also enter into other license agreements, both as licensor andlicensee, covering certain products and processes with various companies. These license agreements require thepayment of certain royalties that are not expected to be material to the segment's financial results.
Inventory, Raw Materials, Right of Return and Seasonality
The segment's practice is to carry reasonable amounts of inventory in order to meet customer deliveryrequirements in a manner consistent with industry standards. At the end of 2006, the segment had higher inventorybalances than at the end of 2005 due to the timing of transitions to EMS manufacturers and business acquisitions.
Availability of materials and components required by the segment is relatively dependable, but fluctuations insupply and market demand could cause selective shortages and affect results. We currently source certain materialsand components from single vendors. Any material disruption from a single-source vendor may have a materialadverse impact on our results of operations.
Electricity is the primary source of energy required for our manufacturing operations, which is currently ingenerally adequate supply for the segments operations. In addition, the cost to operate our facilities and freightcosts are dependent on world oil prices. A substantial increase in world-wide oil prices could have a negativeimpact on our results of operations. Labor is generally available in reasonable proximity to the segment'smanufacturing facilities. However, difficulties in obtaining any of the aforementioned items or a significant costincrease could affect the segment's results.
Generally, we do not permit customers to return products, other than for standard warranty provisions. Wehave not recently experienced seasonal buying patterns for our products. However, as our retail cable modem anddigital set-top box sales increase, we may have increased sales during the holiday season at the end of each year.

14
Our Facilities/Manufacturing
Our headquarters are located in Horsham, Pennsylvania. We have several offices throughout North America,Europe, Latin America and Asia, and we operate manufacturing facilities in Taipei, Taiwan and Nogales, Mexico.We also use contract manufacturers, primarily in China, for a portion of our cable modem/voice moduleproduction in order to enhance our ability to lower our costs and deliver products that meet consumer demand.The amount of this activity has increased slightly throughout 2006 and is projected to increase further in futureyears.
Other Information
2006 Change in Organizational Structure. Effective as of the second quarter of 2006, the automotiveelectronics business was presented as a discontinued operation and the segments were realigned into three operatingbusiness groups: (i) Mobile Devices, (ii) Networks and Enterprise, and (iii) Connected Home Solutions.
Financial Information About Segments. The response to this section of Item 1 incorporates by referenceNote 11, ""Information by Segment and Geographic Region,'' of Part II, Item 8: Financial Statements andSupplementary Data of this document.
Customers. Motorola has several large customers, the loss of one or more of which could have a materialadverse effect on the Company. Motorola's largest end customers (including sales through distributors) are SprintNextel, China Mobile, Verizon, Cingular and T-Mobile. No single customer accounted for more than 10% of theCompany's net sales in 2006.
Approximately 1% of Motorola's net sales in 2006 were to various branches and agencies, including the armedservices, of the U.S. Government. All contracts with the U.S. Government are subject to cancellation at theconvenience of the Government.
Government contractors, including Motorola, are routinely subjected to numerous audits and investigations,which may be either civil or criminal in nature. The consequences of these audits and investigations may includeadministrative action to suspend business dealings with the contractor and to exclude it from receiving newbusiness. In addition, Motorola, like other contractors, reviews aspects of its government contracting operations,and, where appropriate, takes corrective actions and makes voluntary disclosures to the U.S. Government. Theseaudits and investigations could adversely affect Motorola's ability to obtain new business from theU.S. Government.
Backlog. Motorola's aggregate backlog position for all Motorola segments, as of the end of the last twofiscal years was approximately as follows:
December 31, 2006ÏÏÏÏÏÏÏÏÏÏÏÏÏÏÏÏÏÏÏÏÏÏÏÏÏÏÏÏÏÏÏÏÏÏÏÏÏÏÏÏÏÏÏÏÏÏÏÏÏÏÏÏÏÏÏÏÏÏÏÏÏÏÏÏ $6.6 billion
December 31, 2005ÏÏÏÏÏÏÏÏÏÏÏÏÏÏÏÏÏÏÏÏÏÏÏÏÏÏÏÏÏÏÏÏÏÏÏÏÏÏÏÏÏÏÏÏÏÏÏÏÏÏÏÏÏÏÏÏÏÏÏÏÏÏÏÏ $7.5 billion
Except as previously discussed in this Item 1, the orders supporting the 2006 backlog amounts shown in theforegoing table are believed to be generally firm, and approximately 90% of the backlog on hand at December 31,2006 is expected to be recognized as revenue in 2007. The forward-looking estimate of the firmness of such ordersis subject to future events that may cause the amount recognized to change.
Research and Development. Motorola's business segments participate in very competitive industries withconstant changes in technology. Throughout its history, Motorola has relied, and continues to rely, primarily on itsresearch and development (""R&D'') programs for the development of new products, and on its productionengineering capabilities for the improvement of existing products. Technical data and product application ideas areexchanged among Motorola's business segments on a regular basis. Management believes, looking forward, thatMotorola's commitment to R&D programs, both to improve existing products and services and to develop newproducts and services, together with its utilization of state-of-the-art technology, should allow each of its segmentsto remain competitive.
R&D expenditures relating to new product development or product improvement were $4.1 billion in 2006,compared to $3.6 billion in 2005 and $3.3 billion in 2004. R&D expenditures increased 14% in 2006 as comparedto 2005, after increasing 9% in 2005 as compared to 2004. Motorola continues to believe that a strong commitment

15
to research and development is required to drive long-term growth. Approximately 27,000 professional employeeswere engaged in such research activities during 2006.
Patents and Trademarks. Motorola seeks to obtain patents and trademarks to protect our proprietaryposition whenever possible and practical. As of December 31, 2006, Motorola owned approximately 8,652 utilityand design patents in the U.S. and 12,024 patents in foreign countries. These foreign patents are mostly counterpartsof Motorola's U.S. patents, but a number result from research conducted outside the U.S. and are originally filed inthe country of origin. During 2006, Motorola was granted 735 U.S. utility and design patents. The numbers ofpatents reported exclude patents sold to Continental AG in its acquisition of the automotive electronics businessand include patents assigned to companies acquired by Motorola during 2006. Many of the patents owned byMotorola are used in its operations or licensed for use by others, and Motorola is licensed to use certain patentsowned by others. Royalty and licensing fees vary from year to year and are subject to the terms of the agreementsand sales volumes of the products subject to licenses.
Environmental Quality. Compliance with federal, state and local laws regulating the discharge of materialsinto the environment, or otherwise relating to the protection of the environment, has no material effect on capitalexpenditures, earnings or the competitive position of Motorola.
Employees. At December 31, 2006, there were approximately 66,000 employees of Motorola and itssubsidiaries, as compared to approximately 69,000 employees at December 31, 2005.
Financial Information About Foreign and Domestic Operations. The response to this section of Item 1incorporates by reference Note 10, ""Commitments and Contingencies'' and Note 11, ""Information by Segment andGeographic Region'' of Part II, Item 8: Financial Statements and Supplementary Data of this document, the ""Resultsof OperationsÌ2006 Compared to 2005'' and ""Results of OperationsÌ2005 Compared to 2004'' sections ofPart II, ""Item 7: Management's Discussion and Analysis of Financial Condition and Results of Operations'' and""Item A: Risk Factors'' of this document.
Available Information
We make available free of charge through our website, www.motorola.com/investor, our annual reports onForm 10-K, quarterly reports on Form 10-Q, current reports on Form 8-K, proxy statements, other reports filedunder the Securities Exchange Act of 1934 (""Exchange Act'') and all amendments to those reports as soon asreasonably practicable after such material is electronically filed with the Securities and Exchange Commission(""SEC''). Our reports are also available free of charge on the SEC's website, www.sec.gov. Also available free ofcharge on our website are the following corporate governance documents:
‚ Motorola, Inc. Restated Certificate of Incorporation‚ Motorola, Inc. Amended and Restated Bylaws‚ Motorola, Inc. Board Governance Guidelines‚ Motorola, Inc. Director Independence Guidelines‚ Principles of Conduct for Members of the Motorola, Inc. Board of Directors‚ Motorola Code of Business Conduct, which is applicable to all Motorola employees, including the principal
executive officer, the principal financial officer and the controller (principal accounting officer)‚ Audit and Legal Committee Charter‚ Compensation and Leadership Committee Charter‚ Governance and Nominating Committee Charter
All of our reports and corporate governance documents may also be obtained without charge by contactingInvestor Relations, Motorola, Inc., Corporate Offices, 1303 East Algonquin Road, Schaumburg, Illinois 60196,E-mail: [email protected], phone: 1-800-262-8509. Our Internet website and the information containedtherein or incorporated therein are not intended to be incorporated into this Annual Report on Form 10-K.

16
Item 1A: Risk Factors
We wish to caution the reader that the following important risk factors, and those risk factors describedelsewhere in this report or our other Securities and Exchange Commission filings, could cause our actual results todiffer materially from those stated in forward-looking statements contained in this document and elsewhere.
The demand for our products depends in large part on the continued growth of the industries in which weparticipate. A market decline in any one of these industries could have an adverse effect on our business.
The rate at which the portions of the telecommunications industry in which we participate continue to grow iscritical to our ability to improve our overall financial performance and we could be negatively impacted by aslowdown. Our business was very negatively impacted by the economic slowdown and the corresponding reductionin capital spending by the telecommunications industry from 2001 to 2003.
Our customers and suppliers are located throughout the world and, as a result, we face risks that other companiesthat are not global may not face.
Our customers and suppliers are located throughout the world and more than half of our net sales are made tocustomers outside of the U.S. In addition, we have many manufacturing, administrative and sales facilities outsidethe U.S. and more than half of our employees are employed outside the U.S. Most of our suppliers are outside theU.S. and most of our products are manufactured outside the U.S.
As with all companies that have sizeable sales and operations outside the U.S., we are exposed to risks thatcould negatively impact sales or profitability, including but not limited to: (1) tariffs, trade barriers and tradedisputes; (2) regulations related to customs and import/export matters; (3) longer payment cycles; (4) tax issues,such as tax law changes, variations in tax laws from country to country and as compared to the U.S., anddifficulties in repatriating cash generated or held abroad in a tax-efficient manner; (5) currency fluctuations,particularly in the Euro, Chinese renminbi and Brazilian real; (6) foreign exchange regulations, which may limit theCompany's ability to convert or repatriate foreign currency; (7) challenges in collecting accounts receivable;(8) cultural and language differences; (9) employment regulations and local labor conditions; (10) difficultiesprotecting IP in foreign countries; (11) instability in economic or political conditions, including inflation, recessionand actual or anticipated military or political conflicts; (12) natural disasters; (13) public health issues oroutbreaks; and (14) the impact of each of the foregoing on our outsourcing and procurement arrangements.
Many of our products that are manufactured outside of the U.S. are manufactured in Asia. In particular, wehave sizeable operations in China, including manufacturing operations, and 11% of our net sales are made tocustomers in China. The legal system in China is still developing and is subject to change. Accordingly, ouroperations and orders for products in China could be adversely impacted by changes to or interpretation of Chineselaw. Further, if manufacturing in the region is disrupted, our overall capacity could be significantly reduced andsales or profitability could be negatively impacted.
We also are increasing our presence and/or selling more of our products in emerging markets such as Indiaand Russia. We face challenges in emerging markets, including creating demand for our products and the negativeimpact of changes in the laws, or the interpretation of the laws, in those countries.
If the quality of our products does not meet our customers' expectations, then our sales and operating earnings,and ultimately our reputation, could be adversely affected.
Occasionally, some of the products we sell have quality issues resulting from the design or manufacture of theproduct, or from the software used in the product. These issues may be caused by the components we purchasefrom other manufacturers. Often these issues are identified prior to the shipment of the products and may causedelays in shipping products to customers, or even the cancellation of orders by customers. Sometimes, we discoverquality issues in the products after they have been shipped to our distributors or end-user customers, requiring us toresolve such issues in a timely manner that is the least disruptive to our customers. Such pre-shipment and post-shipment quality issues can have legal and financial ramifications, including: delays in the recognition of revenue,loss of revenue or future orders, customer-imposed penalties on Motorola for failure to meet contractualrequirements, increased costs associated with repairing or replacing products, and a negative impact on our goodwilland brand name reputation.

17
In some cases, if the quality issue affects the product's safety or regulatory compliance, then such a ""defective''product may need to be recalled. Depending on the nature of the defect and the number of products in the field, itcan cause the Company to incur substantial recall costs, in addition to the costs associated with the potential lossof future orders, and the damage to the Company's goodwill or brand/reputation. In addition, the Company maybe required, under certain customer contracts, to pay damages for failed performance that might exceed the revenuethat the Company receives from the contracts. Recalls involving regulatory agencies can also result in fines andadditional costs. Finally, recalls can result in third-party litigation, including class action litigation by personsalleging common harm resulting from the purchase of the products.
We operate in highly-competitive markets and our financial results will be affected if we are not able to competeeffectively.
The markets for our products are highly competitive with respect to, among other factors: pricing, product andservice quality, and the time required to introduce new products and services. The markets for many of ourproducts are characterized by rapidly changing technologies, frequent new product introductions, short product lifecycles and evolving industry standards. We are constantly exposed to the risk that our competitors may implementnew technologies before we do, or may offer lower prices, additional products or services or other incentives thatwe cannot or will not offer. We can give no assurances that we will be able to compete successfully against existingor future competitors.
The uncertainty of current economic and political conditions makes budgeting and forecasting difficult and mayreduce demand for our products.
Current conditions in the domestic and global economies are uncertain. The U.S. involvement in Iraq and otherglobal conflicts, including in the Middle East, as well as public health issues, have created many economic andpolitical uncertainties that have impacted the global economy. As a result, it is difficult to estimate the level ofgrowth for the world economy as a whole. It is even more difficult to estimate growth in various parts of theworld economy, including the markets in which we participate. Because all components of our budgeting andforecasting are dependent upon estimates of growth in the markets we serve and demand for our products, theprevailing economic uncertainties render estimates of future income and expenditures difficult.
We have sizable manufacturing operations and engineering resources in Israel that could be disrupted as aresult of hostilities in the region. We also sell our products and services throughout the Middle East and demandfor our products and services could be negatively impacted by hostilities.
The future direction of the overall domestic and global economies will have a significant impact on our overallperformance. The potential for future terrorist attacks, increased global conflicts and the escalation of existingconflicts and public health issues has created worldwide uncertainties that have negatively impacted, and maycontinue to negatively impact, demand for certain of our products.
Our future operating results depend on our ability to purchase a sufficient amount of materials, parts andcomponents to meet the demands of our customers.
Our ability to meet customers' demands depends, in part, on our ability to obtain timely and adequate deliveryof quality materials, parts and components from our suppliers. We have experienced shortages in the past that haveadversely affected our operations. Although we work closely with our suppliers to avoid these types of shortages,there can be no assurances that we will not encounter these problems in the future. Furthermore, certain of ourcomponents are available only from a single source or limited sources. We may not be able to diversify sources in atimely manner. A reduction or interruption in supplies or a significant increase in the price of supplies could have amaterial adverse effect on our businesses.
Our success depends in part on our timely introduction of new products and technologies and our results can beimpacted by our significant investments in new products and technologies.
The markets for our products are characterized by rapidly changing technologies, frequent new productintroductions, short product life cycles and evolving industry standards. Our success depends, in substantial part, onthe timely and successful introduction of new products and upgrades of current products to comply with emergingindustry standards and to address competing technological and product developments carried out by our

18
competitors. The research and development of new, technologically-advanced products is a complex and uncertainprocess requiring high levels of innovation, as well as the accurate anticipation of technological and market trends.We may focus our resources on technologies that do not become widely accepted and are not commercially viable.In addition, products may contain defects or errors that are detected only after deployment. If our products are notcompetitive or do not work properly, our business will suffer.
Our results are subject to risks related to our significant investment in developing and introducing newproducts, such as: seamless mobility products; advanced wireless handsets; WiMAX and other advancedtechnologies for wireless broadband networks; products for transmission of telephony and high-speed data overhybrid fiber coaxial cable systems; integrated digital radios; and integrated public safety systems. These risksinclude: (i) difficulties and delays in the development, production, testing and marketing of products; (ii) customeracceptance of products; (iii) the development of, approval and compliance with industry standards; (iv) thesignificant amount of resources we must devote to the development of new technology; and (v) the ability todifferentiate our products and compete with other companies in the same markets.
Our success, in part, will be affected by the ability of our wireless businesses to successfully compete in theever-evolving markets in which we participate. We face intense competition in these markets from both establishedcompanies and new entrants. Product life cycles can be short and new products are expensive to develop and bringto market.
Our success is dependent, in part, upon our ability to form successful strategic alliances. If these arrangements donot develop as expected, our business may be adversely impacted.
We currently partner with industry leaders to meet customer product and service requirements and to developinnovative advances in design and technology. Some of our partnerships allow us to supplement internalmanufacturing capacity and share the cost of developing next-generation technologies. Other partnerships allow usto offer more services and features to our customers. If such arrangements do not develop as expected, ourbusiness could be adversely impacted.
We rely on third-party distributors, representatives and retailers to sell certain of our products.
In addition to our own distribution force, we offer our products through a variety of third-party distributors,representatives and retailers. Certain of our distributors or representatives may market products that compete withthe Company's products. The loss, termination or failure of one or more of our distributors or representatives toeffectively promote our products, or changes in the financial or business condition of these distributors,representatives or retailers, could affect the Company's ability to bring its products to market.
Our business will be harmed if we are found to have infringed intellectual property rights of third parties, or if ourintellectual property protection is inadequate to protect our proprietary rights.
Because our products are comprised of complex technology, we are involved in litigation regarding patent andother intellectual property rights. Third parties have asserted, and in the future may assert, claims against us allegingthat we have infringed their intellectual property rights. If we do not succeed in any such litigation, we could berequired to expend significant resources to pay damages, develop non-infringing intellectual property or to obtainlicenses to the intellectual property that is the subject of such litigation. However, we cannot be certain that anysuch licenses, if available at all, will be available to us on commercially reasonable terms. Also, defending theseclaims may be expensive and divert the time and efforts of our management and employees.
Our patent and other intellectual property rights are important competitive tools and may generate incomeunder license agreements. We regard our intellectual property rights as proprietary and attempt to protect themwith patents, copyrights, trademarks, trade secret laws, confidentiality agreements and other methods. We alsogenerally restrict access to and distribution of our proprietary information. Despite these precautions, it may bepossible for a third party to obtain and use our proprietary information or develop similar technologyindependently. In addition, effective patent, copyright, trademark and trade secret protection may be unavailable orlimited in certain foreign countries. Unauthorized use of our intellectual property rights by third parties and the costof any litigation necessary to enforce our intellectual property rights could have an adverse impact on our business.
As we expand our business, including through acquisitions, and compete with new competitors in new markets,the breadth and strength of our intellectual property portfolio in those new areas may not be as developed as in

19
our longer-standing businesses. This may expose us to a heightened risk of litigation and other challenges fromcompetitors in these new markets.
Our future operating results may be negatively impacted if we are not successful in licensing our intellectualproperty.
As part of business strategy, primarily in our Mobile Devices business, we strategically license our intellectualproperty. Our existing intellectual property may not continue to generate sales and operating earnings at currentlevels and we may not be successful at licensing new intellectual property.
Many of our components and products are manufactured by third parties and if third-party manufacturers lacksufficient quality control or if there are significant changes in the financial or business condition of suchthird-party manufacturers, it may have a material adverse effect on our business.
We rely on third-party suppliers for many of the components used in our products and we rely on third-partymanufacturers to manufacture many of our assemblies and finished products. If we are not able to engage suchmanufacturers with the capabilities or capacities required by our business, or such third parties lack sufficientquality control or if there are significant changes in the financial or business condition of such third parties, it couldhave a material adverse effect on our business.
We also have third-party arrangements for the design or manufacture of certain products, parts andcomponents. If we are not able to engage such parties with the capabilities or capacities required by our business,or these third parties fail to deliver quality products, parts and components on time and at reasonable prices, wecould have difficulties fulfilling our orders and our sales and profits could decline.
There is no guarantee that design wins will become actual orders and sales.
A ""design win'' occurs when a customer or prospective customer notifies us that our product has been selectedto be integrated with the customer's product. There can be delays of several months or more between the designwin and when a customer initiates actual orders. The design win may never become an actual order or sale.Further, if the customer's plans change, we may commit significant resources to design wins that do not result inactual orders.
We have taken, and continue to take, cost-reduction actions. Our ability to complete these actions and the impactof such actions on our business may be limited by a variety of factors. The cost reduction actions, in turn, mayexpose us to additional production risk and have an adverse effect on our sales and profitability.
We have been reducing costs and simplifying our product portfolios in all of our businesses. We havediscontinued product lines, exited businesses, consolidated manufacturing operations, increased manufacturing withthird parties and reduced our employee population.
The impact of these cost-reduction actions on our sales and profitability may be influenced by factorsincluding, but not limited to: (1) our ability to successfully complete these ongoing efforts; (2) our ability togenerate the level of cost savings we expect or that are necessary to enable us to effectively compete; (3) delays inimplementation of anticipated workforce reductions in highly-regulated locations outside of the United States,particularly in Europe and Asia; (4) decreases in employee morale and the failure to meet operational targets dueto the loss of employees; (5) our ability to retain or recruit key employees; (6) our manufacturing capacity,including capacity from third parties; and (7) the performance of other parties under contract manufacturingarrangements on which we rely for the manufacture of certain products, parts and components.
An important cost-reduction action has been to reduce the number of our facilities, including manufacturingfacilities. All of our businesses have exited certain facilities or consolidated facilities so that our products aremanufactured in fewer facilities. While we have business continuity and risk management plans in place in casecapacity is significantly reduced or eliminated at a given facility, the reduced number of alternative facilities couldcause the period of any manufacturing disruptions to be longer. As a result, we could have difficulties fulfilling ourorders and our sales and profits could decline.

20
We may not continue to have access to the capital markets to obtain long-term and short-term financing onacceptable terms and conditions, particularly if our credit ratings are downgraded.
From time to time we access the long-term and short-term capital markets to obtain financing. Although webelieve that we can continue to access the capital markets in 2007 on acceptable terms and conditions, our accessand the availability of acceptable terms and conditions are impacted by many factors, including: (i) our creditratings; (ii) the liquidity of the overall capital markets; and (iii) the current state of the economy, including thetelecommunications industry. There can be no assurances that we will continue to have access to the capitalmarkets on terms acceptable to the Company.
The Company's debt ratings are considered ""investment grade''. If our credit ratings were to decline threelevels from the current rating, we would no longer be considered investment grade and our financial flexibilitywould be reduced and our cost of borrowing would increase. Some of the factors that impact our credit ratings,including the overall economic health of the telecommunications industry, are outside of our control. There can beno assurances that our current credit ratings will continue.
Our commercial paper is rated ""A-1/P-2/F-1.'' Although we continue to issue commercial paper, there can beno assurances that we will continue to have access to the commercial paper markets on terms acceptable to theCompany.
We may not be able to borrow funds under our credit facility if we are not able to meet the conditions toborrowing in our facility.
We view our existing five-year revolving domestic credit facility as a source of available liquidity. This facilitycontains various conditions, covenants and representations with which we must be in compliance in order toborrow funds. We have never borrowed under this facility or previous domestic revolving credit facilities. However,if we wish to borrow under this facility in the future, there can be no assurance that we will be in compliance withthese conditions, covenants and representations.
We may continue to make strategic acquisitions of other companies or businesses and these acquisitions introducesignificant risks and uncertainties, including risks related to integrating the acquired businesses and achievingbenefits from the acquisitions.
In order to position ourselves to take advantage of growth opportunities, we have made, and may continue tomake, strategic acquisitions that involve significant risks and uncertainties. These risks and uncertainties include:(1) the difficulty in integrating newly-acquired businesses and operations in an efficient and effective manner;(2) the challenges in achieving strategic objectives, cost savings and other benefits from acquisitions; (3) the riskthat our markets do not evolve as anticipated and that the technologies acquired do not prove to be those neededto be successful in those markets; (4) the potential loss of key employees of the acquired businesses; (5) the riskof diverting the attention of senior management from our operations; (6) the risks of entering new markets inwhich we have limited experience; (7) risks associated with integrating financial reporting and internal controlsystems; (8) difficulties in expanding information technology systems and other business processes to accommodatethe acquired businesses; and (9) future impairments of goodwill of an acquired business.
In 2006 and early 2007, we made several strategic acquisitions. In January 2007, we acquired SymbolTechnologies, Inc. (""Symbol''). Symbol, which is now a wholly-owned subsidiary of Motorola, is being integratedwith Motorola and will form the core of Motorola's enterprise mobility business within our Networks andEnterprise segment. As a result of the acquisition, approximately 5,200 employees joined Motorola. In light of thesize of this transaction, some of the risks described above may be more significant.
Acquisition candidates in the industries in which we participate may carry higher relative valuations (based ontheir earnings) than we do. This is particularly evident in software and services businesses. Acquiring a business thathas a higher valuation than Motorola may be dilutive to our earnings, especially when the acquired business haslittle or no revenue. In addition, we may not pursue opportunities that are highly dilutive to near-term earnings andhave, in the past, foregone certain of these acquisitions.
Key employees of acquired businesses may receive substantial value in connection with a transaction in theform of change-in-control agreements, acceleration of stock options and the lifting of restrictions on other equity-based compensation rights. To retain such employees and integrate the acquired business, we may offer additionalretention incentives, but it may still be difficult to retain certain key employees.

21
The value of our investments in the securities of various companies fluctuates and it may be difficult for us torealize the value of these investments.
We hold a portfolio of investments in various companies. Since the majority of these securities representinvestments in technology companies, the fair market values of these securities are subject to significant pricevolatility. In addition, the realizable value of these securities is subject to market and other conditions.
We also have invested in numerous privately-held companies, many of which can still be considered in startupor developmental stages. These investments are inherently risky as the market for the technologies or products theyhave under development are typically in the early stages and may never materialize. We could lose all orsubstantially all of our investments in these companies, and in some cases have.
We purchase a large amount of credit insurance to mitigate some of our credit risks.
Our ability to sell certain of our receivables could be negatively impacted if we are not able to continue topurchase credit insurance in certain countries and in sufficient quantities. In addition, our success in certaincountries may be dependent on our ability to obtain sufficient credit insurance.
It may be difficult for us to recruit and retain the types of highly-skilled employees that are necessary to remaincompetitive.
Competition for key technical personnel in high-technology industries is intense. We believe that our futuresuccess depends in large part on our continued ability to hire, assimilate, retain and leverage the skills of qualifiedengineers and other highly-skilled personnel needed to compete and develop successful new products. We may notbe as successful as our competitors at recruiting, assimilating, retaining and utilizing these highly-skilled personnel.
The unfavorable outcome of litigation pending or future litigation could materially impact the Company.
Our financial results could be materially adversely impacted by unfavorable outcomes to any pending or futurelitigation. See ""Item 3 Ì Legal Proceedings.'' There can be no assurances as to the favorable outcome of anylitigation.
We are subject to a wide range of environmental, health and safety laws.
Our operations and the products we manufacture and/or sell are subject to a wide range of globalenvironmental, health and safety laws. Compliance with existing or future environmental, health and safety lawscould subject us to future costs, liabilities, impact our production capabilities, constrict our ability to sell, expandor acquire facilities and generally impact our financial performance.
Some of these laws relate to the use, disposal, clean up of, and exposure to hazardous substances. In theUnited States, laws often require parties to fund remedial studies or action regardless of fault. Motorola continuesto incur disposal cost and has ongoing remediation obligations. Changes to U.S. environmental laws or ourdiscovery of additional obligations under these laws could have a negative impact on Motorola.
Over the last several years, environmental laws focused on the energy efficiency of electronic products andaccessories; electronic products and packaging, recycling; and reducing or eliminating certain hazardous substancesin electronic products have expanded dramatically. These laws impact our products and make it more expensive tomanufacture and sell product. It may also be difficult to comply with the laws in a timely way and we may nothave compliant products available in the quantities requested by our customers, thereby impacting our sales andprofitability. For example, electronic products sold into Europe were required to meet stringent chemicalrestrictions by July 1, 2006 under the EU RoHS Directive. China is adopting similar requirements, the first of whichrequire labeling and chemical content disclosure for all electronic products sold into or within China afterFebruary 28, 2007. We expect these trends to continue. In addition, we anticipate increased consumer demand forthe voluntary reduction or elimination of certain hazardous constituents from our wireless handsets.

22
We may provide financing and financial guarantees to our customers, some of which may be for significantamounts.
The competitive environment in which we operate may require us to provide long-term customer financing to acustomer in order to win a contract. Customer financing arrangements may include all or a portion of the purchaseprice for our products and services. In some circumstances, these loans can be very large. We may also assistcustomers in obtaining financing from banks and other sources and may also provide financial guarantees on behalfof our customers. Our success, particularly in our infrastructure businesses, may be dependent, in part, upon ourability to provide customer financing on competitive terms and on our customers' creditworthiness.
We also provide revolving, short-term financing to certain customers and distributors that purchase ourequipment. Our success may be dependent, in part, on our ability to provide this financing. Our financial resultscould be negatively impacted if our customers or distributors fail to repay this revolving, short-term debt and/orour sales to such customers or distributors could be reduced in the event of real or perceived issues about thecredit quality of the customer or distributor.
When we lend our customers money in connection with the sale of our equipment, we are at risk of not beingrepaid.
While we have generally been able to place a portion of our customer financings with third-party lenders, aportion of these financings are supported directly by us. There can be higher risks of default associated with someof these financings, particularly when provided to start-up operations such as local network providers, customers indeveloping countries, or customers in specific financing-intensive areas of the industry (such as 3G wirelessoperators). Should customers fail to meet their obligations on new or existing loans, losses could be incurred andsuch losses could negatively impact our financial results.
Our large system contracts for infrastructure equipment and the resulting reliance on large customers maynegatively impact our business.
We are exposed to risks due to large system contracts for infrastructure equipment and the resulting relianceon large customers. These include: (1) the technological risks of such contracts, especially when the contractsinvolve new technology, and (2) financial risks under these contracts, including the estimates inherent in projectingcosts associated with large contracts and the related impact on operating results. We are also facing increasingcompetition from traditional system integrators and the defense industry as system contracts become larger andmore complicated. Political developments can impact the nature and timing of these large contracts.
It is important that we are able to obtain many different types of insurance, and if we are not able to obtaininsurance we are forced to retain the risk.
The Company has many types of insurance coverage and also self-insures for some risks and obligations. Theinsurance market was disrupted after the events of September 11, 2001 and the 2005 hurricanes. While the cost andavailability of most insurance has stabilized, there are still certain types and levels of insurance that remainunavailable. Natural disasters and certain risks arising from securities claims and public liability are potential self-insured events that could negatively impact our financial performance.
Government regulation of radio frequencies may limit the growth of the wireless communications industry orreduce barriers to entry for new competitors.
Radio frequencies are required to provide wireless services. The allocation of frequencies is regulated in theU.S. and other countries throughout the world and limited spectrum space is allocated to wireless services. Thegrowth of the wireless and personal communications industry may be affected if adequate frequencies are notallocated or, alternatively, if new technologies are not developed to better utilize the frequencies currently allocatedfor such use. Industry growth has been and may continue to be affected by the cost of new licenses required to usefrequencies and any related frequency relocation costs.
The U.S. leads the world in spectrum deregulation, allowing new wireless communications technologies to bedeveloped and offered for sale. Examples include wireless local area network systems, such as WiFi, and wide areanetwork systems, such as WiMAX. Other countries have also deregulated portions of the available spectrum toallow these and other technologies, which can be offered without spectrum license costs. Deregulation mayintroduce new competition and new opportunities for Motorola and our customers.

23
Changes in government policies and laws or economic conditions may adversely affect our financial results.
Our results may be affected by changes in trade, monetary and fiscal policies, laws and regulations, or otheractivities of U.S. and non-U.S. governments, agencies and similar organizations. Our results may also be affected bysocial and economic conditions, which impact our operations, including in emerging markets in Asia, India, LatinAmerica and Eastern Europe, and in markets subject to ongoing political hostilities and war, including the MiddleEast.
In addition, there are currently few laws or regulations that apply directly to access to, or commerce on, theInternet. We could be adversely affected by any such regulation in any country where we operate. The adoption ofsuch measures could decrease demand for our products and at the same time increase the cost of selling suchproducts.
Consolidations in both the cable and telecommunication industries may adversely impact our business.
The cable and telecommunication industries have experienced consolidation, and this trend is expected tocontinue according to industry estimates. Industry consolidation could result in delays of purchases or in theselection of new suppliers by the merged companies to equipment suppliers such as Motorola and our competitors.
Due to continuing consolidation within the cable industry worldwide, a small number of operators own amajority of cable television systems and account for a significant portion of the capital spending made by cabletelevision system operators. Net sales to the Connected Home Solutions segment's largest customer, Comcastrepresented approximately 29% of the Connected Home Solutions segment's total net sales in 2006.
Regulatory changes impacting our cable products may adversely impact our business.
Currently, reception of digital television programming from the cable broadband network requires a set-topbox with certain technology. This security technology has limited the availability of set-top boxes to thosemanufactured by a few cable network manufacturers, including Motorola. The FCC has enacted regulationsrequiring separation of security functionality from set-top boxes to increase competition and encourage the sale ofset-top boxes in the retail market by July 1, 2007. Traditionally, cable service providers sold or leased the set-topbox to their customer. If the retail market develops for set-top boxes and televisions capable of accepting thesecurity modules, sales of our set-top boxes may be negatively impacted. In addition, we risk lost sales ifcompetitors bring set-top boxes with separable security to market before we do.
We rely on complex information technology systems and networks to operate our business. Any significant systemor network disruption could have a material adverse impact on our operations, sales and operating results.
We rely on the efficient and uninterrupted operation of complex information technology systems andnetworks. All information technology systems are potentially vulnerable to damage or interruption from a variety ofsources, including but not limited to computer viruses, security breach, energy blackouts, natural disasters,terrorism, war and telecommunication failures. There also may be system or network disruptions if new orupgraded business management systems are defective or are not installed properly. We have implemented variousmeasures to manage our risks related to system and network disruptions, but a system failure or security breachcould negatively impact our operations and financial results. In addition, we may incur additional costs to remedythe damages caused by these disruptions or security breaches.
Our share price has been and may continue to be volatile.
Our share price has been volatile due, in part, to generally volatile securities markets, and the volatility in thetelecommunications and technology companies' securities markets in particular. Factors other than our financialresults that may affect our share price include, but are not limited to, market expectations of our performance,capital spending plans of our customers, and the level of perceived growth in the industries in which we participate.
The level of returns on pension and retirement plan assets could affect our earnings in future periods.
The funding obligations for our pension plans are impacted by the performance of the financial markets,particularly the equity markets, and interest rates. Funding obligations are determined under government regulationsand are measured each year based on the value of assets and liabilities on a specific date. If the financial marketsdo not provide the long-term returns that are expected under the governmental funding calculations we could be

24
required to make larger contributions. The equity markets can be, and recently have been, very volatile, andtherefore our estimate of future contribution requirements can change dramatically in relatively short periods oftime. Similarly, changes in interest rates can impact our contribution requirements. In a low interest rateenvironment, the likelihood of required contributions in the future increases.
Compliance with changing regulation of corporate governance and public disclosure may result in additionalexpenses.
Compliance with changing laws, regulations and standards relating to corporate governance and publicdisclosure, including the Sarbanes-Oxley Act of 2002, new SEC regulations and changes to the New York StockExchange rules, has required us to expend significant resources and incur additional expenses and will continue todo so. We are committed to maintaining the highest standards of corporate governance and public disclosure. As aresult, we will continue to invest necessary resources to comply with evolving laws, regulations and standards, andthis investment may continue to result in increased general and administrative expenses and a diversion ofmanagement time and attention from revenue-generating activities.
The outcome of currently ongoing and future examinations of our income tax returns by the IRS.
We are subject to continued examination of our income tax returns by the Internal Revenue Service and othertax authorities. We regularly assess the likelihood of adverse outcomes resulting from these examinations todetermine the adequacy of our provision for income taxes. There can be no assurance that the outcomes fromthese continuing examinations will not have an adverse effect on future operating results.
Item 1B: Unresolved Staff Comments
None.
Item 2: Properties
Motorola's principal executive offices are located at 1303 East Algonquin Road, Schaumburg, Illinois 60196.Motorola also operates manufacturing facilities and sales offices in other U.S. locations and in many othercountries. (See ""Item 1: Business'' for information regarding the location of the principal manufacturing facilitiesfor each of Motorola's business segments.) Motorola owns 41 facilities (manufacturing, sales, service and office),21 of which are located in North America and 20 of which are located in other countries. Motorola leases 295facilities, 90 of which are located in North America and 205 of which are located in other countries.
As compared to 2005, the number of facilities owned or leased, excluding new acquisitions, was reducedprimarily because of the optimization of space and workplace mobility programs being utilized instead of addingsites and space. New business acquisitions closed to date have added 21 sites to the Motorola real estate portfolioworldwide. In addition, as part of Motorola's overall strategy to reduce operating costs and improve the financialperformance of the corporation, a number of businesses and facilities have either been sold or are currently forsale. During 2006, facilities in Rohnert Park, California and Ichon, Korea and land parcels in Elgin, Illinois andTempe, Arizona were sold. A facility in Deer Park, Illinois was sold as part of the sale of the automotiveelectronics business. Sites at Glen Rock, New Jersey and Guangzhou, China and land parcels in Anderson, SouthCarolina and Tempe, Arizona are currently up for sale.
Motorola generally considers the productive capacity of the plants operated by each of its business segments tobe adequate and sufficient for the requirements of each business group. The extent of utilization of suchmanufacturing facilities varies from plant to plant and from time to time during the year.
A substantial portion of Motorola's products are manufactured in Asia, primarily China, either in our ownfacilities or in the facilities of others who manufacture and assemble products for Motorola. If manufacturing inthe region was disrupted, Motorola's overall productive capacity could be significantly reduced.

25
Item 3: Legal Proceedings
Personal Injury Cases
Cases relating to Wireless Telephone Usage
On May 26, 2000, a purported nationwide class action suit Naquin, et al., v. Nokia Mobile Phones, et al. wasfiled against Motorola and several other cellular phone manufacturers and carriers in the Civil District Court for theParish of Orleans, State of Louisiana. The case alleges the failure to incorporate a remote headset into cellularphones rendered the phones defective by exposing users to biological injury and health risks and plaintiffs seekcompensatory damages and injunctive relief. Similar state class action suits were filed on April 19, 2001, in theCircuit Court for Baltimore City, Maryland, Pinney and Colonell v. Nokia, Inc. et al., and in the PennsylvaniaCourt of Common Pleas, Philadelphia County, Farina v. Nokia, Inc., et al.; and on April 20, 2001, in the SupremeCourt of the Sate of New York, County of Bronx, Gilliam et al., v. Nokia, Inc., et al. During 2001, after removalto federal court, the Judicial Panel on Multidistrict Litigation (""MDL Panel'') transferred the above four cases tothe United States District Court for the District of Maryland (the ""MDL Court'') for coordinated or consolidatedpretrial proceedings in the matter called In re Wireless Telephone Radio Frequency Emissions Products LiabilityLitigation (the ""MDL Proceeding'').
The Pinney and Gilliam plaintiffs dismissed these cases without prejudice in April and March 2006,respectively. On November 6, 2006, plaintiffs dismissed the Naquin case without prejudice.
In 2005, as a result of a decision of the United States Court of Appeals for the Fourth Circuit, the Farina casewas remanded to Pennsylvania state courts from which it was removed. In late 2005 and early 2006, Plaintiffs inFarina amended their complaints to add allegations that cellular telephones sold without headsets are defectivebecause they present a safety risk when used while driving and to seek punitive damages. Farina also seeksdeclaratory relief and treble and statutory damages. After the Farina complaint was amended, on February 17,2006, a newly-added defendant to the Farina case removed the case to federal court. As of June 15, 2006, theMDL Panel formally transferred the newly-removed Farina case to the MDL Court. On November 10, 2006,defendants moved to dismiss Farina and filed a motion for referral to the FCC. On November 10, 2006, plaintiffmoved to remand Farina to state court. Plaintiff also filed an alternative motion for suggestion of remand to thetransferor court in Philadelphia. All Farina motions are pending before the MDL Court.
During 2001 and 2002, several additional cases were filed alleging that use of a cellular phone caused amalignant brain tumor: Murray v. Motorola, Inc., et al., filed November 15, 2001, in the Superior Court of theDistrict of Columbia; Agro et. al., v. Motorola, Inc., et al., filed February 26, 2002, in the Superior Court of theDistrict of Columbia; Cochran et. al., v. Audiovox Corporation, et al., filed February 26, 2002, in the SuperiorCourt of the District of Columbia and Schofield et. al., v. Matsushita Electric Corporation of America, et al., filedFebruary 26, 2002, in the Superior Court of the District of Columbia. Each complaint seeks compensatory damagesin excess of $25 million, consequential damages in excess of $25 million and punitive and/or exemplary damages inexcess of $100 million. These cases were removed to federal court and transferred to the MDL Court. On July 19,2004, the MDL Court found that there was no federal court jurisdiction over Murray, Agro, Cochran and Schofieldand remanded those cases to the Superior Court for the District of Columbia. On November 30, 2004, defendantsmoved to dismiss the Murray, Agro, Cochran and Schofield complaints. That motion remains pending before theSuperior Court for the District of Columbia.
Brower v. Motorola, Inc., et al., filed April 19, 2001, in the Superior Court of the State of California, Countyof San Diego, also seeks relief on behalf of an individual who had brain cancer. A first amended complaint wasfiled in Brower to add class allegations that defendants engaged in deceptive and misleading actions by falselystating that cellular phones are safe and by failing to disclose studies that allegedly show cellular phones can causeharm. Brower seeks injunctive relief, restitution, compensatory and punitive damages and disgorgement of profits.On September 9, 2002, Dahlgren v. Motorola, Inc., et al., was filed in the D.C. Superior Court containing classclaims similar to Brower. Dahlgren seeks injunctive and equitable relief, actual damages, treble or statutorydamages, punitive damages and a constructive trust. These two cases were also removed to federal court andtransferred to the MDL Court. On June 10, 2005, the Dahlgren case was remanded to the Superior Court for theDistrict of Columbia. On December 9, 2005, plaintiff filed an amended complaint in Dahlgren. Defendants movedto dismiss Dahlgren on February 3, 2006. That motion is still pending. On February 15, 2006, the MDL Courtremanded Brower to California state court. The California state court set a deadline of January 19, 2007, for thefiling of an amended complaint. To date, no amended complaint has been filed.

26
Iridium-Related Cases
Class Action Securities Lawsuits
Motorola has been named as one of several defendants in putative class action securities lawsuits arising out ofalleged misrepresentations or omissions regarding the Iridium satellite communications business, which onMarch 15, 2001, were consolidated in the federal district court in the District of Columbia under Freeland v.Iridium World Communications, Inc., et al., originally filed on April 22, 1999. Plaintiff's motion for classcertification was granted on January 9, 2006 and the trial is scheduled to begin on May 22, 2008.
Bankruptcy Court Lawsuit
Motorola was sued by the Official Committee of the Unsecured Creditors of Iridium in the Bankruptcy Courtfor the Southern District of New York on July 19, 2001. In re Iridium Operating LLC, et al. v. Motorola assertsclaims for breach of contract, warranty, fiduciary duty and fraudulent transfer and preferences, and seeks in excessof $4 billion in damages. Trial began on the solvency portion of these claims on October 23, 2006.
On March 30, 2001, the United States Bankruptcy Court for the Southern District of New York presiding overthe Iridium bankruptcy proceeding approved a settlement between the unsecured creditors of the Iridium Debtorsand the Iridium Debtors' pre-petition secured lenders. The settlement agreement creates and provides for thefunding of a litigation vehicle for the purpose of pursuing litigation against Motorola. Motorola appealed theapproval of the settlement to the United States District Court for the Southern District of New York. On April 7,2005, the District Court entered an order denying Motorola's appeal and affirming the settlement. On May 4, 2005,Motorola filed a notice of appeal to the United States Court of Appeals for the Second Circuit. The appeal is fullybriefed and argued and remains pending.
Iridium India Lawsuits
Motorola and certain of its current and former officers and directors were named as defendants in a privatecriminal complaint filed by Iridium India Telecom Ltd. (""Iridium India'') in October 2001 in the Court of the ExtraJudicial Magistrate, First Class, Khadki, Pune, India. The Iridium India Telecom Ltd. v. Motorola, Inc. et al. complaintalleges that the defendants conspired to, and did, commit the criminal offense of ""cheating'' by fraudulently inducingIridium India to purchase gateway equipment from Motorola, to acquire Iridium stock, and to invest in developing amarket for Iridium services in India. Under the Indian penal code, ""cheating'' is punishable by imprisonment for up to7 years and a fine of any amount. The court may also require defendants to compensate the victim for its losses, whichthe complaint estimates at about $100 million. In August 2003, the Bombay High Court granted Motorola's petition todismiss the criminal action against Motorola and the individual defendants. Iridium India has petitioned the IndianSupreme Court to exercise its discretion to review that dismissal, and that petition is pending.
In September 2002, Iridium India also filed a civil suit in the Bombay High Court against Motorola and Iridium.The suit alleges fraud, intentional misrepresentation and negligent misrepresentation by Motorola and Iridium ininducing Iridium India to purchase gateway equipment from Motorola, to acquire Iridium stock, and to invest indeveloping a market for Iridium services in India. Iridium India claims in excess of $200 million in damages andinterest. Following extensive proceedings in the trial court and on appeal related to Iridium India's motion for interimrelief, Motorola has deposited approximately $44 million in a specially designated account in India, and the IndianSupreme Court has accepted for a full hearing at a later date Motorola's appeal regarding interim relief.
Shareholder Derivative CaseÌIridium and Telsim
M&C Partners III v. Galvin, et al., filed January 10, 2002, in the Circuit Court of Cook County, Illinois, is ashareholder derivative action against fifteen current and former members of the Motorola Board of Directors andMotorola as a nominal defendant. The lawsuit alleges that the Motorola directors breached their fiduciary duty tothe Company and/or committed gross mismanagement of Motorola's business and assets by allowing Motorola toengage in improper practices with respect to Iridium and Telsim (as defined below).
In April 2006, the Court held that the plaintiff could not pursue its Iridium-related claims, but denied withoutprejudice plaintiff's motion to file a Third Amended Complaint with respect to new allegations pertaining toTelsim. Following the Court's ruling for defendants on the Iridium-related claims and plaintiff's July 20, 2006demand with respect to Telsim-related claims, the Motorola Board of Directors appointed an investigatorycommittee to investigate those Telsim-related claims.
27
An unfavorable outcome in one or more of the Iridium-related cases still pending could have a materialadverse effect on Motorola's consolidated financial position, liquidity or results of operations.
Telsim-Related Cases
In April 2001, Telsim Mobil Telekomunikasyon Hizmetleri A.S. (""Telsim''), a wireless telephone operator inTurkey, defaulted on the payment of approximately $2 billion of loans owed to Motorola and its subsidiaries(the ""Telsim Loans''). Motorola fully reserved the carrying value of the Telsim Loans in the second quarter of2002. The Uzan family controlled Telsim until 2004 when an agency of the Turkish government took over controlof Telsim. Telsim was sold by the Turkish government to Vodafone in 2006. Motorola received payment from thesale, pursuant to the settlement described below. Motorola is involved in several matters related to Telsim.
October 2005 Settlement
In 2005, Motorola signed an agreement resolving its disputes regarding the Telsim Loans with Telsim and theGovernment of Turkey (the ""Telsim Dispute Agreement''). Under the Telsim Dispute Agreement, Motorola waspaid $410 million on May 24, 2006 (in addition to the $500 million Motorola received pursuant to the TelsimDispute Agreement in 2005) upon Vodafone's completion of its acquisition of Telsim as final payment. Motorolaalso agreed that it will not pursue collection efforts against the three corporate defendants under TMSF control(Unikom Iletisim Hizmetleri Pazarlama A.S., Standart Pazarlama A.S., and Standart Telekomunikasyon BilgisayarHizmetleri A.S.) (the ""Corporate Defendants''), that are subject to its final judgment in the U.S. courts related tothe matter. The Telsim Dispute Agreement permits Motorola to continue its efforts (except in Turkey and threeother countries, which restriction is subject to certain conditions) to enforce the U.S. Judgment described belowagainst the Uzan family. In addition, pursuant to the Telsim Dispute Agreement, Telsim and its related companieshave dismissed all litigation, including arbitrations, pending against Motorola.
U.S. Judgment
The Company continues its efforts to collect on its judgment of $2.13 billion (the ""U.S. Judgment'') forcompensatory damages rendered by the United States District Court for the Southern District of New York(the ""District Court'') against the Uzans on July 31, 2003 and affirmed by the U.S. Court of Appeals for the SecondCircuit (the ""Second Circuit'') in 2004 and in connection with foreign proceedings against the Uzan family. However,the Company believes that the ongoing litigation, collection and/or settlement processes against the Uzan family will bevery lengthy in light of the Uzans' continued resistance to satisfy the judgment against them and their decision to violatevarious courts' orders, including orders holding them in contempt of court. Following a remand from the Second Circuitof the U.S. Judgment by the District Court, on February 8, 2006, the District Court awarded a judgment in favor ofMotorola for $1 billion in punitive damages against the Uzan family and their co-conspirator, Antonio LunaBettancourt. The defendants have appealed this judgment to the Second Circuit.
Class Action Securities Lawsuits
A purported class action lawsuit, Barry Family LP v. Carl F. Koenemann, was filed against the former chieffinancial officer of Motorola on December 24, 2002 in the United States District Court for the Southern District ofNew York, alleging breach of fiduciary duty and violations of Section 10(b) of the Securities Exchange Act of1934 and SEC Rule 10b-5. In 2003, it was consolidated with a number of related cases as In re Motorola SecuritiesLitigation in the United States District Court for the Northern District of Illinois (the ""Illinois District Court'').The plaintiffs allege that the price of Motorola's stock was artificially inflated by a failure to disclose vendorfinancing to Telsim Mobil Telekomunikasyon Hizmetleri A.S. (""Telsim''), in connection with the sale oftelecommunications equipment by Motorola as well as other related aspects of Motorola's dealings with Telsim.On August 25, 2004, the Illinois District Court issued its decision on Motorola's motion to dismiss, granting themotion in part and denying it in part. The court dismissed without prejudice the fraud claims against the individualdefendants and denied the motion to dismiss as to Motorola. The plaintiffs chose not to file an amendedcomplaint; therefore, the fraud claims against the individual defendants are dismissed. The court, however, declinedto dismiss the plaintiffs' claims that the individual defendants were ""controlling persons of Motorola.'' During2005, the court certified the case as a class action. The case is scheduled for trial beginning April 16, 2007.
A purported class action, Howell v. Motorola, Inc., et al., was filed against Motorola and various of itsdirectors, officers and employees in the United States District Court for the Northern District of Illinois on July 21,2003, alleging breach of fiduciary duty and violations of the Employment Retirement Income Security Act

28
(""ERISA''). The complaint alleged that the defendants had improperly permitted participants in the Motorola401(k) Plan (the ""Plan'') to purchase or hold shares of common stock of Motorola because the price ofMotorola's stock was artificially inflated by a failure to disclose vendor financing to Telsim in connection with thesale of telecommunications equipment by Motorola. The plaintiff sought to represent a class of participants in thePlan for whose individual accounts the Plan purchased or held shares of common stock of Motorola from""May 16, 2000 to the present'', and sought an unspecified amount of damages. On September 30, 2005, the districtcourt dismissed the second amended complaint filed on October 15, 2004 (the ""Howell Complaint''). Plaintifffiled an appeal to the dismissal on October 27, 2005. In addition, on October 19, 2005, plaintiff's counsel filed amotion seeking to add a new lead plaintiff and assert the same claims set forth in the Howell Complaint (the""October 19th Motion''). On August 11, 2006, the district court denied the October 19th Motion, finding thesecond purported plaintiff lacked standing to sue. Plaintiff filed an appeal. On November 20, 2006, the appealscourt dismissed the second appeal. Three new purported lead plaintiffs have since intervened in the case, and havefiled a motion for class certification seeking to represent Plan participants for whose individual accounts the Planpurchased and/or held shares of Motorola common stock from May 16, 2000 through December 31, 2002.
Securities and Exchange Commission Investigation
Motorola was involved in an investigation by the Securities and Exchange Commission (""SEC'') regardingTelsim matters. On February 5, 2007, the investigation was terminated by the SEC and the Company was notifiedthat no enforcement action was recommended by the SEC.
Charter Communications Class Action Securities Litigation
On August 5, 2002, Stoneridge Investment Partners LLC filed a purported class action in the United StatesDistrict Court for the Eastern District of Missouri (""District Court'') against Charter Communications, Inc.(""Charter'') and certain of its officers, alleging violations of Section 10(b) of the Securities Exchange Act of 1934and Rule 10b-5 promulgated thereunder relating to Charter securities. This complaint did not name Motorola as adefendant, but asserted that Charter and the other named defendants had violated the securities laws in connectionwith, inter alia, a transaction with Motorola. On August 5, 2003, the plaintiff amended its complaint to addMotorola, Inc. as a defendant. As to Motorola, the amended complaint alleges a claim under Section 10(b) of theSecurities Exchange Act of 1934 and Rule 10b-5(a)-(c) promulgated thereunder relating to Charter securities andseeks an award of compensatory damages. The District Court issued a final judgment dismissing Motorola from thecase which plaintiff appealed to the United States Court of Appeals for the Eighth Circuit (""Court of Appeals'').On April 11, 2006, the Court of Appeals affirmed the final judgment of the District Court dismissing Motorolafrom the case. On July 7, 2006 plaintiff filed a petition for certiorari seeking review of the Court of Appealsdecision by the United States Supreme Court. On October 20, 2006, Motorola submitted its response opposing thepetition.
In re Adelphia Communications Corp. Securities and Derivative Litigation
On December 22, 2003, Motorola was named as a defendant in two cases relating to the In re AdelphiaCommunications Corp. Securities and Derivative Litigation (the ""Adelphia MDL''). The Adelphia MDL consistsof at least fourteen individual cases and one purported class action that were filed in or have been transferred tothe United States District Court for the Southern District of New York. First, Motorola was named as a defendantin the Second Amended Complaint in the individual case of W.R. Huff Asset Management Co. L.L.C. v. Deloitte &Touche LLP, et al. (the ""Huff Complaint'') This case was originally filed by W.R. Huff Asset Management Co.L.L.C. on June 7, 2002, in the United States District Court for the Western District of New York and wassubsequently transferred to the Southern District of New York as related to the Adelphia MDL. Several otherindividual and corporate defendants are also named in the amended complaint along with Motorola.
As to Motorola, the complaint alleges a claim arising under Section 10(b) of the Securities Exchange Act of1934 and Rule 10b-5 promulgated thereunder relating to Adelphia securities, and seeks recovery of theconsideration paid by plaintiff for Adelphia debt securities, compensatory damages, costs and expenses of litigationand other relief. Motorola filed a motion to dismiss this complaint on March 8, 2004, which is awaiting decision.
Also on December 22, 2003, Motorola was named as a defendant in Stocke v. John J. Rigas, et al. This casewas originally filed in Pennsylvania and was subsequently transferred to the Southern District of New York asrelated to the Adelphia MDL. Several other individual and corporate defendants are also named in the amendedcomplaint along with Motorola. As to Motorola, the complaint generally makes the same allegations as the HuffComplaint and a state law claim of aiding and abetting fraud relating to Adelphia securities. The complaint seeks

29
return of the consideration paid by plaintiff for Adelphia securities, punitive damages and other relief. Motorolafiled a motion to dismiss this complaint on April 12, 2004 which is awaiting decision.
On July 23, 2004, Motorola was named as a defendant in Argent Classic Convertible Arbitrage Fund L.P., et al. v.Scientific-Atlanta, Inc., et al. (the ""Argent Complaint''). The Argent Complaint was filed against Scientific Atlanta andMotorola in the Southern District of New York. The Argent Complaint generally makes the same allegations as theother previously-disclosed cases relating to the In re Adelphia Communications Corp. Securities and DerivativeLitigation that have been transferred to the Southern District of New York. The complaint seeks compensatory damagesand other relief. On October 12, 2004, Motorola filed a motion to dismiss the Argent Complaint which is awaitingdecision.
On September 14, 2004, Motorola was named in a complaint filed in state court in Los Angeles, California, namingMotorola and Scientific-Atlanta and certain officers of Scientific-Atlanta, Los Angeles County Employees RetirementAssociation et al. v. Motorola, Inc., et al. The complaint raises claims under California law for aiding and abetting fraudand conspiracy to defraud and generally makes the same allegations as the other previously-disclosed cases relating tothe In re Adelphia Communications Corp. Securities and Derivative Litigation that have been transferred to theSouthern District of New York. There are no new substantive allegations. The complaint seeks compensatory damages,opportunity-cost damages, punitive and other exemplary damages and other relief. In late 2004, the Multi-DistrictLitigation Panel transferred the case to federal court in New York, which transfer is now final. On September 19, 2005,Motorola filed a motion to dismiss the complaint in this action which is awaiting decision.
On October 25, 2004, Motorola was named in a complaint filed in state court in Fulton County, Georgia, namingMotorola and Scientific-Atlanta and certain officers of Scientific-Atlanta, AIG DKR SoundShore Holdings, Ltd., et al. v.Scientific-Atlanta Inc., et al. The complaint raises claims under Georgia law of conspiracy to defraud and generallymakes the same allegations as the other previously disclosed cases relating to the In re Adelphia Communications Corp.Securities and Derivative Litigation that have already been filed and transferred to the Southern District of New York.The complaint seeks damages and statutory compensation, punitive damages and other relief. On April 18, 2005, theMulti-District Litigation Panel issued a final order transferring the case to New York and that transfer is final. OnSeptember 19, 2005, Motorola filed a motion to dismiss the complaint in this action which is awaiting decision.
Adelphia Communications Corp.ÌRelated Cases
Bankruptcy Court Lawsuit
On June 23, 2006, Adelphia objected to Motorola's claim for payment of $67 million and asserted causes ofaction against Motorola including preferences, avoidance of liens, fraudulent transfers, equitable subordination andaiding and abetting fraud as part of the ongoing Adelphia bankruptcy action in the Bankruptcy Court for theSouthern District of New York. Plaintiff is alleging damages in excess of $1 billion against Motorola for the abovestated causes of action.
Securities and Exchange Commission Investigation
Motorola is involved in an ongoing investigation by the Securities and Exchange Commission regardingAdelphia matters, which remains outstanding. However, the Company has reached a settlement agreement with thestaff of the Northeast Regional office of the SEC that is subject to final approval of the Commission.
Motorola is a defendant in various other suits, claims and investigations that arise in the normal course ofbusiness. In the opinion of management, and other than discussed above with respect to the Iridium cases, theultimate disposition of the Company's pending legal proceedings will not have a material adverse effect on theconsolidated financial position, liquidity or results of operations.

30
Item 4: Submission of Matters to a Vote of Security Holders
Not applicable.
Executive Officers of the Registrant
Following are the persons who were the executive officers of Motorola as of February 28, 2007, their ages asof January 1, 2007, their current titles and positions they have held during the last five years:
Edward J. Zander; age 59; Chairman and Chief Executive Officer since January 2004; Managing Director ofSilver Lake Partners from July 2003 to December 2003; President and COO of Sun Microsystems, Inc. from January1998 until June 2002.
Gregory Q. Brown; age 46; Executive Vice President, President, Networks and Enterprise since January 2005;Executive Vice President and President, Commercial, Government and Industrial Solutions Sector from January2003 to January 2005; Chairman of the Board and Chief Executive Officer of Micromuse, Inc. from February 1999to December 2002.
David W. Devonshire; age 61; Executive Vice President, Chief Financial Officer since April 2002; ExecutiveVice President and Chief Financial Officer of Ingersoll-Rand Company from January 2000 to January 2002.
Ruth A. Fattori; age 54; Executive Vice President, Human Resources since November 2004; Senior VicePresident, JP Morgan Chase & Co., from April 2003 to November 2004; Executive Vice President, Process andProductivity, Conseco, Inc. from January 2001 to December 2002; Senior Vice President, Human Resources,Siemens Corporation from October 1999 to January 2001.
Kenneth C. Keller, Jr.; age 45; Executive Vice President, Chief Marketing Officer since October 2006; GlobalLeader, Infant Nutrition, HJ Heinz Company from July 2006-October 2006; Chairman and Chief Executive Officerof Heinz Italy from June 2004 to June 2006; Chief Growth Officer of HJ Heinz Company from January 2003 toMay 2004; Managing Director (US) and Global LeaderÌKetchup, Condiments and Sauces, HJ Heinz Companyfrom January 2000 to December 2003.
A. Peter Lawson; age 60; Executive Vice President, General Counsel and Secretary since May 1998.
Daniel M. Moloney; age 47; Executive Vice President, President, Connected Home Solutions since January 2005;Executive Vice President and President, Broadband Communications Sector (""BCS'') from June 2002 to January2005; Senior Vice President and General Manager, IP Systems Group, BCS from February 2000 to June 2002.
Patricia B. Morrison; age 47; Executive Vice President, Chief Information Officer since February 2007; SeniorVice President, Chief Information Officer since July 2005; Executive Vice President, Chief Information Officer ofOffice Depot, Inc. from January 2002 to April 2005.
Richard N. Nottenburg; age 52; Executive Vice President, Chief Strategy Officer since March 2005; Senior VicePresident and Chief Strategy Officer from July 2004 to March 2005; Strategic Advisor to Motorola, Inc. February 2004to July 2004; Vice President and General Manager of Vitesse Semiconductor Corporation from August 2003 to January2004; Chairman of the Board, President and Chief Executive Officer of Multilink from January 1995 to August 2003.
Stuart C. Reed; age 45; Executive Vice President, Chief Supply Chain Officer since February 2006; Senior VicePresident, Chief Supply Chain Officer from April 2005 to February 2006; Vice President, Worldwide Manufacturingand Engineering, Integrated Supply Chain, IBM Corporation (""IBM'') from January 2005 to April 2005; VicePresident, Systems, Storage and Software Products, IBM from August 2004 to January 2005; Vice President, Systemsand Storage, Worldwide Manufacturing Operations, IBM from January 2003 to August 2004; Vice President,Strategy, Process and Systems, IBM from January 2002 to January 2003; Vice President, Integrated Supply Chain,IBM from June 1999 to January 2002.
Padmasree Warrior; age 46; Executive Vice President, Chief Technology Officer since March 2005; Senior VicePresident and Chief Technology Officer from January 2003 to March 2005; Corporate Vice President and GeneralManager, Energy Systems Group, Integrated Electronic Systems Sector from April 2002 to January 2003; CorporateVice President and General Manager, Thoughtbeam, Inc., a wholly-owned subsidiary of Motorola, Inc., fromOctober 2001 to April 2002.
The above executive officers will serve as executive officers of Motorola until the regular meeting of theBoard of Directors in May 2007 or until their respective successors shall have been elected. There is no familyrelationship between any of the executive officers listed above.

31
PART II
Item 5: Market for Registrant's Common Equity, Related Stockholder Matters and IssuerPurchases of Equity Securities
Motorola's common stock is listed on the New York and Chicago Stock Exchanges. The number ofstockholders of record of Motorola common stock on January 31, 2007 was 75,892.
The remainder of the response to this Item incorporates by reference Note 16, ""Quarterly and Other FinancialData (unaudited)'' of the Notes to Consolidated Financial Statements appearing under ""Item 8: FinancialStatements and Supplementary Data''.
The following table provides information with respect to acquisitions by the Company of shares of its commonstock during the quarter ended December 31, 2006.
ISSUER PURCHASES OF EQUITY SECURITIES
(d) Maximum Number(c) Total Number (or Approximate Dollar
of Shares Purchased Value) of Shares that(a) Total Number (b) Average Price as Part of Publicly May Yet Be Purchased
of Shares Paid per Announced Plans Under the Plans orPeriod Purchased(1)(4) Share(1)(2) or Programs(3)(4) Programs(5)
10/1/06 to 10/28/06 5,284 $25.82 0 $4,500,000,00010/29/06 to 11/25/06 15,613,158 $22.39 15,613,158 $4,150,401,66911/26/06 to 12/31/06 16,430,030 $21.29 16,425,602 $3,800,689,819
Total 32,048,472 $21.83 32,038,760
(1) In addition to purchases under the 2006 Stock Repurchase Program (as defined below), included in this column are transactions under theCompany's equity compensation plans involving the delivery to the Company of 8,445 shares of Motorola common stock to satisfy taxwithholding obligations in connection with the vesting of restricted stock granted to Company employees and the surrender of 1,267 sharesof Motorola common stock to pay the option exercise price in connection with the exercise of employee stock options.
(2) Average price paid per share of stock repurchased under the 2006 Stock Repurchase Program is execution price, excluding commissions paidto brokers.
(3) On May 18, 2005, the Company announced that its Board of Directors authorized the Company to repurchase up to $4 billion of itsoutstanding shares of common stock over a period of up to 36 months ending in May 2008, subject to market conditions (the ""2005 StockRepurchase Program''). On July 24, 2006, the Company announced that it entered into an agreement to repurchase approximately$1.2 billion of its outstanding shares of common stock. This repurchase, which was accomplished through an accelerated stock buyback(""ASB'') agreement, together with all repurchases made prior to the date thereof, completed the repurchases authorized under the 2005Stock Repurchase Program. Under the ASB the Company immediately paid $1.2 billion and received an initial 37.9 million shares in Julyfollowed by an additional 11.3 million shares in August. In October, the Company received an additional 1.3 million shares, as the finaladjustment under the ASB. The total shares repurchased under the ASB were 50.5 million.
(4) The 1.3 million shares delivered under the ASB that were delivered in October, but paid for in July, have not been reflected in Octoberpurchases.
(5) The Company also announced on July 24, 2006 that its Board of Directors authorized the Company to repurchase up to an additional$4.5 billion of its outstanding shares of common stock over a period of up to 36 months ending in June 2009, subject to market conditions(the ""2006 Stock Repurchase Program'').

32
PERFORMANCE GRAPH
The following graph compares the five-year cumulative total returns of Motorola, Inc., the S&P 500 Index andthe S&P Communications Equipment Index.
This graph assumes $100 was invested in the stock or the Index on December 31, 2001 and also assumes thereinvestment of dividends. This graph assumes reinvestment of the Company's distribution to its shareholders of0.110415 shares of Class B common stock of Freescale Semiconductor, Inc. (""Freescale Class B Shares'') onDecember 2, 2004 for each share of Motorola common stock. For purposes of this graph, the FreescaleSemiconductor, Inc. distribution is treated as a non-taxable cash dividend of $2.06 (the value of 0.110415 FreescaleClass B Shares, based on Freescale Semiconductor's December 2, 2004 closing price of $18.69) that would havebeen reinvested in Motorola common stock at the close of business on December 2, 2004.
Five-Year Performance Graph
162.8
58.7
177.2
134.0
96.0
123.5
76.6
108.7105.6
96.9
117.6
51.7
92.396.0
98.2
0
20
40
60
80
100
120
140
160
180
200
2001 2002 2003 2004 2005 2006
S&P CommunicationsS&P 500Motorola

33
Item 6: Selected Financial Data
Motorola, Inc. and SubsidiariesFive Year Financial Summary
Years Ended December 31(Dollars in millions, except as noted) 2006 2005 2004 2003 2002
Operating ResultsNet sales $ 42,879 $35,262 $29,663 $21,718 $22,105Costs of sales 30,152 23,833 19,698 14,567 14,812
Gross margin 12,727 11,429 9,965 7,151 7,293
Selling, general and administrative expenses 4,504 3,628 3,508 3,084 3,703Research and development expenditures 4,106 3,600 3,316 2,849 2,777Other charges (income) 25 (404) 149 77 1,384
Operating earnings (loss) 4,092 4,605 2,992 1,141 (571)
Other income (expense):Interest income (expense), net 326 71 (200) (296) (347)Gains on sales of investments and businesses, net 41 1,845 460 540 81Other 151 (109) (140) (141) (1,343)
Total other income (expense) 518 1,807 120 103 (1,609)
Earnings (loss) from continuing operations beforeincome taxes 4,610 6,412 3,112 1,244 (2,180)
Income tax expense (benefit) 1,349 1,893 1,013 403 (760)
Earnings (loss) from continuing operations 3,261 4,519 2,099 841 (1,420)Earnings (loss) from discontinued operations, net of tax 400 59 (567) 52 (1,065)
Net earnings (loss) $ 3,661 $ 4,578 $ 1,532 $ 893 $(2,485)
Per Share Data (in dollars)Diluted earnings (loss) from continuing operations per
common share $ 1.30 $ 1.79 $ 0.87 $ 0.36 $ (0.62)Diluted earnings (loss) per common share 1.46 1.81 0.64 0.38 (1.09)Diluted weighted average common shares outstanding (in
millions) 2,504.2 2,527.0 2,472.0 2,351.2 2,282.3Dividends paid per share $ 0.18 $ 0.16 $ 0.16 $ 0.16 $ 0.16
Balance SheetTotal assets $ 38,593 $35,802 $30,922 $31,999 $31,152Long-term debt and redeemable preferred securities 2,704 3,806 4,581 6,007 6,477Total debt and redeemable preferred securities 4,397 4,254 5,298 6,876 7,975Total stockholders' equity 17,142 16,673 13,331 12,689 11,239
Other DataCapital expenditures $ 649 $ 548 $ 405 $ 309 $ 332
% of sales 1.5% 1.6% 1.4% 1.4% 1.5%Research and development expenditures $ 4,106 $ 3,600 $ 3,316 $ 2,849 $ 2,777
% of sales 9.6% 10.2% 11.2% 13.1% 12.6%Year-end employment (in thousands)* 66 69 68 88 97
* Employment decrease in 2004 primarily reflects the impact of the spin-off of Freescale Semiconductor.

34 MANAGEMENT'S DISCUSSION AND ANALYSISOF FINANCIAL CONDITION AND RESULTS OF OPERATIONS
Item 7: Management's Discussion and Analysis of Financial Condition and Results ofOperations
The following is a discussion and analysis of our financial position and results of operations for each of thethree years in the period ended December 31, 2006. This commentary should be read in conjunction with ourconsolidated financial statements and the notes thereto which appear beginning under ""Item 8: Financial Statementsand Supplementary Data.''
Executive Overview
What businesses are we in?
Motorola reports financial results for the following three operating business segments:
‚ The Mobile Devices segment designs, manufactures, sells and services wireless handsets with integratedsoftware and accessory products, and licenses intellectual property. The segment's net sales in 2006 were$28.4 billion, representing 66% of the Company's consolidated net sales.
‚ The Networks and Enterprise segment designs, manufactures, sells, installs and services: (i) cellularinfrastructure systems and wireless broadband systems to public carriers and other wireless service providers(referred to as the ""public networks'' market), and (ii) analog and digital two-way radio, voice and datacommunications products and systems, as well as wireless broadband systems, to a wide range of publicsafety, government, utility, transportation and other worldwide enterprise markets (referred to as the""private networks'' market). In January 2007, the segment completed the acquisition of SymbolTechnologies, Inc. (""Symbol''), a leader in designing, developing, manufacturing and servicing products andsystems used in end-to-end enterprise mobility solutions. Symbol will become the cornerstone of thesegment's enterprise mobility strategy. The segment's net sales in 2006 were $11.2 billion, representing 26%of the Company's consolidated net sales.
‚ The Connected Home Solutions segment designs, manufactures, sells and services: (i) cable television,Internet Protocol (""IP'') video and broadcast network set-top boxes (""digital entertainment devices''),(ii) end-to-end digital video system solutions, (iii) broadband access networks, and (iv) IP-based data andvoice products (including modems). The segment's net sales in 2006 were $3.3 billion, representing 8% ofthe Company's consolidated net sales.
What were our 2006 financial highlights?
‚ Net Sales Increased 22%: Our net sales were $42.9 billion in 2006, up 22% from $35.3 billion in 2005.Net sales increased in all three of our operating segments.
‚ Operating Earnings were $4.1 Billion: We generated operating earnings of $4.1 billion in 2006, a decreaseof 11% compared to operating earnings of $4.6 billion in 2005. Operating margin was 9.5% of net sales in2006, compared to 13.1% of net sales in 2005.
‚ Earnings From Continuing Operations were $3.3 Billion: We generated earnings from continuingoperations of $3.3 billion in 2006, a 28% decrease compared to earnings from continuing operations of$4.5 billion in 2005.
‚ Earnings From Continuing Operations of $1.30 per Share: Our earnings from continuing operations perdiluted common share were $1.30 in 2006, compared to earnings from continuing operations per dilutedcommon share of $1.79 in 2005.
‚ Operating Cash Flow of $3.5 Billion: We generated operating cash flow of $3.5 billion in 2006, comparedto operating cash flow of $4.3 billion in 2005.
‚ Net Cash* Increased by 7%: We increased our net cash position by $712 million during 2006 and endedthe year with a net cash position of $11.2 billion.
* Net Cash • Cash and cash equivalents ° Sigma Funds ° Short-term investments ¿ Notes payable and current portion of long-term debt ÌLong-term Debt

35MANAGEMENT'S DISCUSSION AND ANALYSISOF FINANCIAL CONDITION AND RESULTS OF OPERATIONS
‚ Gains on Sales of Investments and Businesses Decreased by $1.8 Billion: In 2005, we recognized$1.8 billion of net gains relating to our equity investments in other companies, primarily from gains on ourshares of Sprint Nextel Corporation (""Sprint Nextel''), and its predecessors. In 2006, net gains from thesale of equity investments were $41 million, a decrease of $1.8 billion.
‚ 171.7 Million Shares of Motorola Common Stock Repurchased for $3.8 Billion: During 2006, theCompany repurchased 171.7 million of its common shares for an aggregate cost of $3.8 billion. In 2005,when the Company initiated the first stock repurchase program in its history, it repurchased 41.7 millioncommon shares at a cost of $874 million.
What were the financial highlights for our three operating businesses in 2006?
‚ In Our Mobile Devices Business: Net sales increased by $6.9 billion, or 32%, to $28.4 billion andoperating earnings increased by 23% to $2.7 billion. As the second largest worldwide supplier of wirelesshandsets, we shipped 217.4 million handsets in 2006, up 49% from 2005, and gained more thanfour percentage points of global market share to an estimated 22%. The gain in market share reflectedstrong demand for our products, particularly our products for GSM and CDMA technologies. The segmenthad higher net sales in High Growth markets (defined as countries in the Middle East, Africa, SoutheastAsia and India), North Asia, North America and Latin America, as a result of an improved productportfolio, strong market growth in emerging markets, and high replacement sales in more mature markets.Average selling price (""ASP'') decreased approximately 11% compared to 2005, driven primarily by anunfavorable geographic and product-tier mix.
‚ In Our Networks and Enterprise Business: Net sales increased by $43 million to $11.2 billion andoperating earnings were down 22% to $1.5 billion. The business had higher net sales in the Europe, MiddleEast and Africa region (""EMEA'') and Latin America, largely offset by lower net sales in North Americaand Asia. The business' slight increase in net sales reflected higher net sales in the private networks market,offset by lower net sales in the public networks market. The decrease in operating earnings was primarilydue to: (i) a decrease in gross margin, due to an unfavorable product/regional mix and competitive pricingin the public networks market, and (ii) an increase in reorganization of business charges, primarily relatedto employee severance costs.
‚ In Our Connected Home Solutions Business: Net sales increased by $456 million, or 16%, to $3.3 billionand operating earnings increased by 46% to $224 million. The business had higher net sales in all regions.Net sales of digital entertainment devices increased by 24%, driven by a product-mix shift towards higher-end products, particularly HD/DVR set-top boxes. The segment continued to be the worldwide leader inmarket share for digital entertainment devices. Net sales of cable modems increased 18%, primarily due toincreases in: (i) cable modem unit shipments, and (ii) ASPs, reflecting increased demand for voice-enabledmodems. The business retained its leading worldwide market share in cable modems.
What were our major accomplishments and challenges in 2006?
In 2006, Motorola continued to focus on increasing profitable sales and growing market share by building onour vision of seamless mobility. We continued our expansion into developing markets, enhanced Motorola'sproduct portfolio with innovative and exciting new devices and solutions and built on the leadership position ofour three business segments through strategic transactions. Although we did not meet our operating earnings targetin our Mobile Devices business during the fourth quarter of 2006, we believe that Motorola remains wellpositioned in our markets.
‚ In Our Mobile Devices Business: During the year, Motorola's unit shipments grew faster than the totalmarket and faster than our top competitors. As a result, Motorola believes it expanded its global marketshare in mobile handsets to approximately 22%, up more than 4 percentage points compared to 2005market share.
The growth in unit sales was fueled by continued demand for the iconic MOTORAZR and newadditions to our product portfolio. Motorola shipped 50 new devices in 2006, including the MOTO Q, forthe customer who multi-tasks and wants flexibility in today's fast-paced business environment, and theMOTOKRZR, for the customer eager to have the industry's newest ultra-slim and ultra-stylish handset.Motorola also introduced the MOTORAZR (RED) and MOTOSLVR (RED), new wireless phones

36 MANAGEMENT'S DISCUSSION AND ANALYSISOF FINANCIAL CONDITION AND RESULTS OF OPERATIONS
designed in partnership with PRODUCT(RED), to raise awareness and money for The Global Fund, aninnovative public-private partnership created to finance a dramatic turnaround in the fight against AIDS inAfrica with an emphasis on women and children.
Additionally, the Mobile Devices business continued its expansion into previously underserved markets,in connection with the Company's ongoing effort to connect ""the next billion'' mobile phone users.Working closely with the GSM Association (""GSMA''), Motorola has enabled economic and socialdevelopment by providing affordable, high-quality access to mobile communications in such markets asIndia, the Philippines, Indonesia and Africa. Most recently, Motorola advanced its efforts to redefine themobile phone marketplace with the launch of the MOTOFONE handset, the first of a new breed ofhandsets designed to disrupt today's communications landscape by cutting across price tiers, productsegments and international markets.
The Mobile Devices business also sought to improve its product offerings through strategic acquisitions.The business acquired TTP Communications plc, a developer of intellectual property used in the design andmanufacture of wireless communication terminals and a leading provider of protocol stack software thatoffers rapid customization of handsets through its AJAR applications framework. In early 2007, the businesscompleted the acquisition of Good Technology, Inc., a leader in enterprise mobile computing software andservice. The acquisition is expected to extend Motorola's mobile computing capabilities while alsoincreasing the Company's enterprise client base.
The Mobile Devices business did face significant challenges during the year, particularly towards the endof the year. In the fourth quarter, the business was negatively impacted because its forecasts of the overallpricing, mix and volume in its GSM business proved to be incorrect. Also, the business failed to capitalizeon the strength of the UMTS market and was impacted by challenges in our iDEN business in the UnitedStates. As a result of these challenges, Mobile Devices' fourth-quarter profitability fell significantly short ofour expectations and ASPs and gross margin as a percentage of sales both decreased in 2006 compared to2005.
‚ In Our Networks and Enterprise Business: One of Motorola's most important initiatives in 2006 was tostrengthen our position in enterprise mobility. Building on our Networks and Enterprise business' record$11.2 billion of sales in 2006, Motorola significantly expanded its presence in the enterprise space. InJanuary 2007, we completed the acquisition of Symbol Technologies, Inc. (""Symbol''), an industry leaderin designing, developing, manufacturing and servicing products and systems used in end-to-end enterprisemobility solutions. Symbol has a world-class product portfolio and valuable intellectual property and willbe the cornerstone of the Networks and Enterprise business' enterprise strategy.
Motorola also initiated a new collaboration with Huawei Technologies to bring an enhanced andextensive portfolio of UMTS and high speed downlink packet access (""HSDPA'')/high speed uplink packetaccess (""HSUPA'') infrastructure equipment to customers worldwide. One of the elements of thiscollaboration is the creation of a joint research and development center in Shanghai, China, whereemployees from both companies work on development of the architecture and portfolio of products andservices.
In the public networks market, Sprint Nextel selected Motorola to play a major role in the Sprint NextelWiMAX infrastructure roll-out. Motorola has been a long-standing proponent of WiMAX and is nowparticipating in 22 WiMAX trials globally. As the exclusive supplier of iDEN technology and a major supplierof CDMA and EV-DO Revision A technologies, the Company offers a complete, end-to-end solution and isuniquely positioned to expand the seamless mobility experience into the wireless mobile broadband market.
Motorola also maintained momentum in infrastructure development and services in 2006 by continuingto deliver outstanding technologies and services for wireless and wireline carriers. Through 2006, thebusiness has 55 commercial deployments of push-to-talk over cellular (""PoC'') technology with customersoperating in 39 countries. The Company's IP Multimedia Subsystem (""IMS'') technology and Open MobileAlliance (""OMA'') PoC standards compatible solution lays the foundation for further ""Push-To''applications.
During 2006, the business continued to refresh and redefine its product portfolio. It completed anumber of significant acquisitions, including: (i) Orthogon Systems LLC, a leader in wireless Ethernetconnectivity and orthogonal frequency division multiplexing (""OFDM'') technology for fixed wirelessequipment, and (ii) NextNet Wireless, Inc., a former Clearwire Corporation subsidiary and a leading

37MANAGEMENT'S DISCUSSION AND ANALYSISOF FINANCIAL CONDITION AND RESULTS OF OPERATIONS
provider of OFDM-based non-line-of-sight (""NLOS'') wireless broadband infrastructure equipment. Also,Motorola sold its automotive electronics business to German automotive supplier Continental AG forapproximately $900 million.
The Networks and Enterprise business faced challenges during 2006, as sales of iDEN and GSMinfrastructure declined compared to 2005. The business also continued to invest in next-generationtechnologies that did not, nor were expected to, contribute meaningful sales or earnings to the business in2006.
‚ In Our Connected Home Solutions Business: The Connected Home Solutions business is the world'sleading provider of digital video set-top boxes and cable modems, with sales of $3.3 billion in 2006.Motorola shipped over 10 million digital set-tops this year and almost one-third of these shipments werehigh-definition TV (""HDTV'') capable. Motorola shipped over 10 million data modems, of which3.7 million were voice-over-IP (""VoIP'') capable. The fourth quarter saw Motorola ship its 50 millionthdigital entertainment device, a significant milestone that underscored the Company's heritage of deliveringinnovations for the digital cable connected home.
The segment expanded its next-generation digital video portfolio, completing several significantacquisitions, including: (i) Kreatel Communications AB, a leading developer of innovative IP-based digitalset-top boxes and software, (ii) Broadbus Technologies, Inc., a provider of technology solutions fortelevision on demand, and (iii) Vertasent LLC, a software developer for managing technology elements forswitched digital video networks. In early 2007, the Connected Home Solutions business completed theacquisition of Netopia, Inc., a broadband equipment provider for DSL customers, which allows for phone,TV and fast Internet connections. The business also announced its intention to acquire Tut Systems, Inc., aleading developer of edge routing and video encoders. With these acquisitions, Motorola now has enhancedcapabilities in its end-to-end, switched digital video solution and a leadership position in the IP-based set-top box market.
Looking Forward
Although our Networks and Enterprise and Connected Home Solutions businesses ended 2006 with strongmomentum, our Mobile Devices business faced major challenges during the latter part of 2006, causing its fourth-quarter profitability to fall significantly short of our expectations. We intend to improve the profitability of thisbusiness and we are taking the necessary actions to make that happen. As we enter 2007, we remain confident inthe strength of each of our core markets. With our continued dedication to quality and our unrelenting focus oninnovation, we are committed to executing on our strategic plan and pursuing profitable sales growth across all ofour businesses. We believe that a balanced focus on profitability and growth will drive shareholder value.
Our vision of seamless mobility continues to drive everything we do. We are dedicated to building simple andseamless connections to people, information and entertainment. We will do this by continuing to revolutionizewireless networks and broadband communications Ì bringing cutting-edge technologies into everyday life andempowering the mobile consumer to go anywhere and do anything without sacrificing complete connectivity. Westrive to design and deliver new ""must have'' products, ""must do'' experiences and powerful networks that enablemobility, along with a full complement of support services. We will continue executing on this vision by extendingit around the world and unveiling new technology platforms and products that break down the boundaries oftraditional communication and improve life.
As we continue to expand the geographies that our products and services reach, it remains important that weembrace the unique needs and customs of our local markets. Vast segments of the world's population, many ofwhom are yet to make a phone call or connect to the Internet, represent a tremendous opportunity for Motorolato extend our brand. As our world becomes increasingly interlinked, Motorola is focused on connecting ""the nextbillion'' mobile phone users. Globalization has made, and will continue to make, country-specific knowledge, talentand leadership indispensable. We have worked to develop specific expertise that allows us to understand thetechnology needs of each market, rather than a ""one-size-fits-all'' solution. We are building a strong and efficientfootprint in the developing world, and we expect that this will generate financial benefits for Motorola and make aprofound and lasting impact on those who were previously unable to ""connect.''
Going forward we are very focused on improving Motorola's operating margin percentage. Much of this focuswill center on our Mobile Devices business, which accounts for nearly two-thirds of our sales and generated muchlower than expected operating margins in the fourth quarter of 2006. Over the last three years, the focus on market

38 MANAGEMENT'S DISCUSSION AND ANALYSISOF FINANCIAL CONDITION AND RESULTS OF OPERATIONS
share growth in the Mobile Devices business has increased its share of the global handset market fromapproximately 12% to approximately 22%. Going forward, this business will rebalance its market share andprofitability objectives, with greater emphasis on profitability. To do this, we will continue to refresh and revitalizeour product portfolio, with greater emphasis on higher-tier multimedia experiences. At the same time, we areincreasing our focus on our cost structure, with particular emphasis on reducing manufacturing and design costs.We will seek to reduce costs and accelerate our time to market by focusing on our silicon and software platformstrategies. We will also continue to invest in the Motorola brand, with emphasis on effective marketing of 2007product line introductions. Although the Mobile Devices business will place a greater emphasis on profitability, werecognize that near-to-medium term pricing pressures will provide challenges to improving margins and profitability.
The transformation of our Networks and Enterprise business began in 2006, when we combined our cellularnetworks infrastructure business with our government and enterprise mobility business, and this transformation willcontinue in 2007. In early 2007, we completed the acquisition of Symbol Technologies, Inc., which now forms thecornerstone of our enterprise mobility business. Our goal is to continue to grow our Networks and Enterprisebusiness consistently and profitably. We are investing to be the leading infrastructure provider of WiMAX, a next-generation wireless broadband technology, and we expect the WiMAX market to begin to materialize in 2008 asseveral WiMAX networks come on-line. Also, we will continue to develop next-generation products and solutionsfor our government and public safety customers, for whom homeland security and public safety needs continue tobe front and center. As the Internet goes mobile and enterprise customers look to enhance productivity, we willleverage our acquisition of Symbol with our existing enterprise assets to capitalize on the enterprise mobilitymarket.
Our Connected Home Solutions business will continue to focus on expanding its leadership position inbroadband connected home products and services in North America while capitalizing on new markets outside ofNorth America. Our shipments outside North America have grown in each of the last three years and these marketscontinue to provide new growth opportunities. We believe we are well positioned to capitalize on the convergenceof services and application across delivery platforms within the home and across mobile applications.
We conduct our business in highly-competitive markets, facing both new and established competitors. Themarkets for many of our products are characterized by rapidly changing technologies, frequent new productintroductions, short product life cycles and evolving industry standards. Market disruptions caused by newtechnologies, the entry of new (and often well-capitalized) competitors into markets we serve, and frequentconsolidations among our customers and competitors, among other matters, introduce volatility into our operatingperformance and cash flow from operations. Meeting these disruptive challenges while working towards full digitalconvergence requires continual technological advancements and continued investment in innovative solutions. Wemust have compelling products that meet the expanding needs and evolving desires of our customers around theworld. We are focused on meeting these challenges and improving our profitability.

39MANAGEMENT'S DISCUSSION AND ANALYSISOF FINANCIAL CONDITION AND RESULTS OF OPERATIONS
Results of Operations
Years Ended December 31(Dollars in millions, except per shareamounts) 2006 % of sales 2005 % of sales 2004 % of sales
Net sales $42,879 $35,262 $29,663Costs of sales 30,152 70.3% 23,833 67.6% 19,698 66.4%
Gross margin 12,727 29.7% 11,429 32.4% 9,965 33.6%Selling, general and administrative expenses 4,504 10.5% 3,628 10.3% 3,508 11.8%Research and development expenditures 4,106 9.6% 3,600 10.2% 3,316 11.2%Other charges(income) 25 0.1% (404) (1.2)% 149 0.5%
Operating earnings 4,092 9.5% 4,605 13.1% 2,992 10.1%Other income (expense):
Interest income (expense), net 326 0.8% 71 0.2% (200) (0.7)%Gains on sales of investments and businesses,
net 41 0.1% 1,845 5.2% 460 1.6%Other 151 0.4% (109) (0.3)% (140) (0.5)%
Earnings from continuing operations beforeincome taxes 4,610 10.8% 6,412 18.2% 3,112 10.5%
Income tax expense 1,349 3.2% 1,893 5.4% 1,013 3.4%
Earnings from continuing operations 3,261 7.6% 4,519 12.8% 2,099 7.1%Earnings (loss) from discontinued operations,
net of tax 400 0.9% 59 0.2% (567) (1.9)%
Net earnings $ 3,661 8.5% $ 4,578 13.0% $ 1,532 5.2%
Earnings (loss) per diluted common share:Continuing operations $ 1.30 $ 1.79 $ 0.87Discontinued operations 0.16 0.02 (0.23)
$ 1.46 $ 1.81 $ 0.64
Geographic market sales measured by the locale of the end customer as a percent of total net sales for 2006,2005 and 2004 are as follows:
Geographic Market Sales by Locale of End Customer
2006 2005 2004
United States 44% 47% 48%Europe 15% 19% 19%Asia, excluding China 11% 9% 10%China 11% 8% 10%Latin America 10% 10% 10%Other Markets 9% 7% 3%
100% 100% 100%
Results of OperationsÌ2006 Compared to 2005
Net Sales
Net sales were $42.9 billion in 2006, up 22% compared to $35.3 billion in 2005. The increase in net salesincludes: (i) a $6.9 billion increase in net sales by the Mobile Devices segment, driven by a 49% increase in unitshipments, reflecting strong demand for GSM and CDMA handsets, partially offset by an 11% decline in averageselling price (""ASP''), (ii) a $456 million increase in net sales by the Connected Home Solutions segment,primarily due to increased demand for HD/DVR set-top boxes, and (iii) a $43 million increase in net sales by theNetworks and Enterprise segment, driven by higher net sales in the Europe, Middle East and Africa region andLatin America, partially offset by lower net sales in North America and Asia.

40 MANAGEMENT'S DISCUSSION AND ANALYSISOF FINANCIAL CONDITION AND RESULTS OF OPERATIONS
Gross Margin
Gross margin was $12.7 billion, or 29.7% of net sales, in 2006, compared to $11.4 billion, or 32.4% of netsales, in 2005. This increase in gross margin was primarily driven by the Mobile Devices segment, due to: (i) the49% increase in unit shipments, (ii) savings from supply chain cost-reduction initiatives, and (iii) increased incomefrom technology and platform licensing, partially offset by an 11% decline in ASP. The Connected Home Solutionssegment also achieved higher gross margin in 2006 compared to 2005, primarily driven by a 16% increase in netsales. Gross margin decreased in the Networks and Enterprise segment, due to an unfavorable product/regional mixand competitive pricing in the public networks market.
In 2006 compared to 2005, gross margin as a percentage of net sales: (i) decreased in the Mobile Devices andNetworks and Enterprise segments, and (ii) increased in the Connected Home Solutions segment. The Company'soverall gross margin as a percentage of net sales can be impacted by the proportion of overall net sales generatedby its various businesses. The decrease in overall gross margin as a percentage of net sales in 2006 compared to2005 can be partially attributed to the fact that an increased percentage of the Company's net sales were generatedby the Mobile Devices segment, which generates lower gross margins than the overall Company average.
Selling, General and Administrative Expenses
Selling, general and administrative (""SG&A'') expenses increased 24% to $4.5 billion, or 10.5% of net sales, in2006, compared to $3.6 billion, or 10.3% of net sales, in 2005. The increase in SG&A expenses was primarilydriven by: (i) increased marketing expenses, mainly in the Mobile Devices segment, to support higher net sales andpromote brand awareness, (ii) recognition of share-based compensation expense to SG&A-related employees inconnection with the adoption of SFAS 123R, and (iii) increased selling and sales support expenses, driven by theincrease in sales commissions from the increase in net sales. SG&A expenses as a percentage of net sales were upslightly, driven by an increase in the Mobile Devices segment, offset by a decreased in the Connected HomeSolutions segment.
Research and Development Expenditures
Research and development (""R&D'') expenditures increased 14% to $4.1 billion, or 9.6% of net sales, in 2006,compared to $3.6 billion, or 10.2% of net sales, in 2005. All three of the Company's operating segments hadincreased R&D expenditures in 2006 compared to 2005. This increase was primarily due to: (i) developmentalengineering expenditures for new product development and investment in next-generation technologies across allsegments, and (ii) recognition of share-based compensation expense to R&D-related employees in connection withthe adoption of SFAS 123R. R&D expenditures as a percentage of net sales decreased, driven by decreases in theMobile Devices and Connected Home Solutions segments.
Other Charges (Income)
The Company recorded charges of $25 million in Other charges (income) in 2006, compared to income of$404 million in 2005. The charges in 2006 include: (i) $172 million of net charges for reorganization of businesses,(ii) $100 million of charges relating to the amortization of intangibles, (iii) an $88 million charitable contributionto the Motorola Foundation of appreciated equity holdings in a third party, (iv) $50 million of legal reserves, and(v) $33 million from acquisition-related in-process research and development charges (""IPR&D''), partially offsetby $418 million of income for collections relating to the Telsim settlement. The net income of $404 million in2005 primarily consisted of $515 million of income for collections relating to the Telsim settlement, partially offsetby: (i) $67 million of charges relating to the amortization of intangibles, (ii) $54 million of net charges forreorganization of businesses, and (iii) $2 million from acquisition-related IPR&D. The net reorganization ofbusinesses charges are discussed in further detail in the ""Reorganization of Businesses'' section.
Net Interest Income (Expense)
Net interest income was $326 million in 2006, compared to net interest income of $71 million in 2005. Netinterest income in 2006 included interest income of $661 million, partially offset by interest expense of$335 million. Net interest income in 2005 included interest income of $396 million, partially offset by interestexpense of $325 million. The increase in net interest income is primarily attributed to an increase in interest incomedue to higher average cash, cash equivalents and Sigma Funds balances earning interest at higher rates.

41MANAGEMENT'S DISCUSSION AND ANALYSISOF FINANCIAL CONDITION AND RESULTS OF OPERATIONS
Gains on Sales of Investments and Businesses
Gains on sales of investments and businesses were $41 million in 2006, compared to $1.8 billion in 2005. In2006, the $41 million of net gains primarily reflects a gain of $141 million on the sale of the Company's remainingshares in Telus Corporation, partially offset by a loss of $126 million on the sale of the Company's remainingshares in Sprint Nextel Corporation (""Sprint Nextel''). In 2005, the net gains were primarily related to: (i) a$1.3 billion net gain in connection with the completion of the merger between Sprint Corporation (""Sprint'') andNextel Communications, Inc. (""Nextel''), and (ii) a $609 million net gain on the sale of a portion of theCompany's shares of Nextel, partially offset by a $70 million net loss on the sale of a portion of the Company'sshares of Sprint Nextel.
Other
Income classified as Other, as presented in Other income (expense), was $151 million in 2006, compared tonet charges of $109 million in 2005. The net income in 2006 was primarily comprised of: (i) a $99 million net gaindue to an increase in market value of a zero-cost collar derivative entered into to protect the value of theCompany's investment in Sprint Nextel, and (ii) $60 million of foreign currency gains, partially offset by$27 million of investment impairment charges. The net charges in 2005 were primarily comprised of:(i) $137 million of debt retirement costs, relating to the Company's repurchase of an aggregate principal amount of$1.0 billion of long-term debt through cash tender offers, (ii) $38 million of foreign currency losses, and(iii) $25 million in investment impairment charges, partially offset by: (i) a $51 million gain due to an increase inthe market value of variable forward instruments entered into to protect the Company's investment in Nextelcommon stock prior to the merger of Sprint and Nextel, and (ii) $30 million in income from the repayment of apreviously-reserved loan related to Iridium.
Effective Tax Rate
The effective tax rate was 29% in 2006, representing a $1.3 billion net tax expense, compared to 30% in 2005,representing a $1.9 billion net tax expense. During 2006, the Company recorded $348 million in net tax benefits,comprised of: (i) a $186 million tax benefit for the reduction in deferred tax valuation allowances for its Germanand U.K. subsidiaries, (ii) $68 million relating to incremental net tax benefits realized in 2006 relating to its 2005repatriations, (iii) a $54 million tax benefit driven by a mix shift in profits towards lower-tax jurisdictions that theCompany intends to permanently reinvest, (iv) a $44 million tax benefit for favorable settlements reached withforeign tax jurisdictions, (v) a $34 million tax charge for a valuation allowance relating to deferred tax assets onselect investments, and (vi) a $30 million incremental tax benefit relating to the contribution of appreciated equityholdings to the Company's charitable foundation. Additionally, during 2006, the Company incurred nondeductibleIPR&D charges relating to acquisitions and restructuring charges in low tax jurisdictions that caused an increase inthe Company's effective tax rate. The Company's effective tax rate in 2006, excluding the net tax benefits,nondeductible IPR&D charges and restructuring charges in low tax jurisdictions, was 36%.
During 2005, the tax rate reflected a $265 million net tax benefit related to the repatriation of foreign earningsunder the provisions of the American Jobs Creation Act of 2004 and an $81 million net tax benefit on the stocksale of a sensor business that was divested in 2005.
Earnings from Continuing Operations
The Company had earnings from continuing operations before income taxes of $4.6 billion in 2006, comparedto earnings from continuing operations before income taxes of $6.4 billion in 2005. After taxes, the Company hadearnings from continuing operations of $3.3 billion, or $1.30 per diluted share, in 2006, compared with earningsfrom continuing operations of $4.5 billion, or $1.79 per diluted share, in 2005.
The decrease in earnings from continuing operations before income taxes in 2006 compared to 2005 isprimarily attributed to: (i) a $1.8 billion decrease in gains on the sale of investments and businesses, (ii) an$876 million increase in SG&A expenses, (iii) a $506 million increase in R&D expenditures, and (iv) a$429 million change in Other charges (income). These negative impacts on operating earnings were partially offsetby: (i) a $1.3 billion increase in gross margin, primarily due to the $7.6 billion increase in net sales, (ii) a$260 million increase in income classified as Other, as presented in Other income (expense), and (iii) a$255 million increase in net interest income.

42 MANAGEMENT'S DISCUSSION AND ANALYSISOF FINANCIAL CONDITION AND RESULTS OF OPERATIONS
Results of OperationsÌ2005 Compared to 2004
Net Sales
Net sales were $35.3 billion in 2005, up 19% from $29.7 billion in 2004. Net sales increased in all three of theCompany's segments in 2005 compared to 2004. The overall increase in net sales reflected: (i) a $4.4 billionincrease in net sales by the Mobile Devices segment, driven by a 40% increase in unit shipments, reflecting strongdemand for GSM handsets, (ii) a $737 million increase in net sales by the Networks and Enterprise segment,reflecting higher net sales in North America and EMEA, partially offset by lower net sales in Asia and LatinAmerica, and (iii) a $536 million increase in net sales by the Connected Home Solutions segment, primarily drivenby increases in both ASP and unit shipments of digital entertainment devices.
Gross Margin
Gross margin was $11.4 billion, or 32.4% of net sales, in 2005, compared to $10.0 billion, or 33.6% of netsales, in 2004. All three of the Company's operating segment had higher gross margin in 2005 compared to 2004.The increase in gross margin in the Mobile Devices segment was primarily due to a 25% increase in net sales, drivenby a 40% increase in unit shipments, partially offset by: (i) a 10% decline in ASP, and (ii) a charge for past use ofKodak intellectual property. The increase in gross margin in the Networks and Enterprise segment was primarilydue to: (i) a 7% increase in net sales, and (ii) improvements in the cost structure of the public networks business.The increase in gross margin in the Connected Home Solutions segment was primarily due to a 23% increase in netsales.
In 2005 compared to 2004, gross margin as a percentage of net sales: (i) decreased in the Mobile Devices andConnected Home Solutions segments, and (ii) increased in the Networks and Enterprise segment. The Company'soverall gross margin as a percentage of net sales can be impacted by the proportion of overall net sales generatedby its various businesses. The decrease in overall gross margin as a percentage of net sales in 2005 compared to2004 can be partially attributed to the fact that an increased percentage of the Company's net sales were generatedby the Mobile Devices segment, which generates lower gross margins than the overall Company average.
Selling, General and Administrative Expenses
SG&A expenses increased 3% to $3.6 billion, or 10.3% of net sales, in 2005, compared to $3.5 billion, or11.8% of net sales, in 2004. The Mobile Devices and Networks and Enterprise segments had increased SG&Aexpenses in 2005 compared to 2004. The increase in SG&A expenses in 2005 compared to 2004 was due to:(i) increased marketing expenses to support higher sales and promote brand awareness, and (ii) increased sellingand sales support expenses, driven by the increase in sales commissions from the increase in net sales. SG&Aexpense as a percentage of net sales decreased, driven by decreases in the Mobile Devices and Connected HomeSolutions segments.
Research and Development Expenditures
R&D expenditures increased 9% to $3.6 billion, or 10.2% of net sales, in 2005, compared to $3.3 billion, or11.2% of net sales, in 2004. All three of the Company's segments had increased R&D expenditures in 2005compared to 2004. The increase in R&D expenditures was primarily due to developmental engineering expendituresfor new product development and investment in next-generation technologies across all segments. R&Dexpenditures as a percentage of net sales decreased, driven by decreases in the Mobile Devices and Networks andEnterprise segments, partially offset by an increase in the Connected Home Solutions segment.
Other Charges (Income)
The Company recorded net income of $404 million in Other charges (income) in 2005, compared to netcharges of $149 million in 2004. The net income in 2005 primarily consisted of $515 million in income forcollections relating to the Telsim settlement, partially offset by: (i) $67 million of charges relating to theamortization of intangibles, (ii) $54 million net of charges for reorganization of businesses, and (iii) $2 millionfrom acquisition-related IPR&D charges. The net charges of $149 million in 2004 primarily consisted of:(i) a $125 million charge for goodwill impairment, related to the sensor business that was divested in 2005,(ii) $52 million of charges relating to the amortization of intangibles, and (iii) $34 million from acquisition-relatedIPR&D, partially offset by: (i) $44 million in income from the reversal of financing receivable reserves due to the

43MANAGEMENT'S DISCUSSION AND ANALYSISOF FINANCIAL CONDITION AND RESULTS OF OPERATIONS
partial collection of the previously-uncollected receivable from Telsim, and (ii) $11 million of net reorganization ofbusinesses reversals for reserves no longer needed. The net reorganization of businesses charges are discussed infurther detail in the ""Reorganization of Businesses'' section.
Net Interest Income (Expense)
Net interest income was $71 million in 2005, compared to net interest expense of $200 million in 2004. Netinterest income in 2005 included interest income of $396 million, partially offset by interest expense of$325 million. Net interest expense in 2004 included interest expense of $354 million, partially offset by interestincome of $154 million. The increase in net interest income in 2005 compared to 2004 reflects: (i) an increase ininterest income due to higher average cash, cash equivalents and Sigma Funds balances earning interest at higherrates, and (ii) the significantly lower levels of total debt in 2005 compared to 2004.
Gains on Sales of Investments and Businesses
Gains on sales of investments and businesses were $1.8 billion in 2005, compared to $460 million in 2004. The2005 net gains were primarily: (i) a $1.3 billion net gain recognized when the Company received 69.3 millionshares of Sprint Nextel, as well as $46 million in cash, in exchange for the Company's shares of Nextel when Sprintand Nextel completed their merger in August 2005, (ii) a $609 million net gain on the sale of a portion of theCompany's shares of Nextel, partially offset by a $70 million net loss on the sale of a portion of the Company'sshares of Sprint Nextel. The 2004 net gains of $460 million were primarily related to: (i) a $130 million gain onthe sale of the Company's remaining shares in Broadcom Corporation, (ii) a $122 million gain on the sale of aportion of the Company's shares in Nextel, (iii) an $82 million gain on the sale of a portion of the Company'sshares in Telus Corporation, and (iv) a $68 million gain on the sale of a portion of the Company's shares inNextel Partners, Inc.
Other
Charges classified as Other, as presented in Other income (expense), were $109 million in 2005, compared to$140 million in 2004. The $109 million of net charges in 2005 were primarily comprised of: (i) $137 million ofdebt retirement costs, relating to the Company's repurchase of an aggregate principal amount of $1.0 billion oflong-term debt through cash tender offers, (ii) $38 million of foreign currency losses, and (iii) $25 million ininvestment impairment charges, partially offset by: (i) a $51 million gain due to an increase in the market value ofvariable forward instruments entered into to protect the Company's investment in Nextel common stock prior tothe merger of Sprint and Nextel, and (ii) $30 million in income from the repayment of a previously-reserved loanrelated to Iridium. The $140 million of net charges in 2004 was primarily comprised of: (i) $81 million of chargesrelated to the redemption of debt, (ii) $44 million of foreign currency losses, and (iii) $36 million of investmentimpairment charges.
Effective Tax Rate
The effective tax rate was 30% in 2005, representing a $1.9 billion net tax expense, compared to a 33%effective tax rate in 2004, representing a $1.0 billion net tax expense. The 2005 tax rate reflected a:(i) $265 million net tax benefit related to the repatriation of foreign earnings under the provisions of the AmericanJobs Creation Act of 2004, and (ii) an $81 million net tax benefit on the stock sale of a sensor business that wasdivested in 2005.
The 2004 effective tax rate reflected a $241 million benefit from the reversal of previously-accrued incometaxes as the result of settlements reached with taxing authorities and a reassessment of tax exposures based on thestatus of current audits, offset by: (i) a $125 million of nondeductible goodwill impairment charges related to thesensor business that was divested in 2005, and (ii) $31 million of acquisition-related IPR&D charges.
Earnings from Continuing Operations
The Company had earnings from continuing operations before income taxes of $6.4 billion in 2005, comparedto earnings from continuing operations before income taxes of $3.1 billion in 2004. After taxes, the Company hadearnings from continuing operations of $4.5 billion, or $1.79 per diluted share from continuing operations, in 2005,

44 MANAGEMENT'S DISCUSSION AND ANALYSISOF FINANCIAL CONDITION AND RESULTS OF OPERATIONS
compared to earnings from continuing operations of $2.1 billion, or $0.87 per diluted share from continuingoperations, in 2004.
The $3.3 billion increase in earnings from continuing operations before income taxes is primarily attributed to:(i) a $1.5 billion increase in gross margin, primarily due to the $5.6 billion increase in total net sales, (ii) a$1.4 billion increase in gains on sales of investments and businesses, (iii) a $553 million increase in incomeclassified as Other, (iv) a $271 million increase in net interest income, and (v) a $31 million decrease in expensesclassified as Other, as presented in Other income (expense). These improvements in earnings were partially offsetby: (i) a $284 million increase in R&D expenditures, and (ii) a $120 million increase in SG&A expenses.
Reorganization of Businesses
The Company maintains a formal Involuntary Severance Plan (the ""Severance Plan'') which permits theCompany to offer eligible employees severance benefits based on years of service and employment grade level inthe event that employment is involuntarily terminated as a result of a reduction-in-force or restructuring. Eachseparate reduction-in-force has qualified for severance benefits under the Severance Plan and, therefore, suchbenefits are accounted for in accordance with Statement No. 112, ""Accounting for Postemployment Benefits''(""SFAS 112''). Under the provisions of SFAS 112, the Company recognizes termination benefits based on formulasper the Severance Plan at the point in time that future settlement is probable and can be reasonably estimatedbased on estimates prepared at the time a restructuring plan is approved by management. Exit costs primarilyconsist of future minimum lease payments on vacated facilities. At each reporting date, the Company evaluates itsaccruals for exit costs and employee separation costs to ensure the accruals are still appropriate. In certaincircumstances, accruals are no longer required because of efficiencies in carrying out the plans or becauseemployees previously identified for separation resigned from the Company and did not receive severance or wereredeployed due to circumstances not foreseen when the original plans were initiated. The Company reversesaccruals through the income statement line item where the original charges were recorded when it is determinedthey are no longer required.
The Company realized cost-saving benefits of approximately $54 million in 2006 from the plans that wereinitiated during 2006, representing: (i) $31 million of savings in R&D expenditures, (ii) $14 million of savings inSG&A expenses, and (iii) $9 million of savings in Costs of sales. Beyond 2006, the Company expects thereorganization plans initiated during 2006 to provide annualized cost savings of approximately $214 million,representing: (i) $101 million of savings in R&D expenditures, (ii) $72 million of savings in SG&A expenses, and(iii) $41 million of savings in Cost of sales.
2006 Charges
During the year ended December 31, 2006, the Company committed to implement various productivityimprovement plans aimed principally at: (i) reducing costs in its supply-chain activities, (ii) integrating the formerNetworks segment and Government and Enterprise Mobility Solutions segment into one organization, theNetworks and Enterprise segment, and (iii) reducing other operating expenses, primarily relating to engineering anddevelopment costs. The Company recorded net reorganization of business charges of $213 million, including$41 million of charges in Costs of sales and $172 million of charges under Other charges in the Company'sconsolidated statement of operations. Included in the aggregate $213 million are charges of $191 million foremployee separation costs, $15 million for fixed asset impairment charges and $30 million for exit costs, partiallyoffset by $23 million of reversals for accruals no longer needed. Total employees impacted by the actionscommitted to in 2006 are 3,900.
The following table displays the net reorganization of business charges by segment:
Year Ended December 31, 2006
Mobile Devices $ (1)Networks and Enterprise 157Connected Home Solutions 50
206General Corporate 7
$213

45MANAGEMENT'S DISCUSSION AND ANALYSISOF FINANCIAL CONDITION AND RESULTS OF OPERATIONS
The following table displays a rollforward of the reorganization of business accruals established for exit costsand employee separation costs from January 1, 2006 to December 31, 2006:
Accruals at 2006 2006 Accruals atJanuary 1, Additional 2006(1) Amount December 31,
2006 Charges Adjustments Used 2006
Exit costsÌlease terminations $ 50 $ 30 $ (7) $ (19) $ 54Employee separation costs 53 191 (16) (124) 104
$103 $221 $(23) $(143) $158
(1) Includes translation adjustments.
Exit CostsÌLease Terminations
At January 1, 2006, the Company had an accrual of $50 million for exit costs attributable to leaseterminations. The 2006 additional charges of $30 million were primarily related to a lease cancellation by theNetworks and Enterprise segment. The 2006 adjustments of $7 million represent reversals of accruals no longerneeded. The $19 million used in 2006 reflects cash payments to lessors. The remaining accrual of $54 million,which is included in Accrued liabilities in the Company's consolidated balance sheet at December 31, 2006,represents future cash payments for lease termination obligations.
Employee Separation Costs
At January 1, 2006, the Company had an accrual of $53 million for employee separation costs, representing theseverance costs for approximately 1,600 employees, of which 1,100 were direct employees and 500 were indirectemployees. The 2006 additional charges of $191 million represent costs for an additional 3,900 employees, ofwhich 1,700 were direct employees and 2,200 were indirect employees. The adjustments of $16 million representreversals of accruals no longer needed.
During 2006, approximately 3,200 employees, of which 1,400 were direct employees and 1,800 were indirectemployees, were separated from the Company. The $124 million used in 2006 reflects cash payments to theseseparated employees. The remaining accrual of $104 million, which is included in Accrued liabilities in theCompany's consolidated balance sheet at December 31, 2006, is expected to be paid to approximately 2,300employees to be separated in 2007.
2005 Charges
During the year ended December 31, 2005, the Company recorded net reorganization of business charges of$91 million, including $37 million of charges in Costs of sales and $54 million of charges under Other charges inthe Company's consolidated statement of operations. Included in the aggregate $91 million are charges of$86 million for employee separation costs and $15 million for fixed asset impairment charges and $5 million forexit costs, partially offset by $15 million of reversals for accruals no longer needed. Total employees impacted bythese action were approximately 2,600.
The following table displays the net reorganization of business charges by segment:
Year Ended December 31, 2005
Mobile Devices $27Networks and Enterprise 52Connected Home Solutions 4
83General Corporate 8
$91

46 MANAGEMENT'S DISCUSSION AND ANALYSISOF FINANCIAL CONDITION AND RESULTS OF OPERATIONS
The following table displays a rollforward of the reorganization of business accruals established for exit costsand employee separation costs from January 1, 2005 to December 31, 2005:
Accruals at 2005 Accruals atJanuary 1, Additional 2005(1) 2005 Amount December 31,
2005 Charges Adjustments Used 2005
Exit costsÌlease terminations $ 73 $ 5 $ (7) $(21) $ 50Employee separation costs 41 86 (14) (60) 53
$114 $91 $(21) $(81) $103
(1) Includes translation adjustments.
Exit CostsÌLease Terminations
At January 1, 2005, the Company had an accrual of $73 million for exit costs attributable to leaseterminations. The 2005 additional charges of $5 million were primarily related to a lease cancellation by theNetworks and Enterprise segment. The 2005 adjustments of $7 million represented reversals of $1 million foraccruals no longer needed and $6 million of translation adjustments. The $21 million used in 2005 reflected cashpayments to lessors. The remaining accrual of $50 million, which was included in Accrued liabilities in theCompany's consolidated balance sheet at December 31, 2005, represents future cash payments for lease terminationobligations.
Employee Separation Costs
At January 1, 2005, the Company had an accrual of $41 million for employee separation costs, representing theseverance costs for approximately 400 employees, of which 50 were direct employees and 350 were indirectemployees. The 2005 additional charges of $86 million represented the severance costs for approximately 2,600employees, of which 1,300 were direct employees and 1,300 were indirect employees. The adjustments of$14 million represented reversals of accruals no longer needed.
During 2005, approximately 1,400 employees, of which 300 were direct employees and 1,100 were indirectemployees, were separated from the Company. The $60 million used in 2005 reflected cash payments to theseseparated employees. The remaining accrual of $53 million was included in Accrued liabilities in the Company'sconsolidated balance sheet at December 31, 2005.
2004 Charges
During the year ended December 31, 2004, the Company recorded net reorganization of business reversals of$15 million, including $4 million of reversals in Costs of sales and $11 million of reversals under Other charges inthe Company's consolidated statement of operations. Included in the aggregate $15 million are charges of$54 million for employee separation costs, partially offset by $63 million of reversals for accruals no longer neededand $6 million for fixed asset adjustment income. Total employees impacted by these actions wereapproximately 800.
The following table displays the net reorganization of business charges by segment:
Year Ended December 31, 2004
Mobile Devices $(28)Networks and Enterprise 2Connected Home Solutions (4)
(30)General Corporate 15
$(15)

47MANAGEMENT'S DISCUSSION AND ANALYSISOF FINANCIAL CONDITION AND RESULTS OF OPERATIONS
The following table displays a rollforward of the reorganization of business accruals established for exit costsand employee separation costs from January 1, 2004 to December 31, 2004:
Accruals at 2004 Accruals atJanuary 1, Additional 2004(1) 2004 Amount December 31,
2004 Charges Adjustments Used 2004
Exit costsÌlease terminations $122 $Ì $(18) $ (31) $ 73Employee separation costs 116 54 (34) (95) 41
$238 $54 $(52) $(126) $114
(1) Includes translation adjustments.
Exit CostsÌLease Terminations
At January 1, 2004, the Company had an accrual of $122 million for exit costs attributable to leaseterminations. The 2004 adjustments of $18 million represented reversals of $29 million for accruals no longerneeded, partially offset by an $11 million translation adjustment. The $31 million used in 2004 reflected cashpayments to lessors. The remaining accrual of $73 million, which was included in Accrued liabilities in theCompany's consolidated balance sheet at December 31, 2004, represents future cash payments for lease terminationobligations.
Employee Separation Costs
At January 1, 2004, the Company had an accrual of $116 million for employee separation costs, representingthe severance costs for approximately 2,100 employees, of which 1,000 were direct employees and 1,100 wereindirect employees. The 2004 additional charges of $54 million represented the severance costs for approximately800 employees, of which 100 were direct employees and 700 were indirect employees. The adjustments of$34 million represented reversals of accruals no longer needed.
During 2004, approximately 2,500 employees, of which 1,000 were direct employees and 1,500 were indirectemployees, were separated from the Company. The $95 million used in 2004 reflected cash payments to theseseparated employees. The remaining accrual of $41 million was included in Accrued liabilities in the Company'sconsolidated balance sheet at December 31, 2004.
Liquidity and Capital Resources
As highlighted in the consolidated statements of cash flows, the Company's liquidity and available capitalresources are impacted by four key components: (i) current cash and cash equivalents, (ii) operating activities,(iii) investing activities, and (iv) financing activities.
Cash and Cash Equivalents
During 2006, the Company's cash and cash equivalents (which are highly-liquid investments with an originalmaturity of three months or less) decreased by $562 million to $3.2 billion at December 31, 2006, compared to$3.8 billion at December 31, 2005. At December 31, 2006, $300 million of this amount was held in the U.S. and$2.9 billion was held by the Company or its subsidiaries in other countries.
The Company has approximately $2.5 billion of earnings in foreign subsidiaries that are not permanentlyreinvested and may be repatriated without additional U.S. federal income tax charges to the Company'sconsolidated statements of operations, given the U.S. federal tax provisions accrued on undistributed earnings andthe utilization of available foreign tax credits. On a cash basis, these repatriations from the Company'snon-U.S. subsidiaries could require the payment of additional foreign taxes, which would be creditable againstU.S. federal income taxes. The repatriation of some of these funds could also be subject to delay for local countryapprovals.

48 MANAGEMENT'S DISCUSSION AND ANALYSISOF FINANCIAL CONDITION AND RESULTS OF OPERATIONS
Operating Activities
The Company has generated positive cash flow from continuing operations in each of the last six years. Thecash provided by operating activities from continuing operations in 2006 was $3.5 billion, compared to $4.3 billionin 2005 and $2.9 billion in 2004. The primary contributors to cash flow from operations in 2006 were: (i) earningsfrom continuing operations (adjusted for non-cash items) of $4.9 billion, and (ii) a $1.7 billion increase inaccounts payable and accrued liabilities. These positive contributors to operating cash flow were partially offset by:(i) a $1.8 billion increase in accounts receivable, (ii) a $718 million increase in inventories, (iii) a $388 millionincrease in other current assets, and (iv)a $215 million increase in other assets and other liabilities.
Accounts Receivable: The Company's net accounts receivable were $7.5 billion at December 31, 2006,compared to $5.7 billion at December 31, 2005. The Company's days sales outstanding (""DSO''), including netlong-term receivables, were 58 days at December 31, 2006, compared to 51 days at December 31, 2005. TheCompany's businesses sell their products in a variety of markets throughout the world. Payment terms can vary bymarket type and geographic location. Accordingly, the Company's levels of accounts receivable and DSO can beimpacted by the timing and level of sales that are made by its various businesses and by the geographic locations inwhich those sales are made.
Inventory: The Company's net inventory was $3.2 billion at December 31, 2006, compared to $2.4 billion atDecember 31, 2005. Inventory balances increased from 2005 to 2006 primarily due to: (i) slower than expectedinitial customer demand for certain products, (ii) an increase in inventory to fulfill longer-term projects, and (iii) abusiness acquisition. The Company's inventory turns decreased to 11.0 at December 31, 2006, compared to 11.3 atDecember 31, 2005, primarily due to slower than expected initial customer demand for certain products. Inventoryturns were calculated using an annualized rolling three months of cost of sales method. Inventory managementcontinues to be an area of focus as the Company balances the need to maintain strategic inventory levels to ensurecompetitive delivery performance to its customers against the risk of inventory obsolescence due to rapidly changingtechnology and customer spending requirements.
Reorganization of Businesses: The Company has implemented reorganization of businesses plans. Cashpayments for exit costs and employee separations in connection with these plans were $143 million in 2006, ascompared to $81 million in 2005. Of the $158 million reorganization of businesses accrual at December 31, 2006,$104 million relates to employee separation costs and is expected to be paid in 2007. The remaining $54 million inaccruals relate to lease termination obligations that are expected to be paid over a number of years.
Defined Benefit Plan Contributions: The Company contributed $276 million to its U.S. pension plans during2006, compared to $308 million contributed in 2005. The Company contributed $122 million to its non-U.S.pension plans during 2006, compared to $62 million contributed in 2005. During 2007, the Company expects tomake cash contributions of approximately $280 million to its U.S. pension plans and approximately $120 million toits non-U.S. pension plans. The Company contributed $27 million to its retiree health care plan in 2006, comparedto $43 million in 2005, and expects to contribute $24 million to this plan in 2007. Retirement-related benefits arefurther discussed below in the ""Significant Accounting PoliciesÌRetirement-Related Benefits'' section.
Investing Activities
The most significant components of the Company's investing activities include: (i) proceeds from sales ofinvestments and businesses, (ii) purchases of Sigma Funds investments, (iii) strategic acquisitions of, or investmentsin, other companies, and (iv) capital expenditures.
Net cash used for investing activities from continuing operations was $1.0 billion in 2006, as compared to netcash used of $2.4 billion in 2005 and $1.6 billion in 2004. This $1.3 billion decrease in cash used for investingactivities from continuing operations was due to: (i) a $1.8 billion decrease in cash used for the purchase of SigmaFunds investments, and (ii) a $463 million increase in proceeds from the sales of investments and businesses,partially offset by: (i) a $756 million increase in cash used for acquisitions and investments, (ii) a $101 millionincrease in capital expenditures, (iii) an $88 million increase in purchases of short-term investments, and (iv) an$18 million decrease in proceeds received from the disposition of property, plant and equipment. The $1.6 billionin cash used for investing activities from continuing operations in 2004 was primarily due to the initial purchase ofSigma Funds investments.
Sales of Investments and Businesses: The Company received $2.0 billion in proceeds from the sales ofinvestments and businesses in 2006, compared to proceeds of $1.5 billion in 2005 and $682 million in 2004. The

49MANAGEMENT'S DISCUSSION AND ANALYSISOF FINANCIAL CONDITION AND RESULTS OF OPERATIONS
$2.0 billion in proceeds in 2006 were primarily comprised of: (i) $856 million in net proceeds from the sale of theautomotive electronics business, (ii) $820 million from the sale of the Company's remaining shares in Sprint NextelCorporation (""Sprint Nextel'') and the termination and cash settlement of a zero-cost collar derivative relating tothese Sprint Nextel shares (the ""Sprint Nextel Derivative''), and (iii) $175 million from the sale of the Company'sremaining shares in Telus Corporation. The $1.5 billion in proceeds generated in 2005 were primarily comprised of:(i) $679 million from the sale of a portion of the Company's shares in Nextel Communications, Inc. (""Nextel'')during the first half of 2005, (ii) $391 million from the sale of a portion of the Company's shares in Sprint Nextelduring the fourth quarter of 2005, (iii) $232 million from the sale of a portion of the Company's shares inSemiconductor Manufacturing International Corporation, and (iv) $96 million received in connection with themerger of Sprint Corporation and Nextel.
Sigma Funds: The Company and its wholly-owned subsidiaries invest most of their excess cash in two funds(the ""Sigma Funds''), which are funds similar to a money market fund. The Company used $1.3 billion in net cashfor the purchase of Sigma Funds investments in 2006, compared to $3.2 billion in net cash used in 2005. The SigmaFunds aggregate balances were $12.2 billion at December 31, 2006, compared to $10.9 billion at December 31,2005. At December 31, 2006, $8.7 billion of the Sigma Funds investments were held in the U.S. and $3.5 billionwere held by the Company or its subsidiaries in other countries. Repatriation of some of these funds could besubject to delay and could have potential adverse tax consequences.
The Sigma Funds portfolios are managed by five major outside investment management firms and includeinvestments in high quality (rated at least A/A-1 by S&P or A2/P-1 by Moody's at purchase date), U.S. dollar-denominated debt obligations including certificates of deposit, bankers' acceptances and fixed time deposits,government obligations, asset-backed securities and commercial paper or short-term corporate obligations. TheSigma Funds investment policies require that the acquired floating rate instruments must have a maturity at purchasedate that does not exceed thirty-six months with an interest rate reset at least annually. The average maturity of theinvestments held by the funds must be 120 days or less with the actual average maturity of the investments being53 days and 74 days at December 31, 2006 and December 31, 2005, respectively. Certain investments withmaturities beyond one year have been classified as short-term based on their highly-liquid nature and because suchmarketable securities represent the investment of cash that is available for current operations.
Strategic Acquisitions and Investments: The Company used cash for acquisitions and new investmentactivities of $1.1 billion in 2006, compared to cash used of $312 million in 2005 and $476 million in 2004. Thelargest components of the $1.1 billion in 2006 expenditures were: (i) $300 million for an equity investment inClearwire, Inc., (ii) $193 million for the acquisition of TTP Communications plc by the Mobile Devices segment,(iii) $181 million for the acquisition of Broadbus Technologies, Inc. by the Connected Home Solutions segment,(iv) $108 million for the acquisition of Kreatel Communications AB by the Connected Home Solutions segment,(v) the acquisition of Orthogon Systems by the Networks and Enterprise segment, and (vi) the acquisition ofNextNet Wireless, Inc. by the Networks and Enterprise segment. The largest components of the $312 million in2005 expenditures were: (i) the acquisition of the remaining interest of MIRS Communications Israel LTD. by theNetworks and Enterprise segment, (ii) the acquisition of Wireless Valley Communications, Inc. by the Networksand Enterprise segment, (iii) the acquisition of certain IP assets and R&D workforce from Sendo by the MobileDevices segment, (iv) the acquisition of Ucentric Systems, Inc. by the Connected Home Solutions segment, and(v) the funding of joint ventures formed by Motorola and Comcast that focus on developing the next-generationof conditional access technologies
In early 2007, Motorola completed three strategic acquisitions for a net aggregate of approximately $4.2 billionin cash (reflecting an aggregate of approximately $4.6 billion of cash spent less an aggregate of approximately$400 million of cash acquired in the acquisitions). Symbol Technologies, Inc. was acquired by the Networks andEnterprise segment in January 2007 for approximately $3.9 billion in cash. Good Technology, Inc. was acquired bythe Mobile Devices segment in January 2007 for approximately $500 million in cash. Netopia, Inc. was acquired by

50 MANAGEMENT'S DISCUSSION AND ANALYSISOF FINANCIAL CONDITION AND RESULTS OF OPERATIONS
the Connected Home Solutions segment in February 2007 for approximately $200 million in cash. The followingtable displays the relative impact of the early 2007 acquisitions on Motorola's domestic and non-U.S. balances:
Summary of Cash Impact from Early 2007 Acquisitions
Non-($ in billions) U.S. U.S. Total
Balances at December 31, 2006Cash and cash equivalents $0.3 $2.9 $ 3.2Sigma Funds 8.7 3.5 12.2Short-Term Investments 0.0 0.2 0.2
Total 9.0 6.6 15.6
Net Cash (used for) provided by early 2007 acquisitions* (4.3) 0.1 (4.2)
Balance reflecting early 2007 acquisitions $4.7 $6.7 $11.4
* As described above, in early 2007, Motorola used an aggregate net of approximately $4.2 billion of cash (reflecting approximately $4.6 billionof cash spent less approximately $400 million of cash acquired from the acquisitions) to complete three strategic acquisitions. The cash usedfor these acquisitions was held in the U.S. and primarily came from the liquidation of Sigma Funds investments held in the U.S. A portion ofthe cash acquired in these acquisitions was outside of the U.S.
Capital Expenditures: Capital expenditures were $649 million in 2006, compared to $548 million in 2005 and$405 million in 2004. The Company's emphasis in making capital expenditures is to focus on strategic investmentsdriven by customer demand and new design capability.
Short-Term Investments: At December 31, 2006, the Company had $224 million in short-term investments(which are highly-liquid fixed-income investments with an original maturity greater than three months but less thanone year), compared to $144 million of short-term investments at December 31, 2005.
Available-For-Sale Securities: In addition to available cash and cash equivalents, Sigma Funds and short-terminvestments, the Company views its available-for-sale securities as an additional source of liquidity. The majority ofthese securities represent investments in technology companies and, accordingly, the fair market values of thesesecurities are subject to substantial price volatility. In addition, the realizable value of these securities is subject tomarket and other conditions. At December 31, 2006, the Company's available-for-sale securities portfolio had anapproximate fair market value of $130 million, which represented a cost basis of $70 million and a net unrealizedgain of $60 million. At December 31, 2005, the Company's available-for-sale securities portfolio had anapproximate fair market value of $1.2 billion, which represented a cost basis of $1.1 billion and a net unrealizedgain of $157 million.
Sprint Nextel Investment: During the first quarter of 2006, the Company entered into the Sprint NextelDerivative to protect itself economically against price fluctuations in its 37.6 million shares of Sprint Nextel non-voting common stock. During the second quarter of 2006, as a result of Sprint Nextel's spin-off of EmbarqCorporation through a dividend to Sprint Nextel shareholders, the Company received approximately 1.9 millionshares of Embarq Corporation. The floor and ceiling prices of the Sprint Nextel Derivative were adjustedaccordingly. The Sprint Nextel Derivative was not designated as a hedge under the provisions of Statement ofFinancial Accounting Standards No. 133, ""Accounting for Derivative Instruments and Hedging Activities.''Accordingly, to reflect the change in fair value of the Sprint Nextel Derivative, the Company recorded a net gain of$99 million for the full year ending December 31, 2006, included in Other income (expense) in the Company'sconsolidated statements of operations.
In December 2006, the Sprint Nextel Derivative was terminated and settled in cash and the 37.6 million sharesof Sprint Nextel were converted to common shares and sold. The Company received aggregate cash proceeds ofapproximately $820 million from the settlement of the Sprint Nextel Derivative and the subsequent sale of the37.6 million Sprint Nextel Shares. The Company recognized a loss of $126 million in connection with the sale ofthe remaining shares of Sprint Nextel common stock. As described above, the Company recorded a net gain of$99 million in connection with the Sprint Nextel Derivative.

51MANAGEMENT'S DISCUSSION AND ANALYSISOF FINANCIAL CONDITION AND RESULTS OF OPERATIONS
Financing Activities
The most significant components of the Company's financing activities are: (i) the purchase of the Company'scommon stock under its share repurchase program, (ii) proceeds from the issuances of stock due to the exercise ofemployee stock options and purchases under the employee stock purchase plan, (iii) the payment of dividends,(iv) excess tax benefits from share-based compensation, (v) net proceeds from commercial paper and short-termborrowings, (vi) distributions to discontinued operations, and (vii) repayment of debt.
Net cash used for financing activities from continuing operations was $3.2 billion in 2006, compared to$907 million of cash used in 2005 and $153 million of cash used in 2004. Cash used for financing activities fromcontinuing operations in 2006 was primarily: (i) $3.8 billion of cash used for purchases of the Company's commonstock under the share repurchase program, (ii) $443 million of cash used to pay dividends, and (iii) $23 millionpaid to discontinued operations for interim funding requirements associated with the automotive electronicsbusiness prior to the sale, partially offset by proceeds of: (i) $918 million received from the issuance of commonstock in connection with the Company's employee stock option plans and employee stock purchase plan,(ii) $165 million in excess tax benefits from share-based compensation, and (iii) $66 million in net proceeds fromcommercial paper and short-term borrowings.
Cash used for financing activities from continuing operations in 2005 was primarily attributable to:(i) $1.1 billion of cash used to repay debt, (ii) $874 million of cash used for purchases of the Company's commonstock under the share repurchase program, and (iii) $394 million of cash used to pay dividends, partially offset byproceeds of $1.2 billion received from the issuance of common stock in connection with the Company's employeestock option plans and employee stock purchase plan.
Short-term Debt: At December 31, 2006, the Company's outstanding notes payable and current portion oflong-term debt was $1.7 billion, compared to $448 million at December 31, 2005. During the fourth quarter of2006, $1.2 billion of 4.608% Senior Notes due November 16, 2007 (the ""2007 4.608% Notes'') were reclassified tocurrent portion of long-term debt.
Net cash proceeds from the sale of commercial paper and short-term borrowings were $66 million in 2006,compared to $11 million in 2005. The Company had $300 million of outstanding commercial paper on bothDecember 31, 2006 and 2005.
Long-term Debt: At December 31, 2006, the Company had outstanding long-term debt of $2.7 billion,compared to $3.8 billion at December 31, 2005. The change can be primarily attributed to the reclassification tocurrent portion of long-term debt of the $1.2 billion of 2007 4.608% Notes.
Redemptions and Repurchases of Outstanding Debt Securities: In January 2007, the Company repaid, atmaturity, all $118 million aggregate principal amount outstanding of its 7.6% Notes due January 1, 2007.
In September 2005, the Company repurchased an aggregate principal amount of $1.0 billion of its outstandinglong-term debt for an aggregate purchase price of $1.1 billion through cash tender offers. Included in the$1.0 billion of long-term debt repurchased were repurchases of a principal amount of: (i) $86 million of the$200 million of 6.50% Notes due 2008 outstanding, (ii) $241 million of the $325 million of 5.80% Notes due2008 outstanding, and (iii) $673 million of the $1.2 billion of 7.625% Notes due 2010 outstanding. In addition, theCompany terminated a notional amount of $1.0 billion fixed-to-floating interest rate swaps associated with the debtrepurchased, resulting in an expense of approximately $22 million. The aggregate charge for the repurchase of thedebt and the termination of the associated interest rate swaps, as presented in Other income (expense), was$137 million.
On September 1, 2005, the Company retired $1 million of the $398 million of the 2025 Debentures inconnection with the holders of the debentures right to put their debentures back to the Company. The residual putoptions expired unexercised and the remaining $397 million of 2025 Debentures were reclassified back to long-termdebt.
The Company may from time to time seek to opportunistically retire certain of its outstanding debt throughopen market cash purchases, privately-negotiated transactions or otherwise. Such repurchases, if any, will depend onprevailing market conditions, the Company's liquidity requirements, contractual restrictions and other factors.
Share Repurchase Program: In May 2005, the Board of Directors authorized the Company to purchase up to$4.0 billion of its outstanding common stock over a period of up to 36 months ending in May 2008, subject to

52 MANAGEMENT'S DISCUSSION AND ANALYSISOF FINANCIAL CONDITION AND RESULTS OF OPERATIONS
market conditions (the ""2005 Stock Repurchase Program''). In July 2006, the Company entered into an acceleratedstock buyback agreement to repurchase approximately $1.2 billion of its outstanding common stock (""ASB''). InOctober 2006, the Company received the final distribution of shares under the ASB. The total shares purchasedunder the ASB were 50.5 million shares. The ASB completed the 2005 Stock Repurchase Program.
On July 24, 2006, the Board of Directors authorized the Company to repurchase up to an additional$4.5 billion of its outstanding shares of common stock over a period of up to 36 months ending in June 2009,subject to market conditions (the ""2006 Stock Repurchase Program''). In the fourth quarter of 2006, the Companypurchased $700 million of shares under the 2006 Stock Repurchase Program.
The Company repurchased a total of 171.7 million common shares (including shares received under the ASB)at a cost of $3.8 billion in 2006. The Company repurchased a total of 41.7 million common shares at a cost of$874 million in 2005. All repurchased shares have been retired.
Credit Ratings: Three independent credit rating agencies, Fitch Investors Service (""Fitch''), Moody's InvestorServices (""Moody's''), and Standard & Poor's (""S&P''), assign ratings to the Company's short-term and long-termdebt. The following chart reflects the current ratings assigned to the Company's senior unsecured non-creditenhanced long-term debt and the Company's commercial paper by each of these agencies.
Long-Term Debt CommercialName of Rating Agency Rating Outlook Paper Date of Last Action
Moody's Baa1 positive P-2 October 25, 2006 (upgrade)Fitch A- stable F-1 July 19, 2006 (upgrade)S&P A- stable A-1 June 26, 2006 (upgrade)
In October 2006, Moody's upgraded the Company's long-term debt rating to ""Baa1'' with a positive outlookfrom ""Baa2'' with a stable outlook. Moody's also affirmed the Company's ""P-2'' short-term debt rating. Therewere no other changes in the Company's debt ratings during the fourth quarter of 2006.
The Company's debt ratings are considered ""investment grade.'' If the Company's senior long-term debt wererated lower than ""BBB-'' by S&P or Fitch or ""Baa3'' by Moody's (which would be a decline of three levels fromcurrent Moody's ratings), the Company's long-term debt would no longer be considered ""investment grade.'' If thiswere to occur, the terms on which the Company could borrow money would become more onerous. The Companywould also have to pay higher fees related to its domestic revolving credit facility. The Company has neverborrowed under its domestic revolving credit facilities.
The Company continues to have access to the commercial paper and long-term debt markets. The Companyhas maintained commercial paper balances of between $300 million and $400 million for the past four years.
As further described under ""Customer Financing Arrangements'' below, for many years the Company hasutilized a number of receivables programs to sell a broadly-diversified group of short-term receivables to thirdparties. Certain of the short-term receivables are sold to a multi-seller commercial paper conduit. This programprovides for up to $500 million of short-term receivables to be outstanding with the conduit at any time. Theobligations of the conduit to continue to purchase receivables under this short-term receivables program could beterminated if the Company's long-term debt was rated lower than ""BB°'' by S&P or ""Ba1'' by Moody's (whichwould be a decline of four levels from the current Moody's rating). If this short-term receivables program wereterminated, the Company would no longer be able to sell its short-term receivables to the conduit in this manner,but it would not have to repurchase previously-sold receivables.
Credit Facilities
At December 31, 2006, the Company's total domestic and non-U.S. credit facilities totaled $4.0 billion, ofwhich $175 million was considered utilized. These facilities are principally comprised of: (i) a $2.0 billion five-yearrevolving domestic credit facility maturing in December 2011 (the ""5-Year Credit Facility'') which is not utilized,and (ii) $2.0 billion of non-U.S. credit facilities (of which $175 million was considered utilized at December 31,2006). The 5-Year Credit Facility replaced the Company's former $1.0 billion three-year revolving domestic creditfacility, which was scheduled to mature in May 2007. Unused availability under the existing credit facilities,together with available cash, cash equivalents, Sigma Funds balances and other sources of liquidity, are generallyavailable to support outstanding commercial paper, which was $300 million at December 31, 2006.

53MANAGEMENT'S DISCUSSION AND ANALYSISOF FINANCIAL CONDITION AND RESULTS OF OPERATIONS
In order to borrow funds under the 5-Year Credit Facility, the Company must be in compliance with variousconditions, covenants and representations contained in the agreements. The Company was in compliance with theterms of the 5-Year Credit Facility at December 31, 2006. The Company has never borrowed under its domesticrevolving credit facilities. Utilization of the non-U.S. credit facilities may also be dependent on the Company'sability to meet certain conditions at the time a borrowing is requested.
Contractual Obligations, Guarantees, and Other Purchase Commitments
Contractual Obligations
Summarized in the table below are the Company's obligations and commitments to make future paymentsunder debt obligations (assuming earliest possible exercise of put rights by holders), lease payment obligations, andpurchase obligations as of December 31, 2006.
Payments Due by Period(1)
(in millions) Total 2007 2008 2009 2010 2011 Thereafter
Long-Term Debt Obligations $4,134 $1,340 $ 198 $ 4 $534 $607 $1,451Lease Obligations 2,328 351 281 209 178 158 1,151Purchase Obligations 1,035 326 120 26 12 12 539
Total Contractual Obligations $7,497 $2,017 $ 599 $239 $724 $777 $3,141
(1) Amounts included represent firm, non-cancelable commitments.
Debt Obligations: At December 31, 2006, the Company's long-term debt obligations, including currentmaturities and unamortized discount and issue costs, totaled $4.1 billion, as compared to $4.0 billion atDecember 31, 2005. A table of all outstanding long-term debt securities can be found in Note 4, ""Debt and CreditFacilities,'' to the Company's consolidated financial statements.
Lease Obligations: The Company owns most of its major facilities, but does lease certain office, factory andwarehouse space, land, and information technology and other equipment under principally non-cancelable operatingleases. At December 31, 2006, future minimum lease obligations, net of minimum sublease rentals, totaled$2.3 billion. Rental expense, net of sublease income, was $241 million in 2006, $250 million in 2005 and$205 million in 2004.
Purchase Obligations: The Company has entered into agreements for the purchase of inventory, license ofsoftware, promotional agreements, and research and development agreements which are firm commitments and arenot cancelable. The longest of these agreements extends through 2015. Total payments expected to be made underthese agreements total $1.0 billion.
Commitments Under Other Long-Term Agreements: The Company has entered into certain long-termagreements to purchase software, components, supplies and materials from suppliers. Most of the agreementsextend for periods of one to three years (three to five years for software). However, generally these agreements donot obligate the Company to make any purchases, and many permit the Company to terminate the agreement withadvance notice (usually ranging from 60 to 180 days). If the Company were to terminate these agreements, itgenerally would be liable for certain termination charges, typically based on work performed and supplier on-handinventory and raw materials attributable to canceled orders. The Company's liability would only arise in the event itterminates the agreements for reasons other than ""cause.''
The Company also enters into a number of arrangements for the sourcing of supplies and materials withminimum purchase commitments and take-or-pay obligations. The majority of the minimum purchase obligationsunder these contracts are over the life of the contract as opposed to a year-by-year take-or-pay. If these agreementswere terminated at December 31, 2006, the Company's obligation would not have been significant. The Companydoes not anticipate the cancellation of any of these agreements in the future. Subsequent to the end of 2006, theCompany entered into take-or-pay arrangements with suppliers through May 2009 with minimum purchaseobligations of $2.2 billion during that period. The Company estimates purchases during that period that exceed theminimum obligations.
The Company outsources certain corporate functions, such as benefit administration and informationtechnology-related services. These contracts are expected to expire in 2013. The total remaining payments underthese contracts are approximately $1.3 billion over the remaining seven years; however, these contracts can be

54 MANAGEMENT'S DISCUSSION AND ANALYSISOF FINANCIAL CONDITION AND RESULTS OF OPERATIONS
terminated. Termination would result in a penalty substantially less than the remaining annual contract payments.The Company would also be required to find another source for these services, including the possibility ofperforming them in-house.
As is customary in bidding for and completing network infrastructure projects and pursuant to a practice theCompany has followed for many years, the Company has a number of performance/bid bonds and standby lettersof credit outstanding, primarily relating to projects of the Networks and Enterprise segment. These instrumentsnormally have maturities of up to three years and are standard in the industry as a way to give customers aconvenient mechanism to seek resolution if a contractor does not satisfy performance requirements under acontract. A customer can draw on the instrument only if the Company does not fulfill all terms of a projectcontract. If such an occasion occurred, the Company would be obligated to reimburse the financial institution thatissued the bond or letter of credit for the amounts paid. The Company is not generally required to post any cash inconnection with the issuance of these bonds or letters of credit. In its long history, it has been extraordinarilyuncommon for the Company to have a performance/bid bond or standby letter of credit drawn upon. AtDecember 31, 2006, outstanding performance/bid bonds and standby letters of credit totaled approximately$1.5 billion, compared to $1.0 billion at the end of 2005.
Off-Balance Sheet Arrangements: Under the definition contained in Item 303(a)(4)(ii) of Regulation S-K,the Company does not have any off-balance sheet arrangements.
Adequate Internal and External Funding Resources
The Company believes that it has adequate internal and external resources available to fund expected workingcapital and capital expenditure requirements for the next twelve months as supported by the level of cash, cashequivalents and Sigma Funds in the U.S., the ability to repatriate cash, cash equivalents and Sigma Funds fromforeign jurisdictions, the ability to borrow under existing or future credit facilities, the ability to issue commercialpaper, and access to the short-term and long-term debt markets.
Customer Financing Commitments and Guarantees
Outstanding Commitments: Certain purchasers of the Company's infrastructure equipment continue torequest that suppliers provide financing in connection with equipment purchases. These requests may include all ora portion of the purchase price of the equipment. Periodically, the Company makes commitments to providefinancing to purchasers in connection with the sale of equipment. However, the Company's obligation to providefinancing is often conditioned on the issuance of a letter of credit in favor of the Company by a reputable bank tosupport the purchaser's credit or a pre-existing commitment from a reputable bank to purchase the receivable fromthe Company. The Company had outstanding commitments to extend credit to third-parties totaling $398 million atDecember 31, 2006, compared to $689 million at December 31, 2005. Of these amounts, $262 million wassupported by letters of credit or by bank commitments to purchase receivables at December 31, 2006, compared to$594 million at December 31, 2005.
Guarantees of Third-Party Debt: In addition to providing direct financing to certain equipment customers,the Company also assists customers in obtaining financing directly from banks and other sources to fund equipmentpurchases. The Company had committed to provide financial guarantees relating to customer financing totaling$122 million and $140 million at December 31, 2006 and December 31, 2005, respectively (including $19 millionand $66 million, respectively, relating to the sale of short-term receivables). Customer financing guaranteesoutstanding were $47 million and $79 million at December 31, 2006 and December 31, 2005, respectively(including $2 million and $42 million, respectively, relating to the sale of short-term receivables).
Customer Financing Arrangements
Outstanding Finance Receivables: The Company had net finance receivables of $269 million at December 31,2006, compared to $260 million at December 31, 2005 (net of allowances for losses of $10 million atDecember 31, 2006 and $12 million at December 31, 2005). These finance receivables are generally interestbearing, with rates ranging from 2% to 11%. Interest income recognized on finance receivables for the years endedDecember 31, 2006, 2005 and 2004 was $9 million, $7 million and $9 million, respectively.
Telsim Loan: On October 28, 2005, the Company entered into an agreement to resolve disputes regardingTelsim Mobil Telekomunikasyon Hizmetleri A.S. (""Telsim'') with Telsim and the government of Turkey. The

55MANAGEMENT'S DISCUSSION AND ANALYSISOF FINANCIAL CONDITION AND RESULTS OF OPERATIONS
government of Turkey and the Turkish Savings and Deposit Insurance Fund (""TMSF'') are third-party beneficiariesof the settlement agreement. In settlement of its claims, the Company received $410 million in cash in 2006 and$500 million in 2005. The Company is permitted to, and will continue to, enforce its U.S. court judgment againstthe Uzan family, except in Turkey and three other countries.
Sales of Receivables and Loans: From time to time, the Company sells short-term receivables, long-termloans and lease receivables under sales-type leases (collectively, ""finance receivables'') to third parties intransactions that qualify as ""true-sales.'' Certain of these finance receivables are sold to third parties on a one-time,non-recourse basis, while others are sold to third parties under committed facilities that involve contractualcommitments from these parties to purchase qualifying receivables up to an outstanding monetary limit. Committedfacilities may be revolving in nature. Certain sales may be made through separate legal entities that are alsoconsolidated by the Company. The Company may or may not retain the obligation to service the sold financereceivables.
In the aggregate, at December 31, 2006, these committed facilities provided for up to $1.3 billion to beoutstanding with the third parties at any time, as compared to up to $1.1 billion provided at December 31, 2005and up to $724 million provided at December 31, 2004. As of December 31, 2006, $817 million of thesecommitted facilities were utilized, compared to $585 million utilized at December 31, 2005 and $305 millionutilized at December 31, 2004. Certain events could cause one of these facilities to terminate. In addition, beforereceivables can be sold under certain of the committed facilities, they may need to meet contractual requirements,such as credit quality or insurability.
Total finance receivables sold by the Company were $6.4 billion in 2006 (including $6.2 billion of short-termreceivables), compared to $4.5 billion sold in 2005 (including $4.2 billion of short-term receivables) and$3.8 billion sold in 2004 (including $3.8 billion of short-term receivables). As of December 31, 2006, there were$1.1 billion of receivables outstanding under these programs for which the Company retained servicing obligations(including $789 million of short-term receivables), compared to $1.0 billion outstanding at December 31, 2005(including $838 million of short-term receivables) and $720 million outstanding at December 31, 2004 (including$589 of short-term receivables).
Under certain of the receivables programs, the value of the receivables sold is covered by credit insuranceobtained from independent insurance companies, less deductibles or self-insurance requirements under the policies(with the Company retaining credit exposure for the remaining portion). The Company's total credit exposure tooutstanding short-term receivables that have been sold was $19 million at December 31, 2006 as compared to$66 million at December 31, 2005. A reserve of $4 million was recorded for potential losses on sold receivables atboth December 31, 2006 and December 31, 2005.
Other Contingencies
Potential Contractual Damage Claims in Excess of Underlying Contract Value: In certain circumstances, ourbusinesses may enter into contracts with customers pursuant to which the damages that could be claimed by theother party for failed performance might exceed the revenue the Company receives from the contract. Contractswith these sorts of uncapped damage provisions are fairly rare, but individual contracts could still representmeaningful risk. Although it has not previously happened to the Company, there is a possibility that a damage claimby a counterparty to one of these contracts could result in expenses to the Company that are far in excess of therevenue received from the counterparty in connection with the contract.
Legal Matters: The Company has several lawsuits filed against it relating to the Iridium program, as furtherdescribed under ""Item 3: Legal Proceedings'' of this document. The Company has not reserved for any potentialliability that may arise as a result of litigation related to the Iridium program. While the still pending cases are invarious stages and the outcomes are not predictable, an unfavorable outcome of one or more of these cases couldhave a material adverse effect on the Company's consolidated financial position, liquidity or results of operations.
The Company is a defendant in various other lawsuits and is subject to various claims which arise in thenormal course of business. In the opinion of management, and other than discussed above with respect to the stillpending Iridium cases, the ultimate disposition of these matters will not have a material adverse effect on theCompany's consolidated financial position, liquidity or results of operations.

56 MANAGEMENT'S DISCUSSION AND ANALYSISOF FINANCIAL CONDITION AND RESULTS OF OPERATIONS
Segment Information
The following commentary should be read in conjunction with the financial results of each reporting segmentas detailed in Note 11, ""Information by Segment and Geographic Region,'' to the Company's consolidated financialstatements. Net sales and operating results for the Company's three operating segments for 2006, 2005 and 2004 arepresented below.
Mobile Devices Segment
The Mobile Devices segment designs, manufactures, sells and services wireless handsets with integratedsoftware and accessory products, and licenses intellectual property. In 2006, the segment's net sales represented 66%of the Company's consolidated net sales, compared to 61% in 2005 and 58% in 2004.
Years Ended December 31 Percent Change(Dollars in millions) 2006 2005 2004 2006Ì2005 2005Ì2004
Segment net sales $28,383 $21,459 $17,108 32% 25%Operating earnings 2,690 2,192 1,728 23% 27%
Segment ResultsÌ2006 Compared to 2005
In 2006, the segment's net sales increased 32% to $28.4 billion, compared to $21.5 billion in 2005. Theincrease in net sales was driven by a 49% increase in unit shipments, primarily driven by strong demand for GSMand CDMA handsets and reflecting consumers' desire for the segment's compelling products that combineinnovative style and leading technology, partially offset by an 11% decrease in average selling price (""ASP''). On aproduct technology basis, net sales of products for GSM and CDMA technologies increased and net sales ofproducts for iDEN and UMTS technologies decreased. On a geographic basis, net sales increased in High Growthmarkets (defined as countries in the Middle East, Africa, Southeast Asia and India), North Asia, North Americaand Latin America, and decreased in Europe.
The segment's operating earnings increased to $2.7 billion in 2006, compared to operating earnings of$2.2 billion in 2005. The 23% increase in operating earnings was primarily due to an increase in gross margin,driven primarily by: (i) the 49% increase in unit shipments, (ii) savings from supply chain cost-reduction initiatives,and (iii) increased income from technology and platform licensing, partially offset by the 11% decline in ASP. Theincrease in gross margin was partially offset by: (i) an increase in selling, general and administrative (""SG&A'')expenses, primarily driven by an increase in marketing expenses to support higher net sales and promote brandawareness, and (ii) an increase in research and development (""R&D'') expenditures, as a result of an increase indevelopmental engineering for new product development and software, as well as ongoing investment in next-generation technologies. The segment's industry typically experiences short life cycles for new products, so it is vitalto the segment's success that new, compelling products are constantly introduced. Therefore, a strong commitmentto R&D is required to fuel long-term growth. As a percentage of net sales, SG&A expenses increased and R&Dexpenditures decreased as compared to 2005.
The segment's backlog was $1.4 billion at December 31, 2006, compared to $3.0 billion at December 31,2005. This decrease in backlog is primarily due to an unusually high level of backlog at December 31, 2005 due tostrong customer demand for new products during the fourth quarter of 2005, certain of which were unable to beshipped in significant quantities due to supply constraints for select components.
Unit shipments increased 49% to 217.4 million units in 2006, compared to 146.0 million units in 2005. Theoverall increase was driven by increased unit shipments of products for GSM, CDMA and UMTS technologies,partially offset by decreased unit shipments of products for iDEN technology. For the full year 2006, unitshipments by the segment increased in all regions. Due to the segment's increase in unit shipments outpacing overallgrowth in the worldwide handset market, which grew approximately 20% in 2006, the segment believes that itexpanded its global handset market share to an estimated 22% in 2006.
In 2006, ASP decreased approximately 11% compared to 2005. The overall decrease in ASP was drivenprimarily by an unfavorable geographic and product-tier mix. By comparison, ASP decreased approximately 10% in2005 and increased approximately 15% in 2004. ASP is impacted by numerous factors, including product mix,market conditions and competitive product offerings, and ASP trends often vary over time.

57MANAGEMENT'S DISCUSSION AND ANALYSISOF FINANCIAL CONDITION AND RESULTS OF OPERATIONS
The largest of the segment's end customers (including sales through distributors) are China Mobile, Verizon,Sprint Nextel, Cingular, and T-Mobile. These five largest customers accounted for approximately 39% of thesegment's net sales in 2006. Besides selling directly to carriers and operators, the segment also sells productsthrough a variety of third-party distributors and retailers, which account for approximately 38% of the segment'snet sales. The largest of these distributors is Brightstar Corporation. The loss of any of the segment's key customerscould have a significant impact on the segment's business.
Although the U.S. market continued to be the segment's largest individual market, many of our customers, andmore than 65% of our segment's 2006 net sales, were outside the U.S. The largest of these international markets areChina, Brazil, the United Kingdom, Mexico, and Hong Kong.
During 2006, the segment completed the acquisition of TTP Communications plc, a developer of intellectualproperty used in the design and manufacture of wireless communication terminals and a leading provider ofprotocol stack software that offers rapid customization of handsets through its AJAR applications framework.Subsequent to the end of 2006, the segment completed the acquisition of Good Technology, Inc., a leader inenterprise mobile computing software and service.
Segment ResultsÌ2005 Compared to 2004
In 2005, the segment's net sales increased 25% to $21.5 billion, compared to $17.1 billion in 2004. Theincrease in net sales was driven by a 40% increase in unit shipments in 2005, reflecting strong consumer demand forGSM handsets. The segment had increased net sales in all regions as a result of an improved product portfolio,strong market growth in emerging markets and high replacement sales in more mature markets.
The segment's operating earnings increased to $2.2 billion in 2005, compared to operating earnings of$1.7 billion in 2004. The 27% increase in operating earnings was primarily related to an increase in gross margin,driven by the 25% increase in net sales. The improvement in gross margin was partially offset by: (i) an increase inSG&A expenses, primarily driven by increased marketing expenses to support higher net sales and brand awareness,and (ii) an increase in R&D expenditures, as a result of increased investment in new product development. As apercentage of net sales, both R&D expenditures and SG&A expenses decreased in 2005 as compared to 2004.
The segment's backlog was $3.0 billion at December 31, 2005, compared to $1.5 billion at December 31,2004. During 2005, the segment had strong order growth and backlog increased due to: (i) strong customerdemand for new products during the fourth quarter of 2005, certain of which were unable to be shipped insignificant quantities due to supply constraints for select components, and (ii) the segment's higher level of generalorder input in the fourth quarter of 2005 compared to the fourth quarter of 2004.
Unit shipments increased 40% to 146.0 million in 2005, compared to 104.5 million in 2004. The increase inunit shipments was attributed to broad acceptance of the segment's product offering, particularly a strong demandfor GSM handsets. For the full year 2005, unit shipments by the segment increased in all regions. Due to thesegment's increase in unit shipments outpacing overall growth in the worldwide handset market, which grewapproximately 17% in 2005, the segment believes that it expanded its global market share to an estimated 18% in2005.
In 2005, ASP decreased approximately 10% compared to 2004. The overall decrease in ASP was drivenprimarily by a higher percentage of lower-tier, lower-priced handsets in the overall sales mix. By comparison, ASPincreased approximately 15% in 2004 and declined approximately 8% in 2003.
The largest of the segment's end customers (including sales through distributors) were Sprint Nextel, Cingular,China Mobile, Am πerica M πovil and T-Mobile. These five largest customers accounted for approximately 41% of thesegment's net sales in 2005. During 2005, purchases of iDEN» products by Sprint Nextel comprised approximately13% of the segment's net sales. Besides selling directly to carriers and operators, the segment also sells productsthrough a variety of third-party distributors and retailers, which account for approximately 36% of the segment'snet sales. The largest of these distributors was Brightstar Corporation.
Although the U.S. market continued to be the segment's largest individual market, many of our customers, andmore than 63% of our segment's 2005 net sales, were outside the U.S. The largest of these international marketswere China, the United Kingdom, Brazil, Germany and Mexico.

58 MANAGEMENT'S DISCUSSION AND ANALYSISOF FINANCIAL CONDITION AND RESULTS OF OPERATIONS
Networks and Enterprise Segment
The Networks and Enterprise segment designs, manufactures, sells, installs and services: (i) cellularinfrastructure systems and wireless broadband systems to public carriers and other wireless service providers(referred to as the ""public networks'' market), and (ii) analog and digital two-way radio, voice and datacommunications products and systems, as well as wireless broadband systems, to a wide range of public safety,government, utility, transportation and other worldwide enterprise markets (referred to as the ""private networks''market). In January 2007, the segment completed the acquisition of Symbol Technologies Inc. (""Symbol''), aleader in designing, developing, manufacturing and servicing products and systems used in end-to-end enterprisemobility solutions. Symbol will become the cornerstone of the segment's enterprise mobility strategy. In 2006, thesegment's net sales represented 26% of the Company's consolidated net sales, compared to 32% in 2005 and 35% in2004.
Years Ended December 31 Percent Change(Dollars in millions) 2006 2005 2004 2006 Ì 2005 2005Ì2004
Segment net sales $11,245 $11,202 $10,465 0% 7%Operating earnings 1,521 1,939 1,550 (22)% 25%
Segment ResultsÌ2006 Compared to 2005
The segment's net sales were $11.2 billion in both 2006 and 2005. The slight increase in net sales was primarilydriven by higher net sales in the Europe, Middle East and Africa region (""EMEA'') and Latin America, partiallyoffset by lower net sales in North America and Asia. In the private networks market, net sales were up in allregions, driven by increased demand for enhanced mission-critical communications systems. Net sales to the publicnetworks market decreased, primarily due to decreases in: (i) Asia, due in part to delays in the granting of 3Glicenses in China that have led service providers to slow their near-term capital investment and competitive pricing,(ii) North America, primarily due to customer expenditures returning to historic trends compared to anexceptionally strong 2005, and (iii) Latin America, partially offset by a slight increase in net sales in EMEA.
The segment's operating earnings were $1.5 billion in 2006, compared to operating earnings of $1.9 billion in2005. The 22% decrease in operating earnings was primarily due to: (i) a decrease in gross margin, due to anunfavorable product/regional mix and competitive pricing in the public networks market, and (ii) an increase inreorganization of business charges, primarily related to employee severance. As a percentage of net sales, both R&Dexpenditures and SG&A expenses were flat compared to 2005.
Net sales into U.S. markets represented approximately 51% of the segment's total net sales in 2006, comparedto approximately 52% in 2005. Due to the nature of the segment's business, many of the agreements we enter intoare long-term contracts that require sizeable investments by our customers. Net sales to the segment's topfive commercial customers, plus the U.S. government and its public safety agencies, represented approximately 34%of the segment's net sales in 2006. The loss of one of these major customers could have a significant impact on thesegment's business and, because many of these contracts are long-term in nature, could impact revenue and earningsover several quarters. The segment's backlog was $4.4 billion at December 31, 2006, compared to $4.1 billion atDecember 31, 2005.
In the private networks business, natural disasters and terrorist-related worldwide events in 2005 continued toplace an emphasis on mission-critical communications systems. Spending by the segment's private networks marketcustomers is affected by government budgets at the national, state and local levels.
In the public networks business, Sprint Nextel selected the segment to play a major role in the Sprint NextelWiMAX infrastructure roll-out. The segment has been a long-standing proponent of WiMAX and is nowparticipating in 22 WiMAX trials globally. The segment also maintained momentum in infrastructure developmentand services in 2006 by continuing to deliver outstanding technologies and services for wireless and wirelinecarriers. The segment has 55 commercial deployments of push-to-talk over cellular (""PoC'') technology withcustomers operating in 39 countries through 2006.
Sprint Nextel is the segment's largest customer and the segment has been Sprint Nextel's sole supplier of iDENnetwork infrastructure equipment for more than ten years. Sprint Nextel uses Motorola's proprietary iDENtechnology to support its nationwide wireless service business. Motorola is currently operating under a supplyagreement for iDEN infrastructure equipment that covers the period from January 1, 2005 through December 31,
59MANAGEMENT'S DISCUSSION AND ANALYSISOF FINANCIAL CONDITION AND RESULTS OF OPERATIONS
2007. The segment's sales of iDEN network infrastructure equipment decreased from 2005 to 2006 and is expectedto continue to decline in 2007.
During 2006, the segment completed a number of significant acquisitions, including: (i) Orthogon Systems LLC,a leader in wireless Ethernet connectivity and orthogonal frequency division multiplexing (""OFDM'') technology forfixed wireless equipment, and (ii) NextNet Wireless, Inc., a former Clearwire Corporation subsidiary and a leadingprovider of OFDM-based non-line-of-sight (""NLOS'') wireless broadband infrastructure equipment.
The acquisition of Symbol is an important step forward for our enterprise mobility strategy. Consistent withthe segment's focus on extending our seamless mobility leadership, the acquisition unites the adjacent assets,expertise, customer bases, supplier bases and industry-leading products to enhance the segment's leading position inthe enterprise mobility market.
Segment ResultsÌ2005 Compared to 2004
In 2005, the segment's net sales increased 7% to $11.2 billion, compared to $10.5 billion in 2004. The increasein net sales was primarily driven by higher net sales in North America and EMEA, partially offset by lower net salesin Asia and Latin America. In 2005 compared to 2004, net sales to the private networks market were up in allregions, driven by increased demand for enhanced mission-critical communications systems and the continued focuson homeland security initiatives. Net sales to the public networks market: (i) increased in EMEA and NorthAmerica, primarily due to increased demand for cellular infrastructure equipment and related services, and(ii) decreased in Asia, due in part to delays in the granting of 3G licenses in China that have led service providersto slow their near-term capital investment, and in Latin America.
The segment's operating earnings increased to $1.9 billion in 2005, compared to operating earnings of$1.6 billion in 2004. The 25% increase in operating earnings was primarily due to: (i) an increase in gross margin,driven by the 7% increase in net sales, and (ii) improvements in cost structure for the public networks market. Thisimprovement in operating results was partially offset by: (i) an increase in SG&A expenses, primarily due toincreased selling and sales support expenses associated with the increase in net sales, and (ii) an increase in R&Dexpenditures, driven by increased investment in next-generation technologies across the segment. As a percentage ofnet sales in 2005 compared to 2004, R&D expenditures decreased and SG&A expenses increased.
Net sales into U.S. markets represented approximately 52% of the segment's total net sales in 2005, compared toapproximately 50% in 2004. Net sales to the segment's top five commercial customers, plus the U.S. government andits public safety agencies, represented approximately 37% of the segment's net sales in 2005. The loss of one of thesemajor customers could have a significant impact on the segment's business and, because many of these contracts arelong-term in nature, could impact revenue and earnings over several quarters. The segment's backlog was $4.1 billionat December 31, 2005, compared to $4.2 billion at December 31, 2004.
On August 12, 2005, Sprint Corporation and Nextel Communications, Inc. completed their merger transaction(the ""Sprint Nextel Merger'') that was announced in December 2004. In 2005, the combined company, SprintNextel, was the segment's largest customer, representing 14% of the segment's net sales. The segment did notexperience any significant impact to its business in 2005 as a result of the Sprint Nextel Merger.
In 2005, the segment continued to build on its industry-leading position in push-to-talk over cellular (""PoC'')technology, executing agreements to launch our PoC product application on both GSM and CDMA2000 networks.The segment had 44 commercial deployments of PoC technology with customers operating in 33 countries andterritories through 2005. In addition, the segment signed a contract with Earthlink to deliver equipment and servicesenabling them to become a Metro WiFi broadband provider in Philadelphia, Anaheim and other cities.
Connected Home Solutions Segment
The Connected Home Solutions segment designs, manufactures, sells and services: (i) cable television, InternetProtocol (""IP'') video and broadcast network set-top boxes (""digital entertainment devices''), (ii) end-to-enddigital video system solutions, (iii) broadband access networks, and (iv) IP-based data and voice products

60 MANAGEMENT'S DISCUSSION AND ANALYSISOF FINANCIAL CONDITION AND RESULTS OF OPERATIONS
(including modems). The segment's net sales represented 8% of the Company's consolidated net sales in 2006,2005 and 2004.
Years Ended December 31 Percent Change(Dollars in millions) 2006 2005 2004 2006Ì2005 2005Ì2004
Segment net sales $3,327 $2,871 $2,335 16% 23%Operating earnings (loss) 224 153 154 46% 0%
Segment ResultsÌ2006 Compared to 2005
In 2006, the segment's net sales increased 16% to $3.3 billion, compared to $2.9 billion in 2005. The increasein net sales was primarily driven by increased demand for digital entertainment devices, particularly advancedHD/DVR set-top boxes. Net sales increased in all regions. Net sales in North America continue to comprise asignificant portion of the segment's business, accounting for 83% of the segment's total net sales in 2006, comparedto 85% in 2005. The segment's backlog was $792 million at December 31, 2006, compared to $430 million atDecember 31, 2005. The 84% increase in backlog is primarily due to strong orders for our digital and HD/DVRset-top boxes.
The segment had operating earnings of $224 million in 2006, compared to operating earnings of $153 millionin 2005. The 46% increase in operating earnings was primarily due to the increase in gross margin, driven by the16% increase in net sales, partially offset by: (i) an increase in Other charges (income) from a legal reserve and anincrease in net reorganization of business charges, primarily relating to employee severance, and (ii) an increase inR&D expenditures, primarily related to developmental engineering expenditures. SG&A expenses and R&Dexpenditures as a percentage of net sales both decreased as compared to 2005.
In 2006, net sales of digital entertainment devices increased 24% compared to 2005. Unit shipments of digitalentertainment devices increased to 10.1 million, a 57% increase from 2005, while ASPs decreased due to a productmix shift. The increase in unit shipments of digital entertainment devices was primarily due to increased demand forHD/DVR set-top boxes. The segment continued to be the worldwide leader in market share for digitalentertainment devices.
In 2006, net sales of cable modems increased 18% compared to 2005. The increase in net sales of cablemodems was due to: (i) increased unit shipments of cable modems, and (ii) increased ASPs for cable modems,reflecting increased demand for advanced voice-enabled modems. The segment retained its leading worldwidemarket share in cable modems.
Demand for the segment's products depends primarily on the level of capital spending by broadband operatorsfor constructing, rebuilding or upgrading their communications systems, and for offering advanced services. In 2006,our cable operator customers significantly increased their purchases of the segment's products and services,primarily due to increased demand for digital entertainment devices, particularly HD/DVR set-top boxes.
The segment is dependent upon a small number of customers for a significant portion of its sales. A smallnumber of large cable television multiple system operators (""MSOs'') own a large portion of the cable systems andaccount for a significant portion of the total capital spending in the cable industry. In 2006, net sales to thesegment's top five customers represented 54% of the segment's total net sales, and net sales to the segment's largestcustomer, Comcast Corporation (""Comcast''), accounted for 29% of the segment's total net sales. The loss ofbusiness from any major MSO could have a significant impact on the segment's business.
During 2006, the segment completed a number of significant acquisitions, including: (i) KreatelCommunications AB, a leading developer of innovative IP-based digital set-top boxes and software, (ii) BroadbusTechnologies, Inc., a provider of technology solutions for television on demand, and (iii) Vertasent LLC, asoftware developer for managing technology elements for switched digital video networks. These acquisitions didnot have a material impact on the segment results in 2006. In February 2007, the segment completed the acquisitionof Netopia, Inc., a broadband equipment provider for DSL customers, which allows for phone, TV and fastInternet connections. The segment also announced its intention to acquire Tut Systems, Inc., a leading developer ofedge routing and video encoders.

61MANAGEMENT'S DISCUSSION AND ANALYSISOF FINANCIAL CONDITION AND RESULTS OF OPERATIONS
Segment ResultsÌ2005 Compared to 2004
In 2005, the segment's net sales increased 23% to $2.9 billion, compared to $2.3 billion in 2004. The increasein overall net sales was driven by increases in both ASP and unit shipments of digital entertainment devices,particularly HD/DVR set-top boxes. Net sales increased in North America, Latin America and Asia, partially offsetby a slight decrease in net sales in EMEA. Net sales in North America accounted for 85% of the segment's totalnet sales in 2005, compared to 83% in 2004. The segment's backlog was $430 million at December 31, 2005,compared to $305 million at December 31, 2004.
The segment generated operating earnings of $153 million in 2005, compared to $154 million in 2004. Theslight decrease in operating earnings was primarily due to an increase in R&D expenditures, primarily related todevelopmental engineering expenditures, partially offset by an increase in gross margin, driven by the 23% increasein net sales. In 2005, compared to 2004, gross margin as a percentage of net sales decreased primarily due toincreased product costs due to increased sales of digital entertainment devices, mainly HD/DVR set-top boxes,partially offset by higher ASPs on HD/DVR set-top boxes. As a percentage of net sales, for 2005 compared to2004, SG&A expenses decreased and R&D expenditures increased.
In 2005, net sales of digital entertainment devices increased 34%, due to increases in both ASP and unitshipments. The increase in ASP was driven by a product-mix shift towards higher-end products, particularlyHD/DVR set-top boxes. The increase in unit shipments was primarily due to the increased spending by cableoperators. The segment continued to be the worldwide leader in market share for digital cable set-top boxes.
In 2005, net sales of cable modems increased 33%. The increase in net sales was due to an increase in cablemodem unit shipments, which was partially offset by the decline in ASP for cable modems. The decrease in ASPwas primarily due to increased competition. The segment retained its leading worldwide market share in cablemodems.
Demand for the segment's products depends primarily on the level of capital spending by broadband operatorsfor constructing, rebuilding or upgrading their communications systems and services. After a number of years ofdecreased capital spending, in 2005 and 2004 our cable operator customers increased their purchases of thesegment's products and services, primarily due to increased demand for advanced digital set-top boxes to provideHD/DVR functionality.
In 2005, net sales to the segment's top five customers represented 53% of the segment's total net sales and netsales to the segment's largest customer, Comcast, accounted for 31% of the segment's total net sales. The loss ofbusiness from any major MSO could have a significant impact on the segment's business.
Significant Accounting Policies
Management's Discussion and Analysis of Financial Condition and Results of Operations discuss theCompany's consolidated financial statements, which have been prepared in accordance with U.S. generally acceptedaccounting principles. The preparation of these financial statements requires management to make estimates andassumptions that affect the reported amounts of assets and liabilities and the disclosure of contingent assets andliabilities at the date of the financial statements, as well as the reported amounts of revenues and expenses duringthe reporting period.
Management bases its estimates and judgments on historical experience, current economic and industryconditions and on various other factors that are believed to be reasonable under the circumstances. This forms thebasis for making judgments about the carrying values of assets and liabilities that are not readily apparent fromother sources. Actual results may differ from these estimates under different assumptions or conditions.Management believes the following significant accounting policies require significant judgment and estimates:
Ì Revenue recognition
Ì Allowance for losses on finance receivables
Ì Inventory valuation reserves
Ì Taxes on income
Ì Valuation of investments and long-lived assets

62 MANAGEMENT'S DISCUSSION AND ANALYSISOF FINANCIAL CONDITION AND RESULTS OF OPERATIONS
Ì Restructuring activities
Ì Retirement-related benefits
Revenue Recognition
The Company's arrangements with customers may differ in nature and complexity and may contain multipledeliverables, including products, equipment, services and software that may be essential to the functionality of theother deliverables, which requires the Company to make judgments and estimates in recognizing revenues.
Product and equipment sales may contain discounts, price protection, return provisions and other customerincentives. The Company's recorded revenues are reduced by allowances for these items at the time the sales arerecorded. The allowances are based on management's best estimate of the amount of allowances that the customerwill ultimately earn and is based on historical experience taking into account the type of products sold, the type ofcustomer and the type of transaction specific to each arrangement.
The Company's long-term contracts may involve the design, engineering, manufacturing and installation ofwireless networks and two-way radio voice and data systems. These systems are designed to meet specific customerrequirements and specifications and generally require extended periods to complete. If the Company can reliablyestimate revenues and contract costs and the technology is considered proven, revenue is recognized under thepercentage of completion method as work progresses towards completion; otherwise, the revenue is recognizedunder the completed contract method. Estimates of contract revenues, contract costs and progress towardscompletion are based on estimates that consider historical experience and other factors believed to be relevantunder the circumstances. Management regularly reviews these estimates and considers the impact of recurringbusiness risks and uncertainties inherent in the contracts, such as system performance and implementation delaysdue to factors within or outside the control of management.
Generally, multiple element arrangements are separated into specific accounting units when delivered elementshave value to the customer on a stand-alone basis, objective and reliable evidence of fair value exists for theundelivered element(s), and delivery of the undelivered element(s) is probable and substantially within the controlof the Company. Total arrangement consideration is allocated to the separate accounting units based on theirrelative fair values (if the fair value of each accounting unit is known) or using the residual method (if the fairvalue of the undelivered element(s) is known). Revenue is recognized for a separate accounting unit when therevenue recognition criteria are met for that unit. In certain situations, judgment is required in determining both thenumber of accounting units and fair value of the elements, although generally the fair value of an element can beobjectively determined if the Company sells the element on a stand-alone basis.
Changes in these estimates could negatively impact the Company's operating results. In addition, unforeseenconditions could arise over the contract term that may have a significant impact on the operating results. It isreasonably likely that different operating results would be reported if the Company used other acceptable revenuerecognition methodologies, such as the completed-contract method, or applied different assumptions.
Allowance for Losses on Finance Receivables
The Company has historically provided financing to certain customers in connection with purchases of theCompany's infrastructure equipment where the contractual terms of the note agreements are greater than one year.Financing provided has included all or a portion of the equipment purchase price.
Gross financing receivables were $279 million and $272 million at December 31, 2006 and 2005, respectivelywith an allowance for losses on these receivables of $10 million and $12 million, respectively. Of the receivables atDecember 31, 2006, $1 million ($0, net of allowances for losses of $1 million) were considered impaired based onmanagement's determination that the Company will be unable to collect all amounts in accordance with thecontractual terms of the relevant agreement. By comparison, impaired receivables at December 31, 2005 were$10 million ($0, net of allowance for losses of $10 million).
Management periodically reviews customer account activity in order to assess the adequacy of the allowancesprovided for potential losses. Factors considered include economic conditions, collateral values and each customer'spayment history and credit worthiness. Adjustments, if any, are made to reserve balances following the completionof these reviews to reflect management's best estimate of potential losses. The resulting net finance receivablebalance is intended to represent the estimated realizable value as determined based on: (i) the fair value of the

63MANAGEMENT'S DISCUSSION AND ANALYSISOF FINANCIAL CONDITION AND RESULTS OF OPERATIONS
underlying collateral, if the receivable is collateralized, or (ii) the present value of expected future cash flowsdiscounted at the effective interest rate implicit in the underlying receivable.
Inventory Valuation Reserves
The Company records valuation reserves on its inventory for estimated obsolescence or un-marketability. Theamount of the reserve is equal to the difference between the cost of the inventory and the estimated market valuebased upon assumptions about future demand and market conditions. On a quarterly basis, management in eachsegment performs an analysis of the underlying inventory to identify reserves needed for excess and obsolescenceand, for the remaining inventory, assesses the net realizable value. Management uses its best judgment to estimateappropriate reserves based on this analysis.
Inventories consisted of the following:
December 31 2006 2005
Finished goods $1,796 $1,252Work-in-process and production materials 1,782 1,699
3,578 2,951Less inventory reserves (416) (529)
$3,162 $2,422
The Company balances the need to maintain strategic inventory levels to ensure competitive deliveryperformance to its customers against the risk of inventory obsolescence due to rapidly changing technology andcustomer requirements. As indicated above, the Company's inventory reserves represented 12% and 18% of thegross inventory balance at December 31, 2006 and 2005, respectively. The Company has inventory reserves forpending cancellations of product lines due to technology changes, long-life cycle products, lifetime buys at the endof supplier production runs, business exits, and a shift of production to outsourcing.
If actual future demand or market conditions are less favorable than those projected by management,additional inventory writedowns may be required. Likewise, as with other reserves based on management'sjudgment, if the reserve is no longer needed, amounts are reversed into income. There were no significant reversalsinto income of this type in 2006 or 2005.
Taxes on Income
The Company's effective tax rate is based on pre-tax income and the tax rates applicable to that income in thevarious jurisdictions in which the Company operates. An estimated effective tax rate for a year is applied to theCompany's quarterly operating results. In the event that there is a significant unusual or discrete item recognized, orexpected to be recognized, in the Company's quarterly operating results, the tax attributable to that item would beseparately calculated and recorded at the same time as the unusual or discrete item. The Company considers theresolution of prior year tax matters to be such items. Significant judgment is required in determining the Company'seffective tax rate and in evaluating its tax positions. The Company establishes reserves when it is probable that theCompany will not realize the full tax benefit of the position. The Company adjusts these reserves in light ofchanging facts and circumstances.
Tax regulations may require items of income and expense to be included in the tax return in different periodsthan the items are reflected in the consolidated financial statements. As a result, the effective tax rate reflected inthe consolidated financial statements may be different than the tax rate reported in the income tax return. Some ofthese differences are permanent, such as expenses that are not deductible on the tax return, and some aretemporary differences, such as depreciation expense. Temporary differences create deferred tax assets and liabilities.Deferred tax assets generally represent items that can be used as a tax deduction or credit in the tax return in futureyears for which the Company has already recorded the tax benefit in the consolidated financial statements. TheCompany establishes valuation allowances for its deferred tax assets when it is more likely than not that theamount of expected future taxable income will not support the use of the deduction or credit. Deferred taxliabilities generally represent tax expense recognized in the consolidated financial statements for which payment hasbeen deferred or expense for which the Company has already taken a deduction on the income tax return, but hasnot yet recognized as expense in the consolidated financial statements.

64 MANAGEMENT'S DISCUSSION AND ANALYSISOF FINANCIAL CONDITION AND RESULTS OF OPERATIONS
Valuation of Investments and Long-Lived Assets
The Company assesses the impairment of investments and long-lived assets, which includes identifiableintangible assets, goodwill and property, plant and equipment, whenever events or changes in circumstances indicatethat the carrying value may not be recoverable. Factors considered important that could trigger an impairmentreview include: (i) underperformance relative to expected historical or projected future operating results,(ii) changes in the manner of use of the assets or the strategy for our overall business, (iii) negative industry oreconomic trends, (iv) declines in stock price of an investment for a sustained period, and (v) our marketcapitalization relative to net book value.
When the Company determines that the carrying value of intangible assets, goodwill and long-lived assets maynot be recoverable, an impairment charge is recorded. Impairment is generally measured based on a projecteddiscounted cash flow method using a discount rate determined by our management to be commensurate with therisk inherent in our current business model or prevailing market rates of investment securities, if available.
At December 31, 2006 and 2005, the net book values of these assets were as follows (in millions):
December 31 2006 2005
Property, plant and equipment $2,267 $2,020Investments 895 1,644Intangible assets 354 231Goodwill 1,706 1,349
$5,222 $5,244
The Company recorded fixed asset impairment charges of $15 million in both 2006 and 2005, compared to nocharges in 2004.
The Company recorded impairment charges related to its investment portfolio of $27 million, $25 million and$36 million in 2006, 2005 and 2004, respectively, representing other-than-temporary declines in the value of theCompany's investment portfolio, primarily related to cost-based investment write-downs. Additionally, the available-for-sale securities portfolio reflected a net pre-tax unrealized gain position of $60 million and $157 million atDecember 31, 2006 and 2005, respectively.
The Company performs a goodwill impairment test at the reporting unit level at least annually onOctober 1, or more often should triggering events occur. In determining the fair value of the reporting unit, theCompany utilizes independent appraisal firms who employ a combination of present value techniques and quotedmarket prices of comparable businesses. No impairment charges were required in 2006 or 2005. During 2004, theCompany determined that goodwill related to a sensor business, which was subsequently divested in 2005, wasimpaired by $125 million.
The Company cannot predict the occurrence of future impairment-triggering events nor the impact such eventsmight have on these reported asset values. Such events may include strategic decisions made in response to theeconomic conditions relative to product lines or operations and the impact of the economic environment on ourcustomer base.
Restructuring Activities
The Company maintains a formal Involuntary Severance Plan (the ""Severance Plan'') which permits theCompany to offer eligible employees severance benefits based on years of service and employment grade level inthe event that employment is involuntarily terminated as a result of a reduction-in-force or restructuring. Eachseparate reduction-in-force has qualified for severance benefits under the Severance Plan and, therefore, suchbenefits are accounted for in accordance with SFAS No. 112, ""Accounting for Postemployment Benefits''(""SFAS 112''). Under the provisions of SFAS 112, the Company recognizes termination benefits based on formulasper the Severance Plan at the point in time that future settlement is probable and can be reasonably estimatedbased on estimates prepared at the time a restructuring plan is approved by management. Exit costs primarilyconsist of future minimum lease payments on vacated facilities. At each reporting date, the Company evaluates itsaccruals for exit costs and employee separation costs to ensure the accruals are still appropriate. In certaincircumstances, accruals are no longer required because of efficiencies in carrying out the plans or becauseemployees previously identified for separation resigned from the Company and did not receive severance or were

65MANAGEMENT'S DISCUSSION AND ANALYSISOF FINANCIAL CONDITION AND RESULTS OF OPERATIONS
redeployed due to circumstances not foreseen when the original plans were initiated. The Company reversesaccruals through the income statement line item where the original charges were recorded when it is determinedthey are no longer required.
Retirement-Related Benefits
The Company's noncontributory pension plan (the ""Regular Pension Plan'') covers U.S. employees whobecame eligible after one year of service. The benefit formula is dependent upon employee earnings and years ofservice. Effective January 1, 2005, newly-hired employees were not eligible to participate in the Regular PensionPlan. On February 20, 2007, the Company passed an amendment to the Regular Pension Plan which changes thedefinition of average earnings. Under the current formula, benefits are calculated using the highest annual earningsin any five years within the last ten calendar years. Beginning in January 2008, the benefit will be based on theaverage of the five highest years of earnings within the last ten calendar years prior to December 31, 2007 averagedwith future earnings. The Company also provides defined benefit plans to some of its foreign entities (the""Non-U.S. Plans'').
The Company also has a noncontributory supplemental retirement benefit plan (the ""Officers' Plan'') for itselected officers. The Officers' Plan contains provisions for funding the participants' expected retirement benefitswhen the participants meet the minimum age and years of service requirements. Elected officers who were not yetvested in the Officers' Plan as of December 31, 1999 had the option to remain in the Officers' Plan or elect to havetheir benefit bought out in restricted stock units. Effective December 31, 1999, no new elected officers wereeligible to participate in the Officers' Plan. Effective June 30, 2005, the salaries to be utilized for calculation ofbenefits under this plan have been frozen.
The Company has an additional noncontributory supplemental retirement benefit plan, the MotorolaSupplemental Pension Plan (""MSPP''), which provides supplemental benefits in excess of the limitations imposedby the Internal Revenue Code on the Regular Pension Plan. Elected officers covered under the Officers' Plan orwho participated in the restricted stock buy-out are not eligible to participate in MSPP. Effective January 1, 2005,newly-hired employees are not eligible to participate in the MSPP. Effective January 1, 2007, eligible compensationfor calculation of benefits under MSPP has been capped at the IRS limit plus $175,000 or, for those in excess ofthis cap at January 1, 2007, their current compensation is frozen for calculation purposes.
Certain healthcare benefits are available to eligible domestic employees meeting certain age and service requirementsupon termination of employment (the ""Postretirement Health Care Benefits Plan''). For eligible employees hired priorto January 1, 2002, the Company offsets a portion of the postretirement medical costs to the retired participant. As ofJanuary 1, 2005, the Postretirement Health Care Benefits Plan has been closed to new participants.
Accounting methodologies use an attribution approach that generally spreads individual events over the servicelives of the employees in the plan. Examples of ""events'' are plan amendments and changes in actuarial assumptionssuch as discount rate, expected long-term rate of return on plan assets, and rate of compensation increases. Theprinciple underlying the required attribution approach is that employees render service over their service lives on arelatively consistent basis and, therefore, the income statement effects of pension benefits or postretirement healthcare benefits are earned in, and should be expensed in, the same pattern.
There are various assumptions used in calculating the net periodic benefit expense and related benefitobligations. One of these assumptions is the expected long-term rate of return on plan assets. The required use ofexpected long-term rate of return on plan assets may result in recognized pension income that is greater or less thanthe actual returns of those plan assets in any given year. Over time, however, the expected long-term returns aredesigned to approximate the actual long-term returns and therefore result in a pattern of income and expenserecognition that more closely matches the pattern of the services provided by the employees. Differences betweenactual and expected returns are recognized in the net periodic pension calculation over five years.
The Company uses long-term historical actual return experience with consideration of the expected investmentmix of the plans' assets, as well as future estimates of long-term investment returns to develop its expected rate ofreturn assumption used in calculating the net periodic pension cost and the net retirement healthcare expense. TheCompany's investment return assumption for the Regular Pension Plan and Postretirement Health Care BenefitsPlan was 8.5% in 2006 and 2005. The investment return assumption for the Officers' Plan was 6% in 2006 and2005. At December 31, 2006, the Regular Pension Plan and the Postretirement Health Care Benefits Planinvestment portfolio were predominantly equity investments and the Officers' Plan investment portfolio waspredominantly fixed-income securities.

66 MANAGEMENT'S DISCUSSION AND ANALYSISOF FINANCIAL CONDITION AND RESULTS OF OPERATIONS
A second key assumption is the discount rate. The discount rate assumptions used for pension benefits andpostretirement health care benefits accounting reflects, at December 31 of each year, the prevailing market rates forhigh-quality, fixed-income debt instruments that, if the obligation was settled at the measurement date, wouldprovide the necessary future cash flows to pay the benefit obligation when due. The Company's discount rate formeasuring the pension obligations was 6% at December 2006 and 2005. The Company's discount rate for measuringthe Postretirement Health Care Benefits Plan obligation was 5.75% at December 31, 2006 and 2005.
A final set of assumptions involves the cost drivers of the underlying benefits. The rate of compensationincrease is a key assumption used in the actuarial model for pension accounting and is determined by the Companybased upon its long-term plans for such increases. In both 2006 and 2005, the Company's rate for futurecompensation increase was 4% for the Regular Pension Plan. The Company's 2006 and 2005 rate for futurecompensation increase for the Officers' Plan was 0% as the salaries to be utilized for calculation of benefits underthis plan have been frozen. For Postretirement Health Care Benefits Plan accounting, the Company reviews externaldata and its own historical trends for health care costs to determine the health care cost trend rates. Based on thisreview, the health care cost trend rate used to determine the December 31, 2006 accumulated postretirementbenefit obligation was 10% for 2006 with a declining trend rate of 1% each year until it reaches 5% by 2011, with aflat 5% rate for 2011 and beyond. Changes in the industry's projected health care costs have caused the gradedtrend rate assumption to be reset to 10% for 2007, with the trend rate expected to grade down 1% per year untilreaching 5% by 2012.
The actuarial assumptions for all plans are set forth at the beginning of the fiscal year. Variations from theseassumptions typically are amortized into expense over the average service period. Beginning in 2006, unamortizedamounts are held as a separate, non-owner component of equity. The Company recorded a non-cash, after-tax, netcharge of $308 million to equity relating to the unamortized amounts for the Regular Pension Plan, the Officers'Plan, Non-U.S. Plans, and the Postretirement Health Care Benefits Plan in the fourth quarter of 2006.
For the Regular Pension Plan, the Company currently estimates 2007 expenses for continuing operations willbe approximately $170 million. The 2006 and 2005 actual expenses were $240 million and $177 million,respectively. Cash contributions of $270 million were made to the Regular Pension Plan in 2006. The Companyexpects to make cash contributions of approximately $280 million to its U.S. pension plans and approximately$120 million to its non-U.S. pension plans during 2007.
For the Postretirement Health Care Benefits Plan, the Company currently estimates 2007 expenses forcontinuing operations will be approximately $21 million. The 2006 and 2005 actual expenses were $22 million and$27 million, respectively. Motorola is obligated to transfer to Freescale Semiconductor $68 million, plus investmentreturns earned on this amount, which was approximately $17 million as of December 31, 2006 in cash or planassets, as permitted by law without adverse tax consequences to Motorola, with such transfer expected to occur in2007. Cash contributions of $27 million were made to this plan in 2006. The Company expects to make cashcontributions of approximately $24 million to the Postretirement Health Care Benefits Plan in 2007.
The impact on the future financial results of the Company in relation to retirement-related benefits isdependent on economic conditions, employee demographics, interest rates and investment performance. TheCompany's measurement date of its plan assets and obligations is December 31. Thus, during the fourth quarter ofeach year, management reviews and, if necessary, adjusts the assumptions associated with its benefit plans.
Recent Accounting Pronouncements
In February 2007, the Financial Accounting Standards Board (""FASB'') issued Statement of FinancialAccounting Standard (""SFAS'') No. 159, ""The Fair Value Option for Financial Assets and Financial Liabilities ÌIncluding an amendment of FASB Statement No. 115'' (""SFAS 159''). SFAS 159 permits entities to elect tomeasure many financial instruments and certain other items at fair value. Unrealized gains and losses on items forwhich the fair value option has been elected will be recognized in earnings at each subsequent reporting date.SFAS 159 is effective for fiscal years beginning after November 15, 2007. The Company is currently assessing theimpact of SFAS 159 on its consolidated financial statements.
In September 2006, the FASB issued EITF 06-4, ""Accounting for Deferred Compensation and PostretirementBenefit Aspects of Endorsement Split-Dollar Life Insurance Arrangements'' (""EITF 06-4''). EITF 06-4 requires thatendorsement split dollar life insurance arrangements which provide a benefit to an employee beyond thepostretirement period be recorded in accordance with SFAS No. 106, ""Employer's Accounting for PostretirementBenefits Other Than Pensions'' or APB Opinion No. 12, ""Omnibus Opinion Ì 1967'' based on the substance of

67MANAGEMENT'S DISCUSSION AND ANALYSISOF FINANCIAL CONDITION AND RESULTS OF OPERATIONS
the agreement with the employee. Under the provisions of these Statements, a liability should be accrued equal tothe actuarial present value of the future death benefits over the service period. EITF 06-4 is effective for fiscal yearsbeginning after December 15, 2007. The effects of applying EITF 06-4 may be reflected as either a cumulative-effect adjustment to retained earnings as of the beginning of the year of adoption or through retrospectiveapplication to all prior periods. The Company is currently assessing the impact of EITF 06-4 on the Company'sconsolidated financial statements.
In September 2006, the FASB issued SFAS No. 158, ""Employers' Accounting for Defined Benefit Pension andOther Postretirement Plans'' (""SFAS 158''). SFAS 158 requires employers to (i) recognize the funded status oftheir defined benefit pension and other postretirement plans on their consolidated balance sheet, (ii) recognize as acomponent of other comprehensive income, net of tax, the gains or losses and prior service costs or credits thatarise during the period but are not recognized as components of net periodic benefit cost, (iii) measure definedbenefit plan assets and obligations as of the date of the employer's statement of financial position, and (iv) discloseadditional information in the notes to financial statements. The Company adopted the recognition and disclosurerequirements of SFAS 158 as of December 31, 2006. The impact of adopting these provisions was an increase in netliabilities for pension and postretirement health care benefits of $783 million and a decrease in stockholders' equityof $514 million, net of taxes. The SFAS 158 provision related to measurement date is effective for fiscal yearsending after December 15, 2008. The Company is currently assessing the impact of the change in measurement dateon the Company's financial statements but does not believe the adoption of this provision of SFAS 158 will have amaterial impact on the Company's consolidated financial statements.
In September 2006, the FASB issued SFAS No. 157, ""Fair Value Measurements'' (""SFAS 157''). SFAS 157defines fair value, establishes a framework for measuring fair value as required by other accounting pronouncementsand expands fair value measurement disclosures. SFAS 157 is effective for fiscal years beginning after November 15,2007. The Company is currently evaluating the impact of SFAS 157 on the Company's consolidated financialstatements.
In September 2006, the SEC issued Staff Accounting Bulletin No. 108 (""SAB 108''), ""Considering the Effectsof Prior Year Misstatements in Current Year Financial Statements.'' SAB 108 expresses the SEC Staff's viewsregarding the process of quantifying financial statement misstatements. SAB 108 addresses the diversity in practice inquantifying financial statement misstatements and the potential under current practice for the build up of improperamounts on the balance sheet. The Company adopted the provisions of SAB 108 as of December 31, 2006. Theadoption of SAB 108 did not have an effect on the Company's consolidated results of operations, financial position,or cash flows.
In June 2006, the FASB issued Interpretation No. 48, ""Accounting for Uncertainty in Income Taxes''(""FIN 48''). FIN 48 clarifies the accounting for uncertainty in income taxes recognized in an enterprise's financialstatements in accordance with SFAS No. 109, ""Accounting for Income Taxes.'' This interpretation prescribes arecognition threshold and measurement attribute for the financial statement recognition and measurement of a taxposition taken or expected to be taken in a tax return. FIN 48 also provides guidance on derecognition of taxbenefits, classification on the balance sheet, interest and penalties, accounting in interim periods, disclosure, andtransition. FIN 48 is effective beginning January 1, 2007. The adoption of FIN 48 is not expected to have amaterial effect on the Company's consolidated results of operations or cash flows. The Company estimates that theadoption of FIN 48 will cause an increase in noncurrent liabilities and an equal offsetting increase in noncurrentdeferred tax assets in the range of $900 million to $1.0 billion. The amount of cash ultimately payable with regardto the uncertain tax positions is not affected by the balance sheet reclassification estimated upon the adoption ofFIN 48 and will be a function of Motorola's overall tax situation when the underlying tax issues are resolved,taking into account the availability of deferred tax assets that may reduce tax otherwise due.
In March 2006, the FASB issued SFAS No. 156, ""Accounting for Servicing of Financial Assets Ì AnAmendment of SFAS No. 140'' (""SFAS 156''). Among other requirements, SFAS 156 requires an entity to recognizea servicing asset or servicing liability each time it undertakes an obligation to service a financial asset by enteringinto a servicing contract when there is either: (i) a transfer of the servicer's financial assets that meets therequirements for sale accounting, (ii) a transfer of the servicer's financial assets to a qualifying special-purposeentity in a guaranteed mortgage securitization in which the transferor retains all of the resulting securities andclassifies them as either available-for-sale securities or trading securities in accordance with SFAS 115, ""Accountingfor Certain Investments in Debt and Equity Securities'', or (iii) an acquisition or assumption of an obligation toservice a financial asset that does not relate to financial assets of the servicer or its consolidated affiliates. SFAS 156is effective for fiscal years beginning after September 15, 2006. The Company does not believe the adoption of

68 MANAGEMENT'S DISCUSSION AND ANALYSISOF FINANCIAL CONDITION AND RESULTS OF OPERATIONS
SFAS 156 will have a material effect on the Company's consolidated results of operations, financial position or cashflows.
Realignment of Segments
Effective as of the second quarter of 2006, the Company realigned its businesses into three operating businesssegments: (i) Mobile Devices, (ii) Networks and Enterprise, and (iii) Connected Home Solutions. In addition,during the second quarter of 2006, the Company executed an agreement to sell its automotive electronics business.Reclassifications have been made to prior years' financial statements and related notes to conform to the 2006presentation and present the automotive electronics business as a discontinued operation.
Reclassifications
Effective as of the fourth quarter 2006, the Company reflects costs associated with the amortization ofintangible assets and in-process research and development at the corporate level rather than at the business segmentlevel. Accordingly, these costs have been reclassified in prior period financial statements from the correspondingbusiness segment to Other and Eliminations to conform to the current period presentation. In addition, certaincosts associated with amortization of intangible assets, information technology development and new productintroduction costs have been reclassified between statement lines in the consolidated statements of operations in theprior period financial statements to conform to the current period presentation.
Forward-Looking Statements
Except for historical matters, the matters discussed in this Form 10-K are forward-looking statements thatinvolve risks and uncertainties. Forward-looking statements include, but are not limited to, statements under thefollowing headings: (1) ""Item 1: Business'' about the impact of the Symbol Technologies, Inc. (""Symbol'')acquisition; (2) ""Mobile Device Segment,'' about industry growth, including in emerging markets and forreplacement sales, the impact of the segment's strategy, the impact from the loss of key customers, the allocationand regulation of frequencies, the impact of regulatory matters, the availability of materials, energy supplies andlabor, the seasonality of the business, the firmness of the segment's backlog and the manufacturing location;(3) ""Networks and Enterprise Segment,'' about the impact of the Symbol acquisition, the potential of theportfolio, 3G licenses and market development, homeland security industry growth, sales and utilization, enterprisemobility market growth, the impact of the segment's strategy, the impact from the loss of key customers,competition from system integrators and telecommunications carriers, consolidation among providers, iDEN trends,the impact of regulatory matters, allocation and regulation of frequencies, the availability of materials, energysupplies and labor, the seasonality of the business and the firmness of the segment's backlog; (4) ""ConnectedHome Solutions Segment,'' about the impact of the segment's strategy, the impact of acquisitions, the impact fromthe loss of key customers, the competitive position, the impact of demand and competitive changes, the impact ofregulatory matters, the availability of materials, energy supplies and labor, the seasonality of the business and thefirmness of the segment's backlog; (5) ""Other Information,'' about the impact from the loss of key customers, thefirmness of the aggregate backlog position, the competitiveness through research and development and utilization oftechnology; (6) ""Properties,'' about the impact of property sales and the consequences of a disruption inmanufacturing; (7) ""Legal Proceedings,'' about the ultimate disposition of pending legal matters;(8) ""Management's Discussion and Analysis,'' about: (a) the impact of acquisitions, (b) the success of ourbusiness strategy, (c) future payments, charges, use of accruals and expected cost-saving benefits associated withour reorganization of business programs, (d) the Company's ability and cost to repatriate funds, (e) the impact ofthe timing and level of sales and the geographic location of such sales, (f) future cash contributions to pensionplans or retiree health benefit plans, (g) outstanding commercial paper balances, (h) the Company's ability andcost to access the capital markets, (i) the Company's ability to retire outstanding debt, (j) adequacy of resourcesto fund expected working capital and capital expenditure measurements, (k) expected payments pursuant tocommitments under long-term agreements, (l) the outcome of ongoing and future legal proceedings (m) theimpact of recent accounting pronouncements on the Company, and (n) the impact of the loss of key customers;and (9) ""Quantitative and Qualitative Disclosures about Market Risk,'' about: (a) the impact of foreign currencyexchange risks, (b) future hedging activity and expectations of the Company, and (c) the ability of counterpartiesto financial instruments to perform their obligations.
Some of the risk factors that affect the Company's business and financial results are discussed in ""Item 1A:Risk Factors.'' We wish to caution the reader that the risk factors discussed in ""Item 1A: Risk Factors'', and thosedescribed elsewhere in this report or our other Securities and Exchange Commission filings, could cause our actualresults to differ materially from those stated in the forward-looking statements.

69
Item 7A. Quantitative and Qualitative Disclosures About Market Risk
Foreign Currency Risk
As a multinational company, the Company's transactions are denominated in a variety of currencies. TheCompany uses financial instruments to reduce its overall exposure to the effects of currency fluctuations on cashflows. The Company's policy prohibits speculation in financial instruments for profit on the exchange rate pricefluctuation, trading in currencies for which there are no underlying exposures, or entering into trades for anycurrency to intentionally increase the underlying exposure. Instruments that are designated as part of a hedgingrelationship must be effective at reducing the risk associated with the exposure being hedged and are designated asa part of a hedging relationship at the inception of the contract. Accordingly, changes in market values of hedgeinstruments must be highly correlated with changes in market values of underlying hedged items both at theinception of the hedge and over the life of the hedge contract.
The Company's strategy in foreign exchange exposure issues is to offset the gains or losses on the financialinstruments against losses or gains on the underlying operational cash flows or investments based on the operatingbusiness units' assessment of risk. The Company enters into derivative contracts for some of the Company's non-functional currency receivables and payables, which are primarily denominated in major currencies that can betraded on open markets. The Company uses forward contracts and options to hedge these currency exposures. Inaddition, the Company enters into derivative contracts for some firm commitments and some forecastedtransactions, which are designated as part of a hedging relationship if it is determined that the transaction qualifiesfor hedge accounting under the provisions of SFAS No. 133, ""Accounting for Derivative Instruments and HedgingActivities.'' A portion of the Company's exposure is from currencies that are not traded in liquid markets and theseare addressed, to the extent reasonably possible, through managing net asset positions, product pricing andcomponent sourcing.
At December 31, 2006 and 2005, the Company had net outstanding foreign exchange contracts totaling$4.8 billion and $2.8 billion, respectively. Management believes that these financial instruments should not subjectthe Company to undue risk due to foreign exchange movements because gains and losses on these contracts shouldoffset losses and gains on the underlying assets, liabilities and transactions, except for the ineffective portion of theinstruments, which are charged to Other within Other income (expense) in the Company's consolidated statementsof operations. The following table shows, in millions of U.S. dollars, the five largest net foreign exchange contractpositions as of December 31, 2006 and, 2005:
December 31,Buy (Sell) 2006 2005
Euro $(2,069) $(1,076)Chinese Renminbi (1,195) (728)Brazilian Real (466) (348)Indian Rupee (148) (70)British Pound 252 (226)
The Company is exposed to credit-related losses if counterparties to financial instruments fail to perform theirobligations. However, the Company does not expect any counterparties, all of whom presently have investmentgrade credit ratings, to fail to meet their obligations.
Foreign exchange financial instruments that are subject to the effects of currency fluctuations, which mayaffect reported earnings, include derivative financial instruments and other financial instruments which are notdenominated in the functional currency of the legal entity holding the instrument. Derivative financial instrumentsconsist primarily of forward contracts and currency options. Other financial instruments, which are notdenominated in the functional currency of the legal entity holding the instrument, consist primarily of cash, cashequivalents, Sigma Funds and short-term investments, as well as accounts payable and receivable. Accounts payableand receivable are reflected at fair value in the financial statements. The fair value of the foreign exchange financialinstruments would hypothetically decrease by $312 million as of December 31, 2006 if the foreign currency rateswere to change unfavorably by 10% of current levels. This hypothetical amount is suggestive of the effect on futurecash flows under the following conditions: (i) all current payables and receivables that are hedged were notrealized, (ii) all hedged commitments and anticipated transactions were not realized or canceled, and (iii) hedgesof these amounts were not canceled or offset. The Company does not expect that any of these conditions will be

70
realized. The Company expects that gains and losses on the derivative financial instruments should offset gains andlosses on the assets, liabilities and future transactions being hedged. If the hedged transactions were included in thesensitivity analysis, the hypothetical change in fair value would be immaterial. The foreign exchange financialinstruments are held for purposes other than trading.
Fair Value Hedges
The Company recorded income of $0.6 million, $1.5 million and $0.1 million for the years endedDecember 31, 2006, 2005 and 2004, respectively, representing the ineffective portions of changes in the fair value offair value hedge positions. These amounts are included in Other within Other income (expense) in the Company'sconsolidated statements of operations. The above amounts include the change in the fair value of derivativecontracts related to the changes in the difference between the spot price and the forward price. These amounts areexcluded from the measure of effectiveness. Expense (income) related to fair value hedges that were discontinuedfor the years ended December 31, 2006, 2005 and 2004 are included in the amounts noted above.
Cash Flow Hedges
The Company recorded income (expense) of $13 million, $1 million and $(12) million for the years endedDecember 31, 2006, 2005 and 2004, respectively, representing the ineffective portions of changes in the fair value ofcash flow hedge positions. These amounts are included in Other within Other income (expense) in the Company'sconsolidated statements of operations. The above amounts include the change in the fair value of derivativecontracts related to the changes in the difference between the spot price and the forward price. These amounts areexcluded from the measure of effectiveness. Expense (income) related to cash flow hedges that were discontinuedfor the years ended December 31, 2006, 2005 and 2004 are included in the amounts noted above.
During the years ended December 31, 2006, 2005 and 2004, on a pre-tax basis, income (expense) of$(98) million, $21 million and $(27) million, respectively, was reclassified from equity to earnings in theCompany's consolidated statements of operations. If exchange rates do not change from year-end, the Companyestimates that $16 million of pre-tax net derivative income included in Non-owner changes to equity withinStockholders' equity would be reclassified into earnings within the next twelve months and will be reclassified inthe same period that the hedged item affects earnings. The actual amounts that will be reclassified into earningsover the next twelve months will vary from this amount as a result of changes in market conditions.
At December 31, 2006, the maximum term of derivative instruments that hedge forecasted transactions wastwo years. However, the weighted average duration of the Company's derivative instruments that hedge forecastedtransactions was seven months.
Net Investment in Foreign Operations Hedge
At December 31, 2006 and 2005, the Company did not have any hedges of foreign currency exposure of netinvestments in foreign operations.
Investments Hedge
During the first quarter of 2006, the Company entered into a zero-cost collar derivative (the ""Sprint NextelDerivative'') to protect itself economically against price fluctuations in its 37.6 million shares of Sprint NextelCorporation (""Sprint Nextel'') non-voting common stock. During the second quarter of 2006, as a result of SprintNextel's spin-off of Embarq Corporation through a dividend to Sprint Nextel shareholders, the Company receivedapproximately 1.9 million shares of Embarq Corporation. The floor and ceiling prices of the Sprint NextelDerivative were adjusted accordingly. The Sprint Nextel Derivative was not designated as a hedge under theprovisions of SFAS No. 133, ""Accounting for Derivative Instruments and Hedging Activities.'' Accordingly, toreflect the change in fair value of the Sprint Nextel Derivative, the Company recorded a net gain of $99 million forthe year ended December 31, 2006, included in Other income (expense) in the Company's consolidated statementsof operations. In December 2006, the Sprint Nextel Derivative was terminated and settled in cash and the37.6 million shares of Sprint Nextel were converted to common shares and sold. The Company received aggregatecash proceeds of approximately $820 million from the settlement of the Sprint Nextel Derivative and the

71
subsequent sale of the 37.6 million Sprint Nextel shares. The Company recognized a loss of $126 million inconnection with the sale of the remaining shares of Sprint Nextel common stock. As described above, theCompany recorded a net gain of $99 million in connection with the Sprint Nextel Derivative.
Prior to the merger of Sprint Corporation (""Sprint'') and Nextel Communications, Inc. (""Nextel''), theCompany had entered into variable share forward purchase agreements (the ""Variable Forwards'') to hedge itsNextel common stock. The Company did not designate the Variable Forwards as a hedge of the Sprint Nextelshares received as a result of the merger. Accordingly, the Company recorded $51 million of gains for the yearended December 31, 2005 reflecting the change in value of the Variable Forwards. The Variable Forwards weresettled during the fourth quarter of 2005.
Fair Value of Financial Instruments
The Company's financial instruments include cash equivalents, Sigma Funds, short-term investments, accountsreceivable, long-term finance receivables, accounts payable, accrued liabilities, notes payable, long-term debt, foreigncurrency contracts and other financing commitments.
Using available market information, the Company determined that the fair value of long-term debt atDecember 31, 2006 was $4.3 billion, compared to a carrying value of $4.1 billion. Since considerable judgment isrequired in interpreting market information, the fair value of the long-term debt is not necessarily indicative of theamount which could be realized in a current market exchange.
The fair values of the other financial instruments were not materially different from their carrying or contractvalues at December 31, 2006.
Equity Price Market Risk
At December 31, 2006, the Company's available-for-sale securities portfolio had an approximate fair marketvalue of $130 million which represented a cost basis of $70 million and a net unrealized gain of $60 million. Thevalue of the available-for-sale securities would change by $13 million as of year-end 2006 if the price of the stockin each of the publicly-traded companies were to change by 10%. These equity securities are held for purposesother than trading.
Interest Rate Risk
At December 31, 2006, the Company's short-term debt consisted primarily of $300 million of commercialpaper, priced at short-term interest rates. The Company has $4.1 billion of long-term debt, including the currentportion of long-term debt, which is primarily priced at long-term, fixed interest rates.
In order to manage the mix of fixed and floating rates in its debt portfolio, the Company has entered intointerest rate swaps to change the characteristics of interest rate payments from fixed-rate payments to short-termLIBOR-based variable rate payments. The following table displays these outstanding interest rate swaps atDecember 31, 2006:
Notional AmountHedged Underlying Debt
Date Executed (in millions) Instrument
August 2004 $1,200 4.608% notes due 2007September 2003 457 7.625% debentures due 2010September 2003 600 8.0% notes due 2011May 2003 114 6.5% notes due 2008May 2003 84 5.8% debentures due 2008May 2003 69 7.625% debentures due 2010March 2002 118 7.6% notes due 2007
$2,642
The weighted average short-term LIBOR-based variable rate payments on each of the above interest rate swapswas 7.29% for the three months ended December 31, 2006. The fair value of the above interest rate swaps atDecember 31, 2006 and December 31, 2005, was $(47) million and $(50) million, respectively. The fair value of

72
the above interest rate swaps would hypothetically decrease by $24 million (i.e., would decrease from$(47) million to $(71) million) if LIBOR were to change unfavorably by 10% from current levels. Except as notedbelow, the Company had no outstanding commodity derivatives, currency swaps or options relating to debtinstruments at December 31, 2006 or December 31, 2005.
The Company designated the above interest rate swap agreements as part of a fair value hedging relationship.As such, changes in the fair value of the hedging instrument, as well as the hedged debt are recognized in earnings,therefore adjusting the carrying amount of the debt. Interest expense on the debt is adjusted to include thepayments made or received under such hedge agreements. In the event the underlying debt instrument matures or isredeemed or repurchased, the Company is likely to terminate the corresponding interest rate swap contracts.
Additionally, effective December 31, 2006, one of the Company's European subsidiaries entered into interestrate agreements (""Interest Agreements'') relating to a Euro-denominated loan. The interest on the Euro-denominated loan is floating based on 3-month EURIBOR plus a spread. The Interest Agreements change thecharacteristics of interest rate payments from short-term EURIBOR based variable payments to maximum fixed-ratepayments. The Interest Agreements are not accounted for as a part of a hedging relationship and accordingly thechanges in the fair value of the Interest Agreements are included in Other income (expense) in the Company'sconsolidated statements of operations. The fair value of the Interest Agreements at December 31, 2006 was$1 million. The fair value of the Interest Agreements would hypothetically decrease by $2 million (i.e., woulddecrease from $1 million to $(1) million if EURIBOR rates were to change unfavorably by 10% from currentlevels).
The Company is exposed to credit loss in the event of nonperformance by the counterparties to its swapcontracts. The Company minimizes its credit risk on these transactions by only dealing with leading, creditworthyfinancial institutions having long-term debt ratings of ""A'' or better and, does not anticipate nonperformance. Inaddition, the contracts are distributed among several financial institutions, thus minimizing credit risk concentration.
Environmental Matters
Compliance with federal, state and local laws regulating the discharge of materials into the environment, orotherwise relating to the protection of the environment, has no material effect on capital expenditures, earnings orthe competitive position of Motorola.
» Reg. U.S. Patent & Trademark Office.
""MOTOROLA'' and ""Stylized M Logo'' are registered trademarks of Motorola, Inc. throughout the world.These marks are valuable corporate assets. Certain other trademarks and service marks of Motorola are registeredin relevant markets. Motorola's increasing focus on marketing products directly to consumers is reflected in anincreasing emphasis on brand equity creation and protection. All other products or service names are the propertyof their respective owners.

73
Item 8: Financial Statements and Supplementary Data
REPORT OF INDEPENDENT REGISTERED PUBLIC ACCOUNTING FIRM
The Board of Directors and StockholdersMotorola, Inc.:
We have audited the accompanying consolidated balance sheets of Motorola, Inc. and Subsidiaries as ofDecember 31, 2006 and 2005, and the related consolidated statements of operations, stockholders' equity and cashflows for each of the years in the three-year period ended December 31, 2006. These consolidated financialstatements are the responsibility of the Company's management. Our responsibility is to express an opinion on theseconsolidated financial statements based on our audits.
We conducted our audits in accordance with the standards of Public Company Accounting Oversight Board(United States). Those standards require that we plan and perform the audit to obtain reasonable assurance aboutwhether the financial statements are free of material misstatement. An audit includes examining, on a test basis,evidence supporting the amounts and disclosures in the financial statements. An audit also includes assessing theaccounting principles used and significant estimates made by management, as well as evaluating the overall financialstatement presentation. We believe that our audits provide a reasonable basis for our opinion.
In our opinion, the consolidated financial statements referred to above present fairly, in all material respects,the financial position of Motorola, Inc. and Subsidiaries as of December 31, 2006 and 2005, and the results of theiroperations and their cash flows for each of the years in the three-year period ended December 31, 2006, inconformity with U.S. generally accepted accounting principles.
As discussed in Notes 1 and 8 to the consolidated financial statements, effective January 1, 2006, the Companyadopted the provisions of Statement of Financial Accounting Standards No. 123 (revised 2004), Share-BasedPayment. Also, as discussed in Notes 1 and 7 to the consolidated financial statements, effective December 31,2006, the Company adopted the provisions of Statement of Financial Accounting Standards No. 158, Employers'Accounting for Defined Benefit Pension and Other Postretirement Plans Ì an amendment of FASB StatementsNo. 87, 88, 106, and 132(R).
We have also audited, in accordance with the standards of the Public Company Accounting Oversight Board(United States), the effectiveness of Motorola, Inc.'s internal control over financial reporting as of December 31,2006, based on criteria established in Internal ControlÌIntegrated Framework issued by the Committee ofSponsoring Organizations of the Treadway Commission (COSO), and our report dated February 28, 2007 expressedan unqualified opinion on management's assessment of, and the effective operation of, internal control overfinancial reporting.
Chicago, IllinoisFebruary 28, 2007

74
Motorola, Inc. and Subsidiaries
Consolidated Statements of Operations
Years Ended December 31(In millions, except per share amounts) 2006 2005 2004
Net sales $42,879 $35,262 $29,663Costs of sales 30,152 23,833 19,698
Gross margin 12,727 11,429 9,965
Selling, general and administrative expenses 4,504 3,628 3,508Research and development expenditures 4,106 3,600 3,316Other charges (income) 25 (404) 149
Operating earnings 4,092 4,605 2,992
Other income (expense):Interest income (expense), net 326 71 (200)Gains on sales of investments and businesses, net 41 1,845 460Other 151 (109) (140)
Total other income 518 1,807 120
Earnings from continuing operations before income taxes 4,610 6,412 3,112Income tax expense 1,349 1,893 1,013
Earnings from continuing operations 3,261 4,519 2,099Earnings (loss) from discontinued operations, net of tax 400 59 (567)
Net earnings $ 3,661 $ 4,578 $ 1,532
Earnings (loss) per common share:Basic:
Continuing operations $ 1.33 $ 1.83 $ 0.89Discontinued operations 0.17 0.02 (0.24)
$ 1.50 $ 1.85 $ 0.65
Diluted:Continuing operations $ 1.30 $ 1.79 $ 0.87Discontinued operations 0.16 0.02 (0.23)
$ 1.46 $ 1.81 $ 0.64
Weighted average common shares outstanding:Basic 2,446.3 2,471.3 2,365.0Diluted 2,504.2 2,527.0 2,472.0
Dividends paid per share $ 0.18 $ 0.16 $ 0.16
See accompanying notes to consolidated financial statements.

75
Motorola, Inc. and Subsidiaries
Consolidated Balance Sheets
December 31(In millions, except per share amounts) 2006 2005
ASSETSCash and cash equivalents $ 3,212 $ 3,774Sigma Funds 12,204 10,867Short-term investments 224 144Accounts receivable, net 7,509 5,652Inventories, net 3,162 2,422Deferred income taxes 1,731 2,355Other current assets 2,933 2,496Current assets held for sale Ì 312
Total current assets 30,975 28,022
Property, plant and equipment, net 2,267 2,020Investments 895 1,644Deferred income taxes 1,325 1,196Other assets 3,131 2,597Non-current assets held for sale Ì 323
Total assets $38,593 $35,802
LIABILITIES AND STOCKHOLDERS' EQUITYNotes payable and current portion of long-term debt $ 1,693 $ 448Accounts payable 5,056 4,295Accrued liabilities 8,676 7,529Current liabilities held for sale Ì 320
Total current liabilities 15,425 12,592
Long-term debt 2,704 3,806Other liabilities 3,322 2,727Non-current liabilities held for sale Ì 4
Stockholders' equityPreferred stock, $100 par value ÌCommon stock, $3 par value 7,197 7,508
Issued shares: 2006Ì2,399.1 and 2005Ì2,502.7Outstanding shares: 2006Ì2,397.4 and 2005Ì2,501.1
Additional paid-in capital 2,509 4,691Retained earnings 9,086 5,897Non-owner changes to equity (1,650) (1,423)
Total stockholders' equity 17,142 16,673
Total liabilities and stockholders' equity $38,593 $35,802
See accompanying notes to consolidated financial statements.

76
Motorola, Inc. and Subsidiaries
Consolidated Statements of Stockholders' Equity
Non-Owner Changes To Equity
Fair ValueCommon Adjustment ForeignStock and To Available Currency RetirementAdditional For Sale Translation Benefits OtherPaid-In Securities, Adjustments, Adjustments, Items, Retained Comprehensive
(In millions, except per share amounts) Capital Net of Tax Net of Tax Net of Tax Net of Tax Earnings Earnings (Loss)
Balances at January 1, 2004 $ 9,379 $ 1,499 $(217) $ (873) $(202) $ 3,103
Net earnings 1,532 $ 1,532Net unrealized losses on securities (net of
tax of $59) (82) (82)Foreign currency translation adjustments
(net of tax of $35) (150) (150)Retirement benefits adjustments(net of tax
of $126) (188) (188)Issuance of common stock and stock
options exercised (including tax benefitsof $51) 688
Gain on sale of subsidiary stock 397Issuance of stock related to Equity Security
Units 1,200Net loss on derivative instruments (net of
tax of $39) (70) (70)Dividends declared ($0.16 per share) (380)Spin-off of Freescale Semiconductor, Inc. 228 (2,533)
Balances at December 31, 2004 11,664 1,417 (139) (1,061) (272) 1,722 $ 1,042
Net earnings 4,578 $ 4,578Net unrealized losses on securities (net of
tax of $812) (1,320) (1,320)Foreign currency translation adjustments
(net of tax of $29) (114) (114)Retirement benefits adjustments(net of tax
of $66) (208) (208)Issuance of common stock and stock
options exercised (including tax benefitsof $210) 1,409
Share repurchase program (874)Net gain on derivative instruments (net of
tax of $154) 274 274Dividends declared ($0.16 per share) (403)
Balances at December 31, 2005 12,199 97 (253) (1,269) 2 5,897 $ 3,210
Net earnings 3,661 $ 3,661Net unrealized losses on securities (net of
tax of $37) (60) (60)Foreign currency translation adjustments
(net of tax of $1) 127 127Retirement benefits adjustments (net of tax
of $150) (308) 206Issuance of common stock and stock
options exercised 916Share repurchase program (3,826)Excess tax benefits from share-based
compensation 165Stock option and employee stock purchase
plan expense 252Net gain on derivative instruments (net of
tax of $6) 14 14Dividends declared ($0.19 per share) (472)
Balances at December 31, 2006 $ 9,706 $ 37 $(126) $(1,577) $ 16 $ 9,086 $ 3,948
See accompanying notes to consolidated financial statements.

77
Motorola, Inc. and Subsidiaries
Consolidated Statements of Cash Flows
Years Ended December 31(In millions) 2006 2005 2004
OperatingNet earnings $ 3,661 $ 4,578 $ 1,532Less: Earnings (loss) from discontinued operations 400 59 (567)
Earnings from continuing operations 3,261 4,519 2,099Adjustments to reconcile earnings from continuing operations to net cash provided by
operating activities:Depreciation and amortization 558 540 566Non-cash other charges 49 106 198Share-based compensation expense 276 14 28Gains on sales of investments and businesses (41) (1,845) (460)Deferred income taxes 838 1,000 466Change in assets and liabilities, net of effects of acquisitions and dispositions:
Accounts receivable (1,775) (1,303) (551)Inventories (718) (19) (399)Other current assets (388) (721) (780)Accounts payable and accrued liabilities 1,654 2,405 1,840Other assets and liabilities (215) (388) (105)
Net cash provided by operating activities from continuing operations 3,499 4,308 2,902
InvestingAcquisitions and investments, net (1,068) (312) (476)Proceeds from sale of investments and businesses 2,001 1,538 682Capital expenditures (649) (548) (405)Proceeds from sale of property, plant and equipment 85 103 138Purchases of Sigma Funds investments, net (1,337) (3,157) (1,522)Sales (purchases) of short-term investments (80) 8 (13)
Net cash used for investing activities from continuing operations (1,048) (2,368) (1,596)
FinancingNet proceeds from (repayment of) commercial paper and short-term borrowings 66 11 (19)Repayment of debt (18) (1,132) (2,250)Repayment of TOPrS Ì Ì (500)Issuance of common stock 918 1,199 1,680Purchase of common stock (3,826) (874) ÌExcess tax benefits from share-based compensation 165 Ì ÌNet payments related to debt redemption Ì Ì (52)Distribution from (to) discontinued operations (23) 283 1,366Payment of dividends (443) (394) (378)
Net cash used for financing activities from continuing operations (3,161) (907) (153)
Effect of exchange rate changes on cash and cash equivalents from continuing operations 148 (105) 91
Discontinued OperationsNet cash provided by (used for) operating activities from discontinued operations (16) 297 1,363Net cash used for investing activities from discontinued operations (13) (16) (2,937)Net cash provided by (used for) financing activities from discontinued operations 23 (283) 1,414Effect of exchange rate changes on cash and cash equivalents from discontinued
operations 6 2 73
Net cash used for discontinued operations Ì Ì (87)
Net increase (decrease) in cash and cash equivalents (562) 928 1,157Cash and cash equivalents, beginning of year (includes $87 million at January 1, 2004
from discontinued operations) 3,774 2,846 1,689
Cash and cash equivalents, end of year $ 3,212 $ 3,774 $ 2,846
Cash Flow Information
Cash paid during the year for:Interest, net $ 322 $ 318 $ 381Income taxes, net of refunds 463 703 467
See accompanying notes to consolidated financial statements.

78
Motorola, Inc. and Subsidiaries
Notes to Consolidated Financial Statements(Dollars in millions, except as noted)
1. Summary of Significant Accounting Policies
Principles of Consolidation: The consolidated financial statements include the accounts of the Company andall majority-owned subsidiaries. All intercompany transactions and balances have been eliminated. The Company'sinvestments in non-controlled entities in which it has the ability to exercise significant influence over operating andfinancial policies are accounted for by the equity method. The Company's investments in other entities areaccounted for using the cost method.
Revenue Recognition: The Company recognizes revenue when persuasive evidence of an arrangement exists,delivery has occurred, the sales price is fixed or determinable, and collectibility of the sales price is reasonablyassured. In addition to these general revenue recognition criteria, the following specific revenue recognition policiesare followed:
Products and Equipment Ì For product and equipment sales, delivery generally does not occur until theproducts or equipment have been shipped, risk of loss has transferred to the customer, and objective evidence existsthat customer acceptance provisions have been met. The Company records revenue when allowances for discounts,price protection, returns and customer incentives can be reliably estimated. Recorded revenues are reduced by theseallowances. The Company bases its estimates on historical experience taking into consideration the type of productssold, the type of customer, and the type of transaction specific in each arrangement.
Long-Term Contracts Ì For long-term contracts that involve customization or modification of the Company'sequipment or software, the Company generally recognizes revenue using the percentage of completion methodbased on the percentage of costs incurred to date compared to the total estimated costs to complete the contract.In certain instances, when revenues or costs associated with long-term contracts cannot be reliably estimated or thecontract involves unproven technologies or other inherent hazards, revenues and costs are deferred until the projectis complete and customer acceptance is obtained.
Services Ì Revenue for services is generally recognized ratably over the contract term as services areperformed.
Software and Licenses Ì Revenue from pre-paid perpetual licenses is recognized at the inception of thearrangement, presuming all other relevant revenue recognition criteria are met. Revenue from non-perpetual licensesor term licenses is recognized ratably over the period that the licensee uses the license. Revenue from softwaremaintenance, technical support and unspecified upgrades is generally recognized over the period that these servicesare delivered.
Multiple Element Arrangements Ì Arrangements with customers may include multiple deliverables, includingany combination of products, equipment, services and software. If multiple element arrangements include softwareor software related elements, the Company applies the provisions of AICPA Statement of Position No. 97-2,""Software Revenue Recognition,'' to determine separate units of accounting and the amount of the arrangement feeto be allocated to those separate units of accounting. Multiple element arrangements that include software areseparated into more than one unit of accounting if the functionality of the delivered element(s) is not dependenton the undelivered element(s), there is vendor-specific objective evidence of the fair value of the undeliveredelement(s), and general revenue recognition criteria related to the delivered element(s) have been met. For allother deliverables, elements are separated into more than one unit of accounting if the delivered element(s) havevalue to the customer on a stand-alone basis, objective and reliable evidence of fair value exists for the undeliveredelement(s), and delivery of the undelivered element(s) is probable and substantially in the control of theCompany. Revenue is allocated to each unit of accounting based on the relative fair value of each accounting unitor using the residual method if objective evidence of fair value does not exist for the delivered element(s). Therevenue recognition criteria described above are applied to each separate unit of accounting. If these criteria are notmet, revenue is deferred until the criteria are met or the last element has been delivered.
Cash Equivalents: The Company considers all highly-liquid investments purchased with an original maturity ofthree months or less to be cash equivalents.

79
Sigma Funds: The Company and its wholly-owned subsidiaries invest most of their excess cash in two SigmaReserve funds (the ""Sigma Funds''), which are funds similar to a money market fund. The Sigma Funds portfoliosare managed by five major outside investment management firms and include investments in high quality (rated atleast A/A-1 by S&P or A2/P-1 by Moody's at purchase date), U.S. dollar-denominated debt obligations includingcertificates of deposit, bankers' acceptances and fixed time deposits, government obligations, asset-backed securitiesand commercial paper or short-term corporate obligations. The Sigma Funds investment policies require thatfloating rate instruments acquired must have a maturity at purchase date that does not exceed thirty-six monthswith an interest rate reset at least annually. The average maturity of the investments held by the funds must be120 days or less with the actual average maturity of the investments being 53 days and 74 days at December 31,2006 and 2005, respectively. The Company values investments in the Sigma Funds using the amortized cost method,which approximates current market value. Under this method, securities are valued at cost when purchased andthereafter a constant proportionate amortization of any discount or premium is recorded until maturity of thesecurity. Certain investments with maturities beyond one year have been classified as short-term based on theirhighly liquid nature and because such marketable securities represent the investment of cash that is available forcurrent operations.
Inventories: Inventories are valued at the lower of average cost (which approximates computation on afirst-in, first-out basis) or market (net realizable value or replacement cost).
Property, Plant and Equipment: Property, plant and equipment are stated at cost less accumulateddepreciation. Depreciation is recorded using straight-line and declining-balance methods, based on the estimateduseful lives of the assets (buildings and building equipment, 5-40 years; machinery and equipment, 2-12 years) andcommences once the assets are ready for their intended use.
Goodwill and Intangible Assets: Goodwill is not amortized, but instead is tested for impairment at leastannually on October 1. Intangible assets are amortized over their respective estimated useful lives ranging from18 months to 13 years. The Company has no intangible assets with indefinite useful lives.
Impairment of Long-Lived Assets: Long-lived assets held and used by the Company and intangible assets arereviewed for impairment whenever events or changes in circumstances indicate that the carrying amount of assetsmay not be recoverable. The Company evaluates recoverability of assets to be held and used by comparing thecarrying amount of an asset to future net undiscounted cash flows to be generated by the assets. If such assets areconsidered to be impaired, the impairment to be recognized is measured by the amount by which the carryingamount of the assets exceeds the fair value of the assets calculated using a discounted future cash flows analysis.Assets held for sale, if any, are reported at the lower of the carrying amount or fair value less cost to sell.
Investments: Investments include, principally, available-for-sale equity securities at fair value, held-to-maturitydebt securities at amortized cost, securities that are restricted for more than one year or not publicly traded at cost,and equity method investments. For the available-for-sale equity securities, any unrealized holding gains and losses,net of deferred taxes, are excluded from operating results and are recognized as a separate component ofStockholders' Equity until realized. The fair values of the securities are determined based on prevailing marketprices. The Company assesses declines in the value of individual investments to determine whether such decline isother-than-temporary and thus the investment is impaired. This assessment is made by considering availableevidence including changes in general market conditions, specific industry and individual company data, the lengthof time and the extent to which the market value has been less than cost, the financial condition and near-termprospects of the individual company, and the Company's intent and ability to hold the investment.
Deferred Income Taxes: Deferred tax assets and liabilities are recognized for the future tax consequencesattributable to differences between the financial statement carrying amounts of existing assets and liabilities andtheir respective tax bases. Deferred tax assets and liabilities are measured using enacted tax rates expected to applyto taxable income in the years in which those temporary differences are expected to be recovered or settled. Inassessing the realizability of the deferred tax assets, management considers whether it is more likely than not thatsome portion or all of the deferred tax assets will not be realized. A valuation allowance is recorded for theportion of the deferred tax assets that are not expected to be realized based on the level of historical taxableincome, projections for future taxable income over the periods in which the temporary differences are deductibleand allowable tax planning strategies.
Finance Receivables: Finance receivables include trade receivables where contractual terms of the noteagreement are greater than one year. Finance receivables are considered impaired when management determines it isprobable that the Company will be unable to collect all amounts due according to the contractual terms of the

80
note agreement, including principal and interest. Impaired finance receivables are valued based on the present valueof expected future cash flows, discounted at the receivable's effective rate of interest, or the fair value of thecollateral if the receivable is collateral dependent. Interest income and late fees on impaired finance receivables arerecognized only when payments are received. Previously impaired finance receivables are no longer consideredimpaired and are reclassified to performing when they have performed under a work out or restructuring for fourconsecutive quarters.
Fair Values of Financial Instruments: The fair values of financial instruments are determined based on quotedmarket prices and market interest rates as of the end of the reporting period. The Company's financial instrumentsinclude cash and cash equivalents, Sigma Funds, short-term investments, accounts receivable, long-term financereceivables, accounts payable, accrued liabilities, notes payable, long-term debt, foreign currency contracts and otherfinancing commitments. The fair values of these financial instruments were, with the exception of long-term debt asdisclosed in Notes 4 and 5, not materially different from their carrying or contract values at December 31, 2006and 2005.
Foreign Currency: Certain of the Company's non-U.S. operations use the respective local currency as thefunctional currency. These operations that do not have the U.S. dollar as their functional currency translate assetsand liabilities at current rates of exchange in effect at the balance sheet date and revenues and expenses using themonthly average exchange rates in effect for the period in which the items occur. The resulting translationadjustments are included as a component of Stockholders' equity in the Company's consolidated balance sheets. Forthose operations that have the U.S. dollar as their functional currency, transactions denominated in the localcurrency are measured into U.S. dollars using the current rates of exchange for monetary assets and liabilities andhistorical rates of exchange for nonmonetary assets. Gains and losses from remeasurement of monetary assets andliabilities are included in Other income (expense) within the Company's consolidated statement of operations.
Derivative Instruments: Gains and losses on hedges of existing assets, or liabilities are marked-to-market andthe result is included within Other income (expense) in the consolidated statements of operations. Gains and losseson financial instruments that hedge firm future commitments are deferred until such time as the underlyingtransactions are recognized or recorded immediately when the transaction is no longer expected to occur. Gains orlosses on financial instruments that do not qualify as hedges under Statement of Financial Accounting Standards(""SFAS'') No. 133, ""Accounting for Derivative Instruments and Hedging Activities'' (""SFAS 133'') are recognizedimmediately as income or expense.
Earnings Per Share: The Company calculates its basic earnings per share based on the weighted effect of allcommon shares issued and outstanding. Net earnings is divided by the weighted average common shares outstandingduring the period to arrive at the basic earnings per share. Diluted earnings per share is calculated by dividing netearnings by the sum of the weighted average number of common shares used in the basic earnings per sharecalculation and the weighted average number of common shares that would be issued assuming exercise orconversion of all potentially dilutive securities, excluding those securities that would be anti-dilutive to the earningsper share calculation. Both basic and diluted earnings per share amounts are calculated for earnings from continuingoperations and earnings (loss) from discontinued operations for all periods presented.
Share-Based Compensation Costs: The Company has incentive plans which reward employees with stockoptions, an employee stock purchase plan, and restricted stock. Prior to January 1, 2006, the Company applied theintrinsic value method of accounting for share-based compensation. On January 1, 2006, the Company adoptedSFAS No. 123R, ""Share-Based Payment'' (""SFAS 123R''). The amount of compensation cost for share-basedawards is measured based on the fair value, as determined by the Black-Scholes option pricing model, on the grantdate that the share-based awards are issued and adjusted for the estimated number of awards that are expected tovest. Compensation cost for equity instruments is recognized on a straight-line basis over the vesting period.
Retirement Benefits: The Company records annual expenses relating to its pension benefit and postretirementplans based on calculations which include various actuarial assumptions, including discount rates, assumed assetrates of return, compensation increases, turnover rates and health care cost trend rates. The Company reviews itsactuarial assumptions on an annual basis and makes modifications to the assumptions based on current rates andtrends. The effects of the gains, losses, and prior service costs and credits are amortized over future service periods.As of December 31, 2006, the funding status, or projected benefit obligation less plan assets, for each plan, isreflected in the Company's consolidated balance sheet.
Use of Estimates: The preparation of financial statements in conformity with U.S. generally acceptedaccounting principles requires management to make certain estimates and assumptions that affect the reportedamounts of assets and liabilities and the disclosure of contingent assets and liabilities at the date of the financial

81
statements and the reported amounts of revenues and expenses during the reporting period. Actual results coulddiffer from those estimates.
Reclassifications: Certain amounts in prior years' financial statements and related notes have been reclassifiedto conform to the 2006 presentation.
Recent Accounting Pronouncements: In February 2007, the Financial Accounting Standards Board (""FASB'')issued Statement of Financial Accounting Standard (""SFAS'') No. 159, ""The Fair Value Option for Financial Assetsand Financial Liabilities Ì Including an amendment of FASB Statement No. 115'' (""SFAS 159''). SFAS 159 permitsentities to elect to measure many financial instruments and certain other items at fair value. Unrealized gains andlosses on items for which the fair value option has been elected will be recognized in earnings at each subsequentreporting date. SFAS 159 is effective for fiscal years beginning after November 15, 2007. The Company is currentlyassessing the impact of SFAS 159 on its consolidated financial statements.
In September 2006, the FASB issued EITF 06-4, ""Accounting for Deferred Compensation and PostretirementBenefit Aspects of Endorsement Split-Dollar Life Insurance Arrangements'' (""EITF 06-4''). EITF 06-4 requires thatendorsement split-dollar life insurance arrangements which provide a benefit to an employee beyond thepostretirement period be recorded in accordance with SFAS No. 106, ""Employer's Accounting for PostretirementBenefits Other Than Pensions'' or APB Opinion No. 12, ""Omnibus OpinionÌ1967'' based on the substance of theagreement with the employee. Under the provisions of these Statements, a liability should be accrued equal to theactuarial present value of the future death benefit over the service period. EITF 06-4 is effective for fiscal yearsbeginning after December 15, 2007. The effects of applying EITF 06-4 may be reflected as either a cumulative-effect adjustment to retained earnings as of the beginning of the year of adoption or through retrospectiveapplication to all prior periods. The Company is currently assessing the impact of EITF 06-4 on the Company'sconsolidated financial statements.
In September 2006, the FASB issued SFAS No. 158, ""Employers' Accounting for Defined Benefit Pension andOther Postretirement Plans'' (""SFAS 158''). SFAS 158 requires employers to (i) recognize the funded status oftheir defined benefit pension and other postretirement plans on their consolidated balance sheet, (ii) recognize as acomponent of other comprehensive income, net of tax, the gains or losses and prior service costs or credits thatarise during the period but are not recognized as components of net periodic benefit cost, (iii) measure definedbenefit plan assets and obligations as of the date of the employer's statement of financial position, and (iv) discloseadditional information in the notes to financial statements. The Company adopted the recognition and disclosurerequirements of SFAS 158 as of December 31, 2006. The impact of adopting these provisions was an increase in netliabilities for pension and postretirement health care benefits of $783 million and a decrease in stockholders' equityof $514 million, net of taxes. The SFAS 158 provision related to measurement date is effective for fiscal yearsending after December 15, 2008. The Company is currently assessing the impact of the change in measurement dateon the Company's financial statements but does not believe the adoption of this provision of SFAS 158 will have amaterial impact on the Company's consolidated financial statements.
In September 2006, the FASB issued SFAS No. 157, ""Fair Value Measurements'' (""SFAS 157''). SFAS 157defines fair value, establishes a framework for measuring fair value as required by other accounting pronouncementsand expands fair value measurement disclosures. SFAS 157 is effective for fiscal years beginning after November 15,2007. The Company is currently evaluating the impact of SFAS 157 on the Company's consolidated financialstatements.
In September 2006, the SEC issued Staff Accounting Bulletin No. 108 (""SAB 108''), ""Considering the Effectsof Prior Year Misstatements in Current Year Financial Statements.'' SAB 108 expresses the SEC Staff's viewsregarding the process of quantifying financial statement misstatements. SAB 108 addresses the diversity in practice inquantifying financial statement misstatements and the potential under current practice for the build up of improperamounts on the balance sheet. The Company adopted the provisions of SAB 108 as of December 31, 2006. Theadoption of SAB 108 did not have a material effect on the Company's consolidated results of operations, financialposition, or cash flows.
In June 2006, the FASB issued Interpretation No. 48, ""Accounting for Uncertainty in Income Taxes''(""FIN 48''). FIN 48 clarifies the accounting for uncertainty in income taxes recognized in an enterprise's financialstatements in accordance with SFAS No. 109, ""Accounting for Income Taxes.'' This interpretation prescribes arecognition threshold and measurement attribute for the financial statement recognition and measurement of a taxposition taken or expected to be taken in a tax return. FIN 48 also provides guidance on derecognition of taxbenefits, classification on the balance sheet, interest and penalties, accounting in interim periods, disclosure, and

82
transition. FIN 48 is effective beginning January 1, 2007. The adoption of FIN 48 is not expected to have amaterial effect on the Company's consolidated results of operations or cash flows. The Company estimates that theadoption of FIN 48 will cause an increase in noncurrent liabilities and an equal offsetting increase in noncurrentdeferred tax assets in the range of $900 million to $1.0 billion. The amount of cash ultimately payable with regardto the uncertain tax positions is not affected by the balance sheet reclassification estimated upon the adoption ofFIN 48 and will be a function of Motorola's overall tax situation when the underlying tax issues are resolved,taking into account the availability of deferred tax assets that may reduce tax otherwise due.
In March 2006, the FASB issued SFAS No. 156, ""Accounting for Servicing of Financial Assets Ì AnAmendment of SFAS No. 140'' (""SFAS 156''). Among other requirements, SFAS 156 requires an entity to recognizea servicing asset or servicing liability each time it undertakes an obligation to service a financial asset by enteringinto a servicing contract when there is either: (i) a transfer of the requirements for sale accounting, (ii) a transferof the servicer's financial assets to a qualifying special-purpose entity in a guaranteed mortgage securitization inwhich the transferor retains all of the resulting securities and classifies them as either available-for-sale securities ortrading securities in accordance with SFAS 115, ""Accounting for Certain Investments in Debt and EquitySecurities'', or (iii) an acquisition or assumption of an obligation to service a financial asset that does not relate tofinancial assets of the servicer or its consolidated affiliates. SFAS 156 is effective for fiscal years beginning afterSeptember 15, 2006. The Company does not believe the adoption of SFAS 156 will have a material effect on theCompany's consolidated results of operations, financial position or cash flows.
2. Discontinued Operations
During 2006, the Company completed the sale of its automotive electronics business, which was a componentof the Networks and Enterprise segment, to Continental AG for $856 million in net cash received. The Companyrecorded a gain on sale of business of $399 million before income taxes, which is included in Earnings (loss) fromdiscontinued operations, net of tax, in the Company's consolidated statements of operations.
During the second quarter of 2004, the Company completed the separation of its semiconductor operationsinto a separate subsidiary, Freescale Semiconductor, Inc. (""Freescale Semiconductor''). Under the terms of theMaster Separation and Distribution Agreement entered into between Motorola and Freescale Semiconductor,Freescale Semiconductor has agreed to indemnify Motorola for substantially all past, present and future liabilitiesassociated with the semiconductor business. In July 2004, an initial public offering (""IPO'') of a minority interestof approximately 32.5% of Freescale Semiconductor was completed. As a result of the IPO the Company recordedadditional paid-in capital of $397 million related to the excess of the IPO price over the book value of the sharessold. Concurrently in July 2004, Freescale Semiconductor issued senior debt securities in an aggregate principalamount of $1.25 billion. On December 2, 2004, Motorola completed the spin-off of its remaining 67.5% equityinterest in Freescale Semiconductor. The spin-off was effected by way of a pro rata non-cash dividend to Motorolastockholders, which reduced retained earnings by $2.5 billion. Holders of Motorola stock at the close of businesson November 26, 2004 received a dividend of .110415 shares of Freescale Semiconductor Class B common stockper share of Motorola common stock. No fractional shares of Freescale Semiconductor were issued. Stockholdersentitled to fractional shares of Freescale Semiconductor Class B common stock in the distribution received the cashvalue instead. The equity distribution was structured to be tax-free to Motorola stockholders for U.S. tax purposes(other than with respect to any cash received in lieu of fractional shares).
The financial results of the automotive electronics business and Freescale Semiconductor have been reflected asdiscontinued operations in the accompanying financial statements and related disclosures for all periods presented.As a result, the footnote disclosures have been revised to exclude amounts related to the automotive electronicsbusiness and Freescale Semiconductor.
The following table displays summarized financial information for discontinued operations:
Years Ended December 31 2006 2005 2004
Net sales (including sales to other Motorola businesses of $0 million, $3 million and$1,173 million for the years ended December 31, 2006, 2005 and 2004, respectively) $860 $1,581 $5,685
Operating earnings 87 118 352Gains (loss) on sales of investments and businesses, net 399 16 (44)Earnings before income taxes 482 135 381Income tax expense 82 76 948Earnings (loss) from discontinued operations, net of tax 400 59 (567)

83
The following table displays a summary of the assets and liabilities held for sale:
December 31 2005
AssetsAccounts receivable, net $144Inventories, net 100Deferred income taxes, current 35Other current assets 33Property, plant and equipment, net 251Investments 10Deferred income taxes, non-current 49Other assets 13
$635
LiabilitiesAccounts payable $111Accrued liabilities 209Other liabilities 4
$324
3. Other Financial Data
Statement of Operations InformationOther Charges (Income)
Other charges (income) included in Operating earnings consist of the following:
Years Ended December 31 2006 2005 2004
Other charges (income):Settlements and collections related to Telsim $(418) $(515) $(44)Reorganization of businesses 172 54 (11)Intangibles amortization 100 67 52In-process research and development charges 33 2 34Charitable contribution to Motorola Foundation 88 Ì ÌLegal reserves 50 Ì ÌGoodwill impairment Ì Ì 125Other Ì (12) (7)
$ 25 $(404) $149
Other Income (Expense)
Interest income (expense), net, and Other both included in Other income (expense) consist of the following:
Years Ended December 31 2006 2005 2004
Interest income (expense), net:Interest expense $(335) $(325) $(354)Interest income 661 396 154
$ 326 $ 71 $(200)
Other:Investment impairments $ (27) $ (25) $ (36)Repayment of previously-reserved Iridium loan Ì 30 ÌDebt retirement Ì (137) (81)Gain on Sprint Nextel derivatives 99 51 ÌForeign currency gain (loss) 60 (38) (44)Other 19 10 21
$ 151 $(109) $(140)

84
Earnings Per Common Share
Basic and diluted earnings per common share from both continuing operations and net earnings, whichincludes discontinued operations is computed as follows:
Continuing Operations Net EarningsYears Ended December 31 2006 2005 2004 2006 2005 2004
Basic earnings per common share:Earnings $ 3,261 $ 4,519 $ 2,099 $ 3,661 $ 4,578 $ 1,532Weighted average common shares outstanding 2,446.3 2,471.3 2,365.0 2,446.3 2,471.3 2,365.0Per share amount $ 1.33 $ 1.83 $ 0.89 $ 1.50 $ 1.85 $ 0.65
Diluted earnings per common share:Earnings $ 3,261 $ 4,519 $ 2,099 $ 3,661 $ 4,578 $ 1,532Add: Interest on equity security units, net Ì Ì 42 Ì Ì 42
Earnings, as adjusted $ 3,261 $ 4,519 $ 2,141 $ 3,661 $ 4,578 $ 1,574
Weighted average common shares outstanding 2,446.3 2,471.3 2,365.0 2,446.3 2,471.3 2,365.0Add effect of dilutive securities:
Employee share-based awards 57.9 55.7 48.8 57.9 55.7 48.8Equity security units Ì Ì 57.8 Ì Ì 57.8Zero coupon notes due 2009 and 2013 Ì Ì 0.4 Ì Ì 0.4
Diluted weighted average common sharesoutstanding 2,504.2 2,527.0 2,472.0 2,504.2 2,527.0 2,472.0
Per share amount $ 1.30 $ 1.79 $ 0.87 $ 1.46 $ 1.81 $ 0.64
In the computation of diluted earnings per common share from both continuing operations and on a netearnings basis for the years ended December 31, 2006, 2005 and 2004 the assumed conversion of 76.6 million,44.8 million and 155.8 million stock options, respectively, were excluded because their inclusion would have beenantidilutive.
Balance Sheet Information
Accounts Receivable
Accounts receivable, net, consists of the following:
December 31 2006 2005
Accounts receivable $7,587 $5,753Less allowance for doubtful accounts (78) (101)
$7,509 $5,652
Inventories
Inventories, net, consist of the following:
December 31 2006 2005
Finished goods $1,796 $1,252Work-in-process and production materials 1,782 1,699
3,578 2,951Less inventory reserves (416) (529)
$3,162 $2,422

85
Other Current Assets
Other current assets consists of the following:
December 31 2006 2005
Contractor receivables $1,349 $1,240Costs in excess of billings 505 495Contract related deferred costs 369 255Other 710 506
$2,933 $2,496
Property, plant, and equipment
Property, plant and equipment, net, consists of the following:
December 31 2006 2005
Land $ 129 $ 147Building 1,705 1,697Machinery and equipment 5,885 5,416
7,719 7,260Less accumulated depreciation (5,452) (5,240)
$ 2,267 $ 2,020
Depreciation expense for the years ended December 31, 2006, 2005 and 2004 was $463 million, $473 millionand $502 million, respectively.
Investments
Investments consist of the following:
December 31 2006 2005
Available-for-sale securities:Cost basis $ 70 $1,065Gross unrealized gains 68 232Gross unrealized losses (8) (75)
Fair value 130 1,222Other securities, at cost 676 284Equity method investments 89 138
$895 $1,644
The Company recorded investment impairment charges of $27 million, $25 million and $36 million for theyears ended December 31, 2006, 2005 and 2004, respectively, primarily related to cost-based investments write-downs. These impairment charges represent other-than-temporary declines in the value of the Company's investmentportfolio. Investment impairment charges are included in Other within Other income (expense) in the Company'sconsolidated statements of operations.
Gains (loss) on sales of investments and businesses, consists of the following:
Years Ended December 31 2006 2005 2004
Gains on sales of investments $41 $1,848 $434Gains (loss) on sales of businesses Ì (3) 26
$41 $1,845 $460
In 2006, the $41 million of net gains was primarily related to a $141 million gain on the sale of the Company'sremaining shares in Telus Corporation, partially offset by a $126 million loss on the sale of the Company'sremaining shares in Sprint Nextel Corporation (""Sprint Nextel'').

86
During the first half of 2005, the Company sold 22.5 million shares of common stock of NextelCommunications, Inc. (""Nextel''). The Company received approximately $679 million in cash and realized a pre-tax gain of $609 million from these sales.
On August 12, 2005, Sprint Corporation completed its merger (the ""Sprint Nextel Merger'') with Nextel. Inconnection with the Sprint Nextel Merger, Motorola received $46 million in cash, 31.7 million voting shares and37.6 million non-voting shares of Sprint Nextel, in exchange for its remaining 54.7 million shares of Nextel. As aresult of this transaction, the Company realized a gain of $1.3 billion, comprised of a $1.7 billion gain recognizedon the receipt of cash and the 69.3 million shares of Sprint Nextel in exchange for its shares of Nextel, net of a$418 million loss recognized on its hedge of 25 million shares of common stock of Nextel.
On December 14, 2004, in connection with the announcement of the definitive agreement relating to the SprintNextel Merger, Motorola, a Motorola subsidiary and Nextel entered into an agreement pursuant to whichMotorola and its subsidiary agreed to not dispose of their 29.7 million non-voting shares of Nextel (now37.6 million shares of non-voting common stock of Sprint Nextel issued in exchange for Nextel non-votingcommon stock pursuant to the Sprint Nextel Merger) for a period of no longer than two years. In exchange forthis agreement, Nextel paid Motorola a fee of $50 million in 2005.
During the fourth quarter of 2005, the Company elected to settle variable share purchase agreements bydelivering 30.3 million shares of Sprint Nextel common stock, with a value of $725 million, to the counterpartiesand selling the remaining 1.4 million Sprint Nextel common shares in the open market. The Company receivedaggregate cash proceeds of $391 million and realized a loss of $70 million in connection with the settlement andsale.
For the year ended December 31, 2004, the $460 million gain on sales of investments and businesses isprimarily comprised of: (i) a $130 million gain on the sale of the Company's remaining shares in BroadcomCorporation, (ii) a $122 million gain on the sale of a portion of the Company's shares in Nextel, (iii) an$82 million gain on the sale of a portion of the Company's shares in Telus Corporation, and (iv) a $68 milliongain on the sale of a portion of the Company's shares in Nextel Partners, Inc.
Other Assets
Other assets consists of the following:
December 31 2006 2005
Long-term finance receivables, net of allowance of $10 and $12 $ 145 $ 82Goodwill 1,706 1,349Intangible assets, net of accumulated amortization of $536 and $437 354 231Royalty license arrangements 439 471Other 487 464
$3,131 $2,597
Accrued Liabilities
Accrued liabilities consists of the following:
December 31 2006 2005
Contractor payables $1,481 $ 985Customer reserves 1,305 1,171Compensation 777 1,057Deferred revenue 730 425Customer downpayments 532 429Warranty reserves 530 467Tax liabilities 444 488Other 2,877 2,507
$8,676 $7,529

87
Other Liabilities
Other liabilities consists of the following:
December 31 2006 2005
Defined benefit plans $1,882 $1,644Postretirement health care benefit plan 214 66Royalty license arrangement 300 315Deferred revenue 273 78Other 653 624
$3,322 $2,727
Stockholders' Equity InformationComprehensive Earnings (Loss)
Net unrealized gains (losses) on securities included in Comprehensive earnings (loss) are comprised of thefollowing:
Years Ended December 31 2006 2005
Gross unrealized gains (losses) on securities, net of tax $ 31 $ (204)Less: Realized gains, net of tax 91 1,116
Net unrealized losses on securities, net of tax $(60) $(1,320)
Share Repurchase Program
In May 2005, the Board of Directors authorized the Company to purchase up to $4.0 billion of its outstandingshares of common stock over a period of up to 36 months ending in May 2008, subject to market conditions (the""2005 Stock Repurchase Program''). In July 2006, the Company entered into an accelerated stock buybackagreement to repurchase approximately $1.2 billion of its outstanding common stock (the ""ASB''). In October2006, the Company received the final distribution of shares under the ASB. The total shares purchased under theASB were 50.5 million shares. The ASB completed the 2005 Stock Repurchase Program.
On July 24, 2006, the Board of Directors authorized the Company to repurchase up to an additional$4.5 billion of its outstanding shares of common stock over a period of up to 36 months ending in June 2009,subject to market conditions (the ""2006 Stock Repurchase Program''). In the fourth quarter of 2006, the Companypurchased $700 million of shares under the 2006 Stock Repurchase Program.
The Company repurchased a total of 171.7 million common shares (including shares received under the ASB)at a cost of $3.8 billion in 2006. The Company repurchased a total of 41.7 million common shares at a cost of$874 million in 2005. All repurchased shares have been retired.

88
4. Debt and Credit Facilities
Long-Term Debt
December 31 2006 2005
7.6% notes due 2007 $ 118 $ 1184.608% senior notes due 2007 1,205 1,2126.5% notes due 2008 114 1145.8% notes due 2008 84 847.625% notes due 2010 525 5258.0% notes due 2011 599 5996.5% debentures due 2025 397 3977.5% debentures due 2025 398 3986.5% debentures due 2028 297 2965.22% debentures due 2097 194 193Other long-term debt 141 39
4,072 3,975Fair value adjustment (28) (50)Less: current portion (1,340) (119)
Long-term debt $ 2,704 $3,806
Short-Term Debt
December 31 2006 2005
Notes to banks $ 71 $ 29Commercial paper 300 300
371 329Add: current portion 1,340 119Fair value adjustment (18) Ì
Notes payable and current portion of long-term debt $1,693 $448
Weighted average interest rates on short-term borrowings
Commercial paper 5.1% 3.4%Other short-term debt 5.8% 3.4%
In January 2007, the Company repaid, at maturity, all $118 million aggregate principal amount outstanding ofits 7.6% Notes due January 1, 2007 (the ""2007 7.6% Notes'').
In November 2006, $1.2 billion of 4.608% Senior Notes due November 16, 2007 were reclassified to currentportion of long-term debt.
In September 2005, the Company repurchased an aggregate principal amount of $1.0 billion of its outstandinglong-term debt for an aggregate purchase price of $1.1 billion through cash tender offers. Included in the$1.0 billion of long-term debt repurchased were repurchases of a principal amount of: (i) $86 million of the$200 million of 6.50% Notes due 2008 outstanding, (ii) $241 million of the $325 million of 5.80% Notes due2008 outstanding, and (iii) $673 million of the $1.2 billion of 7.625% Notes due 2010 outstanding. In addition, theCompany terminated a notional amount of $1.0 billion of fixed-to-floating interest rate swaps associated with thedebt repurchased, resulting in an expense of approximately $22 million. The aggregate charge for the repurchase ofthe debt and the termination of the associated interest rate swaps, as presented in Other income (expense) in theCompany's consolidated statements of operations, was $137 million.
On September 1, 2005, the Company retired approximately $1 million of the $398 million of 6.5% Debenturesdue 2025 (the ""2025 Debentures'') in connection with the holders of the debentures right to put their debenturesback to the Company. The residual put options expired unexercised and the remaining $397 million of 2025Debentures were reclassified to long-term debt.

89
In 2004, the Company retired approximately $2.3 billion of debt, including $1.8 billion of debt retired prior tomaturity. The net charge for the repurchase of the debt and the termination of the associated interest rate swaps, aspresented in Other income (expense) in the Company's consolidated statements of operations, was $81 million.
Aggregate requirements for long-term debt maturities during the next five years are as follows: 2007 Ì$1.3 billion; 2008 Ì $198 million; 2009 Ì $4 million; 2010 Ì $534 million; 2011 Ì $607 million.
In December 2006, the Company signed a new five-year revolving domestic credit facility (""5-Year CreditFacility'') for $2.0 billion, replacing the existing facility totaling $1.0 billion. At December 31, 2006, thecommitment fee assessed against the daily average amounts unused was 6.5 basis points. Important terms of the5-Year Credit Facility include a covenant relating to the ratio of total debt to EBITDA. The Company was incompliance with the terms of the 5-year Credit Facility at December 31, 2006. The Company's current corporatecredit ratings are ""A¿'' with a stable outlook by Fitch, ""Baa1'' with a positive outlook by Moody's, and ""A¿''with a stable outlook by S&P. The Company has never borrowed under its domestic revolving credit facilities. TheCompany also has $2.0 billion of non-U.S. credit facilities with interest rates on borrowings varying from country tocountry depending upon local market conditions. At December 31, 2006, the Company's total domestic andnon-U.S. credit facilities totaled $4.0 billion, of which $175 million was considered utilized.
5. Risk Management
Derivative Financial Instruments
Foreign Currency Risk
As a multinational company, the Company's transactions are denominated in a variety of currencies. TheCompany uses financial instruments to reduce its overall exposure to the effects of currency fluctuations on cashflows. The Company's policy prohibits speculation in financial instruments for profit on the exchange rate pricefluctuation, trading in currencies for which there are no underlying exposures, or entering into trades for anycurrency to intentionally increase the underlying exposure. Instruments that are designated as part of a hedgingrelationship must be effective at reducing the risk associated with the exposure being hedged and are designated asa part of a hedging relationship at the inception of the contract. Accordingly, changes in market values of hedgeinstruments must be highly correlated with changes in market values of underlying hedged items both at theinception of the hedge and over the life of the hedge contract.
The Company's strategy in foreign exchange exposure issues is to offset the gains or losses on the financialinstruments against losses or gains on the underlying operational cash flows or investments based on the operatingbusiness units' assessment of risk. The Company enters into derivative contracts for some of the Company's non-functional currency receivables and payables, which are primarily denominated in major currencies that can betraded on open markets. The Company uses forward contracts and options to hedge these currency exposures. Inaddition, the Company enters into derivative contracts for some firm commitments and some forecastedtransactions, which are designated as part of a hedging relationship if it is determined that the transaction qualifiesfor hedge accounting under the provisions of SFAS No. 133. A portion of the Company's exposure is fromcurrencies that are not traded in liquid markets and these are addressed, to the extent reasonably possible, throughmanaging net asset positions, product pricing and component sourcing.
At December 31, 2006 and 2005, the Company had net outstanding foreign exchange contracts totaling$4.8 billion and $2.8 billion, respectively. Management believes that these financial instruments should not subjectthe Company to undue risk due to foreign exchange movements because gains and losses on these contracts shouldoffset losses and gains on the underlying assets, liabilities and transactions, except for the ineffective portion of theinstruments, which are charged to Other within Other income (expense) in the Company's consolidated statementsof operations. The following table shows the five largest net foreign exchange contract positions as ofDecember 31, 2006 and 2005:
December 31, December 31,Buy (Sell) 2006 2005
Euro $(2,069) $(1,076)Chinese Renminbi (1,195) (728)Brazilian Real (466) (348)Indian Rupee (148) (70)British Pound 252 (226)

90
The Company is exposed to credit-related losses if counterparties to financial instruments fail to perform theirobligations. However, the Company does not expect any counterparties, all of whom presently have investmentgrade credit ratings, to fail to meet their obligations.
Interest Rate Risk
At December 31, 2006, the Company's short-term debt consisted primarily of $300 million of commercialpaper, priced at short-term interest rates. The Company has $4.1 billion of long-term debt, including the currentportion of long-term debt, which is primarily priced at long-term, fixed interest rates.
In order to manage the mix of fixed and floating rates in its debt portfolio, the Company has entered intointerest rate swaps to change the characteristics of interest rate payments from fixed-rate payments to short-termLIBOR-based variable rate payments. The following table displays these outstanding interest rate swaps atDecember 31, 2006:
Notional AmountDate Executed Hedged Underlying Debt Instrument
August 2004 $1,200 4.608% notes due 2007September 2003 457 7.625% debentures due 2010September 2003 600 8.0% notes due 2011May 2003 114 6.5% notes due 2008May 2003 84 5.8% debentures due 2008May 2003 69 7.625% debentures due 2010March 2002 118 7.6% notes due 2007
$2,642
The weighted average short-term LIBOR-based variable rate payments on each of the above interest rate swapswas 7.29% for the three months ended December 31, 2006. The fair value of the above interest rate swaps atDecember 31, 2006 and 2005, was $(47) million and $(50) million, respectively. Except as noted below, theCompany had no outstanding commodity derivatives, currency swaps or options relating to debt instruments atDecember 31, 2006 or December 31, 2005.
The Company designated the above interest rate swap agreements as part of a fair value hedging relationship.As such, changes in the fair value of the hedging instrument, as well as the hedged debt are recognized in earnings,therefore adjusting the carrying amount of the debt. Interest expense on the debt is adjusted to include thepayments made or received under such hedge agreements. In the event the underlying debt instrument matures or isredeemed or repurchased, the Company is likely to terminate the corresponding interest rate swap contracts.
Additionally, effective December 31, 2006, one of the Company's European subsidiaries entered into interestrate agreements (""Interest Agreements'') relating to a Euro-denominated loan. The interest on the Euro-denominated loan is floating based on 3-month EURIBOR plus a spread. The Interest Agreements change thecharacteristics of interest rate payments from short-term EURIBOR based variable payments to maximum fixed-ratepayments. The Interest Agreements are not accounted for as part of a hedging relationship and accordingly thechanges in the fair value of the Interest Agreements are included in Other income (expense) in the Company'sconsolidated statements of operations. The fair value of the Interest Agreements at December 31, 2006 was$1 million.
The Company is exposed to credit loss in the event of nonperformance by the counterparties to its swapcontracts. The Company minimizes its credit risk on these transactions by only dealing with leading, creditworthyfinancial institutions having long-term debt ratings of ""A'' or better and, does not anticipate nonperformance. Inaddition, the contracts are distributed among several financial institutions, thus minimizing credit risk concentration.

91
Stockholders' Equity
Derivative instruments activity, net of tax, included in Non-owner changes to equity within Stockholders'Equity for the years ended December 31, 2006 and 2005 is as follows:
2006 2005
Balance at January 1 $ 2 $(272)Increase in fair value 75 28Reclassifications to earnings (61) 246
Balance at December 31 $ 16 $ 2
Fair Value Hedges
The Company recorded income of $0.6 million, $1.5 million and $0.1 million for the years endedDecember 31, 2006, 2005 and 2004, respectively, representing the ineffective portions of changes in the fair value offair value hedge positions. These amounts are included in Other within Other income (expense) in the Company'sconsolidated statements of operations. The above amounts include the change in the fair value of derivativecontracts related to the changes in the difference between the spot price and the forward price. These amounts areexcluded from the measure of effectiveness. Expense (income) related to fair value hedges that were discontinuedfor the years ended December 31, 2006, 2005 and 2004 are included in the amounts noted above.
Cash Flow Hedges
The Company recorded income (expense) of $13 million, $1 million and $(12) million for the years endedDecember 31, 2006, 2005 and 2004, respectively, representing the ineffective portions of changes in the fair value ofcash flow hedge positions. These amounts are included in Other within Other income (expense) in the Company'sconsolidated statements of operations. The above amounts include the change in the fair value of derivativecontracts related to the changes in the difference between the spot price and the forward price. These amounts areexcluded from the measure of effectiveness. Expense (income) related to cash flow hedges that were discontinuedfor the years ended December 31, 2006, 2005 and 2004 are included in the amounts noted above.
During the years ended December 31, 2006, 2005 and 2004, on a pre-tax basis, income (expense) of$(98) million, $21 million and $(27) million, respectively, was reclassified from equity to earnings in theCompany's consolidated statements of operations. If exchange rates do not change from year-end, the Companyestimates that $16 million of pre-tax net derivative income included in Non-owner changes to equity withinStockholders' equity would be reclassified into earnings within the next twelve months and will be reclassified inthe same period that the hedged item affects earnings. The actual amounts that will be reclassified into earningsover the next twelve months will vary from this amount as a result of changes in market conditions.
At December 31, 2006, the maximum term of derivative instruments that hedge forecasted transactions wastwo years. However, the weighted average duration of the Company's derivative instruments that hedge forecastedtransactions was seven months.
Net Investment in Foreign Operations Hedge
At December 31, 2006 and 2005, the Company did not have any hedges of foreign currency exposure of netinvestments in foreign operations.
Investments Hedge
During the first quarter of 2006, the Company entered into a zero-cost collar derivative (the ""Sprint NextelDerivative'') to protect itself economically against price fluctuations in its 37.6 million shares of Sprint NextelCorporation (""Sprint Nextel'') non-voting common stock. During the second quarter of 2006, as a result of SprintNextel's spin-off of Embarq Corporation through a dividend to Sprint Nextel shareholders, the Company receivedapproximately 1.9 million shares of Embarq Corporation. The floor and ceiling prices of the Sprint NextelDerivative were adjusted accordingly. The Sprint Nextel Derivative was not designated as a hedge under the

92
provisions of SFAS No. 133, ""Accounting for Derivative Instruments and Hedging Activities''. Accordingly, toreflect the change in fair value of the Sprint Nextel Derivative, the Company recorded a net gain of $99 million forthe year ended December 31, 2006, included in Other income (expense) in the Company's consolidated statementsof operations. In December 2006, the Sprint Nextel Derivative was terminated and settled in cash and the37.6 million shares of Sprint Nextel were converted to common shares and sold. The Company received aggregatecash proceeds of approximately $820 million from the settlement of the Sprint Nextel Derivative and thesubsequent sale of the 37.6 million Sprint Nextel shares. The Company recognized a loss of $126 million inconnection with the sale of the remaining shares of Sprint Nextel common stock. As described above, theCompany recorded a net gain of $99 million in connection with the Sprint Nextel Derivative.
Prior to the merger of Sprint Corporation (""Sprint'') and Nextel Communications, Inc. (""Nextel''), theCompany had entered into variable share forward purchase agreements (the ""Variable Forwards'') to hedge itsNextel common stock. The Company did not designate the Variable Forwards as a hedge of the Sprint Nextelshares received as a result of the merger. Accordingly, the Company recorded $51 million of gains for the yearended December 31, 2005 reflecting the change in value of the Variable Forwards. The Variable Forwards weresettled during the fourth quarter of 2005.
Fair Value of Financial Instruments
The Company's financial instruments include cash equivalents, Sigma Funds, short-term investments, accountsreceivable, long-term finance receivables, accounts payable, accrued liabilities, notes payable, long-term debt, foreigncurrency contracts and other financing commitments.
Using available market information, the Company determined that the fair value of long-term debt atDecember 31, 2006 was $4.3 billion, compared to a carrying value of $4.1 billion. Since considerable judgment isrequired in interpreting market information, the fair value of the long-term debt is not necessarily indicative of theamount which could be realized in a current market exchange.
The fair values of the other financial instruments were not materially different from their carrying or contractvalues at December 31, 2006.
6. Income Taxes
Components of earnings (loss) from continuing operations before income taxes are as follows:
Years Ended December 31 2006 2005 2004
United States $1,034 $3,232 $ 853Other nations 3,576 3,180 2,259
$4,610 $6,412 $3,112
Components of income tax expense (benefit) are as follows:
Years Ended December 31 2006 2005 2004
United States $ 10 $ 240 $ 44Other nations 488 638 458States (U.S.) 13 15 6
Current income tax expense 511 893 508
United States 892 891 504Other nations (147) (42) (94)States (U.S.) 93 151 95
Deferred income tax expense 838 1,000 505
Total income tax expense $1,349 $1,893 $1,013
Deferred tax charges (benefits) that were recorded within Non-owner changes to equity in the Company'sconsolidated balance sheets resulted primarily from fair value adjustments to available-for-sale securities, losses onderivative instruments and retirement benefit adjustments. The adjustments were $(182) million, $(753) millionand $(189) million for the years ended December 31, 2006, 2005 and 2004, respectively. Except for certain

93
earnings that the Company intends to reinvest indefinitely, provisions have been made for the estimated U.S. federalincome taxes applicable to undistributed earnings of non-U.S. subsidiaries. Undistributed earnings that the Companyintends to reinvest indefinitely, and for which no U.S. Federal income taxes has been provided, aggregate$4.0 billion, $2.8 billion and $5.6 billion at December 31, 2006, 2005 and 2004, respectively. The portion ofearnings not reinvested indefinitely may be distributed without additional U.S. federal income taxes charges giventhe U.S. federal tax provisions accrued on undistributed earnings and the utilization of available foreign tax credits.
On October 22, 2004, the American Jobs Creation Act of 2004 (""the Act'') was signed into law. The Actprovides for a special one-time tax incentive for U.S. multinationals to repatriate accumulated earnings from theirforeign subsidiaries by providing an 85 percent dividends received deduction for certain qualifying dividends. TheCompany repatriated approximately $4.6 billion of accumulated earnings under the Act and recorded an associatedtax benefit of $265 million in 2005. The Company finalized certain actions maximizing the tax benefit attributableto the repatriation of foreign earnings under the provisions of the Act and recognized an additional $68 million ofnet tax benefits relating to these actions during 2006.
Differences between income tax expense (benefit) computed at the U.S. federal statutory tax rate of 35% andincome tax expense (benefit) are as follows:
Years Ended December 31 2006 2005 2004
Income tax expense at statutory rate $1,613 $2,244 $1,089Taxes on non-U.S. earnings (449) (460) (528)State income taxes 77 121 66Tax benefit on qualifying repatriations (68) (265) ÌTax on undistributed non-U.S. earnings 194 202 327Research credits (34) (23) (72)Foreign export sales and section 199 deduction (22) (13) (30)Non-deductible acquisition charges 4 2 11Goodwill impairments Ì Ì 44Tax benefit on disposition of subsidiaries Ì (81) ÌOther provisions 247 233 42Charitable contributions (28) Ì ÌValuation allowance (187) (88) (26)Other 2 21 90
$1,349 $1,893 $1,013
Significant components of deferred tax assets (liabilities) are as follows:
December 31 2006 2005
Inventory $ 163 $ 223Employee benefits 915 881Capitalized items 915 1,033Tax basis differences on investments 110 (104)Depreciation tax basis differences on fixed assets 89 63Undistributed non-U.S. earnings (329) (229)Tax carryforwards 1,515 2,098Available for sale securities (23) (60)Business reorganization 38 14Long-term financing reserves 9 152Warranty and customer reserves 398 356Deferred revenue 224 101Valuation allowances (740) (896)Deferred charges 46 45Other (357) (146)
$2,973 $3,531
Gross deferred tax assets were $8.7 billion, $9.9 billion and $9.8 billion at December 31, 2006, 2005 and 2004,respectively. Deferred tax assets, net of valuation allowances, were $8.0 billion, $9.0 billion and $8.9 billion at

94
December 31, 2006, 2005 and 2004, respectively. Gross deferred tax liabilities were $5.0 billion, $5.5 billion and$5.0 billion at December 31, 2006, 2005 and 2004, respectively.
The Company had deferred tax assets for tax carryforwards totaling $1.5 billion and $2.1 billion atDecember 31, 2006 and 2005, respectively, of which $1.0 billion and $1.6 billion related to U.S. tax carryforwards.Details on the U.S. tax carryforwards at December 31, 2006 are shown in the table below.
Gross Tax ExpirationU.S. Tax Carryforwards Tax Loss Effected Period
U.S. tax losses $ 637 $ 223 2019-2024Foreign tax credits Ì 211 2013-2015General business credits Ì 385 2018-2026Minimum tax credits Ì 93 unlimitedCapital losses 13 5 2007State tax losses 1,675 72 2008-2023State tax credits Ì 33 2009-2024
Total U.S. tax carryforwards $2,325 $1,022
At December 31, 2006 the Company had valuation allowances totaling $218 million against its U.S. deferredtax assets. The valuation allowances relate primarily to tax carryforwards of acquired businesses which havelimitations upon their use and state tax carryforwards with short expiration periods. During 2006, the Companyrecorded a $34 million valuation allowance against deferred tax assets for certain investments that will generatefuture capital losses. The Company feels that the capital losses on these investments will likely expire unused. TheCompany believes that the remaining U.S. deferred tax assets are more likely than not to be realizable based onestimates of future taxable income and the implementation of tax planning strategies.
The Company's non-U.S. subsidiaries, primarily in Germany and the UK, had deferred tax assets from taxcarryforwards of $493 million and $530 million at December 31, 2006 and 2005, respectively. At December 31,2006, the Company had $433 million of deferred tax assets for tax carryforwards that can be carried forwardindefinitely, $22 million which will expire by 2009 and $38 million that will expire by 2020. The tax carryforwardsat December 31, 2006 are comprised of $1.3 billion of tax loss carryforwards, representing a $430 million deferredtax balance, and $63 million of tax credit carryforwards for a total deferred tax balance of $493 million. During2006, the Company realized tax benefits of $194 million relating to the reversal of valuation allowances for its non-U.S. subsidiaries, primarily in Germany and the UK, based on the likelihood that the Company would be able toutilize the tax carryforwards and deferred tax assets in the future. At December 31, 2006, the Company hasrecorded valuation allowances of $522 million against its non-U.S. subsidiaries deferred tax assets, of which$31 million of valuation allowance relates to a 2006 acquisition that if reversed would be offset by a reduction togoodwill. The Company believes that the remaining deferred tax assets of its non-U.S. subsidiaries are more likelythan not to be realizable based on estimates of future taxable income and the implementation of tax planningstrategies.
The Internal Revenue Service (""IRS'') is currently conducting its field examination of the Company's 2001through 2003 tax returns. In June 2006, in connection with this examination, the Company received notices ofproposed adjustments for the 2001 and 2002 taxable years relating to transfer pricing. These proposed adjustmentsare similar to those previously made by the IRS for the Company's 1996-2000 taxable years. The Company iscurrently protesting the 1996 through 2000 adjustments at the appellate level of the IRS. The Company disagreeswith all of these proposed transfer pricing-related adjustments and intends to vigorously dispute them throughapplicable IRS and judicial procedures, as appropriate. However, if the IRS were to ultimately prevail on thesematters, it could result in: (i) additional taxable income for the years 1996 through 2000 of approximately$1.4 billion, which could result in additional income tax liability for the Company of approximately $500 million,and (ii) additional taxable income for the years 2001 and 2002 of approximately $800 million, which could resultin additional income tax liability for the Company of approximately $300 million. Although the final resolution ofthese matters is uncertain, based on current information, in the opinion of the Company's management, theultimate disposition of these matters will not have a material adverse effect on the Company's consolidatedfinancial position, liquidity or results of operations. However, an unfavorable resolution could have a materialadverse effect on the Company's consolidated financial position, liquidity or results of operations in the periods inwhich the matter is ultimately resolved.

95
During the years ended December 31, 2006 and 2005, the Company reached favorable agreements with severalnon-U.S. taxing authorities that resulted in net income tax benefits of $44 million and $28 million, respectively. TheCompany has several other non-U.S. income tax audits pending and while the final resolution is uncertain, in theopinion of the Company's management the ultimate disposition of the audits will not have a material adverse effecton the Company's consolidated financial position, liquidity or results of operations.
7. Retirement Benefits
Pension Benefit Plans
The Company's noncontributory pension plan (the ""Regular Pension Plan'') covers U.S. employees whobecame eligible after one year of service. The benefit formula is dependent upon employee earnings and years ofservice. Effective January 1, 2005, newly-hired employees were not eligible to participate in the Regular PensionPlan. On February 20, 2007, the Company passed an amendment to the Regular Pension Plan which changes thedefinition of average earnings. Under the current formula, benefits are calculated using the highest annual earningsin any five years within the last ten calendar years. Beginning in January 2008, the benefit will be based on theaverage of the five highest years of earnings within the last ten calendar years prior to December 31, 2007 averagedwith future earnings. The Company also provides defined benefit plans to some of its foreign entities (the""Non-U.S. Plans'').
The Company also has a noncontributory supplemental retirement benefit plan (the ""Officers' Plan'') for itselected officers. The Officers' Plan contains provisions for funding the participants' expected retirement benefitswhen the participants meet the minimum age and years of service requirements. Elected officers who were not yetvested in the Officers' Plan as of December 31, 1999 had the option to remain in the Officers' Plan or elect to havetheir benefit bought out in restricted stock units. Effective December 31, 1999, newly elected officers are noteligible to participate in the Officers' Plan. Effective June 30, 2005, salaries were frozen for this plan.
The Company has an additional noncontributory supplemental retirement benefit plan, the MotorolaSupplemental Pension Plan (""MSPP''), which provides supplemental benefits in excess of the limitations imposedby the Internal Revenue Code on the Regular Pension Plan. Elected officers covered under the Officers' Plan orwho participated in the restricted stock buy-out are not eligible to participate in MSPP. Effective January 1, 2005,newly hired employees were not eligible to participate in the MSPP. Effective January 1, 2007, eligiblecompensation has been capped at the IRS limit plus $175,000 or, for those in excess of this cap at January 1, 2007,their current eligible compensation is frozen for calculation purposes.
As of December 31, 2006, the Company was required to apply SFAS No. 158, ""Employers' Accounting forDefined Benefit Pension and Other Postretirement Plans'' (""SFAS 158'') to recognize the funded status of itsdefined benefit plans on its consolidate balance sheet. SFAS 158 requires that the Company recognize, on aprospective basis, the funded status of its defined benefit pension and other postretirement plans on its consolidatedbalance sheet and recognize as a component of other comprehensive income, net of tax, the gains or losses andprior service costs or credits that have not been recognized as components of net periodic benefit cost. TheCompany is also required to disclose the incremental impact of the implementation of SFAS 158 versus continuingto record a minimum pension liability as previously required under SFAS No. 87, ""Employers' Accounting forPensions'' (""SFAS 87'').
The information below for Non-U.S. plans covers the Company's principal foreign plans; any other plans arenot material to the Company either individually or in the aggregate.

96
The net periodic pension cost for the Regular Pension Plan, Officers' Plan and MSPP and Non-U.S. plans wasas follows:
Regular Pension Plan
Years Ended December 31 2006 2005 2004
Service cost $ 150 $ 142 $ 168Interest cost 309 280 271Expected return on plan assets (329) (315) (286)Amortization of:
Unrecognized net loss 115 75 33Unrecognized prior service cost (5) (5) (7)
Settlement/curtailment gain Ì Ì (12)
Net periodic pension cost $ 240 $ 177 $ 167
Officers' Plan and MSPP
Years Ended December 31 2006 2005 2004
Service cost $ 5 $10 $14Interest cost 8 9 12Expected return on plan assets (4) (3) (3)Amortization of:
Unrecognized net loss 5 5 7Unrecognized prior service cost Ì 1 1
Settlement/curtailment loss 4 12 14
Net periodic pension cost $18 $34 $45
Non-U.S. Plans
Years Ended December 31 2006 2005 2004
Service cost $ 40 $ 44 $ 51Interest cost 67 67 66Expected return on plan assets (54) (52) (47)Amortization of:
Unrecognized net loss 17 14 24Unrecognized prior service cost Ì Ì 1
Settlement/curtailment loss Ì Ì 2
Net periodic pension cost $ 70 $ 73 $ 97

97
The status of the Company's plans is as follows:
2006 2005Officers' Officers'
and Non and NonRegular MSPP U.S. Regular MSPP U.S.
Change in benefit obligation:Benefit obligation at January 1 $5,175 $160 $1,520 $4,741 $185 $1,310Service cost 150 5 40 142 10 44Interest cost 309 8 67 280 9 67Plan amendments Ì Ì Ì 4 Ì ÌSettlement/curtailment Ì Ì Ì Ì (20) (3)Actuarial (gain)loss 76 (13) (10) 277 6 264Foreign exchange valuation adjustment Ì Ì 195 Ì Ì (148)Employee contributions Ì Ì 12 Ì Ì 11Tax payments Ì (3) Ì Ì (16) ÌBenefit payments (229) (20) (26) (269) (14) (25)
Benefit obligation at December 31 5,481 137 1,798 5,175 160 1,520
Change in plan assets:Fair value at January 1 3,736 92 896 3,483 87 772Return on plan assets 508 3 55 247 2 155Company contributions 270 6 122 275 33 62Employee contributions Ì Ì 12 Ì Ì 11Foreign exchange valuation adjustment Ì Ì 119 Ì Ì (83)Tax payments from plan assets Ì (3) Ì Ì (15) ÌBenefit payments from plan assets (229) (20) (26) (269) (15) (21)
Fair value at December 31 4,285 78 1,178 3,736 92 896
Funded status of the plan (1,196) (59) (620) (1,439) (68) (624)Unrecognized net loss 1,612 53 469 1,831 75 454Unrecognized prior service cost (25) (2) 4 (31) (3) 4
Prepaid (accrued) pension cost $ 391 $ (8) $ (147) $ 361 $ 4 $ (166)
Components of prepaid (accrued) pension cost:Intangible asset $ Ì $ Ì $ Ì $ Ì $ Ì $ 4Prepaid benefit cost Ì Ì 13 Ì Ì 18Current benefit liability Ì (3) (3) Ì Ì ÌNon-current benefit liability (1,196) (56) (630) (1,023) (58) (563)Deferred income taxes 587 19 2 526 24 2Non-owner changes to equity 1,000 32 471 858 38 373
Prepaid (accrued) pension cost $ 391 $ (8) $ (147) $ 361 $ 4 $ (166)
As required under SFAS 87, after-tax charges of $208 million and $188 million for the years endedDecember 31, 2005 and 2004, respectively, were recorded in Non-owner changes in equity to reflect the net changein the Company's additional minimum pension liability associated with these plans. With the adoption of SFAS 158,an after-tax charge of $234 million to Non-owner changes in equity was recorded to reflect the funded status ofthe Company's defined benefit plans on the consolidated balance sheet as of December 31, 2006. Had provisions ofSFAS 87 continued to apply, the Company would have increased equity by $206 million, net of tax. Accordingly,the incremental impact of adopting SFAS 158 on the defined benefit plans resulted in a decrease to equity of$440 million.

98
The incremental impact of applying SFAS 158 on individual line items in the Company's consolidated balancesheet as of December 31, 2006 for all defined benefit plans is as follows:
Before SFAS 158 Adjustment After SFAS 158
Prepaid benefit cost 20 (7) 13Intangible asset 4 (4) ÌCurrent liability Ì (6) (6)Non-current liability (1,267) (615) (1,882)Deferred income taxes 416 192 608Non-owner changes to equity 1,063 440 1,503
The total amount included in Non-owner changes to equity relating to defined benefit plans was $1.5 billion,net of taxes, as of December 31, 2006. It is estimated that pre-tax amounts of $110 million, $4 million, and$23 million will be amortized from this balance and will be reflected in the net periodic cost for the Regular Plan,Officers' and MSPP Plan, and Non-U.S. Plans, respectively, for 2007.
The Company uses a five-year, market-related asset value method of amortizing asset-related gains and losses.Prior service costs are being amortized over periods ranging from 11 to 12 years. The benefit obligation and planassets have been measured as of December 31, 2006 for all U.S. plans and as of October 1, 2006 for allNon-U.S. plans. Benefits under all pension plans are valued based upon the projected unit credit cost method.
Certain actuarial assumptions such as the discount rate and the long-term rate of return on plan assets have asignificant effect on the amounts reported for net periodic cost and benefit obligation. The assumed discount ratesreflect the prevailing market rates of a large universe of high-quality, non-callable, corporate bonds currentlyavailable that, if the obligation were settled at the measurement date, would provide the necessary future cash flowsto pay the benefit obligation when due. The long-term rates of return on plan assets represents an estimate of long-term returns on an investment portfolio consisting of a mixture of equities, fixed income, cash and otherinvestments similar to the actual investment mix. In determining the long-term return on plan assets, the Companyconsiders long-term rates of return on the asset classes (both historical and forecasted) in which the Companyexpects the plan funds to be invested.
Weighted average actuarial assumptions used to determine costs for the plans were as follows:
2006 2005December 31 U.S. Non U.S. U.S. Non U.S.
Discount rate for obligations 6.00% 4.62% 6.00% 5.46%Investment return assumption (Regular Plan) 8.50% 6.27% 8.50% 6.94%Investment return assumption (Officers' Plan) 6.00% N/A 6.00% N/A
Weighted average actuarial assumptions used to determine benefit obligations for the plans were as follows:
2006 2005December 31 U.S. Non U.S. U.S. Non U.S.
Discount rate for obligations 6.00% 4.81% 6.00% 4.60%Future compensation increase rate (Regular Plan) 4.00% 4.18% 4.00% 4.14%Future compensation increase rate (Officers' Plan) 0.00% N/A 0.00% N/A
The accumulated benefit obligations for the plans were as follows:
2006 2005Officers' Officers'
and Non and NonDecember 31 Regular MSPP U.S. Regular MSPP U.S.
Accumulated benefit obligation $4,969 $125 $1,690 $4,759 $149 $1,429
The Company has adopted a pension investment policy designed to meet or exceed the expected rate of returnon plan assets assumption. To achieve this, the pension plans retain professional investment managers that invest

99
plan assets in equity and fixed income securities and cash. In addition, some plans invest in insurance contracts. TheCompany has the following target mixes for these asset classes, which are readjusted at least quarterly, when anasset class weighting deviates from the target mix, with the goal of achieving the required return at a reasonable risklevel as follows:
Target MixAsset Category 2006 2005
Equity securities 75% 73%Fixed income securities 24% 25%Cash and other investments 1% 2%
The weighted-average pension plan asset allocation at December 31, 2006 and 2005 by asset categories was asfollows:
Actual MixAsset Category 2006 2005
Equity securities 75% 73%Fixed income securities 24 25Cash and other investments 1 2
100% 100%
Within the equity securities asset class, the investment policy provides for investments in a broad range ofpublicly-traded securities including both domestic and international stocks. Within the fixed income securities assetclass, the investment policy provides for investments in a broad range of publicly-traded debt securities rangingfrom U.S. Treasury issues, corporate debt securities, mortgage and asset-backed securities, as well as internationaldebt securities. In the cash and other investments asset class, investments may be in cash, cash equivalents orinsurance contracts.
The Company expects to make cash contributions of approximately $280 million to its U.S. pension plans andapproximately $120 million to its non-U.S. pension plans in 2007.
The following benefit payments, which reflect expected future service, as appropriate, are expected to be paid:
Officersand Non
Year Regular MSPP U.S.
2007 $ 186 $13 $272008 196 15 302009 206 14 332010 218 14 362011 233 25 402012-2016 1,473 45 267
Postretirement Health Care Benefit Plan
Certain health care benefits are available to eligible domestic employees meeting certain age and servicerequirements upon termination of employment (the ""Postretirement Health Care Benefits Plan''). For eligibleemployees hired prior to January 1, 2002, the Company offsets a portion of the postretirement medical costs to theretired participant. As of January 1, 2005, the Postretirement Health Care Benefit Plan has been closed to newparticipants. The benefit obligation and plan assets for the Postretirement Health Care Benefit Plan have beenmeasured as of December 31, 2006.
The assumptions used were as follows:
December 31 2006 2005
Discount rate for obligations 5.75% 5.75%Investment return assumptions 8.50% 8.50%

100
Net Postretirement Health Care Benefit Plan expenses were as follows:
Years Ended December 31 2006 2005 2004
Service cost $ 8 $ 9 $ 10Interest cost 25 30 46Expected return on plan assets (18) (19) (21)Amortization of:
Unrecognized net loss 9 10 14Unrecognized prior service cost (2) (3) (4)
Settlement/curtailment gain Ì Ì (6)
Net postretirement health care expense $ 22 $ 27 $ 39
The funded status of the plan is as follows.
2006 2005
Change in benefit obligation:Benefit obligation at January 1 $ 496 $ 544Service cost 8 9Interest cost 25 30Plan amendments Ì 1Actuarial (gain) loss (37) (36)Benefit payments (32) (52)
Benefit obligation at December 31 460 496
Change in plan assets:Fair value at January 1 212 188Return on plan assets 30 15Company contributions 27 43Benefit payments made with plan assets (26) (34)
Fair value at December 31 243 212
Funded status of the plan (217) (284)Unrecognized net loss 171 230Unrecognized prior service cost (9) (12)
Accrued postretirement health care cost $ (55) $ (66)
Consolidated balance sheet components of accrued health care cost as a result of SFAS 158:
Year Ended December 31 2006
Current liability $ (3)Non-current liability (214)Deferred income taxes 88Non-owner changes to equity 74
Accrued postretirement health care cost $ (55)
With the adoption of SFAS 158, an after-tax charge of $74 million was recorded in Non-owner changes toequity to reflect the funded status of the Company's Postretirement Health Care Benefit Plan on the consolidatedbalance sheet as of December 31, 2006. Under previous accounting rules, there would have been no balance sheet

101
adjustment to increase the liability as of year end. Accordingly, the incremental impact of adopting SFAS 158 onthe Postretirement Health Care Benefit Plan is $74 million.
The incremental impact of applying SFAS 158 on individual line items in the Company's consolidated balancesheet as of December 31, 2006 for the Postretirement Health Care Benefit Plan is as follows:
Before SFAS 158 Adjustment After SFAS 158
Current liability Ì (3) (3)Non-current liability (55) (159) (214)Deferred income taxes Ì 88 88Non-owner changes to equity Ì 74 74
The total amount included in Non-owner changes to equity relating to the Postretirement Health Care BenefitPlan is $74 million, net of taxes. It is estimated that a pre-tax amount of $6 million will be amortized from thisbalance and will be reflected in the net periodic cost for the Postretirement Health Care Benefit Plan in 2007.
In connection with the spin-off of Freescale Semiconductor, post-retirement health care benefit obligationsrelating to eligible former and active vested Freescale Semiconductor employees on December 2, 2004 (""Spin-offDate'') and active Freescale Semiconductor employees who vest within the three year period following the Spin-offDate were transferred to Freescale Semiconductor. Benefit obligations transferred were $217 million with$99 million of unrecognized net losses also transferred to Freescale Semiconductor. Such amounts have beenexcluded from the Motorola amounts for both periods presented above. Additionally under the terms of theEmployee Matters Agreement entered into between Motorola and Freescale Semiconductor, Motorola is obligatedto transfer to Freescale Semiconductor $68 million in cash or Plan assets plus approximately $17 million ofinvestment returns earned on these plan assets as of December 31, 2006, as permitted by law without adverse taxconsequences to Motorola. This obligation is included in Accrued liabilities in the Company's consolidated balancesheets.
The Company has adopted an investment policy for plan assets designed to meet or exceed the expected rateof return on plan assets assumption. To achieve this, the plan retains professional investment managers that investplan assets in equity and fixed income securities and cash. The Company has the following target mixes for theseasset classes, which are readjusted at least quarterly, when an asset class weighting deviates from the target mix,with the goal of achieving the required return at a reasonable risk level as follows:
Target MixAsset Category 2006 2005
Equity securities 75% 75%Fixed income securities 24% 24%Cash and other investments 1% 1%
The weighted-average asset allocation for plan assets at December 31, 2006 and 2005 by asset categories wereas follows:
Actual MixAsset Category 2006 2005
Equity securities 75% 75%Fixed income securities 22 22Cash and other investments 3 3
100% 100%
Within the equity securities asset class, the investment policy provides for investments in a broad range ofpublicly-traded securities including both domestic and international stocks. Within the fixed income securities assetclass, the investment policy provides for investments in a broad range of publicly-traded debt securities rangingfrom U.S. Treasury issues, corporate debt securities, mortgages and asset-backed issues, as well as international debtsecurities. In the cash asset class, investments may be in cash and cash equivalents.
Cash contributions of $27 million were made to the Postretirement Health Care Benefit Plan in 2006. TheCompany expects to make cash contributions of $24 million to the retiree health care plan in 2007.

102
The following benefit payments, which reflect expected future service, as appropriate, are expected to be paid:
Year
2007 $ 392008 372009 352010 342011 332012-2016 155
The health care trend rate used to determine the December 31, 2006 accumulated postretirement benefitobligation is 10% for 2007. Beyond 2006, the rate is assumed to decrease by 1% per year until it reaches 5% by2012 and then remains flat. The health care trend rate used to determine the December 31, 2005 accumulatedpostretirement benefit obligation was 10% for 2005 with the trend rate expected to grade down 1% per year untilreaching 5% by 2011 and then remaining flat. Changes in the industry's projected health care costs have caused thegraded trend rate assumption to be reset to 10% as of December 31, 2006.
Changing the health care trend rate by one percentage point would change the accumulated postretirementbenefit obligation and the net retiree health care expense as follows:
1% Point 1% PointIncrease Decrease
Effect on:Accumulated postretirement benefit obligation $21 $(22)Net retiree health care expense 2 (2)
The Company maintains a life time cap on postretirement health care costs, which reduces the liabilityduration of the plan. A result of this lower duration is a decreased sensitivity to a change in the discount rate trendassumption with respect to the liability and related expense.
The Company has no significant postretirement health care benefit plans outside the United States.
Defined Contribution Plan
The Company and certain subsidiaries have various defined contribution plans, in which all eligible employeesparticipate.
In the U.S., the 401(k) plan is a contributory plan. Matching contributions are based upon the amount of theemployees' contributions. Effective January 1, 2005, newly hired employees have a higher maximum matchingcontribution at 4% on the first 6% of employee contributions, compared to 3% for employees hired prior toJanuary 2005. The profit sharing contribution for the year ended December 31, 2004 was $69 million. Before 2005,profit sharing contributions were generally based upon pre-tax earnings, as defined, with an adjustment for theaggregate matching contribution. Effective January 1, 2005, the plan was amended to exclude the profit sharingcomponent.
The Company's expenses, primarily relating to the employer match, for all defined contribution plans, for theyears ended December 31, 2006, 2005 and 2004 were $105 million, $105 million and $126 million, respectively.
8. Share-Based Compensation Plans and Other Incentive Plans
Stock Options and Employee Stock Purchase Plan
The Company grants options to acquire shares of common stock to certain employees, non-employee directorsand to existing option holders in connection with the merging of option plans following an acquisition. Eachoption granted has an exercise price of 100% of the fair market value of the common stock on the date of thegrant. Most option awards have a contractual life of ten years and vest over four years. Upon the occurrence of achange in control, each stock option outstanding on the date on which the change in control occurs willimmediately become exercisable in full.
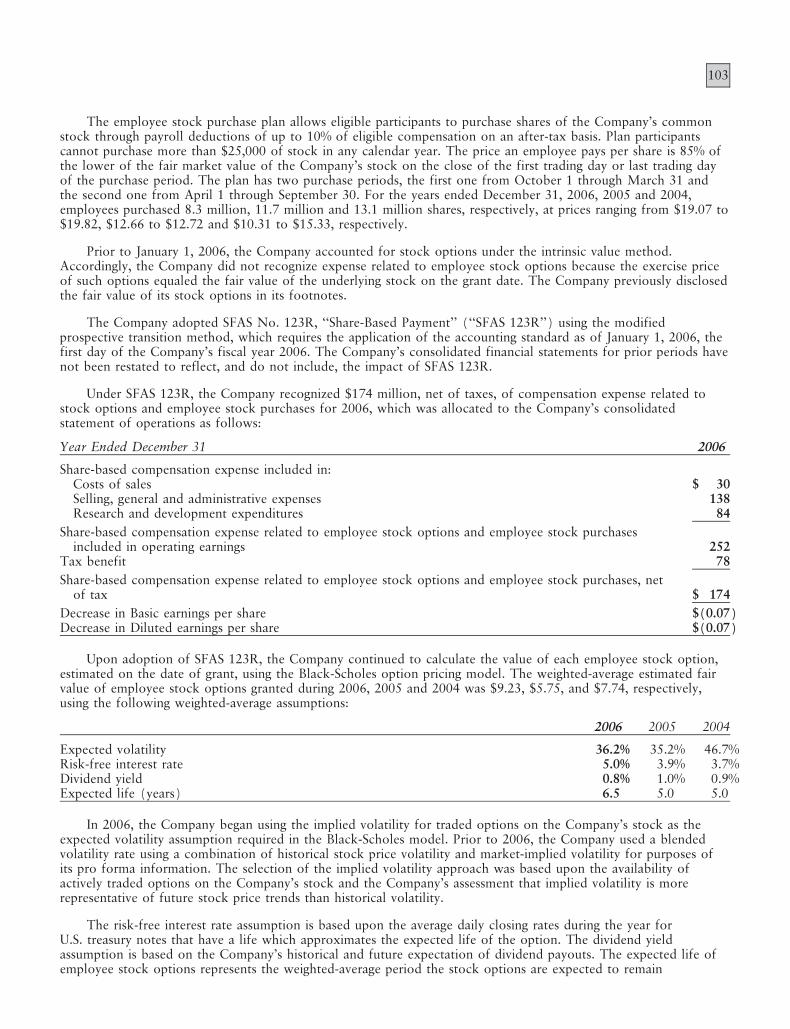
103
The employee stock purchase plan allows eligible participants to purchase shares of the Company's commonstock through payroll deductions of up to 10% of eligible compensation on an after-tax basis. Plan participantscannot purchase more than $25,000 of stock in any calendar year. The price an employee pays per share is 85% ofthe lower of the fair market value of the Company's stock on the close of the first trading day or last trading dayof the purchase period. The plan has two purchase periods, the first one from October 1 through March 31 andthe second one from April 1 through September 30. For the years ended December 31, 2006, 2005 and 2004,employees purchased 8.3 million, 11.7 million and 13.1 million shares, respectively, at prices ranging from $19.07 to$19.82, $12.66 to $12.72 and $10.31 to $15.33, respectively.
Prior to January 1, 2006, the Company accounted for stock options under the intrinsic value method.Accordingly, the Company did not recognize expense related to employee stock options because the exercise priceof such options equaled the fair value of the underlying stock on the grant date. The Company previously disclosedthe fair value of its stock options in its footnotes.
The Company adopted SFAS No. 123R, ""Share-Based Payment'' (""SFAS 123R'') using the modifiedprospective transition method, which requires the application of the accounting standard as of January 1, 2006, thefirst day of the Company's fiscal year 2006. The Company's consolidated financial statements for prior periods havenot been restated to reflect, and do not include, the impact of SFAS 123R.
Under SFAS 123R, the Company recognized $174 million, net of taxes, of compensation expense related tostock options and employee stock purchases for 2006, which was allocated to the Company's consolidatedstatement of operations as follows:
Year Ended December 31 2006
Share-based compensation expense included in:Costs of sales $ 30Selling, general and administrative expenses 138Research and development expenditures 84
Share-based compensation expense related to employee stock options and employee stock purchasesincluded in operating earnings 252
Tax benefit 78
Share-based compensation expense related to employee stock options and employee stock purchases, netof tax $ 174
Decrease in Basic earnings per share $(0.07)Decrease in Diluted earnings per share $(0.07)
Upon adoption of SFAS 123R, the Company continued to calculate the value of each employee stock option,estimated on the date of grant, using the Black-Scholes option pricing model. The weighted-average estimated fairvalue of employee stock options granted during 2006, 2005 and 2004 was $9.23, $5.75, and $7.74, respectively,using the following weighted-average assumptions:
2006 2005 2004
Expected volatility 36.2% 35.2% 46.7%Risk-free interest rate 5.0% 3.9% 3.7%Dividend yield 0.8% 1.0% 0.9%Expected life (years) 6.5 5.0 5.0
In 2006, the Company began using the implied volatility for traded options on the Company's stock as theexpected volatility assumption required in the Black-Scholes model. Prior to 2006, the Company used a blendedvolatility rate using a combination of historical stock price volatility and market-implied volatility for purposes ofits pro forma information. The selection of the implied volatility approach was based upon the availability ofactively traded options on the Company's stock and the Company's assessment that implied volatility is morerepresentative of future stock price trends than historical volatility.
The risk-free interest rate assumption is based upon the average daily closing rates during the year forU.S. treasury notes that have a life which approximates the expected life of the option. The dividend yieldassumption is based on the Company's historical and future expectation of dividend payouts. The expected life ofemployee stock options represents the weighted-average period the stock options are expected to remain

104
outstanding. In 2006, the Company began using an estimated forfeiture rate of 25% based on historical data. Thisestimated forfeiture rate may be revised in subsequent periods if actual forfeitures differ from this estimate. Prior to2006, the Company used the actual forfeiture method, which assumed that all options would vest and pro formaexpense was adjusted when options were forfeited prior to the vesting dates.
Stock options activity was as follows (in thousands, except exercise price and employee data):
2006 2005 2004Shares Wtd. Avg. Shares Wtd. Avg. Shares Wtd. Avg.
Subject to Exercise Subject to Exercise Subject to ExerciseYears Ended December 31 Options Price Options Price Options Price
Options outstanding at January 1 267,755 $17 335,757 $16 305,842 $17Options granted 37,202 21 40,675 16 58,429 18Adjustments to options outstanding
to reflect FreescaleSemiconductor spin-off Ì Ì Ì Ì 36,111 2
Options exercised (59,878) 13 (85,527) 12 (25,178) 13Options terminated, cancelled or
expired (11,634) 19 (23,150) 25 (39,447)* 15
Options outstanding atDecember 31 233,445 18 267,755 17 335,757 16
Options exercisable atDecember 31 135,052 19 149,329 19 195,297 17
Approx. number of employeesgranted options 28,900 25,300 33,900
* The 39,447 options terminated, cancelled or expired includes approximately 22,000 options that were unvestedand forfeited by employees of Freescale Semiconductor as of the spin-off.
At December 31, 2006, the Company had $408 million of total unrecognized compensation expense, net ofestimated forfeitures, related to stock option plans and the employee stock purchase plan that will be recognizedover the weighted average period of approximately two years. Cash received from stock option exercises and theemployee stock purchase plan was $918 million, $1.2 billion and $477 million for the years ended December 31,2006, 2005 and 2004, respectively. The total intrinsic value of options exercised during the years endedDecember 31, 2006, 2005 and 2004 was $568 million, $571 million and $70 million, respectively. The aggregateintrinsic value for options outstanding and exercisable as of December 31, 2006 was $1.2 billion and $768 million,respectively.
On December 2, 2004, in connection with the spin-off of the Company's remaining equity interest in FreescaleSemiconductor, certain adjustments were made to outstanding stock options. For vested and unvested options heldby Motorola employees and vested options held by Freescale Semiconductor employees, the number of underlyingshares and the exercise price of the options were adjusted to preserve the intrinsic value and the ratio of theexercise price to the fair market value of an underlying share that existed immediately prior to the distribution. Inaddition, the contractual life of the vested options held by Freescale Semiconductor employees was truncatedaccording to the terms of the original grant. Unvested options held by Freescale Semiconductor employees expiredaccording to the terms of the original grants. No other adjustments were made to the terms of the original optiongrants.
At December 31, 2006 and 2005, 110.9 million shares and 79.6 million shares, respectively, were available forfuture share-based award grants under the 2006 Motorola Omnibus Plan, covering all equity awards to employeesand non-employee directors.
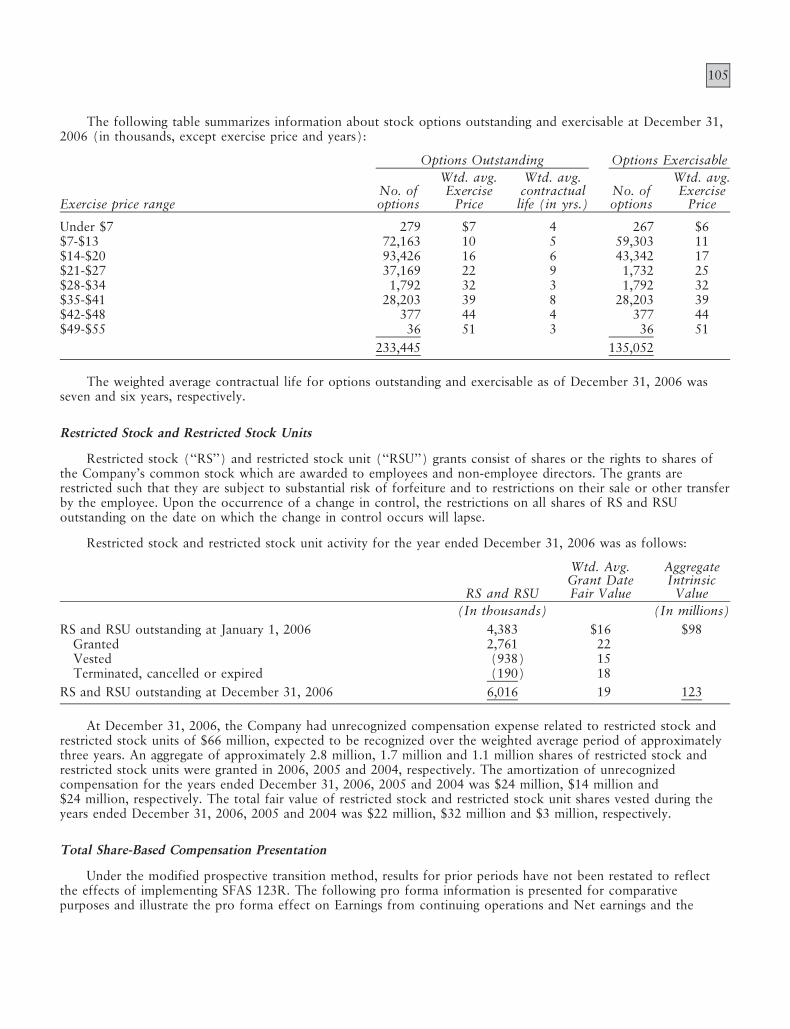
105
The following table summarizes information about stock options outstanding and exercisable at December 31,2006 (in thousands, except exercise price and years):
Options Outstanding Options ExercisableWtd. avg. Wtd. avg. Wtd. avg.
No. of Exercise contractual No. of ExerciseExercise price range options Price life (in yrs.) options Price
Under $7 279 $7 4 267 $6$7-$13 72,163 10 5 59,303 11$14-$20 93,426 16 6 43,342 17$21-$27 37,169 22 9 1,732 25$28-$34 1,792 32 3 1,792 32$35-$41 28,203 39 8 28,203 39$42-$48 377 44 4 377 44$49-$55 36 51 3 36 51
233,445 135,052
The weighted average contractual life for options outstanding and exercisable as of December 31, 2006 wasseven and six years, respectively.
Restricted Stock and Restricted Stock Units
Restricted stock (""RS'') and restricted stock unit (""RSU'') grants consist of shares or the rights to shares ofthe Company's common stock which are awarded to employees and non-employee directors. The grants arerestricted such that they are subject to substantial risk of forfeiture and to restrictions on their sale or other transferby the employee. Upon the occurrence of a change in control, the restrictions on all shares of RS and RSUoutstanding on the date on which the change in control occurs will lapse.
Restricted stock and restricted stock unit activity for the year ended December 31, 2006 was as follows:
Wtd. Avg. AggregateGrant Date Intrinsic
RS and RSU Fair Value Value(In thousands) (In millions)
RS and RSU outstanding at January 1, 2006 4,383 $16 $98Granted 2,761 22Vested (938) 15Terminated, cancelled or expired (190) 18
RS and RSU outstanding at December 31, 2006 6,016 19 123
At December 31, 2006, the Company had unrecognized compensation expense related to restricted stock andrestricted stock units of $66 million, expected to be recognized over the weighted average period of approximatelythree years. An aggregate of approximately 2.8 million, 1.7 million and 1.1 million shares of restricted stock andrestricted stock units were granted in 2006, 2005 and 2004, respectively. The amortization of unrecognizedcompensation for the years ended December 31, 2006, 2005 and 2004 was $24 million, $14 million and$24 million, respectively. The total fair value of restricted stock and restricted stock unit shares vested during theyears ended December 31, 2006, 2005 and 2004 was $22 million, $32 million and $3 million, respectively.
Total Share-Based Compensation Presentation
Under the modified prospective transition method, results for prior periods have not been restated to reflectthe effects of implementing SFAS 123R. The following pro forma information is presented for comparativepurposes and illustrate the pro forma effect on Earnings from continuing operations and Net earnings and the

106
respective earnings per share for each period presented as if the Company had applied the fair value recognitionprovisions to share-based employee compensation prior to 2006 (in millions, except per share amounts):
Continuing Operations Net EarningsYears Ended December 31 2006 2005 2004 2006 2005 2004
Earnings:Earnings, as reported $3,261 $4,519 $2,099 $3,661 $4,578 $1,532Add: Share-based employee compensation expense
included in reported earnings, net of related taxeffects n/a 9 15 n/a 9 19
Deduct: Share-based employee compensation expensedetermined under fair value-based method for allawards, net of related tax effects n/a (170) (150) n/a (170) (188)
Pro forma earnings $3,261 $4,358 $1,964 $3,661 $4,417 $1,363
Basic earnings per common share:As reported $ 1.33 $ 1.83 $ 0.89 $ 1.50 $ 1.85 $ 0.65Pro forma $ n/a $ 1.76 $ 0.83 $ n/a $ 1.79 $ 0.58
Diluted earnings per common share:As reported $ 1.30 $ 1.79 $ 0.87 $ 1.46 $ 1.81 $ 0.64Pro forma $ n/a $ 1.72 $ 0.81 $ n/a $ 1.75 $ 0.57
Prior to adopting SFAS 123R, the Company presented all tax benefits resulting from the exercise of stockoptions as operating cash flows in the statements of cash flows. As a result, $210 million and $51 million of excesstax benefits for 2005 and 2004, respectively, have been classified as an operating cash inflow. SFAS 123R requirescash flows resulting from excess tax benefits to be classified as a part of cash flows from financing activities. Excesstax benefits are realized tax benefits from tax deductions for exercised options in excess of the deferred tax assetattributable to stock compensation costs for such options. As a result of adopting SFAS 123R, $165 million ofexcess tax benefits for 2006 have been classified as a financing cash inflow.
Motorola Incentive Plan
The Motorola Incentive Plan provides eligible employees with an annual payment, calculated as a percentageof an employee's eligible earnings, in the year after the close of the current calendar year if specified business goalsare met. The provisions for awards under these incentive plans for the years ended December 31, 2006, 2005 and2004 were $268 million, $548 million and $771 million, respectively.
Mid-Range Incentive Plan
The Mid-Range Incentive Plan (""MRIP'') rewarded participating elected officers for the Company'sachievement of outstanding performance during the period, based on two performance objectives measured overtwo-year cycles. The provision for MRIP for the years ended December 31, 2005 and 2004 was $19 million and$56 million, respectively.
Long-Range Incentive Plan
In 2005, a Long-Range Incentive Plan (""LRIP'') was introduced to replace MRIP. LRIP rewards participatingelected officers for the Company's achievement of outstanding performance during the period, based on twoperformance objectives measured over three-year cycles. The provision for LRIP for the years ended December 31,2006 and 2005 was $16 million and $15 million, respectively.

107
9. Financing Arrangements
Finance receivables consist of the following:
December 31 2006 2005
Gross finance receivables $ 279 $ 272Less allowance for losses (10) (12)
269 260Less current portion (124) (178)
Long-term finance receivables $ 145 $ 82
Current finance receivables are included in Accounts receivable and long-term finance receivables are includedin Other assets in the Company's consolidated balance sheets. Interest income recognized on finance receivables forthe years ended December 31, 2006, 2005 and 2004 was $9 million, $7 million and $9 million, respectively.Impaired finance receivables totaled $1 million and $10 million at December 31, 2006 and 2005, respectively, with$1 million and $10 million allowance for losses at December 31, 2006 and 2005, respectively. Interest income onimpaired finance receivables is recognized as cash is collected and totaled less than $1 million for the year endedDecember 31, 2006 and 2005 and $2 million for the year ended December 31, 2004.
On October 28, 2005, the Company entered into an agreement to resolve disputes regarding Telsim MobilTelekomunikasyon Hizmetleri A.S. (""Telsim'') with Telsim and the government of Turkey. The government ofTurkey and the Turkish Savings and Deposit Insurance Fund (""TMSF'') are third-party beneficiaries of thesettlement agreement. In settlement of its claims, the Company received $410 million in cash in 2006 and$500 million in cash in 2005. The Company is permitted to, and will continue to, enforce its U.S. court judgmentagainst the Uzan family, except in Turkey and three other countries.
From time to time, the Company sells short-term receivables, long-term loans and lease receivables under sales-type leases (collectively, ""finance receivables'') to third parties in transactions that qualify as ""true-sales.'' Certainof these finance receivables are sold to third parties on a one-time, non-recourse basis, while others are sold tothird parties under committed facilities that involve contractual commitments from these parties to purchasequalifying receivables up to an outstanding monetary limit. Committed facilities may be revolving in nature. Certainsales may be made through separate legal entities that are also consolidated by the Company. The Company may ormay not retain the obligation to service the sold finance receivables.
In the aggregate, at December 31, 2006, these committed facilities provided for up to $1.3 billion to beoutstanding with the third parties at any time, as compared to up to $1.1 billion provided at December 31, 2005and up to $724 million provided at December 31, 2004. As of December 31, 2006, $817 million of thesecommitted facilities were utilized, compared to $585 million utilized at December 31, 2005 and $305 millionutilized at December 31, 2004. Certain events could cause one of these facilities to terminate. In addition, beforereceivables can be sold under certain of the committed facilities, they may need to meet contractual requirements,such as credit quality or insurability.
Total finance receivables sold by the Company were $6.4 billion in 2006 (including $6.2 billion of short-termreceivables), compared to $4.5 billion sold in 2005 (including $4.2 billion of short-term receivables) and$3.8 billion sold in 2004 (including $3.8 billion of short-term receivables). As of December 31, 2006, there were$1.1 billion of receivables outstanding under these programs for which the Company retained servicing obligations(including $789 million of short-term receivables), compared to $1.0 billion outstanding at December 31, 2005(including $838 million of short-term receivables) and $720 million outstanding at December 31, 2004 (including$589 of short-term receivables).
Under certain of the receivables programs, the value of the receivables sold is covered by credit insuranceobtained from independent insurance companies, less deductibles or self-insurance requirements under the policies(with the Company retaining credit exposure for the remaining portion). The Company's total credit exposure tooutstanding short-term receivables that have been sold was $19 million at December 31, 2006 as compared to$66 million at December 31, 2005. A reserve of $4 million was recorded for potential losses on sold receivables atboth December 31, 2006 and December 31, 2005.
Certain purchasers of the Company's infrastructure equipment continue to request that suppliers providefinancing in connection with equipment purchases. These requests may include all or a portion of the purchase

108
price of the equipment. Periodically, the Company makes commitments to provide financing to purchasers inconnection with the sale of equipment. However, the Company's obligation to provide financing is oftenconditioned on the issuance of a letter of credit in favor of the Company by a reputable bank to support thepurchaser's credit or a pre-existing commitment from a reputable bank to purchase the receivable from theCompany. The Company had outstanding commitments to extend credit to third-parties totaling $398 million atDecember 31, 2006, compared to $689 million at December 31, 2005. Of these amounts, $262 million wassupported by letters of credit or by bank commitments to purchase receivables at December 31, 2006, compared to$594 million at December 31, 2005.
In addition to providing direct financing to certain equipment customers, the Company also assists customers inobtaining financing directly from banks and other sources to fund equipment purchases. The Company hadcommitted to provide financial guarantees relating to customer financing totaling $122 million and $140 million atDecember 31, 2006 and December 31, 2005, respectively (including $19 million and $66 million, respectively,relating to the sale of short-term receivables). Customer financing guarantees outstanding were $47 million and$79 million at December 31, 2006 and 2005, respectively (including $2 million and $42 million, respectively,relating to the sale of short-term receivables).
10. Commitments and Contingencies
Leases
The Company owns most of its major facilities, but does lease certain office, factory and warehouse space,land, and information technology and other equipment under principally non-cancelable operating leases. Rentalexpense, net of sublease income for the years ended December 31, 2006, 2005 and 2004 was $241 million,$250 million and $205 million, respectively. At December 31, 2006, future minimum lease obligations, net ofminimum sublease rentals, for the next five years and beyond are as follows: 2007 Ì $351 million; 2008 Ì$281 million; 2009 Ì $209 million; 2010 Ì $178 million; 2011 Ì $158 million; beyond Ì $1.2 billion.
Legal
Iridium Program: The Company has been named as one of several defendants in putative class actionsecurities lawsuits arising out of alleged misrepresentations or omissions regarding the Iridium satellitecommunications business, which on March 15, 2001, were consolidated in the federal district court in the Districtof Columbia under Freeland v. Iridium World Communications, Inc., et al., originally filed on April 22, 1999.Plaintiffs motion for class certification was granted on January 9, 2006 and the trial is scheduled to begin onMay 22, 2008.
The Company was sued by the Official Committee of the Unsecured Creditors of Iridium in the BankruptcyCourt for the Southern District of New York on July 19, 2001. In re Iridium Operating LLC, et al. v. Motorolaasserts claims for breach of contract, warranty, fiduciary duty and fraudulent transfer and preferences, and seeks inexcess of $4 billion in damages. Trial began on the solvency portion of these claims on October 23, 2006.
The Company has not reserved for any potential liability that may arise as a result of the litigation describedabove related to the Iridium program. While the still pending cases are in various stages and the outcomes are notpredictable, an unfavorable outcome of one or more of these cases could have a material adverse effect on theCompany's consolidated financial position, liquidity or results of operations.
Other: The Company is a defendant in various other suits, claims and investigations that arise in the normalcourse of business. In the opinion of management, and other than as discussed above with respect to the Iridiumcases, the ultimate disposition of these matters will not have a material adverse effect on the Company'sconsolidated financial position, liquidity or results of operations.
Other
The Company is also a party to a variety of agreements pursuant to which it is obligated to indemnify theother party with respect to certain matters. Some of these obligations arise as a result of divestitures of theCompany's assets or businesses and require the Company to hold the other party harmless against losses arisingfrom the settlement of these pending obligations. The total amount of indemnification under these types ofprovisions at December 31, 2006 and 2005 was $169 million and $28 million, respectively, with the Company
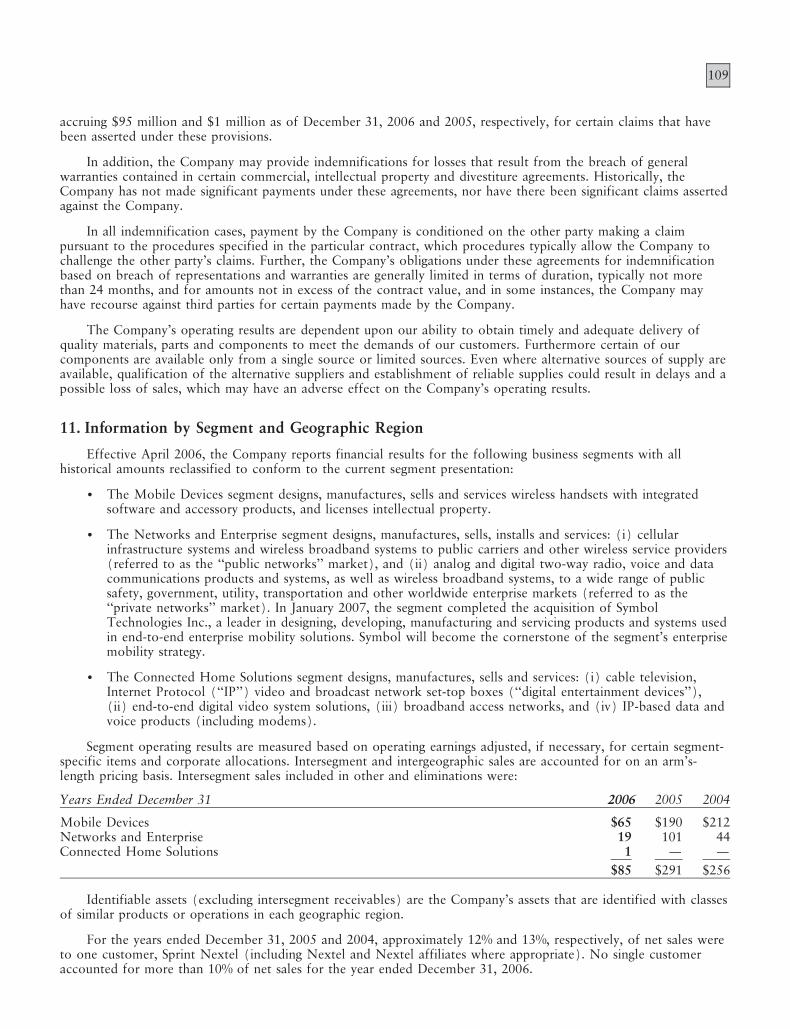
109
accruing $95 million and $1 million as of December 31, 2006 and 2005, respectively, for certain claims that havebeen asserted under these provisions.
In addition, the Company may provide indemnifications for losses that result from the breach of generalwarranties contained in certain commercial, intellectual property and divestiture agreements. Historically, theCompany has not made significant payments under these agreements, nor have there been significant claims assertedagainst the Company.
In all indemnification cases, payment by the Company is conditioned on the other party making a claimpursuant to the procedures specified in the particular contract, which procedures typically allow the Company tochallenge the other party's claims. Further, the Company's obligations under these agreements for indemnificationbased on breach of representations and warranties are generally limited in terms of duration, typically not morethan 24 months, and for amounts not in excess of the contract value, and in some instances, the Company mayhave recourse against third parties for certain payments made by the Company.
The Company's operating results are dependent upon our ability to obtain timely and adequate delivery ofquality materials, parts and components to meet the demands of our customers. Furthermore certain of ourcomponents are available only from a single source or limited sources. Even where alternative sources of supply areavailable, qualification of the alternative suppliers and establishment of reliable supplies could result in delays and apossible loss of sales, which may have an adverse effect on the Company's operating results.
11. Information by Segment and Geographic Region
Effective April 2006, the Company reports financial results for the following business segments with allhistorical amounts reclassified to conform to the current segment presentation:
‚ The Mobile Devices segment designs, manufactures, sells and services wireless handsets with integratedsoftware and accessory products, and licenses intellectual property.
‚ The Networks and Enterprise segment designs, manufactures, sells, installs and services: (i) cellularinfrastructure systems and wireless broadband systems to public carriers and other wireless service providers(referred to as the ""public networks'' market), and (ii) analog and digital two-way radio, voice and datacommunications products and systems, as well as wireless broadband systems, to a wide range of publicsafety, government, utility, transportation and other worldwide enterprise markets (referred to as the""private networks'' market). In January 2007, the segment completed the acquisition of SymbolTechnologies Inc., a leader in designing, developing, manufacturing and servicing products and systems usedin end-to-end enterprise mobility solutions. Symbol will become the cornerstone of the segment's enterprisemobility strategy.
‚ The Connected Home Solutions segment designs, manufactures, sells and services: (i) cable television,Internet Protocol (""IP'') video and broadcast network set-top boxes (""digital entertainment devices''),(ii) end-to-end digital video system solutions, (iii) broadband access networks, and (iv) IP-based data andvoice products (including modems).
Segment operating results are measured based on operating earnings adjusted, if necessary, for certain segment-specific items and corporate allocations. Intersegment and intergeographic sales are accounted for on an arm's-length pricing basis. Intersegment sales included in other and eliminations were:
Years Ended December 31 2006 2005 2004
Mobile Devices $65 $190 $212Networks and Enterprise 19 101 44Connected Home Solutions 1 Ì Ì
$85 $291 $256
Identifiable assets (excluding intersegment receivables) are the Company's assets that are identified with classesof similar products or operations in each geographic region.
For the years ended December 31, 2005 and 2004, approximately 12% and 13%, respectively, of net sales wereto one customer, Sprint Nextel (including Nextel and Nextel affiliates where appropriate). No single customeraccounted for more than 10% of net sales for the year ended December 31, 2006.

110
Segment information
Operating EarningsNet Sales (Loss)
Years Ended December 31 2006 2005 2004 2006 2005 2004
Mobile Devices $28,383 $21,459 $17,108 $2,690 $2,192 $1,728Networks and Enterprise 11,245 11,202 10,465 1,521 1,939 1,550Connected Home Solutions 3,327 2,871 2,335 224 153 154
42,955 35,532 29,908 4,435 4,284 3,432Other and Eliminations (76) (270) (245) (343) 321 (440)
$42,879 $35,262 $29,663
Operating earnings 4,092 4,605 2,992Total other income 518 1,807 120
Earnings from continuing operations before incometaxes $4,610 $6,412 $3,112
Effective the fourth quarter 2006, the Company reflects costs associated with the amortization of intangibleassets and in-process research and development (""IPR&D'') at the corporate level rather than at the businesssegment level. Accordingly, these costs have been reclassified for all periods presented from the correspondingbusiness segment to Others and Eliminations to conform to the current period presentation.
Other as presented in Other and Eliminations above consists primarily of (i) general corporate relatedexpenses, including stock option and employee stock purchase plan expenses, (ii) various corporate programsrepresenting developmental businesses and research and development projects, which are not included in any majorsegment, and (iii) the Company's wholly-owned finance subsidiary. Beginning in 2006, certain general corporateexpenses, which had previously been allocated to the business segments, are included in the operating expenses ofOther. These expenses, which were approximately $98 million for the year ended December 31, 2006, are no longerallocated to the operating segments, primarily include: (i) corporate general and administrative expenses, includingstrategy, legal, human resources, finance and CEO and CFO functional staff expenses, (ii) corporate marketingexpenses, and (iii) research and development projects.
In 2006, the Company also recorded income of $418 million for a payment relating to the Telsim settlement,partially offset by expenses of $88 million representing a charitable contribution to the Motorola Foundation ofappreciated equity holdings in a third party both of which are presented in Other and Eliminations.
DepreciationAssets Capital Expenditures Expense
Years Ended December 31 2006 2005 2004 2006 2005 2004 2006 2005 2004
Mobile Devices $ 9,316 $ 7,551 $ 5,443 $164 $126 $ 92 $133 $127 $136Networks and Enterprise 6,812 5,893 5,276 320 271 249 215 227 232Connected Home Solutions 3,202 2,442 2,346 19 28 27 42 51 59
19,330 15,886 13,065 503 425 368 390 405 427Other and Eliminations 19,263 19,281 17,083 146 123 37 73 68 75
38,593 35,167 30,148 $649 $548 $405 $463 $473 $502Discontinued Operations Ì 635 774
$38,593 $35,802 $30,922
Assets in Other include primarily cash and cash equivalents, Sigma Funds, deferred income taxes, marketablesecurities, property, plant and equipment, investments, and the administrative headquarters of the Company.

111
Geographic area information
Property, Plant, andNet Sales* Assets** Equipment
Years Ended December 31 2006 2005 2004 2006 2005 2004 2006 2005 2004
United States $18,808 $16,701 $14,244 $24,212 $23,635 $18,932 $1,089 $1,010 $1,061China 4,664 2,908 2,928 4,649 3,843 3,532 278 189 209United Kingdom 1,306 1,532 1,452 1,773 1,962 966 134 127 132Germany 874 882 700 1,195 990 968 131 118 138Israel 659 534 502 1,195 1,372 1,217 156 134 125Singapore 176 156 163 3,713 2,993 3,388 39 35 32Other nations 16,392 12,549 9,674 6,051 4,330 5,193 498 457 388Adjustments and
Eliminations Ì Ì Ì (4,195) (3,958) (4,048) (58) (50) (28)
$42,879 $35,262 $29,663 $38,593 $35,167 $30,148 $2,267 $2,020 $2,057
* Net sales by geographic region are measured by the locale of end customer.
** Excludes assets held for sale relating to discontinued operations of $635 million and $774 million atDecember 31, 2005 and 2004, respectively.
12. Shareholder Rights Plan
Effective August 1, 2006 (the ""Termination Date''), the Company terminated its shareholder rights plan. Theshareholder rights plan was scheduled to expire in November 2008. On the Termination Date, in connection withthe termination of the shareholder rights plan, the Company made the filings necessary to eliminate all references tothe Company's Junior Participating Preferred Stock, Series B (""Series B'') from its Restated Certificate ofIncorporation. Accordingly, no authorized Series B shares are reflected in the Company's consolidated balance sheetas of December 31, 2006. No Series B shares were or have been issued.
13. Reorganization of Businesses
The Company maintains a formal Involuntary Severance Plan (the ""Severance Plan'') which permits theCompany to offer eligible employees severance benefits based on years of service and employment grade level inthe event that employment is involuntarily terminated as a result of a reduction-in-force or restructuring. Eachseparate reduction-in-force has qualified for severance benefits under the Severance Plan and, therefore, suchbenefits are accounted for in accordance with SFAS No. 112, ""Accounting for Postemployment Benefits''(""SFAS 112''). Under the provisions of SFAS 112, the Company recognizes termination benefits based on formulasper the Severance Plan at the point in time that future settlement is probable and can be reasonably estimatedbased on estimates prepared at the time a restructuring plan is approved by management. Exit costs primarilyconsist of future minimum lease payments on vacated facilities. At each reporting date, the Company evaluates itsaccruals for exit costs and employee separation costs to ensure the accruals are still appropriate. In certaincircumstances, accruals are no longer required because of efficiencies in carrying out the plans or becauseemployees previously identified for separation resigned from the Company and did not receive severance or wereredeployed due to circumstances not foreseen when the original plans were initiated. The Company reversesaccruals through the income statement line item where the original charges were recorded when it is determinedthey are no longer required.
2006 Charges
During the year ended December 31, 2006, the Company committed to implement various productivityimprovement plans aimed principally at: (i) reducing costs in its supply-chain activities, (ii) integrating the formerNetworks segment and Government and Enterprise Mobility Solutions segment into one organization, theNetworks and Enterprise segment, and (iii) reducing other operating expenses, primarily relating to engineering anddevelopment costs. The Company recorded net reorganization of business charges of $213 million, including$41 million of charges in Costs of sales and $172 million of charges under Other charges in the Company'sconsolidated statement of operations. Included in the aggregate $213 million are charges of $191 million foremployee separation costs, $15 million for fixed asset impairment charges and $30 million for exit costs, partially

112
offset by $23 million of reversals for accruals no longer needed. Total employees impacted by the actionscommitted to in 2006 are 3,900.
The following table displays the net reorganization of business charges by segment:
Year Ended December 31, 2006
Mobile Devices $ (1)Networks and Enterprise 157Connected Home Solutions 50
206General Corporate 7
$213
The following table displays a rollforward of the reorganization of business accruals established for exit costsand employee separation costs from January 1, 2006 to December 31, 2006:
Accruals at 2006 2006 Accruals atJanuary 1, Additional 2006(1) Amount December 31,
2006 Charges Adjustments Used 2006
Exit costs Ì lease terminations $ 50 $ 30 $ (7) $ (19) $ 54Employee separation costs 53 191 (16) (124) 104
$103 $221 $(23) $(143) $158
(1) Includes translation adjustments.
Exit Costs Ì Lease Terminations
At January 1, 2006, the Company had an accrual of $50 million for exit costs attributable to leaseterminations. The 2006 additional charges of $30 million were primarily related to a lease cancellation by theNetworks and Enterprise segment. The 2006 adjustments of $7 million represent reversals of accruals no longerneeded. The $19 million used in 2006 reflects cash payments to lessors. The remaining accrual of $54 million,which is included in Accrued liabilities in the Company's consolidated balance sheet at December 31, 2006,represents future cash payments for lease termination obligations.
Employee Separation Costs
At January 1, 2006, the Company had an accrual of $53 million for employee separation costs, representing theseverance costs for approximately 1,600 employees, of which 1,100 were direct employees and 500 were indirectemployees. The 2006 additional charges of $191 million represent costs for an additional 3,900 employees, ofwhich 1,700 were direct employees and 2,200 were indirect employees. The adjustments of $16 million representreversals of accruals no longer needed.
During 2006, approximately 3,200 employees, of which 1,400 were direct employees and 1,800 were indirectemployees, were separated from the Company. The $124 million used in 2006 reflects cash payments to theseseparated employees. The remaining accrual of $104 million, which is included in Accrued liabilities in theCompany's consolidated balance sheet at December 31, 2006, is expected to be paid to approximately 2,300employees to be separated in 2007.
2005 Charges
During the year ended December 31, 2005, the Company recorded net reorganization of business charges of$91 million, including $37 million of charges in Costs of sales and $54 million of charges under Other charges inthe Company's consolidated statement of operations. Included in the aggregate $91 million are charges of$86 million for employee separation costs and $15 million for fixed asset impairment charges and $5 million forexit costs, partially offset by $15 million of reversals for accruals no longer needed. Total employees impacted bythese action were approximately 2,600.

113
The following table displays the net reorganization of business charges by segment:
Year Ended December 31, 2005
Mobile Devices $27Networks and Enterprise 52Connected Home Solutions 4
83General Corporate 8
$91
The following table displays a rollforward of the reorganization of business accruals established for exit costsand employee separation costs from January 1, 2005 to December 31, 2005:
Accruals at 2005 2005 Accruals atJanuary 1, Additional 2005(1) Amount December 31,
2005 Charges Adjustments Used 2005
Exit costs Ì lease terminations $ 73 $ 5 $ (7) $(21) $ 50Employee separation costs 41 86 (14) (60) 53
$114 $91 $(21) $(81) $103
(1) Includes translation adjustments.
Exit Costs Ì Lease Terminations
At January 1, 2005, the Company had an accrual of $73 million for exit costs attributable to leaseterminations. The 2005 additional charges of $5 million were primarily related to a lease cancellation by theNetworks and Enterprise segment. The 2005 adjustments of $7 million represented reversals of $1 million foraccruals no longer needed and $6 million of translation adjustments. The $21 million used in 2005 reflected cashpayments to lessors. The remaining accrual of $50 million, which was included in Accrued liabilities in theCompany's consolidated balance sheet at December 31, 2005, represents future cash payments for lease terminationobligations.
Employee Separation Costs
At January 1, 2005, the Company had an accrual of $41 million for employee separation costs, representing theseverance costs for approximately 400 employees, of which 50 were direct employees and 350 were indirectemployees. The 2005 additional charges of $86 million represented the severance costs for approximately 2,600employees, of which 1,300 were direct employees and 1,300 were indirect employees. The adjustments of$14 million represented reversals of accruals no longer needed.
During 2005, approximately 1,400 employees, of which 300 were direct employees and 1,100 were indirectemployees, were separated from the Company. The $60 million used in 2005 reflected cash payments to theseseparated employees. The remaining accrual of $53 million was included in Accrued liabilities in the Company'sconsolidated balance sheet at December 31, 2005.
2004 Charges
During the year ended December 31, 2004, the Company recorded net reorganization of business reversals of$15 million, including $4 million of reversals in Costs of sales and $11 million of reversals under Other charges inthe Company's consolidated statement of operations. Included in the aggregate $15 million are charges of$54 million for employee separation costs, partially offset by $63 million of reversals for accruals no longer neededand $6 million for fixed asset adjustment income. Total employees impacted by these actions were approximately800.

114
The following table displays the net reorganization of business charges by segment:
Year Ended December 31, 2004
Mobile Devices $(28)Networks and Enterprise 2Connected Home Solutions (4)
(30)General Corporate 15
$(15)
The following table displays a rollforward of the reorganization of business accruals established for exit costsand employee separation costs from January 1, 2004 to December 31, 2004:
Accrualsat 2004 2004 Accruals at
January 1, Additional 2004(1) Amount December 31,2004 Charges Adjustments Used 2004
Exit costs Ì lease terminations $122 $Ì $(18) $ (31) $ 73Employee separation costs 116 54 (34) (95) 41
$238 $54 $(52) $(126) $114
(1) Includes translation adjustments.
Exit Costs Ì Lease Terminations
At January 1, 2004, the Company had an accrual of $122 million for exit costs attributable to leaseterminations. The 2004 adjustments of $18 million represented reversals of $29 million for accruals no longerneeded, partially offset by an $11 million translation adjustment. The $31 million used in 2004 reflected cashpayments to lessors. The remaining accrual of $73 million, which was included in Accrued liabilities in theCompany's consolidated balance sheet at December 31, 2004, represents future cash payments for lease terminationobligations.
Employee Separation Costs
At January 1, 2004, the Company had an accrual of $116 million for employee separation costs, representingthe severance costs for approximately 2,100 employees, of which 1,000 were direct employees and 1,100 wereindirect employees. The 2004 additional charges of $54 million represented the severance costs for approximately800 employees, of which 100 were direct employees and 700 were indirect employees. The adjustments of$34 million represented reversals of accruals no longer needed.
During 2004, approximately 2,500 employees, of which 1,000 were direct employees and 1,500 were indirectemployees, were separated from the Company. The $95 million used in 2004 reflected cash payments to theseseparated employees. The remaining accrual of $41 million was included in Accrued liabilities in the Company'sconsolidated balance sheet at December 31, 2004.
14. Acquisitions and Related Intangibles
The Company accounts for acquisitions using purchase accounting with the results of operations for eachacquiree included in the Company's consolidated financial statements for the period subsequent to the date ofacquisition. The pro forma effects of these acquisitions on the Company's consolidated financial statements werenot significant individually nor in the aggregate.
The allocation of value to in-process research and development was determined using expected future cashflows discounted at average risk adjusted rates reflecting both technological and market risk as well as the timevalue of money. Historical pricing, margins and expense levels, where applicable, were used in the valuation of thein-process products. The in-process research and development acquired will have no alternative future uses if theproducts are not feasible.

115
The developmental products for the companies acquired have varying degrees of timing, technology, costs-to-complete and market risks throughout final development. If the products fail to become viable, the Company willunlikely be able to realize any value from the sale of incomplete technology to another party or through internalre-use. The risks of market acceptance for the products under development and potential reductions in projectedsales volumes and related profits in the event of delayed market availability for any of the products exist. Efforts tocomplete all developmental products continue and there are no known delays to forecasted plans.
The following is a summary of significant acquisitions in 2006, 2005 and 2004:
In-ProcessResearch and
Quarter DevelopmentAcquired Consideration Form of Consideration Charge
2006 AcquisitionsBroadbus Technologies, Inc. Q3 $181 Cash $12TTP Communications plc Q3 $193 Cash $17Kreatel Communications AB Q1 $108 Cash $ 1
2005 AcquisitionsNo significant acquisitions Ì Ì Ì Ì
2004 AcquisitionsMeshNetworks, Inc. Q4 $169 Cash $16Force Computers Q3 $121 Cash $ 2
The following table summarizes net tangible and intangible assets acquired and the consideration provided forthe acquisitions identified above:
Years Ended December 31 2006 2005 2004
Tangible net assets $ 20 $Ì $ 39Goodwill 262 Ì 178Other intangibles 170 Ì 55In-process research and development 30 Ì 18
$ 482 $Ì $ 290
Consideration:Cash $ 482 $Ì $ 290Stock Ì Ì Ì
$ 482 $Ì $ 290
Broadbus Technologies, Inc.
In September 2006, the Company acquired Broadbus Technologies, Inc. (""Broadbus''), a leading provider ofcontent on-demand technologies, for $181 million in cash. The Company recorded $131 million in goodwill, noneof which is expected to be deductible for tax purposes, a $12 million charge for acquired in-process research anddevelopment costs, and $30 million in identifiable intangible assets. The acquired in-process research anddevelopment will have no alternative future uses if the products are not feasible. At the date of the acquisition, oneproject was in process. This project is expected to be completed in 2008. The average risk adjusted rate used tovalue this project was 22%. The allocation of value to in-process research and development was determined usingexpected future cash flows discounted at average risk adjusted rates reflecting both technological and market risk aswell as the time value of money. These research and development costs were expensed at the date of acquisition.Goodwill and intangible assets are included in Other assets in the Company's consolidated balance sheets. Theintangible assets are being amortized over periods ranging from 3 to 5 years on a straight-line basis.
The results of operations of Broadbus have been included in the Connected Home Solutions segment in theCompany's consolidated financial statements subsequent to the date of acquisition. The pro forma effects of thisacquisition on the Company's consolidated financial statements were not significant.

116
TTP Communications plc
In August 2006, the Company acquired TTP Communications plc (""TTPCom''), a leader in wireless softwareplatforms, protocol stacks and semiconductor solutions, for $193 million in cash. The Company recorded$52 million in goodwill, a portion of which is expected to be deductible for tax purposes, a $17 million charge foracquired in-process research and development costs, and $118 million in identifiable intangible assets. The acquiredin-process research and development will have no alternative future uses if the products are not feasible. At thedate of the acquisition, a total of four projects were in process. These projects are expected to be completed in2008. The average risk adjusted rate used to value these projects was 18%. The allocation of value to in-processresearch and development was determined using expected future cash flows discounted at average risk adjustedrates reflecting both technological and market risk as well as the time value of money. These research anddevelopment costs were expensed at the date of acquisition. Goodwill and intangible assets are included in Otherassets in the Company's consolidated balance sheets. The intangible assets are being amortized over periods rangingfrom 18 months to 5 years on a straight-line basis.
The results of operations of TTPCom have been included in the Mobile Devices segment in the Company'sconsolidated financial statements subsequent to the date of acquisition. The pro forma effects of this acquisition onthe Company's consolidated financial statements were not significant.
Kreatel Communications AB
In February 2006, the Company acquired Kreatel Communications AB (""Kreatel''), a leading developer ofinnovative Internet Protocol (""IP'') based digital set-top boxes, for $108 million in cash. The Company recorded$79 million in goodwill, a portion of which is expected to be deductible for tax purposes, a $1 million charge foracquired in-process research and development costs, and $22 million in identifiable intangible assets. The acquiredin-process research and development will have no alternative future uses if the products are not feasible. At thedate of the acquisition, a total of two projects were in process. These projects have since been completed. Theaverage risk adjusted rate used to value these projects was 19%. The allocation of value to in-process research anddevelopment was determined using expected future cash flows discounted at average risk adjusted rates reflectingboth technological and market risk as well as the time value of money. These research and development costs wereexpensed at the date of acquisition. Goodwill and intangible assets are included in Other assets in the Company'sconsolidated balance sheets. The intangible assets are being amortized over periods ranging from 2 to 4 years on astraight-line basis.
The results of operations of Kreatel have been included in the Connected Home Solutions segment in theCompany's consolidated financial statements subsequent to the date of acquisition. The pro forma effects of thisacquisition on the Company's consolidated financial statements were not significant.
MeshNetworks
In November 2004, the Company acquired MeshNetworks, Inc. (""MeshNetworks''), a developer of mobilemesh networking and position location technologies that allow customers to deploy high-performance, InternetProtocol-based wireless broadband networks, for $169 million in cash.
The Company recorded approximately $119 million in goodwill, none of which is expected to be deductiblefor tax purposes, a $16 million charge for acquired in-process research and development, and $20 million in otherintangibles. The acquired in-process research and development will have no alternative future uses if the productsare not feasible. At the date of the acquisition, a total of three projects were in process. These projects have sincebeen completed. The average risk adjusted rate used to value these projects was 45%. The allocation of value to in-process research and development was determined using expected future cash flows discounted at average riskadjusted rates reflecting both technological and market risk as well as the time value of money. These research anddevelopment costs were written off at the date of acquisition and have been included in Other Charges in theCompany's consolidated statements of operations. Goodwill and intangible assets are included in Other Assets inthe Company's consolidated balance sheets. The intangible assets will be amortized over a period of 5 years on astraight-line basis.
The results of operations of MeshNetworks have been included in the Networks and Enterprise segment in theCompany's consolidated financial statements subsequent to the date of acquisition. The pro forma effects of thisacquisition on the Company's consolidated financial statements were not significant.

117
Force Computers
In August 2004, the Company acquired Force Computers (""Force''), a worldwide designer and supplier ofopen, standards-based and custom embedded computing solutions, for $121 million in cash.
The Company recorded approximately $59 million in goodwill, none of which was deductible for taxpurposes, a $2 million charge for acquired in-process research and development, and $35 million in otherintangibles. The in-process research and development costs were written off at the date of acquisition and havebeen included in Other Charges in the Company's consolidated statements of operations. Goodwill and intangibleassets are included in Other Assets in the Company's consolidated balance sheets. The intangible assets will beamortized over a period of 5 years on a straight-line basis.
The results of operations of Force have been included in the Networks and Enterprise segment in theCompany's consolidated financial statements subsequent to the date of acquisition. The pro forma effects of thisacquisition on the Company's consolidated financial statements were not significant.
2007 Acquisitions
Symbol Technologies, Inc.: In January 2007, the Networks and Enterprise segment completed the acquisitionof Symbol Technologies, Inc. (""Symbol''), for approximately $3.9 billion in cash. Symbol is a leader in designing,developing, manufacturing and servicing products and systems used in end-to-end enterprise mobility solutionsfeaturing rugged mobile computing, advanced data capture, radio frequency identification, wireless infrastructureand mobility management.
Good Technology, Inc.: In January 2007, the Mobile Devices segment completed the acquisition of GoodTechnology, Inc., for approximately $500 million in cash. Good Technology, Inc. is a leader in enterprise mobilecomputing software and service.
Netopia, Inc.: In February 2007, the Connected Home Solutions segment completed the acquisition ofNetopia, Inc., for approximately $200 million in cash. Netopia, Inc. is a broadband equipment provider for DSLcustomers, which allows for phone, TV and fast Internet connections.
Intangible Assets
Amortized intangible assets, excluding goodwill were comprised of the following:
2006 2005Gross Gross
Carrying Accumulated Carrying AccumulatedDecember 31 Amount Amortization Amount Amortization
Intangible assets:Licensed technology $119 $107 $112 $104Completed technology 486 334 407 285Other intangibles 285 95 149 48
$890 $536 $668 $437
Amortization expense on intangible assets, which is included within Other and Eliminations, was $100 million,$67 million and $52 million for the years ended December 31, 2006, 2005 and 2004, respectively. As ofDecember 31, 2006 future amortization expense is estimated to be $116 million for 2007, $85 million in 2008,$69 million in 2009, $48 million in 2010, and $29 million in 2011.

118
Amortized intangible assets, excluding goodwill by business segment:
2006 2005Gross Gross
Carrying Accumulated Carrying AccumulatedDecember 31 Amount Amortization Amount Amortization
Mobile Devices $154 $ 41 $ 36 $ 14Networks and Enterprise 273 151 250 119Connected Home Solutions 463 344 382 304
$890 $536 $668 $437
The following tables display a rollforward of the carrying amount of goodwill from January 1, 2005 toDecember 31, 2006, by business segment:
January 1, December 31,Segment 2006 Acquired Adjustments 2006
Mobile Devices $ 17 $ 52 $Ì $ 69Networks and Enterprise 539 73 (1) 611Connected Home Solutions 793 211 22 1,026
$1,349 $336 $21 $1,706
January 1, December 31,Segment 2005 Acquired Adjustments 2005
Mobile Devices $ 17 $Ì $ Ì $ 17Networks and Enterprise 484 73 (18) 539Connected Home Solutions 782 16 (5) 793
$1,283 $89 $(23) $1,349
The goodwill impairment test is performed at the reporting unit level and is a two-step analysis. First, the fairvalue (""FV'') of each reporting unit is compared to its book value. If the FV of the reporting unit is less than itsbook value, the Company performs a hypothetical purchase price allocation based on the reporting unit's FV todetermine the FV of the reporting unit's goodwill. FV is determined with the help of independent appraisal firmsusing a combination of present value techniques and quoted market prices of comparable businesses. Noimpairment charges were required for the year ended December 31, 2006 or December 31, 2005. For the yearended December 31, 2004, the Company determined that goodwill related to a sensor group, which wassubsequently divested in 2005, was impaired by a total of $125 million.

119
15. Valuation and Qualifying Accounts
The following table presents the valuation and qualifying account activity for the years ended December 31,2006, 2005 and 2004:
Balance at Charged to Balance atJanuary 1 Earnings Used Adjustments(1) December 31
2006Reorganization of Businesses $ 103 $ 221 $ (143) $ (23) $ 158Allowance for Doubtful Accounts 101 50 (58) (15) 78Allowance for Losses on Finance Receivables 12 5 (8) 1 10Inventory Reserves 529 517 (490) (140) 416Warranty Reserves 467 977 (891) (23) 530Customer Reserves 1,171 4,218 (3,597) (487) 1,305
2005Reorganization of Businesses 114 91 (81) (21) 103Allowance for Doubtful Accounts 173 17 (14) (75) 101Allowance for Losses on Finance Receivables 1,966 Ì (1,926) (28) 12Inventory Reserves 522 569 (389) (173) 529Warranty Reserves 472 816 (696) (125) 467Customer Reserves 842 3,215 (2,588) (298) 1,171
2004Reorganization of Businesses 238 54 (126) (52) 114Allowance for Doubtful Accounts 247 36 (24) (86) 173Allowance for Losses on Finance Receivables 2,095 2 (69) (62) 1,966Inventory Reserves 568 377 (376) (47) 522Warranty Reserves 332 600 (342) (118) 472Customer Reserves 573 2,563 (2,018) (276) 842
(1) Includes translation adjustments.

120
16. Quarterly and Other Financial Data (unaudited)*
2006 20051st 2nd 3rd 4th 1st 2nd 3rd 4th
Operating Results
Net sales $9,608 $10,876 $10,603 $11,792 $7,767 $8,408 $9,048 $10,039
Costs of sales 6,677 7,519 7,233 8,723 5,191 5,654 6,122 6,866
Gross margin 2,931 3,357 3,370 3,069 2,576 2,754 2,926 3,173
Selling, general andadministrative expenses 1,069 1,154 1,123 1,158 886 877 881 984
Research and developmentexpenditures 964 1,035 1,046 1,061 823 897 901 979
Other charges (income) 49 (354) 233 97 11 22 64 (501)
Operating earnings 849 1,522 968 753 856 958 1,080 1,711
Earnings from continuingoperations 656 1,349 727 529 685 919 1,738 1,177
Net earnings 686 1,384 968 623 692 933 1,751 1,202
Per Share Data (in dollars)
Continuing Operations:
Basic earnings per commonshare $ 0.26 $ 0.55 $ 0.30 $ 0.22 $ 0.28 $ 0.37 $ 0.70 $ 0.47
Diluted earnings per commonshare 0.26 0.54 0.29 0.21 0.28 0.37 0.68 0.46
Net Earnings:
Basic earnings per commonshare 0.28 0.56 0.40 0.26 0.28 0.38 0.71 0.48
Diluted earnings per commonshare 0.27 0.55 0.39 0.25 0.28 0.37 0.69 0.47
Dividends declared 0.04 0.05 0.05 0.05 0.04 0.04 0.04 0.04
Dividends paid 0.04 0.04 0.05 0.05 0.04 0.04 0.04 0.04
Stock prices
High 24.67 24.24 25.55 26.30 17.52 19.25 23.99 24.99
Low 20.22 19.01 18.66 20.17 14.69 14.48 18.05 19.45
* Certain amounts in prior years' financial statements and related notes have been reclassified to conform to the2006 presentation.

121
Item 9: Changes in and Disagreements with Accountants on Accounting and Financial Disclosure
None.
Item 9A: Controls and ProceduresEvaluation of Disclosure Controls and Procedures.
Under the supervision and with the participation of our senior management, including our chief executiveofficer and chief financial officer, we conducted an evaluation of the effectiveness of the design and operation ofour disclosure controls and procedures, as defined in Rules 13a-15(e) and 15d-15(e) under the Securities ExchangeAct of 1934, as amended (the ""Exchange Act''), as of the end of the period covered by this annual report (the""Evaluation Date''). Based on this evaluation, our chief executive officer and chief financial officer concluded as ofthe Evaluation Date that our disclosure controls and procedures were effective such that the information relating toMotorola, including our consolidated subsidiaries, required to be disclosed in our Securities and ExchangeCommission (""SEC'') reports (i) is recorded, processed, summarized and reported within the time periods specifiedin SEC rules and forms, and (ii) is accumulated and communicated to Motorola's management, including our chiefexecutive officer and chief financial officer, as appropriate to allow timely decisions regarding required disclosure.
Management's Report on Internal Control Over Financial Reporting.
Motorola's management is responsible for establishing and maintaining adequate internal control over financialreporting as such term is defined in Rule 13a-15(f) of the Exchange Act. Under the supervision and with theparticipation of our senior management, including our chief executive officer and chief financial officer, we assessedthe effectiveness of our internal control over financial reporting as of December 31, 2006, using the criteria setforth in the Internal ControlÌIntegrated Framework issued by the Committee of Sponsoring Organizations of theTreadway Commission (COSO). Based on this assessment, management has concluded that our internal controlover financial reporting is effective as of December 31, 2006. KPMG LLP, our independent registered publicaccounting firm, has issued an audit report on management's assessment of our internal control over financialreporting which is included herein.
Changes in Internal Control Over Financial Reporting.
There have been no changes in our internal control over financial reporting that occurred during the quarterended December 31, 2006 that have materially affected or are reasonably likely to materially affect our internalcontrol over financial reporting.

122
REPORT OF INDEPENDENT REGISTERED PUBLIC ACCOUNTING FIRM
The Board of Directors and StockholdersMotorola, Inc.:
We have audited management's assessment, included in the accompanying Management's Report on InternalControl Over Financial Reporting in Item 9A: Controls and Procedures, that Motorola, Inc. maintained effectiveinternal control over financial reporting as of December 31, 2006, based on criteria established in InternalControlÌIntegrated Framework issued by the Committee of Sponsoring Organizations of the TreadwayCommission (COSO). Motorola, Inc.'s management is responsible for maintaining effective internal control overfinancial reporting and for its assessment of the effectiveness of internal control over financial reporting. Ourresponsibility is to express an opinion on management's assessment and an opinion on the effectiveness of theCompany's internal control over financial reporting based on our audit.
We conducted our audit in accordance with the standards of the Public Company Accounting Oversight Board(United States). Those standards require that we plan and perform the audit to obtain reasonable assurance aboutwhether effective internal control over financial reporting was maintained in all material respects. Our auditincluded obtaining an understanding of internal control over financial reporting, evaluating management'sassessment, testing and evaluating the design and operating effectiveness of internal control, and performing suchother procedures as we considered necessary in the circumstances. We believe that our audit provides a reasonablebasis for our opinion.
A company's internal control over financial reporting is a process designed to provide reasonable assuranceregarding the reliability of financial reporting and the preparation of financial statements for external purposes inaccordance with generally accepted accounting principles. A company's internal control over financial reportingincludes those policies and procedures that (1) pertain to the maintenance of records that, in reasonable detail,accurately and fairly reflect the transactions and dispositions of the assets of the company; (2) provide reasonableassurance that transactions are recorded as necessary to permit preparation of financial statements in accordancewith generally accepted accounting principles, and that receipts and expenditures of the company are being madeonly in accordance with authorizations of management and directors of the company; and (3) provide reasonableassurance regarding prevention or timely detection of unauthorized acquisition, use, or disposition of the company'sassets that could have a material effect on the financial statements.
Because of its inherent limitations, internal control over financial reporting may not prevent or detectmisstatements. Also, projections of any evaluation of effectiveness to future periods are subject to the risk thatcontrols may become inadequate because of changes in conditions, or that the degree of compliance with thepolicies or procedures may deteriorate.
In our opinion, management's assessment that Motorola, Inc. maintained effective internal control overfinancial reporting as of December 31, 2006, is fairly stated, in all material respects, based on criteria established inInternal ControlÌIntegrated Framework issued by the Committee of Sponsoring Organizations of the TreadwayCommission (COSO). Also, in our opinion, Motorola, Inc. maintained, in all material respects, effective internalcontrol over financial reporting as of December 31, 2006, based on criteria established in Internal ControlÌIntegrated Framework issued by the Committee of Sponsoring Organizations of the Treadway Commission(COSO).
We also have audited, in accordance with the standards of the Public Company Accounting Oversight Board(United States), the consolidated balance sheets of Motorola, Inc. and Subsidiaries as of December 31, 2006 and2005, and the related consolidated statements of operations, stockholders' equity and cash flows for each of theyears in the three-year period ended December 31, 2006, and our report dated February 28, 2006 expressed anunqualified opinion on those consolidated financial statements.
Chicago, IllinoisFebruary 28, 2007
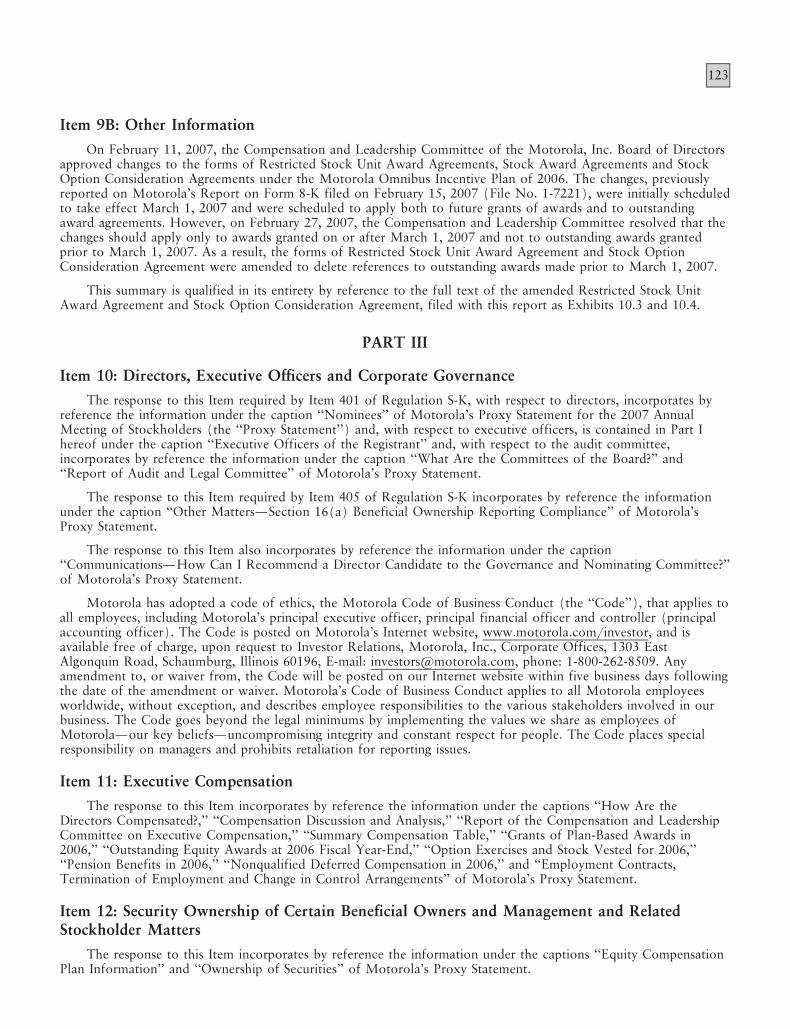
123
Item 9B: Other Information
On February 11, 2007, the Compensation and Leadership Committee of the Motorola, Inc. Board of Directorsapproved changes to the forms of Restricted Stock Unit Award Agreements, Stock Award Agreements and StockOption Consideration Agreements under the Motorola Omnibus Incentive Plan of 2006. The changes, previouslyreported on Motorola's Report on Form 8-K filed on February 15, 2007 (File No. 1-7221), were initially scheduledto take effect March 1, 2007 and were scheduled to apply both to future grants of awards and to outstandingaward agreements. However, on February 27, 2007, the Compensation and Leadership Committee resolved that thechanges should apply only to awards granted on or after March 1, 2007 and not to outstanding awards grantedprior to March 1, 2007. As a result, the forms of Restricted Stock Unit Award Agreement and Stock OptionConsideration Agreement were amended to delete references to outstanding awards made prior to March 1, 2007.
This summary is qualified in its entirety by reference to the full text of the amended Restricted Stock UnitAward Agreement and Stock Option Consideration Agreement, filed with this report as Exhibits 10.3 and 10.4.
PART III
Item 10: Directors, Executive Officers and Corporate Governance
The response to this Item required by Item 401 of Regulation S-K, with respect to directors, incorporates byreference the information under the caption ""Nominees'' of Motorola's Proxy Statement for the 2007 AnnualMeeting of Stockholders (the ""Proxy Statement'') and, with respect to executive officers, is contained in Part Ihereof under the caption ""Executive Officers of the Registrant'' and, with respect to the audit committee,incorporates by reference the information under the caption ""What Are the Committees of the Board?'' and""Report of Audit and Legal Committee'' of Motorola's Proxy Statement.
The response to this Item required by Item 405 of Regulation S-K incorporates by reference the informationunder the caption ""Other MattersÌSection 16(a) Beneficial Ownership Reporting Compliance'' of Motorola'sProxy Statement.
The response to this Item also incorporates by reference the information under the caption""CommunicationsÌHow Can I Recommend a Director Candidate to the Governance and Nominating Committee?''of Motorola's Proxy Statement.
Motorola has adopted a code of ethics, the Motorola Code of Business Conduct (the ""Code''), that applies toall employees, including Motorola's principal executive officer, principal financial officer and controller (principalaccounting officer). The Code is posted on Motorola's Internet website, www.motorola.com/investor, and isavailable free of charge, upon request to Investor Relations, Motorola, Inc., Corporate Offices, 1303 EastAlgonquin Road, Schaumburg, Illinois 60196, E-mail: [email protected], phone: 1-800-262-8509. Anyamendment to, or waiver from, the Code will be posted on our Internet website within five business days followingthe date of the amendment or waiver. Motorola's Code of Business Conduct applies to all Motorola employeesworldwide, without exception, and describes employee responsibilities to the various stakeholders involved in ourbusiness. The Code goes beyond the legal minimums by implementing the values we share as employees ofMotorolaÌour key beliefsÌuncompromising integrity and constant respect for people. The Code places specialresponsibility on managers and prohibits retaliation for reporting issues.
Item 11: Executive Compensation
The response to this Item incorporates by reference the information under the captions ""How Are theDirectors Compensated?,'' ""Compensation Discussion and Analysis,'' ""Report of the Compensation and LeadershipCommittee on Executive Compensation,'' ""Summary Compensation Table,'' ""Grants of Plan-Based Awards in2006,'' ""Outstanding Equity Awards at 2006 Fiscal Year-End,'' ""Option Exercises and Stock Vested for 2006,''""Pension Benefits in 2006,'' ""Nonqualified Deferred Compensation in 2006,'' and ""Employment Contracts,Termination of Employment and Change in Control Arrangements'' of Motorola's Proxy Statement.
Item 12: Security Ownership of Certain Beneficial Owners and Management and RelatedStockholder Matters
The response to this Item incorporates by reference the information under the captions ""Equity CompensationPlan Information'' and ""Ownership of Securities'' of Motorola's Proxy Statement.

124
Item 13: Certain Relationships and Related Transactions, and Director IndependenceThe response to this Item incorporates by reference the relevant information under the caption ""Related
Person Transaction Policy and Procedures'' and ""Which Directors Are Independent'' of Motorola's ProxyStatement.
Item 14: Principal Accounting Fees and ServicesThe response to this Item incorporates by reference the information under the caption ""Independent Registered
Public Accounting Firm'' and ""Audit and Legal Committee Pre-Approval Policies'' of Motorola's Proxy Statement.

125
PART IV
Item 15: Exhibits, Financial Statement Schedules(a) 1. Financial Statements
See Part II, Item 8 hereof.
2. Financial Statement Schedule and Independent Auditors' Report
All schedules omitted are inapplicable or the information required is shown in the consolidated financialstatements or notes thereto.
3. Exhibits
Exhibits required to be attached by Item 601 of Regulation S-K are listed in the Exhibit Index attached hereto,which is incorporated herein by this reference. Following is a list of management contracts and compensatoryplans and arrangements required to be filed as exhibits to this form by Item 15(b) hereof:
Motorola Omnibus Incentive Plan of 2006Form of Motorola, Inc. Award DocumentÌTerms and Conditions Related to Employee Nonqualified Stock
Options relating to the Motorola Omnibus Incentive Plan of 2006Form of Motorola, Inc. Restricted Stock Unit Award Agreement relating to the Motorola Omnibus Incentive Plan
of 2006Form of Motorola Stock Option Consideration Agreement, as amended through February 27, 2007Form of Motorola, Inc. Award DocumentÌTerms and Conditions Related to Employee Nonqualified Stock
Options for Edward J. Zander, relating to the Motorola Omnibus Incentive Plan of 2006Form of Motorola, Inc. Restricted Stock Unit Award Agreement for Edward J. Zander relating to the Motorola
Omnibus Incentive Plan of 2006Form of Motorola Stock Option Consideration Agreement for Edward J. Zander, Chairman and Chief Executive
Officer, Motorola, Inc.Form of Deferred Stock Units Agreement between Motorola, Inc. and its non-employee directors, relating to the
deferred stock units issued in lieu of cash compensation to directors under the Motorola Omnibus IncentivePlan of 2006 or any successor plan.
Form of Deferred Stock Units Award Agreement between Motorola, Inc. and its non-employee directors under theMotorola Omnibus Incentive Plan of 2006 or any successor plan.
Motorola Omnibus Incentive Plan of 2003Motorola Omnibus Incentive Plan of 2002Motorola Omnibus Incentive Plan of 2000Motorola Compensation/Acquisition Plan of 2000Motorola Amended and Restated Incentive Plan of 1998Share Option Plan of 1996Form of Motorola, Inc. Award DocumentÌTerms and Conditions Related to Non-Employee Director
Nonqualified Stock Options relating to the Motorola Omnibus Incentive Plan of 2002Form of Motorola, Inc. Award DocumentÌTerms and Conditions Related to Employee Nonqualified Stock
Options, relating to the Motorola Omnibus Incentive Plan of 2003, the Motorola Omnibus Incentive Plan of2002, the Motorola Omnibus Incentive Plan of 2000, the Motorola Amended and Restated Incentive Plan of1998 and the Motorola Compensation/Acquisition Plan of 2000 (collectively the ""Prior Plans'')
Form of Motorola, Inc. Restricted Stock Agreement, relating to the Prior PlansForm of Motorola, Inc. Restricted Stock Unit Award Agreement (Cliff Vesting) relating to the Prior PlansForm of Motorola, Inc. Restricted Stock Unit Award Agreement (Periodic Vesting), relating to the Prior PlansForm of Motorola, Inc. Award DocumentÌTerms and Conditions Related to Employee Nonqualified Stock
Options for Edward J. Zander, relating to the Prior PlansForm of Motorola, Inc. Restricted Stock Unit Award Agreement for Edward J. Zander relating to the Motorola
Omnibus Incentive Plan of 2003, as amended for grants on or after May 3, 2005Form of Motorola, Inc. Restricted Stock Unit Award Agreement for Edward J. Zander relating to the Motorola
Omnibus Incentive Plan of 2003Form of Deferred Stock Units Agreement between Motorola, Inc. and its non-employee directors, relating to the
deferred stock units issued in lieu of cash compensation to directors under the Motorola Omnibus IncentivePlan of 2003

126
Motorola Non-Employee Directors Stock PlanMotorola 2006 Incentive PlanMotorola Long-Range Incentive Plan (LRIP) of 2005Motorola Long-Range Incentive Plan (LRIP) of 2006Motorola Elected Officers Supplementary Retirement PlanMotorola Management Deferred Compensation PlanMotorola, Inc. Senior Officer Change in Control Severance PlanMotorola, Inc. Retiree Basic Life Insurance for Elected Officers prior to January 1, 2004 who retire after January 1,
2005Arrangement for directors' fees for non-employee directorsInsurance covering non-employee directors and their spousesEmployment Agreement between Motorola, Inc. and Edward J. Zander dated as of December 15, 2003, as
amendedAgreement between Motorola, Inc. and Adrian Nemcek dated July 18, 2006Description of Future Compensation Arrangements between Motorola, Inc. and David Devonshire, Executive Vice
President and Chief Financial Officer of the Company as of March 2002Form of Motorola Stock Option Consideration Agreement as amended on May 2, 2006
(b) Exhibits:
See Item 15(a)3 above.

127
CONSENT OF INDEPENDENT REGISTERED PUBLIC ACCOUNTING FIRM
The Board of DirectorsMotorola, Inc.:
We consent to incorporation by reference in the registration statements on Form S-8 (Nos. 33-59285,333-51847, 333-65941, 333-88735, 333-36308, 333-37114, 333-53120, 333-60560, 333-60612, 333-60976,333-87724, 333-87728, 333-87730, 333-104259, 333-105107, 333-123879 and 333-133736) and on Form S-3(Nos. 333-75940, 333-76637 and 333-36320) of Motorola, Inc. of our reports dated February 28, 2007, withrespect to the consolidated balance sheets of Motorola, Inc. and Subsidiaries as of December 31, 2006 and 2005,and the related consolidated statements of operations, stockholders' equity and cash flows for each of the years inthe three-year period ended December 31, 2006, management's assessment of the effectiveness of internal controlover financial reporting as of December 31, 2006, and the effectiveness of internal control over financial reportingas of December 31, 2006, which reports appear in the December 31, 2006, annual report on Form 10-K ofMotorola, Inc. Our report on the consolidated financial statements refers to the adoption of the provisions ofStatement of Financial Accounting Standards No. 123 (revised 2004), Share-Based Payment, effective January 1,2006 and Statement of Financial Accounting Standards No. 158, Employers' Accounting for Defined BenefitPension and Other Postretirement Plans Ì an amendment of FASB Statements No. 87, 88, 106, and 132(R),effective December 31, 2006.
Chicago, IllinoisFebruary 28, 2007

128
SIGNATURES
Pursuant to the requirements of Section 13 or 15(d) of the Securities Exchange Act of 1934, Motorola, Inc.has duly caused this report to be signed on its behalf by the undersigned, thereunto duly authorized.
MOTOROLA, INC.
By: /s/ EDWARD J. ZANDER
Edward J. ZanderChairman of the Board and
Chief Executive Officer
February 28, 2007
Pursuant to the requirements of the Securities Exchange Act of 1934, this report has been signed below by thefollowing persons on behalf of Motorola, Inc. and in the capacities and on the dates indicated.
Signature Title Date
/s/ EDWARD J. ZANDER Chairman of the Board and February 28, 2007Chief Executive OfficeEdward J. Zander(Principal Executive Officer)
/s/ DAVID W. DEVONSHIRE Executive Vice President, February 28, 2007Chief Financial OfficerDavid W. Devonshire(Principal Financial Officer)
/s/ STEVEN J. STROBEL Senior Vice President, February 28, 2007Corporate ControllerSteven J. Strobel(Principal Accounting Officer)
/s/ DAVID W. DORMAN Director February 28, 2007
David W. Dorman
/s/ H. LAURANCE FULLER Director February 28, 2007
H. Laurance Fuller
/s/ JUDY C. LEWENT Director February 28, 2007
Judy C. Lewent
/s/ THOMAS J. MEREDITH Director February 28, 2007
Thomas J. Meredith
/s/ NICHOLAS NEGROPONTE Director February 28, 2007
Nicholas Negroponte
/s/ INDRA K. NOOYI Director February 28, 2007
Indra K. Nooyi

129
Signature Title Date
/s/ SAMUEL C. SCOTT III Director February 28, 2007
Samuel C. Scott III
/s/ RON SOMMER Director February 28, 2007
Ron Sommer
/s/ JAMES R. STENGEL Director February 28, 2007
James R. Stengel
/s/ DOUGLAS A. WARNER III Director February 28, 2007
Douglas A. Warner III
/s/ DR. JOHN A. WHITE Director February 28, 2007
Dr. John A. White
/s/ MILES D. WHITE Director February 28, 2007
Miles D. White

130
EXHIBIT INDEX
Exhibit No. Exhibit
2.1 Agreement and Plan of Merger, dated as of September 18, 2006, among Motorola, Inc., MotorolaGTG Subsidiary I Corp. and Symbol Technologies, Inc. (incorporated by reference to Exhibit 2.1 toMotorola's Report on Form 8-K filed on September 25, 2006 (File No. 1-7221)).
2.2 Amendment No. 1, dated as of October 30, 2006, to Agreement and Plan of Merger, dated as ofSeptember 18, 2006, among Motorola, Inc., Motorola GTG Subsidiary I Corp. and SymbolTechnologies, Inc. (incorporated by reference to Exhibit 2.2 to Motorola's Quarterly Report onForm 10-Q for the fiscal quarter ended September 30, 2006) (File No. 1-7221)).
3.1 Restated Certificate of Incorporation of Motorola, Inc., as amended through May 3, 2000(incorporated by reference to Exhibit 3(i)(b) to Motorola's Quarterly Report on Form 10-Q for thefiscal quarter ended April 1, 2000) (File No. 1-7221)).
3.2 Motorola, Inc. Amended and Restated Bylaws as of February 23, 2006 (incorporated by reference toExhibit 3.1 to Motorola's Report on Form 8-K filed March 1, 2006 (File No. 1-7221)).
4.2(a) Senior Indenture, dated as of May 1, 1995, between Harris Trust and Savings Bank and Motorola,Inc. (incorporated by reference to Exhibit 4(d) of the Registrant's Registration Statement onForm S-3 dated September 25, 1995 (Registration No. 33-62911)).
4.2(b) Instrument of Resignation, Appointment and Acceptance, dated as of January 22, 2001, amongMotorola, Inc., Bank One Trust Company, N.A. and BNY Midwest Trust Company (as successor ininterest to Harris Trust and Savings Bank) (incorporated by reference to Exhibit 4.2(b) toMotorola's Annual Report on Form 10-K for the fiscal year ended December 31, 2000 (FileNo. 1-7221)).
Certain instruments defining the rights of holders of long-term debt of Motorola and of all itssubsidiaries for which consolidated or unconsolidated financial statements are required to be filed arebeing omitted pursuant to paragraph(4)(iii)(A) of Item 601 of Regulation S-K. Motorola agrees tofurnish a copy of any such instrument to the Commission upon request.
*10.1 Motorola Omnibus Incentive Plan of 2006 (as Amended through November 14, 2006).
10.2 Form of Motorola, Inc. Award DocumentÌTerms and Conditions Related to EmployeeNonqualified Stock Options relating to the Motorola Omnibus Incentive Plan of 2006, as amendedthrough February 11, 2007 (incorporated by reference to Exhibit 10.37 to Motorola's Report onForm 8-K, filed on February 15, 2007 (File No. 1-7221)).
*10.3 Form of Motorola, Inc. Restricted Stock Unit Award Agreement relating to the Motorola OmnibusIncentive Plan of 2006 as amended through February 27, 2007.
*10.4 Form of Motorola Stock Option Consideration Agreement, as amended on February 27, 2007.
*10.5 Form of Motorola, Inc. Award DocumentÌTerms and Conditions Related to EmployeeNonqualified Stock Options for Edward J. Zander, relating to the Motorola Omnibus Incentive Planof 2006 or any successor plan, as amended through February 11, 2007.
*10.6 Form of Motorola, Inc. Restricted Stock Unit Award Agreement for Edward J. Zander relating to theMotorola Omnibus Incentive Plan of 2006, as amended through February 11, 2007.
10.7 Form of Motorola Stock Option Consideration Agreement for Edward J. Zander, Chairman andChief Executive Officer, Motorola, Inc., as amended on May 2, 2006 (incorporated by reference toExhibit 10.41 to Motorola's Quarterly Report on Form 10-Q for the fiscal quarter ended July 1,2006) (File No. 1-7221)).
*10.8 Form of Deferred Stock Units Agreement between Motorola, Inc. and its non-employee directors,relating to the deferred stock units issued in lieu of cash compensation to directors under theMotorola Omnibus Incentive Plan of 2006 or any successor plan, amended as of February 11, 2007.

131
Exhibit No. Exhibit
*10.9 Form of Deferred Stock Units Award Agreement between Motorola, Inc. and its non-employeedirectors under the Motorola Omnibus Incentive Plan of 2006 or any successor plan as amendedFebruary 11, 2007.
10.10 Motorola Omnibus Incentive Plan of 2003, as amended through April 2, 2004 (incorporated byreference to Exhibit 10.1 to Motorola's Quarterly Report on Form 10-Q for the fiscal quarter endedApril 3, 2004 (File No. 1-7221)).
10.11 Motorola Omnibus Incentive Plan of 2002, as amended through April 2, 2004 (incorporated byreference to Exhibit 10.2 to Motorola's Quarterly Report on Form 10-Q for the fiscal quarter endedApril 3, 2004 (File No. 1-7221)).
10.12 Motorola Omnibus Incentive Plan of 2000, as amended through April 2, 2004 (incorporated byreference to Exhibit 10.3 to Motorola's Quarterly Report on Form 10-Q for the fiscal quarter endedApril 3, 2004 (File No. 1-7221)).
10.13 Motorola Compensation/Acquisition Plan of 2000, as amended through April 2, 2004 (incorporatedby reference to Exhibit 10.4 to Motorola's Quarterly Report on Form 10-Q for the fiscal quarterended April 3, 2004 (File No. 1-7221)).
10.14 Motorola Amended and Restated Incentive Plan of 1998, as amended through April 2, 2004(incorporated by reference to Exhibit 10.5 to Motorola's Quarterly Report on Form 10-Q for thefiscal quarter ended April 3, 2004 (File No. 1-7221)).
10.15 Share Option Plan of 1996, as amended through May 7, 1997 (incorporated by reference toExhibit 10.6 to Motorola's Annual Report on Form 10-K for the fiscal year ended December 31,2002 (File No. 1-7221)).
10.16 Form of Motorola, Inc. Award DocumentÌTerms and Conditions Related to Non-EmployeeDirector Nonqualified Stock Options relating to the Motorola Omnibus Incentive Plan of 2002(incorporated by reference to Exhibit 10.2 to Motorola's Quarterly Report on Form 10-Q for thefiscal quarter ended March 30, 2002 (File No. 1-7221)).
10.17 Form of Motorola, Inc. Award DocumentÌTerms and Conditions Related to EmployeeNonqualified Stock Options, relating to the Motorola Omnibus Incentive Plan of 2003, the MotorolaOmnibus Incentive Plan of 2002, the Motorola Omnibus Incentive Plan of 2000, the MotorolaAmended and Restated Incentive Plan of 1998 and the Motorola Compensation/Acquisition Plan of2000, as amended through May 2, 2005, incorporated by reference to Exhibit 10.46 to Motorola'sQuarterly Report on Form 10-Q for the fiscal quarter ended April 2, 2005 (File No. 1-7221)).
10.18 Form of Motorola, Inc. Restricted Stock Agreement, relating to the Motorola Omnibus IncentivePlan of 2003, the Motorola Omnibus Incentive Plan of 2002, the Motorola Omnibus Incentive Planof 2000 and the Motorola Compensation/Acquisition Plan of 2000, as amended through July 29,2004 (incorporated by reference to Exhibit 10.11 to Motorola's Quarterly Report on Form 10-Q forthe fiscal quarter ended July 3, 2004 (File No. 1-7221)).
10.19 Form of Motorola, Inc. Restricted Stock Unit Award Agreement (Cliff Vesting) relating to theMotorola Omnibus Incentive Plan of 2003, the Motorola Omnibus Incentive Plan of 2002, theMotorola Omnibus Incentive Plan of 2000 and the Motorola Compensation/Acquisition Plan of2000, as amended through July 29, 2004 (incorporated by reference to Exhibit 10.12 to Motorola'sQuarterly Report on Form 10-Q for the fiscal quarter ended July 3, 2004 (File No. 1-7221.))
10.20 Form of Motorola, Inc. Restricted Stock Unit Award Agreement (Periodic Vesting), relating to theMotorola Omnibus Incentive Plan of 2003, the Motorola Omnibus Incentive Plan of 2002, theMotorola Omnibus Incentive Plan of 2000 and the Motorola Compensation/Acquisition Plan of2000 (incorporated by reference to Exhibit 10.34 to Motorola's Quarterly Report on Form 10-Q forthe fiscal quarter ended July 3, 2004 (File No. 1-7221)).

132
Exhibit No. Exhibit
10.21 Form of Motorola, Inc. Award DocumentÌTerms and Conditions Related to EmployeeNonqualified Stock Options for Edward J. Zander, relating to the Motorola Omnibus Incentive Planof 2003, the Motorola Omnibus Incentive Plan of 2002, the Motorola Omnibus Incentive Plan of2000 and the Motorola Amended and Restated Incentive Plan of 1998, as amended February 14,2005 (incorporated by reference to Exhibit 10.24(b) to Motorola's Annual Report on Form 10-Kfor the fiscal year ended December 31, 2004 (File No. 1-7221)).
10.22 Form of Motorola, Inc. Restricted Stock Unit Award Agreement for Edward J. Zander relating to theMotorola Omnibus Incentive Plan of 2003, as amended for grants on or after May 3, 2005(incorporated by reference to Exhibit 10.45 to Motorola's Report on Form 8-K filed on May 6,2005 (File No. 1-7221)).
10.23 Form of Motorola, Inc. Restricted Stock Unit Award Agreement for Edward J. Zander relating to theMotorola Omnibus Incentive Plan of 2003 (incorporated by reference to Exhibit 10.33 toMotorola's Quarterly Report on Form 10-Q for the fiscal quarter ended April 3, 2004 (FileNo. 1-7221)).
10.24 Form of Deferred Stock Units Agreement between Motorola, Inc. and its non-employee directors,relating to the deferred stock units issued in lieu of cash compensation to directors under theMotorola Omnibus Incentive Plan of 2003, amended as of January 1, 2006, or any successor plan(incorporated by reference to Motorola's Annual Report on Form 10-K for the fiscal year endedDecember 31, 2005) (File No. 1-7221)).
10.25 Motorola Non-Employee Directors Stock Plan, as amended and restated on May 6, 2003(incorporated by reference to Exhibit 10.20 to Motorola's Quarterly Report on Form 10-Q for thefiscal quarter ended March 29, 2003 (File No. 1-7221)).
10.26 Motorola 2006 Incentive Plan (incorporated by reference to Exhibit 10.26 to Motorola's QuarterlyReport on Form 10-Q for the fiscal quarter ended July 1, 2006) (File No. 1-7221)).
*10.27 Motorola Long-Range Incentive Plan (LRIP) of 2005 (as Amended through November 14, 2006).
*10.28 Motorola Long-Range Incentive Plan (LRIP) of 2006 (as Amended through November 14, 2006).
10.29 Motorola Elected Officers Supplementary Retirement Plan amended effective as of June 30, 2005, asamended through February 28, 2005 (as incorporated by reference to Exhibit No. 10.33 toMotorola's Annual Report on Form 10-K for the fiscal year ended December 31, 2004 (FileNo. 1-7221)).
10.30 Motorola Management Deferred Compensation Plan, as amended through May 2, 2006, effective asof January 1, 2005 (incorporated by reference to Exhibit 10.29 to Motorola's Quarterly Report onForm 10-Q for the fiscal quarter ended April 1, 2006 (File No. 1-7221)).
10.31 Motorola, Inc. Senior Officer Change in Control Severance Plan, amended on May 2, 2006, effectiveas of January 1, 2005 (incorporated by reference to Exhibit 10.30 to Motorola's Quarterly Report onForm 10-Q for the fiscal quarter ended April 1, 2006 (File No. 1-7221)).
10.32 Motorola, Inc. Retiree Basic Life Insurance for Elected Officers prior to January 1, 2004 who retireafter January 1, 2005 (incorporated by reference to Exhibit 10.36 to Motorola's Annual Report onForm 10-K for the fiscal year ended December 31, 2004 (File No. 1-7221)).
10.33 Arrangement for directors' fees for non-employee directors (description incorporated by referencefrom the information under the caption ""How Are the Directors Compensated?'' of Motorola'sProxy Statement for the Annual Meeting of Stockholders currently scheduled to be held on May 7,2007 (""Motorola Proxy Statement'')).
10.34 Insurance covering non-employee directors and their spouses (including a description incorporated byreference from the information under the caption ""How Are the Directors Compensated?'' of theMotorola Proxy Statement and to Exhibit 10.38 to Motorola's Annual Report on Form 10-K for thefiscal year ended December 31, 2004 (File No. 1-7221)).

133
Exhibit No. Exhibit
10.35 Employment Agreement between Motorola, Inc. and Edward J. Zander dated as of December 15,2003 as amended through May 2, 2006 (incorporated by reference to Exhibit 10.34 to Motorola'sQuarterly Report on Form 10-Q for the fiscal quarter ended April 1, 2006 (File No. 1-7221)).
10.36 Agreement between Motorola, Inc. and Adrian Nemcek dated July 18, 2006 (incorporated byreference to Exhibit 10.45 to Motorola's Quarterly Report on Form 10-Q for the fiscal quarter endedJuly 1, 2006) (File No. 1-7221)).
10.37 Description of Future Compensation Arrangements between Motorola, Inc. and David Devonshire,Executive Vice President and Chief Financial Officer of the Company, as of March 2002(incorporated by reference to Exhibit 10.2 to Motorola's Quarterly Report on Form 10-Q for thefiscal quarter ended September 28, 2002 (File No. 1-7221)).
10.38 Form of Motorola Stock Option Consideration Agreement, as amended on May 2, 2006(incorporated by reference to Exhibit 10.39 to Motorola's Quarterly Report on Form 10-Q for thefiscal quarter ended April 1, 2006) (File No. 1-7221)).
*12 Statement regarding Computation of Ratio of Earnings to Fixed Charges.
*21 Subsidiaries of Motorola.
23 Consent of Independent Registered Public Accounting Firm, see page 127 of the Annual Report onForm 10-K of which this Exhibit Index is a part.
*31.1 Certification of Edward J. Zander pursuant to Section 302 of the Sarbanes-Oxley Act of 2002.
*31.2 Certification of David W. Devonshire pursuant to Section 302 of the Sarbanes-Oxley Act of 2002.
*32.1 Certification of Edward J. Zander pursuant to Section 906 of the Sarbanes-Oxley Act of 2002.
*32.2 Certification of David W. Devonshire pursuant to Section 906 of the Sarbanes-Oxley Act of 2002.
* Filed herewith

(This page intentionally left blank)

DIRECTORS STANDING FOR ELECTION TO THE MOTOROLA, INC. BOARD OF DIRECTORS
Edward J. Zander
Chairman of the Board and Chief Executive Officer, Motorola, Inc.
David W. Dorman
Senior Advisor and Partner, Warburg Pincus, Former Chairman of the Board and Chief Executive Officer, AT&T
Judy C. Lewent
Executive Vice President, Chief Financial Officer, Merck & Co., Inc.
Thomas J. Meredith
General Partner and Co-Founder, Meritage Capital, L.P., Former Chief Financial Officer, Dell, Inc.
Nicholas Negroponte
Founder and Chairman, One Laptop Per Child Non-Profit Association
Samuel C. Scott, III
Lead Director; Chairman, President and Chief Executive Officer, Corn Products International
Ron Sommer
Former Chairman of the Board of Management, Deutsche
Telekom AG
James R. Stengel
Global Marketing Officer, Procter & Gamble Company
Douglas A. Warner, III
Former Chairman of the Board, J.P. Morgan Chase & Co.
John A. White
Chancellor, University of Arkansas
Miles D. White
Chairman of the Board and Chief Executive Officer, Abbott Laboratories
Edward J. Zander
Chairman of the Board and Chief Executive Officer
Gregory Q. Brown
Executive Vice President, Motorola, Inc.President, Networks & Enterprise Business
David W. Devonshire
Executive Vice President, Chief Financial Officer
Ruth A. Fattori
Executive Vice President, Human Resources
Kenneth C. “Casey” Keller, Jr.
Executive Vice President, Chief Marketing Officer
A. Peter Lawson
Executive Vice President, General Counsel and Secretary
Daniel M. Moloney
Executive Vice President, Motorola, Inc.President, Connected Home Business
Patricia B. Morrison
Executive Vice President, Chief Information Officer
Richard N. Nottenburg
Executive Vice President, Chief Strategy Officer
Stuart C. Reed
Executive Vice President, Chief Supply Chain Officer
Padmasree Warrior
Executive Vice President, Chief Technology Officer
STOCKHOLDER REFERENCE INFORMATION
Stock transfer, registrar, dividend disbursing, direct stock
purchase and dividend reinvestment agent
Mellon Investor Services LLC480 Washington Blvd., Jersey City, NJ 07310-1900 U.S.A.800-704-4098www.melloninvestor.com/isd
For shareholder correspondence:
Mellon Investor Services LLCShareholder Relations DepartmentP.O. Box 3315South Hackensack, NJ 07606-1915 U.S.A.
For transfer of stock:
Mellon Investor Services LLCStock Transfer DepartmentP.O. Box 3312South Hackensack, NJ 07606-1912 U.S.A.
INVESTOR RELATIONS
Security analysts, investment professionals and shareholders can find investor relations information on the Internet at www.motorola.com/investor.
Inquiries should be directed to:
Investor Relations, Motorola, Inc.Corporate Offices1303 East Algonquin RoadSchaumburg, IL 60196 U.S.A.E-mail: [email protected]
Common Stock
Motorola common stock is listed on the New York and Chicago Stock Exchanges.
Annual Meeting of Stockholders
The annual meeting will be held on May 7, 2007.A notice of the meeting, together with a form of Proxy and a ProxyStatement, will be mailed to stockholders on or about March 19, 2007,at which time proxies will be solicited by the Board of Directors.
Availability of Proxy Statement and Form 10-K
The Proxy Statement and the Form 10-K are available on the Internetat www.motorola.com/investor. A copy of the Proxy Statementand/or Form 10-K may be obtained without charge by contacting the Investor Relations Department as listed above.
Independent Registered Public Accounting Firm
KPMG LLP303 East Wacker DriveChicago, IL 60601 U.S.A.
Non-Incorporation of Form 10-K ‘‘Wrap’’
Motorola’s 2006 Form 10-K, as filed with the SEC, is included withinthis Annual Report. Other than the Form 10-K, all other portions ofthis Annual Report are not ‘‘filed’’ with the SEC and should not bedeemed so.
Certifications
The most recent certifications by our Chief Executive Officer andChief Financial Officer pursuant to Section 302 and 906 of theSarbanes-Oxley Act of 2002 are filed as exhibits to our Form 10-K.Our Chief Executive Officer’s most recent annual certification to theNew York Stock Exchange was submitted May 22, 2006.
SENIOR MANAGEMENT
s

Motorola, Inc.1303 E. Algonquin RoadSchaumburg, Illinois 60196 U.S.A.847-576-5000www.motorola.com
MOTOROLA and the Stylized M Logo are registered in the U.S. Patent and Trademark Office. All other product or service names are the property of their registered owners. © Motorola, Inc. 2007