Embed Size (px)
Citation preview
Town of Hilton Head Island, South Carolina
Consolidated Annual Financial ReportFiscal Year Ended
June 30, 2011
Get Your Plaid On at the Annual Heritage PGA TOUR Golf Tournament
Town of Hilton Head Island, South Carolina
COMPREHENSIVE ANNUAL FINANCIAL REPORT
FISCAL YEAR ENDED JUNE 30, 2011
Prepared by the Finance Department

Introductory Section
i
Transmittal Letter For The Fiscal Year Ended June 30, 2011 The Town of Hilton Head Island, South Carolina January 31, 2012 The Honorable Mayor, Members of the Town Council, and Citizens of the Town of Hilton Head Island, South Carolina:
The Comprehensive Annual Financial Report of the Town of Hilton Head Island, South Carolina, (the Town) for the fiscal year ended June 30, 2011, is submitted in accordance with South Carolina Code Ann., Section 5-7-240 that requires an annual audit of the books of account and financial records of the Town. Management assumes full responsibility for the completeness and reliability of all information presented in this report, based upon a comprehensive framework of internal control that it established for this purpose. Because the cost of internal controls should not outweigh their anticipated benefits, the objective is to provide reasonable rather than absolute assurance that the financial statements are free of any material misstatements.
In relation to the Town of Hilton Head Island’s financial statements being presented fairly and in accordance with generally accepted accounting principles, ElliottDavis, LLC, has issued an unqualified (“clean”) opinion for the year ended June 30, 2011. The independent auditor’s report is located at the front of the financial section of this report. Management’s discussion and analysis (MD&A) immediately follows the independent auditor’s report and provides a narrative introduction, overview and analysis of the basic financial statements. MD&A complements this letter of transmittal and should be read in conjunction with it. Town of Hilton Head Island Profile
The Town of Hilton Head Island, incorporated in 1983, is a barrier island on the Atlantic coast of South Carolina. The Island is located about 30 miles from Savannah, Georgia, and about 90 miles from Charleston, South Carolina. Approximately 54 square miles in area, the Island is about 12 miles long and 5 miles wide. A four-lane bridge over the Intercoastal Waterway connects the Island with the mainland. The Town has jurisdiction over the entire Island except for Mariner's Cove, Blue Heron Point, and Windmill Harbor. The Town is empowered to levy a property tax on both real and personal property located within its boundaries. The Town of Hilton Head Island operates under the council manager-form of government. Policy-making and legislative authority are vested in a governing council (Council) consisting of a mayor and six (6) other members. The Council appoints the government’s manager, who in turn appoints the heads of the various departments. The mayor and each member of council shall be elected for a term of office of four (4) years.
ii
The Town was incorporated under a concept of "Limited Services" government for growth management to provide services of land planning and inspections. To keep the cost of this government low and to avoid duplication of services, contractual arrangements were made with the County to provide for the services of police and property tax billing and collections. The annual budget serves as the foundation for the Town of Hilton Head Island’s financial planning and control. The Town Council formally adopts the budget and legally allocates, or appropriates, available monies for the Town’s various funds. Therefore, these funds have appropriated budgets, and budget to actual information is presented. On or before the second regular Council meeting in June, the Town Manager submits to the City Council a proposed budget for the fiscal year commencing the following July 1. The budget includes proposed expenditures and the means of financing them. Two public hearings are held prior to the budget’s final adoption in order to obtain taxpayer comments. In June, the budget is legally enacted through passage of an ordinance. The ordinance sets the limit for expenditures during the fiscal year. The expenditure appropriations in the adopted budget are by department. The maximum legal expenditure permitted for the fiscal year is the total budget as adopted. Departmental appropriations may be amended during the year in accordance with the budget amendment policies included in the current fiscal year budget document. Local Economy
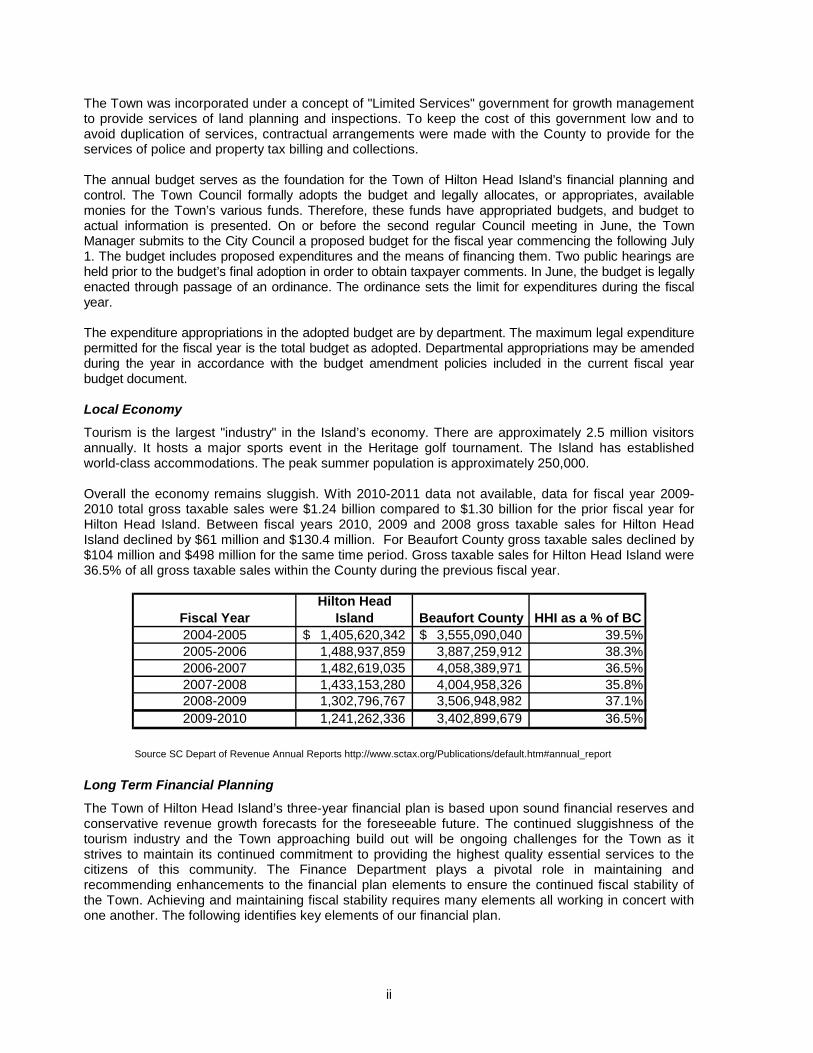
Tourism is the largest "industry" in the Island’s economy. There are approximately 2.5 million visitors annually. It hosts a major sports event in the Heritage golf tournament. The Island has established world-class accommodations. The peak summer population is approximately 250,000. Overall the economy remains sluggish. With 2010-2011 data not available, data for fiscal year 2009-2010 total gross taxable sales were $1.24 billion compared to $1.30 billion for the prior fiscal year for Hilton Head Island. Between fiscal years 2010, 2009 and 2008 gross taxable sales for Hilton Head Island declined by $61 million and $130.4 million. For Beaufort County gross taxable sales declined by $104 million and $498 million for the same time period. Gross taxable sales for Hilton Head Island were 36.5% of all gross taxable sales within the County during the previous fiscal year.
Fiscal YearHilton Head
Island Beaufort County HHI as a % of BC2004-2005 1,405,620,342$ 3,555,090,040$ 39.5%2005-2006 1,488,937,859 3,887,259,912 38.3%2006-2007 1,482,619,035 4,058,389,971 36.5%2007-2008 1,433,153,280 4,004,958,326 35.8%2008-2009 1,302,796,767 3,506,948,982 37.1%2009-2010 1,241,262,336 3,402,899,679 36.5%
Source SC Depart of Revenue Annual Reports http://www.sctax.org/Publications/default.htm#annual_report Long Term Financial Planning
The Town of Hilton Head Island’s three-year financial plan is based upon sound financial reserves and conservative revenue growth forecasts for the foreseeable future. The continued sluggishness of the tourism industry and the Town approaching build out will be ongoing challenges for the Town as it strives to maintain its continued commitment to providing the highest quality essential services to the citizens of this community. The Finance Department plays a pivotal role in maintaining and recommending enhancements to the financial plan elements to ensure the continued fiscal stability of the Town. Achieving and maintaining fiscal stability requires many elements all working in concert with one another. The following identifies key elements of our financial plan.
iii
Adopted Financial Policies Financial policies establish the framework for the Town’s overall fiscal planning and management. They set forth guidelines against which current budgetary performance can be measured and proposals for future programs can be evaluated. These policies set the tone for all fiscal decisions made by staff and Town Council. The Town currently has financial policies governing operations, capital planning, debt management, reserves and financial reporting. Regular reviews and enhancement of these policies are done in conjunction with the financial plan development and are adopted annually by Town Council. Financial Resource Planning The Town’s strategic financial planning begins with determining the Town’s fiscal capacity based upon long-term financial forecasts of recurring available revenues. Conservative financial forecasts coupled with financial trend analysis techniques and careful reserve analysis help preserve the fiscal wellbeing of the Town of Hilton Head Island. Strategic financial capacity planning is a critical element to reach long-term financial stability goals and to determine special financial needs for critical objectives of the Town Council. Multi-Year Operating Budget Planning Multi-year budget planning encompasses long-range operating expenditure plans, which are linked to community expectations and broad goals of the Town Council. The multi-year approach provides a better opportunity for staff to change its financial paradigm from what do we need this year to how do we accomplish our level of service objectives over time, given our financial capacity. While the Town is required to adopt an annual budget to meet State statutory requirements, the Town builds a three-year financial plan to help anticipate future impacts and ensure achievement of Town objectives. Capital Improvement Project Planning The Town’s Capital Improvement Program is planned for ten years and analyzed using specific prioritization criteria. The impact of projects on operating costs are planned and considered in developing future operating budget plans. Pay-as-you-go funding sources are conservatively estimated to avoid over-committing to capital construction using revenues that are not certain. To the extent debt financing is used, capital project plans are sized to conform to existing debt management policies. Debt Management All debt issued by the Town is for the purpose of financing capital infrastructure or long-lived costly assets. Each debt issuance is evaluated in respect to debt service as a percentage of operating expenditures, tax and revenue bases for the repayment of debt, the overall debt burden on the community, statutory limitations and factors affecting tax-exempt interest costs. In all cases a long-term analysis is made considering the financial (debt) capacity that best fits the Town’s ability to pay for capital projects. The size of the capital improvement program based on debt capacity in conjunction with conservatively estimated revenues (pay-as-you-go projects) helps stabilize per capita debt and lower annual debt service costs to the Town over the long-term. The Town’s credit ratings on its outstanding bonds are Aaa, AA+, AA+, from the three major credit ratings agencies, Moody’s Investor Service, Standard and Poor’s Rating Group, and Fitch Ratings, respectively. These ratings reinforce confidence in our efforts to maintain a fiscally sound operation through uncertain economic times.
iv
Major Initiatives
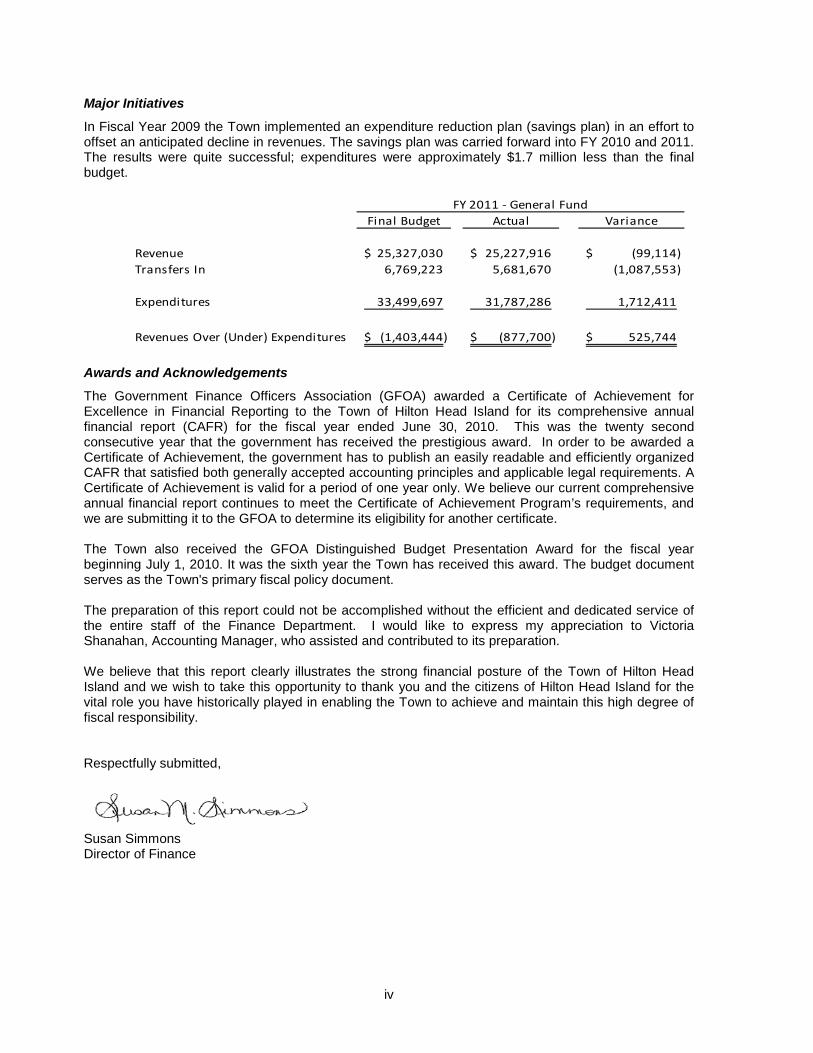
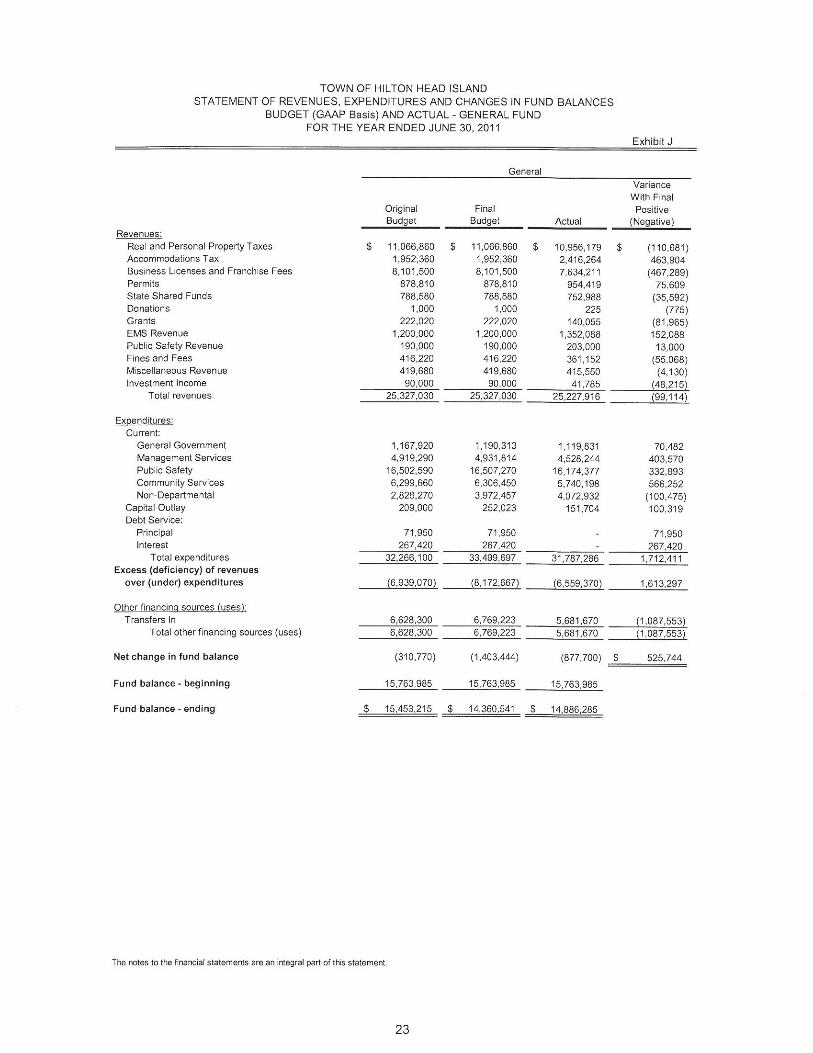
In Fiscal Year 2009 the Town implemented an expenditure reduction plan (savings plan) in an effort to offset an anticipated decline in revenues. The savings plan was carried forward into FY 2010 and 2011. The results were quite successful; expenditures were approximately $1.7 million less than the final budget.
Final Budget Actual Variance
Revenue 25,327,030$ 25,227,916$ (99,114)$ Transfers In 6,769,223 5,681,670 (1,087,553)
Expenditures 33,499,697 31,787,286 1,712,411
Revenues Over (Under) Expenditures (1,403,444)$ (877,700)$ 525,744$
FY 2011 - General Fund
Awards and Acknowledgements
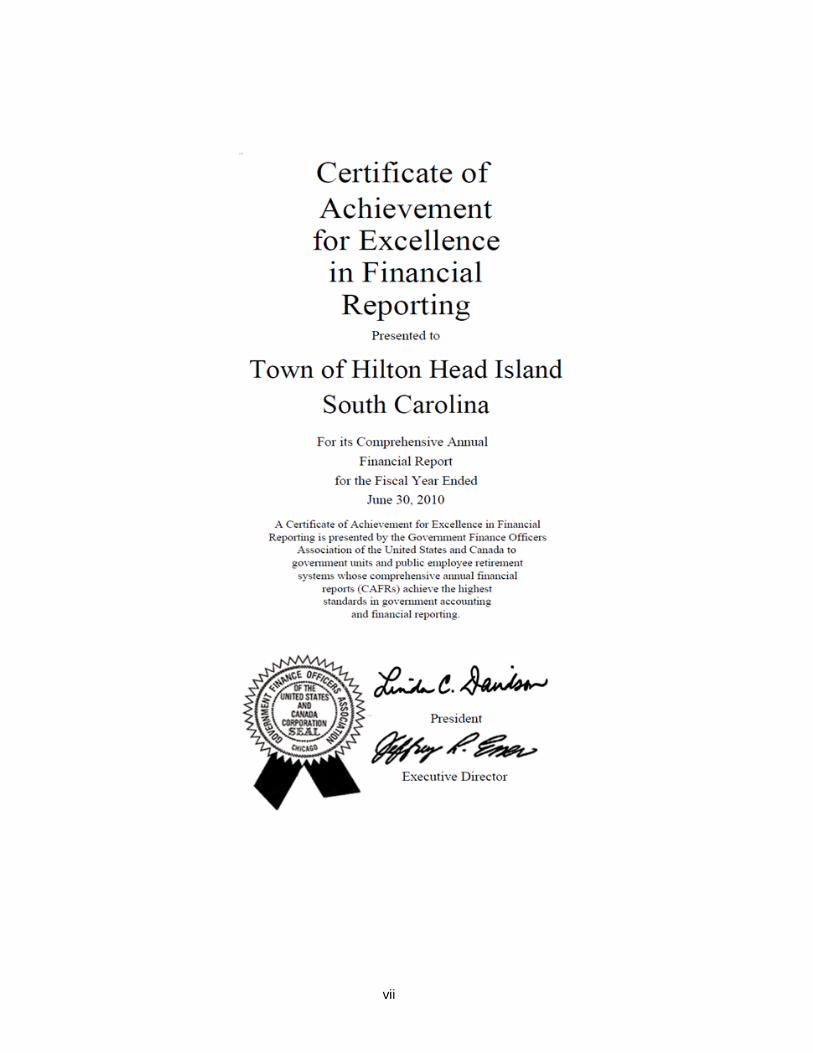
The Government Finance Officers Association (GFOA) awarded a Certificate of Achievement for Excellence in Financial Reporting to the Town of Hilton Head Island for its comprehensive annual financial report (CAFR) for the fiscal year ended June 30, 2010. This was the twenty second consecutive year that the government has received the prestigious award. In order to be awarded a Certificate of Achievement, the government has to publish an easily readable and efficiently organized CAFR that satisfied both generally accepted accounting principles and applicable legal requirements. A Certificate of Achievement is valid for a period of one year only. We believe our current comprehensive annual financial report continues to meet the Certificate of Achievement Program’s requirements, and we are submitting it to the GFOA to determine its eligibility for another certificate. The Town also received the GFOA Distinguished Budget Presentation Award for the fiscal year beginning July 1, 2010. It was the sixth year the Town has received this award. The budget document serves as the Town's primary fiscal policy document. The preparation of this report could not be accomplished without the efficient and dedicated service of the entire staff of the Finance Department. I would like to express my appreciation to Victoria Shanahan, Accounting Manager, who assisted and contributed to its preparation. We believe that this report clearly illustrates the strong financial posture of the Town of Hilton Head Island and we wish to take this opportunity to thank you and the citizens of Hilton Head Island for the vital role you have historically played in enabling the Town to achieve and maintain this high degree of fiscal responsibility. Respectfully submitted,
Susan Simmons Director of Finance
v
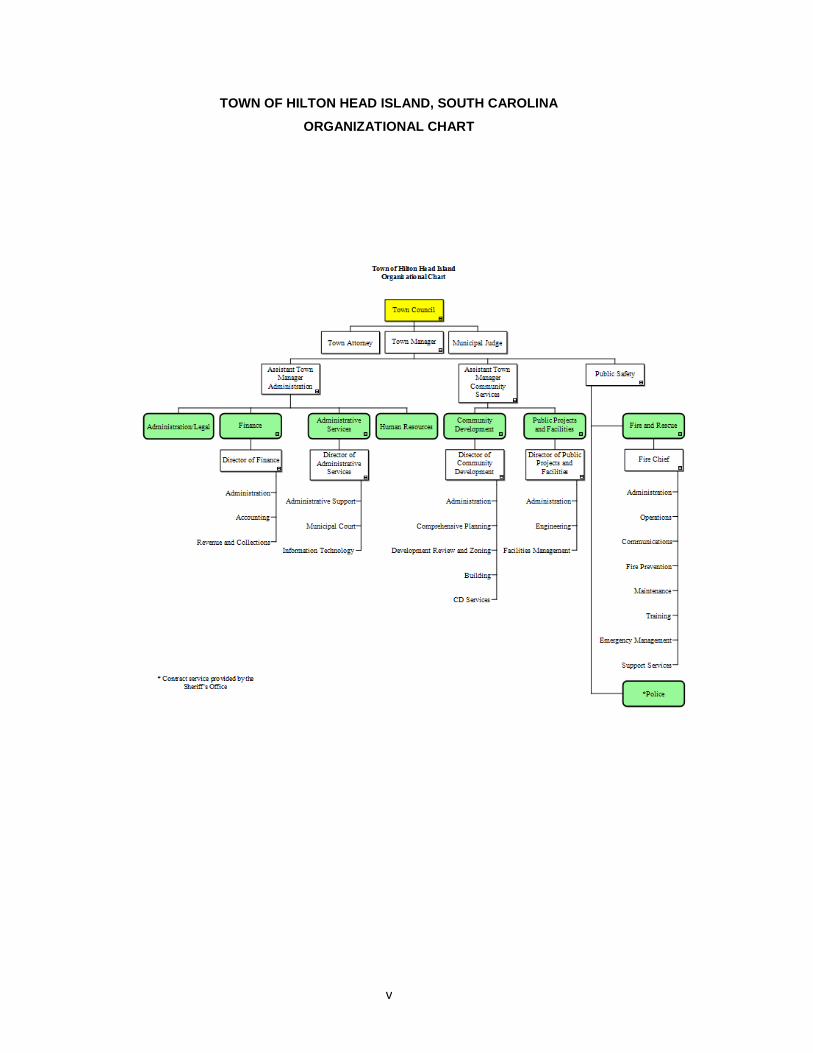
TOWN OF HILTON HEAD ISLAND, SOUTH CAROLINA
ORGANIZATIONAL CHART
vi
vii

Financial Section
3
TOWN OF HILTON HEAD ISLAND, SOUTH CAROLINA MANAGEMENT’S DISCUSSION AND ANALYSIS
YEAR ENDED JUNE 30, 2011
This section of the Town of Hilton Head Island’s annual financial report represents its discussion and analysis of the Town’s financial performance during the fiscal year ended June 30, 2011. The information in this section should be considered in conjunction with information provided in the transmittal letter and detailed financial statements contained elsewhere in this document. Financial Highlights
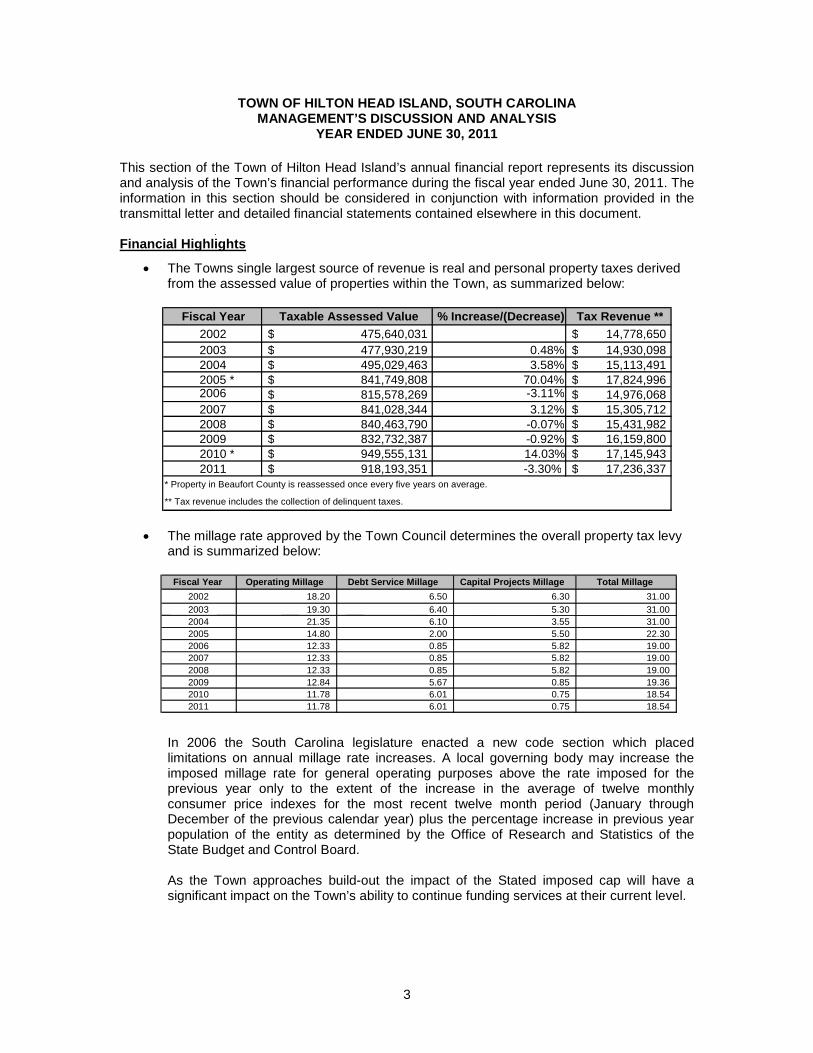
• The Towns single largest source of revenue is real and personal property taxes derived from the assessed value of properties within the Town, as summarized below:
• The millage rate approved by the Town Council determines the overall property tax levy
and is summarized below:
In 2006 the South Carolina legislature enacted a new code section which placed limitations on annual millage rate increases. A local governing body may increase the imposed millage rate for general operating purposes above the rate imposed for the previous year only to the extent of the increase in the average of twelve monthly consumer price indexes for the most recent twelve month period (January through December of the previous calendar year) plus the percentage increase in previous year population of the entity as determined by the Office of Research and Statistics of the State Budget and Control Board.
As the Town approaches build-out the impact of the Stated imposed cap will have a
significant impact on the Town’s ability to continue funding services at their current level.
Fiscal Year Operating Millage Debt Service Millage Capital Projects Millage Total Millage 2002 18.20 6.50 6.30 31.00 2003 19.30 6.40 5.30 31.00 2004 21.35 6.10 3.55 31.00 2005 14.80 2.00 5.50 22.30 2006 12.33 0.85 5.82 19.00 2007 12.33 0.85 5.82 19.00 2008 12.33 0.85 5.82 19.00 2009 12.84 5.67 0.85 19.36 2010 11.78 6.01 0.75 18.54 2011 11.78 6.01 0.75 18.54
Fiscal Year Taxable Assessed Value % Increase/(Decrease) Tax Revenue ** 2002 475,640,031 $ 14,778,650 $ 2003 477,930,219 $ 0.48% 14,930,098 $ 2004 495,029,463 $ 3.58% 15,113,491 $ 2005 * 841,749,808 $ 70.04% 17,824,996 $ 2006 815,578,269 $ -3.11% 14,976,068 $ 2007 841,028,344 $ 3.12% 15,305,712 $ 2008 840,463,790 $ -0.07% 15,431,982 $ 2009 832,732,387 $ -0.92% 16,159,800 $ 2010 * 949,555,131 $ 14.03% 17,145,943 $ 2011 918,193,351 $ -3.30% 17,236,337 $
* Property in Beaufort County is reassessed once every five years on average. ** Tax revenue includes the collection of delinquent taxes.
4
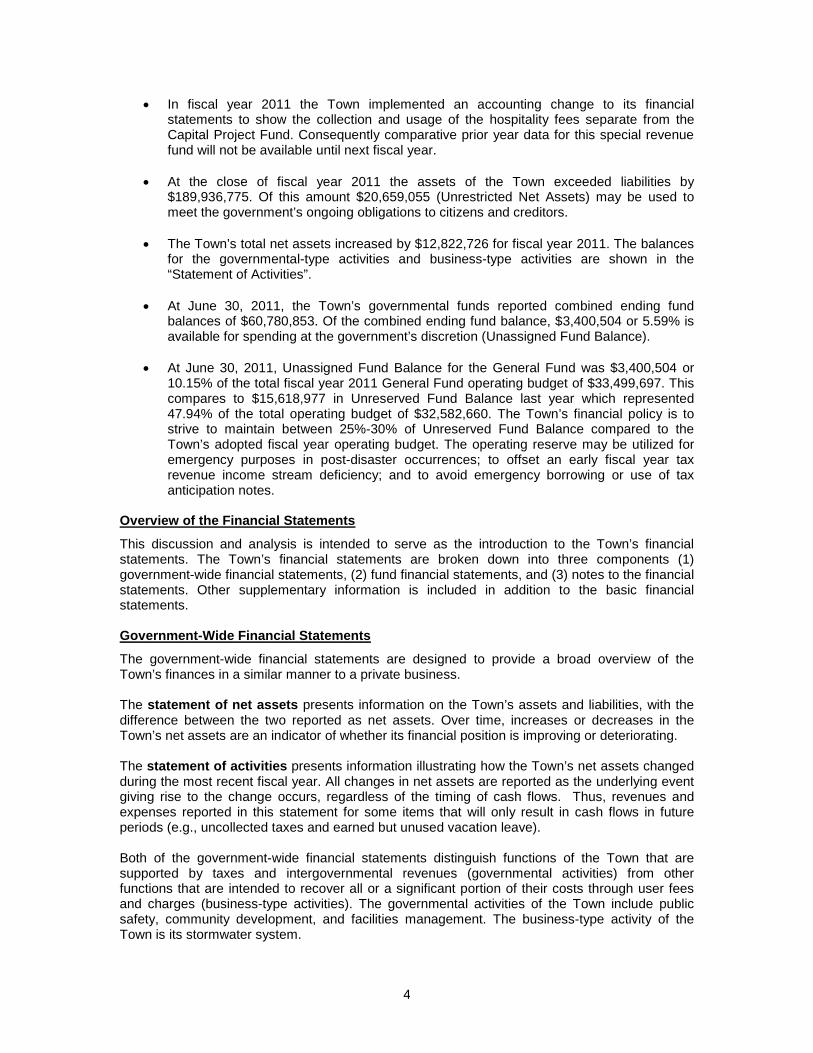
• In fiscal year 2011 the Town implemented an accounting change to its financial statements to show the collection and usage of the hospitality fees separate from the Capital Project Fund. Consequently comparative prior year data for this special revenue fund will not be available until next fiscal year.
• At the close of fiscal year 2011 the assets of the Town exceeded liabilities by
$189,936,775. Of this amount $20,659,055 (Unrestricted Net Assets) may be used to meet the government’s ongoing obligations to citizens and creditors.
• The Town’s total net assets increased by $12,822,726 for fiscal year 2011. The balances
for the governmental-type activities and business-type activities are shown in the “Statement of Activities”.
• At June 30, 2011, the Town’s governmental funds reported combined ending fund
balances of $60,780,853. Of the combined ending fund balance, $3,400,504 or 5.59% is available for spending at the government’s discretion (Unassigned Fund Balance).
• At June 30, 2011, Unassigned Fund Balance for the General Fund was $3,400,504 or
10.15% of the total fiscal year 2011 General Fund operating budget of $33,499,697. This compares to $15,618,977 in Unreserved Fund Balance last year which represented 47.94% of the total operating budget of $32,582,660. The Town’s financial policy is to strive to maintain between 25%-30% of Unreserved Fund Balance compared to the Town’s adopted fiscal year operating budget. The operating reserve may be utilized for emergency purposes in post-disaster occurrences; to offset an early fiscal year tax revenue income stream deficiency; and to avoid emergency borrowing or use of tax anticipation notes.
Overview of the Financial Statements
This discussion and analysis is intended to serve as the introduction to the Town’s financial statements. The Town’s financial statements are broken down into three components (1) government-wide financial statements, (2) fund financial statements, and (3) notes to the financial statements. Other supplementary information is included in addition to the basic financial statements. Government-Wide Financial Statements
The government-wide financial statements are designed to provide a broad overview of the Town’s finances in a similar manner to a private business. The statement of net assets presents information on the Town’s assets and liabilities, with the difference between the two reported as net assets. Over time, increases or decreases in the Town’s net assets are an indicator of whether its financial position is improving or deteriorating. The statement of activities presents information illustrating how the Town’s net assets changed during the most recent fiscal year. All changes in net assets are reported as the underlying event giving rise to the change occurs, regardless of the timing of cash flows. Thus, revenues and expenses reported in this statement for some items that will only result in cash flows in future periods (e.g., uncollected taxes and earned but unused vacation leave). Both of the government-wide financial statements distinguish functions of the Town that are supported by taxes and intergovernmental revenues (governmental activities) from other functions that are intended to recover all or a significant portion of their costs through user fees and charges (business-type activities). The governmental activities of the Town include public safety, community development, and facilities management. The business-type activity of the Town is its stormwater system.
5
Fund Financial Statements
A fund is a grouping of related accounts that is used to maintain control over resources that have been segregated for specific activities or objectives. Fund financial statements are designed to demonstrate compliance with finance-related legal requirements. All of the funds of the Town can be divided into three categories: governmental funds, fiduciary fund, and proprietary funds. Governmental Funds
Governmental funds are used to account for essentially the same functions reported as government activities in the government-wide financial statements. However, unlike the government-wide financial statements, the governmental funds financial statements focus on near-term inflows and outflows of spendable resources as well as on balances of spendable resources available at the end of the fiscal year. Such information may be useful in determining what financial resources are available in the near future to finance the Town’s programs. Because the focus of governmental funds is narrower than the government-wide statements, it is useful to compare the information presented for the governmental funds with similar information presented for governmental activities in the government-wide financial statements. By doing so, readers may better understand the long-term impact of the government’s near-term financing decisions. Both the governmental funds balance sheet and the governmental funds statement of revenues, expenditures and changes in fund balances provide a reconciliation to facilitate this comparison between governmental funds and governmental activities. The Town maintains ten governmental funds. Eight are classified as major funds: General Fund, Tax Increment Financing (TIF) District, Accommodations Tax (State), Real Estate Transfer Fee, Beach Preservation Fee, Hospitality Fee, Debt Service Fund, and the Capital Projects Fund. Two are classified as non-major funds: Palmetto Electric and Home Grant. For reporting purposes on the fund financial statements, the special revenue funds are consolidated under the heading Non-major Governmental Funds. The Town of Hilton Head Island adopts an annual budget for its General Fund, Capital Projects Fund, and the Debt Service Fund. The budget is a legally adopted document that incorporates input from the citizens of the Town, the management of the Town, and the decisions of the Town Council about which services to provide and how to pay for them. Proprietary Funds
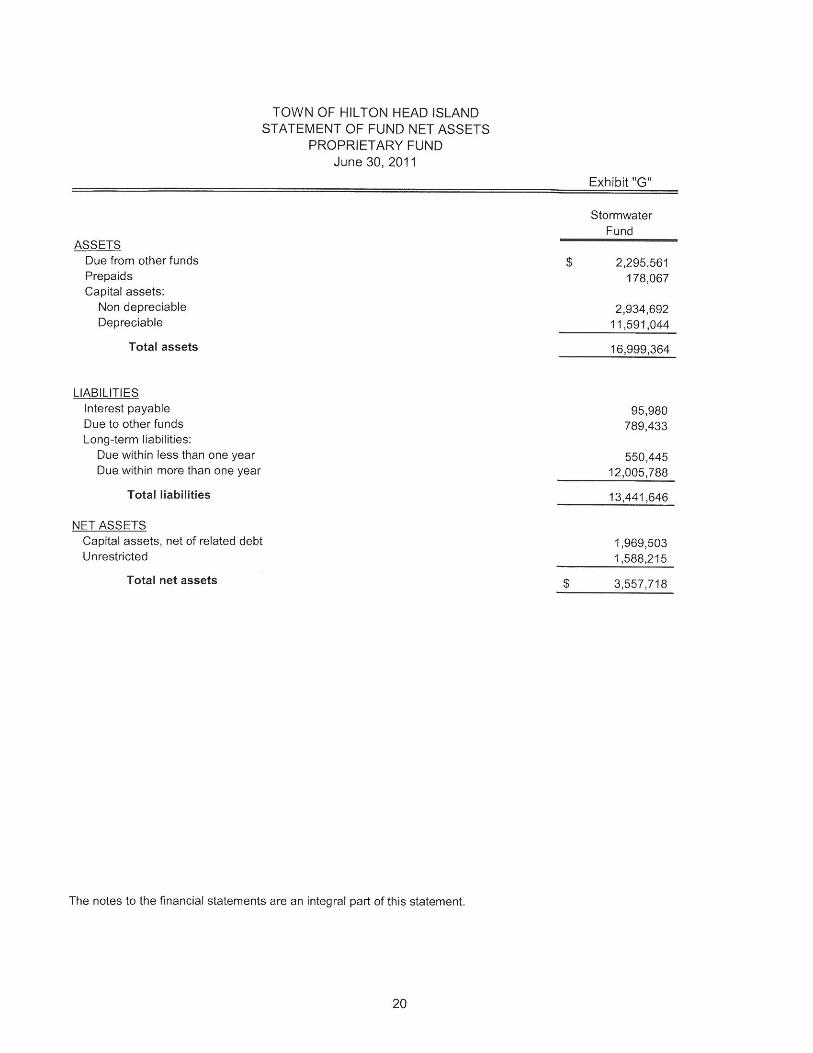
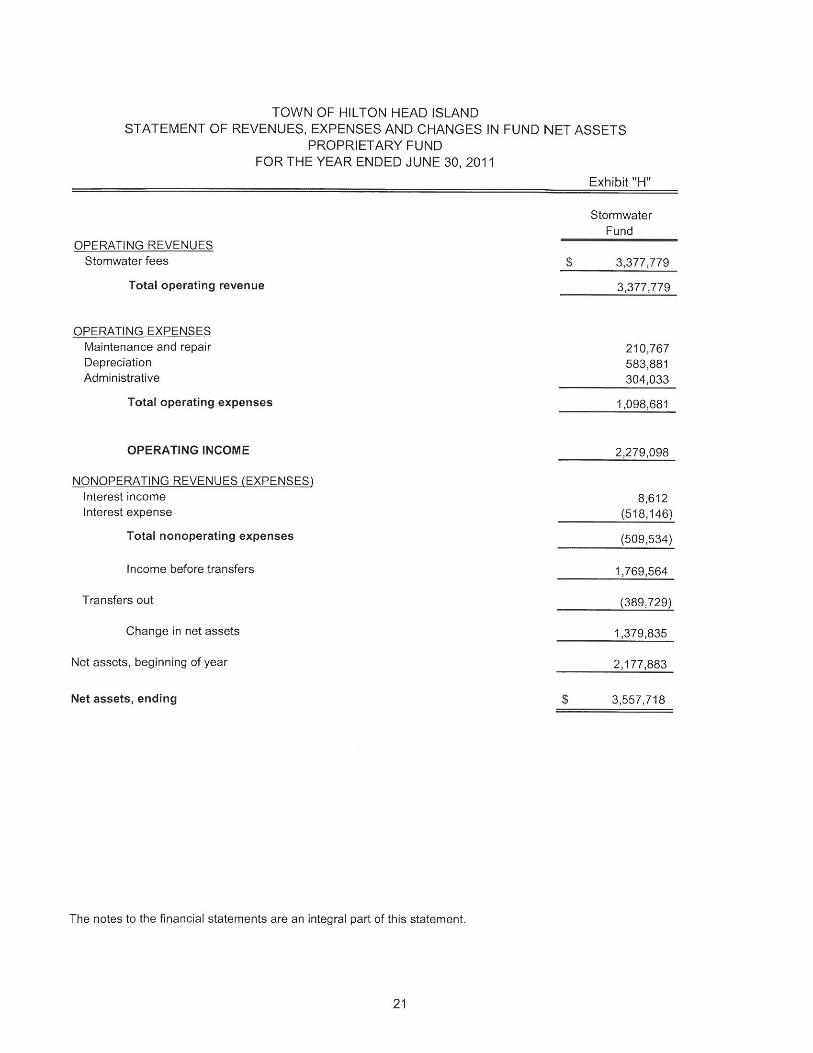
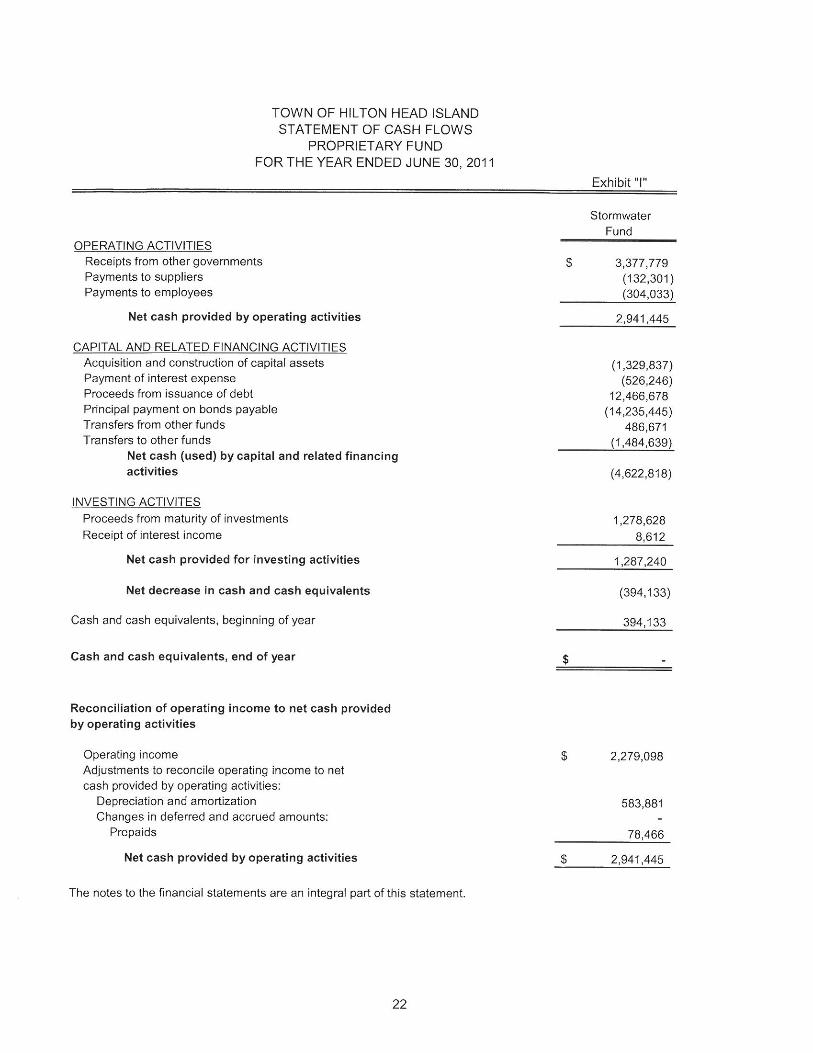
The Town maintains one type of Proprietary Fund, an enterprise fund. This fund is used to report the same functions presented as business-type activities in the government-wide financial statements, only in more detail. The proprietary fund financial statements provide financial information related to the Town’s stormwater system operations. Fiduciary Funds
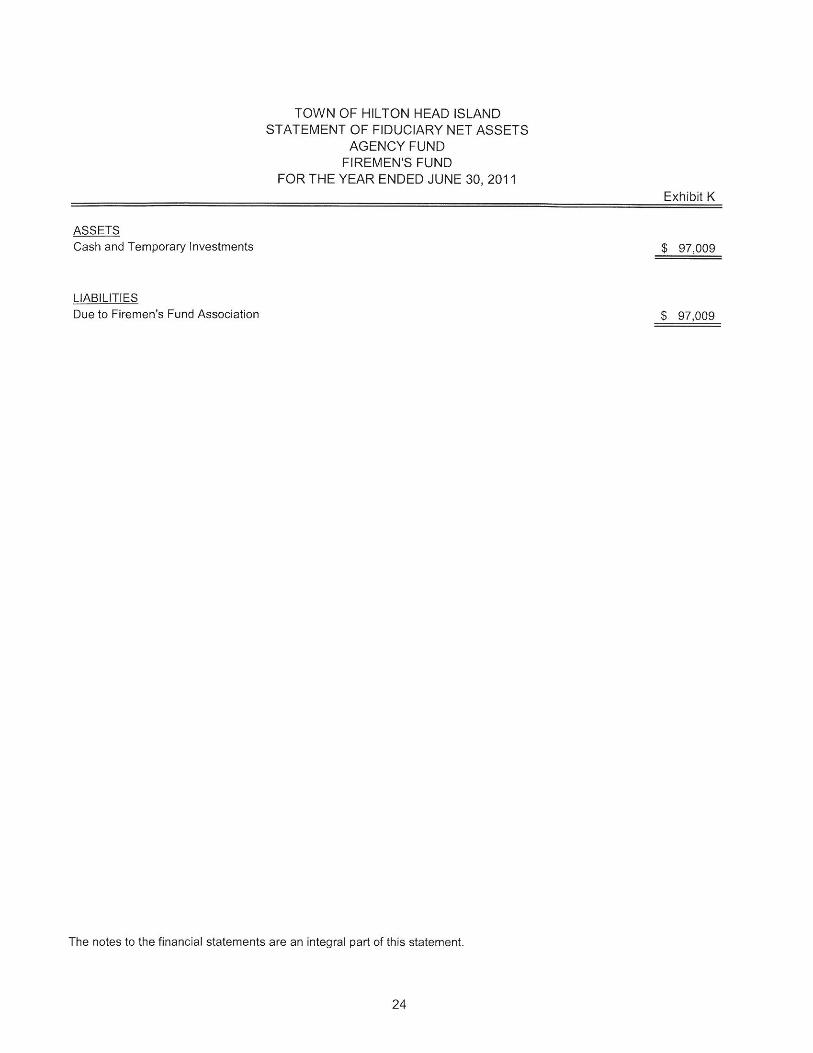
The Town maintains one Fiduciary Fund, the Firemen’s Fund. This fund is used to account for certain funds held on behalf of the Town’s firemen. The activity associated with this fund is excluded from the Town’s financial statements because the Town cannot use these assets to finance its operations. The Town is responsible for ensuring that the assets reported in this fund are used for their intended purposes. Notes to the Financial Statements
The notes to the financial statements provide additional information that is essential to the full understanding of the data provided in the government-wide and fund financial statements. In addition to the basic financial statements and accompanying notes, the report also contains certain required supplementary information.
6
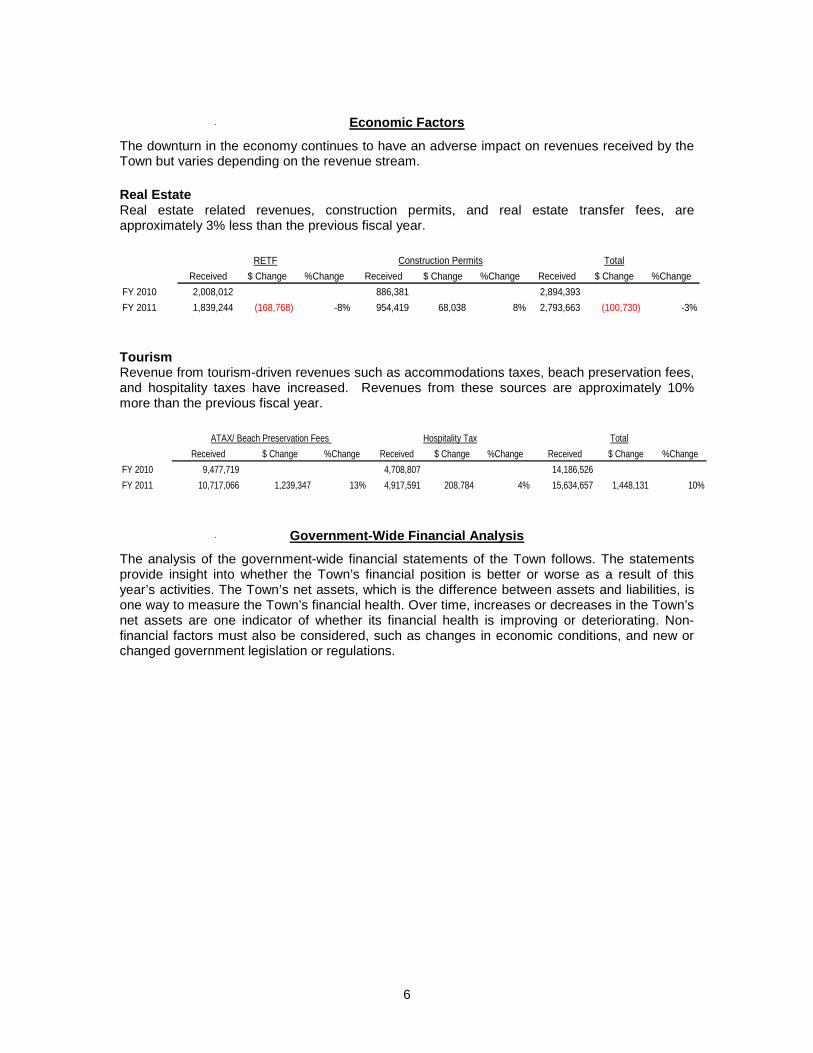
Economic Factors
The downturn in the economy continues to have an adverse impact on revenues received by the Town but varies depending on the revenue stream. Real Estate Real estate related revenues, construction permits, and real estate transfer fees, are approximately 3% less than the previous fiscal year.
Received $ Change %Change Received $ Change %Change Received $ Change %ChangeFY 2010 2,008,012 886,381 2,894,393 FY 2011 1,839,244 (168,768) -8% 954,419 68,038 8% 2,793,663 (100,730) -3%
RETF Construction Permits Total
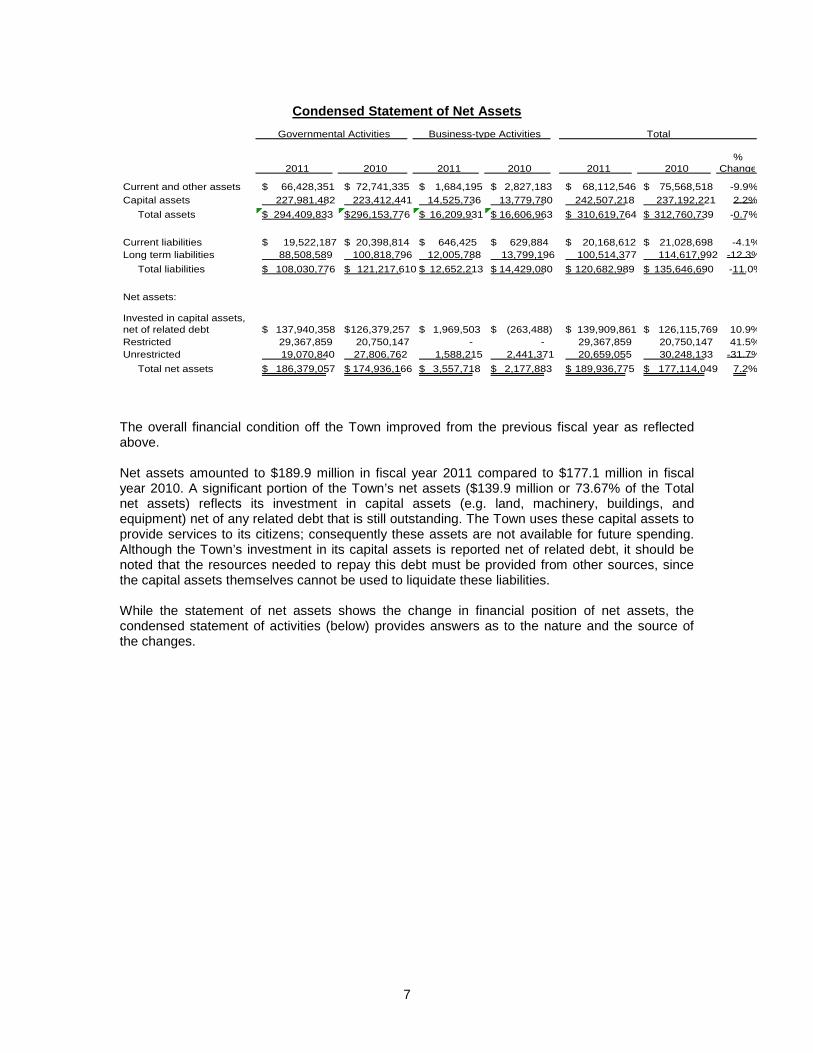
Tourism Revenue from tourism-driven revenues such as accommodations taxes, beach preservation fees, and hospitality taxes have increased. Revenues from these sources are approximately 10% more than the previous fiscal year.
Received $ Change %Change Received $ Change %Change Received $ Change %ChangeFY 2010 9,477,719 4,708,807 14,186,526 FY 2011 10,717,066 1,239,347 13% 4,917,591 208,784 4% 15,634,657 1,448,131 10%
ATAX/ Beach Preservation Fees Hospitality Tax Total
Government-Wide Financial Analysis
The analysis of the government-wide financial statements of the Town follows. The statements provide insight into whether the Town’s financial position is better or worse as a result of this year’s activities. The Town’s net assets, which is the difference between assets and liabilities, is one way to measure the Town’s financial health. Over time, increases or decreases in the Town’s net assets are one indicator of whether its financial health is improving or deteriorating. Non-financial factors must also be considered, such as changes in economic conditions, and new or changed government legislation or regulations.
7
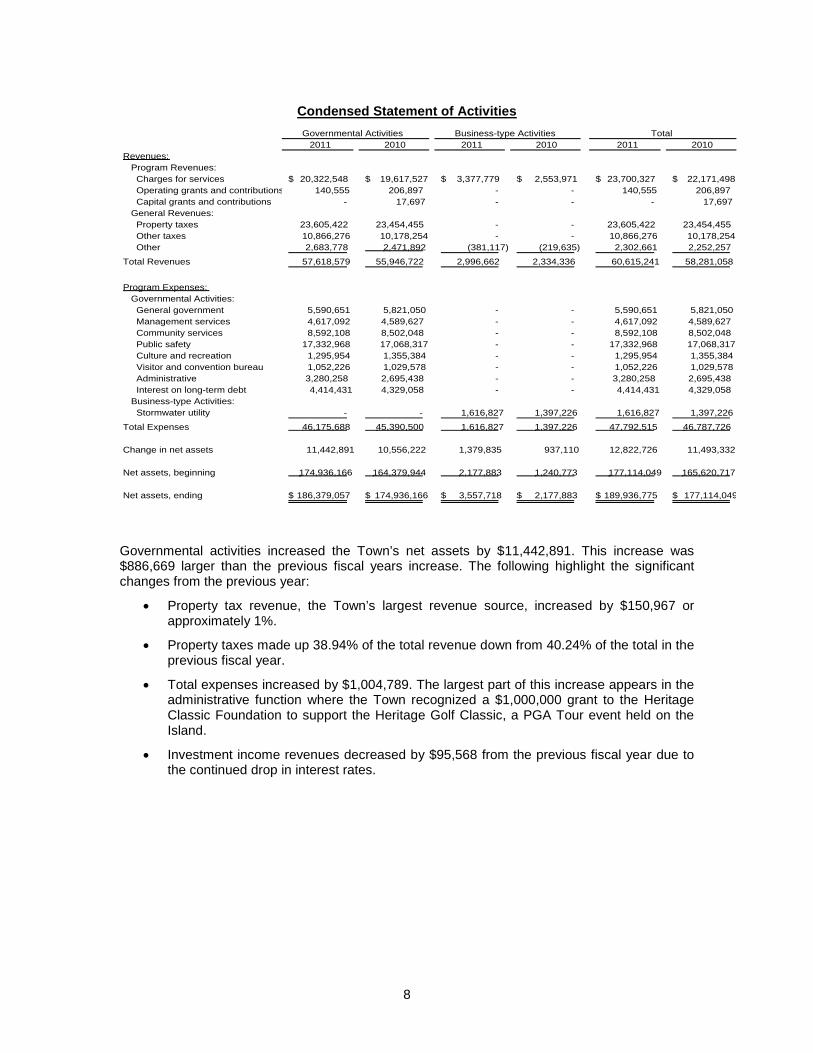
Condensed Statement of Net Assets
2011 2010 2011 2010 2011 2010%
Change
Current and other assets 66,428,351$ 72,741,335$ 1,684,195$ 2,827,183$ 68,112,546$ 75,568,518$ -9.9%Capital assets 227,981,482 223,412,441 14,525,736 13,779,780 242,507,218 237,192,221 2.2% Total assets 294,409,833$ 296,153,776$ 16,209,931$ 16,606,963$ 310,619,764$ 312,760,739$ -0.7%
Current liabilities 19,522,187$ 20,398,814$ 646,425$ 629,884$ 20,168,612$ 21,028,698$ -4.1%Long term liabilities 88,508,589 100,818,796 12,005,788 13,799,196 100,514,377 114,617,992 -12.3% Total liabilities 108,030,776$ 121,217,610$ 12,652,213$ 14,429,080$ 120,682,989$ 135,646,690$ -11.0%
Net assets:
Invested in capital assets, net of related debt 137,940,358$ 126,379,257$ 1,969,503$ (263,488)$ 139,909,861$ 126,115,769$ 10.9%Restricted 29,367,859 20,750,147 - - 29,367,859 20,750,147 41.5%Unrestricted 19,070,840 27,806,762 1,588,215 2,441,371 20,659,055 30,248,133 -31.7% Total net assets 186,379,057$ 174,936,166$ 3,557,718$ 2,177,883$ 189,936,775$ 177,114,049$ 7.2%
Governmental Activities Business-type Activities Total
The overall financial condition off the Town improved from the previous fiscal year as reflected above. Net assets amounted to $189.9 million in fiscal year 2011 compared to $177.1 million in fiscal year 2010. A significant portion of the Town’s net assets ($139.9 million or 73.67% of the Total net assets) reflects its investment in capital assets (e.g. land, machinery, buildings, and equipment) net of any related debt that is still outstanding. The Town uses these capital assets to provide services to its citizens; consequently these assets are not available for future spending. Although the Town’s investment in its capital assets is reported net of related debt, it should be noted that the resources needed to repay this debt must be provided from other sources, since the capital assets themselves cannot be used to liquidate these liabilities. While the statement of net assets shows the change in financial position of net assets, the condensed statement of activities (below) provides answers as to the nature and the source of the changes.
8
Condensed Statement of Activities
2011 2010 2011 2010 2011 2010Revenues: Program Revenues: Charges for services 20,322,548$ 19,617,527$ 3,377,779$ 2,553,971$ 23,700,327$ 22,171,498$ Operating grants and contributions 140,555 206,897 - - 140,555 206,897 Capital grants and contributions - 17,697 - - - 17,697 General Revenues: Property taxes 23,605,422 23,454,455 - - 23,605,422 23,454,455 Other taxes 10,866,276 10,178,254 - - 10,866,276 10,178,254 Other 2,683,778 2,471,892 (381,117) (219,635) 2,302,661 2,252,257
Total Revenues 57,618,579 55,946,722 2,996,662 2,334,336 60,615,241 58,281,058
Program Expenses: Governmental Activities: General government 5,590,651 5,821,050 - - 5,590,651 5,821,050 Management services 4,617,092 4,589,627 - - 4,617,092 4,589,627 Community services 8,592,108 8,502,048 - - 8,592,108 8,502,048 Public safety 17,332,968 17,068,317 - - 17,332,968 17,068,317 Culture and recreation 1,295,954 1,355,384 - - 1,295,954 1,355,384 Visitor and convention bureau 1,052,226 1,029,578 - - 1,052,226 1,029,578 Administrative 3,280,258 2,695,438 - - 3,280,258 2,695,438 Interest on long-term debt 4,414,431 4,329,058 - - 4,414,431 4,329,058 Business-type Activities: Stormwater utility - - 1,616,827 1,397,226 1,616,827 1,397,226
Total Expenses 46,175,688 45,390,500 1,616,827 1,397,226 47,792,515 46,787,726
Change in net assets 11,442,891 10,556,222 1,379,835 937,110 12,822,726 11,493,332
Net assets, beginning 174,936,166 164,379,944 2,177,883 1,240,773 177,114,049 165,620,717
Net assets, ending 186,379,057$ 174,936,166$ 3,557,718$ 2,177,883$ 189,936,775$ 177,114,049$
Governmental Activities Business-type Activities Total
Governmental activities increased the Town’s net assets by $11,442,891. This increase was $886,669 larger than the previous fiscal years increase. The following highlight the significant changes from the previous year:
• Property tax revenue, the Town’s largest revenue source, increased by $150,967 or approximately 1%.
• Property taxes made up 38.94% of the total revenue down from 40.24% of the total in the previous fiscal year.
• Total expenses increased by $1,004,789. The largest part of this increase appears in the administrative function where the Town recognized a $1,000,000 grant to the Heritage Classic Foundation to support the Heritage Golf Classic, a PGA Tour event held on the Island.
• Investment income revenues decreased by $95,568 from the previous fiscal year due to the continued drop in interest rates.
9
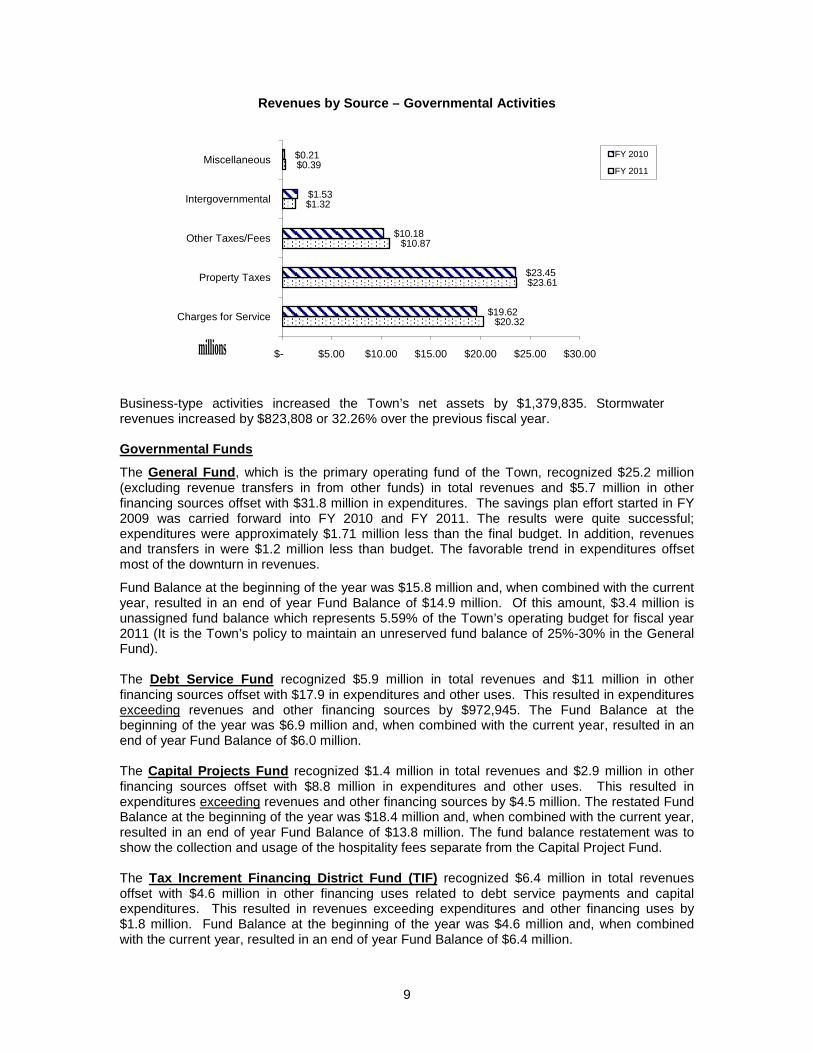
Revenues by Source – Governmental Activities
Business-type activities increased the Town’s net assets by $1,379,835. Stormwater revenues increased by $823,808 or 32.26% over the previous fiscal year.
Governmental Funds
The General Fund, which is the primary operating fund of the Town, recognized $25.2 million (excluding revenue transfers in from other funds) in total revenues and $5.7 million in other financing sources offset with $31.8 million in expenditures. The savings plan effort started in FY 2009 was carried forward into FY 2010 and FY 2011. The results were quite successful; expenditures were approximately $1.71 million less than the final budget. In addition, revenues and transfers in were $1.2 million less than budget. The favorable trend in expenditures offset most of the downturn in revenues.
Fund Balance at the beginning of the year was $15.8 million and, when combined with the current year, resulted in an end of year Fund Balance of $14.9 million. Of this amount, $3.4 million is unassigned fund balance which represents 5.59% of the Town’s operating budget for fiscal year 2011 (It is the Town’s policy to maintain an unreserved fund balance of 25%-30% in the General Fund). The Debt Service Fund recognized $5.9 million in total revenues and $11 million in other financing sources offset with $17.9 in expenditures and other uses. This resulted in expenditures exceeding revenues and other financing sources by $972,945. The Fund Balance at the beginning of the year was $6.9 million and, when combined with the current year, resulted in an end of year Fund Balance of $6.0 million. The Capital Projects Fund recognized $1.4 million in total revenues and $2.9 million in other financing sources offset with $8.8 million in expenditures and other uses. This resulted in expenditures exceeding revenues and other financing sources by $4.5 million. The restated Fund Balance at the beginning of the year was $18.4 million and, when combined with the current year, resulted in an end of year Fund Balance of $13.8 million. The fund balance restatement was to show the collection and usage of the hospitality fees separate from the Capital Project Fund. The Tax Increment Financing District Fund (TIF) recognized $6.4 million in total revenues offset with $4.6 million in other financing uses related to debt service payments and capital expenditures. This resulted in revenues exceeding expenditures and other financing uses by $1.8 million. Fund Balance at the beginning of the year was $4.6 million and, when combined with the current year, resulted in an end of year Fund Balance of $6.4 million.
$20.32
$23.61
$10.87
$1.32
$0.39
$19.62
$23.45
$10.18
$1.53
$0.21
$- $5.00 $10.00 $15.00 $20.00 $25.00 $30.00
Charges for Service
Property Taxes
Other Taxes/Fees
Intergovernmental
Miscellaneous FY 2010
FY 2011
millions
10
The Accommodations Tax Fund * recognized $3.5 million in total revenues offset with $2.3 million in expenditures and $1.1 million in other financing uses. This resulted in revenues exceeding expenditures by $101,938. Fund Balance at the beginning of the year was $1.3 million and, when combined with the current year resulted in a end of year Fund Balance of $1.4 million. The Real Estate Transfer Fee Fund * recognized $1.8 million in total revenues and $1.0 million in other financing sources, offset with $18,393 in expenditures and $3.5 million in other financing uses. This resulted in expenditures exceeding revenues by $678,460. Fund Balance at the beginning of the year was $1.8 million and, when combined with the current year, resulted in an end of year Fund Balance of $1.1 million. The Beach Preservation Fee Fund * recognized $4.9 million in total revenues offset with $4.4 million in other financing uses and $142,905 in expenditures. This resulted in revenues exceeding expenditures by $346,870. Fund Balance at the beginning of the year was $14.5 million and, when combined with the current year, resulted in an end of year Fund Balance of $14.8 million. The Hospitality Fee Fund * recognized $4.9 million in total revenues offset with $5.2 million in other financing uses. This resulted in other financing uses exceeding revenues by $313,459. The restated Fund Balance at the beginning of the year was $2.1 million and, when combined with the current year, resulted in an end of year Fund Balance of $1.8 million. The fund balance restatement was to show the collection and usage of the hospitality fees separate from the Capital Project Fund.
* Revenue from these sources has declined due to the overall downturn in the economy. Sufficient revenues exist to cover fixed expenditures associated with debt service payments (if applicable) while all other expenditures and transfers to the General Fund or Capital Projects Fund have been reduced wherever possible to minimize the impact of the decline in revenues.
11
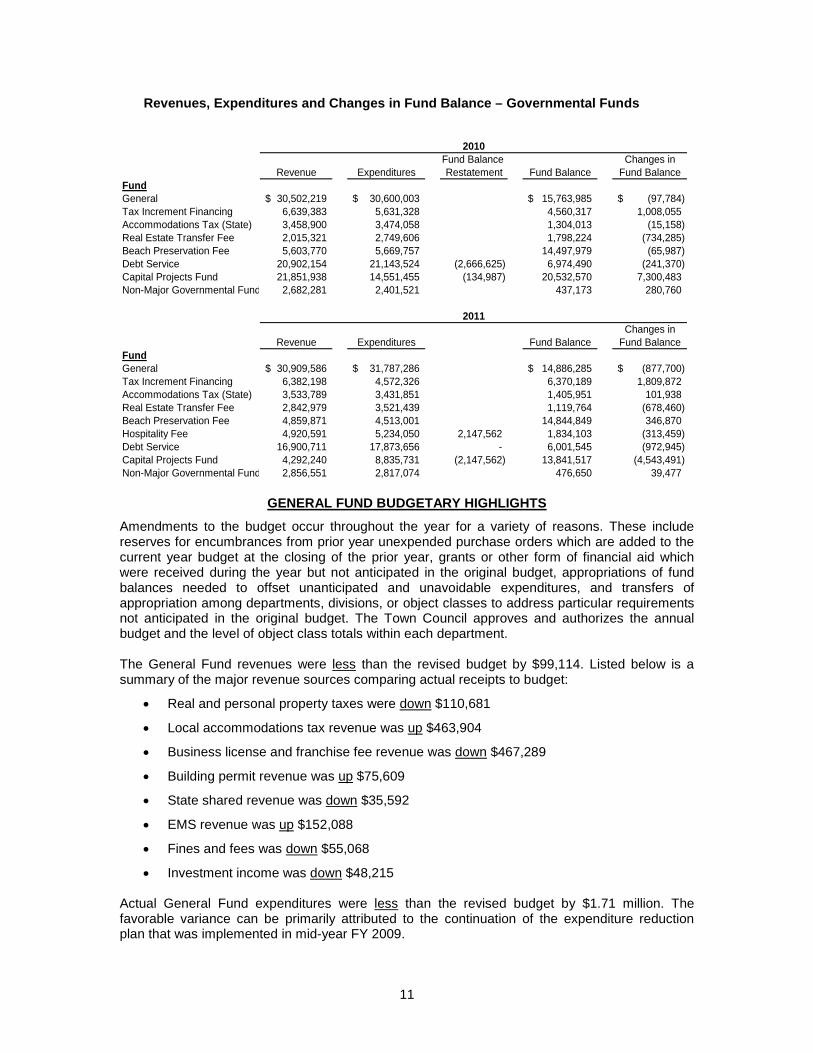
Revenues, Expenditures and Changes in Fund Balance – Governmental Funds
Fund Balance Changes inRevenue Expenditures Restatement Fund Balance Fund Balance
FundGeneral 30,502,219$ 30,600,003$ 15,763,985$ (97,784)$ Tax Increment Financing 6,639,383 5,631,328 4,560,317 1,008,055 Accommodations Tax (State) 3,458,900 3,474,058 1,304,013 (15,158) Real Estate Transfer Fee 2,015,321 2,749,606 1,798,224 (734,285) Beach Preservation Fee 5,603,770 5,669,757 14,497,979 (65,987) Debt Service 20,902,154 21,143,524 (2,666,625) 6,974,490 (241,370) Capital Projects Fund 21,851,938 14,551,455 (134,987) 20,532,570 7,300,483 Non-Major Governmental Fund 2,682,281 2,401,521 437,173 280,760
Changes inRevenue Expenditures Fund Balance Fund Balance
FundGeneral 30,909,586$ 31,787,286$ 14,886,285$ (877,700)$ Tax Increment Financing 6,382,198 4,572,326 6,370,189 1,809,872 Accommodations Tax (State) 3,533,789 3,431,851 1,405,951 101,938 Real Estate Transfer Fee 2,842,979 3,521,439 1,119,764 (678,460) Beach Preservation Fee 4,859,871 4,513,001 14,844,849 346,870 Hospitality Fee 4,920,591 5,234,050 2,147,562 1,834,103 (313,459) Debt Service 16,900,711 17,873,656 - 6,001,545 (972,945) Capital Projects Fund 4,292,240 8,835,731 (2,147,562) 13,841,517 (4,543,491) Non-Major Governmental Fund 2,856,551 2,817,074 476,650 39,477
2010
2011
GENERAL FUND BUDGETARY HIGHLIGHTS
Amendments to the budget occur throughout the year for a variety of reasons. These include reserves for encumbrances from prior year unexpended purchase orders which are added to the current year budget at the closing of the prior year, grants or other form of financial aid which were received during the year but not anticipated in the original budget, appropriations of fund balances needed to offset unanticipated and unavoidable expenditures, and transfers of appropriation among departments, divisions, or object classes to address particular requirements not anticipated in the original budget. The Town Council approves and authorizes the annual budget and the level of object class totals within each department. The General Fund revenues were less than the revised budget by $99,114. Listed below is a summary of the major revenue sources comparing actual receipts to budget:
• Real and personal property taxes were down $110,681
• Local accommodations tax revenue was up $463,904
• Business license and franchise fee revenue was down $467,289
• Building permit revenue was up $75,609
• State shared revenue was down $35,592
• EMS revenue was up $152,088
• Fines and fees was down $55,068
• Investment income was down $48,215 Actual General Fund expenditures were less than the revised budget by $1.71 million. The favorable variance can be primarily attributed to the continuation of the expenditure reduction plan that was implemented in mid-year FY 2009.
12
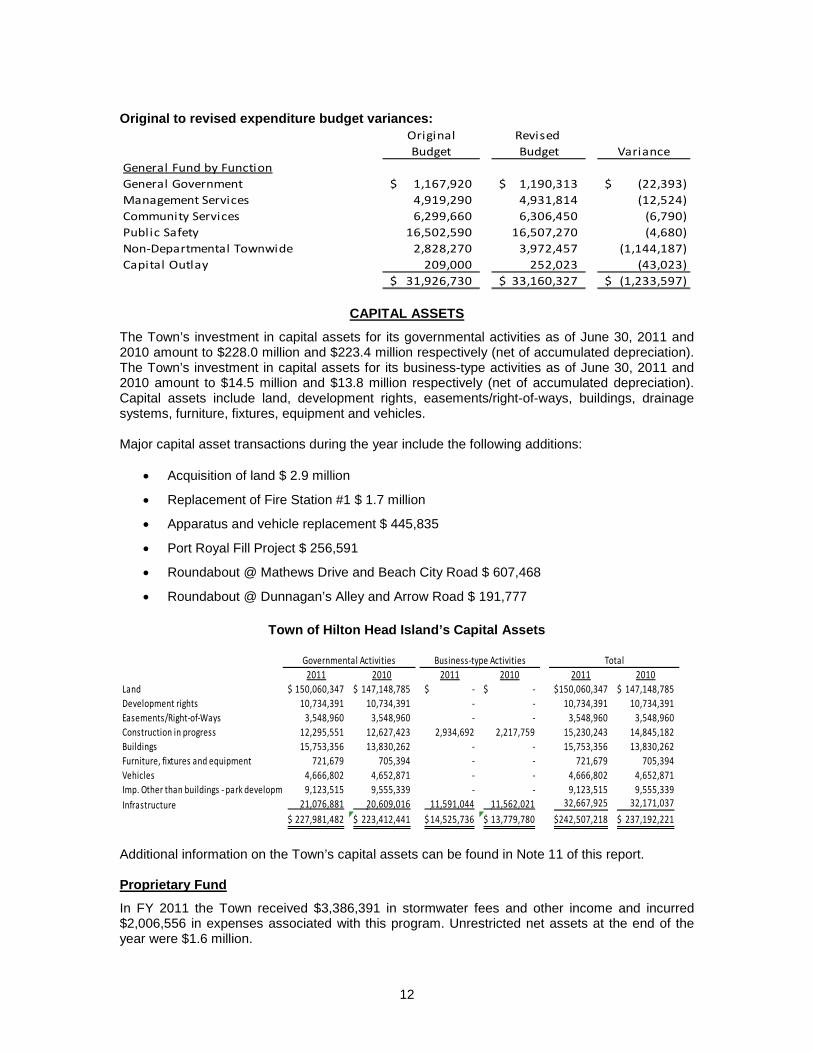
Original to revised expenditure budget variances:
Original Revised Budget Budget Variance
General Fund by FunctionGeneral Government 1,167,920$ 1,190,313$ (22,393)$ Management Services 4,919,290 4,931,814 (12,524) Community Services 6,299,660 6,306,450 (6,790) Public Safety 16,502,590 16,507,270 (4,680) Non-Departmental Townwide 2,828,270 3,972,457 (1,144,187) Capital Outlay 209,000 252,023 (43,023)
31,926,730$ 33,160,327$ (1,233,597)$
CAPITAL ASSETS
The Town’s investment in capital assets for its governmental activities as of June 30, 2011 and 2010 amount to $228.0 million and $223.4 million respectively (net of accumulated depreciation). The Town’s investment in capital assets for its business-type activities as of June 30, 2011 and 2010 amount to $14.5 million and $13.8 million respectively (net of accumulated depreciation). Capital assets include land, development rights, easements/right-of-ways, buildings, drainage systems, furniture, fixtures, equipment and vehicles. Major capital asset transactions during the year include the following additions:
• Acquisition of land $ 2.9 million
• Replacement of Fire Station #1 $ 1.7 million
• Apparatus and vehicle replacement $ 445,835
• Port Royal Fill Project $ 256,591
• Roundabout @ Mathews Drive and Beach City Road $ 607,468
• Roundabout @ Dunnagan’s Alley and Arrow Road $ 191,777
Town of Hilton Head Island’s Capital Assets
2011 2010 2011 2010 2011 2010Land 150,060,347$ 147,148,785$ -$ -$ 150,060,347$ 147,148,785$ Development rights 10,734,391 10,734,391 - - 10,734,391 10,734,391 Easements/Right-of-Ways 3,548,960 3,548,960 - - 3,548,960 3,548,960 Construction in progress 12,295,551 12,627,423 2,934,692 2,217,759 15,230,243 14,845,182 Buildings 15,753,356 13,830,262 - - 15,753,356 13,830,262 Furniture, fixtures and equipment 721,679 705,394 - - 721,679 705,394 Vehicles 4,666,802 4,652,871 - - 4,666,802 4,652,871 Imp. Other than buildings - park developm 9,123,515 9,555,339 - - 9,123,515 9,555,339 Infrastructure 21,076,881 20,609,016 11,591,044 11,562,021 32,667,925 32,171,037
227,981,482$ 223,412,441$ 14,525,736$ 13,779,780$ 242,507,218$ 237,192,221$
Governmental Activities Business-type Activities Total
Additional information on the Town’s capital assets can be found in Note 11 of this report. Proprietary Fund
In FY 2011 the Town received $3,386,391 in stormwater fees and other income and incurred $2,006,556 in expenses associated with this program. Unrestricted net assets at the end of the year were $1.6 million.
13
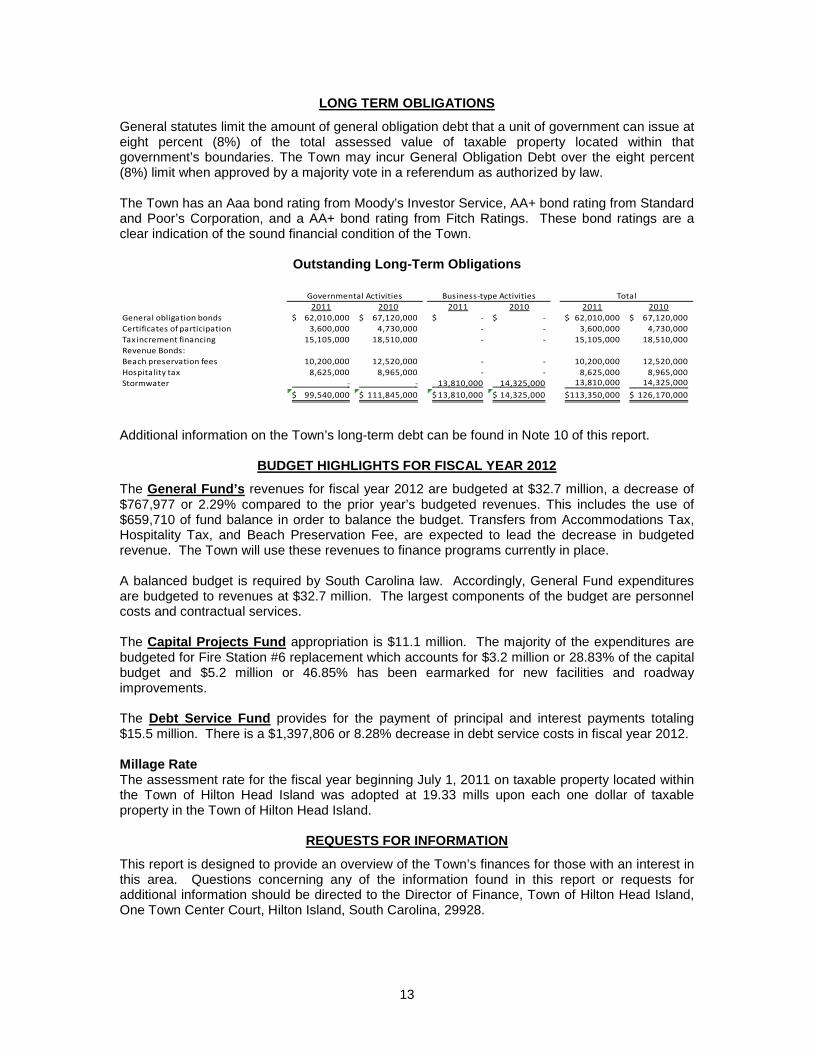
LONG TERM OBLIGATIONS
General statutes limit the amount of general obligation debt that a unit of government can issue at eight percent (8%) of the total assessed value of taxable property located within that government’s boundaries. The Town may incur General Obligation Debt over the eight percent (8%) limit when approved by a majority vote in a referendum as authorized by law.
The Town has an Aaa bond rating from Moody’s Investor Service, AA+ bond rating from Standard and Poor’s Corporation, and a AA+ bond rating from Fitch Ratings. These bond ratings are a clear indication of the sound financial condition of the Town.
Outstanding Long-Term Obligations
2011 2010 2011 2010 2011 2010General obligation bonds 62,010,000$ 67,120,000$ -$ -$ 62,010,000$ 67,120,000$ Certificates of participation 3,600,000 4,730,000 - - 3,600,000 4,730,000 Tax increment financing 15,105,000 18,510,000 - - 15,105,000 18,510,000 Revenue Bonds:Beach preservation fees 10,200,000 12,520,000 - - 10,200,000 12,520,000 Hospitality tax 8,625,000 8,965,000 - - 8,625,000 8,965,000 Stormwater - - 13,810,000 14,325,000 13,810,000 14,325,000
99,540,000$ 111,845,000$ 13,810,000$ 14,325,000$ 113,350,000$ 126,170,000$
Governmental Activities Business-type Activities Total
Additional information on the Town’s long-term debt can be found in Note 10 of this report.
BUDGET HIGHLIGHTS FOR FISCAL YEAR 2012
The General Fund’s revenues for fiscal year 2012 are budgeted at $32.7 million, a decrease of $767,977 or 2.29% compared to the prior year’s budgeted revenues. This includes the use of $659,710 of fund balance in order to balance the budget. Transfers from Accommodations Tax, Hospitality Tax, and Beach Preservation Fee, are expected to lead the decrease in budgeted revenue. The Town will use these revenues to finance programs currently in place. A balanced budget is required by South Carolina law. Accordingly, General Fund expenditures are budgeted to revenues at $32.7 million. The largest components of the budget are personnel costs and contractual services. The Capital Projects Fund appropriation is $11.1 million. The majority of the expenditures are budgeted for Fire Station #6 replacement which accounts for $3.2 million or 28.83% of the capital budget and $5.2 million or 46.85% has been earmarked for new facilities and roadway improvements. The Debt Service Fund provides for the payment of principal and interest payments totaling $15.5 million. There is a $1,397,806 or 8.28% decrease in debt service costs in fiscal year 2012. Millage Rate The assessment rate for the fiscal year beginning July 1, 2011 on taxable property located within the Town of Hilton Head Island was adopted at 19.33 mills upon each one dollar of taxable property in the Town of Hilton Head Island.
REQUESTS FOR INFORMATION
This report is designed to provide an overview of the Town’s finances for those with an interest in this area. Questions concerning any of the information found in this report or requests for additional information should be directed to the Director of Finance, Town of Hilton Head Island, One Town Center Court, Hilton Island, South Carolina, 29928.

Basic Financial Statements
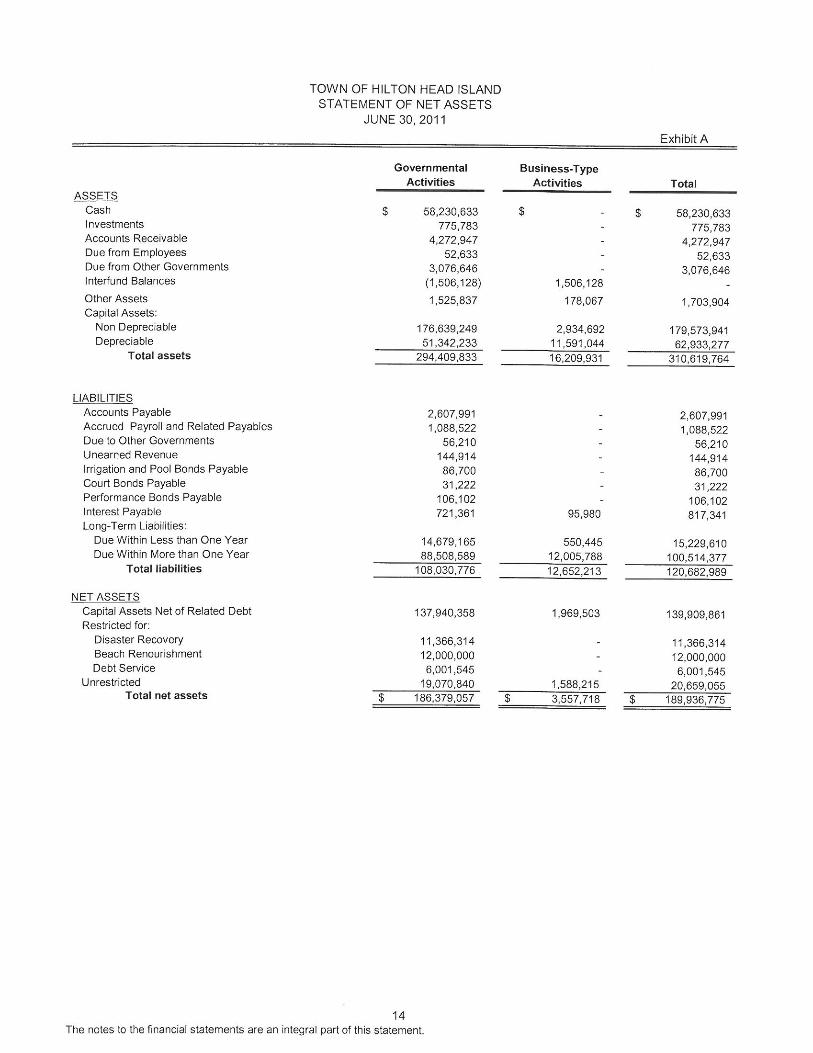
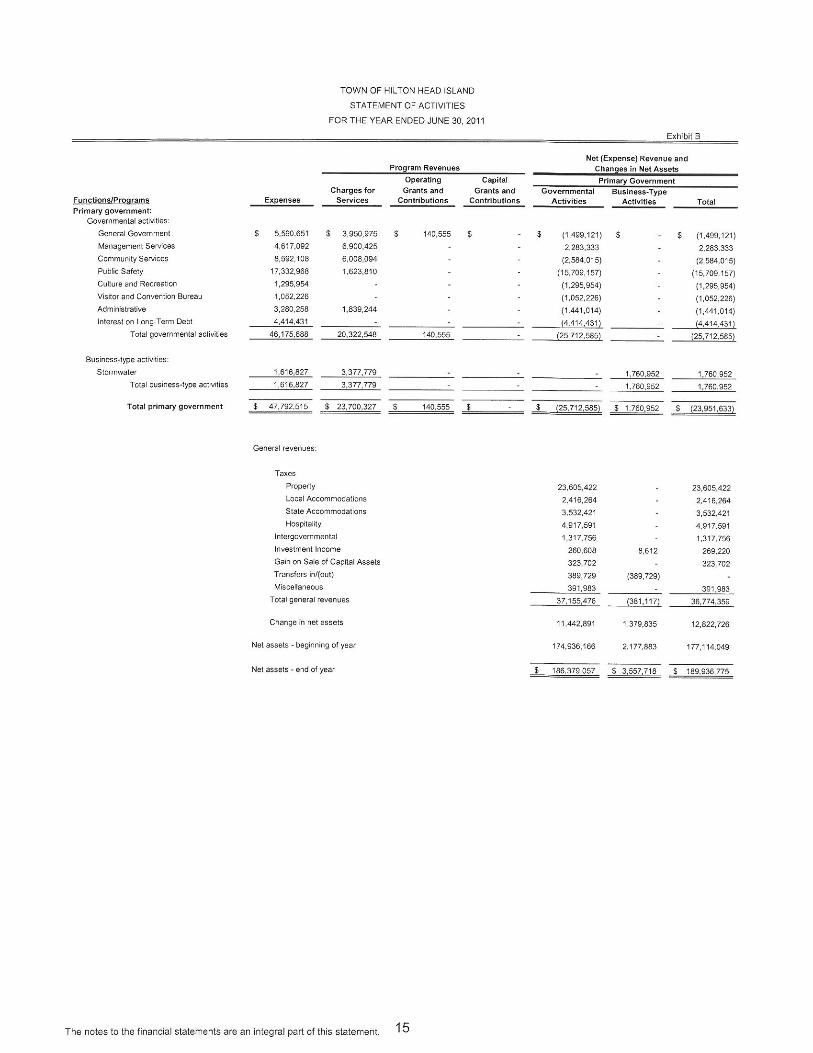
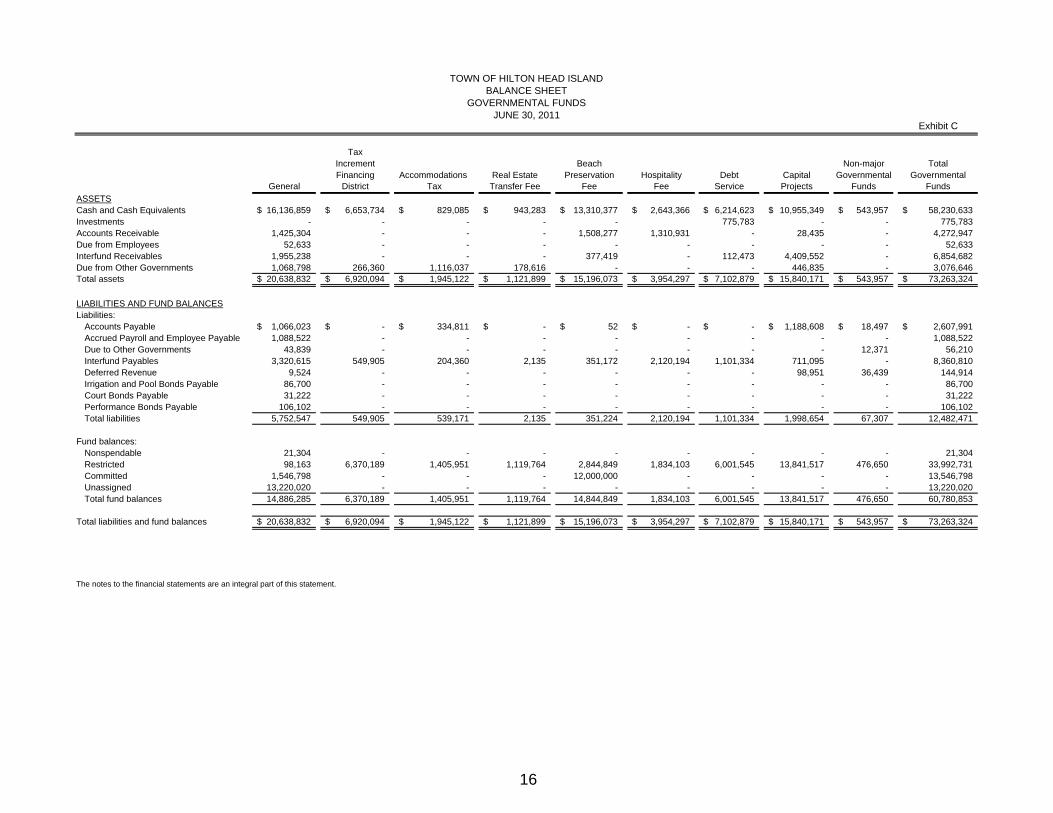
Exhibit C
TaxIncrement Beach Non-major TotalFinancing Accommodations Real Estate Preservation Hospitality Debt Capital Governmental Governmental
General District Tax Transfer Fee Fee Fee Service Projects Funds FundsASSETSCash and Cash Equivalents 16,136,859$ 6,653,734$ 829,085$ 943,283$ 13,310,377$ 2,643,366$ 6,214,623$ 10,955,349$ 543,957$ 58,230,633$ Investments - - - - - 775,783 - - 775,783 Accounts Receivable 1,425,304 - - - 1,508,277 1,310,931 - 28,435 - 4,272,947 Due from Employees 52,633 - - - - - - - - 52,633 Interfund Receivables 1,955,238 - - - 377,419 - 112,473 4,409,552 - 6,854,682 Due from Other Governments 1,068,798 266,360 1,116,037 178,616 - - - 446,835 - 3,076,646 Total assets 20,638,832$ 6,920,094$ 1,945,122$ 1,121,899$ 15,196,073$ 3,954,297$ 7,102,879$ 15,840,171$ 543,957$ 73,263,324$
LIABILITIES AND FUND BALANCESLiabilities:
Accounts Payable 1,066,023$ -$ 334,811$ -$ 52$ -$ -$ 1,188,608$ 18,497$ 2,607,991$ Accrued Payroll and Employee Payable 1,088,522 - - - - - - - - 1,088,522 Due to Other Governments 43,839 - - - - - - - 12,371 56,210 Interfund Payables 3,320,615 549,905 204,360 2,135 351,172 2,120,194 1,101,334 711,095 - 8,360,810 Deferred Revenue 9,524 - - - - - - 98,951 36,439 144,914 Irrigation and Pool Bonds Payable 86,700 - - - - - - - - 86,700 Court Bonds Payable 31,222 - - - - - - - - 31,222 Performance Bonds Payable 106,102 - - - - - - - - 106,102 Total liabilities 5,752,547 549,905 539,171 2,135 351,224 2,120,194 1,101,334 1,998,654 67,307 12,482,471
Fund balances:Nonspendable 21,304 - - - - - - - - 21,304 Restricted 98,163 6,370,189 1,405,951 1,119,764 2,844,849 1,834,103 6,001,545 13,841,517 476,650 33,992,731 Committed 1,546,798 - - - 12,000,000 - - - - 13,546,798 Unassigned 13,220,020 - - - - - - - - 13,220,020 Total fund balances 14,886,285 6,370,189 1,405,951 1,119,764 14,844,849 1,834,103 6,001,545 13,841,517 476,650 60,780,853
Total liabilities and fund balances 20,638,832$ 6,920,094$ 1,945,122$ 1,121,899$ 15,196,073$ 3,954,297$ 7,102,879$ 15,840,171$ 543,957$ 73,263,324$
The notes to the financial statements are an integral part of this statement.
JUNE 30, 2011GOVERNMENTAL FUNDS
BALANCE SHEETTOWN OF HILTON HEAD ISLAND
16
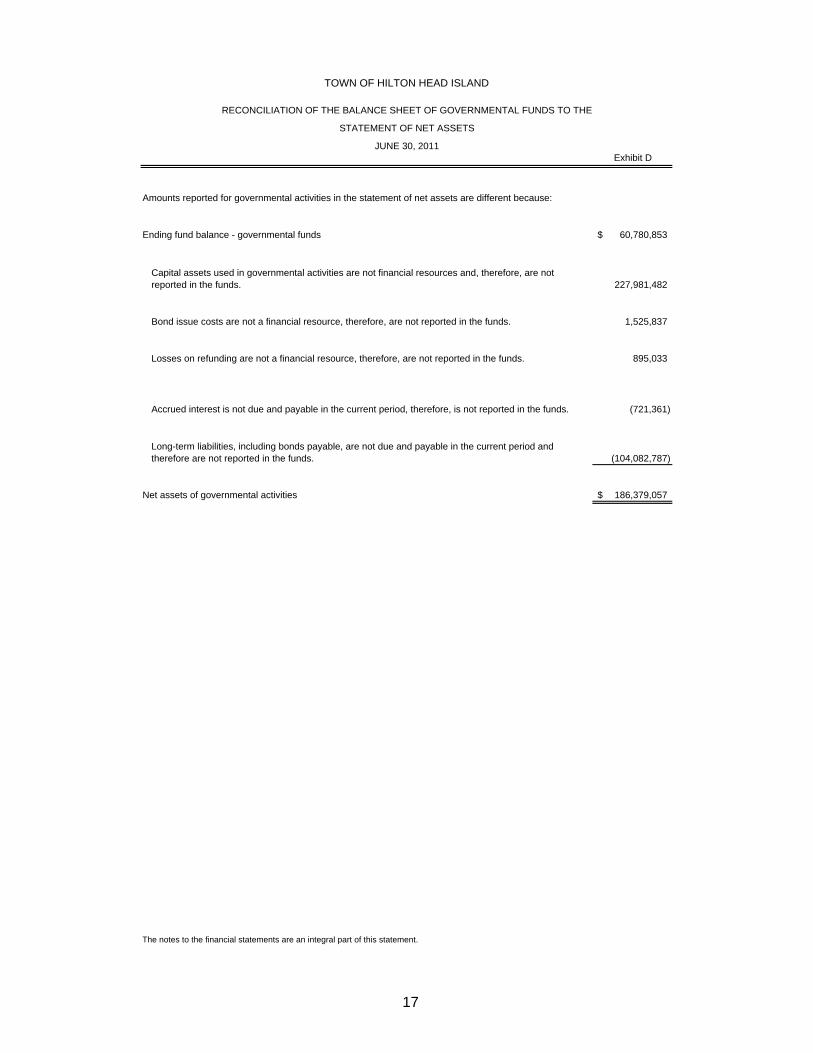
TOWN OF HILTON HEAD ISLAND
RECONCILIATION OF THE BALANCE SHEET OF GOVERNMENTAL FUNDS TO THE
STATEMENT OF NET ASSETS
JUNE 30, 2011Exhibit D
Amounts reported for governmental activities in the statement of net assets are different because:
Ending fund balance - governmental funds 60,780,853$
227,981,482
1,525,837
895,033
(721,361)
(104,082,787)
Net assets of governmental activities 186,379,057$
The notes to the financial statements are an integral part of this statement.
Capital assets used in governmental activities are not financial resources and, therefore, are not reported in the funds.
Accrued interest is not due and payable in the current period, therefore, is not reported in the funds.
Long-term liabilities, including bonds payable, are not due and payable in the current period and therefore are not reported in the funds.
Bond issue costs are not a financial resource, therefore, are not reported in the funds.
Losses on refunding are not a financial resource, therefore, are not reported in the funds.
17
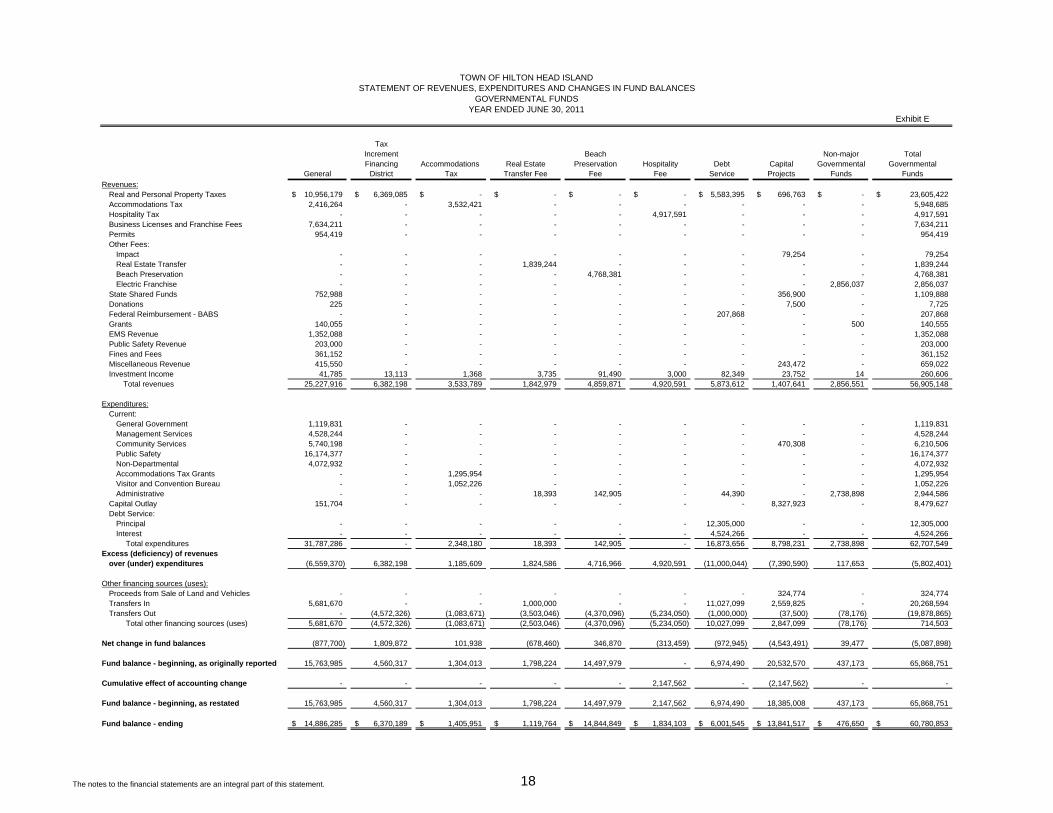
Exhibit E
TaxIncrement Beach Non-major TotalFinancing Accommodations Real Estate Preservation Hospitality Debt Capital Governmental Governmental
General District Tax Transfer Fee Fee Fee Service Projects Funds FundsRevenues:
Real and Personal Property Taxes 10,956,179$ 6,369,085$ -$ -$ -$ -$ 5,583,395$ 696,763$ -$ 23,605,422$ Accommodations Tax 2,416,264 - 3,532,421 - - - - - - 5,948,685 Hospitality Tax - - - - - 4,917,591 - - - 4,917,591 Business Licenses and Franchise Fees 7,634,211 - - - - - - - - 7,634,211 Permits 954,419 - - - - - - - - 954,419 Other Fees:
Impact - - - - - - - 79,254 - 79,254 Real Estate Transfer - - - 1,839,244 - - - - - 1,839,244 Beach Preservation - - - - 4,768,381 - - - - 4,768,381 Electric Franchise - - - - - - - - 2,856,037 2,856,037
State Shared Funds 752,988 - - - - - - 356,900 - 1,109,888 Donations 225 - - - - - - 7,500 - 7,725 Federal Reimbursement - BABS - - - - - - 207,868 - - 207,868 Grants 140,055 - - - - - - - 500 140,555 EMS Revenue 1,352,088 - - - - - - - - 1,352,088 Public Safety Revenue 203,000 - - - - - - - - 203,000 Fines and Fees 361,152 - - - - - - - - 361,152 Miscellaneous Revenue 415,550 - - - - - - 243,472 - 659,022 Investment Income 41,785 13,113 1,368 3,735 91,490 3,000 82,349 23,752 14 260,606
Total revenues 25,227,916 6,382,198 3,533,789 1,842,979 4,859,871 4,920,591 5,873,612 1,407,641 2,856,551 56,905,148
Expenditures:Current:
General Government 1,119,831 - - - - - - - - 1,119,831 Management Services 4,528,244 - - - - - - - - 4,528,244 Community Services 5,740,198 - - - - - - 470,308 - 6,210,506 Public Safety 16,174,377 - - - - - - - - 16,174,377 Non-Departmental 4,072,932 - - - - - - - - 4,072,932 Accommodations Tax Grants - - 1,295,954 - - - - - - 1,295,954 Visitor and Convention Bureau - - 1,052,226 - - - - - - 1,052,226 Administrative - - - 18,393 142,905 - 44,390 - 2,738,898 2,944,586
Capital Outlay 151,704 - - - - - - 8,327,923 - 8,479,627 Debt Service:
Principal - - - - - - 12,305,000 - - 12,305,000 Interest - - - - - - 4,524,266 - - 4,524,266
Total expenditures 31,787,286 - 2,348,180 18,393 142,905 - 16,873,656 8,798,231 2,738,898 62,707,549 Excess (deficiency) of revenues
over (under) expenditures (6,559,370) 6,382,198 1,185,609 1,824,586 4,716,966 4,920,591 (11,000,044) (7,390,590) 117,653 (5,802,401)
Other financing sources (uses):Proceeds from Sale of Land and Vehicles - - - - - - - 324,774 - 324,774 Transfers In 5,681,670 - - 1,000,000 - - 11,027,099 2,559,825 - 20,268,594 Transfers Out - (4,572,326) (1,083,671) (3,503,046) (4,370,096) (5,234,050) (1,000,000) (37,500) (78,176) (19,878,865)
Total other financing sources (uses) 5,681,670 (4,572,326) (1,083,671) (2,503,046) (4,370,096) (5,234,050) 10,027,099 2,847,099 (78,176) 714,503
Net change in fund balances (877,700) 1,809,872 101,938 (678,460) 346,870 (313,459) (972,945) (4,543,491) 39,477 (5,087,898)
Fund balance - beginning, as originally reported 15,763,985 4,560,317 1,304,013 1,798,224 14,497,979 - 6,974,490 20,532,570 437,173 65,868,751
Cumulative effect of accounting change - - - - - 2,147,562 - (2,147,562) - -
Fund balance - beginning, as restated 15,763,985 4,560,317 1,304,013 1,798,224 14,497,979 2,147,562 6,974,490 18,385,008 437,173 65,868,751
Fund balance - ending 14,886,285$ 6,370,189$ 1,405,951$ 1,119,764$ 14,844,849$ 1,834,103$ 6,001,545$ 13,841,517$ 476,650$ 60,780,853$
YEAR ENDED JUNE 30, 2011GOVERNMENTAL FUNDS
STATEMENT OF REVENUES, EXPENDITURES AND CHANGES IN FUND BALANCESTOWN OF HILTON HEAD ISLAND
The notes to the financial statements are an integral part of this statement. 18
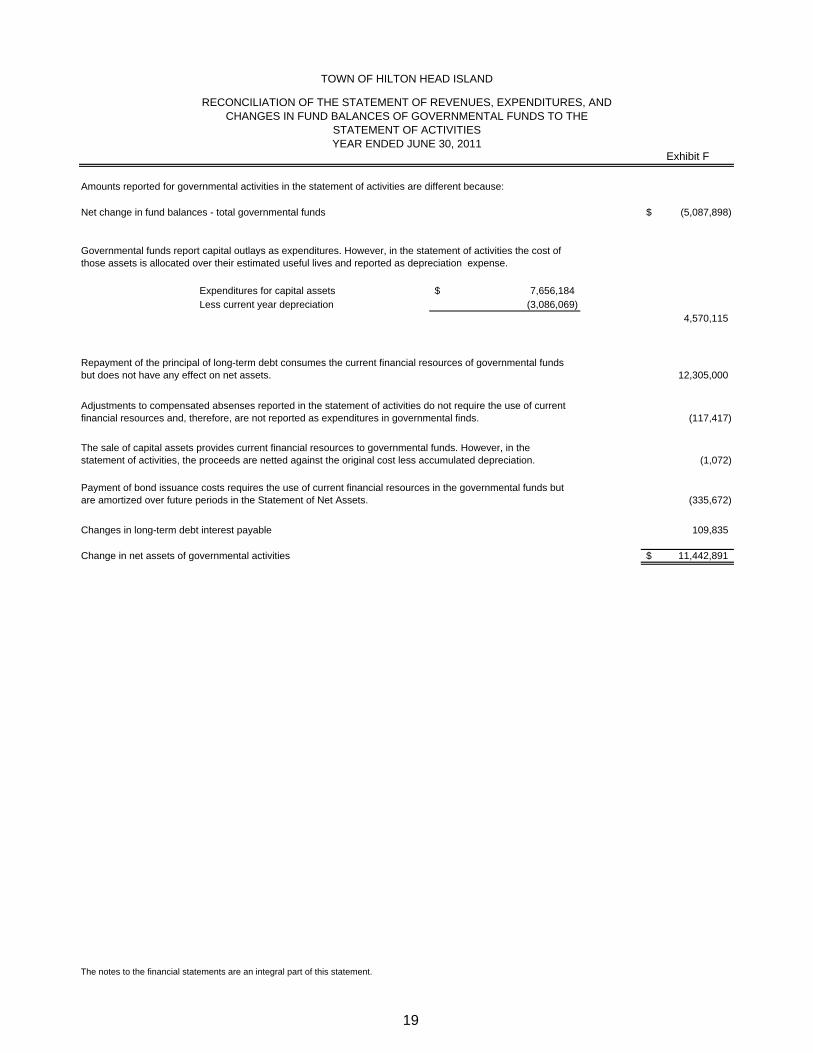
TOWN OF HILTON HEAD ISLAND
RECONCILIATION OF THE STATEMENT OF REVENUES, EXPENDITURES, ANDCHANGES IN FUND BALANCES OF GOVERNMENTAL FUNDS TO THE
STATEMENT OF ACTIVITIESYEAR ENDED JUNE 30, 2011
Exhibit F
Amounts reported for governmental activities in the statement of activities are different because:
Net change in fund balances - total governmental funds (5,087,898)$
Expenditures for capital assets 7,656,184$ Less current year depreciation (3,086,069)
4,570,115
12,305,000
(117,417)
(1,072)
(335,672)
109,835
Change in net assets of governmental activities 11,442,891$
The notes to the financial statements are an integral part of this statement.
Governmental funds report capital outlays as expenditures. However, in the statement of activities the cost of those assets is allocated over their estimated useful lives and reported as depreciation expense.
Repayment of the principal of long-term debt consumes the current financial resources of governmental funds but does not have any effect on net assets.
Adjustments to compensated absenses reported in the statement of activities do not require the use of current financial resources and, therefore, are not reported as expenditures in governmental finds.
The sale of capital assets provides current financial resources to governmental funds. However, in the statement of activities, the proceeds are netted against the original cost less accumulated depreciation.
Payment of bond issuance costs requires the use of current financial resources in the governmental funds but are amortized over future periods in the Statement of Net Assets.
Changes in long-term debt interest payable
19
TOWN OF HILTON HEAD ISLAND, SOUTH CAROLINA NOTES TO FINANCIAL STATEMENTS
25
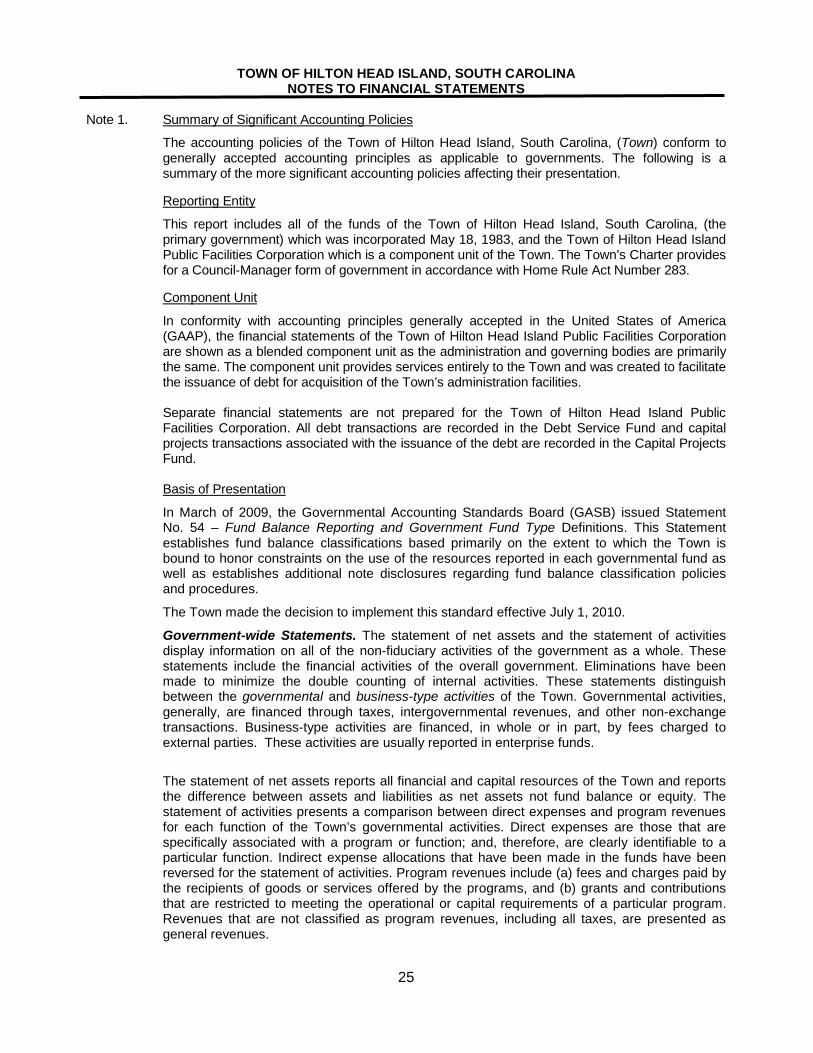
Note 1. Summary of Significant Accounting Policies
The accounting policies of the Town of Hilton Head Island, South Carolina, (Town) conform to generally accepted accounting principles as applicable to governments. The following is a summary of the more significant accounting policies affecting their presentation.
Reporting Entity
This report includes all of the funds of the Town of Hilton Head Island, South Carolina, (the primary government) which was incorporated May 18, 1983, and the Town of Hilton Head Island Public Facilities Corporation which is a component unit of the Town. The Town’s Charter provides for a Council-Manager form of government in accordance with Home Rule Act Number 283.
Component Unit
In conformity with accounting principles generally accepted in the United States of America (GAAP), the financial statements of the Town of Hilton Head Island Public Facilities Corporation are shown as a blended component unit as the administration and governing bodies are primarily the same. The component unit provides services entirely to the Town and was created to facilitate the issuance of debt for acquisition of the Town’s administration facilities.
Separate financial statements are not prepared for the Town of Hilton Head Island Public
Facilities Corporation. All debt transactions are recorded in the Debt Service Fund and capital projects transactions associated with the issuance of the debt are recorded in the Capital Projects Fund.
Basis of Presentation
In March of 2009, the Governmental Accounting Standards Board (GASB) issued Statement No. 54 – Fund Balance Reporting and Government Fund Type Definitions. This Statement establishes fund balance classifications based primarily on the extent to which the Town is bound to honor constraints on the use of the resources reported in each governmental fund as well as establishes additional note disclosures regarding fund balance classification policies and procedures.
The Town made the decision to implement this standard effective July 1, 2010.
Government-wide Statements. The statement of net assets and the statement of activities display information on all of the non-fiduciary activities of the government as a whole. These statements include the financial activities of the overall government. Eliminations have been made to minimize the double counting of internal activities. These statements distinguish between the governmental and business-type activities of the Town. Governmental activities, generally, are financed through taxes, intergovernmental revenues, and other non-exchange transactions. Business-type activities are financed, in whole or in part, by fees charged to external parties. These activities are usually reported in enterprise funds.
The statement of net assets reports all financial and capital resources of the Town and reports the difference between assets and liabilities as net assets not fund balance or equity. The statement of activities presents a comparison between direct expenses and program revenues for each function of the Town’s governmental activities. Direct expenses are those that are specifically associated with a program or function; and, therefore, are clearly identifiable to a particular function. Indirect expense allocations that have been made in the funds have been reversed for the statement of activities. Program revenues include (a) fees and charges paid by the recipients of goods or services offered by the programs, and (b) grants and contributions that are restricted to meeting the operational or capital requirements of a particular program. Revenues that are not classified as program revenues, including all taxes, are presented as general revenues.
TOWN OF HILTON HEAD ISLAND, SOUTH CAROLINA NOTES TO FINANCIAL STATEMENTS
26
Note 1. Summary of Significant Accounting Policies (continued) Basis of Presentation – Fund Financial Statements (continued)
Financial Statements. Separate financial statements are provided for the governmental funds, proprietary fund, and fiduciary fund, even though the latter is excluded from the government-wide financial statements. The focus of governmental and proprietary fund financial statements is on major funds rather than reporting funds by type. Each major governmental fund and the enterprise fund are reported as separate columns in the fund financial statements. All remaining governmental funds are aggregated and reported as nonmajor funds.
1. The Town reports the following major governmental funds:
General. The General Fund is used to account for all financial sources except those required to be accounted for in another fund.
Tax Increment Financing District (Special Revenue Fund). This fund is used to account for incremental taxes charged to individuals. These revenues are used for expenditures for specific purposes.
Beach Preservation Fee (Special Revenue Fund). This fund is used to account for beach preservation fees. These revenues are used for expenditures for specific purposes.
Real Estate Transfer Fee (Special Revenue Fund). The fund accounts for a fee equal to one quarter of one percent (.0025) of the purchase price upon the transfer of any real property situated within the corporate limits of the Town. These revenues are used for expenditures for specific purposes.
Accommodations Tax {State} (Special Revenue Fund). This fund is used to account for the Town’s receipts from the two percent (2%) tax levied on rentals of transient accommodations within the corporate limit. These revenues are used for expenditures for specific purposes.
Hospitality Fees (Special Revenue Fund). This fund is used to account for the Town’s receipts from the 2% tax levied on the sale of prepared meals and beverages sold in establishments or sales of prepared meals and beverages sold in establishments licensed for on-premises consumption of alcoholic beverages, beer or wine. These financial resources are used for expenditures for capital outlay that enhance the health, safety and general welfare of the Town.
Debt Service. This fund is used for accumulating resources for the payment of interest and principal on general long-term obligation debt.
Capital Projects. This fund is used to account for financial resources to be used for the acquisition or construction of major capital facilities.
2. The Town reports the Palmetto Electric Franchise Fees and the Home Grant Special Revenue Funds as non-major governmental funds.
3. The Town’s agency fund is presented in the fiduciary fund financial statement. Since these assets cannot be used to address activities or obligations of the Town, the agency fund is not incorporated into the government-wide financial statements. The Town’s agency fund is as follows:
The Firemen’s Fund is used to account for resources held by the Town for its firemen in an agency capacity.
TOWN OF HILTON HEAD ISLAND, SOUTH CAROLINA NOTES TO FINANCIAL STATEMENTS
27
Note 1. Summary of Significant Accounting Policies (continued) Basis of Presentation – Fund Financial Statements (continued)
4. The Town’s proprietary fund is presented in the enterprise fund financial statement. The
Town’s stormwater fund is used to account for the costs associated with the management, construction, maintenance, protections, control, regulation, use, and enhancement of stormwater systems and programs within the Town limits of Hilton Head Island in concert with Beaufort County and other water resource management programs. Costs are recovered through user charges in a manner similar to private business enterprises. This fund is a major fund.
Measurement Focus and Basis of Accounting
All funds of the Town are maintained during the year using the modified accrual basis of accounting.
Government-wide Financial Statements. The government-wide financial statements are reported using the economic resources measurement focus and the accrual basis of accounting. Revenues are recorded when earned and expenses are recorded at the time liabilities are incurred, regardless of when the related cash flows take place. Nonexchange transactions in which the Town gives (or receives) value without directly receiving (or giving) equal value in exchange include property taxes, grants, and donations. On an accrual basis, revenue from property taxes is recognized in the fiscal year for which the taxes are levied. Revenue from grants and donations is recognized in the fiscal year in which all eligibility requirements have been satisfied. Additionally, the effect of interfund activity has been eliminated from the government-wide financial statements, except for the amounts due between the Town’s governmental activities and business-type activities.
Governmental Fund Financial Statements. Governmental funds are reported using the current financial resources measurement focus and the modified accrual basis of accounting. Under this method, revenues are recognized when measurable and available.
Expenditures are recorded when the related fund liability is incurred except for principal and interest on general long-term debt, claims and judgments, and compensated absences which are recognized as expenditures to the extent they have matured. General capital asset acquisitions are reported as expenditures in governmental funds. Proceeds of general long-term debt and acquisitions under capital leases are reported as other financing sources. Taxpayer-assessed income and gross receipts are recognized as revenue when in the hands of intermediary collecting governments (state shared revenues, sales and accommodation tax revenue). Business license revenues are recognized when measurable and available. Property tax revenues are recognized when received or available for payment of liabilities of the current period. The Town considers property taxes as available if collected within 60 days after year-end.
TOWN OF HILTON HEAD ISLAND, SOUTH CAROLINA NOTES TO FINANCIAL STATEMENTS
28
Note 1. Summary of Significant Accounting Policies (continued) Measurement Focus and Basis of Accounting (continued)
Property taxes for the year ended June 30, 2011, includes an accrual for property taxes collected 60 days after June 30. Property taxes are levied based on assessed values and the property tax calendar as follows:
Property Tax Calendar
Assessment date 2010 Property tax due March 16 Delinquent date March 17 Levy date August 23 Tax sale First Monday in October
The County has no specific lien date. As permitted by generally accepted accounting principles, the Town has elected to apply only applicable Financial Accounting Standards Board (FASB) Statements and Interpretations issued on or before November 30, 1989, that do not contradict GASB pronouncements in its accounting and reporting practices for its government-wide financial statements. It has also elected not to apply FASB Statements and Interpretations issued after November 30, 1989 for its enterprise fund.
Proprietary Fund Financial Statements. Proprietary funds distinguish operating revenues and expenses from non-operating items. Operating revenues and expenses generally result from providing services and producing and delivering goods in connection with a proprietary fund’s principal ongoing operations. The principal operating revenues for the Town’s stormwater enterprise fund are charges to the customers for sales and service. Operating expenses for enterprise funds include the cost of sales and services, administrative expenses, and depreciation on capital assets. All revenues and expense not meeting this definition are reported as non-operating revenues and expenses.
Use of Estimates
The preparation of financial statements in conformity with GAAP requires management to make estimates and assumptions that affect certain reported amounts and disclosures. Accordingly, actual results could differ from those estimates.
Budgets and Budgetary Accounting
Annual appropriated budgets are adopted for the General Fund, Debt Service Fund, and Capital Projects Fund. Budgets for the aforementioned funds are prepared in accordance with GAAP. The Town uses the following procedures in establishing budgetary data reflected in these financial statements:
1. The Town Manager submits to Town Council a proposed operating budget for the General Fund, Capital Projects Fund, and Debt Service Fund for the year which includes proposed expenditures and the means of financing them.
2. Public hearings are held for taxpayers' comments for the General Fund, Capital Projects Fund and Debt Service budgets.
TOWN OF HILTON HEAD ISLAND, SOUTH CAROLINA NOTES TO FINANCIAL STATEMENTS
29
Note 1. Summary of Significant Accounting Policies (continued)
Budgets and Budgetary Accounting (continued)
3. The budgets are legally enacted and adopted by Town Council.
4. Budgetary transfers between departments may be authorized by the Town Manager; however, any revisions that alter the total expenditures of any fund must be approved by Town Council.
The expenditures may not legally exceed appropriations at the fund level except for additional
funds received as grants or donations. Appropriations lapse at year-end.
Presented budgeted amounts are as originally adopted, transferred by Town Manager, or amended by Town Council. The amendments to the budget were:
General FundRevenues:Hospitality Fee Transfer $ 140,923 Prior Year Funds 1,092,674 Total Revenue Increases $ 1,233,597
Expenditure Increases/(Decreases):Town Council - Professional Services 22,393 Finance; Administration - Professional Services 3,000 Finance; Accounting - Professional Services 5,774 Finance; Business License - Equipment <$5,000 1,452 Finance; Business License - Office Supplies 1,548 Administration; Information Technology - Maintenance Contracts (43,133)Administration; Information Technology - Computer Software <$50,000 30,883 Administration; Information Technology - Computer Software >$50,000 24,898 Administration; Information Technology - Specialized Equipment 18,125 Administration; Human Resources - Consulting Services 13,000 Community Development; Developmental Review & Zoning - Consulting Services 790 Townwide - Professional Services 140,923 Townwide - Grants 1,003,264 Fire and Rescue; Emergency Management - Maintenance Contracts 3,000 Fire and Rescue; Logistics - Radio Repair and Maintenance 1,680 Public Projects and Facilities; Facilities Mgt. - Maintenance Contracts/Fees 6,000 Total Expenditure Increases $ 1,233,597
Capital Projects FundRevenues:Bond Proceeds (607,356)$ Transfer In - Hospitality Taxes 3,037,267 Sunday Permit Fees 301,843 Impact Fees 44,699 Transfer In - Beach Preservation Fees 954,140 Transfer In - Tax Increment Financing 30,429 Total Revenue Increases 3,761,022$
TOWN OF HILTON HEAD ISLAND, SOUTH CAROLINA NOTES TO FINANCIAL STATEMENTS
30
Note 1. Summary of Significant Accounting Policies (continued)
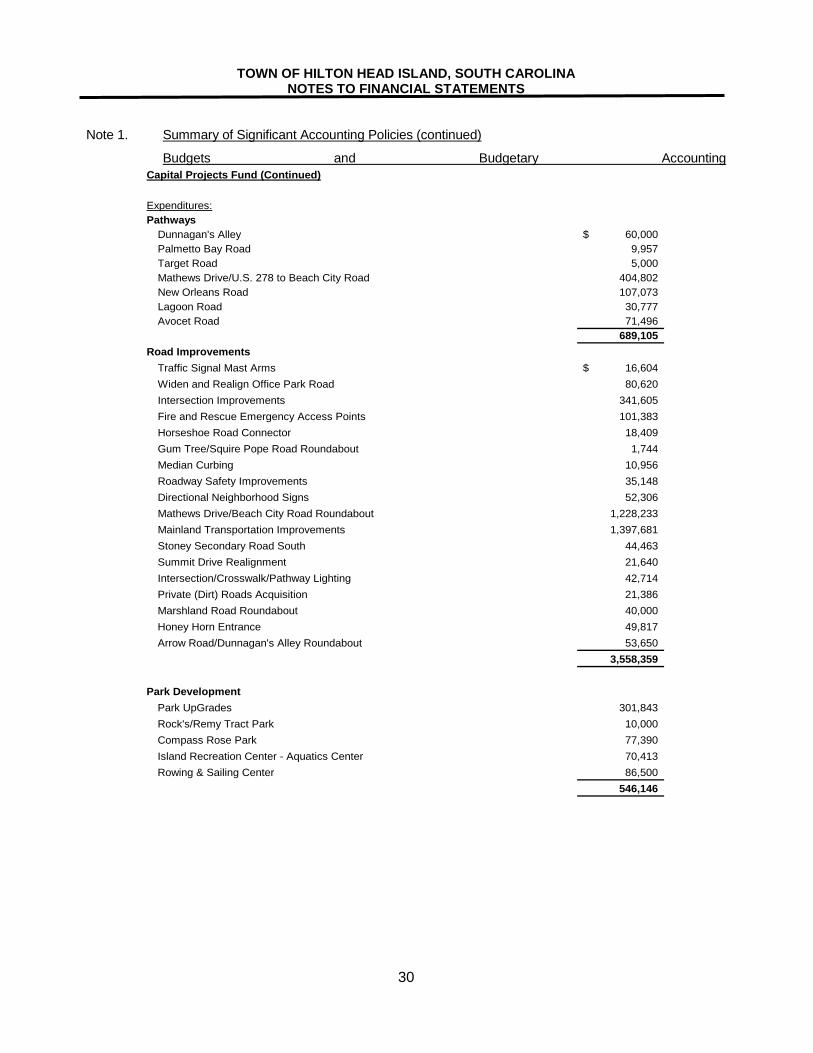
Budgets and Budgetary Accounting Capital Projects Fund (Continued)
Expenditures:Pathways
Dunnagan's Alley 60,000$ Palmetto Bay Road 9,957Target Road 5,000Mathews Drive/U.S. 278 to Beach City Road 404,802New Orleans Road 107,073Lagoon Road 30,777Avocet Road 71,496
689,105Road Improvements
Traffic Signal Mast Arms 16,604$ Widen and Realign Office Park Road 80,620 Intersection Improvements 341,605 Fire and Rescue Emergency Access Points 101,383 Horseshoe Road Connector 18,409 Gum Tree/Squire Pope Road Roundabout 1,744 Median Curbing 10,956 Roadway Safety Improvements 35,148 Directional Neighborhood Signs 52,306 Mathews Drive/Beach City Road Roundabout 1,228,233 Mainland Transportation Improvements 1,397,681 Stoney Secondary Road South 44,463 Summit Drive Realignment 21,640 Intersection/Crosswalk/Pathway Lighting 42,714 Private (Dirt) Roads Acquisition 21,386 Marshland Road Roundabout 40,000 Honey Horn Entrance 49,817 Arrow Road/Dunnagan's Alley Roundabout 53,650
3,558,359
Park DevelopmentPark UpGrades 301,843 Rock's/Remy Tract Park 10,000 Compass Rose Park 77,390 Island Recreation Center - Aquatics Center 70,413 Rowing & Sailing Center 86,500
546,146
TOWN OF HILTON HEAD ISLAND, SOUTH CAROLINA NOTES TO FINANCIAL STATEMENTS
31
Note 1. Summary of Significant Accounting Policies (continued)
Budgets and Budgetary Accounting (Continued)
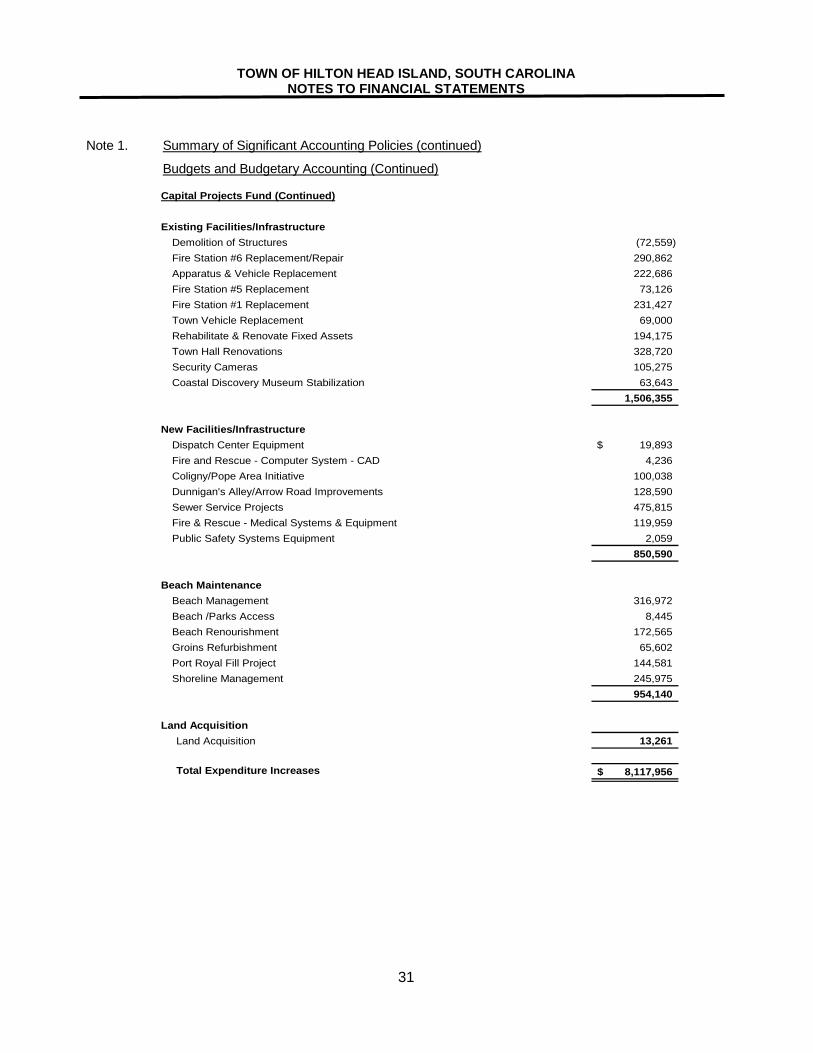
Capital Projects Fund (Continued)
Existing Facilities/InfrastructureDemolition of Structures (72,559) Fire Station #6 Replacement/Repair 290,862 Apparatus & Vehicle Replacement 222,686 Fire Station #5 Replacement 73,126 Fire Station #1 Replacement 231,427 Town Vehicle Replacement 69,000 Rehabilitate & Renovate Fixed Assets 194,175 Town Hall Renovations 328,720 Security Cameras 105,275 Coastal Discovery Museum Stabilization 63,643
1,506,355
New Facilities/InfrastructureDispatch Center Equipment 19,893$ Fire and Rescue - Computer System - CAD 4,236 Coligny/Pope Area Initiative 100,038 Dunnigan's Alley/Arrow Road Improvements 128,590 Sewer Service Projects 475,815 Fire & Rescue - Medical Systems & Equipment 119,959 Public Safety Systems Equipment 2,059
850,590
Beach MaintenanceBeach Management 316,972 Beach /Parks Access 8,445 Beach Renourishment 172,565 Groins Refurbishment 65,602 Port Royal Fill Project 144,581 Shoreline Management 245,975
954,140
Land Acquisition Land Acquisition 13,261
Total Expenditure Increases 8,117,956$
TOWN OF HILTON HEAD ISLAND, SOUTH CAROLINA NOTES TO FINANCIAL STATEMENTS
32
Note 1. Summary of Significant Accounting Policies (continued) Cash Equivalents
For purposes of this report the Town considers both unrestricted and restricted demand deposits, money market accounts and certificates of deposits with a maturity date of three months or less when purchased to be cash equivalents.
For purposes of the statement of cash flows for the proprietary (enterprise) fund cash equivalents are deposit accounts (including restricted assets) with a maturity date of three months or less, and other short-term highly liquid investments that are readily convertible to known amounts of cash.
Investments
Investments are stated at fair value which is equivalent to market value for all investments held in the general fund, special revenue funds, capital projects fund, debt service fund and proprietary fund. All changes in fair value are recorded as investment income.
Due to and from Other Funds/ Internal Balances
Interfund receivables and payables in the fund financial statements and internal balances in the government-wide financial statements arise from interfund transactions and are recorded by all funds affected in the period in which transactions are executed. As a general rule, the effect of interfund activity has been eliminated from the government-wide financial statements, except for the amounts due between the Town’s governmental activities and business-type activities..
Capital Assets
Capital assets are reported in the applicable governmental or business-type activities columns in the government-wide financial statements. Capital assets used in the operations of governmental funds and are not specifically related to activities reported in proprietary or fiduciary funds have been reported as assets in the governmental activities column of the government-wide financial statement. Capital assets are defined by the Town as assets including, but not limited to, land, buildings, machinery and equipment with an initial individual cost of $5,000 or more and an estimated useful life in excess of one year. The only exception to the $5,000 threshold is software acquisition. Software and other associated intangibles with an initial individual cost of $50,000 or more and an estimated useful life in excess of two years is capitalized.
TOWN OF HILTON HEAD ISLAND, SOUTH CAROLINA NOTES TO FINANCIAL STATEMENTS
33
Note 1. Summary of Significant Accounting Policies (continued)
Capital Assets (continued) Any donations of capital assets are recorded at fair value at date of donation. Purchased or constructed capital assets are reported at cost or estimated historical cost. The cost of normal maintenance and repairs that do not add to the value of the asset or materially extend the asset’s lives are not capitalized. Capital assets of the Town are depreciated over their useful lives on a straight-line basis as follows:
Building 25-30 years Infrastructure 25 years Vehicles 8-15 years Furniture, fixtures, and equipment 5-20 years Roads 25-30 years Waterway 30 years Dams 30-50 years Software 10 years
Long-Term Obligations
In the government-wide financial statements and the proprietary fund type in the fund financial statements, long-term debt and other long-term obligations are reported as liabilities in the applicable governmental activities, business-type activities, or proprietary fund type statement of net assets. Bond premiums and discounts, as well as issuance costs, are deferred and amortized over the life of the bonds using the straight-line method that approximates the effective interest method. Bonds payable are reported net of the applicable bond premiums or discounts and deferred losses on refundings. Bond issuance costs are reported as other assets and amortized over the term of the related debt.
In fund financial statements, governmental fund types recognize bond premiums and discounts, as well as bond issuance costs, during the current period. The face amount of debt issued is reported as other financing sources. Premiums received on debt issuances are reported as other financing sources while discounts on debt issuances are reported as other financing uses. Issuance costs, whether or not withheld from the actual debt proceeds received, are reported as debt service expenditures.
Compensated Absences
The Town has a policy to accrue compensated absences for employees when the obligation relating to the employee's rights to receive compensation is attributable to the employee's services already rendered, when the rights vest and accumulate and when the payment is payable. Vacation pay meets the above criteria for accrual, whereas sick pay does not. Sick pay does not vest until an employee reaches retirement age and/or has a minimum of five years consecutive employment. In accordance with GASB Statement No. 16, Accounting for Compensated Absences, no liability is recorded for nonvesting accumulative rights to receive sick pay benefits.
The sick leave termination benefit for employees who have a minimum of five years consecutive
employment and are terminated for non-disciplinary reasons is computed based on actual sick leave. The sick leave termination benefit is paid as a taxable lump-sum bonus at termination. Sick leave was not accrued other than for the termination or retirement benefit. The General Fund is used to liquidate the liability for compensated absences.
TOWN OF HILTON HEAD ISLAND, SOUTH CAROLINA NOTES TO FINANCIAL STATEMENTS
34
Note 1. Summary of Significant Accounting Policies (continued) Fund Equity Governmental fund equity is classified as fund balance. Fund balance is further classified as nonspendable, restricted, committed, assigned of unassigned. Nonspendable fund balance cannot be spent because of its form. Restricted fund balance has limitations imposed by creditors, grantors, or contributors or by enabling legislation or constitutional provisions. Committed fund balance is a limitation imposed by the Town Council through approval of resolutions. Assigned fund balances is a limitation imposed by a designee of the Town Council. Unassigned fund balance in the General Fund is the new resources in excess of what can be properly classified in one of the above categories. Negative unassigned fund balance in other governmental funds represents excess expenditures incurred over the amounts restricted, committed, or assigned to those purposes. Proprietary fund equity is classified the same as in the government-wide statements. Restricted Net Assets For the government-wide financial statements, net assets are reported as restricted when constraints placed on net assets are either: 1) externally imposed by creditors (such as debt covenants), grantors, contributors, or laws or regulations of other governments or 2) imposed by law through constitutional provisions or enabling legislation. Program Revenues
Amounts reported as program revenues include 1) charges to customers or applicants for goods, services, or privileges provided, 2) operating grants and contributions, and 3) capital grants and contributions. Internally dedicated resources are reported as general revenues rather than as program revenues. Likewise, general revenues include all taxes.
Subsequent Events
In preparing the comprehensive annual financial report (CAFR) for the fiscal year ended June 30, 2011, the Town evaluated events and transactions for potential recognition or disclosure through January 31, 2012.
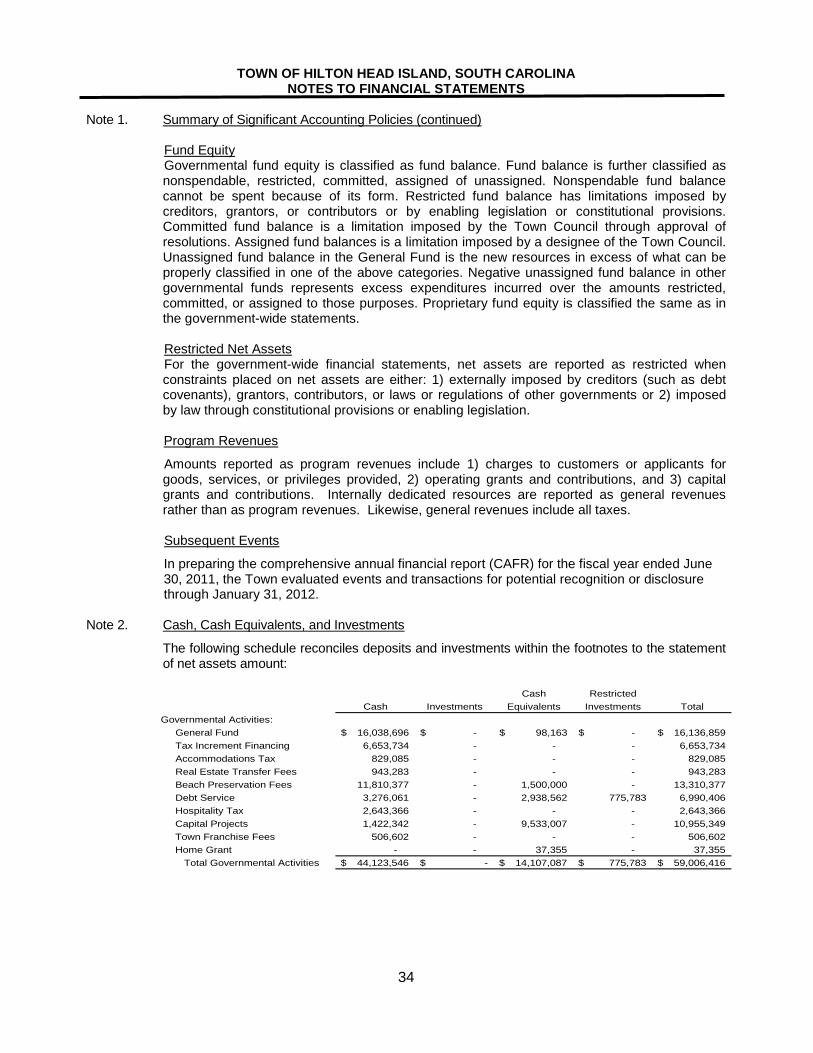
Note 2. Cash, Cash Equivalents, and Investments
The following schedule reconciles deposits and investments within the footnotes to the statement of net assets amount:
Cash Restricted
Cash Investments Equivalents Investments TotalGovernmental Activities: General Fund 16,038,696$ -$ 98,163$ -$ 16,136,859$ Tax Increment Financing 6,653,734 - - - 6,653,734 Accommodations Tax 829,085 - - - 829,085 Real Estate Transfer Fees 943,283 - - - 943,283 Beach Preservation Fees 11,810,377 - 1,500,000 - 13,310,377 Debt Service 3,276,061 - 2,938,562 775,783 6,990,406 Hospitality Tax 2,643,366 - - - 2,643,366 Capital Projects 1,422,342 - 9,533,007 - 10,955,349 Town Franchise Fees 506,602 - - - 506,602 Home Grant - - 37,355 - 37,355 Total Governmental Activities 44,123,546$ -$ 14,107,087$ 775,783$ 59,006,416$
TOWN OF HILTON HEAD ISLAND, SOUTH CAROLINA NOTES TO FINANCIAL STATEMENTS
35
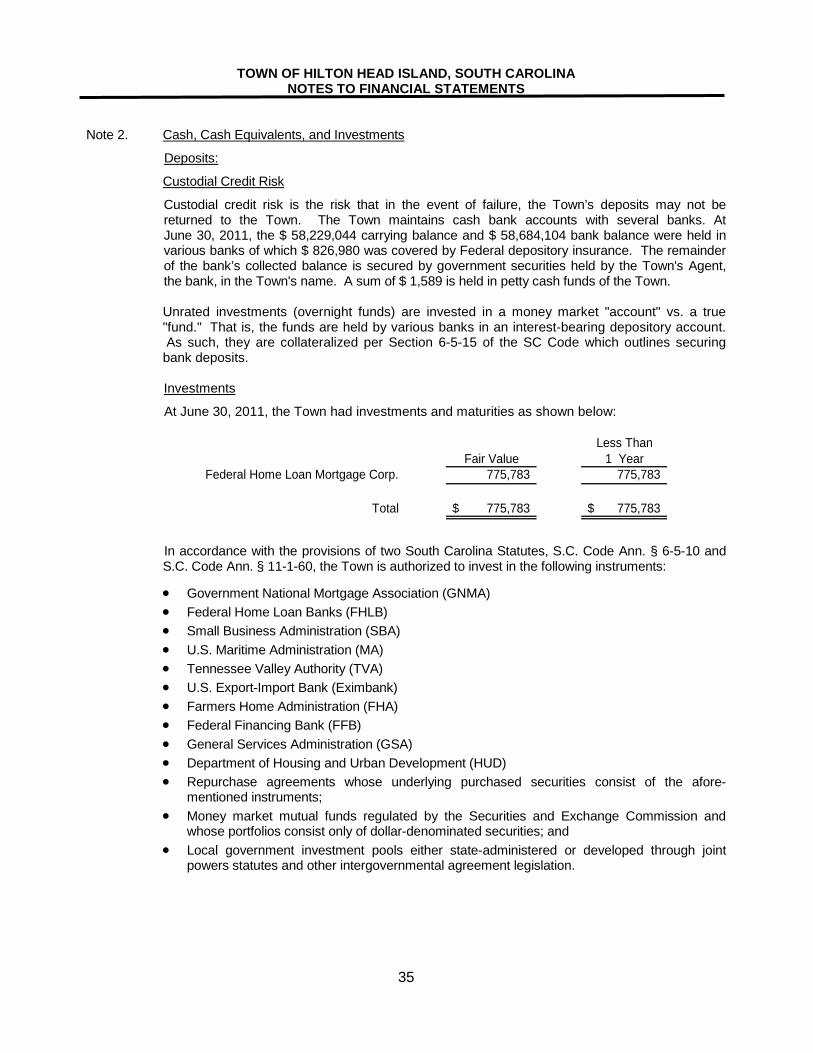
Note 2. Cash, Cash Equivalents, and Investments
Deposits:
Custodial Credit Risk
Custodial credit risk is the risk that in the event of failure, the Town’s deposits may not be returned to the Town. The Town maintains cash bank accounts with several banks. At June 30, 2011, the $ 58,229,044 carrying balance and $ 58,684,104 bank balance were held in various banks of which $ 826,980 was covered by Federal depository insurance. The remainder of the bank’s collected balance is secured by government securities held by the Town's Agent, the bank, in the Town's name. A sum of $ 1,589 is held in petty cash funds of the Town.
Unrated investments (overnight funds) are invested in a money market "account" vs. a true
"fund." That is, the funds are held by various banks in an interest-bearing depository account. As such, they are collateralized per Section 6-5-15 of the SC Code which outlines securing bank deposits.
Investments
At June 30, 2011, the Town had investments and maturities as shown below:
Less ThanFair Value 1 Year
Federal Home Loan Mortgage Corp. 775,783 775,783
Total 775,783$ 775,783$
In accordance with the provisions of two South Carolina Statutes, S.C. Code Ann. § 6-5-10 and S.C. Code Ann. § 11-1-60, the Town is authorized to invest in the following instruments:
• Government National Mortgage Association (GNMA) • Federal Home Loan Banks (FHLB) • Small Business Administration (SBA) • U.S. Maritime Administration (MA) • Tennessee Valley Authority (TVA) • U.S. Export-Import Bank (Eximbank) • Farmers Home Administration (FHA) • Federal Financing Bank (FFB) • General Services Administration (GSA) • Department of Housing and Urban Development (HUD) • Repurchase agreements whose underlying purchased securities consist of the afore-
mentioned instruments; • Money market mutual funds regulated by the Securities and Exchange Commission and
whose portfolios consist only of dollar-denominated securities; and • Local government investment pools either state-administered or developed through joint
powers statutes and other intergovernmental agreement legislation.
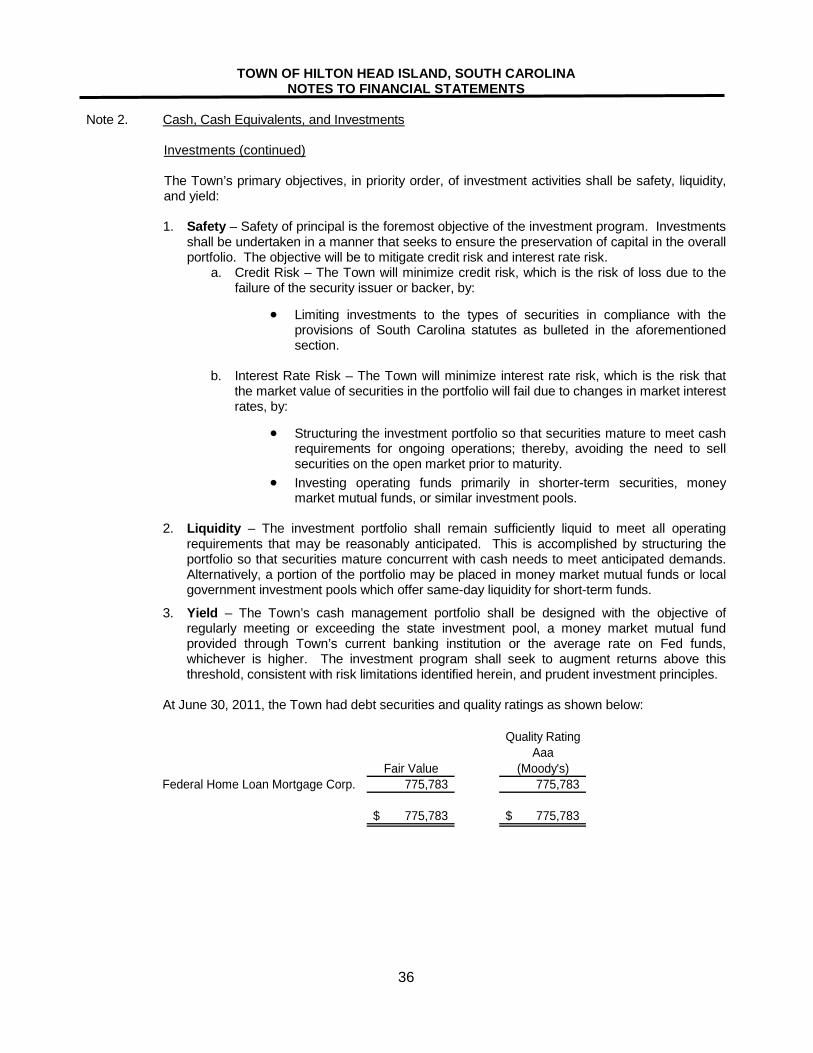
TOWN OF HILTON HEAD ISLAND, SOUTH CAROLINA NOTES TO FINANCIAL STATEMENTS
36
Note 2. Cash, Cash Equivalents, and Investments
Investments (continued)
The Town’s primary objectives, in priority order, of investment activities shall be safety, liquidity, and yield:
1. Safety – Safety of principal is the foremost objective of the investment program. Investments
shall be undertaken in a manner that seeks to ensure the preservation of capital in the overall portfolio. The objective will be to mitigate credit risk and interest rate risk.
a. Credit Risk – The Town will minimize credit risk, which is the risk of loss due to the failure of the security issuer or backer, by:
• Limiting investments to the types of securities in compliance with the provisions of South Carolina statutes as bulleted in the aforementioned section.
b. Interest Rate Risk – The Town will minimize interest rate risk, which is the risk that
the market value of securities in the portfolio will fail due to changes in market interest rates, by:
• Structuring the investment portfolio so that securities mature to meet cash requirements for ongoing operations; thereby, avoiding the need to sell securities on the open market prior to maturity.
• Investing operating funds primarily in shorter-term securities, money market mutual funds, or similar investment pools.
2. Liquidity – The investment portfolio shall remain sufficiently liquid to meet all operating
requirements that may be reasonably anticipated. This is accomplished by structuring the portfolio so that securities mature concurrent with cash needs to meet anticipated demands. Alternatively, a portion of the portfolio may be placed in money market mutual funds or local government investment pools which offer same-day liquidity for short-term funds.
3. Yield – The Town’s cash management portfolio shall be designed with the objective of regularly meeting or exceeding the state investment pool, a money market mutual fund provided through Town’s current banking institution or the average rate on Fed funds, whichever is higher. The investment program shall seek to augment returns above this threshold, consistent with risk limitations identified herein, and prudent investment principles.
At June 30, 2011, the Town had debt securities and quality ratings as shown below:
Quality RatingAaa
Fair Value (Moody's)Federal Home Loan Mortgage Corp. 775,783 775,783
775,783$ 775,783$
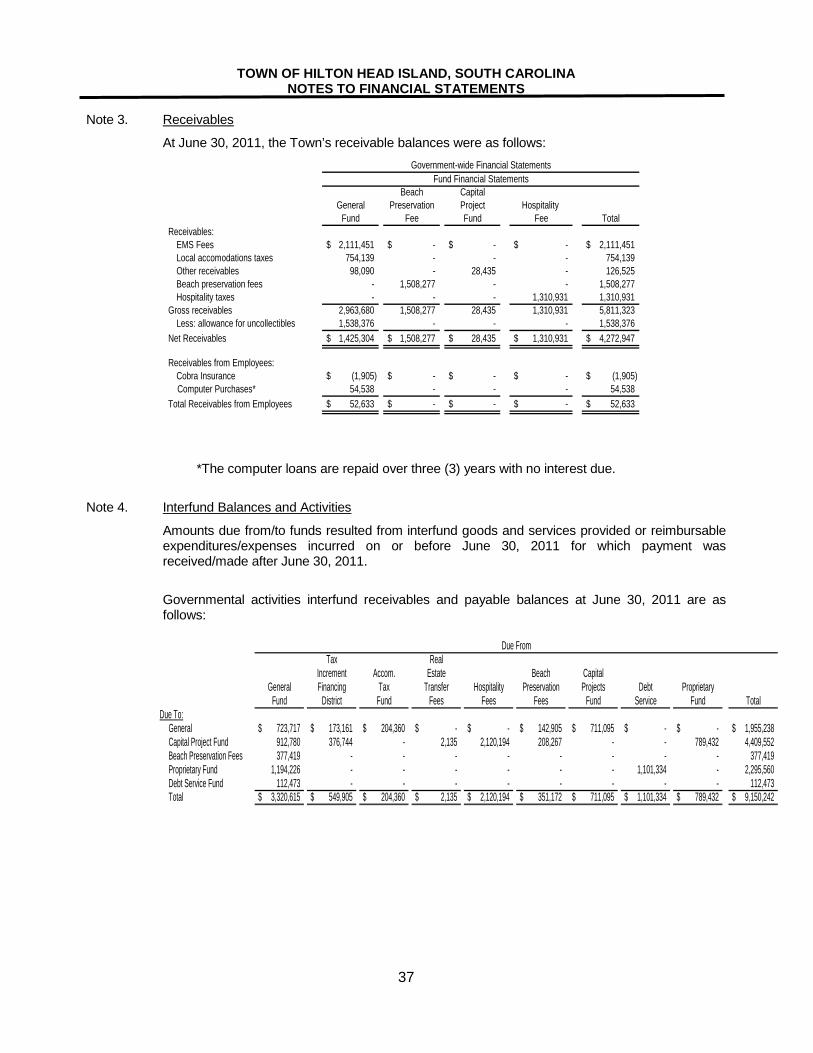
TOWN OF HILTON HEAD ISLAND, SOUTH CAROLINA NOTES TO FINANCIAL STATEMENTS
37
Note 3. Receivables
At June 30, 2011, the Town’s receivable balances were as follows:
Beach CapitalGeneral Preservation Project Hospitality
Fund Fee Fund Fee TotalReceivables:
EMS Fees 2,111,451$ -$ -$ -$ 2,111,451$ Local accomodations taxes 754,139 - - - 754,139 Other receivables 98,090 - 28,435 - 126,525 Beach preservation fees - 1,508,277 - - 1,508,277 Hospitality taxes - - - 1,310,931 1,310,931
Gross receivables 2,963,680 1,508,277 28,435 1,310,931 5,811,323 Less: allowance for uncollectibles 1,538,376 - - - 1,538,376
Net Receivables 1,425,304$ 1,508,277$ 28,435$ 1,310,931$ 4,272,947$
Receivables from Employees:Cobra Insurance (1,905)$ -$ -$ -$ (1,905)$
Computer Purchases* 54,538 - - - 54,538 Total Receivables from Employees 52,633$ -$ -$ -$ 52,633$
Fund Financial StatementsGovernment-wide Financial Statements
*The computer loans are repaid over three (3) years with no interest due.
Note 4. Interfund Balances and Activities
Amounts due from/to funds resulted from interfund goods and services provided or reimbursable expenditures/expenses incurred on or before June 30, 2011 for which payment was received/made after June 30, 2011.
Governmental activities interfund receivables and payable balances at June 30, 2011 are as
follows:
Due FromTax Real
Increment Accom. Estate Beach CapitalGeneral Financing Tax Transfer Hospitality Preservation Projects Debt Proprietary
Fund District Fund Fees Fees Fees Fund Service Fund TotalDue To:
General 723,717$ 173,161$ 204,360$ -$ -$ 142,905$ 711,095$ -$ -$ 1,955,238$ Capital Project Fund 912,780 376,744 - 2,135 2,120,194 208,267 - - 789,432 4,409,552 Beach Preservation Fees 377,419 - - - - - - - - 377,419 Proprietary Fund 1,194,226 - - - - - - 1,101,334 - 2,295,560 Debt Service Fund 112,473 - - - - - - - - 112,473 Total 3,320,615$ 549,905$ 204,360$ 2,135$ 2,120,194$ 351,172$ 711,095$ 1,101,334$ 789,432$ 9,150,242$
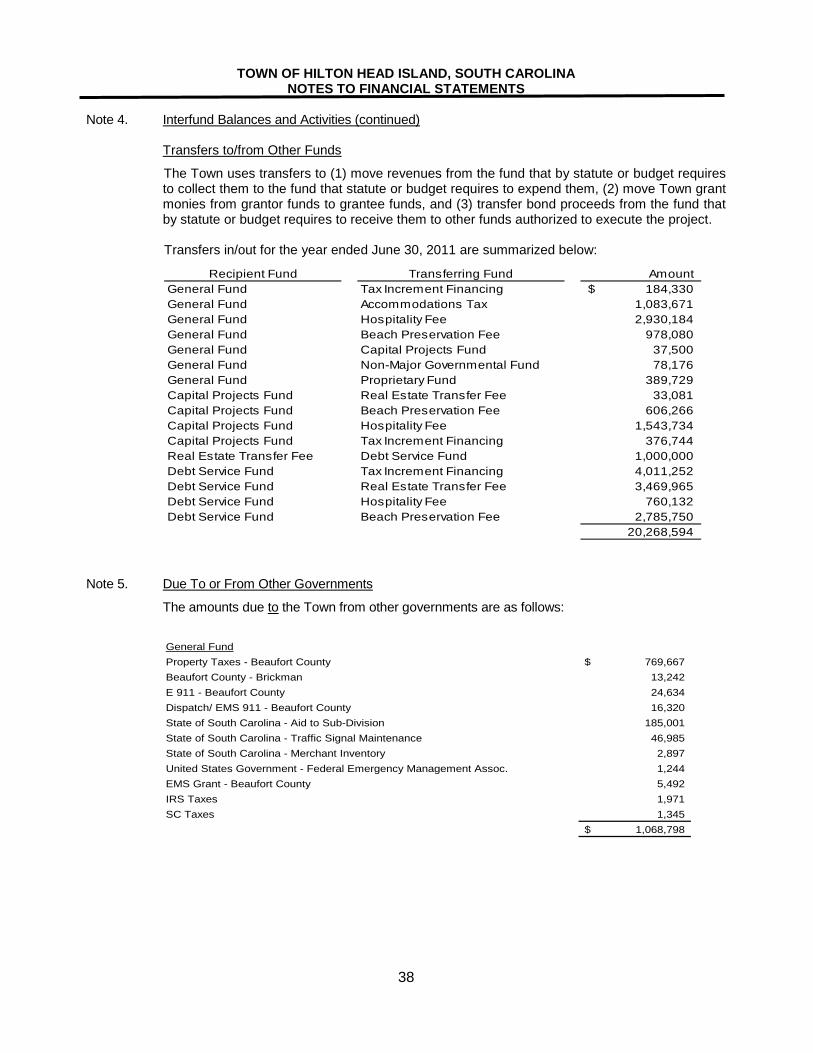
TOWN OF HILTON HEAD ISLAND, SOUTH CAROLINA NOTES TO FINANCIAL STATEMENTS
38
Note 4. Interfund Balances and Activities (continued) Transfers to/from Other Funds
The Town uses transfers to (1) move revenues from the fund that by statute or budget requires to collect them to the fund that statute or budget requires to expend them, (2) move Town grant monies from grantor funds to grantee funds, and (3) transfer bond proceeds from the fund that by statute or budget requires to receive them to other funds authorized to execute the project.
Transfers in/out for the year ended June 30, 2011 are summarized below:
AmountGeneral Fund Tax Increment Financing 184,330$ General Fund Accommodations Tax 1,083,671 General Fund Hospitality Fee 2,930,184 General Fund Beach Preservation Fee 978,080 General Fund Capital Projects Fund 37,500 General Fund Non-Major Governmental Fund 78,176 General Fund Proprietary Fund 389,729 Capital Projects Fund Real Estate Transfer Fee 33,081 Capital Projects Fund Beach Preservation Fee 606,266 Capital Projects Fund Hospitality Fee 1,543,734 Capital Projects Fund Tax Increment Financing 376,744 Real Estate Transfer Fee Debt Service Fund 1,000,000 Debt Service Fund Tax Increment Financing 4,011,252 Debt Service Fund Real Estate Transfer Fee 3,469,965 Debt Service Fund Hospitality Fee 760,132 Debt Service Fund Beach Preservation Fee 2,785,750
20,268,594
Recipient Fund Transferring Fund
Note 5. Due To or From Other Governments
The amounts due to the Town from other governments are as follows:
General FundProperty Taxes - Beaufort County 769,667$ Beaufort County - Brickman 13,242 E 911 - Beaufort County 24,634 Dispatch/ EMS 911 - Beaufort County 16,320 State of South Carolina - Aid to Sub-Division 185,001 State of South Carolina - Traffic Signal Maintenance 46,985 State of South Carolina - Merchant Inventory 2,897 United States Government - Federal Emergency Management Assoc. 1,244 EMS Grant - Beaufort County 5,492 IRS Taxes 1,971 SC Taxes 1,345
1,068,798$
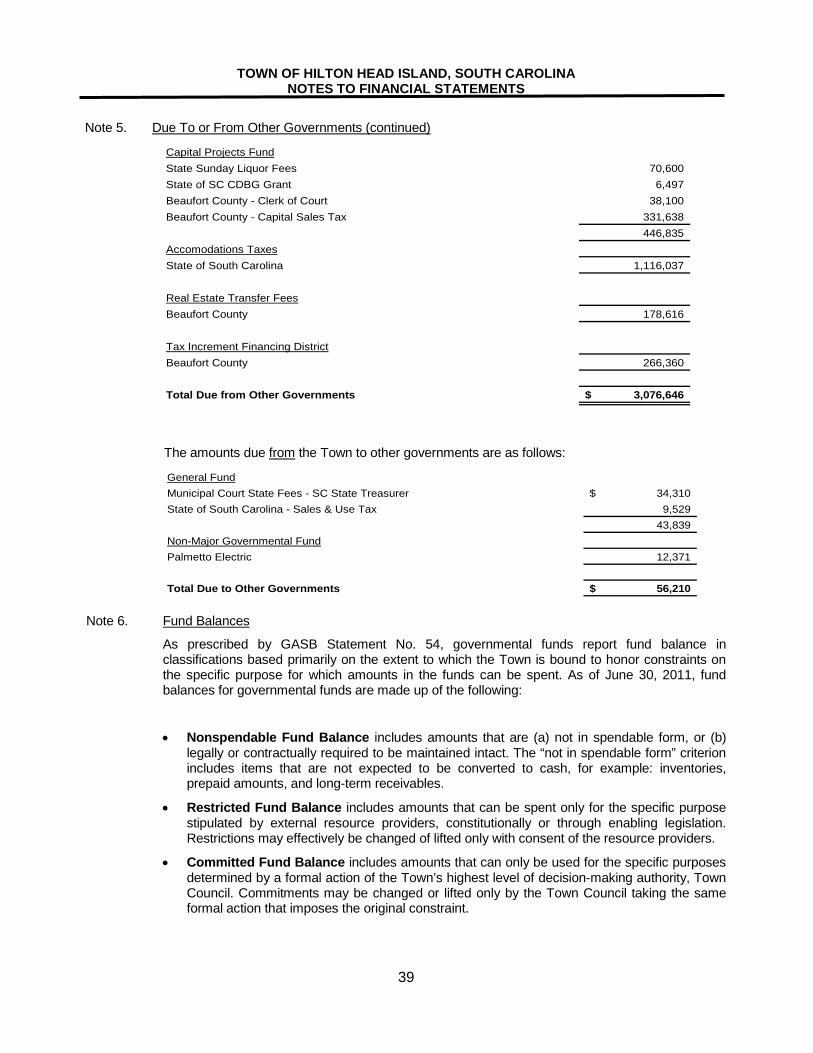
TOWN OF HILTON HEAD ISLAND, SOUTH CAROLINA NOTES TO FINANCIAL STATEMENTS
39
Note 5. Due To or From Other Governments (continued)
Capital Projects FundState Sunday Liquor Fees 70,600 State of SC CDBG Grant 6,497 Beaufort County - Clerk of Court 38,100 Beaufort County - Capital Sales Tax 331,638
446,835 Accomodations TaxesState of South Carolina 1,116,037
Real Estate Transfer FeesBeaufort County 178,616
Tax Increment Financing DistrictBeaufort County 266,360
Total Due from Other Governments 3,076,646$
The amounts due from the Town to other governments are as follows:
General FundMunicipal Court State Fees - SC State Treasurer 34,310$ State of South Carolina - Sales & Use Tax 9,529
43,839 Non-Major Governmental FundPalmetto Electric 12,371
Total Due to Other Governments 56,210$ Note 6. Fund Balances
As prescribed by GASB Statement No. 54, governmental funds report fund balance in classifications based primarily on the extent to which the Town is bound to honor constraints on the specific purpose for which amounts in the funds can be spent. As of June 30, 2011, fund balances for governmental funds are made up of the following:
• Nonspendable Fund Balance includes amounts that are (a) not in spendable form, or (b) legally or contractually required to be maintained intact. The “not in spendable form” criterion includes items that are not expected to be converted to cash, for example: inventories, prepaid amounts, and long-term receivables.
• Restricted Fund Balance includes amounts that can be spent only for the specific purpose stipulated by external resource providers, constitutionally or through enabling legislation. Restrictions may effectively be changed of lifted only with consent of the resource providers.
• Committed Fund Balance includes amounts that can only be used for the specific purposes determined by a formal action of the Town’s highest level of decision-making authority, Town Council. Commitments may be changed or lifted only by the Town Council taking the same formal action that imposes the original constraint.
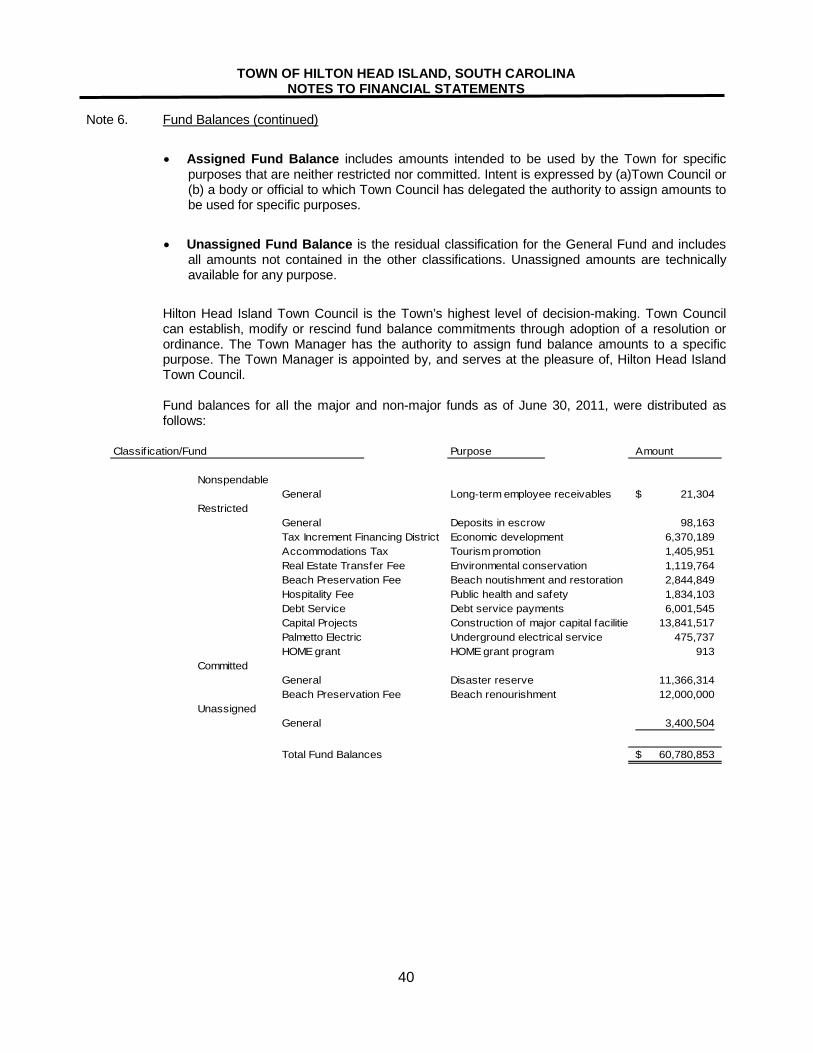
TOWN OF HILTON HEAD ISLAND, SOUTH CAROLINA NOTES TO FINANCIAL STATEMENTS
40
Note 6. Fund Balances (continued)
• Assigned Fund Balance includes amounts intended to be used by the Town for specific purposes that are neither restricted nor committed. Intent is expressed by (a)Town Council or (b) a body or official to which Town Council has delegated the authority to assign amounts to be used for specific purposes.
• Unassigned Fund Balance is the residual classification for the General Fund and includes all amounts not contained in the other classifications. Unassigned amounts are technically available for any purpose.
Hilton Head Island Town Council is the Town’s highest level of decision-making. Town Council can establish, modify or rescind fund balance commitments through adoption of a resolution or ordinance. The Town Manager has the authority to assign fund balance amounts to a specific purpose. The Town Manager is appointed by, and serves at the pleasure of, Hilton Head Island Town Council.
Fund balances for all the major and non-major funds as of June 30, 2011, were distributed as
follows:
Purpose Amount
NonspendableGeneral Long-term employee receivables 21,304$
RestrictedGeneral Deposits in escrow 98,163 Tax Increment Financing District Economic development 6,370,189 Accommodations Tax Tourism promotion 1,405,951 Real Estate Transfer Fee Environmental conservation 1,119,764 Beach Preservation Fee Beach noutishment and restoration 2,844,849 Hospitality Fee Public health and safety 1,834,103 Debt Service Debt service payments 6,001,545 Capital Projects Construction of major capital facilitie 13,841,517 Palmetto Electric Underground electrical service 475,737 HOME grant HOME grant program 913
CommittedGeneral Disaster reserve 11,366,314 Beach Preservation Fee Beach renourishment 12,000,000
UnassignedGeneral 3,400,504
Total Fund Balances 60,780,853$
Classif ication/Fund
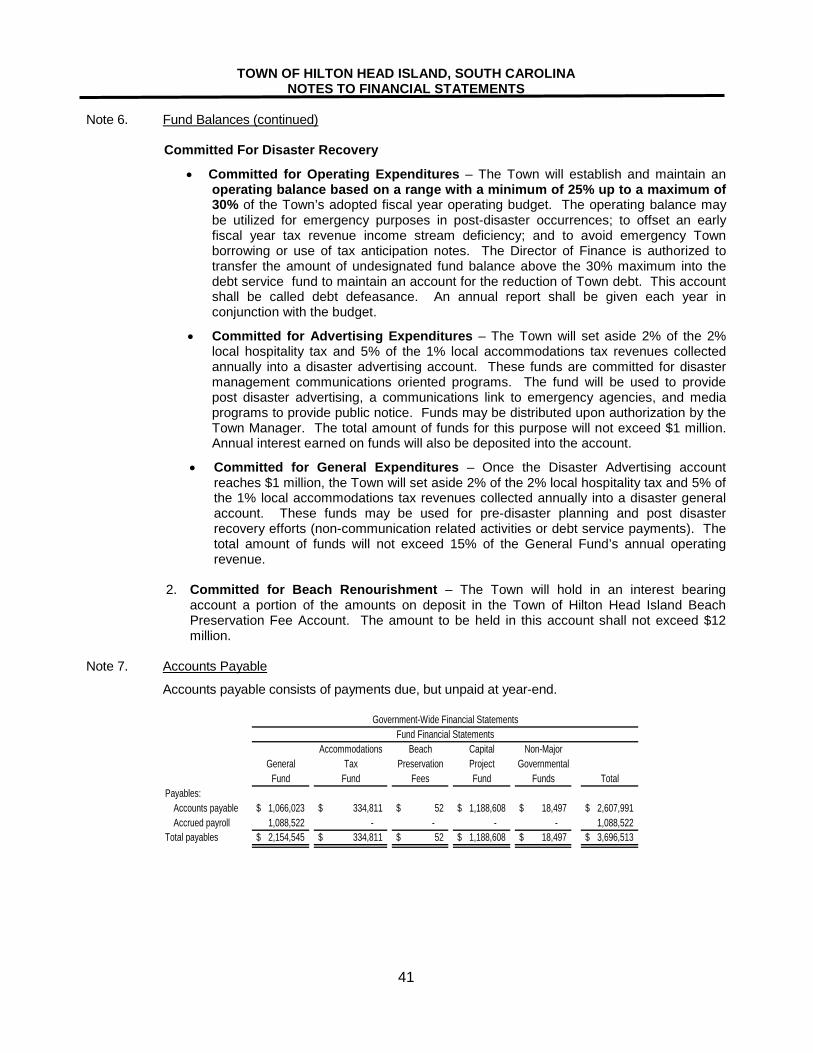
TOWN OF HILTON HEAD ISLAND, SOUTH CAROLINA NOTES TO FINANCIAL STATEMENTS
41
Note 6. Fund Balances (continued)
Committed For Disaster Recovery
• Committed for Operating Expenditures – The Town will establish and maintain an operating balance based on a range with a minimum of 25% up to a maximum of 30% of the Town’s adopted fiscal year operating budget. The operating balance may be utilized for emergency purposes in post-disaster occurrences; to offset an early fiscal year tax revenue income stream deficiency; and to avoid emergency Town borrowing or use of tax anticipation notes. The Director of Finance is authorized to transfer the amount of undesignated fund balance above the 30% maximum into the debt service fund to maintain an account for the reduction of Town debt. This account shall be called debt defeasance. An annual report shall be given each year in conjunction with the budget.
• Committed for Advertising Expenditures – The Town will set aside 2% of the 2% local hospitality tax and 5% of the 1% local accommodations tax revenues collected annually into a disaster advertising account. These funds are committed for disaster management communications oriented programs. The fund will be used to provide post disaster advertising, a communications link to emergency agencies, and media programs to provide public notice. Funds may be distributed upon authorization by the Town Manager. The total amount of funds for this purpose will not exceed $1 million. Annual interest earned on funds will also be deposited into the account.
• Committed for General Expenditures – Once the Disaster Advertising account reaches $1 million, the Town will set aside 2% of the 2% local hospitality tax and 5% of the 1% local accommodations tax revenues collected annually into a disaster general account. These funds may be used for pre-disaster planning and post disaster recovery efforts (non-communication related activities or debt service payments). The total amount of funds will not exceed 15% of the General Fund’s annual operating revenue.
2. Committed for Beach Renourishment – The Town will hold in an interest bearing
account a portion of the amounts on deposit in the Town of Hilton Head Island Beach Preservation Fee Account. The amount to be held in this account shall not exceed $12 million.
Note 7. Accounts Payable
Accounts payable consists of payments due, but unpaid at year-end.
Accommodations Beach Capital Non-MajorGeneral Tax Preservation Project Governmental
Fund Fund Fees Fund Funds TotalPayables:
Accounts payable 1,066,023$ 334,811$ 52$ 1,188,608$ 18,497$ 2,607,991$ Accrued payroll 1,088,522 - - - - 1,088,522
Total payables 2,154,545$ 334,811$ 52$ 1,188,608$ 18,497$ 3,696,513$
Fund Financial StatementsGovernment-Wide Financial Statements
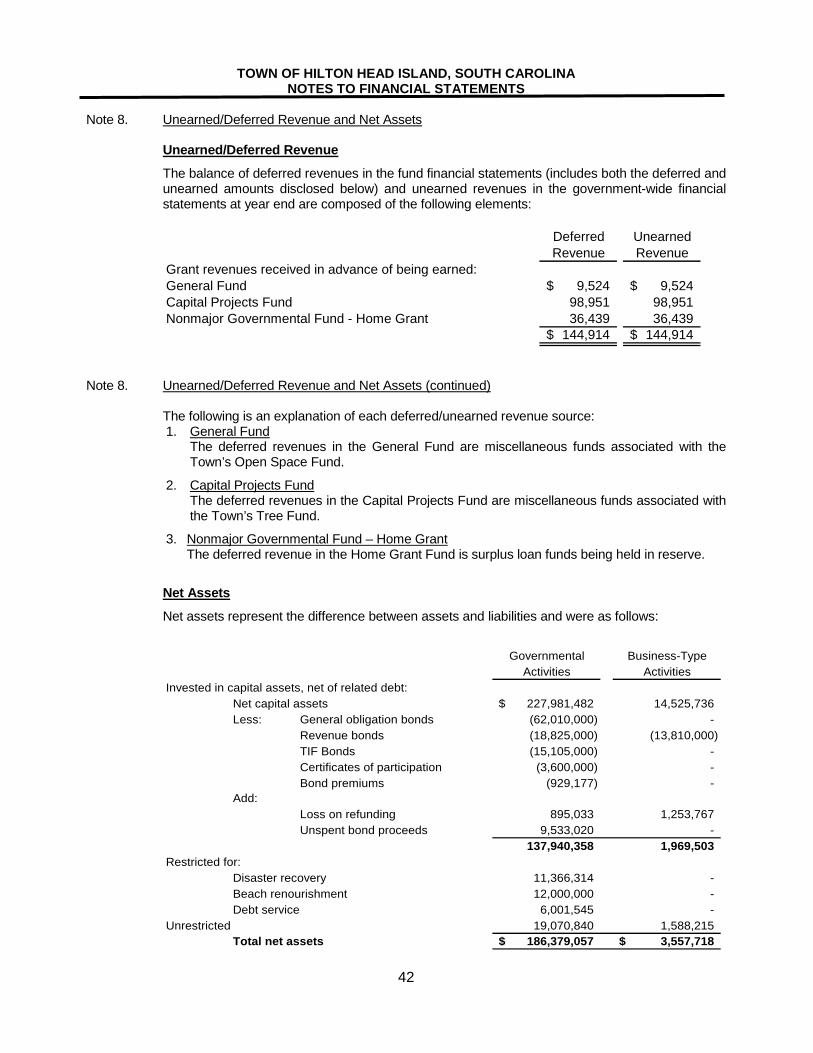
TOWN OF HILTON HEAD ISLAND, SOUTH CAROLINA NOTES TO FINANCIAL STATEMENTS
42
Note 8. Unearned/Deferred Revenue and Net Assets Unearned/Deferred Revenue
The balance of deferred revenues in the fund financial statements (includes both the deferred and unearned amounts disclosed below) and unearned revenues in the government-wide financial statements at year end are composed of the following elements:
Deferred UnearnedRevenue Revenue
Grant revenues received in advance of being earned:General Fund 9,524$ 9,524$ Capital Projects Fund 98,951 98,951 Nonmajor Governmental Fund - Home Grant 36,439 36,439
144,914$ 144,914$
Note 8. Unearned/Deferred Revenue and Net Assets (continued)
The following is an explanation of each deferred/unearned revenue source: 1. General Fund
The deferred revenues in the General Fund are miscellaneous funds associated with the Town’s Open Space Fund.
2. Capital Projects Fund The deferred revenues in the Capital Projects Fund are miscellaneous funds associated with the Town’s Tree Fund.
3. Nonmajor Governmental Fund – Home Grant The deferred revenue in the Home Grant Fund is surplus loan funds being held in reserve.
Net Assets
Net assets represent the difference between assets and liabilities and were as follows:
Governmental Business-Type
Activities ActivitiesInvested in capital assets, net of related debt:
Net capital assets 227,981,482$ 14,525,736 Less: General obligation bonds (62,010,000) -
Revenue bonds (18,825,000) (13,810,000) TIF Bonds (15,105,000) - Certificates of participation (3,600,000) - Bond premiums (929,177) -
Add:895,033 1,253,767
Unspent bond proceeds 9,533,020 - 137,940,358 1,969,503
Restricted for:Disaster recovery 11,366,314 - Beach renourishment 12,000,000 - Debt service 6,001,545 -
Unrestricted 19,070,840 1,588,215 Total net assets 186,379,057$ 3,557,718$
Loss on refunding
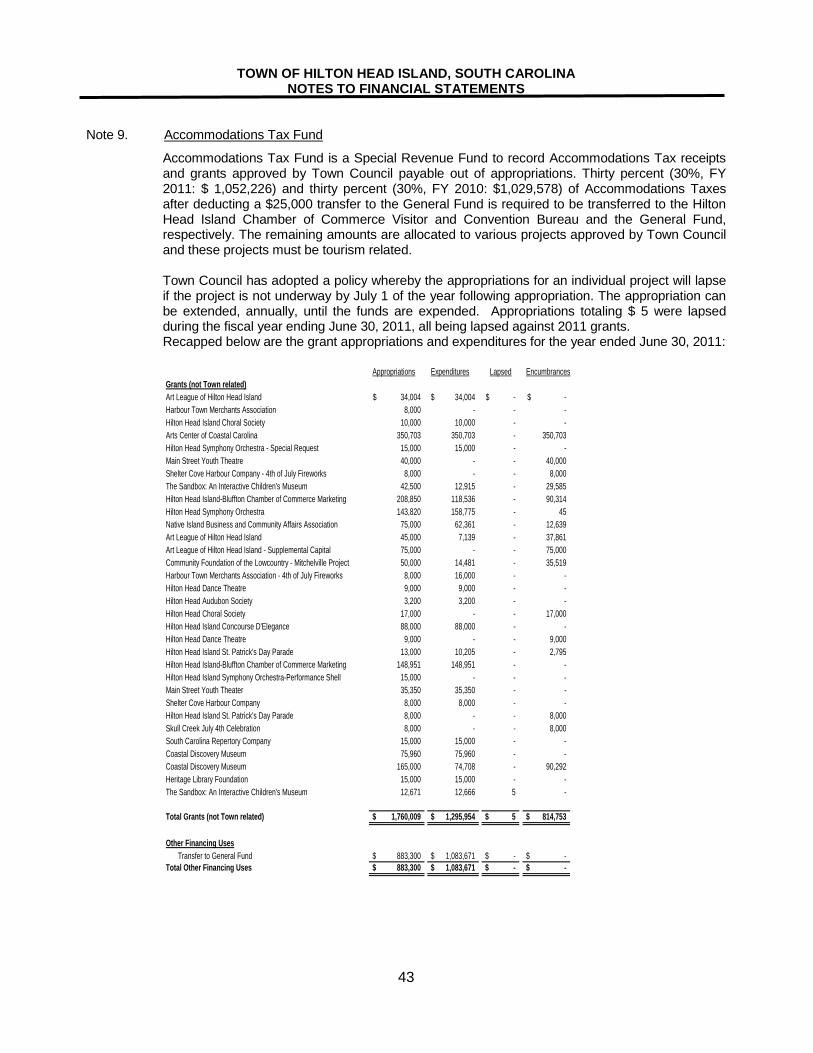
TOWN OF HILTON HEAD ISLAND, SOUTH CAROLINA NOTES TO FINANCIAL STATEMENTS
43
Note 9. Accommodations Tax Fund
Accommodations Tax Fund is a Special Revenue Fund to record Accommodations Tax receipts and grants approved by Town Council payable out of appropriations. Thirty percent (30%, FY 2011: $ 1,052,226) and thirty percent (30%, FY 2010: $1,029,578) of Accommodations Taxes after deducting a $25,000 transfer to the General Fund is required to be transferred to the Hilton Head Island Chamber of Commerce Visitor and Convention Bureau and the General Fund, respectively. The remaining amounts are allocated to various projects approved by Town Council and these projects must be tourism related.
Town Council has adopted a policy whereby the appropriations for an individual project will lapse
if the project is not underway by July 1 of the year following appropriation. The appropriation can be extended, annually, until the funds are expended. Appropriations totaling $ 5 were lapsed during the fiscal year ending June 30, 2011, all being lapsed against 2011 grants.
Recapped below are the grant appropriations and expenditures for the year ended June 30, 2011:
Appropriations Expenditures Lapsed EncumbrancesGrants (not Town related)Art League of Hilton Head Island 34,004$ 34,004$ -$ -$ Harbour Town Merchants Association 8,000 - - - Hilton Head Island Choral Society 10,000 10,000 - -Arts Center of Coastal Carolina 350,703 350,703 - 350,703 Hilton Head Symphony Orchestra - Special Request 15,000 15,000 - - Main Street Youth Theatre 40,000 - - 40,000 Shelter Cove Harbour Company - 4th of July Fireworks 8,000 - - 8,000 The Sandbox: An Interactive Children's Museum 42,500 12,915 - 29,585 Hilton Head Island-Bluffton Chamber of Commerce Marketing 208,850 118,536 - 90,314 Hilton Head Symphony Orchestra 143,820 158,775 - 45 Native Island Business and Community Affairs Association 75,000 62,361 - 12,639 Art League of Hilton Head Island 45,000 7,139 - 37,861 Art League of Hilton Head Island - Supplemental Capital 75,000 - - 75,000 Community Foundation of the Lowcountry - Mitchelville Project 50,000 14,481 - 35,519 Harbour Town Merchants Association - 4th of July Fireworks 8,000 16,000 - - Hilton Head Dance Theatre 9,000 9,000 - - Hilton Head Audubon Society 3,200 3,200 - - Hilton Head Choral Society 17,000 - - 17,000 Hilton Head Island Concourse D'Elegance 88,000 88,000 - - Hilton Head Dance Theatre 9,000 - - 9,000 Hilton Head Island St. Patrick's Day Parade 13,000 10,205 - 2,795 Hilton Head Island-Bluffton Chamber of Commerce Marketing 148,951 148,951 - - Hilton Head Island Symphony Orchestra-Performance Shell 15,000 - - - Main Street Youth Theater 35,350 35,350 - - Shelter Cove Harbour Company 8,000 8,000 - - Hilton Head Island St. Patrick's Day Parade 8,000 - - 8,000 Skull Creek July 4th Celebration 8,000 - - 8,000 South Carolina Repertory Company 15,000 15,000 - - Coastal Discovery Museum 75,960 75,960 - - Coastal Discovery Museum 165,000 74,708 - 90,292 Heritage Library Foundation 15,000 15,000 - - The Sandbox: An Interactive Children's Museum 12,671 12,666 5 -
Total Grants (not Town related) 1,760,009$ 1,295,954$ 5$ 814,753$
Other Financing UsesTransfer to General Fund 883,300$ 1,083,671$ -$ -$
Total Other Financing Uses 883,300$ 1,083,671$ -$ -$
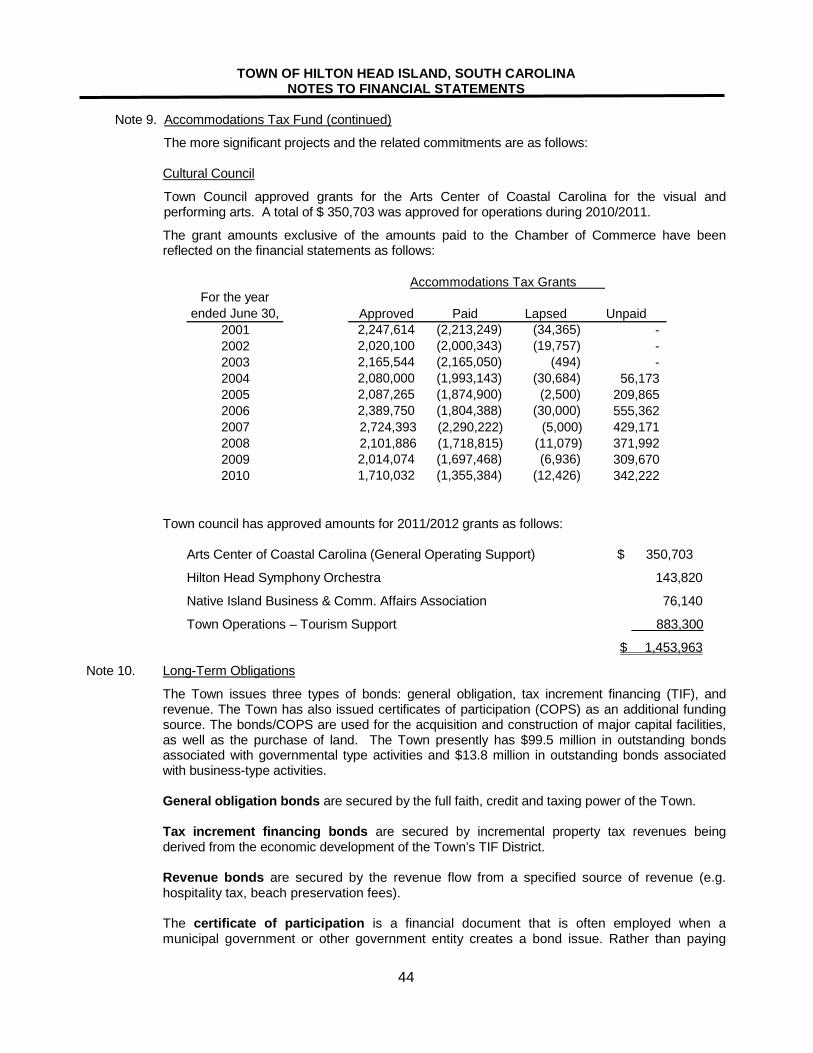
TOWN OF HILTON HEAD ISLAND, SOUTH CAROLINA NOTES TO FINANCIAL STATEMENTS
44
Note 9. Accommodations Tax Fund (continued)
The more significant projects and the related commitments are as follows: Cultural Council
Town Council approved grants for the Arts Center of Coastal Carolina for the visual and performing arts. A total of $ 350,703 was approved for operations during 2010/2011.
The grant amounts exclusive of the amounts paid to the Chamber of Commerce have been reflected on the financial statements as follows:
For the year ended June 30, Approved Paid Lapsed Unpaid
2001 2,247,614 (2,213,249) (34,365) - 2002 2,020,100 (2,000,343) (19,757) - 2003 2,165,544 (2,165,050) (494) - 2004 2,080,000 (1,993,143) (30,684) 56,173 2005 2,087,265 (1,874,900) (2,500) 209,865 2006 2,389,750 (1,804,388) (30,000) 555,362 2007 2,724,393 (2,290,222) (5,000) 429,171 2008 2,101,886 (1,718,815) (11,079) 371,992 2009 2,014,074 (1,697,468) (6,936) 309,670 2010 1,710,032 (1,355,384) (12,426) 342,222
Accommodations Tax Grants
Town council has approved amounts for 2011/2012 grants as follows: Arts Center of Coastal Carolina (General Operating Support) $ 350,703
Hilton Head Symphony Orchestra 143,820
Native Island Business & Comm. Affairs Association 76,140
Town Operations – Tourism Support 883,300
$ 1,453,963
Note 10. Long-Term Obligations
The Town issues three types of bonds: general obligation, tax increment financing (TIF), and revenue. The Town has also issued certificates of participation (COPS) as an additional funding source. The bonds/COPS are used for the acquisition and construction of major capital facilities, as well as the purchase of land. The Town presently has $99.5 million in outstanding bonds associated with governmental type activities and $13.8 million in outstanding bonds associated with business-type activities.
General obligation bonds are secured by the full faith, credit and taxing power of the Town.
Tax increment financing bonds are secured by incremental property tax revenues being derived from the economic development of the Town’s TIF District.
Revenue bonds are secured by the revenue flow from a specified source of revenue (e.g. hospitality tax, beach preservation fees). The certificate of participation is a financial document that is often employed when a municipal government or other government entity creates a bond issue. Rather than paying
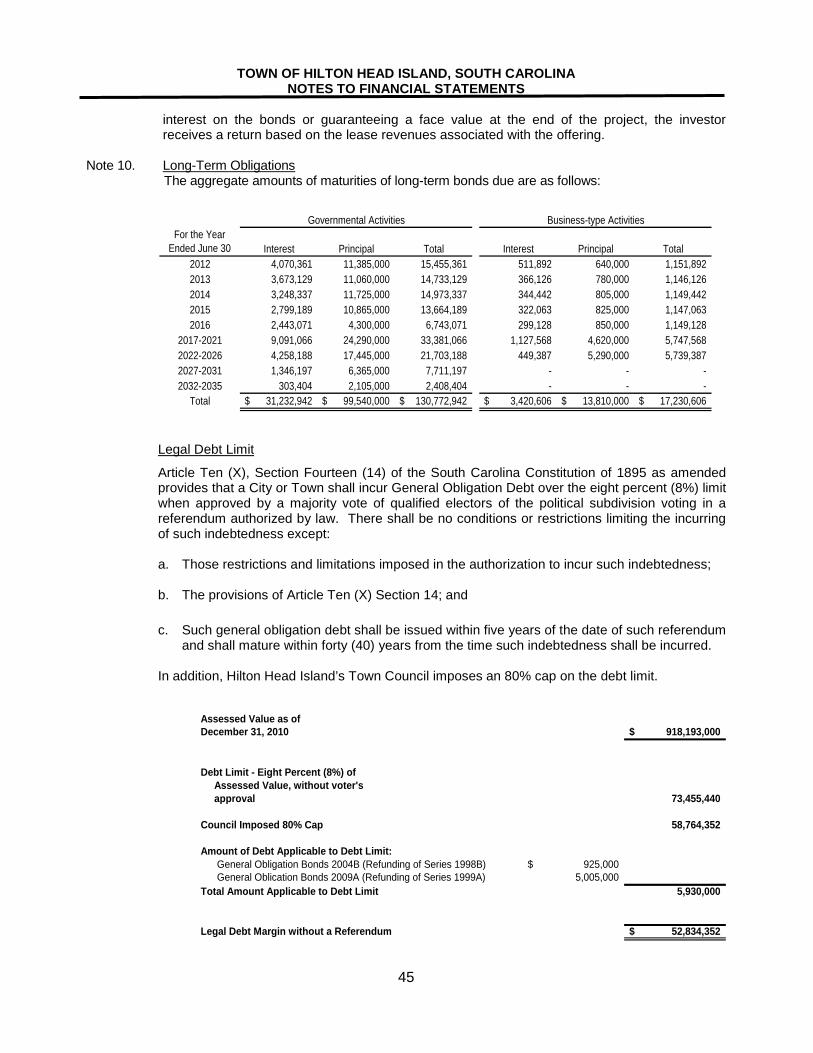
TOWN OF HILTON HEAD ISLAND, SOUTH CAROLINA NOTES TO FINANCIAL STATEMENTS
45
interest on the bonds or guaranteeing a face value at the end of the project, the investor receives a return based on the lease revenues associated with the offering.
Note 10. Long-Term Obligations The aggregate amounts of maturities of long-term bonds due are as follows:
For the Year Ended June 30 Interest Principal Total Interest Principal Total
2012 4,070,361 11,385,000 15,455,361 511,892 640,000 1,151,892 2013 3,673,129 11,060,000 14,733,129 366,126 780,000 1,146,126 2014 3,248,337 11,725,000 14,973,337 344,442 805,000 1,149,442 2015 2,799,189 10,865,000 13,664,189 322,063 825,000 1,147,063 2016 2,443,071 4,300,000 6,743,071 299,128 850,000 1,149,128
2017-2021 9,091,066 24,290,000 33,381,066 1,127,568 4,620,000 5,747,568 2022-2026 4,258,188 17,445,000 21,703,188 449,387 5,290,000 5,739,387 2027-2031 1,346,197 6,365,000 7,711,197 - - - 2032-2035 303,404 2,105,000 2,408,404 - - -
Total 31,232,942$ 99,540,000$ 130,772,942$ 3,420,606$ 13,810,000$ 17,230,606$
Governmental Activities Business-type Activities
Legal Debt Limit
Article Ten (X), Section Fourteen (14) of the South Carolina Constitution of 1895 as amended provides that a City or Town shall incur General Obligation Debt over the eight percent (8%) limit when approved by a majority vote of qualified electors of the political subdivision voting in a referendum authorized by law. There shall be no conditions or restrictions limiting the incurring of such indebtedness except:
a. Those restrictions and limitations imposed in the authorization to incur such indebtedness;
b. The provisions of Article Ten (X) Section 14; and
c. Such general obligation debt shall be issued within five years of the date of such referendum
and shall mature within forty (40) years from the time such indebtedness shall be incurred.
In addition, Hilton Head Island’s Town Council imposes an 80% cap on the debt limit.
Assessed Value as ofDecember 31, 2010 918,193,000$
Debt Limit - Eight Percent (8%) of Assessed Value, without voter's approval 73,455,440
Council Imposed 80% Cap 58,764,352
Amount of Debt Applicable to Debt Limit:General Obligation Bonds 2004B (Refunding of Series 1998B) 925,000$ General Oblication Bonds 2009A (Refunding of Series 1999A) 5,005,000
Total Amount Applicable to Debt Limit 5,930,000
Legal Debt Margin without a Referendum 52,834,352$
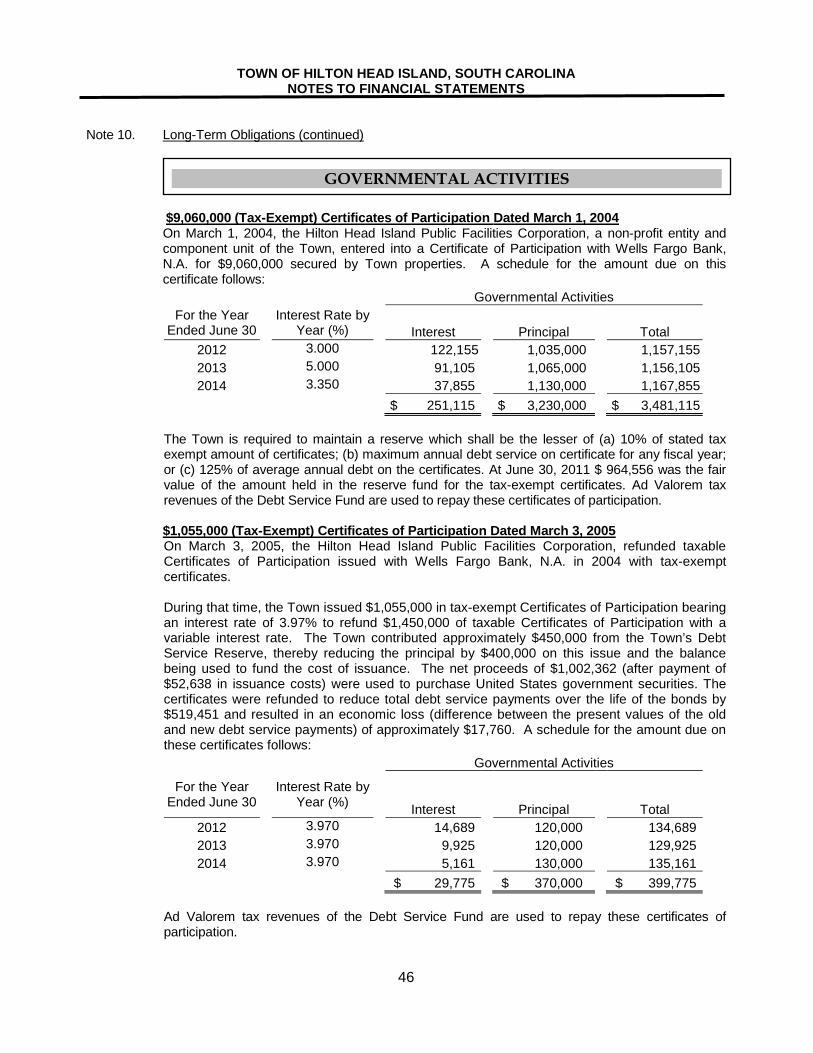
TOWN OF HILTON HEAD ISLAND, SOUTH CAROLINA NOTES TO FINANCIAL STATEMENTS
46
Note 10. Long-Term Obligations (continued)
$9,060,000 (Tax-Exempt) Certificates of Participation Dated March 1, 2004 On March 1, 2004, the Hilton Head Island Public Facilities Corporation, a non-profit entity and component unit of the Town, entered into a Certificate of Participation with Wells Fargo Bank, N.A. for $9,060,000 secured by Town properties. A schedule for the amount due on this certificate follows: Governmental Activities
For the Year Ended June 30 Interest Rate by
Year (%) Interest Principal Total 2012 3.000 122,155 1,035,000 1,157,155 2013 5.000 91,105 1,065,000 1,156,105 2014 3.350 37,855 1,130,000 1,167,855
$ 251,115 $ 3,230,000 $ 3,481,115
The Town is required to maintain a reserve which shall be the lesser of (a) 10% of stated tax exempt amount of certificates; (b) maximum annual debt service on certificate for any fiscal year; or (c) 125% of average annual debt on the certificates. At June 30, 2011 $ 964,556 was the fair value of the amount held in the reserve fund for the tax-exempt certificates. Ad Valorem tax revenues of the Debt Service Fund are used to repay these certificates of participation.
$1,055,000 (Tax-Exempt) Certificates of Participation Dated March 3, 2005
On March 3, 2005, the Hilton Head Island Public Facilities Corporation, refunded taxable Certificates of Participation issued with Wells Fargo Bank, N.A. in 2004 with tax-exempt certificates.
During that time, the Town issued $1,055,000 in tax-exempt Certificates of Participation bearing an interest rate of 3.97% to refund $1,450,000 of taxable Certificates of Participation with a variable interest rate. The Town contributed approximately $450,000 from the Town’s Debt Service Reserve, thereby reducing the principal by $400,000 on this issue and the balance being used to fund the cost of issuance. The net proceeds of $1,002,362 (after payment of $52,638 in issuance costs) were used to purchase United States government securities. The certificates were refunded to reduce total debt service payments over the life of the bonds by $519,451 and resulted in an economic loss (difference between the present values of the old and new debt service payments) of approximately $17,760. A schedule for the amount due on these certificates follows: Governmental Activities
For the Year Ended June 30 Interest Rate by
Year (%) Interest Principal Total 2012 3.970 14,689 120,000 134,689 2013 3.970 9,925 120,000 129,925 2014 3.970 5,161 130,000 135,161
$ 29,775 $ 370,000 $ 399,775
Ad Valorem tax revenues of the Debt Service Fund are used to repay these certificates of participation.
GOVERNMENTAL ACTIVITIES
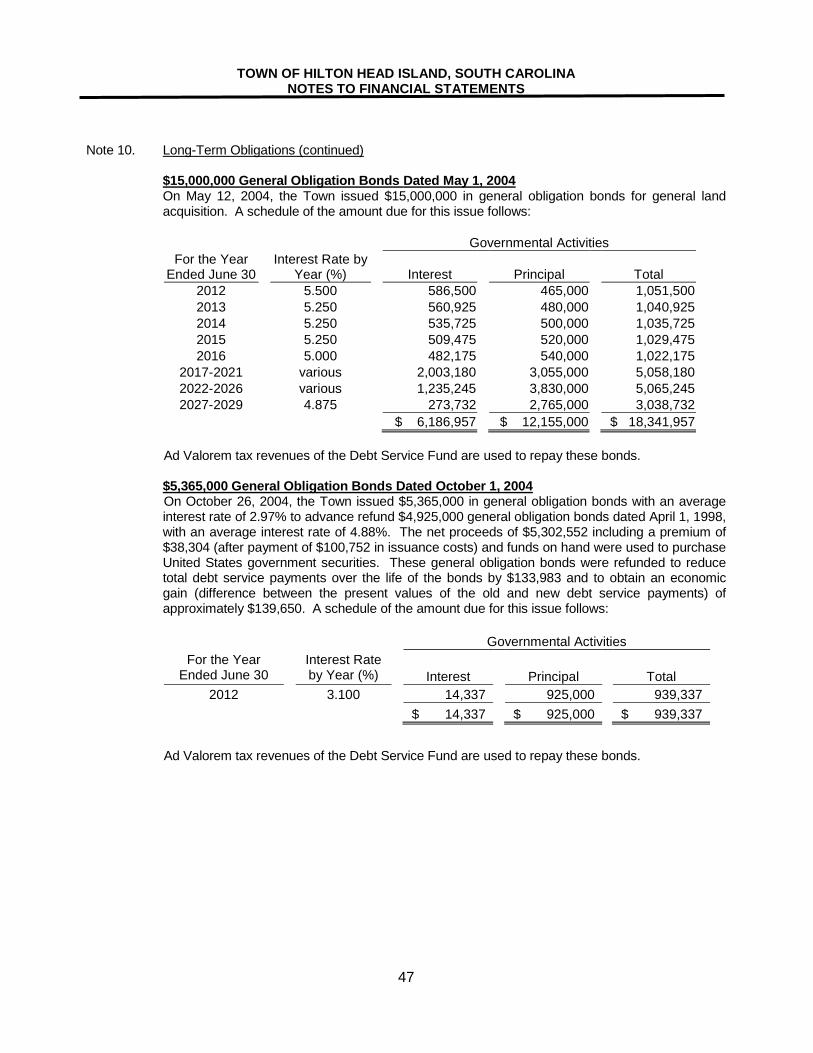
TOWN OF HILTON HEAD ISLAND, SOUTH CAROLINA NOTES TO FINANCIAL STATEMENTS
47
Note 10. Long-Term Obligations (continued) $15,000,000 General Obligation Bonds Dated May 1, 2004 On May 12, 2004, the Town issued $15,000,000 in general obligation bonds for general land
acquisition. A schedule of the amount due for this issue follows:
Governmental Activities For the Year
Ended June 30 Interest Rate by Year (%) Interest Principal Total
2012 5.500 586,500 465,000 1,051,500 2013 5.250 560,925 480,000 1,040,925 2014 5.250 535,725 500,000 1,035,725 2015 5.250 509,475 520,000 1,029,475 2016 5.000 482,175 540,000 1,022,175
2017-2021 various 2,003,180 3,055,000 5,058,180 2022-2026 various 1,235,245 3,830,000 5,065,245 2027-2029 4.875 273,732 2,765,000 3,038,732
$ 6,186,957 $ 12,155,000 $ 18,341,957
Ad Valorem tax revenues of the Debt Service Fund are used to repay these bonds. $5,365,000 General Obligation Bonds Dated October 1, 2004
On October 26, 2004, the Town issued $5,365,000 in general obligation bonds with an average interest rate of 2.97% to advance refund $4,925,000 general obligation bonds dated April 1, 1998, with an average interest rate of 4.88%. The net proceeds of $5,302,552 including a premium of $38,304 (after payment of $100,752 in issuance costs) and funds on hand were used to purchase United States government securities. These general obligation bonds were refunded to reduce total debt service payments over the life of the bonds by $133,983 and to obtain an economic gain (difference between the present values of the old and new debt service payments) of approximately $139,650. A schedule of the amount due for this issue follows:
Governmental Activities
For the Year Ended June 30 Interest Rate
by Year (%) Interest Principal Total 2012 3.100 14,337 925,000 939,337
$ 14,337 $ 925,000 $ 939,337
Ad Valorem tax revenues of the Debt Service Fund are used to repay these bonds.
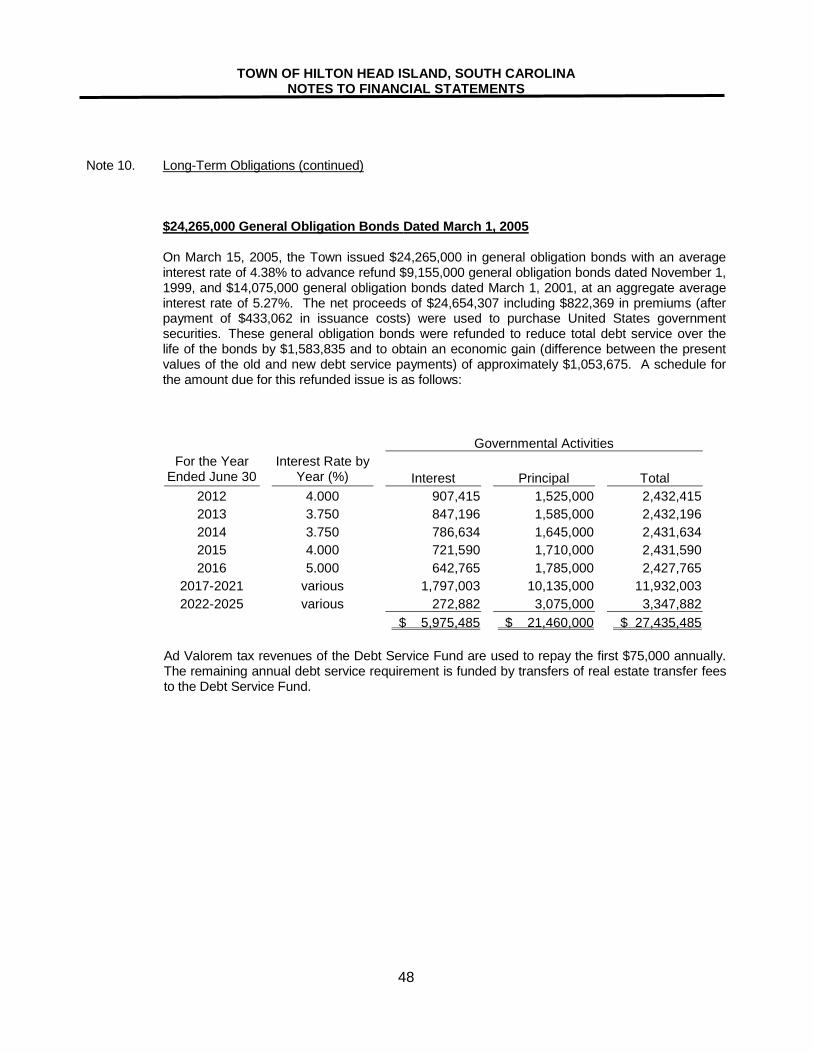
TOWN OF HILTON HEAD ISLAND, SOUTH CAROLINA NOTES TO FINANCIAL STATEMENTS
48
Note 10. Long-Term Obligations (continued) $24,265,000 General Obligation Bonds Dated March 1, 2005 On March 15, 2005, the Town issued $24,265,000 in general obligation bonds with an average
interest rate of 4.38% to advance refund $9,155,000 general obligation bonds dated November 1, 1999, and $14,075,000 general obligation bonds dated March 1, 2001, at an aggregate average interest rate of 5.27%. The net proceeds of $24,654,307 including $822,369 in premiums (after payment of $433,062 in issuance costs) were used to purchase United States government securities. These general obligation bonds were refunded to reduce total debt service over the life of the bonds by $1,583,835 and to obtain an economic gain (difference between the present values of the old and new debt service payments) of approximately $1,053,675. A schedule for the amount due for this refunded issue is as follows:
Governmental Activities For the Year
Ended June 30 Interest Rate by Year (%) Interest Principal Total
2012 4.000 907,415 1,525,000 2,432,415 2013 3.750 847,196 1,585,000 2,432,196 2014 3.750 786,634 1,645,000 2,431,634 2015 4.000 721,590 1,710,000 2,431,590 2016 5.000 642,765 1,785,000 2,427,765
2017-2021 various 1,797,003 10,135,000 11,932,003 2022-2025 various 272,882 3,075,000 3,347,882
$ 5,975,485 $ 21,460,000 $ 27,435,485 Ad Valorem tax revenues of the Debt Service Fund are used to repay the first $75,000 annually. The remaining annual debt service requirement is funded by transfers of real estate transfer fees to the Debt Service Fund.
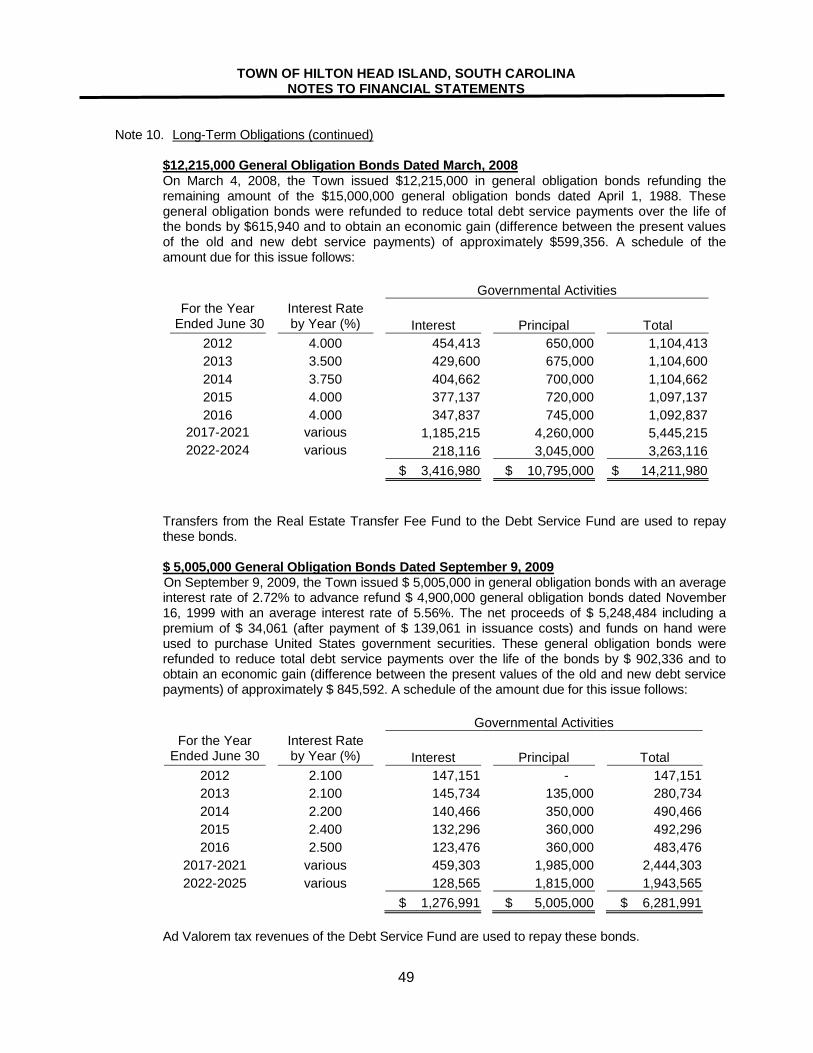
TOWN OF HILTON HEAD ISLAND, SOUTH CAROLINA NOTES TO FINANCIAL STATEMENTS
49
Note 10. Long-Term Obligations (continued) $12,215,000 General Obligation Bonds Dated March, 2008 On March 4, 2008, the Town issued $12,215,000 in general obligation bonds refunding the
remaining amount of the $15,000,000 general obligation bonds dated April 1, 1988. These general obligation bonds were refunded to reduce total debt service payments over the life of the bonds by $615,940 and to obtain an economic gain (difference between the present values of the old and new debt service payments) of approximately $599,356. A schedule of the amount due for this issue follows:
Governmental Activities
For the Year Ended June 30 Interest Rate
by Year (%) Interest Principal Total 2012 4.000 454,413 650,000 1,104,413 2013 3.500 429,600 675,000 1,104,600 2014 3.750 404,662 700,000 1,104,662 2015 4.000 377,137 720,000 1,097,137 2016 4.000 347,837 745,000 1,092,837
2017-2021 various 1,185,215 4,260,000 5,445,215 2022-2024 various 218,116 3,045,000 3,263,116
$ 3,416,980 $ 10,795,000 $ 14,211,980
Transfers from the Real Estate Transfer Fee Fund to the Debt Service Fund are used to repay
these bonds. $ 5,005,000 General Obligation Bonds Dated September 9, 2009
On September 9, 2009, the Town issued $ 5,005,000 in general obligation bonds with an average interest rate of 2.72% to advance refund $ 4,900,000 general obligation bonds dated November 16, 1999 with an average interest rate of 5.56%. The net proceeds of $ 5,248,484 including a premium of $ 34,061 (after payment of $ 139,061 in issuance costs) and funds on hand were used to purchase United States government securities. These general obligation bonds were refunded to reduce total debt service payments over the life of the bonds by $ 902,336 and to obtain an economic gain (difference between the present values of the old and new debt service payments) of approximately $ 845,592. A schedule of the amount due for this issue follows: Governmental Activities
For the Year Ended June 30 Interest Rate
by Year (%) Interest Principal Total 2012 2.100 147,151 - 147,151 2013 2.100 145,734 135,000 280,734 2014 2.200 140,466 350,000 490,466 2015 2.400 132,296 360,000 492,296 2016 2.500 123,476 360,000 483,476
2017-2021 various 459,303 1,985,000 2,444,303 2022-2025 various 128,565 1,815,000 1,943,565
$ 1,276,991 $ 5,005,000 $ 6,281,991 Ad Valorem tax revenues of the Debt Service Fund are used to repay these bonds.
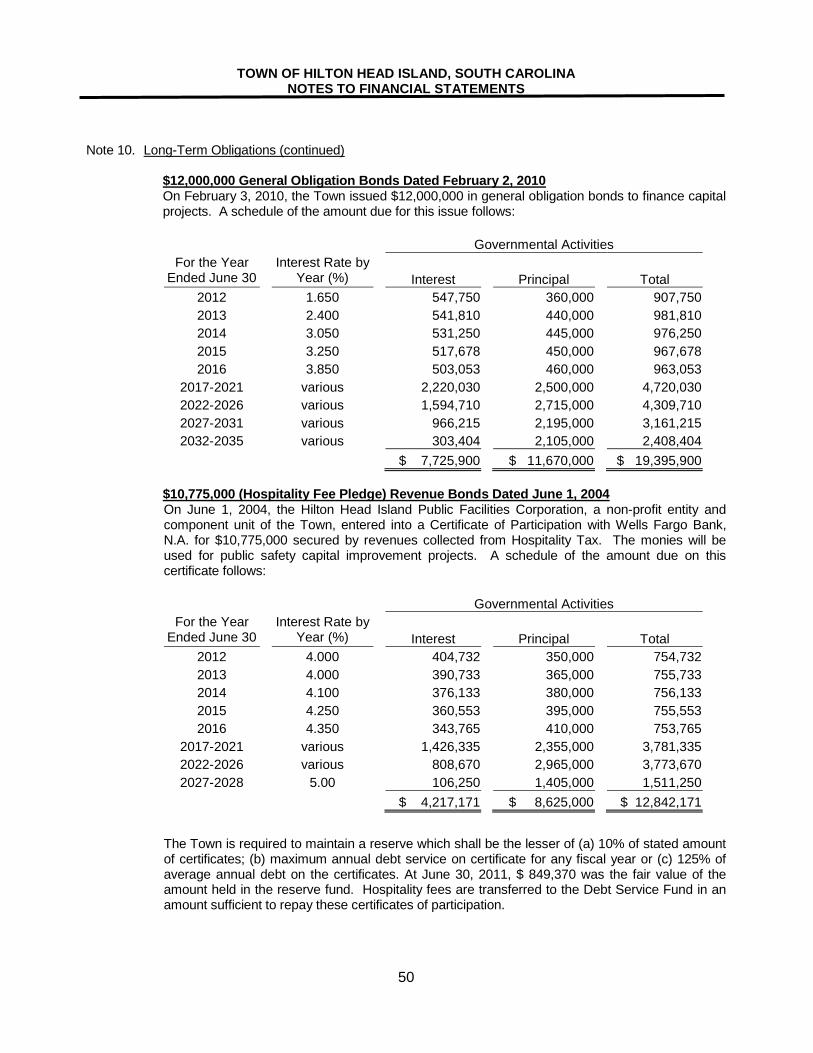
TOWN OF HILTON HEAD ISLAND, SOUTH CAROLINA NOTES TO FINANCIAL STATEMENTS
50
Note 10. Long-Term Obligations (continued) $12,000,000 General Obligation Bonds Dated February 2, 2010 On February 3, 2010, the Town issued $12,000,000 in general obligation bonds to finance capital
projects. A schedule of the amount due for this issue follows:
Governmental Activities For the Year
Ended June 30 Interest Rate by Year (%) Interest Principal Total
2012 1.650 547,750 360,000 907,750 2013 2.400 541,810 440,000 981,810 2014 3.050 531,250 445,000 976,250 2015 3.250 517,678 450,000 967,678 2016 3.850 503,053 460,000 963,053
2017-2021 various 2,220,030 2,500,000 4,720,030 2022-2026 various 1,594,710 2,715,000 4,309,710 2027-2031 various 966,215 2,195,000 3,161,215 2032-2035 various 303,404 2,105,000 2,408,404
$ 7,725,900 $ 11,670,000 $ 19,395,900 $10,775,000 (Hospitality Fee Pledge) Revenue Bonds Dated June 1, 2004
On June 1, 2004, the Hilton Head Island Public Facilities Corporation, a non-profit entity and component unit of the Town, entered into a Certificate of Participation with Wells Fargo Bank, N.A. for $10,775,000 secured by revenues collected from Hospitality Tax. The monies will be used for public safety capital improvement projects. A schedule of the amount due on this certificate follows:
Governmental Activities
For the Year Ended June 30 Interest Rate by
Year (%) Interest Principal Total 2012 4.000 404,732 350,000 754,732 2013 4.000 390,733 365,000 755,733 2014 4.100 376,133 380,000 756,133 2015 4.250 360,553 395,000 755,553 2016 4.350 343,765 410,000 753,765
2017-2021 various 1,426,335 2,355,000 3,781,335 2022-2026 various 808,670 2,965,000 3,773,670 2027-2028 5.00 106,250 1,405,000 1,511,250
$ 4,217,171 $ 8,625,000 $ 12,842,171
The Town is required to maintain a reserve which shall be the lesser of (a) 10% of stated amount of certificates; (b) maximum annual debt service on certificate for any fiscal year or (c) 125% of average annual debt on the certificates. At June 30, 2011, $ 849,370 was the fair value of the amount held in the reserve fund. Hospitality fees are transferred to the Debt Service Fund in an amount sufficient to repay these certificates of participation.
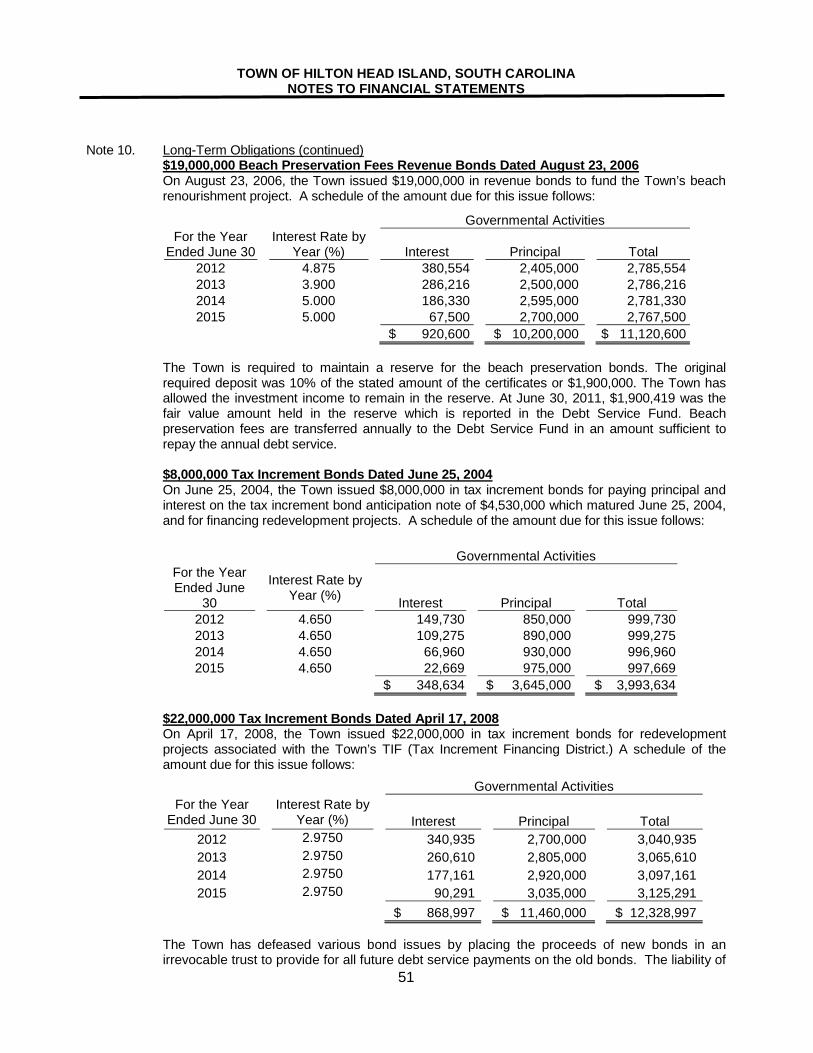
TOWN OF HILTON HEAD ISLAND, SOUTH CAROLINA NOTES TO FINANCIAL STATEMENTS
51
Note 10. Long-Term Obligations (continued) $19,000,000 Beach Preservation Fees Revenue Bonds Dated August 23, 2006 On August 23, 2006, the Town issued $19,000,000 in revenue bonds to fund the Town’s beach
renourishment project. A schedule of the amount due for this issue follows:
Governmental Activities For the Year
Ended June 30 Interest Rate by Year (%) Interest Principal Total
2012 4.875 380,554 2,405,000 2,785,554 2013 3.900 286,216 2,500,000 2,786,216 2014 5.000 186,330 2,595,000 2,781,330 2015 5.000 67,500 2,700,000 2,767,500
$ 920,600 $ 10,200,000 $ 11,120,600 The Town is required to maintain a reserve for the beach preservation bonds. The original
required deposit was 10% of the stated amount of the certificates or $1,900,000. The Town has allowed the investment income to remain in the reserve. At June 30, 2011, $1,900,419 was the fair value amount held in the reserve which is reported in the Debt Service Fund. Beach preservation fees are transferred annually to the Debt Service Fund in an amount sufficient to repay the annual debt service.
$8,000,000 Tax Increment Bonds Dated June 25, 2004 On June 25, 2004, the Town issued $8,000,000 in tax increment bonds for paying principal and
interest on the tax increment bond anticipation note of $4,530,000 which matured June 25, 2004, and for financing redevelopment projects. A schedule of the amount due for this issue follows:
Governmental Activities
For the Year Ended June
30 Interest Rate by
Year (%) Interest Principal Total 2012 4.650 149,730 850,000 999,730 2013 4.650 109,275 890,000 999,275 2014 4.650 66,960 930,000 996,960 2015 4.650 22,669 975,000 997,669
$ 348,634 $ 3,645,000 $ 3,993,634 $22,000,000 Tax Increment Bonds Dated April 17, 2008 On April 17, 2008, the Town issued $22,000,000 in tax increment bonds for redevelopment
projects associated with the Town’s TIF (Tax Increment Financing District.) A schedule of the amount due for this issue follows: Governmental Activities
For the Year Ended June 30 Interest Rate by
Year (%) Interest Principal Total 2012 2.9750 340,935 2,700,000 3,040,935 2013 2.9750 260,610 2,805,000 3,065,610 2014 2.9750 177,161 2,920,000 3,097,161 2015 2.9750 90,291 3,035,000 3,125,291
$ 868,997 $ 11,460,000 $ 12,328,997
The Town has defeased various bond issues by placing the proceeds of new bonds in an irrevocable trust to provide for all future debt service payments on the old bonds. The liability of
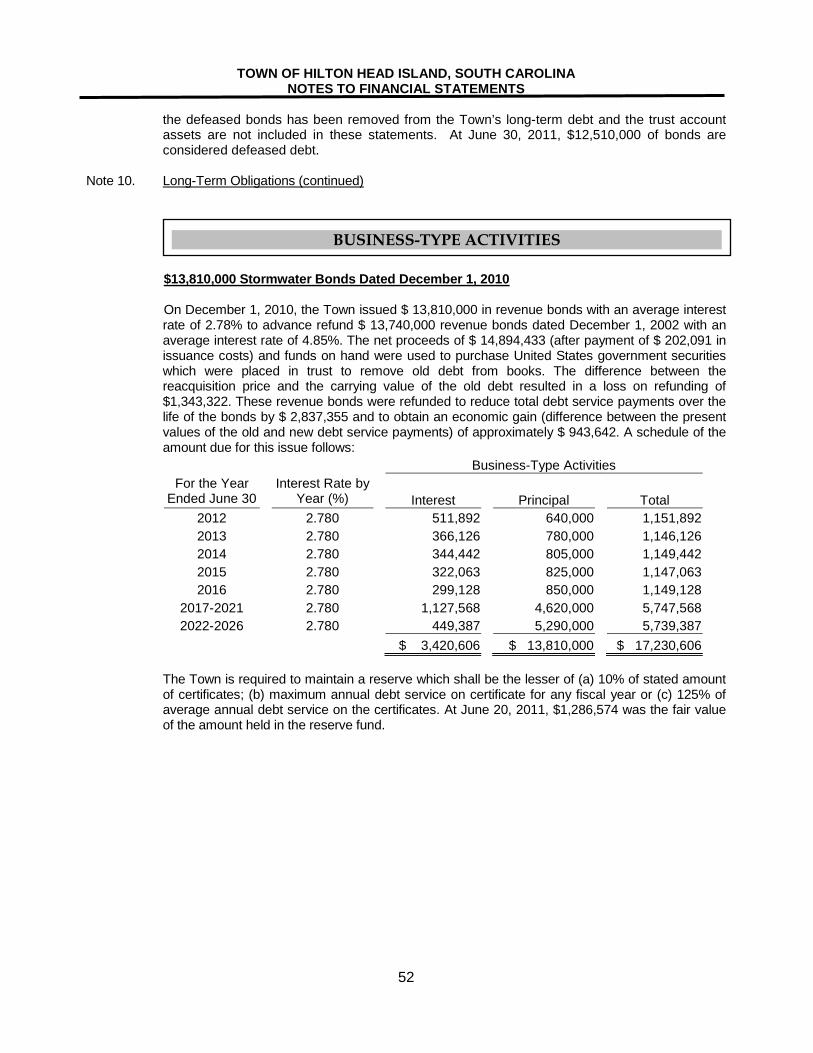
TOWN OF HILTON HEAD ISLAND, SOUTH CAROLINA NOTES TO FINANCIAL STATEMENTS
52
the defeased bonds has been removed from the Town’s long-term debt and the trust account assets are not included in these statements. At June 30, 2011, $12,510,000 of bonds are considered defeased debt.
Note 10. Long-Term Obligations (continued)
$13,810,000 Stormwater Bonds Dated December 1, 2010 On December 1, 2010, the Town issued $ 13,810,000 in revenue bonds with an average interest rate of 2.78% to advance refund $ 13,740,000 revenue bonds dated December 1, 2002 with an average interest rate of 4.85%. The net proceeds of $ 14,894,433 (after payment of $ 202,091 in issuance costs) and funds on hand were used to purchase United States government securities which were placed in trust to remove old debt from books. The difference between the reacquisition price and the carrying value of the old debt resulted in a loss on refunding of $1,343,322. These revenue bonds were refunded to reduce total debt service payments over the life of the bonds by $ 2,837,355 and to obtain an economic gain (difference between the present values of the old and new debt service payments) of approximately $ 943,642. A schedule of the amount due for this issue follows: Business-Type Activities
For the Year Ended June 30 Interest Rate by
Year (%) Interest Principal Total 2012 2.780 511,892 640,000 1,151,892 2013 2.780 366,126 780,000 1,146,126 2014 2.780 344,442 805,000 1,149,442 2015 2.780 322,063 825,000 1,147,063 2016 2.780 299,128 850,000 1,149,128
2017-2021 2.780 1,127,568 4,620,000 5,747,568 2022-2026 2.780 449,387 5,290,000 5,739,387
$ 3,420,606 $ 13,810,000 $ 17,230,606
The Town is required to maintain a reserve which shall be the lesser of (a) 10% of stated amount of certificates; (b) maximum annual debt service on certificate for any fiscal year or (c) 125% of average annual debt service on the certificates. At June 20, 2011, $1,286,574 was the fair value of the amount held in the reserve fund.
BUSINESS-TYPE ACTIVITIES
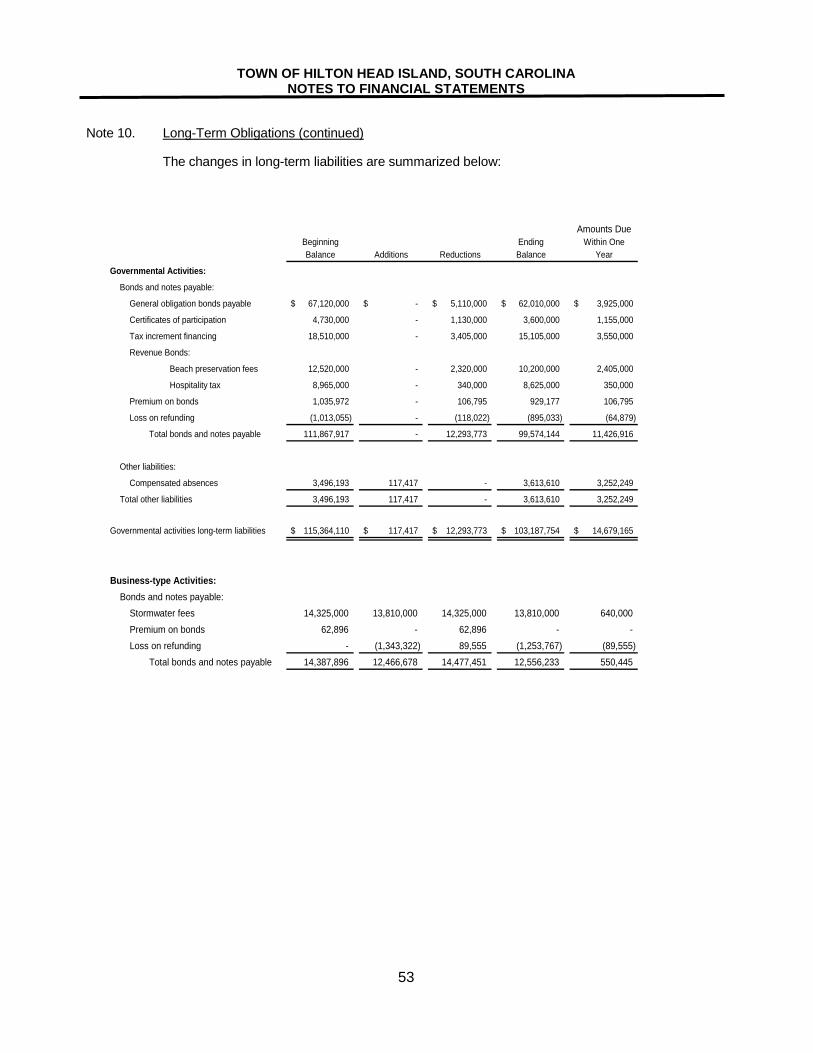
TOWN OF HILTON HEAD ISLAND, SOUTH CAROLINA NOTES TO FINANCIAL STATEMENTS
53
Note 10. Long-Term Obligations (continued)
The changes in long-term liabilities are summarized below:
Amounts DueBeginning Ending Within OneBalance Additions Reductions Balance Year
Governmental Activities:
Bonds and notes payable:
67,120,000$ -$ 5,110,000$ 62,010,000$ 3,925,000$
Certificates of participation 4,730,000 - 1,130,000 3,600,000 1,155,000
Tax increment financing 18,510,000 - 3,405,000 15,105,000 3,550,000
Revenue Bonds:
Beach preservation fees 12,520,000 - 2,320,000 10,200,000 2,405,000
Hospitality tax 8,965,000 - 340,000 8,625,000 350,000
Premium on bonds 1,035,972 - 106,795 929,177 106,795
Loss on refunding (1,013,055) - (118,022) (895,033) (64,879)
Total bonds and notes payable 111,867,917 - 12,293,773 99,574,144 11,426,916
Other liabilities:
Compensated absences 3,496,193 117,417 - 3,613,610 3,252,249
Total other liabilities 3,496,193 117,417 - 3,613,610 3,252,249
Governmental activities long-term liabilities 115,364,110$ 117,417$ 12,293,773$ 103,187,754$ 14,679,165$
Business-type Activities:Bonds and notes payable:
Stormwater fees 14,325,000 13,810,000 14,325,000 13,810,000 640,000 Premium on bonds 62,896 - 62,896 - - Loss on refunding - (1,343,322) 89,555 (1,253,767) (89,555)
Total bonds and notes payable 14,387,896 12,466,678 14,477,451 12,556,233 550,445
General obligation bonds payable
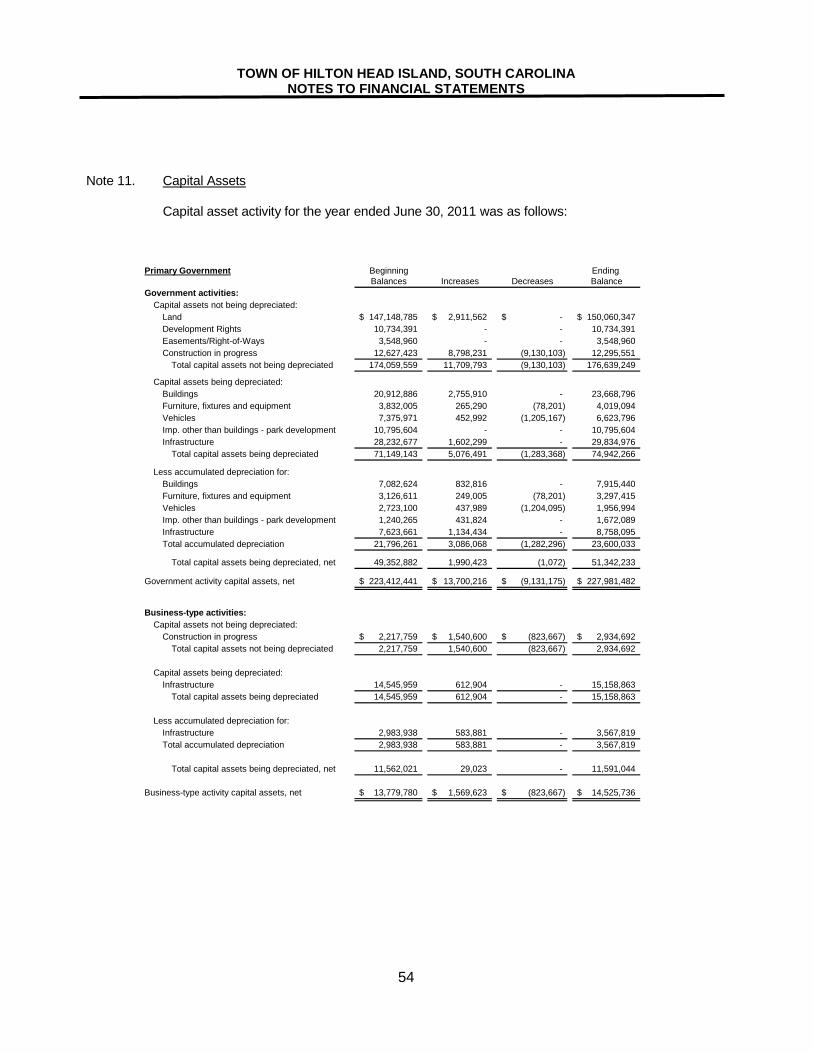
TOWN OF HILTON HEAD ISLAND, SOUTH CAROLINA NOTES TO FINANCIAL STATEMENTS
54
Note 11. Capital Assets Capital asset activity for the year ended June 30, 2011 was as follows:
Primary Government Beginning Ending Balances Increases Decreases Balance
Government activities:Capital assets not being depreciated:
Land 147,148,785$ 2,911,562$ -$ 150,060,347$ Development Rights 10,734,391 - - 10,734,391 Easements/Right-of-Ways 3,548,960 - - 3,548,960 Construction in progress 12,627,423 8,798,231 (9,130,103) 12,295,551
Total capital assets not being depreciated 174,059,559 11,709,793 (9,130,103) 176,639,249
Capital assets being depreciated:Buildings 20,912,886 2,755,910 - 23,668,796 Furniture, fixtures and equipment 3,832,005 265,290 (78,201) 4,019,094 Vehicles 7,375,971 452,992 (1,205,167) 6,623,796 Imp. other than buildings - park development 10,795,604 - - 10,795,604 Infrastructure 28,232,677 1,602,299 - 29,834,976
Total capital assets being depreciated 71,149,143 5,076,491 (1,283,368) 74,942,266
Less accumulated depreciation for:Buildings 7,082,624 832,816 - 7,915,440 Furniture, fixtures and equipment 3,126,611 249,005 (78,201) 3,297,415 Vehicles 2,723,100 437,989 (1,204,095) 1,956,994 Imp. other than buildings - park development 1,240,265 431,824 - 1,672,089 Infrastructure 7,623,661 1,134,434 - 8,758,095 Total accumulated depreciation 21,796,261 3,086,068 (1,282,296) 23,600,033
Total capital assets being depreciated, net 49,352,882 1,990,423 (1,072) 51,342,233
Government activity capital assets, net 223,412,441$ 13,700,216$ (9,131,175)$ 227,981,482$
Business-type activities:Capital assets not being depreciated:
Construction in progress 2,217,759$ 1,540,600$ (823,667)$ 2,934,692$ Total capital assets not being depreciated 2,217,759 1,540,600 (823,667) 2,934,692
Capital assets being depreciated:Infrastructure 14,545,959 612,904 - 15,158,863
Total capital assets being depreciated 14,545,959 612,904 - 15,158,863
Less accumulated depreciation for:Infrastructure 2,983,938 583,881 - 3,567,819 Total accumulated depreciation 2,983,938 583,881 - 3,567,819
Total capital assets being depreciated, net 11,562,021 29,023 - 11,591,044
Business-type activity capital assets, net 13,779,780$ 1,569,623$ (823,667)$ 14,525,736$
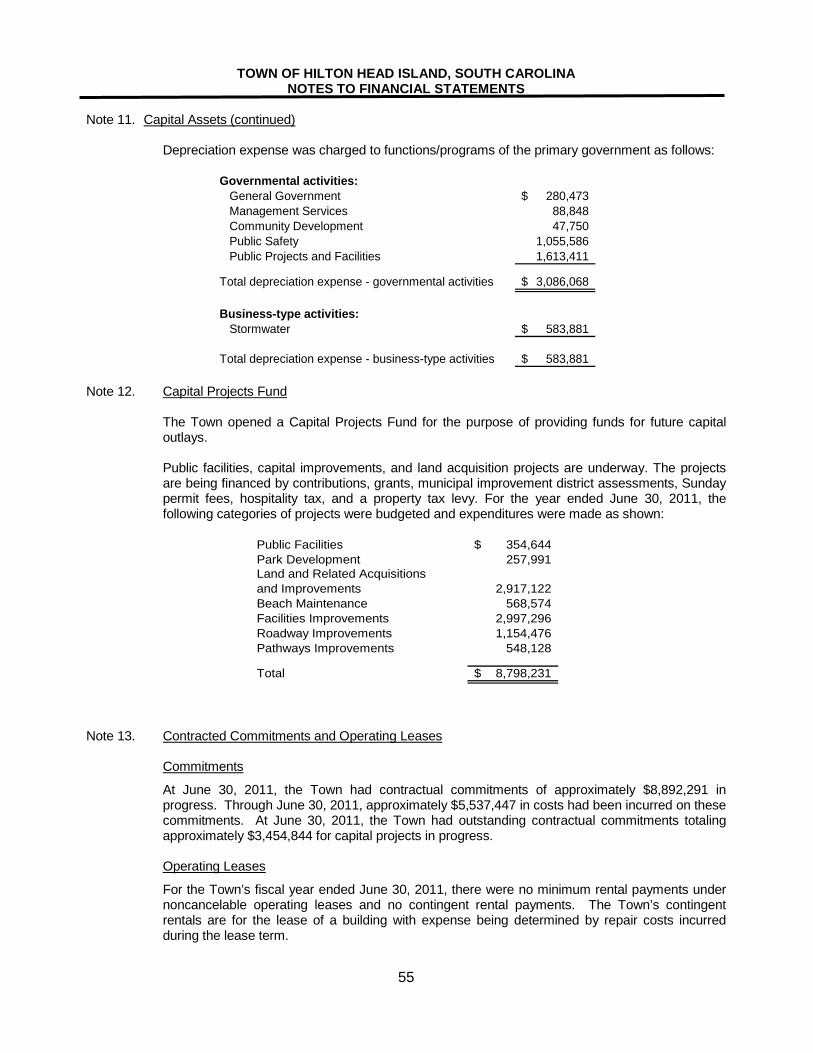
TOWN OF HILTON HEAD ISLAND, SOUTH CAROLINA NOTES TO FINANCIAL STATEMENTS
55
Note 11. Capital Assets (continued) Depreciation expense was charged to functions/programs of the primary government as follows:
Governmental activities:General Government 280,473$ Management Services 88,848 Community Development 47,750 Public Safety 1,055,586 Public Projects and Facilities 1,613,411
Total depreciation expense - governmental activities 3,086,068$
Business-type activities:Stormwater 583,881$
Total depreciation expense - business-type activities 583,881$
Note 12. Capital Projects Fund The Town opened a Capital Projects Fund for the purpose of providing funds for future capital
outlays. Public facilities, capital improvements, and land acquisition projects are underway. The projects
are being financed by contributions, grants, municipal improvement district assessments, Sunday permit fees, hospitality tax, and a property tax levy. For the year ended June 30, 2011, the following categories of projects were budgeted and expenditures were made as shown:
Public Facilities 354,644$ Park Development 257,991
2,917,122 Beach Maintenance 568,574 Facilities Improvements 2,997,296 Roadway Improvements 1,154,476 Pathways Improvements 548,128
Total 8,798,231$
Land and Related Acquisitions and Improvements
Note 13. Contracted Commitments and Operating Leases Commitments
At June 30, 2011, the Town had contractual commitments of approximately $8,892,291 in progress. Through June 30, 2011, approximately $5,537,447 in costs had been incurred on these commitments. At June 30, 2011, the Town had outstanding contractual commitments totaling approximately $3,454,844 for capital projects in progress.
Operating Leases
For the Town’s fiscal year ended June 30, 2011, there were no minimum rental payments under noncancelable operating leases and no contingent rental payments. The Town’s contingent rentals are for the lease of a building with expense being determined by repair costs incurred during the lease term.
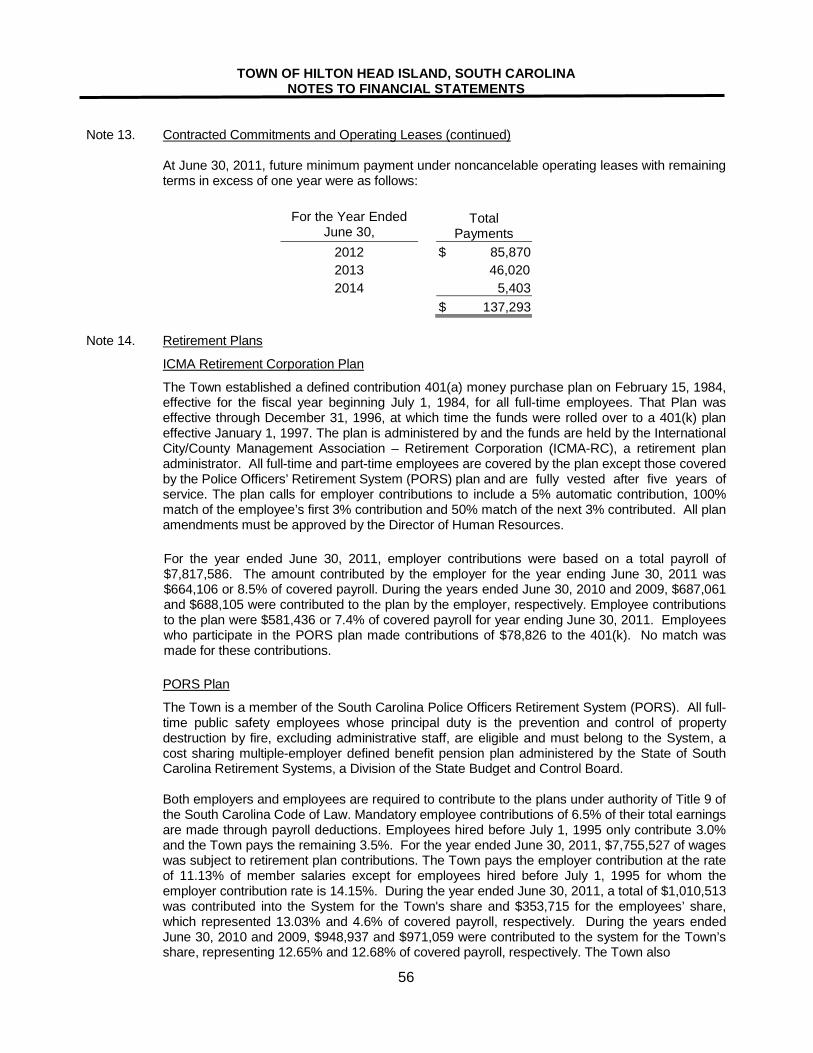
TOWN OF HILTON HEAD ISLAND, SOUTH CAROLINA NOTES TO FINANCIAL STATEMENTS
56
Note 13. Contracted Commitments and Operating Leases (continued) At June 30, 2011, future minimum payment under noncancelable operating leases with remaining
terms in excess of one year were as follows:
For the Year Ended June 30,
Total Payments
2012 $ 85,870 2013 46,020 2014 5,403
$ 137,293 Note 14. Retirement Plans
ICMA Retirement Corporation Plan
The Town established a defined contribution 401(a) money purchase plan on February 15, 1984, effective for the fiscal year beginning July 1, 1984, for all full-time employees. That Plan was effective through December 31, 1996, at which time the funds were rolled over to a 401(k) plan effective January 1, 1997. The plan is administered by and the funds are held by the International City/County Management Association – Retirement Corporation (ICMA-RC), a retirement plan administrator. All full-time and part-time employees are covered by the plan except those covered by the Police Officers’ Retirement System (PORS) plan and are fully vested after five years of service. The plan calls for employer contributions to include a 5% automatic contribution, 100% match of the employee’s first 3% contribution and 50% match of the next 3% contributed. All plan amendments must be approved by the Director of Human Resources. For the year ended June 30, 2011, employer contributions were based on a total payroll of $7,817,586. The amount contributed by the employer for the year ending June 30, 2011 was $664,106 or 8.5% of covered payroll. During the years ended June 30, 2010 and 2009, $687,061 and $688,105 were contributed to the plan by the employer, respectively. Employee contributions to the plan were $581,436 or 7.4% of covered payroll for year ending June 30, 2011. Employees who participate in the PORS plan made contributions of $78,826 to the 401(k). No match was made for these contributions.
PORS Plan
The Town is a member of the South Carolina Police Officers Retirement System (PORS). All full-time public safety employees whose principal duty is the prevention and control of property destruction by fire, excluding administrative staff, are eligible and must belong to the System, a cost sharing multiple-employer defined benefit pension plan administered by the State of South Carolina Retirement Systems, a Division of the State Budget and Control Board. Both employers and employees are required to contribute to the plans under authority of Title 9 of the South Carolina Code of Law. Mandatory employee contributions of 6.5% of their total earnings are made through payroll deductions. Employees hired before July 1, 1995 only contribute 3.0% and the Town pays the remaining 3.5%. For the year ended June 30, 2011, $7,755,527 of wages was subject to retirement plan contributions. The Town pays the employer contribution at the rate of 11.13% of member salaries except for employees hired before July 1, 1995 for whom the employer contribution rate is 14.15%. During the year ended June 30, 2011, a total of $1,010,513 was contributed into the System for the Town's share and $353,715 for the employees’ share, which represented 13.03% and 4.6% of covered payroll, respectively. During the years ended June 30, 2010 and 2009, $948,937 and $971,059 were contributed to the system for the Town’s share, representing 12.65% and 12.68% of covered payroll, respectively. The Town also
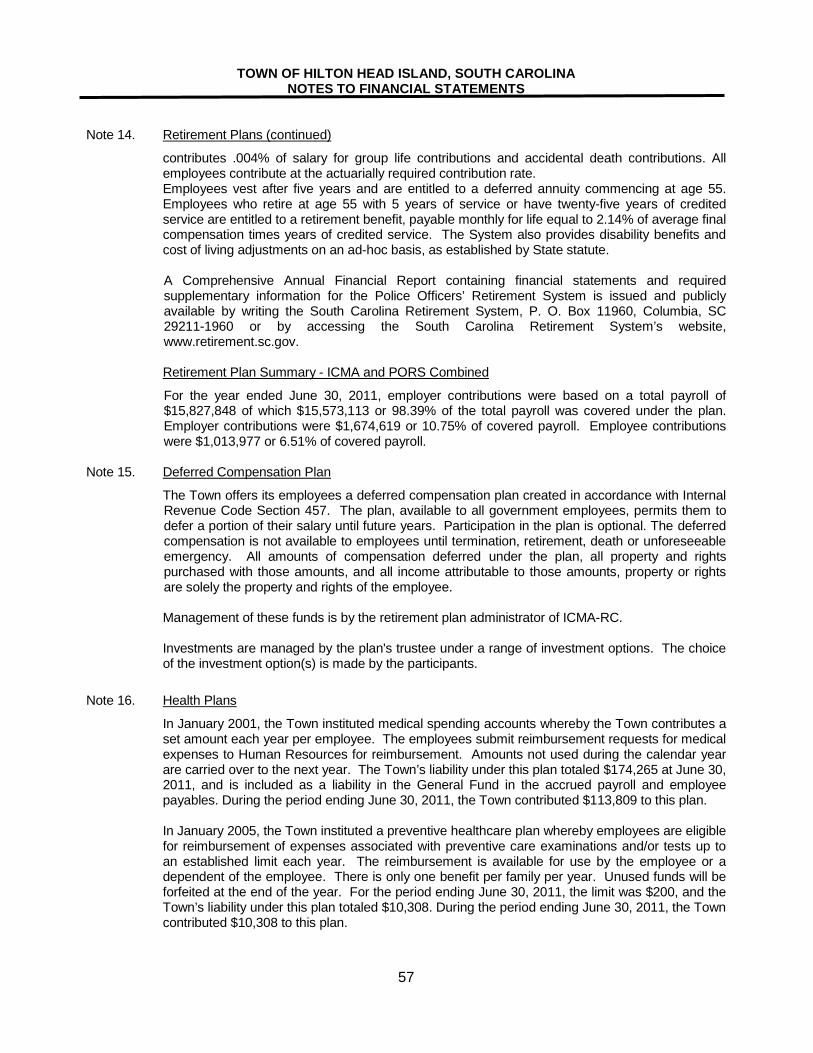
TOWN OF HILTON HEAD ISLAND, SOUTH CAROLINA NOTES TO FINANCIAL STATEMENTS
57
Note 14. Retirement Plans (continued)
contributes .004% of salary for group life contributions and accidental death contributions. All employees contribute at the actuarially required contribution rate. Employees vest after five years and are entitled to a deferred annuity commencing at age 55. Employees who retire at age 55 with 5 years of service or have twenty-five years of credited service are entitled to a retirement benefit, payable monthly for life equal to 2.14% of average final compensation times years of credited service. The System also provides disability benefits and cost of living adjustments on an ad-hoc basis, as established by State statute. A Comprehensive Annual Financial Report containing financial statements and required supplementary information for the Police Officers’ Retirement System is issued and publicly available by writing the South Carolina Retirement System, P. O. Box 11960, Columbia, SC 29211-1960 or by accessing the South Carolina Retirement System’s website, www.retirement.sc.gov.
Retirement Plan Summary - ICMA and PORS Combined
For the year ended June 30, 2011, employer contributions were based on a total payroll of $15,827,848 of which $15,573,113 or 98.39% of the total payroll was covered under the plan. Employer contributions were $1,674,619 or 10.75% of covered payroll. Employee contributions were $1,013,977 or 6.51% of covered payroll.
Note 15. Deferred Compensation Plan
The Town offers its employees a deferred compensation plan created in accordance with Internal Revenue Code Section 457. The plan, available to all government employees, permits them to defer a portion of their salary until future years. Participation in the plan is optional. The deferred compensation is not available to employees until termination, retirement, death or unforeseeable emergency. All amounts of compensation deferred under the plan, all property and rights purchased with those amounts, and all income attributable to those amounts, property or rights are solely the property and rights of the employee.
Management of these funds is by the retirement plan administrator of ICMA-RC. Investments are managed by the plan's trustee under a range of investment options. The choice
of the investment option(s) is made by the participants. Note 16. Health Plans
In January 2001, the Town instituted medical spending accounts whereby the Town contributes a set amount each year per employee. The employees submit reimbursement requests for medical expenses to Human Resources for reimbursement. Amounts not used during the calendar year are carried over to the next year. The Town’s liability under this plan totaled $174,265 at June 30, 2011, and is included as a liability in the General Fund in the accrued payroll and employee payables. During the period ending June 30, 2011, the Town contributed $113,809 to this plan.
In January 2005, the Town instituted a preventive healthcare plan whereby employees are eligible
for reimbursement of expenses associated with preventive care examinations and/or tests up to an established limit each year. The reimbursement is available for use by the employee or a dependent of the employee. There is only one benefit per family per year. Unused funds will be forfeited at the end of the year. For the period ending June 30, 2011, the limit was $200, and the Town’s liability under this plan totaled $10,308. During the period ending June 30, 2011, the Town contributed $10,308 to this plan.
TOWN OF HILTON HEAD ISLAND, SOUTH CAROLINA NOTES TO FINANCIAL STATEMENTS
58
Note 16. Health Plans (continued) In January 2005, the Town also instituted a preventive dental care plan whereby employees
covered by the State Dental Plan are eligible for reimbursement of out-of-pocket expenses associated with preventive dental care up to an established limit each year. The reimbursement is available to the employee and their dependents provided they are covered under the State Dental Plan. Unused funds will be forfeited at the end of the year. For the period ending June 30, 2011 the limit was $150 per covered individual, and the Town’s liability under this plan totaled $20,933. During the period ending June 30, 2011, the Town contributed $20,933 to this plan.
Note 17. Other Post-Employment Benefits
In January 2002, the Town instituted a plan for retiree medical expenses. Annually, the Town contributes one hundred percent of the value of the forfeited sick leave into individual ICMA investment accounts to pay retiree medical expenses. Employees who retire meeting 25 years for Police Office Retirement System or 5 years of service and age 55 are eligible for the benefit. The plan carries to survivor or dependent at death, but is used for future contributions credit if an employee leaves for a reason other than retirement. Seven (7) employees were eligible for the benefits for the period ending June 30, 2011.
The Town contributed $81,593 during the year ended June 30, 2011.
In June of 2004, the Government Accounting Standards Board issued GASB 45 “Accounting and Financial Reporting by Employers for Post-Employment Benefits Other Than Pensions.” Under this pronouncement, starting in fiscal year 2009, the Town may be required to disclose the cost of this benefit for all its employees.
The Town has determined that the Town only has an implicit subsidy which is immaterial at fiscal
year-end. It will take several years before the liability becomes material. The Town will continue to study its options and will wait for further guidance as health reform takes shape at the federal level.
Note 18. Contingencies
Arbitrage - State and local bonds issued after 1984 are subject to arbitrage restrictions as enacted by the Federal government. To retain the Bonds tax exempt status, local governments must meet the regulations as adopted by the U.S. Treasury Department. The proceeds from the bond issue must not be invested, for more than a temporary period, in obligations producing a materially higher yield than the bond issue. To maintain tax exempt status, the yield earned at the materially higher rate over the bond cost must be remitted to the U.S. Treasury every five years. Exceptions to the regulations include the requirement that the local government expend all the Bond proceeds within designated periods which could be up to three years.
Based on preliminary calculations by the Town's Management, the Town is not earning materially
higher yields and it expects to expend all funds within the designated time.
Risk Management and Litigation - The Town is exposed to various risks of losses related to torts; theft of, damage to, and destruction of assets; errors and omissions; injuries to employees; and natural disasters. The Town participates in the State of South Carolina insurance fund and also purchases commercial insurance as its primary defense against losses arising from the above. The fund provides beneficial insurance rates with regular insurance coverage. The fund is not considered a risk pool. The amount of settlements has not exceeded insurance coverage over the past three fiscal years.
TOWN OF HILTON HEAD ISLAND, SOUTH CAROLINA NOTES TO FINANCIAL STATEMENTS
59
Note 18. Contingencies (continued)
The Town has also designated a portion of its fund balance to defray the extraordinary costs it anticipates it would incur during a natural disaster. These anticipated costs are for employee overtime, disaster aid and the like. All risk management activities are accounted for in the general fund. Expenditures and claims are recognized when it is probable that a loss has occurred and the amount of the loss can be reasonably estimated. In determining claims, events that might create claims, but for which none have been reported, are considered. No amount for claims has been accrued at June 30, 2011.
Lawsuits - The Town has been named in several lawsuits concerning zoning, enforcement of Town ordinances and for performance. None of these suits claim any damages.
The Town has been named in several lawsuits concerning other matters asserting monetary
damages. The cases are in preliminary stages and the possible outcome or damages are unknown at this time.
Note 19. Change in Accounting Principle and Prior Period Adjustment
During 2011, the Town began to account for the hospitality fees as a special revenue fund. In prior years, the hospitality fees have been accounted for as part of capital projects fund in the financial statements and a governmental activity in the government-wide statements. Because these funds are restricted to enhance the health, safety and general welfare of the Town, management believes these operations more accurately meet the criteria of a special revenue fund. The effect of this change in the governmental funds was to decrease the beginning fund balance in the capital projects fund by $ 2,147,562, while increasing beginning fund balance in the special revenue fund by the same amount. There was no effect on the government-wide statements.
A summary of the above is as follows:
Capital Projects Hospitality Fees
Fund financial statements
Fund balance, beginning, as originally reported $ 20,532,570 $ -
Change in accounting principle
Capital projects fund (2,147,562) 2,147,562
Fund balance, beginning, as restated $ 18,385,008 $ 2,147,562
TOWN OF HILTON HEAD ISLAND, SOUTH CAROLINA NOTES TO FINANCIAL STATEMENTS
60
Note 20. Subsequent Events
On August 3, 2011, the Town issued $12,385,000 in general obligation bonds with an average interest rate of 4.76% to advance refund $11,210,000 general obligation bonds dated May 12, 2004, with an average interest rate of 3.28%The net proceeds of $12,281,450 including a premium of $194,479 (after payment of $298,029 in issuance costs) and funds on hand were used to purchase United States government securities. These general obligation bonds were refunded to reduce total debt service payments over the life of the bonds by $740,894 and to obtain an economic gain (difference between the present values of the old and new debt service payments) of approximately $579,041. A schedule of the amount due for this issue follows:
For the Year Ended June 30
Interest Rate by Year (%) Interest Principal Total
2012 2.000 216,519$ 295,000$ 511,519$ 2013 2.000 368,844 145,000 513,844 2014 2.000 365,944 625,000 990,944 2015 2.000 353,444 630,000 983,444 2016 2.000 340,844 640,000 980,844
2017-2021 various 1,453,842 3,385,000 4,838,842 2022-2026 various 894,588 3,955,000 4,849,588 2027-2029 various 201,064 2,710,000 2,911,064
4,195,088$ 12,385,000$ 16,580,088$
Governmental Activities
On October 26, 2011, the Town issued $8,250,000 in special obligation bonds (hospitality fee) with an average interest rate of 3.32% to advance refund $8,625,000 in revenue bonds (hospitality fee) dated June 1, 2004 with an average interest rate of 4.86%. The net proceeds of $8,129,802 including a premium of $33,584 (after payment of $150,484 in issuance costs) and funds on hand were used to purchase United States government securities. These revenue bonds were refunded to reduce total debt service payments over the life of the bonds by $2,091,227 and to obtain an economic gain (difference between present values of old and new debt service payments) of approximately $291,878. A schedule of the amount due for this issue follows:
For the Year Ended June 30
Interest Rate by Year (%) Interest Principal Total
2012 2.000 146,375$ 535,000$ 681,375$ 2013 2.000 234,394 395,000 629,394 2014 2.000 226,494 405,000 631,494 2015 2.000 218,394 410,000 628,394 2016 - 210,194 420,000 630,194
2017-2021 various 893,270 2,260,000 3,153,270 2022-2026 various 503,908 2,635,000 3,138,908 2027-2028 various 67,918 1,190,000 1,257,918
2,500,947$ 8,250,000$ 10,750,947$
Governmental Activities
The Town is required to maintain a reserve which shall be the lesser of (a) 10% of stated amount of certificates; (b) maximum annual debt service on certificates for any fiscal year or; (c) 125% of the average annual debt on the certificates. Hospitality fees are transferred to the Debt Service Fund in amounts sufficient to repay these special obligation bonds.
TOWN OF HILTON HEAD ISLAND, SOUTH CAROLINA NOTES TO FINANCIAL STATEMENTS
61
Note 20. Subsequent Events (continued) On October 26, 2011, the Town issued $15,250,000 in special obligation bonds (hospitality fee) to finance capital projects. A schedule of the amount due for this issue follows:
For the Year Ended June 30
Interest Rate by Year (%) Interest Principal Total
2012 2.000 356,971$ 240,000$ 596,971$ 2013 2.000 592,919 410,000 1,002,919 2014 2.000 584,719 415,000 999,719 2015 2.000 576,419 425,000 1,001,419 2016 2.000 567,919 430,000 997,919
2017-2021 various 2,645,845 2,355,000 5,000,845 2022-2026 various 2,096,670 2,910,000 5,006,670 2027-2031 various 1,368,770 3,630,000 4,998,770 2032-2036 various 563,888 4,435,000 4,998,888
9,354,120$ 15,250,000$ 24,604,120$
Governmental Activities
On November 18, 2011, the Town issued $11,000,000 in special obligation bonds (beach preservation fee) to finance beach renourishment projects. A schedule of the amount due for this issue follows:
For the Year Ended June 30
Interest Rate by Year (%) Interest Principal Total
2012 - 65,424$ -$ 65,424$ 2013 - 322,638 - 322,638 2014 - 322,638 - 322,638 2015 4.000 296,338 1,315,000 1,611,338 2016 4.000 223,938 2,305,000 2,528,938
2017-2019 various 251,495 7,380,000 7,631,495 1,482,471$ 11,000,000$ 12,482,471$
Governmental Activities
The Town is required to maintain a reserve which shall be the lesser of (a) 10% of stated amount of certificates; (b) maximum annual debt service on certificates for any fiscal year or; (c) 125% of the average annual debt on the certificates. Hospitality fees are transferred to the Debt Service Fund in amounts sufficient to repay these special obligation bonds.
Other Supplementary Information General Fund The General Fund is used to account for resources traditionally associated with government which are not required legally or by sound financial management to be accounted for in another fund. Debt Service Fund The Debt Service Fund account is used for accumulating resources for the payment of interest and principal on general long-term obligation debt. Capital Projects Fund The Capital Projects Funds account for all resources used for the acquisition or construction of general fixed assets and major capital improvements other than those financed by proprietary funds and trust funds.
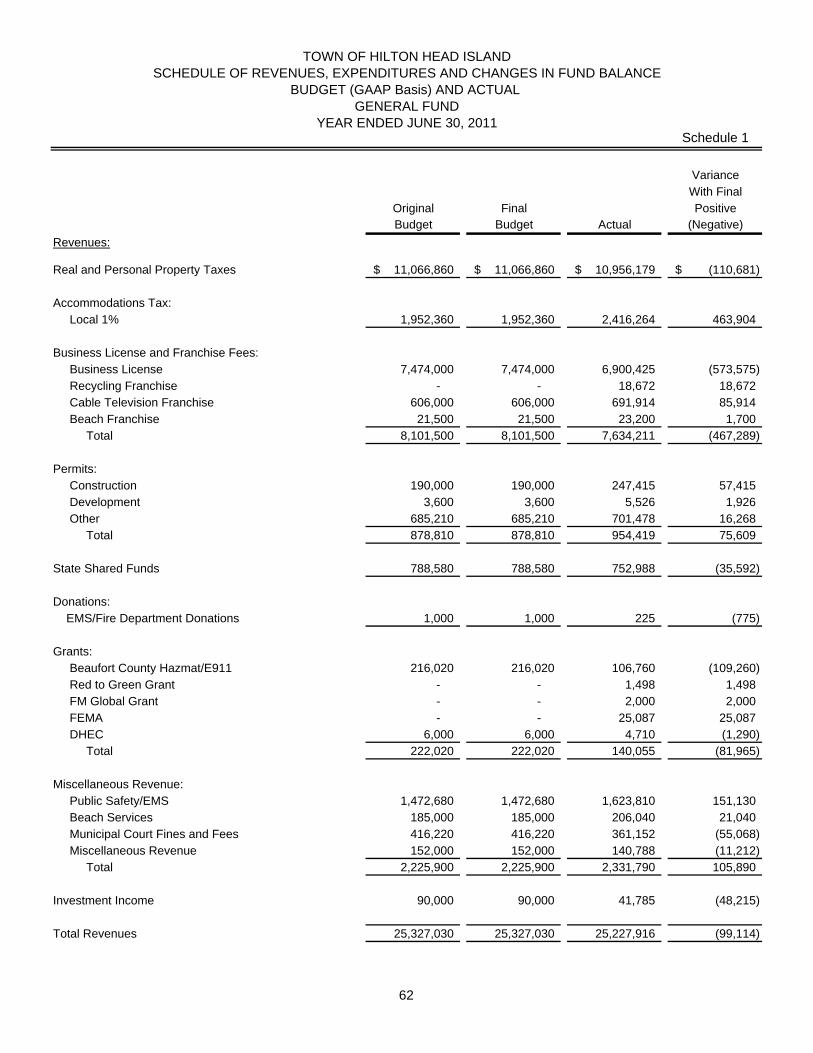
Schedule 1
VarianceWith Final
Original Final PositiveBudget Budget Actual (Negative)
Revenues:
Real and Personal Property Taxes 11,066,860$ 11,066,860$ 10,956,179$ (110,681)$
Accommodations Tax: Local 1% 1,952,360 1,952,360 2,416,264 463,904
Business License and Franchise Fees: Business License 7,474,000 7,474,000 6,900,425 (573,575) Recycling Franchise - - 18,672 18,672 Cable Television Franchise 606,000 606,000 691,914 85,914 Beach Franchise 21,500 21,500 23,200 1,700 Total 8,101,500 8,101,500 7,634,211 (467,289)
Permits: Construction 190,000 190,000 247,415 57,415 Development 3,600 3,600 5,526 1,926 Other 685,210 685,210 701,478 16,268 Total 878,810 878,810 954,419 75,609
State Shared Funds 788,580 788,580 752,988 (35,592)
Donations: EMS/Fire Department Donations 1,000 1,000 225 (775)
Grants: Beaufort County Hazmat/E911 216,020 216,020 106,760 (109,260) Red to Green Grant - - 1,498 1,498 FM Global Grant - - 2,000 2,000 FEMA - - 25,087 25,087 DHEC 6,000 6,000 4,710 (1,290) Total 222,020 222,020 140,055 (81,965)
Miscellaneous Revenue: Public Safety/EMS 1,472,680 1,472,680 1,623,810 151,130 Beach Services 185,000 185,000 206,040 21,040 Municipal Court Fines and Fees 416,220 416,220 361,152 (55,068) Miscellaneous Revenue 152,000 152,000 140,788 (11,212) Total 2,225,900 2,225,900 2,331,790 105,890
Investment Income 90,000 90,000 41,785 (48,215)
Total Revenues 25,327,030 25,327,030 25,227,916 (99,114)
YEAR ENDED JUNE 30, 2011
TOWN OF HILTON HEAD ISLAND
GENERAL FUND
SCHEDULE OF REVENUES, EXPENDITURES AND CHANGES IN FUND BALANCEBUDGET (GAAP Basis) AND ACTUAL
62
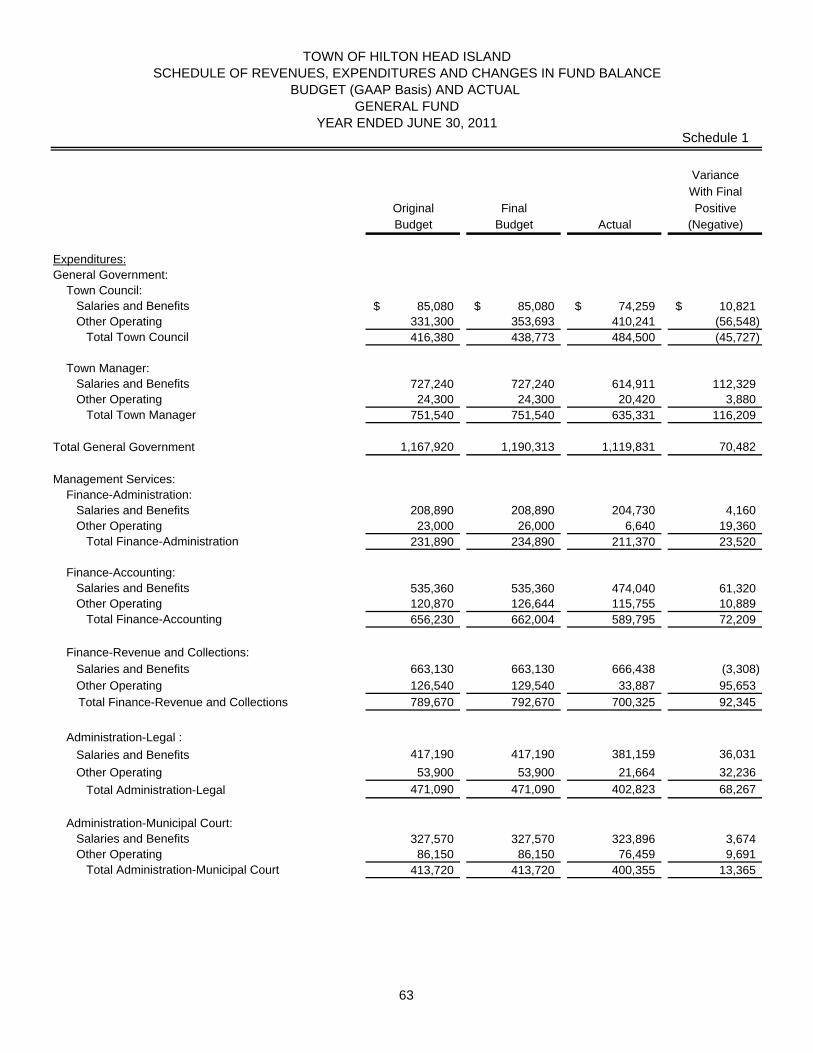
Schedule 1
VarianceWith Final
Original Final PositiveBudget Budget Actual (Negative)
YEAR ENDED JUNE 30, 2011
TOWN OF HILTON HEAD ISLAND
GENERAL FUND
SCHEDULE OF REVENUES, EXPENDITURES AND CHANGES IN FUND BALANCEBUDGET (GAAP Basis) AND ACTUAL
Expenditures:General Government: Town Council: Salaries and Benefits 85,080$ 85,080$ 74,259$ 10,821$ Other Operating 331,300 353,693 410,241 (56,548) Total Town Council 416,380 438,773 484,500 (45,727)
Town Manager: Salaries and Benefits 727,240 727,240 614,911 112,329 Other Operating 24,300 24,300 20,420 3,880 Total Town Manager 751,540 751,540 635,331 116,209
Total General Government 1,167,920 1,190,313 1,119,831 70,482
Management Services: Finance-Administration: Salaries and Benefits 208,890 208,890 204,730 4,160 Other Operating 23,000 26,000 6,640 19,360 Total Finance-Administration 231,890 234,890 211,370 23,520 Finance-Accounting: Salaries and Benefits 535,360 535,360 474,040 61,320 Other Operating 120,870 126,644 115,755 10,889 Total Finance-Accounting 656,230 662,004 589,795 72,209
Finance-Revenue and Collections: Salaries and Benefits 663,130 663,130 666,438 (3,308) Other Operating 126,540 129,540 33,887 95,653
Total Finance-Revenue and Collections 789,670 792,670 700,325 92,345
Administration-Legal : Salaries and Benefits 417,190 417,190 381,159 36,031 Other Operating 53,900 53,900 21,664 32,236 Total Administration-Legal 471,090 471,090 402,823 68,267
Administration-Municipal Court: Salaries and Benefits 327,570 327,570 323,896 3,674 Other Operating 86,150 86,150 76,459 9,691 Total Administration-Municipal Court 413,720 413,720 400,355 13,365
63
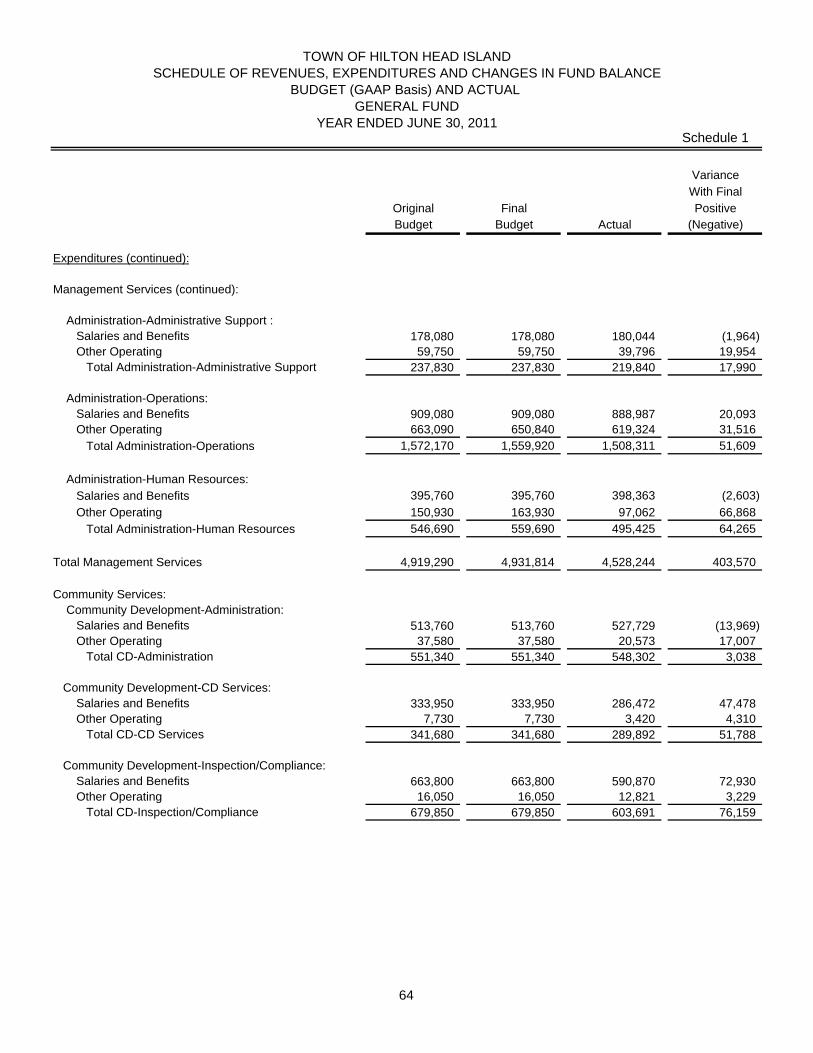
Schedule 1
VarianceWith Final
Original Final PositiveBudget Budget Actual (Negative)
YEAR ENDED JUNE 30, 2011
TOWN OF HILTON HEAD ISLAND
GENERAL FUND
SCHEDULE OF REVENUES, EXPENDITURES AND CHANGES IN FUND BALANCEBUDGET (GAAP Basis) AND ACTUAL
Expenditures (continued):
Management Services (continued):
Administration-Administrative Support : Salaries and Benefits 178,080 178,080 180,044 (1,964) Other Operating 59,750 59,750 39,796 19,954 Total Administration-Administrative Support 237,830 237,830 219,840 17,990
Administration-Operations: Salaries and Benefits 909,080 909,080 888,987 20,093 Other Operating 663,090 650,840 619,324 31,516 Total Administration-Operations 1,572,170 1,559,920 1,508,311 51,609
Administration-Human Resources: Salaries and Benefits 395,760 395,760 398,363 (2,603) Other Operating 150,930 163,930 97,062 66,868 Total Administration-Human Resources 546,690 559,690 495,425 64,265
Total Management Services 4,919,290 4,931,814 4,528,244 403,570
Community Services: Community Development-Administration: Salaries and Benefits 513,760 513,760 527,729 (13,969) Other Operating 37,580 37,580 20,573 17,007 Total CD-Administration 551,340 551,340 548,302 3,038
Community Development-CD Services: Salaries and Benefits 333,950 333,950 286,472 47,478 Other Operating 7,730 7,730 3,420 4,310 Total CD-CD Services 341,680 341,680 289,892 51,788
Community Development-Inspection/Compliance: Salaries and Benefits 663,800 663,800 590,870 72,930 Other Operating 16,050 16,050 12,821 3,229 Total CD-Inspection/Compliance 679,850 679,850 603,691 76,159
64
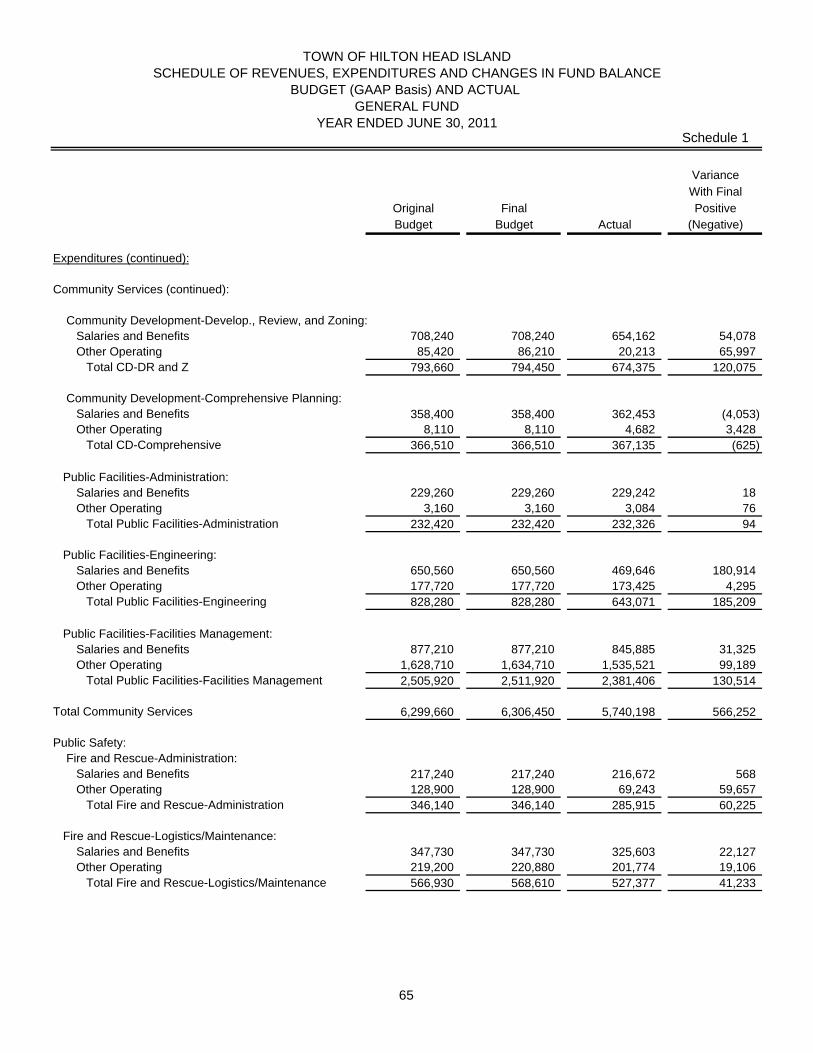
Schedule 1
VarianceWith Final
Original Final PositiveBudget Budget Actual (Negative)
YEAR ENDED JUNE 30, 2011
TOWN OF HILTON HEAD ISLAND
GENERAL FUND
SCHEDULE OF REVENUES, EXPENDITURES AND CHANGES IN FUND BALANCEBUDGET (GAAP Basis) AND ACTUAL
Expenditures (continued):
Community Services (continued):
Community Development-Develop., Review, and Zoning: Salaries and Benefits 708,240 708,240 654,162 54,078 Other Operating 85,420 86,210 20,213 65,997 Total CD-DR and Z 793,660 794,450 674,375 120,075
Community Development-Comprehensive Planning: Salaries and Benefits 358,400 358,400 362,453 (4,053) Other Operating 8,110 8,110 4,682 3,428 Total CD-Comprehensive 366,510 366,510 367,135 (625)
Public Facilities-Administration: Salaries and Benefits 229,260 229,260 229,242 18 Other Operating 3,160 3,160 3,084 76 Total Public Facilities-Administration 232,420 232,420 232,326 94
Public Facilities-Engineering: Salaries and Benefits 650,560 650,560 469,646 180,914 Other Operating 177,720 177,720 173,425 4,295 Total Public Facilities-Engineering 828,280 828,280 643,071 185,209
Public Facilities-Facilities Management: Salaries and Benefits 877,210 877,210 845,885 31,325 Other Operating 1,628,710 1,634,710 1,535,521 99,189 Total Public Facilities-Facilities Management 2,505,920 2,511,920 2,381,406 130,514
Total Community Services 6,299,660 6,306,450 5,740,198 566,252
Public Safety: Fire and Rescue-Administration: Salaries and Benefits 217,240 217,240 216,672 568 Other Operating 128,900 128,900 69,243 59,657 Total Fire and Rescue-Administration 346,140 346,140 285,915 60,225
Fire and Rescue-Logistics/Maintenance: Salaries and Benefits 347,730 347,730 325,603 22,127 Other Operating 219,200 220,880 201,774 19,106 Total Fire and Rescue-Logistics/Maintenance 566,930 568,610 527,377 41,233
65
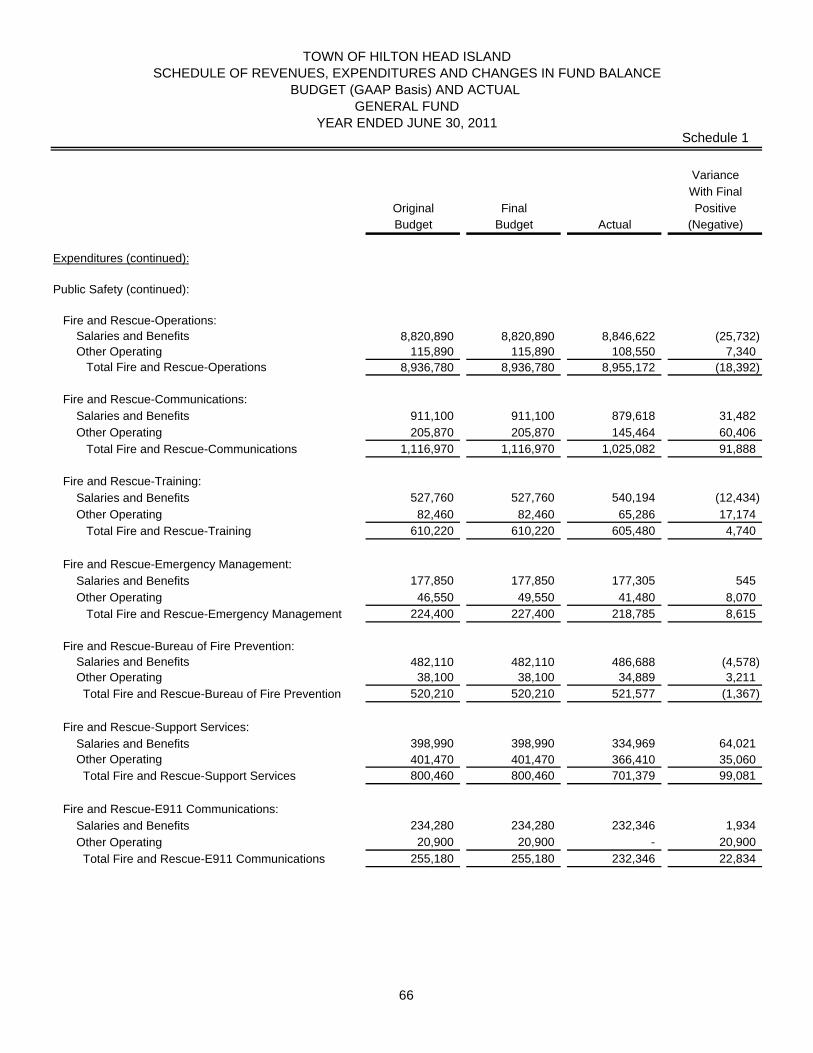
Schedule 1
VarianceWith Final
Original Final PositiveBudget Budget Actual (Negative)
YEAR ENDED JUNE 30, 2011
TOWN OF HILTON HEAD ISLAND
GENERAL FUND
SCHEDULE OF REVENUES, EXPENDITURES AND CHANGES IN FUND BALANCEBUDGET (GAAP Basis) AND ACTUAL
Expenditures (continued):
Public Safety (continued):
Fire and Rescue-Operations: Salaries and Benefits 8,820,890 8,820,890 8,846,622 (25,732) Other Operating 115,890 115,890 108,550 7,340 Total Fire and Rescue-Operations 8,936,780 8,936,780 8,955,172 (18,392)
Fire and Rescue-Communications: Salaries and Benefits 911,100 911,100 879,618 31,482 Other Operating 205,870 205,870 145,464 60,406 Total Fire and Rescue-Communications 1,116,970 1,116,970 1,025,082 91,888
Fire and Rescue-Training: Salaries and Benefits 527,760 527,760 540,194 (12,434) Other Operating 82,460 82,460 65,286 17,174 Total Fire and Rescue-Training 610,220 610,220 605,480 4,740
Fire and Rescue-Emergency Management: Salaries and Benefits 177,850 177,850 177,305 545 Other Operating 46,550 49,550 41,480 8,070 Total Fire and Rescue-Emergency Management 224,400 227,400 218,785 8,615
Fire and Rescue-Bureau of Fire Prevention: Salaries and Benefits 482,110 482,110 486,688 (4,578) Other Operating 38,100 38,100 34,889 3,211 Total Fire and Rescue-Bureau of Fire Prevention 520,210 520,210 521,577 (1,367)
Fire and Rescue-Support Services: Salaries and Benefits 398,990 398,990 334,969 64,021 Other Operating 401,470 401,470 366,410 35,060 Total Fire and Rescue-Support Services 800,460 800,460 701,379 99,081
Fire and Rescue-E911 Communications: Salaries and Benefits 234,280 234,280 232,346 1,934 Other Operating 20,900 20,900 - 20,900 Total Fire and Rescue-E911 Communications 255,180 255,180 232,346 22,834
66
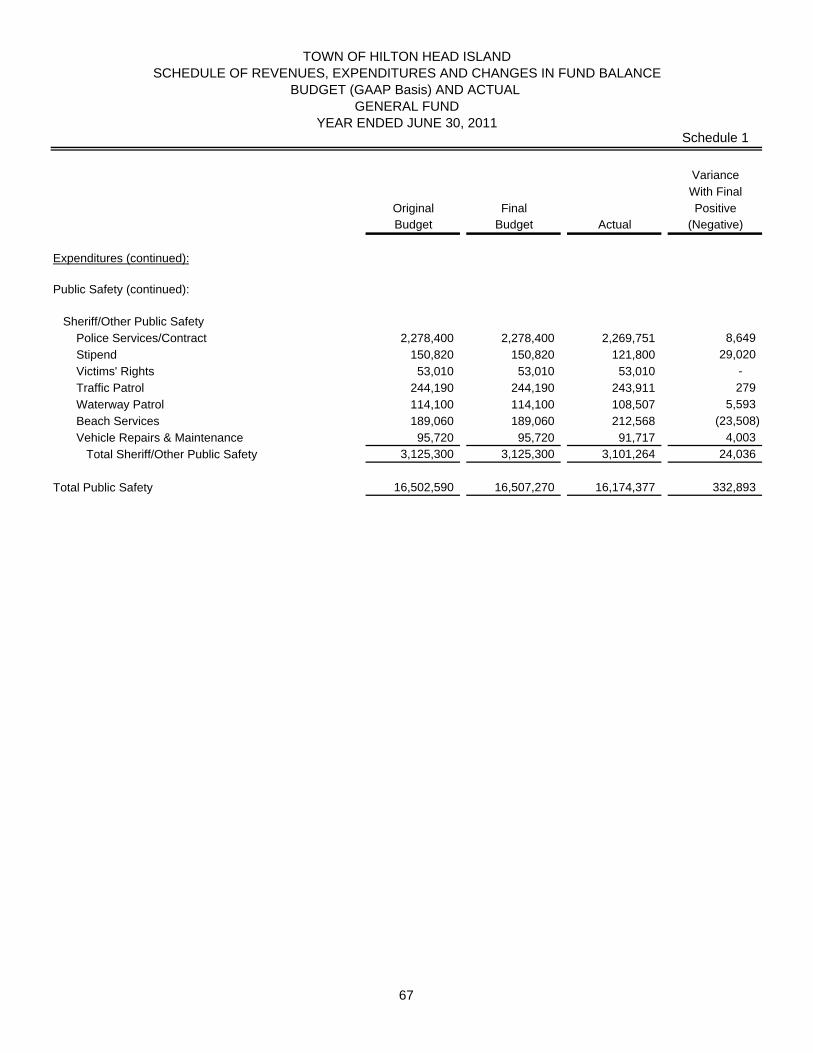
Schedule 1
VarianceWith Final
Original Final PositiveBudget Budget Actual (Negative)
YEAR ENDED JUNE 30, 2011
TOWN OF HILTON HEAD ISLAND
GENERAL FUND
SCHEDULE OF REVENUES, EXPENDITURES AND CHANGES IN FUND BALANCEBUDGET (GAAP Basis) AND ACTUAL
Expenditures (continued):
Public Safety (continued):
Sheriff/Other Public Safety Police Services/Contract 2,278,400 2,278,400 2,269,751 8,649 Stipend 150,820 150,820 121,800 29,020 Victims' Rights 53,010 53,010 53,010 - Traffic Patrol 244,190 244,190 243,911 279 Waterway Patrol 114,100 114,100 108,507 5,593 Beach Services 189,060 189,060 212,568 (23,508) Vehicle Repairs & Maintenance 95,720 95,720 91,717 4,003 Total Sheriff/Other Public Safety 3,125,300 3,125,300 3,101,264 24,036
Total Public Safety 16,502,590 16,507,270 16,174,377 332,893
67
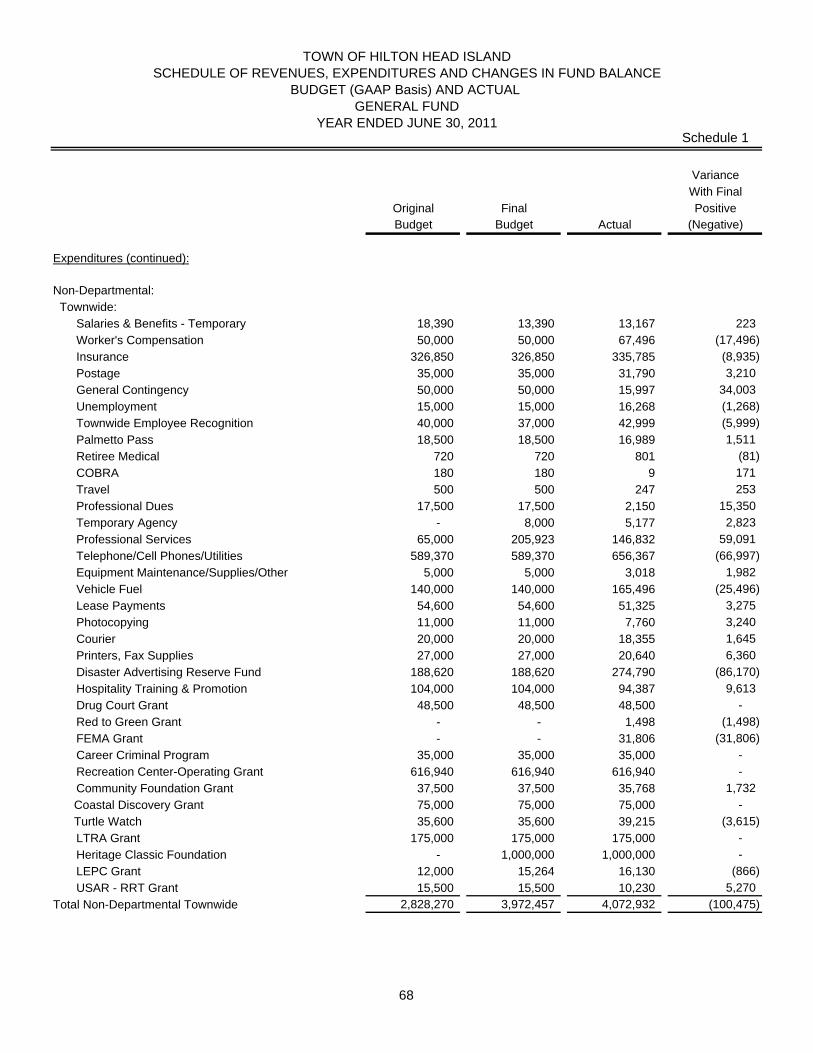
Schedule 1
VarianceWith Final
Original Final PositiveBudget Budget Actual (Negative)
YEAR ENDED JUNE 30, 2011
TOWN OF HILTON HEAD ISLAND
GENERAL FUND
SCHEDULE OF REVENUES, EXPENDITURES AND CHANGES IN FUND BALANCEBUDGET (GAAP Basis) AND ACTUAL
Expenditures (continued):
Non-Departmental: Townwide: Salaries & Benefits - Temporary 18,390 13,390 13,167 223 Worker's Compensation 50,000 50,000 67,496 (17,496) Insurance 326,850 326,850 335,785 (8,935) Postage 35,000 35,000 31,790 3,210 General Contingency 50,000 50,000 15,997 34,003 Unemployment 15,000 15,000 16,268 (1,268) Townwide Employee Recognition 40,000 37,000 42,999 (5,999) Palmetto Pass 18,500 18,500 16,989 1,511 Retiree Medical 720 720 801 (81) COBRA 180 180 9 171 Travel 500 500 247 253 Professional Dues 17,500 17,500 2,150 15,350 Temporary Agency - 8,000 5,177 2,823 Professional Services 65,000 205,923 146,832 59,091 Telephone/Cell Phones/Utilities 589,370 589,370 656,367 (66,997) Equipment Maintenance/Supplies/Other 5,000 5,000 3,018 1,982 Vehicle Fuel 140,000 140,000 165,496 (25,496) Lease Payments 54,600 54,600 51,325 3,275 Photocopying 11,000 11,000 7,760 3,240 Courier 20,000 20,000 18,355 1,645 Printers, Fax Supplies 27,000 27,000 20,640 6,360 Disaster Advertising Reserve Fund 188,620 188,620 274,790 (86,170) Hospitality Training & Promotion 104,000 104,000 94,387 9,613 Drug Court Grant 48,500 48,500 48,500 - Red to Green Grant - - 1,498 (1,498) FEMA Grant - - 31,806 (31,806) Career Criminal Program 35,000 35,000 35,000 - Recreation Center-Operating Grant 616,940 616,940 616,940 - Community Foundation Grant 37,500 37,500 35,768 1,732
Coastal Discovery Grant 75,000 75,000 75,000 - Turtle Watch 35,600 35,600 39,215 (3,615)
LTRA Grant 175,000 175,000 175,000 - Heritage Classic Foundation - 1,000,000 1,000,000 - LEPC Grant 12,000 15,264 16,130 (866) USAR - RRT Grant 15,500 15,500 10,230 5,270 Total Non-Departmental Townwide 2,828,270 3,972,457 4,072,932 (100,475)
68
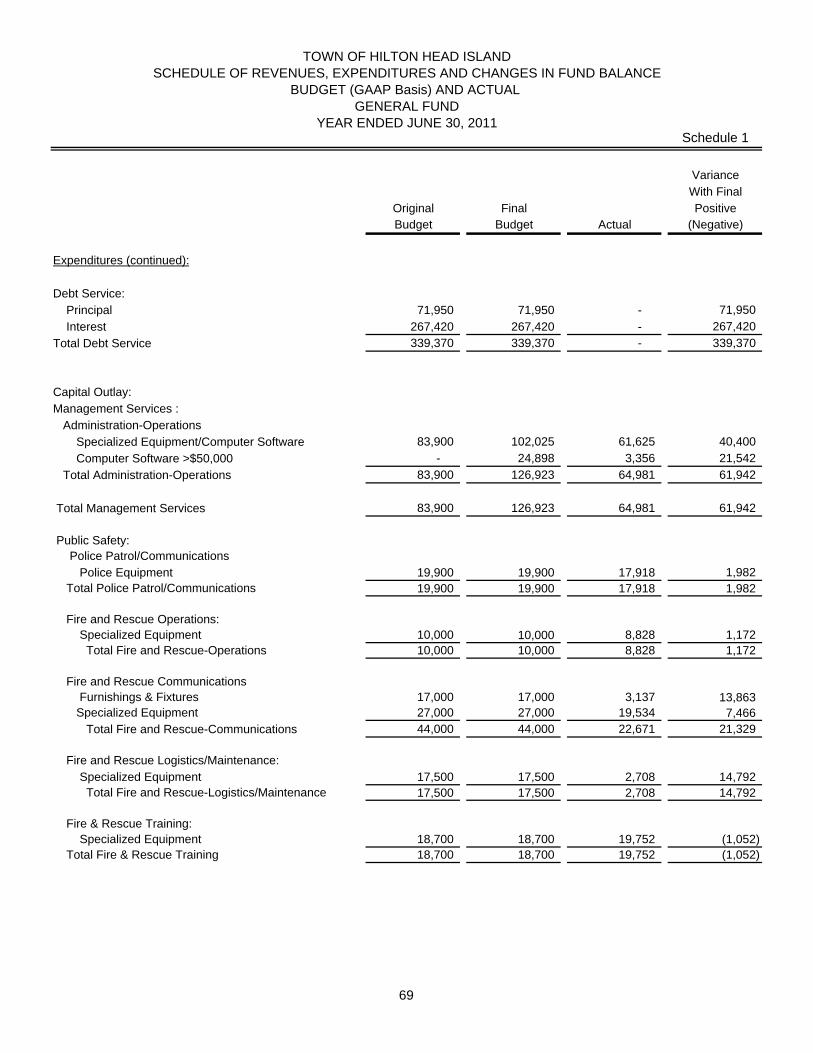
Schedule 1
VarianceWith Final
Original Final PositiveBudget Budget Actual (Negative)
YEAR ENDED JUNE 30, 2011
TOWN OF HILTON HEAD ISLAND
GENERAL FUND
SCHEDULE OF REVENUES, EXPENDITURES AND CHANGES IN FUND BALANCEBUDGET (GAAP Basis) AND ACTUAL
Expenditures (continued):
Debt Service: Principal 71,950 71,950 - 71,950 Interest 267,420 267,420 - 267,420 Total Debt Service 339,370 339,370 - 339,370
Capital Outlay:Management Services : Administration-Operations Specialized Equipment/Computer Software 83,900 102,025 61,625 40,400 Computer Software >$50,000 - 24,898 3,356 21,542 Total Administration-Operations 83,900 126,923 64,981 61,942
Total Management Services 83,900 126,923 64,981 61,942
Public Safety: Police Patrol/Communications Police Equipment 19,900 19,900 17,918 1,982 Total Police Patrol/Communications 19,900 19,900 17,918 1,982
Fire and Rescue Operations: Specialized Equipment 10,000 10,000 8,828 1,172 Total Fire and Rescue-Operations 10,000 10,000 8,828 1,172
Fire and Rescue Communications Furnishings & Fixtures 17,000 17,000 3,137 13,863 Specialized Equipment 27,000 27,000 19,534 7,466 Total Fire and Rescue-Communications 44,000 44,000 22,671 21,329
Fire and Rescue Logistics/Maintenance: Specialized Equipment 17,500 17,500 2,708 14,792 Total Fire and Rescue-Logistics/Maintenance 17,500 17,500 2,708 14,792
Fire & Rescue Training: Specialized Equipment 18,700 18,700 19,752 (1,052) Total Fire & Rescue Training 18,700 18,700 19,752 (1,052)
69
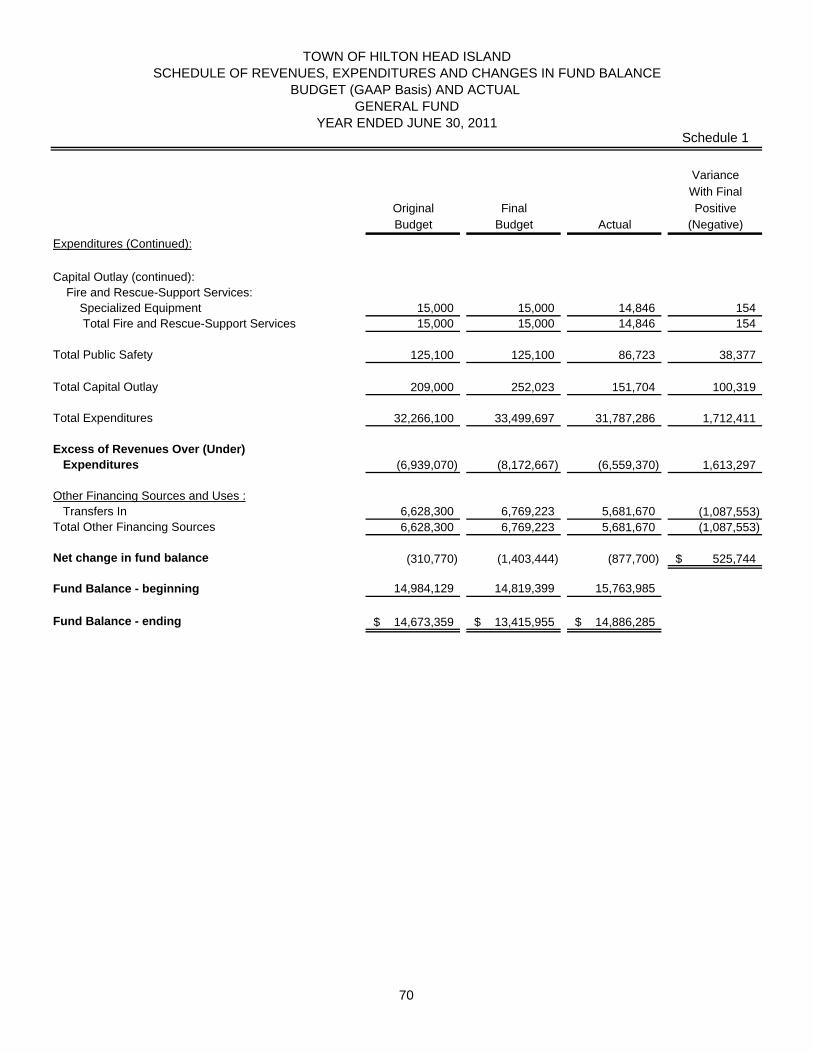
Schedule 1
VarianceWith Final
Original Final PositiveBudget Budget Actual (Negative)
YEAR ENDED JUNE 30, 2011
TOWN OF HILTON HEAD ISLAND
GENERAL FUND
SCHEDULE OF REVENUES, EXPENDITURES AND CHANGES IN FUND BALANCEBUDGET (GAAP Basis) AND ACTUAL
Expenditures (Continued):
Capital Outlay (continued): Fire and Rescue-Support Services: Specialized Equipment 15,000 15,000 14,846 154 Total Fire and Rescue-Support Services 15,000 15,000 14,846 154
Total Public Safety 125,100 125,100 86,723 38,377
Total Capital Outlay 209,000 252,023 151,704 100,319
Total Expenditures 32,266,100 33,499,697 31,787,286 1,712,411
Excess of Revenues Over (Under) Expenditures (6,939,070) (8,172,667) (6,559,370) 1,613,297
Other Financing Sources and Uses : Transfers In 6,628,300 6,769,223 5,681,670 (1,087,553) Total Other Financing Sources 6,628,300 6,769,223 5,681,670 (1,087,553)
Net change in fund balance (310,770) (1,403,444) (877,700) 525,744$
Fund Balance - beginning 14,984,129 14,819,399 15,763,985
Fund Balance - ending 14,673,359$ 13,415,955$ 14,886,285$
70
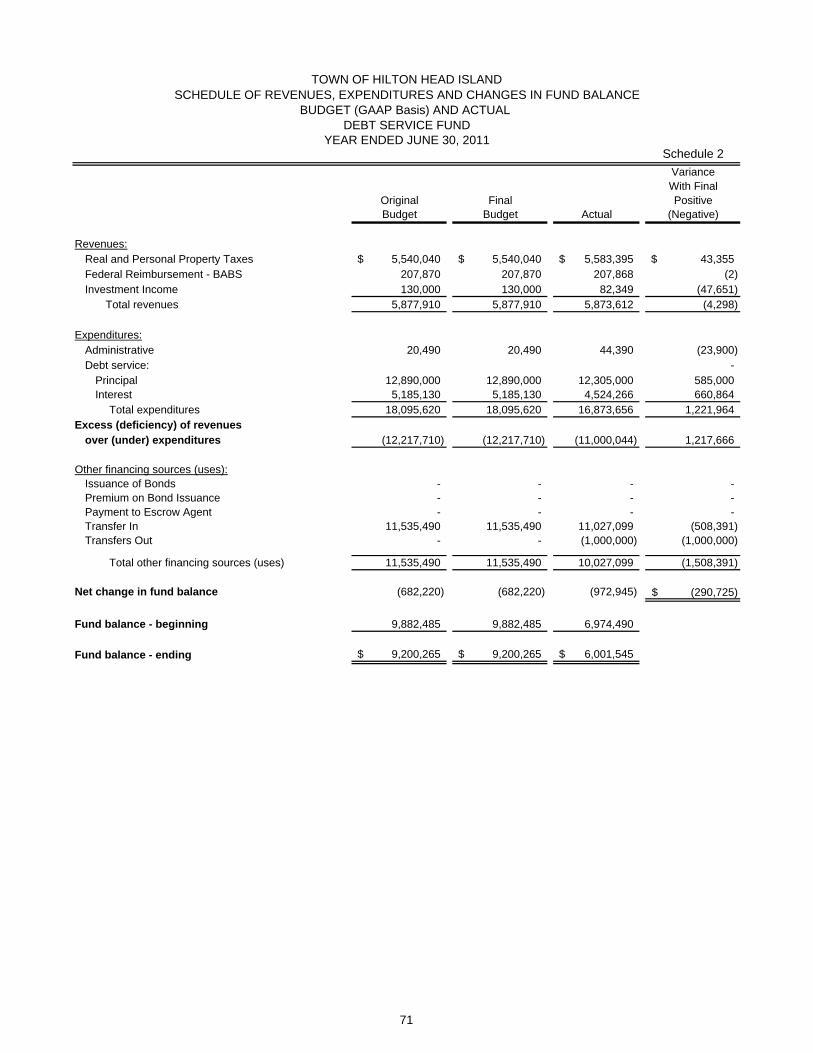
TOWN OF HILTON HEAD ISLAND
YEAR ENDED JUNE 30, 2011Schedule 2
VarianceWith Final
Original Final PositiveBudget Budget Actual (Negative)
Revenues:Real and Personal Property Taxes 5,540,040$ 5,540,040$ 5,583,395$ 43,355$ Federal Reimbursement - BABS 207,870 207,870 207,868 (2) Investment Income 130,000 130,000 82,349 (47,651)
Total revenues 5,877,910 5,877,910 5,873,612 (4,298)
Expenditures:Administrative 20,490 20,490 44,390 (23,900) Debt service: -
Principal 12,890,000 12,890,000 12,305,000 585,000 Interest 5,185,130 5,185,130 4,524,266 660,864
Total expenditures 18,095,620 18,095,620 16,873,656 1,221,964 Excess (deficiency) of revenues
over (under) expenditures (12,217,710) (12,217,710) (11,000,044) 1,217,666
Other financing sources (uses):Issuance of Bonds - - - - Premium on Bond Issuance - - - - Payment to Escrow Agent - - - - Transfer In 11,535,490 11,535,490 11,027,099 (508,391) Transfers Out - - (1,000,000) (1,000,000)
Total other financing sources (uses) 11,535,490 11,535,490 10,027,099 (1,508,391)
Net change in fund balance (682,220) (682,220) (972,945) (290,725)$
Fund balance - beginning 9,882,485 9,882,485 6,974,490
Fund balance - ending 9,200,265$ 9,200,265$ 6,001,545$
SCHEDULE OF REVENUES, EXPENDITURES AND CHANGES IN FUND BALANCEBUDGET (GAAP Basis) AND ACTUAL
DEBT SERVICE FUND
71
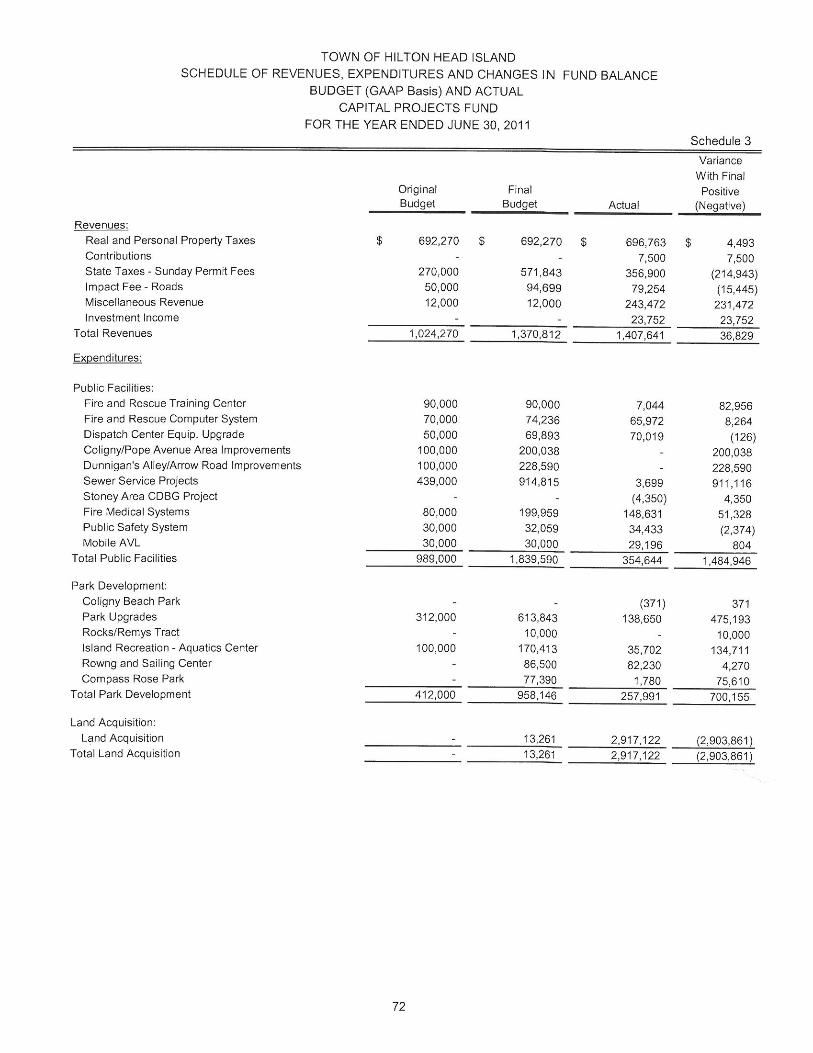
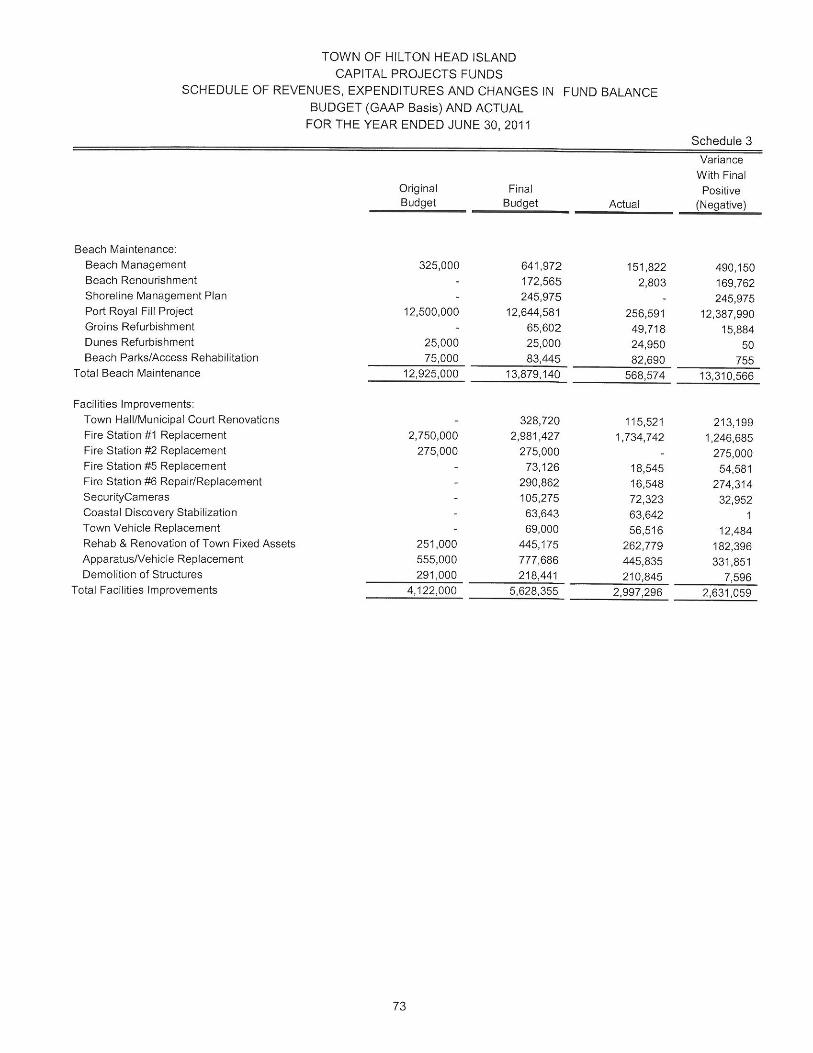
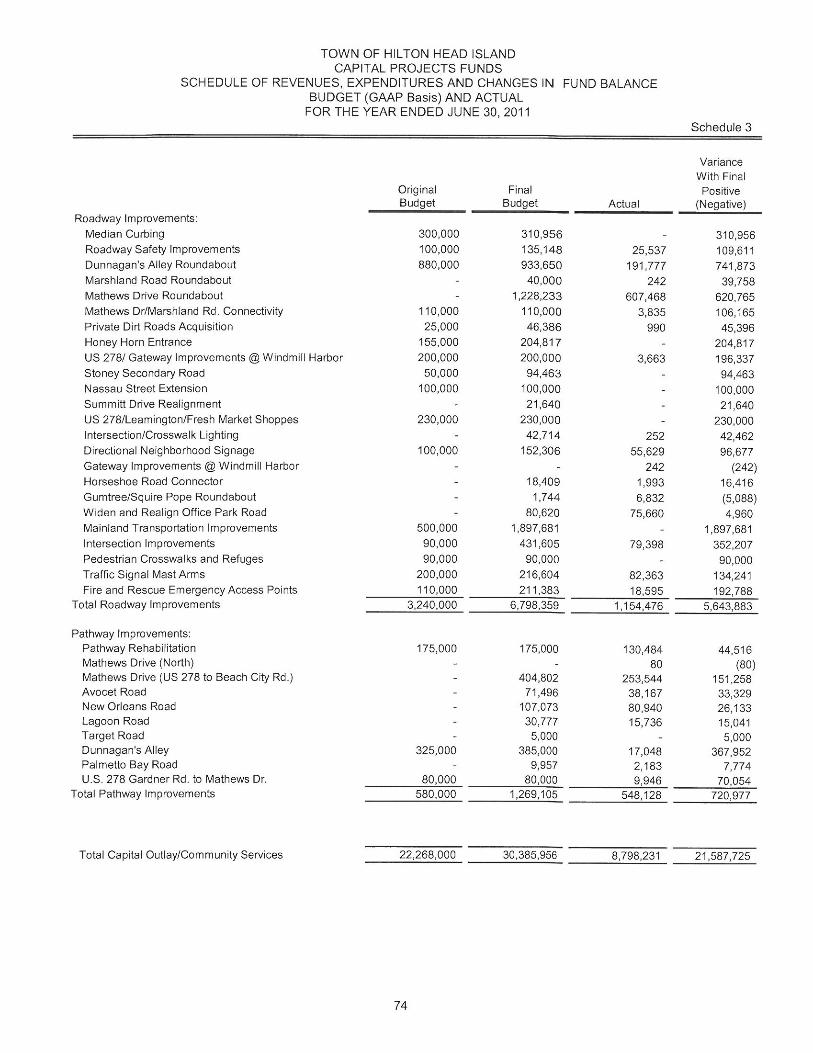
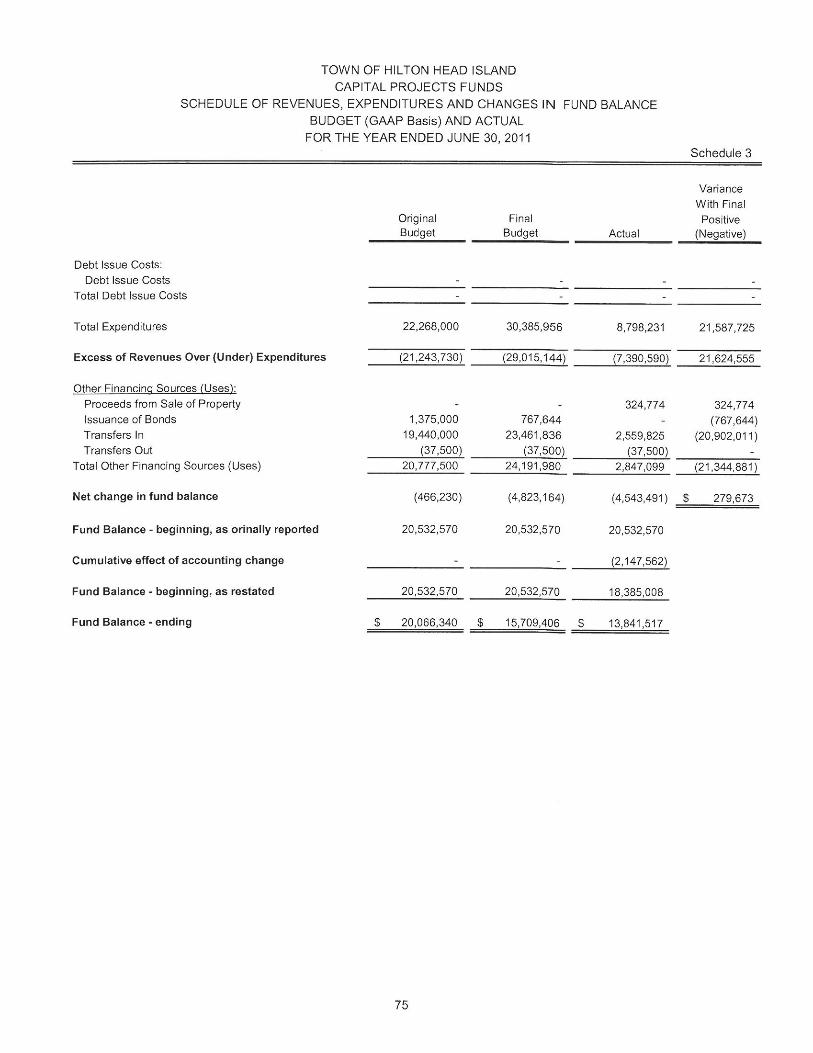
Other Supplementary Information
Nonmajor Governmental Funds
Special Revenue Funds – These funds are used to account for the proceeds of specific revenue sources that are legally restricted to expenditures for specified purposes.
1. Palmetto Electric Franchise Fees – This fund is used to account for franchise
fees paid by Palmetto Electric Cooperative, Inc. These funds will be utilized to offset costs associated with the undergrounding (placement underground) of all existing and future non-transmission lines owned by Palmetto Electric pursuant to the terms and conditions of the Franchise Agreement and related Underground Service Agreement between the Town and Palmetto Electric.
2. Home Grant – Homeownership Assistance Program provides a no-interest, ten-
year deferred loan to prospective, income-qualified homebuyers to meet down payment and closing cost requirements.
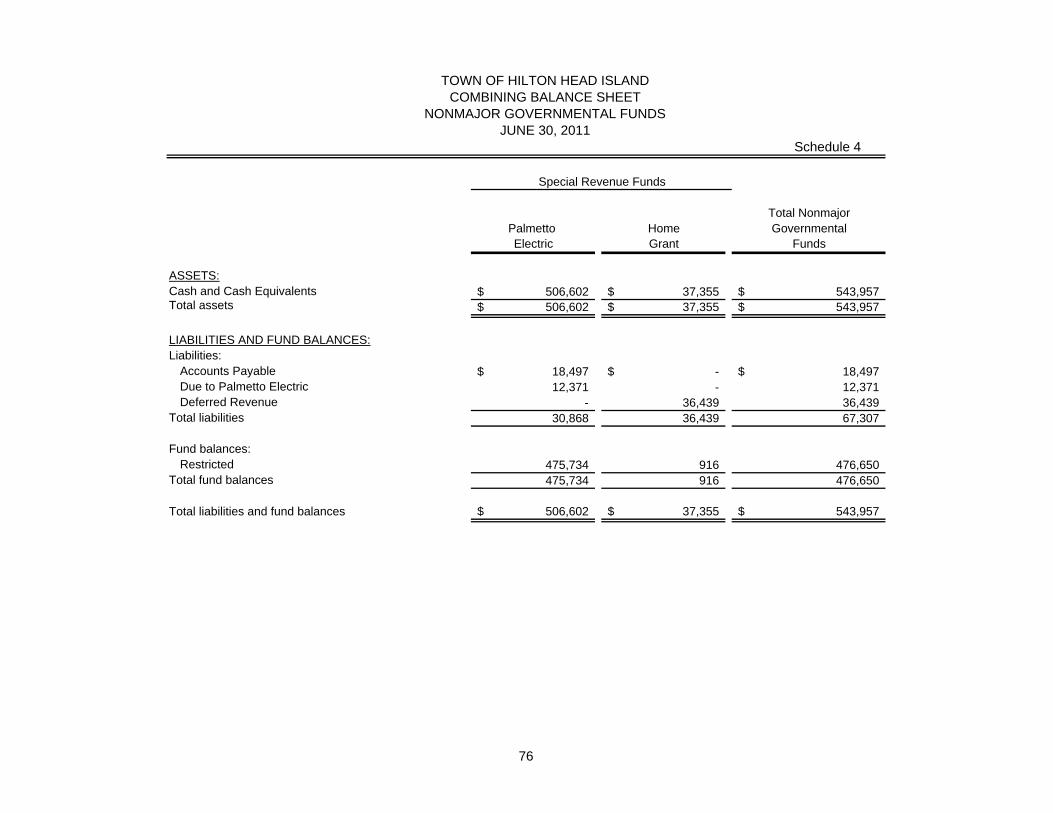
TOWN OF HILTON HEAD ISLANDCOMBINING BALANCE SHEET
NONMAJOR GOVERNMENTAL FUNDSJUNE 30, 2011
Schedule 4
Total NonmajorPalmetto Home GovernmentalElectric Grant Funds
ASSETS:Cash and Cash Equivalents 506,602$ 37,355$ 543,957$ Total assets 506,602$ 37,355$ 543,957$
LIABILITIES AND FUND BALANCES:Liabilities:
Accounts Payable 18,497$ -$ 18,497$ Due to Palmetto Electric 12,371 - 12,371 Deferred Revenue - 36,439 36,439
Total liabilities 30,868 36,439 67,307
Fund balances:Restricted 475,734 916 476,650
Total fund balances 475,734 916 476,650
Total liabilities and fund balances 506,602$ 37,355$ 543,957$
Special Revenue Funds
76
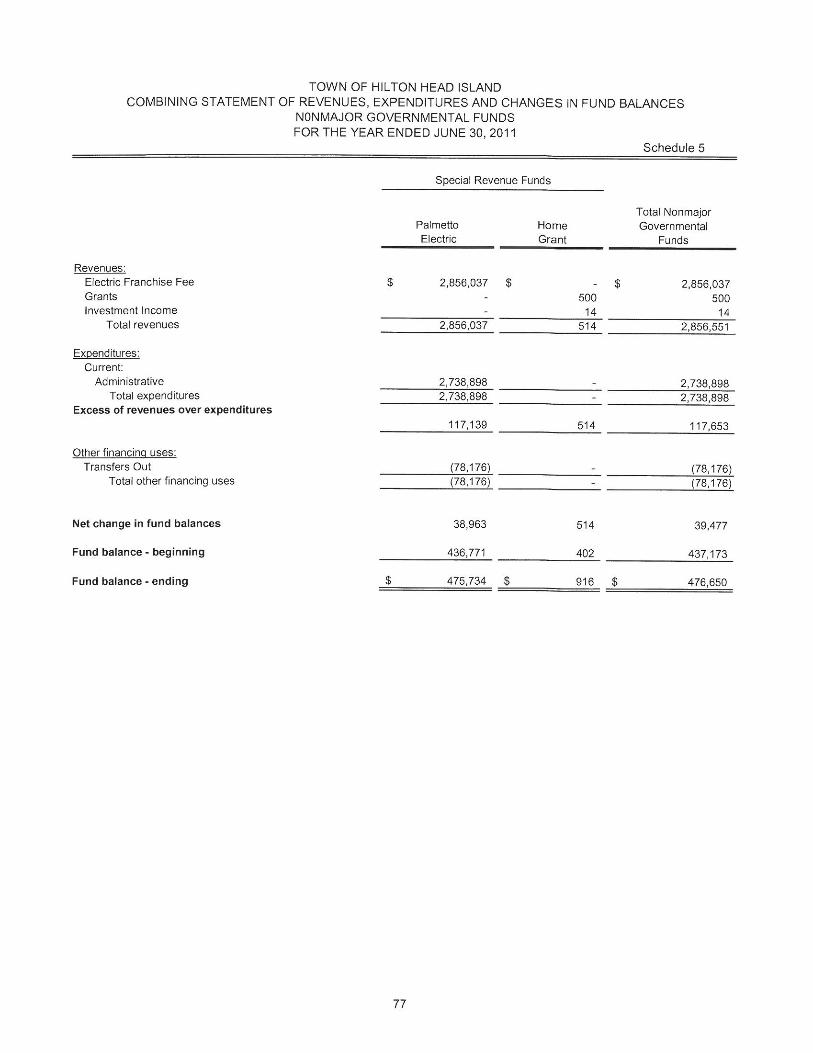
Other Supplementary Information
Agency Fund – This fund is used to account for assets which are custodial in nature (assets equal liabilities) and do not involve the measurement of results of operations.
Firemen’s Fund – This fund is used to account for the accumulation of resources primarily from the firemen’s share of insurance proceeds remitted by the State of South Carolina to the Town firemen and expended for their benefit.
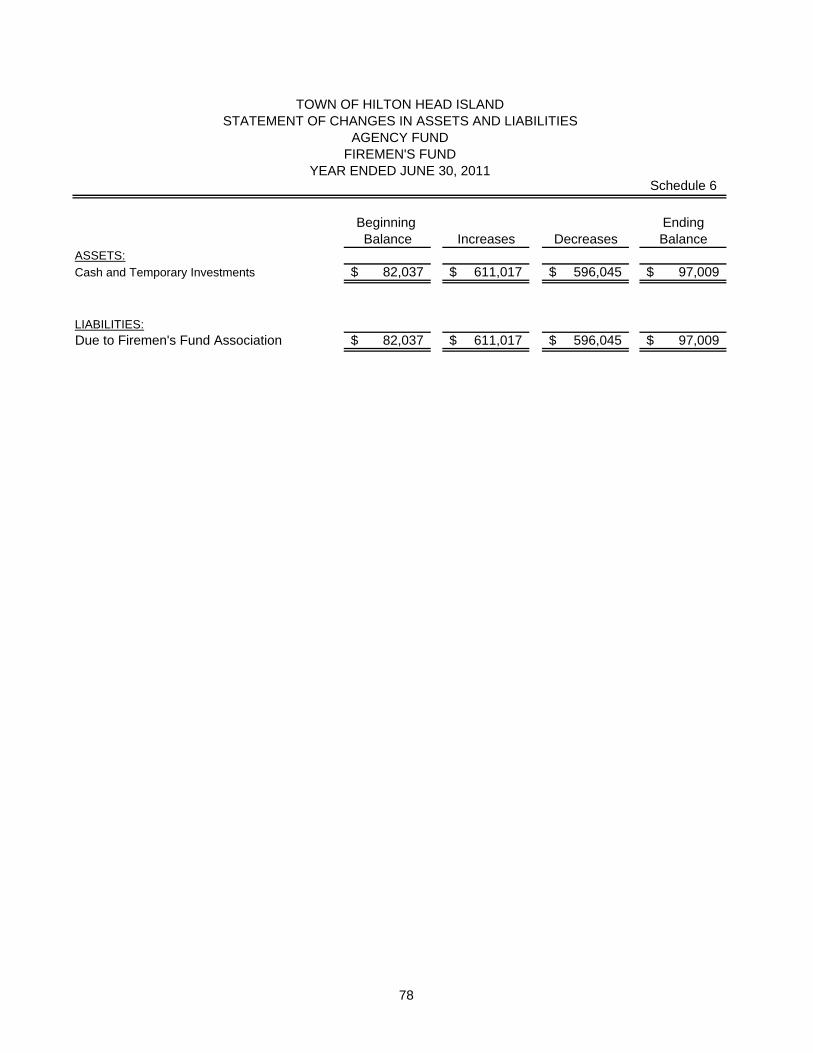
Schedule 6
Beginning EndingBalance Increases Decreases Balance
ASSETS:Cash and Temporary Investments 82,037$ 611,017$ 596,045$ 97,009$
LIABILITIES:Due to Firemen's Fund Association 82,037$ 611,017$ 596,045$ 97,009$
YEAR ENDED JUNE 30, 2011
TOWN OF HILTON HEAD ISLAND
AGENCY FUNDFIREMEN'S FUND
STATEMENT OF CHANGES IN ASSETS AND LIABILITIES
78
Statistical Section (Unaudited)
79
Statistical Section
This part of the Town Hilton Head Island's comprehensive financial report represents detailedinformation as a context for understanding what the information in the financial statements,note disclosures, and required supplementary information says about the Town's overall financial health.
Contents Pages
Financial Trends 80-84 These schedules contain trend information to help the reader understand how the Town's financial performance and well being have changed over time.
Revenue Capacity 85-90 These schedules contain information to help the reader assess the factors affecting the Town's ability to generate its property and sales taxes.
Debt Capacity These schedules present information to help the reader assess the affordability 91-95 of the Town's current levels of outstanding debt and the Town's abilities to issue additional debt in the future.
Demographic and Economic Information These schedules offer demographic and economic indicators to help the reader 96-97 understand the environment within which the Town's financial activities take place and to help make comparisons over time and with other governments.
Operating Information These schedules contain information about the Town's operations and resources 98-101 to help the reader understand how the Town's financial information relates to the services the Town provides and the activities it performs.
Sources: Unless otherwise noted, the information in these schedules is derived from the comprehensiveannual financial reports for the relevant year. The Town implemented Statement 34 in 2003; schedulespresenting government-wide information include information beginning in that year.
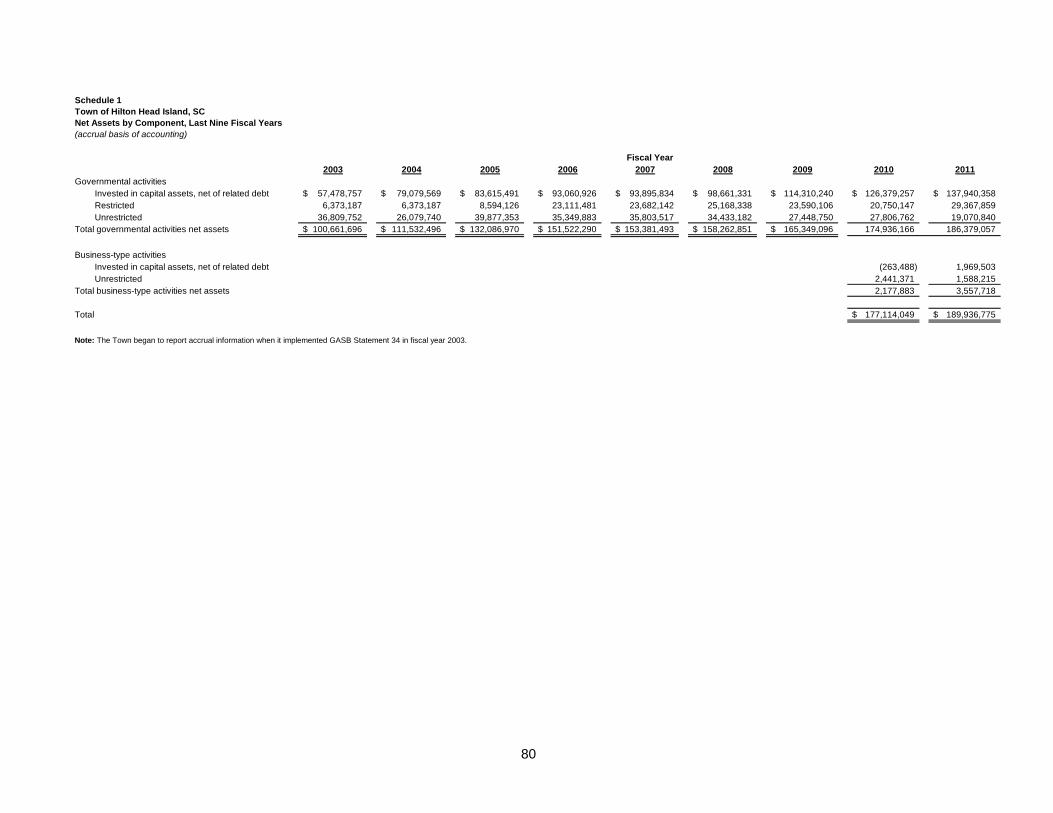
80
Schedule 1Town of Hilton Head Island, SCNet Assets by Component, Last Nine Fiscal Years(accrual basis of accounting)
2003 2004 2005 2006 2007 2008 2009 2010 2011Governmental activities
Invested in capital assets, net of related debt 57,478,757$ 79,079,569$ 83,615,491$ 93,060,926$ 93,895,834$ 98,661,331$ 114,310,240$ 126,379,257$ 137,940,358$ Restricted 6,373,187 6,373,187 8,594,126 23,111,481 23,682,142 25,168,338 23,590,106 20,750,147 29,367,859 Unrestricted 36,809,752 26,079,740 39,877,353 35,349,883 35,803,517 34,433,182 27,448,750 27,806,762 19,070,840
Total governmental activities net assets 100,661,696$ 111,532,496$ 132,086,970$ 151,522,290$ 153,381,493$ 158,262,851$ 165,349,096$ 174,936,166 186,379,057
Business-type activitiesInvested in capital assets, net of related debt (263,488) 1,969,503 Unrestricted 2,441,371 1,588,215
Total business-type activities net assets 2,177,883 3,557,718
Total 177,114,049$ 189,936,775$
Note: The Town began to report accrual information when it implemented GASB Statement 34 in fiscal year 2003.
Fiscal Year
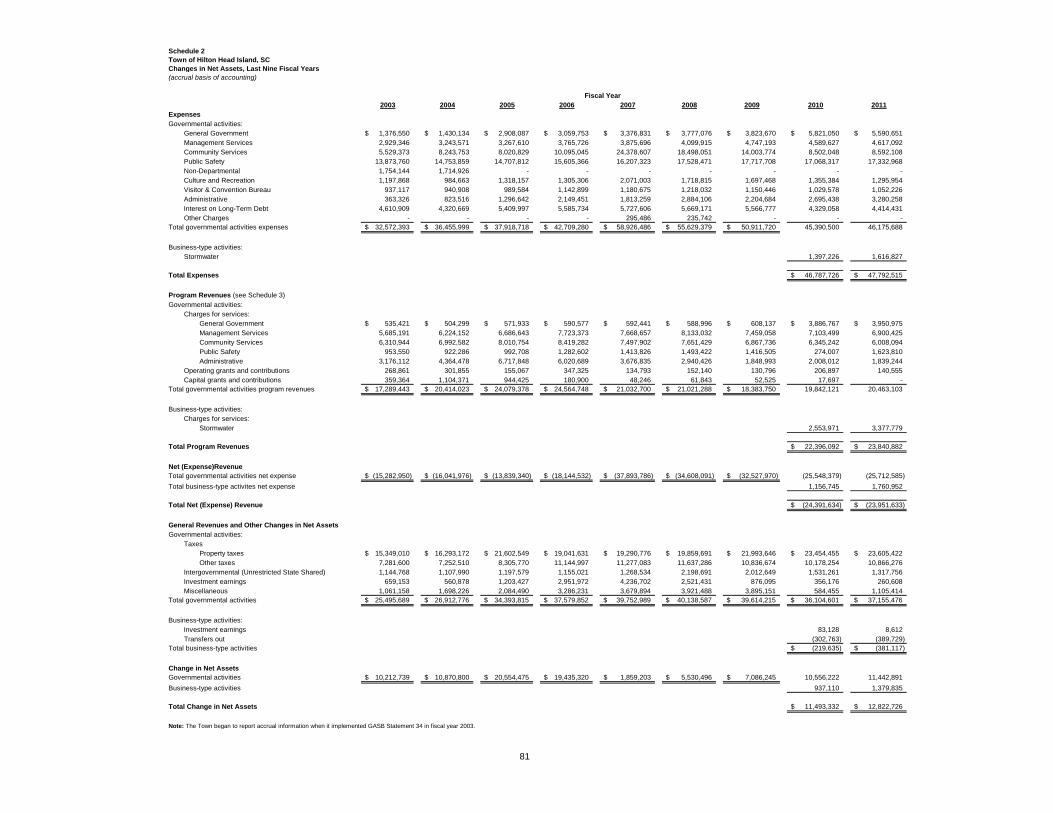
81
Schedule 2Town of Hilton Head Island, SCChanges in Net Assets, Last Nine Fiscal Years(accrual basis of accounting)
2003 2004 2005 2006 2007 2008 2009 2010 2011ExpensesGovernmental activities:
General Government 1,376,550$ 1,430,134$ 2,908,087$ 3,059,753$ 3,376,831$ 3,777,076$ 3,823,670$ 5,821,050$ 5,590,651$ Management Services 2,929,346 3,243,571 3,267,610 3,765,726 3,875,696 4,099,915 4,747,193 4,589,627 4,617,092 Community Services 5,529,373 8,243,753 8,020,829 10,095,045 24,378,607 18,498,051 14,003,774 8,502,048 8,592,108 Public Safety 13,873,760 14,753,859 14,707,812 15,605,366 16,207,323 17,528,471 17,717,708 17,068,317 17,332,968 Non-Departmental 1,754,144 1,714,926 - - - - - - - Culture and Recreation 1,197,868 984,663 1,318,157 1,305,306 2,071,003 1,718,815 1,697,468 1,355,384 1,295,954 Visitor & Convention Bureau 937,117 940,908 989,584 1,142,899 1,180,675 1,218,032 1,150,446 1,029,578 1,052,226 Administrative 363,326 823,516 1,296,642 2,149,451 1,813,259 2,884,106 2,204,684 2,695,438 3,280,258 Interest on Long-Term Debt 4,610,909 4,320,669 5,409,997 5,585,734 5,727,606 5,669,171 5,566,777 4,329,058 4,414,431 Other Charges - - - - 295,486 235,742 - - -
Total governmental activities expenses 32,572,393$ 36,455,999$ 37,918,718$ 42,709,280$ 58,926,486$ 55,629,379$ 50,911,720$ 45,390,500 46,175,688
Business-type activities:Stormwater 1,397,226 1,616,827
Total Expenses 46,787,726$ 47,792,515$
Program Revenues (see Schedule 3)Governmental activities:
Charges for services:General Government 535,421$ 504,299$ 571,933$ 590,577$ 592,441$ 588,996$ 608,137$ 3,886,767$ 3,950,975$ Management Services 5,685,191 6,224,152 6,686,643 7,723,373 7,668,657 8,133,032 7,459,058 7,103,499 6,900,425 Community Services 6,310,944 6,992,582 8,010,754 8,419,282 7,497,902 7,651,429 6,867,736 6,345,242 6,008,094 Public Safety 953,550 922,286 992,708 1,282,602 1,413,826 1,493,422 1,416,505 274,007 1,623,810 Administrative 3,176,112 4,364,478 6,717,848 6,020,689 3,676,835 2,940,426 1,848,993 2,008,012 1,839,244
Operating grants and contributions 268,861 301,855 155,067 347,325 134,793 152,140 130,796 206,897 140,555 Capital grants and contributions 359,364 1,104,371 944,425 180,900 48,246 61,843 52,525 17,697 -
Total governmental activities program revenues 17,289,443$ 20,414,023$ 24,079,378$ 24,564,748$ 21,032,700$ 21,021,288$ 18,383,750$ 19,842,121 20,463,103
Business-type activities:Charges for services:
Stormwater 2,553,971 3,377,779
Total Program Revenues 22,396,092$ 23,840,882$
Net (Expense)RevenueTotal governmental activities net expense (15,282,950)$ (16,041,976)$ (13,839,340)$ (18,144,532)$ (37,893,786)$ (34,608,091)$ (32,527,970)$ (25,548,379) (25,712,585) Total business-type activites net expense 1,156,745 1,760,952
Total Net (Expense) Revenue (24,391,634)$ (23,951,633)$
General Revenues and Other Changes in Net AssetsGovernmental activities:
TaxesProperty taxes 15,349,010$ 16,293,172$ 21,602,549$ 19,041,631$ 19,290,776$ 19,859,691$ 21,993,646$ 23,454,455$ 23,605,422$ Other taxes 7,281,600 7,252,510 8,305,770 11,144,997 11,277,083 11,637,286 10,836,674 10,178,254 10,866,276
Intergovernmental (Unrestricted State Shared) 1,144,768 1,107,990 1,197,579 1,155,021 1,268,534 2,198,691 2,012,649 1,531,261 1,317,756 Investment earnings 659,153 560,878 1,203,427 2,951,972 4,236,702 2,521,431 876,095 356,176 260,608 Miscellaneous 1,061,158 1,698,226 2,084,490 3,286,231 3,679,894 3,921,488 3,895,151 584,455 1,105,414
Total governmental activities 25,495,689$ 26,912,776$ 34,393,815$ 37,579,852$ 39,752,989$ 40,138,587$ 39,614,215$ 36,104,601$ 37,155,476$
Business-type activities:Investment earnings 83,128 8,612 Transfers out (302,763) (389,729)
Total business-type activities (219,635)$ (381,117)$
Change in Net AssetsGovernmental activities 10,212,739$ 10,870,800$ 20,554,475$ 19,435,320$ 1,859,203$ 5,530,496$ 7,086,245$ 10,556,222 11,442,891 Business-type activities 937,110 1,379,835
Total Change in Net Assets 11,493,332$ 12,822,726$
Note: The Town began to report accrual information when it implemented GASB Statement 34 in fiscal year 2003.
Fiscal Year
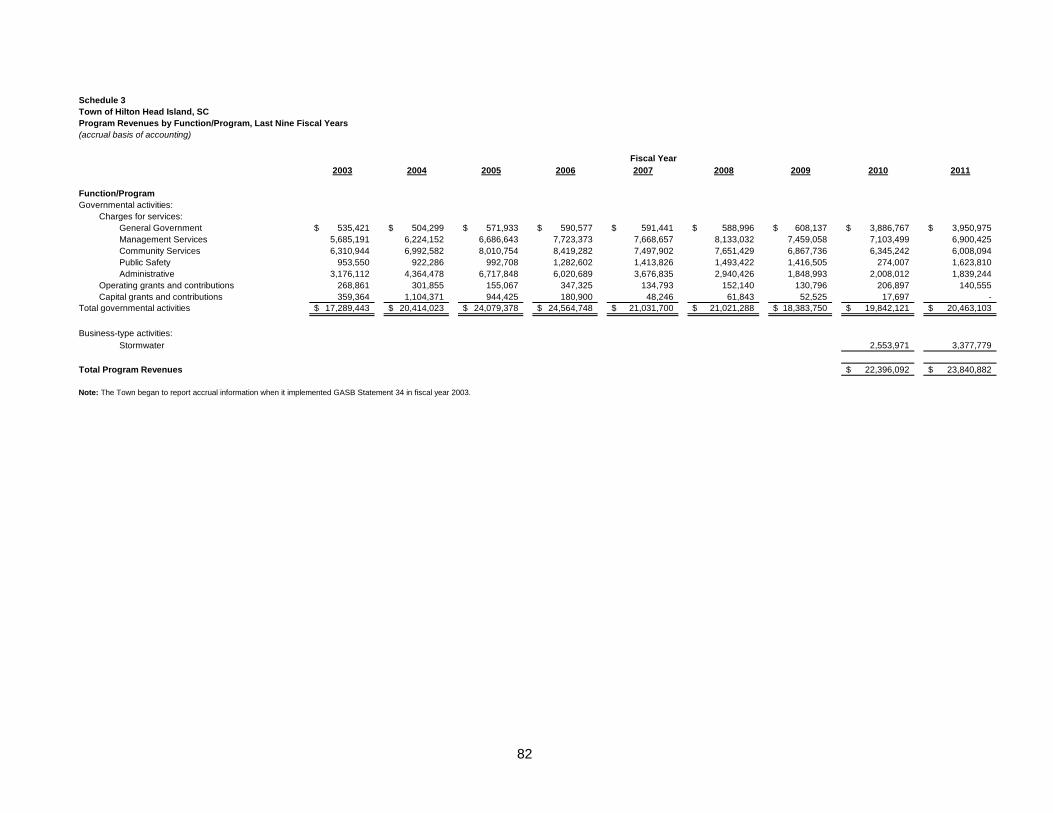
82
Schedule 3Town of Hilton Head Island, SCProgram Revenues by Function/Program, Last Nine Fiscal Years(accrual basis of accounting)
2003 2004 2005 2006 2007 2008 2009 2010 2011
Function/ProgramGovernmental activities:
Charges for services:General Government 535,421$ 504,299$ 571,933$ 590,577$ 591,441$ 588,996$ 608,137$ 3,886,767$ 3,950,975$ Management Services 5,685,191 6,224,152 6,686,643 7,723,373 7,668,657 8,133,032 7,459,058 7,103,499 6,900,425 Community Services 6,310,944 6,992,582 8,010,754 8,419,282 7,497,902 7,651,429 6,867,736 6,345,242 6,008,094 Public Safety 953,550 922,286 992,708 1,282,602 1,413,826 1,493,422 1,416,505 274,007 1,623,810 Administrative 3,176,112 4,364,478 6,717,848 6,020,689 3,676,835 2,940,426 1,848,993 2,008,012 1,839,244
Operating grants and contributions 268,861 301,855 155,067 347,325 134,793 152,140 130,796 206,897 140,555 Capital grants and contributions 359,364 1,104,371 944,425 180,900 48,246 61,843 52,525 17,697 -
Total governmental activities 17,289,443$ 20,414,023$ 24,079,378$ 24,564,748$ 21,031,700$ 21,021,288$ 18,383,750$ 19,842,121$ 20,463,103$
Business-type activities:Stormwater 2,553,971 3,377,779
Total Program Revenues 22,396,092$ 23,840,882$
Note: The Town began to report accrual information when it implemented GASB Statement 34 in fiscal year 2003.
Fiscal Year
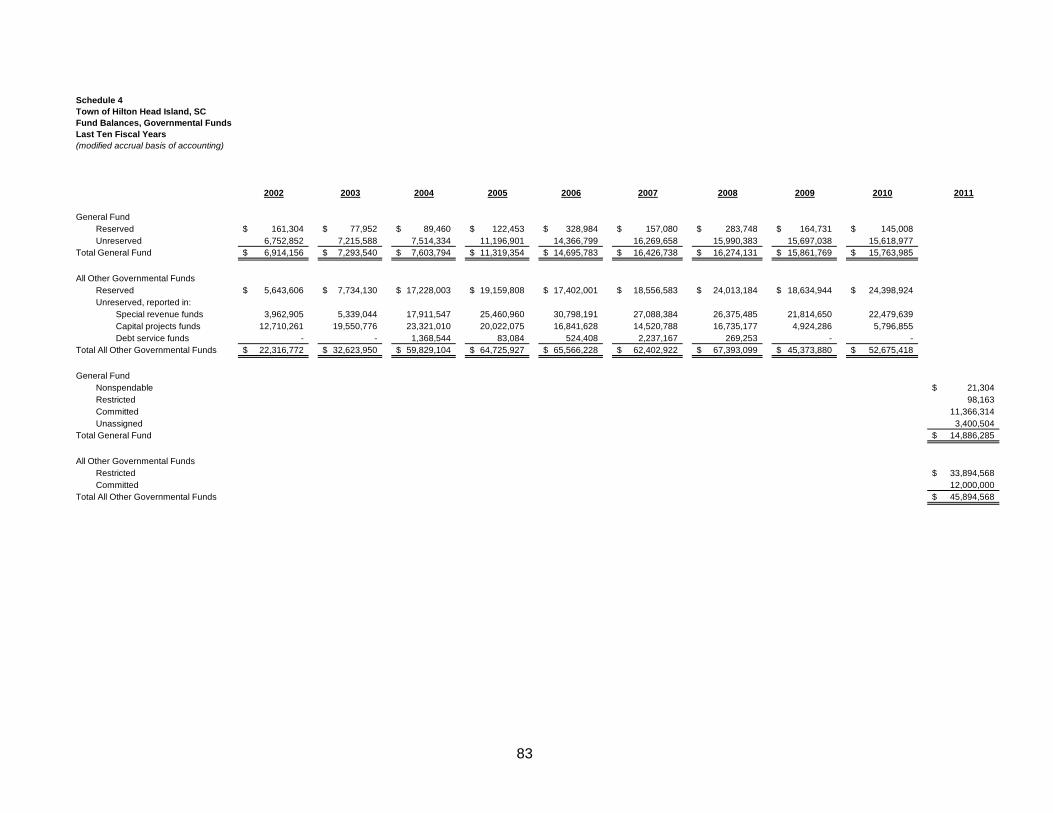
83
Schedule 4Town of Hilton Head Island, SCFund Balances, Governmental FundsLast Ten Fiscal Years(modified accrual basis of accounting)
2002 2003 2004 2005 2006 2007 2008 2009 2010 2011
General FundReserved 161,304$ 77,952$ 89,460$ 122,453$ 328,984$ 157,080$ 283,748$ 164,731$ 145,008$ Unreserved 6,752,852 7,215,588 7,514,334 11,196,901 14,366,799 16,269,658 15,990,383 15,697,038 15,618,977
Total General Fund 6,914,156$ 7,293,540$ 7,603,794$ 11,319,354$ 14,695,783$ 16,426,738$ 16,274,131$ 15,861,769$ 15,763,985$
All Other Governmental FundsReserved 5,643,606$ 7,734,130$ 17,228,003$ 19,159,808$ 17,402,001$ 18,556,583$ 24,013,184$ 18,634,944$ 24,398,924$ Unreserved, reported in:
Special revenue funds 3,962,905 5,339,044 17,911,547 25,460,960 30,798,191 27,088,384 26,375,485 21,814,650 22,479,639 Capital projects funds 12,710,261 19,550,776 23,321,010 20,022,075 16,841,628 14,520,788 16,735,177 4,924,286 5,796,855 Debt service funds - - 1,368,544 83,084 524,408 2,237,167 269,253 - -
Total All Other Governmental Funds 22,316,772$ 32,623,950$ 59,829,104$ 64,725,927$ 65,566,228$ 62,402,922$ 67,393,099$ 45,373,880$ 52,675,418$
General FundNonspendable 21,304$ Restricted 98,163 Committed 11,366,314 Unassigned 3,400,504
Total General Fund 14,886,285$
All Other Governmental FundsRestricted 33,894,568$ Committed 12,000,000
Total All Other Governmental Funds 45,894,568$
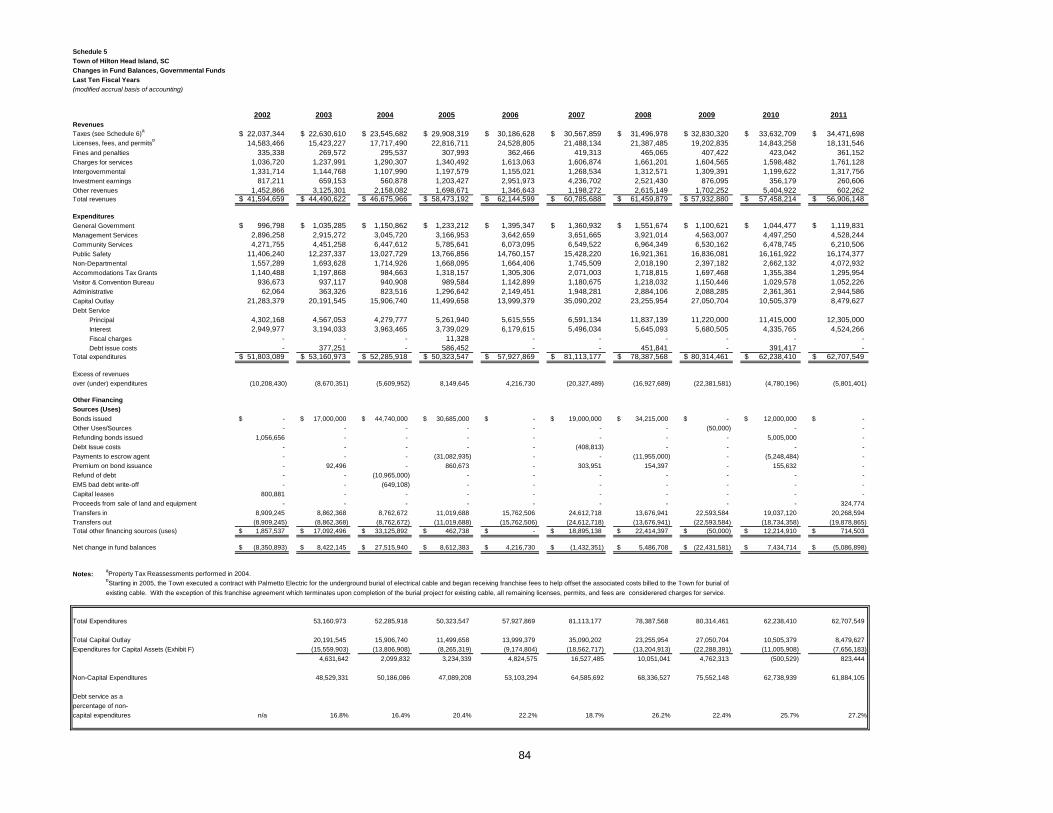
84
Schedule 5Town of Hilton Head Island, SCChanges in Fund Balances, Governmental FundsLast Ten Fiscal Years(modified accrual basis of accounting)
2002 2003 2004 2005 2006 2007 2008 2009 2010 2011RevenuesTaxes (see Schedule 6)a 22,037,344$ 22,630,610$ 23,545,682$ 29,908,319$ 30,186,628$ 30,567,859$ 31,496,978$ 32,830,320$ 33,632,709$ 34,471,698$ Licenses, fees, and permitsb 14,583,466 15,423,227 17,717,490 22,816,711 24,528,805 21,488,134 21,387,485 19,202,835 14,843,258 18,131,546 Fines and penalties 335,338 269,572 295,537 307,993 362,466 419,313 465,065 407,422 423,042 361,152 Charges for services 1,036,720 1,237,991 1,290,307 1,340,492 1,613,063 1,606,874 1,661,201 1,604,565 1,598,482 1,761,128 Intergovernmental 1,331,714 1,144,768 1,107,990 1,197,579 1,155,021 1,268,534 1,312,571 1,309,391 1,199,622 1,317,756 Investment earnings 817,211 659,153 560,878 1,203,427 2,951,973 4,236,702 2,521,430 876,095 356,179 260,606 Other revenues 1,452,866 3,125,301 2,158,082 1,698,671 1,346,643 1,198,272 2,615,149 1,702,252 5,404,922 602,262 Total revenues 41,594,659$ 44,490,622$ 46,675,966$ 58,473,192$ 62,144,599$ 60,785,688$ 61,459,879$ 57,932,880$ 57,458,214$ 56,906,148$
ExpendituresGeneral Government 996,798$ 1,035,285$ 1,150,862$ 1,233,212$ 1,395,347$ 1,360,932$ 1,551,674$ 1,100,621$ 1,044,477$ 1,119,831$ Management Services 2,896,258 2,915,272 3,045,720 3,166,953 3,642,659 3,651,665 3,921,014 4,563,007 4,497,250 4,528,244 Community Services 4,271,755 4,451,258 6,447,612 5,785,641 6,073,095 6,549,522 6,964,349 6,530,162 6,478,745 6,210,506 Public Safety 11,406,240 12,237,337 13,027,729 13,766,856 14,760,157 15,428,220 16,921,361 16,836,081 16,161,922 16,174,377 Non-Departmental 1,557,289 1,693,628 1,714,926 1,668,095 1,664,406 1,745,509 2,018,190 2,397,182 2,662,132 4,072,932 Accommodations Tax Grants 1,140,488 1,197,868 984,663 1,318,157 1,305,306 2,071,003 1,718,815 1,697,468 1,355,384 1,295,954 Visitor & Convention Bureau 936,673 937,117 940,908 989,584 1,142,899 1,180,675 1,218,032 1,150,446 1,029,578 1,052,226 Administrative 62,064 363,326 823,516 1,296,642 2,149,451 1,948,281 2,884,106 2,088,285 2,361,361 2,944,586 Capital Outlay 21,283,379 20,191,545 15,906,740 11,499,658 13,999,379 35,090,202 23,255,954 27,050,704 10,505,379 8,479,627 Debt Service
Principal 4,302,168 4,567,053 4,279,777 5,261,940 5,615,555 6,591,134 11,837,139 11,220,000 11,415,000 12,305,000 Interest 2,949,977 3,194,033 3,963,465 3,739,029 6,179,615 5,496,034 5,645,093 5,680,505 4,335,765 4,524,266 Fiscal charges - - - 11,328 - - - - - - Debt issue costs - 377,251 - 586,452 - - 451,841 - 391,417 -
Total expenditures 51,803,089$ 53,160,973$ 52,285,918$ 50,323,547$ 57,927,869$ 81,113,177$ 78,387,568$ 80,314,461$ 62,238,410$ 62,707,549$
Excess of revenuesover (under) expenditures (10,208,430) (8,670,351) (5,609,952) 8,149,645 4,216,730 (20,327,489) (16,927,689) (22,381,581) (4,780,196) (5,801,401)
Other FinancingSources (Uses)Bonds issued -$ 17,000,000$ 44,740,000$ 30,685,000$ -$ 19,000,000$ 34,215,000$ -$ 12,000,000$ -$ Other Uses/Sources - - - - - - - (50,000) - - Refunding bonds issued 1,056,656 - - - - - - - 5,005,000 - Debt Issue costs - - - - - (408,813) - - - - Payments to escrow agent - - - (31,082,935) - - (11,955,000) - (5,248,484) - Premium on bond issuance - 92,496 - 860,673 - 303,951 154,397 - 155,632 - Refund of debt - - (10,965,000) - - - - - - - EMS bad debt write-off - - (649,108) - - - - - - - Capital leases 800,881 - - - - - - - - - Proceeds from sale of land and equipment - - - - - - - - - 324,774 Transfers in 8,909,245 8,862,368 8,762,672 11,019,688 15,762,506 24,612,718 13,676,941 22,593,584 19,037,120 20,268,594 Transfers out (8,909,245) (8,862,368) (8,762,672) (11,019,688) (15,762,506) (24,612,718) (13,676,941) (22,593,584) (18,734,358) (19,878,865) Total other financing sources (uses) 1,857,537$ 17,092,496$ 33,125,892$ 462,738$ -$ 18,895,138$ 22,414,397$ (50,000)$ 12,214,910$ 714,503$
Net change in fund balances (8,350,893)$ 8,422,145$ 27,515,940$ 8,612,383$ 4,216,730$ (1,432,351)$ 5,486,708$ (22,431,581)$ 7,434,714$ (5,086,898)$
Notes: aProperty Tax Reassessments performed in 2004.bStarting in 2005, the Town executed a contract with Palmetto Electric for the underground burial of electrical cable and began receiving franchise fees to help offset the associated costs billed to the Town for burial ofexisting cable. With the exception of this franchise agreement which terminates upon completion of the burial project for existing cable, all remaining licenses, permits, and fees are considerered charges for service.
Total Expenditures 53,160,973 52,285,918 50,323,547 57,927,869 81,113,177 78,387,568 80,314,461 62,238,410 62,707,549
Total Capital Outlay 20,191,545 15,906,740 11,499,658 13,999,379 35,090,202 23,255,954 27,050,704 10,505,379 8,479,627 Expenditures for Capital Assets (Exhibit F) (15,559,903) (13,806,908) (8,265,319) (9,174,804) (18,562,717) (13,204,913) (22,288,391) (11,005,908) (7,656,183)
4,631,642 2,099,832 3,234,339 4,824,575 16,527,485 10,051,041 4,762,313 (500,529) 823,444
Non-Capital Expenditures 48,529,331 50,186,086 47,089,208 53,103,294 64,585,692 68,336,527 75,552,148 62,738,939 61,884,105
Debt service as apercentage of non-capital expenditures n/a 16.8% 16.4% 20.4% 22.2% 18.7% 26.2% 22.4% 25.7% 27.2%
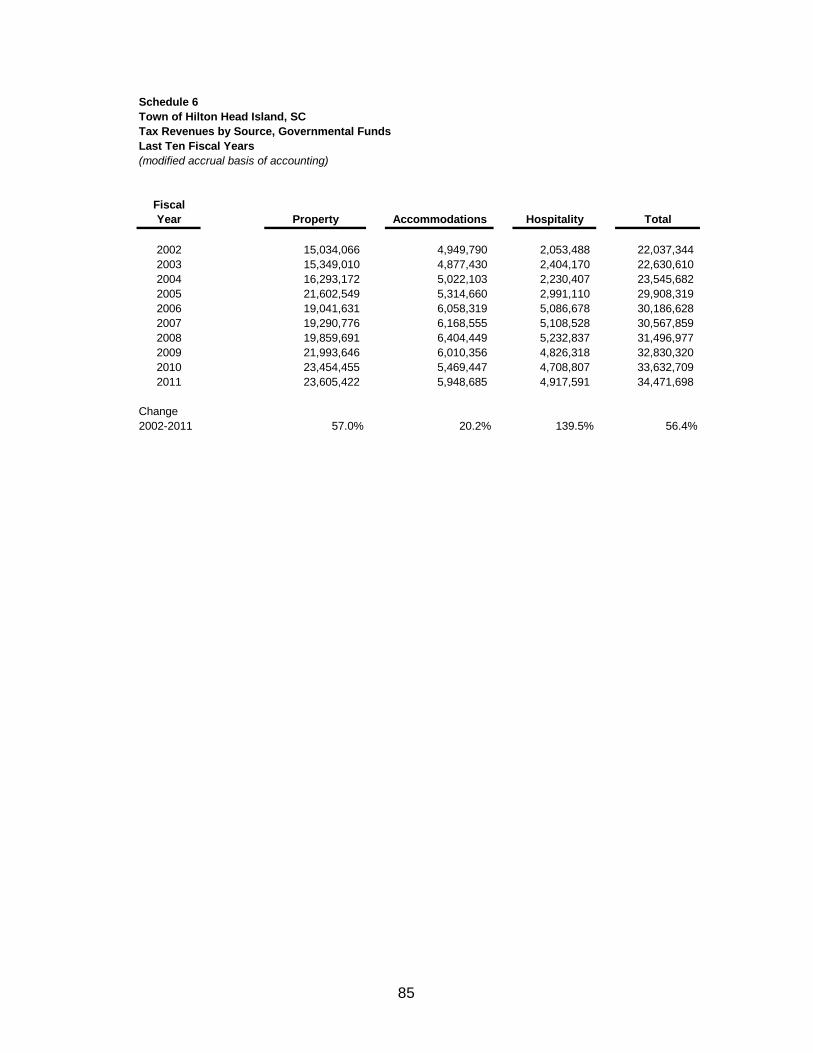
85
Schedule 6Town of Hilton Head Island, SCTax Revenues by Source, Governmental FundsLast Ten Fiscal Years(modified accrual basis of accounting)
FiscalYear Property Accommodations Hospitality Total
2002 15,034,066 4,949,790 2,053,488 22,037,344 2003 15,349,010 4,877,430 2,404,170 22,630,610 2004 16,293,172 5,022,103 2,230,407 23,545,682 2005 21,602,549 5,314,660 2,991,110 29,908,319 2006 19,041,631 6,058,319 5,086,678 30,186,628 2007 19,290,776 6,168,555 5,108,528 30,567,859 2008 19,859,691 6,404,449 5,232,837 31,496,977 2009 21,993,646 6,010,356 4,826,318 32,830,320 2010 23,454,455 5,469,447 4,708,807 33,632,709 2011 23,605,422 5,948,685 4,917,591 34,471,698
Change2002-2011 57.0% 20.2% 139.5% 56.4%
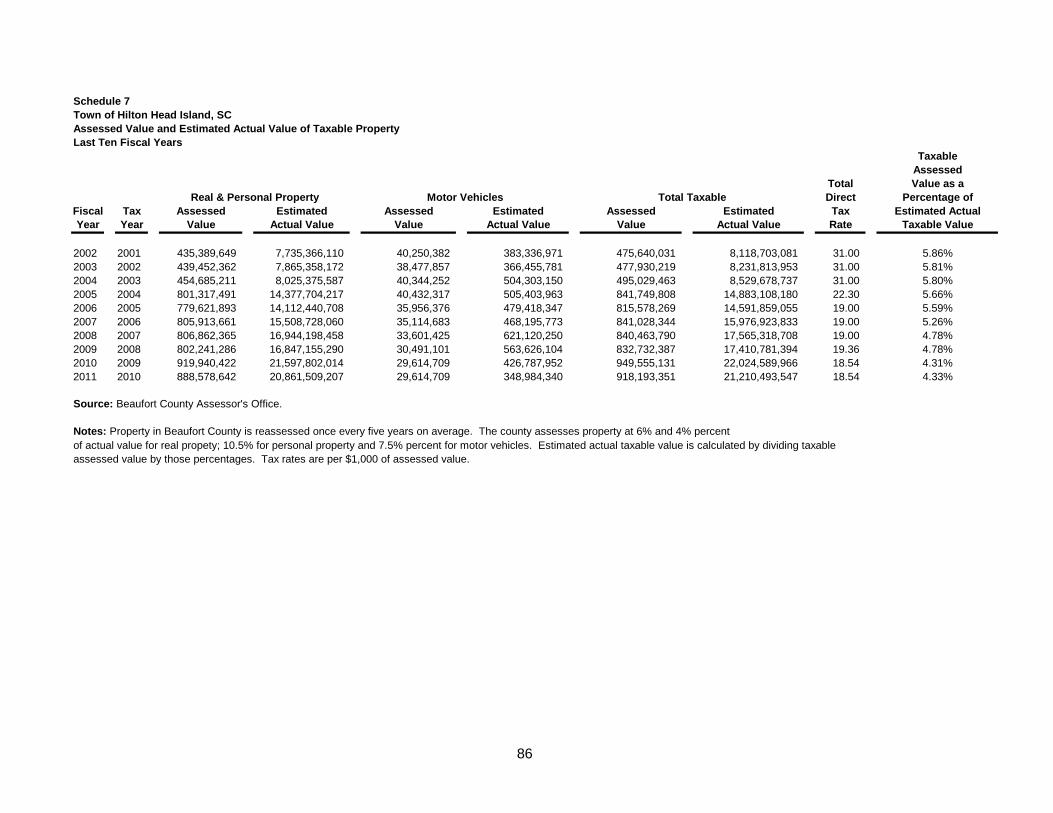
86
Schedule 7Town of Hilton Head Island, SCAssessed Value and Estimated Actual Value of Taxable PropertyLast Ten Fiscal Years
TaxableAssessed
Total Value as aReal & Personal Property Motor Vehicles Total Taxable Direct Percentage of
Fiscal Tax Assessed Estimated Assessed Estimated Assessed Estimated Tax Estimated ActualYear Year Value Actual Value Value Actual Value Value Actual Value Rate Taxable Value
2002 2001 435,389,649 7,735,366,110 40,250,382 383,336,971 475,640,031 8,118,703,081 31.00 5.86%2003 2002 439,452,362 7,865,358,172 38,477,857 366,455,781 477,930,219 8,231,813,953 31.00 5.81%2004 2003 454,685,211 8,025,375,587 40,344,252 504,303,150 495,029,463 8,529,678,737 31.00 5.80%2005 2004 801,317,491 14,377,704,217 40,432,317 505,403,963 841,749,808 14,883,108,180 22.30 5.66%2006 2005 779,621,893 14,112,440,708 35,956,376 479,418,347 815,578,269 14,591,859,055 19.00 5.59%2007 2006 805,913,661 15,508,728,060 35,114,683 468,195,773 841,028,344 15,976,923,833 19.00 5.26%2008 2007 806,862,365 16,944,198,458 33,601,425 621,120,250 840,463,790 17,565,318,708 19.00 4.78%2009 2008 802,241,286 16,847,155,290 30,491,101 563,626,104 832,732,387 17,410,781,394 19.36 4.78%2010 2009 919,940,422 21,597,802,014 29,614,709 426,787,952 949,555,131 22,024,589,966 18.54 4.31%2011 2010 888,578,642 20,861,509,207 29,614,709 348,984,340 918,193,351 21,210,493,547 18.54 4.33%
Source: Beaufort County Assessor's Office.
Notes: Property in Beaufort County is reassessed once every five years on average. The county assesses property at 6% and 4% percentof actual value for real propety; 10.5% for personal property and 7.5% percent for motor vehicles. Estimated actual taxable value is calculated by dividing taxableassessed value by those percentages. Tax rates are per $1,000 of assessed value.
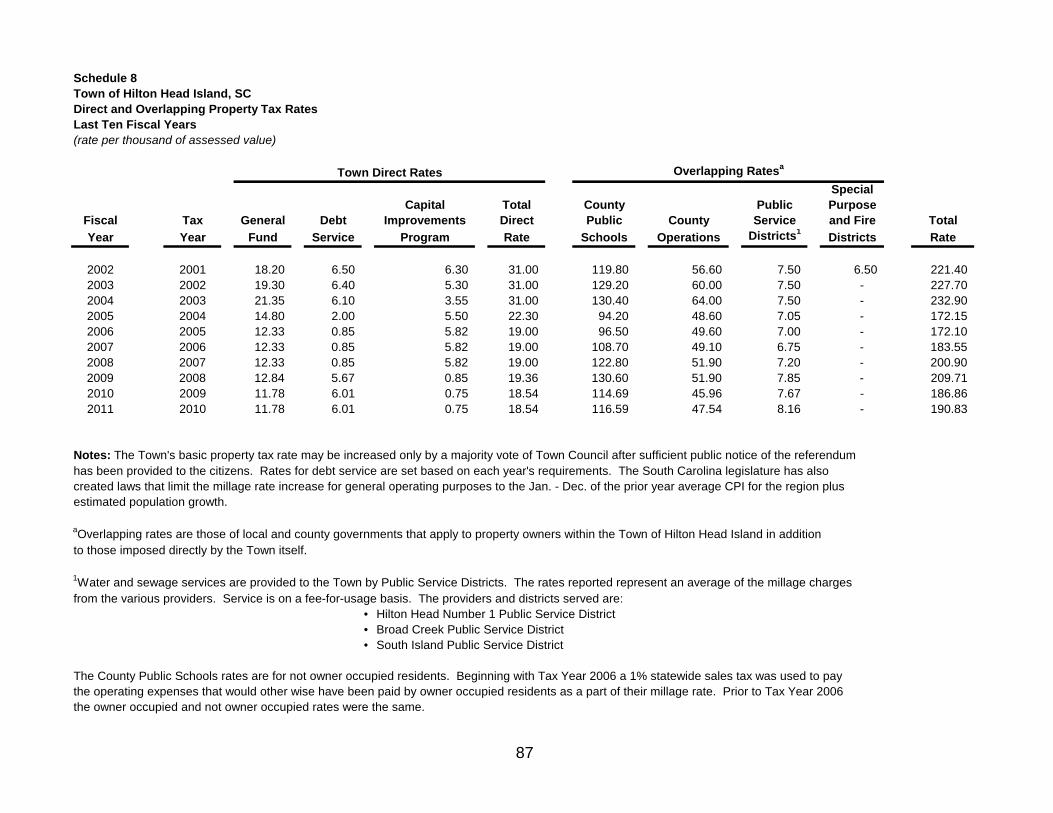
87
Schedule 8Town of Hilton Head Island, SCDirect and Overlapping Property Tax RatesLast Ten Fiscal Years(rate per thousand of assessed value)
Town Direct Rates Overlapping Ratesa
SpecialCapital Total County Public Purpose
Fiscal Tax General Debt Improvements Direct Public County Service and Fire TotalYear Year Fund Service Program Rate Schools Operations Districts1 Districts Rate
2002 2001 18.20 6.50 6.30 31.00 119.80 56.60 7.50 6.50 221.40 2003 2002 19.30 6.40 5.30 31.00 129.20 60.00 7.50 - 227.70 2004 2003 21.35 6.10 3.55 31.00 130.40 64.00 7.50 - 232.90 2005 2004 14.80 2.00 5.50 22.30 94.20 48.60 7.05 - 172.15 2006 2005 12.33 0.85 5.82 19.00 96.50 49.60 7.00 - 172.10 2007 2006 12.33 0.85 5.82 19.00 108.70 49.10 6.75 - 183.55 2008 2007 12.33 0.85 5.82 19.00 122.80 51.90 7.20 - 200.90 2009 2008 12.84 5.67 0.85 19.36 130.60 51.90 7.85 - 209.71 2010 2009 11.78 6.01 0.75 18.54 114.69 45.96 7.67 - 186.86 2011 2010 11.78 6.01 0.75 18.54 116.59 47.54 8.16 - 190.83
Notes: The Town's basic property tax rate may be increased only by a majority vote of Town Council after sufficient public notice of the referendumhas been provided to the citizens. Rates for debt service are set based on each year's requirements. The South Carolina legislature has alsocreated laws that limit the millage rate increase for general operating purposes to the Jan. - Dec. of the prior year average CPI for the region plusestimated population growth.
aOverlapping rates are those of local and county governments that apply to property owners within the Town of Hilton Head Island in additionto those imposed directly by the Town itself.
1Water and sewage services are provided to the Town by Public Service Districts. The rates reported represent an average of the millage chargesfrom the various providers. Service is on a fee-for-usage basis. The providers and districts served are:
• Hilton Head Number 1 Public Service District• Broad Creek Public Service District• South Island Public Service District
The County Public Schools rates are for not owner occupied residents. Beginning with Tax Year 2006 a 1% statewide sales tax was used to pay the operating expenses that would other wise have been paid by owner occupied residents as a part of their millage rate. Prior to Tax Year 2006the owner occupied and not owner occupied rates were the same.
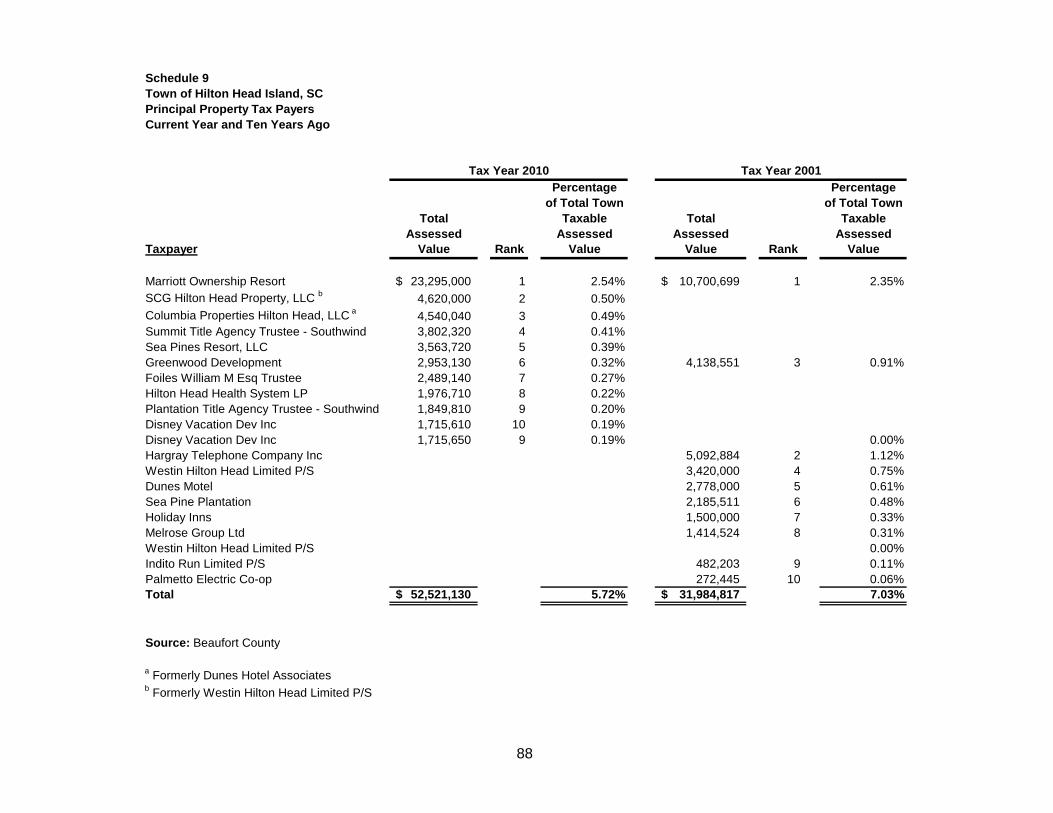
88
Schedule 9Town of Hilton Head Island, SCPrincipal Property Tax PayersCurrent Year and Ten Years Ago
Tax Year 2010 Tax Year 2001Percentage Percentage
of Total Town of Total TownTotal Taxable Total Taxable
Assessed Assessed Assessed AssessedTaxpayer Value Rank Value Value Rank Value
Marriott Ownership Resort 23,295,000$ 1 2.54% 10,700,699$ 1 2.35%SCG Hilton Head Property, LLC b 4,620,000 2 0.50%Columbia Properties Hilton Head, LLC a 4,540,040 3 0.49%Summit Title Agency Trustee - Southwind 3,802,320 4 0.41%Sea Pines Resort, LLC 3,563,720 5 0.39%Greenwood Development 2,953,130 6 0.32% 4,138,551 3 0.91%Foiles William M Esq Trustee 2,489,140 7 0.27%Hilton Head Health System LP 1,976,710 8 0.22%Plantation Title Agency Trustee - Southwind 1,849,810 9 0.20%Disney Vacation Dev Inc 1,715,610 10 0.19%Disney Vacation Dev Inc 1,715,650 9 0.19% 0.00%Hargray Telephone Company Inc 5,092,884 2 1.12%Westin Hilton Head Limited P/S 3,420,000 4 0.75%Dunes Motel 2,778,000 5 0.61%Sea Pine Plantation 2,185,511 6 0.48%Holiday Inns 1,500,000 7 0.33%Melrose Group Ltd 1,414,524 8 0.31%Westin Hilton Head Limited P/S 0.00%Indito Run Limited P/S 482,203 9 0.11%Palmetto Electric Co-op 272,445 10 0.06%Total 52,521,130$ 5.72% 31,984,817$ 7.03%
Source: Beaufort County
a Formerly Dunes Hotel Associatesb Formerly Westin Hilton Head Limited P/S
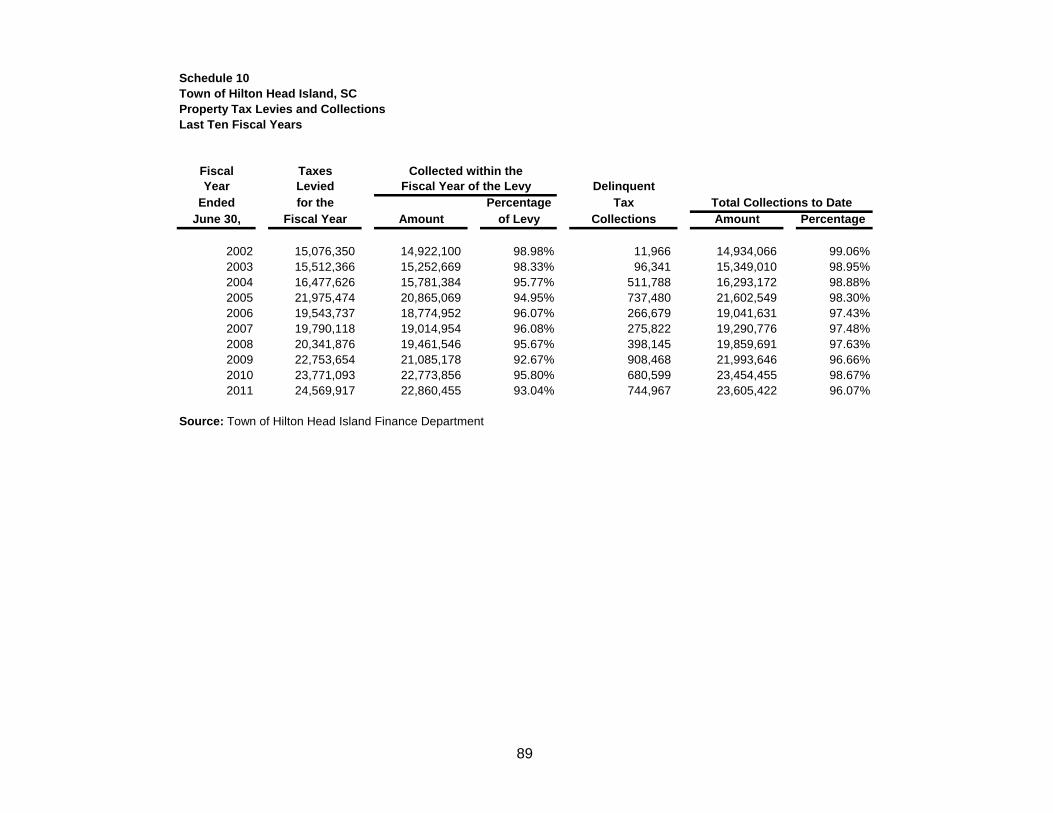
89
Schedule 10Town of Hilton Head Island, SCProperty Tax Levies and CollectionsLast Ten Fiscal Years
Fiscal Taxes Collected within theYear Levied Fiscal Year of the Levy Delinquent
Ended for the Percentage Tax Total Collections to DateJune 30, Fiscal Year Amount of Levy Collections Amount Percentage
2002 15,076,350 14,922,100 98.98% 11,966 14,934,066 99.06%2003 15,512,366 15,252,669 98.33% 96,341 15,349,010 98.95%2004 16,477,626 15,781,384 95.77% 511,788 16,293,172 98.88%2005 21,975,474 20,865,069 94.95% 737,480 21,602,549 98.30%2006 19,543,737 18,774,952 96.07% 266,679 19,041,631 97.43%2007 19,790,118 19,014,954 96.08% 275,822 19,290,776 97.48%2008 20,341,876 19,461,546 95.67% 398,145 19,859,691 97.63%2009 22,753,654 21,085,178 92.67% 908,468 21,993,646 96.66%2010 23,771,093 22,773,856 95.80% 680,599 23,454,455 98.67%2011 24,569,917 22,860,455 93.04% 744,967 23,605,422 96.07%
Source: Town of Hilton Head Island Finance Department
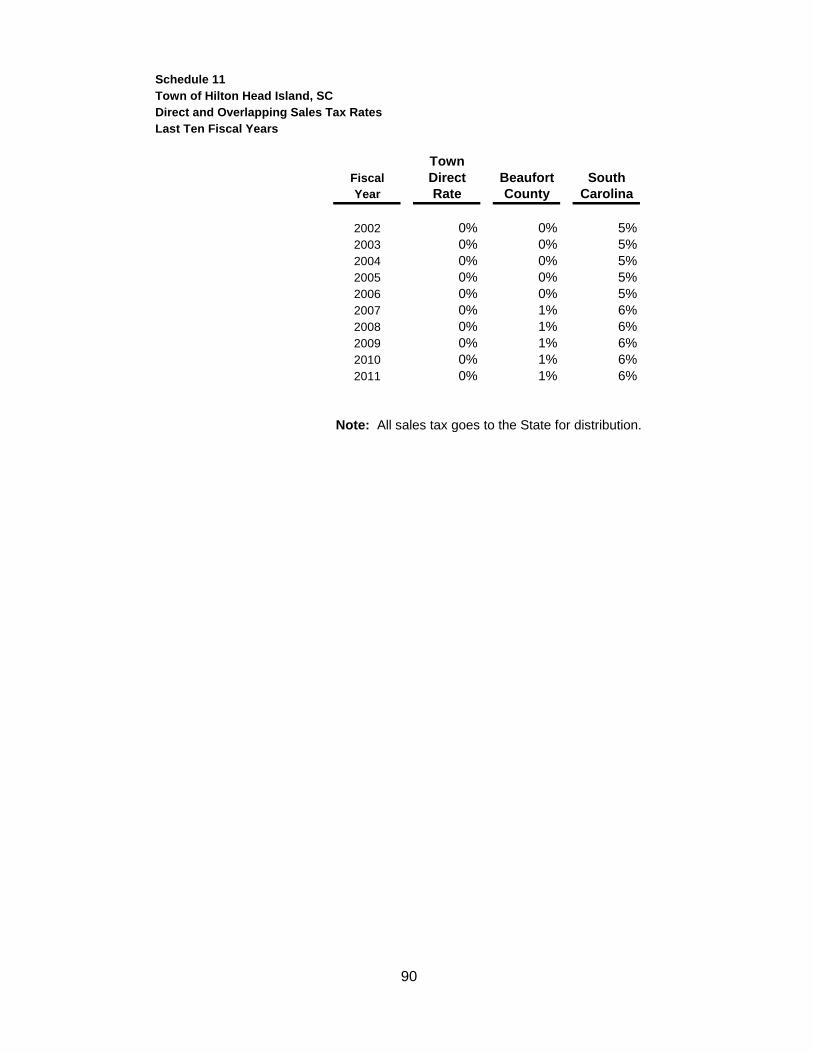
90
Schedule 11Town of Hilton Head Island, SCDirect and Overlapping Sales Tax RatesLast Ten Fiscal Years
TownFiscal Direct Beaufort SouthYear Rate County Carolina
2002 0% 0% 5%2003 0% 0% 5%2004 0% 0% 5%2005 0% 0% 5%2006 0% 0% 5%2007 0% 1% 6%2008 0% 1% 6%2009 0% 1% 6%2010 0% 1% 6%2011 0% 1% 6%
Note: All sales tax goes to the State for distribution.
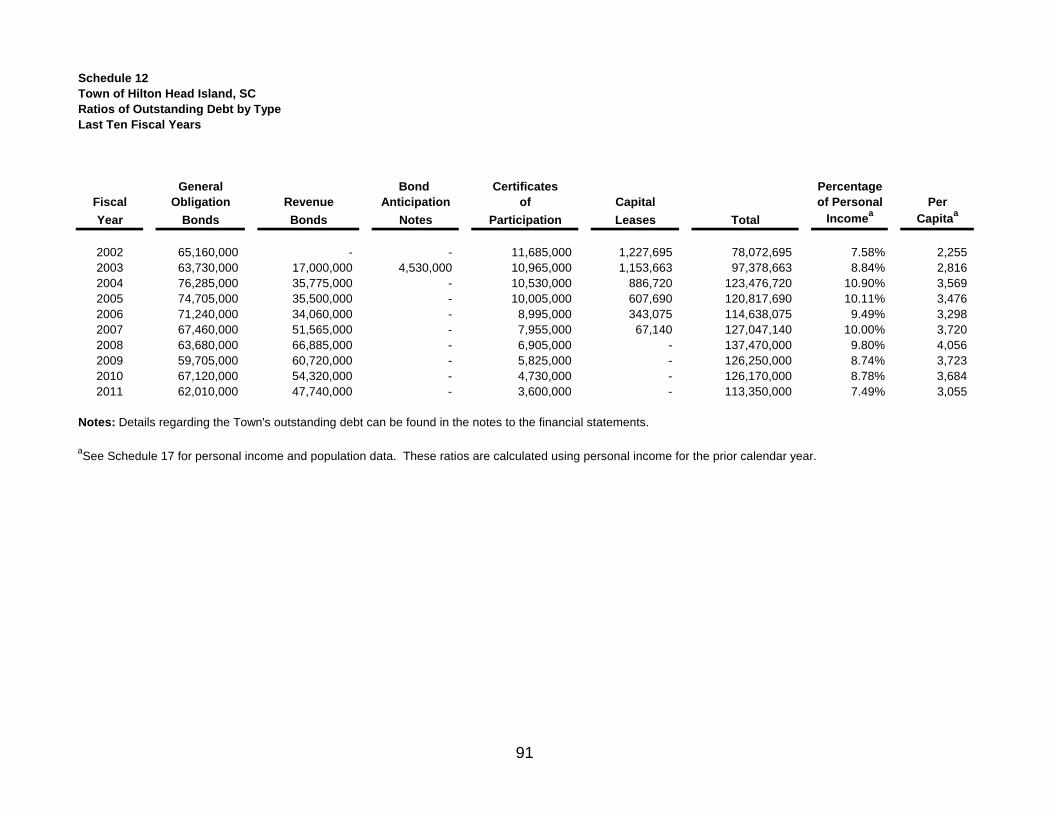
91
Schedule 12Town of Hilton Head Island, SCRatios of Outstanding Debt by TypeLast Ten Fiscal Years
General Bond Certificates PercentageFiscal Obligation Revenue Anticipation of Capital of Personal PerYear Bonds Bonds Notes Participation Leases Total Incomea Capitaa
2002 65,160,000 - - 11,685,000 1,227,695 78,072,695 7.58% 2,255 2003 63,730,000 17,000,000 4,530,000 10,965,000 1,153,663 97,378,663 8.84% 2,816 2004 76,285,000 35,775,000 - 10,530,000 886,720 123,476,720 10.90% 3,569 2005 74,705,000 35,500,000 - 10,005,000 607,690 120,817,690 10.11% 3,476 2006 71,240,000 34,060,000 - 8,995,000 343,075 114,638,075 9.49% 3,298 2007 67,460,000 51,565,000 - 7,955,000 67,140 127,047,140 10.00% 3,720 2008 63,680,000 66,885,000 - 6,905,000 - 137,470,000 9.80% 4,056 2009 59,705,000 60,720,000 - 5,825,000 - 126,250,000 8.74% 3,723 2010 67,120,000 54,320,000 - 4,730,000 - 126,170,000 8.78% 3,684 2011 62,010,000 47,740,000 - 3,600,000 - 113,350,000 7.49% 3,055
Notes: Details regarding the Town's outstanding debt can be found in the notes to the financial statements.
aSee Schedule 17 for personal income and population data. These ratios are calculated using personal income for the prior calendar year.
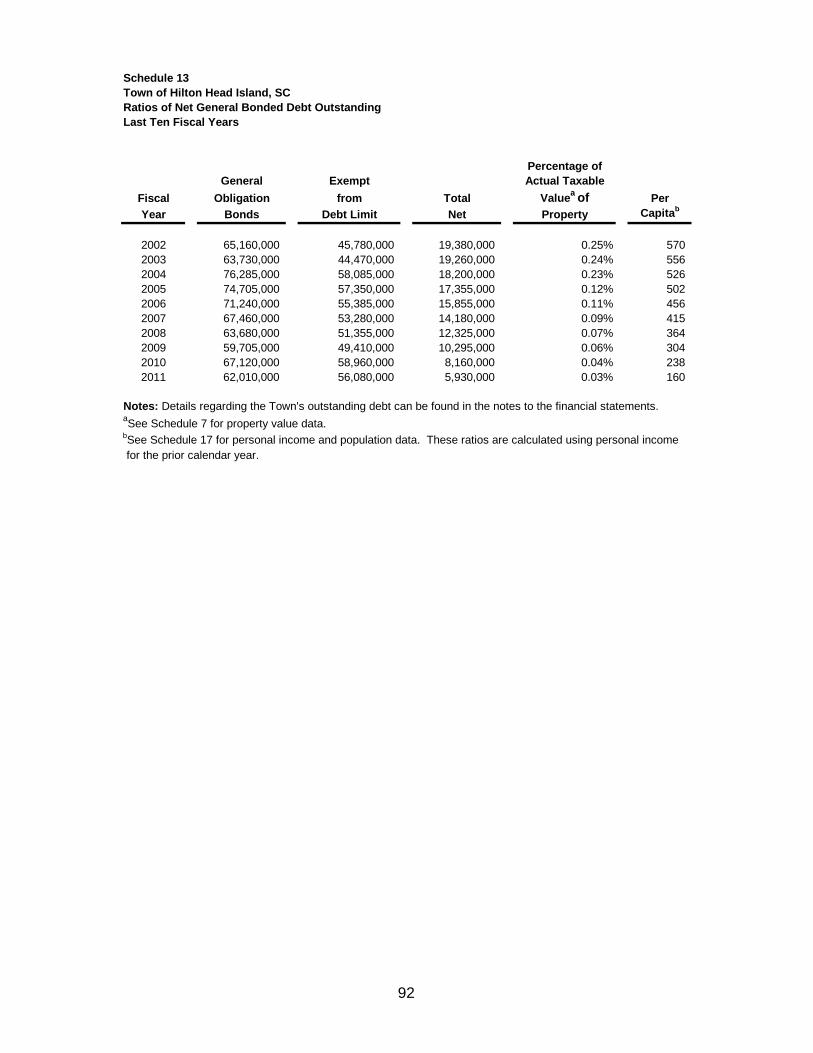
92
Schedule 13Town of Hilton Head Island, SCRatios of Net General Bonded Debt OutstandingLast Ten Fiscal Years
Percentage ofGeneral Exempt Actual Taxable
Fiscal Obligation from Total Valuea of PerYear Bonds Debt Limit Net Property Capitab
2002 65,160,000 45,780,000 19,380,000 0.25% 570 2003 63,730,000 44,470,000 19,260,000 0.24% 556 2004 76,285,000 58,085,000 18,200,000 0.23% 526 2005 74,705,000 57,350,000 17,355,000 0.12% 502 2006 71,240,000 55,385,000 15,855,000 0.11% 456 2007 67,460,000 53,280,000 14,180,000 0.09% 415 2008 63,680,000 51,355,000 12,325,000 0.07% 364 2009 59,705,000 49,410,000 10,295,000 0.06% 304 2010 67,120,000 58,960,000 8,160,000 0.04% 238 2011 62,010,000 56,080,000 5,930,000 0.03% 160
Notes: Details regarding the Town's outstanding debt can be found in the notes to the financial statements.aSee Schedule 7 for property value data.bSee Schedule 17 for personal income and population data. These ratios are calculated using personal income for the prior calendar year.
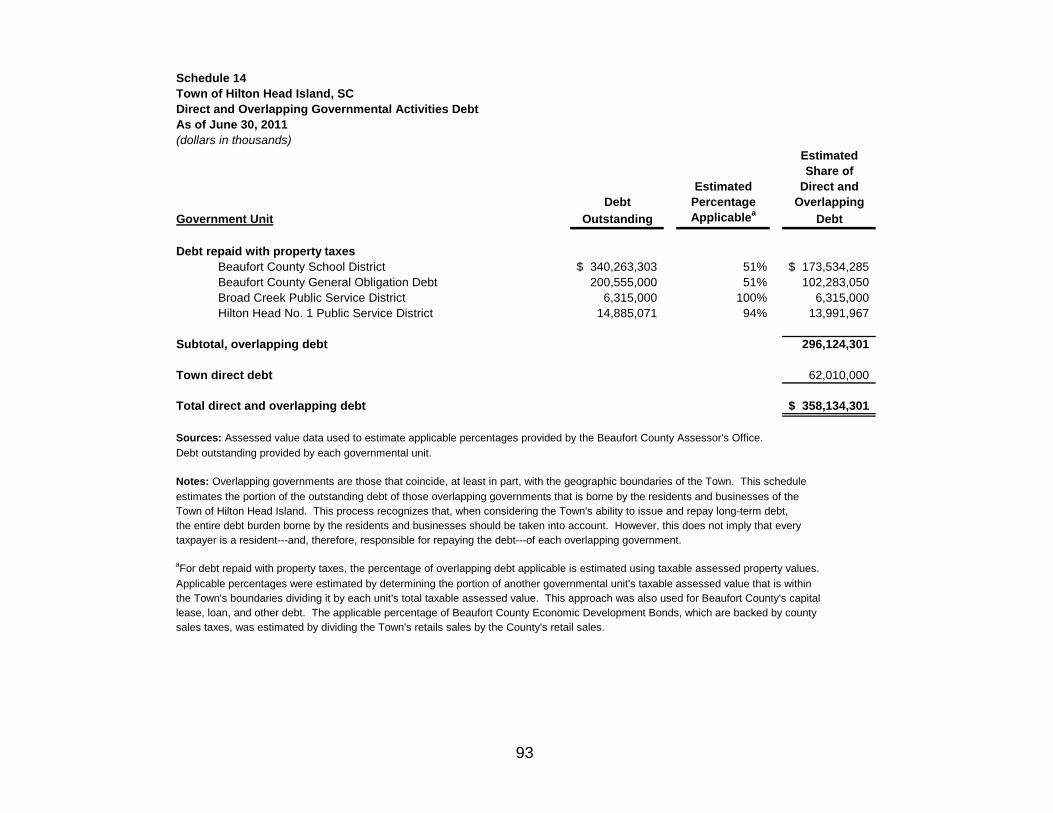
93
Schedule 14Town of Hilton Head Island, SCDirect and Overlapping Governmental Activities DebtAs of June 30, 2011(dollars in thousands)
EstimatedShare of
Estimated Direct andDebt Percentage Overlapping
Government Unit Outstanding Applicablea Debt
Debt repaid with property taxesBeaufort County School District 340,263,303$ 51% 173,534,285$ Beaufort County General Obligation Debt 200,555,000 51% 102,283,050 Broad Creek Public Service District 6,315,000 100% 6,315,000 Hilton Head No. 1 Public Service District 14,885,071 94% 13,991,967
Subtotal, overlapping debt 296,124,301
Town direct debt 62,010,000
Total direct and overlapping debt 358,134,301$
Sources: Assessed value data used to estimate applicable percentages provided by the Beaufort County Assessor's Office.Debt outstanding provided by each governmental unit.
Notes: Overlapping governments are those that coincide, at least in part, with the geographic boundaries of the Town. This scheduleestimates the portion of the outstanding debt of those overlapping governments that is borne by the residents and businesses of the Town of Hilton Head Island. This process recognizes that, when considering the Town's ability to issue and repay long-term debt,the entire debt burden borne by the residents and businesses should be taken into account. However, this does not imply that everytaxpayer is a resident---and, therefore, responsible for repaying the debt---of each overlapping government.
aFor debt repaid with property taxes, the percentage of overlapping debt applicable is estimated using taxable assessed property values.Applicable percentages were estimated by determining the portion of another governmental unit's taxable assessed value that is withinthe Town's boundaries dividing it by each unit's total taxable assessed value. This approach was also used for Beaufort County's capitallease, loan, and other debt. The applicable percentage of Beaufort County Economic Development Bonds, which are backed by countysales taxes, was estimated by dividing the Town's retails sales by the County's retail sales.
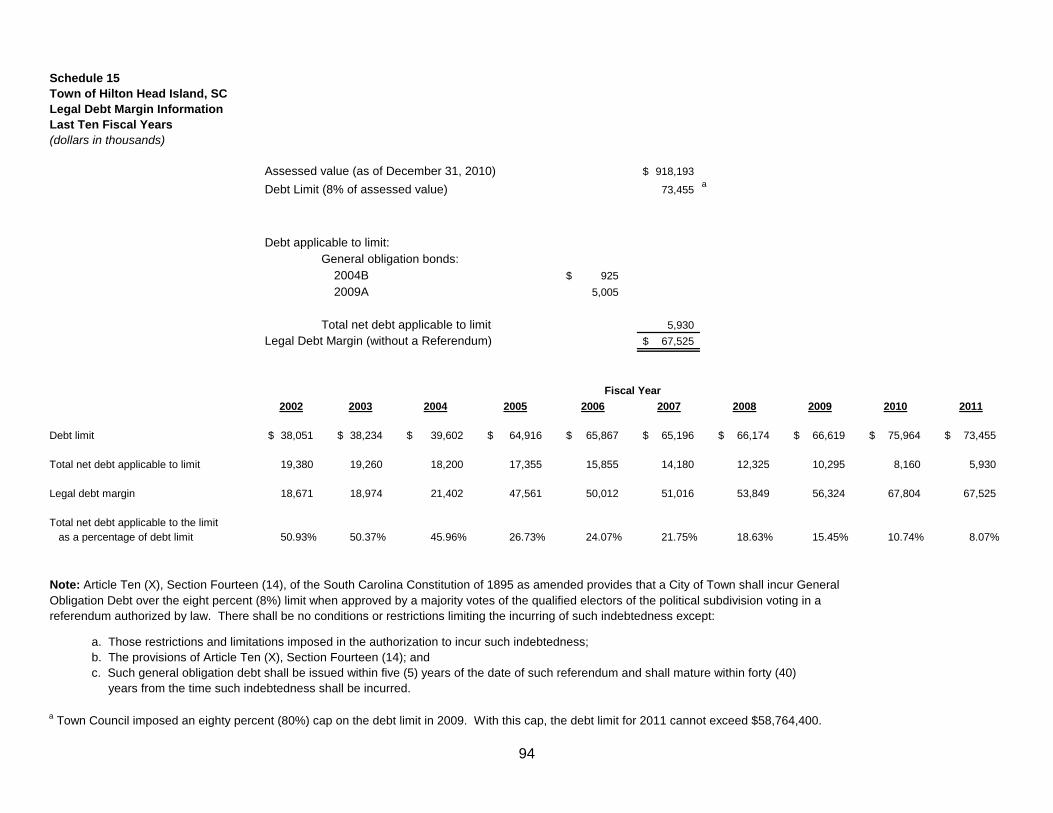
94
Schedule 15Town of Hilton Head Island, SCLegal Debt Margin InformationLast Ten Fiscal Years(dollars in thousands)
Assessed value (as of December 31, 2010) 918,193$
Debt Limit (8% of assessed value) 73,455 a
Debt applicable to limit:General obligation bonds:
2004B 925$ 2009A 5,005
Total net debt applicable to limit 5,930 Legal Debt Margin (without a Referendum) 67,525$
2002 2003 2004 2005 2006 2007 2008 2009 2010 2011
Debt limit 38,051$ 38,234$ 39,602$ 64,916$ 65,867$ 65,196$ 66,174$ 66,619$ 75,964$ 73,455$
Total net debt applicable to limit 19,380 19,260 18,200 17,355 15,855 14,180 12,325 10,295 8,160 5,930
Legal debt margin 18,671 18,974 21,402 47,561 50,012 51,016 53,849 56,324 67,804 67,525
Total net debt applicable to the limit as a percentage of debt limit 50.93% 50.37% 45.96% 26.73% 24.07% 21.75% 18.63% 15.45% 10.74% 8.07%
Note: Article Ten (X), Section Fourteen (14), of the South Carolina Constitution of 1895 as amended provides that a City of Town shall incur GeneralObligation Debt over the eight percent (8%) limit when approved by a majority votes of the qualified electors of the political subdivision voting in a referendum authorized by law. There shall be no conditions or restrictions limiting the incurring of such indebtedness except:
a. Those restrictions and limitations imposed in the authorization to incur such indebtedness;b. The provisions of Article Ten (X), Section Fourteen (14); andc. Such general obligation debt shall be issued within five (5) years of the date of such referendum and shall mature within forty (40) years from the time such indebtedness shall be incurred.
a Town Council imposed an eighty percent (80%) cap on the debt limit in 2009. With this cap, the debt limit for 2011 cannot exceed $58,764,400.
Fiscal Year
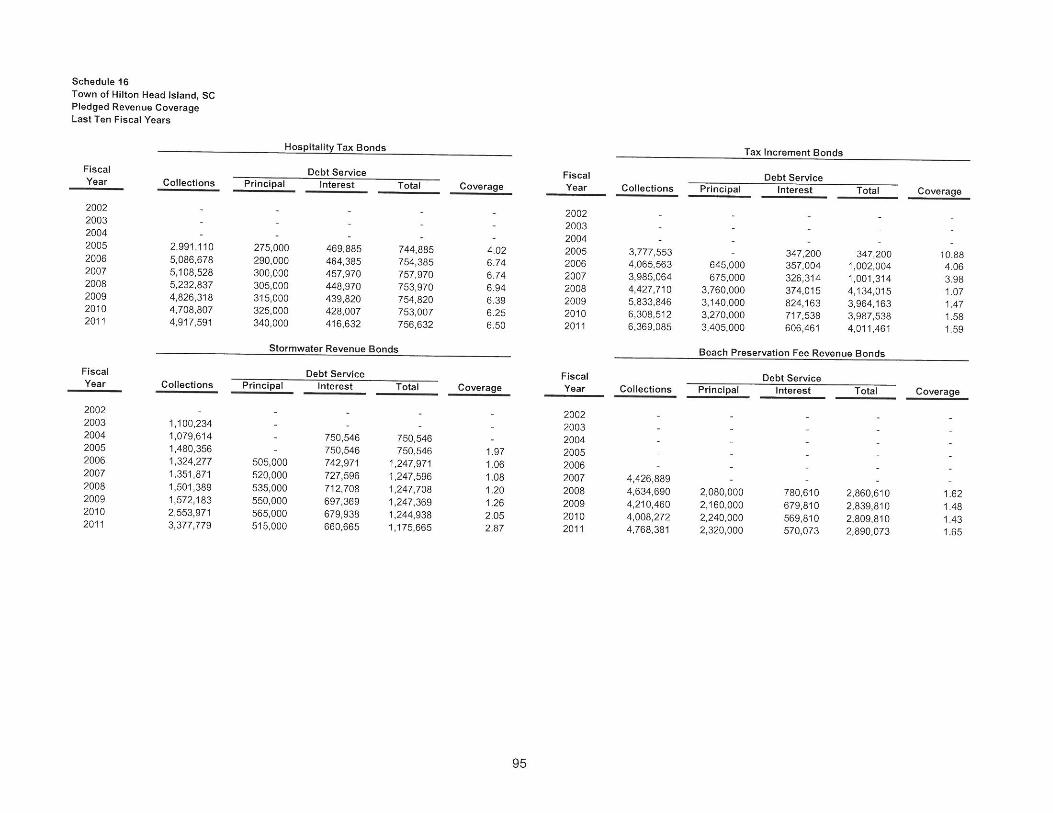
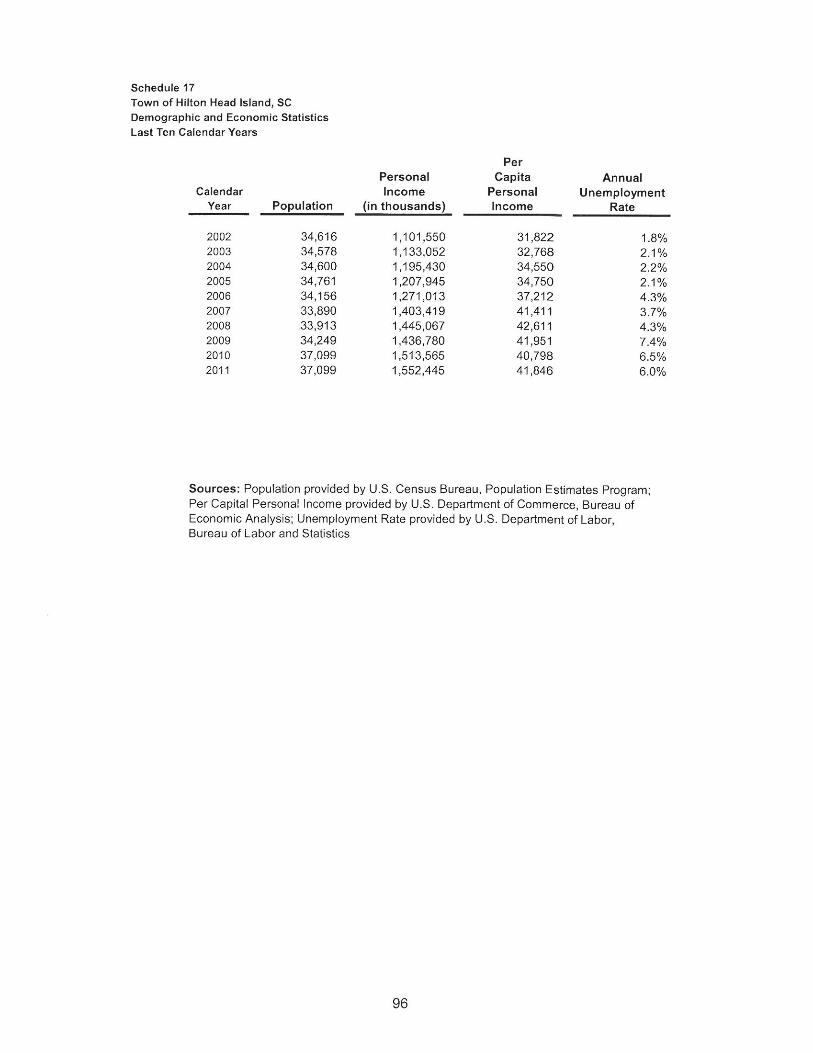
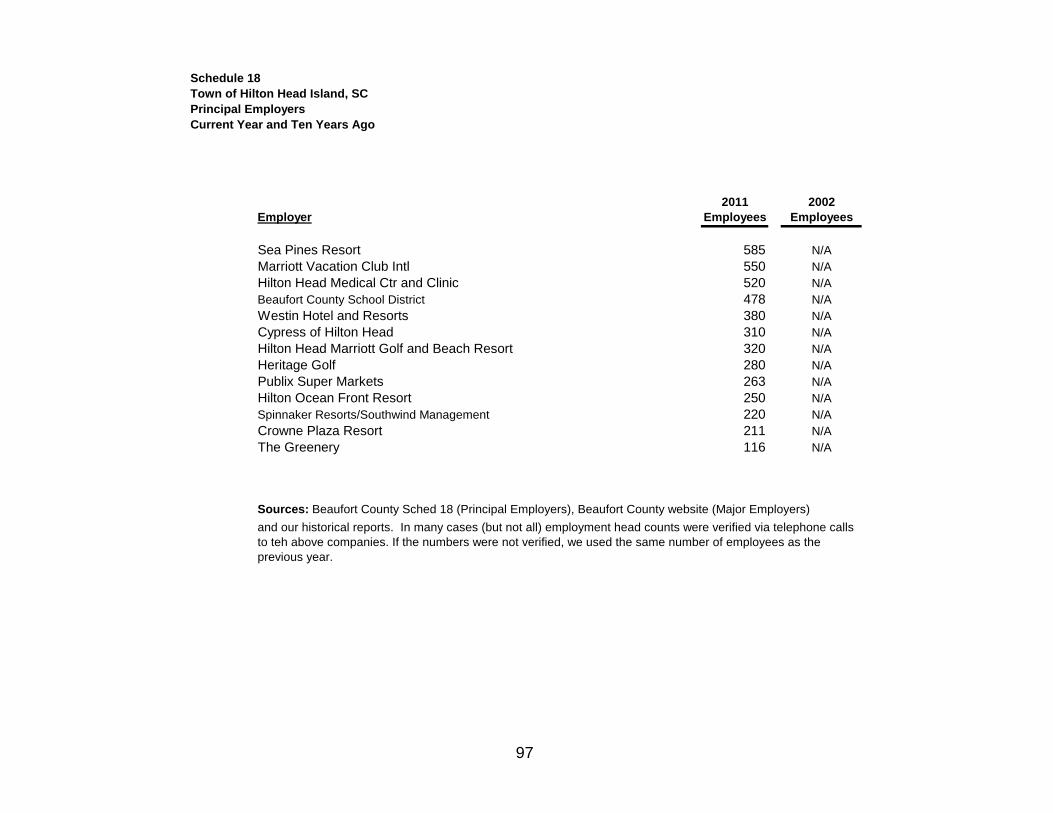
97
Schedule 18Town of Hilton Head Island, SCPrincipal EmployersCurrent Year and Ten Years Ago
2011 2002Employer Employees Employees
Sea Pines Resort 585 N/AMarriott Vacation Club Intl 550 N/AHilton Head Medical Ctr and Clinic 520 N/ABeaufort County School District 478 N/AWestin Hotel and Resorts 380 N/ACypress of Hilton Head 310 N/AHilton Head Marriott Golf and Beach Resort 320 N/AHeritage Golf 280 N/APublix Super Markets 263 N/AHilton Ocean Front Resort 250 N/ASpinnaker Resorts/Southwind Management 220 N/ACrowne Plaza Resort 211 N/AThe Greenery 116 N/A
Sources: Beaufort County Sched 18 (Principal Employers), Beaufort County website (Major Employers)and our historical reports. In many cases (but not all) employment head counts were verified via telephone calls to teh above companies. If the numbers were not verified, we used the same number of employees as the previous year.
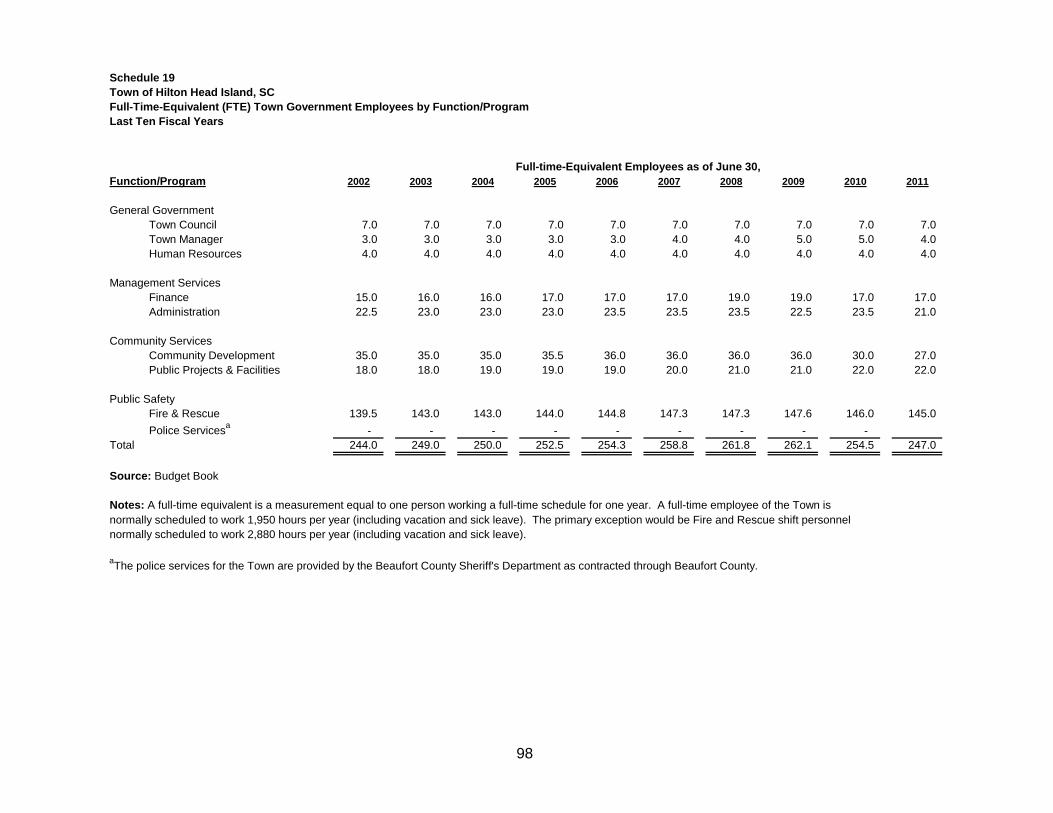
98
Schedule 19Town of Hilton Head Island, SCFull-Time-Equivalent (FTE) Town Government Employees by Function/ProgramLast Ten Fiscal Years
Function/Program 2002 2003 2004 2005 2006 2007 2008 2009 2010 2011
General GovernmentTown Council 7.0 7.0 7.0 7.0 7.0 7.0 7.0 7.0 7.0 7.0 Town Manager 3.0 3.0 3.0 3.0 3.0 4.0 4.0 5.0 5.0 4.0 Human Resources 4.0 4.0 4.0 4.0 4.0 4.0 4.0 4.0 4.0 4.0
Management ServicesFinance 15.0 16.0 16.0 17.0 17.0 17.0 19.0 19.0 17.0 17.0 Administration 22.5 23.0 23.0 23.0 23.5 23.5 23.5 22.5 23.5 21.0
Community ServicesCommunity Development 35.0 35.0 35.0 35.5 36.0 36.0 36.0 36.0 30.0 27.0 Public Projects & Facilities 18.0 18.0 19.0 19.0 19.0 20.0 21.0 21.0 22.0 22.0
Public SafetyFire & Rescue 139.5 143.0 143.0 144.0 144.8 147.3 147.3 147.6 146.0 145.0 Police Servicesa - - - - - - - - -
Total 244.0 249.0 250.0 252.5 254.3 258.8 261.8 262.1 254.5 247.0
Source: Budget Book
Notes: A full-time equivalent is a measurement equal to one person working a full-time schedule for one year. A full-time employee of the Town is normally scheduled to work 1,950 hours per year (including vacation and sick leave). The primary exception would be Fire and Rescue shift personnelnormally scheduled to work 2,880 hours per year (including vacation and sick leave).
aThe police services for the Town are provided by the Beaufort County Sheriff's Department as contracted through Beaufort County.
Full-time-Equivalent Employees as of June 30,
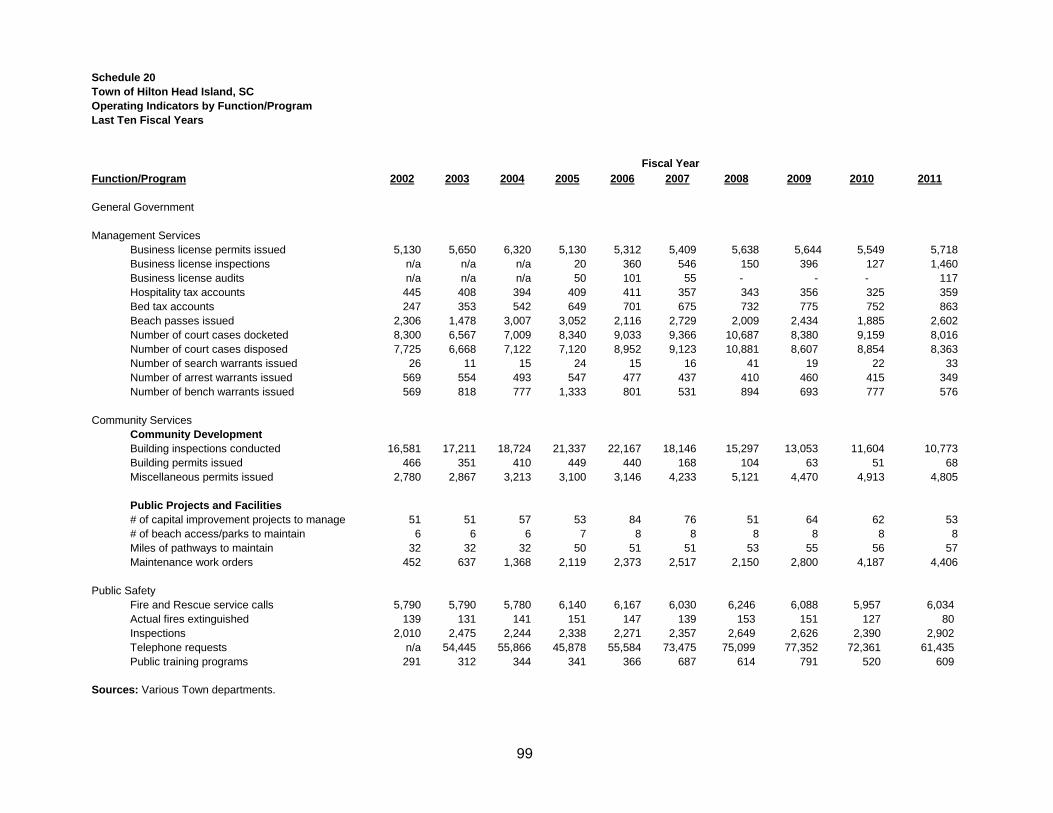
99
Schedule 20Town of Hilton Head Island, SCOperating Indicators by Function/ProgramLast Ten Fiscal Years
Function/Program 2002 2003 2004 2005 2006 2007 2008 2009 2010 2011
General Government
Management ServicesBusiness license permits issued 5,130 5,650 6,320 5,130 5,312 5,409 5,638 5,644 5,549 5,718Business license inspections n/a n/a n/a 20 360 546 150 396 127 1,460Business license audits n/a n/a n/a 50 101 55 - - - 117Hospitality tax accounts 445 408 394 409 411 357 343 356 325 359Bed tax accounts 247 353 542 649 701 675 732 775 752 863Beach passes issued 2,306 1,478 3,007 3,052 2,116 2,729 2,009 2,434 1,885 2,602Number of court cases docketed 8,300 6,567 7,009 8,340 9,033 9,366 10,687 8,380 9,159 8,016Number of court cases disposed 7,725 6,668 7,122 7,120 8,952 9,123 10,881 8,607 8,854 8,363Number of search warrants issued 26 11 15 24 15 16 41 19 22 33Number of arrest warrants issued 569 554 493 547 477 437 410 460 415 349Number of bench warrants issued 569 818 777 1,333 801 531 894 693 777 576
Community ServicesCommunity DevelopmentBuilding inspections conducted 16,581 17,211 18,724 21,337 22,167 18,146 15,297 13,053 11,604 10,773Building permits issued 466 351 410 449 440 168 104 63 51 68Miscellaneous permits issued 2,780 2,867 3,213 3,100 3,146 4,233 5,121 4,470 4,913 4,805
Public Projects and Facilities# of capital improvement projects to manage 51 51 57 53 84 76 51 64 62 53# of beach access/parks to maintain 6 6 6 7 8 8 8 8 8 8Miles of pathways to maintain 32 32 32 50 51 51 53 55 56 57Maintenance work orders 452 637 1,368 2,119 2,373 2,517 2,150 2,800 4,187 4,406
Public SafetyFire and Rescue service calls 5,790 5,790 5,780 6,140 6,167 6,030 6,246 6,088 5,957 6,034 Actual fires extinguished 139 131 141 151 147 139 153 151 127 80 Inspections 2,010 2,475 2,244 2,338 2,271 2,357 2,649 2,626 2,390 2,902 Telephone requests n/a 54,445 55,866 45,878 55,584 73,475 75,099 77,352 72,361 61,435 Public training programs 291 312 344 341 366 687 614 791 520 609
Sources: Various Town departments.
Fiscal Year
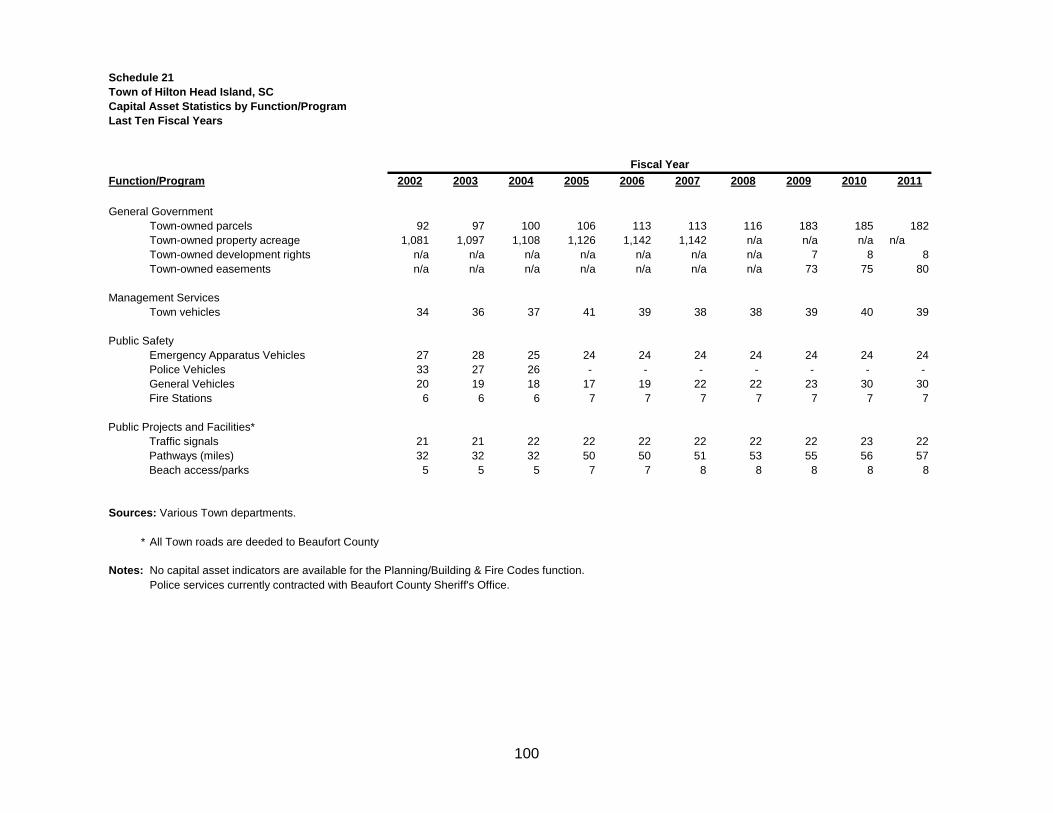
100
Schedule 21Town of Hilton Head Island, SCCapital Asset Statistics by Function/ProgramLast Ten Fiscal Years
Function/Program 2002 2003 2004 2005 2006 2007 2008 2009 2010 2011
General GovernmentTown-owned parcels 92 97 100 106 113 113 116 183 185 182Town-owned property acreage 1,081 1,097 1,108 1,126 1,142 1,142 n/a n/a n/a n/aTown-owned development rights n/a n/a n/a n/a n/a n/a n/a 7 8 8Town-owned easements n/a n/a n/a n/a n/a n/a n/a 73 75 80
Management ServicesTown vehicles 34 36 37 41 39 38 38 39 40 39
Public SafetyEmergency Apparatus Vehicles 27 28 25 24 24 24 24 24 24 24Police Vehicles 33 27 26 - - - - - - -General Vehicles 20 19 18 17 19 22 22 23 30 30Fire Stations 6 6 6 7 7 7 7 7 7 7
Public Projects and Facilities*Traffic signals 21 21 22 22 22 22 22 22 23 22Pathways (miles) 32 32 32 50 50 51 53 55 56 57Beach access/parks 5 5 5 7 7 8 8 8 8 8
Sources: Various Town departments.
* All Town roads are deeded to Beaufort County
Notes: No capital asset indicators are available for the Planning/Building & Fire Codes function. Police services currently contracted with Beaufort County Sheriff's Office.
Fiscal Year
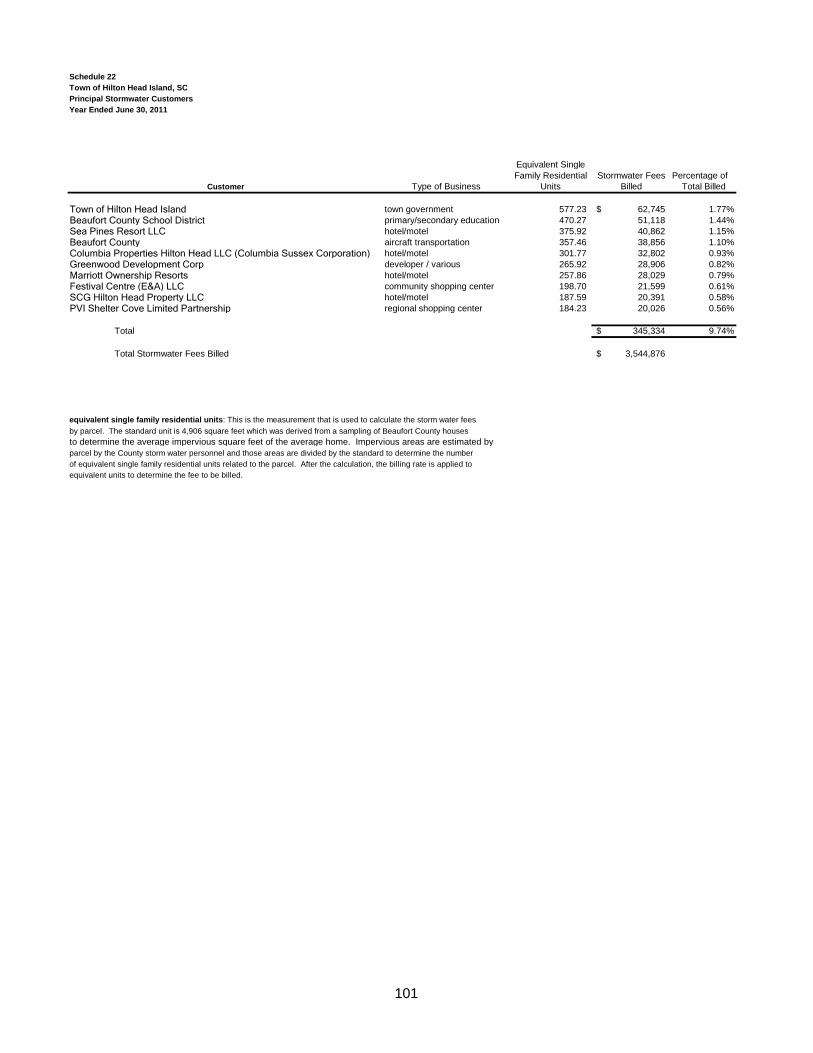
101
Schedule 22Town of Hilton Head Island, SCPrincipal Stormwater CustomersYear Ended June 30, 2011
Equivalent SingleFamily Residential Stormwater Fees Percentage of
Units Billed Total Billed
Town of Hilton Head Island town government 577.23 62,745$ 1.77%Beaufort County School District primary/secondary education 470.27 51,118 1.44%Sea Pines Resort LLC hotel/motel 375.92 40,862 1.15%Beaufort County aircraft transportation 357.46 38,856 1.10%Columbia Properties Hilton Head LLC (Columbia Sussex Corporation) hotel/motel 301.77 32,802 0.93%Greenwood Development Corp developer / various 265.92 28,906 0.82%Marriott Ownership Resorts hotel/motel 257.86 28,029 0.79%Festival Centre (E&A) LLC community shopping center 198.70 21,599 0.61%SCG Hilton Head Property LLC hotel/motel 187.59 20,391 0.58%PVI Shelter Cove Limited Partnership regional shopping center 184.23 20,026 0.56%
Total 345,334$ 9.74%
Total Stormwater Fees Billed 3,544,876$
equivalent single family residential units: This is the measurement that is used to calculate the storm water feesby parcel. The standard unit is 4,906 square feet which was derived from a sampling of Beaufort County housesto determine the average impervious square feet of the average home. Impervious areas are estimated by parcel by the County storm water personnel and those areas are divided by the standard to determine the numberof equivalent single family residential units related to the parcel. After the calculation, the billing rate is applied to equivalent units to determine the fee to be billed.
Customer Type of Business

Supplemental Financial Information
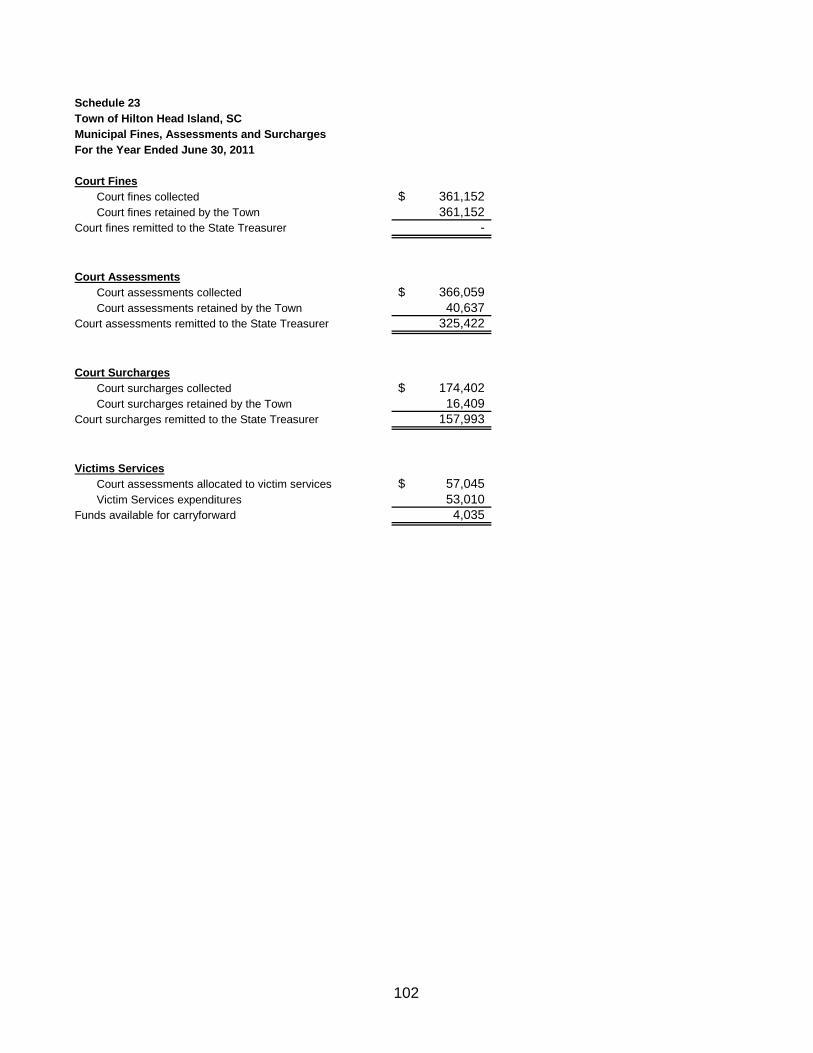
102
Schedule 23Town of Hilton Head Island, SCMunicipal Fines, Assessments and SurchargesFor the Year Ended June 30, 2011
Court FinesCourt fines collected 361,152$ Court fines retained by the Town 361,152
Court fines remitted to the State Treasurer -
Court AssessmentsCourt assessments collected 366,059$ Court assessments retained by the Town 40,637
Court assessments remitted to the State Treasurer 325,422
Court SurchargesCourt surcharges collected 174,402$ Court surcharges retained by the Town 16,409
Court surcharges remitted to the State Treasurer 157,993
Victims ServicesCourt assessments allocated to victim services 57,045$ Victim Services expenditures 53,010
Funds available for carryforward 4,035