Embed Size (px)
Citation preview
www.greenpeace.org/india
Report produced by Greenpeace India Society, August 2012
Written by Grace Boyle, Jai krishna R, Lauri Myllyvirta, Owen Pascoe
Case studies written by Grace Boyle
Photography by Vivek Mutharamalingam, Sudhanshu Malhotra & Pravin Raut
Photo Editing by Sudhanshu Malhotra
Thanks and acknowledgments: Shripad Dharmadhikary, Suresh Pandurang Lule, Gopu Pimplapure and Ujwal Khopkar, Sanjay Kohle and Family, Nandu Kherde and Family, Resources and Livelihoods Group, Prayas.
Contact: Jaikrishna R at [email protected]
Design: Shagun Mitra
Cover image: The right bank canal of Bawanthadi Dam in Bhandara district, Vidarbha.The dam is yet to be commissioned.
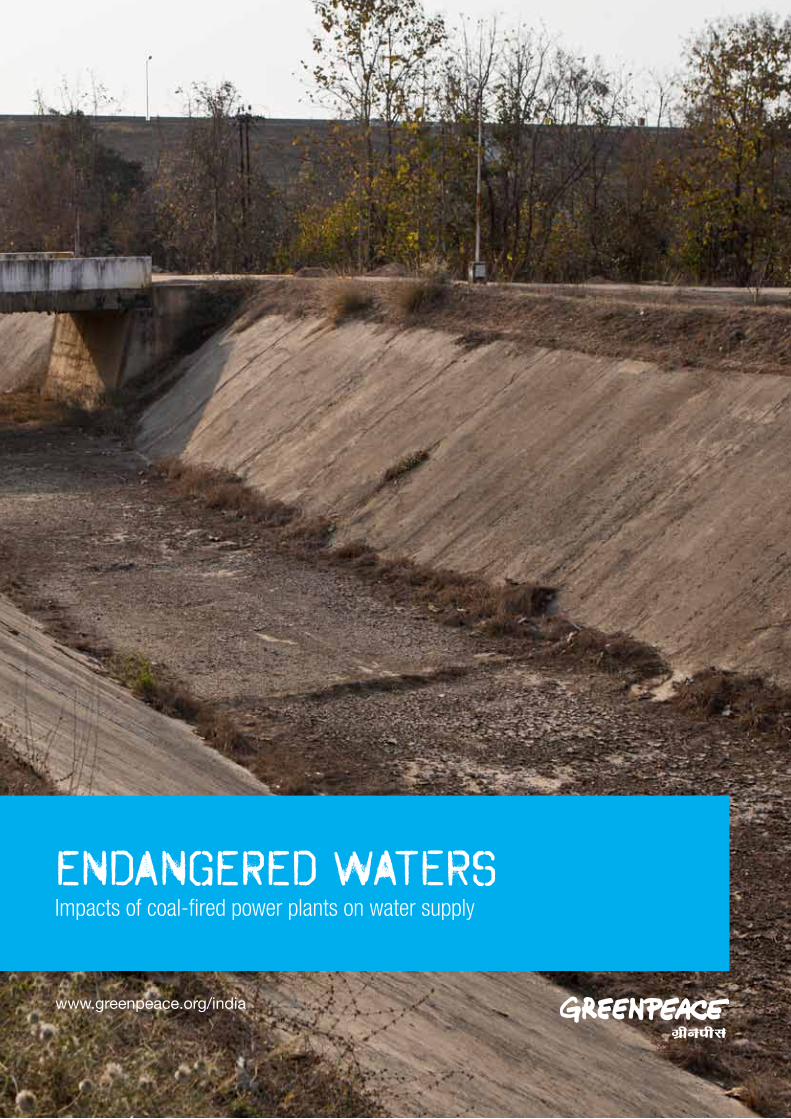
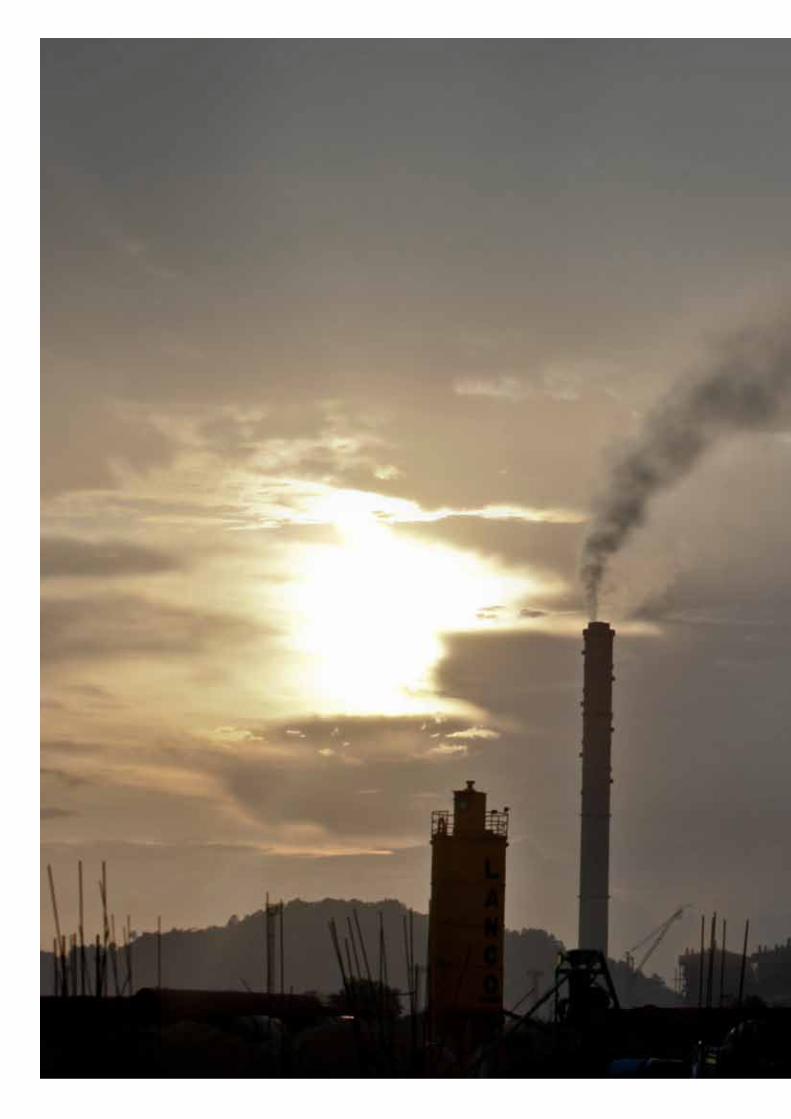
Image: Anpara thermal power plant on the outskirts of Dibulganj, Uttar Pradesh
Printed on 100% recycled paper.
ContentsList of tablesList of figuresExecutive summary
1. Introduction 2. The thirst for thermal power 2.1 Consumption of water by coal power plants 2.1.2 Factors affecting water consumption 2.1.3 How much water is consumed? 2.2 India’s thermal power boom 2.2.1 Encouraging private investment 2.3 Clusters of power plants2.4 The Draft National Water Policy
3. Water conflict: coal plants vs. agriculture3.1 Vidarbha in context3.2 Seventy-one thermal power plants in Vidarbha3.2.2 Low water efficiency3.3 Development and irrigation backlogs in Vidarbha3.4 Farmer suicides and relief packages3.5 Maharashtra water policy and the diversion of irrigation water
4. Water availability in river Wardha: new study by IIT Delhi4.1 Weather and land data4.2 Flow measurements4.3 Virgin, present and future scenarios4.4 Results of the study
5. Case studies from Amravati district, Maharashtra
6. Risks for investors and national energy security6.1 Physical water risk6.2 Regulatory risk6.3 Political risk6.4 Risk to reputation
7. A twin solution to water and climate crises: the Energy [R]evolution scenario
8. Recommendations and demands
9. References
010203
050707080811121315
16171821263335
3737373738
43
5555575757
58
65
67
Comparative water consumption by typical sub-critical coal plants in India and Australia 11
Table 1
LIST OF TABLES
Approvals for coal-based thermal power projects granted and pending by the Maharashtra state government as of December 2010 21
Table 2
Rates of water consumption for thermal power projects granted environmental clearance in Vidarbha as of December 2010 21
Table 3
Sectoral backlog in Maharashtra from 1982-1994 29
Table 4
Regional backlog in Maharashtra from 1982-1994 29
Table 5
Regional backlog in irrigation sector from 1982-2007 30
Table 6
Suicides in the six worst-hit districts of Vidarbha from 2001-2010 34
Table 7
Diversions of irrigation water for use by thermal power plants dams in Vidarbha between 2003 and January 2011 36
Table 8
Water requirements of present and future reservoirs on the river Wardha included in the IIT study 38
Table 9
Annual mean flow of river Wardha in million cubic metres across three scenarios, as simulated under SWAT 42
Table 10
Simulated monthly flows of river Wardha under present conditions for two time horizons, in million cubic metres 42
Table 11
Endangered WatersGreenpeace India
01
lIST OF FIGURES
Endangered WatersGreenpeace India
02
Typical water consumption by a coal-based power plant in India 07
Figure 1
Map of coal-fired power plant clusters in India 14
Figure 2
Map of Vidarbha region in Maharashtra 16
Figure 3
Proposed and approved thermal power plants in Vidarbha 19
Figure 4
Graph of regional backlog in the irrigation sector in Maharashtra from 1982–2007 33
Figure 5
Monthly outflow variation for the Wardha sub-basin in virgin, present and future scenarios 38
Figure 6
Command areas of Upper Wardha and Lower Wardha dams, Vidarbha 43
Figure 7
Water consumption of different power generation technologies 58
Figure 9
Water requirements for thermal power generation and associated coal mining in three scenarios 61
Figure 10
India’s electricity generation structure in the reference and Energy [R]evolution scenarios 62
Figure 11
Electricity supply costs in the reference and Energy [R]evolution scenarios 64
Figure 12
Development of CO2 emissions from India’s energy sector in the reference and Energy [R]evolution scenarios 64
Figure 13
Annual mean flow of river Wardha including future reservoirs 56
Figure 8
Endangered WatersGreenpeace India
03
Executive Summary
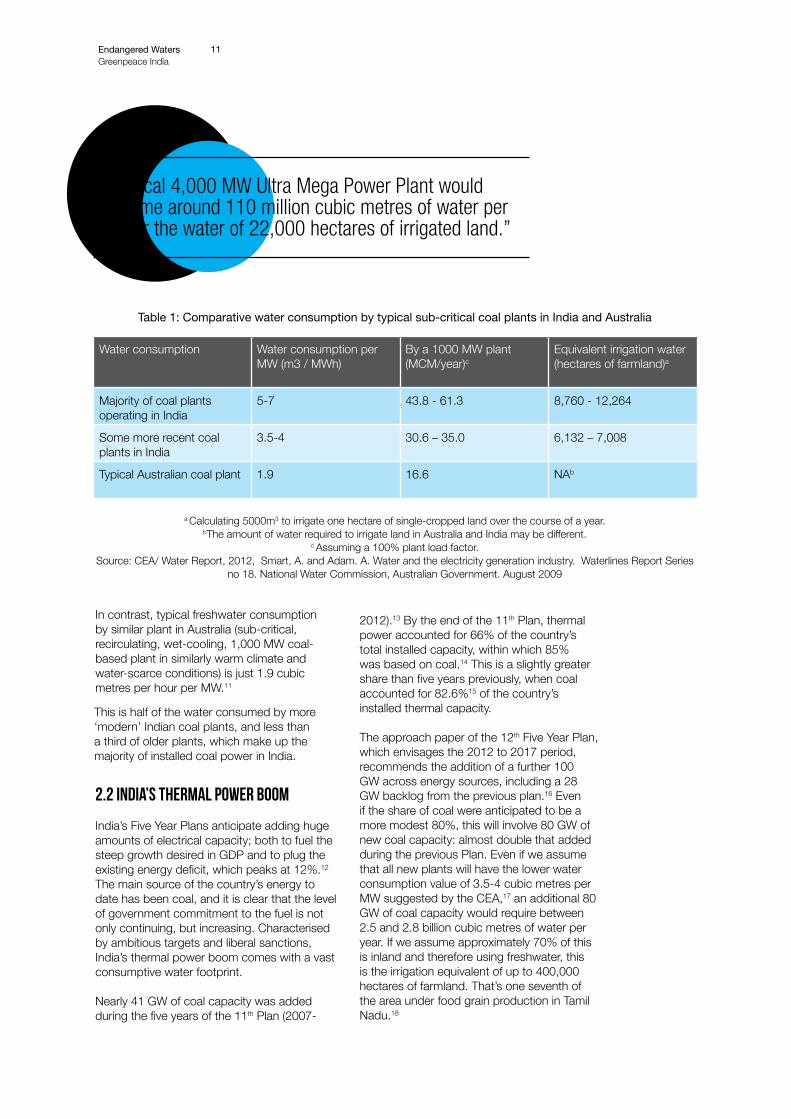
Coal-based thermal power is an extremely water-intensive way to generate energy. The CEA writes that a typical coal plant operating in India consumes 5-7 cubic metres of water per MW per hour; some more recent plants will use 3.5-4 cubic metres of water per MW per hour. In contrast, a similar plant in Australia typically consumes just 1.9 cubic metres per MW per hour.
In the last 20 years, India’s power generation has tripled and the water requirements for power generation more than doubled. India now aims to add 100 GW of new capacity in the 12th Plan period, which at an 80% coal share will consume at least another 2,500 – 2,800 million cubic metres of water per year. Assuming 70% will be inland, this is the equivalent irrigation water of up to 400,000 hectares of farmland.
Such rapid expansion is due in part to increasing private investment in the power sector, encouraged by the government since 1991 and expected to increase from 33% to 50% over the course of the 12th Plan period. The 4,000 MW Ultra Mega Power Projects awarded to the private sector via bidding may each typically consume around 110 million cubic metres of water per year.
The new power plants are coming up in clusters; inland clusters will use only freshwater from rivers and other water bodies, such as irrigation reservoirs. There seems to be no consideration of the cumulative impact of this water use when sanctioning projects, and the total capacity of projects
that have received government sanctions is far beyond the capacity targeted.
This report examines Vidarbha, Maharashtra, as one such case.
VidarbhaAs of December 2010, 71 thermal power plants, with a collective electrical capacity of nearly 55 GW, were in various stages of approval in Vidarbha. This is a total water allocation by the state government of 2,049 million cubic metres of water per year, or the equivalent irrigation water for approximately 409,800 hectares of arable land. All of this is fresh water, taken from dams or rivers.
The water efficiency of these plants is low, ranging from 3.11 to 4.92 cubic metres per MW per hour. This makes them inefficient by both international and targeted national standards.
Vidarbha suffers the most neglect of any region in Maharashtra, particularly in the irrigation sector. Lack of irrigation facilities have been linked to suicides and agricultural distress, and Rs. 6, 814 crore of State funds have been issued in relief packages for the region in the last ten years. Yet the locations of upcoming power plants includes Vidarbha’s six most distressed districts, in which 6,084 farmers killed themselves between 2001 and 2010. A number of these power plants have been allocated water diverted from farmland irrigation.
Through minutes of meetings of the High Power Committee,
Maharashtra, Greenpeace has learned that at least 398.87 million cubic metres of water per year was directed to be diverted from irrigation to thermal power plants in Vidarbha between 2003 and 2011. This water could irrigate approximately 79,774 hectares of farmland.
These diversions are a consequence of the Maharashtra State Water Policy, which prioritised industrial water use above agricultural use between 2003 and 2011. The Draft National Water policy 2012 does not require agriculture to be prioritised over industry and endangers the same situation across the country, to the great detriment of farming communities.
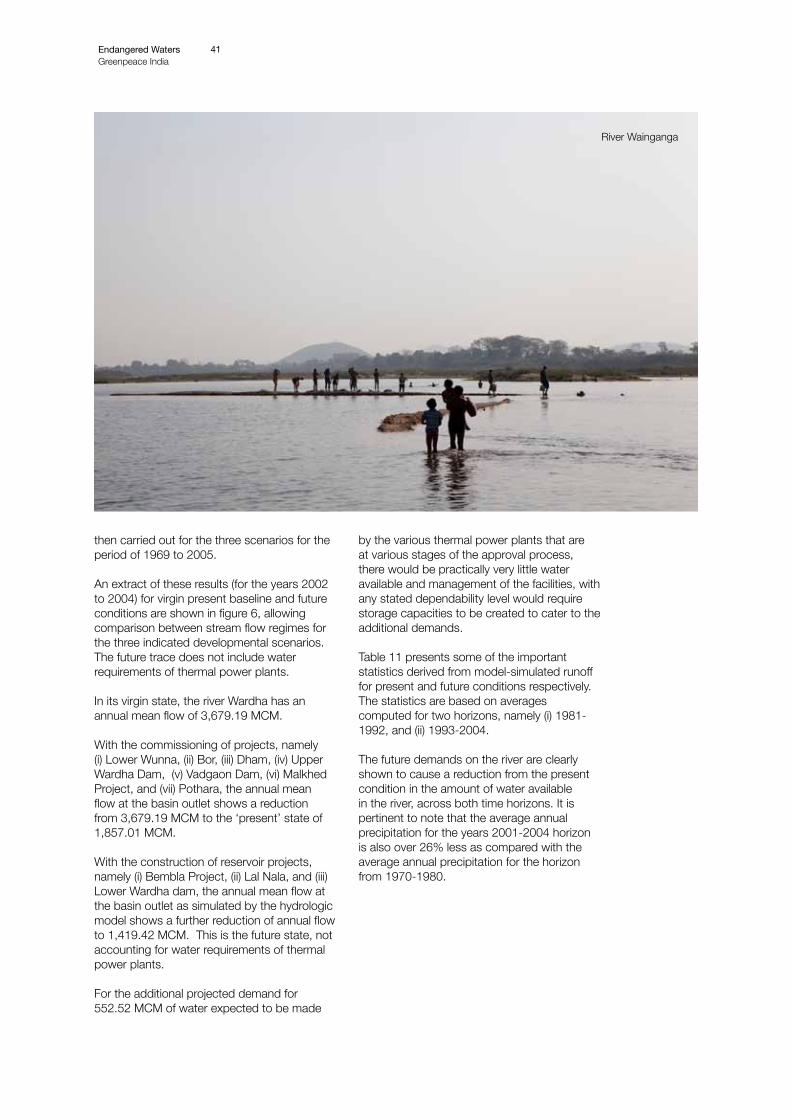
New study by IIT Delhi
The Department of Civil Engineering at the Indian Institute of Technology, Delhi has assessed the water availability in Wardha river in western Vidarbha.
The study, commissioned by Greenpeace, showed the annual mean flow of the river as having already reduced from 3,679.19 MCM (million cubic metres of water per year) in its natural state to 1,857.01 MCM in its present state, as a result of dams and reservoirs. Upcoming reservoirs will further reduce the flow to 1,419.42 MCM.
As of December 2010, an additional 552.52 MCM of water per year had also been allocated from Wardha to upcoming thermal power plants. In four of the years modelled, the annual flow of the river was less than this. The
modelling also showed intra-annual variation in the river flow could mean significant additional investment to be required by power companies for large storage reservoirs.
Water conflicts and risk
India is already in a condition of water stress, and national demand for water is projected to outstrip supply in less than thirty years. National irrigation water requirements are expected to increase 50% by 2050. The government’s push on such water-intensive methods of power production, therefore, will make conflicts between power projects and agriculture inevitable.
Three case studies from the Wardha river basin show communities are beginning to fight against diversions of irrigation water, causing political and regulatory risk for governments and administrators, and economic risk and risk to reputation for power companies.
A study by HSBC found that coal projects in several Indian states faced significant earnings risks due to water scarcity, with the risks highest during summer months. A 2010 analysis found that each 5% drop in a coal-fired power plant’s load factor will result in nearly a 75 basis point drop in the project internal rate of return.
Water-conserving energy generation
In contrast to thermal power, renewable energy technologies
such as wind power, solar photovoltaic, solar dish, combined heat and power, run-of-river hydro, and ocean energy require little to no water.
Under the Energy [R]evolution scenario, a global energy roadmap, almost half of India’s power would be provided by these technologies by 2030. This compares with approximately 10% under a business-as-usual development. This scenario would save approximately eight billion cubic metres of water in fossil fuel extraction and power generation by 2030: enough to meet the water requirements of 160 million urban dwellers. Electricity supply costs would also become lower than the reference scenario post 2025, and actually start to decrease post 2030.
Endangered WatersGreenpeace India
04
INTRODUCTION
a2500m3 (50m x 20m x 2.5m).bAssuming a 100% plant load factor.cTaking 5000m3 as the irrigation water for one hectare of single-cropped land.
Endangered WatersGreenpeace India
05
01
Coal-based thermal power is an extremely water-intensive way to generate energy. A typical thermal power plant operating in India consumes 5-7 cubic metres of water per MW per hour; therefore a 1,000 MW plant would consume enough water to fill an Olympic-sized swimming poola every 20-30 minutesb. Power plants built more recently will use 3.5-4 cubic metres of water per MW per hour, in which case a 1,000 MW plant will consume water that could be used to irrigate up to 7,000 hectares of agricultural landc.
In the last 20 years, India’s power generation has tripled and the water requirements for power generation more than doubled. If India continues to add thermal power capacity at such galloping pace – as is envisioned in the 12th Five Year Plan - water conflicts between agriculture and coal-fired thermal power shall become inevitable. The country is already water-stressed1. Increasing populations - plus the food, cities and industries to feed and house them - will increase the national demand for water; simultaneously climate change is reducing the amount of freshwater that is readily and reliably available. In Maharashtra it has been discovered that irrigation water is already being diverted to thermal power plants, with no apparent compensation to the farmers losing water.2
Vidarbha, in the east of Maharashtra, serves as an example of a crisis situation threatening across the country. A neglected
agricultural region with high suicide rates, the distress of Vidarbha’s farmers seems to have done little to stall the sanctions being given liberally to thermal power projects. As of December 2010, 71 new thermal power plants were in various stages of approval in Vidarbha, many of them projects of private companies and all seeking allocation of fresh water3. If all are built, their collective water consumption will be over two billion cubic metres per year. This is madness. The location of these power plants includes the six most distressed districts of Vidarbha, in which 6,084 farmers killed themselves between 2001 and 20104. While many factors contribute to farmer suicides, irrigation has been acknowledged as capable of bringing major relief to such agricultural distress. There already exists a giant backlog of irrigation programmes in Vidarbha compared to the rest of Maharashtra, and more than Rs. 2,177 crore of central funds dedicated to clearing it. To divert water to thermal power plants from the few irrigation programmes that do exist is inexcusable.
As with other clusters of thermal power plants in India, these projects are also coming up in places with an abundance of energy sources such as sunshine and wind. Renewable energy technologies consume little-to-no water: it is nonsensical that these coal plants are being approved in an area where affordable electricity could be produced without using the
scarce water resources needed for irrigation.
Local communities in Vidarbha are now beginning to fight back against the water diversions, causing costly delays for power projects, or even a complete change of location. The story of one such community is told in section 5, as are the stories of two communities who are losing their irrigation water to a thermal power plant. The investment risks this poses for companies are covered in section 6.
Section 4 of this report presents a new study by Indian Institute of Technology, Delhi, of the impact of the proposed thermal power plants on the water availability in the Wardha river basin, western Vidarbha. Using the SWAT modeling tool, the study simulates the scenarios of Wardha basin if all the demands planned for the area, including thermal power plants, were to be built. It finds that the annual mean flow in the river would reduce from its present level of 1,419 million cubic metres to a mere 867 million cubic metres: a reduction of almost 40%.5
The situation in Vidarbha threatens across the country. Water consumption must be one of our main considerations in choosing how to power India’s future. By taking water that could be used for irrigation, thermal power may begin to threaten India’s food security. By choosing thermal power in an increasingly water-stressed nation, India is endangering its energy security.
Endangered WatersGreenpeace India
06
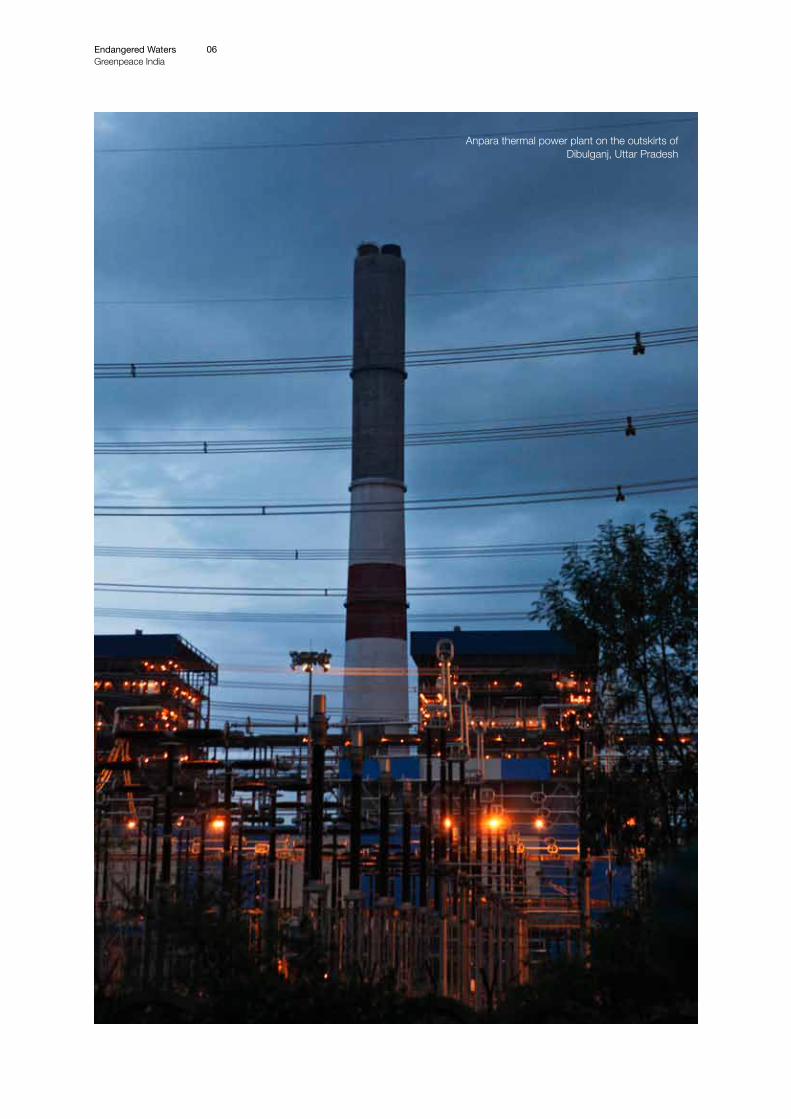
Anpara thermal power plant on the outskirts of Dibulganj, Uttar Pradesh
Of all types of thermal power, electricity generated by coal, in particular, has a very large impact on freshwater systems through all stages of the coal cycle. The effect of this coal cycle on water – from mining and preparation to combustion and waste disposal - can be polluting or consumptive, and often both.d
2.1 Consumption of water by coal-based power plants
For the purposes of this report, consumption is defined as water withdrawn from a source and neither discharged back into a surface water body, nor delivered for another use. Evaporated water may also be considered as consumed water in relation to local supply, as most does not rain back within the same water catchments.
The Central Electricity Authority (CEA) lists the
dThis report will focus on the consumptive water use that takes place within the premises of thermal power plants in India. Water consumed by mining is not considered here.
The thirst for thermal power
Endangered WatersGreenpeace India
07
02
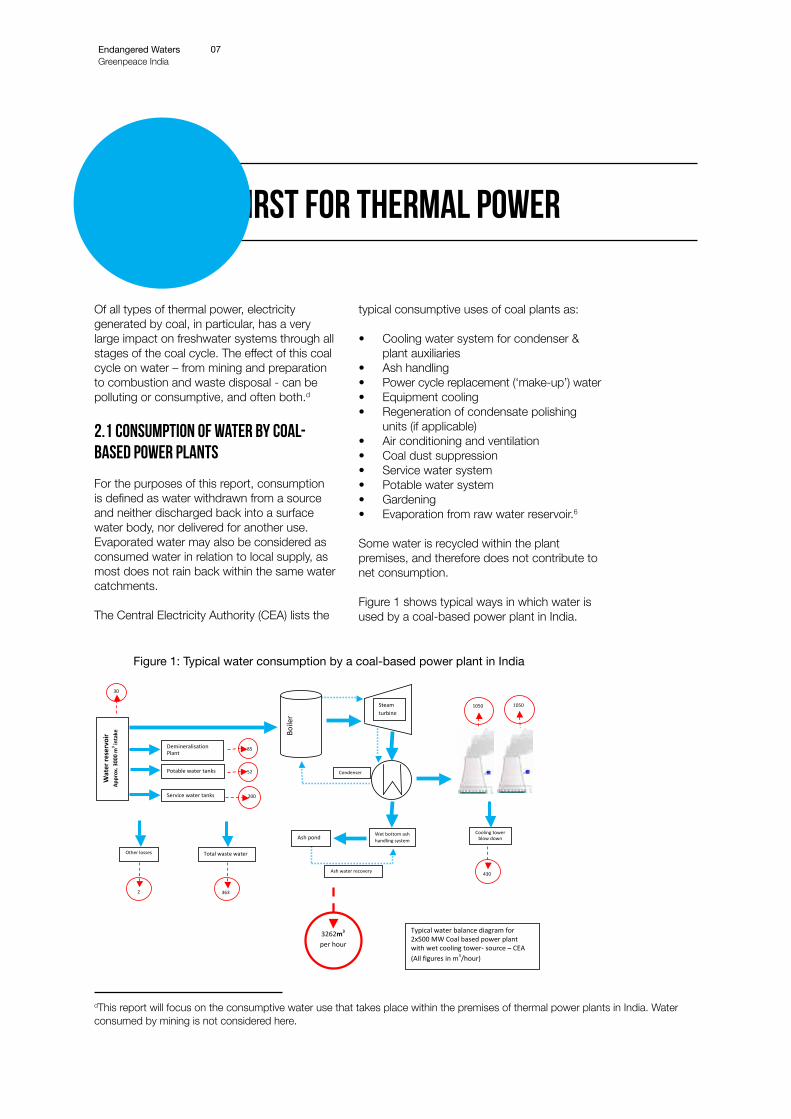
typical consumptive uses of coal plants as:
• Cooling water system for condenser & plant auxiliaries
• Ash handling• Power cycle replacement (‘make-up’) water • Equipment cooling• Regeneration of condensate polishing
units (if applicable)• Air conditioning and ventilation• Coal dust suppression• Service water system• Potable water system• Gardening• Evaporation from raw water reservoir.6
Some water is recycled within the plant premises, and therefore does not contribute to net consumption.
Figure 1 shows typical ways in which water is used by a coal-based power plant in India.
Condenser
363
430
Water re
servoir
Approx. 300
0 m
3 intake
Demineralisation Plant
Potable water tanks
Service water tanks
Boile
r
Steam turbine
Wet bottom ash handling system Ash pond
Ash water recovery
30
1050 1050
Total waste water
Cooling tower blow down
85
52
200
Other losses
2
3262m3 per hour
Typical water balance diagram for 2x500 MW Coal based power plant with wet cooling tower-‐ source – CEA (All figures in m3/hour)
Figure 1: Typical water consumption by a coal-based power plant in India
2.1.2 Factors affecting water consumption
The quality of raw water; the type of condenser cooling system; the technology used; the quality of coal and the systems of ash disposal and wastewater management all affect the amount of water a coal plant consumes. The higher the generating capacity, of course, the greater the amount of water required. Power plants using once-through (also called open loop) condenser cooling systems use more water than those with recirculating (also called closed loop) systems (however, not all of this will be consumptive use).
Whether open loop or recirculating, all large, grid-connected, coal-based power plants (those with capacity greater than 600 MW) in India use water for their cooling systems. Here, replacement water (‘make-up’) for the cooling tower typically accounts for 86%e of the total water consumed by the plant.
It is possible that recirculating systems may substitute some of their consumptive water with air: a ‘dry cooling’ system. This uses approximately 80% less water than wet cooling systemsf, but also raises the capital costs of a plant by about 10% per MW, lowers output by about 7% and so also increases gross heat rate by the same amount.7 For these reasons, the CEA recommends that dry cooling systems be used for thermal power plants in India only in areas where the water is simply not available. Unfortunately, water allocated to irrigation is not necessarily considered as unavailable (see section 3.5 on water diversions).
Indian coal is mostly low-grade, with a high
ash content of around 40%. However, it is both available within national borders and cheaper than imported coal, and so indigenous coal is used in power plants in India as far as possible. Combustion of coal with high-ash content may also indirectly raise water consumption, as most plants in India use a wet ash disposal system.
Technology may also affect water consumption: supercritical power plants consume approximately 10-20%8 less water than sub-critical plants. Ultra Mega Power Projects (see section 2.2.1) are required to incorporate supercritical technology; however they also have a capacity of around 4,000 MW, the proportional water consumption of which will dwarf any water efficiency from technology. All older, existing coal plants in India use sub-critical technology.
2.1.3 How much water is consumed?
Until recently, consumptive water requirements for Indian coal-based plants were between five and seven cubic metres per hour per MW, depending on whether ash disposal water was recirculated or not.9 This will account for the majority of existing power plants in India.
Some more recent plants are designed to have a raw water consumption of 3.5-4 cubic metres per hour per MW, depending on the factors given in section 2.1.2. However, not all new plants will keep their water consumption within this limit (see section 3.2.2).
Note that this is assuming no flue gas desulfurisation takes place, which would increase water consumption. Flue gas desulfurisation is currently not obligatory in India.10
eFor a 1000 MW plant with two units of 500 MW, wet ash disposal, non-recycling of ash pond water and consumptive use of 4m3/h. Water Report. CEA. 2012.fFor a 2x500 MW sub-critical inland thermal power plant using indigenous coal. Water Report. CEA.2012.
Endangered WatersGreenpeace India
08
“Whether open loop or recirculating, all large, grid-connected, coal-based power plants in
India use water for their cooling systems.”
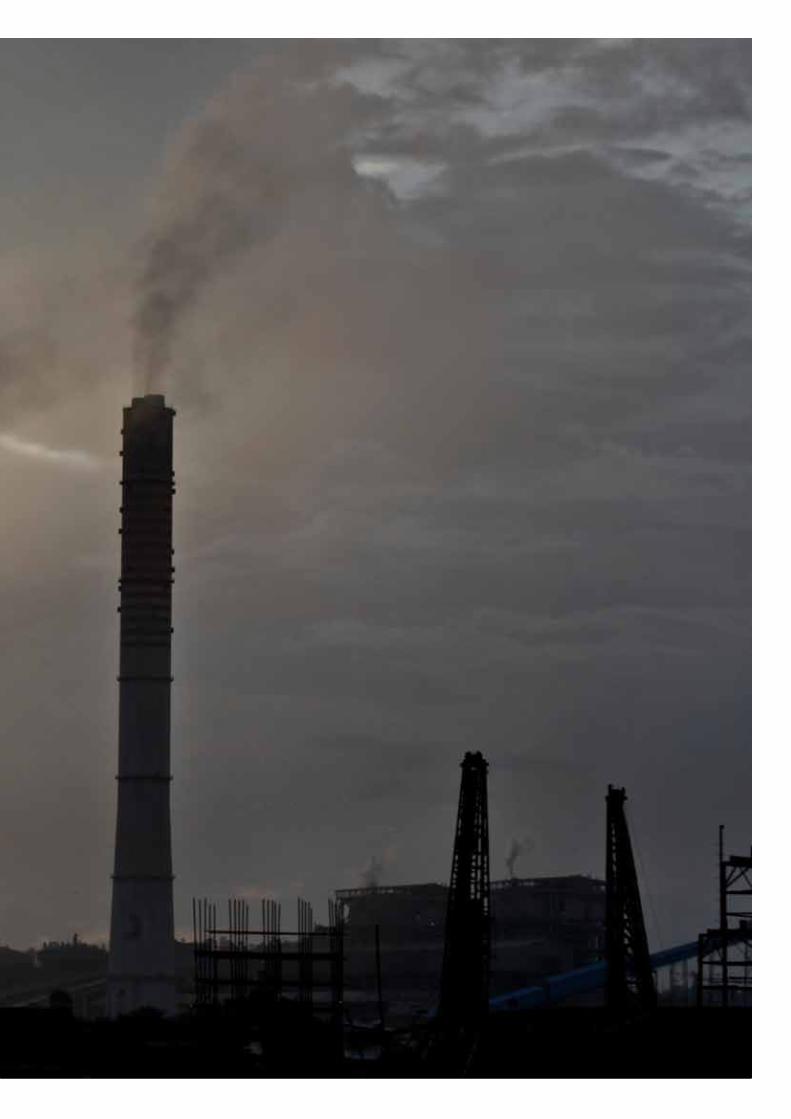
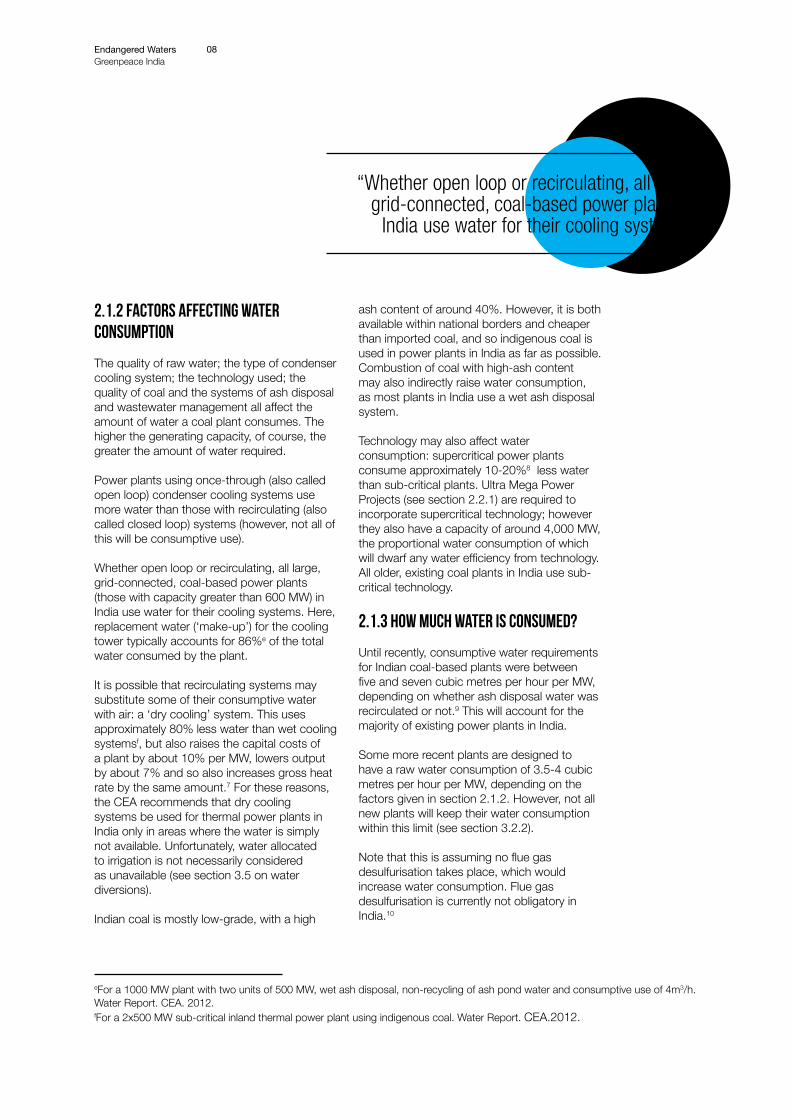
Anpara thermal power plant on the outskirts of Dibulganj, Uttar Pradesh
In contrast, typical freshwater consumption by similar plant in Australia (sub-critical, recirculating, wet-cooling, 1,000 MW coal-based plant in similarly warm climate and water-scarce conditions) is just 1.9 cubic metres per hour per MW.11
This is half of the water consumed by more ‘modern’ Indian coal plants, and less than a third of older plants, which make up the majority of installed coal power in India.
Table 1: Comparative water consumption by typical sub-critical coal plants in India and Australia
Water consumption Water consumption per MW (m3 / MWh)
By a 1000 MW plant (MCM/year)c
Equivalent irrigation water (hectares of farmland)a
Majority of coal plants operating in India
5-7 43.8 - 61.3 8,760 - 12,264
Some more recent coal plants in India
3.5-4 30.6 – 35.0 6,132 – 7,008
Typical Australian coal plant 1.9 16.6 NAb
a Calculating 5000m3 to irrigate one hectare of single-cropped land over the course of a year.bThe amount of water required to irrigate land in Australia and India may be different.
c Assuming a 100% plant load factor. Source: CEA/ Water Report, 2012, Smart, A. and Adam. A. Water and the electricity generation industry. Waterlines Report Series
no 18. National Water Commission, Australian Government. August 2009
2.2 India’s thermal power boom
India’s Five Year Plans anticipate adding huge amounts of electrical capacity; both to fuel the steep growth desired in GDP and to plug the existing energy deficit, which peaks at 12%.12 The main source of the country’s energy to date has been coal, and it is clear that the level of government commitment to the fuel is not only continuing, but increasing. Characterised by ambitious targets and liberal sanctions, India’s thermal power boom comes with a vast consumptive water footprint.
Nearly 41 GW of coal capacity was added during the five years of the 11th Plan (2007-
2012).13 By the end of the 11th Plan, thermal power accounted for 66% of the country’s total installed capacity, within which 85% was based on coal.14 This is a slightly greater share than five years previously, when coal accounted for 82.6%15 of the country’s installed thermal capacity.
The approach paper of the 12th Five Year Plan, which envisages the 2012 to 2017 period, recommends the addition of a further 100 GW across energy sources, including a 28 GW backlog from the previous plan.16 Even if the share of coal were anticipated to be a more modest 80%, this will involve 80 GW of new coal capacity: almost double that added during the previous Plan. Even if we assume that all new plants will have the lower water consumption value of 3.5-4 cubic metres per MW suggested by the CEA,17 an additional 80 GW of coal capacity would require between 2.5 and 2.8 billion cubic metres of water per year. If we assume approximately 70% of this is inland and therefore using freshwater, this is the irrigation equivalent of up to 400,000 hectares of farmland. That’s one seventh of the area under food grain production in Tamil Nadu.18
Endangered WatersGreenpeace India
11
“A typical 4,000 MW Ultra Mega Power Plant would consume around 110 million cubic metres of water per year, or the water of 22,000 hectares of irrigated land.”
There seems to be no consideration of the cumulative impact of this water use when sanctioning projects: contrary to a purveyed view, it is extremely rare that environmental clearance forms an obstacle to thermal power plants. In fact, clearances for thermal power projects during the 11th Five Year Plan were granted by the Union Ministry of Environment and Forests at a rate six times that which were actually installed. Between 2007 and August 2011, thermal power plants of 210 GW capacity received environmental clearance, of which 176 GW (84%) was coal-based.19 Over 500 GW more was in the pipeline, of which the majority was the result of private investment.20
2.2.1 Encouraging private investment
Such rapid expansion of thermal power – and its associated water use - in India is due in part to increasing activity within the private
sector. The central government has been consistently encouraging private investment in power generation and distribution, as well as trading, since 1991, before the Electricity Act of 2003 delicensed thermal power generation completely. Precursors to the Act were the Private Power Policy (1991) and the Mega Power Policy (1995), which introduced such incentives as 100% foreign direct investment in generation transmission and distribution, tax holidays for 10 years (recently extended to 15 years), and waiver of import duties on capital goods.21 Many state governments also offer a single window clearance scheme for power projects, which allows independent power producers to access the various clearances required through only a single application and within a fixed timeframe. This includes water clearances.
Endangered WatersGreenpeace India
12
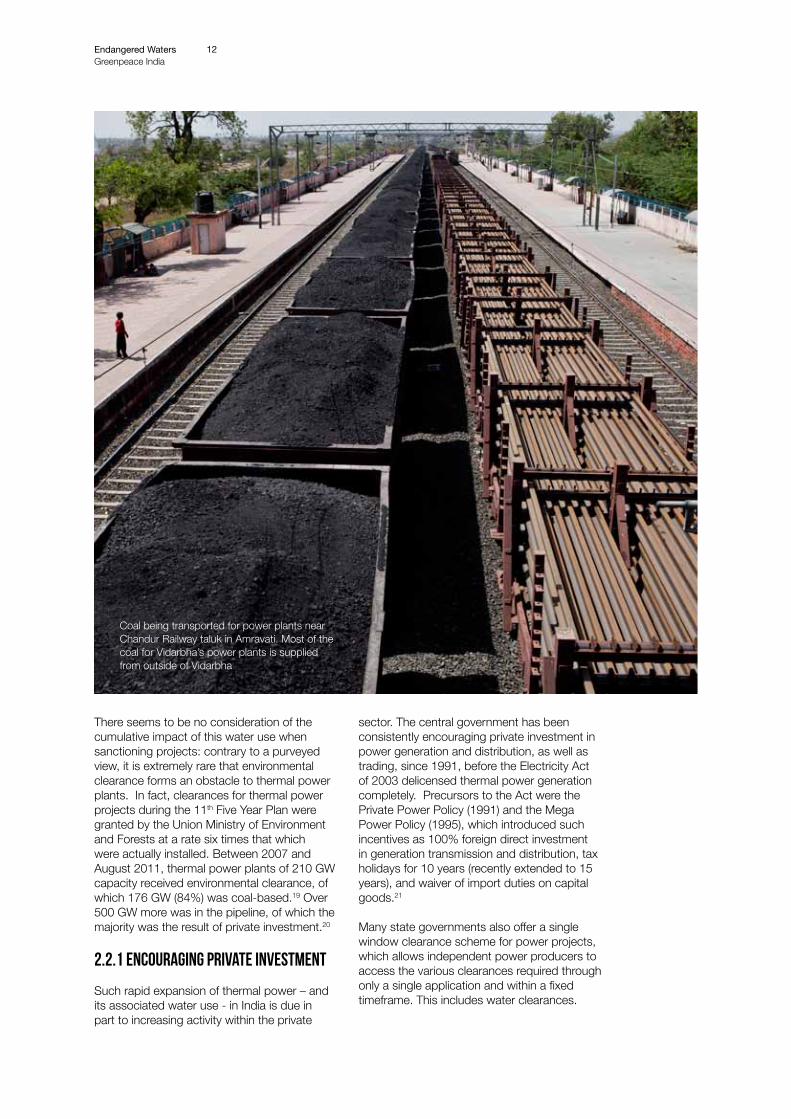
Coal being transported for power plants near Chandur Railway taluk in Amravati. Most of the coal for Vidarbha’s power plants is supplied from outside of Vidarbha
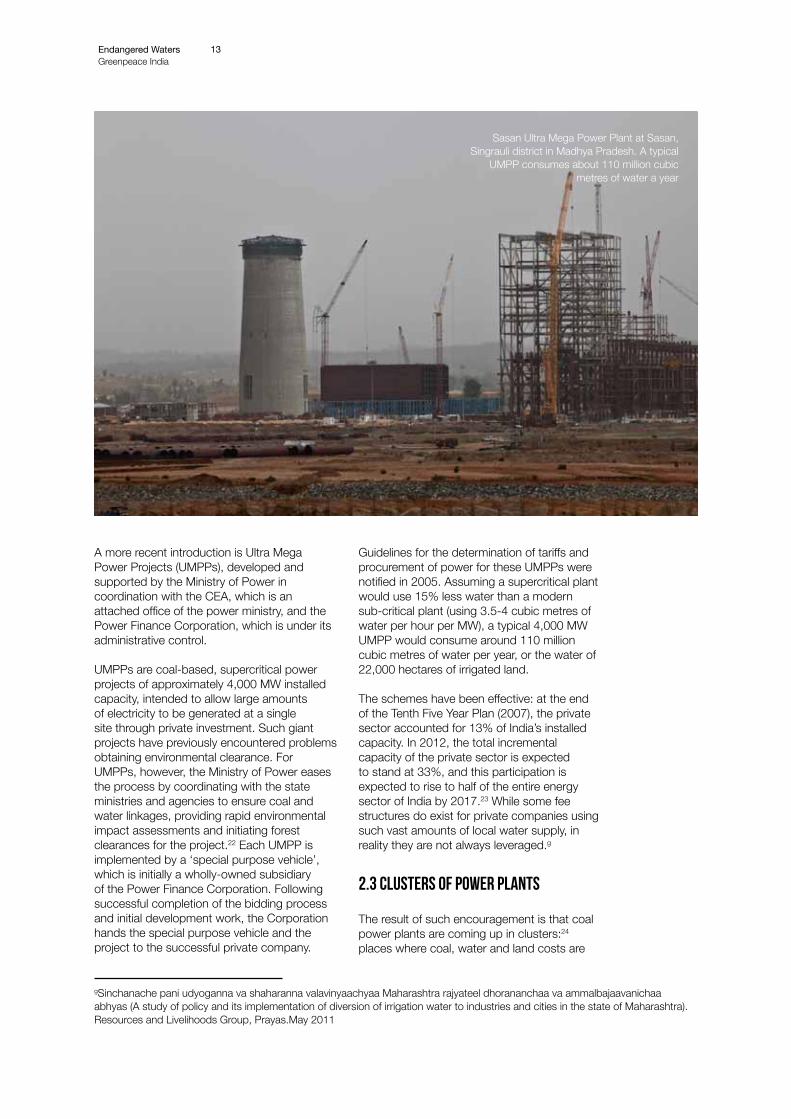
A more recent introduction is Ultra Mega Power Projects (UMPPs), developed and supported by the Ministry of Power in coordination with the CEA, which is an attached office of the power ministry, and the Power Finance Corporation, which is under its administrative control.
UMPPs are coal-based, supercritical power projects of approximately 4,000 MW installed capacity, intended to allow large amounts of electricity to be generated at a single site through private investment. Such giant projects have previously encountered problems obtaining environmental clearance. For UMPPs, however, the Ministry of Power eases the process by coordinating with the state ministries and agencies to ensure coal and water linkages, providing rapid environmental impact assessments and initiating forest clearances for the project.22 Each UMPP is implemented by a ‘special purpose vehicle’, which is initially a wholly-owned subsidiary of the Power Finance Corporation. Following successful completion of the bidding process and initial development work, the Corporation hands the special purpose vehicle and the project to the successful private company.
Guidelines for the determination of tariffs and procurement of power for these UMPPs were notified in 2005. Assuming a supercritical plant would use 15% less water than a modern sub-critical plant (using 3.5-4 cubic metres of water per hour per MW), a typical 4,000 MW UMPP would consume around 110 million cubic metres of water per year, or the water of 22,000 hectares of irrigated land.
The schemes have been effective: at the end of the Tenth Five Year Plan (2007), the private sector accounted for 13% of India’s installed capacity. In 2012, the total incremental capacity of the private sector is expected to stand at 33%, and this participation is expected to rise to half of the entire energy sector of India by 2017.23 While some fee structures do exist for private companies using such vast amounts of local water supply, in reality they are not always leveraged.g
Endangered WatersGreenpeace India
13
image
2.3 Clusters of power plants
Sasan Ultra Mega Power Plant at Sasan, Singrauli district in Madhya Pradesh. A typical
UMPP consumes about 110 million cubic metres of water a year
gSinchanache pani udyoganna va shaharanna valavinyaachyaa Maharashtra rajyateel dhorananchaa va ammalbajaavanichaa abhyas (A study of policy and its implementation of diversion of irrigation water to industries and cities in the state of Maharashtra).Resources and Livelihoods Group, Prayas.May 2011
The result of such encouragement is that coal power plants are coming up in clusters:24 places where coal, water and land costs are
Endangered WatersGreenpeace India
14
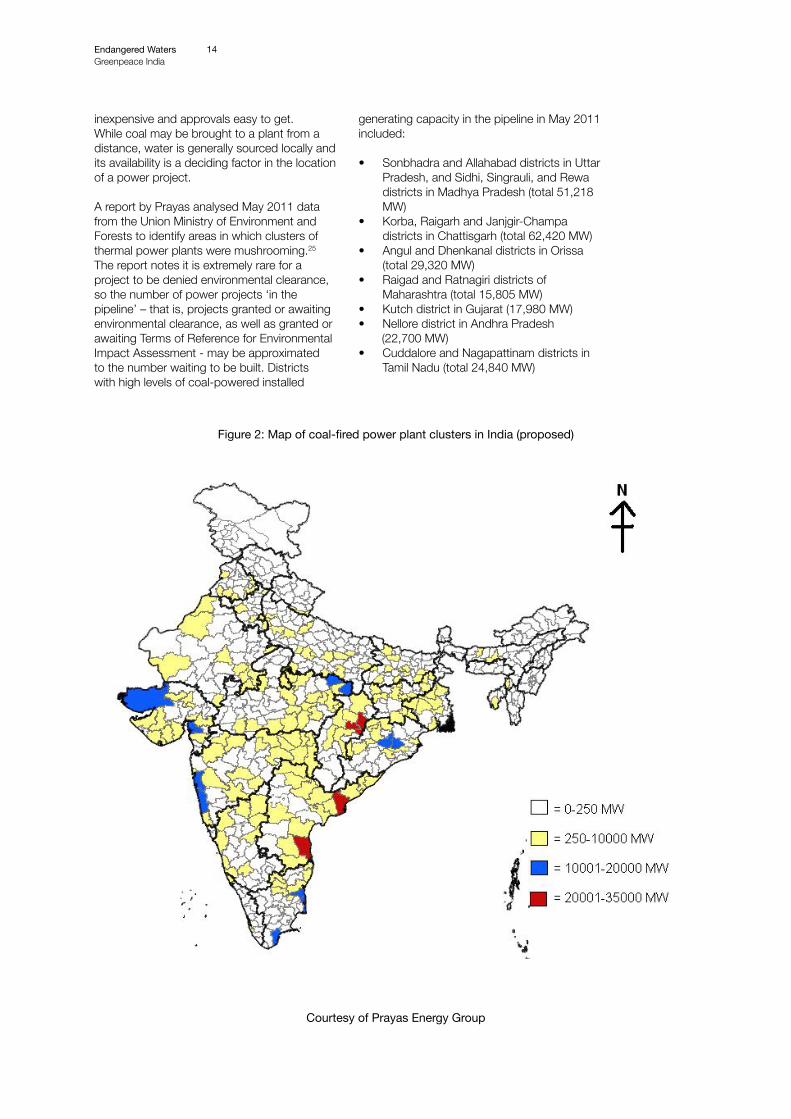
Figure 2: Map of coal-fired power plant clusters in India (proposed)
inexpensive and approvals easy to get. While coal may be brought to a plant from a distance, water is generally sourced locally and its availability is a deciding factor in the location of a power project.
A report by Prayas analysed May 2011 data from the Union Ministry of Environment and Forests to identify areas in which clusters of thermal power plants were mushrooming.25 The report notes it is extremely rare for a project to be denied environmental clearance, so the number of power projects ‘in the pipeline’ – that is, projects granted or awaiting environmental clearance, as well as granted or awaiting Terms of Reference for Environmental Impact Assessment - may be approximated to the number waiting to be built. Districts with high levels of coal-powered installed
generating capacity in the pipeline in May 2011 included:
• Sonbhadra and Allahabad districts in Uttar Pradesh, and Sidhi, Singrauli, and Rewa districts in Madhya Pradesh (total 51,218 MW)
• Korba, Raigarh and Janjgir-Champa districts in Chattisgarh (total 62,420 MW)
• Angul and Dhenkanal districts in Orissa (total 29,320 MW)
• Raigad and Ratnagiri districts of Maharashtra (total 15,805 MW)
• Kutch district in Gujarat (17,980 MW)• Nellore district in Andhra Pradesh (22,700 MW)• Cuddalore and Nagapattinam districts in
Tamil Nadu (total 24,840 MW)
Courtesy of Prayas Energy Group
A cluster of power plants coming up in Vidarbha and their impact on water availability is discussed in detail in sections 3 and 4.
Thermal power projects in coastal districts may draw seawater; others are slightly inland and may draw from rivers or other bodies of freshwater. It is illegal for thermal power plants to draw groundwater. Inland clusters will use only freshwater from rivers and other water bodies, such as irrigation reservoirs, and so the chances of the water requirements of the power plants clashing with the local water requirements of farmers are high.
As power projects must obtain water clearance from the relevant state departments before the final stage of applying for environmental clearance from the Ministry of Environment and Forests, all the projects above will already have been allocated water.
2.4 The Draft National Water Policy
The National Water Policy of India, 2002, listed water uses in order of priority: 1. Drinking water
2. Irrigation3. Hydro-power4. Ecology5. Agro-industries and non-agricultural
industries6. Navigation and other uses.26
However, the Draft National Water Policy of 2012 - the final version was not available at the time of going to print - specifies only that priority should be given to the ‘minimum quantity of water required for survival of human beings and ecosystem’.27 Beyond that, it writes that water ‘should be treated as an economic good’. This creates a very real danger that freshwater will be allocated to thermal power projects ahead of irrigation programmes to the great detriment of farming communities, as has already been the case in Maharashtra (see sections 3.5 and 5).
Endangered WatersGreenpeace India
15
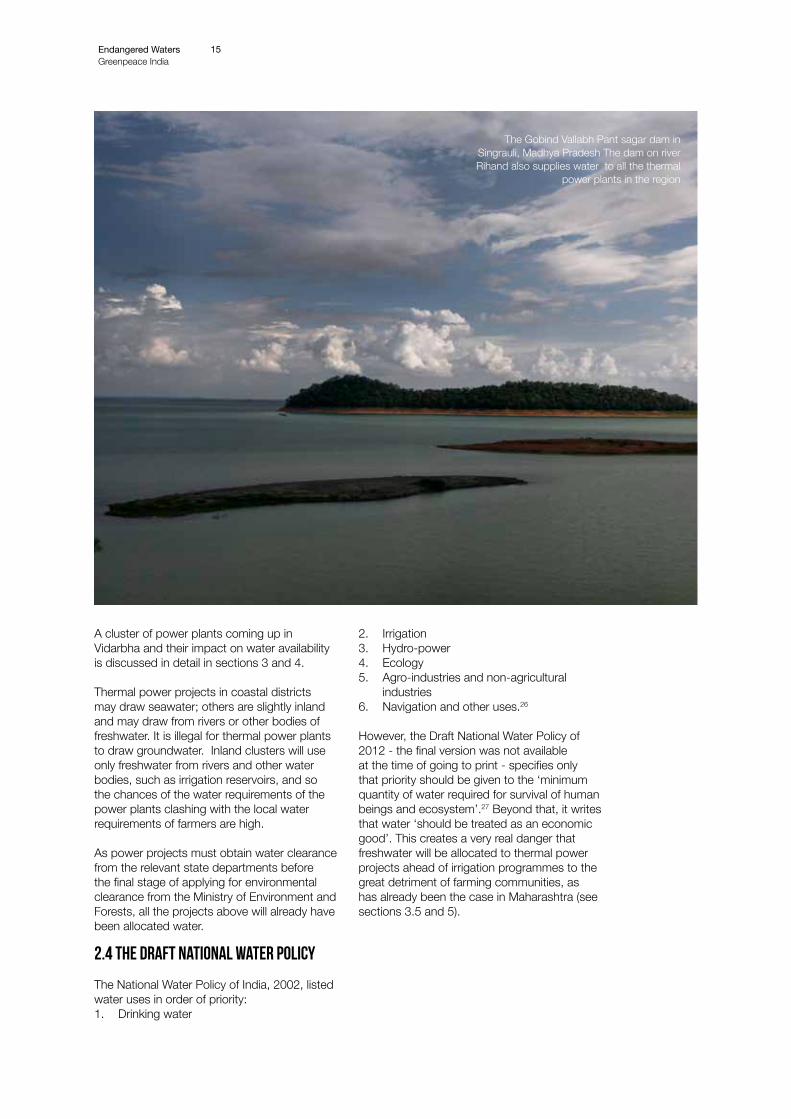
The Gobind Vallabh Pant sagar dam in Singrauli, Madhya Pradesh The dam on river Rihand also supplies water to all the thermal
power plants in the region
Water conflict: coal plants vs. agriculture
One of the major and most important uses of freshwater in India is irrigation. For many farmers, eking a living on a thin economic margin, irrigation facilities can be vitally important. India is already in a condition of water stress, and the need for irrigation water is expected to increase 50% by 2050. When combined with other rising needs, this means demand for water is projected to outstrip supply in less than thirty years.28
The government’s push on a power generation method with such large water requirements as thermal power, therefore, will make conflicts between power projects and agriculture inevitable.
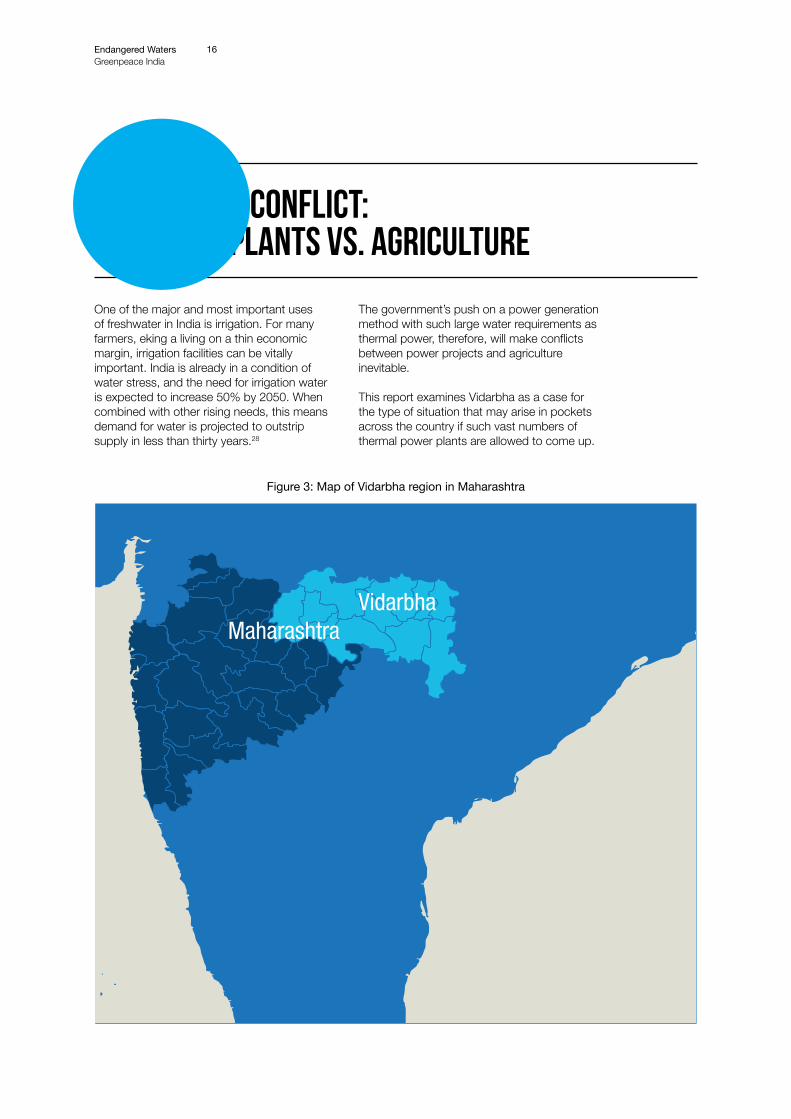
This report examines Vidarbha as a case for the type of situation that may arise in pockets across the country if such vast numbers of thermal power plants are allowed to come up.
Figure 3: Map of Vidarbha region in Maharashtra
Endangered WatersGreenpeace India
16
03
MaharashtraVidarbha
3.1 Vidarbha in context
Vidarbha is big: it accounts for 20.5% of the population (23,003,179 people), and 31.5% of the area (97,069 square kilometres) of India’s second-most-populous and third-largest state.29 Following the liberalisation of India’s economy in 1991, Maharashtra has become a hot destination for Foreign Direct Investment, with state GDP consistently above national level since 2004-5.30 Yet there is great regional imbalance in the state, and the situation in Vidarbha is very different.
Roughly 58% of the region (5.7 million hectares) is cultivable: this is about a quarter of the total cultivable land of Maharashtra. In terms of area, Vidarbha actually has the largest amount of rice cultivation in the state (732,000 ha), nearly double that of Konkan, the region with the second-largest rice cultivation.31 Despite this, it produces less rice than either Konkan or Western Maharashtra,h a low productivity due in part to insufficient irrigation facilities. According to the Ministry of Agriculture, the ratio of kharif to rabi cropping area in Western Maharashtra is 1.22 and Marathwada 0.51, indicating all and half of the area is covered by irrigation, respectively. In Vidarbha, this ratio is only 0.15.32 Section 3.3 contains more information on the irrigation backlog in Vidarbha.
Most farming in Vidarbha is therefore dependent on low-to-moderate rainfall, varying between 650 mm and 1,750 mm across the region.33 The wetter, eastern side (Bhandara, Gondia, Chandrapur and Gadchiroli districts) is a traditional rice-growing zone, whereas cotton and soybean take prevalence as kharif crop in the drier west (Amravati, Akola, Buldhana and Washim districts). The central districts of Nagpur, Wardha and Yavatmal receive moderate rainfall.
Vidarbha’s main rivers are Wainganga and Wardha, in the east and west of the region, respectively. They join together to form the Pranahita river over the borders of Chandrapur and Gadchiroli districts, becoming part of the Godavari basin. The Maharashtra Irrigation Commission in 199934 delineated this basin into nine sub-basins, of which Wardha, middle Wainganga, lower Wainganga (including Pranahita, Inchampalli and Indravati) and Pengangai sub-basins fall within the present boundaries of Vidarbha. Of these, only the Wainganga sub-basins are considered to have surplus water.
The limited amount of irrigation in the region is mostly based on dams. There are approximately 11 majorj dams and 58 medium dams currently in Vidarbha,35 controlled by the Vidarbha Irrigation Development Corporation, Nagpur. This VIDC is also in charge of developing new irrigation projects.
Despite its administrative neglect, Vidarbha possesses great wealth in terms of natural resources: most of Maharashtra’s known mineral reserves, including manganese, iron ore, copper and bauxite occur in these eastern districts, with some deposits in the west.36 Significantly, all of the state’s coal reserves are in Vidarbha.37
The region also retains some excellent forest cover to date: Gadchiroli district has the most area under ‘very dense forest’ in the whole of the state, followed by Chandrapur district;38 some of these areas are home to an endangered tiger population. All of the sanctuaries advertised by the Maharashtra tourism department as containing tigers - a major tourist attraction - are within Vidarbha.39 Of the four Project Tiger reserves in Maharashtra, the three oldest are also in Vidarbha: Melghat, Tadoba-Andhari and
Endangered WatersGreenpeace India
17
“Vidarbha has the largest amount of rice cultivation in Maharashtra, yet produces less rice than either Konkan or Western Maharashtra: a low productivity due in part to insufficient irrigation facilities.”
hMarathwada does not grow rice but rather sugarcane as its main crop, despite its heavy water intensity in such a dry region.iAlso called Painganga.jMedium dams are those with a cultivable command area of between 2,000 and 10,000 hectares; major dams those with more than 10,000 ha.
Pench. Tigers of Tadoba-Andhari reserve, however, are now being threatened by expansive coal mining.40
Vidarbha currently has four state-owned coal-based thermal power stations. Koradi and Khaperkheda (1,040 MW and 840 MW
installed capacity, respectively) thermal power stations are located on either side of Koradi town in Nagpur district. Chandrapur Super Thermal Power Station (2,340 MW installed capacity) is in Chandrapur district in the south, and the smaller Paras Thermal Power Station (305 MW installed capacity) is in Akola district in the west of Vidarbha.41
However, there are plans for this to drastically change.
3.2 Seventy-one thermal power plants in Vidarbha
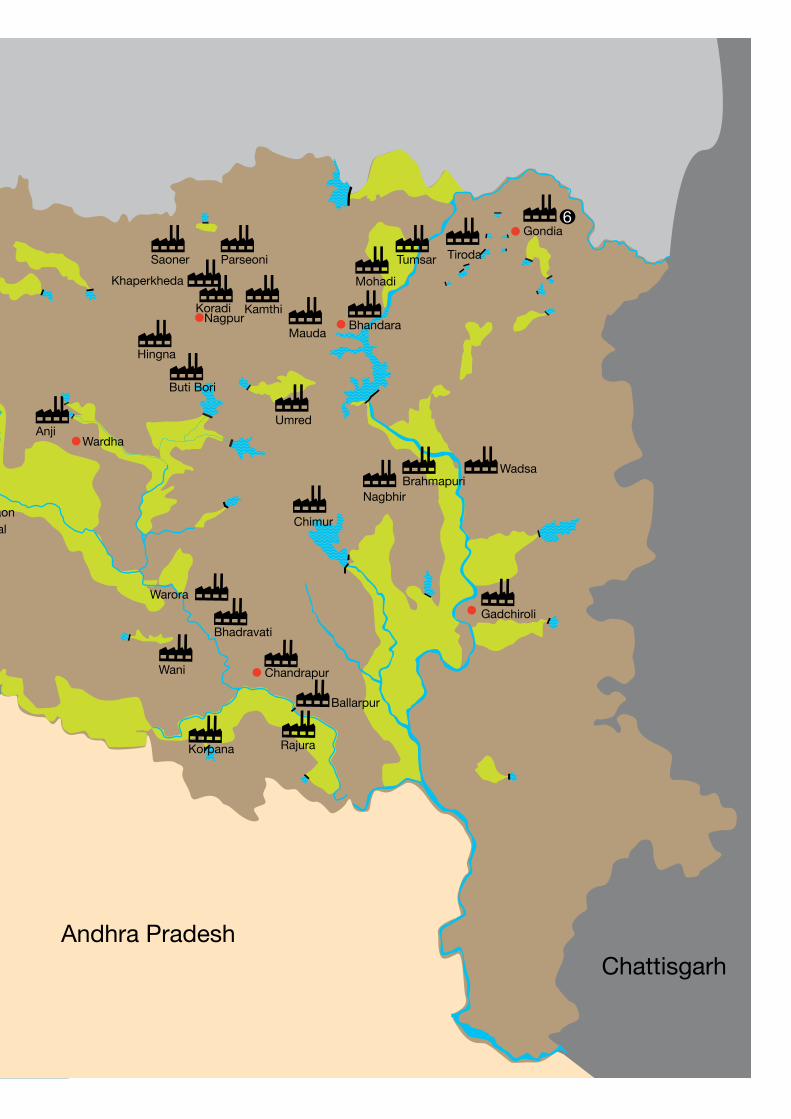
Using data obtained from the Vidarbha Irrigation Development Corporation and Vidarbha Statutory Development Board,
we present the thermal power plants in the pipeline for Vidarbha region. The number of power projects revealed through this data will be greater than that given by data from the Union Ministry of Environment and Forests, as water allocations must be given at the state level before a project application proceeds to the central ministry. These are displayed in Table 2 and Figure 4.
Endangered WatersGreenpeace India
18
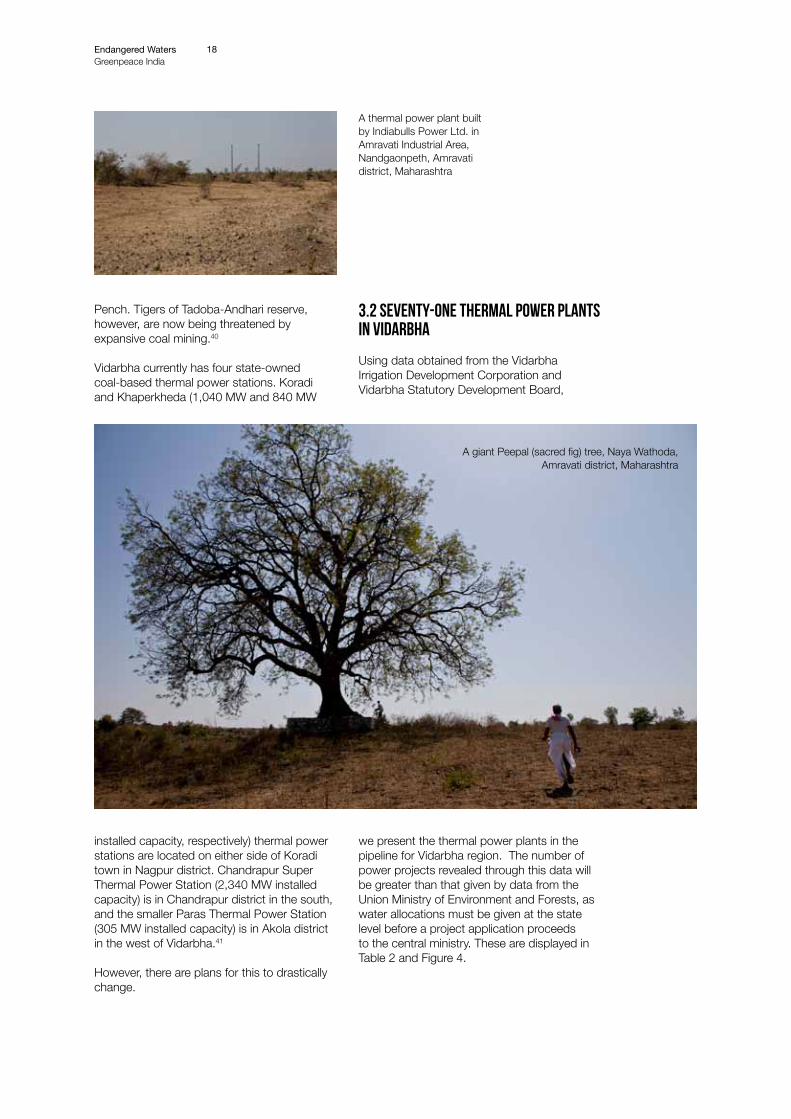
A thermal power plant built by Indiabulls Power Ltd. in Amravati Industrial Area, Nandgaonpeth, Amravati district, Maharashtra
A giant Peepal (sacred fig) tree, Naya Wathoda, Amravati district, Maharashtra
Gondia
TirodaTumsar
Mohadi
BhandaraMauda
KamthiKoradi
KhaperkhedaParseoniSaoner
Umred
Buti Bori
Anji
Ner
Nandgaon Peth
Lonar
Mahagaon
Paras
Wadsa
Nagbhir
Chimur
Warora
Bhadravati
Brahmapuri
Rajura
Chandrapur
Korpana
Wani
Babhulgaon
Gadchiroli
Hingna
Ballarpur
Nagpur
Wardha
Yavatmal
Amravati
Akola
Washim
Buldhana
Madhya Pradesh
ChattisgarhAndhra Pradesh
Rest of Maharashtra
6
Coal-based power plants
Command Area
Area submerged by dams
District headquarters
Dam
River
Figure 4: Proposed and approved thermal power plants in Vidarbha
Gondia
TirodaTumsar
Mohadi
BhandaraMauda
KamthiKoradi
KhaperkhedaParseoniSaoner
Umred
Buti Bori
Anji
Ner
Nandgaon Peth
Lonar
Mahagaon
Paras
Wadsa
Nagbhir
Chimur
Warora
Bhadravati
Brahmapuri
Rajura
Chandrapur
Korpana
Wani
Babhulgaon
Gadchiroli
Hingna
Ballarpur
Nagpur
Wardha
Yavatmal
Amravati
Akola
Washim
Buldhana
Madhya Pradesh
ChattisgarhAndhra Pradesh
Rest of Maharashtra
6
Coal-based power plants
Command Area
Area submerged by dams
District headquarters
Dam
River
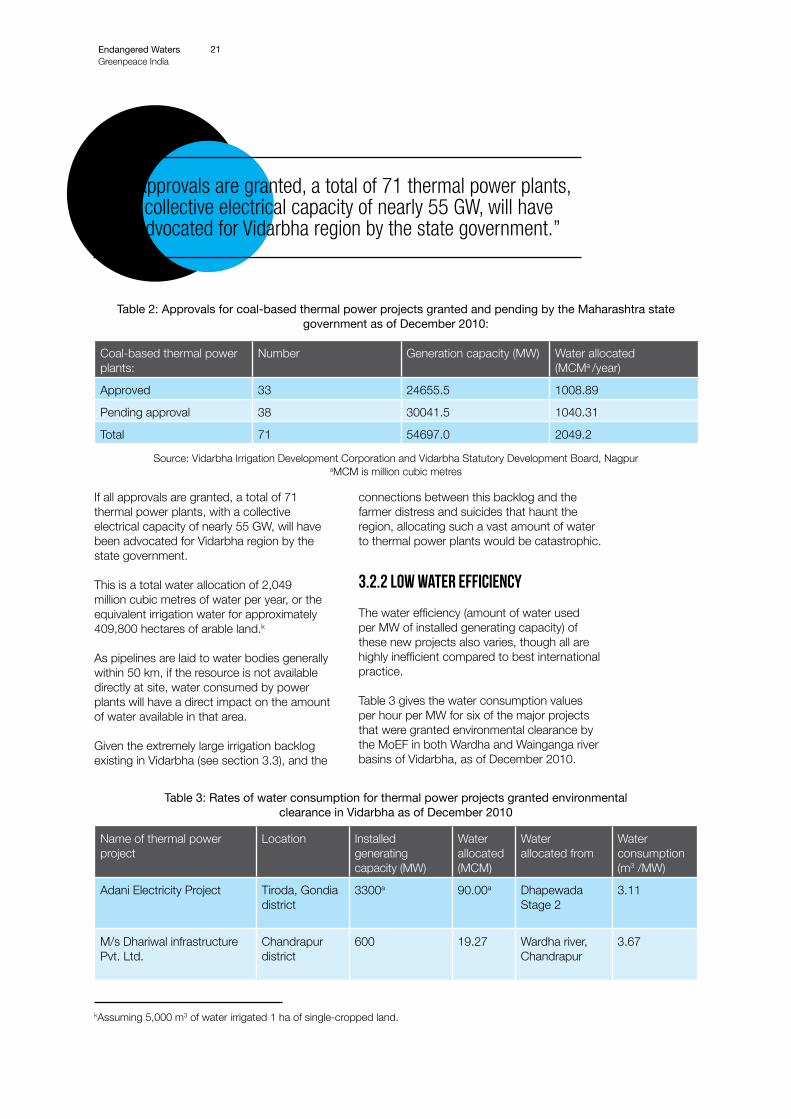
Table 2: Approvals for coal-based thermal power projects granted and pending by the Maharashtra state government as of December 2010:
Coal-based thermal power plants:
Number Generation capacity (MW) Water allocated(MCMa /year)
Approved 33 24655.5 1008.89
Pending approval 38 30041.5 1040.31
Total 71 54697.0 2049.2
Source: Vidarbha Irrigation Development Corporation and Vidarbha Statutory Development Board, Nagpur aMCM is million cubic metres
If all approvals are granted, a total of 71 thermal power plants, with a collective electrical capacity of nearly 55 GW, will have been advocated for Vidarbha region by the state government.
This is a total water allocation of 2,049 million cubic metres of water per year, or the equivalent irrigation water for approximately 409,800 hectares of arable land.k
As pipelines are laid to water bodies generally within 50 km, if the resource is not available directly at site, water consumed by power plants will have a direct impact on the amount of water available in that area.
Given the extremely large irrigation backlog existing in Vidarbha (see section 3.3), and the
connections between this backlog and the farmer distress and suicides that haunt the region, allocating such a vast amount of water to thermal power plants would be catastrophic.
3.2.2 Low water efficiency
The water efficiency (amount of water used per MW of installed generating capacity) of these new projects also varies, though all are highly inefficient compared to best international practice.
Table 3 gives the water consumption values per hour per MW for six of the major projects that were granted environmental clearance by the MoEF in both Wardha and Wainganga river basins of Vidarbha, as of December 2010.
Name of thermal power project
Location Installed generating capacity (MW)
Water allocated (MCM)
Water allocated from
Water consumption (m3 /MW)
Adani Electricity Project Tiroda, Gondia district
3300a 90.00a Dhapewada Stage 2
3.11
M/s Dhariwal infrastructure Pvt. Ltd.
Chandrapur district
600 19.27 Wardha river, Chandrapur
3.67
Table 3: Rates of water consumption for thermal power projects granted environmental clearance in Vidarbha as of December 2010
Endangered WatersGreenpeace India
21
“If all approvals are granted, a total of 71 thermal power plants, with a collective electrical capacity of nearly 55 GW, will have been advocated for Vidarbha region by the state government.”
kAssuming 5,000 m3 of water irrigated 1 ha of single-cropped land.
Endangered WatersGreenpeace India
22
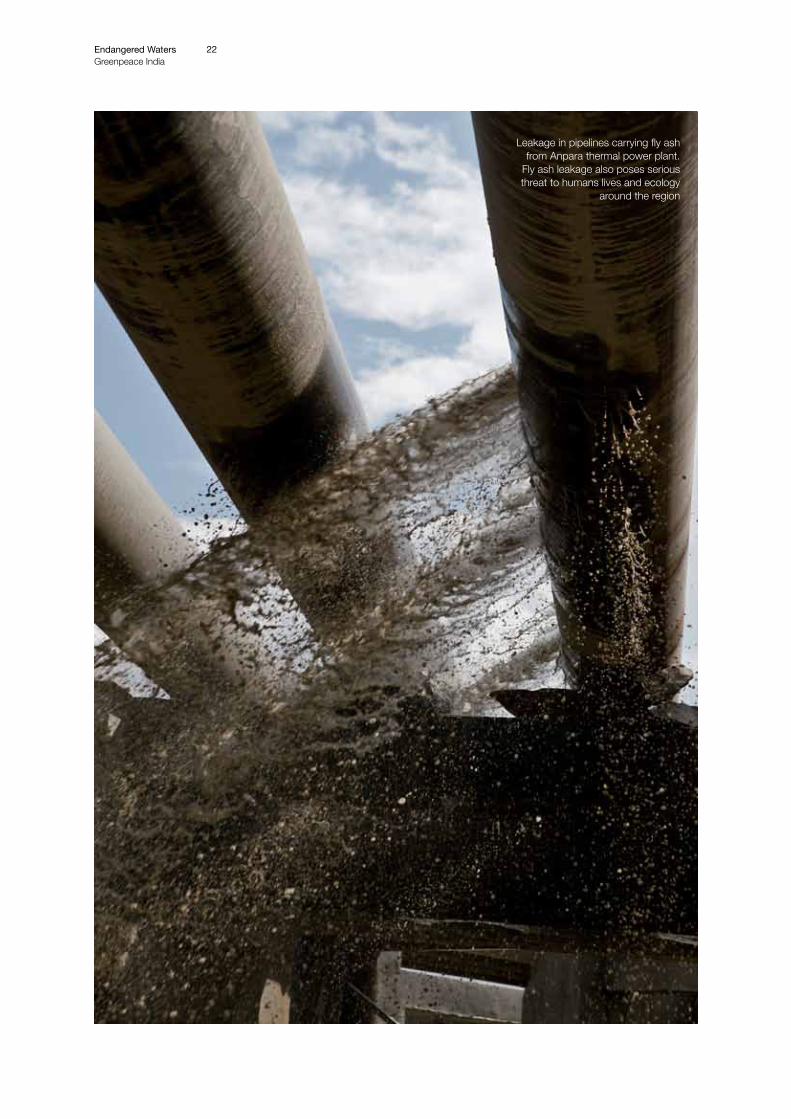
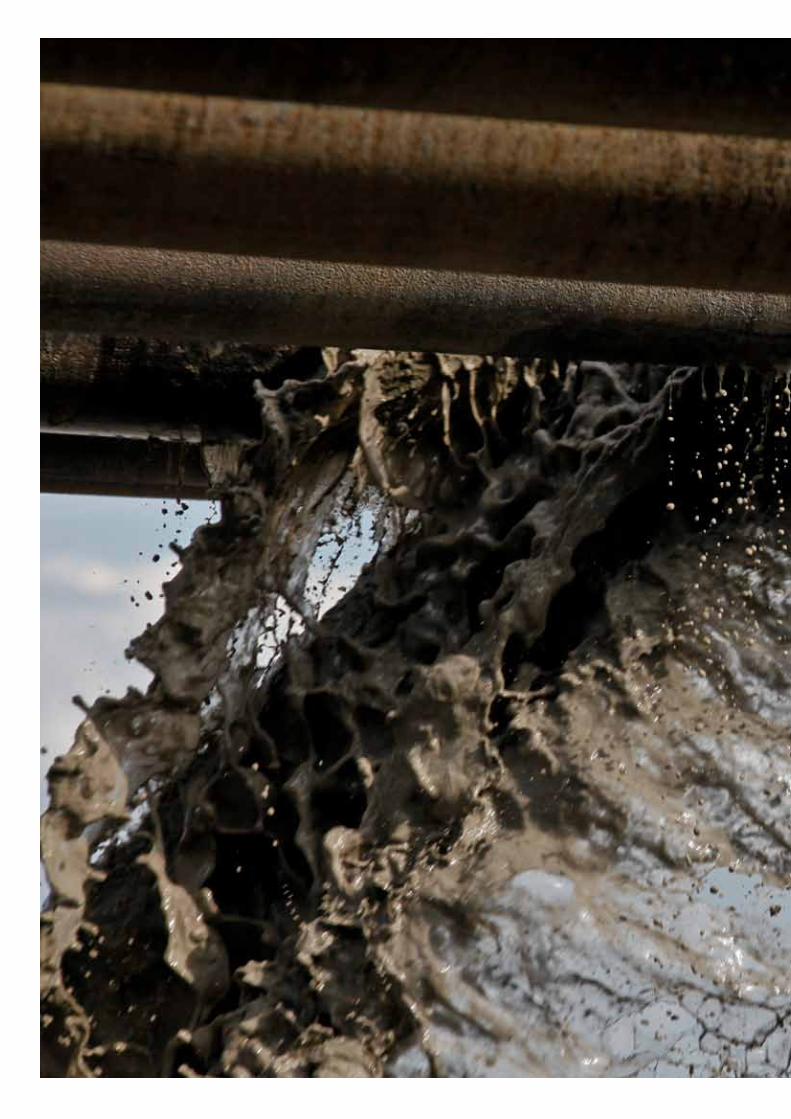
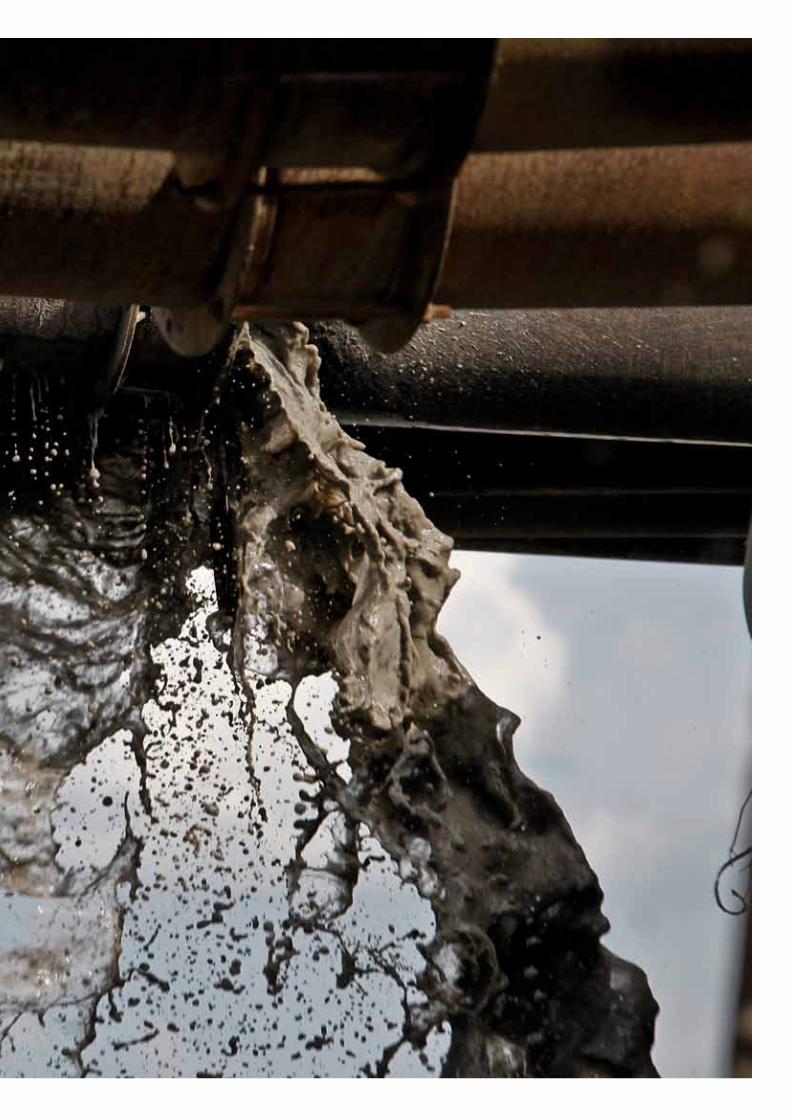
Leakage in pipelines carrying fly ash from Anpara thermal power plant.
Fly ash leakage also poses serious threat to humans lives and ecology
around the region
Leaks in pipelines carrying fly ash
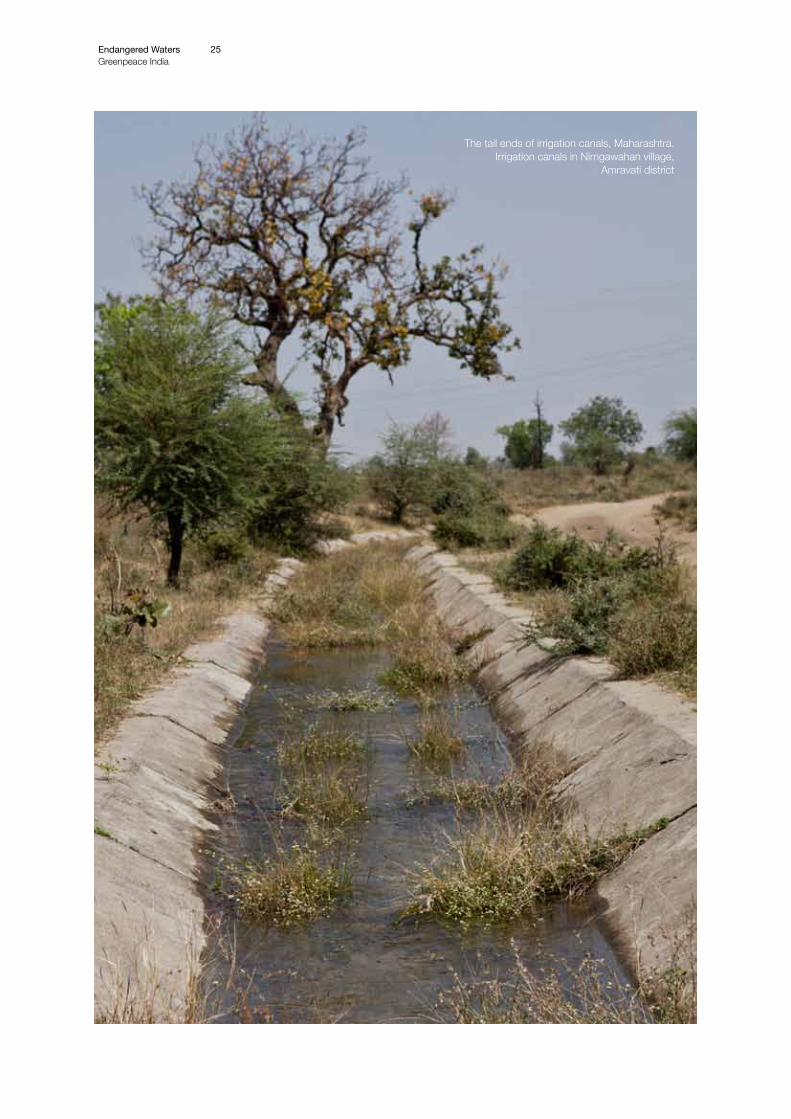
The tail ends of irrigation canals, Maharashtra.Irrigation canals in Nimgawahan village,
Amravati district
Endangered WatersGreenpeace India
25
Name of thermal power project
Location Installed generating capacity (MW)
Water allocated (MCM)
Water allocated from
Water consumption (m3 /MW)
M/s Indiabulls Power Ltd. Amravati district 2640b 87.60 Upper Wardha reservoir
3.79
M/s Ideal Energy Projects Ltd.
Umred, Nagpur district
270 10.00 Lower Wunna/ Wadgaon reservoirc
4.23
M/s Vidarbha Industries Pvt. Ltd.
Nagpur district 300 12.35 Lower Wunna/ Wadgaon reservoirc
4.70
National Thermal Power Station (NTPC)
Mauda, Nagpur district
2320 100.00 Gosikhurd reservoir
4.92
aThere are two Adani projects at Tiroda, one of 2000 MW and 70 MCM of water, and one of 1300 MW and 20 MCM of water. They are presented together here.
bEnvironmental clearance for 2700 MW has been granted to Indiabulls; however as many articles place the plant at 2640 MW we use that lower value here.
cWunna is occasionally also spelled as Waina, and Wadgaon as Vadgaon.
As can be seen from the table above, not all the thermal power projects granted environmental clearance for Vidarbha have water consumption values of 3.5-4 cubic metres per MW, as the CEA suggests modern plants should. The NTPC plant in Mauda, which is owned and operated by the government, has a particularly high level of freshwater consumption.
In contrast, typical fresh water consumption by similar plant in Australia (sub-critical, recirculating, wet-cooling, 1000 MW coal-based plant in similarly warm climate and water-scarce conditions) is just 1.9 cubic metres per hour per MW.l
The Vidarbha thermal power plants are therefore extremely inefficient by international standards, but also by national (targeted) standards.
3.3 Development and irrigation backlogs in Vidarbha
Regional imbalance in a state can be
characterised by ‘backlog’; the amount by which government spending for a particular sector and region falls below the state average. It can therefore be used as a good indicator of neglect for different regions of the state. To date, three committees have been set up to investigate development backlog in Maharashtra;
1) The Fact Finding Committee on Regional Imbalance in Maharashtra, headed by Dr. V. M. Dandekar, examined backlog up to 20th June 1982, though the findings it submitted to the Government were never formally accepted. They examined backlog in nine broad sectors.The committee found the largest sectoral backlog by far was in the irrigation sector (43.5%, Rs. 1,385.92 crore); more than double the backlog of the next-most-neglected sector (roads). In terms of region, the greatest backlog was in Vidarbha (39.1%, Rs. 1,246.54 crore).
2) The Indicators and Backlog Committee examined development backlogs up to 31st March 1994. The Government of Maharashtra
lSmart.A and Aspinall.A. Water and the electricity generation industry.Waterlines Report Series no.18 National Water Commission, Australian Government. August 2009. mSee samatolvikas.org for further information
Endangered WatersGreenpeace India
26
m
Irrigation canals are used to grow wheat in Nimgawahan village, Amravati district, Maharashtra
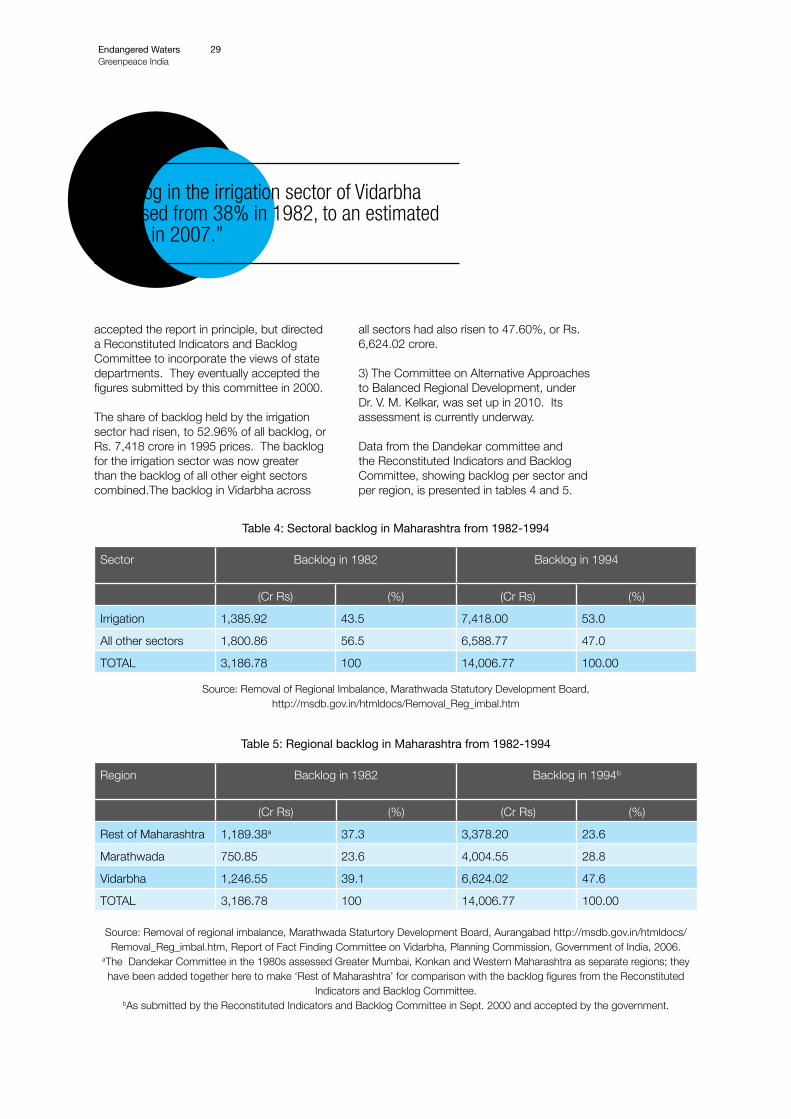
accepted the report in principle, but directed a Reconstituted Indicators and Backlog Committee to incorporate the views of state departments. They eventually accepted the figures submitted by this committee in 2000.
The share of backlog held by the irrigation sector had risen, to 52.96% of all backlog, or Rs. 7,418 crore in 1995 prices. The backlog for the irrigation sector was now greater than the backlog of all other eight sectors combined.The backlog in Vidarbha across
all sectors had also risen to 47.60%, or Rs. 6,624.02 crore.
3) The Committee on Alternative Approaches to Balanced Regional Development, under Dr. V. M. Kelkar, was set up in 2010. Its assessment is currently underway.
Data from the Dandekar committee and the Reconstituted Indicators and Backlog Committee, showing backlog per sector and per region, is presented in tables 4 and 5.
Table 4: Sectoral backlog in Maharashtra from 1982-1994
Sector Backlog in 1982 Backlog in 1994
(Cr Rs) (%) (Cr Rs) (%)
Irrigation 1,385.92 43.5 7,418.00 53.0
All other sectors 1,800.86 56.5 6,588.77 47.0
TOTAL 3,186.78 100 14,006.77 100.00
Source: Removal of Regional Imbalance, Marathwada Statutory Development Board, http://msdb.gov.in/htmldocs/Removal_Reg_imbal.htm
Table 5: Regional backlog in Maharashtra from 1982-1994
Region Backlog in 1982 Backlog in 1994b
(Cr Rs) (%) (Cr Rs) (%)
Rest of Maharashtra 1,189.38a 37.3 3,378.20 23.6
Marathwada 750.85 23.6 4,004.55 28.8
Vidarbha 1,246.55 39.1 6,624.02 47.6
TOTAL 3,186.78 100 14,006.77 100.00
Source: Removal of regional imbalance, Marathwada Staturtory Development Board, Aurangabad http://msdb.gov.in/htmldocs/Removal_Reg_imbal.htm, Report of Fact Finding Committee on Vidarbha, Planning Commission, Government of India, 2006.
aThe Dandekar Committee in the 1980s assessed Greater Mumbai, Konkan and Western Maharashtra as separate regions; they have been added together here to make ‘Rest of Maharashtra’ for comparison with the backlog figures from the Reconstituted
Indicators and Backlog Committee.bAs submitted by the Reconstituted Indicators and Backlog Committee in Sept. 2000 and accepted by the government.
Endangered WatersGreenpeace India
29
“Backlog in the irrigation sector of Vidarbha increased from 38% in 1982, to an estimated 77.6% in 2007.”
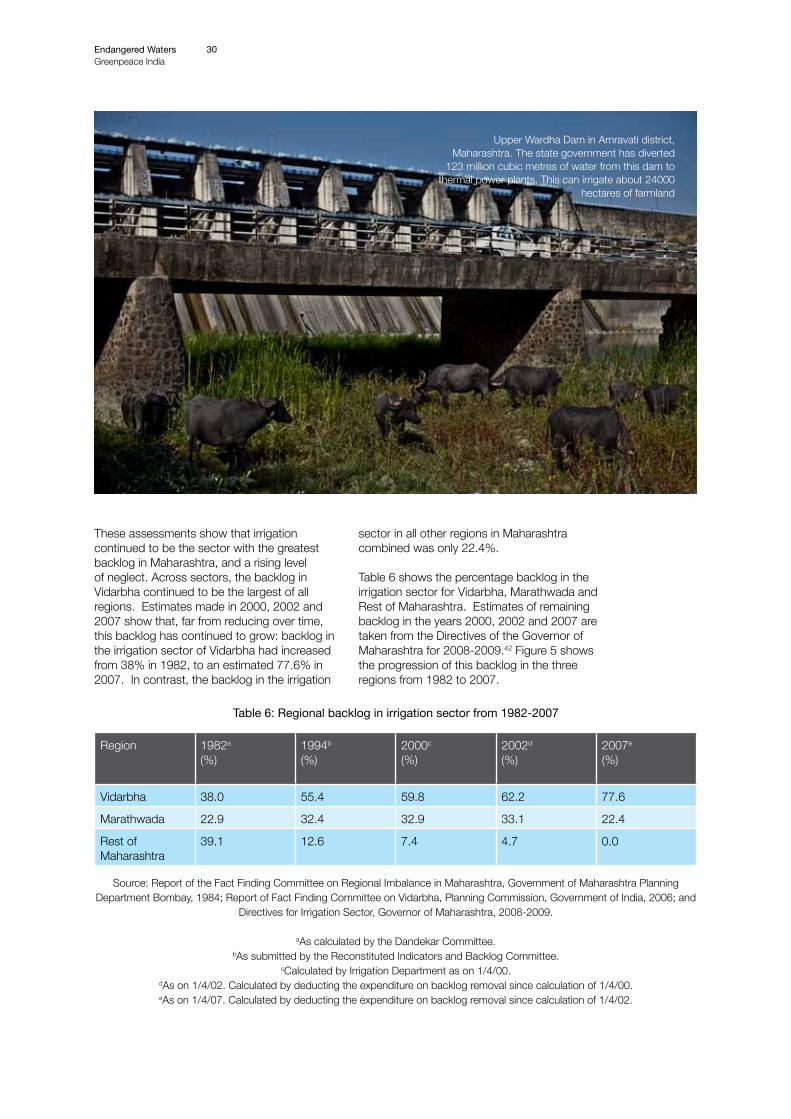
These assessments show that irrigation continued to be the sector with the greatest backlog in Maharashtra, and a rising level of neglect. Across sectors, the backlog in Vidarbha continued to be the largest of all regions. Estimates made in 2000, 2002 and 2007 show that, far from reducing over time, this backlog has continued to grow: backlog in the irrigation sector of Vidarbha had increased from 38% in 1982, to an estimated 77.6% in 2007. In contrast, the backlog in the irrigation
sector in all other regions in Maharashtra combined was only 22.4%.
Table 6 shows the percentage backlog in the irrigation sector for Vidarbha, Marathwada and Rest of Maharashtra. Estimates of remaining backlog in the years 2000, 2002 and 2007 are taken from the Directives of the Governor of Maharashtra for 2008-2009.42 Figure 5 shows the progression of this backlog in the three regions from 1982 to 2007.
Table 6: Regional backlog in irrigation sector from 1982-2007
Source: Report of the Fact Finding Committee on Regional Imbalance in Maharashtra, Government of Maharashtra Planning Department Bombay, 1984; Report of Fact Finding Committee on Vidarbha, Planning Commission, Government of India, 2006; and
Directives for Irrigation Sector, Governor of Maharashtra, 2008-2009.
aAs calculated by the Dandekar Committee.bAs submitted by the Reconstituted Indicators and Backlog Committee.
cCalculated by Irrigation Department as on 1/4/00.dAs on 1/4/02. Calculated by deducting the expenditure on backlog removal since calculation of 1/4/00.eAs on 1/4/07. Calculated by deducting the expenditure on backlog removal since calculation of 1/4/02.
Region 1982a (%)
1994b (%)
2000c (%)
2002d (%)
2007e (%)
Vidarbha 38.0 55.4 59.8 62.2 77.6
Marathwada 22.9 32.4 32.9 33.1 22.4
Rest of Maharashtra
39.1 12.6 7.4 4.7 0.0
Endangered WatersGreenpeace India
30
Upper Wardha Dam in Amravati district, Maharashtra. The state government has diverted
123 million cubic metres of water from this dam to thermal power plants. This can irrigate about 24000
hectares of farmland


A farmer in Ghuikhed village, Amravati district, Maharashtra. The village will soon be submerged by the backwaters of the new Bembla dam, and
residents will have to move to a new location. Some of Ghuikhed’s agricultural lands will remain
above water, however, and these at least have the advantage of receiving irrigation from the Upper Wardha dam in the north. But when water from
Upper Wardha is diverted to power plants, it is these lands, situated at the tail ends of irrigation canals,
which stand to lose their water first.
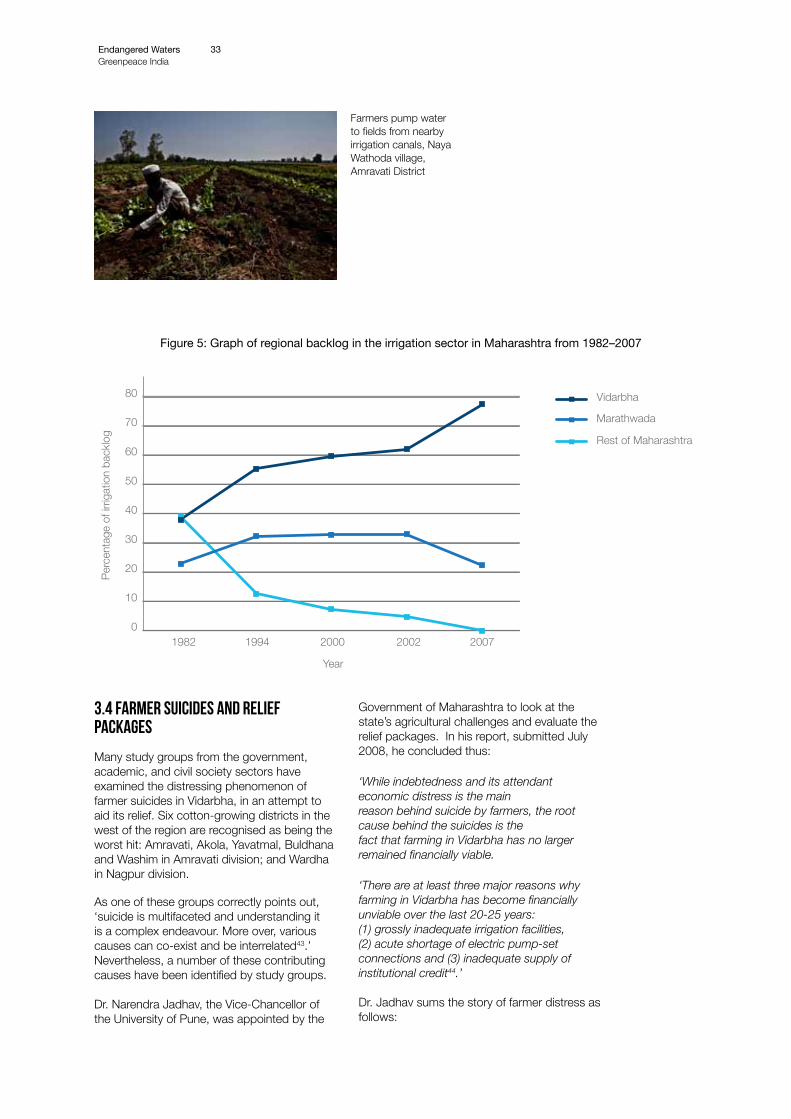
Figure 5: Graph of regional backlog in the irrigation sector in Maharashtra from 1982–2007
3.4 Farmer suicides and relief packages
Many study groups from the government, academic, and civil society sectors have examined the distressing phenomenon of farmer suicides in Vidarbha, in an attempt to aid its relief. Six cotton-growing districts in the west of the region are recognised as being the worst hit: Amravati, Akola, Yavatmal, Buldhana and Washim in Amravati division; and Wardha in Nagpur division.
As one of these groups correctly points out, ‘suicide is multifaceted and understanding it is a complex endeavour. More over, various causes can co-exist and be interrelated43.’ Nevertheless, a number of these contributing causes have been identified by study groups.
Dr. Narendra Jadhav, the Vice-Chancellor of the University of Pune, was appointed by the
Government of Maharashtra to look at the state’s agricultural challenges and evaluate the relief packages. In his report, submitted July 2008, he concluded thus:
‘While indebtedness and its attendant economic distress is the mainreason behind suicide by farmers, the root cause behind the suicides is thefact that farming in Vidarbha has no larger remained financially viable.
‘There are at least three major reasons why farming in Vidarbha has become financially unviable over the last 20-25 years: (1) grossly inadequate irrigation facilities, (2) acute shortage of electric pump-set connections and (3) inadequate supply of institutional credit44.’
Dr. Jadhav sums the story of farmer distress as follows:
Endangered WatersGreenpeace India
33
0
10
20
30
40
50
60
70
80
1982 1994 2000 2002 2007
Year
Perc
enta
ge o
f irri
gatio
n ba
cklo
g
Vidarbha
Marathwada
Rest of Maharashtra
Farmers pump water to fields from nearby irrigation canals, Naya Wathoda village,Amravati District
‘…the support from the Government and the banks for farmers in Vidarbha has steadily declined for over 20 years. As a result, farmers had to rely on costly inputs. Illustratively, instead of bank credit at low interest rates, farmers had to borrow from money lenders at exorbitant interest rates; instead of cost-effective self-generated seeds, farmers had to buy expensive seeds from private companies. Consequently, the cost of farming rose significantly. At the same time, given the paucity of irrigation facilities, farmers had to rely on the vagaries of monsoon, which affected the farm production. At times even when farm production had increased, unremunerative prices meant little or no increase in the income of the farmers. Moreover, during the years of natural calamities there was no supporting income from supplementary activities. As a combined result, indebtedness grew and the farmers were subject to severe economic distress, which also caused damage to their social status. Constant pressures from banks and more so from the unauthorized moneylenders led to severe mental distress, compromising their dignity and resultant frustration drove the selfrespecting farmers to commit suicide45.’
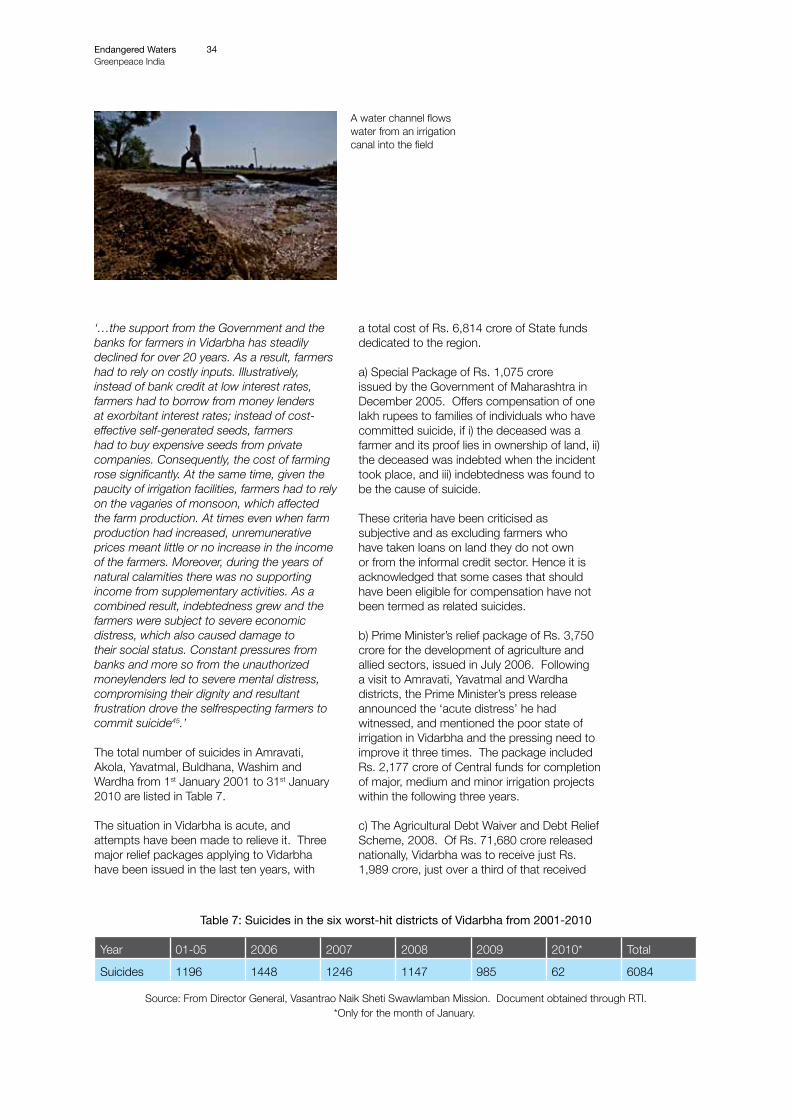
The total number of suicides in Amravati, Akola, Yavatmal, Buldhana, Washim and Wardha from 1st January 2001 to 31st January 2010 are listed in Table 7.
The situation in Vidarbha is acute, and attempts have been made to relieve it. Three major relief packages applying to Vidarbha have been issued in the last ten years, with
Table 7: Suicides in the six worst-hit districts of Vidarbha from 2001-2010
Source: From Director General, Vasantrao Naik Sheti Swawlamban Mission. Document obtained through RTI. *Only for the month of January.
Year 01-05 2006 2007 2008 2009 2010* Total
Suicides 1196 1448 1246 1147 985 62 6084
a total cost of Rs. 6,814 crore of State funds dedicated to the region.
a) Special Package of Rs. 1,075 crore issued by the Government of Maharashtra in December 2005. Offers compensation of one lakh rupees to families of individuals who have committed suicide, if i) the deceased was a farmer and its proof lies in ownership of land, ii) the deceased was indebted when the incident took place, and iii) indebtedness was found to be the cause of suicide.
These criteria have been criticised as subjective and as excluding farmers who have taken loans on land they do not own or from the informal credit sector. Hence it is acknowledged that some cases that should have been eligible for compensation have not been termed as related suicides.
b) Prime Minister’s relief package of Rs. 3,750 crore for the development of agriculture and allied sectors, issued in July 2006. Following a visit to Amravati, Yavatmal and Wardha districts, the Prime Minister’s press release announced the ‘acute distress’ he had witnessed, and mentioned the poor state of irrigation in Vidarbha and the pressing need to improve it three times. The package included Rs. 2,177 crore of Central funds for completion of major, medium and minor irrigation projects within the following three years.
c) The Agricultural Debt Waiver and Debt Relief Scheme, 2008. Of Rs. 71,680 crore released nationally, Vidarbha was to receive just Rs. 1,989 crore, just over a third of that received
Endangered WatersGreenpeace India
34
A water channel flows water from an irrigation canal into the field
by Western Maharashtra. This is due in part to the availability of bank credit to irrigated land, and the debt waiver scheme’s recognition only of formal sector lending. Loans from private moneylenders in Vidarbha are rife, and irrigation is minimal.
3.5 Maharashtra water policy and the diversion of irrigation water
It is clear from the backlog data in sections 3.3 and 3.4 that irrigation remains one of the most neglected sectors, and the farmers of Vidarbha are in severe need. Yet during the same years that Rs. 6,814 crore of public money was allocated to relieve Vidarbha’s distress, including by implementing irrigation programmes, the state government was diverting water from the few irrigation programmes that do exist to thermal power plants.
The Maharashtra State Water Policy, 200346 listed water uses in a different order of priority to the National Water Policy that had been released the year before (see section 2.4). The state priorities were:
1. Domestic use2. Industrial, commercial use and agro-
based industrial use3. Agriculture and hydropower4. Environment and recreation uses5. All other uses.47
Unlike the National Water Policy, priority for water in Maharashtra had been given to industrial and commercial use over irrigation. This remained the legislation until May 2011, when a Government resolution moved agricultural uses to second place, bumping industrial and commercial use to third priority.The resolution mentioned farmer suicides as part of the reason behind the change.48
In the eight years in which industrial water use was prioritised over irrigation, however, many
water allocations and diversions had been made. A High Power Committee (HPC) was created in 2003 to oversee diversions of more than 25% of any water project. The group consisted of six ministers from the ministries of industry, agriculture, finance and water supply, and had the power to take decisions without further consultation. The Maharashtra Water Resources Authority Act of 2005 laid down procedural norms for inter-sectoral water diversions that included a public hearing,49 but the HPC did not adhere to these.
Between 2003 and 2010, the HPC diverted at least 1,500 million cubic metres of water per year from irrigation to non-irrigation purposes (mostly industrial, but also some domestic) from 38 dams across Maharashtra. This is the irrigation water of approximately 300,000 hectares of farmland. When considered with the diversions made by other governmental agencies before and after the HPC, a total of at least 2,885 million cubic metres of water has been diverted from 43 dams in Maharashtra, affecting 357,621 hectares of irrigated area. Of this water, 54% has been diverted to industry, and of that amount, 61% is to thermal power plants, including private power companies. 31% of the diversions are from dams in Vidarbha. This information and more can be found in a 2011 report50 by the Prayas RELI Group, which examined the minutes of 17 of the 25 HPC meetings held from 2003 to January 2010. Therefore, there are almost certainly more diversions than are described here.
Greenpeace obtained the minutes of 20 of 28 meetings of the High Powered Committee held between 2003 and January 2011 through the Right to Information Act of 2005. The amount of irrigation water diverted specifically to thermal power plants in these meetings is presented in table 8, with the source of the water and the equivalent land deprived of irrigation. As the minutes of all meetings were not accessible, the list may not be exhaustive.
Endangered WatersGreenpeace India
35
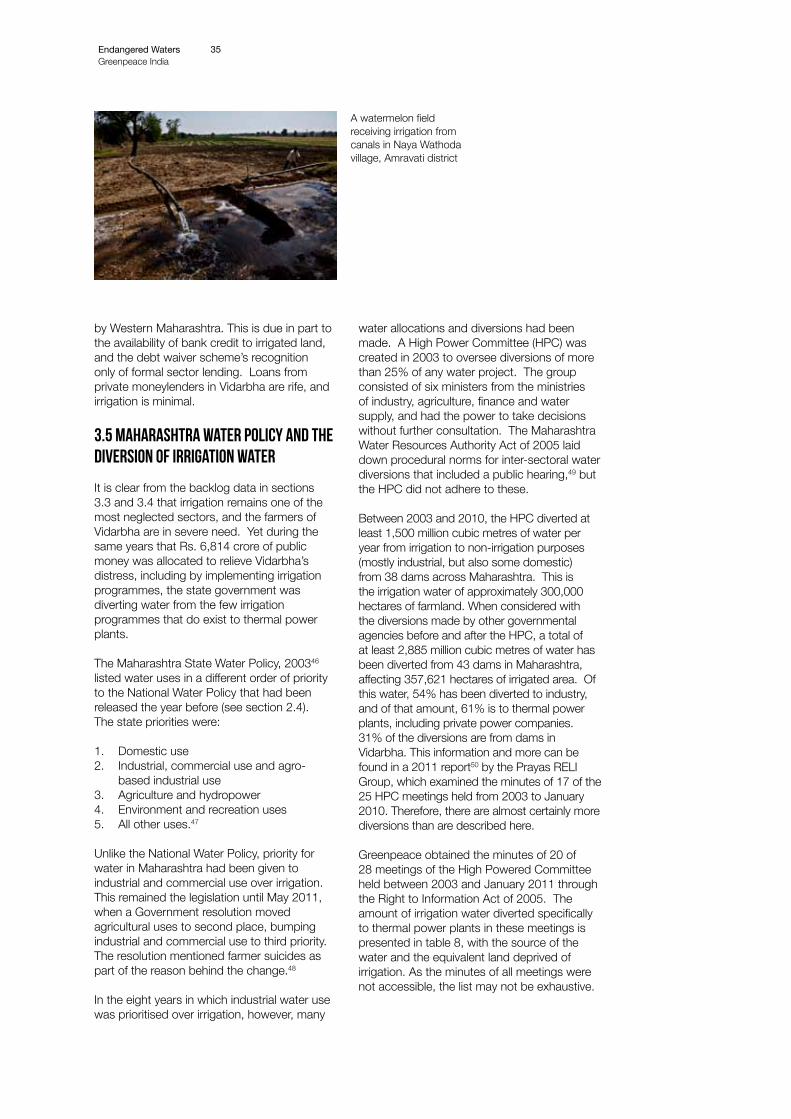
A watermelon field receiving irrigation from canals in Naya Wathoda village, Amravati district
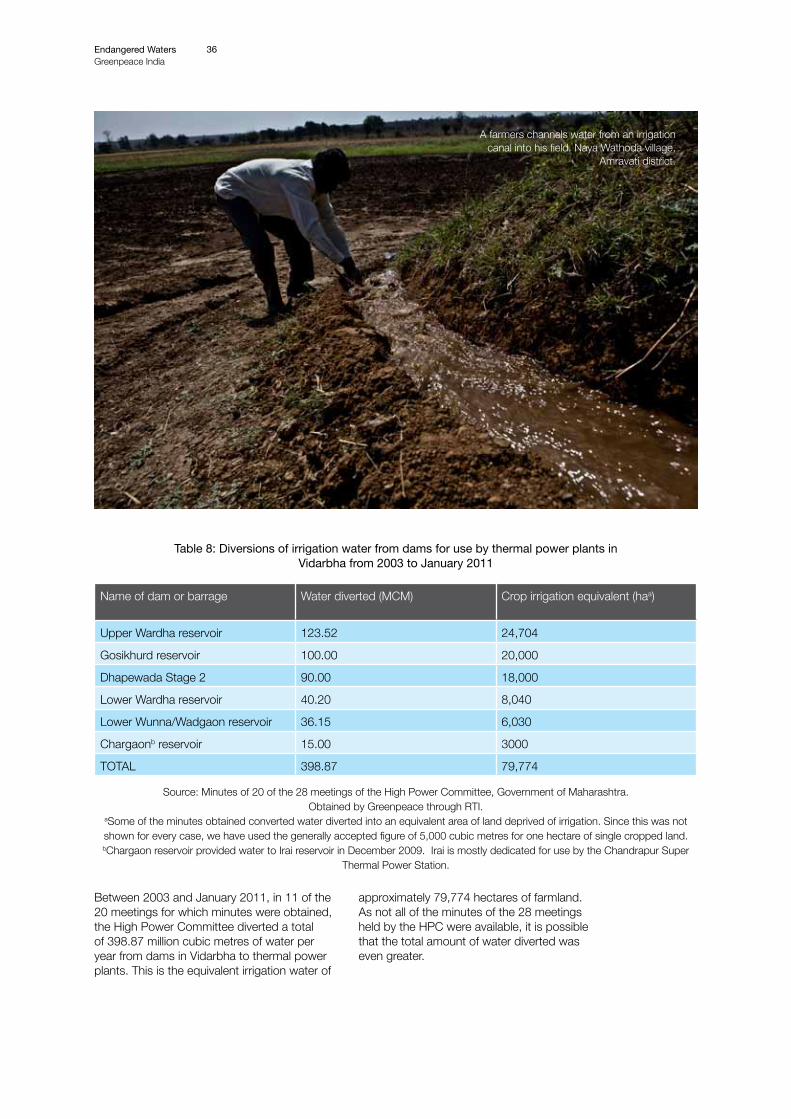
Table 8: Diversions of irrigation water from dams for use by thermal power plants in Vidarbha from 2003 to January 2011
Source: Minutes of 20 of the 28 meetings of the High Power Committee, Government of Maharashtra. Obtained by Greenpeace through RTI.
aSome of the minutes obtained converted water diverted into an equivalent area of land deprived of irrigation. Since this was not shown for every case, we have used the generally accepted figure of 5,000 cubic metres for one hectare of single cropped land.bChargaon reservoir provided water to Irai reservoir in December 2009. Irai is mostly dedicated for use by the Chandrapur Super
Thermal Power Station.
Between 2003 and January 2011, in 11 of the 20 meetings for which minutes were obtained, the High Power Committee diverted a total of 398.87 million cubic metres of water per year from dams in Vidarbha to thermal power plants. This is the equivalent irrigation water of
approximately 79,774 hectares of farmland. As not all of the minutes of the 28 meetings held by the HPC were available, it is possible that the total amount of water diverted was even greater.
Endangered WatersGreenpeace India
36
Name of dam or barrage Water diverted (MCM) Crop irrigation equivalent (haa)
Upper Wardha reservoir 123.52 24,704
Gosikhurd reservoir 100.00 20,000
Dhapewada Stage 2 90.00 18,000
Lower Wardha reservoir 40.20 8,040
Lower Wunna/Wadgaon reservoir 36.15 6,030
Chargaonb reservoir 15.00 3000
TOTAL 398.87 79,774
A farmers channels water from an irrigation canal into his field. Naya Wathoda village,
Amravati district.
There is no evidence that the cumulative impact of existing development on water resources is taken into consideration when setting capacity targets, or granting water allocations and environmental clearances to thermal plants and other similar development projects.
The Department of Civil Engineering of Indian Institute of Technology, Delhi, has analysed the present and future water demands to be placed upon the river Wardha in western Vidarbha, including 552.52 million cubic metres (MCM) of water per year from 27 thermal power plants. The study, titled Impact of Water Resources Projects - a case study of Wardha, is authored by Prof. A. K. Gosain, Dr. Rakesh Khosa and Mr. Jatin Anand.
The study focuses on the hydrology of Wardha sub-basin of Godavari river basin, which occupies the area between latitudes 19° 18’N and 21° 58’N and longitudes 77° 20’E and 79° 45’E.
A hydrologic modeling-based approach is followed to assess the overall water resources potential of Wardha sub-basin and, additionally, to evaluate the impacts of various development schemes that fall in the following categories:
• Schemes currently in operation• Virgin basin condition • Schemes under implementation • Schemes already approved but yet to be
implemented (including proposed water requirements for thermal power plants in the River basin).
The hydrologic model of the study area was developed using the SWATn application platform and simulations obtained for the four aforementioned development scenarios.
WATER AVAILABILITY IN RIVER WARDHA:NEW STUDY BY IIT DELHI
4.1 Weather and land data
The model analyses the river basin using information about watershed boundaries, elevation of the land from satellite topography pictures available from CIAT,o land use data from the Global Land Cover Facility and soil-related information from the Digital Soil Map prepared by the FAO. Weather data from stations within the region including IMD gridded precipitation data are incorporated to provide the most representative hydro-meteorological history available. Other meteorological data required by SWAT (solar radiation, wind speed, and relative humidity) are estimated using the SWAT weather generator.
4.2 Flow measurements
The flow in Wardha is observed at the Central Water Commission’s Gauge & Discharge (G&D) site at Ghugus where it drains an area of 19,759.95 square kilometres. The site is located upstream of the confluence of Wardha with Penganga.
4.3 Virgin, present and future scenarios
The simulations were done for three scenarios: virgin, present and future. The virgin scenario has no man-made constraints on the river: no reservoirs, canals nor any water diverted for irrigation, domestic or industrial purposes.
The present scenario is assumed as of 2009, incorporating information on the various reservoirs and irrigation projects from the National Register of Large Damsp, as well as water accounts data received from the Maharashtra Water Resources Development Centre. These water accounts also provide the
Endangered WatersGreenpeace India
37
04
nhttp://swatmodel.tamu.edu/.ohttp://srtm.csi.cgiar.org/.phttp://www.cwc.nic.in/main/downloads/National%20Register%20of%20Large%20Dams%202012.pdf
present state of utilisation and allocations for six major projects commissioned between 2005 and 2010, which are included in the modelling.
The list of reservoirs included in the IIT study are listed in table 9. The three dams listed as under construction are included in the future scenario.
The water requirements of the thermal power plants that have been proposed in the region are presented separately after the future
scenarios have been predicted. According to the data received from Vidarbha Irrigation Development Corporation, 27 thermal power plants, with a total water requirement of 555.52 million cubic metres of water per year, are proposed to be set up in the Wardha sub-basin.
4.4 Results of the studyAs the flow observations available were for the period of 1991 to 2004, this period was used for calibration of the model. Simulations were
Endangered WatersGreenpeace India
38
Reservoir River Year of commissioning Volume (MCM)
Upper Wardha Wardha 1993 786.48
Bor Bor 1965 138.75
Lower Wardha Wardha Under construction 253.34
Malkhed Kholad 1972 10.90
Wadgaon Wadgaon 1997 152.60
Dham Dham 1986 72.46
Lower Wunna (Nand) Nand 1990 62.18
Bembla Bembla Under construction 322.07
Pothara Pothara 1983 38.40
Lal Naala Pothara Under construction 10.00
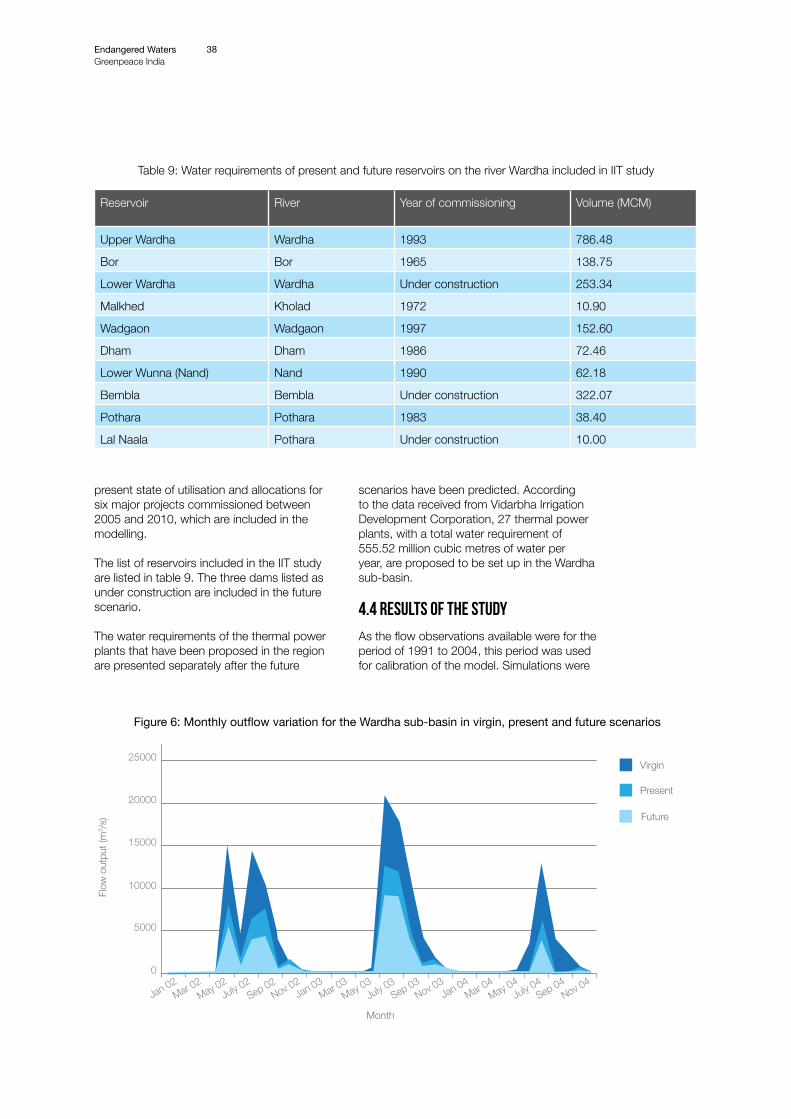
Table 9: Water requirements of present and future reservoirs on the river Wardha included in IIT study
Jan 02Mar 02
May 02July 0
2Sep 02
Nov 02Jan 03
Mar 03May 03
July 03Sep 03
Nov 03Jan 04
Mar 04May 04
July 04Sep 04
Nov 040
5000
10000
15000
20000
25000
Flow
out
put (
m3 /s
)
Month
Present
Virgin
Future
Figure 6: Monthly outflow variation for the Wardha sub-basin in virgin, present and future scenarios
River Wainganga flows through Bhandara, Gondia and Gadchiroli districts of western Vidarbha
then carried out for the three scenarios for the period of 1969 to 2005.
An extract of these results (for the years 2002 to 2004) for virgin present baseline and future conditions are shown in figure 6, allowing comparison between stream flow regimes for the three indicated developmental scenarios. The future trace does not include water requirements of thermal power plants. In its virgin state, the river Wardha has an annual mean flow of 3,679.19 MCM.
With the commissioning of projects, namely (i) Lower Wunna, (ii) Bor, (iii) Dham, (iv) Upper Wardha Dam, (v) Vadgaon Dam, (vi) Malkhed Project, and (vii) Pothara, the annual mean flow at the basin outlet shows a reduction from 3,679.19 MCM to the ‘present’ state of 1,857.01 MCM.
With the construction of reservoir projects, namely (i) Bembla Project, (ii) Lal Nala, and (iii) Lower Wardha dam, the annual mean flow at the basin outlet as simulated by the hydrologic model shows a further reduction of annual flow to 1,419.42 MCM. This is the future state, not accounting for water requirements of thermal power plants.
For the additional projected demand for 552.52 MCM of water expected to be made
by the various thermal power plants that are at various stages of the approval process, there would be practically very little water available and management of the facilities, with any stated dependability level would require storage capacities to be created to cater to the additional demands.
Table 11 presents some of the important statistics derived from model-simulated runoff for present and future conditions respectively. The statistics are based on averages computed for two horizons, namely (i) 1981-1992, and (ii) 1993-2004.
The future demands on the river are clearly shown to cause a reduction from the present condition in the amount of water availablein the river, across both time horizons. It is pertinent to note that the average annual precipitation for the years 2001-2004 horizon is also over 26% less as compared with the average annual precipitation for the horizon from 1970-1980.
Endangered WatersGreenpeace India
41
River Wainganga
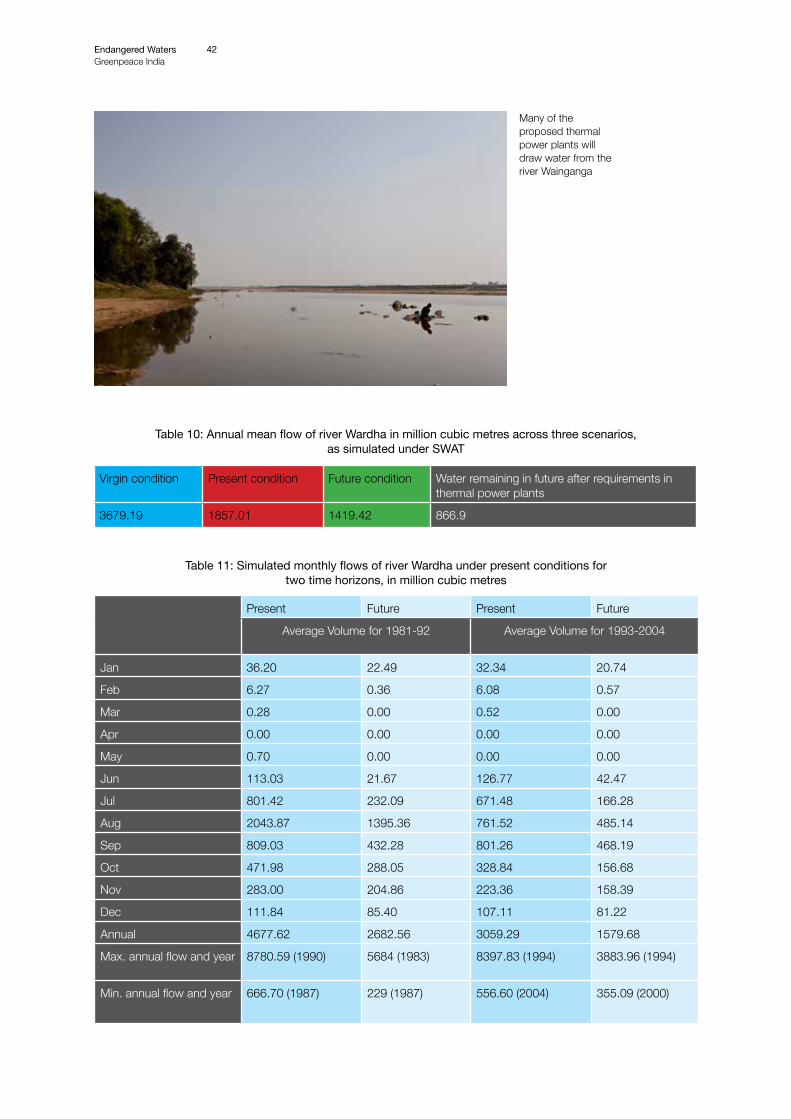
Table 10: Annual mean flow of river Wardha in million cubic metres across three scenarios, as simulated under SWAT
Virgin condition Present condition Future condition Water remaining in future after requirements in thermal power plants
3679.19 1857.01 1419.42 866.9
Present Future Present Future
Average Volume for 1981-92 Average Volume for 1993-2004
Jan 36.20 22.49 32.34 20.74
Feb 6.27 0.36 6.08 0.57
Mar 0.28 0.00 0.52 0.00
Apr 0.00 0.00 0.00 0.00
May 0.70 0.00 0.00 0.00
Jun 113.03 21.67 126.77 42.47
Jul 801.42 232.09 671.48 166.28
Aug 2043.87 1395.36 761.52 485.14
Sep 809.03 432.28 801.26 468.19
Oct 471.98 288.05 328.84 156.68
Nov 283.00 204.86 223.36 158.39
Dec 111.84 85.40 107.11 81.22
Annual 4677.62 2682.56 3059.29 1579.68
Max. annual flow and year 8780.59 (1990) 5684 (1983) 8397.83 (1994) 3883.96 (1994)
Min. annual flow and year 666.70 (1987) 229 (1987) 556.60 (2004) 355.09 (2000)
Table 11: Simulated monthly flows of river Wardha under present conditions for two time horizons, in million cubic metres
Endangered WatersGreenpeace India
42
Many of the proposed thermal power plants will draw water from the river Wainganga
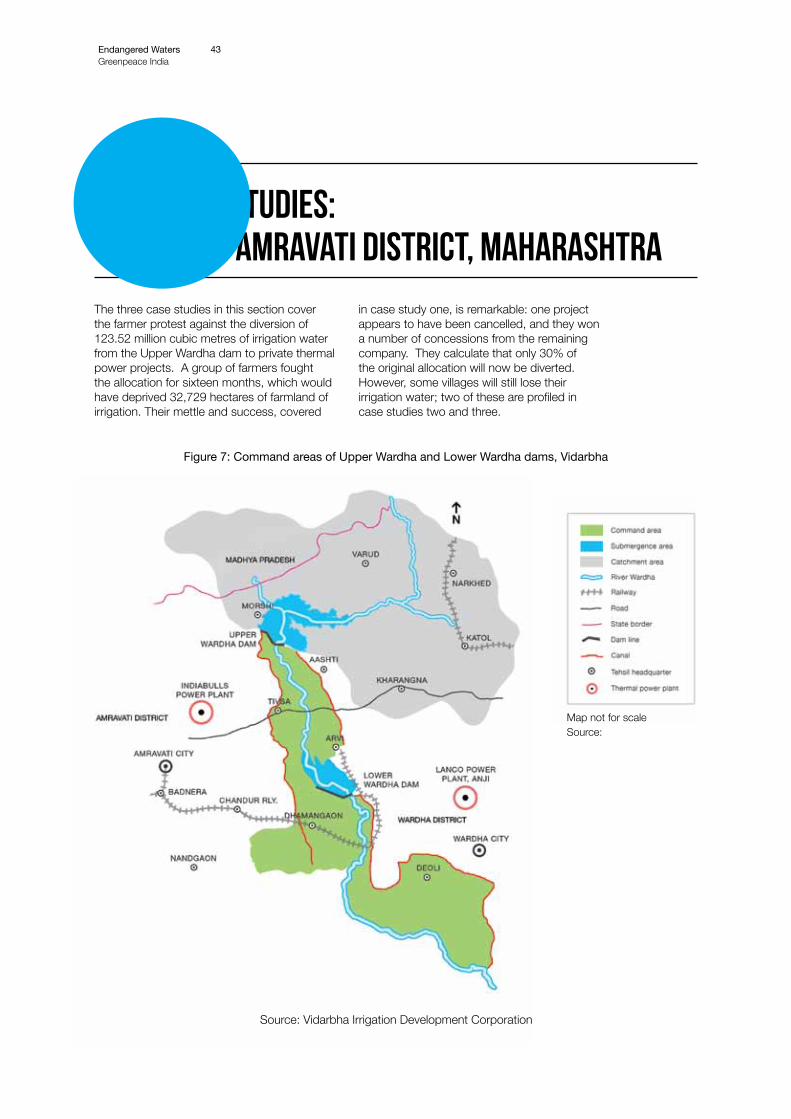
The three case studies in this section cover the farmer protest against the diversion of 123.52 million cubic metres of irrigation water from the Upper Wardha dam to private thermal power projects. A group of farmers fought the allocation for sixteen months, which would have deprived 32,729 hectares of farmland of irrigation. Their mettle and success, covered
Case studies: from Amravati district, Maharashtra
in case study one, is remarkable: one project appears to have been cancelled, and they won a number of concessions from the remaining company. They calculate that only 30% of the original allocation will now be diverted. However, some villages will still lose their irrigation water; two of these are profiled in case studies two and three.
Figure 7: Command areas of Upper Wardha and Lower Wardha dams, Vidarbha
Source: Vidarbha Irrigation Development Corporation.
Endangered WatersGreenpeace India
43
Map not for scaleSource:
05
Source: Vidarbha Irrigation Development Corporation

Endangered WatersGreenpeace India
44
Farmers in a public meeting discussing the impacts of
upcoming thermal power plants in Bhandara District
Endangered WatersGreenpeace India
45
Case stuDY IThe fightAmravati district, Maharashtra
The five men clung tightly to the skeleton of the telecom tower, shouting they would not let their irrigation water be diverted to a power plant. On the ground 250 feet below, more farmers rushed from their demonstration at the tahasil office to stare up at their fellow protesters. This hadn’t been part of the andolan plan, but the farmers viewed the water diversions as a matter of life and death, and emotions were running high. The men on the ground began to shout too, and address the gathering crowds. Traffic jammed, and police looked on in confusion – if they tried to forcibly remove the protesters from the tower, the men had threatened to jump. The situation was now high-profile, and government officials had warned the police not to take any wrong action. As night fell they arranged lights, and the crowds on the road cooked dinner, sending food and water to the protesters up the tower in a basket.
The men stayed on the tower for eight hours, descending only once the District Collector had arranged a meeting between the farmers and Ajit Pawar, then the Minister of Water Resources for Maharashtra, the following week. Determined, the core group travelled to Mantralaya in Mumbai to meet him, as well as other MLAs and the MP of Amravati, their home district. The ministers and the farmers spoke for over an hour about the diversions of irrigation water to thermal power plants in Vidarbha, which had been sanctioned by the government. In particular, they protested the allocation of 87.60 million cubic metres (MCM) of water to a power plant called Indiabulls, which would deprive 23,219 hectares of farmland in Amravati and Wardha districts of irrigation water.
“Ajit Pawar assured us not a single drop of water would be taken from irrigation,” remembers Sanjay Kolhe, an Amravati farmer and one of the leaders of the protest. “He said he also belongs to a farmer family, so how could he hurt the farmers of the state.”
The farmers thanked the officials and returned to Amravati to wait for confirmation of the promise in writing. But when the resolution of the meeting arrived two weeks later, it promised only to try and search out new sources of water for irrigation. The diversion of existing irrigation water to thermal power plants would continue. The farmers were bitterly disappointed. “It was totally false,” says Sanjay. In December they performed a tervi for Pawar, as well as Maharashtra MLA Rajendra Darda and Lok Sabha MP Datta Meghe.
*******Rewind two years to 21st February 2008. The Hon. Ministerial High Power Committee of Maharashtra, a group chaired by the Minister of Water Resources and consisting of ministers from irrigation, industry, agriculture, water supply and finance departments, holds a meeting.
Mandated to deal with diversions of water from existing allocations, in this meeting the group considers an application by Indiabulls Power Limited for a 2,640 MW coal-based thermal power plant in Nandgaon Peth industrial area, Amravati district. The group decides to allocate the plant water from the Upper Wardha dam, 30 kilometres away. They calculate that this demand will deprive 23,219 hectares of irrigation.51 The diversion is approved.
On 28th April 2008, the High Power Committee examines another application for water, this time from Amravati Thermal Power Company Private Limited. The company seeks 35.92 MCM of water each year for a 1,320 MW coal-fuelled power plant, also in Nandgaon Peth industrial area. Again, the committee directs that water should be taken from the Upper Wardha dam.
In just two months, the committee has diverted water from 32,729 hectares of irrigated farmland to thermal

power plants, or 41% of the total command area of the Upper Wardha dam.q
Nearly two years later, Sanjay Kolhe and the farmers of Amravati district begin their fight to claw it back.
*******
The Upper Wardha dam, or the Nal Damayanti Sagar, to give it its official and rarely-used name - blocks the Wardha river not long after it begins, on the border of Amravati and Wardha districts in western Vidarbha. The dam’s oceanic backwaters submerged 2,696 houses and 24,078 acres of land across both districts, but promised that 77% of the water collected would be distributed as irrigation, and almost all of the remainder as drinking water for the townships. Consequently, the project encountered little opposition. “The rehabilitated people were given very low compensation, but water was very much in need,” says Sanjay, whose uncle was amongst those who lost land to the dam. “No one wanted to protest too much as they knew their brother would be able to take a bumper crop.”
Irrigation began in 1993 via two canals: one on the right bank into Amravati, and one on the left bank to Wardha district. The canals were extended over time, and by 2009 the dam could provide irrigation to a projected area of 80,250 hectares of farmlandr. In Amravati district, the canal ran for 95 kilometres. Farmers receiving irrigation were able to take a second or even third crop per year, and yield increased accordingly. When building their case against the water diversions, Sanjay and the farmers collected data from local markets, which they say show food produce in Amravati had increased. Cotton - the crop grown predominantly as kharif in the dry landholdings of western Vidarbha - could also be left longer in the ground, and Sanjay says his cotton yield tripled as a result. For an early summer visitor, the difference between irrigated and non-irrigated land is immediately obvious: areas that draw from the canals are plump and green; those that do not are brittle and dry.
By 2008, the Upper Wardha dam had no spare water to send to power plants; in fact it seems its reserves were already over-allocated. The fourth revised project estimate of the dam,52 a government document produced in April 2009, shows the various utilisations of the dam water, as well as attempts to accommodate the sanctions for power plants made by the High Powered Committee. Only three pages of the document were provided to the Amravati farmers in response to their application through RTI.
From the 3rd Revised Estimate (see middle column of image, pg 47) to the 4th (right hand column of image, pg 47), the amount of water allocated for irrigation has reduced by two thirds (from 302.78 to 200.203 MCM), and even the allocation for drinking water has reduced slightly (79.72 to 77.329 MCM). Evaporation losses from the dam have also reduced to around three quarters of their previous level (93.26 to 68.535 MCM), though there is no explanation how this may have happened. Water for industrial use increased by about 150% (10 to 24.735 MCM). In total, these water utilisations add up to 370.802 MCM, though it is written above that only 327.467 MCM of water is available for use. Additional sanctions of 123.52 MCM are then made for thermal power plants. There is no explanation in the available documents of where this water is expected to come from.
When a power plant is built on public land, part of the clearance process is a consultation of the people living nearby. However, when a power plant is built on industrial land such as the land at Nandgaon Peth, there is no obligation to inform or consult the local people, as if land were the only resource to be used. No one informed the Amravati farmers that their irrigation water was being diverted; they were left to find out through a newspaper article and RTI documents such as the one above. Their discovery of the apparent apathy of their government to the fate of farmers left them feeling deeply betrayed.
“The reason these projects get placed in Vidarbha is because the land is cheap, and they know farmers are financially weak and no prominent or strong politician stands behind them,” says Nandu Kherde, a farmer and activist who was also part of the core Amravati protest group. “They don’t want these battles to be fought in Western Maharashtra.”
Endangered WatersGreenpeace India
46
qUsing HPC/Indiabulls ratio of 3,774 m3 water required for 1ha irrigation. 123.52 MCM water for both power plants therefore deprives 32,729ha of irrigation, or 41% of 80,250 ha, which is the total command area as defined by the Dept. of Water Resources. rAs stated in letter from the Assistant Chief Engineer, Department of Water Resources, Amravati. Document obtained by Sanjay Kolhe through the Right to Information Act, 2005.
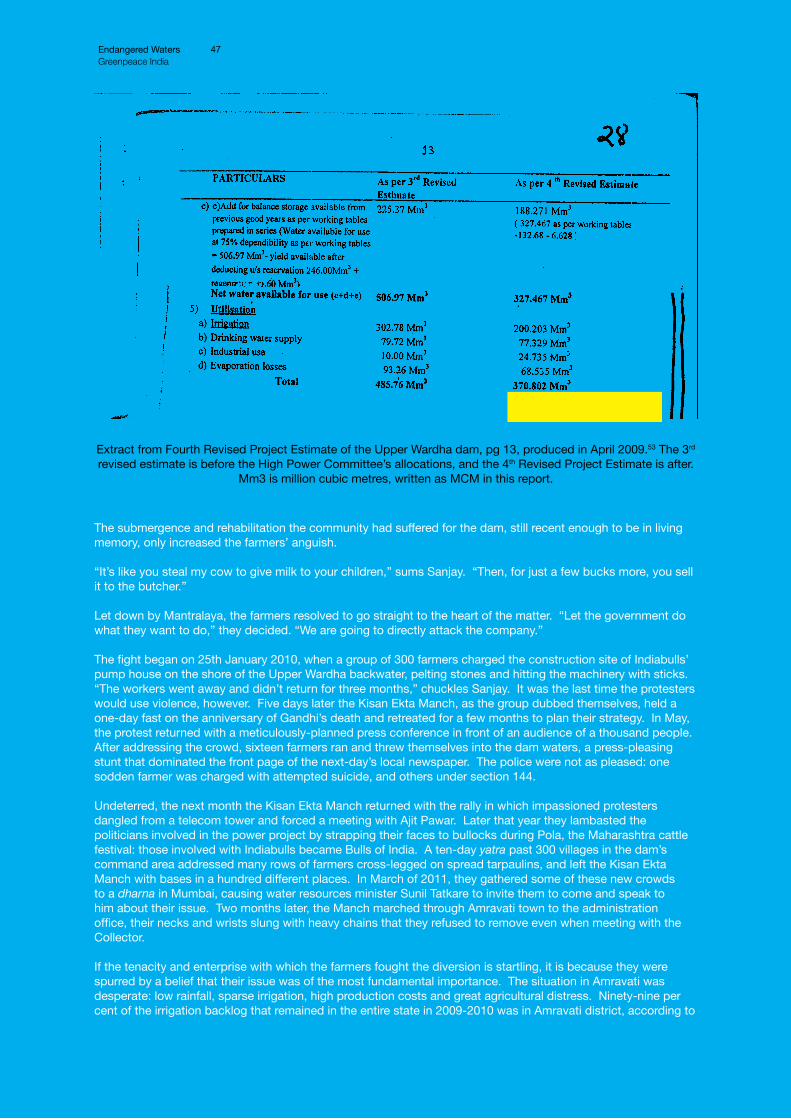
Endangered WatersGreenpeace India
47
The submergence and rehabilitation the community had suffered for the dam, still recent enough to be in living memory, only increased the farmers’ anguish.
“It’s like you steal my cow to give milk to your children,” sums Sanjay. “Then, for just a few bucks more, you sell it to the butcher.”
Let down by Mantralaya, the farmers resolved to go straight to the heart of the matter. “Let the government do what they want to do,” they decided. “We are going to directly attack the company.”
The fight began on 25th January 2010, when a group of 300 farmers charged the construction site of Indiabulls’ pump house on the shore of the Upper Wardha backwater, pelting stones and hitting the machinery with sticks. “The workers went away and didn’t return for three months,” chuckles Sanjay. It was the last time the protesters would use violence, however. Five days later the Kisan Ekta Manch, as the group dubbed themselves, held a one-day fast on the anniversary of Gandhi’s death and retreated for a few months to plan their strategy. In May, the protest returned with a meticulously-planned press conference in front of an audience of a thousand people. After addressing the crowd, sixteen farmers ran and threw themselves into the dam waters, a press-pleasing stunt that dominated the front page of the next-day’s local newspaper. The police were not as pleased: one sodden farmer was charged with attempted suicide, and others under section 144.
Undeterred, the next month the Kisan Ekta Manch returned with the rally in which impassioned protesters dangled from a telecom tower and forced a meeting with Ajit Pawar. Later that year they lambasted the politicians involved in the power project by strapping their faces to bullocks during Pola, the Maharashtra cattle festival: those involved with Indiabulls became Bulls of India. A ten-day yatra past 300 villages in the dam’s command area addressed many rows of farmers cross-legged on spread tarpaulins, and left the Kisan Ekta Manch with bases in a hundred different places. In March of 2011, they gathered some of these new crowds to a dharna in Mumbai, causing water resources minister Sunil Tatkare to invite them to come and speak to him about their issue. Two months later, the Manch marched through Amravati town to the administration office, their necks and wrists slung with heavy chains that they refused to remove even when meeting with the Collector.
If the tenacity and enterprise with which the farmers fought the diversion is startling, it is because they were spurred by a belief that their issue was of the most fundamental importance. The situation in Amravati was desperate: low rainfall, sparse irrigation, high production costs and great agricultural distress. Ninety-nine per cent of the irrigation backlog that remained in the entire state in 2009-2010 was in Amravati district, according to
Extract from Fourth Revised Project Estimate of the Upper Wardha dam, pg 13, produced in April 2009.53 The 3rd revised estimate is before the High Power Committee’s allocations, and the 4th Revised Project Estimate is after.
Mm3 is million cubic metres, written as MCM in this report.

the Governor of Maharashtra – some 257,518 hectares of standard rabi equivalent.54 Introducing such a water-intensive industry as thermal power generation, and in particular diverting water to it from the few irrigation programmes already existing, was madness.
“Power is essential for the world,” stipulates Sanjay. “But it is totally wrong to divert irrigation water to thermal power plants and to let farmers die.”
Government documents obtained by the Kisan Ekta Manch showed 1,294 farmers had committed suicide in Amravati between 2001 and 2010: a figure surpassed only by Yavatmal district in the whole of Vidarbha. The reasons for suicide are many and complex but irrigation is accepted as being a major factor in relieving agricultural hardships, and the Manch worried that diverting the precious resource would push farmers over the edge.
“The power is made from farmers’ infrastructure and then used only for urban and industrial areas, so the amount of farmer suicides will rise,” Sanjay continues. “In this sense, the policy of the government is totally negative. If you want power, you can look at non-conventional energy. Otherwise coal will be finished, water will be finished and then the power will also be finished. There will be nothing left for the next generation, and then what will we do? We should leave them something positive.”
The next generation sometimes joined the protest. One year into the fight, Indiabulls tried to lay its pipelines from the Upper Wardha dam to the power plant, and the Kisan Ekta Manch blockaded the site. Children sat on top of the unbroken ground while adults around them held placards and chanted their dissent. The work was delayed for two months.
In all, the protest created a lot of problems for the company, forcing it to make a number of costly concessions to the farmers. These included moving the location of the pump house and installing an outpost next to it for protection, staffed day and night by armed guards. The farmers under whose land the water pipeline was eventually laid say the company was forced to quintuple the compensation for this service, from Rs. 15,000 to Rs. 75,000. When the company carried out stone blasting near Sanjay’s hotel, he charged them one lakh rupees for every stone that hit his property: a grand total of five.
“We wanted to teach them that going against the will of the local people is not advisable, and not profitable,” explains Sanjay. Over the course of the farmers’ fight the share price of Indiabulls Power Ltd. dropped by 46%,55 which Sanjay attributes to the trouble caused by the Manch. Delays and public protest are damaging for a company aiming to turn a profit, and a compromise often makes better economical sense. The Chairman of Indiabulls has met Sanjay Kolhe three times.
Plans for Amravati Thermal Power Ltd., the second power plant to which water from Upper Wardha power plant had been diverted, had meanwhile quietly melted away; Sanjay says Ashok Chavan told him that the project had been cancelled. A business media article records a letter from the company to the power ministry, citing local resistance as the reason the plant was unable to make progress and hence was shifting to Bhandara district.56
On the 27th of May 2011, sixteen months after the farmers had first attacked the pump house, they received a letter from Indiabulls Power Limited. “We request you to kindly cooperate with us by withdrawing the agitation started by your Manch,” the letter read. It promised to lay only a single water pipeline of 1,200 mm from the Upper Wardha dam to the power project.
The farmers were broke, they were tired, and many of the core group had court cases pending against them. Sanjay consulted with an engineer who told him that the pipeline would not be able to transport more than 100 million litres per day from the dam, or 36.5 MCM of water per year: just over 40% of the original allocation to the power plant. The Manch held a meeting and decided, finally, to halt their andolan. “We felt we had saved 60% of the water [from Indiabulls],” says Sanjay. “What more could we do?”
Endangered WatersGreenpeace India
48
Case stuDY IITwice damnedGhuikhed village, Chandur Railway taluka, Amravati district
Ghuikhed village cowers at the tail ends of the Upper Wardha irrigation network, one hundred kilometres from the dam. These furthest reaches of the right bank canal were constructed only three years ago, and provide irrigation to roughly a quarter of the Ghuikhed’s 600 acres. Farmers have since grown wheat, gram, chana and groundnut as their rabi crop, but this small security is now threatened by the diversion of irrigation water to Indiabulls thermal power plant.
“If the water is diverted to Sophia, naturally nothing will be left for us because we are at the tail ends,” says farmer Umanand Jamdapure, referring to the power plant by its colloquial name. “The extra crop we are trying to get won’t come.”
Farmers say irrigation has increased crop yield in Ghuikhed by two thirds, as well as raising the general level of water in the ground and the wells. The village has formed three Water User Associations to deal purely with the timing and supply of irrigation. They want it to be released more often, and they want more individual attention: sometimes excess water flows through the end of the sub-canals to flood their fields, and not all of the canals are properly lined to prevent seepage of the precious resource. Down here, though, no-one listens to their grievances. Ghuikhed joined the Amravati fight to claw back what they could of the diverted irrigation water (see case study I), but the victory fell short of saving their own village: the power plant will still draw from the dam, and when it does less water will be channelled out for irrigation. Logically, it will be those seven villages at the fingertips of the right bank canal that will be the first to suffer.
Aside from the recent irrigation programme, Ghuikhed has not been a particularly fortunate village. Roughly one in seven live below the poverty line, and there are many landless labourers amongst the seven thousand residents. The village’s recent memory attests that the average rains are decreasing, and for the last two years the farmers have had to resow their kharif seedlings because the rains failed to arrive on time: a costly as well as time-consuming task.
Water is a paradoxically relentless issue - twenty kilometres from the village is the newly-built Bembla dam. The holding wall of the dam is complete, and last year the backwater began to pool. It engulfed Ghuikhed’s southern fields and some of its housing before retreating, leaving the edge of the village a derelict landscape of half-gone houses and piles of shattered roof tiles.
Panchfula Yashwant Bankar’s son died trying to fetch his cattle from their compound when the water came rushing in. The cows could swim and survived, but Ramesh could not, and drowned. Panchfula and her daughter-in-law sit helplessly on the ground outside the wreckage of the house; they say they haven’t yet received their rehabilitation money so can’t even move away from the place.
Each monsoon the backwater will come a little higher, and every dry season sink back a little less. Within a few years the south side of Ghuikhed will be completely submerged and all houses must shift to another location within the village boundary. Left behind will be Ghuikhed’s most prized asset: a 14th century heritage temple. An immense wall is being built to try and isolate it from the water: an optimistic leaflet shows the compound as an island with steps leading up from a serene lake.
“We are greatly hurt,” says farmer Gajanan Rambhau Shahade, surveying the wreckage of the village. Ghuikhed is being hit twice: forced to shift for a dam that will not give them irrigation, and losing the irrigation on their remaining land – that from the Upper Wardha dam - to a thermal power plant. “Dam: damned,” Gajanan remarks.
The portrait of former President of India and former Amravati MP, Pratibha Patil hangs in the Gram Panchayat office, along with those of other leaders, but evidence of their touch is hard to come by in this village. The
Endangered WatersGreenpeace India
49

various debt waiver and relief schemes released for Vidarbha included Ghuikhed, but loans on land bigger than five acres still had to be repaid at least in part by the farmers themselves, and so many remain in debt. Gajanan says the rehabilitation money received for ten submerged acres is barely enough to purchase one, and so he doesn’t know how he will move forward. There have been no suicides in Ghuikhed, partly as the staggered rehabilitation money received for houses and land has cushioned the hard times. But people will soon have to pay to construct their new houses and village infrastructure, he says, “so now who knows?”
Bhajans from the temple waver in the otherwise still air, across the half-dissolved mud houses that stand like jagged teeth in the stifling heat of a Vidarbha summer.
Endangered WatersGreenpeace India
50
The changing landscape of Ghuikhed village, Amravati district, Maharashtra. The village has already been partly submerged by the rising backwaters of Bembla dam during recenr monsoons, and will soon be submerged completely. All residents will have to move to a new location. Some of Ghuikhed’s agricultural lands remain
above water, however, and these at least have the advantage of receiving irrigation from the Upper Wardha dam in the north. But when water from Upper Wardha is diverted to power plants, it is these lands, situated at the tail
ends of irrigation canals, which stand to lose their water first.
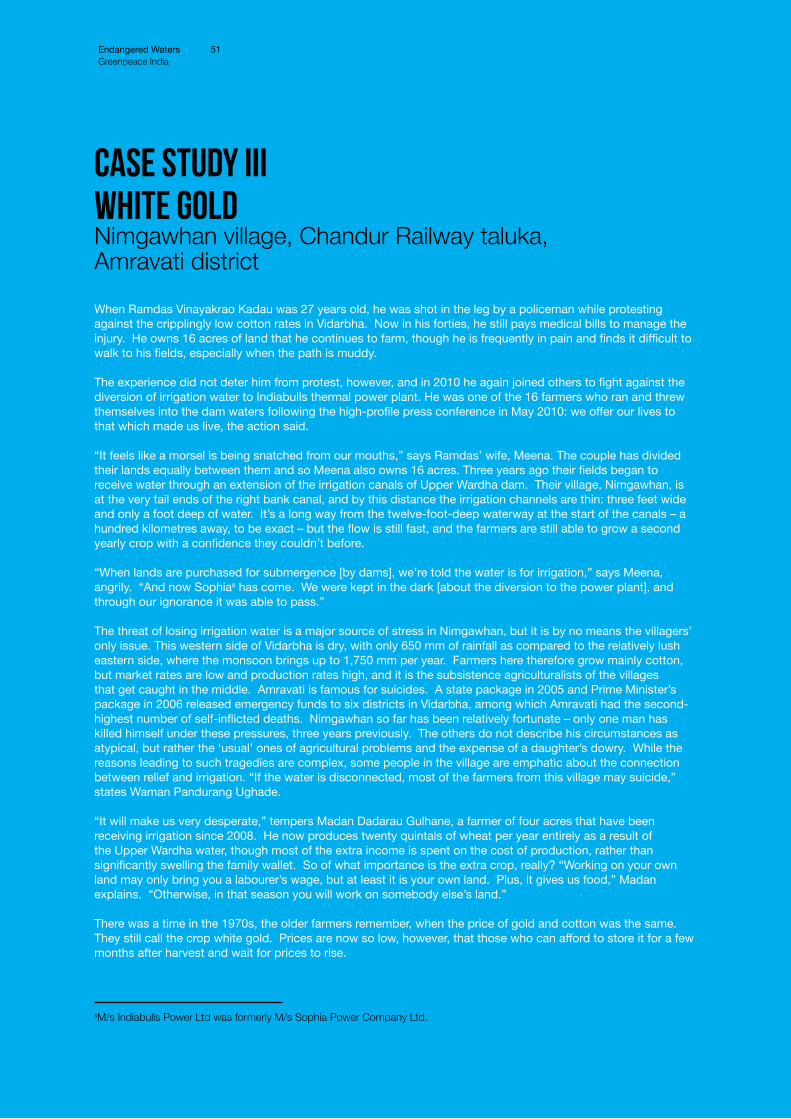
Case stuDY IIIWhite goldNimgawhan village, Chandur Railway taluka, Amravati district
When Ramdas Vinayakrao Kadau was 27 years old, he was shot in the leg by a policeman while protesting against the cripplingly low cotton rates in Vidarbha. Now in his forties, he still pays medical bills to manage the injury. He owns 16 acres of land that he continues to farm, though he is frequently in pain and finds it difficult to walk to his fields, especially when the path is muddy.
The experience did not deter him from protest, however, and in 2010 he again joined others to fight against the diversion of irrigation water to Indiabulls thermal power plant. He was one of the 16 farmers who ran and threw themselves into the dam waters following the high-profile press conference in May 2010: we offer our lives to that which made us live, the action said.
“It feels like a morsel is being snatched from our mouths,” says Ramdas’ wife, Meena. The couple has divided their lands equally between them and so Meena also owns 16 acres. Three years ago their fields began to receive water through an extension of the irrigation canals of Upper Wardha dam. Their village, Nimgawhan, is at the very tail ends of the right bank canal, and by this distance the irrigation channels are thin: three feet wide and only a foot deep of water. It’s a long way from the twelve-foot-deep waterway at the start of the canals – a hundred kilometres away, to be exact – but the flow is still fast, and the farmers are still able to grow a second yearly crop with a confidence they couldn’t before.
“When lands are purchased for submergence [by dams], we’re told the water is for irrigation,” says Meena, angrily. “And now Sophias has come. We were kept in the dark [about the diversion to the power plant], and through our ignorance it was able to pass.”
The threat of losing irrigation water is a major source of stress in Nimgawhan, but it is by no means the villagers’ only issue. This western side of Vidarbha is dry, with only 650 mm of rainfall as compared to the relatively lush eastern side, where the monsoon brings up to 1,750 mm per year. Farmers here therefore grow mainly cotton, but market rates are low and production rates high, and it is the subsistence agriculturalists of the villages that get caught in the middle. Amravati is famous for suicides. A state package in 2005 and Prime Minister’s package in 2006 released emergency funds to six districts in Vidarbha, among which Amravati had the second-highest number of self-inflicted deaths. Nimgawhan so far has been relatively fortunate – only one man has killed himself under these pressures, three years previously. The others do not describe his circumstances as atypical, but rather the ‘usual’ ones of agricultural problems and the expense of a daughter’s dowry. While the reasons leading to such tragedies are complex, some people in the village are emphatic about the connection between relief and irrigation. “If the water is disconnected, most of the farmers from this village may suicide,” states Waman Pandurang Ughade.
“It will make us very desperate,” tempers Madan Dadarau Gulhane, a farmer of four acres that have been receiving irrigation since 2008. He now produces twenty quintals of wheat per year entirely as a result of the Upper Wardha water, though most of the extra income is spent on the cost of production, rather than significantly swelling the family wallet. So of what importance is the extra crop, really? “Working on your own land may only bring you a labourer’s wage, but at least it is your own land. Plus, it gives us food,” Madan explains. “Otherwise, in that season you will work on somebody else’s land.”
There was a time in the 1970s, the older farmers remember, when the price of gold and cotton was the same. They still call the crop white gold. Prices are now so low, however, that those who can afford to store it for a few months after harvest and wait for prices to rise.
Endangered WatersGreenpeace India
51
sM/s Indiabulls Power Ltd was formerly M/s Sophia Power Company Ltd.

Like most, Deepak and Archana Gawande store the picked cotton in the main room of their house. They also grow tur and soybean in the monsoon season. Last year the rains were bad, and the white balls fill only the back half of the room, with a thin space left at the ceiling for the fan to rotate. The irrigation lets the family take a second crop of wheat, though, and so now a bad kharif is not so serious a matter. For a water charge of 100 rupees per acre the ground yields twice, and now Deepak will pay the huge neon threshers that drive down from Punjab to harvest the golden wheat. He will get about seven quintals per acre.
“If Indiabulls gets the water we won’t have anything for our second crop,” points out Archana. Any extra money is immediately put away for the next year, just in case, and Archana does not want her two children to work in the fields. “No. No,” she emphasises. “Some farmers don’t even have enough to eat.” She’d like industry to come to Nimgawhan, but accepts “naturally, this being a very internal rural area, the industries don’t come.” One hundred kilometres away, in an otherwise stark industrial area, a thermal power plant will begin drawing water from her village.
Endangered WatersGreenpeace India
52
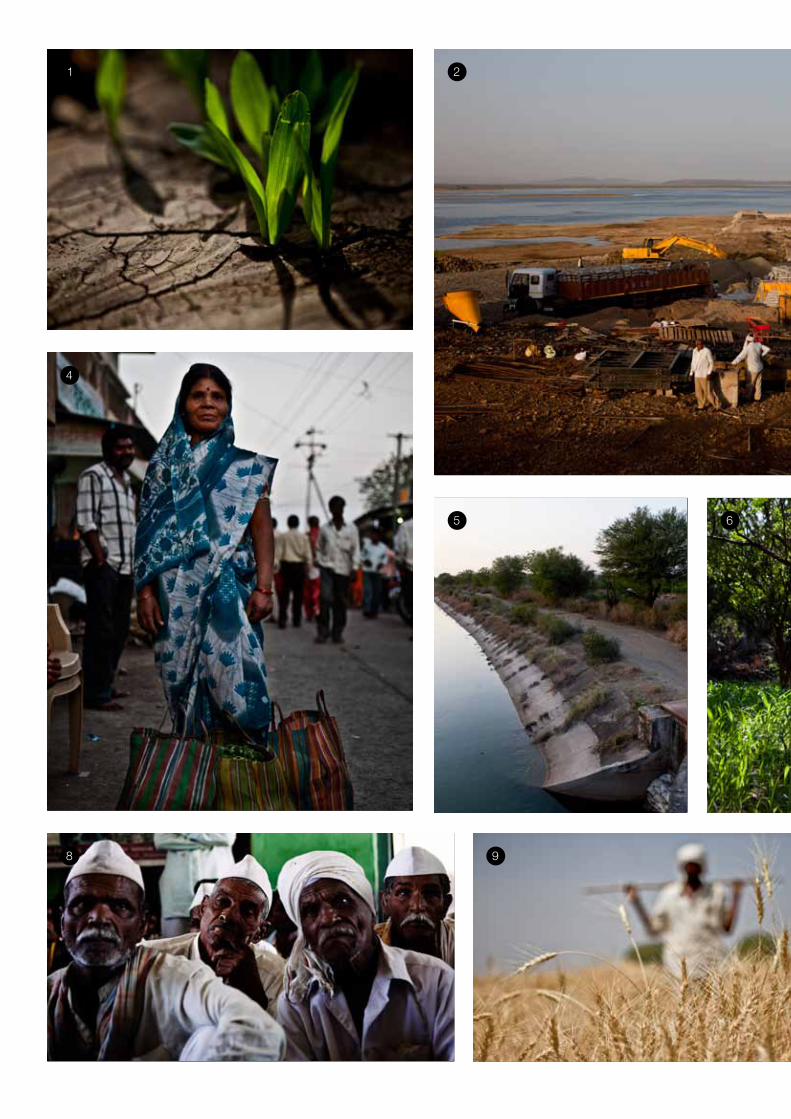
1 2
65
4
8 9
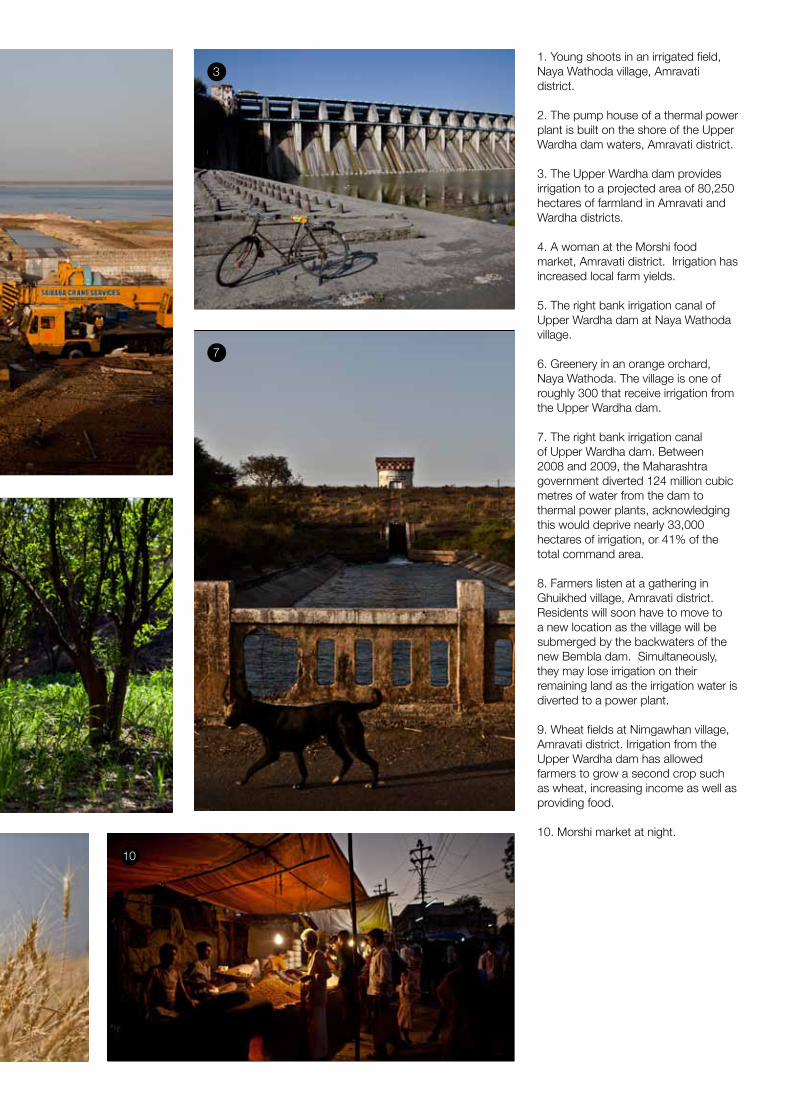
1. Young shoots in an irrigated field, Naya Wathoda village, Amravati district.
2. The pump house of a thermal power plant is built on the shore of the Upper Wardha dam waters, Amravati district.
3. The Upper Wardha dam provides irrigation to a projected area of 80,250 hectares of farmland in Amravati and Wardha districts.
4. A woman at the Morshi food market, Amravati district. Irrigation has increased local farm yields.
5. The right bank irrigation canal of Upper Wardha dam at Naya Wathoda village.
6. Greenery in an orange orchard, Naya Wathoda. The village is one of roughly 300 that receive irrigation from the Upper Wardha dam.
7. The right bank irrigation canal of Upper Wardha dam. Between 2008 and 2009, the Maharashtra government diverted 124 million cubic metres of water from the dam to thermal power plants, acknowledging this would deprive nearly 33,000 hectares of irrigation, or 41% of the total command area.
8. Farmers listen at a gathering in Ghuikhed village, Amravati district. Residents will soon have to move to a new location as the village will be submerged by the backwaters of the new Bembla dam. Simultaneously, they may lose irrigation on their remaining land as the irrigation water is diverted to a power plant.
9. Wheat fields at Nimgawhan village, Amravati district. Irrigation from the Upper Wardha dam has allowed farmers to grow a second crop such as wheat, increasing income as well as providing food.
10. Morshi market at night.
3
7
10
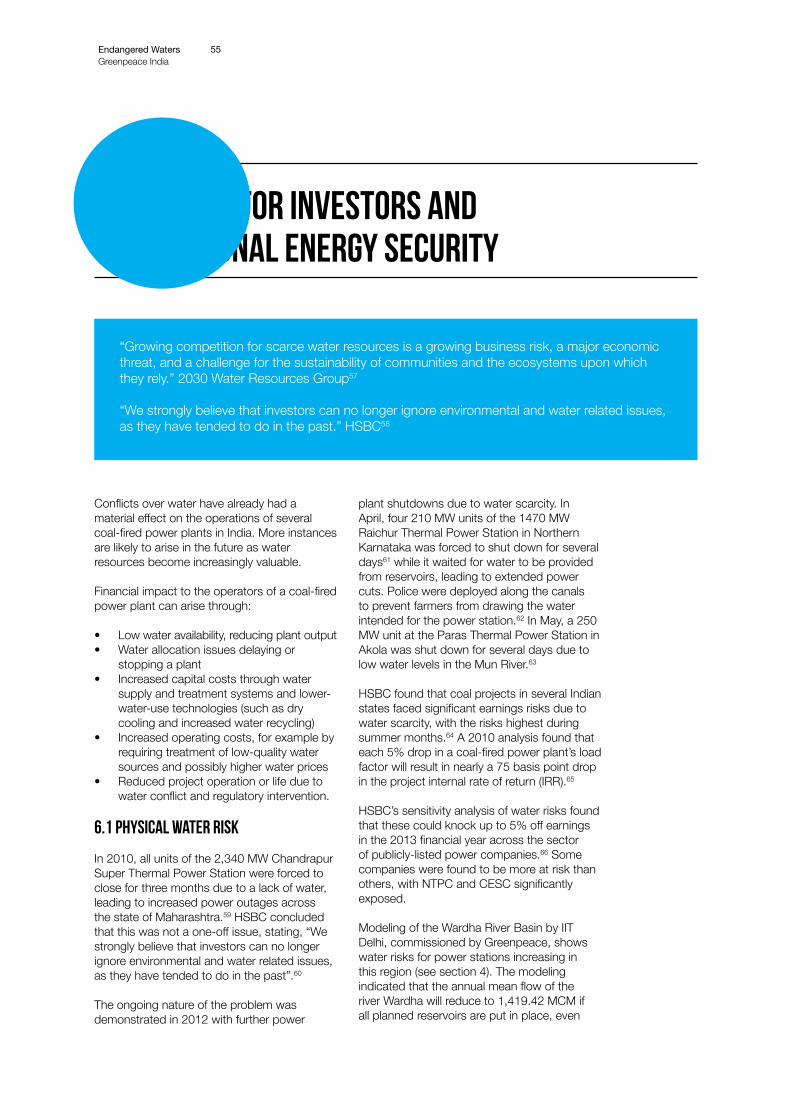
Risks for investors and national energy security
“Growing competition for scarce water resources is a growing business risk, a major economic threat, and a challenge for the sustainability of communities and the ecosystems upon which they rely.” 2030 Water Resources Group57
“We strongly believe that investors can no longer ignore environmental and water related issues, as they have tended to do in the past.” HSBC58
Conflicts over water have already had a material effect on the operations of several coal-fired power plants in India. More instances are likely to arise in the future as water resources become increasingly valuable.
Financial impact to the operators of a coal-fired power plant can arise through:
• Low water availability, reducing plant output• Water allocation issues delaying or
stopping a plant • Increased capital costs through water
supply and treatment systems and lower-water-use technologies (such as dry cooling and increased water recycling)
• Increased operating costs, for example by requiring treatment of low-quality water sources and possibly higher water prices
• Reduced project operation or life due to water conflict and regulatory intervention.
6.1 Physical water risk
In 2010, all units of the 2,340 MW Chandrapur Super Thermal Power Station were forced to close for three months due to a lack of water, leading to increased power outages across the state of Maharashtra.59 HSBC concluded that this was not a one-off issue, stating, “We strongly believe that investors can no longer ignore environmental and water related issues, as they have tended to do in the past”.60
The ongoing nature of the problem was demonstrated in 2012 with further power
plant shutdowns due to water scarcity. In April, four 210 MW units of the 1470 MW Raichur Thermal Power Station in Northern Karnataka was forced to shut down for several days61 while it waited for water to be provided from reservoirs, leading to extended power cuts. Police were deployed along the canals to prevent farmers from drawing the water intended for the power station.62 In May, a 250 MW unit at the Paras Thermal Power Station in Akola was shut down for several days due to low water levels in the Mun River.63
HSBC found that coal projects in several Indian states faced significant earnings risks due to water scarcity, with the risks highest during summer months.64 A 2010 analysis found that each 5% drop in a coal-fired power plant’s load factor will result in nearly a 75 basis point drop in the project internal rate of return (IRR).65
HSBC’s sensitivity analysis of water risks found that these could knock up to 5% off earnings in the 2013 financial year across the sector of publicly-listed power companies.66 Some companies were found to be more at risk than others, with NTPC and CESC significantly exposed.
Modeling of the Wardha River Basin by IIT Delhi, commissioned by Greenpeace, shows water risks for power stations increasing in this region (see section 4). The modeling indicated that the annual mean flow of the river Wardha will reduce to 1,419.42 MCM if all planned reservoirs are put in place, even
Endangered WatersGreenpeace India
55
06
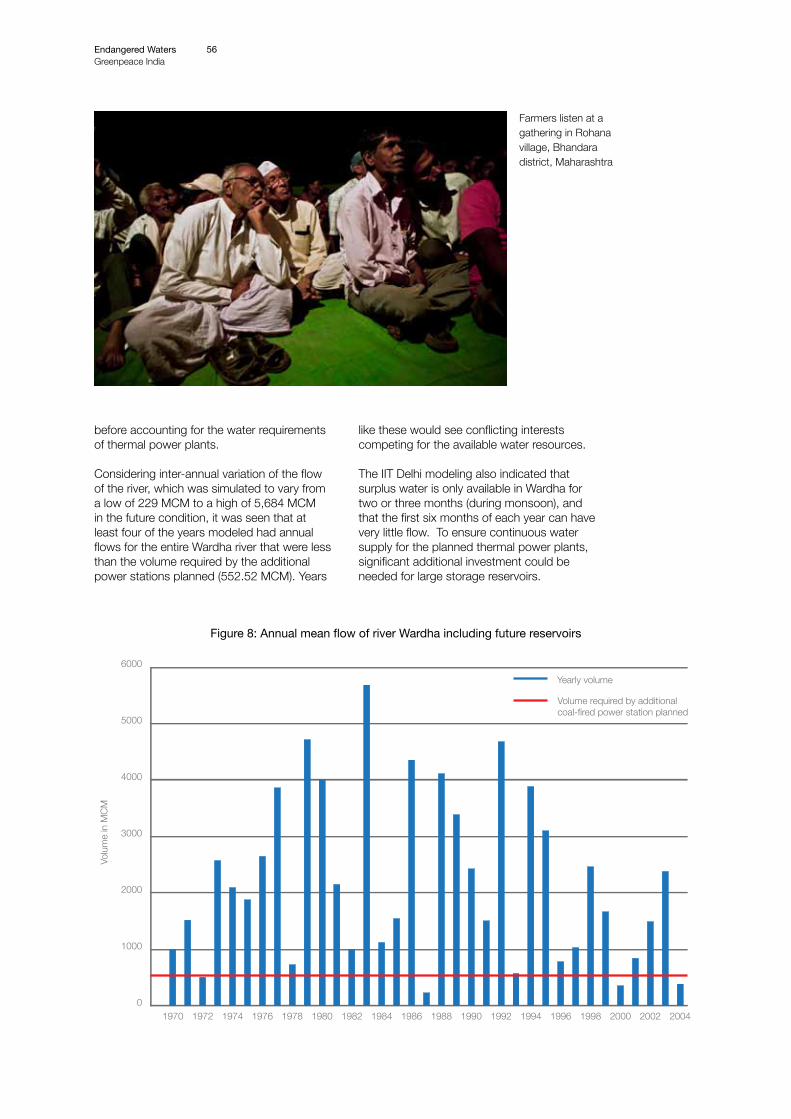
0
1000
2000
3000
4000
5000
6000
200420022000199819961994199219901988198619841982198019781976197419721970
Yearly volume
Volume required by additional coal-fired power station planned
Volu
me
in M
CM
before accounting for the water requirements of thermal power plants.
Considering inter-annual variation of the flow of the river, which was simulated to vary from a low of 229 MCM to a high of 5,684 MCM in the future condition, it was seen that at least four of the years modeled had annual flows for the entire Wardha river that were less than the volume required by the additional power stations planned (552.52 MCM). Years
like these would see conflicting interests competing for the available water resources.
The IIT Delhi modeling also indicated that surplus water is only available in Wardha for two or three months (during monsoon), and that the first six months of each year can have very little flow. To ensure continuous water supply for the planned thermal power plants, significant additional investment could be needed for large storage reservoirs.
Figure 8: Annual mean flow of river Wardha including future reservoirs
Endangered WatersGreenpeace India
56
Farmers listen at a gathering in Rohana village, Bhandara district, Maharashtra
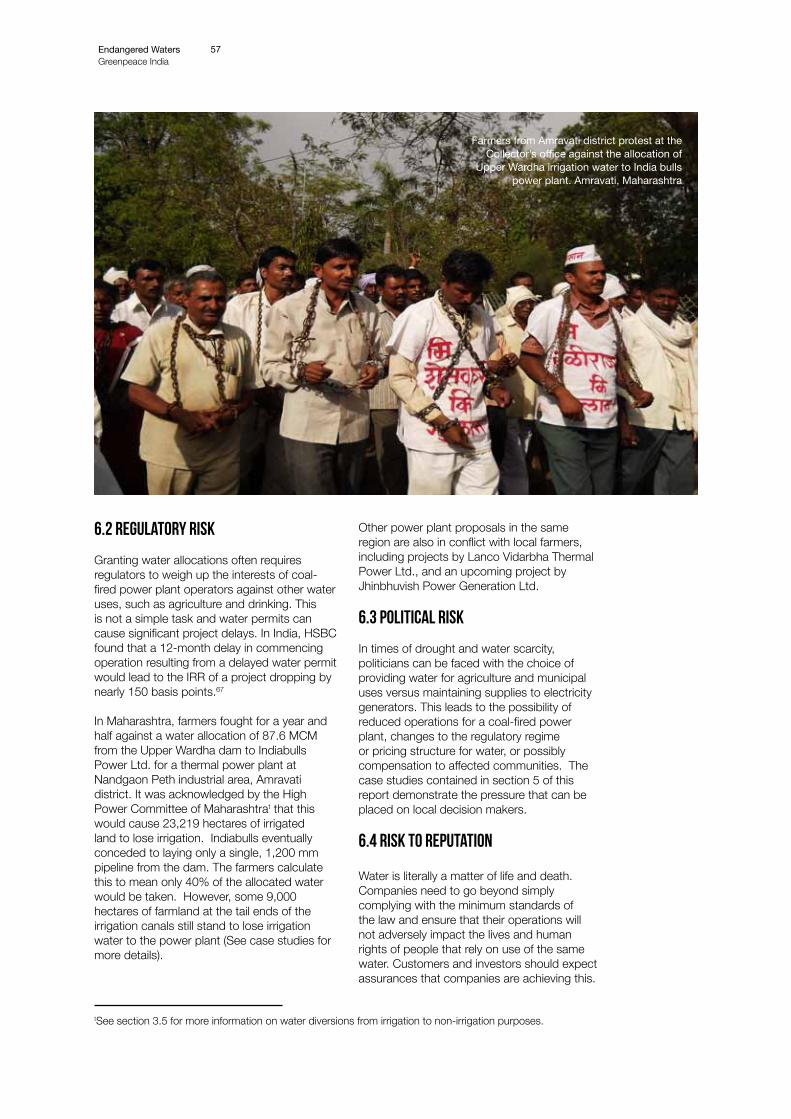
6.2 Regulatory risk
Granting water allocations often requires regulators to weigh up the interests of coal-fired power plant operators against other water uses, such as agriculture and drinking. This is not a simple task and water permits can cause significant project delays. In India, HSBC found that a 12-month delay in commencing operation resulting from a delayed water permit would lead to the IRR of a project dropping by nearly 150 basis points.67
In Maharashtra, farmers fought for a year and half against a water allocation of 87.6 MCM from the Upper Wardha dam to Indiabulls Power Ltd. for a thermal power plant at Nandgaon Peth industrial area, Amravati district. It was acknowledged by the High Power Committee of Maharashtrat that this would cause 23,219 hectares of irrigated land to lose irrigation. Indiabulls eventually conceded to laying only a single, 1,200 mm pipeline from the dam. The farmers calculate this to mean only 40% of the allocated water would be taken. However, some 9,000 hectares of farmland at the tail ends of the irrigation canals still stand to lose irrigation water to the power plant (See case studies for more details).
Other power plant proposals in the same region are also in conflict with local farmers, including projects by Lanco Vidarbha Thermal Power Ltd., and an upcoming project by Jhinbhuvish Power Generation Ltd.
6.3 Political risk
In times of drought and water scarcity, politicians can be faced with the choice of providing water for agriculture and municipal uses versus maintaining supplies to electricity generators. This leads to the possibility of reduced operations for a coal-fired power plant, changes to the regulatory regime or pricing structure for water, or possibly compensation to affected communities. The case studies contained in section 5 of this report demonstrate the pressure that can be placed on local decision makers.
6.4 Risk to reputation
Water is literally a matter of life and death. Companies need to go beyond simply complying with the minimum standards of the law and ensure that their operations will not adversely impact the lives and human rights of people that rely on use of the same water. Customers and investors should expect assurances that companies are achieving this.
Endangered WatersGreenpeace India
57
Farmers from Amravati district protest at the Collector’s office against the allocation of
Upper Wardha irrigation water to India bulls power plant. Amravati, Maharashtra
tSee section 3.5 for more information on water diversions from irrigation to non-irrigation purposes.
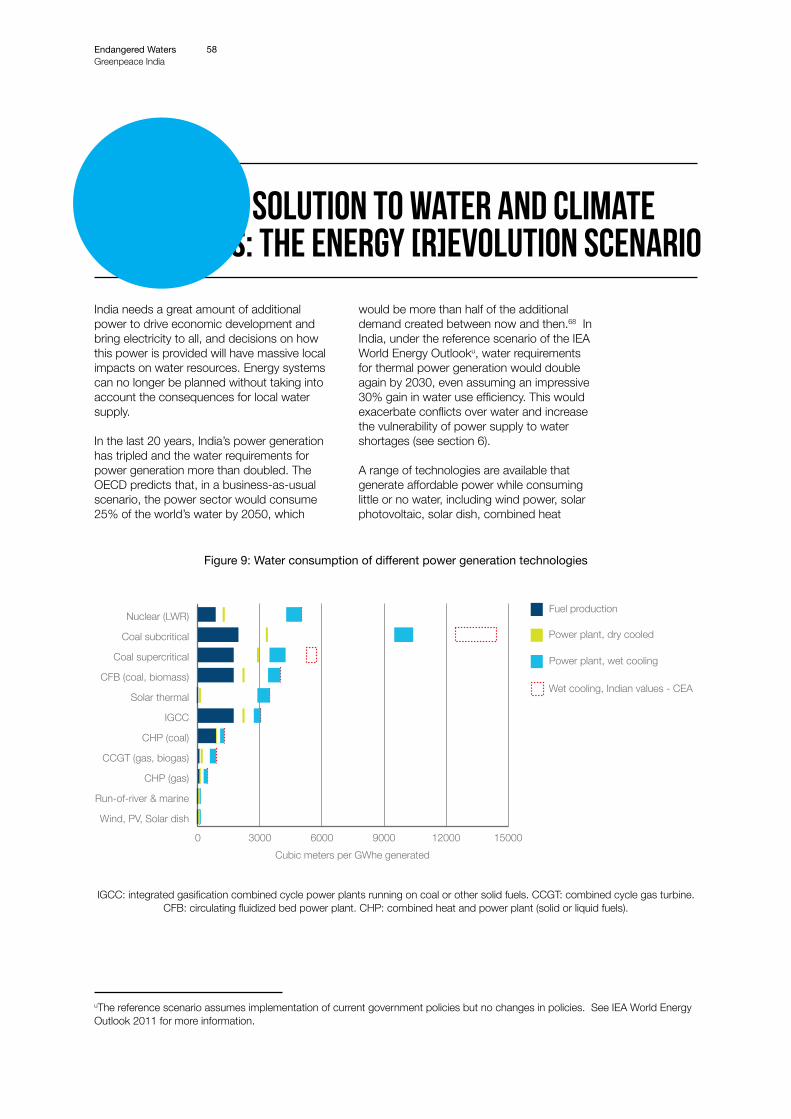
A twin solution to water and climate crises: the Energy [R]evolution scenario
India needs a great amount of additional power to drive economic development and bring electricity to all, and decisions on how this power is provided will have massive local impacts on water resources. Energy systems can no longer be planned without taking into account the consequences for local water supply.
In the last 20 years, India’s power generation has tripled and the water requirements for power generation more than doubled. The OECD predicts that, in a business-as-usual scenario, the power sector would consume 25% of the world’s water by 2050, which
would be more than half of the additional demand created between now and then.68 In India, under the reference scenario of the IEA World Energy Outlooku, water requirements for thermal power generation would double again by 2030, even assuming an impressive 30% gain in water use efficiency. This would exacerbate conflicts over water and increase the vulnerability of power supply to water shortages (see section 6).
A range of technologies are available that generate affordable power while consuming little or no water, including wind power, solar photovoltaic, solar dish, combined heat
Figure 9: Water consumption of different power generation technologies
IGCC: integrated gasification combined cycle power plants running on coal or other solid fuels. CCGT: combined cycle gas turbine. CFB: circulating fluidized bed power plant. CHP: combined heat and power plant (solid or liquid fuels).
Endangered WatersGreenpeace India
58
Yearly Volume
0 3000 6000 9000 12000 15000
Wind, PV, Solar dish
Run-of-river & marine
CHP (gas)
CCGT (gas, biogas)
CHP (coal)
IGCC
Solar thermal
CFB (coal, biomass)
Coal supercritical
Coal subcritical
Nuclear (LWR)
Wet cooling, Indian values - CEA
Power plant, wet cooling
Power plant, dry cooled
Fuel production
Cubic meters per GWhe generated
07
uThe reference scenario assumes implementation of current government policies but no changes in policies. See IEA World Energy Outlook 2011 for more information.
The Dali Zhemoshan Wind Farm is Yunnan’s first wind power plant, as well as
China’s highest, at an altitude of 2,800-3,006 meters (9,186-9,862 ft). It started
power generation in December 2008© Bao Lihui / Greenpeace
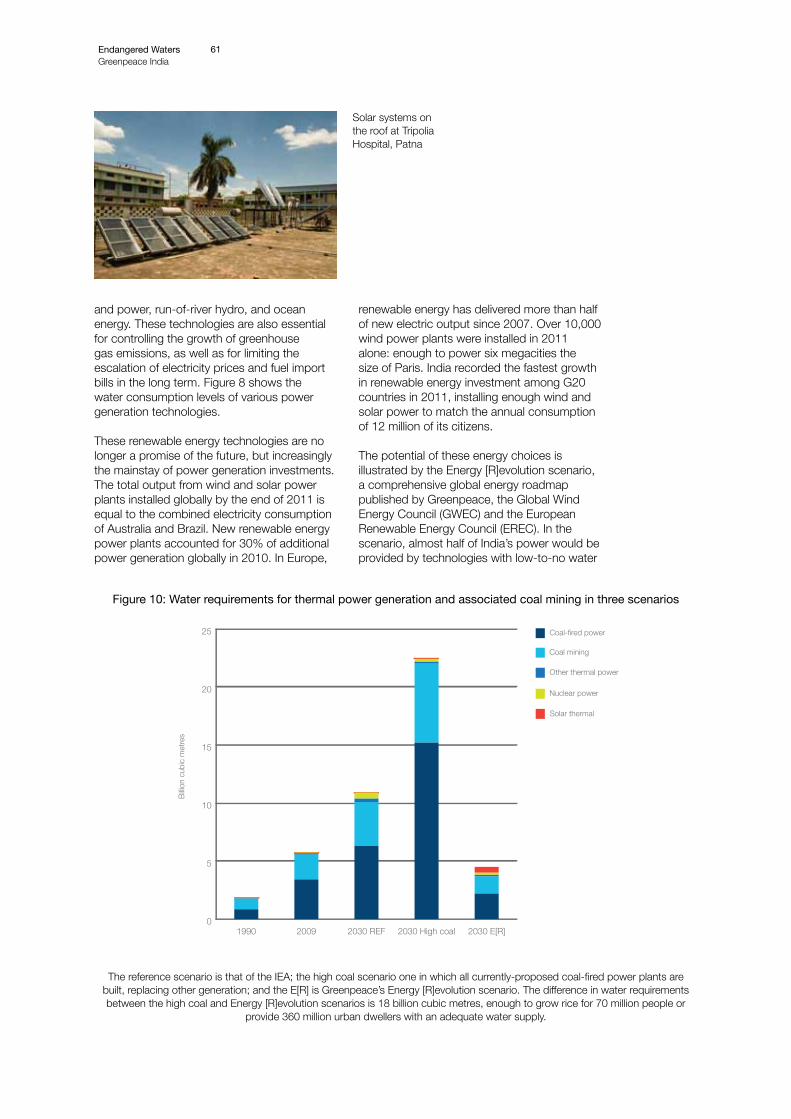
and power, run-of-river hydro, and ocean energy. These technologies are also essential for controlling the growth of greenhouse gas emissions, as well as for limiting the escalation of electricity prices and fuel import bills in the long term. Figure 8 shows the water consumption levels of various power generation technologies.
These renewable energy technologies are no longer a promise of the future, but increasingly the mainstay of power generation investments. The total output from wind and solar power plants installed globally by the end of 2011 is equal to the combined electricity consumption of Australia and Brazil. New renewable energy power plants accounted for 30% of additional power generation globally in 2010. In Europe,
renewable energy has delivered more than half of new electric output since 2007. Over 10,000 wind power plants were installed in 2011 alone: enough to power six megacities the size of Paris. India recorded the fastest growth in renewable energy investment among G20 countries in 2011, installing enough wind and solar power to match the annual consumption of 12 million of its citizens.
The potential of these energy choices is illustrated by the Energy [R]evolution scenario, a comprehensive global energy roadmap published by Greenpeace, the Global Wind Energy Council (GWEC) and the European Renewable Energy Council (EREC). In the scenario, almost half of India’s power would be provided by technologies with low-to-no water
Figure 10: Water requirements for thermal power generation and associated coal mining in three scenarios
The reference scenario is that of the IEA; the high coal scenario one in which all currently-proposed coal-fired power plants are built, replacing other generation; and the E[R] is Greenpeace’s Energy [R]evolution scenario. The difference in water requirements between the high coal and Energy [R]evolution scenarios is 18 billion cubic metres, enough to grow rice for 70 million people or
provide 360 million urban dwellers with an adequate water supply.
Endangered WatersGreenpeace India
61
0
5
10
15
20
25
2030 E[R]2030 High coal2030 REF20091990
Solar thermal
Nuclear power
Other thermal power
Coal mining
Coal-fired power
Billio
n cu
bic
met
res
Solar systems on the roof at Tripolia Hospital, Patna
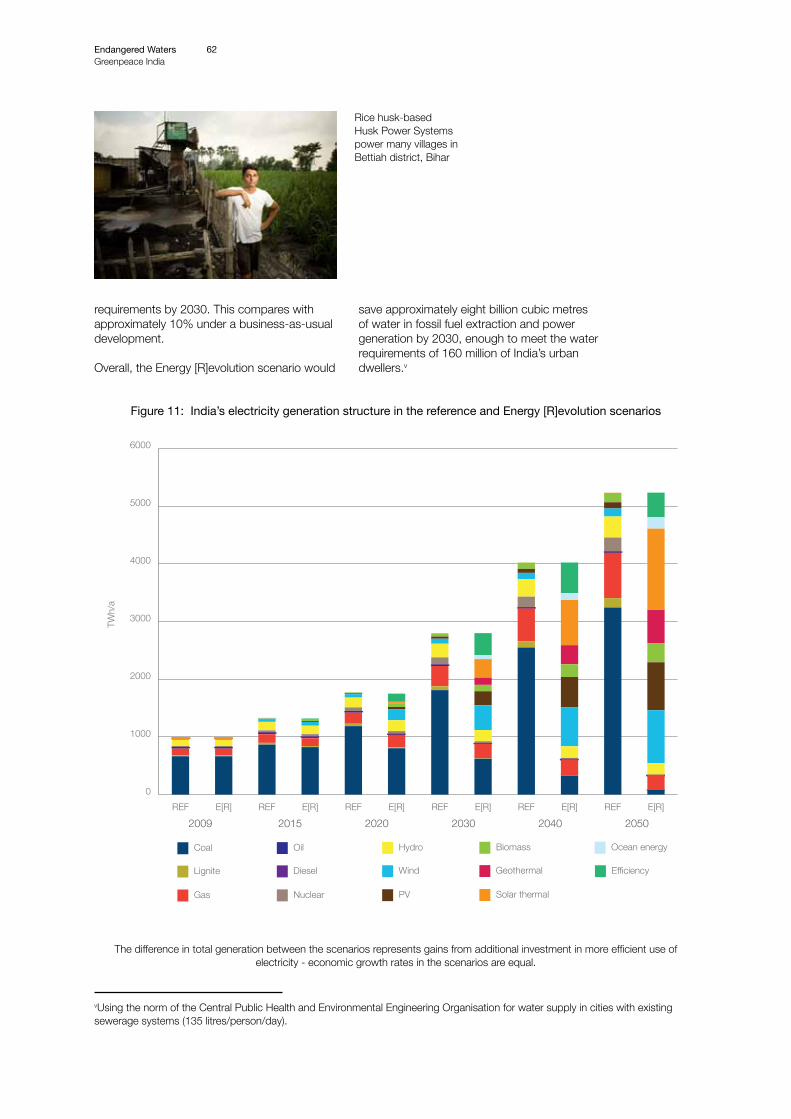
requirements by 2030. This compares with approximately 10% under a business-as-usual development.
Overall, the Energy [R]evolution scenario would
save approximately eight billion cubic metres of water in fossil fuel extraction and power generation by 2030, enough to meet the water requirements of 160 million of India’s urban dwellers.v
Figure 11: India’s electricity generation structure in the reference and Energy [R]evolution scenarios
The difference in total generation between the scenarios represents gains from additional investment in more efficient use of electricity - economic growth rates in the scenarios are equal.
Endangered WatersGreenpeace India
62
0
1000
2000
3000
4000
5000
6000
E[R]REFE[R]REFE[R]REFE[R]REFE[R]REFE[R]REF
Gas
Lignite
Coal
Nuclear
Diesel
Oil
PV
Wind
Hydro
Solar thermal
Geothermal
Biomass Ocean energy
Efficiency
TWh/
aRice husk-based Husk Power Systems power many villages in Bettiah district, Bihar
vUsing the norm of the Central Public Health and Environmental Engineering Organisation for water supply in cities with existing sewerage systems (135 litres/person/day).
2009 2015 2020 2030 2040 2050

An electrician at Tripolia Hospital in Patna operates the concentrated solar power (CSP)
system on the hospital roof
Endangered WatersGreenpeace India
63
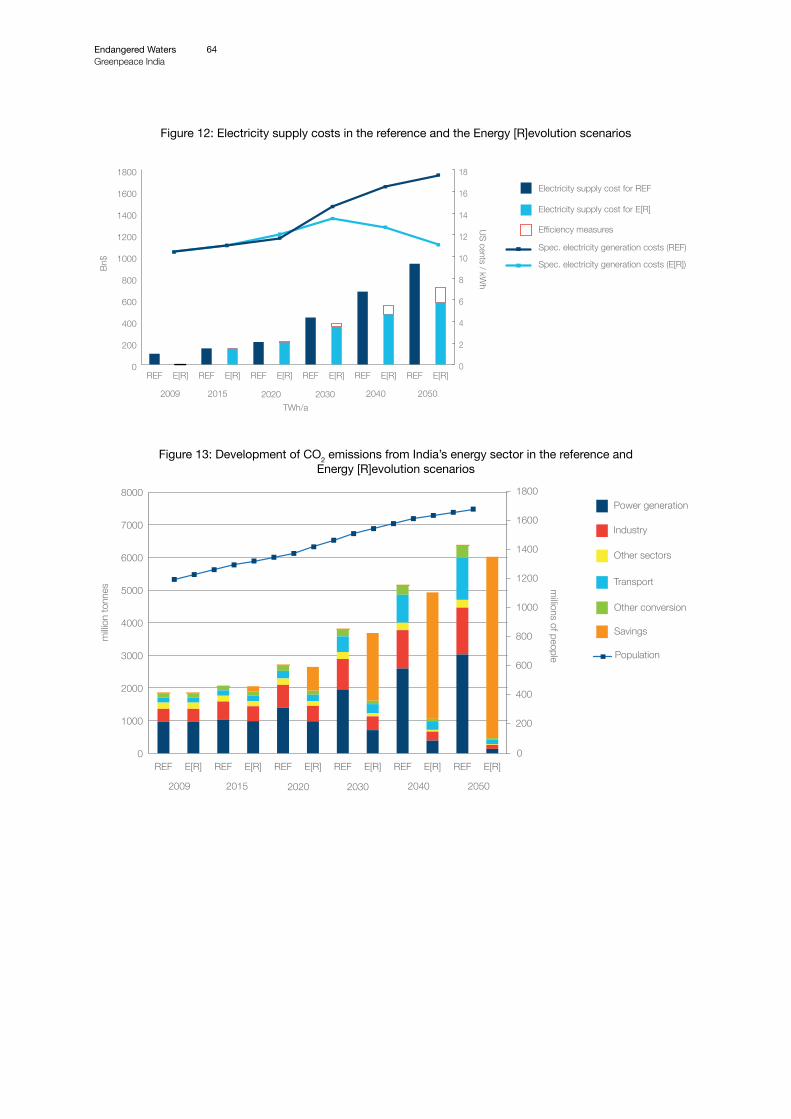
Figure 12: Electricity supply costs in the reference and the Energy [R]evolution scenarios
Figure 13: Development of CO2 emissions from India’s energy sector in the reference and Energy [R]evolution scenarios
0
200
400
600
800
1000
1200
1400
1600
1800
E[R]REFE[R]REFE[R]REFE[R]REFE[R]REFE[R]REF0
2
4
6
8
10
12
14
16
18
Electricity supply cost for E[R]
Electricity supply cost for REF
Efficiency measures
Spec. electricity generation costs (REF)
Spec. electricity generation costs (E[R])Bn$
US cents / kWh
TWh/a2009 2015 2020 2030 2040 2050
0
1000
2000
3000
4000
5000
6000
7000
8000
Savings
Other conversion
Transport
Other sectors
Industry
Power generation
E[R]REFE[R]REFE[R]REFE[R]REFE[R]REFE[R]REF0
200
400
600
800
1000
1200
1400
1600
1800
milli
on to
nnes m
illions of people
2009 2015 2020 2030 2040 2050
Population
Endangered WatersGreenpeace India
64
Recommendations & DEMANDS
India is facing water crisis. Multiple assessments69 of the country’s water supply agree that the demand for both groundwater and surface water will exceed availability within 30-40 years. This will be exacerbated by the impact of climate change on the monsoon, which is predicted to bring more intense rainfall in fewer spells, intense floods, and droughts.
In this context, it is clear the massive and unplanned expansion of thermal power plant clusters will create water scarcity. Agriculture and the livelihoods of farming communities will be adversely affected, as seen in the case studies in section 5.
Greenpeace recommends the following to ensure a sustainable water policy, while providing for the country’s growing energy needs.
1. Water allocations must prioritise irrigation above industry to protect the livelihoods of farmers. The diversion of water to industry cannot be allowed without first satisfying both drinking and irrigation requirements.
Approximately 60% (84 million hectares) of national productive agricultural land is rain-fed. Irrigation can contribute to increases in food production and therefore food security, but also lift the economic status of farmers, reduce agrarian distress and lessen income risk to a large extent. The irrigation component of the Bharat Nirman programme aimed to achieve 10 million hectares of irrigation potential from 2005 to 2009, and more government allocations and targets to increase irrigated areas were announced for 2009 and 2010. If water availability is compromised by diversion to thermal power plants the effort and expense of building this irrigation infrastructure will have been wasted. Such diversion of irrigation water to industrial uses, particularly coal-fired thermal power plants, is currently happening across the country, legalised by state governments and in danger of being supported by central policy.
2. There must be an immediate moratorium on environmental clearances granted to inland coal-based thermal power projects, until these clearances have been re-examined on the basis of cumulative water impact and availability in the local area.
According to a 2011 report70 by Prayas Energy Group, ‘Out of the 192,804 MW that have got the environmental clearance, about 138,000 MW or 72% [of the coal plants] are inland. Of these, close to 50% are concentrated in four river basins, namely, Ganga (33,255 MW), Godavari (16,235 MW), Mahanadi (14,595 MW) and Brahmani (6,534 MW).’
By approving clusters of coal-based power plants in specific regions of the country where water is scarce, we are doubling risks: one, of water conflicts effected by diverting irrigation water to power plants; and two, of forced shutdown of an operating power plant as a result of water scarcity.
3. Cumulative water risk assessments must be made part of all future environmental clearance processes for coal-fired thermal power plants, to avoid conflict with agricultural use. No environmental clearances at central level, nor water allocations at state level, should be given to thermal power plants without such analysis being carried out.
Coal-based thermal power plants pose a risk to both water security and energy security. The water efficiency levels of present and upcoming coal power plants in India fall far below global standards, yet even at a level of best international practice these plants remain highly water-intensive. If the water requirements of pre-processing coal are included, this demand grows even higher.
Endangered WatersGreenpeace India
65
08
The IIT Delhi study of river Wardha (section 4) further demonstrates that water scarcity can be aggravated by natural conditions in the river basin; this may become more severe in the future as a result of climate change. This poses risk not only to investment, but also the energy security coal power plants are envisaged as delivering.
The Union Ministry of Water Resources must conduct basin-level, cumulative water risk assessments to assess the feasibility of coal power plants without affecting the existing water requirements of the region. To start, this assessment should begin with identifying regions where irrigation is a higher priority than industrial needs.
The Ministry should work in close cooperation with the Ministry of Power and the Ministry of Environment and Forests to ensure this assessment is considered when granting environmental clearances to coal power plants.
4. The Government of Maharashtra must conduct water availability assessments for the river basins of Maharashtra. The water diversions made to industry by the High Power Committee between 2003 and 2011 must be suspended until these assessments are complete.
Following a visit to Vidarbha, Prime Minister Dr. Manmohan Singh in 2006 cited poor irrigation as one of the primary reasons for the agrarian crisis in the region. The subsequent relief package assured irrigation covering 1.59 lakh hectares would be achieved in three years, at a cost of Rs. 2,177 crore. Yet by December 2010, more than 71 coal power plants with a total generation capacity of almost 55,000 MW were being planned in the same region. Granted a total water allocation of 2,049 million cubic metres of water per year, the thermal power plants had been allotted the equivalent irrigation water for approximately 409,800 hectares of arable land.
The IIT Delhi study on water availability in the sub-basin of river Wardha (in westVidarbha, see section 4) shows an alarming picture of the water conflict that may arise between thermal power plants and agriculture if all the plants allocated water are built. This must be prevented and the Government of Maharashtra conduct a water availability assessment in the concerned river basins, while suspending all allocations to thermal power plants until the assessment is complete.
5. India must invest in energy solutions that take the social and environmental impacts of projects into account. This would include investing significantly in energy efficient systems and maximising the use of renewable energy, to deliver energy security to the country.
India recorded the fastest growth in renewable energy investment among G20 countries in 2011, installing enough wind and solar power to match the annual consumption of 12 million citizens. The present trend of coal-based power generation brings multiple risks to national energy security by depending on imported coal and conflicted water, as well as by increasing health and environmental damage. The Planning Commission predicts that the demand- supply gap for coal will increase from 20% today to 34% by 2016 - all of this deficit will eventually be imported.
In contrast, renewable energy technologies avoid these risks, and have very low water requirements per MWh generated. India must accelerate renewable energy growth rates by introducing enabling policies and frameworks, to deliver future energy security.
Endangered WatersGreenpeace India
66
1Riding the Wave, Infrastructure Today. Ernst & Young.2012.2Sinchanache pani udyoganna va shaharanna valavinyaachyaa Maharashtra rajyateel dhorananchaa va ammalbajaavanichaa abhyas (A study of policy and its implementation of diversion of irrigation water to industries and cities in the state of Maharashtra).Resources and Livelihoods Group, Prayas.May 20113Vidarbha Irrigation Development Corporation and Vidarbha Statutory Development Board, Nagpur.4Director General, Vasantrao Naik Sheti Swawlamban Mission. Document obtained through Right to Information Act, 2005.5Gosain A.K, Khosa.R and Anand.J. Impact of Water Resources Projects - a case study of Wardha. Greenpeace India Society. April 2012.6Report on Minimisation of Water Requirement in Coal Based Thermal Power Stations.Central Electricity Authority.January 2012. (hereafter referred to as CEA--Water Report 2012)7Water Report. CEA. 2012.8National Energy Technology Laboratory, US Department of Energy, 2009. Water Requirements for Existing and Emerging Thermoelectric Plant Technologies. August 2008 (April 2009 Revision)9Water Report. CEA. 2012.10http://pib.nic.in/newsite/erelease.aspx?relid=8327011Smart.A and Adam.A. Water and the electricity generation industry. Waterlines Report Series no 18. National Water Commission, Australian Government. August 2009. 12Load Generation Balance Report. Central Electricity Authority. 2011-2012. http://www.cea.nic.in/reports/yearly/lgbr_report.pdf. Last Accessed on 25 June 201213Central Electricity Authority 2007,2012. 14Central Electricity Authority. 2012.15Central Electricity Authority, 2009 16Faster, Sustainable and More Inclusive Growth. An Approach to the Twelfth Five Year Plan. Planning Commission, Government of India. October 2011.17Water Report. CEA. 2012.18http://eands.dacnet.nic.in/At_A_Glance-2011/4.5(b).xls19Factsheets no. 04: Thermal Power Plants. Centre for Science and Environment. February 2012. http://www.cseindia.org/content/factsheets-0 . Last Accessed on 25 June 2012.20Thermal Power Plants on the Anvil, Implications and Need for Rationalization. Prayas Energy Group. August 2011.21See http://www.pppinindia.com/sector-power.php for more information. Last accessed on 25 June 2012.22Ultra Mega Power Projects.Ministry of Power, Government of India. http://www.powermin.nic.in/whats_new/pdf/ultra%20mega%20project.pdf.23Faster, Sustainable and More Inclusive Growth. An Approach to the Twelfth Five Year Plan.Planning Commission. Government of India. October 2011.24Thermal Power Plants on the Anvil, Implications and Need for Rationalization. Prayas Energy Group. August 201125ibid.26National Water Policy.Ministry of Water Resources, Government of India. April 2002.27Draft National Water Policy (2012).Ministry of Water Resources, Government of India.28Riding the Wave, Infrastructure Today. Ernst & Young. 2012.29Census of India(2011). Ministry of Home Affairs, Government of India.30Data for use of Deputy Chairman.Planning Commission, Government of India. 18 May 2011. http://planningcommission.nic.in/data/datatable/1705/databook_dch_160511.pdf. Last Accessed on 25 June 2012.31Thaware B.L, Kunkerkar R.L and Shivade H.A. Status Paper on Rice in Maharashtra. Rice Knowledge Management Portal, Hyderabad. http://www.rkmp.co.in/research-domain/rice-state-wise.Last Accessed on 25 June 2012.32National Conference on Agriculture for Rabi Campaign (2009). Department of Agriculture, Government of Maharashtra. agricoop.nic.in. Last Accessed on 25 June 2012.33Dr. Panjabrao Deshmukh Krishi Vidyapeeth, Akola. http://www.pdkv.ac.in/aicrpAgromet.php. Last Accessed on 25 June 2012.
References
Endangered WatersGreenpeace India
67
09
34Water Auditing of Irrigation Projects in Maharashtra State (2007-2008), Water Resources Department, Government of India. March 2009. http://mahawrd.org/downloads/wa0708.pdf.35http://www.mwrdc.org/majorfile.htm, http://www.mwrdc.org/medium.htm Last accessed 25 June 2012 36Mineral and Metal Scenario. Annual Report 2010-2011. Ch 3. Ministry of Mines, Government of India. http://mines.gov.in/annual201011/chap3.pdf. Last Accessed on 25 June 2012.37Indian Bureau of Mines.ibm.nic.in/coalandlignite.pdf. Last Accessed on 25 June 2012.38Environmental Information Centre, Department of Environment, Government of Maharashtra. http://ibm.nic.in/imyb2010_coalandligite.pdf Last Accessed on 25 June 2012.39Maharashtra Tourism Development Corporation. http://www.maharashtratourism.gov.in. Last Accessed on 25 June 2012.40Undermining Tadoba’s Tigers.Greenpeace India Society.January 2012. http://www.greenpeace.org/india/Global/india/report/2011/Report-Undermining-Tadoba%27s-Tigers.pdf. Last Accessed on 25 June 2012.41As listed on http://www.mahagenco.in/INSTALLED-CAPACITY-01.shtm.Last Accessed on 25 June 2012.42Directives for Irrigation Sector. Annexure I. Governor of Maharashtra(2008-2009). http://rajbhavan.maharashtra.gov.in/responsibility/responsibilities_devboard.htm. Last Accessed on 15 June 2012.43Mishra.S. Suicide of Farmers in Maharashtra. , Indira Gandhi Institute of Development Research.26 January 2006.44Dr. Jadhav.N. Farmers’ Suicide and Debt Waiver: An Action Plan for Agricultural Development of Maharashtra. July 2008. 45Ibid.46State Water Policy. Water Resources Department, Government of Maharashtra. http://mahawrd.org/pdf/SWPE.pdf. Last Accessed on 25 June 2012.47Ibid.48Government resolution of the state of Maharashtra, no. 2011/252/11/ amendment dated 18th May 2011.49Maharashtra Act No. XVIII of 2005. Maharashtra Water Resources Regulatory Authority.50Sinchanache pani udyoganna va shaharanna valavinyaachyaa Maharashtra rajyateel dhorananchaa va ammalbajaavanichaa abhyas (A study of policy and its implementation of diversion of irrigation water to industries and cities in the state of Maharashtra, Resources and Livelihoods Group, Prayas, May 201151Minutes of the 13th meeting of the High Powered Committee. Translated from Marathi. , Document obtained through Right To Information Act,2005. 52Upper Wardha Project, Fourth Revised Project Estimate.Volume IV. Water Resources Department, Vidarbha Irrigation Development Corporation, Nagpur. April 2009. Three pages of the document obtained through RTI. 53Ibid.54Directives by the Governor of Maharashtra under Rule 7 of the Development Boards for Vidarbha, Marathwada and the Rest of Maharashtra Order, 2011, for the region wise distribution of outlays in the Annual Plan of FY 2012-13.55From early January 2010 to late May 2011, the share price of Indiabulls Power Ltd. on the National Stock Exchange of India dropped from 37 to 20 INR. Note that many factors contribute to a share price fall.56http://www.infraline.com/details/bhandara-thermal-power-corp-seeks-mops-help-in-securing-coal-linkage-for-its-proposed-2640-mw-power-project-maharashtra-110416.htm. Last Accessed on 25 June 2012.
Endangered WatersGreenpeace India
68
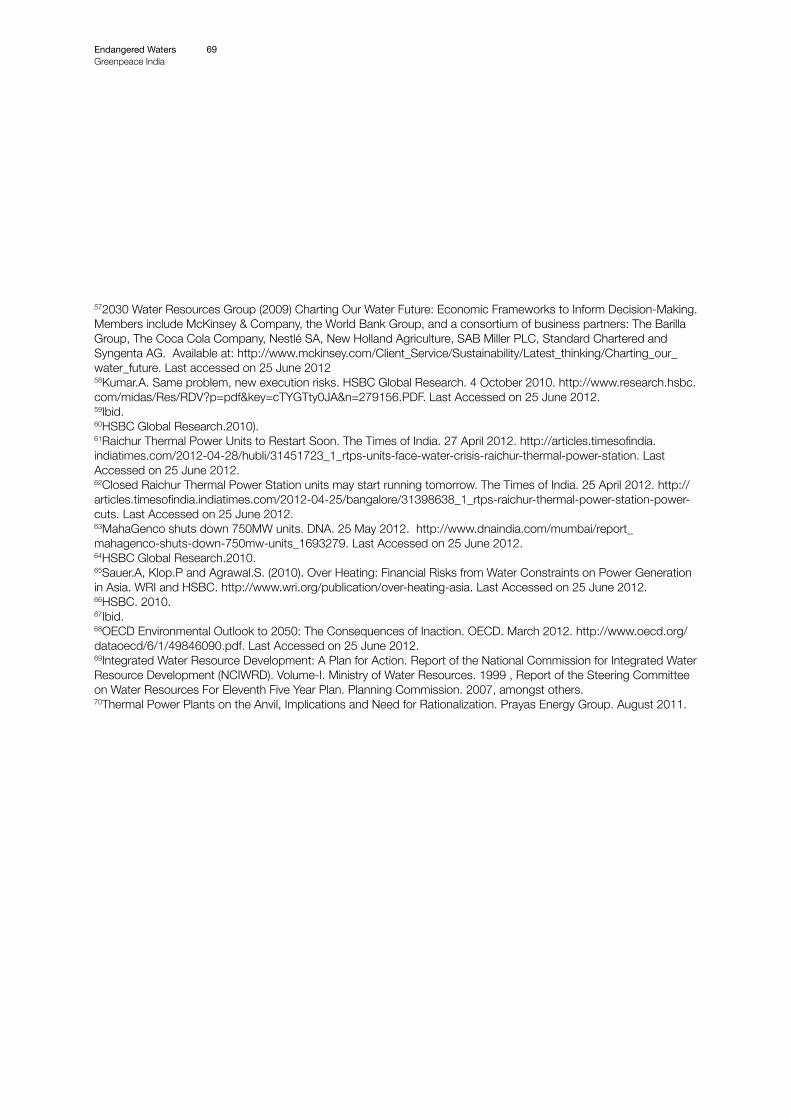
572030 Water Resources Group (2009) Charting Our Water Future: Economic Frameworks to Inform Decision-Making. Members include McKinsey & Company, the World Bank Group, and a consortium of business partners: The Barilla Group, The Coca Cola Company, Nestlé SA, New Holland Agriculture, SAB Miller PLC, Standard Chartered and Syngenta AG. Available at: http://www.mckinsey.com/Client_Service/Sustainability/Latest_thinking/Charting_our_water_future. Last accessed on 25 June 201258Kumar.A. Same problem, new execution risks. HSBC Global Research. 4 October 2010. http://www.research.hsbc.com/midas/Res/RDV?p=pdf&key=cTYGTty0JA&n=279156.PDF. Last Accessed on 25 June 2012.59Ibid.60HSBC Global Research.2010).61Raichur Thermal Power Units to Restart Soon. The Times of India. 27 April 2012. http://articles.timesofindia.indiatimes.com/2012-04-28/hubli/31451723_1_rtps-units-face-water-crisis-raichur-thermal-power-station. Last Accessed on 25 June 2012.62Closed Raichur Thermal Power Station units may start running tomorrow. The Times of India. 25 April 2012. http://articles.timesofindia.indiatimes.com/2012-04-25/bangalore/31398638_1_rtps-raichur-thermal-power-station-power-cuts. Last Accessed on 25 June 2012.63MahaGenco shuts down 750MW units. DNA. 25 May 2012. http://www.dnaindia.com/mumbai/report_mahagenco-shuts-down-750mw-units_1693279. Last Accessed on 25 June 2012.64HSBC Global Research.2010.65Sauer.A, Klop.P and Agrawal.S. (2010). Over Heating: Financial Risks from Water Constraints on Power Generation in Asia. WRI and HSBC. http://www.wri.org/publication/over-heating-asia. Last Accessed on 25 June 2012. 66HSBC. 2010.67Ibid.68OECD Environmental Outlook to 2050: The Consequences of Inaction. OECD. March 2012. http://www.oecd.org/dataoecd/6/1/49846090.pdf. Last Accessed on 25 June 2012.69Integrated Water Resource Development: A Plan for Action. Report of the National Commission for Integrated Water Resource Development (NCIWRD). Volume-I. Ministry of Water Resources. 1999 , Report of the Steering Committee on Water Resources For Eleventh Five Year Plan. Planning Commission. 2007, amongst others.70Thermal Power Plants on the Anvil, Implications and Need for Rationalization. Prayas Energy Group. August 2011.
Endangered WatersGreenpeace India
69

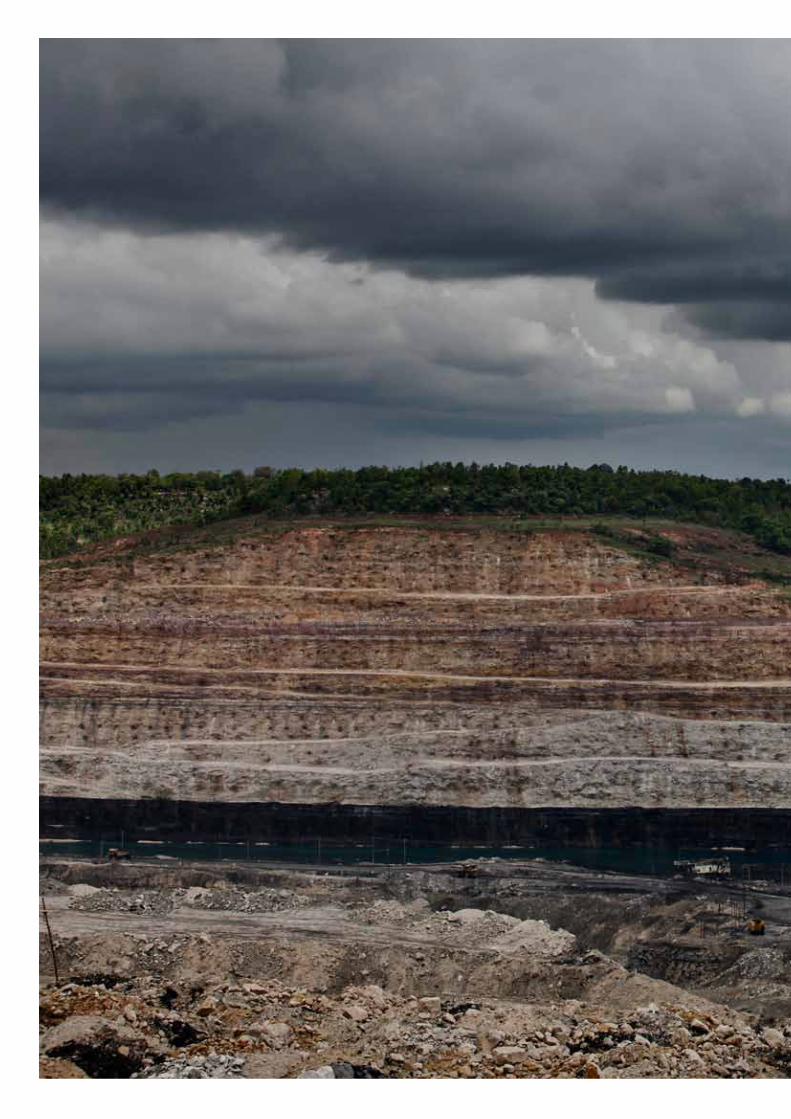
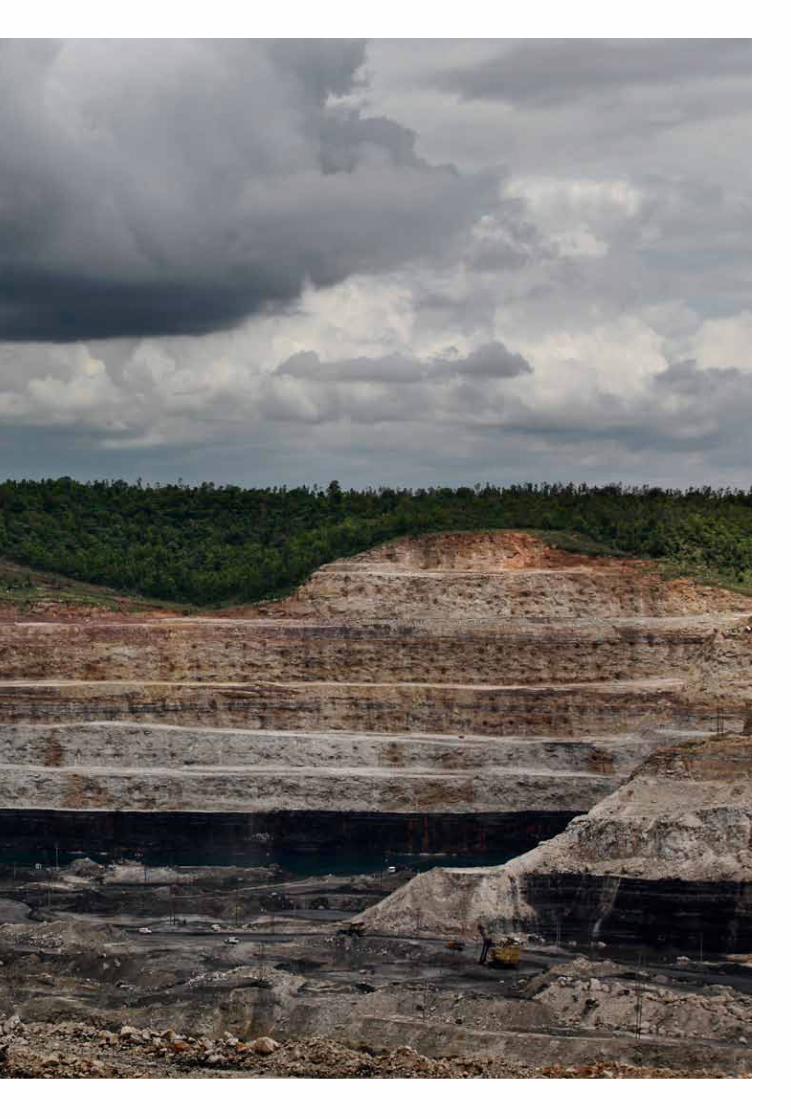
Nigahi coal mine, India’s largest open cast mine, operated by NCL(Northern
Coalfields Limited) in Singrauli. Greenpeace organized a high level
fact finding team to visit Singrauli in Madhya Pradesh to understand the impact coal mining has had on
people, livelihoods and ecology

A-23, Second Floor, Green ParkNear Aurbindo Place MarketNew Delhi 110 016, India
Greenpeace is a global organisation that uses non-violent direct action to tackle the most crucial threats to our planet’s biodiversity and environment. Greenpeace is a non-profit organisation, present in 40 countries across Europe, The Americas, Asia and the Pacific.
It speaks for 2.8 million supporters worldwide, and inspires many millions more to take action every day. To maintain its independence, Greenpeace does not accept donations from governments or corporations but relies on contributions from individual supporters and foundation grants.
Greenpeace has been campaigning against environmental degradation since 1971 when a small boat of volunteers and journalists sailed into Amchitka, an area north of Alaska, where the US Government was conducting underground nuclear tests.This tradition of ‘bearing witness’ in a non-violent manner continues today, and ships are an important part of all its campaign work.