Embed Size (px)
Citation preview

2012 Annual Global Energy Conference
Jefferies 2012 Annual Global Energy Conference

Table of Contents
Public Company Profiles 4 Private Company Profiles 92 Jefferies Biographies 95 Important Disclosures 103
2 Jefferies 2012 Annual Global Energy Conference

Conference Notes
3 Jefferies 2012 Annual Global Energy Conference

Public Company Profiles
4 Jefferies 2012 Annual Global Energy Conference

Conference Notes
5
Jefferies 2012 Annual Global Energy Conference

Anadarko Petroleum Company
6
Sources: Company filings, Company website and Capital IQ as of November 15, 2012. Balance sheet data is as of the most recent SEC filing available on November 15, 2012.
Ticker: APC Jefferies Rating: Buy Price: $70.38 (as of Nov 15, 2012) Price / Volume Graph
Exchange: NYSE Jefferies Analyst: Subash Chandra Target Price: $96.00
Business Description
Founded: 1959 Employees: 4,800 Location: The Woodlands, TX (United States)
Trading Data ( as of Nov 15, 2012) ($USD) Financial Projections ($USD millions, except per share data)
Share Price $70.38 (Consensus, unless otherwise noted) FY 2012E FY 2013E FY 2014E
% of 52-Week High 79.3% Revenue $13,434.6 $15,217.0 $17,359.452-Week High $88.70 EBITDA 8,997.4 9,753.7 11,063.152-Week Low 56.42 EPS (GAAP) $4.35 $4.42 $5.4790-Day Avg. Daily Trading Volume (000s) 3,344 EPS (Adjusted) 3.38 4.34 5.15Fiscal Year End December EPS (Jefferies) 3.34 3.41 NA
Enterprise Value Calculation ($USD millions) Valuation Metrics (x)
Market Capitalization (fully-diluted) $35,173.0 Enterprise Value / Revenue 3.6x 3.1x 2.8x
Total Debt 14,141.0 Enterprise Value / EBITDA 5.3x 4.9x 4.3x
Minority Interest 1,038.0 Price / Earnings (GAAP) 16.2x 15.9x 12.9xPreferred Equity – Price / Earnings (Adjusted) 20.8x 16.2x 13.7xCash and Cash Equivalents 2,532.0 Total Debt / EBITDA 1.6x 1.4x 1.3xEnterprise Value $47,820.0
Price / Volume — Last Twelve Months
Anadarko Petroleum Corporation engages in the exploration, development, production, and marketing of natural gas, crude oil, condensate, and natural gas liquids(NGLs) in the United States, Algeria, and internationally. The company operates in three segments: Oil and Gas Exploration and Production; Midstream; and Marketing. The Oil and Gas Exploration and Production segment explores for and produces natural gas, crude oil, condensate, and NGLs. The Midstream segment provides gathering, processing, treating, and transportation services to Anadarko and third-party oil, natural-gas, and NGLs producers, as well as owns and operates gathering, processing, treating, and transportation systems in the United States. The Marketing segment sells oil, natural gas, and NGLs in the United States; and markets oil from Algeria, China, and Ghana. As of December 31, 2011, the company had proved reserves of approximately 2.5 billion barrels of oil equivalent. Anadarko Petroleum Corporation was founded in 1959 and is headquartered in The Woodlands, Texas.
-
2,000
4,000
6,000
8,000
10,000
12,000
14,000
–
$10.00
$20.00
$30.00
$40.00
$50.00
$60.00
$70.00
$80.00
$90.00
$100.00
11/11 12/11 1/12 2/12 3/12 4/12 5/12 6/12 7/12 8/12 9/12 10/12 11/12
Volu
me (0
00s)
Price (
$U
SD
)
Volume Price
Jefferies 2012 Annual Global Energy Conference

Arch Coal Inc.
Jefferies 2012 Annual Global Energy Conference 7
Sources: Company filings, Company website and Capital IQ as of November 15, 2012. Balance sheet data is as of the most recent SEC filing available on November 15, 2012.
Ticker: ACI Jefferies Rating: Buy Price: $6.37 (as of Nov 15, 2012) Price / Volume Graph
Exchange: NYSE Jefferies Analyst: Peter Ward Target Price: $12.00
Business Description
Founded: 1969 Employees: 7,442 Location: St Louis, MO (United States)
Trading Data ( as of Nov 15, 2012) ($USD) Financial Projections ($USD millions, except per share data)
Share Price $6.37 (Consensus, unless otherwise noted) FY 2012E FY 2013E FY 2014E
% of 52-Week High 37.7% Revenue $4,186.4 $4,069.5 $4,549.252-Week High $16.88 EBITDA 682.6 626.4 818.852-Week Low 5.16 EPS (GAAP) ($1.47) ($0.66) $0.1390-Day Avg. Daily Trading Volume (000s) 15,367 EPS (Adjusted) (0.27) (0.56) (0.02)Fiscal Year End December EPS (Jefferies) (0.02) (0.50) NA
Enterprise Value Calculation ($USD millions) Valuation Metrics (x)
Market Capitalization (fully-diluted) $1,352.2 Enterprise Value / Revenue 1.3x 1.3x 1.2x
Total Debt 4,581.1 Enterprise Value / EBITDA 7.7x 8.4x 6.5x
Minority Interest – Price / Earnings (GAAP) NM NM 49.9xPreferred Equity – Price / Earnings (Adjusted) NM NM NMCash and Cash Equivalents 650.1 Total Debt / EBITDA 6.7x 7.3x 5.6xEnterprise Value $5,283.2
Price / Volume — Last Twelve Months
Arch Coal, Inc. engages in the production and sale of steam and metallurgical coal from surface and underground mines located in the United States. As of December 31, 2011, it operated or contracted out the operation of 46 active mines, and owned or controlled approximately 5.33 billion tons of proven and probable recoverable reserves; and owned or controlled primarily through long-term leases approximately 32,135 acres of coal land in Ohio, 25,037 acres of coal land in Maryland, 33,238 acres of coal land in Virginia, 371,071 acres of coal land in West Virginia, 105,667 acres of coal land in Wyoming, 242,390 acres of coal land in Illinois, 62,822 acres of coal land in Utah, 234,401 acres of coal land in Kentucky, 19,267 acres of coal land in Montana, 21,802 acres of coal land in New Mexico, and 18,443 acres of coal land in Colorado. The company also owned or controlled smaller parcels of property in Alabama, Indiana, Washington, Arkansas, California, and Texas through long-term leases. Arch Coal, Inc. sells steam coal to power plants and industrial facilities, and metallurgical coal for use in steel production worldwide. The company was founded in 1969 and is headquartered in St. Louis, Missouri.
-
5,000
10,000
15,000
20,000
25,000
30,000
35,000
40,000
45,000
50,000
–
$2.00
$4.00
$6.00
$8.00
$10.00
$12.00
$14.00
$16.00
$18.00
11/11 12/11 1/12 2/12 3/12 4/12 5/12 6/12 7/12 8/12 9/12 10/12 11/12
Volu
me (0
00s)
Price (
$U
SD
)
Volume Price

Atlas Energy, L.P.
Jefferies 2012 Annual Global Energy Conference 8
Sources: Company filings, Company website and Capital IQ as of November 15, 2012. Balance sheet data is as of the most recent SEC filing available on November 15, 2012.
Ticker: ATLS Jefferies Rating: Not Covered Price: $31.46 (as of Nov 15, 2012) Price / Volume Graph
Exchange: NYSE
Business Description
Founded: NM Employees: 683 Location: Pittsburgh, PA (United States)
Trading Data ( as of Nov 15, 2012) ($USD) Financial Projections ($USD millions, except per share data)
Share Price $31.46 (Consensus, unless otherwise noted) FY 2012E FY 2013E FY 2014E
% of 52-Week High 79.9% Revenue $1,533.2 $2,317.3 $2,876.652-Week High $39.35 EBITDA 232.8 407.7 321.052-Week Low 22.50 EPS (GAAP) NA NA NA90-Day Avg. Daily Trading Volume (000s) 150 EPS (Adjusted) (0.06) 1.28 1.97Fiscal Year End December EPS (Jefferies) NA NA NA
Enterprise Value Calculation ($USD millions) Valuation Metrics (x)
Market Capitalization (fully-diluted) $1,615.6 Enterprise Value / Revenue 2.7x 1.8x 1.4x
Total Debt 1,008.6 Enterprise Value / EBITDA 17.5x 10.0x 12.7x
Minority Interest 1,492.7 Price / Earnings (GAAP) NA NA NAPreferred Equity – Price / Earnings (Adjusted) NM 24.6x 16.0xCash and Cash Equivalents 33.3 Total Debt / EBITDA 4.3x 2.5x 3.1xEnterprise Value $4,083.7
Price / Volume — Last Twelve Months
Atlas Energy, L.P. engages in the development and production of natural gas and oil in the Appalachian basin, Illinois basin, and the Rocky Mountain region of the United States. It is also involved in the provision of natural gas gathering, processing, and treating services in the Anadarko and Permian basins located in the southwestern and mid-continent regions of the United States; natural gas gathering services in the Appalachian basin in the northeastern region of the United States; and natural gas liquids transportation services in the southwest region of the United States. As of December 31, 2011, the company had working interests in approximately 8,500 gross producing natural gas and oil wells; overriding royalty interests in approximately 500 gross producing natural gas and oil wells; and proved reserves of 167.6 billion cubic feet equivalent. It operated 7 active natural gas processing plants with aggregate capacity of approximately 610 MMcfd; 9,000 miles of active natural gas gathering systems located in Oklahoma, Kansas, and Texas, which transport gas from wells and central delivery points in the Anadarko and Permian basins; and 100 miles of active natural gas gathering systems located in Tennessee. Atlas Energy GP, LLC serves as a general partner of Atlas Energy, L.P. The company was formerly known as Atlas Pipeline Holdings, L.P. and changed its name to Atlas Energy, L.P. in February 2011. Atlas Energy, L.P. is based in Pittsburgh, Pennsylvania.
-
500
1,000
1,500
2,000
2,500
–
$5.00
$10.00
$15.00
$20.00
$25.00
$30.00
$35.00
$40.00
$45.00
11/11 12/11 1/12 2/12 3/12 4/12 5/12 6/12 7/12 8/12 9/12 10/12 11/12
Volu
me (0
00s)
Price (
$U
SD
)
Volume Price

Atwood Oceanics, Inc.
Jefferies 2012 Annual Global Energy Conference 9
Sources: Company filings, Company website and Capital IQ as of November 15, 2012. Balance sheet data is as of the most recent SEC filing available on November 15, 2012.
Ticker: ATW Jefferies Rating: Buy Price: $46.37 (as of Nov 15, 2012) Price / Volume Graph
Exchange: NYSE Jefferies Analyst: Brad Handler Target Price: $58.00
Business Description
Founded: 1968 Employees: 1,300 Location: Houston, TX (United States)
Trading Data ( as of Nov 15, 2012) ($USD) Financial Projections ($USD millions, except per share data)
Share Price $46.37 (Consensus, unless otherwise noted) FY 2012E FY 2013E FY 2014E
% of 52-Week High 92.4% Revenue $999.3 $1,282.0 NA52-Week High $50.18 EBITDA 520.1 694.8 609.352-Week Low 34.93 EPS (GAAP) $5.09 $6.68 NA90-Day Avg. Daily Trading Volume (000s) 465 EPS (Adjusted) 5.14 6.80 6.43Fiscal Year End September EPS (Jefferies) 5.00 5.70 NA
Enterprise Value Calculation ($USD millions) Valuation Metrics (x)
Market Capitalization (fully-diluted) $3,030.9 Enterprise Value / Revenue 3.8x 3.0x NA
Total Debt 835.1 Enterprise Value / EBITDA 7.3x 5.5x 6.2x
Minority Interest – Price / Earnings (GAAP) 9.1x 6.9x NAPreferred Equity – Price / Earnings (Adjusted) 9.0x 6.8x 7.2xCash and Cash Equivalents 77.9 Total Debt / EBITDA 1.6x 1.2x 1.4xEnterprise Value $3,788.2
Price / Volume — Last Twelve Months
Atwood Oceanics, Inc., an offshore drilling contractor, engages in the drilling and completion of exploratory and developmental oil and gas wells worldwide. The company owns 10 mobile offshore drilling units located in the U.S. Gulf of Mexico, South America, the Mediterranean Sea, west Africa, Southeast Asia, and Australia. It also has an ultra-deepwater semisubmersible, two ultra-deepwater drillships, and three high-specification jack ups under construction. The company was founded in 1968 and is headquartered in Houston, Texas.
-
500
1,000
1,500
2,000
2,500
–
$10.00
$20.00
$30.00
$40.00
$50.00
$60.00
11/11 12/11 1/12 2/12 3/12 4/12 5/12 6/12 7/12 8/12 9/12 10/12 11/12
Volu
me (0
00s)
Price (
$U
SD
)
Volume Price

Aurora Oil & Gas Ltd.
Jefferies 2012 Annual Global Energy Conference 10
Sources: Company filings, Company website and Capital IQ as of November 15, 2012. Balance sheet data is as of the most recent SEC filing available on November 15, 2012.
Ticker: AUT Jefferies Rating: Not Covered Price: $3.63 (as of Nov 15, 2012) Price / Volume Graph
Exchange: ASX
Business Description
Founded: 1975 Employees: 29 Location: Perth, Australia
Trading Data ( as of Nov 15, 2012) ($USD) Financial Projections ($USD millions, except per share data)
Share Price $3.63 (Consensus, unless otherwise noted) FY 2012E FY 2013E FY 2014E
% of 52-Week High 82.6% Revenue $297.6 $690.3 $887.252-Week High $4.40 EBITDA 161.7 398.2 519.752-Week Low 2.93 EPS (GAAP) $0.15 $0.40 $0.5690-Day Avg. Daily Trading Volume (000s) 1,259 EPS (Adjusted) 0.15 0.40 0.48Fiscal Year End December EPS (Jefferies) NA NA NA
Enterprise Value Calculation ($USD millions) Valuation Metrics (x)
Market Capitalization (fully-diluted) $1,627.4 Enterprise Value / Revenue 6.2x 2.7x 2.1x
Total Debt 360.8 Enterprise Value / EBITDA 11.4x 4.6x 3.6x
Minority Interest – Price / Earnings (GAAP) 23.8x 9.1x 6.5xPreferred Equity – Price / Earnings (Adjusted) 23.7x 9.1x 7.5xCash and Cash Equivalents 143.2 Total Debt / EBITDA 2.2x 0.9x 0.7xEnterprise Value $1,845.0
Price / Volume — Last Twelve Months
Aurora Oil & Gas Limited engages in the development and production of oil, condensate, and natural gas in Karnes, Live Oak, and Atascosa counties in south Texas. It participates in approximately 77,000 gross acres, including approximately 17,800 net acres in the Sugarkane Field in the Eagle Ford shale. The company was formerly known as Tony Barlow Australia Limited and changed its name to Aurora Oil & Gas Limited in April 2005. Aurora Oil & Gas Limited was incorporated in 1975 and is headquartered in Perth, Australia.
-
1,000
2,000
3,000
4,000
5,000
6,000
7,000
8,000
9,000
–
$0.50
$1.00
$1.50
$2.00
$2.50
$3.00
$3.50
$4.00
$4.50
$5.00
11/11 12/11 1/12 2/12 3/12 4/12 5/12 6/12 7/12 8/12 9/12 10/12 11/12
Volu
me (0
00s)
Price (
$U
SD
)
Volume Price

Baker Hughes Incorporated
Jefferies 2012 Annual Global Energy Conference 11
Sources: Company filings, Company website and Capital IQ as of November 15, 2012. Balance sheet data is as of the most recent SEC filing available on November 15, 2012.
Ticker: BHI Jefferies Rating: Hold Price: $39.87 (as of Nov 15, 2012) Price / Volume Graph
Exchange: NYSE Jefferies Analyst: Brad Handler Target Price: $47.00
Business Description
Founded: 1972 Employees: 58,800 Location: Houston, TX (United States)
Trading Data ( as of Nov 15, 2012) ($USD) Financial Projections ($USD millions, except per share data)
Share Price $39.87 (Consensus, unless otherwise noted) FY 2012E FY 2013E FY 2014E
% of 52-Week High NA Revenue $21,220.2 $22,046.0 $24,621.852-Week High $57.97 EBITDA 3,904.8 4,348.2 5,236.852-Week Low 37.08 EPS (GAAP) $3.25 $3.55 $5.1190-Day Avg. Daily Trading Volume (000s) 4,130 EPS (Adjusted) 3.34 3.68 4.90Fiscal Year End December EPS (Jefferies) 3.43 3.75 6.00
Enterprise Value Calculation ($USD millions) Valuation Metrics (x)
Market Capitalization (fully-diluted) $17,528.7 Enterprise Value / Revenue 1.0x 1.0x 0.9x
Total Debt 5,145.0 Enterprise Value / EBITDA 5.6x 5.0x 4.2x
Minority Interest 198.0 Price / Earnings (GAAP) 12.3x 11.2x 7.8xPreferred Equity – Price / Earnings (Adjusted) 11.9x 10.8x 8.1xCash and Cash Equivalents 1,007.0 Total Debt / EBITDA 1.3x 1.2x 1.0xEnterprise Value $21,864.7
Price / Volume — Last Twelve Months
Baker Hughes Incorporated supplies oilfield services, products, and technology services and systems to the oil and natural gas industry worldwide. The company offers drilling and evaluation products and services, including drill bits for performance drilling, hole enlargement, and coring; conventional and rotary steerable systems; measurement-while-drilling and logging-while-drilling systems to perform reservoir navigation services; drilling optimization services; tools for coil tubing drilling and wellbore re-entry systems; coring drilling systems; surface logging systems; emulsion and water-based drilling fluids systems; and reservoir drill-in fluids, as well as fluids environmental services. Its drilling and evaluation products and services also comprise wireline services, such as tools for open hole and cased hole well logging to gather data to perform petrophysical and geophysical analysis; reservoir evaluation coring; casing perforation; fluid characterization; production logging; well integrity testing; pipe recovery; and seismic and micro seismic services. In addition, the company provides completion and production products and services consisting of completion systems; wellbore intervention products and services to improve the performance of existing wellbores; intelligent production system products and services to monitor and control the production from individual wells or fields; artificial lifts, which include electric submersible pumps systems, progressing cavity pump systems, gas lift systems, and surface horizontal pumping systems to lift oil and water; hammer services, tubular running systems, and completion assembly systems; chemicals and chemical application systems; and cementing, stimulation, and coil tubing services. Further, it offers industrial and other products and services to the downstream refining, and the process and pipeline industries. The company was founded in 1972 and is headquartered in Houston, Texas.
-
5,000
10,000
15,000
20,000
25,000
30,000
–
$10.00
$20.00
$30.00
$40.00
$50.00
$60.00
$70.00
11/11 12/11 1/12 2/12 3/12 4/12 5/12 6/12 7/12 8/12 9/12 10/12 11/12
Volu
me (0
00s)
Price (
$U
SD
)
Volume Price

Basic Energy Services, Inc.
Jefferies 2012 Annual Global Energy Conference 12
Sources: Company filings, Company website and Capital IQ as of November 15, 2012. Balance sheet data is as of the most recent SEC filing available on November 15, 2012.
Ticker: BAS Jefferies Rating: Hold Price: $9.24 (as of Nov 15, 2012) Price / Volume Graph
Exchange: NYSE Jefferies Analyst: Brad Handler Target Price: $10.00
Business Description
Founded: 1992 Employees: 5,600 Location: Midland, TX (United States)
Trading Data ( as of Nov 15, 2012) ($USD) Financial Projections ($USD millions, except per share data)
Share Price $9.24 (Consensus, unless otherwise noted) FY 2012E FY 2013E FY 2014E
% of 52-Week High 39.6% Revenue $1,392.2 $1,339.4 $1,470.252-Week High $23.33 EBITDA 318.8 285.4 353.252-Week Low 8.52 EPS (GAAP) $0.94 $0.24 $1.2990-Day Avg. Daily Trading Volume (000s) 1,260 EPS (Adjusted) 1.07 0.27 1.17Fiscal Year End December EPS (Jefferies) 1.09 0.40 1.30
Enterprise Value Calculation ($USD millions) Valuation Metrics (x)
Market Capitalization (fully-diluted) $370.2 Enterprise Value / Revenue 0.8x 0.8x 0.7x
Total Debt 799.8 Enterprise Value / EBITDA 3.3x 3.7x 3.0x
Minority Interest – Price / Earnings (GAAP) 9.8x 38.9x 7.2xPreferred Equity – Price / Earnings (Adjusted) 8.7x 33.7x 7.9xCash and Cash Equivalents 103.6 Total Debt / EBITDA 2.5x 2.8x 2.3xEnterprise Value $1,066.4
Price / Volume — Last Twelve Months
Basic Energy Services, Inc. provides various well site services to oil and natural gas drilling and producing companies in the United States. Its Completion and Remedial Services segment provides pressure pumping services, such as cementing, acidizing, fracturing, coiled tubing, nitrogen, and pressure testing; rental and fishing tools; coiled tubing; snubbing services; thru-tubing; cased-hole wireline services; and underbalanced drilling in low pressure and fluid sensitive reservoirs. This segment operates 222 pressure pumping units. As of December 31, 2011, it operated 12 coiled tubing units; 49 air compressor packages; 12 wireline units; and 26 snubbing units. The company’s Fluid Services segment offers oilfield fluid supply, transportation, storage, and construction services, which comprise the transportation of fluids and salt water; sale and transportation of fresh and brine water; rental of portable frac tanks and test tanks; operation of company-owned fresh water and brine source wells and non-hazardous wastewater disposal wells; and preparation, construction, and maintenance of access roads, drilling locations, and production facilities. This segment operates 890 fluid services trucks. Its Well Servicing segment provides various services performed with a mobile well servicing rig and ancillary equipment, such as maintenance work, hoisting tools and equipment required by the operation, and plugging and abandonment services, as well as manufactures and sells workover rigs. It operates a fleet of 417 well servicing rigs and related equipment. The company’s Contract Drilling segment employs drilling rigs and related equipment to penetrate the earth to a desired depth and initiate production. This segment owns and operates 12 land drilling rigs. The company was formerly known as Sierra Well Service, Inc. and changed its name to Basic Energy Services, Inc. in 2000. Basic Energy Services, Inc. was founded in 1992 and is based in Midland, Texas.
-
1,000
2,000
3,000
4,000
5,000
6,000
–
$5.00
$10.00
$15.00
$20.00
$25.00
11/11 12/11 1/12 2/12 3/12 4/12 5/12 6/12 7/12 8/12 9/12 10/12 11/12
Volu
me (0
00s)
Price (
$U
SD
)
Volume Price
BP plc
Jefferies 2012 Annual Global Energy Conference 13
Sources: Company filings, Company website and Capital IQ as of November 15, 2012. Balance sheet data is as of the most recent SEC filing available on November 15, 2012.
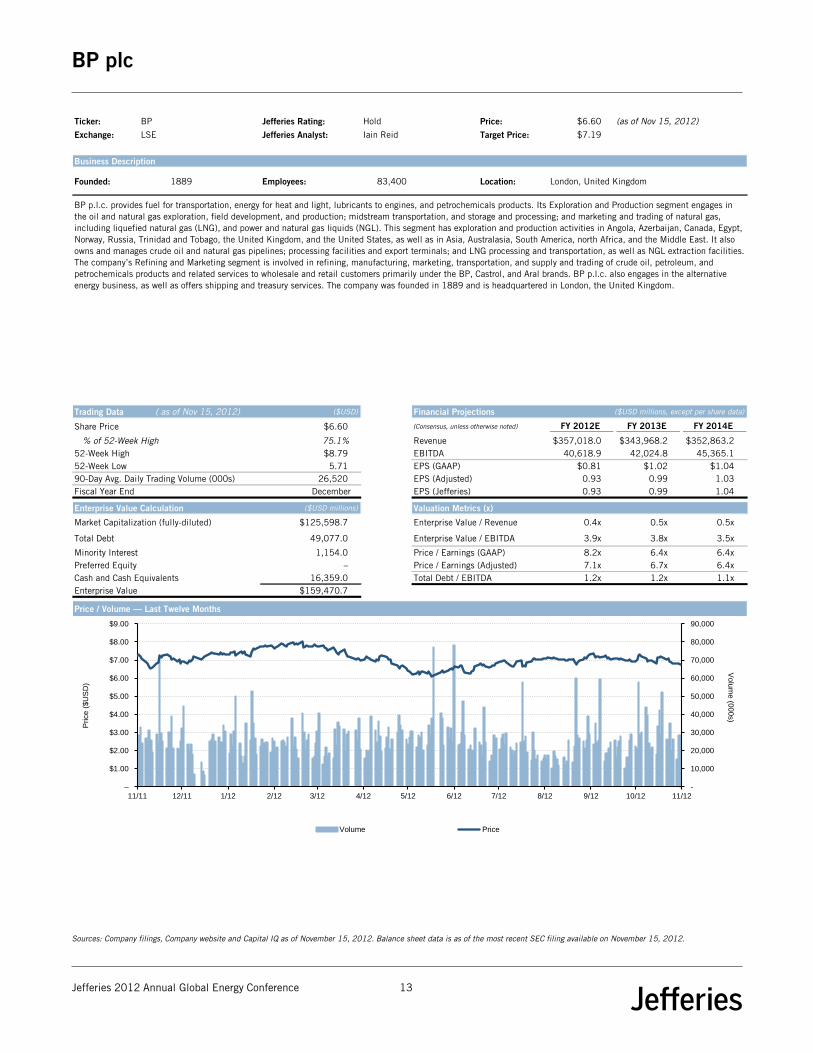
Ticker: BP Jefferies Rating: Hold Price: $6.60 (as of Nov 15, 2012) Price / Volume Graph
Exchange: LSE Jefferies Analyst: Iain Reid Target Price: $7.19
Business Description
Founded: 1889 Employees: 83,400 Location: London, United Kingdom
Trading Data ( as of Nov 15, 2012) ($USD) Financial Projections ($USD millions, except per share data)
Share Price $6.60 (Consensus, unless otherwise noted) FY 2012E FY 2013E FY 2014E
% of 52-Week High 75.1% Revenue $357,018.0 $343,968.2 $352,863.252-Week High $8.79 EBITDA 40,618.9 42,024.8 45,365.152-Week Low 5.71 EPS (GAAP) $0.81 $1.02 $1.0490-Day Avg. Daily Trading Volume (000s) 26,520 EPS (Adjusted) 0.93 0.99 1.03Fiscal Year End December EPS (Jefferies) 0.93 0.99 1.04
Enterprise Value Calculation ($USD millions) Valuation Metrics (x)
Market Capitalization (fully-diluted) $125,598.7 Enterprise Value / Revenue 0.4x 0.5x 0.5x
Total Debt 49,077.0 Enterprise Value / EBITDA 3.9x 3.8x 3.5x
Minority Interest 1,154.0 Price / Earnings (GAAP) 8.2x 6.4x 6.4xPreferred Equity – Price / Earnings (Adjusted) 7.1x 6.7x 6.4xCash and Cash Equivalents 16,359.0 Total Debt / EBITDA 1.2x 1.2x 1.1xEnterprise Value $159,470.7
Price / Volume — Last Twelve Months
BP p.l.c. provides fuel for transportation, energy for heat and light, lubricants to engines, and petrochemicals products. Its Exploration and Production segment engages in the oil and natural gas exploration, field development, and production; midstream transportation, and storage and processing; and marketing and trading of natural gas, including liquefied natural gas (LNG), and power and natural gas liquids (NGL). This segment has exploration and production activities in Angola, Azerbaijan, Canada, Egypt, Norway, Russia, Trinidad and Tobago, the United Kingdom, and the United States, as well as in Asia, Australasia, South America, north Africa, and the Middle East. It also owns and manages crude oil and natural gas pipelines; processing facilities and export terminals; and LNG processing and transportation, as well as NGL extraction facilities. The company’s Refining and Marketing segment is involved in refining, manufacturing, marketing, transportation, and supply and trading of crude oil, petroleum, and petrochemicals products and related services to wholesale and retail customers primarily under the BP, Castrol, and Aral brands. BP p.l.c. also engages in the alternative energy business, as well as offers shipping and treasury services. The company was founded in 1889 and is headquartered in London, the United Kingdom.
-
10,000
20,000
30,000
40,000
50,000
60,000
70,000
80,000
90,000
–
$1.00
$2.00
$3.00
$4.00
$5.00
$6.00
$7.00
$8.00
$9.00
11/11 12/11 1/12 2/12 3/12 4/12 5/12 6/12 7/12 8/12 9/12 10/12 11/12
Volu
me (0
00s)
Price (
$U
SD
)
Volume Price

Breitburn Energy Partners L.P.
Jefferies 2012 Annual Global Energy Conference 14
Sources: Company filings, Company website and Capital IQ as of November 15, 2012. Balance sheet data is as of the most recent SEC filing available on November 15, 2012.
Ticker: BBEP Jefferies Rating: Not Covered Price: $17.01 (as of Nov 15, 2012) Price / Volume Graph
Exchange: NasdaqGS
Business Description
Founded: 2006 Employees: 395 Location: Los Angeles, CA (United States)
Trading Data ( as of Nov 15, 2012) ($USD) Financial Projections ($USD millions, except per share data)
Share Price $17.01 (Consensus, unless otherwise noted) FY 2012E FY 2013E FY 2014E
% of 52-Week High 83.1% Revenue $421.3 $516.6 $588.852-Week High $20.47 EBITDA 296.6 321.6 381.252-Week Low 16.06 EPS (GAAP) $0.09 $0.64 $0.7590-Day Avg. Daily Trading Volume (000s) 762 EPS (Adjusted) 0.71 0.70 0.87Fiscal Year End December EPS (Jefferies) NA NA NA
Enterprise Value Calculation ($USD millions) Valuation Metrics (x)
Market Capitalization (fully-diluted) $1,371.8 Enterprise Value / Revenue 5.1x 4.2x 3.6x
Total Debt 781.7 Enterprise Value / EBITDA 7.2x 6.7x 5.6x
Minority Interest – Price / Earnings (GAAP) NM 26.6x 22.7xPreferred Equity – Price / Earnings (Adjusted) 23.9x 24.1x 19.7xCash and Cash Equivalents 4.4 Total Debt / EBITDA 2.6x 2.4x 2.1xEnterprise Value $2,149.1
Price / Volume — Last Twelve Months
BreitBurn Energy Partners L.P. engages in the acquisition, exploitation, and development of oil and gas properties in the United States. The company’s properties include natural gas, oil, and midstream assets comprising fields in the Antrim Shale in Michigan, and the New Albany Shale in Indiana and Kentucky; and fields in the Evanston and Green River basins in southwestern Wyoming, the Wind river and Big Horn basins in central Wyoming, the Powder River basin in eastern Wyoming, the Los Angeles basin in California, and fields in Florida’s Sunniland Trend. As of December 31, 2011, its total estimated proved reserves were 151.1 million barrels of oil equivalent. BreitBurn GP, LLC serves as the general partner to the company. BreitBurn Energy Partners L.P. was founded in 2006 and is headquartered in Los Angeles, California.
-
1,000
2,000
3,000
4,000
5,000
6,000
7,000
8,000
9,000
10,000
–
$5.00
$10.00
$15.00
$20.00
$25.00
11/11 12/11 1/12 2/12 3/12 4/12 5/12 6/12 7/12 8/12 9/12 10/12 11/12
Volu
me (0
00s)
Price (
$U
SD
)
Volume Price

Bristow Group, Inc.
Jefferies 2012 Annual Global Energy Conference 15
Sources: Company filings, Company website and Capital IQ as of November 15, 2012. Balance sheet data is as of the most recent SEC filing available on November 15, 2012.
Ticker: BRS Jefferies Rating: Not Covered Price: $49.07 (as of Nov 15, 2012) Price / Volume Graph
Exchange: NYSE
Business Description
Founded: 1969 Employees: 3,281 Location: Houston, TX (United States)
Trading Data ( as of Nov 15, 2012) ($USD) Financial Projections ($USD millions, except per share data)
Share Price $49.07 (Consensus, unless otherwise noted) FY 2012E FY 2013E FY 2014E
% of 52-Week High 93.4% Revenue $1,466.5 $1,648.7 $1,850.852-Week High $52.54 EBITDA 291.4 341.9 403.852-Week Low 37.92 EPS (GAAP) $3.55 $4.28 $4.9790-Day Avg. Daily Trading Volume (000s) 170 EPS (Adjusted) 3.53 4.37 5.14Fiscal Year End March EPS (Jefferies) NA NA NA
Enterprise Value Calculation ($USD millions) Valuation Metrics (x)
Market Capitalization (fully-diluted) $1,765.5 Enterprise Value / Revenue 1.5x 1.3x 1.2x
Total Debt 734.7 Enterprise Value / EBITDA 7.4x 6.3x 5.4x
Minority Interest 9.7 Price / Earnings (GAAP) 13.8x 11.5x 9.9xPreferred Equity – Price / Earnings (Adjusted) 13.9x 11.2x 9.6xCash and Cash Equivalents 348.3 Total Debt / EBITDA 2.5x 2.1x 1.8xEnterprise Value $2,161.6
Price / Volume — Last Twelve Months
Bristow Group Inc. provides helicopter services to the offshore energy industry primarily in Europe, West Africa, North America, and Australia. Its helicopters are used principally to transport personnel between onshore bases and offshore production platforms, drilling rigs, and other installations, as well as to transport time-sensitive equipment to these offshore locations. The company also offers helicopter flight training services to commercial pilots and flight instructors through its Bristow Academy; In addition, it provides military training; and helicopter repair, engineering support, airport management, maintenance and support, and search and rescue services. The company provides its helicopter services to integrated, national, and independent oil and gas companies. As of March 31, 2012, it operated a fleet of 556 aircraft. The company was formerly known as Offshore Logistics Inc. and changed its name to Bristow Group Inc. in February 2006. Bristow Group Inc. was founded in 1969 and is based in Houston, Texas.
-
100
200
300
400
500
600
700
800
900
1,000
–
$10.00
$20.00
$30.00
$40.00
$50.00
$60.00
11/11 12/11 1/12 2/12 3/12 4/12 5/12 6/12 7/12 8/12 9/12 10/12 11/12
Volu
me (0
00s)
Price (
$U
SD
)
Volume Price

Cabot Oil & Gas Corporation
Jefferies 2012 Annual Global Energy Conference 16
Sources: Company filings, Company website and Capital IQ as of November 15, 2012. Balance sheet data is as of the most recent SEC filing available on November 15, 2012.
Ticker: COG Jefferies Rating: Buy Price: $47.64 (as of Nov 15, 2012) Price / Volume Graph
Exchange: NYSE Jefferies Analyst: Biju Z Perincheril Target Price: $48.00
Business Description
Founded: 1989 Employees: 529 Location: Houston, TX (United States)
Trading Data ( as of Nov 15, 2012) ($USD) Financial Projections ($USD millions, except per share data)
Share Price $47.64 (Consensus, unless otherwise noted) FY 2012E FY 2013E FY 2014E
% of 52-Week High 96.8% Revenue $1,177.3 $1,669.8 $2,534.652-Week High $49.24 EBITDA 762.1 1,194.8 1,734.652-Week Low 28.84 EPS (GAAP) $0.65 $1.22 $3.0790-Day Avg. Daily Trading Volume (000s) 2,420 EPS (Adjusted) 0.59 1.21 2.44Fiscal Year End December EPS (Jefferies) 0.52 0.65 NA
Enterprise Value Calculation ($USD millions) Valuation Metrics (x)
Market Capitalization (fully-diluted) $9,996.7 Enterprise Value / Revenue 9.4x 6.6x 4.3x
Total Debt 1,062.0 Enterprise Value / EBITDA 14.5x 9.2x 6.4x
Minority Interest – Price / Earnings (GAAP) NM 39.1x 15.5xPreferred Equity – Price / Earnings (Adjusted) NM 39.2x 19.6xCash and Cash Equivalents 37.5 Total Debt / EBITDA 1.4x 0.9x 0.6xEnterprise Value $11,021.2
Price / Volume — Last Twelve Months
Cabot Oil & Gas Corporation, an independent oil and gas company, engages in the development, exploitation, exploration, production, and marketing of natural gas, crude oil and, and natural gas liquids in the United States. The company’s properties primarily located in Appalachia, east and south Texas, and Oklahoma. It also transports, stores, gathers, and produces natural gas for resale. The company sells its natural gas to industrial customers, local distribution companies, and gas marketers through on and off pipeline and gathering system, as well as to intrastate pipelines, natural gas processors, and marketing companies. As of December 31, 2011, it had proved reserves of approximately 3,033 billion cubic feet of natural gas equivalents. The company was founded in 1989 and is headquartered in Houston, Texas.
-
2,000
4,000
6,000
8,000
10,000
12,000
14,000
16,000
–
$10.00
$20.00
$30.00
$40.00
$50.00
$60.00
11/11 12/11 1/12 2/12 3/12 4/12 5/12 6/12 7/12 8/12 9/12 10/12 11/12
Volu
me (0
00s)
Price (
$U
SD
)
Volume Price

Cairn Energy plc
Jefferies 2012 Annual Global Energy Conference 17
Sources: Company filings, Company website and Capital IQ as of November 15, 2012. Balance sheet data is as of the most recent SEC filing available on November 15, 2012.
Ticker: CNE Jefferies Rating: Buy Price: $4.18 (as of Nov 15, 2012) Price / Volume Graph
Exchange: LSE Jefferies Analyst: Laura Loppacher Target Price: $6.15
Business Description
Founded: NM Employees: 1,178 Location: Edinburgh, United Kingdom
Trading Data ( as of Nov 15, 2012) ($USD) Financial Projections ($USD millions, except per share data)
Share Price $4.18 (Consensus, unless otherwise noted) FY 2012E FY 2013E FY 2014E
% of 52-Week High 34.4% Revenue NA NA NA52-Week High $12.16 EBITDA (124.1) 17.6 (119.9)52-Week Low 3.89 EPS (GAAP) $0.00 ($0.02) ($0.01)90-Day Avg. Daily Trading Volume (000s) 1,647 EPS (Adjusted) (0.42) (0.02) (0.03)Fiscal Year End December EPS (Jefferies) (0.16) (0.17) NA
Enterprise Value Calculation ($USD millions) Valuation Metrics (x)
Market Capitalization (fully-diluted) $2,516.9 Enterprise Value / Revenue NA NA NA
Total Debt 6.0 Enterprise Value / EBITDA NM NM NM
Minority Interest – Price / Earnings (GAAP) NM NM NMPreferred Equity – Price / Earnings (Adjusted) NM NM NMCash and Cash Equivalents 932.8 Total Debt / EBITDA NM 0.3x NMEnterprise Value $1,590.1
Price / Volume — Last Twelve Months
Cairn Energy PLC engages in the exploration for, and development and production of oil and gas. The company has license interests principally in 11 blocks covering a total area of 102,000 square kilometers located in Greenland. It also has license interests in various blocks located in Albania, Spain, Nepal, and India. The company is headquartered in Edinburgh, the United Kingdom.
-
5,000
10,000
15,000
20,000
25,000
30,000
35,000
40,000
45,000
–
$2.00
$4.00
$6.00
$8.00
$10.00
$12.00
$14.00
11/11 12/11 1/12 2/12 3/12 4/12 5/12 6/12 7/12 8/12 9/12 10/12 11/12
Volu
me (0
00s)
Price (
$U
SD
)
Volume Price

Cameron International Corporation
Jefferies 2012 Annual Global Energy Conference 18
Sources: Company filings, Company website and Capital IQ as of November 15, 2012. Balance sheet data is as of the most recent SEC filing available on November 15, 2012.
Ticker: CAM Jefferies Rating: Buy Price: $52.63 (as of Nov 15, 2012) Price / Volume Graph
Exchange: NYSE Jefferies Analyst: Brad Handler Target Price: $63.00
Business Description
Founded: 1833 Employees: 22,500 Location: Houston, TX (United States)
Trading Data ( as of Nov 15, 2012) ($USD) Financial Projections ($USD millions, except per share data)
Share Price $52.63 (Consensus, unless otherwise noted) FY 2012E FY 2013E FY 2014E
% of 52-Week High 87.7% Revenue $8,459.8 $9,550.7 $10,691.752-Week High $60.00 EBITDA 1,331.1 1,662.8 2,016.152-Week Low 38.38 EPS (GAAP) $3.11 $4.00 $5.0990-Day Avg. Daily Trading Volume (000s) 2,723 EPS (Adjusted) 3.15 4.07 5.14Fiscal Year End December EPS (Jefferies) 3.12 3.80 4.85
Enterprise Value Calculation ($USD millions) Valuation Metrics (x)
Market Capitalization (fully-diluted) $12,984.6 Enterprise Value / Revenue 1.6x 1.4x 1.3x
Total Debt 2,047.8 Enterprise Value / EBITDA 10.3x 8.2x 6.8x
Minority Interest – Price / Earnings (GAAP) 16.9x 13.2x 10.3xPreferred Equity – Price / Earnings (Adjusted) 16.7x 12.9x 10.2xCash and Cash Equivalents 1,354.8 Total Debt / EBITDA 1.5x 1.2x 1.0xEnterprise Value $13,677.6
Price / Volume — Last Twelve Months
Cameron International Corporation provides flow equipment products, systems, and services worldwide. Its Drilling & Production Systems segment offers systems and equipment to control pressures and direct flows of oil and gas wells; and designs and manufactures structural components for land and offshore drilling rigs. This segment provides surface and subsea production systems, blowout preventers, drilling and production control systems, block and gate valves, actuators, chokes, wellheads, manifolds, drilling risers, top drives, mud pumps, elastomers, and other rig products. The company’s Valves & Measurement segment offers valves and measurement systems primarily to control, direct, and measure the flow of oil and gas. This segment provides gate and ball valves, butterfly and Orbit valves, double block and bleed valves, plug and globe valves, check valves, actuators, and chokes; and measurement products, such as totalizers, turbine meters, flow computers, chart recorders, ultrasonic flow meters, and sampling systems. Its Process & Compression Systems segment offers process packages for the separation and treatment of impurities. This segment provides oil and gas separation equipment, heaters, dehydration and desalting units, gas conditioning units, membrane separation and water processing systems, integral engine-compressors, separable reciprocating compressors, two and four-stroke cycle gas engines, turbochargers, integrally-geared centrifugal compressors, and compressor systems and controls; and aftermarket services comprising spare parts, technical services, repairs, overhauls, and upgrades. Cameron International Corporation serves oil, gas, and process industries through sales and marketing employees, agents, distributors, and wholesalers. The company was formerly known as Cooper Cameron Corporation and changed its name to Cameron International Corporation in May 2006. Cameron International Corporation was founded in 1833 and is headquartered in Houston, Texas.
-
2,000
4,000
6,000
8,000
10,000
12,000
14,000
–
$10.00
$20.00
$30.00
$40.00
$50.00
$60.00
$70.00
11/11 12/11 1/12 2/12 3/12 4/12 5/12 6/12 7/12 8/12 9/12 10/12 11/12
Volu
me (0
00s)
Price (
$U
SD
)
Volume Price

Chesapeake Energy Corporation
Jefferies 2012 Annual Global Energy Conference 19
Sources: Company filings, Company website and Capital IQ as of November 15, 2012. Balance sheet data is as of the most recent SEC filing available on November 15, 2012.
Ticker: CHK Jefferies Rating: Buy Price: $16.39 (as of Nov 15, 2012) Price / Volume Graph
Exchange: NYSE Jefferies Analyst: Biju Z Perincheril Target Price: $26.00
Business Description
Founded: 1989 Employees: 12,600 Location: Oklahoma City, OK (United States)
Trading Data ( as of Nov 15, 2012) ($USD) Financial Projections ($USD millions, except per share data)
Share Price $16.39 (Consensus, unless otherwise noted) FY 2012E FY 2013E FY 2014E
% of 52-Week High 62.7% Revenue $11,532.8 $12,163.1 $14,117.152-Week High $26.16 EBITDA 3,592.3 4,792.2 5,968.352-Week Low 13.32 EPS (GAAP) ($0.95) $1.24 $1.8890-Day Avg. Daily Trading Volume (000s) 13,091 EPS (Adjusted) 0.46 1.31 2.14Fiscal Year End December EPS (Jefferies) 0.43 1.01 NA
Enterprise Value Calculation ($USD millions) Valuation Metrics (x)
Market Capitalization (fully-diluted) $10,564.4 Enterprise Value / Revenue 2.8x 2.7x 2.3x
Total Debt 16,458.0 Enterprise Value / EBITDA 9.0x 6.7x 5.4x
Minority Interest 2,364.0 Price / Earnings (GAAP) NM 13.2x 8.7xPreferred Equity 3,062.0 Price / Earnings (Adjusted) 35.4x 12.5x 7.7xCash and Cash Equivalents 142.0 Total Debt / EBITDA 4.6x 3.4x 2.8xEnterprise Value $32,306.4
Price / Volume — Last Twelve Months
Chesapeake Energy Corporation engages in the acquisition, exploration, development, and production of natural gas and oil properties in the United States. The company also offers marketing, midstream, drilling, and other oilfield services. It holds interests in various natural gas resources, including the Haynesville and Bossier Shales in northwestern Louisiana and East Texas; the Marcellus Shale in the northern Appalachian Basin of West Virginia and Pennsylvania; the Barnett Shale in the Fort Worth Basin of north-central Texas; and the Pearsall Shale in South Texas. The company also holds interests in various liquids-rich resource plays located in Oklahoma, the Texas Panhandle, West Texas, southern New Mexico, and Wyoming. As of December 31, 2011, it had interests in approximately 45,700 gross productive wells. The company’s proved reserves comprise approximately 18.789 trillion cubic feet of natural gas equivalents. Chesapeake Energy Corporation was founded in 1989 and is based in Oklahoma City, Oklahoma.
-
20,000
40,000
60,000
80,000
100,000
120,000
140,000
160,000
–
$5.00
$10.00
$15.00
$20.00
$25.00
$30.00
11/11 12/11 1/12 2/12 3/12 4/12 5/12 6/12 7/12 8/12 9/12 10/12 11/12
Volu
me (0
00s)
Price (
$U
SD
)
Volume Price

Cobalt International Energy, Inc.
Jefferies 2012 Annual Global Energy Conference 20
Sources: Company filings, Company website and Capital IQ as of November 15, 2012. Balance sheet data is as of the most recent SEC filing available on November 15, 2012.
Ticker: CIE Jefferies Rating: Not Covered Price: $20.59 (as of Nov 15, 2012) Price / Volume Graph
Exchange: NYSE
Business Description
Founded: 2005 Employees: 75 Location: Houston, TX (United States)
Trading Data ( as of Nov 15, 2012) ($USD) Financial Projections ($USD millions, except per share data)
Share Price $20.59 (Consensus, unless otherwise noted) FY 2012E FY 2013E FY 2014E
% of 52-Week High 56.4% Revenue NA $0.0 $0.052-Week High $36.51 EBITDA (103.2) (116.7) (111.6)52-Week Low 8.77 EPS (GAAP) ($0.65) ($0.51) ($0.75)90-Day Avg. Daily Trading Volume (000s) 1,292 EPS (Adjusted) (0.55) (0.50) (0.50)Fiscal Year End December EPS (Jefferies) NA NA NA
Enterprise Value Calculation ($USD millions) Valuation Metrics (x)
Market Capitalization (fully-diluted) $8,453.7 Enterprise Value / Revenue NA NM NM
Total Debt – Enterprise Value / EBITDA NM NM NM
Minority Interest – Price / Earnings (GAAP) NM NM NMPreferred Equity – Price / Earnings (Adjusted) NM NM NMCash and Cash Equivalents 1,012.2 Total Debt / EBITDA – – – Enterprise Value $7,441.5
Price / Volume — Last Twelve Months
Cobalt International Energy, Inc., a development stage company, operates as an independent oil-focused exploration and production company. It focuses on the deepwater of the United States Gulf of Mexico, and offshore Angola and Gabon in West Africa. The company has strategic relationships with TOTAL E&P USA, INC. and Sociedade Nacional de Combustíveis de Angola—Empresa Pública. Cobalt International Energy, Inc. was founded in 2005 and is headquartered in Houston, Texas.
-
5,000
10,000
15,000
20,000
25,000
–
$5.00
$10.00
$15.00
$20.00
$25.00
$30.00
$35.00
$40.00
11/11 12/11 1/12 2/12 3/12 4/12 5/12 6/12 7/12 8/12 9/12 10/12 11/12
Volu
me (0
00s)
Price (
$U
SD
)
Volume Price

Compagnie Générale de Géophysique-Veritas SA
Jefferies 2012 Annual Global Energy Conference 21
Sources: Company filings, Company website and Capital IQ as of November 15, 2012. Balance sheet data is as of the most recent SEC filing available on November 15, 2012.
Ticker: GA Jefferies Rating: Not Covered Price: $28.07 (as of Nov 15, 2012) Price / Volume Graph
Exchange: ENXTPA
Business Description
Founded: 1931 Employees: 7,198 Location: Paris, France
Trading Data ( as of Nov 15, 2012) ($USD) Financial Projections ($USD millions, except per share data)
Share Price $28.07 (Consensus, unless otherwise noted) FY 2012E FY 2013E FY 2014E
% of 52-Week High 82.0% Revenue $3,593.6 $4,732.2 $5,154.652-Week High $34.22 EBITDA 1,163.5 1,656.4 1,895.052-Week Low 18.04 EPS (GAAP) $1.19 $2.68 $3.6790-Day Avg. Daily Trading Volume (000s) 908 EPS (Adjusted) 1.23 2.66 3.83Fiscal Year End December EPS (Jefferies) NA NA NA
Enterprise Value Calculation ($USD millions) Valuation Metrics (x)
Market Capitalization (fully-diluted) $4,243.5 Enterprise Value / Revenue 1.7x 1.3x 1.2x
Total Debt 1,996.8 Enterprise Value / EBITDA 5.2x 3.6x 3.2x
Minority Interest 94.3 Price / Earnings (GAAP) 23.6x 10.5x 7.7xPreferred Equity – Price / Earnings (Adjusted) 22.7x 10.5x 7.3xCash and Cash Equivalents 337.1 Total Debt / EBITDA 1.7x 1.2x 1.1xEnterprise Value $5,997.5
Price / Volume — Last Twelve Months
Compagnie Générale de Géophysique Veritas, S.A. engages in the provision of geophysical equipment and geophysical services for the oil and gas exploration and production industry in North America, Central and South Americas, Europe, Africa, the Middle East, and the Asia Pacific. The company engages in the acquisition of seismic data for land, transition zones, and shallow water; processing, imaging, and interpretation of geophysical data, data management, and reservoir studies; and acquisition of offshore seismic data, as well as provides related processing and interpretation software. It is also involved in the development and production of seismic acquisition systems and specialized equipment in the land and marine seismic markets. As of December 31, 2011, the company operated processing and imaging centers, including 13 dedicated client centers. Compagnie Générale de Géophysique Veritas, S.A. was founded in 1931 and is headquartered in Paris, France.
-
500
1,000
1,500
2,000
2,500
3,000
3,500
–
$5.00
$10.00
$15.00
$20.00
$25.00
$30.00
$35.00
$40.00
11/11 12/11 1/12 2/12 3/12 4/12 5/12 6/12 7/12 8/12 9/12 10/12
Volu
me (0
00s)
Price (
$U
SD
)
Volume Price

Comstock Resources Inc.
Jefferies 2012 Annual Global Energy Conference 22
Sources: Company filings, Company website and Capital IQ as of November 15, 2012. Balance sheet data is as of the most recent SEC filing available on November 15, 2012.
Ticker: CRK Jefferies Rating: Not Covered Price: $15.81 (as of Nov 15, 2012) Price / Volume Graph
Exchange: NYSE
Business Description
Founded: 1919 Employees: 124 Location: Frisco, TX (United States)
Trading Data ( as of Nov 15, 2012) ($USD) Financial Projections ($USD millions, except per share data)
Share Price $15.81 (Consensus, unless otherwise noted) FY 2012E FY 2013E FY 2014E
% of 52-Week High 74.7% Revenue $470.3 $636.2 $855.952-Week High $21.16 EBITDA 337.3 486.9 552.052-Week Low 11.05 EPS (GAAP) ($0.87) $0.94 $3.5190-Day Avg. Daily Trading Volume (000s) 1,216 EPS (Adjusted) (1.42) 0.85 2.21Fiscal Year End December EPS (Jefferies) NA NA NA
Enterprise Value Calculation ($USD millions) Valuation Metrics (x)
Market Capitalization (fully-diluted) $761.4 Enterprise Value / Revenue 4.2x 3.1x 2.3x
Total Debt 1,238.8 Enterprise Value / EBITDA 5.9x 4.1x 3.6x
Minority Interest – Price / Earnings (GAAP) NM 16.7x 4.5xPreferred Equity – Price / Earnings (Adjusted) NM 18.5x 7.1xCash and Cash Equivalents 17.6 Total Debt / EBITDA 3.7x 2.5x 2.2xEnterprise Value $1,982.6
Price / Volume — Last Twelve Months
Comstock Resources, Inc. engages in the acquisition, exploration, development, and production of oil and natural gas properties in the United States. The company’s oil and gas operations are primarily located in east Texas/north Louisiana, south Texas, and west Texas, as well as in New Mexico, Kentucky, and the Mid-Continent region. It owns interests in approximately 1,711 producing oil and natural gas wells, as well as operates 974 of those wells. As of December 31, 2011, the company had proved reserves of 1.3 trillion cubic feet of natural gas equivalent. Comstock Resources, Inc. was founded in 1919 and is headquartered in Frisco, Texas.
-
1,000
2,000
3,000
4,000
5,000
6,000
7,000
8,000
9,000
10,000
–
$5.00
$10.00
$15.00
$20.00
$25.00
11/11 12/11 1/12 2/12 3/12 4/12 5/12 6/12 7/12 8/12 9/12 10/12 11/12
Volu
me (0
00s)
Price (
$U
SD
)
Volume Price

ConocoPhillips
Jefferies 2012 Annual Global Energy Conference 23
Sources: Company filings, Company website and Capital IQ as of November 15, 2012. Balance sheet data is as of the most recent SEC filing available on November 15, 2012.
Ticker: COP Jefferies Rating: Hold Price: $54.59 (as of Nov 15, 2012) Price / Volume Graph
Exchange: NYSE Jefferies Analyst: Iain Reid Target Price: $60.00
Business Description
Founded: 1917 Employees: 16,700 Location: Houston, TX (United States)
Trading Data ( as of Nov 15, 2012) ($USD) Financial Projections ($USD millions, except per share data)
Share Price $54.59 (Consensus, unless otherwise noted) FY 2012E FY 2013E FY 2014E
% of 52-Week High 69.7% Revenue $96,463.5 $55,205.9 $49,363.452-Week High $78.29 EBITDA 23,002.0 22,927.5 24,342.352-Week Low 50.62 EPS (GAAP) $6.43 $5.77 $6.0690-Day Avg. Daily Trading Volume (000s) 6,093 EPS (Adjusted) 5.95 6.21 6.21Fiscal Year End December EPS (Jefferies) 5.68 5.22 5.80
Enterprise Value Calculation ($USD millions) Valuation Metrics (x)
Market Capitalization (fully-diluted) $66,266.5 Enterprise Value / Revenue 0.9x 1.6x 1.8x
Total Debt 24,886.0 Enterprise Value / EBITDA 3.9x 3.9x 3.7x
Minority Interest 471.0 Price / Earnings (GAAP) 8.5x 9.5x 9.0xPreferred Equity – Price / Earnings (Adjusted) 9.2x 8.8x 8.8xCash and Cash Equivalents 1,268.0 Total Debt / EBITDA 1.1x 1.1x 1.0xEnterprise Value $90,355.5
Price / Volume — Last Twelve Months
ConocoPhillips explores for, produces, transports, and markets crude oil, natural gas, natural gas liquids, liquefied natural gas and bitumen on a worldwide basis. The company’s portfolio includes assets in North America, Europe, Asia, and Australia; growing North American shale and oil sands businesses; various international development projects; and a global exploration program. As of December 31, 2011, ConocoPhillips conducted exploration activities in 19 countries and produced hydrocarbons in 13 countries, with proved reserves located in 15 countries. The company was founded in 1917 and is based in Houston, Texas.
-
5,000
10,000
15,000
20,000
25,000
30,000
35,000
40,000
–
$10.00
$20.00
$30.00
$40.00
$50.00
$60.00
$70.00
$80.00
$90.00
11/11 12/11 1/12 2/12 3/12 4/12 5/12 6/12 7/12 8/12 9/12 10/12 11/12
Volu
me (0
00s)
Price (
$U
SD
)
Volume Price

Continental Resources, Inc.
Jefferies 2012 Annual Global Energy Conference 24
Sources: Company filings, Company website and Capital IQ as of November 15, 2012. Balance sheet data is as of the most recent SEC filing available on November 15, 2012.
Ticker: CLR Jefferies Rating: Buy Price: $68.71 (as of Nov 15, 2012) Price / Volume Graph
Exchange: NYSE Jefferies Analyst: Subash Chandra Target Price: $91.00
Business Description
Founded: 1967 Employees: 721 Location: Oklahoma City, OK (United States)
Trading Data ( as of Nov 15, 2012) ($USD) Financial Projections ($USD millions, except per share data)
Share Price $68.71 (Consensus, unless otherwise noted) FY 2012E FY 2013E FY 2014E
% of 52-Week High 70.7% Revenue $2,418.8 $3,204.1 $4,335.752-Week High $97.19 EBITDA 1,894.1 2,593.8 3,495.652-Week Low 61.02 EPS (GAAP) $3.67 $4.30 $5.2590-Day Avg. Daily Trading Volume (000s) 967 EPS (Adjusted) 3.26 4.62 6.13Fiscal Year End December EPS (Jefferies) 3.41 4.76 NA
Enterprise Value Calculation ($USD millions) Valuation Metrics (x)
Market Capitalization (fully-diluted) $12,625.1 Enterprise Value / Revenue 6.3x 4.8x 3.5x
Total Debt 2,945.7 Enterprise Value / EBITDA 8.1x 5.9x 4.4x
Minority Interest – Price / Earnings (GAAP) 18.7x 16.0x 13.1xPreferred Equity – Price / Earnings (Adjusted) 21.1x 14.9x 11.2xCash and Cash Equivalents 259.4 Total Debt / EBITDA 1.6x 1.1x 0.8xEnterprise Value $15,311.4
Price / Volume — Last Twelve Months
Continental Resources, Inc. engages in the exploration, development, and production of crude oil and natural gas primarily in the north, south, and east regions of the United States. The company primarily sells its oil and natural gas production to end users, as well as to midstream marketing companies or oil refining companies at the lease. As of December 31, 2011, its estimated proved reserves were 508.4 million barrels of crude oil equivalent, with estimated proved developed reserves of 205.2 million barrels of crude oil equivalent. The company had interests in 3,255 wells and served as the operator of 2,082 of these wells. Continental Resources, Inc. was founded in 1967 and is headquartered in Enid, Oklahoma.
-
500
1,000
1,500
2,000
2,500
3,000
3,500
4,000
4,500
–
$10.00
$20.00
$30.00
$40.00
$50.00
$60.00
$70.00
$80.00
$90.00
$100.00
11/11 12/11 1/12 2/12 3/12 4/12 5/12 6/12 7/12 8/12 9/12 10/12 11/12
Volu
me (0
00s)
Price (
$U
SD
)
Volume Price

Copano Energy LLC
Jefferies 2012 Annual Global Energy Conference 25
Sources: Company filings, Company website and Capital IQ as of November 15, 2012. Balance sheet data is as of the most recent SEC filing available on November 15, 2012.
Ticker: CPNO Jefferies Rating: Not Covered Price: $29.06 (as of Nov 15, 2012) Price / Volume Graph
Exchange: NasdaqGS
Business Description
Founded: 2001 Employees: 391 Location: Houston, TX (United States)
Trading Data ( as of Nov 15, 2012) ($USD) Financial Projections ($USD millions, except per share data)
Share Price $29.06 (Consensus, unless otherwise noted) FY 2012E FY 2013E FY 2014E
% of 52-Week High 76.4% Revenue $1,428.6 $1,765.5 $1,742.552-Week High $38.03 EBITDA 232.2 302.7 362.152-Week Low 24.24 EPS (GAAP) ($1.54) $0.89 $1.2890-Day Avg. Daily Trading Volume (000s) 362 EPS (Adjusted) 0.30 0.96 1.63Fiscal Year End December EPS (Jefferies) NA NA NA
Enterprise Value Calculation ($USD millions) Valuation Metrics (x)
Market Capitalization (fully-diluted) $2,294.0 Enterprise Value / Revenue 2.5x 2.1x 2.1x
Total Debt 1,094.2 Enterprise Value / EBITDA 15.6x 12.0x 10.0x
Minority Interest – Price / Earnings (GAAP) NM 32.5x 22.7xPreferred Equity 285.2 Price / Earnings (Adjusted) NM 30.2x 17.8xCash and Cash Equivalents 53.5 Total Debt / EBITDA 4.7x 3.6x 3.0xEnterprise Value $3,619.9
Price / Volume — Last Twelve Months
Copano Energy, L.L.C. provides midstream services to natural gas producers in the United States. The company’s services include natural gas gathering, compression, dehydration, treating, marketing, transportation, processing, and fractionation. It owns and operates natural gas gathering and intrastate transportation pipeline assets; natural gas processing and fractionation facilities; and natural gas liquid (NGL) pipelines in Texas, Oklahoma, Wyoming, and Louisiana. The company operates approximately 6,800 miles of natural gas gathering and transmission pipelines; and 10 natural gas processing plants with approximately 1 billion cubic feet per day of combined processing capacity. It also operates 380 miles of NGL pipelines. The company serves third-party pipelines, distribution companies, power generation facilities, and industrial customers. Copano Energy, L.L.C. was founded in 2001 and is based in Houston, Texas.
-
1,000
2,000
3,000
4,000
5,000
6,000
7,000
–
$5.00
$10.00
$15.00
$20.00
$25.00
$30.00
$35.00
$40.00
11/11 12/11 1/12 2/12 3/12 4/12 5/12 6/12 7/12 8/12 9/12 10/12 11/12
Volu
me (0
00s)
Price (
$U
SD
)
Volume Price

Core Laboratories NV
Jefferies 2012 Annual Global Energy Conference 26
Sources: Company filings, Company website and Capital IQ as of November 15, 2012. Balance sheet data is as of the most recent SEC filing available on November 15, 2012.
Ticker: CLB Jefferies Rating: Not Covered Price: $98.73 (as of Nov 15, 2012) Price / Volume Graph
Exchange: NYSE
Business Description
Founded: 1936 Employees: 5,000 Location: Amsterdam, Netherlands
Trading Data ( as of Nov 15, 2012) ($USD) Financial Projections ($USD millions, except per share data)
Share Price $98.73 (Consensus, unless otherwise noted) FY 2012E FY 2013E FY 2014E
% of 52-Week High 68.9% Revenue $973.9 $1,054.3 $1,176.652-Week High $143.21 EBITDA 316.8 348.3 395.552-Week Low 94.72 EPS (GAAP) $4.52 $5.00 $5.7790-Day Avg. Daily Trading Volume (000s) 404 EPS (Adjusted) 4.48 5.01 5.81Fiscal Year End December EPS (Jefferies) NA NA NA
Enterprise Value Calculation ($USD millions) Valuation Metrics (x)
Market Capitalization (fully-diluted) $4,606.5 Enterprise Value / Revenue 4.9x 4.6x 4.1x
Total Debt 213.1 Enterprise Value / EBITDA 15.2x 13.8x 12.1x
Minority Interest 3.9 Price / Earnings (GAAP) 21.8x 19.8x 17.1xPreferred Equity – Price / Earnings (Adjusted) 22.0x 19.7x 17.0xCash and Cash Equivalents 24.7 Total Debt / EBITDA 0.7x 0.6x 0.5xEnterprise Value $4,798.8
Price / Volume — Last Twelve Months
Core Laboratories N.V. engages in the provision of reservoir description, production enhancement, and reservoir management services to the oil and gas industry worldwide. The company’s reservoir description services comprise the characterization of petroleum reservoir rock, fluid, and gas samples; and provision of analytical and field services to characterize properties of crude oil and petroleum products. Its production enhancement products and services relate to reservoir well completions, perforations, stimulations, and production, as well as include integrated services to evaluate the effectiveness of well completions and to develop solutions to increase the effectiveness of enhanced oil recovery projects. The company’s reservoir management services consist of the combination and integration of information from reservoir description and production enhancement services to increase production and enhance recovery of oil and gas from clients' reservoirs. Core Laboratories N.V. markets and sells its services and products through sales representatives, technical seminars, trade shows, and print advertising, as well as through direct sales force, technical experts, operating managers, sales representatives, and distributors in various markets. The company was founded in 1936 and is based in Amsterdam, the Netherlands.
-
500
1,000
1,500
2,000
2,500
3,000
3,500
4,000
–
$20.00
$40.00
$60.00
$80.00
$100.00
$120.00
$140.00
$160.00
11/11 12/11 1/12 2/12 3/12 4/12 5/12 6/12 7/12 8/12 9/12 10/12 11/12
Volu
me (0
00s)
Price (
$U
SD
)
Volume Price
Crimson Exploration Inc.
Jefferies 2012 Annual Global Energy Conference 27
Sources: Company filings, Company website and Capital IQ as of November 15, 2012. Balance sheet data is as of the most recent SEC filing available on November 15, 2012.
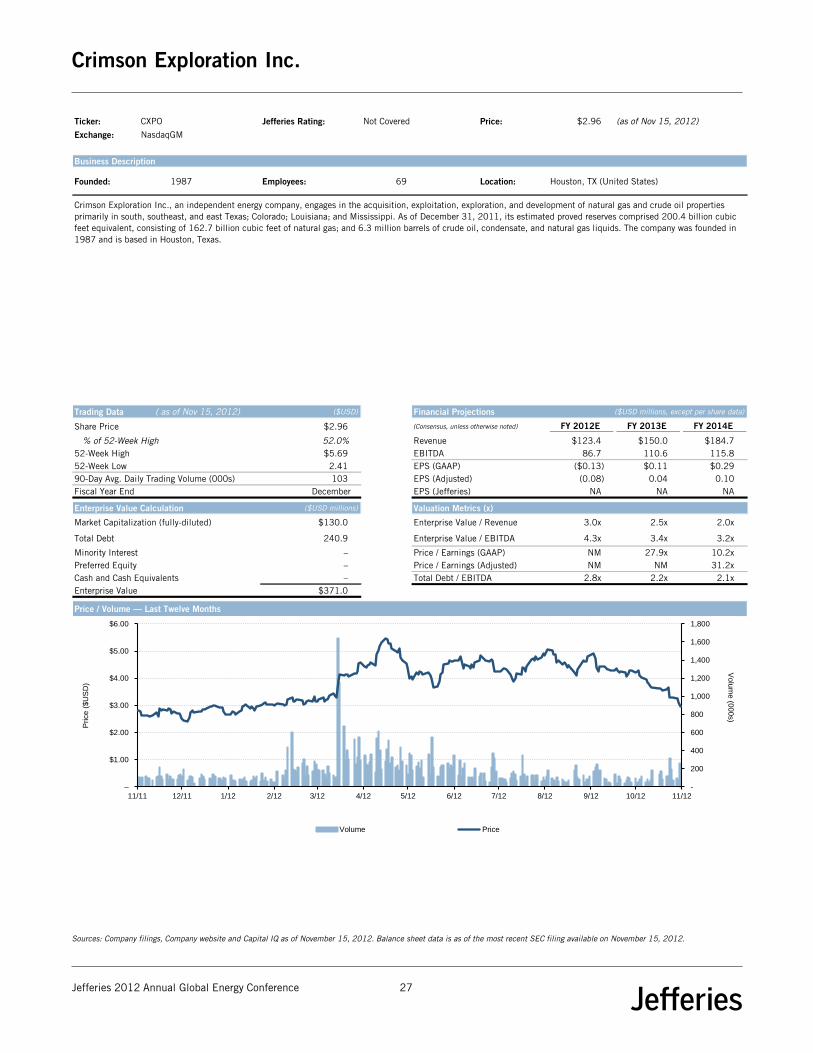
Ticker: CXPO Jefferies Rating: Not Covered Price: $2.96 (as of Nov 15, 2012) Price / Volume Graph
Exchange: NasdaqGM
Business Description
Founded: 1987 Employees: 69 Location: Houston, TX (United States)
Trading Data ( as of Nov 15, 2012) ($USD) Financial Projections ($USD millions, except per share data)
Share Price $2.96 (Consensus, unless otherwise noted) FY 2012E FY 2013E FY 2014E
% of 52-Week High 52.0% Revenue $123.4 $150.0 $184.752-Week High $5.69 EBITDA 86.7 110.6 115.852-Week Low 2.41 EPS (GAAP) ($0.13) $0.11 $0.2990-Day Avg. Daily Trading Volume (000s) 103 EPS (Adjusted) (0.08) 0.04 0.10Fiscal Year End December EPS (Jefferies) NA NA NA
Enterprise Value Calculation ($USD millions) Valuation Metrics (x)
Market Capitalization (fully-diluted) $130.0 Enterprise Value / Revenue 3.0x 2.5x 2.0x
Total Debt 240.9 Enterprise Value / EBITDA 4.3x 3.4x 3.2x
Minority Interest – Price / Earnings (GAAP) NM 27.9x 10.2xPreferred Equity – Price / Earnings (Adjusted) NM NM 31.2xCash and Cash Equivalents – Total Debt / EBITDA 2.8x 2.2x 2.1xEnterprise Value $371.0
Price / Volume — Last Twelve Months
Crimson Exploration Inc., an independent energy company, engages in the acquisition, exploitation, exploration, and development of natural gas and crude oil properties primarily in south, southeast, and east Texas; Colorado; Louisiana; and Mississippi. As of December 31, 2011, its estimated proved reserves comprised 200.4 billion cubic feet equivalent, consisting of 162.7 billion cubic feet of natural gas; and 6.3 million barrels of crude oil, condensate, and natural gas liquids. The company was founded in 1987 and is based in Houston, Texas.
-
200
400
600
800
1,000
1,200
1,400
1,600
1,800
–
$1.00
$2.00
$3.00
$4.00
$5.00
$6.00
11/11 12/11 1/12 2/12 3/12 4/12 5/12 6/12 7/12 8/12 9/12 10/12 11/12
Volu
me (0
00s)
Price (
$U
SD
)
Volume Price

Diamond Offshore Drilling, Inc.
Jefferies 2012 Annual Global Energy Conference 28
Sources: Company filings, Company website and Capital IQ as of November 15, 2012. Balance sheet data is as of the most recent SEC filing available on November 15, 2012.
Ticker: DO Jefferies Rating: Hold Price: $64.91 (as of Nov 15, 2012) Price / Volume Graph
Exchange: NYSE Jefferies Analyst: Brad Handler Target Price: $75.00
Business Description
Founded: 1989 Employees: 5,300 Location: Houston, TX (United States)
Trading Data ( as of Nov 15, 2012) ($USD) Financial Projections ($USD millions, except per share data)
Share Price $64.91 (Consensus, unless otherwise noted) FY 2012E FY 2013E FY 2014E
% of 52-Week High 88.3% Revenue $2,977.3 $3,231.4 $4,029.652-Week High $73.50 EBITDA 1,309.0 1,462.3 1,981.452-Week Low 52.98 EPS (GAAP) $5.00 $5.26 $7.7590-Day Avg. Daily Trading Volume (000s) 1,267 EPS (Adjusted) 4.74 5.26 7.72Fiscal Year End December EPS (Jefferies) 4.74 5.25 8.20
Enterprise Value Calculation ($USD millions) Valuation Metrics (x)
Market Capitalization (fully-diluted) $9,024.4 Enterprise Value / Revenue 3.0x 2.8x 2.2x
Total Debt 1,496.0 Enterprise Value / EBITDA 6.9x 6.2x 4.6x
Minority Interest – Price / Earnings (GAAP) 13.0x 12.3x 8.4xPreferred Equity – Price / Earnings (Adjusted) 13.7x 12.3x 8.4xCash and Cash Equivalents 1,492.2 Total Debt / EBITDA 1.1x 1.0x 0.8xEnterprise Value $9,028.3
Price / Volume — Last Twelve Months
Diamond Offshore Drilling, Inc. operates as an offshore oil and gas drilling contractor worldwide. It offers a range of services in the ultra-deepwater, deepwater, and mid-water markets, as well as in the non-floater or jack-up market. The company operates a fleet of approximately 49 offshore rigs comprising 32 semisubmersible rigs, 13 jack-up rigs, and 4 drill ships. Its customer base consists primarily of major and independent oil and gas companies, and government-owned oil companies. The company was founded in 1989 and is headquartered in Houston, Texas. Diamond Offshore Drilling, Inc. is a subsidiary of Loews Corporation.
-
500
1,000
1,500
2,000
2,500
3,000
3,500
4,000
4,500
–
$10.00
$20.00
$30.00
$40.00
$50.00
$60.00
$70.00
$80.00
11/11 12/11 1/12 2/12 3/12 4/12 5/12 6/12 7/12 8/12 9/12 10/12 11/12
Volu
me (0
00s)
Price (
$U
SD
)
Volume Price

Endeavour International Corporation
Jefferies 2012 Annual Global Energy Conference 29
Sources: Company filings, Company website and Capital IQ as of November 15, 2012. Balance sheet data is as of the most recent SEC filing available on November 15, 2012.
Ticker: END Jefferies Rating: Not Covered Price: $6.12 (as of Nov 15, 2012) Price / Volume Graph
Exchange: NYSE
Business Description
Founded: 2000 Employees: 57 Location: Houston, TX (United States)
Trading Data ( as of Nov 15, 2012) ($USD) Financial Projections ($USD millions, except per share data)
Share Price $6.12 (Consensus, unless otherwise noted) FY 2012E FY 2013E FY 2014E
% of 52-Week High 45.4% Revenue $214.3 $507.2 $434.152-Week High $13.48 EBITDA 130.0 364.8 346.052-Week Low 5.73 EPS (GAAP) ($2.78) $1.14 $1.4990-Day Avg. Daily Trading Volume (000s) 654 EPS (Adjusted) (1.42) 1.15 1.24Fiscal Year End December EPS (Jefferies) NA NA NA
Enterprise Value Calculation ($USD millions) Valuation Metrics (x)
Market Capitalization (fully-diluted) $285.2 Enterprise Value / Revenue 5.0x 2.1x 2.5x
Total Debt 825.4 Enterprise Value / EBITDA 8.3x 3.0x 3.1x
Minority Interest – Price / Earnings (GAAP) NM 5.4x 4.1xPreferred Equity 43.7 Price / Earnings (Adjusted) NM 5.3x 4.9xCash and Cash Equivalents 75.7 Total Debt / EBITDA 6.4x 2.3x 2.4xEnterprise Value $1,078.6
Price / Volume — Last Twelve Months
Endeavour International Corporation, an independent oil and gas company, engages in the acquisition, development, exploration, and production of crude oil and natural gas. The company holds interest in the Alba, Bittern, and Enoch producing fields, as well as focuses on developing the Bacchus, Rochelle, and Columbus fields in the United Kingdom. It also has interests in various resource plays, including established areas, such as the Haynesville and Marcellus; and developing areas comprising Heath Shale oil play located in Montana, the United States. As of December 31, 2011, the company had estimated proved reserves of 22.7 million barrels of oil equivalent. Endeavour International Corporation was founded in 2000 and is based in Houston, Texas.
-
1,000
2,000
3,000
4,000
5,000
6,000
7,000
8,000
9,000
–
$2.00
$4.00
$6.00
$8.00
$10.00
$12.00
$14.00
11/11 12/11 1/12 2/12 3/12 4/12 5/12 6/12 7/12 8/12 9/12 10/12 11/12
Volu
me (0
00s)
Price (
$U
SD
)
Volume Price

EOG Resources, Inc.
Jefferies 2012 Annual Global Energy Conference 30
Sources: Company filings, Company website and Capital IQ as of November 15, 2012. Balance sheet data is as of the most recent SEC filing available on November 15, 2012.
Ticker: EOG Jefferies Rating: Buy Price: $116.16 (as of Nov 15, 2012) Price / Volume Graph
Exchange: NYSE Jefferies Analyst: Biju Z Perincheril Target Price: $135.00
Business Description
Founded: 1985 Employees: 2,550 Location: Houston, TX (United States)
Trading Data ( as of Nov 15, 2012) ($USD) Financial Projections ($USD millions, except per share data)
Share Price $116.16 (Consensus, unless otherwise noted) FY 2012E FY 2013E FY 2014E
% of 52-Week High 93.3% Revenue $11,606.5 $12,951.6 $15,595.152-Week High $124.49 EBITDA 6,170.0 6,941.9 8,224.252-Week Low 82.48 EPS (GAAP) $5.21 $6.18 $8.9690-Day Avg. Daily Trading Volume (000s) 1,724 EPS (Adjusted) 5.37 6.08 8.18Fiscal Year End December EPS (Jefferies) 4.97 4.96 NA
Enterprise Value Calculation ($USD millions) Valuation Metrics (x)
Market Capitalization (fully-diluted) $31,465.5 Enterprise Value / Revenue 3.2x 2.8x 2.4x
Total Debt 6,316.3 Enterprise Value / EBITDA 5.9x 5.3x 4.5x
Minority Interest – Price / Earnings (GAAP) 22.3x 18.8x 13.0xPreferred Equity – Price / Earnings (Adjusted) 21.6x 19.1x 14.2xCash and Cash Equivalents 1,112.6 Total Debt / EBITDA 1.0x 0.9x 0.8xEnterprise Value $36,669.2
Price / Volume — Last Twelve Months
EOG Resources, Inc., together with its subsidiaries, engages in the exploration, development, production, and marketing of crude oil and natural gas primarily in the United States, Canada, the Republic of Trinidad and Tobago, the United Kingdom, the People's Republic of China, and the Argentine Republic. As of December 31, 2011, it had a total estimated net proved reserves of 2,054 million barrels of oil equivalent (MMBoe), of which 517 million barrels (MMBbl) were crude oil and condensate reserves, and 228 MMBbl were natural gas liquids reserves; and 7,851 billion cubic feet were natural gas reserves. The company held approximately 572,000 net acreage position in the oil window of the Eagle Ford Shale Play near San Antonio, Texas. EOG Resources, Inc. was founded in 1985 and is headquartered in Houston, Texas.
-
1,000
2,000
3,000
4,000
5,000
6,000
7,000
8,000
–
$20.00
$40.00
$60.00
$80.00
$100.00
$120.00
$140.00
11/11 12/11 1/12 2/12 3/12 4/12 5/12 6/12 7/12 8/12 9/12 10/12 11/12
Volu
me (0
00s)
Price (
$U
SD
)
Volume Price

EPL Oil & Gas, Inc.
Jefferies 2012 Annual Global Energy Conference 31
Sources: Company filings, Company website and Capital IQ as of November 15, 2012. Balance sheet data is as of the most recent SEC filing available on November 15, 2012.
Ticker: EPL Jefferies Rating: Not Covered Price: $19.78 (as of Nov 15, 2012) Price / Volume Graph
Exchange: NYSE
Business Description
Founded: 1998 Employees: 108 Location: New Orleans, LA (United States)
Trading Data ( as of Nov 15, 2012) ($USD) Financial Projections ($USD millions, except per share data)
Share Price $19.78 (Consensus, unless otherwise noted) FY 2012E FY 2013E FY 2014E
% of 52-Week High 85.9% Revenue $426.3 $693.3 $735.252-Week High $23.02 EBITDA 281.3 477.9 512.052-Week Low 12.14 EPS (GAAP) $1.49 $3.20 $3.1390-Day Avg. Daily Trading Volume (000s) 239 EPS (Adjusted) 1.82 3.14 3.13Fiscal Year End December EPS (Jefferies) NA NA NA
Enterprise Value Calculation ($USD millions) Valuation Metrics (x)
Market Capitalization (fully-diluted) $773.2 Enterprise Value / Revenue 2.3x 1.4x 1.3x
Total Debt 204.9 Enterprise Value / EBITDA 3.5x 2.0x 1.9x
Minority Interest – Price / Earnings (GAAP) 13.3x 6.2x 6.3xPreferred Equity – Price / Earnings (Adjusted) 10.9x 6.3x 6.3xCash and Cash Equivalents 7.3 Total Debt / EBITDA 0.7x 0.4x 0.4xEnterprise Value $970.8
Price / Volume — Last Twelve Months
EPL Oil & Gas, Inc. operates as an independent oil and natural gas exploration and production company in the United States. The company has interests in producing oil and natural gas assets in the U.S. Gulf of Mexico shelf focusing on state and federal waters offshore Louisiana. As of December 31, 2011, it had estimated proved reserves of 37.1 million barrels of oil equivalent; and had working interests in 25 producing fields located in the Gulf of Mexico shelf region. The company was formerly known as Energy Partners, Ltd. and changed its name to EPL Oil & Gas, Inc. in September 2012. EPL Oil & Gas, Inc. was founded in 1998 and is based in New Orleans, Louisiana with an additional office in Houston, Texas.
-
200
400
600
800
1,000
1,200
–
$5.00
$10.00
$15.00
$20.00
$25.00
11/11 12/11 1/12 2/12 3/12 4/12 5/12 6/12 7/12 8/12 9/12 10/12 11/12
Volu
me (0
00s)
Price (
$U
SD
)
Volume Price

Forest Oil Corporation
Jefferies 2012 Annual Global Energy Conference 32
Sources: Company filings, Company website and Capital IQ as of November 15, 2012. Balance sheet data is as of the most recent SEC filing available on November 15, 2012.
Ticker: FST Jefferies Rating: Hold Price: $6.31 (as of Nov 15, 2012) Price / Volume Graph
Exchange: NYSE Jefferies Analyst: Biju Z Perincheril Target Price: $7.00
Business Description
Founded: 1916 Employees: 676 Location: Denver, CO (United States)
Trading Data ( as of Nov 15, 2012) ($USD) Financial Projections ($USD millions, except per share data)
Share Price $6.31 (Consensus, unless otherwise noted) FY 2012E FY 2013E FY 2014E
% of 52-Week High 36.6% Revenue $644.3 $672.4 $805.952-Week High $17.22 EBITDA 506.9 487.7 589.852-Week Low 5.68 EPS (GAAP) ($8.61) $0.42 $0.8890-Day Avg. Daily Trading Volume (000s) 3,944 EPS (Adjusted) 0.39 0.42 0.89Fiscal Year End December EPS (Jefferies) 0.39 0.22 NA
Enterprise Value Calculation ($USD millions) Valuation Metrics (x)
Market Capitalization (fully-diluted) $728.5 Enterprise Value / Revenue 4.3x 4.1x 3.4x
Total Debt 2,092.4 Enterprise Value / EBITDA 5.5x 5.7x 4.7x
Minority Interest – Price / Earnings (GAAP) NM 14.9x 7.2xPreferred Equity – Price / Earnings (Adjusted) 16.2x 14.9x 7.1xCash and Cash Equivalents 50.7 Total Debt / EBITDA 4.1x 4.3x 3.5xEnterprise Value $2,770.2
Price / Volume — Last Twelve Months
Forest Oil Corporation, an independent oil and gas company, engages in the acquisition, exploration, development, and production of oil, natural gas, and natural gas liquids in the United States. The company primarily has interests in the properties in the Texas Panhandle; the east Texas/north Louisiana; and the Eagle Ford Shale in south Texas. As of December 31, 2011, its total estimated proved oil and gas reserves were approximately 1,904 billion cubic feet equivalent. The company was founded in 1916 and is headquartered in Denver, Colorado with an additional office in Houston, Texas.
-
5,000
10,000
15,000
20,000
25,000
30,000
–
$2.00
$4.00
$6.00
$8.00
$10.00
$12.00
$14.00
$16.00
$18.00
11/11 12/11 1/12 2/12 3/12 4/12 5/12 6/12 7/12 8/12 9/12 10/12 11/12
Volu
me (0
00s)
Price (
$U
SD
)
Volume Price

Forum Energy Technologies, Inc.
Jefferies 2012 Annual Global Energy Conference 33
Sources: Company filings, Company website and Capital IQ as of November 15, 2012. Balance sheet data is as of the most recent SEC filing available on November 15, 2012.
Ticker: FET Jefferies Rating: Buy Price: $23.79 (as of Nov 15, 2012) Price / Volume Graph
Exchange: NYSE Jefferies Analyst: Brad Handler Target Price: $28.00
Business Description
Founded: NM Employees: 3,100 Location: Houston, TX (United States)
Trading Data ( as of Nov 15, 2012) ($USD) Financial Projections ($USD millions, except per share data)
Share Price $23.79 (Consensus, unless otherwise noted) FY 2012E FY 2013E FY 2014E
% of 52-Week High 92.3% Revenue $1,418.8 $1,570.0 $1,856.752-Week High $25.78 EBITDA 307.1 345.2 404.852-Week Low 18.60 EPS (GAAP) $1.85 $1.99 $2.5790-Day Avg. Daily Trading Volume (000s) 334 EPS (Adjusted) 1.85 1.95 2.40Fiscal Year End December EPS (Jefferies) 1.85 1.80 2.15
Enterprise Value Calculation ($USD millions) Valuation Metrics (x)
Market Capitalization (fully-diluted) $2,060.7 Enterprise Value / Revenue 1.7x 1.5x 1.3x
Total Debt 318.7 Enterprise Value / EBITDA 7.7x 6.8x 5.8x
Minority Interest 0.7 Price / Earnings (GAAP) 12.9x 11.9x 9.2xPreferred Equity – Price / Earnings (Adjusted) 12.8x 12.2x 9.9xCash and Cash Equivalents 17.9 Total Debt / EBITDA 1.0x 0.9x 0.8xEnterprise Value $2,362.1
Price / Volume — Last Twelve Months
Forum Energy Technologies, Inc. provides manufactured technologies and applied products to the energy industry. Its Drilling and Subsea segment designs, manufactures, and provides products and related services to the drilling and intervention sectors, as well as to the subsea services and construction sectors. This segment offers subsea capital equipment, components and tooling, and products for subsea pipelines, as well as subsea technical services and rental items; and downhole products for the well construction and production enhancement markets, such as proprietary Davis-Lynch cementing and casing tools, including float equipment, stage tools, and inflatable packers, as well as Cannon downhole protection solutions for permanent gauges, sub surface safety valve control lines, electrical submersible pump cabling, and other downhole control lines and flatpacks. It also provides drilling consumables and capital equipment, such as powered and manual tubular handling equipment, torque equipment, customized offline crane systems, drilling data acquisition management systems, pumps, valves, manifolds, drilling fluid-end components, and pressure control equipment for both coiled tubing and wireline well intervention operations. The company’s Production and Infrastructure segment designs, manufactures, and provides products and services related to the well stimulation, completion, production, and infrastructure markets. It offers surface process and pipeline equipment, including separators, packaged production systems, tanks, pressure vessels, skidded vessels with gas measurement, modular process plants, headers, and manifolds; specialty pipeline construction equipment; a range of valves; and surface completion and flow equipment, as well as aftermarket services. The company was formerly known as Forum Oilfield Technologies, Inc. and changed its name to Forum Energy Technologies, Inc. in August 2010. Forum Energy Technologies, Inc. is headquartered in Houston, Texas.
-
2,000
4,000
6,000
8,000
10,000
12,000
14,000
–
$5.00
$10.00
$15.00
$20.00
$25.00
$30.00
4/12 5/12 6/12 7/12 8/12 9/12 10/12 11/12
Volu
me (0
00s)
Price (
$U
SD
)
Volume Price

Gastar Exploration, Ltd.
Jefferies 2012 Annual Global Energy Conference 34
Sources: Company filings, Company website and Capital IQ as of November 15, 2012. Balance sheet data is as of the most recent SEC filing available on November 15, 2012.
Ticker: GST Jefferies Rating: Not Covered Price: $0.72 (as of Nov 15, 2012) Price / Volume Graph
Exchange: AMEX
Business Description
Founded: 1987 Employees: 42 Location: Houston, TX (United States)
Trading Data ( as of Nov 15, 2012) ($USD) Financial Projections ($USD millions, except per share data)
Share Price $0.72 (Consensus, unless otherwise noted) FY 2012E FY 2013E FY 2014E
% of 52-Week High 20.3% Revenue $59.5 $103.2 NA52-Week High $3.55 EBITDA 31.2 65.0 NA52-Week Low 0.77 EPS (GAAP) ($1.22) $0.11 NA90-Day Avg. Daily Trading Volume (000s) 355 EPS (Adjusted) (0.09) 0.10 NAFiscal Year End December EPS (Jefferies) NA NA NA
Enterprise Value Calculation ($USD millions) Valuation Metrics (x)
Market Capitalization (fully-diluted) $47.3 Enterprise Value / Revenue 3.1x 1.8x NA
Total Debt 70.0 Enterprise Value / EBITDA 5.9x 2.8x NA
Minority Interest 76.6 Price / Earnings (GAAP) NM 6.9x NAPreferred Equity – Price / Earnings (Adjusted) NM 7.0x NACash and Cash Equivalents 9.1 Total Debt / EBITDA 2.2x 1.1x NAEnterprise Value $184.7
Price / Volume — Last Twelve Months
Gastar Exploration Ltd., an independent energy company, engages in the exploration, development, and production of natural gas and oil in the United States. It focuses on the unconventional reserves, such as shale resource plays. As of December 31, 2011, the company had interests in the Marcellus Shale assets in West Virginia and Pennsylvania of approximately 43,400 gross acres; approximately 63,000 gross acres in Preston, Tucker, Pocahontas, Randolph, and Pendleton counties in West Virginia; and leases covering approximately 41,100 gross acres in the Bossier play in the Hilltop area of east Texas in Leon and Robertson counties. It also owned an average non-operated working interest on approximately 35,900 gross acres in the Powder River basin of Wyoming and Montana, as well as had proved undeveloped reserves of totaled 41.2 billion cubic feet of natural gas equivalent. Gastar Exploration Ltd. was founded in 1987 and is based in Houston, Texas.
-
500
1,000
1,500
2,000
2,500
3,000
–
$0.50
$1.00
$1.50
$2.00
$2.50
$3.00
$3.50
$4.00
11/11 12/11 1/12 2/12 3/12 4/12 5/12 6/12 7/12 8/12 9/12 10/12 11/12
Volu
me (0
00s)
Price (
$U
SD
)
Volume Price

Goodrich Petroleum Corp.
Jefferies 2012 Annual Global Energy Conference 35
Sources: Company filings, Company website and Capital IQ as of November 15, 2012. Balance sheet data is as of the most recent SEC filing available on November 15, 2012.
Ticker: GDP Jefferies Rating: Hold Price: $8.17 (as of Nov 15, 2012) Price / Volume Graph
Exchange: NYSE Jefferies Analyst: Subash Chandra Target Price: $14.00
Business Description
Founded: 1970 Employees: 113 Location: Houston, TX (United States)
Trading Data ( as of Nov 15, 2012) ($USD) Financial Projections ($USD millions, except per share data)
Share Price $8.17 (Consensus, unless otherwise noted) FY 2012E FY 2013E FY 2014E
% of 52-Week High 39.5% Revenue $239.7 $279.6 $365.952-Week High $20.67 EBITDA 181.7 193.9 272.952-Week Low 7.77 EPS (GAAP) ($0.35) ($0.47) $0.8190-Day Avg. Daily Trading Volume (000s) 968 EPS (Adjusted) (0.55) (0.73) 0.10Fiscal Year End December EPS (Jefferies) (0.19) 0.01 NA
Enterprise Value Calculation ($USD millions) Valuation Metrics (x)
Market Capitalization (fully-diluted) $297.3 Enterprise Value / Revenue 3.6x 3.1x 2.4x
Total Debt 570.0 Enterprise Value / EBITDA 4.8x 4.5x 3.2x
Minority Interest – Price / Earnings (GAAP) NM NM 10.0xPreferred Equity 2.3 Price / Earnings (Adjusted) NM NM NMCash and Cash Equivalents 1.6 Total Debt / EBITDA 3.1x 2.9x 2.1xEnterprise Value $868.0
Price / Volume — Last Twelve Months
Goodrich Petroleum Corporation, an independent oil and natural gas company, engages in the exploration, development, and production of oil and natural gas. The company holds interest in Eagle Ford Shale and Buda Lime formations in south Texas; Haynesville Shale and Cotton Valley Taylor Sand in northwest Louisiana and east Texas; Tuscaloosa Marine Shale in southeast Louisiana and southwest Mississippi; the Midway field located in San Patricio County, Texas; and the Garfield Unit in Kalkaska County, Michigan. It owns working interests in 401 producing oil and natural gas wells located in 29 fields in five states. As of December 31, 2011, the company had estimated proved reserves of approximately 463.5 billion cubic feet of natural gas, 0.5 Million barrels of crude oil or other liquid hydrocarbons (MMBbls) of natural gas liquids, and 5.8 MMBbls of oil and condensate. Goodrich Petroleum Corporation was founded in 1970 and is headquartered in Houston, Texas.
-
500
1,000
1,500
2,000
2,500
3,000
3,500
4,000
4,500
5,000
–
$5.00
$10.00
$15.00
$20.00
$25.00
11/11 12/11 1/12 2/12 3/12 4/12 5/12 6/12 7/12 8/12 9/12 10/12 11/12
Volu
me (0
00s)
Price (
$U
SD
)
Volume Price

Gulfmark Offshore, Inc.
Jefferies 2012 Annual Global Energy Conference 36
Sources: Company filings, Company website and Capital IQ as of November 15, 2012. Balance sheet data is as of the most recent SEC filing available on November 15, 2012.
Ticker: GLF Jefferies Rating: Not Covered Price: $28.51 (as of Nov 15, 2012) Price / Volume Graph
Exchange: NYSE
Business Description
Founded: 1996 Employees: 1,700 Location: Houston, TX (United States)
Trading Data ( as of Nov 15, 2012) ($USD) Financial Projections ($USD millions, except per share data)
Share Price $28.51 (Consensus, unless otherwise noted) FY 2012E FY 2013E FY 2014E
% of 52-Week High 50.5% Revenue $394.8 $461.4 $506.552-Week High $56.41 EBITDA 115.8 180.6 207.252-Week Low 29.29 EPS (GAAP) $1.32 $3.43 $3.5090-Day Avg. Daily Trading Volume (000s) 172 EPS (Adjusted) 1.32 3.23 3.95Fiscal Year End December EPS (Jefferies) NA NA NA
Enterprise Value Calculation ($USD millions) Valuation Metrics (x)
Market Capitalization (fully-diluted) $759.1 Enterprise Value / Revenue 2.5x 2.2x 2.0x
Total Debt 391.0 Enterprise Value / EBITDA 8.6x 5.5x 4.8x
Minority Interest – Price / Earnings (GAAP) 21.7x 8.3x 8.2xPreferred Equity – Price / Earnings (Adjusted) 21.6x 8.8x 7.2xCash and Cash Equivalents 149.0 Total Debt / EBITDA 3.4x 2.2x 1.9xEnterprise Value $1,001.1
Price / Volume — Last Twelve Months
GulfMark Offshore, Inc. provides offshore marine support and transportation services primarily to companies involved in the offshore exploration and production of oil and natural gas. Its vessels offer various services supporting the construction, positioning, and ongoing operation of offshore oil and natural gas drilling rigs and platforms, and related infrastructure. The company’s vessels transport materials, supplies, and personnel to offshore facilities, as well as move and position drilling structures. Its fleet of offshore supply vessels include anchor handling, towing, and support vessels; platform supply vessels; fast supply or crew vessels; specialty vessels; standby rescue vessels; construction support vessels; and utility vessels. The company also offers management services to other vessel owners. As of February 23, 2012, its active fleet included 73 owned vessels and 18 managed vessels. The company principally serves integrated oil and natural gas companies; independent oil and natural gas exploration and production companies working in international markets; and foreign government-owned or controlled oil and natural gas companies, as well as companies that provide logistic, construction, and other services to such oil and natural gas companies and foreign government organizations. It primarily operates in the North Sea, Southeast Asia, and the Americas. GulfMark Offshore, Inc. was founded in 1996 and is based in Houston, Texas.
-
100
200
300
400
500
600
700
–
$10.00
$20.00
$30.00
$40.00
$50.00
$60.00
11/11 12/11 1/12 2/12 3/12 4/12 5/12 6/12 7/12 8/12 9/12 10/12 11/12
Volu
me (0
00s)
Price (
$U
SD
)
Volume Price

Gulfport Energy Corp.
Jefferies 2012 Annual Global Energy Conference 37
Sources: Company filings, Company website and Capital IQ as of November 15, 2012. Balance sheet data is as of the most recent SEC filing available on November 15, 2012.
Ticker: GPOR Jefferies Rating: Buy Price: $30.95 (as of Nov 15, 2012) Price / Volume Graph
Exchange: NasdaqGS Jefferies Analyst: Biju Z Perincheril Target Price: $36.00
Business Description
Founded: NM Employees: 50 Location: Oklahoma City, OK (United States)
Trading Data ( as of Nov 15, 2012) ($USD) Financial Projections ($USD millions, except per share data)
Share Price $30.95 (Consensus, unless otherwise noted) FY 2012E FY 2013E FY 2014E
% of 52-Week High 82.2% Revenue $266.9 $425.7 $640.552-Week High $37.63 EBITDA 179.5 309.9 440.952-Week Low 15.79 EPS (GAAP) $1.22 $1.67 $2.4490-Day Avg. Daily Trading Volume (000s) 1,062 EPS (Adjusted) 1.46 1.75 2.76Fiscal Year End December EPS (Jefferies) 1.49 0.92 NA
Enterprise Value Calculation ($USD millions) Valuation Metrics (x)
Market Capitalization (fully-diluted) $1,724.5 Enterprise Value / Revenue 7.0x 4.4x 2.9x
Total Debt 143.2 Enterprise Value / EBITDA 10.3x 6.0x 4.2x
Minority Interest – Price / Earnings (GAAP) 25.3x 18.6x 12.7xPreferred Equity – Price / Earnings (Adjusted) 21.2x 17.7x 11.2xCash and Cash Equivalents 12.3 Total Debt / EBITDA 0.8x 0.5x 0.3xEnterprise Value $1,855.4
Price / Volume — Last Twelve Months
Gulfport Energy Corporation engages in the exploration, development, and production of oil and natural gas properties. Its principal properties are located in the Louisiana Gulf Coast, in west Texas in the Permian Basin and in western Colorado in the Niobrara Formation. The company also holds acreage position in the Alberta oil sands in Canada; and interests in entities that operate in southeast Asia, including the Phu Horm gas field in Thailand, as well as leasehold interests in the Utica Shale in eastern Ohio. As of December 31, 2011, it had 19.4 million barrels of oil equivalent of proved reserves. The company is headquartered in Oklahoma City, Oklahoma.
-
500
1,000
1,500
2,000
2,500
3,000
3,500
4,000
4,500
–
$5.00
$10.00
$15.00
$20.00
$25.00
$30.00
$35.00
$40.00
11/11 12/11 1/12 2/12 3/12 4/12 5/12 6/12 7/12 8/12 9/12 10/12 11/12
Volu
me (0
00s)
Price (
$U
SD
)
Volume Price

Halliburton Company
Jefferies 2012 Annual Global Energy Conference 38
Sources: Company filings, Company website and Capital IQ as of November 15, 2012. Balance sheet data is as of the most recent SEC filing available on November 15, 2012.
Ticker: HAL Jefferies Rating: Buy Price: $30.36 (as of Nov 15, 2012) Price / Volume Graph
Exchange: NYSE Jefferies Analyst: Brad Handler Target Price: $45.00
Business Description
Founded: 1919 Employees: 70,000 Location: Houston, TX (United States)
Trading Data ( as of Nov 15, 2012) ($USD) Financial Projections ($USD millions, except per share data)
Share Price $30.36 (Consensus, unless otherwise noted) FY 2012E FY 2013E FY 2014E
% of 52-Week High 77.5% Revenue $28,311.6 $29,582.4 $33,337.952-Week High $39.19 EBITDA 6,051.8 6,264.8 7,941.552-Week Low 26.28 EPS (GAAP) $2.81 $3.04 $4.2290-Day Avg. Daily Trading Volume (000s) 12,689 EPS (Adjusted) 2.99 3.11 4.21Fiscal Year End December EPS (Jefferies) 2.94 3.15 4.45
Enterprise Value Calculation ($USD millions) Valuation Metrics (x)
Market Capitalization (fully-diluted) $28,173.7 Enterprise Value / Revenue 1.1x 1.0x 0.9x
Total Debt 4,820.0 Enterprise Value / EBITDA 5.1x 4.9x 3.9x
Minority Interest 23.0 Price / Earnings (GAAP) 10.8x 10.0x 7.2xPreferred Equity – Price / Earnings (Adjusted) 10.2x 9.7x 7.2xCash and Cash Equivalents 2,032.0 Total Debt / EBITDA 0.8x 0.8x 0.6xEnterprise Value $30,984.7
Price / Volume — Last Twelve Months
Halliburton Company provides various products and services to the energy industry for exploring, developing, and producing oil and natural gas worldwide. It operates in two segments, Completion and Production, and Drilling and Evaluation. The Completion and Production segment offers production enhancement services, including stimulation services and sand control services; and cementing services comprising bonding the well and well casing, while isolating fluid zones and maximizing wellbore stability, and casing equipment. This segment also provides completion tools consisting of subsurface safety valves and flow control equipment, surface safety systems, packers and specialty completion equipment, intelligent completion systems, expandable liner hanger systems, sand control systems, well servicing tools, and reservoir performance services; well intervention services, pressure control, equipment rental tools and services, and pipeline and process services; and oilfield production and completion chemicals and services. The Drilling and Evaluation segment offers drill bits and services, including roller cone rock bits, fixed cutter bits, hole enlargement, and related downhole tools and services; wireline and perforating services consisting of open-hole wireline services; and testing and subsea services comprising acquisition and analysis of dynamic reservoir information, and reservoir optimization solutions. This segment also provides drilling fluid systems, performance additives, completion fluids, solids control, specialized testing equipment, and waste management services; drilling systems and services; integrated exploration, drilling, production software information systems, and consulting and data management services; and oilfield project management and integrated solutions. The company serves upstream oil and gas industries. Halliburton Company was founded in 1919 and is based in Houston, Texas.
-
10,000
20,000
30,000
40,000
50,000
60,000
–
$5.00
$10.00
$15.00
$20.00
$25.00
$30.00
$35.00
$40.00
$45.00
11/11 12/11 1/12 2/12 3/12 4/12 5/12 6/12 7/12 8/12 9/12 10/12 11/12
Volu
me (0
00s)
Price (
$U
SD
)
Volume Price

Helix Energy Solutions Group, Inc.
Jefferies 2012 Annual Global Energy Conference 39
Sources: Company filings, Company website and Capital IQ as of November 15, 2012. Balance sheet data is as of the most recent SEC filing available on November 15, 2012.
Ticker: HLX Jefferies Rating: Not Covered Price: $16.06 (as of Nov 15, 2012) Price / Volume Graph
Exchange: NYSE
Business Description
Founded: 1979 Employees: 1,655 Location: Houston, TX (United States)
Trading Data ( as of Nov 15, 2012) ($USD) Financial Projections ($USD millions, except per share data)
Share Price $16.06 (Consensus, unless otherwise noted) FY 2012E FY 2013E FY 2014E
% of 52-Week High 76.1% Revenue $1,435.0 $1,414.0 $1,526.652-Week High $21.09 EBITDA 620.6 589.1 682.352-Week Low 14.61 EPS (GAAP) $1.46 $1.66 $2.2090-Day Avg. Daily Trading Volume (000s) 815 EPS (Adjusted) 1.86 1.78 2.22Fiscal Year End December EPS (Jefferies) NA NA NA
Enterprise Value Calculation ($USD millions) Valuation Metrics (x)
Market Capitalization (fully-diluted) $1,691.7 Enterprise Value / Revenue 1.6x 1.6x 1.5x
Total Debt 1,173.7 Enterprise Value / EBITDA 3.7x 3.9x 3.4x
Minority Interest 26.3 Price / Earnings (GAAP) 11.0x 9.7x 7.3xPreferred Equity 1.0 Price / Earnings (Adjusted) 8.6x 9.0x 7.2xCash and Cash Equivalents 583.8 Total Debt / EBITDA 1.9x 2.0x 1.7xEnterprise Value $2,308.9
Price / Volume — Last Twelve Months
Helix Energy Solutions Group, Inc., together with its subsidiaries, operates as an offshore energy company. It provides reservoir development solutions and other contracting services to the energy market, as well as to its oil and gas properties. The company offers various contracting services in the Gulf of Mexico, North Sea, the Asia Pacific, and west Africa regions primarily in deepwater. Its development services include installation of subsea pipelines, flowlines, control umbilicals, manifold assemblies, and risers; pipelay and burial; installation and tie-in of riser, and manifold assembly; commissioning, testing, and inspection; and cable and umbilical lay, and connection. The company also offers various production services comprising inspection, repair, and maintenance of production structures, risers, pipelines, and subsea equipment; well intervention; life of field support; and intervention engineering. In addition, it provides reclamation services, such as reclamation and remediation services; plugging and abandonment services; platform salvage and removal services; pipeline abandonment services; and site inspections. Further, the company offers oil and natural gas processing services to oil and natural gas companies. Additionally, it engages in the prospect generation, exploration, development, and production of oil and gas properties located in the Gulf of Mexico. As of December 31, 2011, its estimated proved reserves totaled approximately 38.9 million barrels of oil equivalent. Helix Energy Solutions Group, Inc. provides its products and services to oil and gas companies, oil and gas pipeline companies, and independent oil and gas producers and suppliers. The company was formerly known as Cal Dive International, Inc. and changed its name to Helix Energy Solutions Group, Inc. in March 2006. Helix Energy Solutions Group, Inc. was incorporated in 1979 and is headquartered in Houston, Texas.
-
500
1,000
1,500
2,000
2,500
3,000
3,500
4,000
–
$5.00
$10.00
$15.00
$20.00
$25.00
11/11 12/11 1/12 2/12 3/12 4/12 5/12 6/12 7/12 8/12 9/12 10/12 11/12
Volu
me (0
00s)
Price (
$U
SD
)
Volume Price

Helmerich & Payne Inc.
Jefferies 2012 Annual Global Energy Conference 40
Sources: Company filings, Company website and Capital IQ as of November 15, 2012. Balance sheet data is as of the most recent SEC filing available on November 15, 2012.
Ticker: HP Jefferies Rating: Buy Price: $49.92 (as of Nov 15, 2012) Price / Volume Graph
Exchange: NYSE Jefferies Analyst: Brad Handler Target Price: $55.00
Business Description
Founded: 1920 Employees: 8,716 Location: Tulsa, OK (United States)
Trading Data ( as of Nov 15, 2012) ($USD) Financial Projections ($USD millions, except per share data)
Share Price $49.92 (Consensus, unless otherwise noted) FY 2012E FY 2013E FY 2014E
% of 52-Week High 72.8% Revenue $3,252.5 $3,540.0 $3,607.752-Week High $68.60 EBITDA 1,228.1 1,375.2 1,292.452-Week Low 38.71 EPS (GAAP) $4.74 $5.14 $4.8590-Day Avg. Daily Trading Volume (000s) 1,423 EPS (Adjusted) 4.69 5.25 5.23Fiscal Year End September EPS (Jefferies) 5.07 4.60 5.40
Enterprise Value Calculation ($USD millions) Valuation Metrics (x)
Market Capitalization (fully-diluted) $5,276.2 Enterprise Value / Revenue 1.7x 1.5x 1.5x
Total Debt 195.0 Enterprise Value / EBITDA 4.4x 3.9x 4.2x
Minority Interest – Price / Earnings (GAAP) 10.5x 9.7x 10.3xPreferred Equity – Price / Earnings (Adjusted) 10.6x 9.5x 9.5xCash and Cash Equivalents 96.1 Total Debt / EBITDA 0.2x 0.1x 0.2xEnterprise Value $5,375.1
Price / Volume — Last Twelve Months
Helmerich & Payne, Inc. engages in the contract drilling of oil and gas wells. It provides drilling rigs, equipments, personnel, and camps on a contract basis to explore for and develop oil and gas from onshore areas and fixed platforms, tension-leg platforms, and spars in offshore areas. The company conducts land drilling operations primarily in Oklahoma, California, Texas, Wyoming, Colorado, Louisiana, Mississippi, Pennsylvania, Utah, Arkansas, New Mexico, Alabama, Montana, North Dakota, and West Virginia; offshore drilling operations in the Gulf of Mexico, offshore of California, Trinidad, and Equatorial Guinea; and international land drilling operations in Ecuador, Colombia, Argentina, Mexico, Tunisia, and Bahrain. As of November 17, 2011, the company's existing fleet included 250 land rigs in the United States, 25 international land rigs, and 9 offshore platform rigs. The company also involved in the ownership, development, and operation of commercial real estate; and research and development of rotary steerable technology. Its properties comprise a shopping center containing approximately 441,000 leasable square feet; multi-tenant industrial warehouse properties of approximately 990,000 leasable square feet; and approximately 210 acres of undeveloped real estate. The company was founded in 1920 and is headquartered in Tulsa, Oklahoma.
-
500
1,000
1,500
2,000
2,500
3,000
3,500
4,000
–
$10.00
$20.00
$30.00
$40.00
$50.00
$60.00
$70.00
11/11 12/11 1/12 2/12 3/12 4/12 5/12 6/12 7/12 8/12 9/12 10/12 11/12
Volu
me (0
00s)
Price (
$U
SD
)
Volume Price

Hercules Offshore, Inc.
Jefferies 2012 Annual Global Energy Conference 41
Sources: Company filings, Company website and Capital IQ as of November 15, 2012. Balance sheet data is as of the most recent SEC filing available on November 15, 2012.
Ticker: HERO Jefferies Rating: Hold Price: $4.74 (as of Nov 15, 2012) Price / Volume Graph
Exchange: NasdaqGS Jefferies Analyst: Brad Handler Target Price: $5.50
Business Description
Founded: 2004 Employees: 2,300 Location: Houston, TX (United States)
Trading Data ( as of Nov 15, 2012) ($USD) Financial Projections ($USD millions, except per share data)
Share Price $4.74 (Consensus, unless otherwise noted) FY 2012E FY 2013E FY 2014E
% of 52-Week High 85.1% Revenue $693.9 $897.4 $943.652-Week High $5.57 EBITDA 148.8 312.1 338.652-Week Low 2.91 EPS (GAAP) ($0.94) $0.23 $0.4290-Day Avg. Daily Trading Volume (000s) 2,703 EPS (Adjusted) (0.54) 0.24 0.43Fiscal Year End December EPS (Jefferies) (0.54) 0.15 0.55
Enterprise Value Calculation ($USD millions) Valuation Metrics (x)
Market Capitalization (fully-diluted) $751.7 Enterprise Value / Revenue 2.0x 1.5x 1.4x
Total Debt 882.3 Enterprise Value / EBITDA 9.2x 4.4x 4.0x
Minority Interest – Price / Earnings (GAAP) NM 20.6x 11.4xPreferred Equity – Price / Earnings (Adjusted) NM 19.5x 11.1xCash and Cash Equivalents 271.6 Total Debt / EBITDA 5.9x 2.8x 2.6xEnterprise Value $1,362.5
Price / Volume — Last Twelve Months
Hercules Offshore, Inc., together with its subsidiaries, provides shallow-water drilling and marine services to the oil and natural gas exploration and production industry worldwide. Its services comprise oil and gas exploration and development drilling, well services, platform inspection, maintenance, and decommissioning services in various water provinces. As of February 23, 2012, the company owned and operated a fleet of 42 jackup rigs, 17 barge rigs, 2 submersible rigs, 1 platform rig, and 58 liftboat vessels, as well as operated 5 liftboat vessels owned by third party. It serves national oil and gas companies, integrated energy companies, and independent oil and natural gas operators. Hercules Offshore, Inc. was founded in 2004 and is headquartered in Houston, Texas.
-
5,000
10,000
15,000
20,000
25,000
30,000
35,000
–
$1.00
$2.00
$3.00
$4.00
$5.00
$6.00
11/11 12/11 1/12 2/12 3/12 4/12 5/12 6/12 7/12 8/12 9/12 10/12 11/12
Volu
me (0
00s)
Price (
$U
SD
)
Volume Price

Hornbeck Offshore Services, Inc.
Jefferies 2012 Annual Global Energy Conference 42
Sources: Company filings, Company website and Capital IQ as of November 15, 2012. Balance sheet data is as of the most recent SEC filing available on November 15, 2012.
Ticker: HOS Jefferies Rating: Not Covered Price: $32.70 (as of Nov 15, 2012) Price / Volume Graph
Exchange: NYSE
Business Description
Founded: 1997 Employees: 1,036 Location: Covington, LA (United States)
Trading Data ( as of Nov 15, 2012) ($USD) Financial Projections ($USD millions, except per share data)
Share Price $32.70 (Consensus, unless otherwise noted) FY 2012E FY 2013E FY 2014E
% of 52-Week High 74.6% Revenue $511.9 $611.5 $811.352-Week High $43.83 EBITDA 211.6 277.6 401.052-Week Low 28.88 EPS (GAAP) $1.07 $2.43 $4.1590-Day Avg. Daily Trading Volume (000s) 553 EPS (Adjusted) 1.16 2.35 4.20Fiscal Year End December EPS (Jefferies) NA NA NA
Enterprise Value Calculation ($USD millions) Valuation Metrics (x)
Market Capitalization (fully-diluted) $1,157.8 Enterprise Value / Revenue 3.1x 2.6x 2.0x
Total Debt 1,083.1 Enterprise Value / EBITDA 7.6x 5.8x 4.0x
Minority Interest – Price / Earnings (GAAP) 30.6x 13.4x 7.9xPreferred Equity – Price / Earnings (Adjusted) 28.2x 13.9x 7.8xCash and Cash Equivalents 633.6 Total Debt / EBITDA 5.1x 3.9x 2.7xEnterprise Value $1,607.3
Price / Volume — Last Twelve Months
Hornbeck Offshore Services, Inc., through its subsidiaries, provides marine transportation services to exploration and production, oilfield service, offshore construction, and the United States military customers. The company operates in two segments, Upstream and Downstream. The Upstream segment owns and operates fleets of the U.S.-flagged new generation offshore support vessels (OSVs) that support deepwater and ultra-deepwater exploration, development, production, construction, installation, maintenance, repair, and enhanced oil recovery requirements of the offshore oil and gas industry in the United States Gulf of Mexico, other U.S. coastlines, Latin America, and the Middle East. This segment also owns work class ROVs, multi-purpose support vessels (MPSVs), and a shore-base facility located in Port Fourchon, Louisiana. In addition, the Upstream segment provides vessel management services for other vessels owners, such as crewing, daily operational management, and maintenance. The Downstream segment owns and operates a fleet of ocean-going tugs and double-hulled tank barges that transport petroleum products, primarily in the northeastern United States, the Gulf of Mexico, the Great Lakes, and Puerto Rico. This segment’s tugs and tank barges provide coastwise transportation of refined and bunker grade petroleum products, as well as downstream services, such as support of deepwater well testing, and other specialty applications. As of December 31, 2011, Hornbeck Offshore Services, Inc. owned and operated 46 active new generation OSVs and 4 MPSVs; and 9 double-hulled tank barges, as well as 15 ocean-going tugs, of which 6 were stacked and being marketed for sale. The company was founded in 1997 and is headquartered in Covington, Louisiana.
-
500
1,000
1,500
2,000
2,500
3,000
3,500
–
$5.00
$10.00
$15.00
$20.00
$25.00
$30.00
$35.00
$40.00
$45.00
$50.00
11/11 12/11 1/12 2/12 3/12 4/12 5/12 6/12 7/12 8/12 9/12 10/12 11/12
Volu
me (0
00s)
Price (
$U
SD
)
Volume Price

HRT Participações em Petróleo S.A.
Jefferies 2012 Annual Global Energy Conference 43
Sources: Company filings, Company website and Capital IQ as of November 15, 2012. Balance sheet data is as of the most recent SEC filing available on November 15, 2012.
Ticker: HRTP3 Jefferies Rating: Buy Price: $2.66 (as of Nov 14, 2012) Price / Volume Graph
Exchange: BOVESPA Jefferies Analyst: Subash Chandra Target Price: $4.92
Business Description
Founded: NM Employees: NM Location: Rio de Janeiro, Brazil
Trading Data ( as of Nov 14, 2012) ($USD) Financial Projections ($USD millions, except per share data)
Share Price $2.66 (Consensus, unless otherwise noted) FY 2012E FY 2013E FY 2014E
% of 52-Week High 37.6% Revenue $4.7 $47.0 $182.652-Week High $7.08 EBITDA (167.9) (144.6) (22.7)52-Week Low 1.70 EPS (GAAP) ($0.28) ($0.37) ($0.23)90-Day Avg. Daily Trading Volume (000s) 6,571 EPS (Adjusted) (0.32) (0.38) (0.33)Fiscal Year End December EPS (Jefferies) (0.80) NA NA
Enterprise Value Calculation ($USD millions) Valuation Metrics (x)
Market Capitalization (fully-diluted) $785.2 Enterprise Value / Revenue NM 4.4x 1.1x
Total Debt 1.6 Enterprise Value / EBITDA NM NM NM
Minority Interest – Price / Earnings (GAAP) NM NM NMPreferred Equity – Price / Earnings (Adjusted) NM NM NMCash and Cash Equivalents 579.2 Total Debt / EBITDA NM NM NMEnterprise Value $207.6
Price / Volume — Last Twelve Months
HRT Participações em Petróleo S.A., through its subsidiaries, engages in the exploration, development, production, distribution, and sale of oil and natural gas. It is also involved in the import, export, refining, sale, and distribution of oil, natural gas, fuel, and oil by-products; generation, sale, and distribution of electric power; and provision of geological, geophysical, and geochemical services. The company operates approximately 21 blocks that cover an area of approximately 48,500 square kilometers in the Solimões Basin in Brazil. It also owns interest in 4 exploratory blocks, which cover an area of approximately 110 square kilometers in the Recôncavo, Espírito Santo, and Rio do Peixe onshore basins in Brazil; and 12 exploration blocks covering an area of approximately 68,800 square kilometers in Namibia. HRT Participações em Petróleo S.A. is headquartered in Rio de Janeiro, Brazil.
-
5,000
10,000
15,000
20,000
25,000
30,000
35,000
40,000
–
$1.00
$2.00
$3.00
$4.00
$5.00
$6.00
$7.00
$8.00
$9.00
11/11 12/11 1/12 2/12 3/12 4/12 5/12 6/12 7/12 8/12 9/12 10/12 11/12
Volu
me (0
00s)
Price (
$U
SD
)
Volume Price
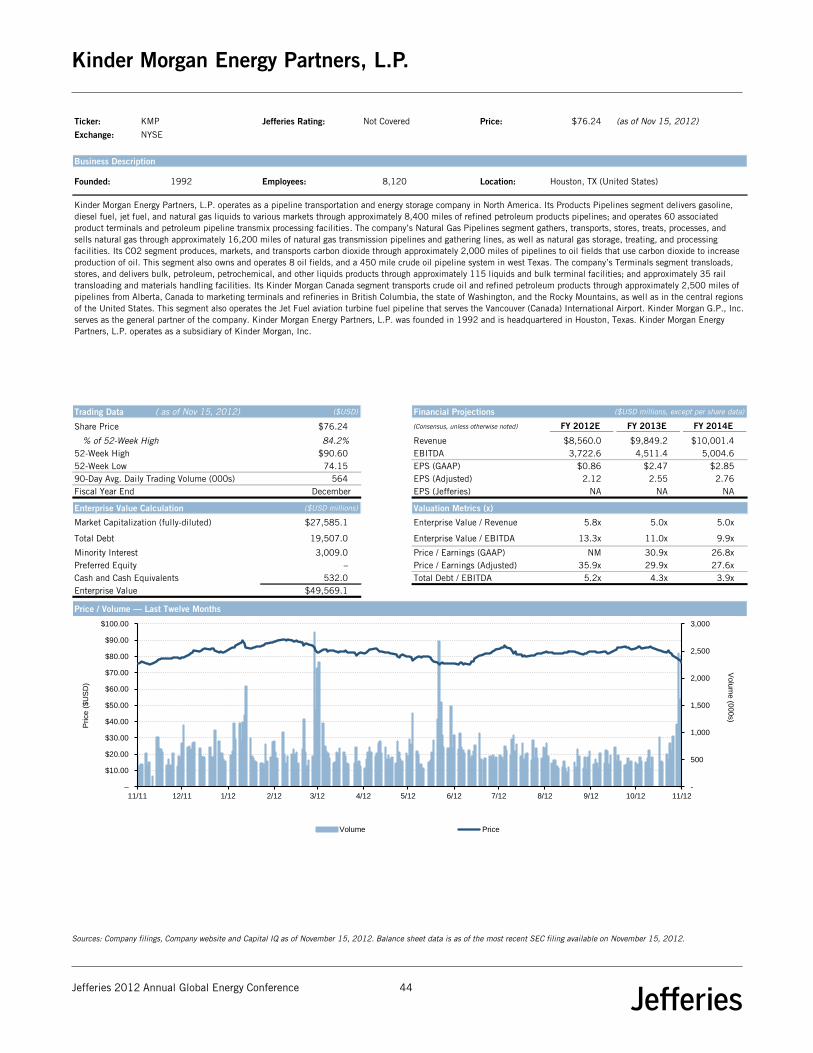
Kinder Morgan Energy Partners, L.P.
Jefferies 2012 Annual Global Energy Conference 44
Sources: Company filings, Company website and Capital IQ as of November 15, 2012. Balance sheet data is as of the most recent SEC filing available on November 15, 2012.
Ticker: KMP Jefferies Rating: Not Covered Price: $76.24 (as of Nov 15, 2012) Price / Volume Graph
Exchange: NYSE
Business Description
Founded: 1992 Employees: 8,120 Location: Houston, TX (United States)
Trading Data ( as of Nov 15, 2012) ($USD) Financial Projections ($USD millions, except per share data)
Share Price $76.24 (Consensus, unless otherwise noted) FY 2012E FY 2013E FY 2014E
% of 52-Week High 84.2% Revenue $8,560.0 $9,849.2 $10,001.452-Week High $90.60 EBITDA 3,722.6 4,511.4 5,004.652-Week Low 74.15 EPS (GAAP) $0.86 $2.47 $2.8590-Day Avg. Daily Trading Volume (000s) 564 EPS (Adjusted) 2.12 2.55 2.76Fiscal Year End December EPS (Jefferies) NA NA NA
Enterprise Value Calculation ($USD millions) Valuation Metrics (x)
Market Capitalization (fully-diluted) $27,585.1 Enterprise Value / Revenue 5.8x 5.0x 5.0x
Total Debt 19,507.0 Enterprise Value / EBITDA 13.3x 11.0x 9.9x
Minority Interest 3,009.0 Price / Earnings (GAAP) NM 30.9x 26.8xPreferred Equity – Price / Earnings (Adjusted) 35.9x 29.9x 27.6xCash and Cash Equivalents 532.0 Total Debt / EBITDA 5.2x 4.3x 3.9xEnterprise Value $49,569.1
Price / Volume — Last Twelve Months
Kinder Morgan Energy Partners, L.P. operates as a pipeline transportation and energy storage company in North America. Its Products Pipelines segment delivers gasoline, diesel fuel, jet fuel, and natural gas liquids to various markets through approximately 8,400 miles of refined petroleum products pipelines; and operates 60 associated product terminals and petroleum pipeline transmix processing facilities. The company’s Natural Gas Pipelines segment gathers, transports, stores, treats, processes, and sells natural gas through approximately 16,200 miles of natural gas transmission pipelines and gathering lines, as well as natural gas storage, treating, and processing facilities. Its CO2 segment produces, markets, and transports carbon dioxide through approximately 2,000 miles of pipelines to oil fields that use carbon dioxide to increase production of oil. This segment also owns and operates 8 oil fields, and a 450 mile crude oil pipeline system in west Texas. The company’s Terminals segment transloads, stores, and delivers bulk, petroleum, petrochemical, and other liquids products through approximately 115 liquids and bulk terminal facilities; and approximately 35 rail transloading and materials handling facilities. Its Kinder Morgan Canada segment transports crude oil and refined petroleum products through approximately 2,500 miles of pipelines from Alberta, Canada to marketing terminals and refineries in British Columbia, the state of Washington, and the Rocky Mountains, as well as in the central regions of the United States. This segment also operates the Jet Fuel aviation turbine fuel pipeline that serves the Vancouver (Canada) International Airport. Kinder Morgan G.P., Inc. serves as the general partner of the company. Kinder Morgan Energy Partners, L.P. was founded in 1992 and is headquartered in Houston, Texas. Kinder Morgan Energy Partners, L.P. operates as a subsidiary of Kinder Morgan, Inc.
-
500
1,000
1,500
2,000
2,500
3,000
–
$10.00
$20.00
$30.00
$40.00
$50.00
$60.00
$70.00
$80.00
$90.00
$100.00
11/11 12/11 1/12 2/12 3/12 4/12 5/12 6/12 7/12 8/12 9/12 10/12 11/12
Volu
me (0
00s)
Price (
$U
SD
)
Volume Price

Kodiak Oil & Gas Corp.
Jefferies 2012 Annual Global Energy Conference 45
Sources: Company filings, Company website and Capital IQ as of November 15, 2012. Balance sheet data is as of the most recent SEC filing available on November 15, 2012.
Ticker: KOG Jefferies Rating: Not Covered Price: $8.44 (as of Nov 15, 2012) Price / Volume Graph
Exchange: NYSE
Business Description
Founded: 1972 Employees: 104 Location: Denver, CO (United States)
Trading Data ( as of Nov 15, 2012) ($USD) Financial Projections ($USD millions, except per share data)
Share Price $8.44 (Consensus, unless otherwise noted) FY 2012E FY 2013E FY 2014E
% of 52-Week High 77.4% Revenue $444.0 $846.4 $1,141.852-Week High $10.90 EBITDA 328.9 640.5 881.452-Week Low 6.92 EPS (GAAP) $0.66 $0.71 $1.0690-Day Avg. Daily Trading Volume (000s) 5,226 EPS (Adjusted) 0.45 0.73 1.07Fiscal Year End December EPS (Jefferies) NA NA NA
Enterprise Value Calculation ($USD millions) Valuation Metrics (x)
Market Capitalization (fully-diluted) $2,228.6 Enterprise Value / Revenue 7.1x 3.7x 2.8x
Total Debt 920.8 Enterprise Value / EBITDA 9.6x 4.9x 3.6x
Minority Interest – Price / Earnings (GAAP) 12.8x 11.9x 8.0xPreferred Equity – Price / Earnings (Adjusted) 18.7x 11.6x 7.9xCash and Cash Equivalents 1.8 Total Debt / EBITDA 2.8x 1.4x 1.0xEnterprise Value $3,147.6
Price / Volume — Last Twelve Months
Kodiak Oil & Gas Corp. engages in the acquisition, exploration, exploitation, development, and production of crude oil and natural gas in the United States. The company’s oil and natural gas reserves and operations are primarily concentrated in the Williston Basin of North Dakota and Montana, and the Green River Basin of Wyoming and Colorado. As of December 31, 2011, it had estimated proved reserves of 35.6 million barrels of oil and 25.5 billion cubic feet of natural gas. The company was formerly known as Columbia Copper Company Ltd. and changed its name to Kodiak Oil & Gas Corp. in September 2001. Kodiak Oil & Gas Corp. was incorporated in 1972 and is headquartered in Denver, Colorado.
-
5,000
10,000
15,000
20,000
25,000
30,000
35,000
40,000
45,000
–
$2.00
$4.00
$6.00
$8.00
$10.00
$12.00
11/11 12/11 1/12 2/12 3/12 4/12 5/12 6/12 7/12 8/12 9/12 10/12 11/12
Volu
me (0
00s)
Price (
$U
SD
)
Volume Price

Kosmos Energy Ltd.
Jefferies 2012 Annual Global Energy Conference 46
Sources: Company filings, Company website and Capital IQ as of November 15, 2012. Balance sheet data is as of the most recent SEC filing available on November 15, 2012.
Ticker: KOS Jefferies Rating: Buy Price: $11.11 (as of Nov 15, 2012) Price / Volume Graph
Exchange: NYSE Jefferies Analyst: Brendan Warn Target Price: $17.00
Business Description
Founded: 2003 Employees: 190 Location: Hamilton, Bermuda
Trading Data ( as of Nov 15, 2012) ($USD) Financial Projections ($USD millions, except per share data)
Share Price $11.11 (Consensus, unless otherwise noted) FY 2012E FY 2013E FY 2014E
% of 52-Week High 56.4% Revenue $675.5 $1,051.2 $1,009.452-Week High $19.70 EBITDA 292.1 609.9 654.652-Week Low 8.19 EPS (GAAP) ($0.16) $0.19 $0.6090-Day Avg. Daily Trading Volume (000s) 271 EPS (Adjusted) (0.18) 0.26 0.31Fiscal Year End December EPS (Jefferies) (0.26) (0.10) 0.59
Enterprise Value Calculation ($USD millions) Valuation Metrics (x)
Market Capitalization (fully-diluted) $4,321.1 Enterprise Value / Revenue 7.3x 4.7x 4.9x
Total Debt 1,007.8 Enterprise Value / EBITDA 16.9x 8.1x 7.5x
Minority Interest – Price / Earnings (GAAP) NM NM 18.7xPreferred Equity – Price / Earnings (Adjusted) NM 42.0x 35.4xCash and Cash Equivalents 399.7 Total Debt / EBITDA 3.5x 1.7x 1.5xEnterprise Value $4,929.2
Price / Volume — Last Twelve Months
Kosmos Energy Ltd. engages in the exploration and production of oil and gas in Africa and South America. Its asset portfolio includes production, discovery, and exploration prospects offshore Ghana, as well as exploration licenses with hydrocarbon potential offshore Mauritania, Morocco and Suriname, and onshore Cameroon. The company was founded in 2003 and is based in Hamilton, Bermuda.
-
500
1,000
1,500
2,000
2,500
3,000
–
$2.00
$4.00
$6.00
$8.00
$10.00
$12.00
$14.00
$16.00
11/11 12/11 1/12 2/12 3/12 4/12 5/12 6/12 7/12 8/12 9/12 10/12 11/12
Volu
me (0
00s)
Price (
$U
SD
)
Volume Price

Magnum Hunter Resources Corp.
Jefferies 2012 Annual Global Energy Conference 47
Sources: Company filings, Company website and Capital IQ as of November 15, 2012. Balance sheet data is as of the most recent SEC filing available on November 15, 2012.
Ticker: MHR Jefferies Rating: Buy Price: $3.43 (as of Nov 15, 2012) Price / Volume Graph
Exchange: NYSE Jefferies Analyst: Subash Chandra Target Price: $6.50
Business Description
Founded: 1997 Employees: 305 Location: Houston, TX (United States)
Trading Data ( as of Nov 15, 2012) ($USD) Financial Projections ($USD millions, except per share data)
Share Price $3.43 (Consensus, unless otherwise noted) FY 2012E FY 2013E FY 2014E
% of 52-Week High 44.5% Revenue $279.4 $489.5 $659.552-Week High $7.71 EBITDA 158.2 328.4 426.952-Week Low 3.35 EPS (GAAP) ($0.30) $0.07 $0.4490-Day Avg. Daily Trading Volume (000s) 3,740 EPS (Adjusted) (0.25) 0.04 0.35Fiscal Year End December EPS (Jefferies) (0.26) (0.40) NA
Enterprise Value Calculation ($USD millions) Valuation Metrics (x)
Market Capitalization (fully-diluted) $585.0 Enterprise Value / Revenue 6.1x 3.5x 2.6x
Total Debt 732.6 Enterprise Value / EBITDA 10.8x 5.2x 4.0x
Minority Interest 14.2 Price / Earnings (GAAP) NM 47.8x 7.8xPreferred Equity 393.3 Price / Earnings (Adjusted) NM NM 9.8xCash and Cash Equivalents 22.0 Total Debt / EBITDA 4.6x 2.2x 1.7xEnterprise Value $1,703.1
Price / Volume — Last Twelve Months
Magnum Hunter Resources Corporation, an independent oil and gas company, engages in the acquisition, exploration, exploitation, development, and production of crude oil, natural gas, and natural gas liquids primarily in West Virginia, Ohio, Texas, Kentucky, and North Dakota, as well as in Saskatchewan, Canada. As of February 27, 2012, the company owned approximately 560,072 net acres, with 170,000 net acres in its core resource areas, including approximately 58,426 net acres in the Marcellus Shale; 61,151 net acres in the Utica Shale; 24,000 net acres in the Eagle Ford Shale; and 75,814 net acres in the Williston Basin. It also had working interest in 15 fields located in the Williston Basin in North Dakota comprising 151 wells and approximately 6,540 net acres, as well as operated 33 vertical and 16 horizontal Marcellus Shale wells. In addition, the company owns property interests in approximately 2,000 operated wells and 87,000 net mineral acres located in the states of Kentucky, Ohio, and West Virginia; a natural gas pipeline; 2 commercial salt water disposal facilities; 3 drilling rigs; workover rigs; and other oilfield equipment. As of December 31, 2011, its proved reserves comprised 44.9 million barrels of crude oil equivalent. The company was formerly known as Petro Resources Corporation and changed its name to Magnum Hunter Resources Corporation in July 2009. Magnum Hunter Resources Corporation was incorporated in 1997 is headquartered in Houston, Texas.
-
5,000
10,000
15,000
20,000
25,000
30,000
35,000
40,000
–
$1.00
$2.00
$3.00
$4.00
$5.00
$6.00
$7.00
$8.00
11/11 12/11 1/12 2/12 3/12 4/12 5/12 6/12 7/12 8/12 9/12 10/12 11/12
Volu
me (0
00s)
Price (
$U
SD
)
Volume Price

MarkWest Energy Partners, L.P.
Jefferies 2012 Annual Global Energy Conference 48
Sources: Company filings, Company website and Capital IQ as of November 15, 2012. Balance sheet data is as of the most recent SEC filing available on November 15, 2012.
Ticker: MWE Jefferies Rating: Not Covered Price: $46.63 (as of Nov 15, 2012) Price / Volume Graph
Exchange: NYSE
Business Description
Founded: 1988 Employees: 683 Location: Denver, CO (United States)
Trading Data ( as of Nov 15, 2012) ($USD) Financial Projections ($USD millions, except per share data)
Share Price $46.63 (Consensus, unless otherwise noted) FY 2012E FY 2013E FY 2014E
% of 52-Week High 75.7% Revenue $1,471.5 $1,787.9 $1,985.152-Week High $61.60 EBITDA 548.9 750.1 993.352-Week Low 45.36 EPS (GAAP) $1.82 $2.15 $3.0790-Day Avg. Daily Trading Volume (000s) 660 EPS (Adjusted) 1.35 1.87 2.99Fiscal Year End December EPS (Jefferies) NA NA NA
Enterprise Value Calculation ($USD millions) Valuation Metrics (x)
Market Capitalization (fully-diluted) $5,483.4 Enterprise Value / Revenue 5.0x 4.1x 3.7x
Total Debt 1,998.0 Enterprise Value / EBITDA 13.4x 9.8x 7.4x
Minority Interest – Price / Earnings (GAAP) 25.7x 21.7x 15.2xPreferred Equity – Price / Earnings (Adjusted) 34.5x 25.0x 15.6xCash and Cash Equivalents 125.5 Total Debt / EBITDA 3.6x 2.7x 2.0xEnterprise Value $7,355.9
Price / Volume — Last Twelve Months
Markwest Energy Partners, L.P., together with its subsidiaries, engages in the gathering, processing, and transportation of natural gas in the southwest, Gulf Coast, and northeast regions of the United States. The company is also involved in the transportation, fractionation, storage, and marketing of natural gas liquids in the Appalachian region; and gathering and transportation of crude oil. It owns a crude oil transportation pipeline in Michigan. MarkWest Energy GP, L.L.C. serves as the general partner of the company. MarkWest Energy Partners, L.P. was founded in 1988 and is headquartered in Denver, Colorado.
-
2,000
4,000
6,000
8,000
10,000
12,000
–
$10.00
$20.00
$30.00
$40.00
$50.00
$60.00
$70.00
11/11 12/11 1/12 2/12 3/12 4/12 5/12 6/12 7/12 8/12 9/12 10/12 11/12
Volu
me (0
00s)
Price (
$U
SD
)
Volume Price

Matador Resources Company
Jefferies 2012 Annual Global Energy Conference 49
Sources: Company filings, Company website and Capital IQ as of November 15, 2012. Balance sheet data is as of the most recent SEC filing available on November 15, 2012.
Ticker: MTDR Jefferies Rating: Buy Price: $8.50 (as of Nov 15, 2012) Price / Volume Graph
Exchange: NYSE Jefferies Analyst: Subash Chandra Target Price: $13.00
Business Description
Founded: 2003 Employees: 41 Location: Dallas, TX (United States)
Trading Data ( as of Nov 15, 2012) ($USD) Financial Projections ($USD millions, except per share data)
Share Price $8.50 (Consensus, unless otherwise noted) FY 2012E FY 2013E FY 2014E
% of 52-Week High 68.9% Revenue $169.5 $251.1 NA52-Week High $12.33 EBITDA 118.8 184.4 NA52-Week Low 7.94 EPS (GAAP) $0.29 $1.12 NA90-Day Avg. Daily Trading Volume (000s) 183 EPS (Adjusted) 0.50 1.05 1.23Fiscal Year End December EPS (Jefferies) 0.46 0.93 NA
Enterprise Value Calculation ($USD millions) Valuation Metrics (x)
Market Capitalization (fully-diluted) $471.8 Enterprise Value / Revenue 3.4x 2.3x NA
Total Debt 106.0 Enterprise Value / EBITDA 4.8x 3.1x NA
Minority Interest – Price / Earnings (GAAP) 29.3x 7.6x NAPreferred Equity – Price / Earnings (Adjusted) 17.0x 8.1x 6.9xCash and Cash Equivalents 4.4 Total Debt / EBITDA 0.9x 0.6x NAEnterprise Value $573.4
Price / Volume — Last Twelve Months
Matador Resources Company, an independent energy company, engages in the acquisition, exploration, development, and production of oil and natural gas resources in the United States. The company primarily focuses on oil and natural gas shale plays, and other unconventional resources. Its operations are located primarily in the Eagle Ford shale play in south Texas and the Haynesville shale play in northwest Louisiana and east Texas. The company also has acreage positions in southeast New Mexico and west Texas, and in southwest Wyoming and adjacent areas in Utah and Idaho. As of December 31, 2011, its estimated total proved reserves were 193.2 billion cubic feet of natural gas equivalents; and had properties, including approximately 51,000 gross acres and 29,000 net acres in the Eagle Ford shale play in Atascosa, DeWitt, Dimmit, Karnes, LaSalle, Gonzales, Webb, Wilson, and Zavala counties in south Texas. The company was formerly known as Matador Holdco, Inc. and changed its name to Matador Resources Company in August 2011. Matador Resources Company was founded in 2003 and is headquartered in Dallas, Texas.
-
500
1,000
1,500
2,000
2,500
3,000
3,500
4,000
4,500
5,000
–
$2.00
$4.00
$6.00
$8.00
$10.00
$12.00
$14.00
2/12 3/12 4/12 5/12 6/12 7/12 8/12 9/12 10/12 11/12
Volu
me (0
00s)
Price (
$U
SD
)
Volume Price

Murphy Oil Corporation
Jefferies 2012 Annual Global Energy Conference 50
Sources: Company filings, Company website and Capital IQ as of November 15, 2012. Balance sheet data is as of the most recent SEC filing available on November 15, 2012.
Business Description
Founded: 1950 Employees: 5,893 Location: El Dorado, AR (United States)
Trading Data ( as of Nov 15, 2012) ($USD) Financial Projections ($USD millions, except per share data)
Share Price $55.22 (Consensus, unless otherwise noted) FY 2012E FY 2013E FY 2014E
% of 52-Week High 84.2% Revenue $28,488.8 $26,357.8 $29,799.252-Week High $65.60 EBITDA 3,337.4 3,448.3 4,082.052-Week Low 43.29 EPS (GAAP) $5.55 $5.36 $6.3090-Day Avg. Daily Trading Volume (000s) 2,226 EPS (Adjusted) 5.57 5.66 6.51Fiscal Year End December EPS (Jefferies) NA NA NA
Enterprise Value Calculation ($USD millions) Valuation Metrics (x)
Market Capitalization (fully-diluted) $10,731.3 Enterprise Value / Revenue 0.4x 0.4x 0.4x
Total Debt 1,184.6 Enterprise Value / EBITDA 3.2x 3.1x 2.6x
Minority Interest – Price / Earnings (GAAP) 9.9x 10.3x 8.8xPreferred Equity – Price / Earnings (Adjusted) 9.9x 9.8x 8.5xCash and Cash Equivalents 1,308.3 Total Debt / EBITDA 0.4x 0.3x 0.3xEnterprise Value $10,607.7
Price / Volume — Last Twelve Months
Murphy Oil Corporation, through its subsidiaries, engages in the exploration and production of oil and gas properties worldwide. It explores for and produces crude oil, natural gas, and natural gas liquids. The company is also involved in refining and marketing crude oil and other feedstocks into petroleum products, such as gasoline and distillates; buying and selling crude oil and refined products; and transporting and marketing petroleum products. It markets its refined products through a network of retail gasoline stations and unbranded wholesale customers. As of December 31, 2011, the company marketed products through 1,128 Murphy owned and operated stations. It has an interest in a Canadian synthetic oil operation; owns two ethanol production facilities in the United States; and one refinery in the United Kingdom. The company was formerly known as Murphy Corporation and changed its name to Murphy Oil Corporation in 1964. Murphy Oil Corporation was founded in 1950 and is headquartered in El Dorado, Arkansas.
-
1,000
2,000
3,000
4,000
5,000
6,000
7,000
8,000
9,000
10,000
–
$10.00
$20.00
$30.00
$40.00
$50.00
$60.00
$70.00
11/11 12/11 1/12 2/12 3/12 4/12 5/12 6/12 7/12 8/12 9/12 10/12 11/12
Volu
me (0
00s)
Price (
$U
SD
)
Volume Price

National Fuel Gas Co.
Jefferies 2012 Annual Global Energy Conference 51
Sources: Company filings, Company website and Capital IQ as of November 15, 2012. Balance sheet data is as of the most recent SEC filing available on November 15, 2012.
Ticker: NFG Jefferies Rating: Not Covered Price: $49.10 (as of Nov 15, 2012) Price / Volume Graph
Exchange: NYSE
Business Description
Founded: 1902 Employees: 1,827 Location: Williamsville, NY (United States)
Trading Data ( as of Nov 15, 2012) ($USD) Financial Projections ($USD millions, except per share data)
Share Price $49.10 (Consensus, unless otherwise noted) FY 2012E FY 2013E FY 2014E
% of 52-Week High 81.6% Revenue $1,833.1 $2,006.0 $2,246.252-Week High $60.14 EBITDA 795.3 848.7 968.352-Week Low 41.57 EPS (GAAP) $2.78 $2.66 $3.3690-Day Avg. Daily Trading Volume (000s) 330 EPS (Adjusted) 2.84 2.87 3.25Fiscal Year End September EPS (Jefferies) NA NA NA
Enterprise Value Calculation ($USD millions) Valuation Metrics (x)
Market Capitalization (fully-diluted) $4,091.5 Enterprise Value / Revenue 3.0x 2.8x 2.5x
Total Debt 1,570.0 Enterprise Value / EBITDA 7.0x 6.6x 5.8x
Minority Interest – Price / Earnings (GAAP) 17.7x 18.5x 14.6xPreferred Equity – Price / Earnings (Adjusted) 17.3x 17.1x 15.1xCash and Cash Equivalents 74.5 Total Debt / EBITDA 2.0x 1.8x 1.6xEnterprise Value $5,587.0
Price / Volume — Last Twelve Months
National Fuel Gas Company operates as a diversified energy company in the United States. The company’s Utility segment sells natural gas or provides natural gas transportation services to approximately 731,600 customers in Buffalo, Niagara Falls, and Jamestown, New York; and Erie and Sharon, Pennsylvania. Its Pipeline and Storage segment provides interstate natural gas transportation and storage services through an integrated gas pipeline system extending from southwestern Pennsylvania to the New York-Canadian border, and eastward to Ellisburg and Leidy, Pennsylvania; and owns and operates 27 underground natural gas storage fields, as well as operates 4 other underground natural gas storage fields jointly with other interstate gas pipeline companies. This segment also transports natural gas for distribution corporation and other utilities, industrial customers, and power producers in New York state. It owns the Empire Pipeline, a 157-mile pipeline that extends from Buffalo to Syracuse; and the Empire Connector, a 76-mile pipeline extension from Rochester to Corning in New York. The company’s Exploration and Production segment engages in the exploration, development, and purchase of natural gas and oil reserves in California and the Appalachian region of the United States. As of September 30, 2011, this segment had proved developed and undeveloped reserves of 43,345 thousand barrels of oil and 674,922 million cubic feet of natural gas. Its Energy Marketing segment markets natural gas to industrial, wholesale, commercial, public authority, and residential customers primarily in western and central New York and northwestern Pennsylvania. The company also owns approximately 95,000 acres of timber property and manages an additional 3,424 acres of timber cutting rights; and builds, owns, and operates natural gas processing and pipeline gathering facilities in the Appalachian region. National Fuel Gas Company was founded in 1902 and is based in Williamsville, New York.
-
500
1,000
1,500
2,000
2,500
3,000
3,500
4,000
–
$10.00
$20.00
$30.00
$40.00
$50.00
$60.00
$70.00
11/11 12/11 1/12 2/12 3/12 4/12 5/12 6/12 7/12 8/12 9/12 10/12 11/12
Volu
me (0
00s)
Price (
$U
SD
)
Volume Price

Natural Resource Partners LP
Jefferies 2012 Annual Global Energy Conference 52
Sources: Company filings, Company website and Capital IQ as of November 15, 2012. Balance sheet data is as of the most recent SEC filing available on November 15, 2012.
Ticker: NRP Jefferies Rating: Not Covered Price: $17.14 (as of Nov 15, 2012) Price / Volume Graph
Exchange: NYSE
Business Description
Founded: 2002 Employees: 71 Location: Houston, TX (United States)
Trading Data ( as of Nov 15, 2012) ($USD) Financial Projections ($USD millions, except per share data)
Share Price $17.14 (Consensus, unless otherwise noted) FY 2012E FY 2013E FY 2014E
% of 52-Week High 58.3% Revenue $361.2 $362.2 $357.652-Week High $29.40 EBITDA 309.4 307.7 301.952-Week Low 17.20 EPS (GAAP) $1.82 $1.71 $1.6690-Day Avg. Daily Trading Volume (000s) 275 EPS (Adjusted) 1.78 1.71 1.70Fiscal Year End December EPS (Jefferies) NA NA NA
Enterprise Value Calculation ($USD millions) Valuation Metrics (x)
Market Capitalization (fully-diluted) $1,817.3 Enterprise Value / Revenue 7.3x 7.3x 7.4x
Total Debt 939.3 Enterprise Value / EBITDA 8.6x 8.6x 8.8x
Minority Interest 12.9 Price / Earnings (GAAP) 9.4x 10.0x 10.3xPreferred Equity – Price / Earnings (Adjusted) 9.6x 10.0x 10.1xCash and Cash Equivalents 122.4 Total Debt / EBITDA 3.0x 3.1x 3.1xEnterprise Value $2,647.0
Price / Volume — Last Twelve Months
Natural Resource Partners L.P., through its subsidiaries, engages in the ownership and management of coal properties in Appalachia, the Illinois Basin, and the western United States, as well as lignite reserves in the Gulf Coast region. The company leases its properties to coal mine operators in exchange for royalty payments. It also owns preparation plants and related material handling facilities; and handling and transportation infrastructure, as well as owns and manages aggregate reserves comprising limestone, granite, clay, and sand and gravel under lease in six states. As of December 31, 2011, the company owned or controlled approximately 2.3 billion tons of proven and probable coal reserves; and approximately 380 million tons of aggregate reserves. NRP (GP) LP operates as the general partner of the company. Natural Resource Partners L.P. was founded in 2002 and is headquartered in Houston, Texas.
-
100
200
300
400
500
600
700
800
900
1,000
–
$5.00
$10.00
$15.00
$20.00
$25.00
$30.00
$35.00
11/11 12/11 1/12 2/12 3/12 4/12 5/12 6/12 7/12 8/12 9/12 10/12 11/12
Volu
me (0
00s)
Price (
$U
SD
)
Volume Price

Newfield Exploration Co.
Jefferies 2012 Annual Global Energy Conference 53
Sources: Company filings, Company website and Capital IQ as of November 15, 2012. Balance sheet data is as of the most recent SEC filing available on November 15, 2012.
Ticker: NFX Jefferies Rating: Buy Price: $24.27 (as of Nov 15, 2012) Price / Volume Graph
Exchange: NYSE Jefferies Analyst: Subash Chandra Target Price: $46.00
Business Description
Founded: 1988 Employees: 1,643 Location: The Woodlands, TX (United States)
Trading Data ( as of Nov 15, 2012) ($USD) Financial Projections ($USD millions, except per share data)
Share Price $24.27 (Consensus, unless otherwise noted) FY 2012E FY 2013E FY 2014E
% of 52-Week High 51.2% Revenue $2,598.9 $2,705.5 $3,129.052-Week High $47.40 EBITDA 1,540.0 1,545.9 1,823.252-Week Low 24.23 EPS (GAAP) $2.13 $2.35 $3.3390-Day Avg. Daily Trading Volume (000s) 2,375 EPS (Adjusted) 2.48 2.48 3.25Fiscal Year End December EPS (Jefferies) 2.66 3.03 NA
Enterprise Value Calculation ($USD millions) Valuation Metrics (x)
Market Capitalization (fully-diluted) $3,221.1 Enterprise Value / Revenue 2.4x 2.3x 2.0x
Total Debt 3,190.0 Enterprise Value / EBITDA 4.1x 4.1x 3.4x
Minority Interest – Price / Earnings (GAAP) 11.4x 10.3x 7.3xPreferred Equity – Price / Earnings (Adjusted) 9.8x 9.8x 7.5xCash and Cash Equivalents 125.0 Total Debt / EBITDA 2.1x 2.1x 1.7xEnterprise Value $6,286.1
Price / Volume — Last Twelve Months
Newfield Exploration Company, an independent energy company, engaged in the exploration, development, and production of crude oil, natural gas, and natural gas liquids. It has operations in the Mid-Continent, the Rocky Mountains, and onshore Texas, as well as in Malaysia and China. As of December 31, 2011, the company owned interests in approximately 825,000 net acres in the Rocky Mountains; approximately 480,000 net acres in the Mid-Continent; approximately 317,000 net acres in Maverick, Dimmit, and Zavala counties, Texas; approximately 147,000 net acres in conventional onshore Texas plays; and in 91 deepwater leases and approximately 275,000 net acres in the Gulf of Mexico. It also has interests in approximately 925,000 net acres in offshore Malaysia; and approximately 290,000 net acres in offshore China. The company has proved reserves of 3.9 trillion cubic feet equivalent and probable reserves of 2.6 trillion cubic feet equivalent. Newfield Exploration Company was founded in 1988 and is headquartered in The Woodlands, Texas.
-
5,000
10,000
15,000
20,000
25,000
–
$5.00
$10.00
$15.00
$20.00
$25.00
$30.00
$35.00
$40.00
$45.00
$50.00
11/11 12/11 1/12 2/12 3/12 4/12 5/12 6/12 7/12 8/12 9/12 10/12 11/12
Volu
me (0
00s)
Price (
$U
SD
)
Volume Price

Newpark Resources Inc.
Jefferies 2012 Annual Global Energy Conference 54
Sources: Company filings, Company website and Capital IQ as of November 15, 2012. Balance sheet data is as of the most recent SEC filing available on November 15, 2012.
Ticker: NR Jefferies Rating: Not Covered Price: $6.87 (as of Nov 15, 2012) Price / Volume Graph
Exchange: NYSE
Business Description
Founded: 1932 Employees: 2,118 Location: The Woodlands, TX (United States)
Trading Data ( as of Nov 15, 2012) ($USD) Financial Projections ($USD millions, except per share data)
Share Price $6.87 (Consensus, unless otherwise noted) FY 2012E FY 2013E FY 2014E
% of 52-Week High 64.7% Revenue $1,021.9 $1,032.0 $1,094.752-Week High $10.62 EBITDA 139.7 156.4 191.352-Week Low 5.19 EPS (GAAP) $0.67 $0.72 $0.9990-Day Avg. Daily Trading Volume (000s) 623 EPS (Adjusted) 0.67 0.77 0.99Fiscal Year End December EPS (Jefferies) NA NA NA
Enterprise Value Calculation ($USD millions) Valuation Metrics (x)
Market Capitalization (fully-diluted) $596.9 Enterprise Value / Revenue 0.7x 0.7x 0.7x
Total Debt 201.6 Enterprise Value / EBITDA 5.5x 4.9x 4.0x
Minority Interest – Price / Earnings (GAAP) 10.3x 9.5x 6.9xPreferred Equity – Price / Earnings (Adjusted) 10.2x 9.0x 6.9xCash and Cash Equivalents 35.5 Total Debt / EBITDA 1.4x 1.3x 1.1xEnterprise Value $763.0
Price / Volume — Last Twelve Months
Newpark Resources, Inc. provides various products and services primarily to the oil and gas exploration industry. It operates in three segments: Fluids Systems and Engineering, Mats and Integrated Services, and Environmental Services. The Fluids Systems and Engineering segment provides drilling fluids products and technical services for technical drilling projects involving complex subsurface conditions, such as horizontal directional, geologically deep, or deep water drilling. This segment also offers completion services and equipment rental services; and sells barite and other industrial minerals. The Mats and Integrated Services segment provides composite mat rentals, well site construction, and related well site services to exploration and production customers. This segment also manufactures and sells DuraBase composite mat systems for use in its domestic and international rental operations. The Environmental Services segment provides onshore and offshore drilling waste management; and reclamation services. This segment also processes and disposes waste generated by oil and gas customers; and receives and disposes non-hazardous industrial waste principally from generators, including refiners, manufacturers, service companies, and industrial municipalities. The company operates primarily in North America, Europe, the Middle East, Africa, Latin America, and the Asia Pacific. Newpark Resources, Inc. was founded in 1932 and is based in The Woodlands, Texas.
-
1,000
2,000
3,000
4,000
5,000
6,000
–
$2.00
$4.00
$6.00
$8.00
$10.00
$12.00
11/11 12/11 1/12 2/12 3/12 4/12 5/12 6/12 7/12 8/12 9/12 10/12 11/12
Volu
me (0
00s)
Price (
$U
SD
)
Volume Price

Northern Oil and Gas, Inc.
Jefferies 2012 Annual Global Energy Conference 55
Sources: Company filings, Company website and Capital IQ as of November 15, 2012. Balance sheet data is as of the most recent SEC filing available on November 15, 2012.
Ticker: NOG Jefferies Rating: Not Covered Price: $14.10 (as of Nov 15, 2012) Price / Volume Graph
Exchange: AMEX
Business Description
Founded: NM Employees: 19 Location: Wayzata, MN (United States)
Trading Data ( as of Nov 15, 2012) ($USD) Financial Projections ($USD millions, except per share data)
Share Price $14.10 (Consensus, unless otherwise noted) FY 2012E FY 2013E FY 2014E
% of 52-Week High 50.4% Revenue $309.4 $432.6 $518.252-Week High $28.00 EBITDA 242.8 329.3 415.152-Week Low 13.75 EPS (GAAP) $1.36 $1.52 $1.8890-Day Avg. Daily Trading Volume (000s) 830 EPS (Adjusted) 1.02 1.41 1.88Fiscal Year End December EPS (Jefferies) NA NA NA
Enterprise Value Calculation ($USD millions) Valuation Metrics (x)
Market Capitalization (fully-diluted) $882.7 Enterprise Value / Revenue 4.0x 2.9x 2.4x
Total Debt 368.0 Enterprise Value / EBITDA 5.1x 3.8x 3.0x
Minority Interest – Price / Earnings (GAAP) 10.4x 9.3x 7.5xPreferred Equity – Price / Earnings (Adjusted) 13.8x 10.0x 7.5xCash and Cash Equivalents 8.2 Total Debt / EBITDA 1.5x 1.1x 0.9xEnterprise Value $1,242.5
Price / Volume — Last Twelve Months
Northern Oil and Gas, Inc., an independent energy company, engages in the acquisition, exploration, development, and production of crude oil and natural gas properties primarily in the Bakken and Three Forks formations within the Williston Basin in North Dakota and Montana. As of December 31, 2011, the company owned working interests in 664 discoveries, consisting of 659 targeting the Bakken and Three Forks formations, and 5 exploratory wells targeting other formations; and developed approximately 52,219 net acres and had approximately 17,290 net acres in the process of drilling and completing. Northern Oil and Gas, Inc. is based in Wayzata, Minnesota.
-
500
1,000
1,500
2,000
2,500
3,000
3,500
–
$5.00
$10.00
$15.00
$20.00
$25.00
$30.00
11/11 12/11 1/12 2/12 3/12 4/12 5/12 6/12 7/12 8/12 9/12 10/12 11/12
Volu
me (0
00s)
Price (
$U
SD
)
Volume Price

Oasis Petroleum Inc.
Jefferies 2012 Annual Global Energy Conference 56
Sources: Company filings, Company website and Capital IQ as of November 15, 2012. Balance sheet data is as of the most recent SEC filing available on November 15, 2012.
Ticker: OAS Jefferies Rating: Buy Price: $29.56 (as of Nov 15, 2012) Price / Volume Graph
Exchange: NYSE Jefferies Analyst: Subash Chandra Target Price: $43.00
Business Description
Founded: 2007 Employees: 259 Location: Houston, TX (United States)
Trading Data ( as of Nov 15, 2012) ($USD) Financial Projections ($USD millions, except per share data)
Share Price $29.56 (Consensus, unless otherwise noted) FY 2012E FY 2013E FY 2014E
% of 52-Week High 83.4% Revenue $678.3 $999.8 $1,294.652-Week High $35.46 EBITDA 490.7 731.2 954.452-Week Low 22.02 EPS (GAAP) $1.67 $2.24 $3.3890-Day Avg. Daily Trading Volume (000s) 1,470 EPS (Adjusted) 1.49 2.33 3.32Fiscal Year End December EPS (Jefferies) 1.45 2.41 NA
Enterprise Value Calculation ($USD millions) Valuation Metrics (x)
Market Capitalization (fully-diluted) $2,760.0 Enterprise Value / Revenue 5.2x 3.6x 2.7x
Total Debt 1,200.0 Enterprise Value / EBITDA 7.2x 4.9x 3.7x
Minority Interest – Price / Earnings (GAAP) 17.7x 13.2x 8.7xPreferred Equity – Price / Earnings (Adjusted) 19.9x 12.7x 8.9xCash and Cash Equivalents 406.5 Total Debt / EBITDA 2.4x 1.6x 1.3xEnterprise Value $3,553.5
Price / Volume — Last Twelve Months
Oasis Petroleum Inc., an independent exploration and production company, engages in the acquisition and development of oil and natural gas resources in the Montana and North Dakota regions of the Williston Basin. The company’s primary project areas include West Williston, East Nesson, and Sanish. As of December 31, 2011, it had approximately 78.7 million barrels of oil equivalent of estimated net proved reserves. Oasis Petroleum Inc. was founded in 2007 and is based in Houston, Texas.
-
1,000
2,000
3,000
4,000
5,000
6,000
7,000
–
$5.00
$10.00
$15.00
$20.00
$25.00
$30.00
$35.00
$40.00
11/11 12/11 1/12 2/12 3/12 4/12 5/12 6/12 7/12 8/12 9/12 10/12 11/12
Volu
me (0
00s)
Price (
$U
SD
)
Volume Price

Oil States International Inc.
Jefferies 2012 Annual Global Energy Conference 57
Sources: Company filings, Company website and Capital IQ as of November 15, 2012. Balance sheet data is as of the most recent SEC filing available on November 15, 2012.
Ticker: OIS Jefferies Rating: Not Covered Price: $64.40 (as of Nov 15, 2012) Price / Volume Graph
Exchange: NYSE
Business Description
Founded: 1995 Employees: 7,949 Location: Houston, TX (United States)
Trading Data ( as of Nov 15, 2012) ($USD) Financial Projections ($USD millions, except per share data)
Share Price $64.40 (Consensus, unless otherwise noted) FY 2012E FY 2013E FY 2014E
% of 52-Week High 73.5% Revenue $4,356.6 $4,471.3 $4,884.652-Week High $87.65 EBITDA 914.0 930.7 1,057.752-Week Low 60.03 EPS (GAAP) $8.07 $8.00 $9.0090-Day Avg. Daily Trading Volume (000s) 594 EPS (Adjusted) 8.09 7.96 9.10Fiscal Year End December EPS (Jefferies) NA NA NA
Enterprise Value Calculation ($USD millions) Valuation Metrics (x)
Market Capitalization (fully-diluted) $3,535.2 Enterprise Value / Revenue 1.0x 1.0x 0.9x
Total Debt 1,186.8 Enterprise Value / EBITDA 5.0x 4.9x 4.3x
Minority Interest 1.2 Price / Earnings (GAAP) 8.0x 8.1x 7.2xPreferred Equity – Price / Earnings (Adjusted) 8.0x 8.1x 7.1xCash and Cash Equivalents 163.6 Total Debt / EBITDA 1.3x 1.3x 1.1xEnterprise Value $4,559.7
Price / Volume — Last Twelve Months
Oil States International, Inc., through its subsidiaries, provides specialty products and services to the oil and gas drilling and production companies worldwide. It operates in four segments: Accommodations, Offshore Products, Well Site Services, and Tubular Services. The Accommodations segment offers temporary and permanent work force accommodation services for people working in remote locations. The Offshore Products segment designs and manufactures flexible bearings and connector products; sub sea pipeline products; marine winches, mooring systems, and cranes and rig equipment; and conductor casing connections and pipes, as well as provides blowout preventer stack assembly, integration, testing, and repair services; and drilling riser and related repair services. The Well Site Services segment offers a range of products and services that are used to drill for, and establish and maintain the flow of oil and gas from a well throughout its lifecycle. This segment engages in the rental of wireline and coiled tubing pressure control equipment; wellhead isolation equipment; pipe recovery systems; thru-tubing fishing services; hydraulic chokes and manifolds; blow out preventers; well testing and flowback equipment; gravel pack operations on well bores; and surface control equipment and down-hole tools utilized by coiled tubing operators. This segment also provides land drilling services. The Tubular Services segment distributes a range of casing and tubing products; and offers threading, logistical, and inventory management services. The company serves national oil companies, independent oil and gas companies, onshore and offshore drilling companies, and other oilfield service and mining companies. Oil States International, Inc. was founded in 1995 and is based in Houston, Texas.
-
500
1,000
1,500
2,000
2,500
–
$10.00
$20.00
$30.00
$40.00
$50.00
$60.00
$70.00
$80.00
$90.00
$100.00
11/11 12/11 1/12 2/12 3/12 4/12 5/12 6/12 7/12 8/12 9/12 10/12 11/12
Volu
me (0
00s)
Price (
$U
SD
)
Volume Price

ONEOK Inc.
Jefferies 2012 Annual Global Energy Conference 58
Sources: Company filings, Company website and Capital IQ as of November 15, 2012. Balance sheet data is as of the most recent SEC filing available on November 15, 2012.
Ticker: OKE Jefferies Rating: Not Covered Price: $44.65 (as of Nov 15, 2012) Price / Volume Graph
Exchange: NYSE
Business Description
Founded: 1906 Employees: 4,795 Location: Tulsa, OK (United States)
Trading Data ( as of Nov 15, 2012) ($USD) Financial Projections ($USD millions, except per share data)
Share Price $44.65 (Consensus, unless otherwise noted) FY 2012E FY 2013E FY 2014E
% of 52-Week High 89.7% Revenue $12,363.0 $14,832.3 $16,538.352-Week High $49.79 EBITDA 1,430.3 1,617.1 1,914.152-Week Low 38.52 EPS (GAAP) $1.68 $2.05 $2.4090-Day Avg. Daily Trading Volume (000s) 906 EPS (Adjusted) 1.69 2.07 2.44Fiscal Year End December EPS (Jefferies) NA NA NA
Enterprise Value Calculation ($USD millions) Valuation Metrics (x)
Market Capitalization (fully-diluted) $9,136.0 Enterprise Value / Revenue 1.4x 1.2x 1.1x
Total Debt 7,205.4 Enterprise Value / EBITDA 12.2x 10.8x 9.1x
Minority Interest 2,109.9 Price / Earnings (GAAP) 26.6x 21.8x 18.6xPreferred Equity – Price / Earnings (Adjusted) 26.5x 21.6x 18.3xCash and Cash Equivalents 985.6 Total Debt / EBITDA 5.0x 4.5x 3.8xEnterprise Value $17,465.6
Price / Volume — Last Twelve Months
ONEOK, Inc., a diversified energy company, engages in the gathering, processing, storage, and transportation of natural gas and natural gas liquids in the United States. The company operates through three segments: ONEOK Partners, Natural Gas Distribution, and Energy Services. The ONEOK Partners segment is involved in gathering, processing, storing, and transporting natural gas; owns and operates regulated natural gas transmission pipelines, natural gas storage facilities, and natural gas gathering systems for unprocessed natural gas; and owns natural gas liquids systems in the Mid-Continent and Rocky Mountain regions. This segment offers its services to petrochemical manufacturers, heating-fuel users, refineries, and propane distributors. The Natural Gas Distribution segment provides natural gas distribution services to residential, commercial, industrial, and transportation customers, as well as wholesale and public authority customers in Oklahoma, Kansas, and Texas. The Energy Services segment offers nonuniform natural gas supply and risk-management services for natural gas and electric utilities, and commercial and industrial customers through its network of leased storage and transportation capacity. ONEOK, Inc. was founded in 1906 and is headquartered in Tulsa, Oklahoma.
-
1,000
2,000
3,000
4,000
5,000
6,000
–
$10.00
$20.00
$30.00
$40.00
$50.00
$60.00
11/11 12/11 1/12 2/12 3/12 4/12 5/12 6/12 7/12 8/12 9/12 10/12 11/12
Volu
me (0
00s)
Price (
$U
SD
)
Volume Price

Patterson-UTI Energy Inc.
Jefferies 2012 Annual Global Energy Conference 59
Sources: Company filings, Company website and Capital IQ as of November 15, 2012. Balance sheet data is as of the most recent SEC filing available on November 15, 2012.
Ticker: PTEN Jefferies Rating: Hold Price: $16.34 (as of Nov 15, 2012) Price / Volume Graph
Exchange: NasdaqGS Jefferies Analyst: Brad Handler Target Price: $17.00
Business Description
Founded: 1978 Employees: 8,200 Location: Houston, TX (United States)
Trading Data ( as of Nov 15, 2012) ($USD) Financial Projections ($USD millions, except per share data)
Share Price $16.34 (Consensus, unless otherwise noted) FY 2012E FY 2013E FY 2014E
% of 52-Week High 71.1% Revenue $2,676.0 $2,493.3 $2,803.452-Week High $22.98 EBITDA 958.0 841.4 1,011.352-Week Low 12.81 EPS (GAAP) $1.84 $1.08 $1.7190-Day Avg. Daily Trading Volume (000s) 3,803 EPS (Adjusted) 1.79 1.13 1.69Fiscal Year End December EPS (Jefferies) 1.81 1.15 2.30
Enterprise Value Calculation ($USD millions) Valuation Metrics (x)
Market Capitalization (fully-diluted) $2,417.9 Enterprise Value / Revenue 1.1x 1.2x 1.0x
Total Debt 600.0 Enterprise Value / EBITDA 3.1x 3.5x 2.9x
Minority Interest – Price / Earnings (GAAP) 8.9x 15.2x 9.5xPreferred Equity – Price / Earnings (Adjusted) 9.2x 14.4x 9.7xCash and Cash Equivalents 83.5 Total Debt / EBITDA 0.6x 0.7x 0.6xEnterprise Value $2,934.4
Price / Volume — Last Twelve Months
Patterson-UTI Energy, Inc., through its subsidiaries, provides onshore contract drilling services to oil and natural gas exploration and production companies in the United States and Canada. The company offers pressure pumping services that consist of well stimulation and cementing for completion of new wells and remedial work on existing wells, as well as hydraulic fracturing, nitrogen, cementing, and acid pumping services in Texas and the Appalachian Basin; and contract drilling services primarily in Texas, New Mexico, Oklahoma, Arkansas, Louisiana, Mississippi, Colorado, Utah, Wyoming, Montana, North Dakota, Pennsylvania, West Virginia, Ohio, and western Canada. It also owns and invests in oil and natural gas assets located primarily in Texas and New Mexico. As of December 31, 2011, it had a drilling fleet of 330 marketable land-based drilling rigs. Patterson-UTI Energy, Inc. was founded in 1978 and is headquartered in Houston, Texas.
-
1,000
2,000
3,000
4,000
5,000
6,000
7,000
8,000
9,000
10,000
–
$5.00
$10.00
$15.00
$20.00
$25.00
11/11 12/11 1/12 2/12 3/12 4/12 5/12 6/12 7/12 8/12 9/12 10/12 11/12
Volu
me (0
00s)
Price (
$U
SD
)
Volume Price

Penn Virginia Corporation
Jefferies 2012 Annual Global Energy Conference 60
Sources: Company filings, Company website and Capital IQ as of November 15, 2012. Balance sheet data is as of the most recent SEC filing available on November 15, 2012.
Ticker: PVA Jefferies Rating: Buy Price: $4.32 (as of Nov 15, 2012) Price / Volume Graph
Exchange: NYSE Jefferies Analyst: Biju Z Perincheril Target Price: $7.50
Business Description
Founded: 1882 Employees: 153 Location: Radnor, PA (United States)
Trading Data ( as of Nov 15, 2012) ($USD) Financial Projections ($USD millions, except per share data)
Share Price $4.32 (Consensus, unless otherwise noted) FY 2012E FY 2013E FY 2014E
% of 52-Week High 55.8% Revenue $326.3 $356.8 $429.752-Week High $7.74 EBITDA 244.1 254.5 304.552-Week Low 3.92 EPS (GAAP) ($1.17) ($0.41) $0.1290-Day Avg. Daily Trading Volume (000s) 1,282 EPS (Adjusted) (0.74) (0.51) 0.15Fiscal Year End December EPS (Jefferies) (0.81) 0.81 NA
Enterprise Value Calculation ($USD millions) Valuation Metrics (x)
Market Capitalization (fully-diluted) $238.0 Enterprise Value / Revenue 2.8x 2.5x 2.1x
Total Debt 676.3 Enterprise Value / EBITDA 3.7x 3.6x 3.0x
Minority Interest – Price / Earnings (GAAP) NM NM 37.6xPreferred Equity – Price / Earnings (Adjusted) NM NM 28.4xCash and Cash Equivalents 5.0 Total Debt / EBITDA 2.8x 2.7x 2.2xEnterprise Value $909.3
Price / Volume — Last Twelve Months
Penn Virginia Corporation, an independent oil and gas company, primarily engages in the exploration and development of natural gas and oil properties in various onshore regions of the United States. The company is involved in the production and sale of natural gas, crude oil, and natural gas liquid products. It primarily focuses on developing the Eagle Ford Shale play in south Texas; and the horizontal Granite Wash play in the Mid-Continent region. The company also drills exploratory wells in the Marcellus Shale play in Pennsylvania; and has interests in the natural gas properties in the Haynesville Shale and Cotton Valley Sands in east Texas, and Selma Chalk in Mississippi. As of December 31, 2011, it had proved natural gas and oil reserves of approximately 883 billion cubic feet of natural gas equivalent; and owned approximately 1.1 million net acres of leasehold and royalty interests. The company sells its products using short-term floating price physical and spot market contracts. Penn Virginia Corporation was founded in 1882 and is headquartered in Radnor, Pennsylvania.
-
5,000
10,000
15,000
20,000
25,000
–
$1.00
$2.00
$3.00
$4.00
$5.00
$6.00
$7.00
$8.00
11/11 12/11 1/12 2/12 3/12 4/12 5/12 6/12 7/12 8/12 9/12 10/12 11/12
Volu
me (0
00s)
Price (
$U
SD
)
Volume Price

Petróleo Brasileiro SA - Petrobras
Jefferies 2012 Annual Global Energy Conference 61
Sources: Company filings, Company website and Capital IQ as of November 15, 2012. Balance sheet data is as of the most recent SEC filing available on November 15, 2012.
Ticker: PETR4 Jefferies Rating: Buy Price: $9.57 (as of Nov 14, 2012) Price / Volume Graph
Exchange: BOVESPA Jefferies Analyst: Iain Reid Target Price: $12.78
Business Description
Founded: 1953 Employees: 81,918 Location: Rio de Janeiro, Brazil
Trading Data ( as of Nov 14, 2012) ($USD) Financial Projections ($USD millions, except per share data)
Share Price $9.57 (Consensus, unless otherwise noted) FY 2012E FY 2013E FY 2014E
% of 52-Week High 76.5% Revenue $135,503.2 $138,303.0 $145,060.952-Week High $12.52 EBITDA 31,481.2 37,368.6 41,133.852-Week Low 8.42 EPS (GAAP) $0.98 $1.24 $1.1890-Day Avg. Daily Trading Volume (000s) 21,144 EPS (Adjusted) 0.96 1.24 1.23Fiscal Year End December EPS (Jefferies) 2.09 2.85 3.67
Enterprise Value Calculation ($USD millions) Valuation Metrics (x)
Market Capitalization (fully-diluted) $127,041.2 Enterprise Value / Revenue 1.4x 1.4x 1.3x
Total Debt 91,836.4 Enterprise Value / EBITDA 6.2x 5.2x 4.7x
Minority Interest 1,078.5 Price / Earnings (GAAP) 9.8x 7.7x 8.1xPreferred Equity – Price / Earnings (Adjusted) 10.0x 7.7x 7.8xCash and Cash Equivalents 26,021.9 Total Debt / EBITDA 2.9x 2.5x 2.2xEnterprise Value $193,934.2
Price / Volume — Last Twelve Months
Petróleo Brasileiro S.A. operates as an integrated oil and gas company in Brazil and internationally. Its Exploration and Production segment engages in the exploration, development, and production activities; sale and transfer of crude oil in domestic and foreign markets; and sale of oil products produced at natural gas processing plants. The company’s Refining, Transportation and Marketing segment is involved in the refining, logistics, transportation, export, and the purchase of crude oil, as well as in the purchase and sale of oil products and ethanol. This segment also engages in the extraction and processing of shale. Its products include gasoline, diesel, and residential liquefied petroleum gas (LPG). The company’s Gas and Power segment engages in the transportation and trade of natural gas; transportation and trade of LNG; generation and trade of electric power; and fertilizer business. Its Biofuel segment engages in the production of biodiesel and its co-products, as well as in the production and marketing of ethanol, sugar, and the excess electric power generated from sugarcane bagasse. The company’s Distribution segment distributes oil products, ethanol, and compressed natural gas in Brazil. Its International segment engages in the exploration, production, refining, transportation, marketing, and distribution of gas and power in countries other than Brazil as well as provides petrochemicals. As of December 31, 2011, the company had proved developed oil and gas reserves of 8,124 Million barrels of oil equivalent (mmboe), including synthetic oil and synthetic gas from oil shale; and proved undeveloped reserves of 4,143 mmboe in Brazil. Petróleo Brasileiro S.A. was founded in 1953 and is headquartered in Rio de Janeiro, Brazil.
-
10,000
20,000
30,000
40,000
50,000
60,000
70,000
80,000
90,000
100,000
–
$2.00
$4.00
$6.00
$8.00
$10.00
$12.00
$14.00
$16.00
11/11 12/11 1/12 2/12 3/12 4/12 5/12 6/12 7/12 8/12 9/12 10/12 11/12
Volu
me (0
00s)
Price (
$U
SD
)
Volume Price

Pioneer Energy Services Corp.
Jefferies 2012 Annual Global Energy Conference 62
Sources: Company filings, Company website and Capital IQ as of November 15, 2012. Balance sheet data is as of the most recent SEC filing available on November 15, 2012.
Ticker: PES Jefferies Rating: Buy Price: $6.11 (as of Nov 15, 2012) Price / Volume Graph
Exchange: NYSE Jefferies Analyst: Brad Handler Target Price: $10.00
Business Description
Founded: 1968 Employees: 3,330 Location: San Antonio, TX (United States)
Trading Data ( as of Nov 15, 2012) ($USD) Financial Projections ($USD millions, except per share data)
Share Price $6.11 (Consensus, unless otherwise noted) FY 2012E FY 2013E FY 2014E
% of 52-Week High 50.5% Revenue $916.2 $939.8 $1,054.852-Week High $12.10 EBITDA 250.8 235.6 333.752-Week Low 6.01 EPS (GAAP) $0.38 $0.17 $0.5590-Day Avg. Daily Trading Volume (000s) 587 EPS (Adjusted) 0.39 0.08 0.58Fiscal Year End December EPS (Jefferies) 0.50 0.15 0.85
Enterprise Value Calculation ($USD millions) Valuation Metrics (x)
Market Capitalization (fully-diluted) $375.8 Enterprise Value / Revenue 0.9x 0.9x 0.8x
Total Debt 499.4 Enterprise Value / EBITDA 3.5x 3.7x 2.6x
Minority Interest – Price / Earnings (GAAP) 16.0x 35.4x 11.1xPreferred Equity – Price / Earnings (Adjusted) 15.6x NM 10.6xCash and Cash Equivalents 6.9 Total Debt / EBITDA 2.0x 2.1x 1.5xEnterprise Value $868.3
Price / Volume — Last Twelve Months
Pioneer Energy Services Corp., through its subsidiaries, provides contract land drilling services and production services to independent and oil and gas exploration and production companies in the United States and Colombia. Its Drilling Services segment provides contract land drilling services to a group of oil and gas exploration and production companies with its fleet of 66 drilling rigs in Texas, North Dakota, Utah, Appalachia, and Colombia. The company’s Production Services segment provides a range of services to exploration and production companies, including well servicing, wireline services, coiled tubing services, and fishing and rental services. It provides its production services in the United States onshore oil and gas producing regions in the Mid-Continent and Rocky Mountain states; and in the onshore and offshore Gulf Coast. As of July 20, 2012, the company had a fleet of 101 well servicing rigs, 117 wireline units, and 11 coiled tubing units. The company was formerly known as Pioneer Drilling Company and changed its name to Pioneer Energy Services Corp. in July 2012. Pioneer Energy Services Corp. was founded in 1968 and is based in San Antonio, Texas.
-
500
1,000
1,500
2,000
2,500
3,000
–
$2.00
$4.00
$6.00
$8.00
$10.00
$12.00
$14.00
11/11 12/11 1/12 2/12 3/12 4/12 5/12 6/12 7/12 8/12 9/12 10/12 11/12
Volu
me (0
00s)
Price (
$U
SD
)
Volume Price

Plains All American Pipeline, L.P.
Jefferies 2012 Annual Global Energy Conference 63
Sources: Company filings, Company website and Capital IQ as of November 15, 2012. Balance sheet data is as of the most recent SEC filing available on November 15, 2012.
Ticker: PAA Jefferies Rating: Not Covered Price: $43.59 (as of Nov 15, 2012) Price / Volume Graph
Exchange: NYSE
Business Description
Founded: 1998 Employees: 3,800 Location: Houston, TX (United States)
Trading Data ( as of Nov 15, 2012) ($USD) Financial Projections ($USD millions, except per share data)
Share Price $43.59 (Consensus, unless otherwise noted) FY 2012E FY 2013E FY 2014E
% of 52-Week High 92.5% Revenue $39,082.9 $41,265.3 $42,692.952-Week High $47.14 EBITDA 2,013.0 2,018.6 2,183.352-Week Low 31.50 EPS (GAAP) $2.83 $2.64 $2.6990-Day Avg. Daily Trading Volume (000s) 811 EPS (Adjusted) 2.97 2.68 2.77Fiscal Year End December EPS (Jefferies) NA NA NA
Enterprise Value Calculation ($USD millions) Valuation Metrics (x)
Market Capitalization (fully-diluted) $14,560.7 Enterprise Value / Revenue 0.6x 0.5x 0.5x
Total Debt 6,799.0 Enterprise Value / EBITDA 11.0x 10.9x 10.1x
Minority Interest 742.0 Price / Earnings (GAAP) 15.4x 16.5x 16.2xPreferred Equity – Price / Earnings (Adjusted) 14.7x 16.3x 15.7xCash and Cash Equivalents 32.0 Total Debt / EBITDA 3.4x 3.4x 3.1xEnterprise Value $22,069.7
Price / Volume — Last Twelve Months
Plains All American Pipeline, L.P., through its subsidiaries, engages in the transportation, storage, terminalling, and marketing of crude oil, refined products, and liquid petroleum gas (LPG) products in the United States and Canada. The company operates in three segments: Transportation, Facilities, and Supply and Logistics. The Transportation segment transports crude oil and refined products on pipelines, gathering systems, trucks, and barges. As of December 31, 2011, this segment owned and leased 16,000 miles of active crude oil and refined products pipelines and gathering systems; 23 million barrels of above-ground tank capacity used primarily to facilitate pipeline throughput; 67 trucks and 382 trailers; and 82 transport and storage barges, and 44 transport tugs. The Facilities segment provides storage, terminalling, and throughput services for crude oil, refined products, and LPG and natural gas, as well as offers LPG fractionation and isomerization, and natural gas processing services. The Supply and Logistics segment purchases crude oil at the wellhead, and pipeline and terminal facilities; waterborne cargoes at their load port and various other locations in transit; and LPG from producers, refiners, and other marketers. This segment also resells or exchanges crude oil and LPG; and transports oil and LPG on trucks, barges, railcars, pipelines, and ocean-going vessels to various delivery points. It has 622 trucks and 731 trailers, and 2,453 railcars. The company also owns and operates natural gas storage facilities. Plains All American Pipeline, L.P. was founded in 1998 and is headquartered in Houston, Texas.
-
1,000
2,000
3,000
4,000
5,000
6,000
7,000
8,000
9,000
–
$5.00
$10.00
$15.00
$20.00
$25.00
$30.00
$35.00
$40.00
$45.00
$50.00
11/11 12/11 1/12 2/12 3/12 4/12 5/12 6/12 7/12 8/12 9/12 10/12 11/12
Volu
me (0
00s)
Price (
$U
SD
)
Volume Price

Precision Drilling Corporation
Jefferies 2012 Annual Global Energy Conference 64
Sources: Company filings, Company website and Capital IQ as of November 15, 2012. Balance sheet data is as of the most recent SEC filing available on November 15, 2012.
Ticker: PD Jefferies Rating: Buy Price: $6.79 (as of Nov 15, 2012) Price / Volume Graph
Exchange: TSX Jefferies Analyst: Brad Handler Target Price: $10.00
Business Description
Founded: 1951 Employees: 7,813 Location: Calgary, Canada
Trading Data ( as of Nov 15, 2012) ($USD) Financial Projections ($USD millions, except per share data)
Share Price $6.79 (Consensus, unless otherwise noted) FY 2012E FY 2013E FY 2014E
% of 52-Week High 53.5% Revenue $2,006.3 $2,124.3 $2,379.752-Week High $12.68 EBITDA 663.7 702.7 785.752-Week Low 5.95 EPS (GAAP) $0.76 $0.82 $1.1090-Day Avg. Daily Trading Volume (000s) 1,061 EPS (Adjusted) 0.77 0.80 1.04Fiscal Year End December EPS (Jefferies) 0.87 0.95 1.35
Enterprise Value Calculation ($USD millions) Valuation Metrics (x)
Market Capitalization (fully-diluted) $1,876.7 Enterprise Value / Revenue 1.4x 1.4x 1.2x
Total Debt 1,224.8 Enterprise Value / EBITDA 4.3x 4.1x 3.7x
Minority Interest – Price / Earnings (GAAP) 9.0x 8.3x 6.2xPreferred Equity – Price / Earnings (Adjusted) 8.9x 8.4x 6.5xCash and Cash Equivalents 230.3 Total Debt / EBITDA 1.8x 1.7x 1.6xEnterprise Value $2,871.2
Price / Volume — Last Twelve Months
Precision Drilling Corporation provides contract drilling, and completion and production services to oil and natural gas exploration and production companies. Its Contract Drilling Services segment offers land drilling, directional drilling, and turnkey drilling services; trucking services for the movement of precision rigs; and procures and distributes oilfield supplies, as well as manufactures and refurbishes drilling and service rig equipments. As of December 31, 2011, this segment operated 188 land drilling rigs in Canada, 143 land drilling rigs in the United States, 3 land drilling rigs in Saudi Arabia, 2 land drilling rigs in Mexico, and 1 land drilling rig in Colombia. The company’s Completion and Production Services segment offers service rigs for well completion and workover services; snubbing services; camp and catering services; and wastewater treatment services, as well as is involved in the rental of oilfield surface equipment, tubulars, well control equipment, wellsite accommodations, and drilling camps. As of December 31, 2011, this segment operated 189 well completion and workover service rigs and 17 snubbing units in Canada; 1 snubbing unit in the United States; 232 wellsite accommodation units in Canada; 28 wellsite accommodation units in the United States; 86 small-flow wastewater treatment units, 4 large-flow wastewater treatment units, and 3 potable water production units in Canada; 56 drilling camps and 2 base camps in Canada; and 4 drilling camps in the United States, as well as provided approximately 11,100 oilfield rental items, including well control equipment, surface equipment and specialty tubulars in Canada. Precision Drilling Corporation was founded in 1951 and is headquartered in Calgary, Canada.
-
1,000
2,000
3,000
4,000
5,000
6,000
7,000
–
$2.00
$4.00
$6.00
$8.00
$10.00
$12.00
$14.00
11/11 12/11 1/12 2/12 3/12 4/12 5/12 6/12 7/12 8/12 9/12 10/12 11/12
Volu
me (0
00s)
Price (
$U
SD
)
Volume Price

Range Resources Corporation
Jefferies 2012 Annual Global Energy Conference 65
Sources: Company filings, Company website and Capital IQ as of November 15, 2012. Balance sheet data is as of the most recent SEC filing available on November 15, 2012.
Ticker: RRC Jefferies Rating: Hold Price: $67.33 (as of Nov 15, 2012) Price / Volume Graph
Exchange: NYSE Jefferies Analyst: Biju Z Perincheril Target Price: $64.00
Business Description
Founded: 1975 Employees: 756 Location: Fort Worth, TX (United States)
Trading Data ( as of Nov 15, 2012) ($USD) Financial Projections ($USD millions, except per share data)
Share Price $67.33 (Consensus, unless otherwise noted) FY 2012E FY 2013E FY 2014E
% of 52-Week High 91.1% Revenue $1,349.5 $1,717.9 $2,236.852-Week High $73.94 EBITDA 822.2 1,088.3 1,407.452-Week Low 52.34 EPS (GAAP) ($0.02) $0.88 $2.4390-Day Avg. Daily Trading Volume (000s) 1,535 EPS (Adjusted) 0.64 1.06 1.93Fiscal Year End December EPS (Jefferies) 0.66 0.92 NA
Enterprise Value Calculation ($USD millions) Valuation Metrics (x)
Market Capitalization (fully-diluted) $10,714.2 Enterprise Value / Revenue 10.1x 7.9x 6.1x
Total Debt 2,849.9 Enterprise Value / EBITDA 16.5x 12.5x 9.6x
Minority Interest – Price / Earnings (GAAP) NM NM 27.7xPreferred Equity – Price / Earnings (Adjusted) NM NM 34.9xCash and Cash Equivalents 0.2 Total Debt / EBITDA 3.5x 2.6x 2.0xEnterprise Value $13,563.9
Price / Volume — Last Twelve Months
Range Resources Corporation operates as an independent natural gas, natural gas liquids (NGLs), and oil company. It engages in the acquisition, exploration, and development of natural gas and oil properties primarily in the Appalachian and southwestern regions of the United States. The company drills and produces shale tight gas, coal bed methane, conventional natural gas, natural gas liquids, and oil in Pennsylvania, Virginia, and West Virginia of the Appalachian region. It owns 5,051 net producing wells; approximately 3,400 miles of transportation and gas gathering lines; and 1.8 million gross acres under lease. The company’s drilling and producing activities in the southwestern United States cover the Permian Basin of West Texas, the Delaware Basin of New Mexico, the East Texas Basin, the Texas Panhandle, the Anadarko Basin of western Oklahoma, the Ardmore Basin of southern Oklahoma, the Nemaha Uplift of northern Oklahoma, and Kansas and Mississippi. It owns 1,636 net producing wells, as well as approximately 890,000 gross acres under lease. As of December 31, 2011, Range Resources Corporation had 5.1 Tcfe of proved reserves. It sells gas to utilities, marketing companies, mid stream companies, and industrial users; and natural gas liquids to natural gas processors and other purchasers or users of NGLs. The company was formerly known as Lomak Petroleum, Inc. and changed its name to Range Resources Corporation in 1998. Range Resources Corporation was founded in 1975 and is headquartered in Fort Worth, Texas.
-
1,000
2,000
3,000
4,000
5,000
6,000
7,000
8,000
–
$10.00
$20.00
$30.00
$40.00
$50.00
$60.00
$70.00
$80.00
11/11 12/11 1/12 2/12 3/12 4/12 5/12 6/12 7/12 8/12 9/12 10/12 11/12
Volu
me (0
00s)
Price (
$U
SD
)
Volume Price

Repsol S.A.
Jefferies 2012 Annual Global Energy Conference 66
Sources: Company filings, Company website and Capital IQ as of November 15, 2012. Balance sheet data is as of the most recent SEC filing available on November 15, 2012.
Ticker: REP Jefferies Rating: Hold Price: $19.87 (as of Nov 15, 2012) Price / Volume Graph
Exchange: CATS Jefferies Analyst: Brendan Warn Target Price: $20.46
Business Description
Founded: 1986 Employees: 46,575 Location: Madrid, Spain
Trading Data ( as of Nov 15, 2012) ($USD) Financial Projections ($USD millions, except per share data)
Share Price $19.87 (Consensus, unless otherwise noted) FY 2012E FY 2013E FY 2014E
% of 52-Week High 64.1% Revenue $73,491.6 $76,662.8 $74,760.252-Week High $30.99 EBITDA 9,010.7 9,108.7 9,588.952-Week Low 13.94 EPS (GAAP) $2.34 $2.04 $2.2390-Day Avg. Daily Trading Volume (000s) 6,855 EPS (Adjusted) 2.02 2.15 2.28Fiscal Year End December EPS (Jefferies) 1.97 2.06 2.29
Enterprise Value Calculation ($USD millions) Valuation Metrics (x)
Market Capitalization (fully-diluted) $23,047.7 Enterprise Value / Revenue 0.6x 0.6x 0.6x
Total Debt 28,763.9 Enterprise Value / EBITDA 5.0x 5.0x 4.7x
Minority Interest 999.2 Price / Earnings (GAAP) 8.5x 9.7x 8.9xPreferred Equity – Price / Earnings (Adjusted) 9.9x 9.3x 8.7xCash and Cash Equivalents 7,392.3 Total Debt / EBITDA 3.2x 3.2x 3.0xEnterprise Value $45,418.4
Price / Volume — Last Twelve Months
Repsol, S.A. engages in the exploration, development, and production of crude oil and natural gas primarily in Spain and Argentina. The company is also involved in the transportation of oil products, liquid petroleum gas (LPG), and natural gas; refining and production of a range of oil products; retailing of oil products, oil derivatives, petrochemicals, LPG, and natural gas; and generation, transportation, distribution, and retailing of electricity. It offers basic petrochemical products, including ethylene, propylene, butadiene, benzene, and ethyl tert-butyl ether, as well as petrochemical derivative products comprising polyolefins, such as polyethylene and polypropylene; and intermediate products that consist of propylene oxide, polyols, glycols, styrene monomers, acrylonitrile/methyl methacrylate, rubber, and styrene derivatives and specialties. The company operates 4,506 service stations and supply units that include 3,620 in Spain, 425 in Portugal, 166 in Italy, and 295 in Peru. As of December 31, 2011, its proven reserves were 1,167 million barrels of oil equivalent (Mboe), of which 393 Mboe relate to crude oil, condensate, and liquefied gases, and the remaining 774 Mboe relate to natural gas. The company was formerly known as Repsol YPF, S.A. and changed its name to Repsol, S.A. in May 2012. Repsol, S.A. was founded in 1986 and is headquartered in Madrid, Spain.
-
50,000
100,000
150,000
200,000
250,000
300,000
–
$5.00
$10.00
$15.00
$20.00
$25.00
$30.00
$35.00
11/11 12/11 1/12 2/12 3/12 4/12 5/12 6/12 7/12 8/12 9/12 10/12
Volu
me (0
00s)
Price (
$U
SD
)
Volume Price

RigNet, Inc.
Jefferies 2012 Annual Global Energy Conference 67
Sources: Company filings, Company website and Capital IQ as of November 15, 2012. Balance sheet data is as of the most recent SEC filing available on November 15, 2012.
Ticker: RNET Jefferies Rating: Buy Price: $17.61 (as of Nov 15, 2012) Price / Volume Graph
Exchange: NasdaqGS Jefferies Analyst: Thomas Seitz Target Price: $22.00
Business Description
Founded: 2000 Employees: 243 Location: Houston, TX (United States)
Trading Data ( as of Nov 15, 2012) ($USD) Financial Projections ($USD millions, except per share data)
Share Price $17.61 (Consensus, unless otherwise noted) FY 2012E FY 2013E FY 2014E
% of 52-Week High 90.4% Revenue $159.8 $196.1 $226.352-Week High $19.49 EBITDA 42.6 55.0 64.452-Week Low 14.91 EPS (GAAP) $0.69 $0.97 $1.1690-Day Avg. Daily Trading Volume (000s) 31 EPS (Adjusted) 0.78 1.03 1.21Fiscal Year End December EPS (Jefferies) 0.79 0.93 1.19
Enterprise Value Calculation ($USD millions) Valuation Metrics (x)
Market Capitalization (fully-diluted) $276.1 Enterprise Value / Revenue 1.8x 1.5x 1.3x
Total Debt 63.6 Enterprise Value / EBITDA 6.7x 5.2x 4.4x
Minority Interest 0.1 Price / Earnings (GAAP) 25.5x 18.2x 15.2xPreferred Equity – Price / Earnings (Adjusted) 22.7x 17.1x 14.5xCash and Cash Equivalents 53.7 Total Debt / EBITDA 1.5x 1.2x 1.0xEnterprise Value $286.0
Price / Volume — Last Twelve Months
RigNet, Inc. provides remote communications services for the oil and gas industry. It offers remote communications services through a controlled and managed Internet protocol/multiprotocol label switching (IP/MPLS) global network, enabling drilling contractors, oil companies, and oilfield service companies to communicate. The company offers a communications package of voice, data, video, networking, and real-time data management to offshore and land-based remote locations. It primarily provides voice-over-Internet-protocol, data, and high-speed Internet access, as well as other value-added services, such as video conferencing solutions, TurboNet solutions for wide area network, real-time data management solutions, Wi-Fi hotspots and Internet kiosks, wireless intercoms, and handheld radios. The company also offers Secure Oil Information Link, a managed members-only communications network hub that enables collaborative partners, suppliers, and customers to transfer and share data. It serves the owners and operators of offshore drilling rigs and production facilities, land rigs, remote offices, and supply bases primarily in the United States, Brazil, Norway, the United Kingdom, Nigeria, Qatar, Saudi Arabia, Singapore, and Australia. The company was founded in 2000 and is headquartered in Houston, Texas.
-
100
200
300
400
500
600
700
800
900
1,000
–
$5.00
$10.00
$15.00
$20.00
$25.00
11/11 12/11 1/12 2/12 3/12 4/12 5/12 6/12 7/12 8/12 9/12 10/12 11/12
Volu
me (0
00s)
Price (
$U
SD
)
Volume Price
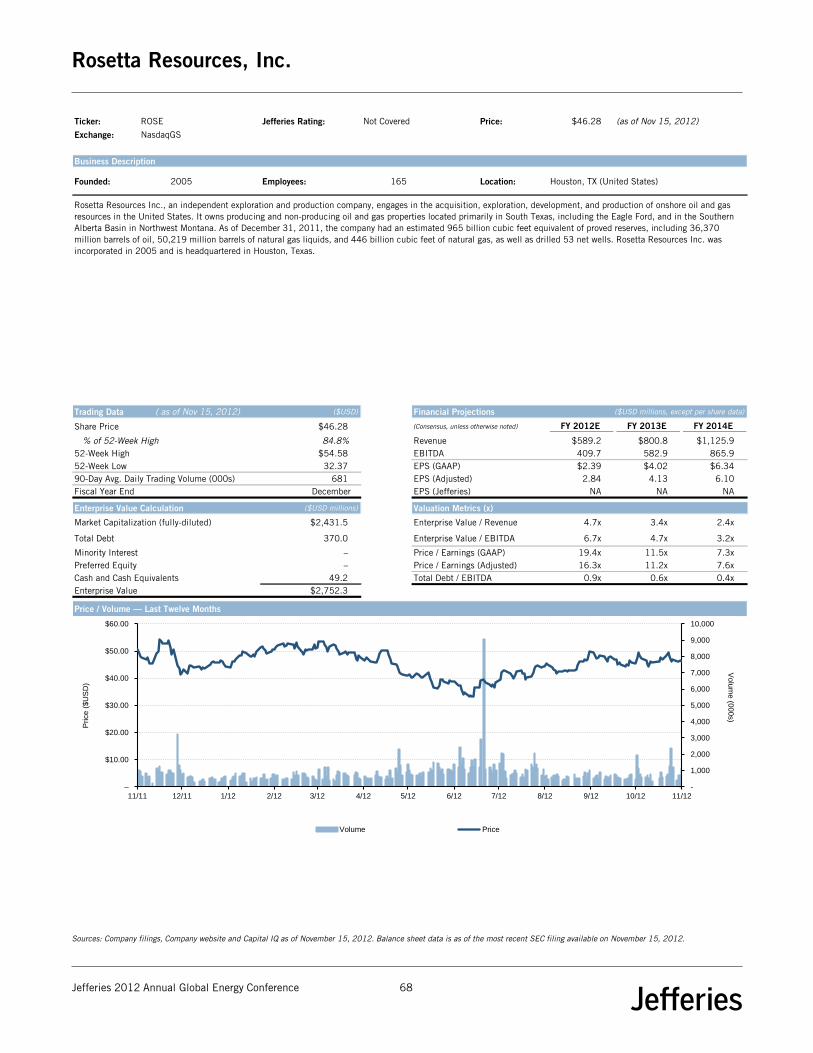
Rosetta Resources, Inc.
Jefferies 2012 Annual Global Energy Conference 68
Sources: Company filings, Company website and Capital IQ as of November 15, 2012. Balance sheet data is as of the most recent SEC filing available on November 15, 2012.
Ticker: ROSE Jefferies Rating: Not Covered Price: $46.28 (as of Nov 15, 2012) Price / Volume Graph
Exchange: NasdaqGS
Business Description
Founded: 2005 Employees: 165 Location: Houston, TX (United States)
Trading Data ( as of Nov 15, 2012) ($USD) Financial Projections ($USD millions, except per share data)
Share Price $46.28 (Consensus, unless otherwise noted) FY 2012E FY 2013E FY 2014E
% of 52-Week High 84.8% Revenue $589.2 $800.8 $1,125.952-Week High $54.58 EBITDA 409.7 582.9 865.952-Week Low 32.37 EPS (GAAP) $2.39 $4.02 $6.3490-Day Avg. Daily Trading Volume (000s) 681 EPS (Adjusted) 2.84 4.13 6.10Fiscal Year End December EPS (Jefferies) NA NA NA
Enterprise Value Calculation ($USD millions) Valuation Metrics (x)
Market Capitalization (fully-diluted) $2,431.5 Enterprise Value / Revenue 4.7x 3.4x 2.4x
Total Debt 370.0 Enterprise Value / EBITDA 6.7x 4.7x 3.2x
Minority Interest – Price / Earnings (GAAP) 19.4x 11.5x 7.3xPreferred Equity – Price / Earnings (Adjusted) 16.3x 11.2x 7.6xCash and Cash Equivalents 49.2 Total Debt / EBITDA 0.9x 0.6x 0.4xEnterprise Value $2,752.3
Price / Volume — Last Twelve Months
Rosetta Resources Inc., an independent exploration and production company, engages in the acquisition, exploration, development, and production of onshore oil and gas resources in the United States. It owns producing and non-producing oil and gas properties located primarily in South Texas, including the Eagle Ford, and in the Southern Alberta Basin in Northwest Montana. As of December 31, 2011, the company had an estimated 965 billion cubic feet equivalent of proved reserves, including 36,370 million barrels of oil, 50,219 million barrels of natural gas liquids, and 446 billion cubic feet of natural gas, as well as drilled 53 net wells. Rosetta Resources Inc. was incorporated in 2005 and is headquartered in Houston, Texas.
-
1,000
2,000
3,000
4,000
5,000
6,000
7,000
8,000
9,000
10,000
–
$10.00
$20.00
$30.00
$40.00
$50.00
$60.00
11/11 12/11 1/12 2/12 3/12 4/12 5/12 6/12 7/12 8/12 9/12 10/12 11/12
Volu
me (0
00s)
Price (
$U
SD
)
Volume Price

Rowan Companies plc
Jefferies 2012 Annual Global Energy Conference 69
Sources: Company filings, Company website and Capital IQ as of November 15, 2012. Balance sheet data is as of the most recent SEC filing available on November 15, 2012.
Ticker: RDC Jefferies Rating: Hold Price: $31.31 (as of Nov 15, 2012) Price / Volume Graph
Exchange: NYSE Jefferies Analyst: Brad Handler Target Price: $36.00
Business Description
Founded: 1923 Employees: 2,719 Location: Houston, TX (United States)
Trading Data ( as of Nov 15, 2012) ($USD) Financial Projections ($USD millions, except per share data)
Share Price $31.31 (Consensus, unless otherwise noted) FY 2012E FY 2013E FY 2014E
% of 52-Week High 79.5% Revenue $1,407.0 $1,563.9 $2,010.352-Week High $39.40 EBITDA 562.8 670.9 981.152-Week Low 28.62 EPS (GAAP) $1.71 $2.67 $4.3490-Day Avg. Daily Trading Volume (000s) 1,535 EPS (Adjusted) 1.96 2.69 4.39Fiscal Year End December EPS (Jefferies) 1.99 2.40 3.30
Enterprise Value Calculation ($USD millions) Valuation Metrics (x)
Market Capitalization (fully-diluted) $3,888.5 Enterprise Value / Revenue 3.5x 3.2x 2.5x
Total Debt 1,393.2 Enterprise Value / EBITDA 8.8x 7.4x 5.0x
Minority Interest – Price / Earnings (GAAP) 18.3x 11.7x 7.2xPreferred Equity – Price / Earnings (Adjusted) 16.0x 11.6x 7.1xCash and Cash Equivalents 328.3 Total Debt / EBITDA 2.5x 2.1x 1.4xEnterprise Value $4,953.4
Price / Volume — Last Twelve Months
Rowan Companies plc, through its subsidiaries, provides offshore oil and gas contract drilling services in the United States and internationally. It primarily focuses on high-specification and premium jack-up rigs for the exploratory and development drilling, as well as well workover operations. As of April 25, 2012, the company provided its contract drilling services through a fleet of 31 self-elevating mobile offshore jack-up rigs, including 11 in the Middle East, 9 in the United States Gulf of Mexico, 6 in the North Sea, 2 in Trinidad, and 1 each in Malaysia and Vietnam. The company was formerly known as Rowan Companies, Inc. and changed its name to Rowan Companies plc on May 4, 2012. Rowan Companies plc was founded in 1923 and is headquartered in Houston, Texas.
-
1,000
2,000
3,000
4,000
5,000
6,000
7,000
8,000
9,000
–
$5.00
$10.00
$15.00
$20.00
$25.00
$30.00
$35.00
$40.00
$45.00
11/11 12/11 1/12 2/12 3/12 4/12 5/12 6/12 7/12 8/12 9/12 10/12 11/12
Volu
me (0
00s)
Price (
$U
SD
)
Volume Price

Royal Dutch Shell plc
Jefferies 2012 Annual Global Energy Conference 70
Sources: Company filings, Company website and Capital IQ as of November 15, 2012. Balance sheet data is as of the most recent SEC filing available on November 15, 2012.
Ticker: RDSA Jefferies Rating: Buy Price: $32.93 (as of Nov 15, 2012) Price / Volume Graph
Exchange: LSE Jefferies Analyst: Iain Reid Target Price: $39.14
Business Description
Founded: NM Employees: 90,000 Location: The Hague, Netherlands
Trading Data ( as of Nov 15, 2012) ($USD) Financial Projections ($USD millions, except per share data)
Share Price $32.93 (Consensus, unless otherwise noted) FY 2012E FY 2013E FY 2014E
% of 52-Week High 73.8% Revenue $465,811.4 $448,109.0 $445,955.952-Week High $44.65 EBITDA 59,730.8 61,787.1 63,011.652-Week Low 31.04 EPS (GAAP) $4.18 $4.20 $4.2990-Day Avg. Daily Trading Volume (000s) 2,553 EPS (Adjusted) 4.23 4.33 4.41Fiscal Year End December EPS (Jefferies) 4.27 4.73 4.86
Enterprise Value Calculation ($USD millions) Valuation Metrics (x)
Market Capitalization (fully-diluted) $212,530.4 Enterprise Value / Revenue 0.5x 0.5x 0.5x
Total Debt 36,358.0 Enterprise Value / EBITDA 3.9x 3.7x 3.7x
Minority Interest 1,398.0 Price / Earnings (GAAP) 7.9x 7.8x 7.7xPreferred Equity – Price / Earnings (Adjusted) 7.8x 7.6x 7.5xCash and Cash Equivalents 18,839.0 Total Debt / EBITDA 0.6x 0.6x 0.6xEnterprise Value $231,447.4
Price / Volume — Last Twelve Months
Royal Dutch Shell plc operates as an oil and gas company worldwide. The company explores for and extracts crude oil and natural gas. It also converts natural gas to liquids to provide cleaner-burning fuels; markets and trades natural gas; extracts bitumen from mined oil sands and convert it to synthetic crude oil; and generates electricity from wind energy. In addition, it converts crude oil into a range of refined products, including gasoline, diesel, heating oil, aviation fuel, marine fuel, lubricants, bitumen, sulphur, and liquefied petroleum gas (LPG); and produces and sells petrochemicals for industrial use. The company holds interests in approximately 30 refineries; approximately 1,500 storage tanks and 150 distribution facilities; and fuels retail network of approximately 43,000 service stations under the Shell brand name. Royal Dutch Shell plc also markets its products under the Shell V-Power and Shell FuelSave brand names. In addition, the company offers lubricants to the passenger cars, trucks, and coaches, as well as for industrial machinery in manufacturing, mining, power generation, agriculture, and construction industries. Further, it sells fuels, specialty products, and services to commercial customers; offers fuel for approximately 7,000 aircraft every day at 800 airports in 30 countries; provides fuels, lubricants, and related technical services to the marine industry; offers liquefied petroleum gas and related services to retail, commercial, and industrial customers for cooking, heating, lighting, and transport applications; provides transport, industrial, and heating fuels; and supplies approximately 11,000 tonnes of bitumen products. Additionally, the company produces a range of base chemicals, including ethylene, propylene, and aromatics; and intermediate chemicals, such as styrene monomer, propylene oxide, solvents, detergent alcohols, ethylene oxide, and ethylene glycol. Royal Dutch Shell plc is headquartered in The Hague, the Netherlands.
-
2,000
4,000
6,000
8,000
10,000
12,000
14,000
16,000
18,000
–
$5.00
$10.00
$15.00
$20.00
$25.00
$30.00
$35.00
$40.00
11/11 12/11 1/12 2/12 3/12 4/12 5/12 6/12 7/12 8/12 9/12 10/12 11/12
Volu
me (0
00s)
Price (
$U
SD
)
Volume Price

Salamander Energy plc
Jefferies 2012 Annual Global Energy Conference 71
Sources: Company filings, Company website and Capital IQ as of November 15, 2012. Balance sheet data is as of the most recent SEC filing available on November 15, 2012.
Ticker: SMDR Jefferies Rating: Not Covered Price: $2.87 (as of Nov 15, 2012) Price / Volume Graph
Exchange: LSE
Business Description
Founded: 2005 Employees: 212 Location: London, United Kingdom
Trading Data ( as of Nov 15, 2012) ($USD) Financial Projections ($USD millions, except per share data)
Share Price $2.87 (Consensus, unless otherwise noted) FY 2012E FY 2013E FY 2014E
% of 52-Week High 68.6% Revenue $344.9 $505.6 $545.152-Week High $4.18 EBITDA 173.2 338.6 384.252-Week Low 2.47 EPS (GAAP) ($0.13) $0.32 $0.3990-Day Avg. Daily Trading Volume (000s) 541 EPS (Adjusted) (0.14) 0.34 0.36Fiscal Year End December EPS (Jefferies) NA NA NA
Enterprise Value Calculation ($USD millions) Valuation Metrics (x)
Market Capitalization (fully-diluted) $736.7 Enterprise Value / Revenue 2.3x 1.6x 1.5x
Total Debt 270.5 Enterprise Value / EBITDA 4.6x 2.4x 2.1x
Minority Interest – Price / Earnings (GAAP) NM 9.0x 7.3xPreferred Equity – Price / Earnings (Adjusted) NM 8.6x 7.9xCash and Cash Equivalents 204.0 Total Debt / EBITDA 1.6x 0.8x 0.7xEnterprise Value $803.2
Price / Volume — Last Twelve Months
Salamander Energy plc engages in the exploration, development, and production of oil and natural gas assets in Asia. It has operations in Thailand, Indonesia, the Philippines, Lao PDR, and Vietnam. As of December 31, 2011, the company had proved and probable reserves of approximately 75.3 million barrels of oil equivalent. Salamander Energy plc was founded in 2005 and is headquartered in London, the United Kingdom.
-
1,000
2,000
3,000
4,000
5,000
6,000
–
$0.50
$1.00
$1.50
$2.00
$2.50
$3.00
$3.50
$4.00
$4.50
11/11 12/11 1/12 2/12 3/12 4/12 5/12 6/12 7/12 8/12 9/12 10/12 11/12
Volu
me (0
00s)
Price (
$U
SD
)
Volume Price

Siemens AG
Jefferies 2012 Annual Global Energy Conference 72
Sources: Company filings, Company website and Capital IQ as of November 15, 2012. Balance sheet data is as of the most recent SEC filing available on November 15, 2012.
Ticker: SIE Jefferies Rating: Buy Price: $98.34 (as of Nov 15, 2012) Price / Volume Graph
Exchange: DB Jefferies Analyst: Lavina Quadros Target Price: $17.59
Business Description
Founded: 1847 Employees: 370,000 Location: Munich, Germany
Trading Data ( as of Nov 15, 2012) ($USD) Financial Projections ($USD millions, except per share data)
Share Price $98.34 (Consensus, unless otherwise noted) FY 2012E FY 2013E FY 2014E
% of 52-Week High NA Revenue $101,698.5 $105,108.1 $108,682.952-Week High $105.51 EBITDA 13,057.1 14,639.7 16,022.952-Week Low 79.49 EPS (GAAP) $7.84 $9.20 $10.1890-Day Avg. Daily Trading Volume (000s) 15 EPS (Adjusted) 8.09 9.42 10.40Fiscal Year End September EPS (Jefferies) 0.50 0.55 0.60
Enterprise Value Calculation ($USD millions) Valuation Metrics (x)
Market Capitalization (fully-diluted) $84,209.3 Enterprise Value / Revenue 0.9x 0.9x 0.9x
Total Debt 26,592.2 Enterprise Value / EBITDA 7.1x 6.4x 5.8x
Minority Interest 730.8 Price / Earnings (GAAP) 12.5x 10.7x 9.7xPreferred Equity – Price / Earnings (Adjusted) 12.2x 10.4x 9.5xCash and Cash Equivalents 18,385.7 Total Debt / EBITDA 2.0x 1.8x 1.7xEnterprise Value $93,146.6
Price / Volume — Last Twelve Months
Siemens Aktiengesellschaft, an electronics and electrical engineering company, operates in the industry, energy, healthcare, and infrastructure and cities sectors worldwide. In the industry sector, the company’s portfolio includes industry automation and drives products and services, and system integration and solutions for plant business. It offers various products, services, and solutions for the efficient use of resources and energy, and for productivity in industry and infrastructure areas. In the energy sector, the company offers products, services, and solutions for the generation and transmission of power; and for the extraction, conversion, and transport of oil and gas. In the healthcare sector, it develops, manufactures, and markets diagnostic and therapeutic systems, devices, and consumables, as well as information technology systems for clinical and administrative purposes. The company also provides technical maintenance, professional, consulting, and financing services in the healthcare sector. In the infrastructure and cities sector, it offers building and mobility solutions and services; and solutions in the area of power distribution, including smart grid applications. In addition, the company is involved in the commercial finance, treasury, financing and investment management, and project and export finance activities. Further, it offers insurance solutions, such as claims management; acts as a broker of company-financed insurances; owns and manages real estate portfolio; and offers services related to real estate development, real estate disposal and asset management, and lease and services management. Additionally, the company has equity investments in telecommunications infrastructure supply and household appliance companies, as well as in a company that provides open communications, network, and security solutions. Siemens Aktiengesellschaft was founded in 1847 and is headquartered in Munich, Germany.
-
20
40
60
80
100
120
140
160
–
$20.00
$40.00
$60.00
$80.00
$100.00
$120.00
11/11 12/11 1/12 2/12 3/12 4/12 5/12 6/12 7/12 8/12 9/12 10/12
Volu
me (0
00s)
Price (
$U
SD
)
Volume Price

SOCO International plc
Jefferies 2012 Annual Global Energy Conference 73
Sources: Company filings, Company website and Capital IQ as of November 15, 2012. Balance sheet data is as of the most recent SEC filing available on November 15, 2012.
Ticker: SIA Jefferies Rating: Hold Price: $5.59 (as of Nov 15, 2012) Price / Volume Graph
Exchange: LSE Jefferies Analyst: Laura Loppacher Target Price: $4.87
Business Description
Founded: 1997 Employees: 14 Location: London, United Kingdom
Trading Data ( as of Nov 15, 2012) ($USD) Financial Projections ($USD millions, except per share data)
Share Price $5.59 (Consensus, unless otherwise noted) FY 2012E FY 2013E FY 2014E
% of 52-Week High 93.9% Revenue $585.2 $688.1 $700.652-Week High $5.95 EBITDA 502.1 587.7 576.652-Week Low 4.01 EPS (GAAP) $0.68 $0.75 $0.7290-Day Avg. Daily Trading Volume (000s) 349 EPS (Adjusted) 0.73 0.87 0.82Fiscal Year End December EPS (Jefferies) 0.41 0.46 NA
Enterprise Value Calculation ($USD millions) Valuation Metrics (x)
Market Capitalization (fully-diluted) $1,853.6 Enterprise Value / Revenue 2.9x 2.4x 2.4x
Total Debt 46.4 Enterprise Value / EBITDA 3.3x 2.9x 2.9x
Minority Interest – Price / Earnings (GAAP) 8.2x 7.4x 7.7xPreferred Equity – Price / Earnings (Adjusted) 7.6x 6.4x 6.8xCash and Cash Equivalents 224.4 Total Debt / EBITDA 0.1x 0.1x 0.1xEnterprise Value $1,675.6
Price / Volume — Last Twelve Months
SOCO International plc engages in the exploration and production of oil and gas properties. It has interests in oil and gas properties located in Vietnam, the Republic of Congo, the Democratic Republic of Congo, and Angola. SOCO International plc was founded in 1997 and is headquartered in London, the United Kingdom.
-
1,000
2,000
3,000
4,000
5,000
6,000
–
$1.00
$2.00
$3.00
$4.00
$5.00
$6.00
$7.00
11/11 12/11 1/12 2/12 3/12 4/12 5/12 6/12 7/12 8/12 9/12 10/12 11/12
Volu
me (0
00s)
Price (
$U
SD
)
Volume Price

Southwestern Energy Co.
Jefferies 2012 Annual Global Energy Conference 74
Sources: Company filings, Company website and Capital IQ as of November 15, 2012. Balance sheet data is as of the most recent SEC filing available on November 15, 2012.
Ticker: SWN Jefferies Rating: Hold Price: $34.39 (as of Nov 15, 2012) Price / Volume Graph
Exchange: NYSE Jefferies Analyst: Biju Z Perincheril Target Price: $29.00
Business Description
Founded: 1929 Employees: 2,287 Location: Houston, TX (United States)
Trading Data ( as of Nov 15, 2012) ($USD) Financial Projections ($USD millions, except per share data)
Share Price $34.39 (Consensus, unless otherwise noted) FY 2012E FY 2013E FY 2014E
% of 52-Week High 85.2% Revenue $1,950.3 $2,376.5 $2,992.652-Week High $40.38 EBITDA 1,592.3 1,907.4 2,212.452-Week Low 25.63 EPS (GAAP) ($1.08) $1.69 $1.8790-Day Avg. Daily Trading Volume (000s) 4,013 EPS (Adjusted) 1.33 1.70 1.87Fiscal Year End December EPS (Jefferies) 1.30 1.57 NA
Enterprise Value Calculation ($USD millions) Valuation Metrics (x)
Market Capitalization (fully-diluted) $12,017.0 Enterprise Value / Revenue 7.0x 5.8x 4.6x
Total Debt 1,695.3 Enterprise Value / EBITDA 8.6x 7.2x 6.2x
Minority Interest – Price / Earnings (GAAP) NM 20.3x 18.4xPreferred Equity – Price / Earnings (Adjusted) 25.9x 20.3x 18.4xCash and Cash Equivalents 18.6 Total Debt / EBITDA 1.1x 0.9x 0.8xEnterprise Value $13,693.8
Price / Volume — Last Twelve Months
Southwestern Energy Company, an independent energy company, engages in the exploration, development, and production of natural gas and oil primarily in the United States. The company operates through two segments, Exploration and Production, and Midstream Services. The Exploration and Production segment is involved in exploration and production activities in the Marcellus Shale play in Pennsylvania, as well as in Texas, Arkansas, and Oklahoma; and focuses on the Fayetteville Shale, an unconventional reservoir located in the Arkoma Basin in Arkansas. It also engages in exploration activities in the Brown Dense formation in Arkansas and Louisiana; and New Brunswick, Canada, as well as operates drilling rigs in Arkansas, Pennsylvania, and Louisiana. The Midstream Services segment is involved in natural gas gathering and marketing activities in Arkansas, Texas, and Pennsylvania. As of December 31, 2011, its net proved reserves were approximately 143.0 billion cubic feet of natural gas equivalent. Southwestern Energy Company was founded in 1929 and is based in Houston, Texas.
-
5,000
10,000
15,000
20,000
25,000
30,000
–
$5.00
$10.00
$15.00
$20.00
$25.00
$30.00
$35.00
$40.00
$45.00
11/11 12/11 1/12 2/12 3/12 4/12 5/12 6/12 7/12 8/12 9/12 10/12 11/12
Volu
me (0
00s)
Price (
$U
SD
)
Volume Price

Statoil ASA
Jefferies 2012 Annual Global Energy Conference 75
Sources: Company filings, Company website and Capital IQ as of November 15, 2012. Balance sheet data is as of the most recent SEC filing available on November 15, 2012.
Ticker: STL Jefferies Rating: Buy Price: $23.90 (as of Nov 15, 2012) Price / Volume Graph
Exchange: OB Jefferies Analyst: Brendan Warn Target Price: $34.86
Business Description
Founded: 1972 Employees: 31,715 Location: Stavanger, Norway
Trading Data ( as of Nov 15, 2012) ($USD) Financial Projections ($USD millions, except per share data)
Share Price $23.90 (Consensus, unless otherwise noted) FY 2012E FY 2013E FY 2014E
% of 52-Week High 84.4% Revenue $124,249.0 $113,051.7 $116,394.652-Week High $28.32 EBITDA 45,588.8 42,421.3 42,495.752-Week Low 23.17 EPS (GAAP) $3.67 $2.93 $2.9890-Day Avg. Daily Trading Volume (000s) 2,971 EPS (Adjusted) 3.01 2.94 3.02Fiscal Year End December EPS (Jefferies) 3.09 3.03 NA
Enterprise Value Calculation ($USD millions) Valuation Metrics (x)
Market Capitalization (fully-diluted) $76,011.0 Enterprise Value / Revenue 0.7x 0.7x 0.7x
Total Debt 19,577.4 Enterprise Value / EBITDA 1.8x 1.9x 1.9x
Minority Interest 136.9 Price / Earnings (GAAP) 6.5x 8.2x 8.0xPreferred Equity – Price / Earnings (Adjusted) 7.9x 8.1x 7.9xCash and Cash Equivalents 14,715.8 Total Debt / EBITDA 0.4x 0.5x 0.5xEnterprise Value $81,009.5
Price / Volume — Last Twelve Months
Statoil ASA, an integrated energy company, engages in the exploration, production, transportation, refining, and marketing of petroleum and petroleum-derived products in Norway and internationally. The company is involved in the exploration, development, and production of crude oil and natural gas, as well as extraction of natural gas liquids. It also transports and markets natural gas and natural gas products; and engages in petroleum refining operations, as well as marketing crude oil and refined petroleum products. In addition, Statoil ASA engages in the retail sale of stationary energy primarily heating oil, kerosene, liquefied petroleum gas, and heavy fuel for industrial purposes; marine fuel comprising marine gasoil and heavy fuel; and aviation fuel, lubricants, and chemicals. Further, it builds and operates offshore wind farms in the United Kingdom off the Norfolk coast. As of December 31, 2011, the company had proved reserves of 5,426 million barrels-of-oil equivalent, including 2,276 million barrels of oil and 3,150 billion cubic meters of natural gas. It also had a network of 2,305 fuel stations comprising 1,739 fuel stations located in Denmark, Norway, and Sweden; and 566 in Poland, Latvia, Lithuania, Estonia, and Russia. The company was formerly known as StatoilHydro ASA and changed its name to Statoil ASA in November 2009. Statoil ASA was founded in 1972 and is based in Stavanger, Norway.
-
2,000
4,000
6,000
8,000
10,000
12,000
14,000
–
$5.00
$10.00
$15.00
$20.00
$25.00
$30.00
$35.00
11/11 12/11 1/12 2/12 3/12 4/12 5/12 6/12 7/12 8/12 9/12 10/12
Volu
me (0
00s)
Price (
$U
SD
)
Volume Price

Stone Energy Corp.
Jefferies 2012 Annual Global Energy Conference 76
Sources: Company filings, Company website and Capital IQ as of November 15, 2012. Balance sheet data is as of the most recent SEC filing available on November 15, 2012.
Ticker: SGY Jefferies Rating: Not Covered Price: $20.65 (as of Nov 15, 2012) Price / Volume Graph
Exchange: NYSE
Business Description
Founded: 1993 Employees: 352 Location: Lafayette, LA (United States)
Trading Data ( as of Nov 15, 2012) ($USD) Financial Projections ($USD millions, except per share data)
Share Price $20.65 (Consensus, unless otherwise noted) FY 2012E FY 2013E FY 2014E
% of 52-Week High 58.2% Revenue $929.4 $952.4 $1,082.552-Week High $35.47 EBITDA 607.5 624.0 736.052-Week Low 20.09 EPS (GAAP) $2.80 $2.36 $2.8590-Day Avg. Daily Trading Volume (000s) 630 EPS (Adjusted) 2.87 2.47 2.85Fiscal Year End December EPS (Jefferies) NA NA NA
Enterprise Value Calculation ($USD millions) Valuation Metrics (x)
Market Capitalization (fully-diluted) $1,022.2 Enterprise Value / Revenue 1.8x 1.7x 1.5x
Total Debt 811.0 Enterprise Value / EBITDA 2.7x 2.7x 2.3x
Minority Interest – Price / Earnings (GAAP) 7.4x 8.7x 7.2xPreferred Equity – Price / Earnings (Adjusted) 7.2x 8.4x 7.2xCash and Cash Equivalents 176.2 Total Debt / EBITDA 1.3x 1.3x 1.1xEnterprise Value $1,657.1
Price / Volume — Last Twelve Months
Stone Energy Corporation, an independent oil and natural gas company, engages in the acquisition, exploration, exploitation, development, and operation of oil and gas properties in the Gulf of Mexico and the Appalachia region. As of December 31, 2011 it had estimated proved oil and natural gas reserves of approximately 602 billion cubic feet of gas equivalent. The company was founded in 1993 and is headquartered in Lafayette, Louisiana with additional offices in New Orleans, Louisiana; Houston, Texas; and Morgantown, West Virginia.
-
500
1,000
1,500
2,000
2,500
3,000
3,500
4,000
–
$5.00
$10.00
$15.00
$20.00
$25.00
$30.00
$35.00
$40.00
11/11 12/11 1/12 2/12 3/12 4/12 5/12 6/12 7/12 8/12 9/12 10/12 11/12
Volu
me (0
00s)
Price (
$U
SD
)
Volume Price

Superior Energy Services, Inc.
Jefferies 2012 Annual Global Energy Conference 77
Sources: Company filings, Company website and Capital IQ as of November 15, 2012. Balance sheet data is as of the most recent SEC filing available on November 15, 2012.
Ticker: SPN Jefferies Rating: Hold Price: $18.51 (as of Nov 15, 2012) Price / Volume Graph
Exchange: NYSE Jefferies Analyst: Brad Handler Target Price: $22.00
Business Description
Founded: 1991 Employees: 6,500 Location: Houston, TX (United States)
Trading Data ( as of Nov 15, 2012) ($USD) Financial Projections ($USD millions, except per share data)
Share Price $18.51 (Consensus, unless otherwise noted) FY 2012E FY 2013E FY 2014E
% of 52-Week High 58.1% Revenue $4,538.7 $4,769.0 $5,288.052-Week High $31.88 EBITDA 1,244.9 1,247.3 1,543.152-Week Low 17.54 EPS (GAAP) $2.42 $2.17 $3.5090-Day Avg. Daily Trading Volume (000s) 2,277 EPS (Adjusted) 2.58 2.22 3.07Fiscal Year End December EPS (Jefferies) 2.61 2.20 3.50
Enterprise Value Calculation ($USD millions) Valuation Metrics (x)
Market Capitalization (fully-diluted) $2,919.0 Enterprise Value / Revenue 1.1x 1.0x 0.9x
Total Debt 1,956.0 Enterprise Value / EBITDA 3.8x 3.8x 3.1x
Minority Interest – Price / Earnings (GAAP) 7.6x 8.5x 5.3xPreferred Equity – Price / Earnings (Adjusted) 7.2x 8.3x 6.0xCash and Cash Equivalents 99.4 Total Debt / EBITDA 1.6x 1.6x 1.3xEnterprise Value $4,775.6
Price / Volume — Last Twelve Months
Superior Energy Services, Inc. provides specialized oilfield services and equipments to serve the production and drilling-related needs of oil and gas companies. It operates through three segments: Subsea and Well Enhancement, Drilling Products and Services, and Marine. The Subsea and Well Enhancement segment provides integrated subsea services and engineering services, mechanical wireline, hydraulic workover and snubbing, well control, coiled tubing, electric line, pumping and stimulation, and wellbore evaluation services; well plug and abandonment services; stimulation and sand control equipment and services; and other oilfield services used to support drilling and production operations. This segment also engages in production handling arrangements; and the production and sale of oil and gas. The Drilling Products and Services segment rents and sells stabilizers, drill pipe, tubulars, and specialized equipment for use with onshore and offshore oil and gas well drilling, completion, production, and workover activities. It also provides on-site accommodations, and bolting and machining services. The Marine segment operates liftboats for production service activities, as well as for oil and gas production facility maintenance, construction operations, and platform removals. Superior Energy Services, Inc. sells its products and services in the United States, the Gulf of Mexico, and internationally. The company was founded in 1991 and is based in Houston, Texas.
-
5,000
10,000
15,000
20,000
25,000
–
$5.00
$10.00
$15.00
$20.00
$25.00
$30.00
$35.00
11/11 12/11 1/12 2/12 3/12 4/12 5/12 6/12 7/12 8/12 9/12 10/12 11/12
Volu
me (0
00s)
Price (
$U
SD
)
Volume Price

Swift Energy Co.
Jefferies 2012 Annual Global Energy Conference 78
Sources: Company filings, Company website and Capital IQ as of November 15, 2012. Balance sheet data is as of the most recent SEC filing available on November 15, 2012.
Ticker: SFY Jefferies Rating: Buy Price: $14.43 (as of Nov 15, 2012) Price / Volume Graph
Exchange: NYSE Jefferies Analyst: Biju Z Perincheril Target Price: $25.00
Business Description
Founded: 1979 Employees: 309 Location: Houston, TX (United States)
Trading Data ( as of Nov 15, 2012) ($USD) Financial Projections ($USD millions, except per share data)
Share Price $14.43 (Consensus, unless otherwise noted) FY 2012E FY 2013E FY 2014E
% of 52-Week High 40.5% Revenue $559.8 $683.8 $808.052-Week High $35.60 EBITDA 341.5 441.4 532.652-Week Low 14.02 EPS (GAAP) $0.52 $1.49 $2.3490-Day Avg. Daily Trading Volume (000s) 803 EPS (Adjusted) 0.52 1.54 2.34Fiscal Year End December EPS (Jefferies) 0.57 1.27 NA
Enterprise Value Calculation ($USD millions) Valuation Metrics (x)
Market Capitalization (fully-diluted) $619.4 Enterprise Value / Revenue 2.6x 2.1x 1.8x
Total Debt 822.7 Enterprise Value / EBITDA 4.2x 3.3x 2.7x
Minority Interest – Price / Earnings (GAAP) 27.7x 9.7x 6.2xPreferred Equity – Price / Earnings (Adjusted) 27.9x 9.4x 6.2xCash and Cash Equivalents 1.7 Total Debt / EBITDA 2.4x 1.9x 1.5xEnterprise Value $1,440.4
Price / Volume — Last Twelve Months
Swift Energy Company engages in acquiring, exploring, developing, and operating oil and natural gas properties. It focuses on oil and natural gas reserves in Texas, as well as onshore and in the inland waters of Louisiana. As of December 31, 2011, the company had estimated proved reserves of 159.6 million barrels of oil equivalent. Swift Energy Company was founded in 1979 and is headquartered in Houston, Texas.
-
500
1,000
1,500
2,000
2,500
–
$5.00
$10.00
$15.00
$20.00
$25.00
$30.00
$35.00
$40.00
11/11 12/11 1/12 2/12 3/12 4/12 5/12 6/12 7/12 8/12 9/12 10/12 11/12
Volu
me (0
00s)
Price (
$U
SD
)
Volume Price

Technip
Jefferies 2012 Annual Global Energy Conference 79
Sources: Company filings, Company website and Capital IQ as of November 15, 2012. Balance sheet data is as of the most recent SEC filing available on November 15, 2012.
Ticker: TEC Jefferies Rating: Not Covered Price: $105.62 (as of Nov 15, 2012) Price / Volume Graph
Exchange: ENXTPA
Business Description
Founded: 1958 Employees: 32,000 Location: Paris, France
Trading Data ( as of Nov 15, 2012) ($USD) Financial Projections ($USD millions, except per share data)
Share Price $105.62 (Consensus, unless otherwise noted) FY 2012E FY 2013E FY 2014E
% of 52-Week High 89.4% Revenue $10,299.4 $11,802.1 $13,414.452-Week High $118.11 EBITDA 1,290.6 1,607.8 1,928.052-Week Low 77.74 EPS (GAAP) $5.86 $7.60 $9.1590-Day Avg. Daily Trading Volume (000s) 379 EPS (Adjusted) 5.86 7.55 9.34Fiscal Year End December EPS (Jefferies) NA NA NA
Enterprise Value Calculation ($USD millions) Valuation Metrics (x)
Market Capitalization (fully-diluted) $11,649.4 Enterprise Value / Revenue 1.1x 1.0x 0.9x
Total Debt 2,701.9 Enterprise Value / EBITDA 8.9x 7.1x 5.9x
Minority Interest 16.7 Price / Earnings (GAAP) 18.0x 13.9x 11.5xPreferred Equity – Price / Earnings (Adjusted) 18.0x 14.0x 11.3xCash and Cash Equivalents 2,937.5 Total Debt / EBITDA 2.1x 1.7x 1.4xEnterprise Value $11,430.4
Price / Volume — Last Twelve Months
Technip provides project management, engineering, and construction services to the oil and gas industry. It operates in three segments: Subsea, Offshore, and Onshore. The Subsea segment engages in the design, engineering, manufacture, and installation of infrastructures and subsea pipe systems used in oil and gas production and transportation. It provides various services, such as delivery of subsea systems, pipelay and subsea construction, maintenance and repair of existing subsea infrastructures, and replacement or removal of subsea equipment. This segment also manufactures rigid and flexible subsea pipelines, as well as umbilicals. The Offshore segment designs, manufactures, and installs fixed and floating platforms that support surface facilities for drilling, producing, and processing oil and gas reserves located in offshore shallow fields and ultra-deep water fields; and installs topsides for fixed and floating platforms. The Onshore segment designs and builds facilities for the production, treatment, and transportation of oil and gas, petrochemicals, and other non-oil and gas activities, as well as infrastructures related to these activities. This segment designs, engineers, and constructs facilities for the development of onshore oil and gas fields, and renovates existing facilities by modernizing production equipment and control systems; pipeline systems for natural gas, crude oil, oil products, water, and liquid sulfur; natural gas treatment and liquification facilities; complex and single refinery units; hydrogen and synthesis gas production units; sulfur recovery units and storage units; ethylene production plants; petrochemical and fertilizers processing plants; biofuels and renewable energy projects; and mining and metal projects. Technip has operations in Europe, the Russian Federation, central Asia, Africa, the Middle East, the Asia-Pacific, and the Americas. The company was founded in 1958 and is headquartered in Paris, France.
-
500
1,000
1,500
2,000
2,500
–
$20.00
$40.00
$60.00
$80.00
$100.00
$120.00
$140.00
11/11 12/11 1/12 2/12 3/12 4/12 5/12 6/12 7/12 8/12 9/12 10/12
Volu
me (0
00s)
Price (
$U
SD
)
Volume Price

TETRA Technologies, Inc.
Jefferies 2012 Annual Global Energy Conference 80
Sources: Company filings, Company website and Capital IQ as of November 15, 2012. Balance sheet data is as of the most recent SEC filing available on November 15, 2012.
Ticker: TTI Jefferies Rating: Not Covered Price: $6.00 (as of Nov 15, 2012) Price / Volume Graph
Exchange: NYSE
Business Description
Founded: 1981 Employees: 3,125 Location: The Woodlands, TX (United States)
Trading Data ( as of Nov 15, 2012) ($USD) Financial Projections ($USD millions, except per share data)
Share Price $6.00 (Consensus, unless otherwise noted) FY 2012E FY 2013E FY 2014E
% of 52-Week High 56.3% Revenue $872.5 $981.7 $1,104.552-Week High $10.66 EBITDA 152.6 206.7 218.252-Week Low 5.35 EPS (GAAP) $0.48 $0.80 $1.1090-Day Avg. Daily Trading Volume (000s) 727 EPS (Adjusted) 0.60 0.86 1.03Fiscal Year End December EPS (Jefferies) NA NA NA
Enterprise Value Calculation ($USD millions) Valuation Metrics (x)
Market Capitalization (fully-diluted) $468.5 Enterprise Value / Revenue 1.0x 0.9x 0.8x
Total Debt 368.6 Enterprise Value / EBITDA 5.6x 4.2x 3.9x
Minority Interest 41.9 Price / Earnings (GAAP) 12.6x 7.5x 5.5xPreferred Equity – Price / Earnings (Adjusted) 10.1x 7.0x 5.8xCash and Cash Equivalents 20.9 Total Debt / EBITDA 2.4x 1.8x 1.7xEnterprise Value $858.1
Price / Volume — Last Twelve Months
TETRA Technologies, Inc. operates as a diversified oil and gas services company. The company operates in three divisions: Fluids, Production Enhancement, and Offshore. The Fluids Division manufactures and markets clear brine fluids, additives, and other associated products and services to the oil and gas industry for use in well drilling, completion, and workover operations in the United States, as well as in various countries in Latin America, Europe, Asia, the Middle East, and Africa; and markets liquid and dry calcium chloride products to non-energy markets. The Production Enhancement division offers production testing services in various oil and gas basins in the United States, as well as in Mexico, Brazil, northern Africa, and the Middle East; and wellhead compression-based production enhancement services in the onshore producing regions of the United States, as well as various onshore basins in Canada, Mexico, South America, Europe, and Asia. The Offshore division provides offshore services, including downhole and subsea oil and gas services, such as well plugging and abandonment, and wireline services; decommissioning and construction services utilizing heavy lift barges and various technologies for offshore oil and gas production platforms and pipelines; and conventional and saturated air diving services. It also engages in the exploration, development, and production of oil and gas properties in the offshore and onshore U.S. Gulf Coast region. This division provides its services to oil and gas companies and independent operators. The company was founded in 1981 and is headquartered in the Woodlands, Texas.
-
500
1,000
1,500
2,000
2,500
3,000
3,500
4,000
–
$2.00
$4.00
$6.00
$8.00
$10.00
$12.00
11/11 12/11 1/12 2/12 3/12 4/12 5/12 6/12 7/12 8/12 9/12 10/12 11/12
Volu
me (0
00s)
Price (
$U
SD
)
Volume Price

Tidewater Inc.
Jefferies 2012 Annual Global Energy Conference 81
Sources: Company filings, Company website and Capital IQ as of November 15, 2012. Balance sheet data is as of the most recent SEC filing available on November 15, 2012.
Ticker: TDW Jefferies Rating: Not Covered Price: $43.03 (as of Nov 15, 2012) Price / Volume Graph
Exchange: NYSE
Business Description
Founded: 1956 Employees: 7,650 Location: New Orleans, LA (United States)
Trading Data ( as of Nov 15, 2012) ($USD) Financial Projections ($USD millions, except per share data)
Share Price $43.03 (Consensus, unless otherwise noted) FY 2012E FY 2013E FY 2014E
% of 52-Week High 68.0% Revenue $1,232.1 $1,422.0 $1,514.652-Week High $63.27 EBITDA 337.4 484.9 544.952-Week Low 43.06 EPS (GAAP) $2.48 $4.96 $5.7490-Day Avg. Daily Trading Volume (000s) 448 EPS (Adjusted) 2.74 4.94 5.98Fiscal Year End March EPS (Jefferies) NA NA NA
Enterprise Value Calculation ($USD millions) Valuation Metrics (x)
Market Capitalization (fully-diluted) $2,184.2 Enterprise Value / Revenue 2.4x 2.1x 1.9x
Total Debt 890.0 Enterprise Value / EBITDA 8.7x 6.1x 5.4x
Minority Interest – Price / Earnings (GAAP) 17.4x 8.7x 7.5xPreferred Equity – Price / Earnings (Adjusted) 15.7x 8.7x 7.2xCash and Cash Equivalents 136.7 Total Debt / EBITDA 2.6x 1.8x 1.6xEnterprise Value $2,937.5
Price / Volume — Last Twelve Months
Tidewater Inc. provides offshore service vessels and marine support services through the operation of a fleet of marine service vessels. It provides services in support of offshore exploration, field development, and production, including towing of and anchor handling for mobile offshore drilling units; transporting supplies and personnel necessary to sustain drilling, workover, and production activities; offshore construction, ROV operations, and seismic support; and various specialized services, such as pipe and cable laying. The company operates and charters deepwater vessels, including platform supply vessels, and anchor handling towing supply vessels that are used in transporting supplies and equipment from shore bases to deepwater and intermediate water depth offshore drilling rigs, platforms, and other installations; towing-supply and supply vessels for use in intermediate and shallow waters; and crewboats and utility vessels for use in transporting personnel and supplies from shore bases to offshore drilling rigs, platforms, and other installations. It also operates offshore tugs used for towing floating drilling rigs; assisting in the docking of tankers; towing barges; assist in pipe laying, cable laying, and construction barges; and towing barges carrying various bulk cargoes and containerized cargo. In addition, the company operates inshore tugs for use within inland waters; and production, line-handling, and various other special purpose vessels. Further, it operates two shipyards that construct, modify, and repair vessels. As of March 31, 2012, the company had 342 vessels serving the offshore energy industry worldwide. Tidewater Inc. was founded in 1956 and is headquartered in New Orleans, Louisiana.
-
500
1,000
1,500
2,000
2,500
3,000
3,500
4,000
–
$10.00
$20.00
$30.00
$40.00
$50.00
$60.00
$70.00
11/11 12/11 1/12 2/12 3/12 4/12 5/12 6/12 7/12 8/12 9/12 10/12 11/12
Volu
me (0
00s)
Price (
$U
SD
)
Volume Price

Total SA
Jefferies 2012 Annual Global Energy Conference 82
Sources: Company filings, Company website and Capital IQ as of November 15, 2012. Balance sheet data is as of the most recent SEC filing available on November 15, 2012.
Ticker: FP Jefferies Rating: Buy Price: $47.87 (as of Nov 15, 2012) Price / Volume Graph
Exchange: ENXTPA Jefferies Analyst: Iain Reid Target Price: $61.39
Business Description
Founded: 1924 Employees: 96,000 Location: Paris, France
Trading Data ( as of Nov 15, 2012) ($USD) Financial Projections ($USD millions, except per share data)
Share Price $47.87 (Consensus, unless otherwise noted) FY 2012E FY 2013E FY 2014E
% of 52-Week High 87.1% Revenue $244,391.1 $240,259.4 $242,936.952-Week High $54.95 EBITDA 43,149.2 42,897.4 44,086.652-Week Low 42.74 EPS (GAAP) $6.68 $7.05 $7.0690-Day Avg. Daily Trading Volume (000s) 4,695 EPS (Adjusted) 6.98 7.03 7.08Fiscal Year End December EPS (Jefferies) 6.98 7.55 7.67
Enterprise Value Calculation ($USD millions) Valuation Metrics (x)
Market Capitalization (fully-diluted) $108,062.1 Enterprise Value / Revenue 0.5x 0.5x 0.5x
Total Debt 45,274.5 Enterprise Value / EBITDA 3.0x 3.1x 3.0x
Minority Interest 1,637.4 Price / Earnings (GAAP) 7.2x 6.8x 6.8xPreferred Equity – Price / Earnings (Adjusted) 6.9x 6.8x 6.8xCash and Cash Equivalents 23,834.8 Total Debt / EBITDA 1.0x 1.1x 1.0xEnterprise Value $131,139.3
Price / Volume — Last Twelve Months
TOTAL S.A., together with its subsidiaries, operates as an integrated oil and gas company worldwide. The company operates in three segments: Upstream, Downstream, and Chemicals. The Upstream segment engages in the exploration, development, and production of oil and gas, liquefied natural gas, and electricity; and shipping and trading liquefied petroleum gas (LPG), as well as power generation from renewable energies, and coal production, trading, and marketing. As of December 31, 2011, it had combined proved reserves of 11,423 million barrels of oil equivalent of oil and gas. The Downstream segment is involved in refining, marketing, trading, and shipping crude oil and petroleum products. This segment also produces and markets a range of specialty products, such as lubricants, LPG, jet fuel, special fluids, heavy fuel, bitumen, marine fuels, and petrochemical feedstock. This segment holds interests in 20 refineries located in Europe, the United States, the French West Indies, Africa, and China, as well as operates a network of 14,819 service stations. The Chemicals segment produces base chemicals, including petrochemicals and fertilizers; and specialty chemicals, such as elastomer processing, adhesives, and electroplating chemistry. This segment serves the automotive, construction, electronics, aerospace, and convenience goods markets. TOTAL S.A. was founded in 1924 and is headquartered in Paris, France.
-
5,000
10,000
15,000
20,000
25,000
30,000
35,000
–
$10.00
$20.00
$30.00
$40.00
$50.00
$60.00
11/11 12/11 1/12 2/12 3/12 4/12 5/12 6/12 7/12 8/12 9/12 10/12 11/12
Volu
me (0
00s)
Price (
$U
SD
)
Volume Price

Triangle Petroleum Corporation
Jefferies 2012 Annual Global Energy Conference 83
Sources: Company filings, Company website and Capital IQ as of November 15, 2012. Balance sheet data is as of the most recent SEC filing available on November 15, 2012.
Ticker: TPLM Jefferies Rating: Not Covered Price: $5.12 (as of Nov 15, 2012) Price / Volume Graph
Exchange: AMEX
Business Description
Founded: 2001 Employees: 32 Location: Denver, CO (United States)
Trading Data ( as of Nov 15, 2012) ($USD) Financial Projections ($USD millions, except per share data)
Share Price $5.12 (Consensus, unless otherwise noted) FY 2012E FY 2013E FY 2014E
% of 52-Week High 62.0% Revenue $66.9 $164.1 $236.852-Week High $8.26 EBITDA 28.7 87.6 123.052-Week Low 4.63 EPS (GAAP) $0.00 $0.57 $0.8890-Day Avg. Daily Trading Volume (000s) 427 EPS (Adjusted) 0.00 0.57 0.88Fiscal Year End January EPS (Jefferies) NA NA NA
Enterprise Value Calculation ($USD millions) Valuation Metrics (x)
Market Capitalization (fully-diluted) $226.9 Enterprise Value / Revenue 3.5x 1.4x 1.0x
Total Debt 120.0 Enterprise Value / EBITDA 8.2x 2.7x 1.9x
Minority Interest 3.3 Price / Earnings (GAAP) NM 9.0x 5.8xPreferred Equity – Price / Earnings (Adjusted) NM 9.0x 5.8xCash and Cash Equivalents 116.4 Total Debt / EBITDA 4.2x 1.4x 1.0xEnterprise Value $233.9
Price / Volume — Last Twelve Months
Triangle Petroleum Corporation engages in the acquisition, exploration, and development of unconventional shale oil resources in the Bakken Shale and Three Forks formations in the Williston Basin of North Dakota and Montana. The company primarily holds interests in approximately 83,000 net acres in McKenzie and Williams Counties of North Dakota, and Roosevelt and Sheridan Counties of Montana. It also holds an 87% working interest in approximately 412,924 net acres of oil and natural gas leases in the Windsor Sub-Basin of the Maritimes Basin located in Nova Scotia, Canada. The company was formerly known as Peloton Resources Inc. and changed its name to Triangle Petroleum Corporation in May 2005. Triangle Petroleum Corporation was incorporated in 2001 and is based in Denver, Colorado.
-
500
1,000
1,500
2,000
2,500
–
$1.00
$2.00
$3.00
$4.00
$5.00
$6.00
$7.00
$8.00
$9.00
11/11 12/11 1/12 2/12 3/12 4/12 5/12 6/12 7/12 8/12 9/12 10/12 11/12
Volu
me (0
00s)
Price (
$U
SD
)
Volume Price
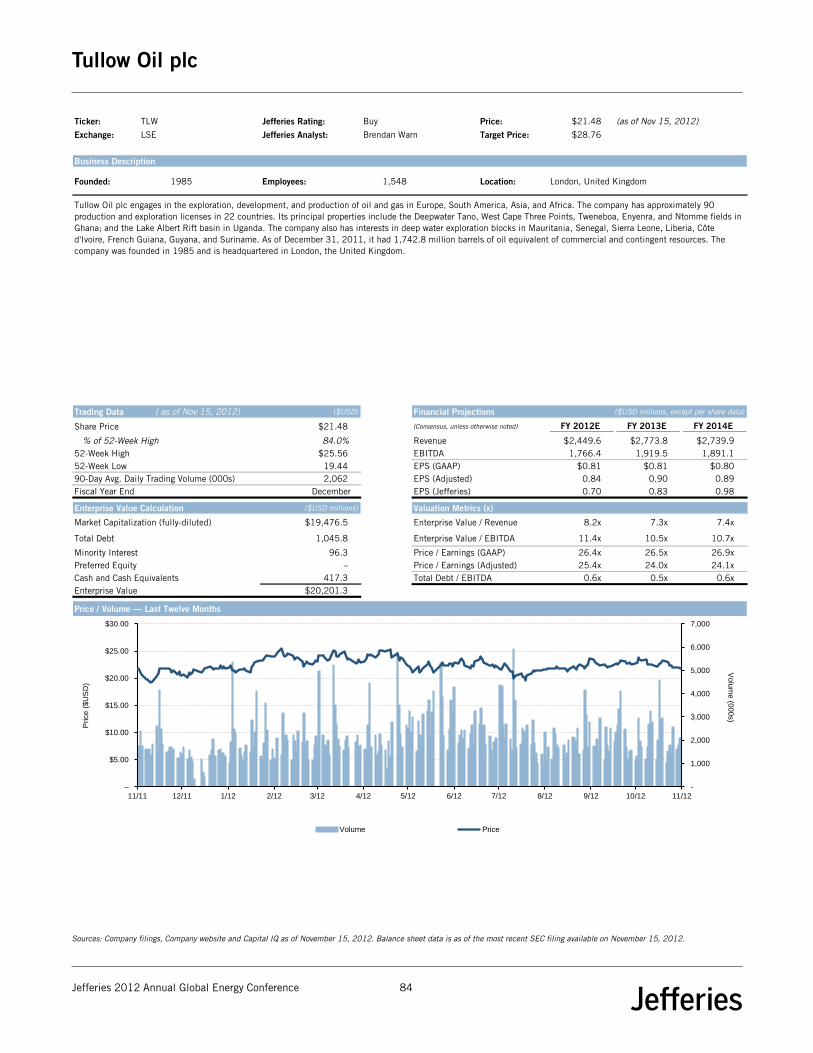
Tullow Oil plc
Jefferies 2012 Annual Global Energy Conference 84
Sources: Company filings, Company website and Capital IQ as of November 15, 2012. Balance sheet data is as of the most recent SEC filing available on November 15, 2012.
Ticker: TLW Jefferies Rating: Buy Price: $21.48 (as of Nov 15, 2012) Price / Volume Graph
Exchange: LSE Jefferies Analyst: Brendan Warn Target Price: $28.76
Business Description
Founded: 1985 Employees: 1,548 Location: London, United Kingdom
Trading Data ( as of Nov 15, 2012) ($USD) Financial Projections ($USD millions, except per share data)
Share Price $21.48 (Consensus, unless otherwise noted) FY 2012E FY 2013E FY 2014E
% of 52-Week High 84.0% Revenue $2,449.6 $2,773.8 $2,739.952-Week High $25.56 EBITDA 1,766.4 1,919.5 1,891.152-Week Low 19.44 EPS (GAAP) $0.81 $0.81 $0.8090-Day Avg. Daily Trading Volume (000s) 2,062 EPS (Adjusted) 0.84 0.90 0.89Fiscal Year End December EPS (Jefferies) 0.70 0.83 0.98
Enterprise Value Calculation ($USD millions) Valuation Metrics (x)
Market Capitalization (fully-diluted) $19,476.5 Enterprise Value / Revenue 8.2x 7.3x 7.4x
Total Debt 1,045.8 Enterprise Value / EBITDA 11.4x 10.5x 10.7x
Minority Interest 96.3 Price / Earnings (GAAP) 26.4x 26.5x 26.9xPreferred Equity – Price / Earnings (Adjusted) 25.4x 24.0x 24.1xCash and Cash Equivalents 417.3 Total Debt / EBITDA 0.6x 0.5x 0.6xEnterprise Value $20,201.3
Price / Volume — Last Twelve Months
Tullow Oil plc engages in the exploration, development, and production of oil and gas in Europe, South America, Asia, and Africa. The company has approximately 90 production and exploration licenses in 22 countries. Its principal properties include the Deepwater Tano, West Cape Three Points, Tweneboa, Enyenra, and Ntomme fields in Ghana; and the Lake Albert Rift basin in Uganda. The company also has interests in deep water exploration blocks in Mauritania, Senegal, Sierra Leone, Liberia, Côte d'Ivoire, French Guiana, Guyana, and Suriname. As of December 31, 2011, it had 1,742.8 million barrels of oil equivalent of commercial and contingent resources. The company was founded in 1985 and is headquartered in London, the United Kingdom.
-
1,000
2,000
3,000
4,000
5,000
6,000
7,000
–
$5.00
$10.00
$15.00
$20.00
$25.00
$30.00
11/11 12/11 1/12 2/12 3/12 4/12 5/12 6/12 7/12 8/12 9/12 10/12 11/12
Volu
me (0
00s)
Price (
$U
SD
)
Volume Price

U.S. Silica Holdings, Inc.
Jefferies 2012 Annual Global Energy Conference 85
Sources: Company filings, Company website and Capital IQ as of November 15, 2012. Balance sheet data is as of the most recent SEC filing available on November 15, 2012.
Ticker: SLCA Jefferies Rating: 0 Price: $15.45 (as of Nov 15, 2012) Price / Volume Graph
Exchange: NYSE Jefferies Analyst: 0 Target Price: –
Business Description
Founded: 2008 Employees: 701 Location: Frederick, MD (United States)
Trading Data ( as of Nov 15, 2012) ($USD) Financial Projections ($USD millions, except per share data)
Share Price $15.45 (Consensus, unless otherwise noted) FY 2012E FY 2013E FY 2014E
% of 52-Week High 69.8% Revenue $431.5 $519.0 $593.152-Week High $22.14 EBITDA 144.1 168.9 201.852-Week Low 9.02 EPS (GAAP) $1.40 $1.68 $2.2090-Day Avg. Daily Trading Volume (000s) 375 EPS (Adjusted) 1.39 1.65 2.16Fiscal Year End December EPS (Jefferies) – – –
Enterprise Value Calculation ($USD millions) Valuation Metrics (x)
Market Capitalization (fully-diluted) $816.5 Enterprise Value / Revenue 2.3x 1.9x 1.7x
Total Debt 266.5 Enterprise Value / EBITDA 6.9x 5.9x 4.9x
Minority Interest – Price / Earnings (GAAP) 11.0x 9.2x 7.0xPreferred Equity – Price / Earnings (Adjusted) 11.1x 9.3x 7.2xCash and Cash Equivalents 93.0 Total Debt / EBITDA 1.8x 1.6x 1.3xEnterprise Value $989.9
Price / Volume — Last Twelve Months
U.S. Silica Holdings, Inc. produces and sells various commercial silica and industrial mineral products. The company offers whole grain commercial silica products to be used as fracturing sand in connection with oil and natural gas recovery; the manufacturers of architectural and solar glass; and foundry and building products industry. It also provides ground commercial silica products for use in plastics, rubber, polishes, cleansers, paints, ceramic frits and glazes, textile fiberglass, and precision castings; and fine ground silica for use in premium paints, specialty coatings, sealants, silicone rubber, and epoxies. In addition, the company offers certain other industrial mineral products, such as aplite, a mineral used to produce container glass and insulation fiberglass, and is a source of alumina to form defects in glass; calcined kaolin clay, a mineral primarily used as a functional extender in paints, plastics, specialty coatings, and rubber; and magnesium silicate, as well as produce and sells an adsorbent made from a mixture of silica and magnesium for preparative and analytical chromatography applications. It serves oil and gas recovery, glass, building products, foundry products, chemicals, and fillers and extenders markets. As of December 31, 2011, it had approximately 316 million tons of estimated proven and probable recoverable mineral reserves. The company was formerly known as GGC USS Holdings, Inc. and changed its name to U.S. Silica Holdings, Inc. in July 2011. The company is headquartered in Frederick, Maryland. U.S. Silica Holdings, Inc. is a subsidiary of GGC USS Holdings, LLC.
-
2,000
4,000
6,000
8,000
10,000
12,000
14,000
–
$5.00
$10.00
$15.00
$20.00
$25.00
2/12 3/12 4/12 5/12 6/12 7/12 8/12 9/12 10/12 11/12
Volu
me (0
00s)
Price (
$U
SD
)
Volume Price

Vantage Drilling Company
Jefferies 2012 Annual Global Energy Conference 86
Sources: Company filings, Company website and Capital IQ as of November 15, 2012. Balance sheet data is as of the most recent SEC filing available on November 15, 2012.
Ticker: VTG Jefferies Rating: Hold Price: $1.65 (as of Nov 15, 2012) Price / Volume Graph
Exchange: AMEX Jefferies Analyst: Brad Handler Target Price: $2.00
Business Description
Founded: 2007 Employees: 980 Location: Houston, TX (United States)
Trading Data ( as of Nov 15, 2012) ($USD) Financial Projections ($USD millions, except per share data)
Share Price $1.65 (Consensus, unless otherwise noted) FY 2012E FY 2013E FY 2014E
% of 52-Week High 84.6% Revenue $464.2 $662.7 $842.152-Week High $1.95 EBITDA 231.7 364.9 457.252-Week Low 1.01 EPS (GAAP) ($0.64) $0.02 $0.4990-Day Avg. Daily Trading Volume (000s) 1,384 EPS (Adjusted) (0.06) 0.16 0.41Fiscal Year End December EPS (Jefferies) (0.02) 0.15 0.20
Enterprise Value Calculation ($USD millions) Valuation Metrics (x)
Market Capitalization (fully-diluted) $485.3 Enterprise Value / Revenue 5.5x 3.9x 3.0x
Total Debt 2,129.6 Enterprise Value / EBITDA 11.0x 7.0x 5.6x
Minority Interest – Price / Earnings (GAAP) NM NM 3.4xPreferred Equity – Price / Earnings (Adjusted) NM 10.6x 4.1xCash and Cash Equivalents 62.5 Total Debt / EBITDA 9.2x 5.8x 4.7xEnterprise Value $2,552.4
Price / Volume — Last Twelve Months
Vantage Drilling Company, through its subsidiaries, provides offshore contract drilling services to oil and natural gas companies in the United States and internationally. The company offers drilling units, related equipment, and work crews under contract to drill oil and natural gas wells. Its fleet of owned and managed drilling units comprises four jackup rigs and three drillships. The company also provides construction supervision services, as well as operates and manages drilling units owned by others. It primarily serves multinational oil and natural gas companies, government owned oil and natural gas companies, and independent oil and natural gas producers. Vantage Drilling Company was founded in 2007 and is based in Houston, Texas.
-
1,000
2,000
3,000
4,000
5,000
6,000
7,000
8,000
9,000
10,000
–
$0.50
$1.00
$1.50
$2.00
$2.50
11/11 12/11 1/12 2/12 3/12 4/12 5/12 6/12 7/12 8/12 9/12 10/12 11/12
Volu
me (0
00s)
Price (
$U
SD
)
Volume Price

W&T Offshore Inc.
Jefferies 2012 Annual Global Energy Conference 87
Sources: Company filings, Company website and Capital IQ as of November 15, 2012. Balance sheet data is as of the most recent SEC filing available on November 15, 2012.
Ticker: WTI Jefferies Rating: Hold Price: $15.54 (as of Nov 15, 2012) Price / Volume Graph
Exchange: NYSE Jefferies Analyst: Biju Z Perincheril Target Price: $22.00
Business Description
Founded: 1983 Employees: 310 Location: Houston, TX (United States)
Trading Data ( as of Nov 15, 2012) ($USD) Financial Projections ($USD millions, except per share data)
Share Price $15.54 (Consensus, unless otherwise noted) FY 2012E FY 2013E FY 2014E
% of 52-Week High 56.7% Revenue $879.7 $977.4 $1,014.852-Week High $27.40 EBITDA 524.4 593.0 651.552-Week Low 13.18 EPS (GAAP) $1.10 $1.18 $1.7990-Day Avg. Daily Trading Volume (000s) 539 EPS (Adjusted) 1.19 1.13 1.68Fiscal Year End December EPS (Jefferies) 1.11 1.07 NA
Enterprise Value Calculation ($USD millions) Valuation Metrics (x)
Market Capitalization (fully-diluted) $1,155.0 Enterprise Value / Revenue 2.1x 1.9x 1.8x
Total Debt 719.0 Enterprise Value / EBITDA 3.6x 3.1x 2.9x
Minority Interest – Price / Earnings (GAAP) 14.1x 13.2x 8.7xPreferred Equity – Price / Earnings (Adjusted) 13.0x 13.7x 9.2xCash and Cash Equivalents 7.0 Total Debt / EBITDA 1.4x 1.2x 1.1xEnterprise Value $1,867.1
Price / Volume — Last Twelve Months
W&T Offshore, Inc., an independent oil and natural gas producer, engages in the acquisition, exploration, and development of oil and natural gas properties primarily in the Gulf of Mexico. The company holds working interests in approximately 60 producing offshore fields in federal and state waters. As of December 31, 2011, it had interests in offshore leases covering approximately 0.8 million gross acres in the coasts of Louisiana, Texas, Mississippi and Alabama, as well as onshore leasehold interest in approximately 0.2 million gross acres in Texas; proved reserves of 116.9 million barrels of oil equivalent (MMBoe); and proved undeveloped reserves of 40.5 MMBoe. The company was founded in 1983 and is headquartered in Houston, Texas.
-
500
1,000
1,500
2,000
2,500
–
$5.00
$10.00
$15.00
$20.00
$25.00
$30.00
11/11 12/11 1/12 2/12 3/12 4/12 5/12 6/12 7/12 8/12 9/12 10/12 11/12
Volu
me (0
00s)
Price (
$U
SD
)
Volume Price

Walter Energy, Inc.
Jefferies 2012 Annual Global Energy Conference 88
Sources: Company filings, Company website and Capital IQ as of November 15, 2012. Balance sheet data is as of the most recent SEC filing available on November 15, 2012.
Ticker: WLT Jefferies Rating: Not Covered Price: $29.45 (as of Nov 15, 2012) Price / Volume Graph
Exchange: NYSE
Business Description
Founded: 1946 Employees: 4,200 Location: Birmingham, AL (United States)
Trading Data ( as of Nov 15, 2012) ($USD) Financial Projections ($USD millions, except per share data)
Share Price $29.45 (Consensus, unless otherwise noted) FY 2012E FY 2013E FY 2014E
% of 52-Week High 38.0% Revenue $2,553.1 $2,752.8 $3,080.552-Week High $77.58 EBITDA 463.0 578.2 785.552-Week Low 29.75 EPS (GAAP) ($16.54) $1.65 $4.4290-Day Avg. Daily Trading Volume (000s) 3,441 EPS (Adjusted) 0.91 1.82 4.31Fiscal Year End December EPS (Jefferies) NA NA NA
Enterprise Value Calculation ($USD millions) Valuation Metrics (x)
Market Capitalization (fully-diluted) $1,841.1 Enterprise Value / Revenue 1.6x 1.5x 1.3x
Total Debt 2,354.9 Enterprise Value / EBITDA 8.8x 7.0x 5.2x
Minority Interest – Price / Earnings (GAAP) NM 17.8x 6.7xPreferred Equity – Price / Earnings (Adjusted) 32.5x 16.2x 6.8xCash and Cash Equivalents 129.9 Total Debt / EBITDA 5.1x 4.1x 3.0xEnterprise Value $4,066.1
Price / Volume — Last Twelve Months
Walter Energy, Inc. produces and exports metallurgical coal for the steel industry primarily in the United States. The company also produces thermal and industrial coal, anthracite, metallurgical coke, coal bed methane gas, and other related products. It principally serves electric utility and industrial customers. The company was formerly known as Walter Industries, Inc. and changed its name to Walter Energy, Inc. in April 2009. Walter Energy, Inc. was founded in 1946 and is headquartered in Birmingham, Alabama.
-
2,000
4,000
6,000
8,000
10,000
12,000
–
$10.00
$20.00
$30.00
$40.00
$50.00
$60.00
$70.00
$80.00
$90.00
11/11 12/11 1/12 2/12 3/12 4/12 5/12 6/12 7/12 8/12 9/12 10/12 11/12
Volu
me (0
00s)
Price (
$U
SD
)
Volume Price

Willbros Group Inc.
Jefferies 2012 Annual Global Energy Conference 89
Sources: Company filings, Company website and Capital IQ as of November 15, 2012. Balance sheet data is as of the most recent SEC filing available on November 15, 2012.
Ticker: WG Jefferies Rating: Not Covered Price: $4.21 (as of Nov 15, 2012) Price / Volume Graph
Exchange: NYSE
Business Description
Founded: 1908 Employees: 8,810 Location: Houston, TX (United States)
Trading Data ( as of Nov 15, 2012) ($USD) Financial Projections ($USD millions, except per share data)
Share Price $4.21 (Consensus, unless otherwise noted) FY 2012E FY 2013E FY 2014E
% of 52-Week High 57.2% Revenue $1,998.3 $2,098.2 $2,278.052-Week High $7.36 EBITDA 66.4 114.9 134.352-Week Low 3.13 EPS (GAAP) ($0.40) $0.42 $0.6090-Day Avg. Daily Trading Volume (000s) 238 EPS (Adjusted) (0.46) 0.50 0.83Fiscal Year End December EPS (Jefferies) NA NA NA
Enterprise Value Calculation ($USD millions) Valuation Metrics (x)
Market Capitalization (fully-diluted) $206.7 Enterprise Value / Revenue 0.2x 0.2x 0.2x
Total Debt 258.9 Enterprise Value / EBITDA 6.8x 3.9x 3.4x
Minority Interest 1.0 Price / Earnings (GAAP) NM 9.9x 7.0xPreferred Equity – Price / Earnings (Adjusted) NM 8.4x 5.1xCash and Cash Equivalents 15.9 Total Debt / EBITDA 3.9x 2.3x 1.9xEnterprise Value $450.6
Price / Volume — Last Twelve Months
Willbros Group, Inc. provides engineering, procurement, and construction (EPC) services to the oil, gas, refinery, petrochemical, and power industries primarily in the United States, Canada, and Oman. Its Upstream Oil & Gas segment designs, constructs, and maintains hydrocarbon transportation systems; constructs facilities, such as pump stations, flow stations, gas processing facilities, gas compressor stations, and metering stations; and constructs pipelines. This segment also provides program development, project management, design, engineering, geographic information systems, integrity, and maintenance services for pipeline systems; and fabricates process modules, station headers, valve stations, and flare pipes and tips. The Downstream Oil & Gas segment offers specialty construction, turnaround, repair, and maintenance services, including EPC services to the downstream energy infrastructure market, which consists of integrated oil companies, independent refineries, product terminals, and petrochemical companies. This segment also provides tank services for construction, maintenance, or repair of petroleum storage tanks; and EPC services through program management and EPC project services. Its Utility T&D segment offers a range of services in electric power and natural gas transmission and distribution, such as maintenance and construction, repair, and restoration of utility infrastructure. Willbros Group, Inc. was founded in 1908 and is headquartered in Houston, Texas.
-
500
1,000
1,500
2,000
2,500
3,000
3,500
–
$1.00
$2.00
$3.00
$4.00
$5.00
$6.00
$7.00
$8.00
11/11 12/11 1/12 2/12 3/12 4/12 5/12 6/12 7/12 8/12 9/12 10/12 11/12
Volu
me (0
00s)
Price (
$U
SD
)
Volume Price

Williams Companies, Inc.
Jefferies 2012 Annual Global Energy Conference 90
Sources: Company filings, Company website and Capital IQ as of November 15, 2012. Balance sheet data is as of the most recent SEC filing available on November 15, 2012.
Ticker: WMB Jefferies Rating: Not Covered Price: $30.97 (as of Nov 15, 2012) Price / Volume Graph
Exchange: NYSE
Business Description
Founded: 1908 Employees: 4,293 Location: Tulsa, OK (United States)
Trading Data ( as of Nov 15, 2012) ($USD) Financial Projections ($USD millions, except per share data)
Share Price $30.97 (Consensus, unless otherwise noted) FY 2012E FY 2013E FY 2014E
% of 52-Week High 82.5% Revenue $7,529.3 $8,134.7 $8,322.552-Week High $37.56 EBITDA 2,575.9 2,939.4 3,417.852-Week Low 26.21 EPS (GAAP) $1.43 $1.22 $1.4590-Day Avg. Daily Trading Volume (000s) 5,840 EPS (Adjusted) 1.15 1.23 1.73Fiscal Year End December EPS (Jefferies) NA NA NA
Enterprise Value Calculation ($USD millions) Valuation Metrics (x)
Market Capitalization (fully-diluted) $19,428.3 Enterprise Value / Revenue 4.2x 3.9x 3.8x
Total Debt 9,514.0 Enterprise Value / EBITDA 12.2x 10.7x 9.2x
Minority Interest 2,899.0 Price / Earnings (GAAP) 21.6x 25.4x 21.4xPreferred Equity – Price / Earnings (Adjusted) 26.8x 25.1x 17.9xCash and Cash Equivalents 431.0 Total Debt / EBITDA 3.7x 3.2x 2.8xEnterprise Value $31,410.3
Price / Volume — Last Twelve Months
The Williams Companies, Inc. operates as an energy infrastructure company in the United States. The company’s Williams Partners segment owns and operates natural gas pipeline system extending from Texas, Louisiana, Mississippi, and the offshore Gulf of Mexico through Alabama, Georgia, South Carolina, North Carolina, Virginia, Maryland, Pennsylvania, and New Jersey to the New York City metropolitan area. It also owns and operates mainline and lateral transmission pipelines extending from the San Juan basin in northwestern New Mexico and southwestern Colorado through Colorado, Utah, Wyoming, Idaho, Oregon, and Washington to a point on the Canadian border near Sumas, Washington. In addition, this segment engages in the production, fractionation, storage, marketing, and transportation of natural gas liquids; gathering, treatment, and processing of natural gas; and offers deepwater production handling and crude oil transportation services. It transports and stores natural gas for local natural gas distribution companies, municipal utilities, direct industrial users, electric power generators, and natural gas marketers and producers. The company’s Midstream Canada & Olefins segment is involved in gathering, treatment, and processing of natural gas; fractionation, storage, and transportation of natural gas liquids; and oil transportation. This segment produces natural gas liquids, such as propane, normal butane, isobutane/butylene, and condensate; ethylene, propylene; and other co-products to a range of customers in the energy and petrochemical industries. As of July 19, 2012, the company owned interests in or operated 15,000 miles of interstate gas pipelines; 1,000 miles of NGL transportation pipelines; and approximately 10,000 miles of oil and gas gathering pipelines. The Williams Companies, Inc. was founded in 1908 and is headquartered in Tulsa, Oklahoma.
-
5,000
10,000
15,000
20,000
25,000
–
$5.00
$10.00
$15.00
$20.00
$25.00
$30.00
$35.00
$40.00
11/11 12/11 1/12 2/12 3/12 4/12 5/12 6/12 7/12 8/12 9/12 10/12 11/12
Volu
me (0
00s)
Price (
$U
SD
)
Volume Price

ZaZa Energy Corporation
Jefferies 2012 Annual Global Energy Conference 91
Sources: Company filings, Company website and Capital IQ as of November 15, 2012. Balance sheet data is as of the most recent SEC filing available on November 15, 2012.
Ticker: ZAZA Jefferies Rating: Not Covered Price: $1.88 (as of Nov 15, 2012) Price / Volume Graph
Exchange: NasdaqCM
Business Description
Founded: 2009 Employees: NM Location: Houston, TX (United States)
Trading Data ( as of Nov 15, 2012) ($USD) Financial Projections ($USD millions, except per share data)
Share Price $1.88 (Consensus, unless otherwise noted) FY 2012E FY 2013E FY 2014E
% of 52-Week High 36.3% Revenue NA NA NA52-Week High $5.18 EBITDA 17.0 17.0 NA52-Week Low 1.20 EPS (GAAP) ($0.06) ($0.11) NA90-Day Avg. Daily Trading Volume (000s) 359 EPS (Adjusted) NA NA NAFiscal Year End December EPS (Jefferies) NA NA NA
Enterprise Value Calculation ($USD millions) Valuation Metrics (x)
Market Capitalization (fully-diluted) $191.3 Enterprise Value / Revenue NA NA NA
Total Debt 115.8 Enterprise Value / EBITDA 17.6x 17.6x NA
Minority Interest – Price / Earnings (GAAP) NM NM NAPreferred Equity – Price / Earnings (Adjusted) NA NA NACash and Cash Equivalents 8.6 Total Debt / EBITDA 6.8x 6.8x NAEnterprise Value $298.5
Price / Volume — Last Twelve Months
ZaZa Energy Corporation, together with its subsidiaries, engages in the exploration and development of unconventional onshore oil and gas resources in the United States and Europe. As of December 31, 2011, it had interests in approximately 82,000 gross acres in the Eaglebine formation, south Texas; and approximately 997,000 gross exploration acres in the Paris Basin, France. The company was founded in 2009 and is based in Houston, Texas.
-
500
1,000
1,500
2,000
2,500
3,000
3,500
4,000
–
$1.00
$2.00
$3.00
$4.00
$5.00
$6.00
2/12 3/12 4/12 5/12 6/12 7/12 8/12 9/12 10/12
Volu
me (0
00s)
Price (
$U
SD
)
Volume Price

Private Company Profiles
92 Jefferies 2012 Annual Global Energy Conference

Sources: Company website and Capital IQ. 93 Jefferies 2012 Annual Global Energy Conference
Green Field Energy Services Inc.www.getgreenfield.com
Founded: 1969 Employees: 173 Location: Lafayette, Louisiana
An independent oilfield services company that provides a wide range of services to oil and natural gas drilling and production companies to help develop and enhance the production of hydrocarbons. Services include hydraulic fracturing, cementing, coiled tubing, pressure pumping, acidizing and other pumping services. As of December 31, 2011, had over 30,000 HP available for hydraulic fracturing, of which 19,000 HP was turbine-powered.
Pluspetrol Energy S.A. www.pluspetrol.net
Founded: NA Employees: 96 Location: Buenos Aires, Argentina
Engages in the exploration and production of oil and gas as well as electricity production in South America. The largest oil and gas producer of Peru. Operates as a subsidiary of Pluspetrol Resources Corporation N.V.

Conference Notes
94
Jefferies 2012 Annual Global Energy Conference

Jefferies Biographies
95 Jefferies 2012 Annual Global Energy Conference

Conference Notes
96
Jefferies 2012 Annual Global Energy Conference

Jefferies Energy Investment Banking
Ralph Eads III, Vice Chairman of Jefferies & Company, Inc. (281) 774-2015 / [email protected]
Ralph Eads is Vice Chairman of Jefferies & Company, Inc. and Global Head of Jefferies’ Energy Investment Banking Group and works with clients in the U.S. and internationally. Under his leadership, Jefferies has established one of the leading energy investment banking practices in the world. His extensive M&A experience includes working on over $150 billion in energy M&A transactions. Notable transactions completed by the firm include $28B of unconventional asset transactions for Chesapeake Energy, the sale of Samson Investment Co. to a KKR-led investor group ($7.2B), the sale of East Resources to Shell ($4.7B), Atlas Energy’s acquisition by Chevron ($4.3B), and Brigham Exploration’s sale to Statoil ($4.6B). Mr. Eads has led the firm’s international expansion, helping Jefferies to complete transactions with 15 of the 20 largest oil and gas companies in the world. The firm has also been the leader in raising private equity for the industry, completing transactions involving KKR, EIG, Kelso, CIC and Temasek. Prior to joining the firm, Mr. Eads was President of Randall & Dewey, which was acquired by Jefferies in 2005. Previously he served as Executive Vice President of El Paso Corporation where he was responsible for its unregulated businesses. Before joining El Paso, he was head of the Energy Group of Donaldson, Lufkin & Jenrette and has held senior positions at S.G. Warburg and Lehman Brothers. Mr. Eads serves on the Board of Trustees of Duke University. He is also Chairman of Expectation Graduation, an initiative with the City of Houston to increase the city’s high school graduation rate.
Ajay Khurana, Co Head of Energy Americas and Managing Director (281) 774-2137 / [email protected]
Ajay Khurana is a Managing Director and Co-Head of Energy Investment Banking for the Americas. Over his career, Mr. Khurana has completed approximately $150 billion in transactions, nearly $80 billion in E&P alone. Mr. Khurana's transaction experience includes M&A for public and private companies, debt and equity financings in the public and private capital markets, joint ventures and other structured transactions, and the assessment of strategic alternatives and shareholder value maximization. Recent transactions include the sale of Samson Investment Company to KKR for $7.2 billion, the sale of Atlas Energy to Chevron for $4.3 billion, CONSOL Energy's $3.3 billion Marcellus Shale JV with Noble Energy and Chesapeake Energy's $4 billion unsecured term loan. Prior to joining Jefferies, Mr. Khurana worked at Morgan Stanley, Intel Capital and SG Cowen.
Stephen M. Straty, Co Head of Energy Americas and Managing Director (972) 701-3240 / [email protected]
Stephen Straty is Americas Co-Head of Energy Investment Banking at Jefferies & Company, Inc. and has over 30 years of experience in investment banking. Prior to joining Jefferies in 2008, Mr. Straty was an executive at Bear, Stearns & Co. Inc., for 17 years, serving as Senior Managing Director and Head of the Natural Resources Group. Mr. Straty has extensive experience in serving a broad array of energy clients, having completed over $75 billion in merger and acquisition and financing assignments during the past ten years. Mr. Straty worked at Smith Barney, Harris, Upham & Co. for 10 years focusing on the energy sector, and prior to that worked in the investment banking division at Prudential Insurance, advising on private placements of debt and equity as well as leveraged buyouts.
97 Jefferies 2012 Global Energy Conference
Jefferies Energy Investment Banking
Peter Bowden, Global Head of Midstream and Managing Director
Peter Bowden is a Managing Director and Global Head of Midstream Energy Investment Banking with Jefferies & Company. Before joining Jefferies in July 2012, Mr. Bowden was a Managing Director at Morgan Stanley, where he was Head of Midstream / MLPs. His career began in the legal profession at Andrews Kurth LLP, where he was principally focused on structuring Master Limited Partnerships and negotiating Midstream transactions. Mr. Bowden is widely recognized for the breadth of his experience, having advised on several of the most significant mergers, acquisitions and joint ventures in the Midstream sector and having bookrun more than 50 equity financings for MLPs over the past few years. Mr. Bowden received his undergraduate degree, with honors, from Harvard University and his law degree from the University of Virginia.
Jack P. Randall, Co Founder of Jefferies Randall & Dewey (281) 203-5291 / [email protected]
Jack Randall is Co-founder of Randall & Dewey, which was acquired by Jefferies in 2005. Co-founding the firm in 1989, Mr. Randall and Ken Dewy pioneered the oil and gas transaction advisory business by combining sophisticated transaction ability with hands-on E&P expertise. With over 35 years of industry experience, Mr. Randall maintains key relationships with industry leaders worldwide and offers clients the benefit of his contacts, reputation, technical expertise and business perspective. Previously, he worked at Amoco Production Company, where he led the E&P M&A group. He is a former board member of XTO Energy (NYSE) and Esenjay Exploration Inc. (NASDAQ). He sits on numerous advisory boards including the M.D. Anderson Cancer Center, The University of Texas College of Engineering, and the Sam Houston Council Boy Scouts of America. He currently chairs The Energy Institute at UT – Austin and is a member of the UT Chancellor’s Executive Committee. He received his MS and BS in engineering from UT - Austin.
Warren R. Keyes, Jr., Managing Director & Head of U.S. Acquisitions and Divestment Team (281) 774-2022 / [email protected]
Warren Keyes is a Managing Director and Head of Technical Services at Jefferies & Company, Inc. in the Energy Investment Banking Group. Mr. Keyes is head of the U.S. Acquisitions and Divestment Team, which specializes in the economics and technical requirements of acquiring, divesting and accurately valuing producing properties. With 33 years of industry experience, 22 in the MA&D arena, he is an expert in navigating the U.S. A&D market. Mr. Keyes has been with the Energy team since 1993, including 12 years with Randall & Dewey. Previously, Mr. Keyes worked at Amoco, where he managed the company’s Permian Basin business unit technical team for five years and was a key member of the A&D team that completed many successful transactions.
98 Jefferies 2012 Global Energy Conference

Jefferies Energy Investment Banking
Joseph “Joe” Gladbach, Managing Director & Co-Head of A&D Services (281) 774-2026 / [email protected]
Joe Gladbach is a Managing Director at Jefferies & Company, Inc. in the Energy Investment Banking Group. He is Co-Head of A&D Services where he specializes in upstream M&A. He has completed over $40 billion in successful transactions involving independents and integrated oil & gas companies. Mr. Gladbach is a natural gas expert whose training and experience includes worldwide natural marketing, gas storage, LNG and gas-to-liquids project development. Prior to his tenure with Jefferies, Mr. Gladbach worked 18 years for Amoco Corporation, focusing on various domestic and international roles in A&D, Strategic Planning, natural gas marketing and project development, and reservoir engineering. Most recently, Mr. Gladbach has played a leading role with his colleagues at Jefferies in concluding a series of groundbreaking gas shale transactions on behalf of their clients.
William “Bill” Marko, Managing Director & Co-Head of A&D Services (281) 774-2068 / [email protected]
William "Bill" Marko is a Managing Director at Jefferies & Company, Inc. in the Energy Investment Banking Group. Mr. Marko is Co-Head of A&D Services and has managed more than $50 billion of asset and corporate transactions. His client base consists of many of the world's 50 largest oil and gas companies. Prior to joining Randall & Dewey, subsequently purchased by Jefferies, Mr. Marko worked more than 18 years in various engineering, operations and commercial roles at Mobil Oil, followed by COO of Madison Energy Advisors, a transaction advisory firm. With more than 32 years of industry experience in worldwide acquisition, divestment and new business development, he has evaluated transactions in all major U.S. basins and more than 40 countries. Mr. Marko is a registered Professional Engineer in Louisiana and is an active member of IPAA, currently serving on its SE Region Board, SPE, having previously served on the Gulf Coast Section (Houston) Board, and is on the Board of Tulane University School of Science & Engineering.
Jay Levy, Head of Oilfield Service and Managing Director (713) 308-4522 / [email protected]
Jay Levy is a Managing Director and Head of Oilfield Service at Jefferies & Company, Inc. in the Energy Investment Banking Group. Prior to joining the firm, he worked in the energy investment banking groups of RBC Capital Markets and Howard, Weil, Labouisse, Friedrichs Incorporated. He has 22 years of experience in energy investment banking and holds a BS in Economics from Southern Methodist University
99 Jefferies 2012 Global Energy Conference

Jefferies Equity Research: Biographies
100
Subash Chandra, Managing Director (212) 284-2271 / [email protected] Associate: Yiktat Fung
Subash Chandra has covered the E&P sector for 15 years, participating in a number of themes such as shale exploration, tight sands, coalbed methane and 3D seismic in the Gulf of Mexico. He has also covered exploration stories in Turkey. Peru, Venezuela, China and Brazil. He has been recognized for stock-picking multiple times by the Wall Street Journal and Smart Money. Chandra is responsible for the firm's natural gas price forecast and has been an early and vocal predictor of the current price regime. He has worked for Morgan Keegan prior to Jefferies, specializing in the search for up and coming names. Also has previously worked at AG Edwards and Edward Jones. He is a graduate of University of Michigan, Ann Arbor.
Bradley Handler / Managing Director (212) 336-7249 / [email protected] Associates: Eduardo Royes, Francis Diebold, Saurabh Pant (Mumbai)
Brad Handler, a Managing Director at Jefferies & Co. has research responsibility for U.S. Oilfield Services and Drilling. He joined Jefferies in 2012 following four years at Credit Suisse and 12 years total experience in equity research. Honors in 2010 include #3 rankings in the Institutional Investor and Forbes Best Brokerage Analysts polls. Honors in 2011 include Runner Up in the Institutional Investor poll. Brad’s professional experience prior to sell-side equity research includes six years in management at a firm that is now part of The Linde Group, a global industrial gas company, and commercial lending at a firm that is now part of Bank of America. Brad is a graduate of Johns Hopkins University and has an MBA from Northwestern University J.L. Kellogg School of Management.
Iain Reid, Managing Director +44 (0)77 7133 5793 / [email protected] Associate: Daniela Pereira De Almeida
Iain Reid joined Jefferies in September 2010 as a Senior Equity Research Analyst, based in London. He covers Global Integrated Oil majors and European refiners in the US, Europe and Latin America for Jefferies. Iain has eighteen years sell-side experience at Jefferies, Macquarie, UBS, NatWest Markets and SG Warburg, where he has been a member of highly ranked oil and gas research teams. Prior to his career in equity research, Iain spent sixteen years in the oil industry as an engineer, economist and corporate planning executive for Shell and Amerada Hess. Iain has a Mechanical Engineering degree from Bristol University and an MBA from the Cranfield Business School.

Jefferies Equity Research: Biographies
101
Peter Ward, Managing Director (212) 336-7315 / [email protected] Associates: Patricia Chinogwenya, Steven Hancock
Pete Ward is a Managing Director and Senior Research Analyst at Jefferies covering the North American Metals & Mining Industry. Prior to joining Jefferies in June 2011, Mr. Ward was an equity research analyst at Lehman Brothers/Barclays Capital for 17 years. Mr. Ward also led the global Metals & Mining team at that firm. For 10 consecutive years from 2001 to 2010 and in 2012, Mr. Ward was named a member of the Institutional Investor All-America Research Team. In 2010, Mr. Ward ranked second among all US analysts and first in Metals & Mining in stock-picking. He received a BA in Economics at Furman University and an MBA from the University of Rhode Island. Mr. Ward is also a CFA Charter holder.
Brendan Warn, Managing Director +44 (0)77 7540 6086 / [email protected] Associates: Matthew Lambourne, Daniela Pereira De Almeida
Brendan Warn joined Jefferies in November 2010 as a Managing Director and Senior Equity Research Analyst, based in London. He covers the European majors and European E&P's for Jefferies International. Brendan has more than 15 years of resources and finance industry experience and joins the firm from Macquarie Capital, where he was a Senior Equity Research Analyst covering European Oil & Gas companies. Previously, Brendan was an Associate Director at Evans & Peck, a management consulting firm focused on the construction, energy, mining and infrastructure industries. Evans & Peck is now a business unit of the international oil services company, WorleyParsons. Prior to consulting, Brendan was an engineer and project manager at BHP Billiton. Brendan has a Mining Engineering degree from the University of South Australia, Master of Commerce from The University of New South Wales, and an MBA from University of New South Wales and the University of Sydney (with semester exchange at Tuck School of Business, Dartmouth College).
Biju Perincheril / Senior Vice President (212) 284-2050 / [email protected] Associate: Yiktat Fung
Biju Z. Perincheril joined Jefferies in 2007 as a senior equity research analyst for the Oil and Gas Exploration and Production sector. Prior to joining Jefferies, Biju spent two years at Fortis Securities. From 2000 to 2005, he was a member of the E&P team at Salomon Smith Barney and then at Banc of America Securities. Biju has a Chemical Engineering degree from the City College of New York and an MBA Tulane University.

Jefferies Equity Research: Biographies
102
Laban Yu, Senior Vice President +852 3743 8047 / [email protected] Associate: Joseph Fong, Po Wei
Laban Yu is a Senior Vice President and Head of Asia Oil and Gas research, based in Hong Kong. He has covered oil and gas for seven years and was ranked No. 1 Asia Energy Analyst by Asia Money in 2011. He covered China oil and gas at Macquarie as well as MainFirst Securities. Prior to coming to Asia, Laban was an Equity Associate at Lehman in New York. Prior to finance, Laban worked in new media in Beijing, as an engineer at Xerox and GM, and as a school teacher in Cameroon. Mr. Yu has a Master's in International Affairs from Columbia University and a BS in Mechanical Engineering from Cornell University. Laban speaks English, Mandarin, French, and West African Pidgin.
Laura Loppacher, Vice President +44 (0)77 7133 5792 / [email protected]
Laura Loppacher covers the European Oil and Gas Exploration and Production sector at Jefferies. Prior to joining Jefferies in September 2010, she worked at Macquarie Group following its acquisition of Tristone Capital, an oil and gas boutique investment bank, where she worked for two years covering both Canadian domestic energy stocks from Calgary and International E&Ps from London. Laura has an MSc in Financial Economics from the Said Business School, Oxford University, and a Bachelor of Commerce in Finance from the College of Commerce University of Saskatchewan and has successfully completed Level III of the CFA Program.
Matthew Lambourne, Associate +44 (0)20 7029 8705 / [email protected]
Matt Lambourne joined Jefferies in July 2012 and is responsible for research coverage of small- and mid-cap E&Ps, with a particular focus on the North Sea. Prior to joining Jefferies he worked for Numis Securities, a mid-market UK investment bank, where he also covered the oil & gas sector, and at Deloitte in the specialist oil & gas advisory team. Matt also has four years' sell-side research experience with Macquarie, covering energy and real estate in the NZ and Australian markets. Matt has a Master of Business (Finance) and a Bachelor of Commerce (Finance) from the University of Otago, Dunedin, New Zealand.

Important Disclosures
103 Jefferies 2012 Annual Global Energy Conference

104
Please contact your Jefferies representative for copies of the most recent research reports on individual companies. This material has been prepared by Jefferies & Company, Inc. a U.S.-registered broker-dealer, employing appropriate expertise, and in the belief that it is fair and not misleading. The information upon which this material is based was obtained from sources believed to be reliable, but has not been independently verified, therefore, we do not guarantee its accuracy. This is not an offer or solicitation of an offer to buy or sell any security or investment. Any opinion or estimates constitute our best judgment as of this date, and are subject to change without notice. Jefferies & Company, Inc. and Jefferies International Limited and their affiliates and their respective directors, officers and employees may buy or sell securities mentioned herein as agent or principal for their own account. This communication is being provided strictly for informational purposes only. Any views or opinions expressed herein are solely those of the institutions identified, not Jefferies. This information is not a solicitation or recommendation to purchase securities of Jefferies and should not be construed as such. Reproduction without written permission of Jefferies is expressly forbidden. All Jefferies logos, trademarks and service marks appearing herein are property of Jefferies & Company, Inc. Member SIPC • © 2012 Jefferies & Company, Inc.
Important Disclosures
Jefferies 2012 Annual Global Energy Conference