Embed Size (px)
Citation preview

The Public Trustee of Queensland Investment Funds
Financial Statements
2011-12
Contents
1 Statements of comprehensive income
3 Statements of financial position
4 Statements of changes in equity
5 Statements of cash flows
7 Notes to the financial statements
34 The Public Trustee of Queensland’s declaration
35 Independent audit report from the Auditor-General of Queensland
General Information
These financial statements cover:
Public Trustee of Queensland Conservative Fund (‘Conservative Fund’)
Public Trustee of Queensland Growth Fund (‘Growth Fund’)
Public Trustee of Queensland Higher Growth Fund (‘Higher Growth Fund’)
Public Trustee of Queensland Australian Equities Fund (‘Australian Equities Fund’)
as individual entities. Collectively these funds are referred as the Public Trustee of Queensland Investment Funds (‘Funds’).
The trustee of the Funds is the Public Trustee of Queensland (ABN 12 676 939 467).
For the purpose of this report ‘The Public Trustee of Queensland’ refers to the independent statutory individual and the ‘Public Trustee’ comprises all the operating activities under its control.
The principal address of the Public Trustee is:
Trustee House 444 Queen Street Brisbane Qld 4000
For information in relation to the Public Trustee of Queensland Investment Funds’ financial statements, please call (07) 3213 9288, email [email protected] or visit the Public Trustee’s internet site at www.pt.qld.gov.au.
PTIF 0 70

The Public Trustee of Queensland Investment Funds
PTIF 1
Statements of comprehensive income For year ended 30 June 2012
Notes Conserv-
ative GrowthHigher
Growth Australian
Equities
$'000 $'000 $'000 $'000
Investment income
Interest income 16 24 15 10
Net gains/(losses) on financial instruments held at fair value through profit or loss 5 (905) (7,063) (7,913) (7,990)
Distributions 4,346 6,383 3,631 2,588
Other income 7 21 19 23
Total net investment income/(loss) 3,464 (635) (4,248) (5,369)
Expenses
Trustee fees 13 1,433 2,666 1,875 826
Total operating expenses 1,433 2,666 1,875 826
Profit/(loss) from ordinary activities 2,031 (3,301) (6,123) (6,195)
Finance costs
Distributions to unitholders 7 (2,910) (3,738) (1,766) (1,768)
Change in net assets attributable to unitholders (total comprehensive income) 6 (879) (7,039) (7,889) (7,963)
The above statements should be read in conjunction with the accompanying notes.
71

The Public Trustee of Queensland Investment Funds
PTIF 2
Statements of comprehensive income For year ended 30 June 2011
Notes Conserv-
ative GrowthHigher
Growth Australian
Equities
$'000 $'000 $'000 $'000
Investment income
Interest income 23 33 25 11
Net gains/(losses) on financial instruments held at fair value through profit or loss 5 456 3,684 4,927 3,369
Distributions 9,116 15,706 12,241 3,914
Other income 82 - 19 25
Total net investment income/(loss) 9,677 19,423 17,212 7,319
Expenses
Trustee fees 13 1,593 2,714 2,091 957
Total operating expenses 1,593 2,714 2,091 957
Profit/(loss) from ordinary activities 8,084 16,709 15,121 6,362
Finance costs
Distributions to unitholders 7 (7,541) (13,019) (10,173) (2,971)
Change in net assets attributable to unitholders (total comprehensive income) 6 543 3,690 4,948 3,391
The above statements should be read in conjunction with the accompanying notes.
72

The Public Trustee of Queensland Investment Funds
PTIF 3
Statements of financial position As at 30 June 2012
Notes Conserv-
ative GrowthHigher
Growth Australian
Equities
$'000 $'000 $'000 $'000
Assets
Cash and cash equivalents 8 4 4 5 4
Receivables 9 697 1,543 1,110 644
Financial assets held at fair value through profit or loss
10 82,878 182,574 114,859 55,604
Total assets 83,579 184,121 115,974 56,252
Liabilities
Distributions payable 7 621 1,165 765 443
Payables 11 134 247 155 68
Total liabilities (excluding net assets attributable to unitholders)
755 1,412 920 511
Net assets attributable to unitholders – liability 6 82,824 182,709 115,054 55,741
As at 30 June 2011
Notes Conserv-
ative GrowthHigher
Growth Australian
Equities
$'000 $'000 $'000 $'000
Assets
Cash and cash equivalents 8 4 4 5 5
Receivables 9 3,069 6,577 5,639 1,657
Financial assets held at fair value through profit or loss
10 109,810 185,315 134,013 67,800
Total assets 112,883 191,896 139,657 69,462
Liabilities
Distributions payable 7 3,329 7,253 5,830 1,658
Payables 11 142 241 180 85
Total liabilities (excluding net assets attributable to unitholders)
3,471 7,494 6,010 1,743
Net assets attributable to unitholders – liability 6 109,412 184,402 133,647 67,719
The above statements should be read in conjunction with the accompanying notes.
73

The Public Trustee of Queensland Investment Funds
PTIF 4
Statements of changes in equity For the year ended 30 June 2012
The Funds’ net assets attributable to unitholders are classified as a liability under AASB 132 Financial Instruments Presentation. As such the Funds have no equity and no items of changes in equity have been presented for the current or comparative year.
Changes in net assets attributable to unitholders are disclosed in Note 6.
The above statements should be read in conjunction with the accompanying notes.
74

The Public Trustee of Queensland Investment Funds
PTIF 5
Statements of cash flows For year ended 30 June 2012
Notes Conserv-
ative GrowthHigher
Growth Australian
Equities
$'000 $'000 $'000 $'000
Cash flows from operating activities
Interest received 16 24 15 10
Reduced input tax credit - received 110 196 141 63
Distributions received 5,742 10,444 7,816 3,599
Trustee fees paid (1,584) (2,863) (2,037) (904)
Proceeds from sale of financial instruments held at fair value through profit or loss 35,331 17,482 19,278 10,380
Purchase of financial instruments held at fair value through profit or loss (8,326) (20,810) (7,678) (6,151)
Net cash flows from/(used in) operating activities 12 31,289 4,473 17,535 6,997
Cash flows from financing activities
Proceeds from applications of units by unitholders 12,499 27,451 11,458 7,892
Payments for redemptions of units by unitholders (38,170) (22,098) (22,162) (11,907)
Distributions paid (5,618) (9,826) (6,831) (2,983)
Net cash flows from/(used in) financing activities (31,289) (4,473) (17,535) (6,998)
Net increase/(decrease) in cash and cash equivalents - - - (1)
Cash and cash equivalents at the beginning of the year 4 4 5 5
Cash and cash equivalents at the end of the year 8 4 4 5 4
The above statements should be read with the accompanying notes.
75

The Public Trustee of Queensland Investment Funds
PTIF 6
Statements of cash flows For year ended 30 June 2011
Notes Conserv-
ative Growth Higher
Growth Australian
Equities
$'000 $'000 $'000 $'000
Cash flows from operating activities
Interest received 23 33 25 11
Reduced input tax credit - received 115 196 152 69
Distributions received 6,793 11,345 8,728 3,840
Trustee fees paid (1,698) (2,892) (2,234) (1,018)
Proceeds from sale of financial instruments held at fair value through profit or loss 10,540 10,140 10,196 3,091
Purchase of financial instruments held at fair value through profit or loss (17,022) (20,060) (10,229) (6,450)
Net cash flows from/(used in) operating activities 12 (1,249) (1,238) 6,638 (457)
Cash flows from financing activities
Proceeds from applications of units by unitholders 24,934 26,070 13,787 7,733
Proceeds from corpus contribution 81 - 19 25
Payments for redemptions of units by unitholders (16,346) (14,808) (11,673) (4,062)
Distributions paid (7,469) (10,096) (8,853) (3,279)
Net cash flows from/(used in) financing activities 1,200 1,166 (6,720) 417
Net increase/(decrease) in cash and cash equivalents (49) (72) (82) (40)
Cash and cash equivalents at the beginning of the year 53 76 87 45
Cash and cash equivalents at the end of the year 8 4 4 5 5
The above statements should be read with the accompanying notes.
76
The Public Trustee of Queensland Investment Funds Notes to the financial statements for the year ended 30 June 2012
PTIF 7
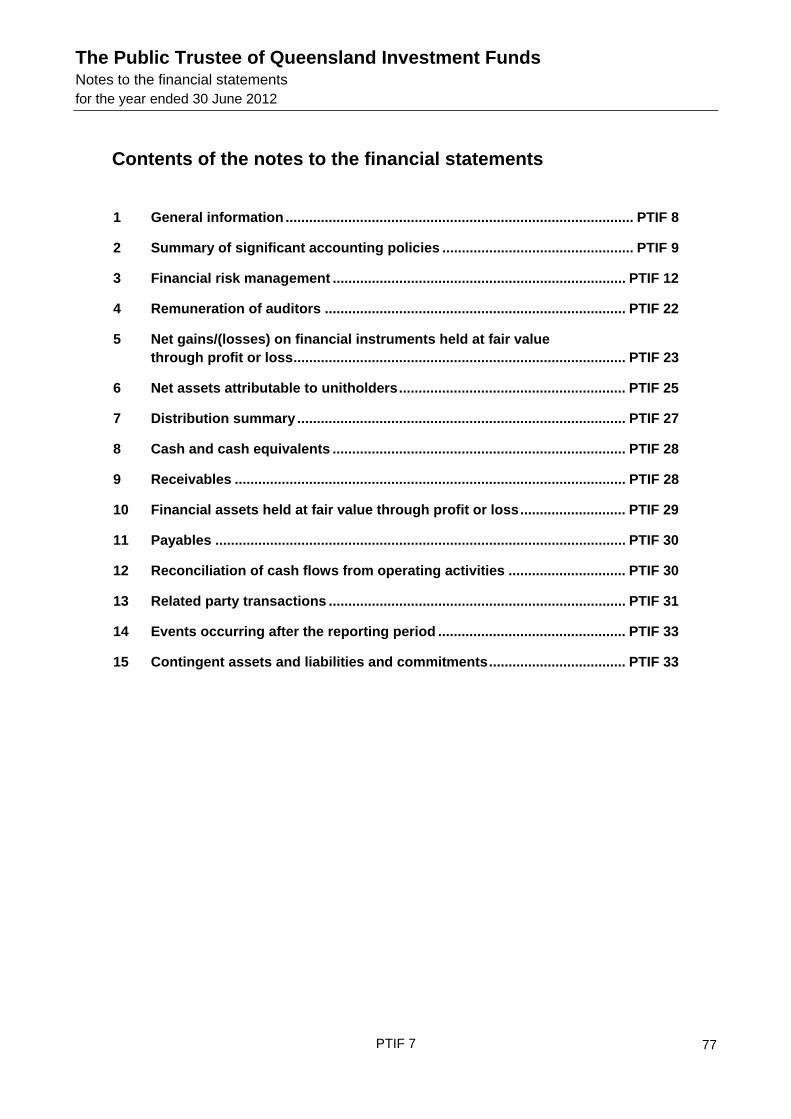
Contents of the notes to the financial statements
1 General information ......................................................................................... PTIF 8
2 Summary of significant accounting policies ................................................. PTIF 9
3 Financial risk management ........................................................................... PTIF 12
4 Remuneration of auditors ............................................................................. PTIF 22
5 Net gains/(losses) on financial instruments held at fair value through profit or loss..................................................................................... PTIF 23
6 Net assets attributable to unitholders.......................................................... PTIF 25
7 Distribution summary .................................................................................... PTIF 27
8 Cash and cash equivalents ........................................................................... PTIF 28
9 Receivables .................................................................................................... PTIF 28
10 Financial assets held at fair value through profit or loss........................... PTIF 29
11 Payables ......................................................................................................... PTIF 30
12 Reconciliation of cash flows from operating activities .............................. PTIF 30
13 Related party transactions ............................................................................ PTIF 31
14 Events occurring after the reporting period ................................................ PTIF 33
15 Contingent assets and liabilities and commitments................................... PTIF 33
77

The Public Trustee of Queensland Investment Funds Notes to the financial statements for the year ended 30 June 2012
PTIF 8
1 General information These financial statements cover:
Public Trustee of Queensland Conservative Fund (‘Conservative Fund’)
Public Trustee of Queensland Growth Fund (‘Growth Fund’)
Public Trustee of Queensland Higher Growth Fund (‘Higher Growth Fund’)
Public Trustee of Queensland Australian Equities Fund (‘Australian Equities Fund’)
as individual entities. Collectively these funds are referred to as the Public Trustee of Queensland Investment Funds (‘Funds’).
The Funds were constituted by a Trust Deed Poll or Supplemental Trust Deed Polls as follows:
Australian Equities Fund 05 Mar 1998
Higher Growth Fund 14 Sep 1999
Conservative Fund 10 July 1996
Growth Fund 10 July 1996
The Funds will terminate on 10 July 2076 unless terminated earlier in accordance with the provisions of the Trust Deed.
The trustee of the Funds is The Public Trustee of Queensland.
The Public Trustee’s principal address is:
Trustee House 444 Queen Street Brisbane Qld 4000
The Fund Administrator and Registry provider is BDO (Qld) Pty Ltd ACN 134 242 434.
The Investment Manager is QIC Limited ACN 130 539 123.
The financial statements were authorised for issue by the Public Trustee as at the date of signing the Public Trustee of Queensland declaration.
The Funds were established by the Public Trustee to provide clients of the Public Trustee with a wider range of investment options than are currently available through the Common Fund to better meet clients’ longer-term financial goals.
The investment objective of each of the individual Funds is as follows:
Conservative Fund
The objectives of the Conservative Fund are to protect the value of an investor’s capital value while achieving a higher return in the medium to longer term than could be achieved by solely investing in interest bearing securities, with less volatility than a fully balanced portfolio. It is to capture the performance of a diversified group of assets, weighted to the defensive asset classes and provide a total return on investment (before fees) at least equal to CPI + 3% per annum over rolling five year periods.
Growth Fund
The objectives of the Growth Fund are to provide a fully diversified investment strategy for those investors seeking long term income and capital growth. It is to capture the performance of a diversified group of assets, weighted to the growth asset classes and provide a total return on investment (before fees) at least equal to CPI + 3.5% per annum over rolling ten year periods.
Higher Growth Fund
The objectives of the Higher Growth Fund are to provide a fully diversified investment strategy for those investors seeking modest income and long term capital growth. It is to capture the performance of a diversified group of assets, weighted to shares and provide a total return on investment (before fees) at least equal to CPI + 4% per annum over rolling ten year periods.
78

The Public Trustee of Queensland Investment Funds Notes to the financial statements for the year ended 30 June 2012
PTIF 9
Australian Equities Fund
The objectives of the Australian Equities Fund are to provide investors with capital growth and some franked income over the long term. It is to capture the performance of the Australian Share market by investing in securities listed or about to be listed on the Australian Stock Exchange and provide a total return on investment (before fees) at least equal to CPI + 5.3% per annum over rolling ten year periods.
2 Summary of significant accounting policies
The principal accounting policies applied in the preparation of these financial statements are set out below. These policies have been consistently applied to all years presented, unless otherwise stated in the following text.
2.1 Basis of preparation
These general purpose financial statements have been prepared in accordance with Australian Accounting Standards issued by the Australian Accounting Standards Board in Australia. The Funds are for-profit entities for the purpose of preparing the financial statements.
All amounts are presented in Australian dollars and have been rounded to the nearest thousand dollars unless otherwise indicated.
These financial statements were prepared on the basis of fair value measurement of assets and liabilities except where otherwise stated.
The statements of financial position are presented on a liquidity basis. Assets and liabilities are presented in decreasing order of liquidity and do not distinguish between current and non-current. All balances are expected to be recovered or settled within twelve months, except for investments in financial assets and net assets attributable to unitholders. The amount expected to be recovered or settled within twelve months after the end of each reporting period cannot be reliably determined.
2.2 Financial instruments
2.2.1 Classification
The Funds’ investments are classified as at fair value through profit or loss. They are comprised of financial instruments designated at fair value through profit or loss upon initial recognition.
These include financial assets that are not held for trading purposes and which may be sold. These are the Funds’ investments in unlisted unit trusts.
Financial assets designated at fair value through profit or loss upon initial recognition are those that are managed and their performance evaluated on a fair value basis in accordance with the Funds’ documented investment strategies. The Funds’ policy is for the Public Trustee to evaluate the information about these financial instruments on a fair value basis together with other related financial information.
Financial assets that are classified as receivables and measured at amortised cost include cash and cash equivalents and accounts receivable.
2.2.2 Recognition / derecognition
The Funds recognise financial assets and financial liabilities on the date they become party to the contractual agreement (trade date) and recognise changes in fair value of the financial assets and financial liabilities from this date.
Investments are derecognised when the right to receive cash flows from the investments have expired or the Funds have transferred substantially all risks and rewards of ownership.
79

The Public Trustee of Queensland Investment Funds Notes to the financial statements for the year ended 30 June 2012
PTIF 10
2.2.3 Measurement
Subsequent to initial recognition, all instruments classified at fair value through profit or loss are measured at fair value with changes in their fair value recognised in the Statement of comprehensive income.
The fair value of financial instruments is based on their quoted market prices at the reporting date without any deduction for estimated future selling costs. Financial assets are priced at the current bid prices, while financial liabilities are priced at current asking prices.
Investments in unlisted unit trusts are recorded at the exit price as reported by the managers of the trusts.
Financial assets classified as receivables are carried at amortised cost using the effective interest rate method, less impairment losses, if any.
Financial liabilities, other than those at fair value through profit or loss, are measured at amortised cost using the effective interest rate.
Financial liabilities arising from the redeemable units issued by the Funds are carried at the redemption amount representing the investors’ right to a residual interest in the Funds’ assets, effectively at fair value at the reporting date.
2.3 Net assets attributable to unitholders
Units are redeemable at the unitholders’ option and are classified as financial liabilities as the Funds are required to distribute their taxable income. The units can be put back to the Funds at any time for cash based on the redemption price. The fair value of redeemable units is measured at the redemption amount that is payable (based on the redemption unit price) at the end of the reporting period if unitholders exercised their right to redeem units in the Funds.
2.4 Cash and cash equivalents
For the purpose of presentation in the Statement of cash flows, cash and cash equivalents includes cash on hand, deposits held at call with financial institutions, other short term, highly liquid investments with original maturities of three months or less from the date of acquisition that are readily convertible to known amounts of cash and which are subject to an insignificant risk of change in value.
Payments and receipts relating to the purchase and sale of investment securities are classified as cash flows from operating activities, as movements in the fair value of these securities represent the Funds’ main income generating activities.
2.5 Investment income
Interest income is recognised in profit or loss for all financial instruments that are not held at fair value through profit or loss using the effective interest method. Interest income on assets held at fair value through profit or loss is included in the net gain/(losses) on financial instruments. Other changes in fair value for such instruments are recorded in accordance with the policies described in Note 2.2.
The effective interest method is a method of calculating the amortised cost of a financial asset or financial liability and of allocating the interest income or interest expense over the relevant period. The effective interest rate is the rate that exactly discounts estimated future cash payments or receipts throughout the expected life of the financial instrument, or a short period where appropriate, to the net carrying amount of the financial asset or liability. When calculating the effective interest rate, the Funds’ estimate cash flows considering all contractual terms of the financial instrument (for example, prepayment options) but do not consider future credit losses. The calculation includes all fees paid or received between the parties to the contract that are an integral part of the effective interest rate, including transaction costs and all other premiums or discounts.
Trust distributions are recognised on an entitlement basis.
2.6 Expenses
All expenses, including the Public Trustee’s fees, are recognised in profit or loss on an accruals basis.
80

The Public Trustee of Queensland Investment Funds Notes to the financial statements for the year ended 30 June 2012
PTIF 11
2.7 Income tax
Under current legislation, the Funds are not subject to income tax as unitholders are presently entitled to the income of the Funds.
The benefit of imputation credits and foreign tax paid are passed on to unitholders.
2.8 Distributions
In accordance with the Trust Deeds, the Funds distribute income adjusted for amounts determined by the Public Trustee to unitholders, by cash or reinvestment. The distributions are recognised in profit or loss as finance costs attributable to unitholders.
2.9 Increase/decrease in net assets attributable to unitholders
Income not distributed is included in net assets attributable to unitholders. Movements in net assets attributable to unitholders are recognised in profit or loss as finance costs.
2.10 Receivables
Receivables may include amounts for interest and Trust distributions. Trust distributions are accrued when the right to receive payment is established. Interest is accrued at the end of each reporting period from the time of the last payment in accordance with the policy set out in Note 2.5. Amounts are generally received within 30 days of being recorded as receivables.
2.11 Payables
Payables include liabilities and accrued expenses owing by the Funds which are unpaid as at the end of the reporting period.
The distribution amount payable to unitholders as at the end of each reporting period is recognised separately in the statements of financial position when unitholders are presently entitled to the distributable income under the Trust Deeds.
2.12 Applications and redemptions
The Funds utilise a buy-sell spread methodology to ensure that investors joining or leaving the Funds contribute to the transactions costs incurred by the Funds buying or selling assets within the Fund. The buy-sell spread is retained by the Funds (it is not a fee paid to the Public Trustee) to ensure equity among investors is maintained.
Application requests are processed utilising the application price to determine the number of units in the Funds to be issued. Redemption requests are processed utilising the redemption price to determine the number of units in the Funds to be cancelled.
2.13 Goods and Services Tax (GST)
The GST incurred on the costs of various services provided to the Funds by third parties such as trustee fees have been passed onto the Funds. The Funds qualify for Reduced Input Tax Credits (RITC) at a rate of 75%; hence expenses have been recognised in profit or loss net of the amount of GST recoverable from the Australian Taxation Office (ATO). Payables are inclusive of GST. The net amount of GST recoverable from the ATO is included in receivables in the Statements of financial position. Cash flows relating to GST are included in the Statement of cash flows on a gross basis.
2.14 Use of estimates
The Funds make estimates and assumptions that affect the reported amounts of assets and liabilities within the next financial year. Estimates are continually evaluated and based on historical experience and other factors, including expectations of future events that are believed to be reasonable under the circumstances.
For the majority of the Funds’ financial investments, quoted market prices are readily available.
The Funds individually hold positions in various unlisted trusts and the investment managers of these funds may use estimates and assumptions that affect the reported amounts of assets and liabilities within the next financial year.
For certain other financial instruments, including receivables and payables, the carrying amount approximate the fair value due to the short-term nature of these financial instruments.
81

The Public Trustee of Queensland Investment Funds Notes to the financial statements for the year ended 30 June 2012
PTIF 12
2.15 New accounting standards and interpretations
Certain new accounting standards and interpretations have been published that are not mandatory for 30 June 2012 reporting periods. The Public Trustee’s assessment of the impact of these new standards (to the extent they are relevant to the Funds) and interpretations is set out below:
2.15.1 AASB 9 Financial Instruments and AASB 2010-7 Amendments to Australian Accounting Standards arising from AASB 9 (December 2010)
AASB 9 Financial Instruments addresses the classification, measurement and derecognition of financial assets and financial liabilities. The Standard is effective for annual periods beginning on or after 1 January 2015. Earlier application is permitted.
AASB 9 permits the recognition of fair value gains and losses in other comprehensive income if they relate to equity investments that are not traded.
The Funds do not plan to adopt this standard before its operative date, which means that it would be first applied in the annual reporting period ending 30 June 2016. When adopted it is not expected that this will have a significant impact on the Funds’ financial statements as the Funds do not hold any available-for-sale investments.
2.15.2 AASB 13 Fair Value Measurement and AASB 2011-8 Amendments to Australian Accounting Standards Arising from AASB 13
AASB 13 was released in September 2011. It explains how to measure fair value and aims to enhance fair value disclosures. Application of the new standard will impact the type of information disclosed in the notes to the financial statements. The Funds do not intend to adopt the new standard before its operative date, which means that it would be first applied in the annual reporting period ending 30 June 2014.
There are no other standards that are not yet effective or that are expected to have a material impact on the Funds in the current or future reporting periods or on foreseeable future transactions.
3 Financial risk management
The Funds’ activities expose them to a variety of financial risks: market risk (including price risk, currency risk, and interest rate risk), credit risk and liquidity risk.
This note presents information about the Funds’ exposure to each of the above risks, as well as the Funds’ objectives, policies and processes for measuring and managing the risk.
The disclosures are prepared on the basis of the Funds’ direct investments and not on a look-through basis to the underlying investments of the unlisted unit trusts that the Funds primarily hold.
(a) Risk management framework
The Funds maintain positions in a variety of unlisted unit trusts managed by QIC in accordance with the Funds’ investment strategy.
The Funds’ overall risk management program focuses on ensuring compliance with their respective Trust Deeds and Information Memorandums and seeks to maximise the returns derived for prudent levels of risk. The primary method of mitigating or controlling risks to the Funds’ investment portfolio is diversification.
The Funds’ investment manager has been given a discretionary authority to manage the assets in line with the Funds’ investment objectives and employs a disciplined approach to the management of risk. The Funds’ portfolios are constructed utilising investments that provide exposure to different assets classes, the returns from which have low correlation, so as to strengthen diversification and consequently reduce the overall effect on asset specific risk.
The Funds’ investment manager will set asset allocation targets within the Dynamic Asset Allocation (‘DAA’) ranges approved by the Public Trustee. The Funds’ investment manager will alter the asset allocation targets to allow the portfolio to move within the DAA ranges, depending on expected future asset class returns.
Monitoring the Funds’ investment portfolio, compliance with the DAA ranges and the performance of the investments is monitored by the Public Trustee Investment Board (‘Investment Board’) on a monthly basis. In instances where the portfolio diverges from the DAA ranges, the Funds’ investment manager is obliged to take actions to rebalance the portfolio in line with the established ranges, within prescribed time limits.
82
The Public Trustee of Queensland Investment Funds Notes to the financial statements for the year ended 30 June 2012
PTIF 13
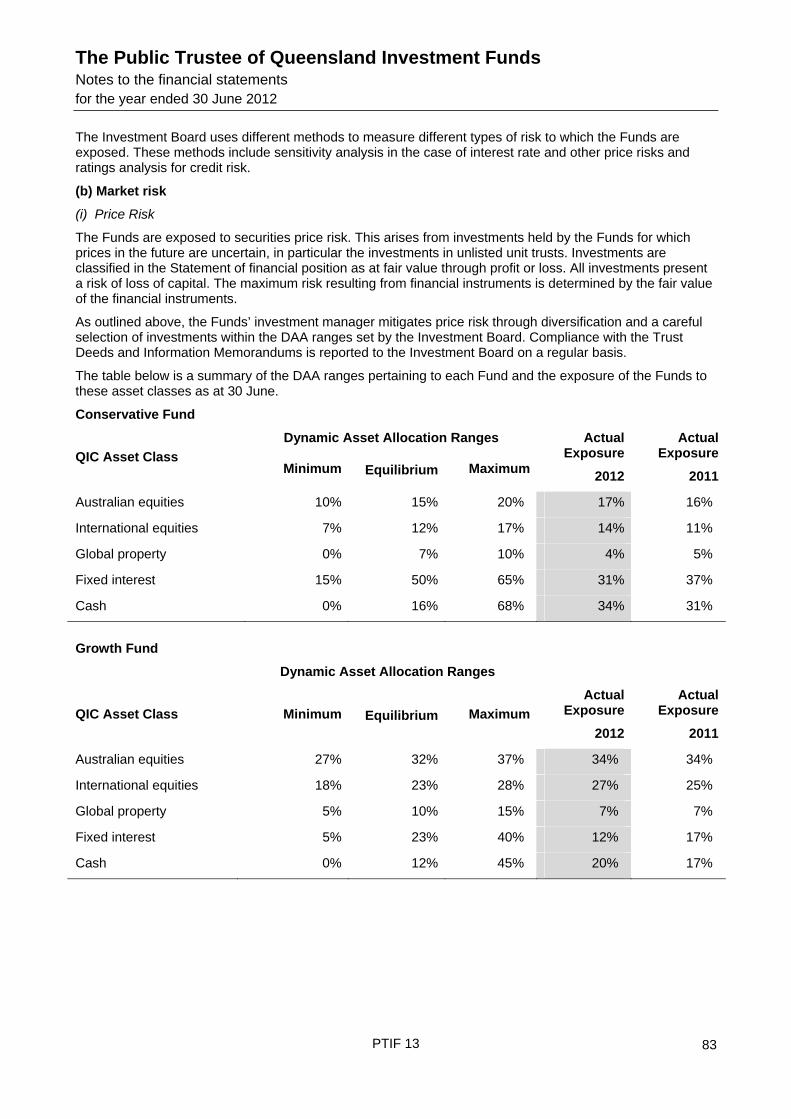
The Investment Board uses different methods to measure different types of risk to which the Funds are exposed. These methods include sensitivity analysis in the case of interest rate and other price risks and ratings analysis for credit risk.
(b) Market risk
(i) Price Risk
The Funds are exposed to securities price risk. This arises from investments held by the Funds for which prices in the future are uncertain, in particular the investments in unlisted unit trusts. Investments are classified in the Statement of financial position as at fair value through profit or loss. All investments present a risk of loss of capital. The maximum risk resulting from financial instruments is determined by the fair value of the financial instruments.
As outlined above, the Funds’ investment manager mitigates price risk through diversification and a careful selection of investments within the DAA ranges set by the Investment Board. Compliance with the Trust Deeds and Information Memorandums is reported to the Investment Board on a regular basis.
The table below is a summary of the DAA ranges pertaining to each Fund and the exposure of the Funds to these asset classes as at 30 June.
Conservative Fund
Dynamic Asset Allocation Ranges
QIC Asset Class Minimum Equilibrium Maximum
Actual Exposure
2012
Actual Exposure
2011
Australian equities 10% 15% 20% 17% 16%
International equities 7% 12% 17% 14% 11%
Global property 0% 7% 10% 4% 5%
Fixed interest 15% 50% 65% 31% 37%
Cash 0% 16% 68% 34% 31%
Growth Fund
Dynamic Asset Allocation Ranges
QIC Asset Class Minimum Equilibrium Maximum
Actual Exposure
2012
Actual Exposure
2011
Australian equities 27% 32% 37% 34% 34%
International equities 18% 23% 28% 27% 25%
Global property 5% 10% 15% 7% 7%
Fixed interest 5% 23% 40% 12% 17%
Cash 0% 12% 45% 20% 17%
83

The Public Trustee of Queensland Investment Funds Notes to the financial statements for the year ended 30 June 2012
PTIF 14
Higher Growth Fund
Dynamic Asset Allocation Ranges
QIC Asset Class Minimum Equilibrium Maximum
Actual Exposure
2012
Actual Exposure
2011
Australian equities 35% 40% 45% 43% 42%
International equities 30% 35% 40% 38% 36%
Global property 0% 7% 10% 4% 5%
Absolute return strategies 0% 2.5% 10% 3% 2%
Fixed Interest 0% 12% 25% 3% 6%
Cash 0% 3.5% 35% 9% 9%
Australian Equities Fund
Dynamic Asset Allocation Ranges QIC Asset Class
Minimum Equilibrium Maximum
Actual Exposure
2012
Actual Exposure
2011
Australian equities 100% 100% 100% 100% 100%
The table below summarises the impact on the Funds’ net assets attributable to unitholders of an increase/decrease in the value of the Trusts’ investments in unlisted unit trusts. The analysis is based on the assumptions that the unlisted unit trusts net asset values increased by 7.5% (2011: 7.5%) and decreased by 7.5% (2011: 7.5%) with all other variables held constant.
As the Funds’ portfolios are constructed utilising a range of unlisted unit trusts that provide exposure to different assets classes, the price risk represented by the change in the fair value of unlisted unit trusts will also be representative of changes in interest rates and foreign exchange rates that the unlisted unit trusts may also be exposed too.
30 June 2012
Conserv-ative Growth
Higher Growth
Australian EquitiesImpact on operating profit / Net assets
attributable to unitholders $'000 $'000 $'000 $'000
Fair value of investments in unlisted unit trusts increased by 7.5% 6,216 13,693 8,614 4,170
Fair value of investments in unlisted unit trusts decreased by 7.5% (6,216) (13,693) (8,614) (4,170)
30 June 2011
Conserv-ative Growth
Higher Growth
Australian EquitiesImpact on operating profit / Net assets
attributable to unitholders $'000 $'000 $'000 $'000
Fair value of investments in unlisted unit trusts increased by 7.5% 8,236 13,899 10,051 5,085
Fair value of investments in unlisted unit trusts decreased by 7.5% (8,236) (13,899) (10,051) (5,085)

The Public Trustee of Queensland Investment Funds Notes to the financial statements for the year ended 30 June 2012
PTIF 15
The sensitivity analysis presented is based upon the portfolio composition as at 30 June. The composition of the Funds’ investment portfolios are expected to change over time. The sensitivity analysis prepared as at 30 June is not necessarily indicative of the effect on the Funds’ net assets attributable to unitholders of future movements in the value of the investments in unlisted unit trusts.
The 7.5% change in unlisted unit trust net asset values have been determined based on management’s best estimate, having regard to a number of factors, including historical levels of changes in the net asset values of the unlisted unit trusts.
However, actual movements in the risk variables may be greater or less than anticipated due to a number of factors, including unusually large market shocks resulting from changes in the performance of and/or correlation between the performances of economies, markets and securities in which the Funds have exposure. As a result, historic variations in risk variables should not be used to predict future variations in risk variables.
(ii) Foreign exchange risk
Foreign exchange risk arises as the value of monetary securities denominated in other currencies will fluctuate due to changes in exchange rates.
When the investment manager formulates a view on the future direction of foreign exchange rates and the potential impact on the Funds, the investment manager factors that into its portfolio allocation decisions.
While the Funds have no direct exposure to foreign exchange rate changes, the Funds may be indirectly affected for example, by the impact of foreign exchange rate changes on the investments held by the unlisted unit trusts in which the Funds primarily invest. No sensitivity analysis has been prepared, however this may not necessarily indicate the effect on the Funds’ net assets attributable to unitholders of future movements in foreign exchange rates. Please refer to Note 3(b)(i) for further details pertaining to the sensitivity of the investments in unlisted unit trusts.
(iii) Cash flow and fair value interest rate risk
The Funds are exposed to cash flow interest rate risk on financial instruments with variable interest rates. Financial instruments with fixed rates expose the Funds to fair value interest rate risk.
The Funds’ interest bearing financial assets expose them to risks associated with the effects of fluctuations in the prevailing levels of market interest rates on its financial position and cash flows.
The Funds have direct exposure to interest rate changes on the valuation and cash flows of their interest bearing assets and liabilities, namely their holdings in cash and cash equivalents. However, as there is no direct impact on the Funds’ operating profit and net assets attributable to unitholders through changes in fair value or changes in future cash flows as a result of any change in the year end interest rates, no sensitivity analysis has been prepared.
However, the Funds may be indirectly affected for example, by the impact of interest rates changes on the investments held by the unlisted unit trusts in which the Funds primarily invest. No sensitivity analysis has been prepared for this exposure, however this may not necessarily indicate the effect on the Funds’ net assets attributable to unitholders of future movements in interest rates. Please refer to Note 3(b)(i) for further details pertaining to the sensitivity of the investments in unlisted unit trusts.
85

The Public Trustee of Queensland Investment Funds Notes to the financial statements for the year ended 30 June 2012
PTIF 16
(c) Credit risk
The Funds are exposed to credit risk, which is the risk that a counterparty will be unable to pay amounts in full when they fall due.
The main concentration of credit risk, to which the Funds are exposed, arises from the Funds’ investments in unlisted unit trusts. The Funds are also exposed to counterparty credit risk on cash and cash equivalents and other receivables.
(i) Unlisted unit Trusts
The Credit risk arising on investments in unlisted unit trusts is mitigated by investing with managers who are well recognised and have a proven track record of delivering on their stated investment objectives. Continual monitoring of the Funds’ investment manager by the Investment Board is also carried out on an ongoing basis.
The Funds’ investment manager separately carries out extensive due diligence on any proposed underlying managers to their unlisted unit trusts prior to making an investment allocation to ensure these managers are well recognised and have a proven track record of delivering on their stated investment objectives.
(ii) Cash and cash equivalents
The exposure to credit risk for cash and cash equivalents is low as all counterparties have a rating of AA (as determined by the Standard and Poor’s) or higher.
In accordance with the Funds’ policy, the investment team of the Public Trustee monitors the Funds’ credit position on a daily basis and the Investment Board reviews it on a monthly basis.
(iii) Other
The Funds are not materially exposed to credit risk on other financial assets.
The maximum exposure to credit risk at the end of each reporting period is the carrying amount of the financial assets. None of these assets are impaired nor past due but not impaired.
(d) Liquidity risk
Liquidity risk is the risk that the Funds may not be able to generate sufficient cash resources to settle its obligations in full as they fall due, or can only do so on terms that are materially disadvantageous.
The Funds are exposed to daily cash redemptions of redeemable units. Investments in unlisted unit trusts expose the Funds to the risk that the manager of those unlisted unit trusts may be unwilling or unable to fulfil the redemption requests within the timeframe requested by the Funds.
In order to manage the Funds’ overall liquidity, the Public Trustee has the discretion to reject an application for units and to defer or adjust a redemption of units if the exercise of such discretion is in the best interests of unitholders.
Units are redeemed on demand at the unitholder’s option. However, the Public Trustee does not envisage that the contractual maturity disclosed in the table below will be representative of the actual cash outflows, as holders of these instruments typically retain them for the medium to long term.
The table below analyses the Funds’ non-derivative financial liabilities into relevant maturity groupings based on the remaining period at the end of the reporting period. The amounts in the table are the contractual undiscounted cash flows.
86

The Public Trustee of Queensland Investment Funds Notes to the financial statements for the year ended 30 June 2012
PTIF 17
Conservative Fund
At 30 June 2012 Less than 1
month1-6 months 6-12
months1-2 years Total
$’000 $’000 $’000 $’000 $’000
Payables 755 - - - 755
Net assets attributable to unitholders 82,824 - - - 82,824
Contractual cash flows 83,579 - - - 83,579
At 30 June 2011 Less than 1 month
1-6 months 6-12 months
1-2 years Total
$’000 $’000 $’000 $’000 $’000
Payables 3,471 - - - 3,471
Net assets attributable to unitholders 109,412 - - - 109,412
Contractual cash flows 112,883 - - - 112,883
Growth Fund
At 30 June 2012 Less than 1
month1-6 months 6-12
months1-2 years Total
$’000 $’000 $’000 $’000 $’000
Payables 1,412 - - - 1,412
Net assets attributable to unitholders 182,709 - - - 182,709
Contractual cash flows 184,121 - - - 184,121
At 30 June 2011 Less than 1 month
1-6 months 6-12 months
1-2 years Total
$’000 $’000 $’000 $’000 $’000
Payables 7,494 - - - 7,494
Net assets attributable to unitholders 184,402 - - - 184,402
Contractual cash flows 191,896 - - - 191,896
87

The Public Trustee of Queensland Investment Funds Notes to the financial statements for the year ended 30 June 2012
PTIF 18
Higher Growth Fund
At 30 June 2012 Less than 1
month1-6 months 6-12
months1-2 years Total
$’000 $’000 $’000 $’000 $’000
Payables 920 - - - 920
Net assets attributable to unitholders 115,054 - - - 115,054
Contractual cash flows 115,974 - - - 115,974
At 30 June 2011 Less than 1 month
1-6 months 6-12 months
1-2 years Total
$’000 $’000 $’000 $’000 $’000
Payables 6,010 - - - 6,010
Net assets attributable to unitholders 133,647 - - - 133,647
Contractual cash flows 139,657 - - - 139,657
Australian Equities Fund
At 30 June 2012 Less than 1
month1-6 months 6-12
months1-2 years Total
$’000 $’000 $’000 $’000 $’000
Payables 511 - - - 511
Net assets attributable to unitholders 55,741 - - - 55,741
Contractual cash flows 56,252 - - - 56,252
At 30 June 2011 Less than 1 month
1-6 months 6-12 months
1-2 years Total
$’000 $’000 $’000 $’000 $’000
Payables 1,743 - - - 1,743
Net assets attributable to unitholders 67,719 - - - 67,719
Contractual cash flows 69,462 - - - 69,462
88

The Public Trustee of Queensland Investment Funds Notes to the financial statements for the year ended 30 June 2012
PTIF 19
(e) Fair value estimation
The carrying amounts of the Funds’ assets and liabilities at the end of each reporting period approximate their fair values.
Financial assets and liabilities held at fair value through profit or loss are measured initially at fair value (being cost). Subsequent to initial recognition, all instruments held at fair value through profit or loss are measured at fair value with changes in their fair value recognised in the statement of comprehensive income.
The Funds value their investments in accordance with the accounting policies set out in note 2.2.
(i) Fair value in an active market
The fair value of financial assets and liabilities traded in active markets is based on their quoted market prices at the end of the reporting period.
The quoted market price used for financial assets held by the Funds is the current bid price.
A financial instrument is regarded as quoted in an active market if quoted prices are readily and regularly available from an exchange, dealer, broker, industry group, pricing service, or regulatory agency, and those prices represent actual and regularly occurring market transactions on an arm’s length basis.
(ii) Fair value in an inactive or unquoted market
The fair value of financial assets and liabilities that are not traded in an active market is determined using valuation techniques. These include the use of recent arm’s length market transactions, reference to the current fair value of substantially similar other instruments, discounted cash flow techniques, option pricing models or any other valuation technique that provides a reliable estimate of prices obtained in actual market transactions.
Investments in other unlisted unit trusts are recorded at the redemption value per unit as reported by the investment managers of such funds.
Valuation techniques employed may not fully reflect all factors relevant to the positions the Funds hold. Valuations may therefore be adjusted, where appropriate, to allow for additional factors including liquidity risk and counterparty risk.
The carrying value less impairment provision of other receivables and payables are assumed to approximate their fair values.
Financial liabilities arising from the redeemable units issued by the Funds are carried at the redemption amount representing the investors’ right to a residual interest in the Funds’ assets, effectively at fair value at the reporting date.
(f) Fair value hierarchy
(i) Classification of financial assets
The Funds’ classify fair value measurements using a fair value hierarchy that reflects the subjectivity of the inputs used in making the measurements. The fair value hierarchy has the following levels:
Quoted prices (unadjusted) in active markets for identical assets or liabilities (level 1);
Inputs other than quoted prices included within level 1 that are observable for the asset or liability, either directly (that is, as prices) or indirectly (that is, derived from prices) (level 2);
Inputs for the asset or liability that are not based on observable market data (that is, unobservable inputs) (level 3).
The level in the fair value hierarchy within which the fair value measurement is categorised is determined on the basis of the lowest level input that is significant to the fair value measurement. For this purpose, the significance of an input is assessed against the fair value measurement. If a fair value measurement uses observable inputs that require significant adjustment based on unobservable inputs, that measurement is a level 3 measurement. Assessing the significance of a particular input to the fair value measurement in its entirety requires judgement, considering factors specific to the asset or liability.
89

The Public Trustee of Queensland Investment Funds Notes to the financial statements for the year ended 30 June 2012
PTIF 20
The determination of what constitutes ‘observable’ requires significant judgement by the Public Trustee. The Public Trustee considers observable data to be that market data that is readily available, regularly distributed or updated, reliable and verifiable, not proprietary, and provided by independent sources that are actively involved in the relevant market.
The tables below set out the Funds’ financial assets (by class) measured at fair value according to the fair value hierarchy at 30 June 2012 and 30 June 2011.
Conservative Fund At 30 June 2012 Level 1 Level 2 Level 3 Total
$’000 $’000 $’000 $’000
Financial assets
Financial assets designated at fair value through profit or loss:
Unlisted unit trusts - 82,878
- 82,878
Total - 82,878 - 82,878
At 30 June 2011 Level 1 Level 2 Level 3 Total
$’000 $’000 $’000 $’000
Financial assets
Financial assets designated at fair value through profit or loss:
Unlisted unit trusts - 109,810
- 109,810
Total - 109,810 - 109,810
90

The Public Trustee of Queensland Investment Funds Notes to the financial statements for the year ended 30 June 2012
PTIF 21
Growth Fund At 30 June 2012 Level 1 Level 2 Level 3 Total
$’000 $’000 $’000 $’000
Financial assets
Financial assets designated at fair value through profit or loss:
Unlisted unit trusts - 182,574
- 182,574
Total - 182,574 - 182,574
At 30 June 2011 Level 1 Level 2 Level 3 Total
$’000 $’000 $’000 $’000
Financial assets
Financial assets designated at fair value through profit or loss:
Unlisted unit trusts - 185,315
- 185,315
Total - 185,315 - 185,315
Higher Growth Fund At 30 June 2012 Level 1 Level 2 Level 3 Total
$’000 $’000 $’000 $’000
Financial assets
Financial assets designated at fair value through profit or loss:
Unlisted unit trusts - 114,859
- 114,859
Total - 114,859 - 114,859
At 30 June 2011 Level 1 Level 2 Level 3 Total
$’000 $’000 $’000 $’000
Financial assets
Financial assets designated at fair value through profit or loss:
Unlisted unit trusts - 134,013
- 134,013
Total - 134,013 - 134,013
91

The Public Trustee of Queensland Investment Funds Notes to the financial statements for the year ended 30 June 2012
PTIF 22
Australian Equities Fund At 30 June 2012 Level 1 Level 2 Level 3 Total
$’000 $’000 $’000 $’000
Financial assets
Financial assets designated at fair value through profit or loss:
Unlisted unit trusts - 55,604
- 55,604
Total - 55,604 - 55,604
At 30 June 2011 Level 1 Level 2 Level 3 Total
$’000 $’000 $’000 $’000
Financial assets
Financial assets designated at fair value through profit or loss:
Unlisted unit trusts - 67,800
- 67,800
Total - 67,800 - 67,800
The Funds’ investments in unlisted unit trusts are classified within level 2 as these markets are not considered to be active but are valued based on alternative pricing sources supported by observable inputs.
4 Remuneration of auditors
During the year the following fees were paid or payable by the Public Trustee for services provided by the auditor of the Funds:
30 June 2012
Conserv-ative Growth
Higher Growth
Australian Equities
$ $ $ $
Queensland Audit Office
Audit of financial statements 15,451 15,451 15,451 15,451
Total remuneration for audit and other assurance services 15,451 15,451 15,451 15,451
92

The Public Trustee of Queensland Investment Funds Notes to the financial statements for the year ended 30 June 2012
PTIF 23
30 June 2011
Conserv-ative Growth
Higher Growth
Australian Equities
$ $ $ $
Queensland Audit Office
Audit of financial statements 14,871 14,871 14,871 14,871
Total remuneration for audit and other assurance services 14,871 14,871 14,871 14,871
5 Net gains/(losses) on financial instruments held at fair value through profit or loss
Net gains/(losses) recognised in relation to financial assets held at fair value through profit or loss.
Conserv-ative Growth
Higher Growth
Australian Equities
30 June 2012
$'000 $'000 $'000 $'000
Financial assets
Unlisted unit trusts (905) (7,063) (7,913) (7,990)
Net gain/(loss) on financial assets held at fair value through profit or loss (905) (7,063) (7,913) (7,990)
Comprising:
Net realised gain/(loss) on financial assets at fair value through profit or loss (470) (840) (835) (1,193)
Net unrealised gain/(loss) on financial assets held at fair value through profit or loss (435) (6,223) (7,078) (6,797)
Net gain/(loss) on financial assets held at fair value through profit or loss (905) (7,063) (7,913) (7,990)
93

The Public Trustee of Queensland Investment Funds Notes to the financial statements for the year ended 30 June 2012
PTIF 24
Conserv-ative Growth
Higher Growth
Australian Equities
30 June 2011
$'000 $'000 $'000 $'000
Financial assets
Unlisted unit trusts 456 3,684 4,927 3,369
Net gain/(loss) on financial assets held at fair value through profit or loss 456 3,684 4,927 3,369
Comprising:
Net realised gain/(loss) on financial assets at fair value through profit or loss 354 990 1,104 290
Net unrealised gain/(loss) on financial assets held at fair value through profit or loss 102 2,694 3,823 3,079
Net gain/(loss) on financial assets held at fair value through profit or loss 456 3,684 4,927 3,369
94

The Public Trustee of Queensland Investment Funds Notes to the financial statements for the year ended 30 June 2012
PTIF 25
6 Net assets attributable to unitholders
Movements in the number of units and net assets attributable to unitholders during the year were as follows:
Conserv-ative Growth
Higher Growth
Australian Equities
30 June 2012
Amount ($’000) $'000 $'000 $'000 $'000
Opening balance 109,412 184,402 133,647 67,719
Applications 12,132 26,987 11,274 7,596
Units issued upon receipt of trustee fee rebates 2 2 1 23
Redemptions (38,207) (22,105) (22,162) (11,907)
Units issued upon reinvestment of distributions 364 462 183 273
Increase/(decrease) in net assets attributable to unitholders (879) (7,039) (7,889) (7,963)
Closing balance 82,824 182,709 115,054 55,741
Units (No’s) Unit No's
'000Unit No's
'000Unit No's
'000 Unit No's
'000
Opening balance 147,813 254,401 192,453 74,070
Applications 16,170 37,677 16,228 8,583
Units issued upon receipt of trustee fee rebates 2 3 1 26
Redemptions (52,090) (31,564) (33,612) (14,262)
Units issued upon reinvestment of distributions 925 1,695 1,131 652
Closing balance 112,820 262,212 176,201 69,069
95

The Public Trustee of Queensland Investment Funds Notes to the financial statements for the year ended 30 June 2012
PTIF 26
Conserv-ative Growth
Higher Growth
Australian Equities
30 June 2011
Amount ($’000) $'000 $'000 $'000 $'000
Opening balance 99,970 169,219 126,556 60,593
Applications 24,022 24,489 12,637 7,033
Units issued upon receipt of trustee fee rebates 4 2 1 59
Redemptions (16,034) (14,576) (11,644) (3,998)
Units issued upon reinvestment of distributions 907 1,578 1,149 641
Increase/(decrease) in net assets attributable to unitholders 543 3,690 4,948 3,391
Closing balance 109,412 184,402 133,647 67,719
Units (No’s) Unit No's
'000Unit No's
'000Unit No's
'000 Unit No's
'000
Opening balance 136,059 239,073 189,304 70,090
Applications 31,735 33,225 17,901 7,460
Units issued upon receipt of trustee fee rebates 6 3 2 63
Redemptions (21,108) (19,446) (16,009) (4,248)
Units issued upon reinvestment of distributions 1,121 1,546 1,255 705
Closing Balance 147,813 254,401 192,453 74,070
Capital risk management
The Funds consider their net assets attributable to unitholders as capital, notwithstanding net assets attributable to unitholders are classified as a liability. The amount of net assets attributable to unitholders can change significantly on a daily basis as the Funds are subject to daily applications and redemptions at the discretion of unitholders.
Daily applications and redemptions are revised relative to the liquidity of the Funds’ underlying assets on a daily basis by the Public Trustee. Under the terms of the Trust Deeds, the Public Trustee has the discretion to reject an application for units and to defer or adjust a redemption of units if the exercise of such discretion is in the best interests of unitholders.
96

The Public Trustee of Queensland Investment Funds Notes to the financial statements for the year ended 30 June 2012
PTIF 27
7 Distribution summary
The distributions for the year were as follows: 30 June
201230 June
201230 June
2011 30 June
2011
Conservative Fund Distribution $'000 CPU* $'000 CPU*
Distribution paid – 30 September 539 0.3674 1,049 0.7405
– 31 December 522 0.3854 1,496 1.0420
– 31 March 1,228 0.9941 1,667 1.1424
Distribution payable – 30 June 621 0.5501 3,329 2.2520
Total distribution 2,910 2.2970 7,541 5.1769
Growth Fund Distribution
Distribution paid – 30 September 675 0.2584 994 0.4034
– 31 December 702 0.2667 1,963 0.7943
– 31 March 1,196 0.4600 2,809 1.1212
Distribution payable – 30 June 1,165 0.4444 7,253 2.8512
Total distribution 3,738 1.4295 13,019 5.1701
Higher Growth Fund Distribution
Distribution paid – 30 September 313 0.1610 267 0.1379
– 31 December 352 0.1837 1,483 0.7658
– 31 March 336 0.1822 2,593 1.3522
Distribution payable – 30 June 765 0.4340 5,830 3.0291
Total distribution 1,766 0.9609 10,173 5.2850
Australian Equities Fund Distribution
Distribution paid – 30 September 472 0.6846 176 0.2457
– 31 December 508 0.7306 921 1.2771
– 31 March 345 0.4946 216 0.2944
Distribution payable – 30 June 443 0.6409 1,658 2.2379
Total distribution 1,768 2.5507 2,971 4.0551
* CPU is cents per unit
97

The Public Trustee of Queensland Investment Funds Notes to the financial statements for the year ended 30 June 2012
PTIF 28
8 Cash and cash equivalents
Conserv-ative Growth
Higher Growth
Australian Equities
30 June 2012 $'000 $'000 $'000 $'000
Cash at bank 4 4 5 4
Total 4 4 5 4
Conserv-ative Growth
Higher Growth
Australian Equities
30 June 2011 $'000 $'000 $'000 $'000
Cash at bank 4 4 5 5
Total 4 4 5 5
9 Receivables
Conserv-ative Growth
Higher Growth
Australian Equities
30 June 2012 $'000 $'000 $'000 $'000
Distribution receivable 690 1,527 1,099 639
Reduced input tax credit receivable 7 16 11 5
Total 697 1,543 1,110 644
Conserv-ative Growth
Higher Growth
Australian Equities
30 June 2011 $'000 $'000 $'000 $'000
Distribution receivable 3,059 6,560 5,626 1,651
Reduced input tax credit receivable 10 17 13 6
Total 3,069 6,577 5,639 1,657
98

The Public Trustee of Queensland Investment Funds Notes to the financial statements for the year ended 30 June 2012
PTIF 29
10 Financial assets held at fair value through profit or loss
Conserv-ative Growth
Higher Growth
Australian Equities30 June 2012
$'000 $'000 $'000 $'000
Designated at fair value through profit or loss
Unlisted unit trusts 82,878 182,574 114,859 55,604
Total financial assets held at fair value through profit or loss 82,878 182,574 114,859 55,604
Comprising:
Unlisted unit trusts
Units in Australian equity trusts 13,766 62,656 48,822 55,604
Units in International equity trusts 11,346 48,584 43,912 -
Units in cash trusts 28,349 36,347 10,471 -
Units in fixed interest trusts 25,698 21,758 3,536 -
Units in global property trusts 3,719 13,229 4,907 -
Units in absolute return strategy trusts - - 3,211 -
Total 82,878 182,574 114,859 55,604
Conserv-ative Growth
Higher Growth
Australian Equities30 June 2011
$'000 $'000 $'000 $'000
Designated at fair value through profit or loss
Unlisted unit trusts 109,810 185,315 134,013 67,800
Total financial assets held at fair value through profit or loss 109,810 185,315 134,013 67,800
Comprising:
Unlisted unit trusts
Units in Australian equity trusts 18,018 62,533 56,345 67,800
Units in International equity trusts 11,901 45,789 47,692 -
Units in cash trusts 34,020 31,066 11,751 -
Units in fixed interest trusts 40,845 32,324 8,453 -
Units in global property trusts 5,026 13,603 6,497 -
Units in absolute return strategy trusts - - 3,275 -
Total 109,810 185,315 134,013 67,800
An overview of the risk exposures of fair value measurements relating to financial assets at fair value through profit or loss is included in note 3.
99
The Public Trustee of Queensland Investment Funds Notes to the financial statements for the year ended 30 June 2012
PTIF 30
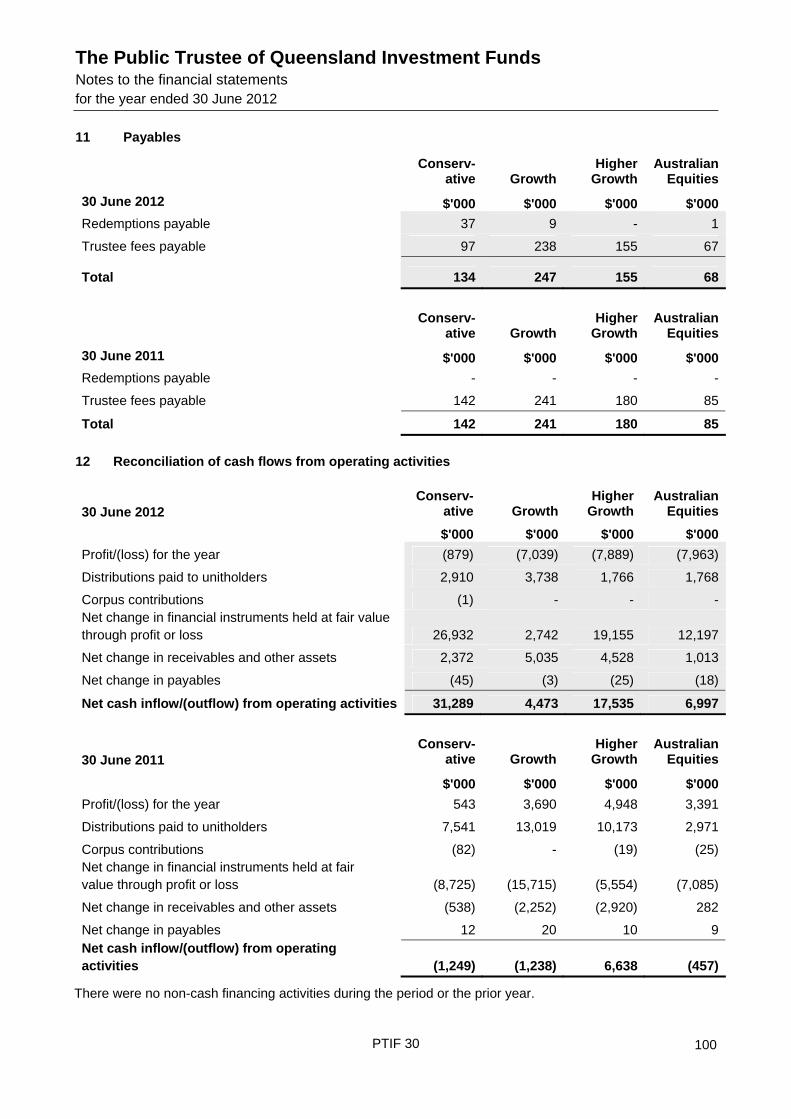
11 Payables
Conserv-ative Growth
Higher Growth
Australian Equities
30 June 2012 $'000 $'000 $'000 $'000
Redemptions payable 37 9 - 1
Trustee fees payable 97 238 155 67
Total 134 247 155 68
Conserv-ative Growth
Higher Growth
Australian Equities
30 June 2011 $'000 $'000 $'000 $'000
Redemptions payable - - - -
Trustee fees payable 142 241 180 85
Total 142 241 180 85
12 Reconciliation of cash flows from operating activities
30 June 2012 Conserv-
ative GrowthHigher
Growth Australian
Equities
$'000 $'000 $'000 $'000
Profit/(loss) for the year (879) (7,039) (7,889) (7,963)
Distributions paid to unitholders 2,910 3,738 1,766 1,768
Corpus contributions (1) - - -Net change in financial instruments held at fair value through profit or loss 26,932 2,742 19,155 12,197
Net change in receivables and other assets 2,372 5,035 4,528 1,013
Net change in payables (45) (3) (25) (18)
Net cash inflow/(outflow) from operating activities 31,289 4,473 17,535 6,997
30 June 2011 Conserv-
ative GrowthHigher
Growth Australian
Equities
$'000 $'000 $'000 $'000
Profit/(loss) for the year 543 3,690 4,948 3,391
Distributions paid to unitholders 7,541 13,019 10,173 2,971
Corpus contributions (82) - (19) (25)Net change in financial instruments held at fair value through profit or loss (8,725) (15,715) (5,554) (7,085)
Net change in receivables and other assets (538) (2,252) (2,920) 282
Net change in payables 12 20 10 9Net cash inflow/(outflow) from operating activities (1,249) (1,238) 6,638 (457)
There were no non-cash financing activities during the period or the prior year.
100

The Public Trustee of Queensland Investment Funds Notes to the financial statements for the year ended 30 June 2012
PTIF 31
13 Related party transactions
Trustee
The trustee of the Funds is the Public Trustee of Queensland.
Key management personnel
Key management personnel that held positions of authority and responsibility for planning, directing and controlling the activities of the Funds during the financial year were key management personnel of the Public Trustee comprising:
Key management personnel Position
Peter Carne Public Trustee of Queensland
Ray Bowers Acting Executive Director, Investment Services and Chief Finance Officer (acting in the position from 30 September 2010 until 4 June 2012)
Tim Murphy Executive Director, Investment Services and Chief Finance Officer (appointed 4 June 2012)
Frank Prostamo Director, Investment Services
There were no other persons with responsibility for planning, directing and controlling the activities of the Funds, directly or indirectly during the financial year.
Key management personnel unit holdings
Key management personnel that had personnel unit holdings in the Funds during the financial year were: 30 June 2012
Conserv-ative Growth
Higher Growth
Australian Equities
Key management personnel Units Units Units Units
Ray Bowers - - 29,160 -
30 June 2011
Conserv-ative Growth
Higher Growth
Australian Equities
Key management personnel Units Units Units Units
Ray Bowers - - 25,760 -
No other key management personnel held units in the Funds.
Key management personnel compensation
Key management personnel are paid by the Public Trustee. Payments made from the Funds to the Public Trustee do not include any amounts directly attributable to the compensation of key management personnel.
Key management personnel loan disclosures
The Funds have not made, guaranteed or secured, directly or indirectly, any loans to the key management personnel or their personally related entities at any time during the reporting period.
101

The Public Trustee of Queensland Investment Funds Notes to the financial statements for the period ended 30 June 2012
PTIF 32
Other transactions within the Funds
Apart from those details in this note, no key management personnel have entered into a material contract with the Funds during the financial year and there were no material contracts involving key management personnel’s interests existing at year end.
Trustee fees and other transactions
Under the terms of the Funds’ Information Memorandum, the Public Trustee is entitled to receive Public Trustee fees, calculated on each Fund’s net asset value at the close of each month and paid monthly in arrears.
The fee covers the usual expenses incurred and includes the QIC’s investment management fees charged to the Public Trustee in respect of each of the QIC funds and covers other expenses incurred by the Public Trustee such as fees for auditing, accounting expenses, bank charges and ongoing maintenance of the unit registry.
The annual trustee fees are grossed up for GST and reduced by the Reduced Input Tax Credits (RITCs) allowed. The annual trustee fees of the Funds (including GST and reduced by RITCs) are as follows:
Fund From 1 June 2012
annual trustee fee*
Prior 1 June 2012 annual trustee fee*
2011 annual trustee fee
Conservative Fund 1.30% 1.45% 1.45%
Growth Fund 1.45% 1.45% 1.45%
Higher Growth Fund 1.50% 1.50% 1.50%
Australian Equities Fund 1.35% 1.40% 1.40%
*On 1 June 2012 the annual trustee fees were reviewed and new rates as outlined above were enacted.
The transactions during the year and amounts payable at year end between the Funds and the Public Trustee were as follows:
30 June 2012 Conservative Growth Higher Growth
Australian Equities
$’000 $’000 $’000 $’000
Trustee fees for the year paid by the Fund to the Public Trustee 1,433 2,666 1,875 826
Amounts payable to the Public Trustee at the end of the reporting period 97 238 155 67
30 June 2011
Conservative Growth Higher Growth
Australian Equities
$’000 $’000 $’000 $’000
Trustee fees for the year paid by the Fund to the Public Trustee 1,593 2,714 2,091 957
Amounts payable to the Public Trustee at the end of the reporting period 142 241 180 85
102

The Public Trustee of Queensland Investment Funds Notes to the financial statements for the period ended 30 June 2012
PTIF 33
Trustee fee rebate
A trustee fee rebate is available for clients holding more than $100,000 in any single fund. This rebate is a reduction in the trustee fee and is calculated on the value of each client’s holding at the close of each month. The tiered trustee fee rebate structure is as follows:
30 June 2012
30 June 2011
Net asset value Rebate % Rebate %
First $100,000 - -
Next $150,000 0.15% 0.15%
Next $250,000 0.40% 0.40%
Next $500,000 0.45% 0.45%
Next $9M 0.85% 0.85%
Next $15M 1.00% 1.00%
Over $25M 1.05% 1.05%
14 Events occurring after the reporting period
The Federal Government has issued final amendments to the Goods and Services Tax (GST) Regulations dealing with certain services acquired by a recognised trust scheme. The major changes contained in the amendments that will impact the Funds relate to the reduction of input tax credits available in respect of certain services provided by trustees and responsible entities to a recognised trust scheme from 75% to 55%. The changes will take effect from 1 July 2012.
Other than the above, there were no other significant events have occurred since the end of the reporting period which would impact on the financial position of the Funds disclosed in the statements of financial position as at 30 June 2012 or on the results and cash flows of the Funds for the year ended on that date. 15 Contingent assets and liabilities and commitments
There are no contingent assets, liabilities or commitments as at 30 June 2012 (2011: Nil).
103