Embed Size (px)
Citation preview
2012 Annual Survey of Regional Not-for-Profit Organizations’
Compensation Practices Summary Report
Conducted and Published by:
December 2012
From 2003 to 2009, the Child Witness Centre conducted an annual Not-For-Profit survey with member agencies of the Kitchener-Waterloo and Cambridge United Way. In 2010, an Advisory Group comprised of members of Waterloo Region Not-For-Profit agencies, determined it was time to expand the audience to provide a benchmarking tool that could be made available to a broader group of Not-For-Profit organizations. They also worked together to create the survey questions to ensure they were representative of the issues currently facing Not-For-Profit organizations in the areas of: Overall Compensation, Governance and Risk Management. At the same time, Cowan Insurance Group volunteered to take over the administration of this survey to help not only with the gathering of data, but to also provide additional insight around the findings and to expand the number of organizations surveyed. Having an independent third party administer the survey also provided an increased level of confidentiality for respondents, which increased participation. The 2012 Advisory Group decided to conduct a condensed version of the survey with a focus on salaries. All survey responses were gathered anonymously and examined in aggregate to ensure that confidentiality was
maintained.
Background Information
“How wonderful it is that nobody need wait a single
moment before starting to improve the world.”
~ Anne Frank
Table of Contents
Opening Remarks………………………………………………………………………………………… 1
Background Information………………………………………………………………………………….. 2
Number of Paid Employees……………………………………………………………………. 2
Length of Service………………………………………………………………………………... 2
Operating Budget……………………………………………………………………………….. 3
Primary Source of Funding……………………………………………………………………. 3
Salaries and Benefits as a Percentage of the Operating Budget…………………………. 3
Salary Increases and Information………………………………………………………………………. 4
Job Information……………………………………………………………………………………………. 6
Summary and Closing Remarks………………………………………………………………………… 12
Appendix: Nonprofit Risk Management……………………………………………………………….. 13
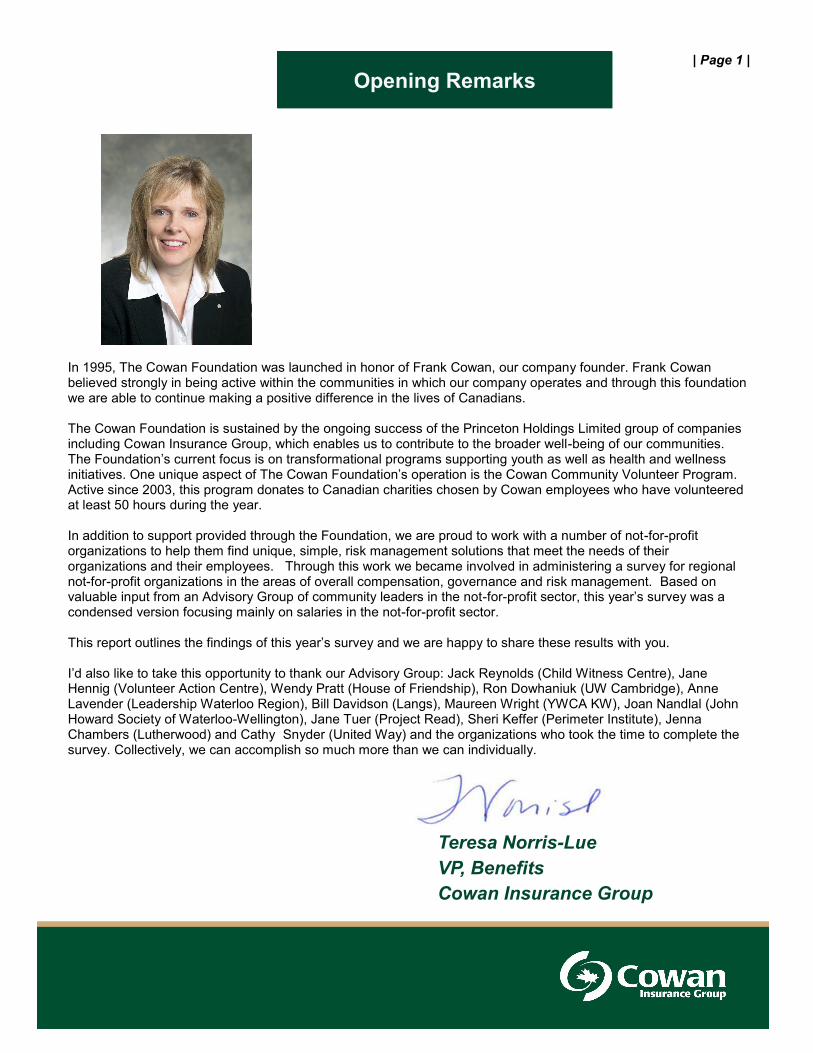
In 1995, The Cowan Foundation was launched in honor of Frank Cowan, our company founder. Frank Cowan believed strongly in being active within the communities in which our company operates and through this foundation we are able to continue making a positive difference in the lives of Canadians. The Cowan Foundation is sustained by the ongoing success of the Princeton Holdings Limited group of companies including Cowan Insurance Group, which enables us to contribute to the broader well-being of our communities. The Foundation’s current focus is on transformational programs supporting youth as well as health and wellness initiatives. One unique aspect of The Cowan Foundation’s operation is the Cowan Community Volunteer Program. Active since 2003, this program donates to Canadian charities chosen by Cowan employees who have volunteered at least 50 hours during the year. In addition to support provided through the Foundation, we are proud to work with a number of not-for-profit organizations to help them find unique, simple, risk management solutions that meet the needs of their organizations and their employees. Through this work we became involved in administering a survey for regional not-for-profit organizations in the areas of overall compensation, governance and risk management. Based on valuable input from an Advisory Group of community leaders in the not-for-profit sector, this year’s survey was a condensed version focusing mainly on salaries in the not-for-profit sector. This report outlines the findings of this year’s survey and we are happy to share these results with you. I’d also like to take this opportunity to thank our Advisory Group: Jack Reynolds (Child Witness Centre), Jane Hennig (Volunteer Action Centre), Wendy Pratt (House of Friendship), Ron Dowhaniuk (UW Cambridge), Anne Lavender (Leadership Waterloo Region), Bill Davidson (Langs), Maureen Wright (YWCA KW), Joan Nandlal (John Howard Society of Waterloo-Wellington), Jane Tuer (Project Read), Sheri Keffer (Perimeter Institute), Jenna Chambers (Lutherwood) and Cathy Snyder (United Way) and the organizations who took the time to complete the survey. Collectively, we can accomplish so much more than we can individually.
| Page 1 |
Teresa Norris-Lue
VP, Benefits
Cowan Insurance Group
Opening Remarks
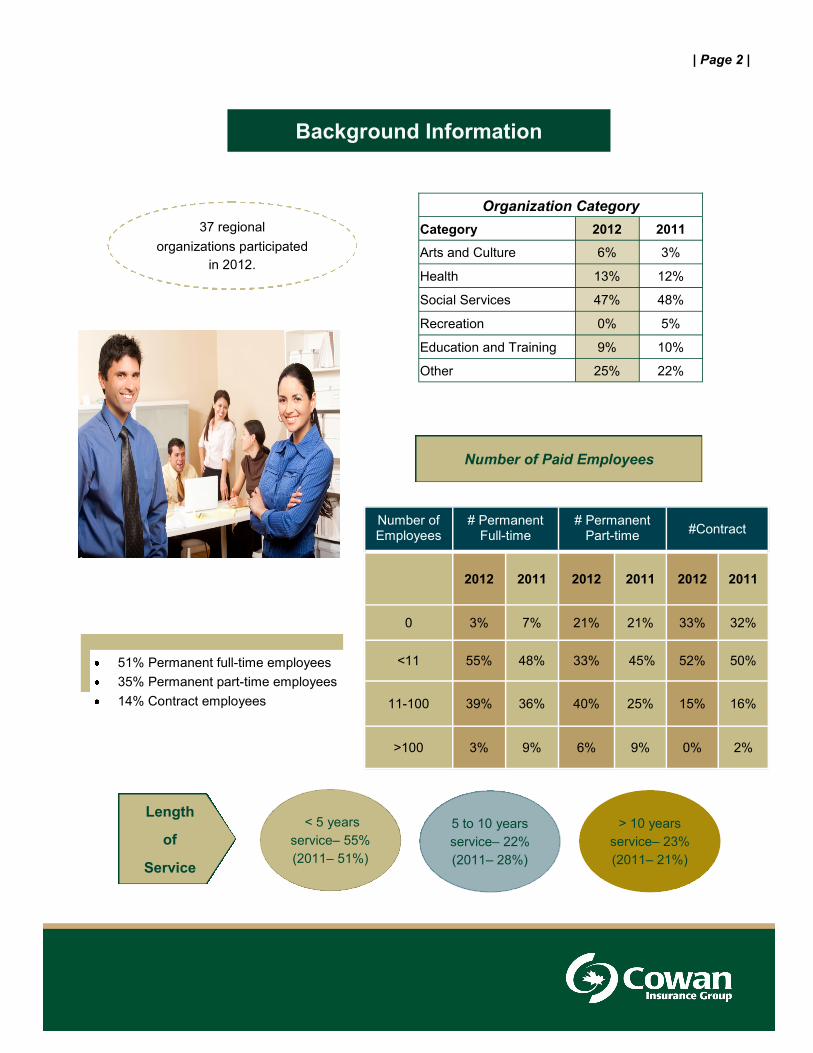
51% Permanent full-time employees
35% Permanent part-time employees
14% Contract employees
| Page 2 |
Background Information
Organization Category
Category 2012 2011
Arts and Culture 6% 3%
Health 13% 12%
Social Services 47% 48%
Recreation 0% 5%
Education and Training 9% 10%
Other 25% 22%
37 regional
organizations participated
in 2012.
Number of Employees
# Permanent Full-time
# Permanent Part-time
#Contract
2012 2011 2012 2011 2012 2011
0 3% 7% 21% 21% 33% 32%
<11 55% 48% 33% 45% 52% 50%
11-100 39% 36% 40% 25% 15% 16%
>100 3% 9% 6% 9% 0% 2%
Number of Paid Employees
5 to 10 years
service– 22%
(2011– 28%)
> 10 years
service– 23%
(2011– 21%)
< 5 years
service– 55%
(2011– 51%)
Length
of
Service
| Page 3 |
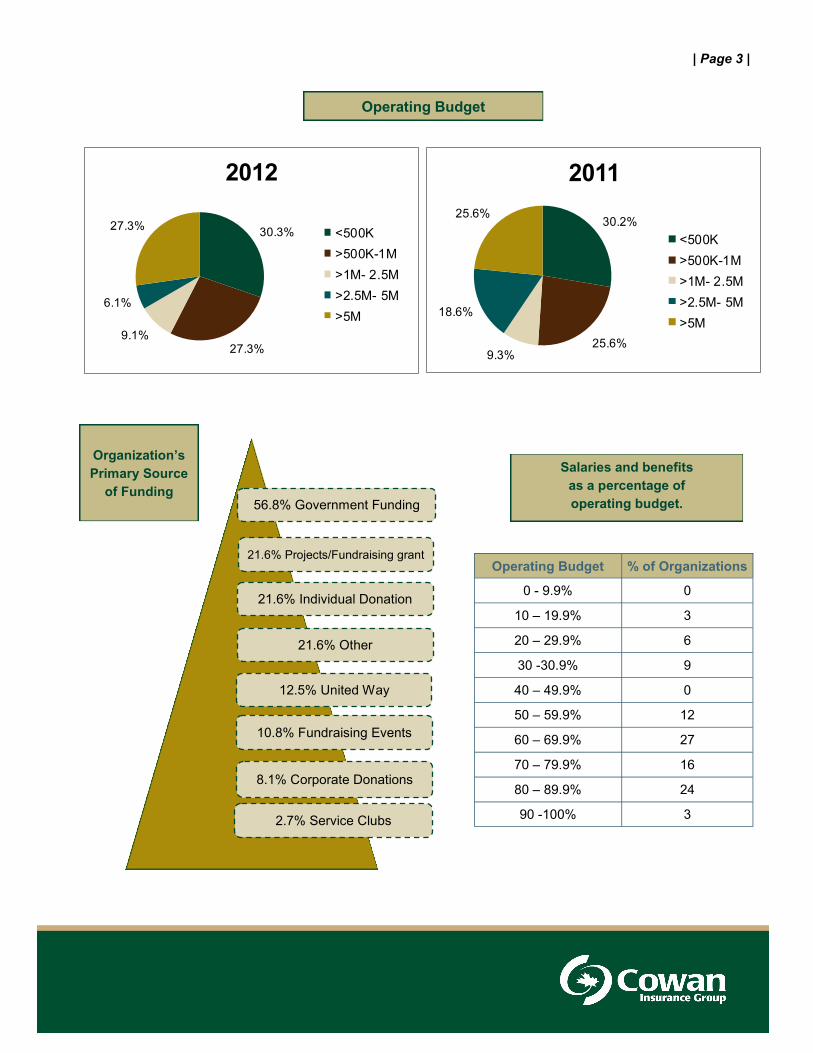
Operating Budget
Operating Budget % of Organizations
0 - 9.9% 0
10 – 19.9% 3
20 – 29.9% 6
30 -30.9% 9
40 – 49.9% 0
50 – 59.9% 12
60 – 69.9% 27
70 – 79.9% 16
80 – 89.9% 24
90 -100% 3
56.8% Government Funding
21.6% Projects/Fundraising grant
2.7% Service Clubs
8.1% Corporate Donations
10.8% Fundraising Events
21.6% Other
21.6% Individual Donation
12.5% United Way
Organization’s
Primary Source
of Funding
30.3%
27.3%9.1%
6.1%
27.3%
2012
<500K
>500K-1M
>1M- 2.5M
>2.5M- 5M
>5M
30.2%
25.6%9.3%
18.6%
25.6%
2011
<500K
>500K-1M
>1M- 2.5M
>2.5M- 5M
>5M
Salaries and benefits
as a percentage of
operating budget.
| Page 4 |
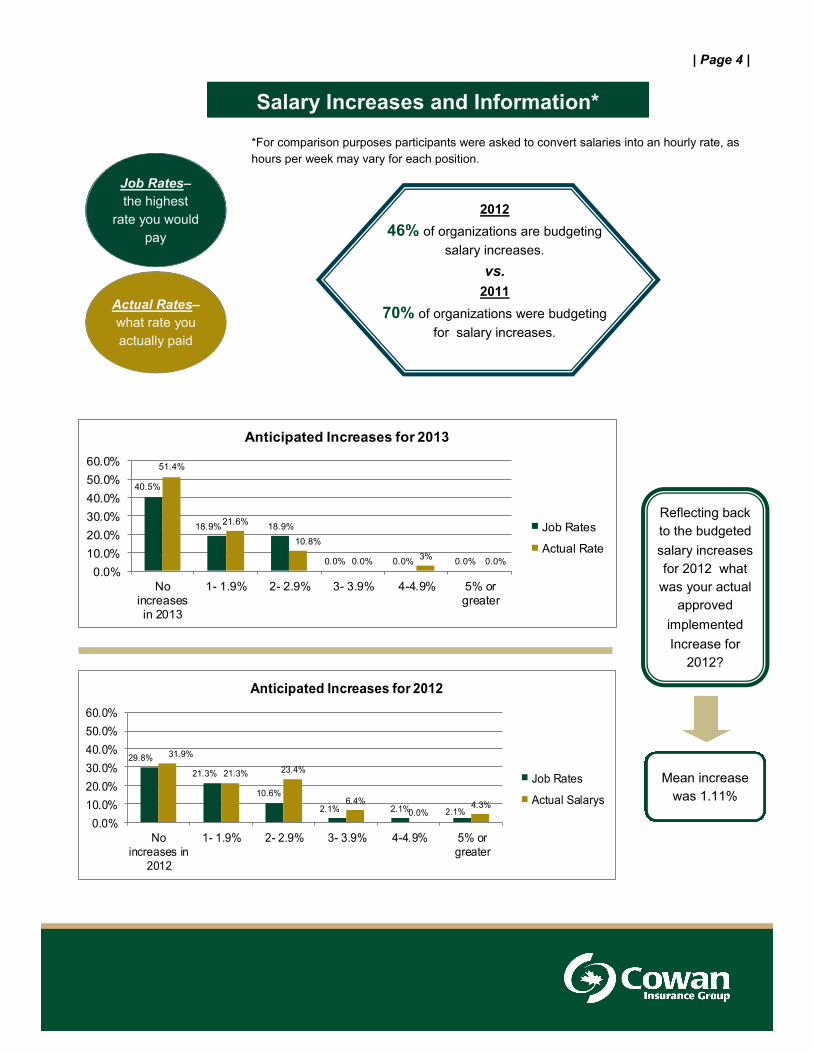
Salary Increases and Information*
Job Rates–
the highest
rate you would
pay
Actual Rates–
what rate you
actually paid
*For comparison purposes participants were asked to convert salaries into an hourly rate, as
hours per week may vary for each position.
40.5%
18.9% 18.9%
0.0% 0.0% 0.0%
51.4%
21.6%
10.8%
0.0%3%
0.0%
0.0%
10.0%
20.0%
30.0%
40.0%
50.0%
60.0%
Noincreasesin 2013
1- 1.9% 2- 2.9% 3- 3.9% 4-4.9% 5% orgreater
Anticipated Increases for 2013
Job Rates
Actual Rate
2012
46% of organizations are budgeting
salary increases.
vs.
2011
70% of organizations were budgeting
for salary increases.
29.8%
21.3%
10.6%
2.1% 2.1% 2.1%
31.9%
21.3% 23.4%
6.4%
0.0%4.3%
0.0%
10.0%
20.0%
30.0%
40.0%
50.0%
60.0%
Noincreases in
2012
1- 1.9% 2- 2.9% 3- 3.9% 4-4.9% 5% orgreater
Anticipated Increases for 2012
Job Rates
Actual Salarys
Reflecting back
to the budgeted
salary increases
for 2012 what
was your actual
approved
implemented
Increase for
2012?
Mean increase
was 1.11%
| Page 5 |
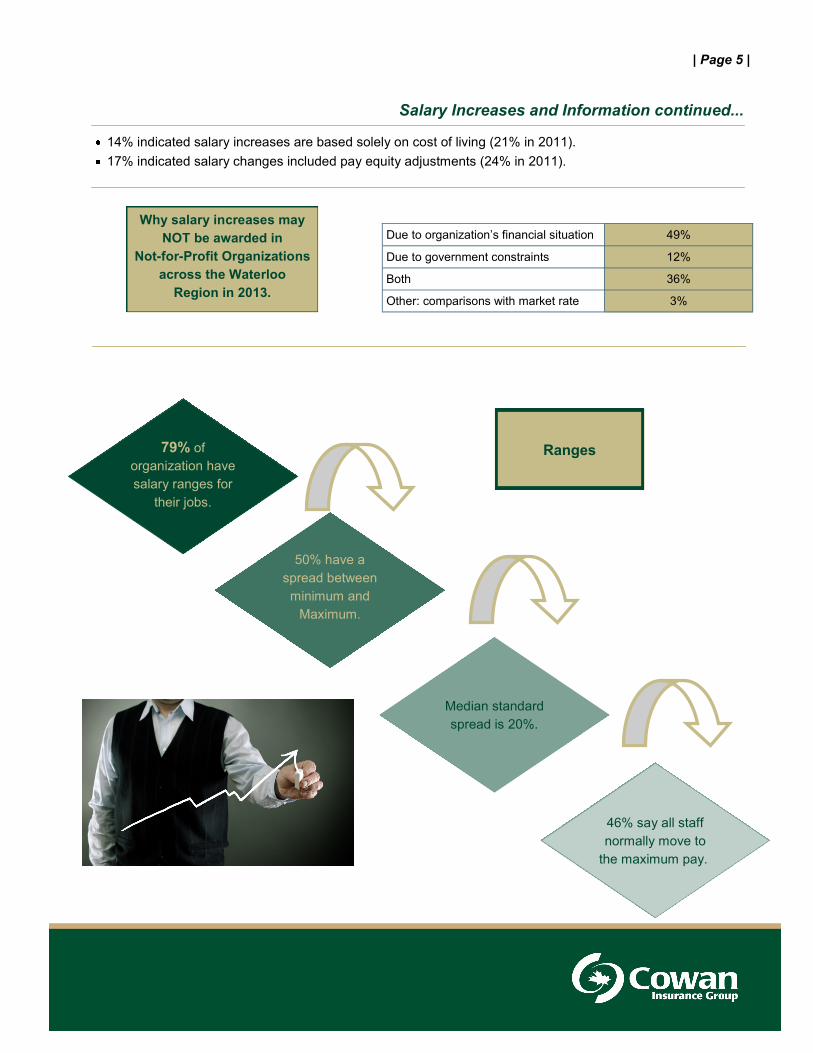
Salary Increases and Information continued...
14% indicated salary increases are based solely on cost of living (21% in 2011).
17% indicated salary changes included pay equity adjustments (24% in 2011).
Due to organization’s financial situation 49%
Due to government constraints 12%
Both 36%
Other: comparisons with market rate 3%
79% of
organization have
salary ranges for
their jobs.
50% have a
spread between
minimum and
Maximum.
Median standard
spread is 20%.
46% say all staff
normally move to
the maximum pay..
Ranges
Why salary increases may
NOT be awarded in
Not-for-Profit Organizations
across the Waterloo
Region in 2013.
| Page 6 |
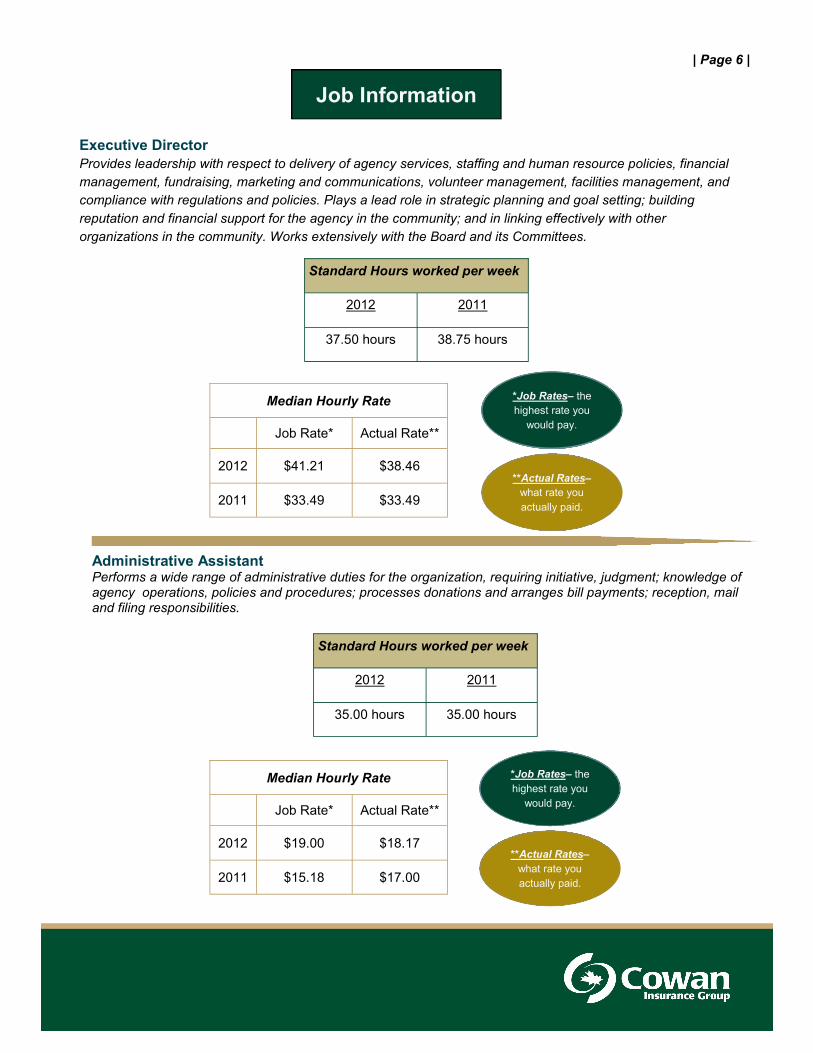
Executive Director
Provides leadership with respect to delivery of agency services, staffing and human resource policies, financial
management, fundraising, marketing and communications, volunteer management, facilities management, and
compliance with regulations and policies. Plays a lead role in strategic planning and goal setting; building
reputation and financial support for the agency in the community; and in linking effectively with other
organizations in the community. Works extensively with the Board and its Committees.
Administrative Assistant Performs a wide range of administrative duties for the organization, requiring initiative, judgment; knowledge of agency operations, policies and procedures; processes donations and arranges bill payments; reception, mail and filing responsibilities.
Job Information
Standard Hours worked per week
2012 2011
37.50 hours 38.75 hours
Median Hourly Rate
Job Rate* Actual Rate**
2012 $41.21 $38.46
2011 $33.49 $33.49
*Job Rates– the
highest rate you
would pay.
**Actual Rates–
what rate you
actually paid.
Standard Hours worked per week
2012 2011
35.00 hours 35.00 hours
Median Hourly Rate
Job Rate* Actual Rate**
2012 $19.00 $18.17
2011 $15.18 $17.00
*Job Rates– the
highest rate you
would pay.
**Actual Rates–
what rate you
actually paid.
| Page 7 |
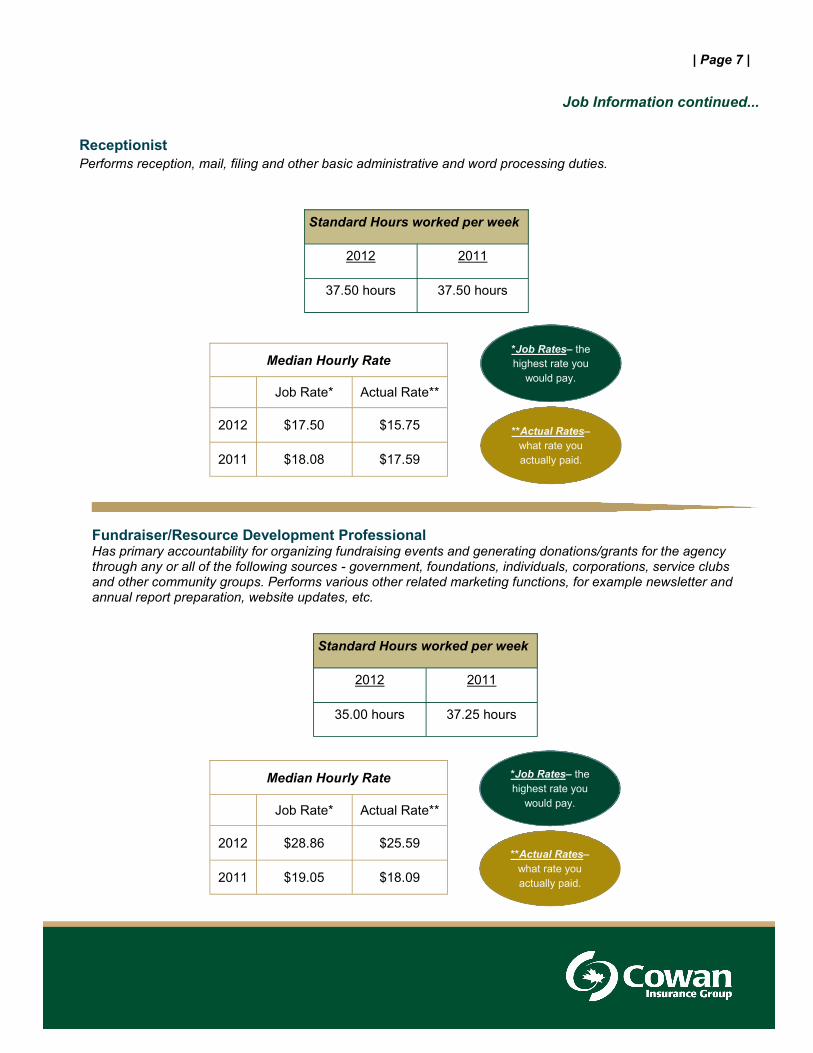
Receptionist
Performs reception, mail, filing and other basic administrative and word processing duties.
Fundraiser/Resource Development Professional Has primary accountability for organizing fundraising events and generating donations/grants for the agency through any or all of the following sources - government, foundations, individuals, corporations, service clubs and other community groups. Performs various other related marketing functions, for example newsletter and annual report preparation, website updates, etc.
Job Information continued...
Standard Hours worked per week
2012 2011
37.50 hours 37.50 hours
Median Hourly Rate
Job Rate* Actual Rate**
2012 $17.50 $15.75
2011 $18.08 $17.59
*Job Rates– the
highest rate you
would pay.
**Actual Rates–
what rate you
actually paid.
Standard Hours worked per week
2012 2011
35.00 hours 37.25 hours
Median Hourly Rate
Job Rate* Actual Rate**
2012 $28.86 $25.59
2011 $19.05 $18.09
*Job Rates– the
highest rate you
would pay.
**Actual Rates–
what rate you
actually paid.
| Page 8 |
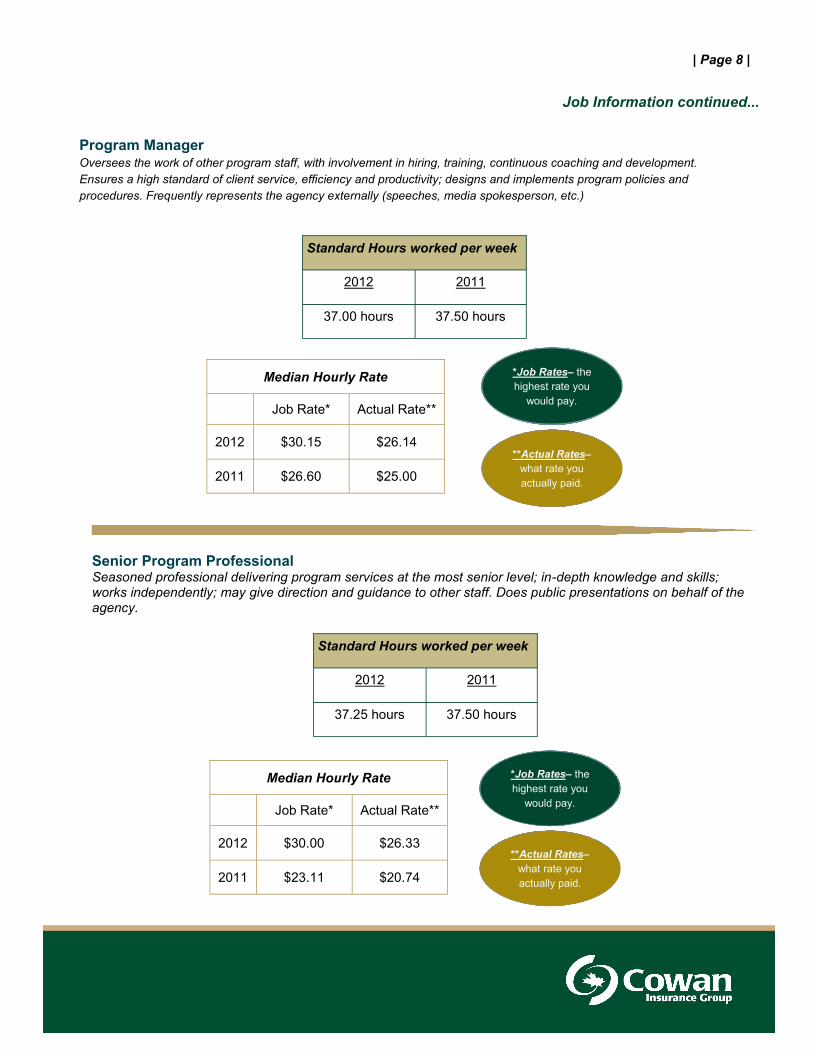
Program Manager Oversees the work of other program staff, with involvement in hiring, training, continuous coaching and development.
Ensures a high standard of client service, efficiency and productivity; designs and implements program policies and
procedures. Frequently represents the agency externally (speeches, media spokesperson, etc.)
Senior Program Professional Seasoned professional delivering program services at the most senior level; in-depth knowledge and skills; works independently; may give direction and guidance to other staff. Does public presentations on behalf of the agency.
Job Information continued...
Standard Hours worked per week
2012 2011
37.00 hours 37.50 hours
Median Hourly Rate
Job Rate* Actual Rate**
2012 $30.15 $26.14
2011 $26.60 $25.00
*Job Rates– the
highest rate you
would pay.
**Actual Rates–
what rate you
actually paid.
Standard Hours worked per week
2012 2011
37.25 hours 37.50 hours
Median Hourly Rate
Job Rate* Actual Rate**
2012 $30.00 $26.33
2011 $23.11 $20.74
*Job Rates– the
highest rate you
would pay.
**Actual Rates–
what rate you
actually paid.
| Page 9 |
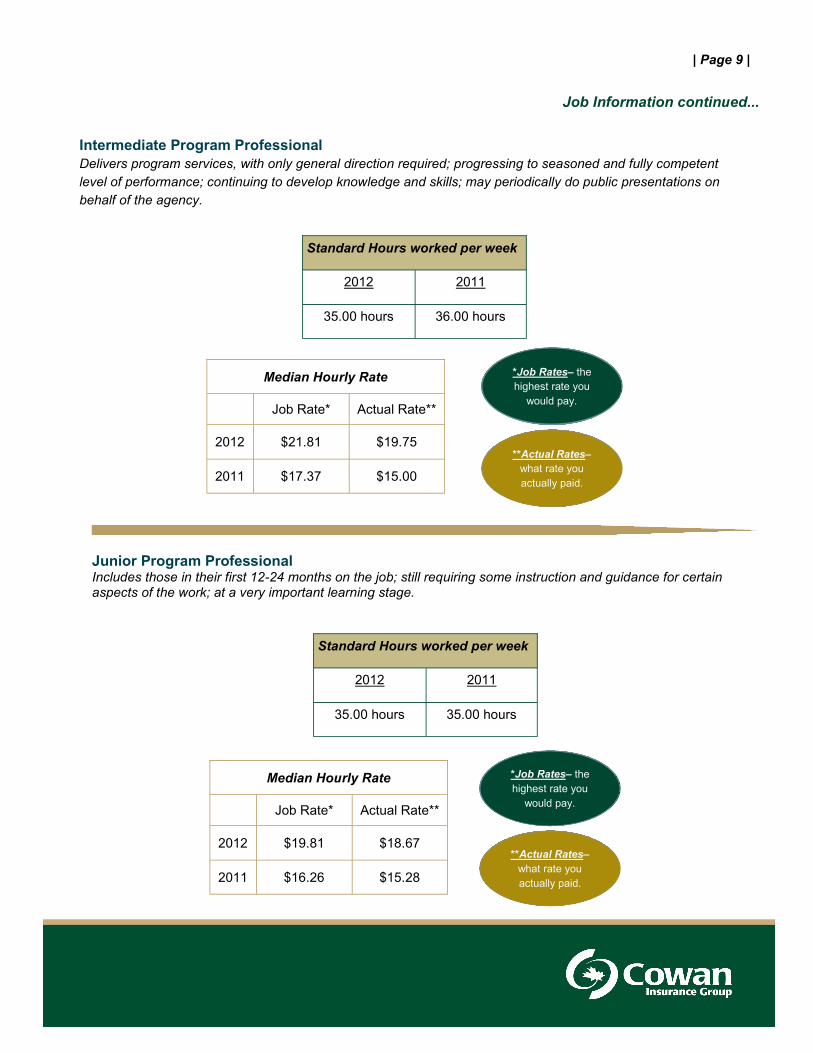
Intermediate Program Professional
Delivers program services, with only general direction required; progressing to seasoned and fully competent
level of performance; continuing to develop knowledge and skills; may periodically do public presentations on
behalf of the agency.
Junior Program Professional Includes those in their first 12-24 months on the job; still requiring some instruction and guidance for certain aspects of the work; at a very important learning stage.
Job Information continued...
Standard Hours worked per week
2012 2011
35.00 hours 36.00 hours
Median Hourly Rate
Job Rate* Actual Rate**
2012 $21.81 $19.75
2011 $17.37 $15.00
*Job Rates– the
highest rate you
would pay.
**Actual Rates–
what rate you
actually paid.
Standard Hours worked per week
2012 2011
35.00 hours 35.00 hours
Median Hourly Rate
Job Rate* Actual Rate**
2012 $19.81 $18.67
2011 $16.26 $15.28
*Job Rates– the
highest rate you
would pay.
**Actual Rates–
what rate you
actually paid.
| Page 10 |
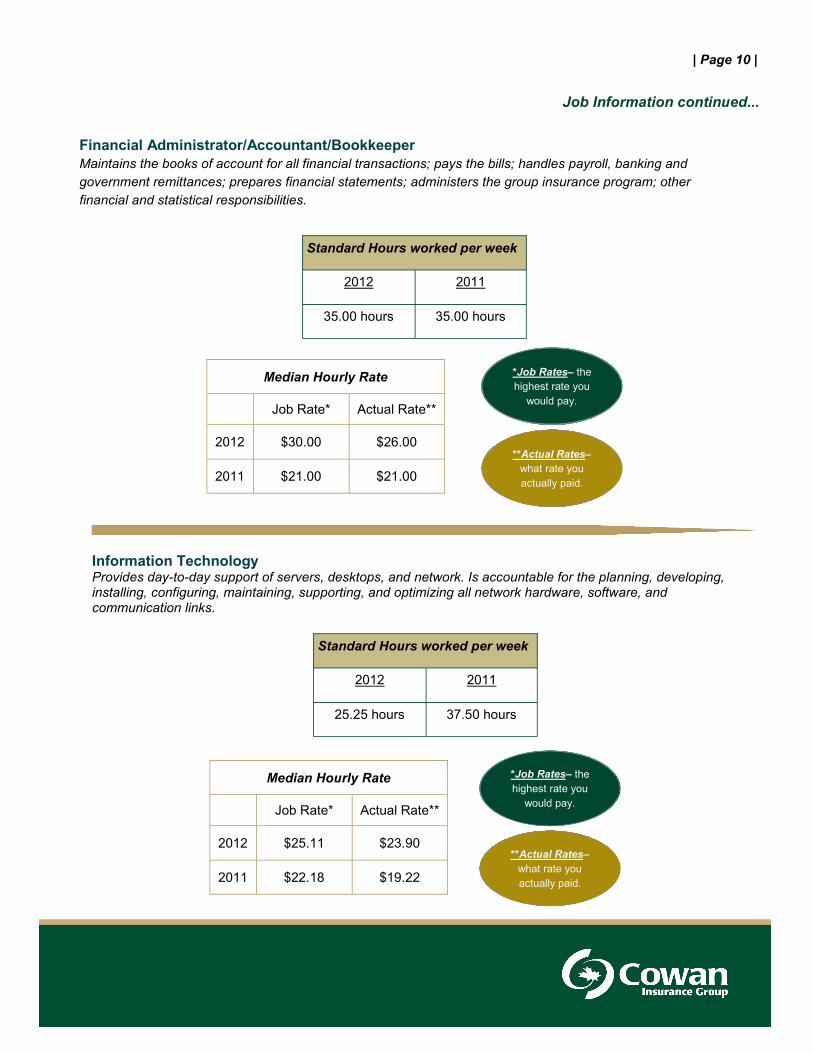
Financial Administrator/Accountant/Bookkeeper
Maintains the books of account for all financial transactions; pays the bills; handles payroll, banking and
government remittances; prepares financial statements; administers the group insurance program; other
financial and statistical responsibilities.
Information Technology Provides day-to-day support of servers, desktops, and network. Is accountable for the planning, developing, installing, configuring, maintaining, supporting, and optimizing all network hardware, software, and communication links.
Job Information continued...
Standard Hours worked per week
2012 2011
35.00 hours 35.00 hours
Median Hourly Rate
Job Rate* Actual Rate**
2012 $30.00 $26.00
2011 $21.00 $21.00
*Job Rates– the
highest rate you
would pay.
**Actual Rates–
what rate you
actually paid.
Standard Hours worked per week
2012 2011
25.25 hours 37.50 hours
Median Hourly Rate
Job Rate* Actual Rate**
2012 $25.11 $23.90
2011 $22.18 $19.22
*Job Rates– the
highest rate you
would pay.
**Actual Rates–
what rate you
actually paid.
| Page 11 |
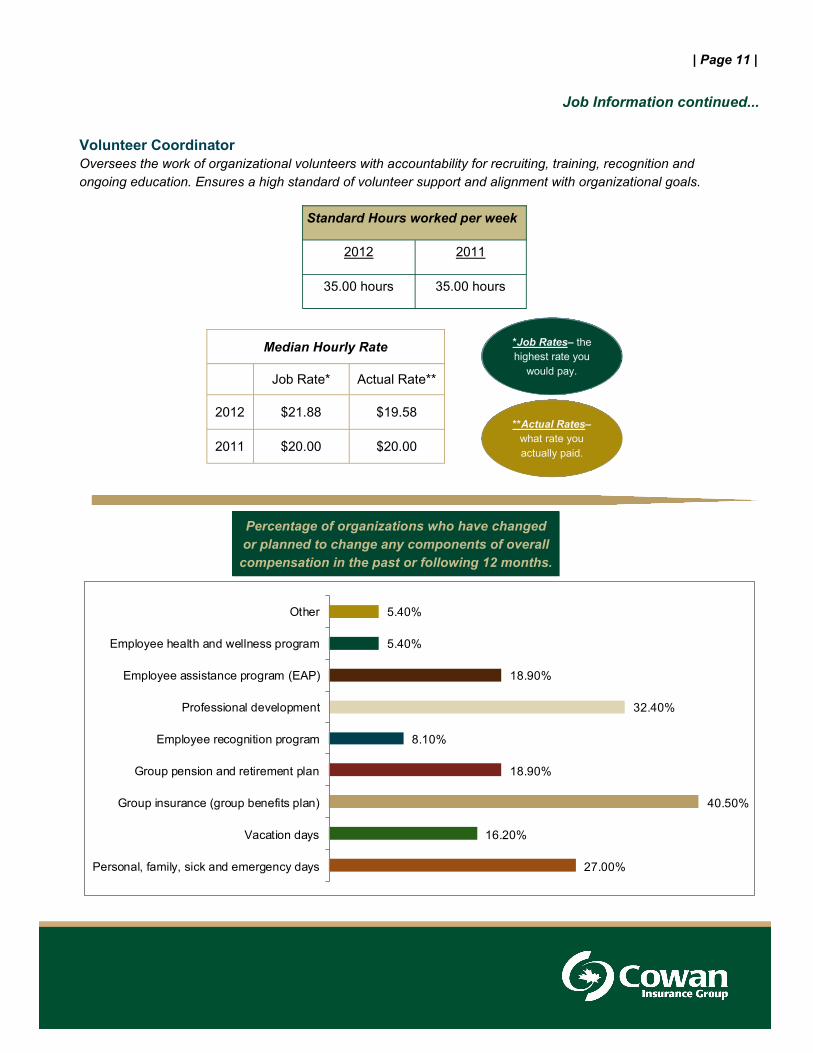
Volunteer Coordinator
Oversees the work of organizational volunteers with accountability for recruiting, training, recognition and
ongoing education. Ensures a high standard of volunteer support and alignment with organizational goals.
Job Information continued...
27.00%
16.20%
40.50%
18.90%
8.10%
32.40%
18.90%
5.40%
5.40%
Personal, family, sick and emergency days
Vacation days
Group insurance (group benefits plan)
Group pension and retirement plan
Employee recognition program
Professional development
Employee assistance program (EAP)
Employee health and wellness program
Other
Standard Hours worked per week
2012 2011
35.00 hours 35.00 hours
Median Hourly Rate
Job Rate* Actual Rate**
2012 $21.88 $19.58
2011 $20.00 $20.00
*Job Rates– the
highest rate you
would pay.
**Actual Rates–
what rate you
actually paid.
Percentage of organizations who have changed
or planned to change any components of overall
compensation in the past or following 12 months.
| Page 12 |
Summary and Closing Remarks
The most noteworthy result in this year’s survey is the number of agencies anticipating salary increases for 2013
(46%) versus those who anticipated salary increases for 2012 (70%). This reflects the extremely challenging
environment that exists in this sector. The balancing act, between funding challenges and an increased need for
many of the services provided, is something not-for-profit leaders are dealing with on a daily basis.
Organizations are continually looking for changes that can be made in a way that will have minimal impact on the
people they serve. As indicated at the bottom of page 13, this includes reviewing overall compensation
budgets. At Cowan, we can assist with this review and, in many instances, find cost saving strategies without
changing the overall compensation being delivered to your teams.
Let’s keep the conversation going….
Email me at [email protected] if you want to discuss.
Thank you to everyone for their participation.
If you have any questions or concerns please contact:
Marisa Macnab by email at [email protected] or by phone at 1-877-578-6030 ext. 51409.
“Unless someone like you cares a whole awful lot, nothing is going to get
better. It’s not.”
~ Dr. Seuss
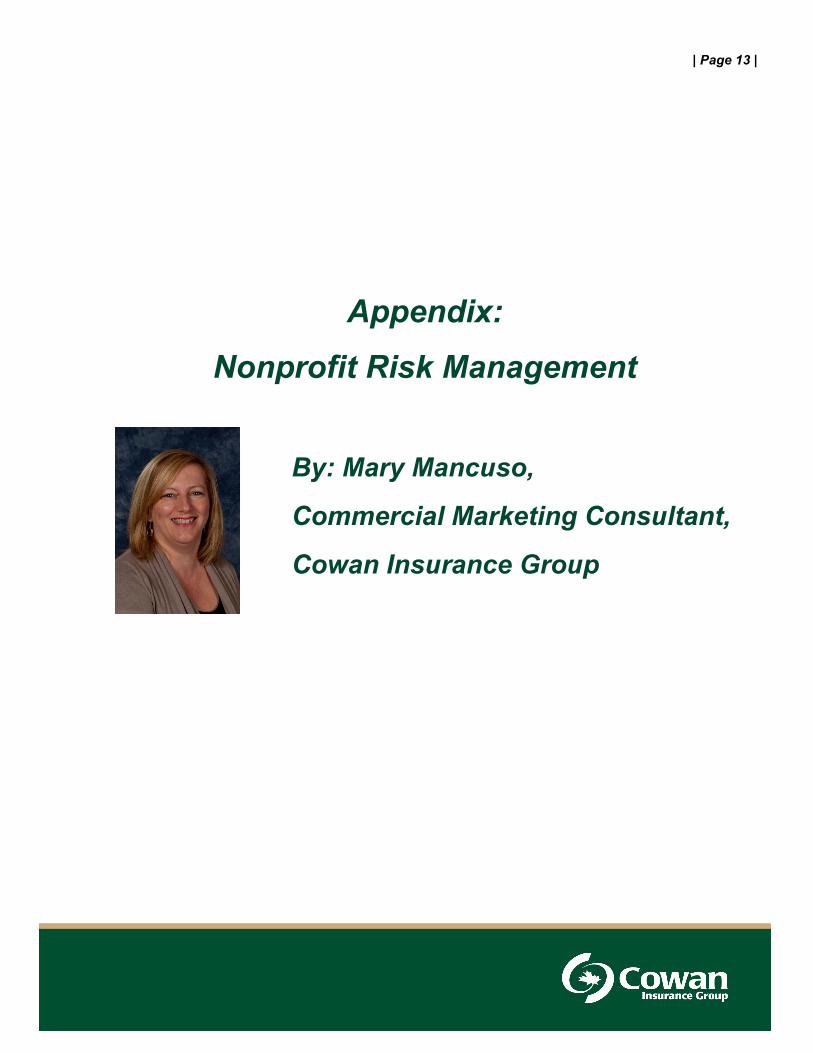
Appendix:
Nonprofit Risk Management
By: Mary Mancuso,
Commercial Marketing Consultant,
Cowan Insurance Group
| Page 13 |
Nonprofit risk management
Nonprofit organizations face unique risk management challenges. They are often held to the same standards
as for-profit organizations but do not have the same resources and knowledge to understand their risks and
how to mitigate them. Legal and financial requirements may determine some of the risks your organization
faces. For example, you must be compliant with tax reporting regulations. If you are not, there may be
financial and legal repercussions. Heightened public scrutiny on nonprofit organizations has also created a
new risk for nonprofit organizations: reputational risk. Controversial actions or decisions can create bad
publicity and alienate supporters, effectively preventing nonprofits from receiving the funding or volunteer base
needed to achieve goals.
All nonprofits should address risk management, regardless of the size of the organization. Organizations
without the processes and people in place to manage risk exposure are vulnerable to devastating losses if a
crisis situation occurs. Addressing risk management before a problem arises decreases your nonprofits risk
exposure and the potential for damages or liability.
Best practice dictates that risk management be addressed when an organization is established and reviewed
annually, at a minimum, to ensure that all risks are understood and accounted for. If your organization does
not have a risk management policy, every practice, event or action by the organization, its employees or
volunteers increases exposure to liability.
What is risk management?
Risk management is the process of identifying your legal, financial and reputational risks and taking steps to
avoid exposure to them. If your nonprofit’s financial assets were compromised, how would you respond? If
your organization had a public relations crisis, how would you protect your reputation? If your facility was
damaged, could your organization continue operating? A well-developed risk management policy helps you
respond to an emergency quickly and minimizes the effect on your operations.
It’s vital that your risk management policy be supported and championed at the executive and leadership
levels. Initiating a risk management culture at these levels helps that culture grow to reach all members of your
organization. Because nonprofits depend heavily on all their employees and volunteers to contribute to the
success of the organization, organization-wide knowledge of how risk management protects the
organization is a vital part of mitigating your risks.
While risk management must start at the leadership level, it cannot be managed without the input of people
from all areas of your organization. A successful risk management culture invites and welcomes involvement
from people across all levels of the organization. Members of the board of directors, leadership teams,
management, operations staff and volunteers each bring a unique knowledge and understanding of the type of
risks they face on a day-to-day basis. Understanding those risks and working together to mitigate them is part
of your nonprofit’s due diligence and responsibility to all parties involved in your organization.
Risk management planning
Risk management requires time and dedication. You must understand your organization and the risks it faces
before you invest in risk mitigation strategies. Failure to do so increases the likelihood of overlooking potential
risks and leaving your organization unprotected.
Your risk management policy should help your organization act in accordance with its values while mitigating
legal, financial and ethical risks. It should be documented and easily available for anyone in your organization
to review. It can be used if you are required to defend your risk management practices and to train staff and
employees on proper risk management strategies.
Your policy should:
1. Identify the risks your nonprofit faces.
2. Assess the effect experiencing each risk would have on your organization.
3. Offer ways to prevent such risks from occurring.
Outline risk response strategies in the event of an unpreventable crisis.
Identifying your risks
Before you can identify your risks, you must define what a risk is. For most organizations, a risk is the
potential for your organization’s actions or decisions to produce an undesired result. It can also be the
potential for the actions or decisions of someone outside your organization to produce an undesirable result
that may be attributed to your organization. You may face physical risks, legal risks, reputation risks and
financial risks, to name a few.
It is impossible to mitigate all risks, but knowing what risks your organization faces can help you develop
strategies to reduce or eliminate them. Nonprofits face a wide range of risks and often lack the resources or
knowledge to fully understand them all. In addition to seeking input from all members of your organization, you
should seek expertise from insurance, legal and financial professionals to fully mitigate your risk exposure.
Some risk areas to review include:
Financial risks: Do you know who is responsible for verifying and auditing your organization’s finances? Are
your financial records up-to-date? Do you have the checks and balances in place to prevent fraud? Are you
compliant with tax regulations? Managing your non-profit’s financial risks involves knowing the status of your
financial situation and taking steps to protect it.
Property risks: Do you have any physical security measures in place to protect your physical property? Video
monitoring, alarm systems, safety and security processes and security personnel can protect your
organization from property risks such as theft or vandalism. Fire suppression systems, including smoke
detectors, sprinklers and fire extinguishers, can prevent or limit fire damage.
Personal safety risks: Are your employees and volunteers safe while working for your organization? Have they been adequately trained for the jobs they are performing? Are there processes in place to deal with health and safety accidents? Is your organization liable for any accidents or injuries that occur on your property or at your events?
Reputational risks: Who manages your organization’s brand and reputation? Who is responsible for
reviewing content and messaging before it is presented to the public? How do you ensure that the information
your organization creates or promotes, the events it sponsors and the people it associates with match your
corporate goals, mission and values? Who responds to media inquiries and publicity requests?
Liability risks: Your organization may be held responsible for the actions of your partners, contractors,
employees and volunteers even if they have signed contracts releasing you from liability and responsibility. Do
you have the proper legal contracts in place with landlords, contractors, service providers and event sponsors
detailing the legal responsibilities of each party? Do you have adequate liability insurance to protect your
organization? Are all employees and volunteers properly screened, hired, trained and supervised when
providing services to the public?
This is just a sampling of the risks your organization may face. To fully protect yourself, your organization and
its assets, you should contact your insurance, legal and financial experts.
Assessing your risks
After you have identified all the risks your organization faces, examine each one to determine what effect it
would have on your operations. Each risk will affect your organization differently. Understanding the
consequences will help you develop successful prevention plans and response strategies.
When completing your risk assessment, consider the following questions to.
Why is the organization susceptible to this risk?
What is the likelihood of experiencing this risk?
What consequences will the organization face if it experiences this risk?
For example, let’s assess some of the risks associated with using social media. Social media has changed
how organizations communicate with clients, donors and the general public, demanding that organizations
interact with their audience. It creates opportunities to engage the audience, and to gather information and
feedback from them, allowing your organization to better position itself for success. These benefits have
compelled many nonprofit organizations to use social media as a market research and promotion tool. It has
also exposed them to a variety of new risks, including:
Defamation: Any organization may be held responsible for something an employee has written or said on
behalf of the organization on any social media supported by the organization.
Copyright: Reusing third-party content in a blog, tweet or any other social media interaction without giving the
proper credit may leave your organization liable to copyright infringement.
Reputation management: Participating in social media means you are inviting comments and criticism from
your audience. Negative publicity can spread quickly and be difficult to control.
To assess the effect these social media risks could have on your organization, ask each of the questions
above about each risk. Is your organization susceptible to defamation risks? What is the likelihood that you will
experience that risk? What are the consequences if you do?
To answer those questions, you will need to research your social media practices. Understanding your current
practices and past experiences will help you accurately gage the effect a risk factor will have on your
organization. Talk to social media experts, brand managers and legal counsel to determine if your organization
is at risk. Research the issue to understand what other organizations similar to yours are experiencing and
doing to mitigate their risks. Your answers will help you develop a risk prevention policy that will decrease or
eliminate your risks.
Risk prevention
After you have identified and assessed your organization’s risk factors, your next step is developing a
comprehensive risk prevention plan. Your risk prevention plan should address each risk factor identified and
offer strategies to negate the risk or decrease the probability of the risk occurring.
The type of risk prevention strategy required depends on the type of risk, the probability of it occurring and the
severity of the consequences if it does occur. Risks that have little probability of occurring and little
consequence can be dealt with through simple prevention strategies. Risks that are very probably to occur or
that could have devastating or long-term consequences require more stringent prevention planning.
A successful risk prevention plan investigates two questions:
What steps can you take to eliminate the risk?
If the risk cannot be eliminated, what steps can you take to mitigate it?
Use these two questions to evaluate each risk you identified. You will not be able to eliminate all risks, but you
should be able to find ways to mitigate each one. Mitigation strategies can include:
Insurance coverages
Volunteer screening plans
Volunteer and employee training and orientation programs
Financial procedures and reporting
Reputation management planning
Workplace health and safety standards
Technology failure and cyber risk prevention
Depending on the nature of your operations, you may require other risk prevention strategies to protect your
organization. Consult volunteer, charity, financial, legal and insurance experts when creating your risk
management plans. They can provide insight on the severity of each risk and the consequences you will face if
exposed to it. They can also guide you to effective risk mitigation procedures.
Once you have developed a thorough risk management strategy, turn your focus to implementing your
strategies and procedures. Prioritize implementation by addressing high probability and high consequence
risks first. Assign risk management tasks and make people accountable for implementing prevention strategies
by a deadline. When you feel confident that your organization has addressed those risks, you can move on to
tackling lower probability and lower consequence risks.
Risk response strategies
It is impossible to mitigate all risks. That’s why it’s critical to develop risk response strategies to compliment
your risk prevention planning. Risk response strategies outline the steps your organization will take a risk
occurs. You should plan a response strategy for each risk factor you identified.
The key objectives of a successful risk management strategy are:
a) to enable your organization to operate under normal conditions, or
b) to outline the procedures required if operations must be altered or stopped.
Your strategy should give a detailed description of the steps required to achieve scenario a and b for each risk
you identified. It should also list who is accountable for each step. It should be easy to use and to find.
Everyone with a risk response strategy accountability should be familiar with the plan and their responsibilities.
Common risk response information includes:
A list of emergency contacts.
A process for notifying and updating emergency personnel, executives, insurance companies and key
stakeholders of any risk exposure situation.
Communications strategies to notify employees, media, volunteers and other stakeholders about the
situation and alternate operating conditions.
Operational contingency plans such as moving to an alternate location or working via remote access.
The location of copies of all your business and financial paperwork. If your primary location is
inaccessible, you will need access to these documents to continue operating.
Evaluation
Your organization will change over time. You may change your operating model, your practices or your goals.
New technologies, strategies, employees or events can introduce new risks. To ensure you are fully prepared,
review and revise your risk management policy on an annual basis, after any changes in your operations or
organizational structure and after experiencing a risk.
Annual reviews allow you to accommodate for changes that do not warrant a complete risk management
review when the change occurs. Larger changes may introduce new high probability or high consequence
risks that require immediate attention. Deal with these risks as they arise so they are not forgotten. Finally, no
risk management plan is perfect. If your nonprofit experiences a risk situation, you will undoubtedly learn how
you could respond more effectively. Apply this knowledge to all areas of your risk management policy to
prepare your organization for future risks.
Mary Mancuso is a Commercial Marketing Consultant specializing in the not-for-profit industry sector at
Cowan Insurance Group. To reach her, e-mail [email protected].
Are you prepared?
Use the following questions to determine the state of your organization’s risk management readiness.
Do you have a risk management policy in place?
If no, begin the process to develop a risk management policy.
Did you consult subject matter experts and representatives from all areas of your organization to
develop the risk management policy?
If not, your risk management policy is likely incomplete. No one person can understand all the areas of your
organization. Rely on the expertise of others to ensure your policy is comprehensive and complete.
Have you documented your policy and all the procedures and training you have in place?
If no, begin the process to document your organization’s risk management policy. This document can be used
to train future employees and volunteers. A documented risk management policy may also be useful as
evidence of due diligence if a claim is filed against your organization.
Do you review your risk management policy annually/after organizational changes/after experiencing a
risk?
If no, you should begin the process of reviewing your policy. Changes in technology, staff, legal obligations or
legislation may alter your risk management requirements. Annual reviews help ensure your policy is
up-to-date.
Have you trained your staff, volunteers and third-party collaborators on your risk management policy?
A risk management policy is useless if it is not understood and applied. Training staff, volunteers and any
third-party collaborators you deal with ensures they understand and know how to apply your risk mitigation
strategies. Training is also part of your organization’s due diligence.
Do you track the full name of each employee/volunteer who attends risk management training, along
with the date and time the training occurred?
This information helps your organization be accountable if your risk management policy is questioned or used
in a legal context.
Do employees follow your policies and procedures?
A risk management policy is only effective if it is carried out. Frequent review of the implementation of your
policy ensures it is being followed. If it is not, investigate why. Is it difficult to understand? It is hard to carry out
during day-to-day activities? Is it outdated and no longer applicable? If so, adjust your strategies and
procedures to match your organization’s daily operations.