Embed Size (px)
DESCRIPTION
Alliance for Biking & Walking report. The report's data cover bicycling and walking levels and demographics; bicycle and pedestrian safety; funding for bicycle and pedestrian projects; written policies on bicycling and walking; bicycle infrastructure; bike-transit integration; bicycling and walking education and encouragement activities; public health indicators; and the economic impact of bicycling and walking
Citation preview
BICYCLING AND WALKING IN THE UNITED STATES
2012 BENCHMARKING REPORT
$34.95

Alliance for Biking & Walking2
2012 Benchmarking Report 3
BICYCLING AND WALKING IN THE UNITED STATES
2012 BENCHMARKING REPORT
Funding for this report was provided by the Centers for Disease Control and Prevention.
This project was also made possible with significant support from AARP and Planet Bike.
Copyright © 2012 by Alliance for Biking & WalkingThe Library of Congress, United States Copyright Office
All rights reserved. This report may be reproduced or transmitted with the written permission of the Alliance. Requests should be
sent to Alliance for Biking & Walking at the address below:
P.O. Box 65150Washington, DC 20035
Phone: 202-449-9692E-mail: [email protected]
Website: http://www.PeoplePoweredMovement.orgcover photo: Frank Chan, San Francisco Bicycle Coalition
Alliance for Biking & Walking4
Photo by Sarah Gilbert
Report CreditsAuthor/Project Manager: Kristen Swanson, Alliance for Biking & Walking
Research Assistant:Andrea Milne, Alliance for Biking & Walking
Research Consultants: Ralph Buehler, PhD, Virginia Tech John Pucher, PhD, Rutgers University
Benchmarking Project Advisors:Christopher Douwes, Federal Highway AdministrationDarren Flusche, League of American BicyclistsDeb Hubsmith, Safe Routes to School National PartnershipJeffrey Miller, Alliance for Biking & WalkingGabe Rousseau, PhD, Federal Highway Administration Stephen Skowronski, Centers for Disease Control and PreventionArthur M. Wendel, MD, MPH , Centers for Disease Control and Prevention
Institute of Transportation Engineers (ITE) Review Committee:Monica Altmaier, Fehr & PeersPhilip J. Caruso, PE, ITEJennifer Donlon, Alta PlanningJames Mackay, City of DenverJina Mahmoudi, ITEMeghan Mitman, Fehr & PeersMatthew D. Ridgway, AICP, PTP, Fehr & Peers Jeffrey R. Riegner, PE, AICP, Whitman, Requardt & Associates, LLPEdward R. Stollof, AICP, ITEShawn M. Turner, PE, Texas Transportation Institute
Additional Contributors:Brendon Haggerty, Clark County, WAKit Hodge, San Francisco Bicycle CoalitionSusan Peithman, Bicycle Transportation AllianceZach Vanderkooy, Bikes Belong Foundation
Editing Assistance:Maggie Warren
Photos courtesy of: Amanda Conde, Andrew Dannenburg, Andrew Schmidt, Arthur Wendall, Bicycle Transportation Alliance, Cascade Bicycle Club, Dan Burden—Walkable and Livable Communities Institute, Daniel Crouch, Daniel Lobo, Dave Delaney, David Flores, Dog company @ Flickr, Don DeBold, Ed Yourdon, Elizabeth Edwards, EPA, Eric Gilliland, Ernesto de Quesada, Frank Chan, Gabriella Salary, Greg Dunham, Greg Raisman, Jan Glas, Jim Swanson, John Lindenmayer, John Luton, jomilo75 @ Flickr, Kate McCarthy, La-Citta-Vita @ Flickr, Lasgalletas@ Flickr, Laurie Lebowsky, Lois Bielefeld, Louisville Metro Government, Mads boedker @ Flickr, Mark Stosberg, Metro Cincinnati Metro Bus, Mid-America Regional Council (Kansas City, MO), Minnesota Clean Ener-gy Resource Teams, Missouri Bicycle and Pedestrian Federation, Natalie Baker, New York City DOT, NHTSA, North Carolina DOT, Paul Adkins, Paul Dineen, Payton Chung, Roland Tanglao, Safe Routes to School National Partnership, San Francisco Bicycle Coalition, Sarah Gilbert, Seattle DOT, Shane MacRhodes, Squiggle Stephenr @ Flickr, Stephen Lee Davis, Tanya Dueri, Teena Wildman, Thomas Le Ngo, Transportation for America, Tupwonders @ Flickr, UncleBucko @ Flickr, Washington State Senate Photography, Will Weaver, Woodleywonder-works @ Flickr, Yvonne Bambrick.Photo by Sarah Gilbert
2012 Benchmarking Report 1Photo by Sarah Gilbert
ACKNOWLEDGMENTSACKNOWLEDGMENTS
This report is the result of hundreds working together. Thanks to the Centers for Disease Control and Prevention for funding the research elements of this project. Thanks to AARP and Planet Bike for funding promotion, dissemination, and other elements of this report. Thanks to Dr. John Pucher of Rutgers University and Dr. Ralph Buehler of Virginia Tech for their guidance, as well as for their contributions to the data analysis and editing of this re-port. And, to Jerry Jayjohn for quality control and Andrea Milne for her assistance with research, data collection, and illustrations.
Thanks to our review team, which includes representatives from the Federal Highway Adminis-tration, Institute of Transportation Engineers, Safe Routes to School National Partnership, and the League of American Bicyclists. Also, thanks to our advisors at the Centers for Disease Control and Prevention for providing their expertise and guidance throughout the report drafting.
Last and most importantly, thanks to the leaders of Alliance member organizations who supported this project. These leaders were the vital links to local officials and delivered the city and state sur-veys on time. This project would not have been possible without them, and it is in support of their vital work that this report has been produced.
Thanks to the following organizations and people for their help providing data for this report.
Activate Omaha, Tammie DodgeActive Transportation Alliance, Ron Burke and Adolfo HernandezAlabama Bicycle Coalition, Marjorie HoldererAlabama Department of Transportation, Mary CrenshawAlan M. Voorhees Transportation Center, Leigh Ann Von HagenAlaska Department of Transportation, Bob LaurieArizona Department of Transportation, Brian Fellows and Michael SandersAtlanta Bicycle Coalition, Rebecca SernaAustin Cycling Association, Stanton TruxilloBicycle Alliance of Minnesota, Dorian GrilleyBicycle Alliance of Washington, Barbara CulpBicycle Coalition of Greater Philadelphia, John BoyleBicycle Coalition of Maine, Nancy GrantBicycle Colorado, Dan Grunig and Justin MillarBicycle Federation of Wisconsin, Jessica Binder, Kevin Hardman, Kevin Luecke, and Amanda WhiteBicycle Indiana, Nancy TibbettBicycle Transportation Alliance, Gerik Kransky, Margaux Mennesson, Susan Peithman, Rob Sadowsky, and Chelsea WhiteBike Texas, Farideh Dassi and Robin StallingsBike Texas, Mark StineBike Walk Mississippi, Melody MoodyBike Walk Tennessee, Kyle Wagenschutz
Bike Walk Virginia, Kimberly Likens PerryBikeDenver, Lise NeerBoston Bikes, Nicole FreedmanCalifornia Bicycle Coalition, David HoffmanCalifornia Department of Transportation, Penny Gray and Ann MahaneyCapitol Region Council of Governments, Sandy FryCascade Bicycle Club, Chuck AyersCharlotte Department of Transportation, Ken TippetteChicago Department of Transportation, Ben GombergCity of Albuquerque, Jim ArrowsmithCity of Arlington, Lyndsay Mitchell and Alicia WinkelblechCity of Austin, Nadia Barrera, Annick Beaudet, and John EastmanCity of Baltimore, Nate EvansCity of Colorado Springs, Kristin Bennett and Tim RobertsCity of Dallas, Max KalhammerCity of Denver, Emily SnyderCity of El Paso, Jared MendozaCity of Fort Worth, Julia McCleearyCity of Fresno, Bryan JonesCity of Houston, Rita Balchus and Dan RaineCity of Jacksonville, James ReedCity of Kansas City, Deb RidgwayCity of Las Vegas, Connie Diso and Greg McDermottCity of Long Beach, Courtney Aguirre

Alliance for Biking & Walking2
City of Mesa, Jim HashCity of Minneapolis, Shaun MurphyCity of New Orleans, Jennifer RuleyCity of Oakland, Jason PattonCity of Oklahoma City, Randy EntzCity of Phoenix, Joseph PerezCity of Raleigh Public Works Department, Fleming El-Amin and Eric LambCity of Sacramento, Ed CoxCity of San Antonio, Julia DianaCity of San Diego, Shahriar Ammi and Samir HajjiriCity of San Jose, John BrazilCity of Tucson Transportation Department, Tom ThivenerCity of Tulsa Public Works Department, Brent StoutCity of Virginia Beach Parks and Recreation, Wayne WilcoxCoalition of Arizona Bicyclists, Robert JensenConsider Biking, Jeff StephensDelaware Department of Transportation, Anthony AglioDistrict Department of Transportation, Mike GoodnoFederal Highway Administration, Donna JonesFlorida Bicycle Association, Laura HallamFlorida Department of Transportation, Dennis ScottFlorida State Safety Office, Dwight KingsburyGeorgia Office of Planning, Byron RushingGreen Mobility Network, John HopkinsHawaii Bicycling League, Chad TaniguchiHonolulu Dept. of Transportation Services, Chris SayersIdaho Transportation Department, Maureen GreshamIowa Bicycle Coalition, Mark WyattIowa Department of Transportation, Craig O'Riley and Milly OrtizKansas Department of Transportation, Becky PepperKentucky Division of Planning, Lynn SoporowskiKentucky Transportation Cabinet, Felicia HarperLake Tahoe Bicycle Coalition, Ty PolastriLeague of American Bicyclists, Bill Nesper and Jeff PeelLeague of Illinois Bicyclists, Ed BarsottiLeague of Michigan Bicyclists, Rich MoellerLittle Rock Bicycle Friendly Committee, Bud LaumerLivableStreets, Jacqueline DouglasLos Angeles County Bicycle Coalition, Michelle Craven, Jennifer Klausner, and Alexis LantzLouisiana Department of Transportation and Development, Thomas ParsonsLouisville Metro Public Works, Rolf Eisinger and Dirk GowinMaryland Dept. of Transportation, Michael JacksonMassachusetts Department of Transportation, Catherine Cagle and Josh LehmanMassBike, David WatsonMemphis Urban Area Metropolitan Planning Organization, Paul MorrisMichigan Department of Transportation, Josh DeBruynMinnesota Department of Transportation, Mary Elizabeth Jackson and Tim R. Mitchell
Missouri Bicycle & Pedestrian Federation, Brent HughMountain State Wheelers Bicycle Club, Dennis StrawnNational Center for Safe Routes to School, Caroline Dickson and Nancy Pullen-SeufertNational Complete Streets Coalition, Stefanie SeskinNational Transportation Enhancements Clearinghouse, Tracy Hadden LohNebraska Department of Roads, David SchoenmakerNevada Department of Transportation, Bill StoryNew Hampshire Bureau of Rail and Transit, Larry KenistonNew Hampshire Dept. of Transportation, Jerry MooreNew York City Department of Transportation, Jennifer Harris-Hernandez and Hayes LordNew York State Dept. of Transportation, Eric OphardtNorth Carolina Bicycle and Pedestrian Transportation, Helen ChaneyNorth Dakota Dept. of Transportation, Bennett KubischtaOhio Department of Transportation, Heather BowdenOklahoma Bicycling Coalition, Pete KramerOklahoma Department of Transportation, Ginger McGovern and Lary WillisPalmetto Cycling Coalition, Rachael BronsonPennsylvania Walks & Bikes, Josh KarnsPhiladelphia Mayor's Office of Transportation & Utilities, Charles CarmaltRegional Transportation Commission of South Nevada, Jerry DukeRhode Island Bicycle Coalition, Barry SchillerRhode Island Dept. of Transportation, Steve ChurchSafe Routes to School National Partnership, Margo PedrosoSan Diego County Bicycle Coalition, Kathy KeehanSan Francisco Bicycle Coalition, Neal Patel and Kit HodgeSeattle Department of Transportation, Doug CoxSouth Carolina Dept. of Transportation, Tom DoddsSouth Dakota Dept. of Transportation, Craig McIntyreSTN Media Group, Ryan GraySt. Paul Smart Trips, Jessica Treat Street Plans Collaborative, Mike Lydon Tennessee Department of Transportation, Jessica WilsonTeton Valley Trails and Pathways, Tim AdamsTransportation Alternatives, Aja Hazelhoff and Caroline SamponaroUtah Department of Transportation, Evelyn TuddenhamVermont Agency of Transportation, Jon KaplanVirginia Bicycling Federation, Champe BurnleyVirginia Department of Transportation, Liz McAdoryWalk/Bike Nashville, David Kleinfelter and Thomas O'ConnellWashington Area Bicyclist Association, Shane FarthingWashington Metropolitan Area Transit Authority, Kristin HaldemanWisconsin Department of Transportation, Tom HuberWyoming Department of Transportation, Talbot Hauffe
ACKNOWLEDGMENTS
2012 Benchmarking Report 3
CONTENTS
TABLE OF CONTENTS
Acknowledgments.....................................1
Preface...............................................................................................................6 Alliance for Biking & Walking..........................6
Benchmarking Project Origins....................6
Executive Summary....................................8Objectives....................................................8Data Collection...........................................9 Key Trends 2005-2010.................................9Results........................................................10
Overview of Walking, Bicycling, Transit, and Car Mode Share........................10
Changes 2005-2010..................................10 High to Low Ranking of Bicycling and
Walking Levels...............................11 Low to High Ranking of Bike/Ped Fatality
Rates..............................................12 High to Low Ranking of Per Capita Funding to Bike/Ped....................................13 State Overview of Primary Benchmarking Indicators........................................14
City Overview of Primary Benchmarking Indicators.......................................15
Conclusions..............................................19
1: Introduction............................................20 Benchmarking Bicycling and Walking......21 Objectives....................................................22
Study Areas and Data Collection..............24 Study Area Populations...................................24
Primary Benchmarks in this Report...........26 Benchmarks in This Report........................27
Using This Report........................................28
2: Levels of Bicycling and Walking...29How Many People Bicycle and Walk?.......29 State Ranking: Bicycling and Walking to
Work...............................................30 City Ranking: Bicycling and Walking to
Work...............................................31 Workers' Commutes in U.S. by Mode of Transport..............................................31
Levels of Walking to Work in U.S....................32 Levels of Bicycling to Work in U.S..................32
Share of Commuters Who Bicycle or Walk 1990-2009......................................33 Share of Commuters Who Walk and Bicycle
in 50 States....................................34 Share of Commuters Who Walk and Bicycle
in Largest U.S. Cities......................35Looking Outside the Borders—Bicycling and
Walking Levels and Demographics.............36Who Bicycles and Walks?...........................41 Pedestrian Commuters by Income
Classification.................................41 Bicyclist and Pedestrian Mode Share
by Income Class...........................41 A Look at Income.........................................42 A Look at Ethnicity........................................43 A Look at Gender.........................................44 Bicycling to Work in States...........................45 Bicycling to Work in Cities............................45
Walking to Work in States.............................46 Walking to Work in Cities..............................47 A Look at Age...............................................48
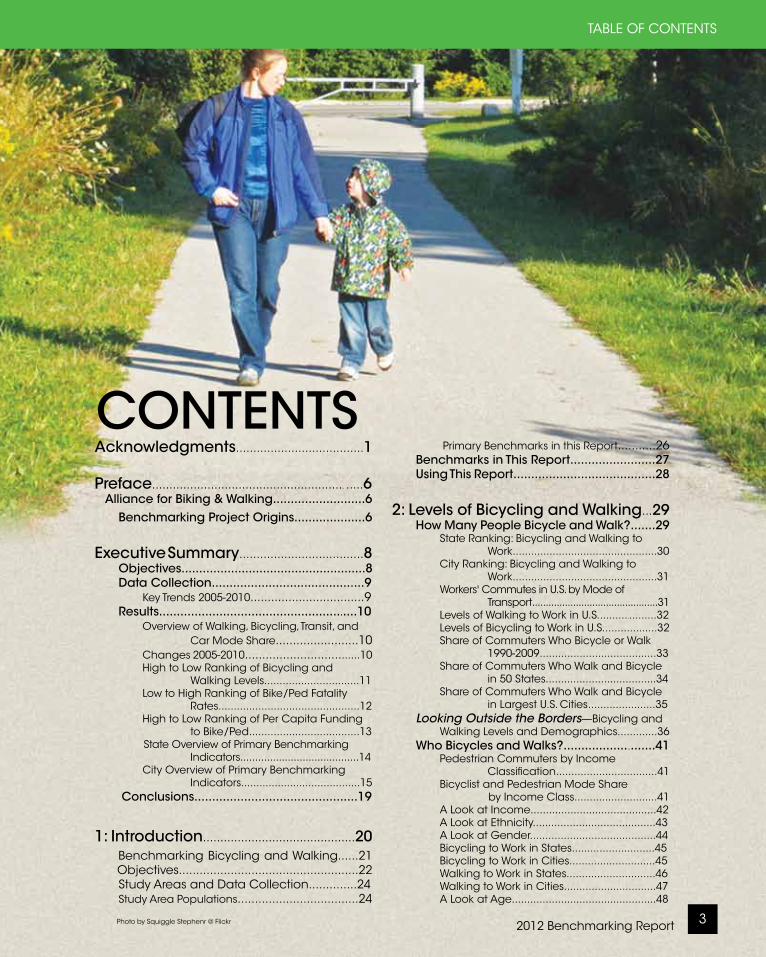
Photo by Squiggle Stephenr @ Flickr
Alliance for Biking & Walking4
3: Safety.........................................................49 Overview of Walking and Pedestrian Safety Nationwide and in Largest U.S. Cities......50 Overview of Bicycling and Bicycle Safety Nationwide and in Largest U.S. Cities......50Victim Demographics...............................50 Safety Demographics...................................51What's the Risk?.........................................52 Safest Places to Bike Ranking.......................52 Safest Places to Walk Ranking......................53 Bicyclist and Pedestrian Risk by State..........54 Fatality Trends................................................55 Pedestrian Safety in States...........................56 Bicycle Safety in States.................................57 Bicycle Safety in Cities..................................59Looking Outside the Borders—Pedestrian
and Bicyclist Fatalities and Injuries.............60 Pedestrian Safety in Cities...........................62 State Safety Policies and Funding...............63 Emerging Trends........................................64Safety Policy...............................................64
4: Policies......................................................65 Bicycling and Walking Policies.................67
Planning for Bicycling and Walking in States.............................................68
Planning for Bicycling and Walking in Cities..............................................69
Complete Streets Policies............................71State Policies.................................................72 City Policies...................................................73State Safe Routes to School Policies...........76Safe Routes to School in Cities....................77State Bicycle Policies....................................79State Legislation Relating to Bicycling........80
Funding Bicycling and Walking................82 Percent of Federal Transportation Dollars to Bicycling and Walking..................82 Bicycle and Pedestrian Dollars by Funding Program............................................82 Percent of Transportation Dollars to Bike/ Ped................................................83 Trends in Bicycle and Pedestrian Projects and Spending 1992-2010.............84 Composition of Federal Funding for Bike/ Ped Provisions in Largest U.S. Cities................................................85 Bike/Ped Funding in States..........................86 Bike/Ped Funding in Cities............................87 Distribution of TE Funding by Category.......88 Distribution of TE Funding across Bicycle and Pedestrian Projects........................88 Percent of Transportation Enhancement Funding to Bike/Ped by State.......89 Transportation Enhancement Rescissions..90 Overall Transportation Versus TE Rescissions by Fiscal Year..................................91 Safe Routes to School Funding....................92 Stimulus Bill Funding.....................................94
Looking Outside the Borders—Investing in Bicycling and Walking..................................96 Existing Bicycle Facilities in Major U.S. Cities.98 Bike/Ped Infrastructure in Cities...................99
TABLE OF CONTENTS
CLOSER LOOK: San Francisco's Burgeoning Bicycle Network...........................100 Growth in Bicycle Facilities in Major U.S. Cities 2009-2011..........................102 Innovative Facilities in Cities......................104 Innovative Facilities Defined......................105 Inventory of Existing Bicycle Routes...........106 U.S. Bicycle Route System Corridor Plan....107 U.S. Bicycle Route Policy.............................108 Bike-Transit Integration................................109
5: Education and Encouragement...1102 of the "5 Es"..........................................110Educating Professionals..........................110 Bike/Ped Professional Education in States...111Educating the Public..............................112 Public Education and Events in States.....113 Bicycle Promotion in Cities........................114 Adult Bicycle Education Courses.............116 Adult Bicycle Education: Adults Per One Participant...........................................117 Youth Bicycle Education Courses.............118
Youth Bicycle Education: Youth Per One Participant.............................................119 Encouragement Programs and Events...121 Bike to Work Day Events..............................121 Schools Participating in Bike and Walk to School Day..................................122 Number of Schools Participating in Walk and Bike to School Day ........................123 City-Sponsored Bicycle Rides.....................125 Open Street/Ciclovia Initiatives.................126
6: Grassroots Advocacy......................127 Growing the Movement..........................127Advocacy as an Indicator......................127 Alliance U.S. Bike/Ped Advocacy Organizations..............................128 Proving Effectiveness...............................128 Measuring Advocacy Capacity.............129 Breakdown of Every Dollar Earned by Statewide Alliance Organizations.........129 Breakdown of Every Dollar Earned by Alliance Organizations Serving Cities...129 Advocacy Capacity Ranking....................130 Per Capita Revenue of Statewide Alliance Organizations.........................................131 Revenue Sources of Statewide Alliance Organizations........................................132
Revenue Sources of Alliance Organizations Serving Cities........................................133 Number of Residents Per One Member in Statewide Alliance Organizations........135 Number of Residents Per One Member in Alliance Organizations Serving Cities...136 Capacity of Statewide Alliance Organizations............................. .138 CLOSER LOOK: Bicycle Transportation Alliance..........................................139 Capacity of Alliance Organizations Serving Cities................................................140 CLOSER LOOK: Cascade Bicycle Club........141
2012 Benchmarking Report 5
TABLE OF CONTENTS
7: Influencing Bicycling and Walking............................................143
Environmental Influences..........................143 Comparing Average Summer and Winter Temperatures to Bicycling Levels......144
Residential Density and Bicycling and Walking Levels in Major U.S. Cities......145 Comparing Facility Miles to Bicycling Levels...................................................146
Socioeconomics and Demographics......147 Comparing Car Ownership to Bicycling and Walking Levels....................................148
Relationship between Bicycle Fatalities and Bicycling Levels..................................149 Relationship between Pedestrian Fatalities and Walking Levels............................150Advocacy and Education........................152 Relationship between Advocacy Capacity and Mode Share................................153 CLOSER LOOK: Oregon's Rising Levels of Bicycling.............................................154 Looking Outside the Borders—Car Ownership and Bicycling and Walking Levels in Developed Nations...................................156Looking to the Leaders.............................156Looking Outside the Borders—The Bicycle
Boom in Seville, Spain...................................157
8: Public Health Benefits.......................160Bicycling, Walking, and Obesity................160 Change in Bicycling and Walking Rates vs. Adult Obesity Rates........................161
Trend in Obese Children vs. Rate of Bicycling and Walking to School...................161 Obesity Levels.................................................162 Levels of Bicycling and Walking to Work............162 Comparing Bicycling and Walking to Obesity Levels in 50 States............163 Public Health in 50 States.......................... ...164
Public Health in U.S. Cities......................... ....165 Comparing Bicycling and Walking to Diabetes Rates in 50 States.................166 Comparing Bicycling and Walking to Physical Activity Rates in 50 States......167 CLOSER LOOK: Clark County, WA's Health Impact Assessment........................168Looking Outside the Borders—Obesity Levels in Developed Nations...................................170 Comparing Bicycling and Walking to High Blood Pressure Rates in 50 States........172Other Health Indicators.............................173
9: Economic Benefits.......................174 Estimating Economic Impact....................174 An Economic Boost...................................175 Job Creation from Bike/Ped Projects...........175 Overview of Bike/Ped Economic Impact Studies............................................177 Lasting Impact............................................178 Economic Impact of Bike/Ped Events.........180 CLOSER LOOK: North Carolina Attracts Bicycle Tourists................................181
We Pay For In a Gallon of Regular Gasoline......................................182 Nonmotorized Transport is Generally Cheaper Than Alternatives.........182 U.S. Oil Imports by Country of Origin........ .183 Bay Area Household Transportation Expenditures................................183 Cost/Benefit............................................184 Percent of Household Expenses Related to Transportation Versus Levels of Bicycling and Walking to Work...185 Annual Household Transportation Expenses.................................... .185 Obesity Costs and Potential Health Savings........................................186 How an Average Households Spends a Dollar............................................187 How the Federal Government Spends a Tax Dollar............................................187 CLOSER LOOK: Cost/Benefits of Bicycling Investment in Portland, OR.........188
Looking Outside the Borders—Bicycling in Groningen: An Economic Program...........190
10: Conclusion........................................193
Appendix 1: Overview of Data Sources..........................................199Appendix 2: Organization and Study Area Matches...............200Appendix 3: Challenges with Trip Data...............................................202Appendix 4: Additional Data on Bicycling and Walking Commute Trends......................205 Bicycle to Work Levels by City 1990-2009....205 Bicycle to Work Levels by State 1990-2009....206 Walking to Work Levels by City 1990-2009....207 Walking to Work Levels by State 1990-2009....208
Appendix 5:Additional Resources...209Appendix 6: Overview of Other Benchmarking Efforts.......... ..218 Benchmarking Efforts Abroad...................219 Benchmarking Efforts in the U.S.................221 Links to Other Benchmarking Efforts..........223 Benchmarking Together.............................227
Appendix 7: Corrections to 2010 Benchmarking Report.........228Bibliography..............................................231
Alliance for Biking & Walking6
EXECUTIVE SUMMARYPREFACE
Alliance for Biking & WalkingAlliance for Biking & Walking is the North American coalition of grassroots bicycling and walking advocacy or-ganizations. Our mission is to create, strengthen, and unite state/provincial and local bicycle and pedestrian advo-cacy organizations. Since our found-ing in 1996, we have grown from 12 to nearly 200 member organizations rep-resenting 48 U.S. states, four Canadian provinces, and Mexico City.
In the last 16 years, we have improved the effectiveness of our organizations through trainings and the sharing of best practice models in organizational development and bicycling and walk-ing initiatives. We are continually im-proving our delivery channels through executive coaching, replicable models, trainings, our on-call support system, strategic planning, and resources like this report.
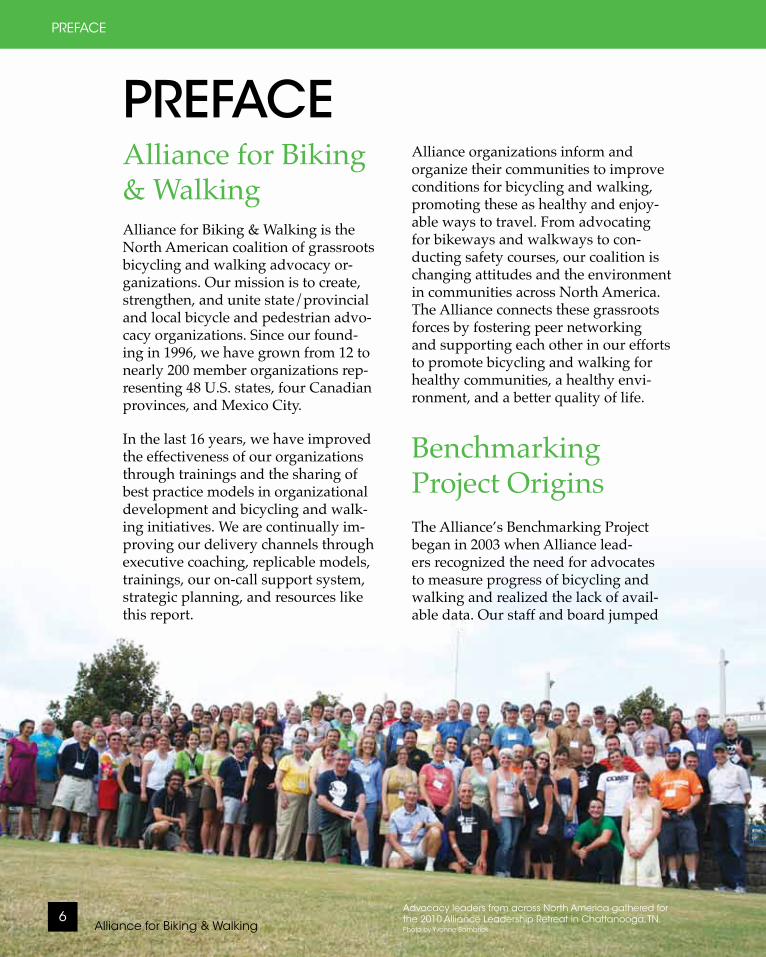
PREFACEAlliance organizations inform and organize their communities to improve conditions for bicycling and walking, promoting these as healthy and enjoy-able ways to travel. From advocating for bikeways and walkways to con-ducting safety courses, our coalition is changing attitudes and the environment in communities across North America. The Alliance connects these grassroots forces by fostering peer networking and supporting each other in our efforts to promote bicycling and walking for healthy communities, a healthy envi-ronment, and a better quality of life.
Benchmarking Project OriginsThe Alliance’s Benchmarking Project began in 2003 when Alliance lead-ers recognized the need for advocates to measure progress of bicycling and walking and realized the lack of avail-able data. Our staff and board jumped
Advocacy leaders from across North America gathered for the 2010 Alliance Leadership Retreat in Chattanooga, TN.Photo by Yvonne Bambrick
2012 Benchmarking Report 7
remove infectious disease risks in the previous century. In 2004 the Alliance completed a pilot benchmarking report collecting data only on bicycling from just 15 cities and 15 states to test methods for the project. This first report helped pave a smoother path for the collection of more comprehensive data from all 50 states and 50 cities in 2006 and 2007. The first full report on the status of bicycling and walking in the United States was published in August 2007 (under the organization's former name: Thunder-head Alliance). The second full report was published in January 2010. This second report marked the first time we had in place a system to track usage and dissemination of report findings. To date, nearly 6,000 copies of the report have been downloaded or distributed. The 2010 report was cited or referenced in over 300 media stories, reports, plans, and articles.
This third full report builds upon our previous efforts to deliver timely data to help locals measure their progress and effectiveness, set new goals, and achieve greater results. Through the ongoing Benchmarking Project, the Alliance for Biking & Walk-ing will publish an updated version of this report every two years and will continuously refine methods and consider new data sets as available. As the project progresses, it will offer more precise benchmarks and recommenda-tions for advocates and government officials so that they have the data they need to improve bicycling and walking in the United States and eventually all of North America.
on the project, recognizing the benefit of showing the impact advocacy has on increasing bicycling and walking. Without hard data to measure results, Alliance organizations were missing a key argument for their efforts.
The Benchmarking Project was also aligned with public health organiza-tions and objectives. The process of benchmarking is designed to facilitate communities to build healthy and safe community environments. This is one of four key directions outlined by the U.S. Department of Health and Human
Services as fundamental to bring pre-vention into our communities. Further-more, it aligns with Centers for Disease Control and Prevention's (CDC) Win-nable Battles to reduce motor vehicle in-juries and increase physical activity. The partnerships addressed in this report among bicycle and pedestrian groups, health organizations, and transporta-tion are necessary to address the infra-structure problems in our communities to improve public health, in the same way that municipal water systems and improved housing infrastructure helped
The process of benchmarking is
designed to facilitate
communities to build healthy and safe community environments.
PREFACE
PREFACE
Alliance for Biking & Walking8
EXECUTIVE SUMMARY
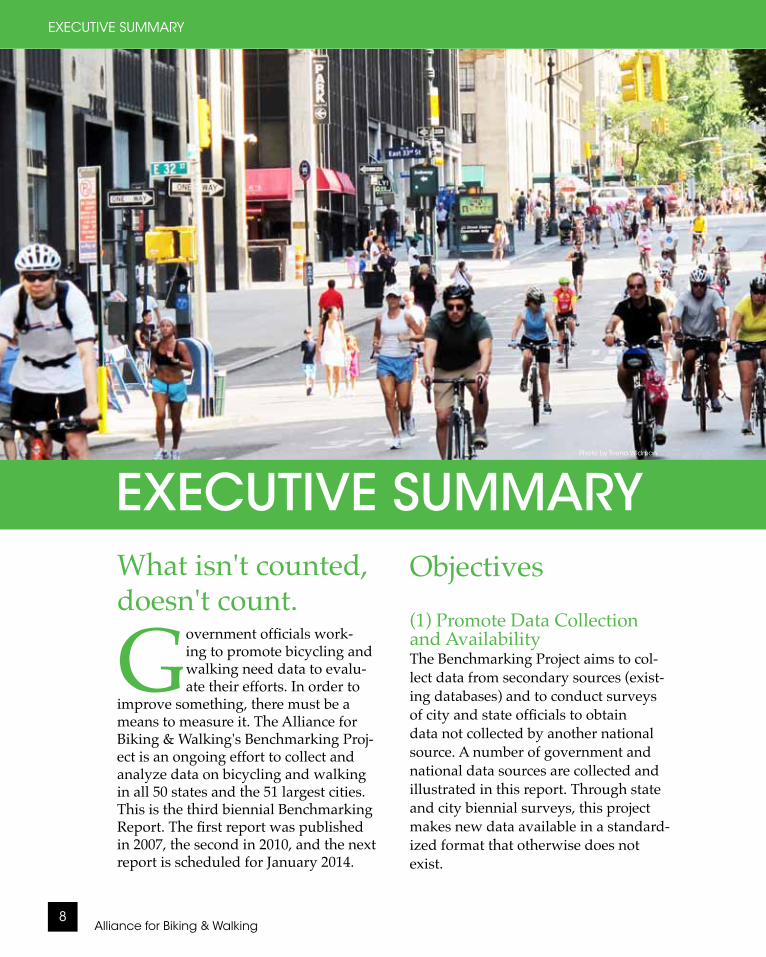
EXECUTIVE SUMMARYWhat isn't counted, doesn't count.
Government officials work-ing to promote bicycling and walking need data to evalu-ate their efforts. In order to
improve something, there must be a means to measure it. The Alliance for Biking & Walking's Benchmarking Proj-ect is an ongoing effort to collect and analyze data on bicycling and walking in all 50 states and the 51 largest cities. This is the third biennial Benchmarking Report. The first report was published in 2007, the second in 2010, and the next report is scheduled for January 2014.
Objectives(1) Promote Data Collection and AvailabilityThe Benchmarking Project aims to col-lect data from secondary sources (exist-ing databases) and to conduct surveys of city and state officials to obtain data not collected by another national source. A number of government and national data sources are collected and illustrated in this report. Through state and city biennial surveys, this project makes new data available in a standard-ized format that otherwise does not exist.
Photo by Teena Wldman

2012 Benchmarking Report 9
EXECUTIVE SUMMARY
(2) Measure Progress and Evaluate ResultsThe Benchmarking Project aims to pro-vide data to government officials and advocates in an accessible format that helps them measure their progress to-ward increasing bicycling and walking and evaluate the results of their efforts. Because the Benchmarking Project is ongoing, cities and states can measure their progress over time and will see the impacts of their efforts. By providing a consistent and objective tool for evalu-ation, organizations, states, and cities can determine what works and what doesn't. Successful models can be emu-lated and failed models reevaluated.
(3) Support Efforts to Increase Bicycling and WalkingThis project will ultimately support the efforts of government officials and bicycle and pedestrian advocacy organizations to increase bicycling and walking in their communities. By providing a means for cities and states
to compare themselves to one another, this report will highlight successes, en-courage communities making progress, and make communities aware of areas where more effort is needed. By high-lighting the top states and cities, other states and cities will gain inspiration and best practice models. This report is intended to help states and communi-ties set goals, plan strategies, and evalu-ate results.
Data CollectionThis report focuses on 50 states and the 51 largest U.S. cities. Most bicycling and walking is in urban areas, and because of short trip distances, the most poten-tial for increasing bicycling and walk-ing is in cities. Whenever possible, the Alliance collected data for this report directly from uniform government data sources. Researchers collected data that were not readily accessible from national sources through two surveys for cities and states. In October 2010,
% of trips 12%% of fatalities 14%% of federal tr 1.6%Levels of Bicycling and Walking,
Bike/Ped Fatalities, and Bike/Ped Funding in the U.S.
Sources: NHTS 2009, FARS 2009, FHWA FMIS 2006-2011
$
Bicyclists and pedestrians make up 12% of all trips
and account for 14% of traffic fatalities,
yet just 1.6% of federal transpor-tation funds go to
these modes.
EXECUTIVE SUMMARY
Photo by Teena Wldman
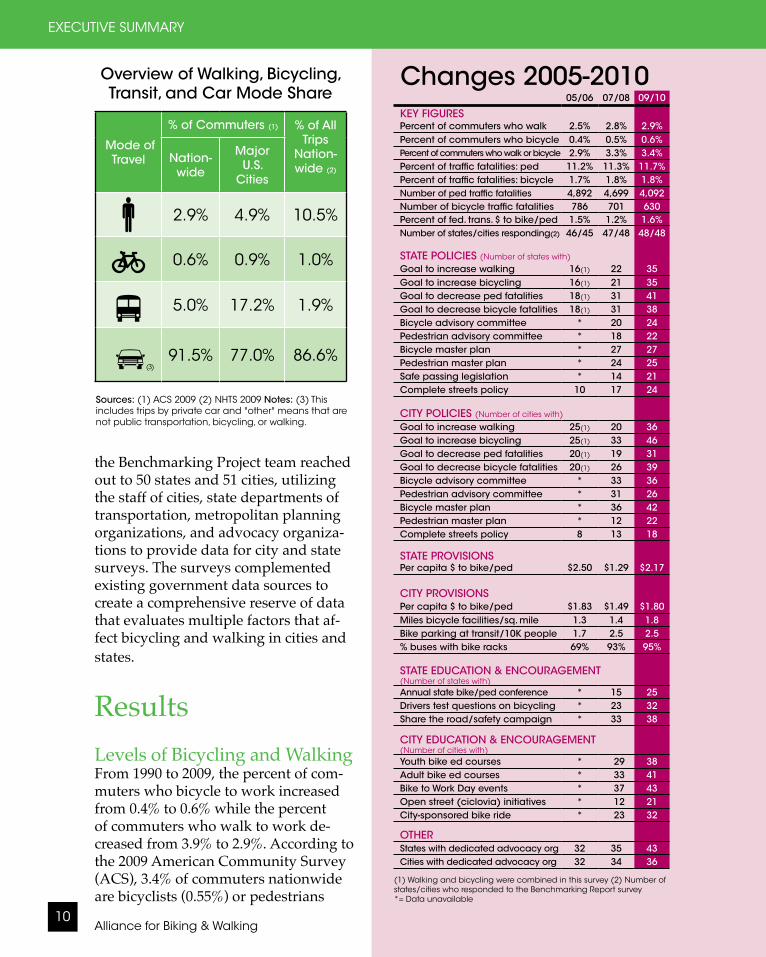
05/06 07/08 09/10
KEY FIGURESPercent of commuters who walk 2.5% 2.8% 2.9%Percent of commuters who bicycle 0.4% 0.5% 0.6%Percent of commuters who walk or bicycle 2.9% 3.3% 3.4%Percent of traffic fatalities: ped 11.2% 11.3% 11.7%Percent of traffic fatalities: bicycle 1.7% 1.8% 1.8%Number of ped traffic fatalities 4,892 4,699 4,092Number of bicycle traffic fatalities 786 701 630Percent of fed. trans. $ to bike/ped 1.5% 1.2% 1.6%Number of states/cities responding(2) 46/45 47/48 48/48
STATE POLICIES (Number of states with)
Goal to increase walking 16(1) 22 35Goal to increase bicycling 16(1) 21 35Goal to decrease ped fatalities 18(1) 31 41Goal to decrease bicycle fatalities 18(1) 31 38Bicycle advisory committee * 20 24Pedestrian advisory committee * 18 22Bicycle master plan * 27 27Pedestrian master plan * 24 25Safe passing legislation * 14 21Complete streets policy 10 17 24
CITY POLICIES (Number of cities with)
Goal to increase walking 25(1) 20 36Goal to increase bicycling 25(1) 33 46Goal to decrease ped fatalities 20(1) 19 31Goal to decrease bicycle fatalities 20(1) 26 39Bicycle advisory committee * 33 36Pedestrian advisory committee * 31 26Bicycle master plan * 36 42Pedestrian master plan * 12 22Complete streets policy 8 13 18
STATE PROVISIONSPer capita $ to bike/ped $2.50 $1.29 $2.17
CITY PROVISIONSPer capita $ to bike/ped $1.83 $1.49 $1.80Miles bicycle facilities/sq. mile 1.3 1.4 1.8Bike parking at transit/10K people 1.7 2.5 2.5% buses with bike racks 69% 93% 95%
STATE EDUCATION & ENCOURAGEMENT(Number of states with)Annual state bike/ped conference * 15 25Drivers test questions on bicycling * 23 32Share the road/safety campaign * 33 38
CITY EDUCATION & ENCOURAGEMENT(Number of cities with)Youth bike ed courses * 29 38Adult bike ed courses * 33 41Bike to Work Day events * 37 43Open street (ciclovia) initiatives * 12 21City-sponsored bike ride * 23 32
OTHERStates with dedicated advocacy org 32 35 43Cities with dedicated advocacy org 32 34 36
(1) Walking and bicycling were combined in this survey (2) Number of states/cities who responded to the Benchmarking Report survey *= Data unavailable
Changes 2005-2010
Alliance for Biking & Walking10
EXECUTIVE SUMMARY
the Benchmarking Project team reached out to 50 states and 51 cities, utilizing the staff of cities, state departments of transportation, metropolitan planning organizations, and advocacy organiza-tions to provide data for city and state surveys. The surveys complemented existing government data sources to create a comprehensive reserve of data that evaluates multiple factors that af-fect bicycling and walking in cities and states.
ResultsLevels of Bicycling and WalkingFrom 1990 to 2009, the percent of com-muters who bicycle to work increased from 0.4% to 0.6% while the percent of commuters who walk to work de-creased from 3.9% to 2.9%. According to the 2009 American Community Survey (ACS), 3.4% of commuters nationwide are bicyclists (0.55%) or pedestrians
Mode of Travel
% of Commuters (1) % of All Trips
Nation-wide (2)
Nation-wide
Major U.S.
Cities
2.9% 4.9% 10.5%
0.6% 0.9% 1.0%
5.0% 17.2% 1.9%
(3)91.5% 77.0% 86.6%
Overview of Walking, Bicycling, Transit, and Car Mode Share
Sources: (1) ACS 2009 (2) NHTS 2009 Notes: (3) This includes trips by private car and "other" means that are not public transportation, bicycling, or walking.
2012 Benchmarking Report 11
EXECUTIVE SUMMARY
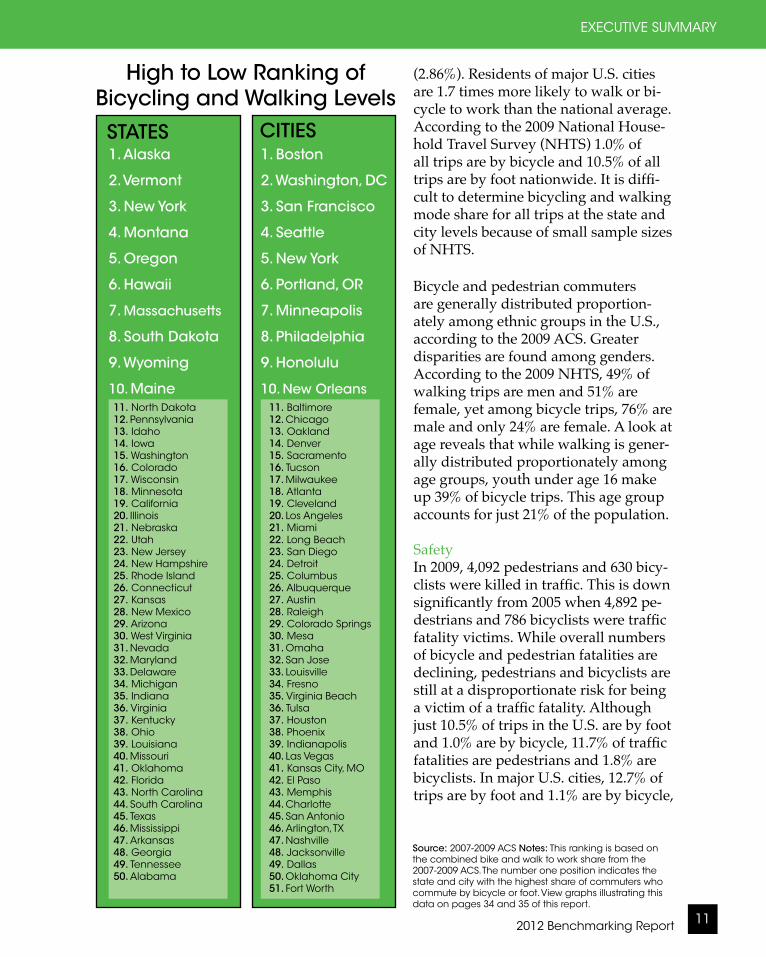
High to Low Ranking of Bicycling and Walking Levels
1. Alaska
2. Vermont
3. New York
4. Montana
5. Oregon
6. Hawaii
7. Massachusetts
8. South Dakota
9. Wyoming
10. Maine11. North Dakota12. Pennsylvania13. Idaho14. Iowa15. Washington16. Colorado17. Wisconsin18. Minnesota19. California20. Illinois21. Nebraska22. Utah23. New Jersey24. New Hampshire25. Rhode Island26. Connecticut27. Kansas28. New Mexico29. Arizona30. West Virginia31. Nevada32. Maryland33. Delaware34. Michigan35. Indiana36. Virginia37. Kentucky38. Ohio39. Louisiana40. Missouri41. Oklahoma42. Florida43. North Carolina44. South Carolina 45. Texas46. Mississippi47. Arkansas48. Georgia49. Tennessee50. Alabama
STATES
11. Baltimore12. Chicago13. Oakland14. Denver15. Sacramento16. Tucson17. Milwaukee18. Atlanta19. Cleveland20. Los Angeles21. Miami22. Long Beach23. San Diego24. Detroit25. Columbus26. Albuquerque27. Austin28. Raleigh29. Colorado Springs30. Mesa31. Omaha32. San Jose33. Louisville34. Fresno35. Virginia Beach36. Tulsa37. Houston38. Phoenix39. Indianapolis40. Las Vegas41. Kansas City, MO42. El Paso43. Memphis44. Charlotte45. San Antonio46. Arlington, TX47. Nashville48. Jacksonville49. Dallas50. Oklahoma City51. Fort Worth
CITIES
(2.86%). Residents of major U.S. cities are 1.7 times more likely to walk or bi-cycle to work than the national average. According to the 2009 National House-hold Travel Survey (NHTS) 1.0% of all trips are by bicycle and 10.5% of all trips are by foot nationwide. It is diffi-cult to determine bicycling and walking mode share for all trips at the state and city levels because of small sample sizes of NHTS.
Bicycle and pedestrian commuters are generally distributed proportion-ately among ethnic groups in the U.S., according to the 2009 ACS. Greater disparities are found among genders. According to the 2009 NHTS, 49% of walking trips are men and 51% are female, yet among bicycle trips, 76% are male and only 24% are female. A look at age reveals that while walking is gener-ally distributed proportionately among age groups, youth under age 16 make up 39% of bicycle trips. This age group accounts for just 21% of the population.
SafetyIn 2009, 4,092 pedestrians and 630 bicy-clists were killed in traffic. This is down significantly from 2005 when 4,892 pe-destrians and 786 bicyclists were traffic fatality victims. While overall numbers of bicycle and pedestrian fatalities are declining, pedestrians and bicyclists are still at a disproportionate risk for being a victim of a traffic fatality. Although just 10.5% of trips in the U.S. are by foot and 1.0% are by bicycle, 11.7% of traffic fatalities are pedestrians and 1.8% are bicyclists. In major U.S. cities, 12.7% of trips are by foot and 1.1% are by bicycle,
Source: 2007-2009 ACS Notes: This ranking is based on the combined bike and walk to work share from the 2007-2009 ACS. The number one position indicates the state and city with the highest share of commuters who commute by bicycle or foot. View graphs illustrating this data on pages 34 and 35 of this report.
1. Boston
2. Washington, DC
3. San Francisco
4. Seattle
5. New York
6. Portland, OR
7. Minneapolis
8. Philadelphia
9. Honolulu
10. New Orleans
Alliance for Biking & Walking12
EXECUTIVE SUMMARY
11. Idaho12. New Hampshire13. Oregon14. Washington15. Wisconsin16. Montana17. New York18. Pennsylvania19. Kansas20. Colorado21. Hawaii22. Utah23. Illinois24. Connecticut25. West Virginia26. Ohio27. Indiana28. Rhode Island29. Virginia30. Kentucky31. New Jersey32. California33. Michigan34. Missouri35. Oklahoma36. Nevada37. Tennessee38. New Mexico39. Maryland40. Arizona41. Arkansas42. Delaware43. Texas44. North Carolina45. Georgia46. Mississippi47. Alabama48. Louisiana49. South Carolina50. Florida
STATES
11. Colorado Springs12. Chicago13. Cleveland14. Oakland15. Baltimore16. Milwaukee17. Sacramento18. Denver19. Virginia Beach20. Tucson21. Mesa22. San Diego23. New Orleans24. San Jose25. Columbus26. Los Angeles27. Atlanta28. Indianapolis29. Long Beach30. Austin31. Arlington, TX32. Raleigh33. Albuquerque34. Las Vegas35. El Paso36. Memphis37. Fresno38. San Antonio39. Nashville40. Detroit41. Houston42. Charlotte43. Louisville44. Miami45. Kansas City, MO46. Oklahoma City47. Tulsa48. Phoenix49. Dallas50. Jacksonville51. Fort Worth
CITIES
Low to High Ranking of Bike/Ped Fatality Rates
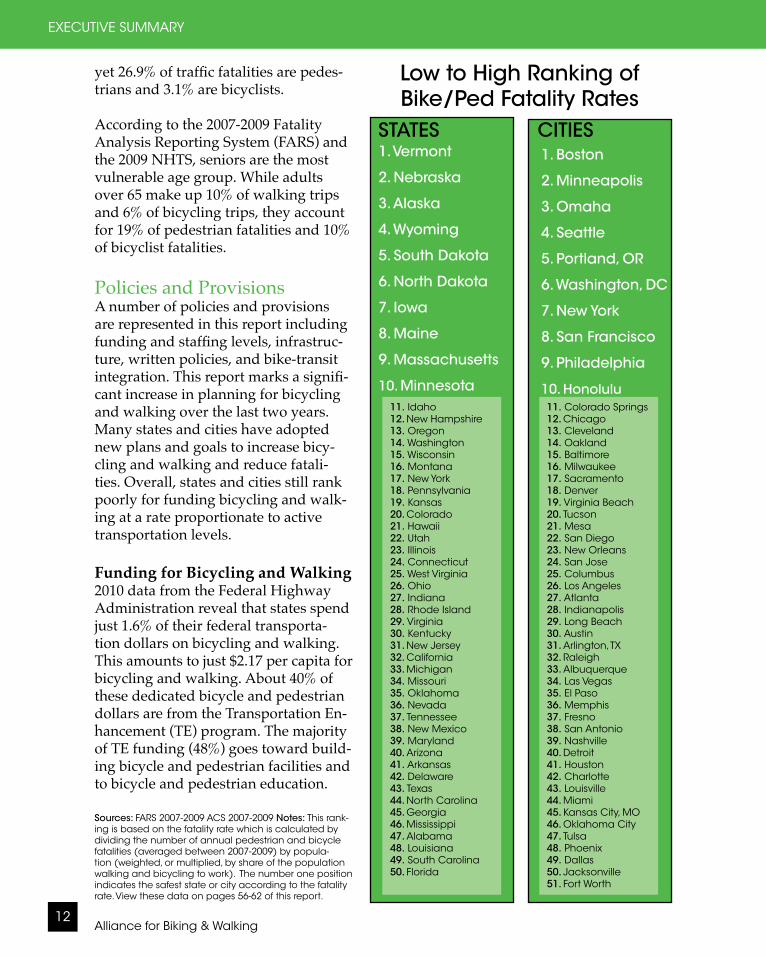
Sources: FARS 2007-2009 ACS 2007-2009 Notes: This rank-ing is based on the fatality rate which is calculated by dividing the number of annual pedestrian and bicycle fatalities (averaged between 2007-2009) by popula-tion (weighted, or multiplied, by share of the population walking and bicycling to work). The number one position indicates the safest state or city according to the fatality rate. View these data on pages 56-62 of this report.
yet 26.9% of traffic fatalities are pedes-trians and 3.1% are bicyclists.
According to the 2007-2009 Fatality Analysis Reporting System (FARS) and the 2009 NHTS, seniors are the most vulnerable age group. While adults over 65 make up 10% of walking trips and 6% of bicycling trips, they account for 19% of pedestrian fatalities and 10% of bicyclist fatalities. Policies and ProvisionsA number of policies and provisions are represented in this report including funding and staffing levels, infrastruc-ture, written policies, and bike-transit integration. This report marks a signifi-cant increase in planning for bicycling and walking over the last two years. Many states and cities have adopted new plans and goals to increase bicy-cling and walking and reduce fatali-ties. Overall, states and cities still rank poorly for funding bicycling and walk-ing at a rate proportionate to active transportation levels.
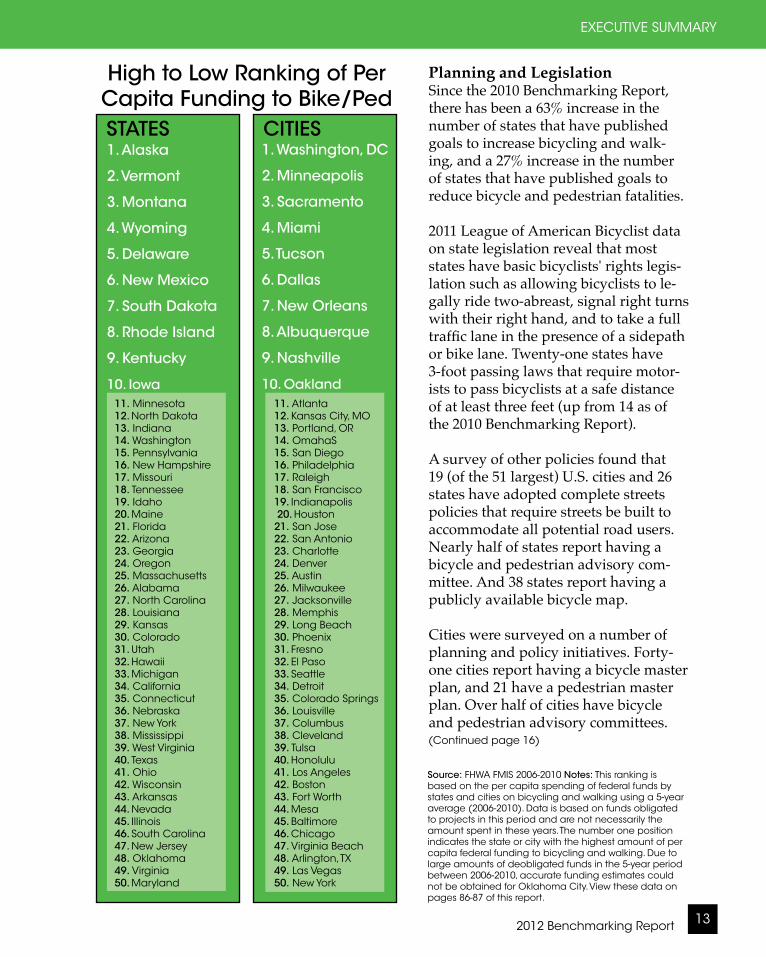
Funding for Bicycling and Walking2010 data from the Federal Highway Administration reveal that states spend just 1.6% of their federal transporta-tion dollars on bicycling and walking. This amounts to just $2.17 per capita for bicycling and walking. About 40% of these dedicated bicycle and pedestrian dollars are from the Transportation En-hancement (TE) program. The majority of TE funding (48%) goes toward build-ing bicycle and pedestrian facilities and to bicycle and pedestrian education.
1. Vermont
2. Nebraska
3. Alaska
4. Wyoming
5. South Dakota
6. North Dakota
7. Iowa
8. Maine
9. Massachusetts
10. Minnesota
1. Boston
2. Minneapolis
3. Omaha
4. Seattle
5. Portland, OR
6. Washington, DC
7. New York
8. San Francisco
9. Philadelphia
10. Honolulu
2012 Benchmarking Report 13
EXECUTIVE SUMMARY
High to Low Ranking of Per Capita Funding to Bike/Ped
11. Minnesota12. North Dakota13. Indiana14. Washington15. Pennsylvania16. New Hampshire17. Missouri18. Tennessee19. Idaho20. Maine21. Florida22. Arizona23. Georgia24. Oregon25. Massachusetts26. Alabama27. North Carolina28. Louisiana29. Kansas30. Colorado31. Utah32. Hawaii33. Michigan34. California35. Connecticut36. Nebraska37. New York38. Mississippi39. West Virginia40. Texas41. Ohio42. Wisconsin43. Arkansas44. Nevada45. Illinois46. South Carolina47. New Jersey48. Oklahoma49. Virginia50. Maryland
STATES
Planning and Legislation Since the 2010 Benchmarking Report, there has been a 63% increase in the number of states that have published goals to increase bicycling and walk-ing, and a 27% increase in the number of states that have published goals to reduce bicycle and pedestrian fatalities.
2011 League of American Bicyclist data on state legislation reveal that most states have basic bicyclists' rights legis-lation such as allowing bicyclists to le-gally ride two-abreast, signal right turns with their right hand, and to take a full traffic lane in the presence of a sidepath or bike lane. Twenty-one states have 3-foot passing laws that require motor-ists to pass bicyclists at a safe distance of at least three feet (up from 14 as of the 2010 Benchmarking Report).
A survey of other policies found that 19 (of the 51 largest) U.S. cities and 26 states have adopted complete streets policies that require streets be built to accommodate all potential road users. Nearly half of states report having a bicycle and pedestrian advisory com-mittee. And 38 states report having a publicly available bicycle map.
Cities were surveyed on a number of planning and policy initiatives. Forty-one cities report having a bicycle master plan, and 21 have a pedestrian master plan. Over half of cities have bicycle and pedestrian advisory committees.
Source: FHWA FMIS 2006-2010 Notes: This ranking is based on the per capita spending of federal funds by states and cities on bicycling and walking using a 5-year average (2006-2010). Data is based on funds obligated to projects in this period and are not necessarily the amount spent in these years. The number one position indicates the state or city with the highest amount of per capita federal funding to bicycling and walking. Due to large amounts of deobligated funds in the 5-year period between 2006-2010, accurate funding estimates could not be obtained for Oklahoma City. View these data on pages 86-87 of this report.
11. Atlanta12. Kansas City, MO13. Portland, OR14. OmahaS15. San Diego16. Philadelphia17. Raleigh 18. San Francisco 19. Indianapolis 20. Houston21. San Jose 22. San Antonio23. Charlotte24. Denver25. Austin 26. Milwaukee27. Jacksonville 28. Memphis29. Long Beach30. Phoenix31. Fresno32. El Paso33. Seattle34. Detroit 35. Colorado Springs36. Louisville37. Columbus38. Cleveland39. Tulsa40. Honolulu41. Los Angeles42. Boston43. Fort Worth44. Mesa45. Baltimore46. Chicago47. Virginia Beach48. Arlington, TX49. Las Vegas50. New York
CITIES1. Alaska
2. Vermont
3. Montana
4. Wyoming
5. Delaware
6. New Mexico
7. South Dakota
8. Rhode Island
9. Kentucky
10. Iowa
1. Washington, DC
2. Minneapolis
3. Sacramento
4. Miami
5. Tucson
6. Dallas
7. New Orleans
8. Albuquerque
9. Nashville
10. Oakland
(Continued page 16)
CITIES
Alliance for Biking & Walking14
EXECUTIVE SUMMARY
State Mode Share Safety Funding Policy (1)
Education/ Encouragement (2)
Advocacy Capacity (3)
Alabama ○ ○ ◐ ○ ○ ◐
Alaska ● ● ● ◐ ○ ○
Arizona ◐ ○ ◐ ● ◐ ●
Arkansas ○ ○ ○ ○ ○ ●
California ◐ ◐ ◐ ◐ ◐ ◐
Colorado ● ◐ ◐ ◐ ◐ ●
Connecticut ◐ ◐ ○ ● ◐ ●
Delaware ◐ ○ ● ● ◐ ◐
Florida ○ ○ ◐ ◐ ● ●
Georgia ○ ○ ◐ ● ○ ●
Hawaii ● ◐ ◐ ◐ ○ ●
Idaho ● ● ◐ ◐ ○ ◐
Illinois ◐ ◐ ○ ◐ ◐ ●
Indiana ○ ◐ ● ○ ● *
Iowa ● ● ● ○ ● ●
Kansas ◐ ◐ ◐ ◐ ◐ *
Kentucky ○ ◐ ● ◐ ● ○
Louisiana ○ ○ ◐ ◐ ◐ ○
Maine ● ● ◐ ● ◐ ●
Maryland ◐ ○ ○ ● ● ●
Massachusetts ● ● ◐ ● ● ●
Michigan ◐ ◐ ◐ ◐ ○ ●
Minnesota ◐ ● ● ● ● ●
Mississippi ○ ○ ○ ○ ◐ ◐
Missouri ○ ◐ ● ○ ◐ ◐
Montana ● ● ● * * ○
Nebraska ◐ ● ○ ○ ○ ○
Nevada ◐ ○ ○ ◐ ◐ ◐
New Hampshire ◐ ● ● ○ ◐ ◐
New Jersey ◐ ◐ ○ ● ◐ ◐
New Mexico ◐ ○ ● * * ●
New York ● ● ○ ● ○ ◐
North Carolina ○ ○ ◐ ● ◐ ◐
North Dakota ● ● ● ○ ○ ○
Ohio ○ ◐ ○ ○ ● *
Oklahoma ○ ○ ○ ○ ◐ ◐
Oregon ● ● ◐ ● ◐ ●
Pennsylvania ● ◐ ● ● ○ ◐
Rhode Island ◐ ◐ ● ● ● *
South Carolina ○ ○ ○ ○ ◐ ●
South Dakota ● ● ● ○ ◐ ◐
Tennessee ○ ○ ◐ ● ◐ ◐
Texas ○ ○ ○ ○ ● *
Utah ◐ ◐ ◐ ◐ ◐ ◐
Vermont ● ● ● ◐ ● *
Virginia ○ ◐ ○ ◐ ◐ ●
Washington ● ● ● ◐ ● ●
West Virginia ◐ ◐ ○ ○ ○ ○
Wisconsin ● ● ○ ● ● ◐
Wyoming ● ● ● ○ ◐ ○
Find the data (page) 45-46 56-57 86 68, 72,80 111, 113 138
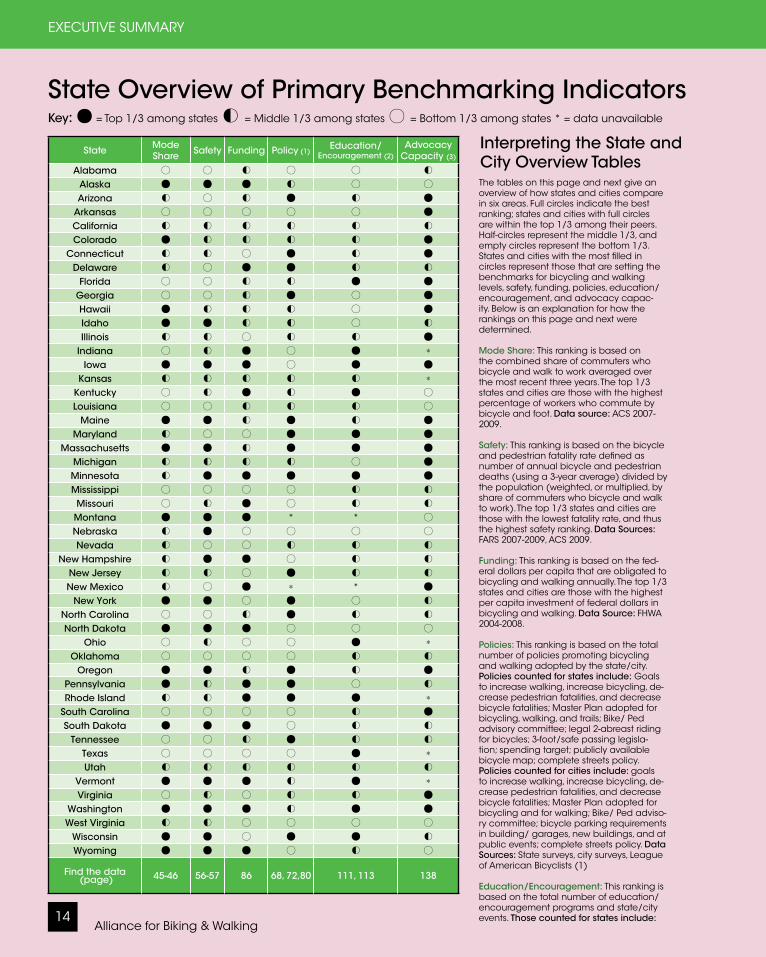
State Overview of Primary Benchmarking IndicatorsKey: ● = Top 1/3 among states ◐ = Middle 1/3 among states ○ = Bottom 1/3 among states * = data unavailable
The tables on this page and next give an overview of how states and cities compare in six areas. Full circles indicate the best ranking; states and cities with full circles are within the top 1/3 among their peers. Half-circles represent the middle 1/3, and empty circles represent the bottom 1/3. States and cities with the most filled in circles represent those that are setting the benchmarks for bicycling and walking levels, safety, funding, policies, education/encouragement, and advocacy capac-ity. Below is an explanation for how the rankings on this page and next were determined.
Mode Share: This ranking is based on the combined share of commuters who bicycle and walk to work averaged over the most recent three years. The top 1/3 states and cities are those with the highest percentage of workers who commute by bicycle and foot. Data source: ACS 2007-2009.
Safety: This ranking is based on the bicycle and pedestrian fatality rate defined as number of annual bicycle and pedestrian deaths (using a 3-year average) divided by the population (weighted, or multiplied, by share of commuters who bicycle and walk to work). The top 1/3 states and cities are those with the lowest fatality rate, and thus the highest safety ranking. Data Sources: FARS 2007-2009, ACS 2009.
Funding: This ranking is based on the fed-eral dollars per capita that are obligated to bicycling and walking annually. The top 1/3 states and cities are those with the highest per capita investment of federal dollars in bicycling and walking. Data Source: FHWA 2004-2008.
Policies: This ranking is based on the total number of policies promoting bicycling and walking adopted by the state/city. Policies counted for states include: Goals to increase walking, increase bicycling, de-crease pedestrian fatalities, and decrease bicycle fatalities; Master Plan adopted for bicycling, walking, and trails; Bike/ Ped advisory committee; legal 2-abreast riding for bicycles; 3-foot/safe passing legisla-tion; spending target; publicly available bicycle map; complete streets policy. Policies counted for cities include: goals to increase walking, increase bicycling, de-crease pedestrian fatalities, and decrease bicycle fatalities; Master Plan adopted for bicycling and for walking; Bike/ Ped adviso-ry committee; bicycle parking requirements in building/ garages, new buildings, and at public events; complete streets policy. Data Sources: State surveys, city surveys, League of American Bicyclists (1)
Education/Encouragement: This ranking is based on the total number of education/encouragement programs and state/city events. Those counted for states include:
Interpreting the State and City Overview Tables

2012 Benchmarking Report 15
EXECUTIVE SUMMARY
City Overview of Primary Benchmarking Indicators
Share the road/public safety campaign; info on bicycling in driver's manual; driver's test questions on bicycling; state-sponsored ride to promote bicycling/activity; bicycling enforcement as a policy academy require-ment; bicycling enforcement in police continuing education; and existence of an annual statewide bike/ped conference. Those counted for cities include: Adult and youth bicycle education courses; Bike to Work Day events; open streets initiative; city-sponsored ride to promote bicycling/activity; public bike share program. Data Source: State and city surveys
Advocacy Capacity: This ranking is based on the 2010 per capita revenue of Alliance bicycling and walking advocacy organiza-tions serving cities/states. Only statewide organizations are included for states and only organizations with a focus on serving a study area city are included for cities. Cit-ies and states without dedicated Alliance advocacy organizations are marked by an empty circle. Data Source: Organization surveys (2)
Notes: (1) Because many states and cities have the same number of policies, policy rankings are not divided into even thirds. For states, those with more than 10 of the 14 policies considered are indicated with full circles; those with 8-10 policies are indicated with a half circle, and those with fewer than 8 policies are indicated with an empty circle. For cities, those with 10 or more of the 13 policies considered are indicated with full circles; those with 6-9 policies are indicated with a half circle, and those with 5 or fewer policies are in-dicated with an empty circle. (2) Because many states and cities have the same number of education and encouragement initiatives, these rankings are not divided into even thirds. For states, those with 6-7 of the 7 initiatives considered are indicated with full circles; those with 4-5 initiatives are indicated with a half circle, and those with 3 or fewer initiatives are indicated with an empty circle. For cities, those with 5-6 of the 6 initiatives considered are indicated with full circles; those with 3-4 initiatives are indicated with a half circle, and those with 2 or fewer initiatives are indicated with an empty circle. (3) These rankings are based on surveys of Alliance bicycling and walking advocacy organizations only. Because some cities and states are not served by dedicated Alliance advocacy organizations, for states, the 16 served by advocacy organizations with the greatest capacity are marked with a full circle, the 15 remaining states served by advocacy organizations are marked with half circles, and the remaining states not served by statewide Alliance advocacy organizations are indicated with empty circles. For cities the 15 served by advocacy organizations with the greatest capacity are marked with a full circle, the 14 remaining cities served by advocacy organizations are marked with half circles, and the remain-ing cities not served by dedicated Alliance advocacy organizations are indicated with empty circles.
Key: ● = Top 1/3 among cities ◐ = Middle 1/3 among cities ○ = Bottom 1/3 among cities * = data unavailable
City Mode Share Safety Funding Policy
(1)Education/
Encouragement (2)Advocacy
Capacity (3)
Albuquerque ◐ ◐ ● ● ◐ *
Arlington, TX ○ ◐ ○ ● ◐ ○
Atlanta ◐ ◐ ● ◐ ◐ ●
Austin ◐ ◐ ◐ ◐ ◐ ◐
Baltimore ● ● ○ ◐ ◐ ○
Boston ● ● ○ ○ ● ●
Charlotte ○ ○ ◐ ● ◐ ◐
Chicago ● ● ○ ◐ ● ●
Cleveland ◐ ● ○ * * ◐
Colorado Springs ◐ ● ○ ○ ◐ ○
Columbus ◐ ◐ ○ ● ◐ ●
Dallas ○ ○ ● ◐ ◐ ◐
Denver ● ◐ ◐ ● ● ◐
Detroit ◐ ○ ◐ * * ○
El Paso ○ ○ ◐ ◐ ○ ○
Fort Worth ○ ○ ○ ○ ○ ◐
Fresno ◐ ○ ◐ ● ◐ ○
Honolulu ● ● ○ ◐ ● ●
Houston ○ ○ ◐ ◐ ◐ ◐
Indianapolis ○ ◐ ◐ * * ●
Jacksonville ○ ○ ◐ ● ◐ ○
Kansas City, MO ○ ○ ● ● ● ◐
Las Vegas ○ ◐ ○ ◐ ○ *
Long Beach ◐ ◐ ◐ ○ ● ◐
Los Angeles ◐ ◐ ○ ◐ ◐ ◐
Louisville ◐ ○ ○ ◐ ● ◐
Memphis ○ ○ ◐ ◐ ◐ ◐
Mesa ◐ ◐ ○ ○ ◐ ○
Miami ◐ ○ ● ◐ ◐ ◐
Milwaukee ● ● ◐ ◐ ◐ ◐
Minneapolis ● ● ● ● ● ●
Nashville ○ ○ ● ● ◐ ○
New Orleans ● ◐ ● ○ ○ ◐
New York ● ● ○ ◐ ● ●
Oakland ● ● ● ● ● ●
Oklahoma City ○ ○ * ◐ ○ ○
Omaha ◐ ● ● ◐ ◐ *
Philadelphia ● ● ● ● ● ●
Phoenix ○ ○ ◐ ◐ ◐ ○
Portland, OR ● ● ● ● ● ●
Raleigh ◐ ◐ ● ◐ ○ ○
Sacramento ● ● ● ● ◐ ●
San Antonio ○ ○ ◐ ○ ◐ ○
San Diego ◐ ◐ ● ◐ ◐ ◐
San Francisco ● ● ◐ ● ● ●
San Jose ◐ ◐ ◐ ● ● *
Seattle ● ● ◐ ● ◐ ●
Tucson ● ◐ ● ◐ ◐ *
Tulsa ○ ○ ○ ○ ◐ ●
Virginia Beach ○ ◐ ○ ● ○ ○
Washington, DC ● ● ● ● ● *
Find the data (page) 45,47 59,62 87 69, 73 114 140

Alliance for Biking & Walking16
EXECUTIVE SUMMARY
mation from state and city surveys and the National Center for Safe Routes to School illustrates the growth in bicycle and pedestrian education in communi-ties. National Walk and Bike to School Day is a popular encouragement activ-ity with growing school participation nationwide.
Thirty-eight cities report having youth bicycle education courses and 41 have adult courses. Youth education is a vital area of outreach because it has the potential to influence the habits of the next generation. The number of youth who participate in bicycle education courses in cities increased by 31% from two years ago. Surveys indicate a 40% increase in adult participation levels for bicycle educational courses over the last two years.
League of American Bicyclists' data indicate that almost all states (49) have information on bicycling in their state driver's manual, yet just 32 states have questions on bicycling on their state driver's exam. The majority of states (38) have a "Share the Road" or simi-lar public safety campaign. Seventeen states report sponsoring a statewide ride to promote bicycling or physical activity.
The Alliance also collected data on pro-fessional education regarding bicycling and walking. Overall, these efforts are growing among states, but there is still great room for improvement. Only 20 states have bicycle enforcement as a po-lice academy requirement. And, just 25 states report having hosted a statewide bicycle and pedestrian conference.
Cities were also surveyed on encour-agement activities including presence of and participation levels in Bike to Work
Infrastructure City surveys examined current and planned bicycle and pedestrian infra-structure in order to benchmark the progress communities are making. Specifically, cities reported miles of bike lanes, bicycle routes, and multi-use paths. On average, cities have 1.8 miles of bicycle facilities (bike lanes, multi-use paths, and signed bicycle routes) per square mile—a 29% increase since the 2010 Benchmarking Report. While implementation of innovative facilities such as bicycle boulevards and colored bike lanes is low, surveys indicated that there are new projects currently being implemented or in the process of approval. The number of cities that report having implemented innovative facilities has increased sig-nificantly in the last two years. Seventy-three percent of cities now report hav-ing implemented sharrows, or shared lane markings.
Bike-Transit Integration Bike-transit integration has proved to be a vital aspect of effective bicycle systems. The report analyzes responses from city and state surveys, as well as American Public Transportation As-sociation (APTA) data, to see how well cities are integrating bicycle systems with transit. Forty-four cities report that 100% of their bus fleet have bicycle racks, a 19% increase over the past two years. Major U.S. cities report an aver-age of 2.5 bicycle parking spaces at bus stops for every 10,000 residents.
Education and Encouragement Education and encouragement pro-grams at the state and city level are effective ways to inform the public and promote bicycling and walking. Infor-
2012 Benchmarking Report 17
EXECUTIVE SUMMARY
Photo by Dan Burden, Walkable and Livable Communities Institute
Day events, open street/ciclovia initia-tives, and city-sponsored bicycle rides. Bike to Work Day is the most common encouragement event with 43 cities participating with an average of one participant for every 286 adults. Thirty-two cities sponsor rides to promote bicycling or physical activity with an average of one participant for every 350 residents. Twenty-one cities have open street (car-free or ciclovia) initiatives with an average of one participant for every 37 residents.
Cycling and Walking AdvocacyAdvocacy organizations have the potential to influence bicycling and walking in the communities they serve
by advocating for and winning new policies, funding, infrastructure, and programs. The number of Alliance state and local bicycle and pedestrian advo-cacy organizations has been increasing steadily since the Alliance was founded in 1996. This report measures organi-zation capacity of Alliance member organizations and sets standards for membership, revenue, staffing, and media exposure. Results from Alliance organization surveys vary widely be-cause of the great variation in maturity and operations of these organizations as well as the communities they serve. Some organizations in this report are decades old while others were founded not long before these surveys were collected.
Alliance for Biking & Walking18
EXECUTIVE SUMMARY
compared public health data to bicy-cling and walking levels. Data from the Behavioral Risk Factor Surveillance System (BRFSS) and ACS reflect a direct relationship between levels of bicycling and walking and several public health indicators. Data suggest that the risk for such health problems as obesity, diabetes, asthma, and hypertension will decrease with more bicycling and walk-ing. States with lower bicycling and walking levels on average have higher levels of obesity, diabetes, hypertension, and asthma. States with higher levels of bicycling and walking also have a greater percentage of adults who meet the recommended 30-plus minutes of daily physical activity. This suggests that increasing bicycling and walking can help achieve public health goals of increasing physical activity and lower-ing rates of overweight and obesity.
Economic BenefitsTo see how bicycling and walking influ-ence the economic strength of commu-nities, the Alliance surveyed numerous studies and data sources. Evidence suggests that bicycling and walking projects create 11-14 jobs per $1 million spent, compared to just 7 jobs created per $1 million spent with highway projects. Surveys show that facilities for bicycling and walking attract tour-ists, event participants, and business. In addition bicycling and walking are af-fordable investments that save commut-ers money and in turn equate to more money available for local economies.
Studies that have performed cost/ben-efit analysis on bicycling and walking facilities have found that these facili-ties have significant benefit for public health, traffic congestion, and air qual-ity. The cost benefit ratio of Portland, OR's bicycle investments, looking at just
Surveys indicate that organizations serving cities earn significantly more per capita than their statewide coun-terparts. Local organizations earn an average of $0.15 per resident served while statewide organizations earn just $0.03 per resident. In general, organiza-tion revenue is diversified, coming from membership and donations, events, fees, grants, contracts, and the bicycle industry. Local Alliance organizations also have much higher per capita mem-bership levels averaging one member per 1,522 residents. Statewide organiza-tions have an average of one member per 4,975 residents. Similarly, statewide organizations operate with an average of 0.4 full-time-equivalent staff (FTE) per million residents served. Organiza-tions serving cities average 2.2 FTE staff per million residents.
Factors Influencing Bicycling and Walking Analysis in this report shows several positive relationships between bicycling and walking rates and safety, advocacy capacity, density, and car ownership. While weather does not appear to be a factor that directly influences bicycling levels, density, advocacy capacity, and car ownership are a few factors that ap-pear to influence bicycling and walking trips.
ACS and FARS data indicate a posi-tive correlation between bicycling and walking levels and safety. In line with previous studies, an increase in walking and bicycling levels is strongly related to increased bicyclist and pedestrian safety.
Public Health BenefitsTo see how bicycling and walking influence public health, the Alliance
2012 Benchmarking Report 19
EXECUTIVE SUMMARY
health and fuel savings, ranged from 3.8-to-1 to 1.3-to-1.
ConclusionsWhile many state and local communi-ties are making sufficient efforts to promote bicycling and walking, much more work needs to be done. Barriers in staffing and funding remain a consis-tent limitation to promoting bicycling and walking. Bicycling and walking make up 11.5% of all trips, and 13.5% of traffic fatalities, and yet receive just 1.6% of federal transportation dollars.
The proven environmental, economic, and personal health benefits that bicy-cling and walking offer are evidence that increasing bicycling and walk-ing levels are in the public good, yet a much greater investment is needed throughout the U.S. This Benchmarking
Report identifies which cities and states are leading the way and provides links to resources (Appendix 5) from these communities.
The Alliance recommends that govern-ment officials and advocates take the time to evaluate their efforts to promote bicycling and walking. This report can be used by communities to see how they measure up, to identify role mod-els, and to set new goals. Continued benchmarking and improvements in the availability of data will strengthen the report in the coming years, and lend a better understanding of the factors that influence bicycling and walking. Ulti-mately, by providing a tool for commu-nities to consistently measure progress, evaluate results, and set new targets, this report will advance efforts for a more bicycle- and pedestrian-friendly America.
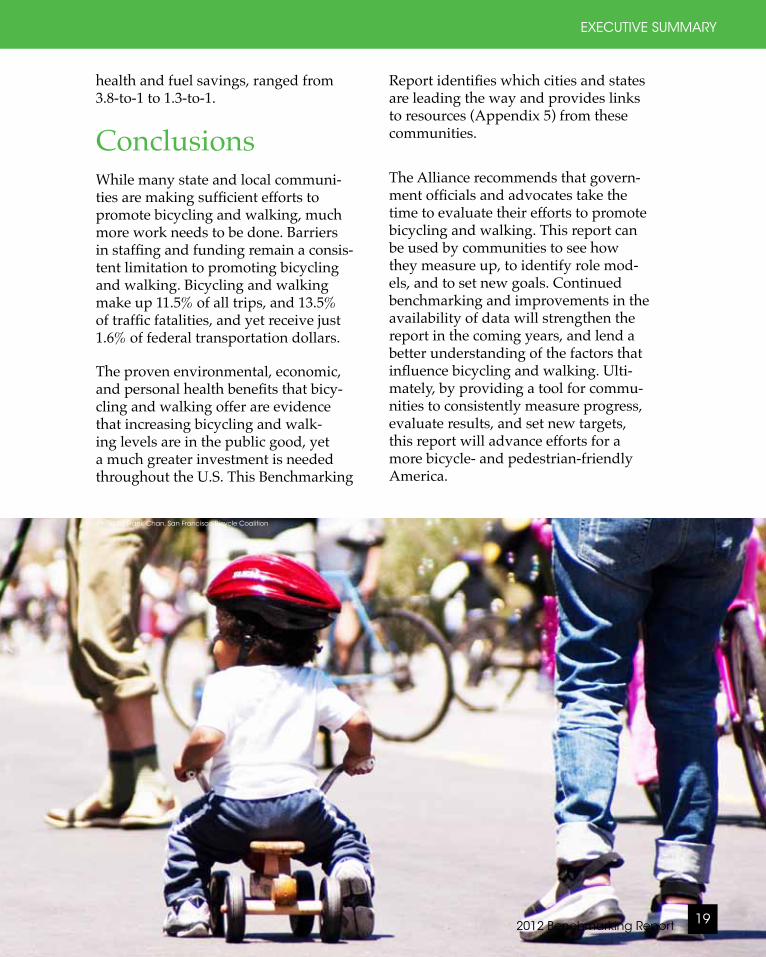
Photo by Frank Chan, San Francisco Bicycle Coalition
Alliance for Biking & Walking20
CHAPTER 1
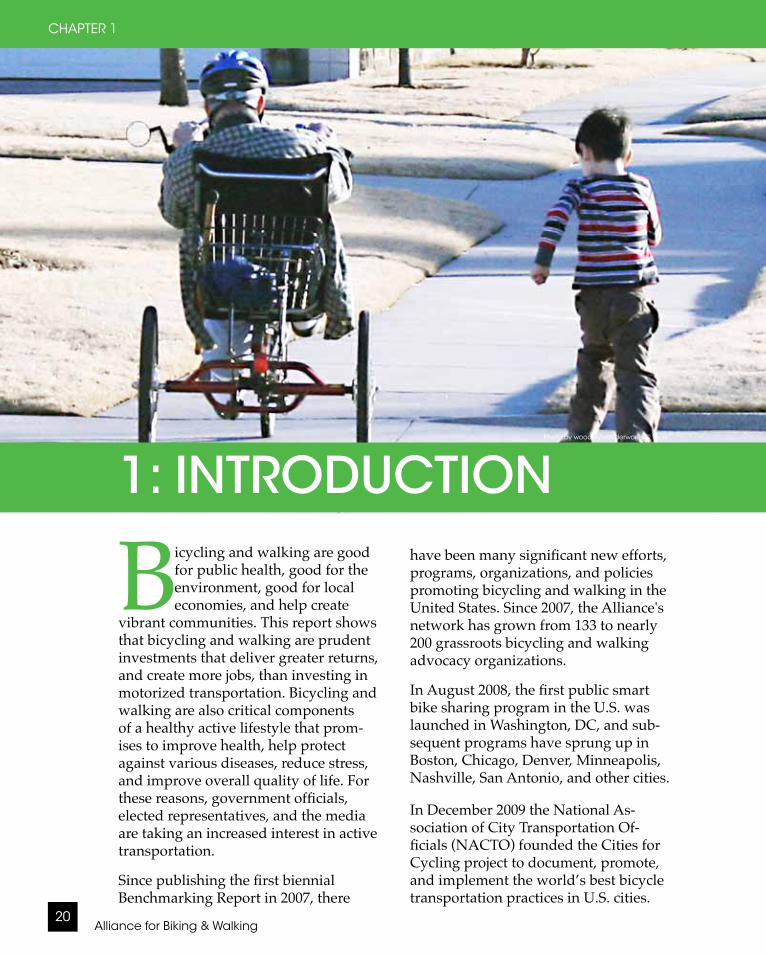
1: INTRODUCTION
Bicycling and walking are good for public health, good for the environment, good for local economies, and help create
vibrant communities. This report shows that bicycling and walking are prudent investments that deliver greater returns, and create more jobs, than investing in motorized transportation. Bicycling and walking are also critical components of a healthy active lifestyle that prom-ises to improve health, help protect against various diseases, reduce stress, and improve overall quality of life. For these reasons, government officials, elected representatives, and the media are taking an increased interest in active transportation.
Since publishing the first biennial Benchmarking Report in 2007, there
have been many significant new efforts, programs, organizations, and policies promoting bicycling and walking in the United States. Since 2007, the Alliance's network has grown from 133 to nearly 200 grassroots bicycling and walking advocacy organizations.
In August 2008, the first public smart bike sharing program in the U.S. was launched in Washington, DC, and sub-sequent programs have sprung up in Boston, Chicago, Denver, Minneapolis, Nashville, San Antonio, and other cities.
In December 2009 the National As-sociation of City Transportation Of-ficials (NACTO) founded the Cities for Cycling project to document, promote, and implement the world’s best bicycle transportation practices in U.S. cities.
Photo by woodleywonderworks @ Flickr
2012 Benchmarking Report 21
INTRODUCTION
The League of American Bicyclists has expanded its Bicycle Friendly Commu-nities Program to make states, business-es, and universities eligible for "bicycle friendly" designation. In April 2011, the Pedestrian and Bicyclist Information Center awarded the inaugural Walk Friendly Community designations to 11 communities.
These efforts are receiving increasing support from people in the public eye. In February 2010, First Lady Michelle Obama launched her Let's Move cam-paign to reduce childhood obesity within one generation. Helping kids become more physically active is one of the program's main goals. In March 2010, U.S. Secretary of Transportation Ray LaHood came out as a champion of bicycling and walking and introduced a new policy that recommended "in-creased commitment to and investment in bicycle facilities and walking net-works." In 2011, a survey of U.S. mayors revealed that they want more control of federal transportation money and 60% of mayors see bicycle and pedestrian projects as a major priority (Flusche 2011).
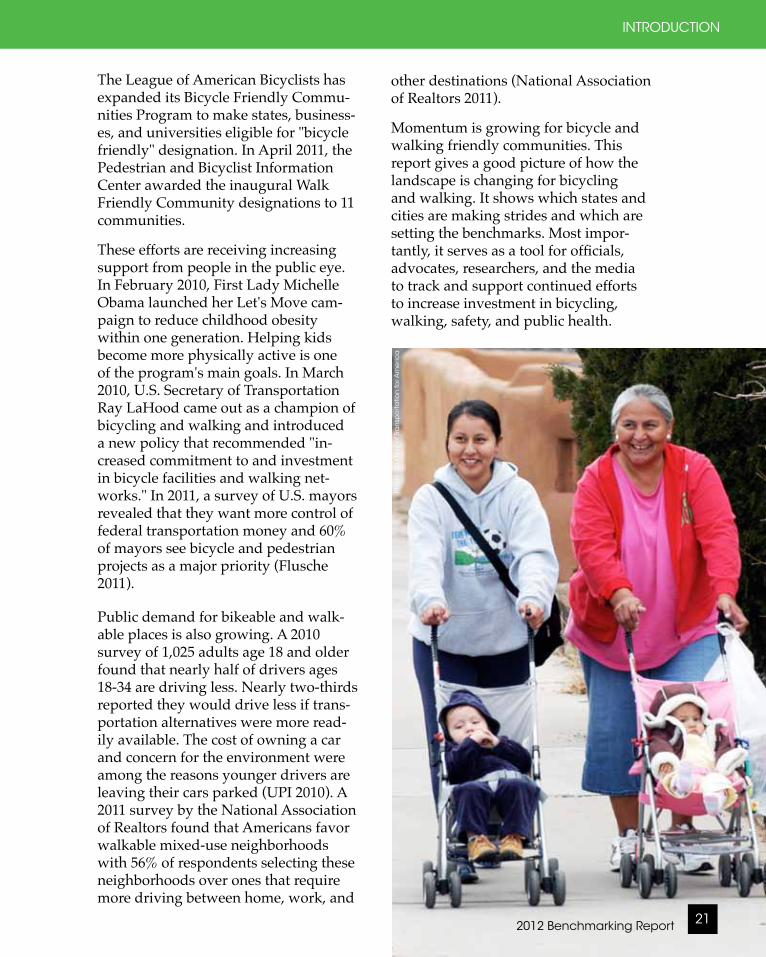
Public demand for bikeable and walk-able places is also growing. A 2010 survey of 1,025 adults age 18 and older found that nearly half of drivers ages 18-34 are driving less. Nearly two-thirds reported they would drive less if trans-portation alternatives were more read-ily available. The cost of owning a car and concern for the environment were among the reasons younger drivers are leaving their cars parked (UPI 2010). A 2011 survey by the National Association of Realtors found that Americans favor walkable mixed-use neighborhoods with 56% of respondents selecting these neighborhoods over ones that require more driving between home, work, and
other destinations (National Association of Realtors 2011).
Momentum is growing for bicycle and walking friendly communities. This report gives a good picture of how the landscape is changing for bicycling and walking. It shows which states and cities are making strides and which are setting the benchmarks. Most impor-tantly, it serves as a tool for officials, advocates, researchers, and the media to track and support continued efforts to increase investment in bicycling, walking, safety, and public health.
Ph
oto
co
urt
esy
of T
ran
spo
rta
tion
for A
me
rica
1: INTRODUCTIONPhoto by woodleywonderworks @ Flickr
Alliance for Biking & Walking22
CHAPTER 1
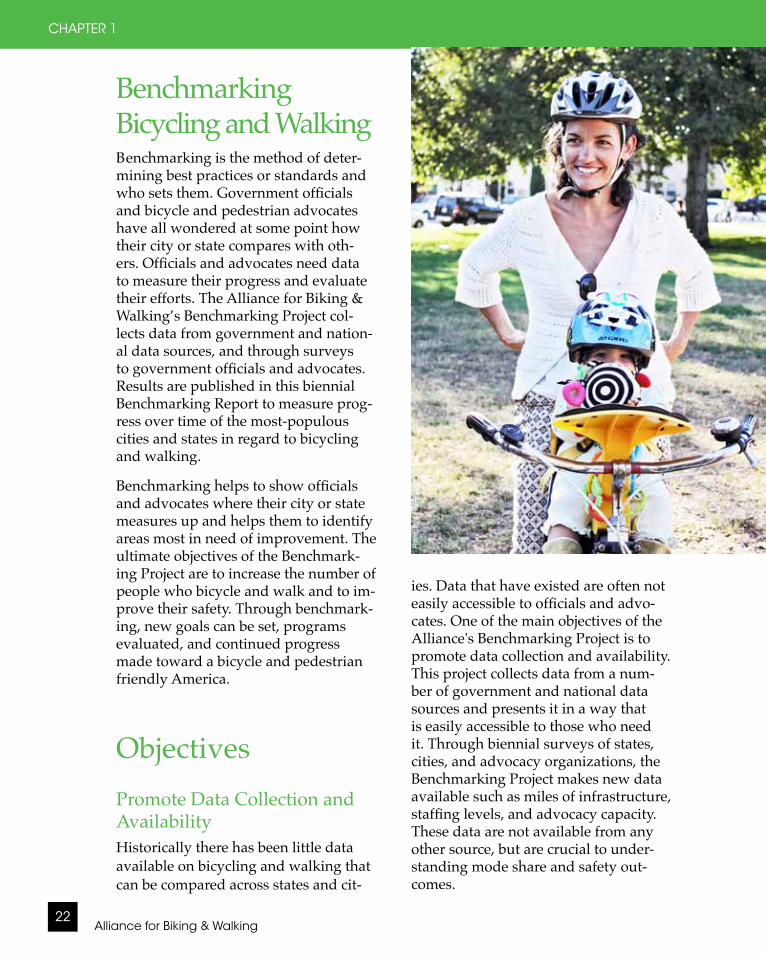
ies. Data that have existed are often not easily accessible to officials and advo-cates. One of the main objectives of the Alliance's Benchmarking Project is to promote data collection and availability. This project collects data from a num-ber of government and national data sources and presents it in a way that is easily accessible to those who need it. Through biennial surveys of states, cities, and advocacy organizations, the Benchmarking Project makes new data available such as miles of infrastructure, staffing levels, and advocacy capacity. These data are not available from any other source, but are crucial to under-standing mode share and safety out-comes.
Benchmarking Bicycling and WalkingBenchmarking is the method of deter-mining best practices or standards and who sets them. Government officials and bicycle and pedestrian advocates have all wondered at some point how their city or state compares with oth-ers. Officials and advocates need data to measure their progress and evaluate their efforts. The Alliance for Biking & Walking’s Benchmarking Project col-lects data from government and nation-al data sources, and through surveys to government officials and advocates. Results are published in this biennial Benchmarking Report to measure prog-ress over time of the most-populous cities and states in regard to bicycling and walking.
Benchmarking helps to show officials and advocates where their city or state measures up and helps them to identify areas most in need of improvement. The ultimate objectives of the Benchmark-ing Project are to increase the number of people who bicycle and walk and to im-prove their safety. Through benchmark-ing, new goals can be set, programs evaluated, and continued progress made toward a bicycle and pedestrian friendly America.
ObjectivesPromote Data Collection and AvailabilityHistorically there has been little data available on bicycling and walking that can be compared across states and cit-
Pho
to b
y Le
slie
Blo
om
2012 Benchmarking Report 23
INTRODUCTION
Make the Health ConnectionThe Centers for Disease Control and Prevention (CDC) has declared obe-sity an epidemic, and people are now looking more closely at the lifestyle choices that may be to blame. Among the top are unhealthy diet and seden-tary lifestyles. Studies demonstrate a link between the built environment and levels of physical activity (Frank et al., 2004; Goldberg 2007; Salems and Handy 2008; TRB 2005). The way communi-ties are designed is inextricably linked to the amount of physical activity their residents average. Where environments are built with bicyclists and pedestrians in mind, more people bicycle and walk. These environments increase opportu-nities for physical activity and promote healthy lifestyles.
Nearly 40% of all trips are two miles or less and 27% are one mile or less (NHTS). These are trips considered an easily bikeable or walkable distance. Now that people are looking for an-swers to reversing the obesity epidemic, increasing bicycling and walking is an obvious solution.
Alliance for Biking & Walking has partnered with the CDC for this project in an effort to highlight the connection between healthy lifestyles and bicycling and walking. This report includes data on physical activity, obesity and over-weight trends, high blood pressure rates, and diabetes, to illustrate the connection between bicycling and walking levels and these health indicators. Along with illustrating the correlation between bicycling and walking and health, the Alliance hopes to show, over time, that as bicycling and walking levels increase, the obesity epidemic begins to reverse.
Measure Progress and Evaluate ResultsBenchmarking is a necessary step to give communities a true picture of how they compare to other communities, what areas they are excelling in, and where they are falling behind. Most im-portantly, these data enable advocates and officials to evaluate the results of their efforts. Because the Benchmark-ing Project is ongoing, states and cities can measure their progress over time and will see the impacts of their ef-forts. By providing a consistent and objective tool for evaluation, this report allows states and cities to determine what works and what doesn’t. Success-ful models can be emulated and failed models discarded.
Support Efforts to Increase Bicycling and Walking The ultimate objectives of the Alliance’s Benchmarking Project are to support the efforts of officials and advocates to increase bicycling and walking in their communities and improve bicycle and pedestrian safety across the U.S. By comparing bicycling and walking statis-tics across states and cities, this report highlights and praises efforts of com-munities who provide models, encour-ages those making progress, and makes states and cities aware of areas where they need work. The Alliance hopes that this report will be used by commu-nities to set goals for increasing bicy-cling and walking, plan strategies using best practice models, and evaluate results over time. The Alliance strives to make this project a service and tool for officials and advocates so that they can chart the best course toward more bike-able and walkable communities.
Alliance for Biking & Walking24
CHAPTER 1
Rank City Population1 New York 8,391,8812 Los Angeles 3,831,8803 Chicago 2,850,5024 Houston 2,260,9185 Phoenix 1,593,6606 Philadelphia 1,547,2977 San Antonio 1,373,6778 San Diego 1,306,2289 Dallas 1,299,590
10 San Jose 964,67911 Detroit 910,84812 San Francisco 815,35813 Jacksonville 813,51814 Indianapolis 807,64015 Austin 790,59316 Columbus 773,02117 Fort Worth 731,58818 Charlotte 704,41719 Memphis 676,64620 Boston 645,18721 Baltimore 637,41822 El Paso 620,44023 Seattle 616,66924 Denver 610,34525 Nashville 605,46626 Milwaukee 605,02727 Washington, DC 599,65728 Las Vegas 567,61029 Portland, OR 566,60630 Louisville 566,49231 Oklahoma City 560,22632 Tucson 543,90733 Atlanta 540,93234 Albuquerque 529,21635 Kansas City, MO 482,22836 Fresno 479,91137 Mesa 467,17838 Sacramento 466,68539 Long Beach 462,59440 Omaha 454,71441 Virginia Beach 433,57542 Miami 433,14343 Cleveland 431,36944 Oakland 409,15145 Raleigh 405,19746 Colorado Springs 399,80347 Tulsa 389,36948 Minneapolis 385,38449 Arlington 380,07250 Honolulu 374,658
51* New Orleans 354,850
Rank State Population1 California 36,961,6642 Texas 24,782,3023 New York 19,541,4534 Florida 18,537,9695 Illinois 12,910,4096 Pennsylvania 12,604,7677 Ohio 11,542,6458 Michigan 9,969,7279 Georgia 9,829,21110 North Carolina 9,380,88411 New Jersey 8,707,74012 Virginia 7,882,59013 Washington 6,664,19514 Arizona 6,595,77815 Massachusetts 6,593,58716 Indiana 6,423,11317 Tennessee 6,296,25418 Missouri 5,987,58019 Maryland 5,699,47820 Wisconsin 5,654,77421 Minnesota 5,266,21522 Colorado 5,024,74823 Alabama 4,708,70824 South Carolina 4,561,24225 Louisiana 4,492,07626 Kentucky 4,314,11327 Oregon 3,825,65728 Oklahoma 3,687,05029 Connecticut 3,518,28830 Iowa 3,007,85731 Mississippi 2,951,99632 Arkansas 2,889,45033 Kansas 2,818,74734 Utah 2,784,57235 Nevada 2,643,08536 New Mexico 2,009,67137 West Virginia 1,819,77738 Nebraska 1,796,62239 Idaho 1,545,80140 New Hampshire 1,324,57541 Maine 1,318,30142 Hawaii 1,295,17843 Rhode Island 1,053,20944 Montana 974,98945 Delaware 885,12246 South Dakota 812,38347 Alaska 698,47348 North Dakota 646,84449 Vermont 621,76050 Wyoming 544,270
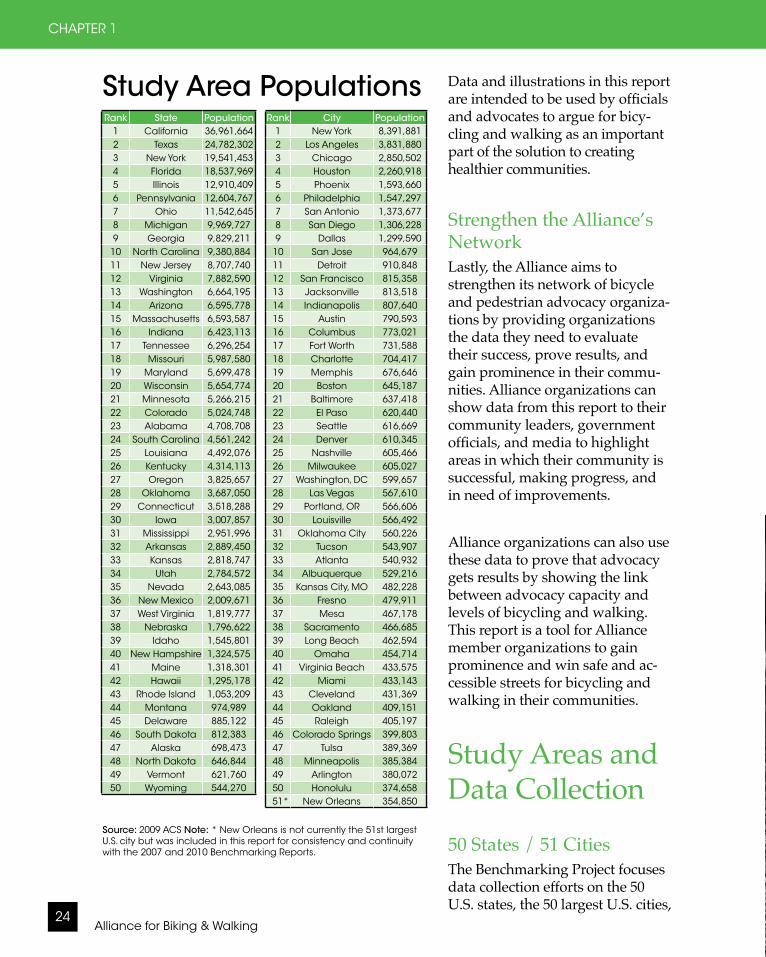
Study Area Populations
Source: 2009 ACS Note: * New Orleans is not currently the 51st largest U.S. city but was included in this report for consistency and continuity with the 2007 and 2010 Benchmarking Reports.
Data and illustrations in this report are intended to be used by officials and advocates to argue for bicy-cling and walking as an important part of the solution to creating healthier communities.
Strengthen the Alliance’s NetworkLastly, the Alliance aims to strengthen its network of bicycle and pedestrian advocacy organiza-tions by providing organizations the data they need to evaluate their success, prove results, and gain prominence in their commu-nities. Alliance organizations can show data from this report to their community leaders, government officials, and media to highlight areas in which their community is successful, making progress, and in need of improvements.
Alliance organizations can also use these data to prove that advocacy gets results by showing the link between advocacy capacity and levels of bicycling and walking. This report is a tool for Alliance member organizations to gain prominence and win safe and ac-cessible streets for bicycling and walking in their communities.
Study Areas and Data Collection
50 States / 51 CitiesThe Benchmarking Project focuses data collection efforts on the 50 U.S. states, the 50 largest U.S. cities,

2012 Benchmarking Report 25
INTRODUCTION
and New Orleans(1). The 51 largest cities were chosen for this study because these areas are the largest population areas of U.S. residents. Cities are also generally more densely developed than suburban and rural communities, and so may have greater opportunities for conversion of car trips to bicycling and walking.
National Data CollectionThe Project Team identified national and uniform government sources for data in this report whenever possible. National data sources utilized for this report include:
• American Community Survey (ACS) (2005-2009)
• American Public Transportation As-sociation (APTA) (2010)
Photo by Jim Swanson
• Behavioral Risk Factor Surveillance System (BRFSS) (2009)
• Federal Highway Administration's FMIS (FHWA) (2004-2010)
• Fatality Analysis Reporting System (FARS) (2005-2009)
• League of American Bicyclists (LAB) Bicycle Friendly States Program (2011)
• National Center for Safe Routes to School (2011)
• National Complete Streets Coalition (2011)
• National Health Interview Survey (NHIS) (2005)
• National Health and Nutrition Exami-nation Study (NHANES) (2005-2006)
• National Household Travel Survey (2001, 2009)
Note: (1) New Orleans was included in the 2007 Benchmarking Report as a top 50 population city (according to 2005 ACS population data), but experienced dramatic population loss after Hurricane Katrina in 2005. Raleigh, NC, moved up into the top 50 largest cities and was the only new city added for this report in 2010. The project team chose to keep New Orleans in this analysis to maintain consistency in cities reported. Throughout this report we refer to the "51 Largest U.S. Cit-ies" which includes the 50 largest U.S. cities and New Orleans. Throughout this report, the top 51 largest U.S. cities are also referred to as "major" or "largest" U.S. cities.
Study Area Populations

Alliance for Biking & Walking26
CHAPTER 1
Input Benchmarks
Policy (Chapter 4)
funding levels (per capita and % of transportation dollars to bicycling and walking)
complete streets policies goals to increase bicycling and
walking goals to increase safety bike/ped master plan bike/ped advisory committee legislation infrastructure (existing and planned
miles per square mile) bike-transit integration • bicycle racks on buses • bicycle parking spaces at transit
stations (per capita) • bicycle access on rail
Programs (Chapter 5)
adult and youth bicycle education courses participation (per capita)
Bike to Work Day participation (per capita)
open streets (ciclovia) initiatives participation (per capita)
city/state-sponsored bicycle rides participation (per capita)
Walk and Bike to School Day participation (per capita)
Advocacy (Chapter 6)
presence of dedicated bike/ped advocacy organization
capacity indicators of advocacy organization
• membership (per capita) • income (per capita) • staff levels (per capita) • contacts (per capita)
Outcome Benchmarks
Mode share (Chapter 2)
share of commuters all trips demographics • age • gender • ethnicity • income
Safety (Chapter 3)
fatalities (number and percent of all traffic fatalities)
risk disparities in mode share and fatali-
ties demographics • age
Public health (Chapter 8)
overweight and obesity levels hypertension (high blood pressure)
levels diabetes levels asthma levels physical activity levels
Primary Benchmarks in This Report
• National Transportation Enhance-ments Clearinghouse (2011)
• Rails-to-Trails Conservancy (2011)• Safe Routes to School National Part-
nership (SRTSNP) State of the State's Report (2011)
• School Transportation News (2011)• U.S. Census (1990, 2000)• United States Historical Climatology
Network (USHCN)• Web-based Injury Statistics Query
and Reporting System (WISQARS) (2009)
In some cases, data in this report come from individual independent studies. The sources for all data are identified throughout the report with accompa-nying charts, tables, and graphics. An overview of the national data sources used in this report can be found in Ap-pendix 1 on page 199. Individual studies cited in this report can be referenced in the Bibliography on page 231.
State and City SurveysMany of the variables this report mea-sures are not currently available from other national sources. In these cases, the project team relied on surveys completed by city and state agencies for data on in-dicators such as miles of bicycle facilities, city and state education efforts, and poli-cies. The surveys were sent to leaders of Alliance organizations, government officials, and advocates in the 50 states and 51 cities represented in this report in October 2010. Because Alliance advocacy leaders can tap existing relationships with local government officials, they were able to help increase the survey response rate and ensure that finished surveys were as complete as possible.
Surveys were completed by department of transportation staff, metropolitan
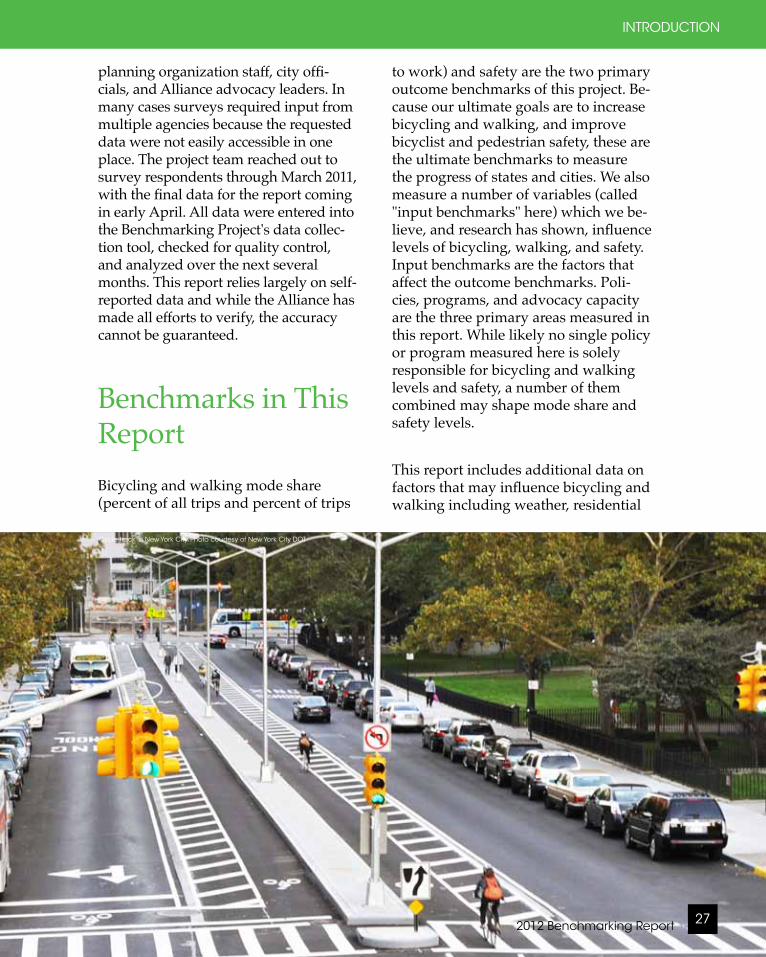
Cycle track in New York City. Photo courtesy of New York City DOT
2012 Benchmarking Report 27
INTRODUCTION
to work) and safety are the two primary outcome benchmarks of this project. Be-cause our ultimate goals are to increase bicycling and walking, and improve bicyclist and pedestrian safety, these are the ultimate benchmarks to measure the progress of states and cities. We also measure a number of variables (called "input benchmarks" here) which we be-lieve, and research has shown, influence levels of bicycling, walking, and safety. Input benchmarks are the factors that affect the outcome benchmarks. Poli-cies, programs, and advocacy capacity are the three primary areas measured in this report. While likely no single policy or program measured here is solely responsible for bicycling and walking levels and safety, a number of them combined may shape mode share and safety levels.
This report includes additional data on factors that may influence bicycling and walking including weather, residential
planning organization staff, city offi-cials, and Alliance advocacy leaders. In many cases surveys required input from multiple agencies because the requested data were not easily accessible in one place. The project team reached out to survey respondents through March 2011, with the final data for the report coming in early April. All data were entered into the Benchmarking Project's data collec-tion tool, checked for quality control, and analyzed over the next several months. This report relies largely on self-reported data and while the Alliance has made all efforts to verify, the accuracy cannot be guaranteed.
Benchmarks in This ReportBicycling and walking mode share (percent of all trips and percent of trips
Alliance for Biking & Walking28
CHAPTER 1
density, and levels of car ownership. This report also includes data on public health, an outcome benchmark of this project.
Using This ReportThe Benchmarking Project is intended as a resource for government officials, bicycle and pedestrian advocates, re-searchers, and the media searching for comparable data and means to measure progress. We encourage you to search this report for your city or state to see how you compare to others. To make data easy to find, this report orders all data tables alphabetically by city or state. Charts and graphs are ordered by benchmark in order to most clearly see how states and cities compare with each other. Here are a few additional tips for using this report:
1. See where you measure up: Review the report for your city or state. See how your city/state compares to others. Are you below or above the average for other cities/states? Note where you are leading and where you are behind.
2. Connect with the media: Consider issuing a press release or talking with the media about this report. Discuss how your state or city stacks up against others in bicycling and walking levels, safety, and funding. Highlight any areas where you are leading and opportunities for improvement. Use the data to support the work you are doing to promote bicycling and walk-ing locally.
3. Evaluate your efforts: Think about where you have been focusing your efforts toward increasing bicycling and walking and safety. Are these efforts working? Look for trends in the data in
this report. Look for benchmarks set by cities and states that are leading in the area you are working in.
4. Set new goals: Use the data in this re-port to set new goals and refocus your efforts if needed. There are examples in this report of significant improvements in just a few short years. You will find which cities and states are leading in funding, safety, facilities, and other ar-eas and will also see what the national average and averages for major U.S. cities are. Use these benchmarks to set goals for your city/state.
5. Use it as a reference book: The Alli-ance has heard from a number of gov-ernment officials and advocates that the Benchmarking Report is a publica-tion they reference frequently in their work. Keep this report on your office bookshelf in an accessible location or digital format. Use it when you are contacted by the media for statistics in your community, or when you need facts for a presentation or paper you are preparing. Use these data to sup-port your work promoting bicycling and walking in your state or city.
6. Share it: Purchase extra hard cop-ies of the report to give to your local elected and agency officials, organiza-tion leaders, and others who can use it. The report can be a great reason to have a meeting, talk about the current status, and improvements you can mutually strive for. It is always best to deliver the report in person. Also share the link to the Benchmarking Project Website with members, allies, and funders.”
If you have questions about the data in this report, would like to request ad-ditional data from the Benchmarking Project, have feedback for our team, or other questions or inquiries, please don't hesitate to contact us at [email protected].
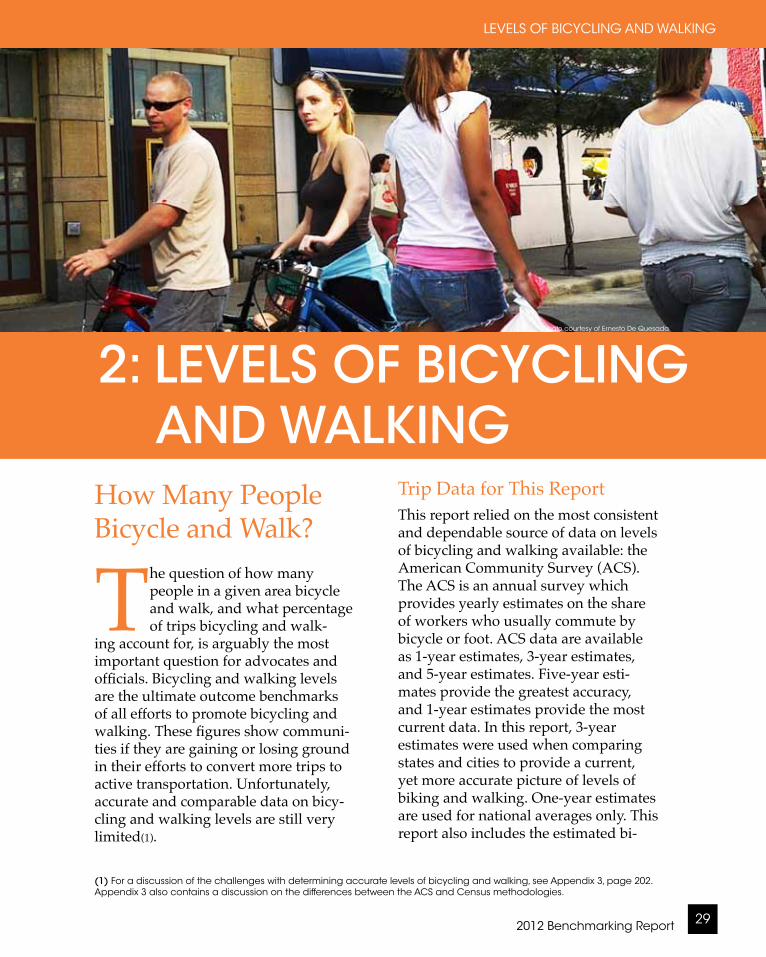
2012 Benchmarking Report 29
LEVELS OF BICYCLING AND WALKING
How Many People Bicycle and Walk?
The question of how many people in a given area bicycle and walk, and what percentage of trips bicycling and walk-
ing account for, is arguably the most important question for advocates and officials. Bicycling and walking levels are the ultimate outcome benchmarks of all efforts to promote bicycling and walking. These figures show communi-ties if they are gaining or losing ground in their efforts to convert more trips to active transportation. Unfortunately, accurate and comparable data on bicy-cling and walking levels are still very limited(1).
(1) For a discussion of the challenges with determining accurate levels of bicycling and walking, see Appendix 3, page 202. Appendix 3 also contains a discussion on the differences between the ACS and Census methodologies.
2: LEVELS OF BICYCLING AND WALKING
Trip Data for This ReportThis report relied on the most consistent and dependable source of data on levels of bicycling and walking available: the American Community Survey (ACS). The ACS is an annual survey which provides yearly estimates on the share of workers who usually commute by bicycle or foot. ACS data are available as 1-year estimates, 3-year estimates, and 5-year estimates. Five-year esti-mates provide the greatest accuracy, and 1-year estimates provide the most current data. In this report, 3-year estimates were used when comparing states and cities to provide a current, yet more accurate picture of levels of biking and walking. One-year estimates are used for national averages only. This report also includes the estimated bi-
Photo courtesy of Ernesto De Quesada
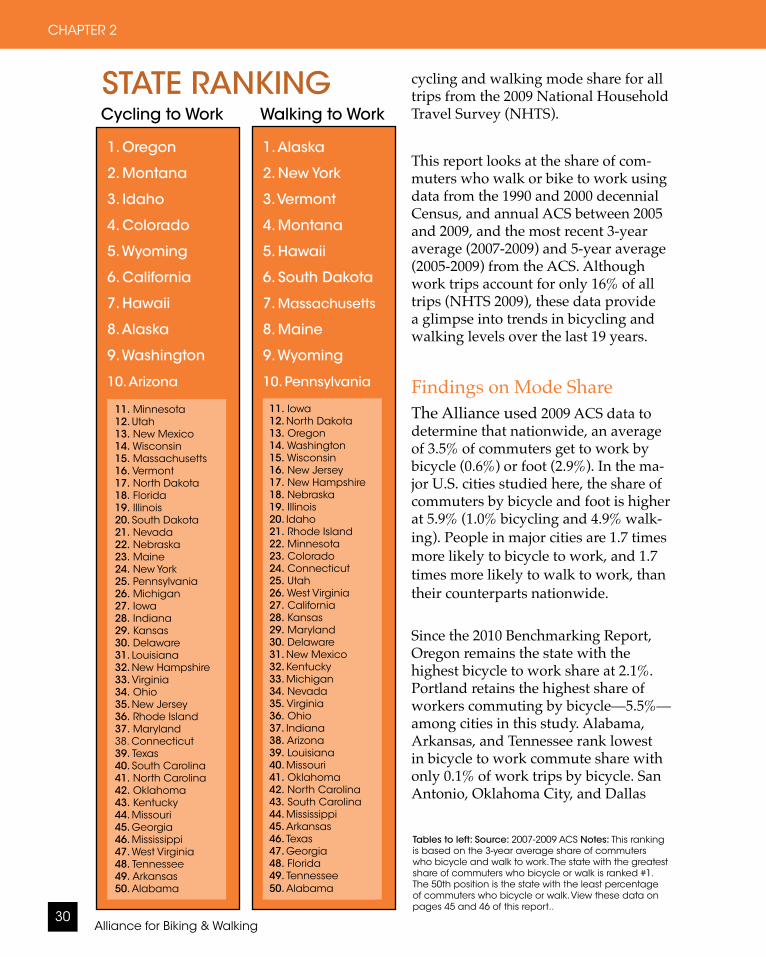
Alliance for Biking & Walking30
CHAPTER 2
cycling and walking mode share for all trips from the 2009 National Household Travel Survey (NHTS).
This report looks at the share of com-muters who walk or bike to work using data from the 1990 and 2000 decennial Census, and annual ACS between 2005 and 2009, and the most recent 3-year average (2007-2009) and 5-year average (2005-2009) from the ACS. Although work trips account for only 16% of all trips (NHTS 2009), these data provide a glimpse into trends in bicycling and walking levels over the last 19 years.
Findings on Mode Share The Alliance used 2009 ACS data to determine that nationwide, an average of 3.5% of commuters get to work by bicycle (0.6%) or foot (2.9%). In the ma-jor U.S. cities studied here, the share of commuters by bicycle and foot is higher at 5.9% (1.0% bicycling and 4.9% walk-ing). People in major cities are 1.7 times more likely to bicycle to work, and 1.7 times more likely to walk to work, than their counterparts nationwide.
Since the 2010 Benchmarking Report, Oregon remains the state with the highest bicycle to work share at 2.1%. Portland retains the highest share of workers commuting by bicycle—5.5%—among cities in this study. Alabama, Arkansas, and Tennessee rank lowest in bicycle to work commute share with only 0.1% of work trips by bicycle. San Antonio, Oklahoma City, and Dallas
STATE RANKING
Tables to left: Source: 2007-2009 ACS Notes: This ranking is based on the 3-year average share of commuters who bicycle and walk to work. The state with the greatest share of commuters who bicycle or walk is ranked #1. The 50th position is the state with the least percentage of commuters who bicycle or walk. View these data on pages 45 and 46 of this report..
11. Iowa12. North Dakota13. Oregon14. Washington15. Wisconsin16. New Jersey17. New Hampshire18. Nebraska19. Illinois20. Idaho21. Rhode Island22. Minnesota23. Colorado24. Connecticut25. Utah26. West Virginia27. California28. Kansas29. Maryland30. Delaware31. New Mexico32. Kentucky33. Michigan34. Nevada35. Virginia36. Ohio37. Indiana38. Arizona39. Louisiana40. Missouri41. Oklahoma42. North Carolina43. South Carolina44. Mississippi45. Arkansas46. Texas47. Georgia48. Florida49. Tennessee50. Alabama
Walking to Work
11. Minnesota12. Utah13. New Mexico14. Wisconsin15. Massachusetts16. Vermont17. North Dakota18. Florida19. Illinois20. South Dakota21. Nevada22. Nebraska23. Maine24. New York25. Pennsylvania26. Michigan27. Iowa28. Indiana29. Kansas30. Delaware31. Louisiana32. New Hampshire33. Virginia34. Ohio35. New Jersey36. Rhode Island37. Maryland38. Connecticut39. Texas40. South Carolina41. North Carolina42. Oklahoma43. Kentucky44. Missouri45. Georgia46. Mississippi47. West Virginia48. Tennessee49. Arkansas50. Alabama
Cycling to Work
1. Oregon
2. Montana
3. Idaho
4. Colorado
5. Wyoming
6. California
7. Hawaii
8. Alaska
9. Washington
10. Arizona
1. Alaska
2. New York
3. Vermont
4. Montana
5. Hawaii
6. South Dakota
7. Massachusetts
8. Maine
9. Wyoming
10. Pennsylvania
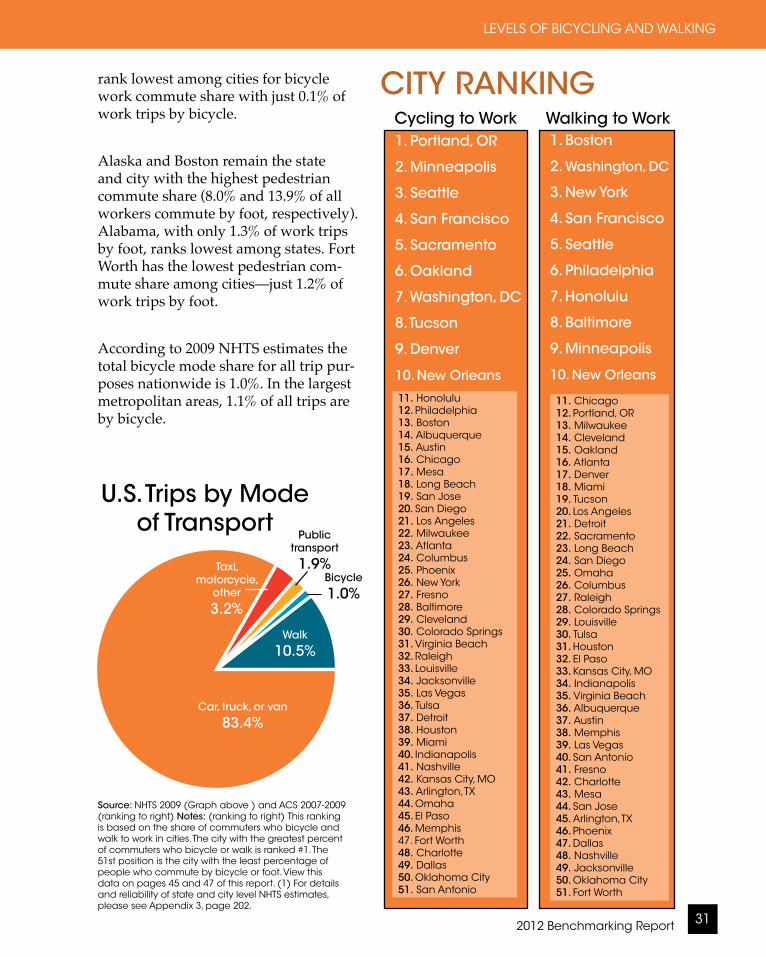
2012 Benchmarking Report 31
LEVELS OF BICYCLING AND WALKING
rank lowest among cities for bicycle work commute share with just 0.1% of work trips by bicycle.
Alaska and Boston remain the state and city with the highest pedestrian commute share (8.0% and 13.9% of all workers commute by foot, respectively). Alabama, with only 1.3% of work trips by foot, ranks lowest among states. Fort Worth has the lowest pedestrian com-mute share among cities—just 1.2% of work trips by foot.
According to 2009 NHTS estimates the total bicycle mode share for all trip pur-poses nationwide is 1.0%. In the largest metropolitan areas, 1.1% of all trips are by bicycle.
CITY RANKING
Source: NHTS 2009 (Graph above ) and ACS 2007-2009 (ranking to right) Notes: (ranking to right) This ranking is based on the share of commuters who bicycle and walk to work in cities. The city with the greatest percent of commuters who bicycle or walk is ranked #1. The 51st position is the city with the least percentage of people who commute by bicycle or foot. View this data on pages 45 and 47 of this report. (1) For details and reliability of state and city level NHTS estimates, please see Appendix 3, page 202.
U.S. Trips by Mode of Transport
11. Honolulu12. Philadelphia13. Boston14. Albuquerque15. Austin16. Chicago17. Mesa18. Long Beach19. San Jose20. San Diego21. Los Angeles22. Milwaukee23. Atlanta24. Columbus25. Phoenix26. New York27. Fresno28. Baltimore29. Cleveland30. Colorado Springs31. Virginia Beach32. Raleigh33. Louisville34. Jacksonville35. Las Vegas36. Tulsa37. Detroit38. Houston39. Miami40. Indianapolis41. Nashville42. Kansas City, MO43. Arlington, TX44. Omaha45. El Paso46. Memphis47. Fort Worth48. Charlotte49. Dallas50. Oklahoma City51. San Antonio
Cycling to Work1. Portland, OR
2. Minneapolis
3. Seattle
4. San Francisco
5. Sacramento
6. Oakland
7. Washington, DC
8. Tucson
9. Denver
10. New Orleans
11. Chicago12. Portland, OR13. Milwaukee14. Cleveland15. Oakland16. Atlanta17. Denver18. Miami19. Tucson20. Los Angeles21. Detroit22. Sacramento23. Long Beach24. San Diego25. Omaha26. Columbus27. Raleigh28. Colorado Springs29. Louisville30. Tulsa31. Houston32. El Paso33. Kansas City, MO34. Indianapolis35. Virginia Beach36. Albuquerque37. Austin38. Memphis39. Las Vegas40. San Antonio41. Fresno42. Charlotte43. Mesa44. San Jose45. Arlington, TX46. Phoenix47. Dallas48. Nashville49. Jacksonville50. Oklahoma City51. Fort Worth
Walking to Work1. Boston
2. Washington, DC
3. New York
4. San Francisco
5. Seattle
6. Philadelphia
7. Honolulu
8. Baltimore
9. Minneapolis
10. New Orleans
Car, truck, or van
83.4%
Walk
10.5%
Taxi, motorcycle,
other
3.2%
Public transport
1.9%Bicycle
1.0%

Alliance for Biking & Walking32
CHAPTER 2
Source: ACS 2007-2009
.
Source: ACS 2007-2009
Levels of Bicycling to Work in U.S.
Levels of Walking to Work in the U.S.
Share of commuters who bike to work
= 0.12%-0.29%= 0.30%-0.54%= 0.55%-0.86%= 0.87%-2.12%
Share of commuters who walk to work
= 1.30%-2.55%= 2.56%-3.23%= 3.24%-4.42%= 4.43%-7.96%
The share of commuters who walk and bicycle to work has grown in recent
years.
Levels of walking to work increased in all but six states between 2005 and 2009. Levels of bicycling to work increased in all but four states during this time period. The southern U.S. remains the region with the lowest levels of bicycling and walking to work.

2012 Benchmarking Report 33
LEVELS OF BICYCLING AND WALKING
NHTS data for 2009 show that nation-ally 10.5% of all trips are by foot. This is up 18% from the 2001 level of 8.9%. Rates of walking in major metropolitan areas ("cities") are even greater. NHTS estimates that 12.7% of all city trips are by foot. This is up 15% from the 2001 level of 11% of all city trips.
The 2009 NHTS also asked respondents how many times they took a trip by bicycle or foot in the last week. Results indicate that 13% of people take at least one bicycle trip per week and 68% of people take at least one walking trip per week. These amount to over 4 billion bicycle trips and nearly 41 billion walk-ing trips in 2009 in the United States.
Biking Walking1990 0.4% 3.9%2000 0.4% 2.9%2005 0.4% 2.5%2006 0.5% 2.9%2007 0.5% 2.8%2008 0.5% 2.8%2009 0.6% 2.9%
0.5%0.5%0.5%0.4%0.4%0.4%
Share of Commuters Who Bicycle and Walk 1990-2009
Sources: U.S. Census 1990, 2000; ACS 2005, ACS 2006, ACS 2007, ACS 2008, ACS 2009
Legend: = % of commuters who walk to work = % of commuters who bike to work
% o
f co
mm
ute
rs
Trends in Bicycling and Walking LevelsThe Alliance looked at data from the 1990 and 2000 decennial Census and annual American Community Surveys from 2005 through 2009 to examine trends in the share of commuters who bicycle or walk to work daily over the last two decades. (Find additional data on bicycling and walking levels over time in Appendix 4, page 205.)
The number of people who bicycle to work has increased steadily, rising 64% between 1990 and 2009 from 466,856 to 765,703 people who bicycle to work na-tionwide. The share of commuters who bicycle to work rose from 0.4% nation-wide in 1990 and 2000 to 0.6% in 2009.
(Continued page 41)
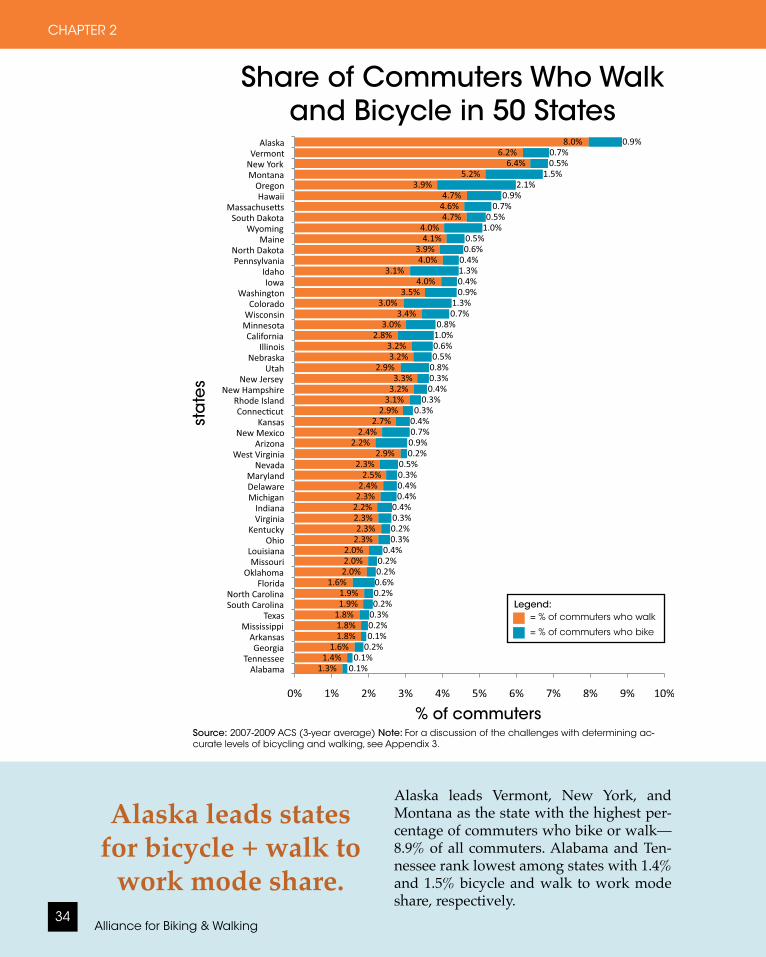
Alliance for Biking & Walking34
CHAPTER 2
Share of Commuters Who Walk and Bicycle in 50 States
Alaska leads states for bicycle + walk to
work mode share.
Alaska leads Vermont, New York, and Montana as the state with the highest per-centage of commuters who bike or walk—8.9% of all commuters. Alabama and Ten-nessee rank lowest among states with 1.4% and 1.5% bicycle and walk to work mode share, respectively.
Source: 2007-2009 ACS (3-year average) Note: For a discussion of the challenges with determining ac-curate levels of bicycling and walking, see Appendix 3.
Legend: = % of commuters who walk = % of commuters who bike
sta
tes
% of commuters

2012 Benchmarking Report 35
LEVELS OF BICYCLING AND WALKING
, TX
, DC
, OR
Share of Commuters Who Walk and Bicycle in Largest U.S. Cities
Boston ranks top for bicycle + walk to work
mode share.
Bicycling and walking mode share is significantly higher in cities. On average 5.8% of commuters in the largest U.S. cities bike or walk to work. Boston (15.4%) leads Washington, DC (13.4%), San Francisco (12.8%), and Seattle (11.5%) as the cities with the highest rate of bicy-cling and walking to work.
Legend: = % of commuters who walk = % of commuters who bike
citi
es
% of commutersSource: 2007-2009 ACS (3-year average) Note: For a discussion of the challenges with determining accurate levels of bicycling and walking, see Appendix 3.
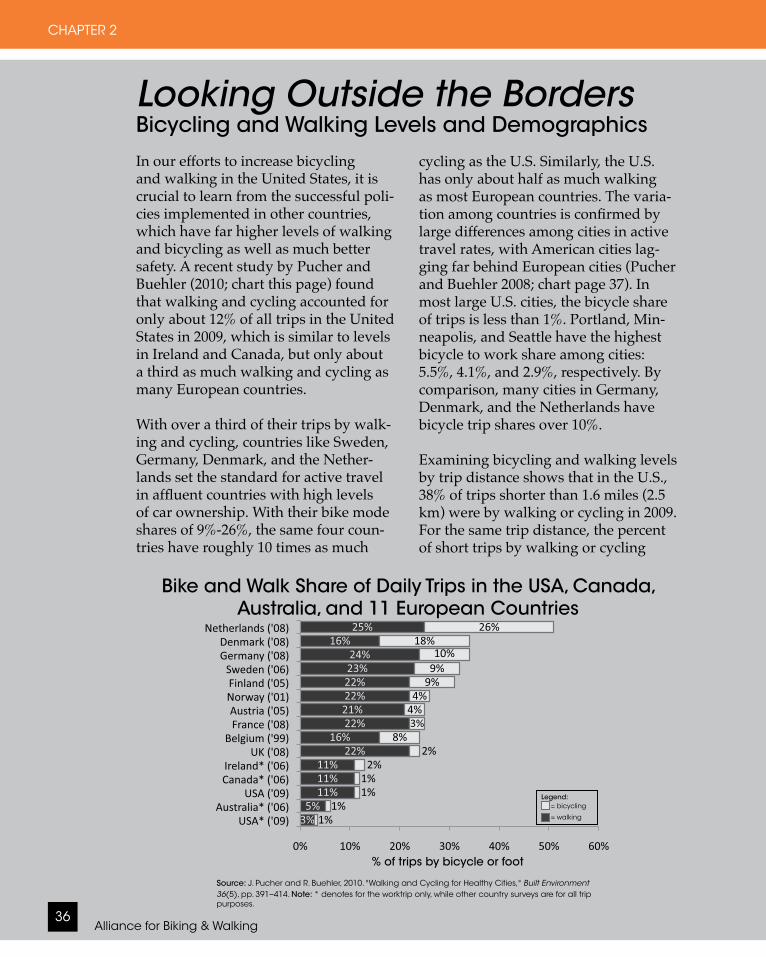
Looking Outside the BordersBicycling and Walking Levels and Demographics
Alliance for Biking & Walking36
CHAPTER 2
In our efforts to increase bicycling and walking in the United States, it is crucial to learn from the successful poli-cies implemented in other countries, which have far higher levels of walking and bicycling as well as much better safety. A recent study by Pucher and Buehler (2010; chart this page) found that walking and cycling accounted for only about 12% of all trips in the United States in 2009, which is similar to levels in Ireland and Canada, but only about a third as much walking and cycling as many European countries.
With over a third of their trips by walk-ing and cycling, countries like Sweden, Germany, Denmark, and the Nether-lands set the standard for active travel in affluent countries with high levels of car ownership. With their bike mode shares of 9%-26%, the same four coun-tries have roughly 10 times as much
cycling as the U.S. Similarly, the U.S. has only about half as much walking as most European countries. The varia-tion among countries is confirmed by large differences among cities in active travel rates, with American cities lag-ging far behind European cities (Pucher and Buehler 2008; chart page 37). In most large U.S. cities, the bicycle share of trips is less than 1%. Portland, Min-neapolis, and Seattle have the highest bicycle to work share among cities: 5.5%, 4.1%, and 2.9%, respectively. By comparison, many cities in Germany, Denmark, and the Netherlands have bicycle trip shares over 10%.
Examining bicycling and walking levels by trip distance shows that in the U.S., 38% of trips shorter than 1.6 miles (2.5 km) were by walking or cycling in 2009. For the same trip distance, the percent of short trips by walking or cycling
Bike and Walk Share of Daily Trips in the USA, Canada, Australia, and 11 European Countries009
Netherlands, France, the UK, and Denmark, 1974-2009
Legend: = bicycling = walking
Source: J. Pucher and R. Buehler, 2010. "Walking and Cycling for Healthy Cities," BuiltEnvironment36(5), pp. 391–414. Note: * denotes for the worktrip only, while other country surveys are for all trip purposes.
% of trips by bicycle or foot
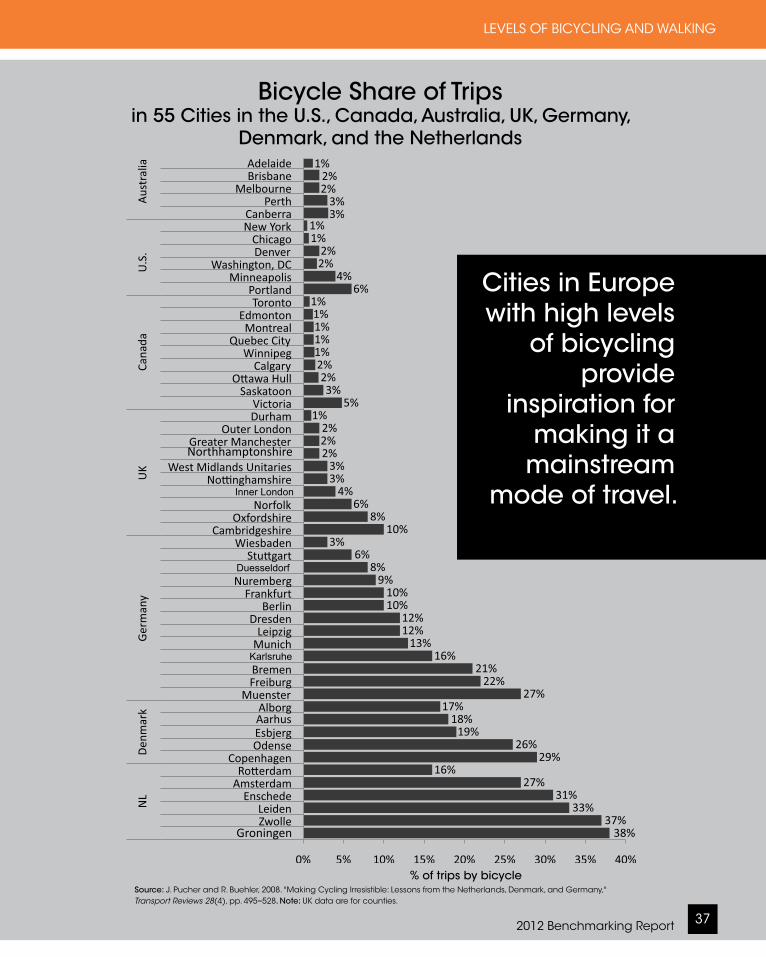
2012 Benchmarking Report 37
LEVELS OF BICYCLING AND WALKING
Aarhus
Groningen
Northhamptonshire
Inner London
Duesseldorf
Karlsruhe
Bicycle Share of Trips in 55 Cities in the U.S., Canada, Australia, UK, Germany,
Denmark, and the Netherlands
Source: J. Pucher and R. Buehler, 2008. "Making Cycling Irresistible: Lessons from the Netherlands, Denmark, and Germany," TransportReviews28(4), pp. 495–528. Note: UK data are for counties.
Cities in Europe with high levels
of bicycling provide
inspiration for making it a
mainstream mode of travel.
% of trips by bicycle

Alliance for Biking & Walking38
CHAPTER 2
was 63% in Germany, 70% in Denmark, and 54% in the Netherlands (see chart this page). The variation between the U.S. and other countries is greatest when looking at longer trip distances. Bicycling and walking account for only 3% of trips of 2.8 to 4 miles (4.5-6.5 km) in the U.S., compared to 16% in Germany, 21% in Denmark, and 27% in the Netherlands. Thus, at every trip distance, walking and cycling rates are much higher in northern Europe than in the U.S.
Perhaps the most striking differences among countries in walking and cycling rates are by age group. In Germany,
Denmark, and the Netherlands, a high proportion of trips in all age categories are by walking or cycling (see chart page 39). In the U.S., only 18% of trips by children are made by walking or cycling, compared to 43% in Germany, 51% in Denmark, and 64% in the Netherlands. Similarly, only 10% of trips by American elderly are by walking or cycling, compared to 43% in Germany, 51% in Denmark, and 64% in the Netherlands. The much higher levels of walking and cycling in northern Europe provide important physical activity, mobil-ity, and independence for all age groups, while children and seniors in the U.S. are often dependent on their families, neigh-bors, and friends for many trips they need to make.
Trends in bicycling and walking levels over the last 35 years vary greatly among
U.S.
Source: J. Pucher and R. Buehler, 2010 "Walking and Cycling for Healthy Cities," BuiltEnvironment36(5), pp. 391–414. URL link: http://policy.rutgers.edu/faculty/pucher/BuiltEnvironment_WalkBike_10Dec2010.pdf
Bicycling and Walking Levels by Trip Distance
% of all trips
Legend: = bicycling = walking
Pho
to b
y Ka
te M
cC
art
hy

2012 Benchmarking Report 39
LEVELS OF BICYCLING AND WALKING
Source: J. Pucher and R. Buehler, 2010. "Walking and Cycling for Healthy Cities," BuiltEnvironment36(5), pp. 391–414. URL link: http://policy.rutgers.edu/faculty/pucher/BuiltEnvironment_WalkBike_10Dec2010.pdf Note (above) (1): Methods for NHTS changed in 2001. Thus the increase from 1990 to 2001 may be due to methods. Moreover, the long-term trend may also be skewed because of that.
65+ 28.00% 23.00%
U.S.
Bicycling and Walking Levels by Age
Ag
e g
rou
p
% of all trips
countries (see chart page 40). France and the UK, for example, suffered dramatic falls in walking and cycling, with roughly 50% declines in both countries. By com-parison, walking and cycling levels have been roughly stable in the Netherlands, Denmark, and Germany, with declines in walking partly offset by increases in cy-cling. The much smaller declines in active transport in the Netherlands, Denmark, and Germany are due to far more car-restrictive policies in those countries since the 1970s, combined with a wide range of measures to encourage more walking and cycling. Car-restrictive measures have been far less common in France and the UK, and those two countries have also done less to promote walking and cycling through infrastructure, programs, and policies (Pucher and Buehler 2010). In ad-
dition, suburban and exurban sprawl has been more extensive in France and the UK than in the Netherlands, Denmark, and Germany.
It is more difficult to gauge walking and cycling trends in the U.S. because there was an important change in the national travel survey methodology in 2001 that raised the walk mode share by capturing previously unreported walk trips. The survey results in the chart on page 40 suggest slight increases in walking and cycling levels in the USA, but in fact, they have probably declined. For example, the U.S. Census, using a consistent meth-odology over time, reports a substantial decline in walking and cycling to work: from 7.9% in 1970 to only 3.3% in 2008 (USDOC 2010).
Legend: = bicycling = walking
Pho
to b
y D
an
Bu
rde
n, W
alk
ab
le a
nd
Liv
ab
le C
om
mu
niti
es
Inst
itute
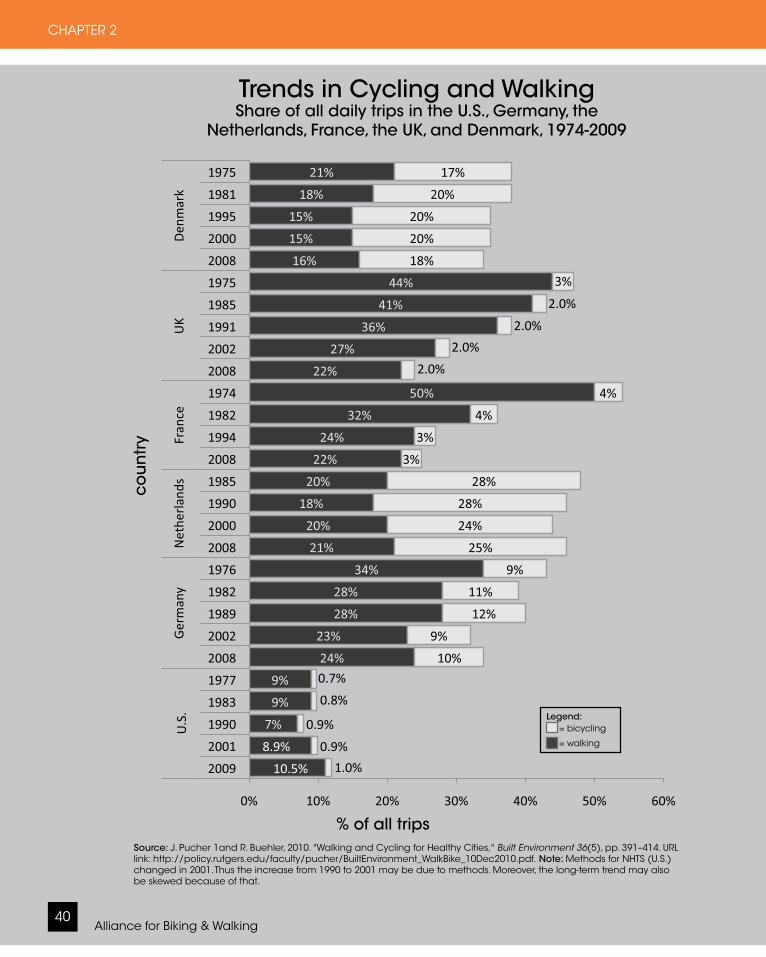
Alliance for Biking & Walking40
CHAPTER 2
0.7%
0.9%
0.9%
0.8%
1.0%
2.0%
2.0%
2.0%
2.0%
10.5%
8.9%
U.S.
Trends in Cycling and WalkingShare of all daily trips in the U.S., Germany, the
Netherlands, France, the UK, and Denmark, 1974-2009c
ou
ntr
y
% of all tripsSource: J. Pucher 1and R. Buehler, 2010. "Walking and Cycling for Healthy Cities," BuiltEnvironment36(5), pp. 391–414. URL link: http://policy.rutgers.edu/faculty/pucher/BuiltEnvironment_WalkBike_10Dec2010.pdf. Note: Methods for NHTS (U.S.) changed in 2001. Thus the increase from 1990 to 2001 may be due to methods. Moreover, the long-term trend may also be skewed because of that.
Legend: = bicycling = walking

2012 Benchmarking Report 41
LEVELS OF BICYCLING AND WALKING
cities
During the same time period the num-ber of people who walk to work fell 12% (from roughly 4.5 million people in 1990 to roughly 4.0 million people in 2009). The number of people who walk to work increased by just 5% between 2000 and 2009. The share of commuters who walk to work is now 2.9%, down from 3.9% in 1990. The share of com-muters who walk to work has remained relatively stable since 2000.
Bicyclist and Pedestrian Mode Share by Income Class Household Income
Less than $20,000
$20,000 to $39,999
$40,000 to $74,999
$75,000 to $99,999
$100,000 and over All
Bicyclists 1.0% 1.2% 1.0% 0.9% 1.1% 1.1%Pedestrians 16.3% 10.3% 8.9% 8.9% 10.2% 10.5%
Source: NHTS 2009
Who Bicycles and Walks?
Demographic DataDetermining who walks and bicycles is also difficult. Because the ACS counts only commuter trips, trips taken for nonwork purposes, such as those made
Louisville 52.38% 32.21% 9.04% 6.37%Colorado Sprin 53.17% 26.00% 12.95% 7.89%Albuquerque 53.31% 26.61% 15.69% 4.39%Fort Worth 53.50% 30.37% 13.83% 2.30%Arlington CBD 55.36% 31.59% 10.02% 3.04%Virginia Beach 56.17% 31.52% 7.02% 5.29%Fresno 56.53% 32.11% 8.81% 2.55%Tulsa 57.32% 29.68% 6.54% 6.47%San Antonio 57.33% 27.93% 10.55% 4.20%El Paso 57.96% 32.49% 8.07% 1.48%Raleigh 58.66% 30.54% 6.17% 4.63%Columbus 60.44% 27.95% 8.61% 3.00%Memphis 62.08% 24.69% 10.65% 2.58%
*** * * †† † ††
, DC
, OR
, TX
Pedestrian Commuters by Income Classification
Source: ACS 2007-2009
% o
f th
ose
wh
o w
alk
to w
ork
in e
ac
h in
co
me
ca
teg
ory
Legend: Annual income equals
= $65,000 or more
= $35,000 to $64,999
= $15,000 to $34,999
= Less than $15,000
= 5 cities with highest median income
= 5 cities with lowest median income
*
†
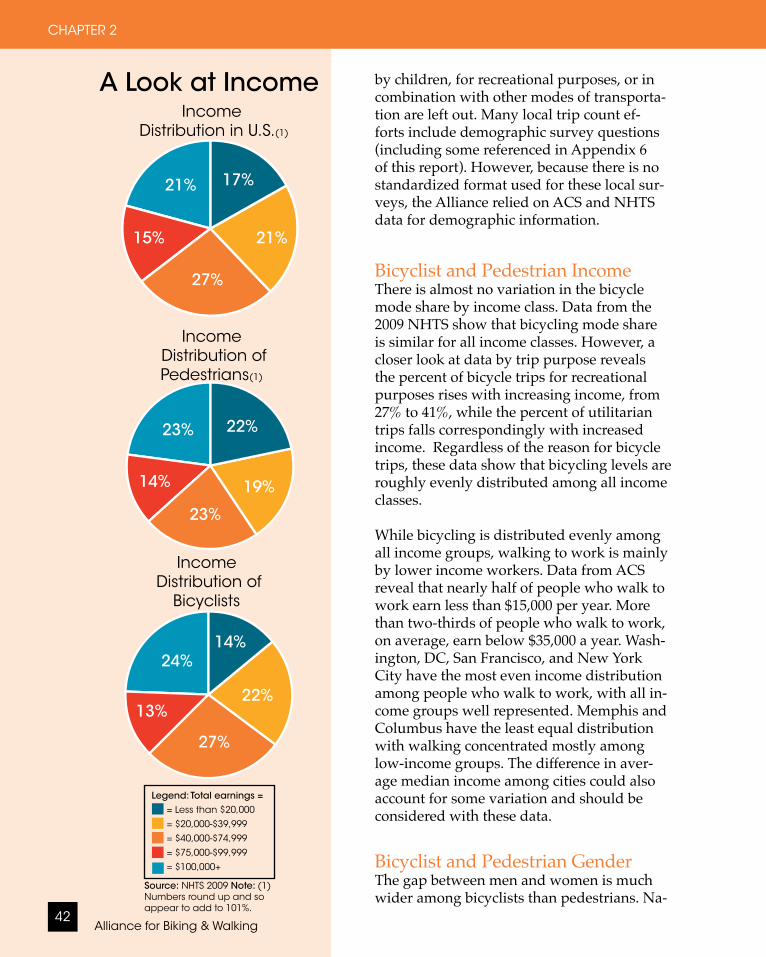
A Look at Income
Alliance for Biking & Walking42
CHAPTER 2
Income Distribution in U.S.(1)
Income Distribution of Pedestrians(1)
by children, for recreational purposes, or in combination with other modes of transporta-tion are left out. Many local trip count ef-forts include demographic survey questions (including some referenced in Appendix 6 of this report). However, because there is no standardized format used for these local sur-veys, the Alliance relied on ACS and NHTS data for demographic information.
Bicyclist and Pedestrian IncomeThere is almost no variation in the bicycle mode share by income class. Data from the 2009 NHTS show that bicycling mode share is similar for all income classes. However, a closer look at data by trip purpose reveals the percent of bicycle trips for recreational purposes rises with increasing income, from 27% to 41%, while the percent of utilitarian trips falls correspondingly with increased income. Regardless of the reason for bicycle trips, these data show that bicycling levels are roughly evenly distributed among all income classes.
While bicycling is distributed evenly among all income groups, walking to work is mainly by lower income workers. Data from ACS reveal that nearly half of people who walk to work earn less than $15,000 per year. More than two-thirds of people who walk to work, on average, earn below $35,000 a year. Wash-ington, DC, San Francisco, and New York City have the most even income distribution among people who walk to work, with all in-come groups well represented. Memphis and Columbus have the least equal distribution with walking concentrated mostly among low-income groups. The difference in aver-age median income among cities could also account for some variation and should be considered with these data. Bicyclist and Pedestrian GenderThe gap between men and women is much wider among bicyclists than pedestrians. Na-
Source: NHTS 2009 Note: (1) Numbers round up and so appear to add to 101%.
Income Distribution of
Bicyclists
Legend: Total earnings = = Less than $20,000
= $20,000-$39,999= $40,000-$74,999= $75,000-$99,999= $100,000+
21%
27%
17%21%
15%
19%
22%23%
23%
14%
22%13%
24%
27%
14%
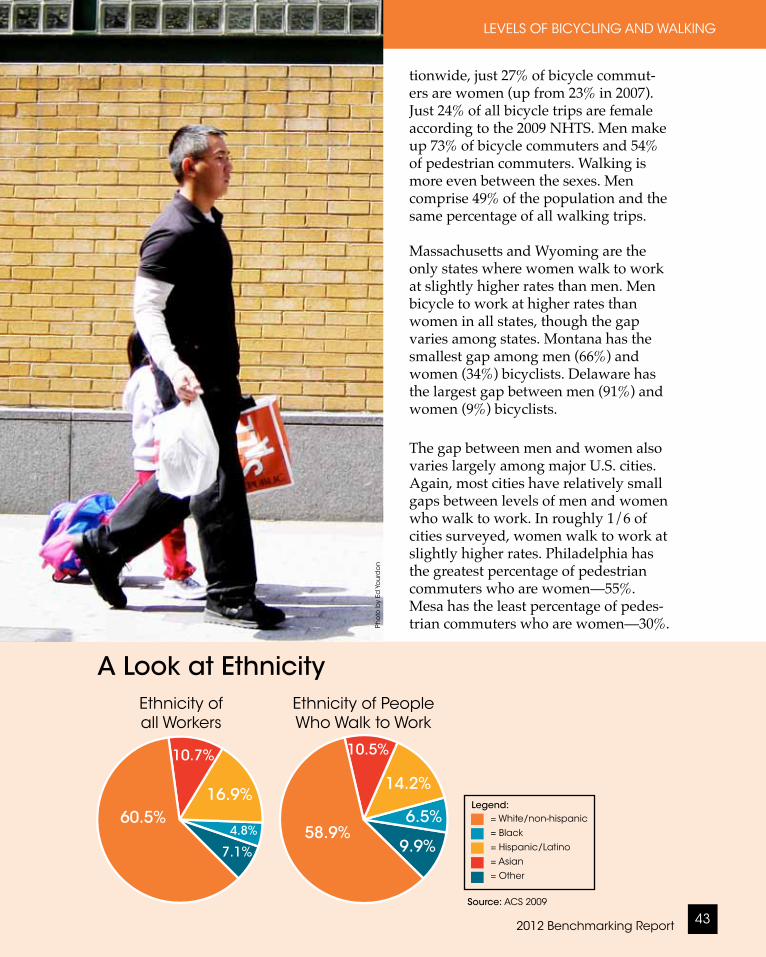
2012 Benchmarking Report 43
LEVELS OF BICYCLING AND WALKING
tionwide, just 27% of bicycle commut-ers are women (up from 23% in 2007). Just 24% of all bicycle trips are female according to the 2009 NHTS. Men make up 73% of bicycle commuters and 54% of pedestrian commuters. Walking is more even between the sexes. Men comprise 49% of the population and the same percentage of all walking trips.
Massachusetts and Wyoming are the only states where women walk to work at slightly higher rates than men. Men bicycle to work at higher rates than women in all states, though the gap varies among states. Montana has the smallest gap among men (66%) and women (34%) bicyclists. Delaware has the largest gap between men (91%) and women (9%) bicyclists.
The gap between men and women also varies largely among major U.S. cities. Again, most cities have relatively small gaps between levels of men and women who walk to work. In roughly 1/6 of cities surveyed, women walk to work at slightly higher rates. Philadelphia has the greatest percentage of pedestrian commuters who are women—55%. Mesa has the least percentage of pedes-trian commuters who are women—30%.
Ethnicity of People Who Walk to Work
Legend: = White/non-hispanic
= Black= Hispanic/Latino= Asian= Other
4%
A Look at Ethnicity
Source: ACS 2009
Pho
to b
y Ed
Yo
urd
on
10.5%
58.9%6.5%
9.9%
14.2%
4.8%60.5%
10.7%
16.9%
7.1%
Ethnicity of all Workers
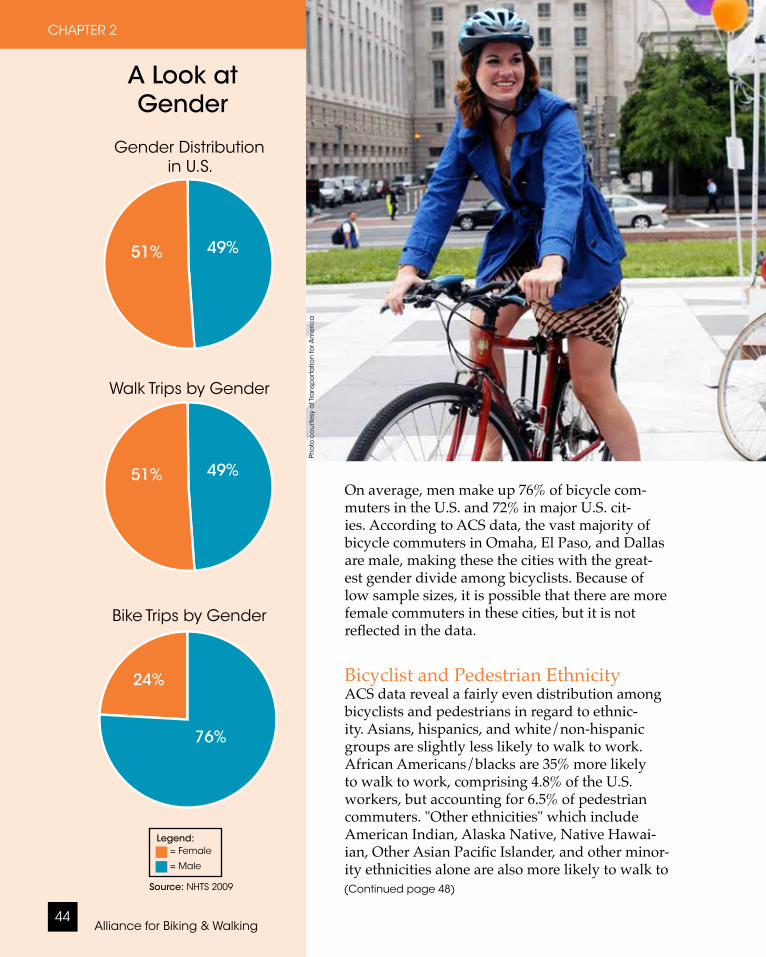
Alliance for Biking & Walking44
CHAPTER 2
A Look at Gender
Walk Trips by Gender
Bike Trips by Gender
Legend: = Female = Male
Source: NHTS 2009
Gender Distribution in U.S.
Pho
to c
ou
rte
sy o
f Tra
nsp
ort
atio
n fo
r Am
eric
a
51% 49%
76%
24%
51% 49%On average, men make up 76% of bicycle com-muters in the U.S. and 72% in major U.S. cit-ies. According to ACS data, the vast majority of bicycle commuters in Omaha, El Paso, and Dallas are male, making these the cities with the great-est gender divide among bicyclists. Because of low sample sizes, it is possible that there are more female commuters in these cities, but it is not reflected in the data.
Bicyclist and Pedestrian EthnicityACS data reveal a fairly even distribution among bicyclists and pedestrians in regard to ethnic-ity. Asians, hispanics, and white/non-hispanic groups are slightly less likely to walk to work. African Americans/blacks are 35% more likely to walk to work, comprising 4.8% of the U.S. workers, but accounting for 6.5% of pedestrian commuters. "Other ethnicities" which include American Indian, Alaska Native, Native Hawai-ian, Other Asian Pacific Islander, and other minor-ity ethnicities alone are also more likely to walk to (Continued page 48)
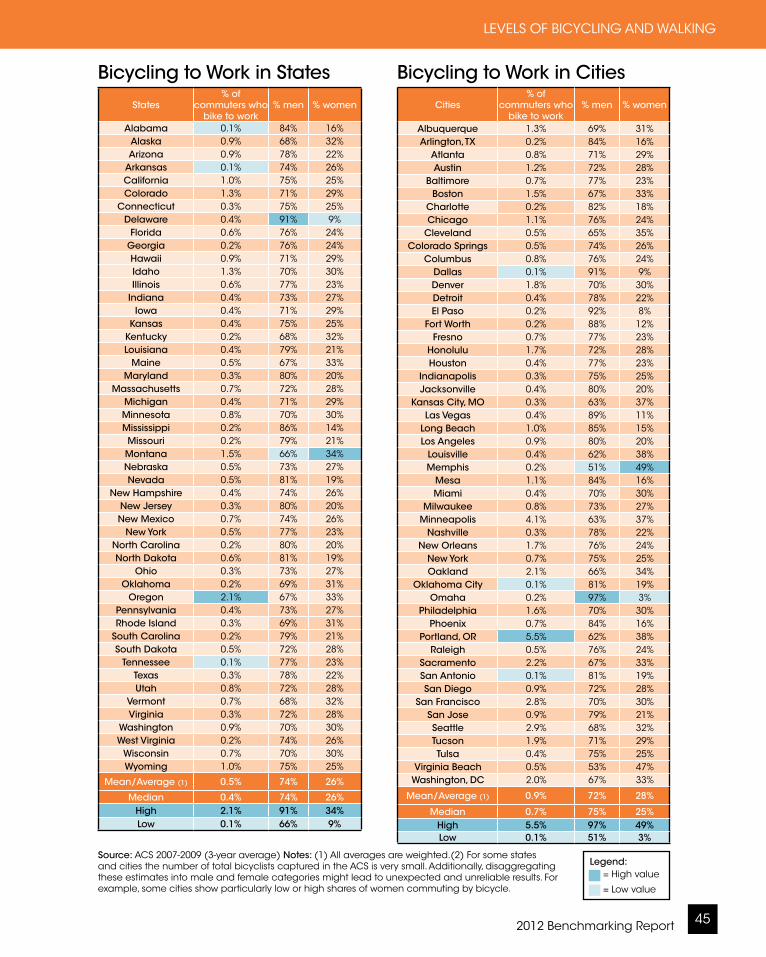
2012 Benchmarking Report 45
LEVELS OF BICYCLING AND WALKING
Cities% of
commuters who bike to work
% men % women
Albuquerque 1.3% 69% 31%Arlington, TX 0.2% 84% 16%
Atlanta 0.8% 71% 29%Austin 1.2% 72% 28%
Baltimore 0.7% 77% 23%Boston 1.5% 67% 33%
Charlotte 0.2% 82% 18%Chicago 1.1% 76% 24%
Cleveland 0.5% 65% 35%Colorado Springs 0.5% 74% 26%
Columbus 0.8% 76% 24%Dallas 0.1% 91% 9%Denver 1.8% 70% 30%Detroit 0.4% 78% 22%El Paso 0.2% 92% 8%
Fort Worth 0.2% 88% 12%Fresno 0.7% 77% 23%
Honolulu 1.7% 72% 28%Houston 0.4% 77% 23%
Indianapolis 0.3% 75% 25%Jacksonville 0.4% 80% 20%
Kansas City, MO 0.3% 63% 37%Las Vegas 0.4% 89% 11%
Long Beach 1.0% 85% 15%Los Angeles 0.9% 80% 20%
Louisville 0.4% 62% 38%Memphis 0.2% 51% 49%
Mesa 1.1% 84% 16%Miami 0.4% 70% 30%
Milwaukee 0.8% 73% 27%Minneapolis 4.1% 63% 37%
Nashville 0.3% 78% 22%New Orleans 1.7% 76% 24%
New York 0.7% 75% 25%Oakland 2.1% 66% 34%
Oklahoma City 0.1% 81% 19%Omaha 0.2% 97% 3%
Philadelphia 1.6% 70% 30%Phoenix 0.7% 84% 16%
Portland, OR 5.5% 62% 38%Raleigh 0.5% 76% 24%
Sacramento 2.2% 67% 33%San Antonio 0.1% 81% 19%San Diego 0.9% 72% 28%
San Francisco 2.8% 70% 30%San Jose 0.9% 79% 21%Seattle 2.9% 68% 32%Tucson 1.9% 71% 29%Tulsa 0.4% 75% 25%
Virginia Beach 0.5% 53% 47%Washington, DC 2.0% 67% 33%
Mean/Average (1) 0.9% 72% 28%
Median 0.7% 75% 25%High 5.5% 97% 49%Low 0.1% 51% 3%
Source: ACS 2007-2009 (3-year average) Notes: (1) All averages are weighted.(2) For some states and cities the number of total bicyclists captured in the ACS is very small. Additionally, disaggregating these estimates into male and female categories might lead to unexpected and unreliable results. For example, some cities show particularly low or high shares of women commuting by bicycle.
Bicycling to Work in Cities
Legend: = High value = Low value
States% of
commuters who bike to work
% men % women
Alabama 0.1% 84% 16%Alaska 0.9% 68% 32%Arizona 0.9% 78% 22%
Arkansas 0.1% 74% 26%California 1.0% 75% 25%Colorado 1.3% 71% 29%
Connecticut 0.3% 75% 25%Delaware 0.4% 91% 9%
Florida 0.6% 76% 24%Georgia 0.2% 76% 24%Hawaii 0.9% 71% 29%Idaho 1.3% 70% 30%Illinois 0.6% 77% 23%
Indiana 0.4% 73% 27%Iowa 0.4% 71% 29%
Kansas 0.4% 75% 25%Kentucky 0.2% 68% 32%Louisiana 0.4% 79% 21%
Maine 0.5% 67% 33%Maryland 0.3% 80% 20%
Massachusetts 0.7% 72% 28%Michigan 0.4% 71% 29%Minnesota 0.8% 70% 30%Mississippi 0.2% 86% 14%Missouri 0.2% 79% 21%Montana 1.5% 66% 34%Nebraska 0.5% 73% 27%Nevada 0.5% 81% 19%
New Hampshire 0.4% 74% 26%New Jersey 0.3% 80% 20%New Mexico 0.7% 74% 26%
New York 0.5% 77% 23%North Carolina 0.2% 80% 20%North Dakota 0.6% 81% 19%
Ohio 0.3% 73% 27%Oklahoma 0.2% 69% 31%
Oregon 2.1% 67% 33%Pennsylvania 0.4% 73% 27%Rhode Island 0.3% 69% 31%
South Carolina 0.2% 79% 21%South Dakota 0.5% 72% 28%
Tennessee 0.1% 77% 23%Texas 0.3% 78% 22%Utah 0.8% 72% 28%
Vermont 0.7% 68% 32%Virginia 0.3% 72% 28%
Washington 0.9% 70% 30%West Virginia 0.2% 74% 26%
Wisconsin 0.7% 70% 30%Wyoming 1.0% 75% 25%
Mean/Average (1) 0.5% 74% 26%
Median 0.4% 74% 26%High 2.1% 91% 34%Low 0.1% 66% 9%
Bicycling to Work in States

Alliance for Biking & Walking46
CHAPTER 2
State
% of commuters who walk to
work
% men % women
Percent of workers who walk to work by annual income (total = 100%)
<$15,000 $15,000-$34,999
$35,000-$64,999 $65,000+
Alabama 1.3% 60% 40% 51% 30% 13% 6%Alaska 8.0% 63% 37% 34% 32% 22% 12%Arizona 2.2% 58% 42% 44% 35% 14% 6%
Arkansas 1.8% 61% 39% 52% 28% 13% 6%California 2.8% 53% 47% 43% 31% 15% 11%Colorado 3.0% 56% 44% 48% 27% 16% 10%
Connecticut 2.9% 54% 46% 50% 24% 15% 10%Delaware 2.4% 54% 46% 54% 22% 15% 9%
Florida 1.6% 56% 44% 45% 34% 14% 7%Georgia 1.6% 59% 41% 46% 32% 13% 9%Hawaii 4.7% 56% 44% 34% 40% 18% 8%Idaho 3.1% 59% 41% 47% 32% 14% 7%Illinois 3.2% 53% 47% 46% 26% 15% 12%
Indiana 2.2% 54% 46% 58% 26% 11% 5%Iowa 4.0% 54% 46% 57% 24% 14% 5%
Kansas 2.7% 56% 44% 52% 29% 14% 5%Kentucky 2.3% 57% 43% 55% 30% 10% 5%Louisiana 2.0% 55% 45% 52% 31% 12% 5%
Maine 4.1% 55% 45% 48% 30% 16% 7%Maryland 2.5% 51% 49% 48% 28% 14% 11%
Massachusetts 4.6% 48% 52% 42% 25% 19% 15%Michigan 2.3% 53% 47% 58% 24% 12% 6%Minnesota 3.0% 53% 47% 47% 26% 18% 9%Mississippi 1.8% 62% 38% 54% 29% 11% 6%Missouri 2.0% 57% 43% 53% 28% 13% 6%Montana 5.2% 55% 45% 45% 30% 18% 7%Nebraska 3.2% 56% 44% 49% 31% 15% 4%Nevada 2.3% 53% 47% 40% 41% 12% 7%
New Hampshire 3.2% 52% 48% 50% 28% 14% 8%New Jersey 3.3% 54% 46% 40% 33% 17% 10%New Mexico 2.4% 57% 43% 47% 31% 15% 7%
New York 6.4% 50% 50% 35% 27% 19% 19%North Carolina 1.9% 63% 37% 49% 32% 12% 7%North Dakota 3.9% 57% 43% 46% 30% 16% 8%
Ohio 2.3% 53% 47% 57% 26% 12% 5%Oklahoma 2.0% 61% 39% 54% 29% 12% 5%
Oregon 3.9% 52% 48% 46% 30% 15% 9%Pennsylvania 4.0% 51% 49% 49% 28% 15% 8%Rhode Island 3.1% 51% 49% 54% 21% 15% 10%
South Carolina 1.9% 58% 42% 55% 28% 10% 6%South Dakota 4.7% 56% 44% 43% 34% 16% 6%
Tennessee 1.4% 61% 39% 55% 26% 13% 7%Texas 1.8% 56% 44% 51% 31% 12% 6%Utah 2.9% 52% 48% 62% 22% 12% 4%
Vermont 6.2% 50% 50% 50% 29% 14% 7%Virginia 2.3% 58% 42% 45% 28% 14% 12%
Washington 3.5% 55% 45% 38% 33% 19% 10%West Virginia 2.9% 57% 43% 57% 27% 12% 4%
Wisconsin 3.4% 53% 47% 53% 26% 14% 6%Wyoming 4.0% 49% 51% 38% 35% 19% 9%
Mean/Average (1) 2.9% 54% 46% 46% 29% 15% 10%
Median 2.9% 55% 45% 49% 29% 14% 7%High 8.0% 63% 52% 62% 41% 22% 19%Low 1.3% 48% 37% 34% 21% 10% 4%
Walking to Work in States
Legend: = High value = Low value
Source: ACS 2007-2009 Notes: (1) All averages are weighted.
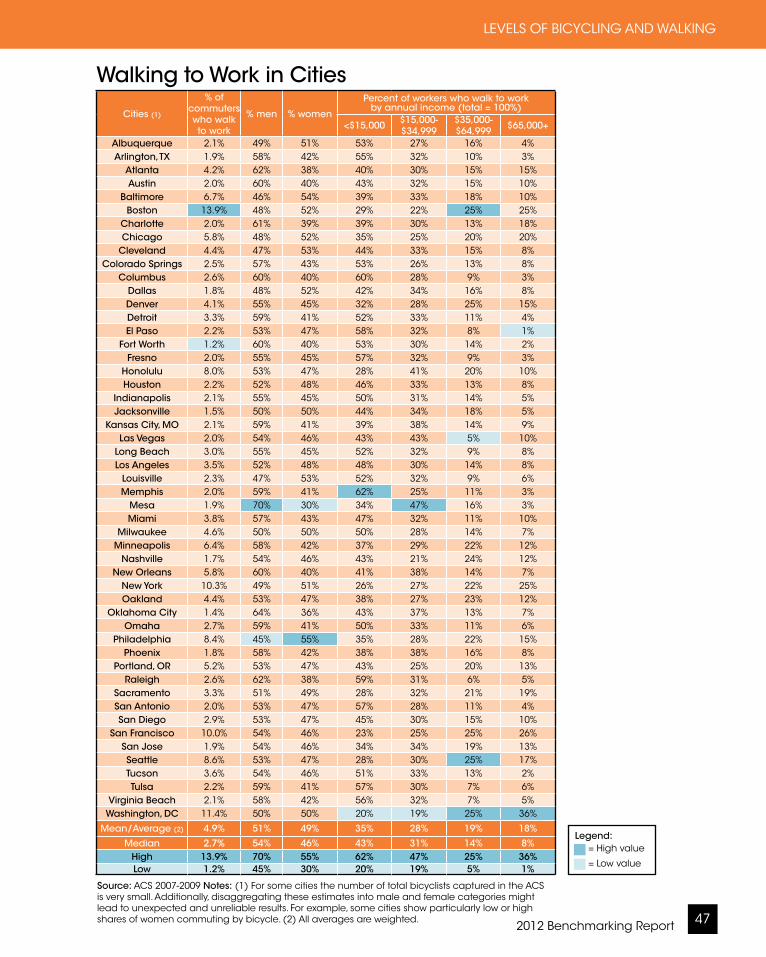
2012 Benchmarking Report 47
LEVELS OF BICYCLING AND WALKING
Cities (1)
% of commuters who walk to work
% men % women
Percent of workers who walk to work by annual income (total = 100%)
<$15,000 $15,000-$34,999
$35,000-$64,999 $65,000+
Albuquerque 2.1% 49% 51% 53% 27% 16% 4%Arlington, TX 1.9% 58% 42% 55% 32% 10% 3%
Atlanta 4.2% 62% 38% 40% 30% 15% 15%Austin 2.0% 60% 40% 43% 32% 15% 10%
Baltimore 6.7% 46% 54% 39% 33% 18% 10%Boston 13.9% 48% 52% 29% 22% 25% 25%
Charlotte 2.0% 61% 39% 39% 30% 13% 18%Chicago 5.8% 48% 52% 35% 25% 20% 20%
Cleveland 4.4% 47% 53% 44% 33% 15% 8%Colorado Springs 2.5% 57% 43% 53% 26% 13% 8%
Columbus 2.6% 60% 40% 60% 28% 9% 3%Dallas 1.8% 48% 52% 42% 34% 16% 8%Denver 4.1% 55% 45% 32% 28% 25% 15%Detroit 3.3% 59% 41% 52% 33% 11% 4%El Paso 2.2% 53% 47% 58% 32% 8% 1%
Fort Worth 1.2% 60% 40% 53% 30% 14% 2%Fresno 2.0% 55% 45% 57% 32% 9% 3%
Honolulu 8.0% 53% 47% 28% 41% 20% 10%Houston 2.2% 52% 48% 46% 33% 13% 8%
Indianapolis 2.1% 55% 45% 50% 31% 14% 5%Jacksonville 1.5% 50% 50% 44% 34% 18% 5%
Kansas City, MO 2.1% 59% 41% 39% 38% 14% 9%Las Vegas 2.0% 54% 46% 43% 43% 5% 10%
Long Beach 3.0% 55% 45% 52% 32% 9% 8%Los Angeles 3.5% 52% 48% 48% 30% 14% 8%
Louisville 2.3% 47% 53% 52% 32% 9% 6%Memphis 2.0% 59% 41% 62% 25% 11% 3%
Mesa 1.9% 70% 30% 34% 47% 16% 3%Miami 3.8% 57% 43% 47% 32% 11% 10%
Milwaukee 4.6% 50% 50% 50% 28% 14% 7%Minneapolis 6.4% 58% 42% 37% 29% 22% 12%
Nashville 1.7% 54% 46% 43% 21% 24% 12%New Orleans 5.8% 60% 40% 41% 38% 14% 7%
New York 10.3% 49% 51% 26% 27% 22% 25%Oakland 4.4% 53% 47% 38% 27% 23% 12%
Oklahoma City 1.4% 64% 36% 43% 37% 13% 7%Omaha 2.7% 59% 41% 50% 33% 11% 6%
Philadelphia 8.4% 45% 55% 35% 28% 22% 15%Phoenix 1.8% 58% 42% 38% 38% 16% 8%
Portland, OR 5.2% 53% 47% 43% 25% 20% 13%Raleigh 2.6% 62% 38% 59% 31% 6% 5%
Sacramento 3.3% 51% 49% 28% 32% 21% 19%San Antonio 2.0% 53% 47% 57% 28% 11% 4%San Diego 2.9% 53% 47% 45% 30% 15% 10%
San Francisco 10.0% 54% 46% 23% 25% 25% 26%San Jose 1.9% 54% 46% 34% 34% 19% 13%Seattle 8.6% 53% 47% 28% 30% 25% 17%Tucson 3.6% 54% 46% 51% 33% 13% 2%Tulsa 2.2% 59% 41% 57% 30% 7% 6%
Virginia Beach 2.1% 58% 42% 56% 32% 7% 5%Washington, DC 11.4% 50% 50% 20% 19% 25% 36%
Mean/Average (2) 4.9% 51% 49% 35% 28% 19% 18%
Median 2.7% 54% 46% 43% 31% 14% 8%High 13.9% 70% 55% 62% 47% 25% 36%Low 1.2% 45% 30% 20% 19% 5% 1%
Source: ACS 2007-2009 Notes: (1) For some cities the number of total bicyclists captured in the ACS is very small. Additionally, disaggregating these estimates into male and female categories might lead to unexpected and unreliable results. For example, some cities show particularly low or high shares of women commuting by bicycle. (2) All averages are weighted.
Walking to Work in Cities
Legend: = High value = Low value
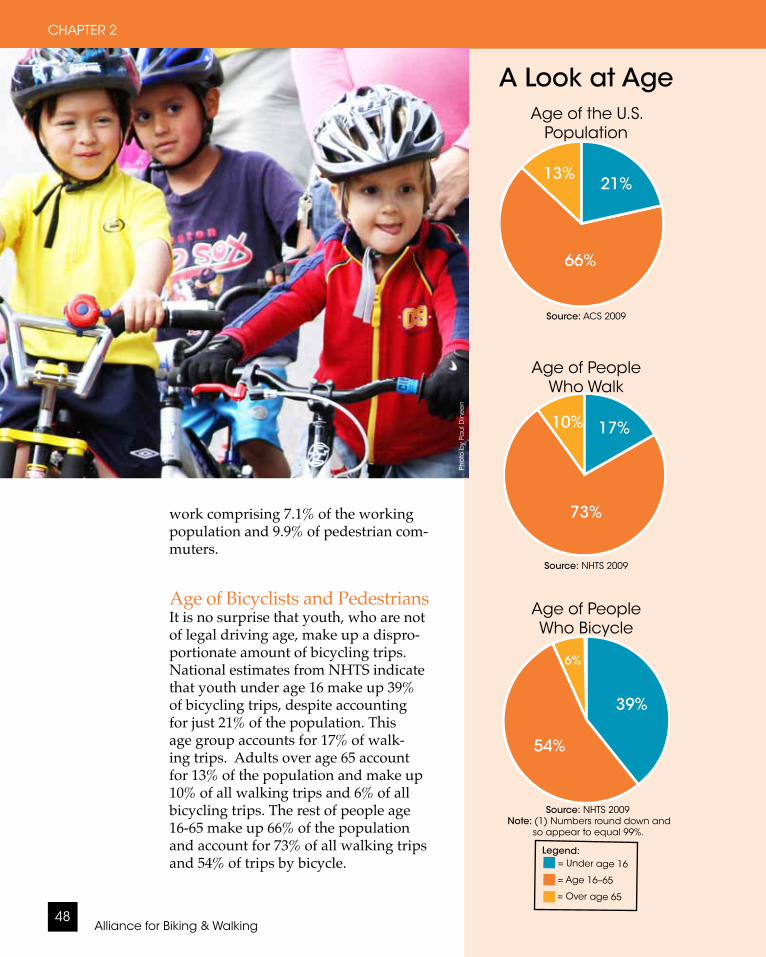
A Look at AgeAge of the U.S.
Population
66%
21%13%
Source: ACS 2009
Age of People Who Walk
17%10%
73%
Source: NHTS 2009
Age of People Who Bicycle
54%
39%
6%
Source: NHTS 2009 Note: (1) Numbers round down and
so appear to equal 99%.
Alliance for Biking & Walking48
CHAPTER 2
Legend: = Under age 16 = Age 16–65 = Over age 65
work comprising 7.1% of the working population and 9.9% of pedestrian com-muters.
Age of Bicyclists and PedestriansIt is no surprise that youth, who are not of legal driving age, make up a dispro-portionate amount of bicycling trips. National estimates from NHTS indicate that youth under age 16 make up 39% of bicycling trips, despite accounting for just 21% of the population. This age group accounts for 17% of walk-ing trips. Adults over age 65 account for 13% of the population and make up 10% of all walking trips and 6% of all bicycling trips. The rest of people age 16-65 make up 66% of the population and account for 73% of all walking trips and 54% of trips by bicycle.
Pho
to b
y Pa
ul D
ine
en
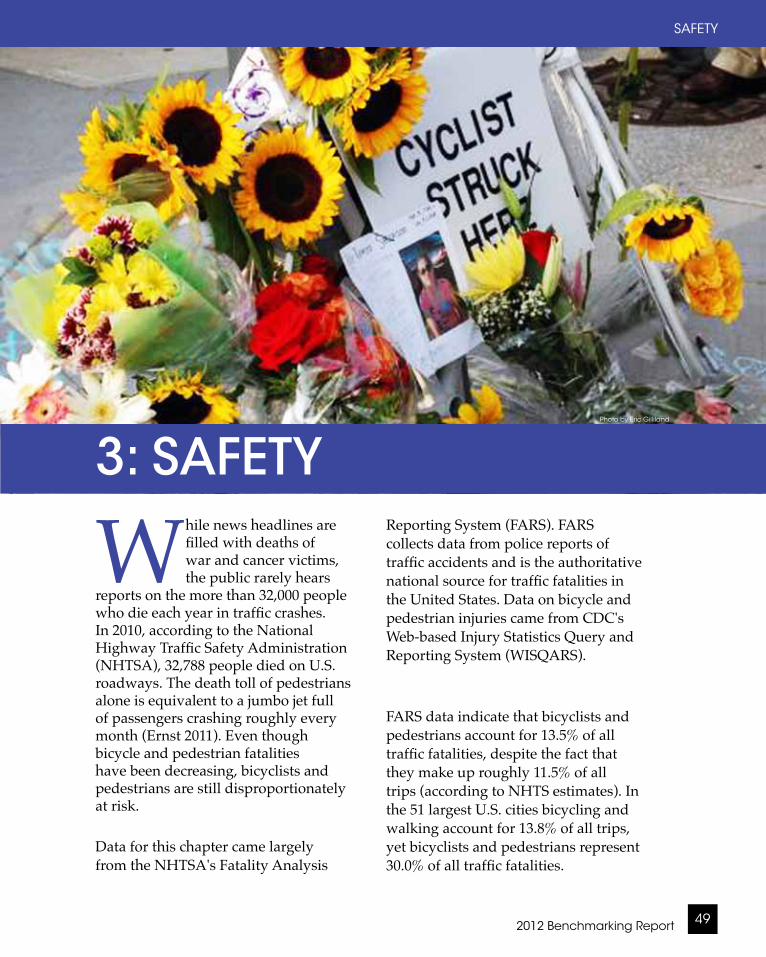
2012 Benchmarking Report 49
SAFETY
While news headlines are filled with deaths of war and cancer victims, the public rarely hears
reports on the more than 32,000 people who die each year in traffic crashes. In 2010, according to the National Highway Traffic Safety Administration (NHTSA), 32,788 people died on U.S. roadways. The death toll of pedestrians alone is equivalent to a jumbo jet full of passengers crashing roughly every month (Ernst 2011). Even though bicycle and pedestrian fatalities have been decreasing, bicyclists and pedestrians are still disproportionately at risk.
Data for this chapter came largely from the NHTSA's Fatality Analysis
U.S. Bike Fatalities 2005-2007
Photo by Eric Gilliland
3: SAFETYReporting System (FARS). FARS collects data from police reports of traffic accidents and is the authoritative national source for traffic fatalities in the United States. Data on bicycle and pedestrian injuries came from CDC's Web-based Injury Statistics Query and Reporting System (WISQARS).
FARS data indicate that bicyclists and pedestrians account for 13.5% of all traffic fatalities, despite the fact that they make up roughly 11.5% of all trips (according to NHTS estimates). In the 51 largest U.S. cities bicycling and walking account for 13.8% of all trips, yet bicyclists and pedestrians represent 30.0% of all traffic fatalities.
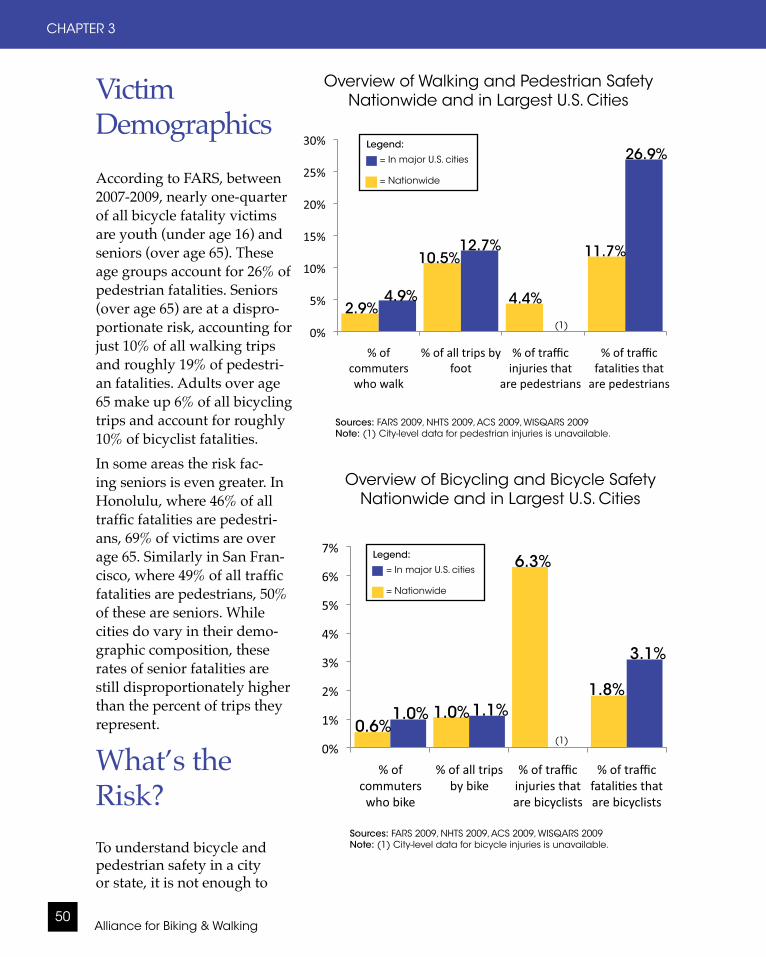
Alliance for Biking & Walking50
CHAPTER 3
% of commuters who bike
% of all trips by bike
% of traffic injuries that are bicyclists
% of traffic fatalities that are bicyclists
Nationwide 0.6% 1.1% 6.30% 1.8%%1.3%1.1%0.1seitiC .S.U rojaM
% of commuters who walk
% of all trips by foot
% of traffic injuries that are pedestrians
% of traffic fatalities that are pedestrians
Nationwide 2.9% 10.8% 4.40% 11.7%%9.62%7.21%9.4seitiC .S.U rojaM
26.9%
11.7%12.7%10.5%
4.9%2.9%
4.4%
Legend: = In major U.S. cities
= Nationwide
Overview of Walking and Pedestrian Safety Nationwide and in Largest U.S. Cities
Sources: FARS 2009, NHTS 2009, ACS 2009, WISQARS 2009Note: (1) City-level data for pedestrian injuries is unavailable.
Overview of Bicycling and Bicycle Safety Nationwide and in Largest U.S. Cities
Sources: FARS 2009, NHTS 2009, ACS 2009, WISQARS 2009Note: (1) City-level data for bicycle injuries is unavailable.
3.1%
1.8%1.1%1.0%1.0%
0.6%
6.3%
Victim DemographicsAccording to FARS, between 2007-2009, nearly one-quarter of all bicycle fatality victims are youth (under age 16) and seniors (over age 65). These age groups account for 26% of pedestrian fatalities. Seniors (over age 65) are at a dispro-portionate risk, accounting for just 10% of all walking trips and roughly 19% of pedestri-an fatalities. Adults over age 65 make up 6% of all bicycling trips and account for roughly 10% of bicyclist fatalities.In some areas the risk fac-ing seniors is even greater. In Honolulu, where 46% of all traffic fatalities are pedestri-ans, 69% of victims are over age 65. Similarly in San Fran-cisco, where 49% of all traffic fatalities are pedestrians, 50% of these are seniors. While cities do vary in their demo-graphic composition, these rates of senior fatalities are still disproportionately higher than the percent of trips they represent.
What’s the Risk?To understand bicycle and pedestrian safety in a city or state, it is not enough to
Legend: = In major U.S. cities
= Nationwide
(1)
(1)

2012 Benchmarking Report 51
SAFETY
Age Legend: = Under age 16 = Over age 65 = Age 16–65
Pedestrian Fatalities by Age
74%
19%
7%
Cyclists Age Distribution
54%
39%
6%
Pedestrians Age Distribution
10%
17%
73%
Source: NHTS 2009, WISQARS 2009, FARS 2007-2009
76%
10%
14%
Cyclist Fatalities by Age
Pedestrians Injuries by Age(1)
8%
19%
74%
Cyclists Injuries by Age
4%
27%
69%
Walk Trips by Gender
51%
49%
Pedestrian Injuries by Gender
42%
58%
Bike Trips by Gender
76%
24%
Sex and Risk
SAFETY DEMOGRAPHICS
Bicycle Injuries by Gender
76%
24%
Sex Legend: = Male = Female
Source: NHTS 2009, WISQARS 2009
Note: (1) Numbers round up and so appear to add to 101%.
Age and Risk
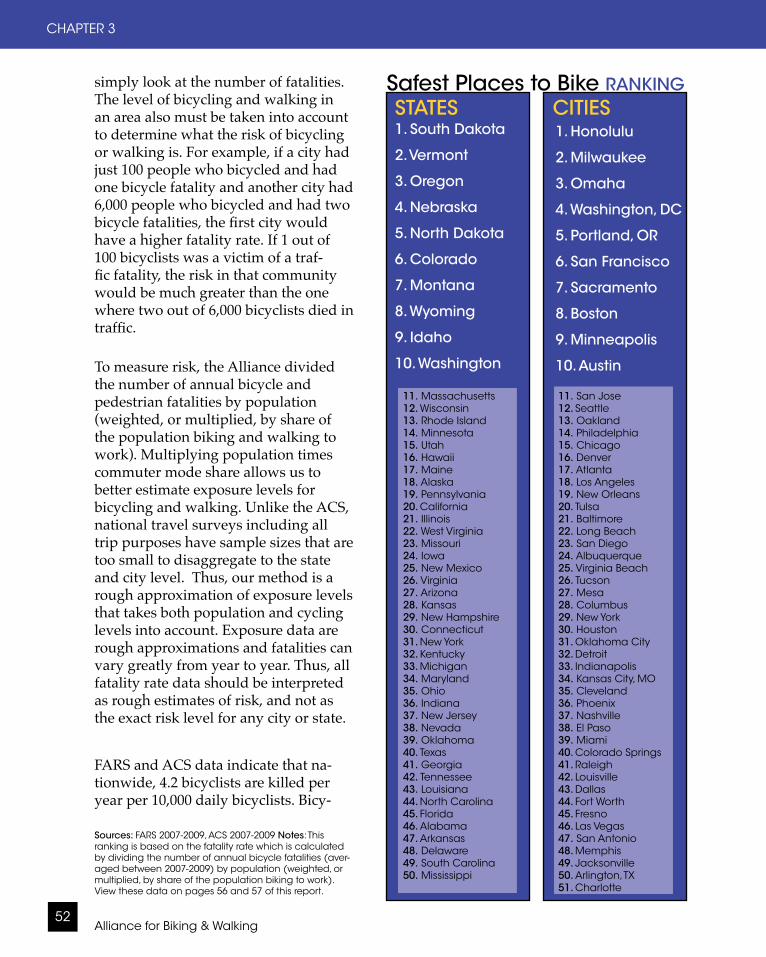
Alliance for Biking & Walking52
CHAPTER 3
9.3%
15.3%
simply look at the number of fatalities. The level of bicycling and walking in an area also must be taken into account to determine what the risk of bicycling or walking is. For example, if a city had just 100 people who bicycled and had one bicycle fatality and another city had 6,000 people who bicycled and had two bicycle fatalities, the first city would have a higher fatality rate. If 1 out of 100 bicyclists was a victim of a traf-fic fatality, the risk in that community would be much greater than the one where two out of 6,000 bicyclists died in traffic.
To measure risk, the Alliance divided the number of annual bicycle and pedestrian fatalities by population (weighted, or multiplied, by share of the population biking and walking to work). Multiplying population times commuter mode share allows us to better estimate exposure levels for bicycling and walking. Unlike the ACS, national travel surveys including all trip purposes have sample sizes that are too small to disaggregate to the state and city level. Thus, our method is a rough approximation of exposure levels that takes both population and cycling levels into account. Exposure data are rough approximations and fatalities can vary greatly from year to year. Thus, all fatality rate data should be interpreted as rough estimates of risk, and not as the exact risk level for any city or state.
FARS and ACS data indicate that na-tionwide, 4.2 bicyclists are killed per year per 10,000 daily bicyclists. Bicy-
11. San Jose12. Seattle13. Oakland14. Philadelphia15. Chicago16. Denver17. Atlanta18. Los Angeles19. New Orleans20. Tulsa21. Baltimore22. Long Beach23. San Diego24. Albuquerque25. Virginia Beach26. Tucson27. Mesa28. Columbus29. New York30. Houston31. Oklahoma City32. Detroit33. Indianapolis34. Kansas City, MO35. Cleveland36. Phoenix37. Nashville38. El Paso39. Miami40. Colorado Springs41. Raleigh42. Louisville43. Dallas44. Fort Worth45. Fresno46. Las Vegas47. San Antonio48. Memphis49. Jacksonville50. Arlington, TX51. Charlotte
CITIESSafest Places to Bike RANKING
11. Massachusetts12. Wisconsin13. Rhode Island14. Minnesota15. Utah16. Hawaii17. Maine18. Alaska19. Pennsylvania20. California21. Illinois22. West Virginia23. Missouri24. Iowa25. New Mexico26. Virginia27. Arizona28. Kansas29. New Hampshire30. Connecticut31. New York32. Kentucky33. Michigan34. Maryland35. Ohio36. Indiana37. New Jersey 38. Nevada39. Oklahoma40. Texas41. Georgia42. Tennessee43. Louisiana44. North Carolina45. Florida46. Alabama47. Arkansas48. Delaware49. South Carolina50. Mississippi
STATES
Sources: FARS 2007-2009, ACS 2007-2009 Notes: This ranking is based on the fatality rate which is calculated by dividing the number of annual bicycle fatalities (aver-aged between 2007-2009) by population (weighted, or multiplied, by share of the population biking to work). View these data on pages 56 and 57 of this report.
1. Honolulu
2. Milwaukee
3. Omaha
4. Washington, DC
5. Portland, OR
6. San Francisco
7. Sacramento
8. Boston
9. Minneapolis
10. Austin
1. South Dakota
2. Vermont
3. Oregon
4. Nebraska
5. North Dakota
6. Colorado
7. Montana
8. Wyoming
9. Idaho
10. Washington
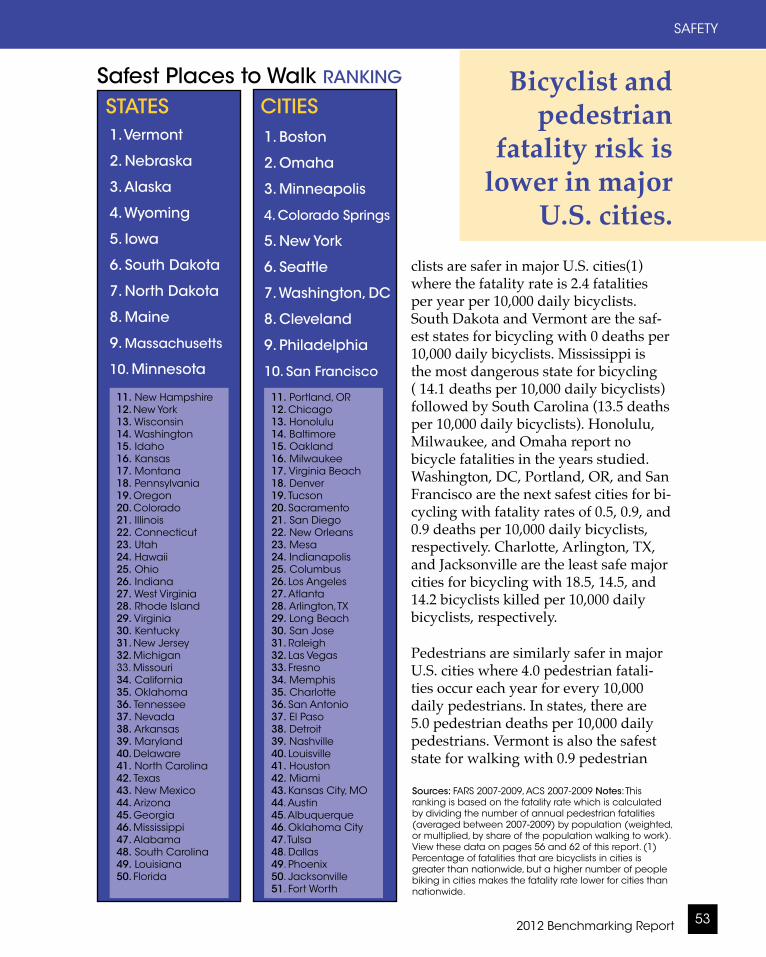
2012 Benchmarking Report 53
SAFETY
clists are safer in major U.S. cities(1) where the fatality rate is 2.4 fatalities per year per 10,000 daily bicyclists. South Dakota and Vermont are the saf-est states for bicycling with 0 deaths per 10,000 daily bicyclists. Mississippi is the most dangerous state for bicycling ( 14.1 deaths per 10,000 daily bicyclists) followed by South Carolina (13.5 deaths per 10,000 daily bicyclists). Honolulu, Milwaukee, and Omaha report no bicycle fatalities in the years studied. Washington, DC, Portland, OR, and San Francisco are the next safest cities for bi-cycling with fatality rates of 0.5, 0.9, and 0.9 deaths per 10,000 daily bicyclists, respectively. Charlotte, Arlington, TX, and Jacksonville are the least safe major cities for bicycling with 18.5, 14.5, and 14.2 bicyclists killed per 10,000 daily bicyclists, respectively.
Pedestrians are similarly safer in major U.S. cities where 4.0 pedestrian fatali-ties occur each year for every 10,000 daily pedestrians. In states, there are 5.0 pedestrian deaths per 10,000 daily pedestrians. Vermont is also the safest state for walking with 0.9 pedestrian
11. New Hampshire12. New York13. Wisconsin14. Washington15. Idaho16. Kansas17. Montana18. Pennsylvania19. Oregon20. Colorado21. Illinois22. Connecticut23. Utah24. Hawaii25. Ohio26. Indiana27. West Virginia28. Rhode Island29. Virginia30. Kentucky31. New Jersey32. Michigan33. Missouri34. California35. Oklahoma36. Tennessee37. Nevada38. Arkansas39. Maryland40. Delaware41. North Carolina42. Texas43. New Mexico44. Arizona45. Georgia46. Mississippi47. Alabama48. South Carolina49. Louisiana50. Florida
STATES
11. Portland, OR12. Chicago13. Honolulu14. Baltimore15. Oakland16. Milwaukee17. Virginia Beach18. Denver19. Tucson20. Sacramento21. San Diego22. New Orleans23. Mesa24. Indianapolis25. Columbus26. Los Angeles27. Atlanta28. Arlington, TX29. Long Beach30. San Jose31. Raleigh32. Las Vegas33. Fresno34. Memphis35. Charlotte36. San Antonio37. El Paso38. Detroit39. Nashville40. Louisville41. Houston42. Miami43. Kansas City, MO44. Austin 45. Albuquerque46. Oklahoma City47. Tulsa48. Dallas49. Phoenix50. Jacksonville51. Fort Worth
CITIESBicyclist and
pedestrian fatality risk is
lower in major U.S. cities.
1. Boston
2. Omaha
3. Minneapolis
4. Colorado Springs
5. New York
6. Seattle
7. Washington, DC
8. Cleveland
9. Philadelphia
10. San Francisco
1. Vermont
2. Nebraska
3. Alaska
4. Wyoming
5. Iowa
6. South Dakota
7. North Dakota
8. Maine
9. Massachusetts
10. Minnesota
Sources: FARS 2007-2009, ACS 2007-2009 Notes: This ranking is based on the fatality rate which is calculated by dividing the number of annual pedestrian fatalities (averaged between 2007-2009) by population (weighted, or multiplied, by share of the population walking to work). View these data on pages 56 and 62 of this report. (1) Percentage of fatalities that are bicyclists in cities is greater than nationwide, but a higher number of people biking in cities makes the fatality rate lower for cities than nationwide.
Safest Places to Walk RANKING

Alliance for Biking & Walking54
CHAPTER 3
Ped Risk per 10K0.86 - 2.372.38 - 4.334.34 - 6.736.74 - 10.7910.80 - 16.72
Source: ACS 2007-2009
Source: FARS 2007-2009, ACS 2007-2009 Notes: These maps use a fatality rate calculated by dividing the number of annual bicycle and pedestrian fatalities (averaged between 2007-2009) by population (weighted, or multiplied, by share of the population biking and walking to work—to adjust for exposure). Because of the approximate nature of the exposure data and great fluctuations in fatality data from year to year, this rate should be seen as a rough estimate.
Pedestrian Risk by State
Bike Risk per 10K0.00 - 1.911.92 - 3.373.38 - 5.845.85 - 9.849.85 - 14.07
Source: ACS 2007-2009
Bicyclist Risk by State
Ped Fatalities per 10K Daily Pedestrians
= 0.86-2.37= 2.38-4.33= 4.34-6.73= 6.74-10.79= 10.80-16.72
Bike Fatalities per 10K Daily Bicyclists
= 0.00-1.91= 1.92-3.37= 3.38-5.84= 5.85-9.84= 9.85-14.07

2012 Benchmarking Report 55
SAFETY
Source: FARS 1975-2009
U.S. Bicycle and Pedestrian Fatalities 1975-2009
pe
de
stria
n fa
talit
ies
Pedestrian Fatalities per 100,000 People by Age
num
be
r o
f fa
talit
ies
Legend: = <13
= 13-19= 20-34= 35-59= 60-69=>70
Fatality Trends
Legend: = Bicyclist fatalities
= Pedestrian fatalities
Bicycle Fatalities by Age
num
be
r o
f fa
talit
ies
= <16 years old
= 16 and older
Legend:
bic
ycle
fata
litie
s
Pho
to b
y Ka
te M
cC
art
hy
deaths per 10,000 daily pedestrians. Florida (17.0 deaths per 10,000 daily pedestrians) is followed by Louisiana (12.0 deaths per 10,000 daily pedestri-ans), and South Carolina (11.7 deaths per 10,000 daily pedestrians) as the least safe states for walking. Boston, Omaha, and Minneapolis have the lowest pe-destrian fatality rates among major U.S. cities with 0.9, 1.6, and 1.6 pedestrian deaths per 10,000 daily pedestrians, respectively. Fort Worth has the high-est pedestrian fatality rates with 20.0 pedestrian deaths per 10,000 daily pedestrians.
Emerging TrendsTraffic fatalities are on the decline throughout the U.S., including those involving bicyclists and pedestrians. Between 1995 and 2009 the number of (Continued page 64)
Pho
to b
y Ka
te M
cC
art
hy
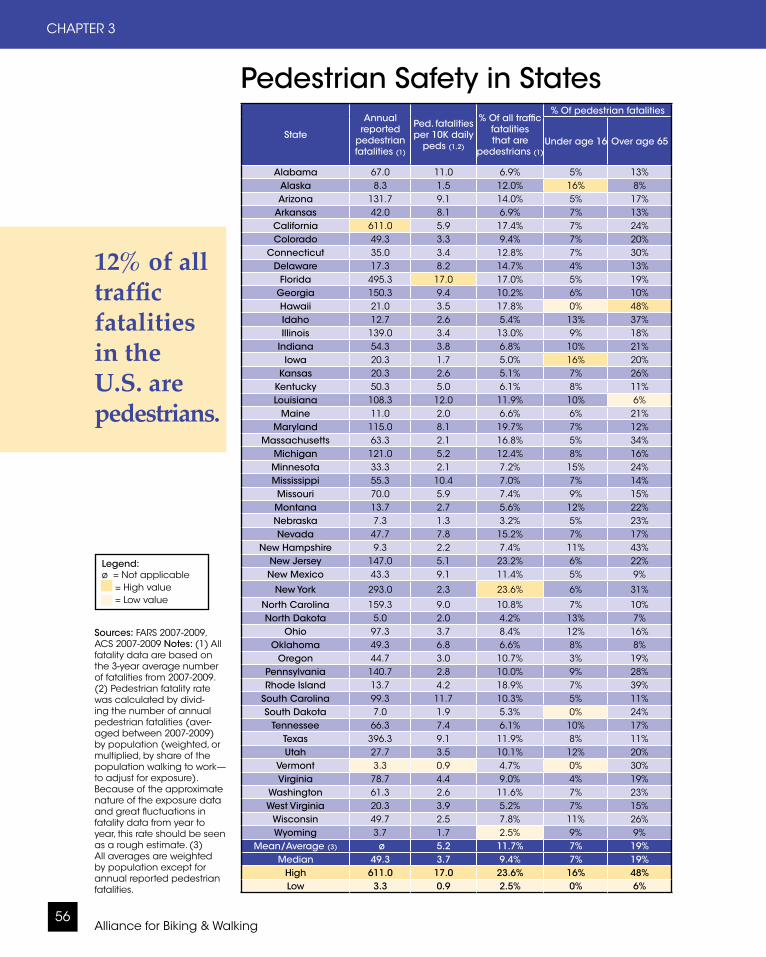
Alliance for Biking & Walking56
CHAPTER 3
State
Annual reported
pedestrian fatalities (1)
Ped. fatalities per 10K daily
peds (1,2)
% Of all traffic fatalities that are
pedestrians (1)
% Of pedestrian fatalities
Under age 16 Over age 65
Alabama 67.0 11.0 6.9% 5% 13%Alaska 8.3 1.5 12.0% 16% 8%Arizona 131.7 9.1 14.0% 5% 17%
Arkansas 42.0 8.1 6.9% 7% 13%California 611.0 5.9 17.4% 7% 24%Colorado 49.3 3.3 9.4% 7% 20%
Connecticut 35.0 3.4 12.8% 7% 30%Delaware 17.3 8.2 14.7% 4% 13%
Florida 495.3 17.0 17.0% 5% 19%Georgia 150.3 9.4 10.2% 6% 10%Hawaii 21.0 3.5 17.8% 0% 48%Idaho 12.7 2.6 5.4% 13% 37%Illinois 139.0 3.4 13.0% 9% 18%
Indiana 54.3 3.8 6.8% 10% 21%Iowa 20.3 1.7 5.0% 16% 20%
Kansas 20.3 2.6 5.1% 7% 26%Kentucky 50.3 5.0 6.1% 8% 11%Louisiana 108.3 12.0 11.9% 10% 6%
Maine 11.0 2.0 6.6% 6% 21%Maryland 115.0 8.1 19.7% 7% 12%
Massachusetts 63.3 2.1 16.8% 5% 34%Michigan 121.0 5.2 12.4% 8% 16%Minnesota 33.3 2.1 7.2% 15% 24%Mississippi 55.3 10.4 7.0% 7% 14%Missouri 70.0 5.9 7.4% 9% 15%Montana 13.7 2.7 5.6% 12% 22%Nebraska 7.3 1.3 3.2% 5% 23%Nevada 47.7 7.8 15.2% 7% 17%
New Hampshire 9.3 2.2 7.4% 11% 43%New Jersey 147.0 5.1 23.2% 6% 22%New Mexico 43.3 9.1 11.4% 5% 9%
New York 293.0 2.3 23.6% 6% 31%
North Carolina 159.3 9.0 10.8% 7% 10%North Dakota 5.0 2.0 4.2% 13% 7%
Ohio 97.3 3.7 8.4% 12% 16%Oklahoma 49.3 6.8 6.6% 8% 8%
Oregon 44.7 3.0 10.7% 3% 19%Pennsylvania 140.7 2.8 10.0% 9% 28%Rhode Island 13.7 4.2 18.9% 7% 39%
South Carolina 99.3 11.7 10.3% 5% 11%South Dakota 7.0 1.9 5.3% 0% 24%
Tennessee 66.3 7.4 6.1% 10% 17%Texas 396.3 9.1 11.9% 8% 11%Utah 27.7 3.5 10.1% 12% 20%
Vermont 3.3 0.9 4.7% 0% 30%Virginia 78.7 4.4 9.0% 4% 19%
Washington 61.3 2.6 11.6% 7% 23%West Virginia 20.3 3.9 5.2% 7% 15%
Wisconsin 49.7 2.5 7.8% 11% 26%Wyoming 3.7 1.7 2.5% 9% 9%
Mean/Average (3) ø 5.2 11.7% 7% 19%Median 49.3 3.7 9.4% 7% 19%
High 611.0 17.0 23.6% 16% 48%Low 3.3 0.9 2.5% 0% 6%
Pedestrian Safety in States
Sources: FARS 2007-2009, ACS 2007-2009 Notes: (1) All fatality data are based on the 3-year average number of fatalities from 2007-2009. (2) Pedestrian fatality rate was calculated by divid-ing the number of annual pedestrian fatalities (aver-aged between 2007-2009) by population (weighted, or multiplied, by share of the population walking to work—to adjust for exposure). Because of the approximate nature of the exposure data and great fluctuations in fatality data from year to year, this rate should be seen as a rough estimate. (3) All averages are weighted by population except for annual reported pedestrian fatalities.
Legend:ø = Not applicable = High value = Low value
12% of all traffic fatalities in the U.S. are pedestrians.

2012 Benchmarking Report 57
SAFETY
State
Annual reported bicycle
fatalities (1)
Bicycle fatalities per
10K daily bicyclists (1,2)
% Of all traffic fatalities that are bicyclists
(1)
% Of bicycle fatalities (1)
Under age 16
Over age 65
Alabama 6.3 10.9 0.6% 32% 0%Alaska 1.7 2.7 2.4% 20% 0%Arizona 21.7 3.9 2.3% 11% 15%
Arkansas 4.3 11.3 0.7% 23% 0%California 105.7 3.0 3.0% 13% 15%Colorado 11.0 1.7 2.1% 27% 6%
Connecticut 4.0 4.3 1.5% 33% 8%Delaware 4.0 12.6 3.4% 33% 17%
Florida 117.3 10.8 4.0% 5% 13%Georgia 18.7 8.3 1.3% 14% 7%Hawaii 3.0 2.5 2.5% 0% 0%Idaho 3.7 1.8 1.5% 9% 18%Illinois 21.7 3.0 2.0% 18% 5%
Indiana 13.3 5.3 1.7% 25% 8%Iowa 4.7 3.7 1.1% 14% 14%
Kansas 4.3 4.2 1.1% 15% 15%Kentucky 4.7 4.7 0.6% 21% 0%Louisiana 15.7 9.8 1.7% 11% 6%
Maine 1.7 2.7 1.0% 0% 0%Maryland 8.0 4.9 1.4% 21% 4%
Massachusetts 9.0 1.9 2.4% 22% 4%Michigan 20.3 4.8 2.1% 15% 13%Minnesota 9.0 2.2 1.9% 19% 22%Mississippi 7.3 14.1 0.9% 23% 5%Missouri 4.7 3.4 0.5% 29% 7%Montana 2.7 1.8 1.1% 25% 0%Nebraska 1.3 1.5 0.6% 25% 0%Nevada 7.7 6.0 2.4% 26% 4%
New Hampshire 2.0 4.3 1.6% 50% 0%New Jersey 15.0 5.6 2.4% 20% 9%New Mexico 5.7 3.8 1.5% 6% 24%
New York 40.7 4.4 3.3% 13% 11%North Carolina 22.0 10.0 1.5% 5% 5%North Dakota 0.7 1.6 0.6% 0% 0%
Ohio 18.0 5.1 1.6% 15% 9%Oklahoma 6.0 7.0 0.8% 22% 17%
Oregon 11.0 1.4 2.6% 6% 18%Pennsylvania 14.3 2.7 1.0% 23% 0%Rhode Island 0.7 2.1 0.9% 0% 0%
South Carolina 15.3 13.5 1.6% 9% 9%South Dakota 0.0 0.0 0.0% ø ø
Tennessee 7.3 8.7 0.7% 41% 5%Texas 49.7 7.9 1.5% 17% 7%Utah 5.0 2.4 1.8% 33% 13%
Vermont 0.0 0.0 0.0% ø øVirginia 10.3 3.8 1.2% 13% 0%
Washington 10.7 1.9 2.0% 6% 9%West Virginia 1.0 3.3 0.3% 0% 33%
Wisconsin 8.7 2.1 1.4% 19% 4%Wyoming 1.0 1.8 0.7% 0% 0%
Mean/Average (3) ø 4.8 1.8% 14% 10%Median 7.3 3.8 1.5% 16% 6%
High 117.3 14.1 4.0% 50% 33%Low 0.0 0.0 0.0% 0% 0%
Bicycle Safety in States
Sources: FARS 2007-2009, ACS 2007-2009 Notes: (1) All fatality data are based on the 3-year average number of fatalities from 2007-2009. (2) Bicyclist fatality rate was calculated by dividing the number of annual bicycle fatalities (averaged between 2007-2009) by population (weighted, or multiplied, by share of the population biking to work—to adjust for exposure). Because of the approximate nature of the exposure data and great fluctua-tions in fatality data from year to year, this rate should be seen as a rough es-timate. (3) All averages are weighted by population except for annual reported bicycle fatalities.
Bicyclists account for
2% of all traffic
fatalities in U.S.
Legend:ø = Not applicable = High value = Low value

Alliance for Biking & Walking58
CHAPTER 3
Photo by Kate McCarthy
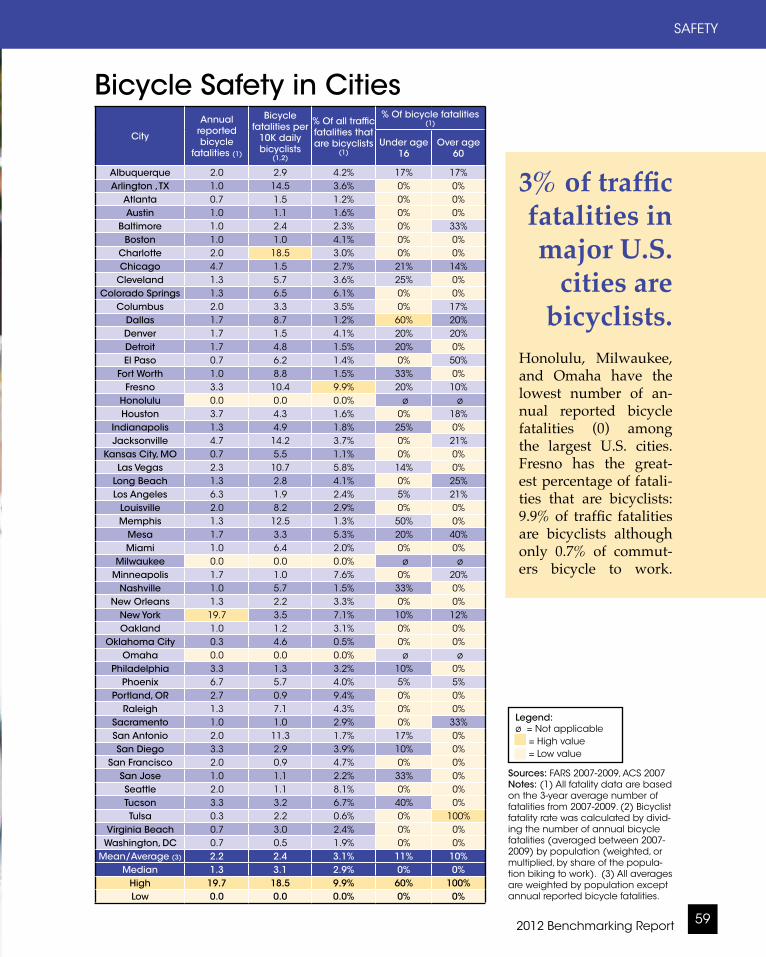
2012 Benchmarking Report 59
SAFETY
City
Annual reported bicycle
fatalities (1)
Bicycle fatalities per
10K daily bicyclists
(1,2)
% Of all traffic fatalities that are bicyclists
(1)
% Of bicycle fatalities (1)
Under age 16
Over age 60
Albuquerque 2.0 2.9 4.2% 17% 17%Arlington , TX 1.0 14.5 3.6% 0% 0%
Atlanta 0.7 1.5 1.2% 0% 0%Austin 1.0 1.1 1.6% 0% 0%
Baltimore 1.0 2.4 2.3% 0% 33%Boston 1.0 1.0 4.1% 0% 0%
Charlotte 2.0 18.5 3.0% 0% 0%Chicago 4.7 1.5 2.7% 21% 14%
Cleveland 1.3 5.7 3.6% 25% 0%Colorado Springs 1.3 6.5 6.1% 0% 0%
Columbus 2.0 3.3 3.5% 0% 17%Dallas 1.7 8.7 1.2% 60% 20%Denver 1.7 1.5 4.1% 20% 20%Detroit 1.7 4.8 1.5% 20% 0%El Paso 0.7 6.2 1.4% 0% 50%
Fort Worth 1.0 8.8 1.5% 33% 0%Fresno 3.3 10.4 9.9% 20% 10%
Honolulu 0.0 0.0 0.0% ø øHouston 3.7 4.3 1.6% 0% 18%
Indianapolis 1.3 4.9 1.8% 25% 0%Jacksonville 4.7 14.2 3.7% 0% 21%
Kansas City, MO 0.7 5.5 1.1% 0% 0%Las Vegas 2.3 10.7 5.8% 14% 0%
Long Beach 1.3 2.8 4.1% 0% 25%Los Angeles 6.3 1.9 2.4% 5% 21%
Louisville 2.0 8.2 2.9% 0% 0%Memphis 1.3 12.5 1.3% 50% 0%
Mesa 1.7 3.3 5.3% 20% 40%Miami 1.0 6.4 2.0% 0% 0%
Milwaukee 0.0 0.0 0.0% ø øMinneapolis 1.7 1.0 7.6% 0% 20%
Nashville 1.0 5.7 1.5% 33% 0%New Orleans 1.3 2.2 3.3% 0% 0%
New York 19.7 3.5 7.1% 10% 12%Oakland 1.0 1.2 3.1% 0% 0%
Oklahoma City 0.3 4.6 0.5% 0% 0%Omaha 0.0 0.0 0.0% ø ø
Philadelphia 3.3 1.3 3.2% 10% 0%Phoenix 6.7 5.7 4.0% 5% 5%
Portland, OR 2.7 0.9 9.4% 0% 0%Raleigh 1.3 7.1 4.3% 0% 0%
Sacramento 1.0 1.0 2.9% 0% 33%San Antonio 2.0 11.3 1.7% 17% 0%San Diego 3.3 2.9 3.9% 10% 0%
San Francisco 2.0 0.9 4.7% 0% 0%San Jose 1.0 1.1 2.2% 33% 0%Seattle 2.0 1.1 8.1% 0% 0%Tucson 3.3 3.2 6.7% 40% 0%Tulsa 0.3 2.2 0.6% 0% 100%
Virginia Beach 0.7 3.0 2.4% 0% 0%Washington, DC 0.7 0.5 1.9% 0% 0%
Mean/Average (3) 2.2 2.4 3.1% 11% 10%Median 1.3 3.1 2.9% 0% 0%
High 19.7 18.5 9.9% 60% 100%Low 0.0 0.0 0.0% 0% 0%
Bicycle Safety in Cities
Sources: FARS 2007-2009, ACS 2007 Notes: (1) All fatality data are based on the 3-year average number of fatalities from 2007-2009. (2) Bicyclist fatality rate was calculated by divid-ing the number of annual bicycle fatalities (averaged between 2007-2009) by population (weighted, or multiplied, by share of the popula-tion biking to work). (3) All averages are weighted by population except annual reported bicycle fatalities.
3% of traffic fatalities in major U.S.
cities are bicyclists.
Honolulu, Milwaukee, and Omaha have the lowest number of an-nual reported bicycle fatalities (0) among the largest U.S. cities. Fresno has the great-est percentage of fatali-ties that are bicyclists: 9.9% of traffic fatalities are bicyclists although only 0.7% of commut-ers bicycle to work.
Legend:ø = Not applicable = High value = Low value
Photo by Kate McCarthy
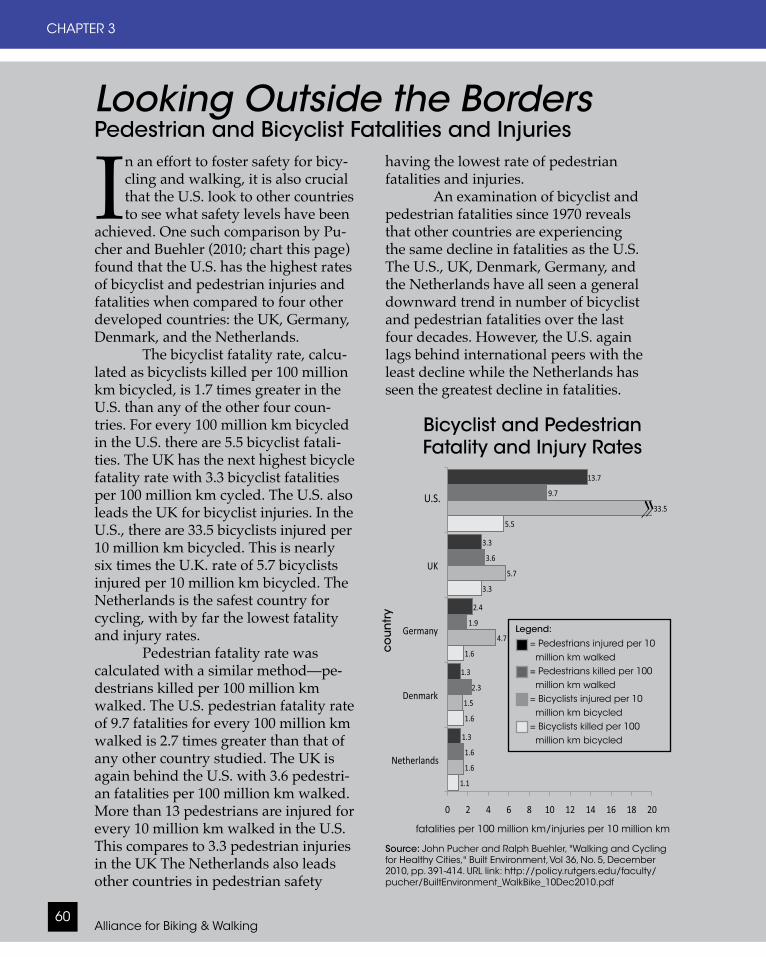
Looking Outside the BordersPedestrian and Bicyclist Fatalities and Injuries
Alliance for Biking & Walking60
CHAPTER 3
In an effort to foster safety for bicy-cling and walking, it is also crucial that the U.S. look to other countries to see what safety levels have been
achieved. One such comparison by Pu-cher and Buehler (2010; chart this page) found that the U.S. has the highest rates of bicyclist and pedestrian injuries and fatalities when compared to four other developed countries: the UK, Germany, Denmark, and the Netherlands. The bicyclist fatality rate, calcu-lated as bicyclists killed per 100 million km bicycled, is 1.7 times greater in the U.S. than any of the other four coun-tries. For every 100 million km bicycled in the U.S. there are 5.5 bicyclist fatali-ties. The UK has the next highest bicycle fatality rate with 3.3 bicyclist fatalities per 100 million km cycled. The U.S. also leads the UK for bicyclist injuries. In the U.S., there are 33.5 bicyclists injured per 10 million km bicycled. This is nearly six times the U.K. rate of 5.7 bicyclists injured per 10 million km bicycled. The Netherlands is the safest country for cycling, with by far the lowest fatality and injury rates. Pedestrian fatality rate was calculated with a similar method—pe-destrians killed per 100 million km walked. The U.S. pedestrian fatality rate of 9.7 fatalities for every 100 million km walked is 2.7 times greater than that of any other country studied. The UK is again behind the U.S. with 3.6 pedestri-an fatalities per 100 million km walked. More than 13 pedestrians are injured for every 10 million km walked in the U.S. This compares to 3.3 pedestrian injuries in the UK The Netherlands also leads other countries in pedestrian safety
having the lowest rate of pedestrian fatalities and injuries. An examination of bicyclist and pedestrian fatalities since 1970 reveals that other countries are experiencing the same decline in fatalities as the U.S. The U.S., UK, Denmark, Germany, and the Netherlands have all seen a general downward trend in number of bicyclist and pedestrian fatalities over the last four decades. However, the U.S. again lags behind international peers with the least decline while the Netherlands has seen the greatest decline in fatalities.
Cyclist and pedestrian fatality rates and non-fatal injury rates in the Netherlands, Denmthe USA, 2004-2008
Cylists killed p Cylists injured Pedestrians kil Pedestrians injured per 10 miNetherlands 1.10 1.60 1.60 1.30Denmark 1.60 1.50 2.30 1.30Germany 1.60 4.70 1.90 2.40
03.306.307.503.3KU07.3107.905.3305.5ASU
U.S.
Bicyclist and Pedestrian Fatality and Injury Rates
Legend: = Pedestrians injured per 10 million km walked= Pedestrians killed per 100 million km walked= Bicyclists injured per 10 million km bicycled= Bicyclists killed per 100 million km bicycled
co
un
try
fatalities per 100 million km/injuries per 10 million km
Source: John Pucher and Ralph Buehler, "Walking and Cycling for Healthy Cities," Built Environment, Vol 36, No. 5, December 2010, pp. 391-414. URL link: http://policy.rutgers.edu/faculty/pucher/BuiltEnvironment_WalkBike_10Dec2010.pdf
»
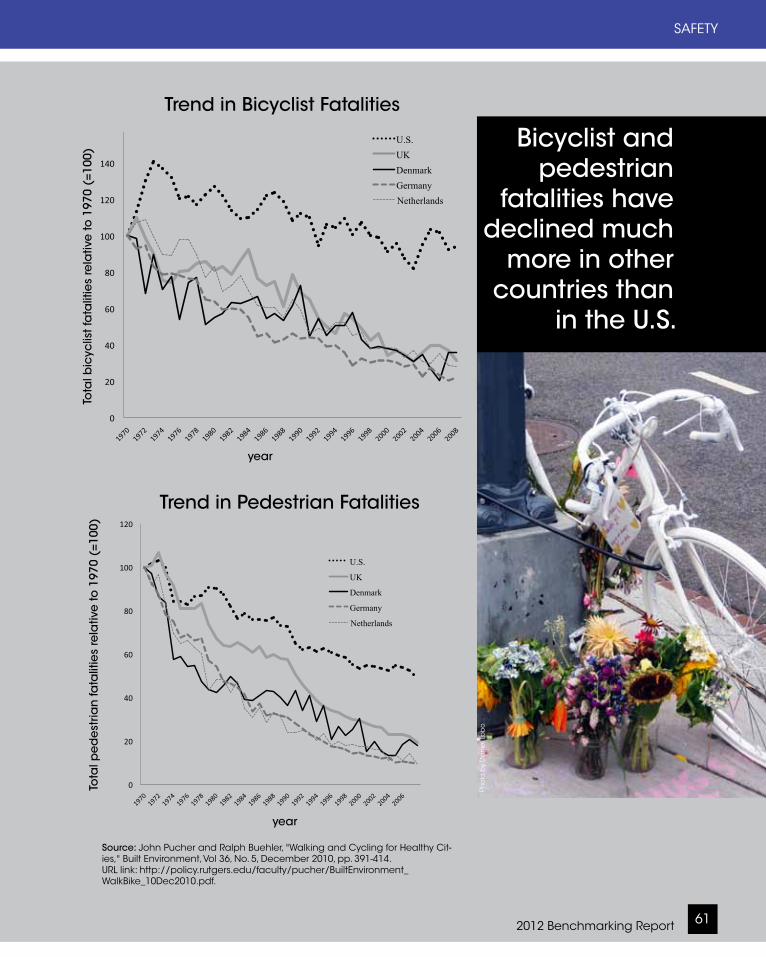
2012 Benchmarking Report 61
SAFETY
2008 58 18
Figure 7. Trend in pedestrian fatalities in the Netherlands, Denmark, Germany, the United KiSources: IRTAD (2010); Pucher and Dijkstra (2000).
U.S.
UK
Denmark
Germany
Netherlands
2008 54 36
d
U.S.UKDenmarkGermanyNetherlands
Trend in Bicyclist Fatalities
Trend in Pedestrian Fatalities
Bicyclist and pedestrian
fatalities have declined much
more in other countries than
in the U.S.
year
year
Tota
l bic
yclis
t fa
talit
ies
rela
tive
to 1
970
(=10
0)To
tal p
ed
est
rian
fata
litie
s re
lativ
e to
197
0 (=
100)
Source: John Pucher and Ralph Buehler, "Walking and Cycling for Healthy Cit-ies," Built Environment, Vol 36, No. 5, December 2010, pp. 391-414. URL link: http://policy.rutgers.edu/faculty/pucher/BuiltEnvironment_WalkBike_10Dec2010.pdf.
Pho
to b
y D
an
iel L
ob
o
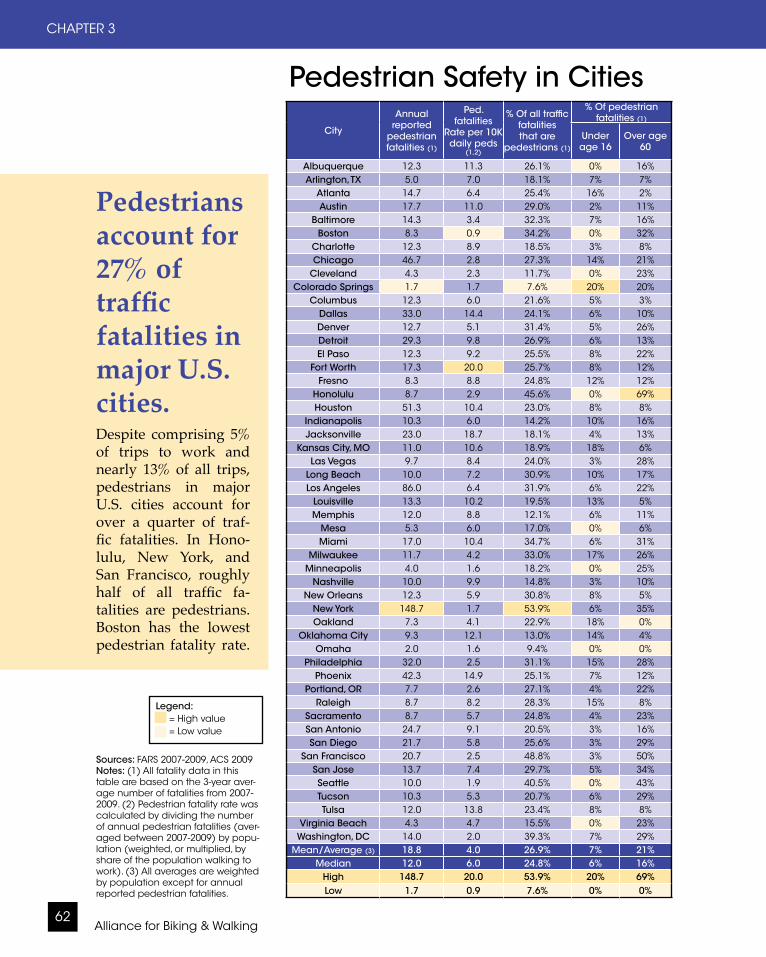
Alliance for Biking & Walking62
CHAPTER 3
City
Annual reported
pedestrian fatalities (1)
Ped. fatalities
Rate per 10K daily peds
(1,2)
% Of all traffic fatalities that are
pedestrians (1)
% Of pedestrian fatalities (1)
Under age 16
Over age 60
Albuquerque 12.3 11.3 26.1% 0% 16%Arlington, TX 5.0 7.0 18.1% 7% 7%
Atlanta 14.7 6.4 25.4% 16% 2%Austin 17.7 11.0 29.0% 2% 11%
Baltimore 14.3 3.4 32.3% 7% 16%Boston 8.3 0.9 34.2% 0% 32%
Charlotte 12.3 8.9 18.5% 3% 8%Chicago 46.7 2.8 27.3% 14% 21%
Cleveland 4.3 2.3 11.7% 0% 23%Colorado Springs 1.7 1.7 7.6% 20% 20%
Columbus 12.3 6.0 21.6% 5% 3%Dallas 33.0 14.4 24.1% 6% 10%Denver 12.7 5.1 31.4% 5% 26%Detroit 29.3 9.8 26.9% 6% 13%El Paso 12.3 9.2 25.5% 8% 22%
Fort Worth 17.3 20.0 25.7% 8% 12%Fresno 8.3 8.8 24.8% 12% 12%
Honolulu 8.7 2.9 45.6% 0% 69%Houston 51.3 10.4 23.0% 8% 8%
Indianapolis 10.3 6.0 14.2% 10% 16%Jacksonville 23.0 18.7 18.1% 4% 13%
Kansas City, MO 11.0 10.6 18.9% 18% 6%Las Vegas 9.7 8.4 24.0% 3% 28%
Long Beach 10.0 7.2 30.9% 10% 17%Los Angeles 86.0 6.4 31.9% 6% 22%
Louisville 13.3 10.2 19.5% 13% 5%Memphis 12.0 8.8 12.1% 6% 11%
Mesa 5.3 6.0 17.0% 0% 6%Miami 17.0 10.4 34.7% 6% 31%
Milwaukee 11.7 4.2 33.0% 17% 26%Minneapolis 4.0 1.6 18.2% 0% 25%
Nashville 10.0 9.9 14.8% 3% 10%New Orleans 12.3 5.9 30.8% 8% 5%
New York 148.7 1.7 53.9% 6% 35%Oakland 7.3 4.1 22.9% 18% 0%
Oklahoma City 9.3 12.1 13.0% 14% 4%Omaha 2.0 1.6 9.4% 0% 0%
Philadelphia 32.0 2.5 31.1% 15% 28%Phoenix 42.3 14.9 25.1% 7% 12%
Portland, OR 7.7 2.6 27.1% 4% 22%Raleigh 8.7 8.2 28.3% 15% 8%
Sacramento 8.7 5.7 24.8% 4% 23%San Antonio 24.7 9.1 20.5% 3% 16%San Diego 21.7 5.8 25.6% 3% 29%
San Francisco 20.7 2.5 48.8% 3% 50%San Jose 13.7 7.4 29.7% 5% 34%Seattle 10.0 1.9 40.5% 0% 43%Tucson 10.3 5.3 20.7% 6% 29%Tulsa 12.0 13.8 23.4% 8% 8%
Virginia Beach 4.3 4.7 15.5% 0% 23%Washington, DC 14.0 2.0 39.3% 7% 29%
Mean/Average (3) 18.8 4.0 26.9% 7% 21%Median 12.0 6.0 24.8% 6% 16%
High 148.7 20.0 53.9% 20% 69%Low 1.7 0.9 7.6% 0% 0%
Pedestrian Safety in Cities
Sources: FARS 2007-2009, ACS 2009 Notes: (1) All fatality data in this table are based on the 3-year aver-age number of fatalities from 2007-2009. (2) Pedestrian fatality rate was calculated by dividing the number of annual pedestrian fatalities (aver-aged between 2007-2009) by popu-lation (weighted, or multiplied, by share of the population walking to work). (3) All averages are weighted by population except for annual reported pedestrian fatalities.
Pedestrians account for 27% of traffic fatalities in major U.S. cities.Despite comprising 5% of trips to work and nearly 13% of all trips, pedestrians in major U.S. cities account for over a quarter of traf-fic fatalities. In Hono-lulu, New York, and San Francisco, roughly half of all traffic fa-talities are pedestrians. Boston has the lowest pedestrian fatality rate.
Legend: = High value
= Low value
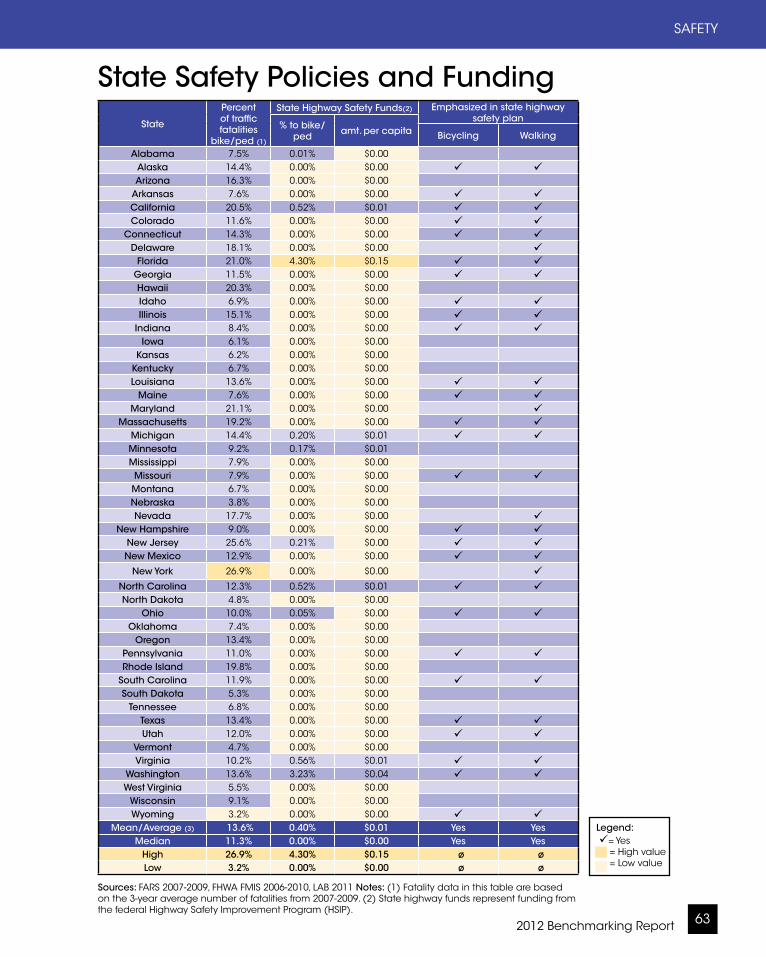
2012 Benchmarking Report 63
SAFETY
State
Percent of traffic fatalities
bike/ped (1)
State Highway Safety Funds(2) Emphasized in state highway safety plan
% to bike/ped amt. per capita Bicycling Walking
Alabama 7.5% 0.01% $0.00Alaska 14.4% 0.00% $0.00 Arizona 16.3% 0.00% $0.00
Arkansas 7.6% 0.00% $0.00 California 20.5% 0.52% $0.01 Colorado 11.6% 0.00% $0.00
Connecticut 14.3% 0.00% $0.00 Delaware 18.1% 0.00% $0.00
Florida 21.0% 4.30% $0.15 Georgia 11.5% 0.00% $0.00 Hawaii 20.3% 0.00% $0.00Idaho 6.9% 0.00% $0.00 Illinois 15.1% 0.00% $0.00
Indiana 8.4% 0.00% $0.00 Iowa 6.1% 0.00% $0.00
Kansas 6.2% 0.00% $0.00Kentucky 6.7% 0.00% $0.00Louisiana 13.6% 0.00% $0.00
Maine 7.6% 0.00% $0.00 Maryland 21.1% 0.00% $0.00
Massachusetts 19.2% 0.00% $0.00 Michigan 14.4% 0.20% $0.01 Minnesota 9.2% 0.17% $0.01Mississippi 7.9% 0.00% $0.00Missouri 7.9% 0.00% $0.00 Montana 6.7% 0.00% $0.00Nebraska 3.8% 0.00% $0.00Nevada 17.7% 0.00% $0.00
New Hampshire 9.0% 0.00% $0.00 New Jersey 25.6% 0.21% $0.00 New Mexico 12.9% 0.00% $0.00
New York 26.9% 0.00% $0.00 North Carolina 12.3% 0.52% $0.01 North Dakota 4.8% 0.00% $0.00
Ohio 10.0% 0.05% $0.00 Oklahoma 7.4% 0.00% $0.00
Oregon 13.4% 0.00% $0.00Pennsylvania 11.0% 0.00% $0.00 Rhode Island 19.8% 0.00% $0.00
South Carolina 11.9% 0.00% $0.00 South Dakota 5.3% 0.00% $0.00
Tennessee 6.8% 0.00% $0.00Texas 13.4% 0.00% $0.00 Utah 12.0% 0.00% $0.00
Vermont 4.7% 0.00% $0.00Virginia 10.2% 0.56% $0.01
Washington 13.6% 3.23% $0.04 West Virginia 5.5% 0.00% $0.00
Wisconsin 9.1% 0.00% $0.00Wyoming 3.2% 0.00% $0.00
Mean/Average (3) 13.6% 0.40% $0.01 Yes Yes Median 11.3% 0.00% $0.00 Yes Yes
High 26.9% 4.30% $0.15 ø øLow 3.2% 0.00% $0.00 ø ø
State Safety Policies and Funding
Sources: FARS 2007-2009, FHWA FMIS 2006-2010, LAB 2011 Notes: (1) Fatality data in this table are based on the 3-year average number of fatalities from 2007-2009. (2) State highway funds represent funding from the federal Highway Safety Improvement Program (HSIP).
Legend: = Yes = High value = Low value
Alliance for Biking & Walking64
CHAPTER 3
bicyclists killed in traffic in the U.S. de-creased by 27%. Pedestrian fatalities fell 24% over the same period. Pedestrian fatalities have experienced a steady de-cline with 2009 being a record low year for fatalities.
When looking at trends in bicycle and pedestrian fatalities over the last three decades, pedestrian fatalities have steadily declined in every age group. While bicycle fatalities among children under 16 have declined sharply in this time period, fatalities in the 16 and old-er age group have steadily increased. However, these charts do not take into account the change in number of people who bike or walk in these age groups. For example, the number of children who bicycle or walk to school has decreased 75% between 1966 and 2009. When walking and cycling levels have declined at such rates, then reduced fa-talities do not necessarily suggest safer walking and cycling.
Safety PolicyThough almost all of the policies dis-cussed in the following chapter could impact safety, this chapter takes a closer look at state highway safety policy. The federal Highway Safety Improvement Program (HSIP) is a federal funding pro-gram that aims to reduce traffic deaths and injuries through infrastructure-related improvements. States must have a state highway safety plan to be eligible for these funds. Twenty-seven states emphasize bicycling in their state high-way safety plan and 31 states emphasize walking. However, the rate at which states obligate safety funds to bicycling and walking is disproportionately low compared to the percent of traffic fatali-ties these modes represent. While 13.6% of traffic fatalities are bicyclists or pedes-trians, just 0.4% of state highway safety funds are directed at these modes. This amounts to just one cent per capita to-ward bicycle and pedestrian safety from this fund.
Photo by Dan Burden, Walkable and Livable Communities Institute

2012 Benchmarking Report 65
POLICIES
Research shows that better poli-cies for bicycling and walking lead to higher levels of bicy-cling and walking (Pucher and
Buehler 2007 and 2008, Pucher et al., 2010). The cities and countries that have invested most heavily in these modes see the greatest share of trips by bicycle and foot (Gotschi and Mills 2009).
For benchmarks in this chapter the Alliance relied on state and city sur-veys, the National Transportation En-hancements Clearinghouse, the Federal Highway Administration’s (FHWA) Fiscal Management Information System (FMIS), League of American Bicyclists’ Bicycle Friendly States data, Safe Routes to School National Partnership, Na-tional Center for Safe Routes to School, the Rails-to-Trails Conservancy, and the American Public Transportation As-sociation. The Alliance sent surveys to all 50 states and the 51 cities included
4: POLICIESin this report. State and city surveys were answered by local advocates and government officials (department of transportation employees, state bicycle and pedestrian coordinators, state Safe Routes to School coordinators, and city planning staff) (for more information on this process, see Chapter 1, page 26). State/city survey data are self-reported by cities/states. Respondents received follow-up only where data appeared inconsistent. Whenever possible, a note is included at the bottom of tables and illustrations noting cities and states that were unable to supply data.
This chapter focuses more heavily on cities since they are where provisions can best be measured. However, not all cities were able to report on bicycling and walking provisions because their agencies have not implemented meth-ods to collect these data and thus have no data available.
Green bike lane in New York City, Photo by Payton Chung
Alliance for Biking & Walking66
CHAPTER 4
Photo by Greg Dunham
2012 Benchmarking Report 67
POLICIES
Bicycling and Walking PoliciesStrong policies to provide provisions for and promote bicycling and walking can help transform communities into healthier and more livable places. This report considered a number of policies such as complete streets policies, bicycle parking policies, annual spending tar-gets for bicycle and pedestrian projects, published goals to increase bicycling and walking, and published goals to de-crease bicycle and pedestrian fatalities.
Planning for Bicycling and Walking
Published GoalsWhen states or cities publish goals to increase bicycling and walking and de-crease crashes, they are making public commitments to progress for which suc-cess can be easily measured. Since the 2010 Benchmarking Report, states and cities have improved in this area with several adopting new goals in the last two years. Thirty-four states report they have published goals for increasing both bicycling and walking. Mississippi has a goal to increase walking only. Nevada has a goal to increase bicycling only. This is up from just 16 states that reported goals for increasing bicycling and walking in 2007 and 20 states as of the 2010 Benchmarking Report.
Similarly, more cities have now adopted goals to increase bicycling and walking. Of the cities surveyed, 36 have goals to increase walking and 46 have goals to increase bicycling. Two years ago just 20 and 33 of these cities reported having such goals, respectively.
States and cities are also increasing their commitment to bicycling and walking safety. Forty-one states report having adopted goals to decrease pedestrian fatalities and 38 have goals to decrease bicycle fatalities. Of the cities surveyed, 39 have adopted goals to reduce bicycle fatalities and 31 have adopted goals to decrease pedestrian fatalities. Just 20 of these cities reported having goals to reduce bicycle and pedestrian fatalities in 2007.
Master PlansPlanning is an integral step to creating healthy livable communities. Bicycle and pedestrian master plans set com-munities' visions for the future and their road maps for achieving their goals. Roughly half of cities and states have adopted master plans for bicycling and walking as of this report. Twenty-four states have bicycle and pedestrian master plans. Hawaii, Minnesota, and Nevada have bicycle master plans only. Rhode Island has a pedestrian master plan only. Colorado is currently devel-oping a bicycle and pedestrian master plan, and Hawaii is currently develop-ing a pedestrian master plan. Twenty-one of the cities surveyed have bicycle and pedestrian master plans. Twenty more have bicycle master plans only.
Many states and cities have also adopt-ed master plans for trails and mountain biking. Two-thirds of states report hav-ing adopted a trail master plan. Florida, Kansas, New Jersey, and Virginia have mountain bike plans. Florida's moun-tain bike plan is included in its state trail plan. Twenty-seven cities have trail master plans. Three of these focus on mountain biking. (For links to sample bicycle and pedestrian master plans, see Appendix 5, pages 213 and 214).(Continued page 70)
Photo by Greg Dunham
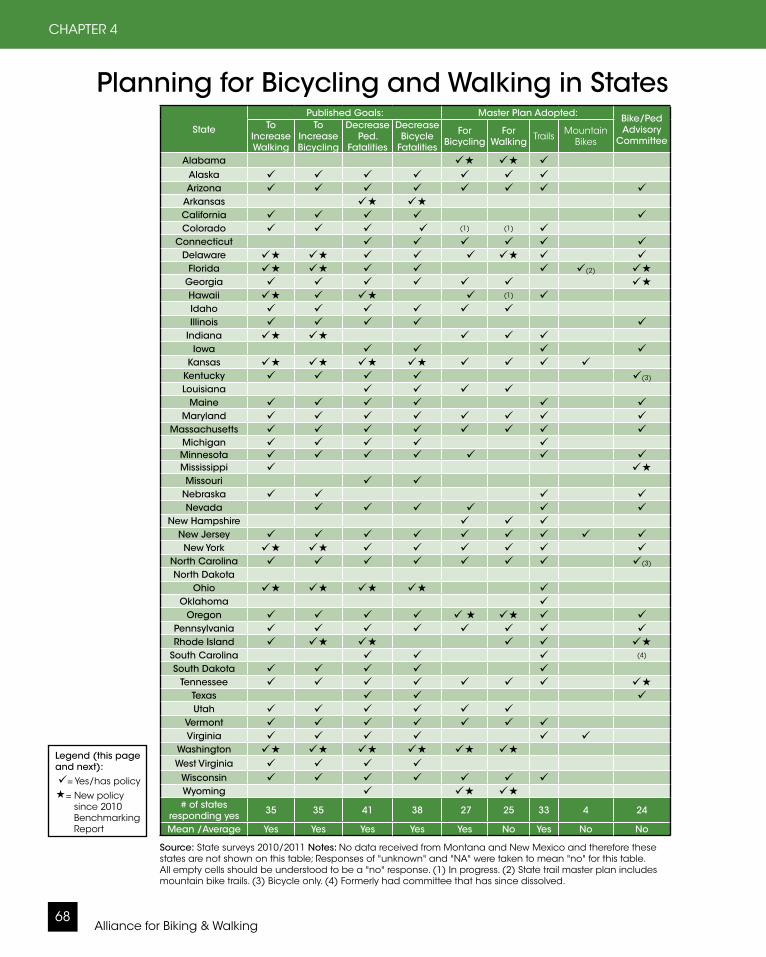
Alliance for Biking & Walking68
CHAPTER 4
Source: State surveys 2010/2011 Notes: No data received from Montana and New Mexico and therefore these states are not shown on this table; Responses of "unknown" and "NA" were taken to mean "no" for this table. All empty cells should be understood to be a "no" response. (1) In progress. (2) State trail master plan includes mountain bike trails. (3) Bicycle only. (4) Formerly had committee that has since dissolved.
State
Published Goals: Master Plan Adopted: Bike/Ped Advisory
Committee
To Increase Walking
To Increase Bicycling
Decrease Ped.
Fatalities
Decrease Bicycle
Fatalities
For Bicycling
For Walking Trails Mountain
Bikes
Alabama Alaska Arizona
Arkansas California Colorado (1) (1)
Connecticut Delaware
Florida (2) Georgia Hawaii (1) Idaho Illinois
Indiana Iowa
Kansas Kentucky (3)
Louisiana Maine
Maryland Massachusetts
Michigan Minnesota Mississippi Missouri
Nebraska Nevada
New Hampshire New Jersey New York
North Carolina (3)
North Dakota Ohio
Oklahoma Oregon
Pennsylvania Rhode Island
South Carolina (4)
South Dakota Tennessee
Texas Utah
Vermont Virginia
Washington West Virginia
Wisconsin Wyoming # of states
responding yes 35 35 41 38 27 25 33 4 24
Mean /Average Yes Yes Yes Yes Yes No Yes No No
Planning for Bicycling and Walking in States
Legend (this page and next): = Yes/has policy= New policy since 2010 Benchmarking Report
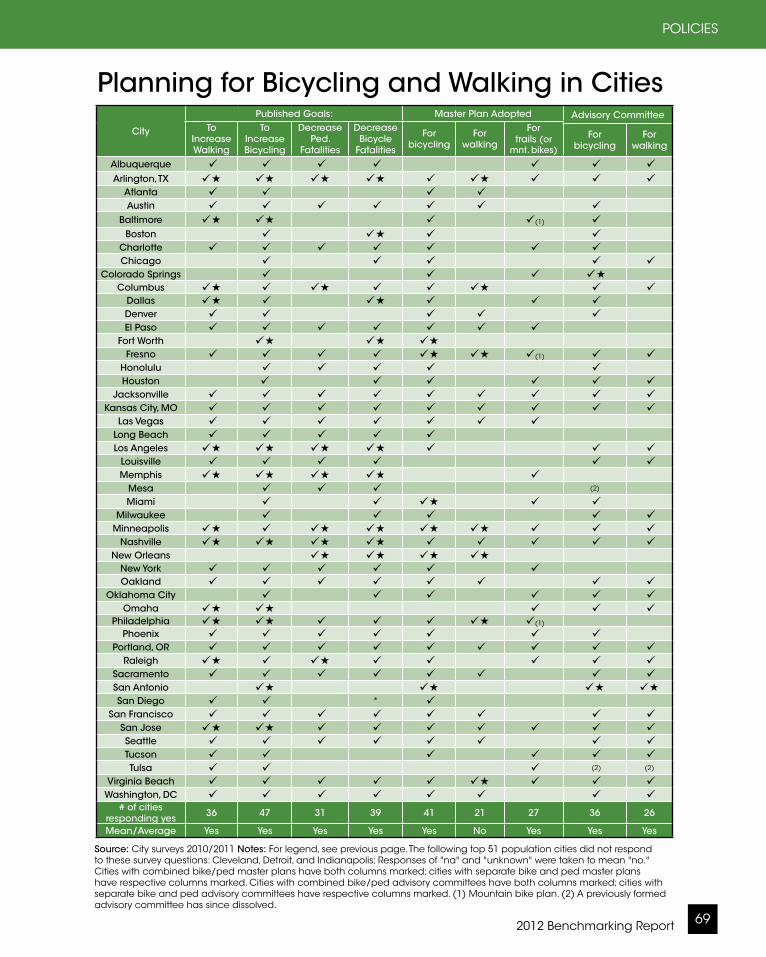
2012 Benchmarking Report 69
POLICIES
Source: City surveys 2010/2011 Notes: For legend, see previous page. The following top 51 population cities did not respond to these survey questions: Cleveland, Detroit, and Indianapolis; Responses of "na" and "unknown" were taken to mean "no." Cities with combined bike/ped master plans have both columns marked; cities with separate bike and ped master plans have respective columns marked. Cities with combined bike/ped advisory committees have both columns marked; cities with separate bike and ped advisory committees have respective columns marked. (1) Mountain bike plan. (2) A previously formed advisory committee has since dissolved.
City
Published Goals: Master Plan Adopted Advisory CommitteeTo
Increase Walking
To Increase Bicycling
Decrease Ped.
Fatalities
Decrease Bicycle
Fatalities
For bicycling
For walking
For trails (or
mnt. bikes)
For bicycling
For walking
Albuquerque Arlington, TX
Atlanta Austin
Baltimore (1) Boston
Charlotte Chicago
Colorado Springs Columbus
Dallas Denver El Paso
Fort Worth Fresno (1)
Honolulu Houston
Jacksonville Kansas City, MO
Las Vegas Long Beach Los Angeles
Louisville Memphis
Mesa (2)
Miami Milwaukee
Minneapolis Nashville
New Orleans New York Oakland
Oklahoma City Omaha
Philadelphia (1)
Phoenix Portland, OR
Raleigh Sacramento San Antonio San Diego *
San Francisco San Jose Seattle Tucson Tulsa (2) (2)
Virginia Beach Washington, DC
# of cities responding yes 36 47 31 39 41 21 27 36 26
Mean/Average Yes Yes Yes Yes Yes No Yes Yes Yes
Planning for Bicycling and Walking in Cities

Alliance for Biking & Walking70
CHAPTER 4
Advisory CommitteesIn many states and cities, bicycle and pedestrian advisory committees as-sist with the planning, development, prioritizing, and implementation of bicycling and walking programs and facilities. These committees are typically comprised of volunteer community stakeholders such as bicycle and run-ning club leaders, bicycle shop own-ers, advocacy leaders, and concerned citizens. Groups typically meet monthly or quarterly to review and make recom-mendations to city or state staff and planners about facilities, programs, and issues relating to bicycling and walking in their state/community. Twenty-six cities and 24 states that were surveyed report having a bicycle and pedestrian advisory committee. Ten cities have bicycle advisory committees only as do the states of Kentucky and North Carolina.
Before: Incomplete Street6th Avenue South in Seattle, WA, photos by Seattle Department of Transportation
Complete Streets PoliciesThe bicycle and pedestrian advocacy movement and its partners for transit and disabled rights have adopted the term “complete streets” because it ac-curately frames the discussion to show that a street is not complete unless all modes of transport are provided for. A complete street provides safe access for pedestrians, bicyclists, children, the elderly, disabled people, transit users, and motorists. Complete streets poli-cies require that all streets are designed and built to provide safe access for all potential users. These policies ensure that provisions such as sidewalks, curb cuts, bike lanes, traffic calming, and in-viting crossings are included in all road projects and not as an optional add-on. According to the National Complete Streets Coalition (as of September 2011), 26 states and 19 of the 51 cities in this report have adopted local complete
After: Complete Street
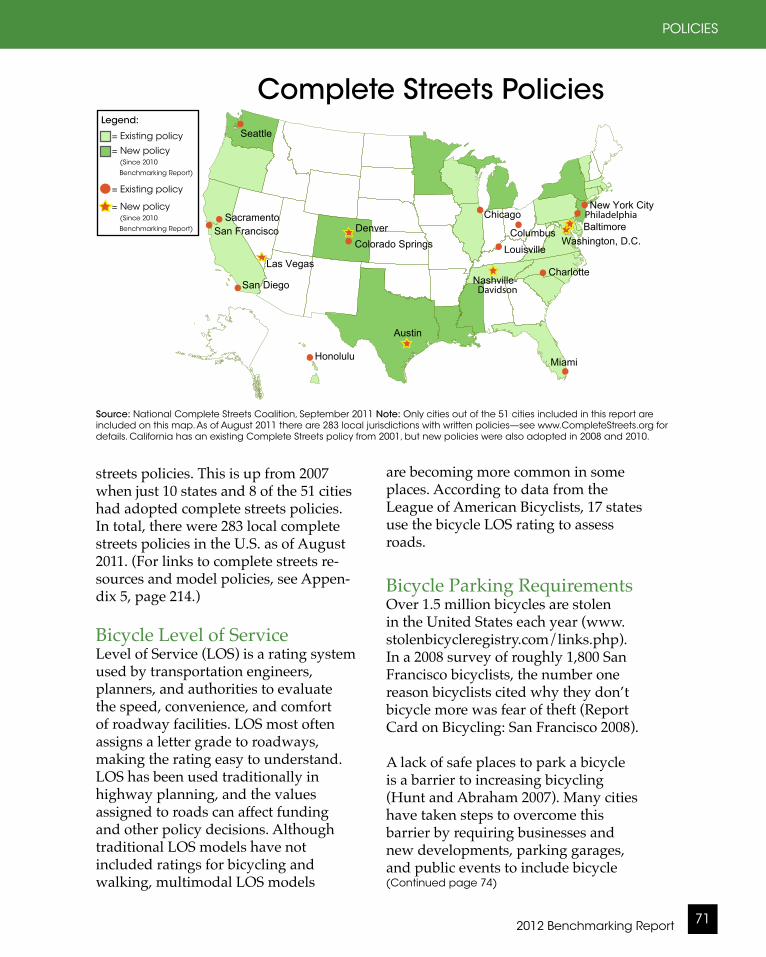
2012 Benchmarking Report 71
POLICIES
Miami
DenverChicago
Seattle
Columbus
New York City
San DiegoCharlotte
Las Vegas
Baltimore
Louisville
Sacramento
Washington, D.C.San Francisco
Colorado Springs
Nashville-
Honolulu
Legend
Existing City PolicyNew City PolicyExisting State PolicyNew State Policy
Source: National Complete Streets Coalition 2011
Davidson
Philadelphia
Austin
Complete Streets Policies
Source: National Complete Streets Coalition, September 2011 Note: Only cities out of the 51 cities included in this report are included on this map. As of August 2011 there are 283 local jurisdictions with written policies—see www.CompleteStreets.org for details. California has an existing Complete Streets policy from 2001, but new policies were also adopted in 2008 and 2010.
streets policies. This is up from 2007 when just 10 states and 8 of the 51 cities had adopted complete streets policies. In total, there were 283 local complete streets policies in the U.S. as of August 2011. (For links to complete streets re-sources and model policies, see Appen-dix 5, page 214.)
Bicycle Level of ServiceLevel of Service (LOS) is a rating system used by transportation engineers, planners, and authorities to evaluate the speed, convenience, and comfort of roadway facilities. LOS most often assigns a letter grade to roadways, making the rating easy to understand. LOS has been used traditionally in highway planning, and the values assigned to roads can affect funding and other policy decisions. Although traditional LOS models have not included ratings for bicycling and walking, multimodal LOS models
are becoming more common in some places. According to data from the League of American Bicyclists, 17 states use the bicycle LOS rating to assess roads.
Bicycle Parking RequirementsOver 1.5 million bicycles are stolen in the United States each year (www.stolenbicycleregistry.com/links.php). In a 2008 survey of roughly 1,800 San Francisco bicyclists, the number one reason bicyclists cited why they don’t bicycle more was fear of theft (Report Card on Bicycling: San Francisco 2008).
A lack of safe places to park a bicycle is a barrier to increasing bicycling (Hunt and Abraham 2007). Many cities have taken steps to overcome this barrier by requiring businesses and new developments, parking garages, and public events to include bicycle
Legend: = Existing policy
= New policy (Since 2010
Benchmarking Report)
= Existing policy
= New policy (Since 2010
Benchmarking Report)
(Continued page 74)

Alliance for Biking & Walking72
CHAPTER 4
State
Publicly available bicycle
map
Complete Streets Policy
Use Bicycle Level of Service
to Assess Roads (1)
AlabamaAlaskaArizona
ArkansasCalifornia Colorado
Connecticut Delaware
Florida Georgia Hawaii Idaho Illinois
IndianaIowa
Kansas Kentucky Louisiana
Maine Maryland
Massachusetts Michigan Minnesota Mississippi Missouri Montana Nebraska Nevada
New Hampshire New Jersey New Mexico
New York North Carolina North Dakota
OhioOklahoma
Oregon Pennsylvania Rhode Island
South Carolina South Dakota
Tennessee Texas Utah
Vermont Virginia
Washington West Virginia
Wisconsin Wyoming # of states
responding yes 38 26 17
Mean/Average Yes No No
State Policies
Over 1/2 of states have now adopted a complete streets policy.
Sources: NCSC September 2011, LAB 2011 Notes: Leg-end next page. (1) State uses a bicycle level of service or similar model to assess bicycling conditions of roads.
Gre
en
bik
e la
ne
on
Fe
ll St
ree
t in
Sa
n F
ran
cis
co
, CA
. P
ho
to b
y Fr
an
k C
ha
n, S
an
Fra
nc
isc
o B
icyc
le C
oa
litio
n
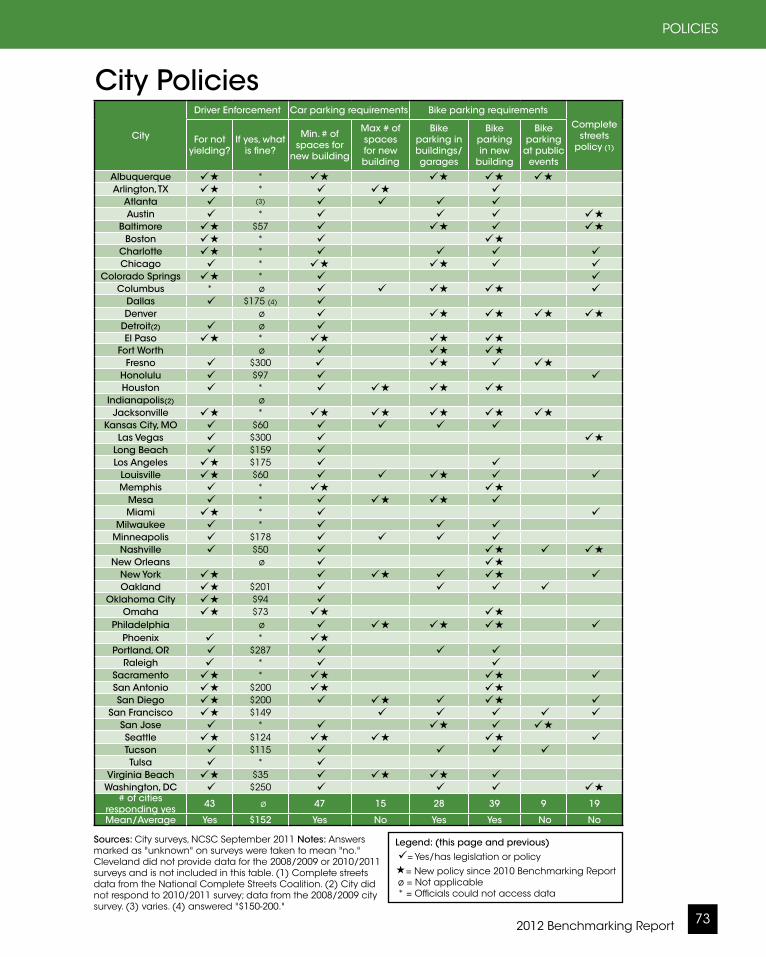
2012 Benchmarking Report 73
POLICIES
Sources: City surveys, NCSC September 2011 Notes: Answers marked as "unknown" on surveys were taken to mean "no." Cleveland did not provide data for the 2008/2009 or 2010/2011 surveys and is not included in this table. (1) Complete streets data from the National Complete Streets Coalition. (2) City did not respond to 2010/2011 survey; data from the 2008/2009 city survey. (3) varies. (4) answered "$150-200."
City
Driver Enforcement Car parking requirements Bike parking requirementsComplete
streets policy (1)
For not yielding?
If yes, what is fine?
Min. # of spaces for
new building
Max # of spaces for new building
Bike parking in buildings/garages
Bike parking in new
building
Bike parking
at public events
Albuquerque * Arlington, TX *
Atlanta (3) Austin *
Baltimore $57 Boston *
Charlotte * Chicago *
Colorado Springs * Columbus * ø
Dallas $175 (4) Denver ø
Detroit(2) ø El Paso *
Fort Worth ø Fresno $300
Honolulu $97 Houston *
Indianapolis(2) øJacksonville *
Kansas City, MO $60 Las Vegas $300
Long Beach $159 Los Angeles $175
Louisville $60 Memphis *
Mesa * Miami *
Milwaukee * Minneapolis $178
Nashville $50 New Orleans ø
New York Oakland $201
Oklahoma City $94 Omaha $73
Philadelphia ø Phoenix *
Portland, OR $287 Raleigh *
Sacramento * San Antonio $200 San Diego $200
San Francisco $149 San Jose * Seattle $124 Tucson $115 Tulsa *
Virginia Beach $35 Washington, DC $250
# of cities responding yes 43 ø 47 15 28 39 9 19
Mean/Average Yes $152 Yes No Yes Yes No No
City Policies
Legend: (this page and previous) = Yes/has legislation or policy= New policy since 2010 Benchmarking Report ø = Not applicable * = Officials could not access data
State Policies
Alliance for Biking & Walking74
CHAPTER 4
parking. Of the cities surveyed for this report, 76% (39 cities) require bicycle parking in new buildings. This is a 70% increase from 2 years ago when just 23 cities reported having this policy. Twenty-eight cities report that they require bicycle parking in buildings/garages—up from just 15 cities 2 years ago. Just nine cities require secure or valet bicycle parking at public events.
A 2002 comparison of bicycle park-ing requirements in 145 jurisdictions reveals that these policies typically require bicycle parking between 2% and 20% of car parking (Comparison of Bike Parking Policies). Some policies are trig-gered by minimum requirements such as the square footage of a building, the number of employees a business has, or the number of car parking spaces. In these cases, if the minimum is not met (such as a business having under 25 employees), a business is not required to install any bicycle parking.
Car Parking RequirementsThe Alliance also surveyed cities on policies requiring a minimum and/or maximum number of car parking spaces for new buildings. Ninety-two percent of responding cities (47 cities) reported having minimum car parking requirements. By masking the true cost of land and parking space, these poli-cies can often negatively affect land-use development that promotes bicycling and walking and lead to sprawl (Shoup 2005). On the flip side, 15 cities (up from six as of the 2010 report) reported having policies that set a maximum number of car parking spaces for new buildings. These progressive policies require more dense development and land-use practices that can encourage
safer and more friendly environments for bicyclists and pedestrians.
Driver EnforcementEnforcement is one of the five Es for creating a bicycle and pedestrian friend-ly community. (Engineering, Education, Encouragement, and Evaluation are the other four.) Enforcement generally includes laws protecting both bicyclists and pedestrians and the enforcement of these laws. Although it is commend-able to have laws that protect bicyclists, pedestrians, and other road users, these laws are less effective if not enforced. Whether it’s ticketing speeding motor-ists or reminding bicyclists to stop at traffic lights, enforcement is critical to ensuring that safety rules keep road us-ers safe.
For this report the Alliance collected data on a number of laws and policies. Relating to driver enforcement, surveys asked cities if they cite drivers for not yielding to bicyclists and pedestrians. Forty-three of the cities surveyed report that their city fines motorists for not yielding to bicyclists and pedestrians when nonmotorized users have the right of way. Of the cities that do en-force not yielding to bicycles and pedes-trians, fines range from $35 to $300. The average fine for motorists is $152.
Safe Routes to School PoliciesThrough the 2005 federal transportation act, $978 million was provided to fund Safe Routes to School programs in all 50 states and the District of Columbia. As part of this legislation, each state was mandated to hire a full-time Safe Routes to School Coordinator. As of March 2011 all states have a full-time Safe Routes
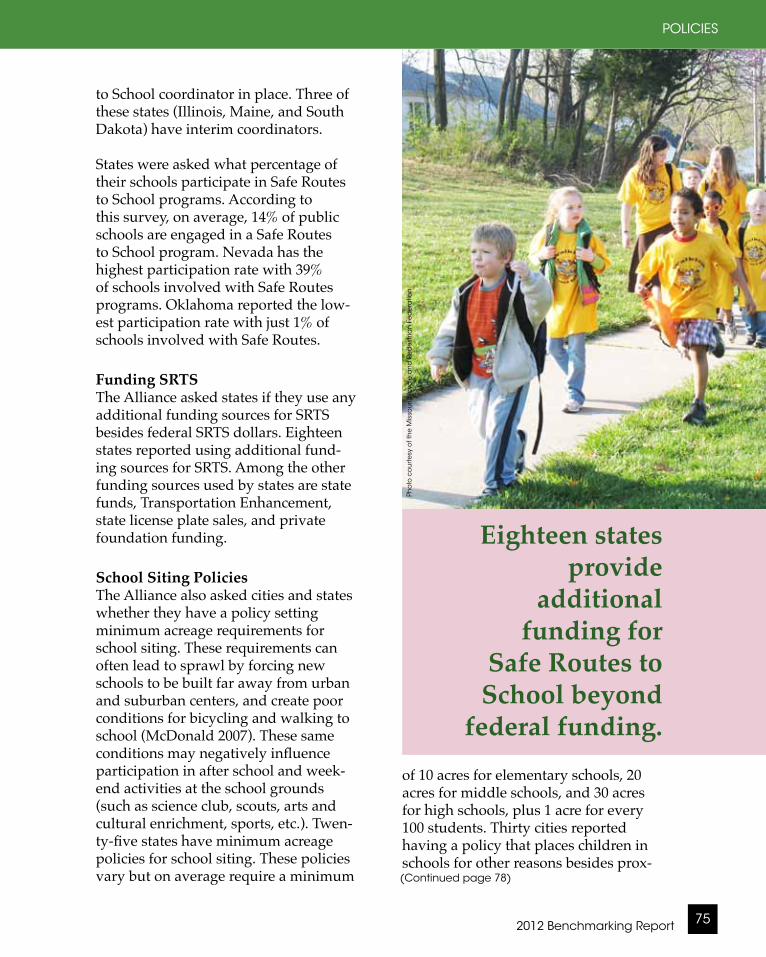
2012 Benchmarking Report 75
POLICIES
Eighteen states provide
additional funding for
Safe Routes to School beyond
federal funding.
to School coordinator in place. Three of these states (Illinois, Maine, and South Dakota) have interim coordinators.
States were asked what percentage of their schools participate in Safe Routes to School programs. According to this survey, on average, 14% of public schools are engaged in a Safe Routes to School program. Nevada has the highest participation rate with 39% of schools involved with Safe Routes programs. Oklahoma reported the low-est participation rate with just 1% of schools involved with Safe Routes.
Funding SRTSThe Alliance asked states if they use any additional funding sources for SRTS besides federal SRTS dollars. Eighteen states reported using additional fund-ing sources for SRTS. Among the other funding sources used by states are state funds, Transportation Enhancement, state license plate sales, and private foundation funding.
School Siting PoliciesThe Alliance also asked cities and states whether they have a policy setting minimum acreage requirements for school siting. These requirements can often lead to sprawl by forcing new schools to be built far away from urban and suburban centers, and create poor conditions for bicycling and walking to school (McDonald 2007). These same conditions may negatively influence participation in after school and week-end activities at the school grounds (such as science club, scouts, arts and cultural enrichment, sports, etc.). Twen-ty-five states have minimum acreage policies for school siting. These policies vary but on average require a minimum
of 10 acres for elementary schools, 20 acres for middle schools, and 30 acres for high schools, plus 1 acre for every 100 students. Thirty cities reported having a policy that places children in schools for other reasons besides prox-
Pho
to c
ou
rte
sy o
f th
e M
isso
uri
Bic
ycle
an
d P
ed
est
rian
Fe
de
ratio
n
(Continued page 78)
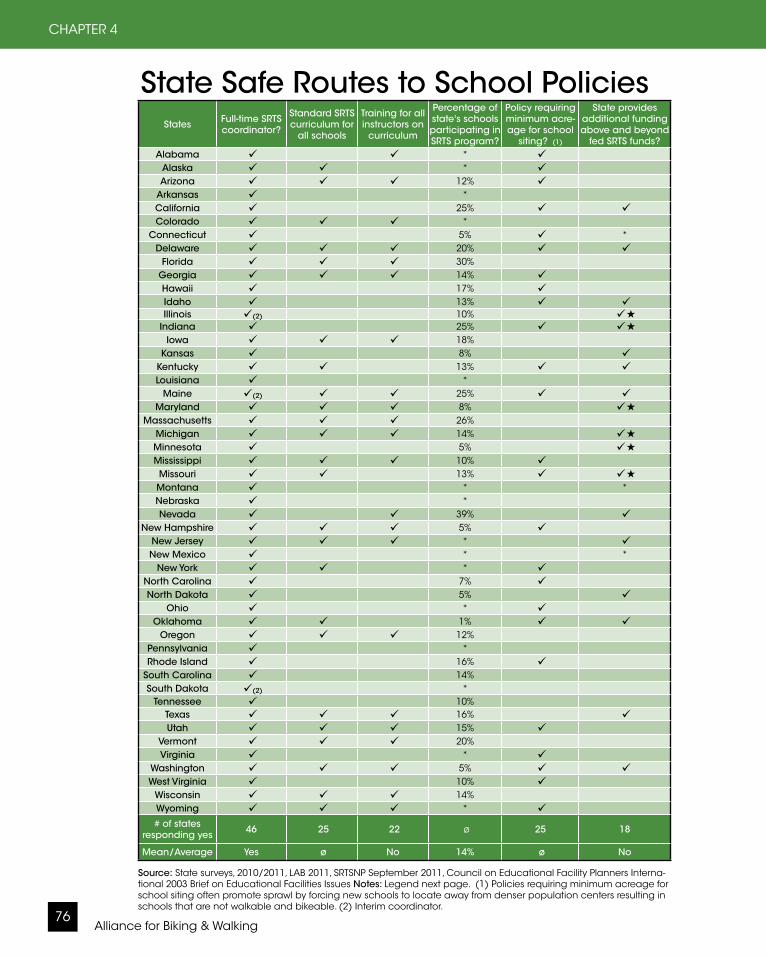
Alliance for Biking & Walking76
CHAPTER 4
States Full-time SRTS coordinator?
Standard SRTS curriculum for
all schools
Training for all instructors on
curriculum
Percentage of state's schools participating in SRTS program?
Policy requiring minimum acre-age for school
siting? (1)
State provides additional funding above and beyond
fed SRTS funds?Alabama *
Alaska * Arizona 12%
Arkansas *California 25% Colorado *
Connecticut 5% *Delaware 20%
Florida 30%Georgia 14% Hawaii 17% Idaho 13% Illinois (2) 10%
Indiana 25% Iowa 18%
Kansas 8% Kentucky 13% Louisiana *
Maine (2) 25% Maryland 8%
Massachusetts 26%Michigan 14% Minnesota 5% Mississippi 10% Missouri 13% Montana * *Nebraska *Nevada 39%
New Hampshire 5% New Jersey * New Mexico * *
New York * North Carolina 7% North Dakota 5%
Ohio * Oklahoma 1%
Oregon 12%Pennsylvania *Rhode Island 16%
South Carolina 14%South Dakota (2) *
Tennessee 10%Texas 16% Utah 15%
Vermont 20%Virginia *
Washington 5% West Virginia 10%
Wisconsin 14%Wyoming * # of states
responding yes 46 25 22 ø 25 18
Mean/Average Yes ø No 14% ø No
State Safe Routes to School Policies
Source: State surveys, 2010/2011, LAB 2011, SRTSNP September 2011, Council on Educational Facility Planners Interna-tional 2003 Brief on Educational Facilities Issues Notes: Legend next page. (1) Policies requiring minimum acreage for school siting often promote sprawl by forcing new schools to locate away from denser population centers resulting in schools that are not walkable and bikeable. (2) Interim coordinator.
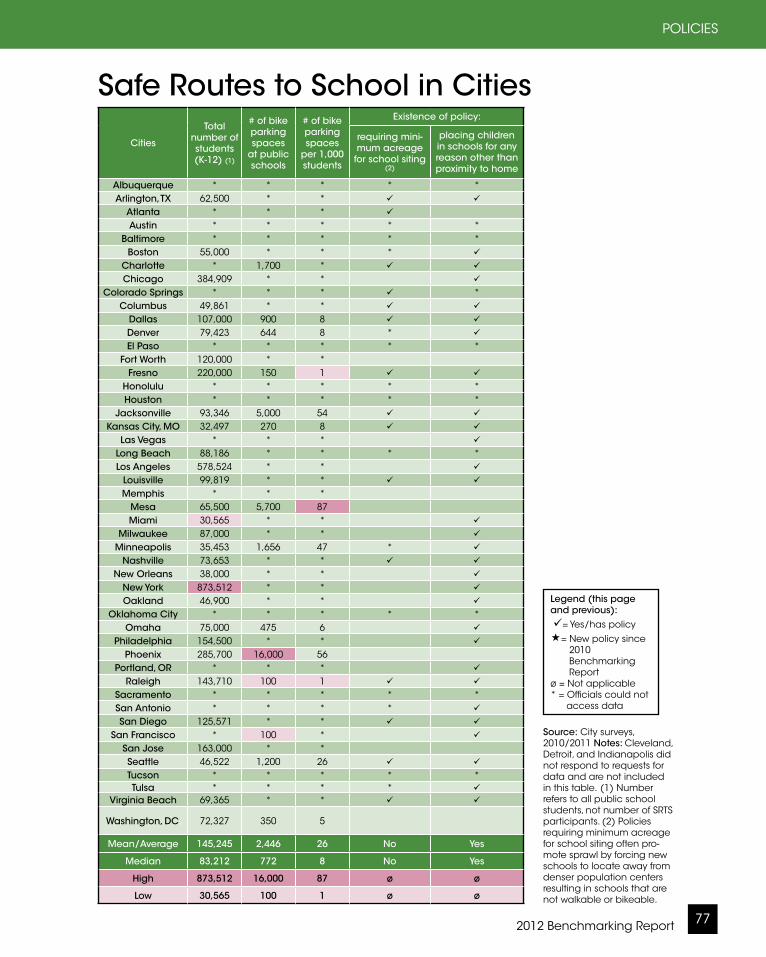
2012 Benchmarking Report 77
POLICIES
Cities
Total number of students (K-12) (1)
# of bike parking spaces
at public schools
# of bike parking spaces
per 1,000 students
Existence of policy:
requiring mini-mum acreage
for school siting (2)
placing children in schools for any reason other than proximity to home
Albuquerque * * * * *Arlington, TX 62,500 * *
Atlanta * * *
Austin * * * * *Baltimore * * * * *
Boston 55,000 * * *
Charlotte * 1,700 *
Chicago 384,909 * *
Colorado Springs * * * *Columbus 49,861 * *
Dallas 107,000 900 8
Denver 79,423 644 8 *
El Paso * * * * *Fort Worth 120,000 * *
Fresno 220,000 150 1
Honolulu * * * * *Houston * * * * *
Jacksonville 93,346 5,000 54
Kansas City, MO 32,497 270 8
Las Vegas * * *
Long Beach 88,186 * * * *Los Angeles 578,524 * *
Louisville 99,819 * *
Memphis * * *Mesa 65,500 5,700 87Miami 30,565 * *
Milwaukee 87,000 * *
Minneapolis 35,453 1,656 47 *
Nashville 73,653 * *
New Orleans 38,000 * *
New York 873,512 * *
Oakland 46,900 * *
Oklahoma City * * * * *Omaha 75,000 475 6
Philadelphia 154,500 * *
Phoenix 285,700 16,000 56Portland, OR * * *
Raleigh 143,710 100 1
Sacramento * * * * *San Antonio * * * *
San Diego 125,571 * *
San Francisco * 100 *
San Jose 163,000 * *Seattle 46,522 1,200 26
Tucson * * * * *Tulsa * * * *
Virginia Beach 69,365 * *
Washington, DC. 72,327 350 5
Mean/Average 145,245 2,446 26 No Yes
Median 83,212 772 8 No Yes
High 873,512 16,000 87 ø ø
Low 30,565 100 1 ø ø
Safe Routes to School in Cities
Source: City surveys, 2010/2011 Notes: Cleveland, Detroit, and Indianapolis did not respond to requests for data and are not included in this table. (1) Number refers to all public school students, not number of SRTS participants. (2) Policies requiring minimum acreage for school siting often pro-mote sprawl by forcing new schools to locate away from denser population centers resulting in schools that are not walkable or bikeable.
Legend (this page and previous): = Yes/has policy= New policy since 2010 Benchmarking Report ø = Not applicable* = Officials could not access data
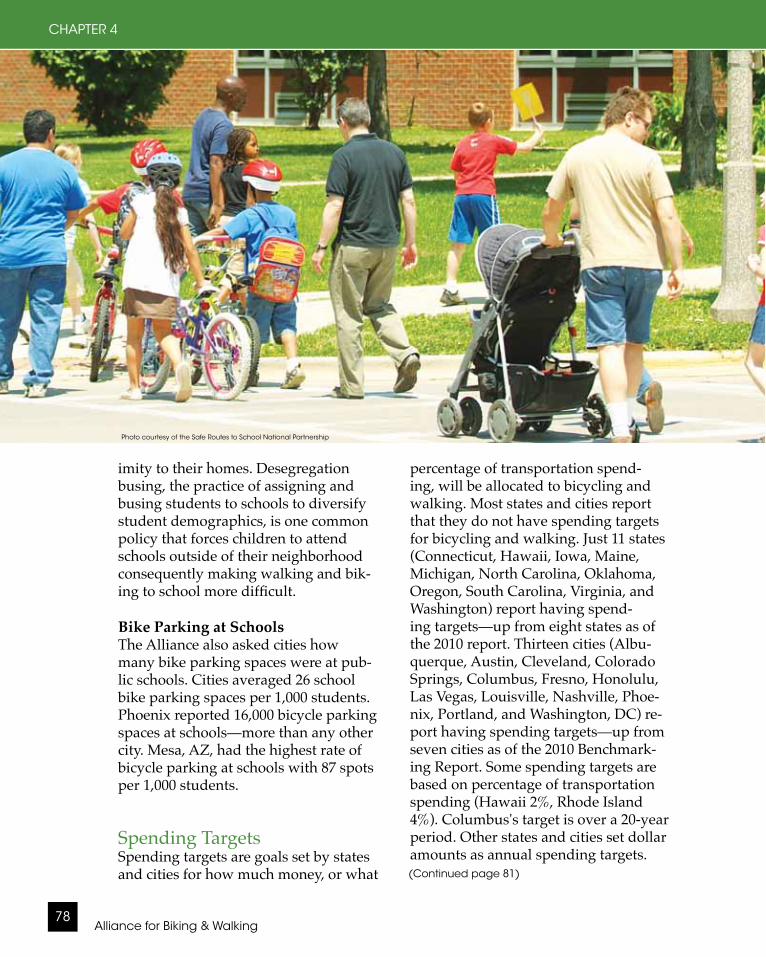
Alliance for Biking & Walking78
CHAPTER 4
imity to their homes. Desegregation busing, the practice of assigning and busing students to schools to diversify student demographics, is one common policy that forces children to attend schools outside of their neighborhood consequently making walking and bik-ing to school more difficult.
Bike Parking at SchoolsThe Alliance also asked cities how many bike parking spaces were at pub-lic schools. Cities averaged 26 school bike parking spaces per 1,000 students. Phoenix reported 16,000 bicycle parking spaces at schools—more than any other city. Mesa, AZ, had the highest rate of bicycle parking at schools with 87 spots per 1,000 students.
Spending TargetsSpending targets are goals set by states and cities for how much money, or what
percentage of transportation spend-ing, will be allocated to bicycling and walking. Most states and cities report that they do not have spending targets for bicycling and walking. Just 11 states (Connecticut, Hawaii, Iowa, Maine, Michigan, North Carolina, Oklahoma, Oregon, South Carolina, Virginia, and Washington) report having spend-ing targets—up from eight states as of the 2010 report. Thirteen cities (Albu-querque, Austin, Cleveland, Colorado Springs, Columbus, Fresno, Honolulu, Las Vegas, Louisville, Nashville, Phoe-nix, Portland, and Washington, DC) re-port having spending targets—up from seven cities as of the 2010 Benchmark-ing Report. Some spending targets are based on percentage of transportation spending (Hawaii 2%, Rhode Island 4%). Columbus's target is over a 20-year period. Other states and cities set dollar amounts as annual spending targets.
Photo courtesy of the Safe Routes to School National Partnership
(Continued page 81)

2012 Benchmarking Report 79
POLICIES
BikeLaneny
Source: LAB 2011
Sidepathny
Source: LAB 2011
YthHelmetny
Source: LAB 2011
Mandatory Bike Lane Use Laws
Mandatory Youth Helmet Laws
Source: LAB 2011
AllStates.3ftPassny
Source: LAB 2011
USBRny
Source: LAB 2011
3-Foot Passing Laws
U.S. Bike Routes Officially Designated
AllStates.2Abreastny
Source: LAB 2011
Bicycles Can Legally Ride 2-Abreast
State Bicycle Policies
Mandatory Sidepath Use Law
Legend: = Policy in existence in this state
= State does not have this policy
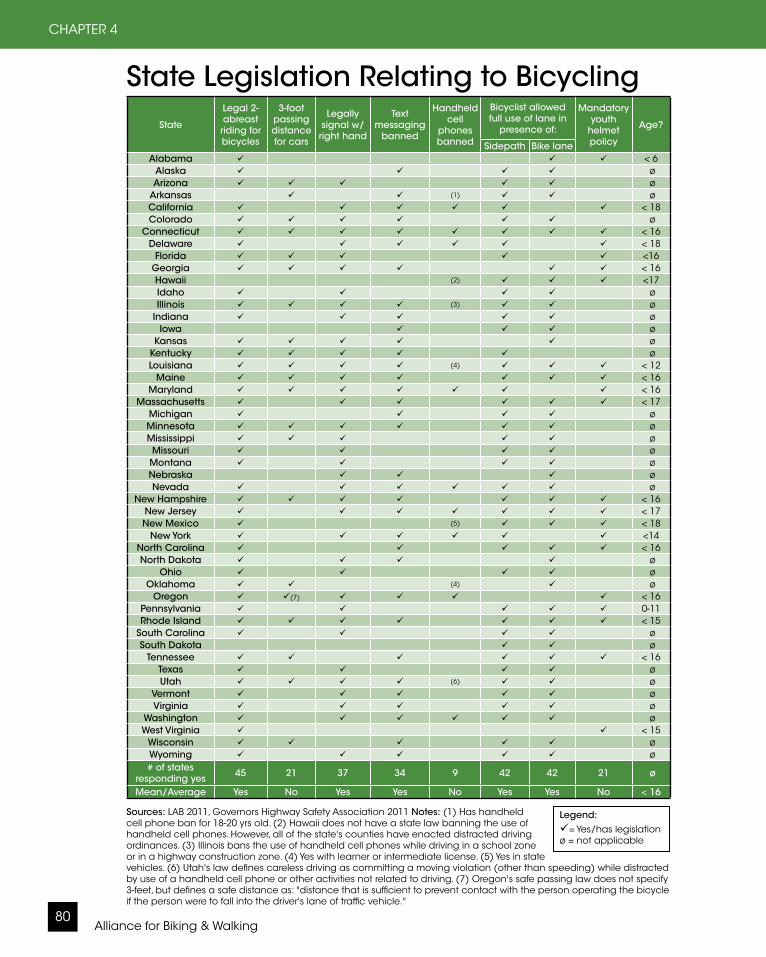
Alliance for Biking & Walking80
CHAPTER 4
Sources: LAB 2011, Governors Highway Safety Association 2011 Notes: (1) Has handheld cell phone ban for 18-20 yrs old. (2) Hawaii does not have a state law banning the use of handheld cell phones. However, all of the state's counties have enacted distracted driving ordinances. (3) Illinois bans the use of handheld cell phones while driving in a school zone or in a highway construction zone. (4) Yes with learner or intermediate license. (5) Yes in state vehicles. (6) Utah's law defines careless driving as committing a moving violation (other than speeding) while distracted by use of a handheld cell phone or other activities not related to driving. (7) Oregon's safe passing law does not specify 3-feet, but defines a safe distance as: "distance that is sufficient to prevent contact with the person operating the bicycle if the person were to fall into the driver's lane of traffic vehicle."
State
Legal 2- abreast riding for bicycles
3-foot passing distance for cars
Legally signal w/ right hand
Text messaging
banned
Handheldcell
phones banned
Bicyclist allowed full use of lane in
presence of:
Mandatory youth
helmet policy
Age?
Sidepath Bike laneAlabama < 6
Alaska øArizona ø
Arkansas (1) øCalifornia < 18Colorado ø
Connecticut < 16Delaware < 18
Florida <16Georgia < 16Hawaii (2) <17Idaho øIllinois (3) ø
Indiana øIowa ø
Kansas øKentucky øLouisiana (4) < 12
Maine < 16Maryland < 16
Massachusetts < 17Michigan øMinnesota øMississippi øMissouri øMontana øNebraska øNevada ø
New Hampshire < 16New Jersey < 17New Mexico (5) < 18
New York <14North Carolina < 16North Dakota ø
Ohio øOklahoma (4) ø
Oregon (7) < 16Pennsylvania 0-11Rhode Island < 15
South Carolina øSouth Dakota ø
Tennessee < 16Texas øUtah (6) ø
Vermont øVirginia ø
Washington øWest Virginia < 15
Wisconsin øWyoming ø# of states
responding yes 45 21 37 34 9 42 42 21 ø
Mean/Average Yes No Yes Yes No Yes Yes No < 16
State Legislation Relating to Bicycling
Legend: = Yes/has legislation ø = not applicable
2012 Benchmarking Report 81
POLICIES
State LegislationCan Bicyclists Legally Ride Two Abreast?Most states have laws that allow bi-cyclists to ride side by side or "two abreast" as long as they are not imped-ing traffic. Riding two abreast is often preferred for bicyclists riding with a companion and can make bicycling a more enjoyable experience, like sitting beside a friend in a bus, train, or car. Forty-five states have legislation al-lowing bicyclists to ride two abreast. Hawaii, Iowa, Montana, Nebraska, and South Dakota are the only states where there is no legislation allowing bicy-clists to ride side by side.
Safe Passing LawsIn recent years many states have suc-cessfully pursued legislation that requires motorists to pass bicyclists at a set "safe" distance. These "Safe Pass-ing" or "3-Feet" laws, as they're often called, are primarily aimed at educating motorists how to safely pass bicyclists. Motorists may believe that just avoid-ing contact with bicyclists is all that is required when passing. Many motorists are unaware of the dangers of passing a bicyclist too closely which may lead to the bicyclist being hit or startled resulting in a crash. The other benefit of safe passing laws is to give police the authority to charge drivers who hit cyclists. If a motorist hits a cyclist, by definition he or she failed to give three feet. Twenty-one states now have safe passing laws on the books (up from 14 as of the 2010 Benchmarking Report).
Distracted Driving LawsDistracted driving has received in-creased attention in recent years, especially as cell phones and texting have become more prominent. In 2009, distracted driving was responsible for
roughly 16% of traffic fatalities (nearly 5,500 victims) (USDOT 2011). Recent re-search has shown that strong laws with strong enforcement can significantly reduce distracted driving and save lives (Cosgrove et al., 2011). As of this re-port, only nine states ban handheld cell phone use by all motorists. Thirty-four states ban text messaging while driving.
Mandatory Bike Lane and Sidepath Use LawsAlthough most state laws define bi-cycles as vehicles with the same rights and responsibilities as other vehicles on roadways, some states and municipali-ties have laws that prohibit bicyclists from full use of roadways when a bike lane or adjacent pathway is present. These “mandatory bike lane use” and “mandatory sidepath” laws can make it illegal for bicyclists to navigate traffic with the best vehicular tactics (such as merging left to avoid an obstruction, merging into the left lane to turn left, or not riding to the right of traffic in a turn lane) and restrict bicyclists' access to businesses or residences.
Most states, however, do allow bi-cyclists full use of the lane in traffic. Forty-two states allow the full use of the lane by bicyclists when a bike lane is present, and 42 allow use of the full lane in the presence of a sidepath. States that have mandatory bike lane use laws include California, Delaware, Florida, Kentucky, Maryland, New York, Or-egon, and West Virginia. States that have mandatory sidepath laws include Alabama, Georgia, Kansas, Nebraska, North Dakota, Oklahoma, Oregon, and West Virginia.
Mandatory Helmet LawsAlthough there is no federal law in the United States requiring helmet use for
State
Legal 2- abreast riding for bicycles
3-foot passing distance for cars
Legally signal w/ right hand
Text messaging
banned
Handheldcell
phones banned
Bicyclist allowed full use of lane in
presence of:
Mandatory youth
helmet policy
Age?
Sidepath Bike laneAlabama < 6
Alaska øArizona ø
Arkansas (1) øCalifornia < 18Colorado ø
Connecticut < 16Delaware < 18
Florida <16Georgia < 16Hawaii (2) <17Idaho øIllinois (3) ø
Indiana øIowa ø
Kansas øKentucky øLouisiana (4) < 12
Maine < 16Maryland < 16
Massachusetts < 17Michigan øMinnesota øMississippi øMissouri øMontana øNebraska øNevada ø
New Hampshire < 16New Jersey < 17New Mexico (5) < 18
New York <14North Carolina < 16North Dakota ø
Ohio øOklahoma (4) ø
Oregon (7) < 16Pennsylvania 0-11Rhode Island < 15
South Carolina øSouth Dakota ø
Tennessee < 16Texas øUtah (6) ø
Vermont øVirginia ø
Washington øWest Virginia < 15
Wisconsin øWyoming ø# of states
responding yes 45 21 37 34 9 42 42 21 ø
Mean/Average Yes No Yes Yes No Yes Yes No < 16
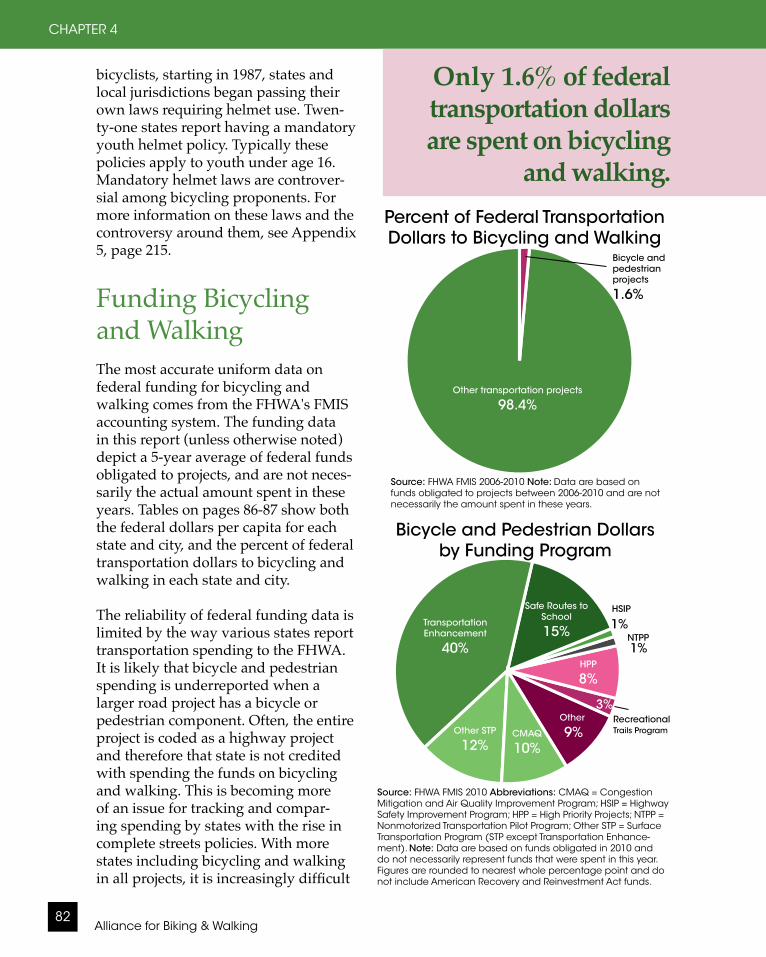
Alliance for Biking & Walking82
CHAPTER 4
bicyclists, starting in 1987, states and local jurisdictions began passing their own laws requiring helmet use. Twen-ty-one states report having a mandatory youth helmet policy. Typically these policies apply to youth under age 16. Mandatory helmet laws are controver-sial among bicycling proponents. For more information on these laws and the controversy around them, see Appendix 5, page 215.
Funding Bicycling and WalkingThe most accurate uniform data on federal funding for bicycling and walking comes from the FHWA's FMIS accounting system. The funding data in this report (unless otherwise noted) depict a 5-year average of federal funds obligated to projects, and are not neces-sarily the actual amount spent in these years. Tables on pages 86-87 show both the federal dollars per capita for each state and city, and the percent of federal transportation dollars to bicycling and walking in each state and city.
The reliability of federal funding data is limited by the way various states report transportation spending to the FHWA. It is likely that bicycle and pedestrian spending is underreported when a larger road project has a bicycle or pedestrian component. Often, the entire project is coded as a highway project and therefore that state is not credited with spending the funds on bicycling and walking. This is becoming more of an issue for tracking and compar-ing spending by states with the rise in complete streets policies. With more states including bicycling and walking in all projects, it is increasingly difficult
Percent of Federal Transportation Dollars to Bicycling and Walking
Only 1.6% of federal transportation dollars are spent on bicycling
and walking.
Source: FHWA FMIS 2006-2010 Note: Data are based on funds obligated to projects between 2006-2010 and are not necessarily the amount spent in these years.
Other transportation projects
98.4%
Bicycle and pedestrian projects
1.6%
HPP
8%
CMAQ
10%
Recreational Trails Program
Safe Routes to School
15%
Other
9%Other STP
12%
3%
Source: FHWA FMIS 2010 Abbreviations: CMAQ = Congestion Mitigation and Air Quality Improvement Program; HSIP = Highway Safety Improvement Program; HPP = High Priority Projects; NTPP = Nonmotorized Transportation Pilot Program; Other STP = Surface Transportation Program (STP except Transportation Enhance-ment). Note: Data are based on funds obligated in 2010 and do not necessarily represent funds that were spent in this year. Figures are rounded to nearest whole percentage point and do not include American Recovery and Reinvestment Act funds.
Transportation Enhancement
40%
HSIP
1%NTPP1%
Bicycle and Pedestrian Dollars by Funding Program
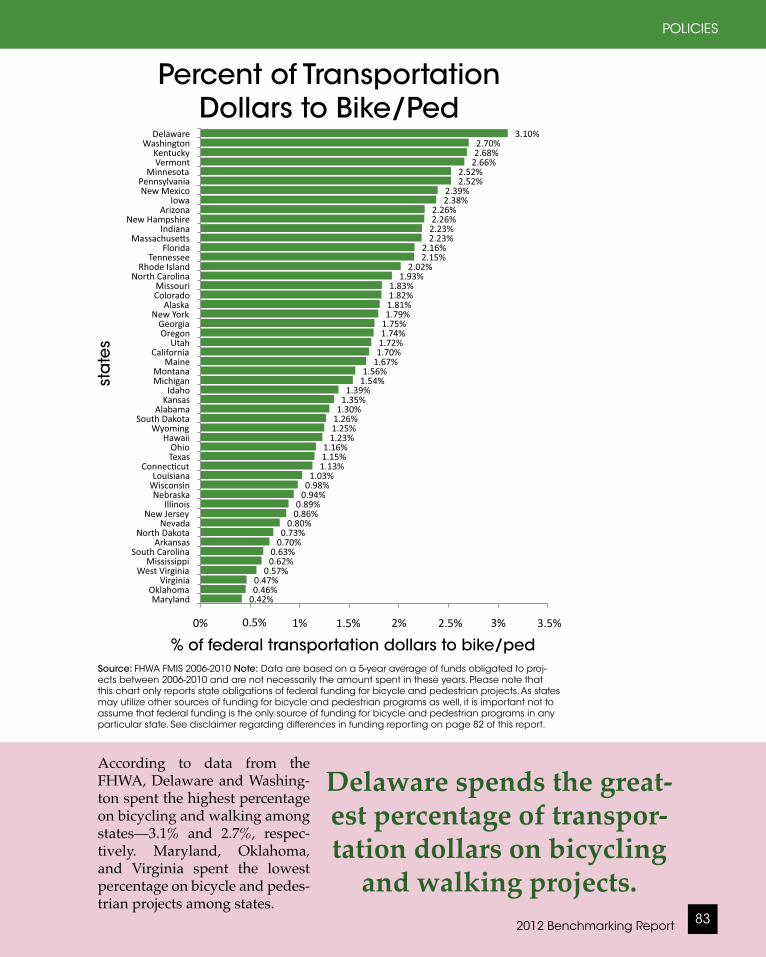
2012 Benchmarking Report 83
POLICIES
Percent of Transportation Dollars to Bike/Ped
0.5% 1.5% 2.5% 3.5%
Delaware spends the great-est percentage of transpor-tation dollars on bicycling
and walking projects.
According to data from the FHWA, Delaware and Washing-ton spent the highest percentage on bicycling and walking among states—3.1% and 2.7%, respec-tively. Maryland, Oklahoma, and Virginia spent the lowest percentage on bicycle and pedes-trian projects among states.
Source: FHWA FMIS 2006-2010 Note: Data are based on a 5-year average of funds obligated to proj-ects between 2006-2010 and are not necessarily the amount spent in these years. Please note that this chart only reports state obligations of federal funding for bicycle and pedestrian projects. As states may utilize other sources of funding for bicycle and pedestrian programs as well, it is important not to assume that federal funding is the only source of funding for bicycle and pedestrian programs in any particular state. See disclaimer regarding differences in funding reporting on page 82 of this report.
sta
tes
% of federal transportation dollars to bike/ped
Bicycle and pedestrian projects
1.6%
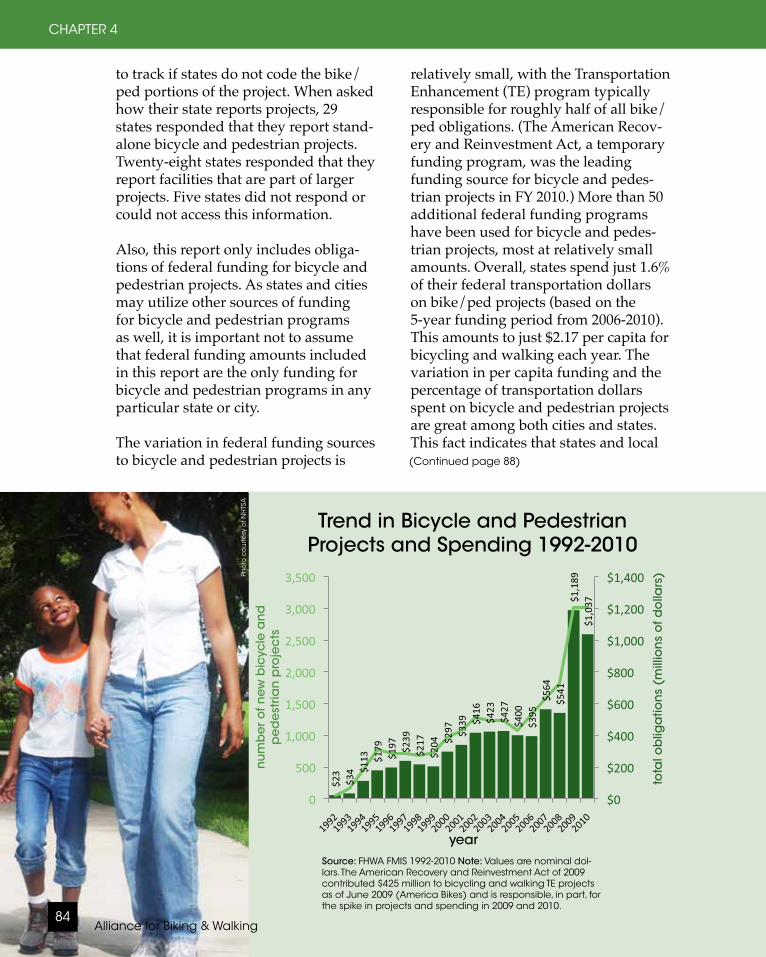
Alliance for Biking & Walking84
CHAPTER 4
year
Funds %1992 50 $22.901993 163 $33.701994 461 $112.601995 778 $178.601996 706 $197.201997 715 $238.801998 681 $216.501999 724 $204.202000 971 $296.702001 1081 $339.102002 1287 $415.902003 1237 $422.702004 1226 $427.102005 1077 $399.902006 1320 $394.902007 1584 $564.002008 1817 $541.002009 3010 $1,188.60 $254.30 $151.00 34.00%2010 3007 $1,036.60
source: http://www.fhwa.dot.gov/environment/bikeped/bipedfund.htm
Trend in Bicycle and Pedestrian Projects and Spending 1992-2010
Source: FHWA FMIS 1992-2010 Note: Values are nominal dol-lars. The American Recovery and Reinvestment Act of 2009 contributed $425 million to bicycling and walking TE projects as of June 2009 (America Bikes) and is responsible, in part, for the spike in projects and spending in 2009 and 2010.
num
be
r o
f new
bic
ycle
an
d
pe
de
stria
n p
roje
cts
tota
l ob
liga
tion
s (m
illio
ns
of d
olla
rs)
to track if states do not code the bike/ped portions of the project. When asked how their state reports projects, 29 states responded that they report stand-alone bicycle and pedestrian projects. Twenty-eight states responded that they report facilities that are part of larger projects. Five states did not respond or could not access this information.
Also, this report only includes obliga-tions of federal funding for bicycle and pedestrian projects. As states and cities may utilize other sources of funding for bicycle and pedestrian programs as well, it is important not to assume that federal funding amounts included in this report are the only funding for bicycle and pedestrian programs in any particular state or city.
The variation in federal funding sources to bicycle and pedestrian projects is
Pho
to c
ou
rte
sy o
f NH
TSA
relatively small, with the Transportation Enhancement (TE) program typically responsible for roughly half of all bike/ped obligations. (The American Recov-ery and Reinvestment Act, a temporary funding program, was the leading funding source for bicycle and pedes-trian projects in FY 2010.) More than 50 additional federal funding programs have been used for bicycle and pedes-trian projects, most at relatively small amounts. Overall, states spend just 1.6% of their federal transportation dollars on bike/ped projects (based on the 5-year funding period from 2006-2010). This amounts to just $2.17 per capita for bicycling and walking each year. The variation in per capita funding and the percentage of transportation dollars spent on bicycle and pedestrian projects are great among both cities and states. This fact indicates that states and local (Continued page 88)
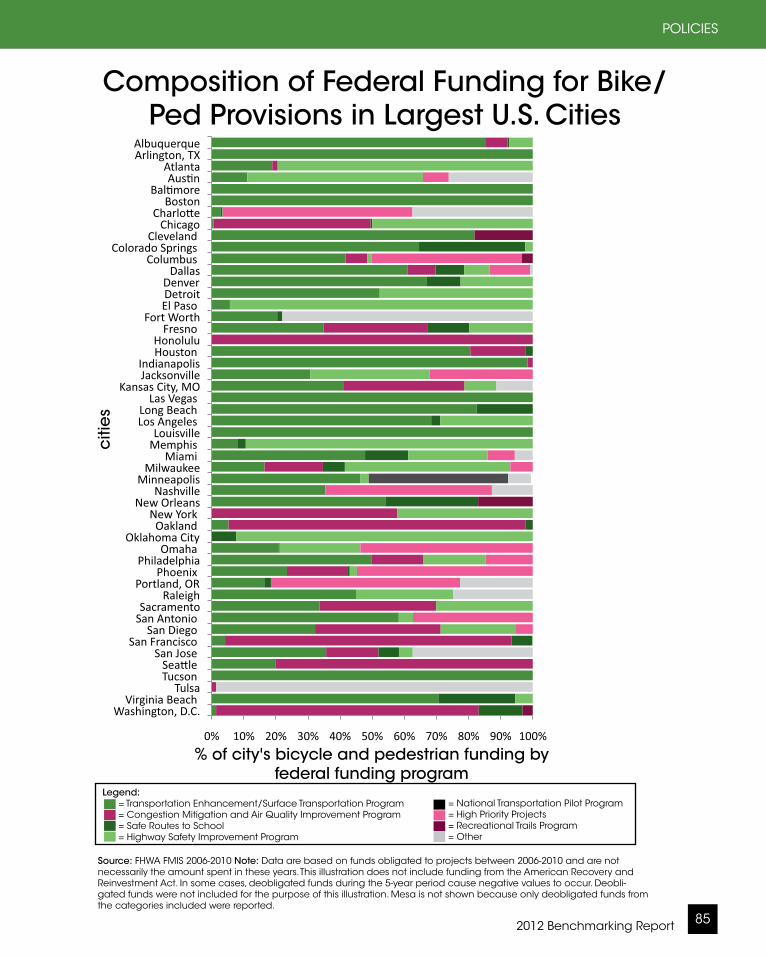
2012 Benchmarking Report 85
POLICIES
Composition of Federal Funding for Bike/Ped Provisions in Largest U.S. Cities
Source: FHWA FMIS 2006-2010 Note: Data are based on funds obligated to projects between 2006-2010 and are not necessarily the amount spent in these years. This illustration does not include funding from the American Recovery and Reinvestment Act. In some cases, deobligated funds during the 5-year period cause negative values to occur. Deobli-gated funds were not included for the purpose of this illustration. Mesa is not shown because only deobligated funds from the categories included were reported.
citi
es
% of city's bicycle and pedestrian funding by federal funding program
Legend: = Transportation Enhancement/Surface Transportation Program = Congestion Mitigation and Air Quality Improvement Program = Safe Routes to School = Highway Safety Improvement Program
= National Transportation Pilot Program = High Priority Projects = Recreational Trails Program = Other
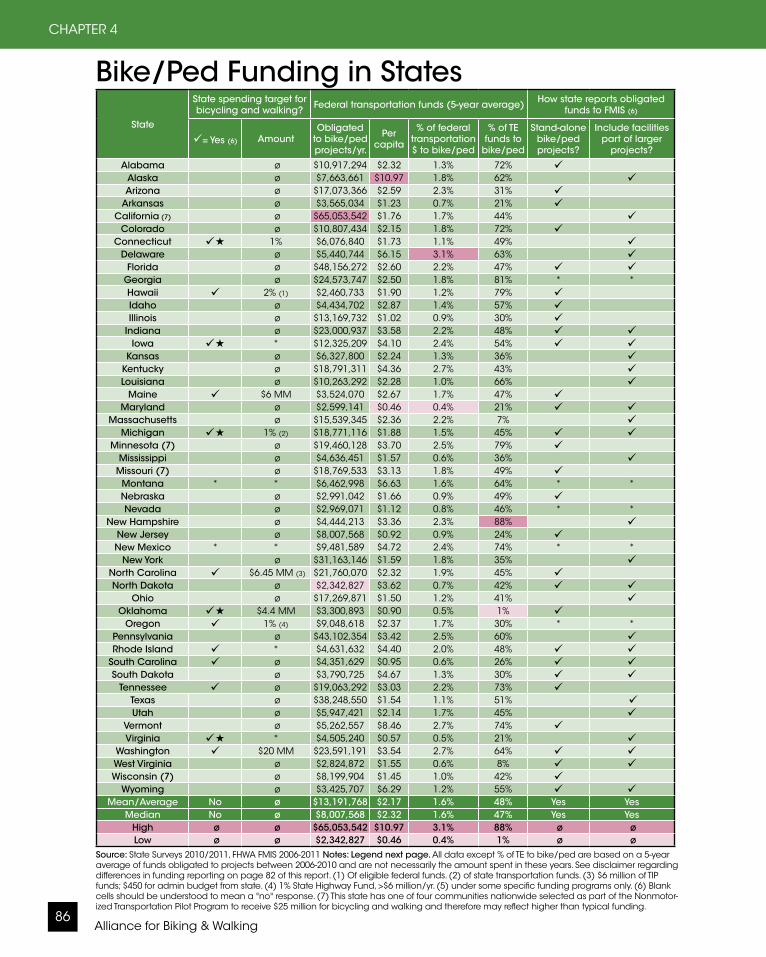
Alliance for Biking & Walking86
CHAPTER 4
State
State spending target for bicycling and walking? Federal transportation funds (5-year average) How state reports obligated
funds to FMIS (6)
= Yes (6) AmountObligated
to bike/ped projects/yr.
Per capita
% of federal transportation $ to bike/ped
% of TE funds to
bike/ped
Stand-alone bike/ped projects?
Include facilities part of larger
projects?
Alabama ø $10,917,294 $2.32 1.3% 72% Alaska ø $7,663,661 $10.97 1.8% 62% Arizona ø $17,073,366 $2.59 2.3% 31%
Arkansas ø $3,565,034 $1.23 0.7% 21% California (7) ø $65,053,542 $1.76 1.7% 44%
Colorado ø $10,807,434 $2.15 1.8% 72% Connecticut 1% $6,076,840 $1.73 1.1% 49%
Delaware ø $5,440,744 $6.15 3.1% 63% Florida ø $48,156,272 $2.60 2.2% 47%
Georgia ø $24,573,747 $2.50 1.8% 81% * *Hawaii 2% (1) $2,460,733 $1.90 1.2% 79% Idaho ø $4,434,702 $2.87 1.4% 57% Illinois ø $13,169,732 $1.02 0.9% 30%
Indiana ø $23,000,937 $3.58 2.2% 48% Iowa * $12,325,209 $4.10 2.4% 54%
Kansas ø $6,327,800 $2.24 1.3% 36% Kentucky ø $18,791,311 $4.36 2.7% 43% Louisiana ø $10,263,292 $2.28 1.0% 66%
Maine $6 MM $3,524,070 $2.67 1.7% 47% Maryland ø $2,599,141 $0.46 0.4% 21%
Massachusetts ø $15,539,345 $2.36 2.2% 7% Michigan 1% (2) $18,771,116 $1.88 1.5% 45%
Minnesota (7) ø $19,460,128 $3.70 2.5% 79% Mississippi ø $4,636,451 $1.57 0.6% 36%
Missouri (7) ø $18,769,533 $3.13 1.8% 49% Montana * * $6,462,998 $6.63 1.6% 64% * *Nebraska ø $2,991,042 $1.66 0.9% 49% Nevada ø $2,969,071 $1.12 0.8% 46% * *
New Hampshire ø $4,444,213 $3.36 2.3% 88% New Jersey ø $8,007,568 $0.92 0.9% 24% New Mexico * * $9,481,589 $4.72 2.4% 74% * *
New York ø $31,163,146 $1.59 1.8% 35% North Carolina $6.45 MM (3) $21,760,070 $2.32 1.9% 45% North Dakota ø $2,342,827 $3.62 0.7% 42%
Ohio ø $17,269,871 $1.50 1.2% 41% Oklahoma $4.4 MM $3,300,893 $0.90 0.5% 1%
Oregon 1% (4) $9,048,618 $2.37 1.7% 30% * *Pennsylvania ø $43,102,354 $3.42 2.5% 60% Rhode Island * $4,631,632 $4.40 2.0% 48%
South Carolina ø $4,351,629 $0.95 0.6% 26% South Dakota ø $3,790,725 $4.67 1.3% 30%
Tennessee ø $19,063,292 $3.03 2.2% 73% Texas ø $38,248,550 $1.54 1.1% 51% Utah ø $5,947,421 $2.14 1.7% 45%
Vermont ø $5,262,557 $8.46 2.7% 74% Virginia * $4,505,240 $0.57 0.5% 21%
Washington $20 MM $23,591,191 $3.54 2.7% 64% West Virginia ø $2,824,872 $1.55 0.6% 8% Wisconsin (7) ø $8,199,904 $1.45 1.0% 42%
Wyoming ø $3,425,707 $6.29 1.2% 55% Mean/Average No ø $13,191,768 $2.17 1.6% 48% Yes Yes
Median No ø $8,007,568 $2.32 1.6% 47% Yes YesHigh ø ø $65,053,542 $10.97 3.1% 88% ø øLow ø ø $2,342,827 $0.46 0.4% 1% ø ø
Bike/Ped Funding in States
Source: State Surveys 2010/2011, FHWA FMIS 2006-2011 Notes: Legend next page. All data except % of TE to bike/ped are based on a 5-year average of funds obligated to projects between 2006-2010 and are not necessarily the amount spent in these years. See disclaimer regarding differences in funding reporting on page 82 of this report. (1) Of eligible federal funds. (2) of state transportation funds. (3) $6 million of TIP funds; $450 for admin budget from state. (4) 1% State Highway Fund, >$6 million/yr. (5) under some specific funding programs only. (6) Blank cells should be understood to mean a "no" response. (7) This state has one of four communities nationwide selected as part of the Nonmotor-ized Transportation Pilot Program to receive $25 million for bicycling and walking and therefore may reflect higher than typical funding.
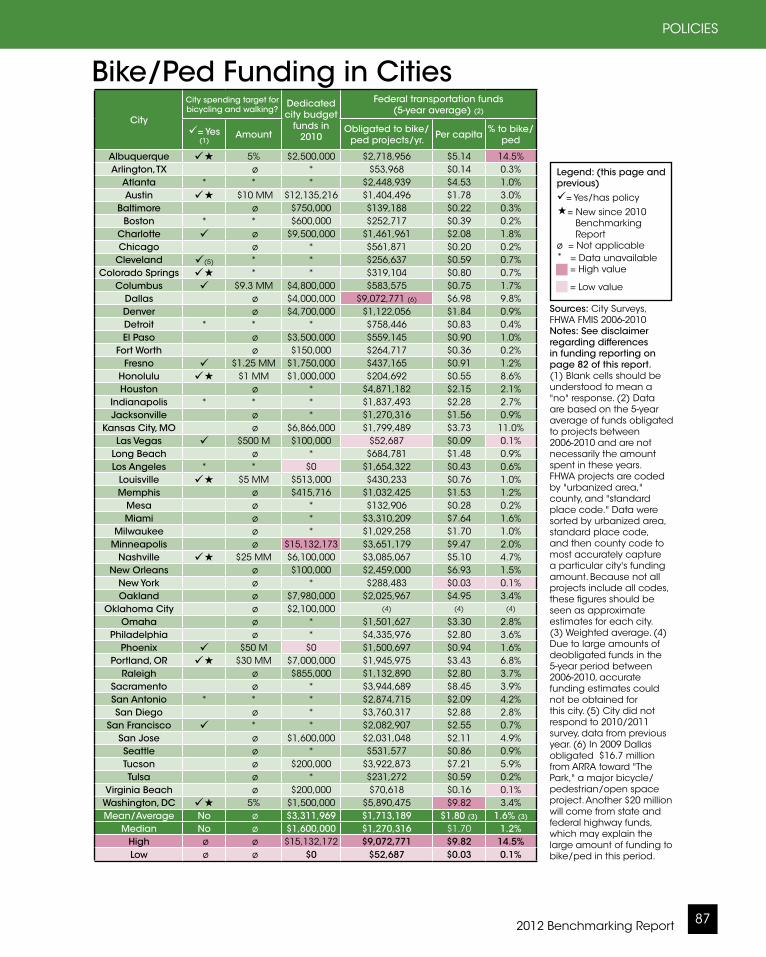
2012 Benchmarking Report 87
POLICIES
City
City spending target for bicycling and walking?
Dedicated city budget
funds in 2010
Federal transportation funds (5-year average) (2)
= Yes (1)
Amount Obligated to bike/ped projects/yr. Per capita % to bike/
ped
Albuquerque 5% $2,500,000 $2,718,956 $5.14 14.5%Arlington, TX ø * $53,968 $0.14 0.3%
Atlanta * * * $2,448,939 $4.53 1.0%Austin $10 MM $12,135,216 $1,404,496 $1.78 3.0%
Baltimore ø $750,000 $139,188 $0.22 0.3%Boston * * $600,000 $252,717 $0.39 0.2%
Charlotte ø $9,500,000 $1,461,961 $2.08 1.8%Chicago ø * $561,871 $0.20 0.2%
Cleveland (5) * * $256,637 $0.59 0.7%Colorado Springs * * $319,104 $0.80 0.7%
Columbus $9.3 MM $4,800,000 $583,575 $0.75 1.7%Dallas ø $4,000,000 $9,072,771 (6) $6.98 9.8%Denver ø $4,700,000 $1,122,056 $1.84 0.9%Detroit * * * $758,446 $0.83 0.4%El Paso ø $3,500,000 $559,145 $0.90 1.0%
Fort Worth ø $150,000 $264,717 $0.36 0.2%Fresno $1.25 MM $1,750,000 $437,165 $0.91 1.2%
Honolulu $1 MM $1,000,000 $204,692 $0.55 8.6%Houston ø * $4,871,182 $2.15 2.1%
Indianapolis * * * $1,837,493 $2.28 2.7%Jacksonville ø * $1,270,316 $1.56 0.9%
Kansas City, MO ø $6,866,000 $1,799,489 $3.73 11.0%Las Vegas $500 M $100,000 $52,687 $0.09 0.1%
Long Beach ø * $684,781 $1.48 0.9%Los Angeles * * $0 $1,654,322 $0.43 0.6%
Louisville $5 MM $513,000 $430,233 $0.76 1.0%Memphis ø $415,716 $1,032,425 $1.53 1.2%
Mesa ø * $132,906 $0.28 0.2%Miami ø * $3,310,209 $7.64 1.6%
Milwaukee ø * $1,029,258 $1.70 1.0%Minneapolis ø $15,132,173 $3,651,179 $9.47 2.0%
Nashville $25 MM $6,100,000 $3,085,067 $5.10 4.7%New Orleans ø $100,000 $2,459,000 $6.93 1.5%
New York ø * $288,483 $0.03 0.1%Oakland ø $7,980,000 $2,025,967 $4.95 3.4%
Oklahoma City ø $2,100,000 (4) (4) (4)
Omaha ø * $1,501,627 $3.30 2.8%Philadelphia ø * $4,335,976 $2.80 3.6%
Phoenix $50 M $0 $1,500,697 $0.94 1.6%Portland, OR $30 MM $7,000,000 $1,945,975 $3.43 6.8%
Raleigh ø $855,000 $1,132,890 $2.80 3.7%Sacramento ø * $3,944,689 $8.45 3.9%San Antonio * * * $2,874,715 $2.09 4.2%San Diego ø * $3,760,317 $2.88 2.8%
San Francisco * * $2,082,907 $2.55 0.7%San Jose ø $1,600,000 $2,031,048 $2.11 4.9%Seattle ø * $531,577 $0.86 0.9%Tucson ø $200,000 $3,922,873 $7.21 5.9%Tulsa ø * $231,272 $0.59 0.2%
Virginia Beach ø $200,000 $70,618 $0.16 0.1%Washington, DC 5% $1,500,000 $5,890,475 $9.82 3.4%Mean/Average No ø $3,311,969 $1,713,189 $1.80 (3) 1.6% (3)
Median No ø $1,600,000 $1,270,316 $1.70 1.2%High ø ø $15,132,172 $9,072,771 $9.82 14.5%Low ø ø $0 $52,687 $0.03 0.1%
Bike/Ped Funding in Cities
Sources: City Surveys, FHWA FMIS 2006-2010 Notes: See disclaimer regarding differences in funding reporting on page 82 of this report. (1) Blank cells should be understood to mean a "no" response. (2) Data are based on the 5-year average of funds obligated to projects between 2006-2010 and are not necessarily the amount spent in these years. FHWA projects are coded by "urbanized area," county, and "standard place code." Data were sorted by urbanized area, standard place code, and then county code to most accurately capture a particular city's funding amount. Because not all projects include all codes, these figures should be seen as approximate estimates for each city. (3) Weighted average. (4) Due to large amounts of deobligated funds in the 5-year period between 2006-2010, accurate funding estimates could not be obtained for this city. (5) City did not respond to 2010/2011 survey, data from previous year. (6) In 2009 Dallas obligated $16.7 million from ARRA toward "The Park," a major bicycle/pedestrian/open space project. Another $20 million will come from state and federal highway funds, which may explain the large amount of funding to bike/ped in this period.
Legend: (this page and previous)= Yes/has policy= New since 2010 Benchmarking Reportø = Not applicable* = Data unavailable = High value = Low value

Alliance for Biking & Walking88
CHAPTER 4
jurisdictions play a significant role in determining how their federal transpor-tation dollars are spent.
Unfortunately, this has meant that often bicycle and pedestrian projects not only receive a smaller than fair share of funds, but are also dispropor-tionately targeted for rescissions. Since 2002, Congress has enacted rescissions, removal of apportioned funding before the funding is set to expire, that have affected transportation funding. In most years, states have had discretion as to how much to rescind from programs such as the Transportation Enhance-ment program as opposed to other federal-aid highway programs.
Transportation EnhancementsThe Transportation Enhancement (TE) program is the best known funding source for bicycle and pedestrian infra-structure improvements. Of Transporta-tion Enhancements funding, $265 mil-lion, or 48%, is allocated to biking and walking infrastructure and programs annually, making it the most important federal funding program to track.
Bicycle and pedestrian projects are dis-proportionately affected by rescissions when states choose to rescind a greater percentage of TE funds than in other transportation funding programs. $2.6 billion, or 21% of apportioned TE fund-ing, has been rescinded since 1992.
In 2010, TE comprised 2.3% of appor-tionments but 26.4% of rescissions. This disparity was greatest in Nebraska where 100% of rescinded funds were TE. Texas, Nevada, and Arkansas also lead for disproportionately rescinding TE funds with 78.8%, 62.1%, and 54.5% of funds rescinded from TE, respec-tively.
Distribution of TE Funding by Category
7. Rehab Hist. Transp.
Facilities
9.9%
8. Rail-Trails
7.5%
1. Bike/Ped Facilities
48.4%
5. Pedestrian Streetscapes
5.8%
5. Landscaping and Scenic
Beautification
12.9%
2. Bike/Ped Safety Education
0.4%
9. Billboard Removal
0.3%
3. Acquisition of Scenic/Historic
Easements
2.4%
6. Historic Preservation
3.6%
4. Scenic/Historic Hwy Programs
5.8%
10 Archaeological Planning/Research
0.5% 11. Environmental Mitigation
1.0%12. Transportation Museums
1.4%
Distribution of TE Funding across Bicycle and Pedestrian Projects
Off-road Trails
34%
Rail-Trails
11%
Pedestrian
44%
On-Road Bike
8%
Transit
2%
Other
0.7%
Safety/Ed.
0.6%
(Continued page 91)Source: NTEC 2010 Note: (1) Numbers round up and so appear to add to more than 100%.
Source: NTEC 2010 Note: (1) Numbers round up and so appear to add to less than 100%.

2012 Benchmarking Report 89
POLICIES
Percent of Transportation Enhancement Funding to Bike/Ped by State
48% of TE funding goes to bicycling
and walking.
Most TE funding (48%) goes toward bicycling and walk-ing facilities, education, and safety. States vary greatly on how they spend their TE dollars. New Hampshire dedi-cates the greatest percentage of TE funds to bicycling and walking (88%); Oklahoma dedicates the smallest share to bicycling and walking (1%).
Source: FHWA FMIS 2006-2010 Note: (1) Figures for this graph are based on a 5-year average of funds obligated to projects between 2006-2010 and are not necessarily the amount spent in these years.
sta
tes
% of obligated TE funds to bike/ped
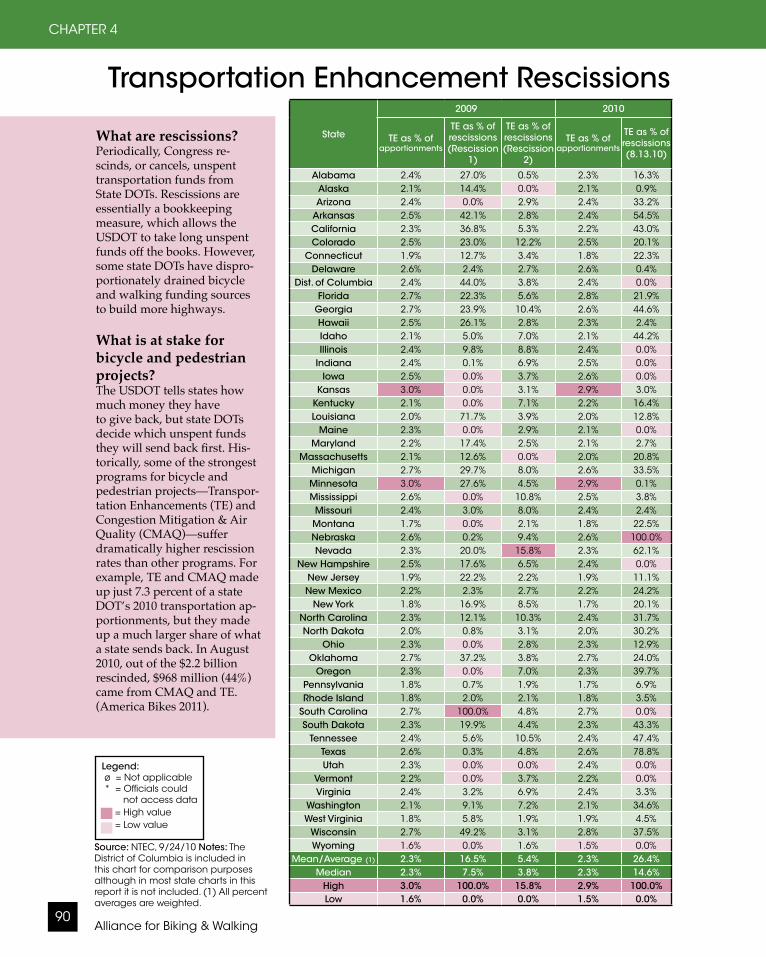
Alliance for Biking & Walking90
CHAPTER 4
Transportation Enhancement Rescissions
Source: NTEC, 9/24/10 Notes: The District of Columbia is included in this chart for comparison purposes although in most state charts in this report it is not included. (1) All percent averages are weighted.
State
2009 2010
TE as % of apportionments
TE as % of rescissions (Rescission
1)
TE as % of rescissions (Rescission
2)
TE as % of apportionments
TE as % of rescissions (8.13.10)
Alabama 2.4% 27.0% 0.5% 2.3% 16.3%Alaska 2.1% 14.4% 0.0% 2.1% 0.9%Arizona 2.4% 0.0% 2.9% 2.4% 33.2%
Arkansas 2.5% 42.1% 2.8% 2.4% 54.5%California 2.3% 36.8% 5.3% 2.2% 43.0%Colorado 2.5% 23.0% 12.2% 2.5% 20.1%
Connecticut 1.9% 12.7% 3.4% 1.8% 22.3%Delaware 2.6% 2.4% 2.7% 2.6% 0.4%
Dist. of Columbia 2.4% 44.0% 3.8% 2.4% 0.0%Florida 2.7% 22.3% 5.6% 2.8% 21.9%
Georgia 2.7% 23.9% 10.4% 2.6% 44.6%Hawaii 2.5% 26.1% 2.8% 2.3% 2.4%Idaho 2.1% 5.0% 7.0% 2.1% 44.2%Illinois 2.4% 9.8% 8.8% 2.4% 0.0%
Indiana 2.4% 0.1% 6.9% 2.5% 0.0%Iowa 2.5% 0.0% 3.7% 2.6% 0.0%
Kansas 3.0% 0.0% 3.1% 2.9% 3.0%Kentucky 2.1% 0.0% 7.1% 2.2% 16.4%Louisiana 2.0% 71.7% 3.9% 2.0% 12.8%
Maine 2.3% 0.0% 2.9% 2.1% 0.0%Maryland 2.2% 17.4% 2.5% 2.1% 2.7%
Massachusetts 2.1% 12.6% 0.0% 2.0% 20.8%Michigan 2.7% 29.7% 8.0% 2.6% 33.5%Minnesota 3.0% 27.6% 4.5% 2.9% 0.1%Mississippi 2.6% 0.0% 10.8% 2.5% 3.8%Missouri 2.4% 3.0% 8.0% 2.4% 2.4%Montana 1.7% 0.0% 2.1% 1.8% 22.5%Nebraska 2.6% 0.2% 9.4% 2.6% 100.0%Nevada 2.3% 20.0% 15.8% 2.3% 62.1%
New Hampshire 2.5% 17.6% 6.5% 2.4% 0.0%New Jersey 1.9% 22.2% 2.2% 1.9% 11.1%New Mexico 2.2% 2.3% 2.7% 2.2% 24.2%
New York 1.8% 16.9% 8.5% 1.7% 20.1%North Carolina 2.3% 12.1% 10.3% 2.4% 31.7%North Dakota 2.0% 0.8% 3.1% 2.0% 30.2%
Ohio 2.3% 0.0% 2.8% 2.3% 12.9%Oklahoma 2.7% 37.2% 3.8% 2.7% 24.0%
Oregon 2.3% 0.0% 7.0% 2.3% 39.7%Pennsylvania 1.8% 0.7% 1.9% 1.7% 6.9%Rhode Island 1.8% 2.0% 2.1% 1.8% 3.5%
South Carolina 2.7% 100.0% 4.8% 2.7% 0.0%South Dakota 2.3% 19.9% 4.4% 2.3% 43.3%
Tennessee 2.4% 5.6% 10.5% 2.4% 47.4%Texas 2.6% 0.3% 4.8% 2.6% 78.8%Utah 2.3% 0.0% 0.0% 2.4% 0.0%
Vermont 2.2% 0.0% 3.7% 2.2% 0.0%Virginia 2.4% 3.2% 6.9% 2.4% 3.3%
Washington 2.1% 9.1% 7.2% 2.1% 34.6%West Virginia 1.8% 5.8% 1.9% 1.9% 4.5%
Wisconsin 2.7% 49.2% 3.1% 2.8% 37.5%Wyoming 1.6% 0.0% 1.6% 1.5% 0.0%
Mean/Average (1) 2.3% 16.5% 5.4% 2.3% 26.4%Median 2.3% 7.5% 3.8% 2.3% 14.6%
High 3.0% 100.0% 15.8% 2.9% 100.0%Low 1.6% 0.0% 0.0% 1.5% 0.0%
Legend: ø = Not applicable * = Officials could not access data = High value = Low value
What are rescissions?Periodically, Congress re-scinds, or cancels, unspent transportation funds from State DOTs. Rescissions are essentially a bookkeeping measure, which allows the USDOT to take long unspent funds off the books. However, some state DOTs have dispro-portionately drained bicycle and walking funding sources to build more highways.
What is at stake for bicycle and pedestrian projects?The USDOT tells states how much money they haveto give back, but state DOTs decide which unspent funds they will send back first. His-torically, some of the strongest programs for bicycle and pedestrian projects—Transpor-tation Enhancements (TE) andCongestion Mitigation & Air Quality (CMAQ)—sufferdramatically higher rescission rates than other programs. For example, TE and CMAQ made up just 7.3 percent of a state DOT’s 2010 transportation ap-portionments, but they made up a much larger share of what a state sends back. In August2010, out of the $2.2 billion rescinded, $968 million (44%) came from CMAQ and TE. (America Bikes 2011).
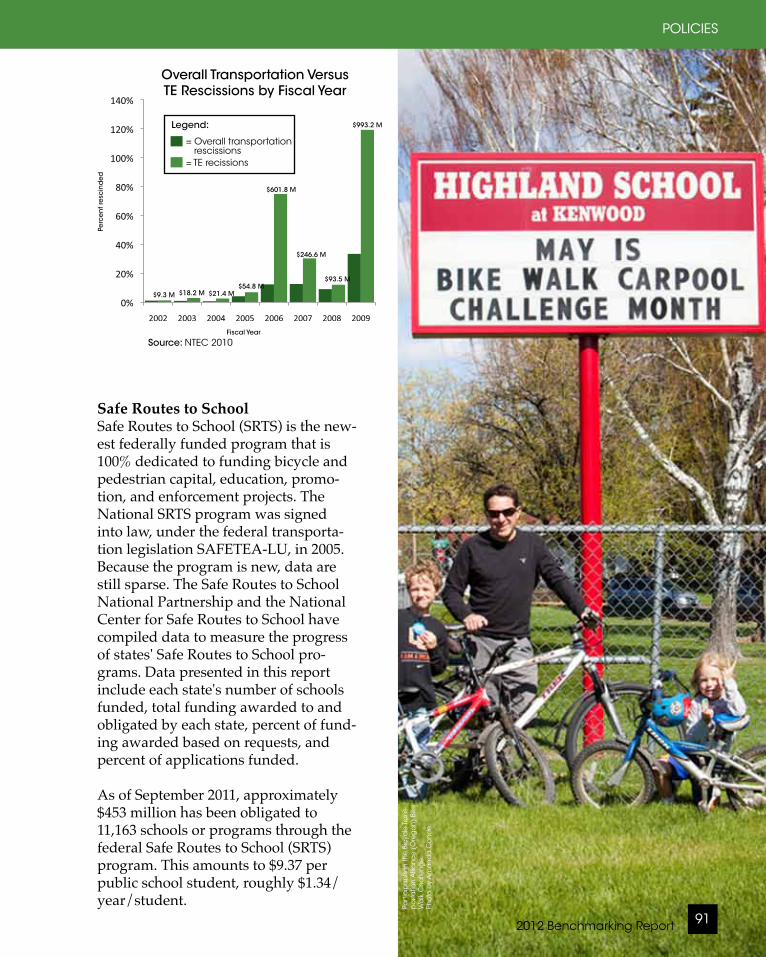
Part
icip
an
ts in
the
Bic
ycle
Tra
ns-
po
rta
tion
Alli
an
ce
(O
reg
on
) Bi
ke
Wa
lk C
ha
llen
ge
. Ph
oto
by
Am
an
da
Co
nd
e.
2012 Benchmarking Report 91
POLICIES
Source: NTEC 2010
% Rescinded Overall % Rescinded from TE%42.1%30.12002%18.2%98.03002%94.2%26.04002%38.6%30.45002
2006 12.31% 74.82%2007 12.50% 30.24%
%30.21%00.980022009 33.36% 119.16%
Overall Transportation Versus TE Rescissions by Fiscal Year
$993.2 M
$93.5 M
$246.6 M
$601.8 M
$54.8 M$21.4 M$18.2 M$9.3 M
Fiscal Year
Perc
en
t re
scin
de
d
Legend: = Overall transportation
rescissions
= TE recissions
Safe Routes to SchoolSafe Routes to School (SRTS) is the new-est federally funded program that is 100% dedicated to funding bicycle and pedestrian capital, education, promo-tion, and enforcement projects. The National SRTS program was signed into law, under the federal transporta-tion legislation SAFETEA-LU, in 2005. Because the program is new, data are still sparse. The Safe Routes to School National Partnership and the National Center for Safe Routes to School have compiled data to measure the progress of states' Safe Routes to School pro-grams. Data presented in this report include each state's number of schools funded, total funding awarded to and obligated by each state, percent of fund-ing awarded based on requests, and percent of applications funded.
As of September 2011, approximately $453 million has been obligated to 11,163 schools or programs through the federal Safe Routes to School (SRTS) program. This amounts to $9.37 per public school student, roughly $1.34/year/student.
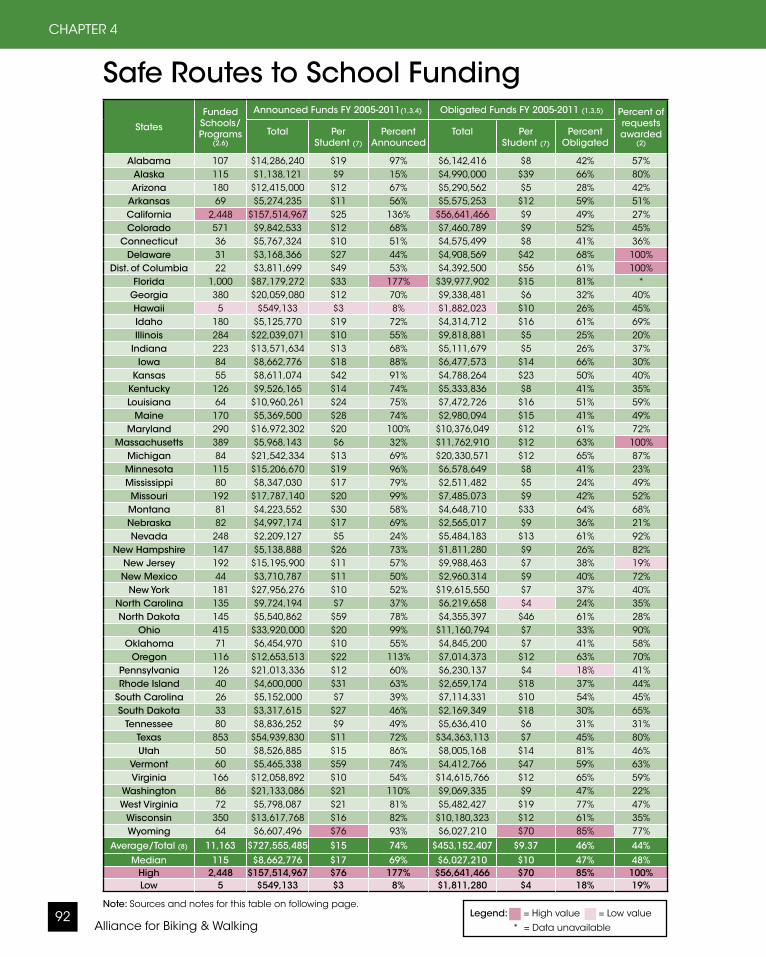
Alliance for Biking & Walking92
CHAPTER 4
States
Funded Schools/Programs
(2,6)
Announced Funds FY 2005-2011(1,3,4) Obligated Funds FY 2005-2011 (1,3,5) Percent of requests awarded
(2)
Total Per Student (7)
Percent Announced
Total Per Student (7)
Percent Obligated
Alabama 107 $14,286,240 $19 97% $6,142,416 $8 42% 57%Alaska 115 $1,138,121 $9 15% $4,990,000 $39 66% 80%Arizona 180 $12,415,000 $12 67% $5,290,562 $5 28% 42%
Arkansas 69 $5,274,235 $11 56% $5,575,253 $12 59% 51%California 2,448 $157,514,967 $25 136% $56,641,466 $9 49% 27%Colorado 571 $9,842,533 $12 68% $7,460,789 $9 52% 45%
Connecticut 36 $5,767,324 $10 51% $4,575,499 $8 41% 36%Delaware 31 $3,168,366 $27 44% $4,908,569 $42 68% 100%
Dist. of Columbia 22 $3,811,699 $49 53% $4,392,500 $56 61% 100%Florida 1,000 $87,179,272 $33 177% $39,977,902 $15 81% *
Georgia 380 $20,059,080 $12 70% $9,338,481 $6 32% 40%Hawaii 5 $549,133 $3 8% $1,882,023 $10 26% 45%Idaho 180 $5,125,770 $19 72% $4,314,712 $16 61% 69%Illinois 284 $22,039,071 $10 55% $9,818,881 $5 25% 20%
Indiana 223 $13,571,634 $13 68% $5,111,679 $5 26% 37%Iowa 84 $8,662,776 $18 88% $6,477,573 $14 66% 30%
Kansas 55 $8,611,074 $42 91% $4,788,264 $23 50% 40%Kentucky 126 $9,526,165 $14 74% $5,333,836 $8 41% 35%Louisiana 64 $10,960,261 $24 75% $7,472,726 $16 51% 59%
Maine 170 $5,369,500 $28 74% $2,980,094 $15 41% 49%Maryland 290 $16,972,302 $20 100% $10,376,049 $12 61% 72%
Massachusetts 389 $5,968,143 $6 32% $11,762,910 $12 63% 100%Michigan 84 $21,542,334 $13 69% $20,330,571 $12 65% 87%Minnesota 115 $15,206,670 $19 96% $6,578,649 $8 41% 23%Mississippi 80 $8,347,030 $17 79% $2,511,482 $5 24% 49%Missouri 192 $17,787,140 $20 99% $7,485,073 $9 42% 52%Montana 81 $4,223,552 $30 58% $4,648,710 $33 64% 68%Nebraska 82 $4,997,174 $17 69% $2,565,017 $9 36% 21%Nevada 248 $2,209,127 $5 24% $5,484,183 $13 61% 92%
New Hampshire 147 $5,138,888 $26 73% $1,811,280 $9 26% 82%New Jersey 192 $15,195,900 $11 57% $9,988,463 $7 38% 19%New Mexico 44 $3,710,787 $11 50% $2,960,314 $9 40% 72%
New York 181 $27,956,276 $10 52% $19,615,550 $7 37% 40%North Carolina 135 $9,724,194 $7 37% $6,219,658 $4 24% 35%North Dakota 145 $5,540,862 $59 78% $4,355,397 $46 61% 28%
Ohio 415 $33,920,000 $20 99% $11,160,794 $7 33% 90%Oklahoma 71 $6,454,970 $10 55% $4,845,200 $7 41% 58%
Oregon 116 $12,653,513 $22 113% $7,014,373 $12 63% 70%Pennsylvania 126 $21,013,336 $12 60% $6,230,137 $4 18% 41%Rhode Island 40 $4,600,000 $31 63% $2,659,174 $18 37% 44%
South Carolina 26 $5,152,000 $7 39% $7,114,331 $10 54% 45%South Dakota 33 $3,317,615 $27 46% $2,169,349 $18 30% 65%
Tennessee 80 $8,836,252 $9 49% $5,636,410 $6 31% 31%Texas 853 $54,939,830 $11 72% $34,363,113 $7 45% 80%Utah 50 $8,526,885 $15 86% $8,005,168 $14 81% 46%
Vermont 60 $5,465,338 $59 74% $4,412,766 $47 59% 63%Virginia 166 $12,058,892 $10 54% $14,615,766 $12 65% 59%
Washington 86 $21,133,086 $21 110% $9,069,335 $9 47% 22%West Virginia 72 $5,798,087 $21 81% $5,482,427 $19 77% 47%
Wisconsin 350 $13,617,768 $16 82% $10,180,323 $12 61% 35%Wyoming 64 $6,607,496 $76 93% $6,027,210 $70 85% 77%
Average/Total (8) 11,163 $727,555,485 $15 74% $453,152,407 $9.37 46% 44%
Median 115 $8,662,776 $17 69% $6,027,210 $10 47% 48%High 2,448 $157,514,967 $76 177% $56,641,466 $70 85% 100%Low 5 $549,133 $3 8% $1,811,280 $4 18% 19%
Safe Routes to School Funding
Note: Sources and notes for this table on following page.Legend: = High value = Low value * = Data unavailable
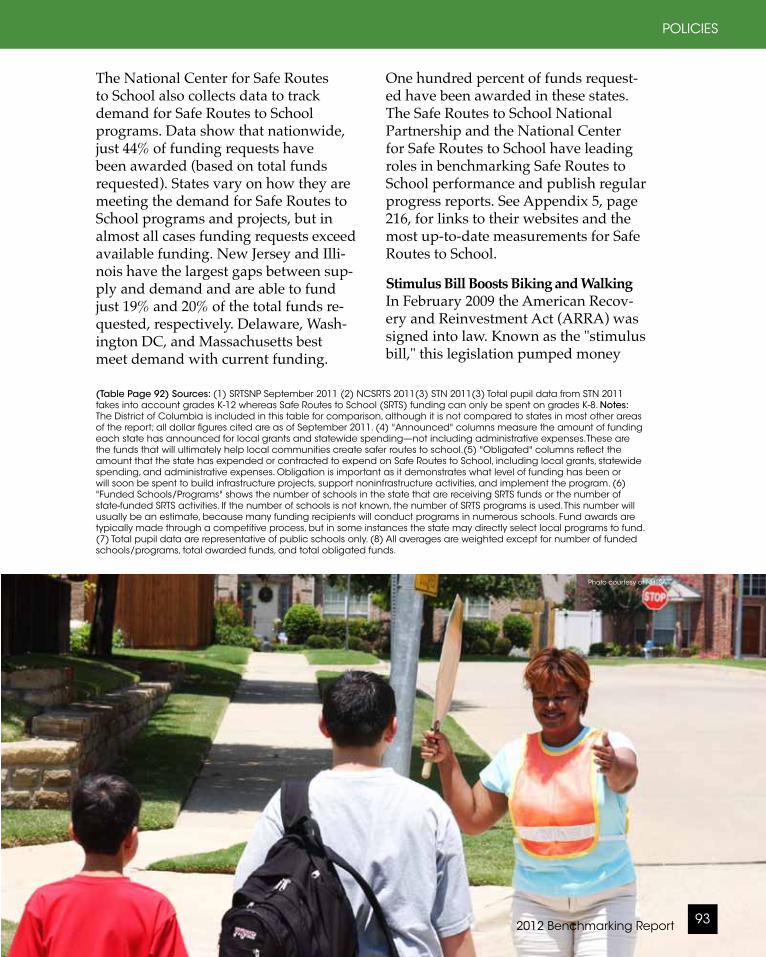
(Table Page 92) Sources: (1) SRTSNP September 2011 (2) NCSRTS 2011(3) STN 2011(3) Total pupil data from STN 2011 takes into account grades K-12 whereas Safe Routes to School (SRTS) funding can only be spent on grades K-8. Notes: The District of Columbia is included in this table for comparison, although it is not compared to states in most other areas of the report; all dollar figures cited are as of September 2011. (4) "Announced" columns measure the amount of funding each state has announced for local grants and statewide spending—not including administrative expenses.These are the funds that will ultimately help local communities create safer routes to school.(5) "Obligated" columns reflect the amount that the state has expended or contracted to expend on Safe Routes to School, including local grants, statewide spending, and administrative expenses. Obligation is important as it demonstrates what level of funding has been or will soon be spent to build infrastructure projects, support noninfrastructure activities, and implement the program. (6) "Funded Schools/Programs" shows the number of schools in the state that are receiving SRTS funds or the number of state-funded SRTS activities. If the number of schools is not known, the number of SRTS programs is used. This number will usually be an estimate, because many funding recipients will conduct programs in numerous schools. Fund awards are typically made through a competitive process, but in some instances the state may directly select local programs to fund. (7) Total pupil data are representative of public schools only. (8) All averages are weighted except for number of funded schools/programs, total awarded funds, and total obligated funds.
Photo courtesy of NHTSA
2012 Benchmarking Report 93
POLICIES
The National Center for Safe Routes to School also collects data to track demand for Safe Routes to School programs. Data show that nationwide, just 44% of funding requests have been awarded (based on total funds requested). States vary on how they are meeting the demand for Safe Routes to School programs and projects, but in almost all cases funding requests exceed available funding. New Jersey and Illi-nois have the largest gaps between sup-ply and demand and are able to fund just 19% and 20% of the total funds re-quested, respectively. Delaware, Wash-ington DC, and Massachusetts best meet demand with current funding.
One hundred percent of funds request-ed have been awarded in these states. The Safe Routes to School National Partnership and the National Center for Safe Routes to School have leading roles in benchmarking Safe Routes to School performance and publish regular progress reports. See Appendix 5, page 216, for links to their websites and the most up-to-date measurements for Safe Routes to School.
Stimulus Bill Boosts Biking and WalkingIn February 2009 the American Recov-ery and Reinvestment Act (ARRA) was signed into law. Known as the "stimulus bill," this legislation pumped money
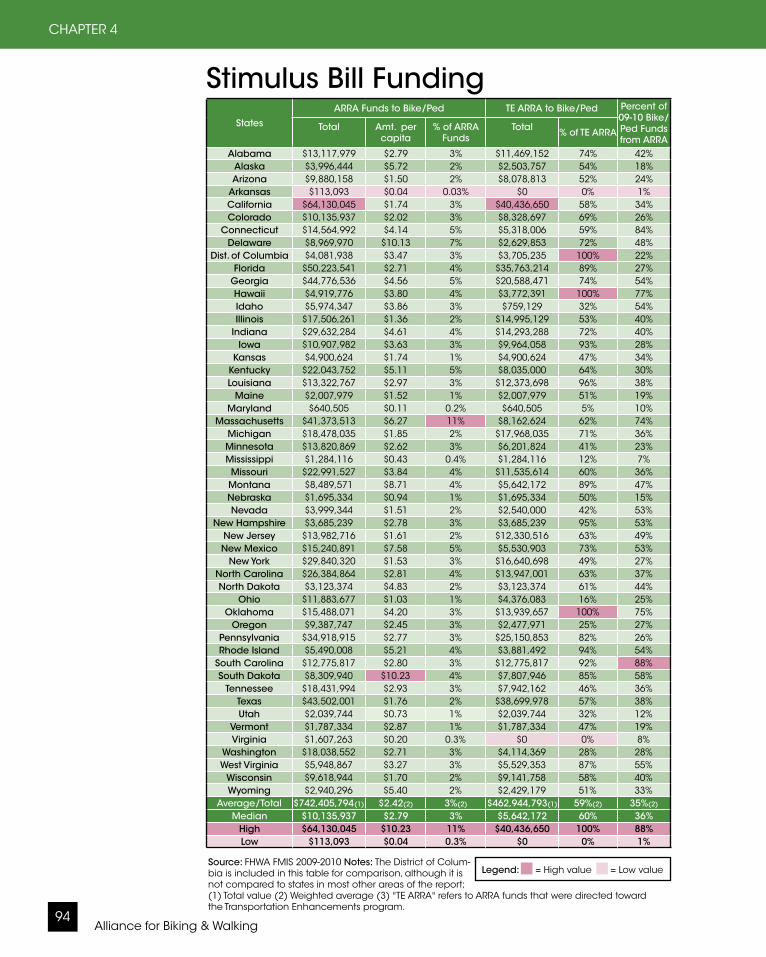
Alliance for Biking & Walking94
CHAPTER 4
States
ARRA Funds to Bike/Ped TE ARRA to Bike/Ped Percent of 09-10 Bike/Ped Funds from ARRA
Total Amt. per capita
% of ARRA Funds
Total % of TE ARRA
Alabama $13,117,979 $2.79 3% $11,469,152 74% 42%Alaska $3,996,444 $5.72 2% $2,503,757 54% 18%Arizona $9,880,158 $1.50 2% $8,078,813 52% 24%
Arkansas $113,093 $0.04 0.03% $0 0% 1%California $64,130,045 $1.74 3% $40,436,650 58% 34%Colorado $10,135,937 $2.02 3% $8,328,697 69% 26%
Connecticut $14,564,992 $4.14 5% $5,318,006 59% 84%Delaware $8,969,970 $10.13 7% $2,629,853 72% 48%
Dist. of Columbia $4,081,938 $3.47 3% $3,705,235 100% 22%Florida $50,223,541 $2.71 4% $35,763,214 89% 27%
Georgia $44,776,536 $4.56 5% $20,588,471 74% 54%Hawaii $4,919,776 $3.80 4% $3,772,391 100% 77%Idaho $5,974,347 $3.86 3% $759,129 32% 54%Illinois $17,506,261 $1.36 2% $14,995,129 53% 40%
Indiana $29,632,284 $4.61 4% $14,293,288 72% 40%Iowa $10,907,982 $3.63 3% $9,964,058 93% 28%
Kansas $4,900,624 $1.74 1% $4,900,624 47% 34%Kentucky $22,043,752 $5.11 5% $8,035,000 64% 30%Louisiana $13,322,767 $2.97 3% $12,373,698 96% 38%
Maine $2,007,979 $1.52 1% $2,007,979 51% 19%Maryland $640,505 $0.11 0.2% $640,505 5% 10%
Massachusetts $41,373,513 $6.27 11% $8,162,624 62% 74%Michigan $18,478,035 $1.85 2% $17,968,035 71% 36%Minnesota $13,820,869 $2.62 3% $6,201,824 41% 23%Mississippi $1,284,116 $0.43 0.4% $1,284,116 12% 7%Missouri $22,991,527 $3.84 4% $11,535,614 60% 36%Montana $8,489,571 $8.71 4% $5,642,172 89% 47%Nebraska $1,695,334 $0.94 1% $1,695,334 50% 15%Nevada $3,999,344 $1.51 2% $2,540,000 42% 53%
New Hampshire $3,685,239 $2.78 3% $3,685,239 95% 53%New Jersey $13,982,716 $1.61 2% $12,330,516 63% 49%New Mexico $15,240,891 $7.58 5% $5,530,903 73% 53%
New York $29,840,320 $1.53 3% $16,640,698 49% 27%North Carolina $26,384,864 $2.81 4% $13,947,001 63% 37%North Dakota $3,123,374 $4.83 2% $3,123,374 61% 44%
Ohio $11,883,677 $1.03 1% $4,376,083 16% 25%Oklahoma $15,488,071 $4.20 3% $13,939,657 100% 75%
Oregon $9,387,747 $2.45 3% $2,477,971 25% 27%Pennsylvania $34,918,915 $2.77 3% $25,150,853 82% 26%Rhode Island $5,490,008 $5.21 4% $3,881,492 94% 54%
South Carolina $12,775,817 $2.80 3% $12,775,817 92% 88%South Dakota $8,309,940 $10.23 4% $7,807,946 85% 58%
Tennessee $18,431,994 $2.93 3% $7,942,162 46% 36%Texas $43,502,001 $1.76 2% $38,699,978 57% 38%Utah $2,039,744 $0.73 1% $2,039,744 32% 12%
Vermont $1,787,334 $2.87 1% $1,787,334 47% 19%Virginia $1,607,263 $0.20 0.3% $0 0% 8%
Washington $18,038,552 $2.71 3% $4,114,369 28% 28%West Virginia $5,948,867 $3.27 3% $5,529,353 87% 55%
Wisconsin $9,618,944 $1.70 2% $9,141,758 58% 40%Wyoming $2,940,296 $5.40 2% $2,429,179 51% 33%
Average/Total $742,405,794(1) $2.42(2) 3%(2) $462,944,793(1) 59%(2) 35%(2)
Median $10,135,937 $2.79 3% $5,642,172 60% 36%High $64,130,045 $10.23 11% $40,436,650 100% 88%Low $113,093 $0.04 0.3% $0 0% 1%
Stimulus Bill Funding
Source: FHWA FMIS 2009-2010 Notes: The District of Colum-bia is included in this table for comparison, although it is not compared to states in most other areas of the report; (1) Total value (2) Weighted average (3) "TE ARRA" refers to ARRA funds that were directed toward the Transportation Enhancements program.
Legend: = High value = Low value
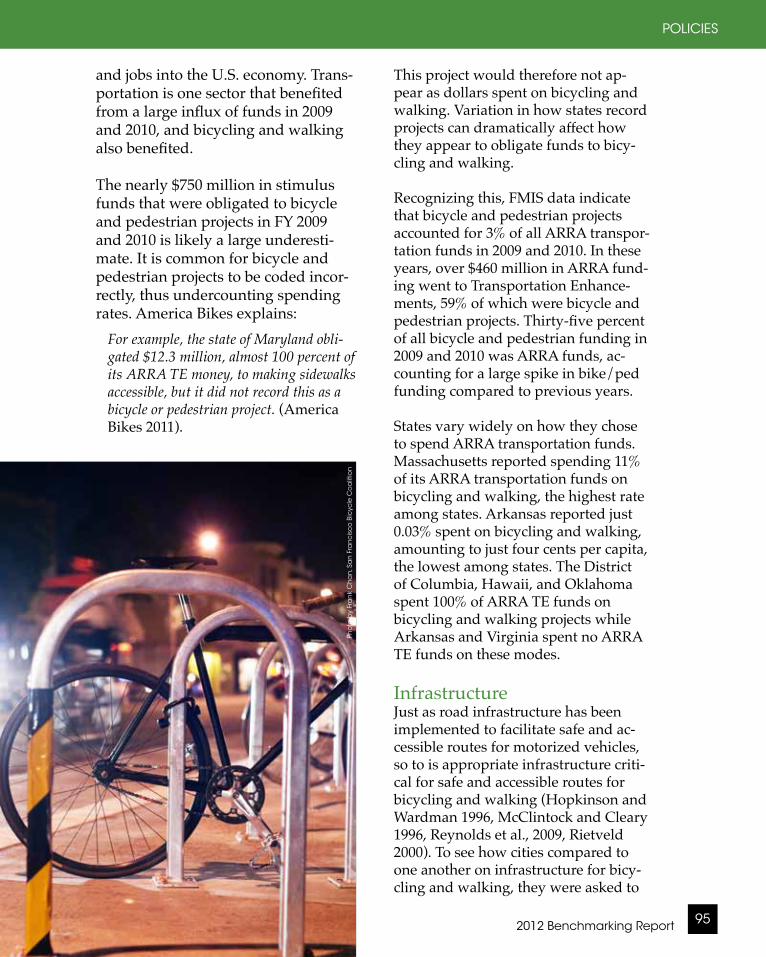
2012 Benchmarking Report 95
POLICIES
and jobs into the U.S. economy. Trans-portation is one sector that benefited from a large influx of funds in 2009 and 2010, and bicycling and walking also benefited.
The nearly $750 million in stimulus funds that were obligated to bicycle and pedestrian projects in FY 2009 and 2010 is likely a large underesti-mate. It is common for bicycle and pedestrian projects to be coded incor-rectly, thus undercounting spending rates. America Bikes explains:
For example, the state of Maryland obli-gated $12.3 million, almost 100 percent of its ARRA TE money, to making sidewalks accessible, but it did not record this as a bicycle or pedestrian project. (America Bikes 2011).
This project would therefore not ap-pear as dollars spent on bicycling and walking. Variation in how states record projects can dramatically affect how they appear to obligate funds to bicy-cling and walking.
Recognizing this, FMIS data indicate that bicycle and pedestrian projects accounted for 3% of all ARRA transpor-tation funds in 2009 and 2010. In these years, over $460 million in ARRA fund-ing went to Transportation Enhance-ments, 59% of which were bicycle and pedestrian projects. Thirty-five percent of all bicycle and pedestrian funding in 2009 and 2010 was ARRA funds, ac-counting for a large spike in bike/ped funding compared to previous years.
States vary widely on how they chose to spend ARRA transportation funds. Massachusetts reported spending 11% of its ARRA transportation funds on bicycling and walking, the highest rate among states. Arkansas reported just 0.03% spent on bicycling and walking, amounting to just four cents per capita, the lowest among states. The District of Columbia, Hawaii, and Oklahoma spent 100% of ARRA TE funds on bicycling and walking projects while Arkansas and Virginia spent no ARRA TE funds on these modes.
InfrastructureJust as road infrastructure has been implemented to facilitate safe and ac-cessible routes for motorized vehicles, so to is appropriate infrastructure criti-cal for safe and accessible routes for bicycling and walking (Hopkinson and Wardman 1996, McClintock and Cleary 1996, Reynolds et al., 2009, Rietveld 2000). To see how cities compared to one another on infrastructure for bicy-cling and walking, they were asked to
Pho
to b
y Fr
an
k C
ha
n, S
an
Fra
nc
isc
o B
icyc
le C
oa
litio
n
Stimulus Bill Funding
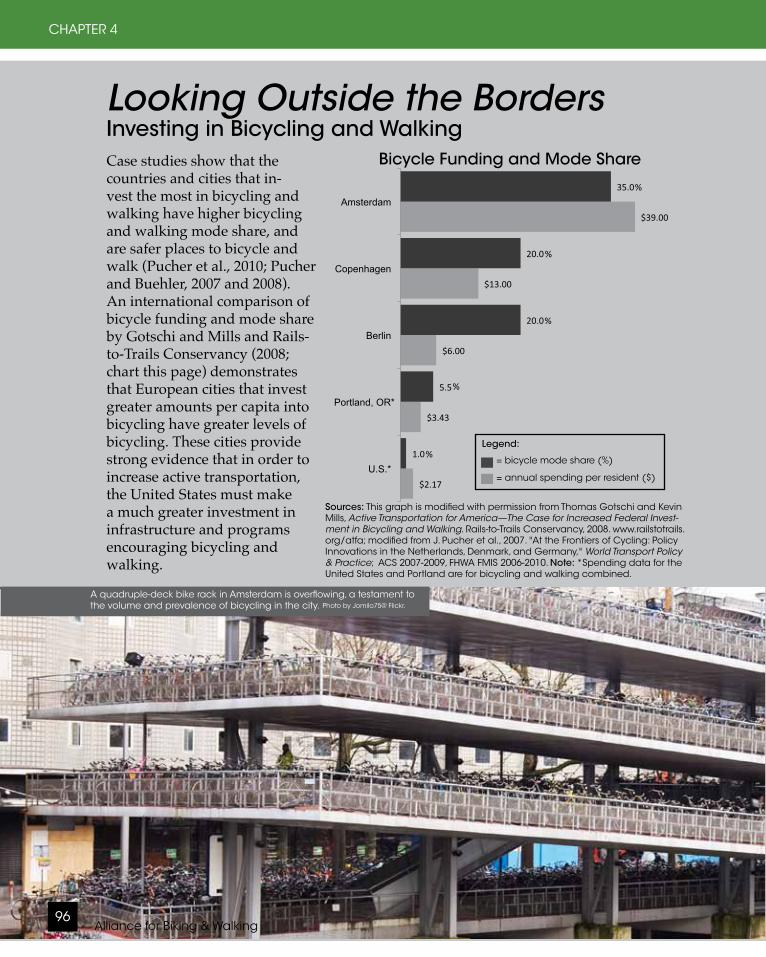
Looking Outside the BordersInvesting in Bicycling and Walking
Alliance for Biking & Walking96
CHAPTER 4
Case studies show that the countries and cities that in-vest the most in bicycling and walking have higher bicycling and walking mode share, and are safer places to bicycle and walk (Pucher et al., 2010; Pucher and Buehler, 2007 and 2008). An international comparison of bicycle funding and mode share by Gotschi and Mills and Rails-to-Trails Conservancy (2008; chart this page) demonstrates that European cities that invest greater amounts per capita into bicycling have greater levels of bicycling. These cities provide strong evidence that in order to increase active transportation, the United States must make a much greater investment in infrastructure and programs encouraging bicycling and walking.
Bicycle Funding and Mode Share
Sources: This graph is modified with permission from Thomas Gotschi and Kevin Mills, ActiveTransportationforAmerica—TheCaseforIncreasedFederalInvest-mentinBicyclingandWalking. Rails-to-Trails Conservancy, 2008. www.railstotrails.org/atfa; modified from J. Pucher et al., 2007. "At the Frontiers of Cycling: Policy Innovations in the Netherlands, Denmark, and Germany," WorldTransportPolicy&Practice; ACS 2007-2009, FHWA FMIS 2006-2010. Note: *Spending data for the United States and Portland are for bicycling and walking combined.
U.S.* $2.17 1.0Portland* $3.43 5.5Berlin $6.00 20.0Copenhagen $13.00 20.0Amsterdam $39.00 35.0
%
%
%
%
%
U.S.*
Portland, OR*
Berlin
Copenhagen
Amsterdam
Legend: = bicycle mode share (%)
= annual spending per resident ($)
A quadruple-deck bike rack in Amsterdam is overflowing, a testament to the volume and prevalence of bicycling in the city. Photo by Jomilo75@ Flickr.

2012 Benchmarking Report 97
POLICIES
report on miles of existing and planned facilities including on-street striped bike lanes, multi-use paths, and signed bicycle routes. Cities averaged 1.8 miles of bicycle facilities (bike lanes, multi-use paths, and signed bicycle routes combined) per square mile. On the high end of the range is San Francisco, with 5.6 miles of bicycle facilities per square mile. Austin and Long Beach rank sec-ond and third, with 4.5 miles of facili-ties per square mile.
Cities average 19.2 miles of sidewalk per square mile. New York reported having 12,750 miles of sidewalk, more than any other city. Baltimore has the densest sidewalk network with 44.4 miles of sidewalk per square mile.
Cities were also asked to report on miles of planned bicycle and pedestrian facilities. Cities who responded report-ed that 20,908 miles of bicycle facilities and 7,079 miles of pedestrian facilities are planned for the coming years. New York has more planned bicycle facilities than any other cities (1,800 miles). Aus-tin has 3,500 planned miles of pedes-trian facilities, more than any other city (see chart page 99).
Innovative Facilities for Bicycling and WalkingA century of planning roads for cars means that planning for bicyclists, pedestrians, and other users will often require innovative designs and treat-ments to retrofit existing infrastructure. For the 2012 Benchmarking Report, the Alliance asked cities which, if any, of five innovative treatments they have used or adopted. (For data on innova-tive facilities, see page 104; for defini-tions of these facilities, see page 105.)
Shared lane markings, also called "shar-rows," are the most common innovative treatment in use today. Thirty-seven cities report that they have used shared lane markings, up 95% from 19 cities two years ago. Ten cities report that they have implemented bicycle bou-levards (up from five 2 years ago). Six more cities reported bicycle boulevards are currently under development or have been proposed. Nine cities have implemented bicycle traffic lights. Six-teen cities have used colored bike lane (Continued page 103)
Pho
to b
y Fr
an
k C
Ha
n, S
an
Fra
nc
isc
o B
icyc
le C
oa
litio
n
Bicycle Funding and Mode Share

Alliance for Biking & Walking98
CHAPTER 4
Existing Bicycle Facilities in Major U.S. Cities
Source: City surveys 2010/2011 Note: (1) Cleveland, Detroit, and Indianapolis data are from 2009 because no 2011 data were supplied.
Cities average 1.8 miles of
bicycle facilities per square mile.
San Francisco and Austin have the most miles of bi-cycle facilities per square mile among the largest U.S. cities. Fresno, Tucson, and Philadelphia rank highest for miles of bike lanes per square mile. Indianapolis, Oklahoma City, and Detroit have the fewest miles of bicycle facilities per square mile.
Legend:
= Miles of bike lanes per square mile
= Miles of multi-use paths per square mile
= Miles of signed bicycle routes per square mile
citi
es
miles of facilities per square mile

2012 Benchmarking Report 99
POLICIES
Bike/Ped Infrastructure in Cities
Source: City surveys 2010/2011, Census 2010 Notes: A survey response of "na" was taken to mean "0" for this table. (1) Weighted average. (2) Bicycle lane miles count both directions when bike lanes are on both sides of two-lane street. (3) Planned facilities includes only miles of new facilities and does not represent a combined value of existing and planned facilities. (4) Did not provide these data for 2010/2011 survey; value represents miles as of 2008/2009 Benchmarking survey. (5) Open-ended.
City
Current miles of bicycle facilities
Miles of sidewalk Planned facilities(3) City adopted goal
On-street bike
lanes(2)
Multi-use
paths
Signed bicycle routes
Total/sq.
mileTotal Total/
sq. mileBicycle (miles)
Over how many years?
Ped. (miles)
Over how many years?
To increase bicycle facilities
To increase ped.
facilitiesAlbuquerque 372 177 137 3.7 * * * 25 * * Arlington, TX 1 47 1 0.5 1,100 11.5 272 20 145 20
Atlanta 19 29 37 0.6 2,160 16.2 250 25 900 25Austin 168 194 983 4.5 2,144 7.2 1,100 19 3,500 (5)
Baltimore 32 37 20.5 1.1 3,600 44.4 150 10 0 ø Boston 63 30.3 0 1.9 * * 150 8 0 ø
Charlotte 111 39 40 0.6 1,927 6.5 783 25 650 25 Chicago 115 50 241 1.8 * * 650 * * *
Cleveland 7(4) 31(4) 13(4) 0.7 * * * * * * * *Colorado Springs 75 110 * 1.0 2,304 11.8 15 25 * *
Columbus 20 65 39.4 0.6 2,081 9.6 536 17 50 5 Dallas 0 115 1,128 3.7 4,750 13.9 1,296 10 340 10 Denver 71 85 258 2.7 2,700 17.6 162 * 54 * Detroit 13.8(4) 25(4) 0(4) 0.4 * * * * * * * *El Paso 56 14 * 0.3 * * 250 15 100 15
Fort Worth 37.6 57.3 44 0.3 * * 480.3 25 0 ø Fresno 350 17 7 3.3 1,870 16.7 905 75 * *
Honolulu 89 47 37 2.8 * * 568 20 * * Houston 206 173 156 0.9 * * 43 5 * *
Indianapolis 59(4) 20(4) * 0.2 * * * * * * * *Jacksonville 320 60 * 0.5 4,350 5.8 100.8 * 68.4 *
Kansas City, MO 55.4 42 205 1.0 2,192 7.0 600 15 * * Las Vegas 113 51 4 1.2 * * 331 25 143 25
Long Beach 94 77 54 4.5 1,587 31.7 * 10 * * Los Angeles 167 58 125 0.8 10,750 22.9 1,680 35 * *
Louisville 53.7 24.3 89.8 0.5 2,500 7.7 550 20 20 20 Memphis 15 24 75 0.4 3,588 11.4 600 10 * 10
Mesa 354 46 140 3.9 4,370 31.9 20 5 8 5 Miami 24.6 14.0 0 1.1 1,050 29.2 276.4 20 30.2 20
Milwaukee 104.9 3.1 65.5 1.8 3,000 31.3 393.8 10 * * Minneapolis 72 84 12 3.1 2,000 37.0 275 30 108 50
Nashville 64 46 69 0.4 1,066 2.2 858 15 607 15 New Orleans 16 13 31 0.4 2,650 15.7 1,002 20 * 20
New York 407 328 * 2.4 12,750 42.1 1,800 20 * * Oakland 58.2 16.8 55 2.3 1,120 20.0 221.8 20 * 20
Oklahoma City 6.6 64.7 76.8 0.2 * * 409 8 * * Omaha 9 100 9 0.9 * * 31 2 * *
Philadelphia 431 82 45.4 4.2 4,500 33.6 * * * * Phoenix 371 274 124 1.5 * * 0 ø 0 ø
Portland, OR 183 75 60 2.4 * * 962 20 * * Raleigh 15 80 101 1.4 1,150 8.0 447 20 38 25
Sacramento 237 81 43 3.7 * * 272 * * 15 San Antonio 236 44 39 0.7 7,840 17.0 45 1 0 ø San Diego 325.5 72.3 112.9 1.6 * * 549.5 * * *
San Francisco 100 23 140 5.6 * * 33 1 * * San Jose 400 54 20 2.7 * * 500 10 * * Seattle 55 45.7 131 2.8 * * 454.7 10 * 6 Tucson 620 75 90 3.5 * * 157 30 25 15 Tulsa 8.6 113.1 82.6 1.0 * * 270.2 5 270.2 5
Virginia Beach 18.3 74.7 75 0.7 * * 328 10 2.3 10 Washington, DC 77 64 65 3.4 1,600 26.2 130 5 20 10 Mean/Average 135 70 115 1.8(1) 3,311 19.2(1) 460 17 283 17 Yes Yes
Median 72 54 63 1.2 2,248 16.5 331 17 50 15 Yes YesHigh 620 328 1,128 5.6 12,750 44.4 1,800 75 3,500 50 ø øLow 0 3.1 0 0.2 1,050 2.2 0 1 0 5 ø ø
Legend: = High value = Low value
ø = Not applicable * = Officials could not access data
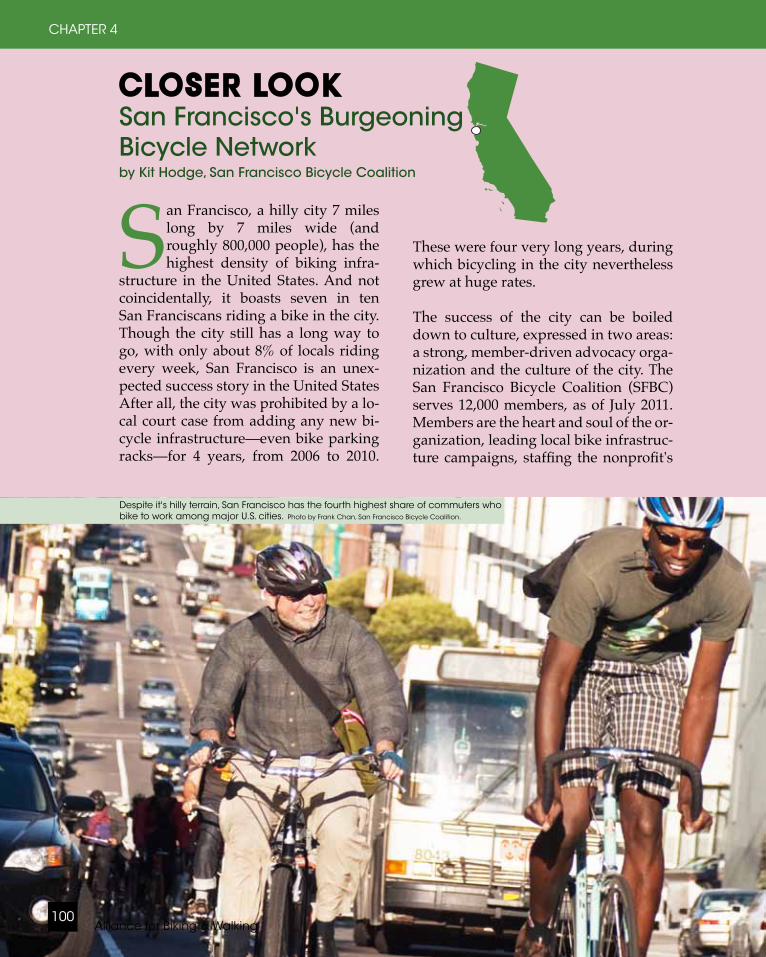
San Francisco, a hilly city 7 miles long by 7 miles wide (and roughly 800,000 people), has the highest density of biking infra-
structure in the United States. And not coincidentally, it boasts seven in ten San Franciscans riding a bike in the city. Though the city still has a long way to go, with only about 8% of locals riding every week, San Francisco is an unex-pected success story in the United States After all, the city was prohibited by a lo-cal court case from adding any new bi-cycle infrastructure—even bike parking racks—for 4 years, from 2006 to 2010.
CLOSER LOOKSan Francisco's Burgeoning Bicycle Networkby Kit Hodge, San Francisco Bicycle Coalition
These were four very long years, during which bicycling in the city nevertheless grew at huge rates.
The success of the city can be boiled down to culture, expressed in two areas: a strong, member-driven advocacy orga-nization and the culture of the city. The San Francisco Bicycle Coalition (SFBC)serves 12,000 members, as of July 2011. Members are the heart and soul of the or-ganization, leading local bike infrastruc-ture campaigns, staffing the nonprofit's
Alliance for Biking & Walking100
CHAPTER 4
Despite it's hilly terrain, San Francisco has the fourth highest share of commuters who bike to work among major U.S. cities. Photo by Frank Chan, San Francisco Bicycle Coalition.
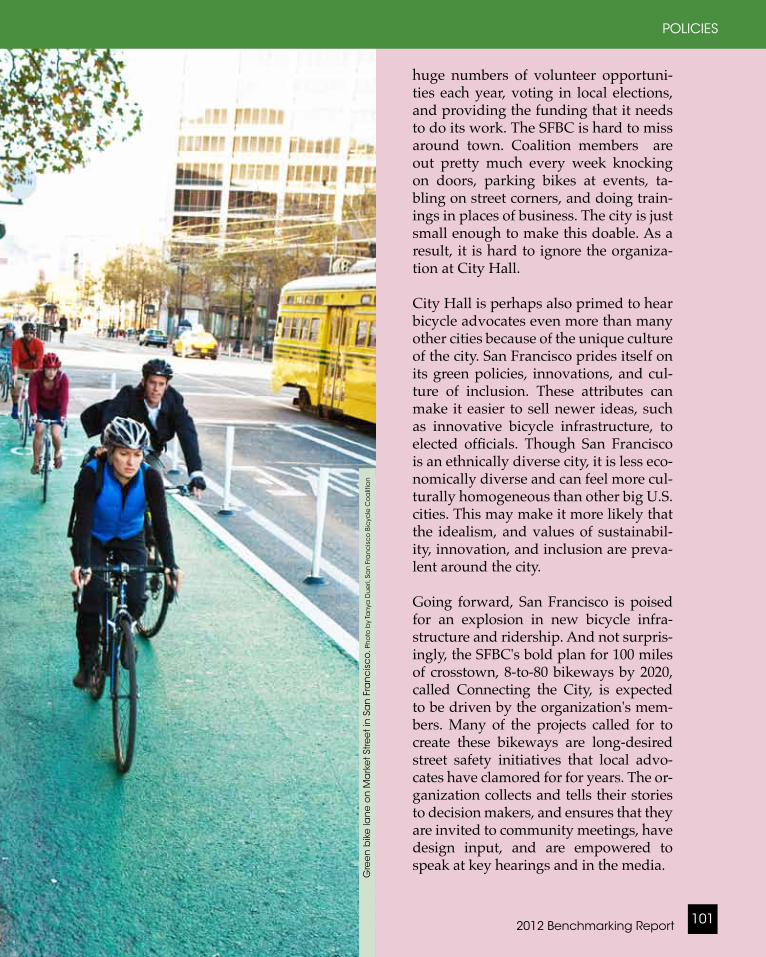
huge numbers of volunteer opportuni-ties each year, voting in local elections, and providing the funding that it needs to do its work. The SFBC is hard to miss around town. Coalition members are out pretty much every week knocking on doors, parking bikes at events, ta-bling on street corners, and doing train-ings in places of business. The city is just small enough to make this doable. As a result, it is hard to ignore the organiza-tion at City Hall.
City Hall is perhaps also primed to hear bicycle advocates even more than many other cities because of the unique culture of the city. San Francisco prides itself on its green policies, innovations, and cul-ture of inclusion. These attributes can make it easier to sell newer ideas, such as innovative bicycle infrastructure, to elected officials. Though San Francisco is an ethnically diverse city, it is less eco-nomically diverse and can feel more cul-turally homogeneous than other big U.S. cities. This may make it more likely that the idealism, and values of sustainabil-ity, innovation, and inclusion are preva-lent around the city.
Going forward, San Francisco is poised for an explosion in new bicycle infra-structure and ridership. And not surpris-ingly, the SFBC's bold plan for 100 miles of crosstown, 8-to-80 bikeways by 2020, called Connecting the City, is expected to be driven by the organization's mem-bers. Many of the projects called for to create these bikeways are long-desired street safety initiatives that local advo-cates have clamored for for years. The or-ganization collects and tells their stories to decision makers, and ensures that they are invited to community meetings, have design input, and are empowered to speak at key hearings and in the media.
2012 Benchmarking Report 101
POLICIES
Gre
en
bik
e la
ne
on
Ma
rke
t Stre
et i
n S
an
Fra
nc
isc
o. P
ho
to b
y Ta
nya
Du
eri,
Sa
n F
ran
cis
co
Bic
ycle
Co
alit
ion
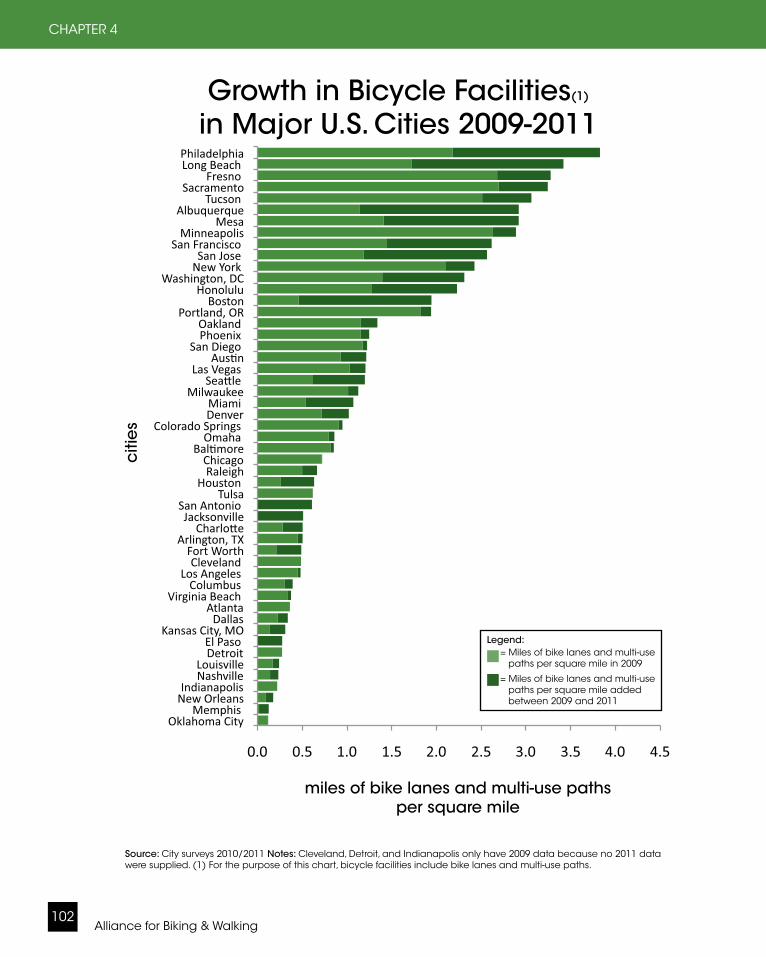
Alliance for Biking & Walking102
CHAPTER 4
Legend: = Miles of bike lanes and multi-use paths per square mile in 2009 = Miles of bike lanes and multi-use paths per square mile added between 2009 and 2011
citi
es
miles of bike lanes and multi-use paths per square mile
Growth in Bicycle Facilities(1) in Major U.S. Cities 2009-2011
Source: City surveys 2010/2011 Notes: Cleveland, Detroit, and Indianapolis only have 2009 data because no 2011 data were supplied. (1) For the purpose of this chart, bicycle facilities include bike lanes and multi-use paths.
2012 Benchmarking Report 103
POLICIES
treatments, up 100% from eight cities as of the 2010 Benchmarking Report. Eight cities report implementing home zones, or woonerfs (only San Jose previously reported experimenting with home zones).
New to the 2012 Benchmarking Report, cities were also asked about additional innovative treatments including bike boxes, cycle tracks, and contra flow bike lanes. Twenty cities report having installed bike boxes, or advanced stop lines, which prioritize cyclists at red lights. Eleven cities have installed cycle tracks and ten cities have contra flow bike lanes.
Portland has used more innovative treatments than any other major U.S. city having implemented every innova-tion surveyed. San Francisco is close behind only lacking bicycle boulevard implementation. Long Beach, Minne-apolis, New York, and Seattle also lead for innovative facilities with six of eight innovative facilities surveyed.
U.S. Bicycle Route SystemAlso new to the 2012 Benchmarking Report are data about state involvement with the U.S. Bicycle Route System. The U.S. Bicycle Route System (USBRS) is a proposed national network of bicycle routes. These routes link urban, subur-ban, and rural areas with appropriate bicycle friendly routes including trails, bike paths, roads with shoulders, and low-traffic routes. For a route to be designated as part of the USBRS it must either connect two or more states, a state and an international border, or one or more U.S. Bicycle Routes.
The first two U.S. Bicycle Routes were designated in 1982 and then no ad-
ditional routes were nominated. In 2003 the American Association of State Highway and Transportation Officials (AASHTO) revived the USBRS with an official task force. An inventory of exist-ing bicycle routes (see map on page 106) throughout the United States was cre-ated as a first step in drafting a national bicycle network plan. In 2008, AASHTO passed a resolution in support of the National Corridor Plan. An application for route designation was completed in May 2009 (Adventure Cycling Associa-tion, 2009).
According to data from Adventure Cy-cling Association, 34 states have an ac-tive USBRS program. Thirty-one states have identified potential USBRs in state or local bicycle plans. Routes have been officially designated as part of the USBRS in nine states, and three states have posted and signed USBRs.
Bike-Transit IntegrationThe last bicycling provision measured was bike-transit integration. This report sought to measure how well cities provide for bicyclists on transit. While most cities are successfully integrating bicycles with buses, many fall behind in regard to providing parking for bicy-clists at transit (Pucher and Buehler 2009). Almost all cities surveyed have 100% of their city bus fleet equipped with bicycle racks. When it comes to bicycle parking, cities report that only 27% of transit stops have bike parking on average. According to the Ameri-can Public Transportation Association, this amounts to just 2.5 bicycle parking spaces at bus stops per 10,000 residents (APTA 2011).
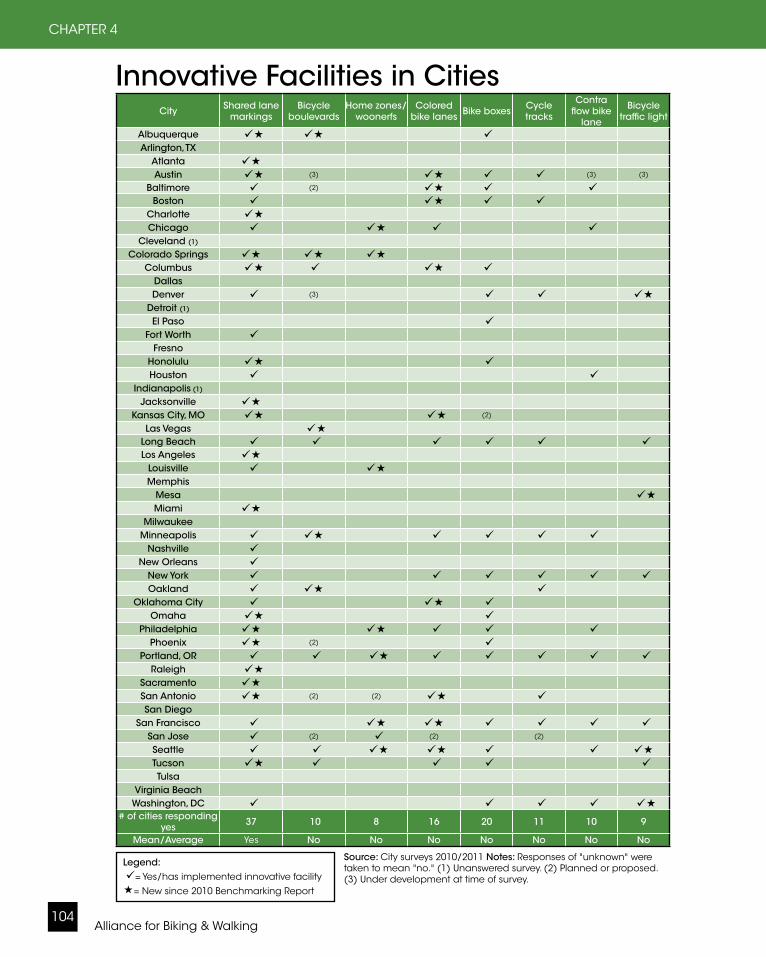
Alliance for Biking & Walking104
CHAPTER 4
City Shared lane markings
Bicycle boulevards
Home zones/woonerfs
Colored bike lanes Bike boxes Cycle
tracks
Contra flow bike
lane
Bicycle traffic light
Albuquerque Arlington, TX
Atlanta Austin (3) (3) (3)
Baltimore (2) Boston
Charlotte Chicago
Cleveland (1)
Colorado Springs Columbus
DallasDenver (3)
Detroit (1)
El Paso Fort Worth
Fresno Honolulu Houston
Indianapolis (1)
Jacksonville Kansas City, MO (2)
Las Vegas Long Beach Los Angeles
Louisville Memphis
Mesa Miami
MilwaukeeMinneapolis
Nashville New Orleans
New York Oakland
Oklahoma City Omaha
Philadelphia Phoenix (2)
Portland, OR Raleigh
Sacramento San Antonio (2) (2) San Diego
San Francisco San Jose (2) (2) (2)
Seattle Tucson Tulsa
Virginia Beach Washington, DC
# of cities responding yes 37 10 8 16 20 11 10 9
Mean/Average Yes No No No No No No No
Innovative Facilities in Cities
Source: City surveys 2010/2011 Notes: Responses of "unknown" were taken to mean "no." (1) Unanswered survey. (2) Planned or proposed. (3) Under development at time of survey.
Legend: = Yes/has implemented innovative facility= New since 2010 Benchmarking Report

2012 Benchmarking Report 105
POLICIES
Shared lane mark-ings—Often called “sharrows,” these are markings which resemble a bicycle and an arrow paint-ed on a roadway to indicate the direction of travel for bicycles as well as motorized vehicles.
Bicycle boulevards—A shared roadway which is intended to give priority to bicyclists by opti-mizing it for bicycle traffic (through traffic calming) and discouraging some motor vehicle traffic. Many of these routes have no bike lanes so bicyclists are allowed use of full lane.
Home zones (woonerf zones)—These streets are des-ignated as “shared streets” and do not prioritize the needs of motor vehicles. Rather, it is a space where pedestrians and bicyclists are the priority and motor vehicles are kept at low speeds.
Colored bike lanes—Bike lanes which have special coloring to provide a distinct visual definition that the space is desig-nated for bicyclists.
Photos top to bottom: (left) John Luton, Payton Chung, La-Citta-Vita@Flickr, Tanya Dueri—San Francisco Bicycle Coalition (right) Alrthur Wendall, New York City DOT, John Luton, Roland Tanglao
Innovative Facilities DefinedBike box—A pave-ment marking that utilizes two stop lines: an advanced stop line for motor ve-hicles, and a stop line closer to the intersec-tion for bicyclists. This allows bicyclists to get a headstart when the light turns green to more safely pro-ceed ahead or make a left turn.
Cycle track— An ex-clusive bicycle facility that combines the user experience of a separated path with the on-street infra-structure of a con-ventional bike lane.
Contra flow bike lane—A designated bicycle lane marked to allow bicyclists to travel against the flow of traffic on a one-way street.
Bicycle traffic light—Lights on roadways which have specific bicycle symbols that illuminate to direct bicycle traffic.
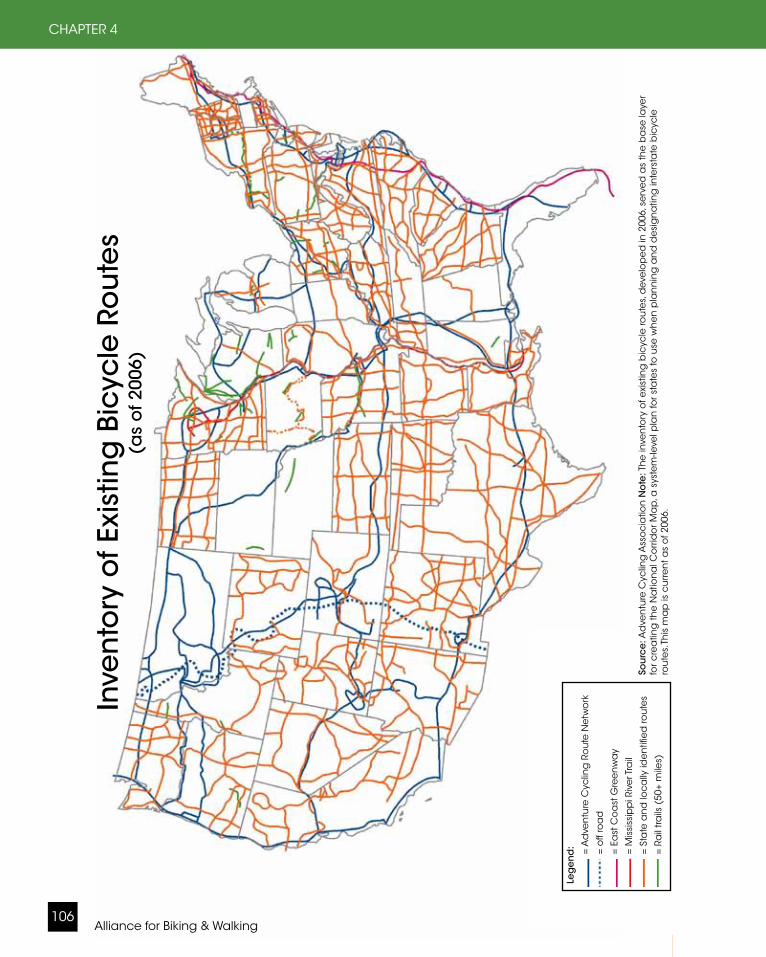
Alliance for Biking & Walking106
CHAPTER 4
Inve
nto
ry o
f Exi
stin
g B
icyc
le R
ou
tes
(as
of 2
006)
Sou
rce
: Ad
ven
ture
Cyc
ling
Ass
oc
iatio
n N
ote
: Th
e in
ven
tory
of e
xist
ing
bic
ycle
rou
tes,
dev
elo
pe
d in
200
6, s
erv
ed
as
the
ba
se la
yer
for c
rea
ting
the
Na
tion
al C
orr
ido
r Ma
p, a
sys
tem
-leve
l pla
n fo
r sta
tes
to u
se w
he
n p
lan
nin
g a
nd
de
sig
na
ting
inte
rsta
te b
icyc
le
rou
tes.
This
ma
p is
cu
rren
t as
of 2
006.
Leg
en
d:
=
Ad
ven
ture
Cyc
ling
Ro
ute
Ne
two
rk
=
off
roa
d
=
Ea
st C
oa
st G
ree
nw
ay
=
Mis
siss
ipp
i Riv
er T
rail
=
Sta
te a
nd
loc
ally
ide
ntif
ied
rou
tes
=
Ra
il tra
ils (
50+
mile
s)
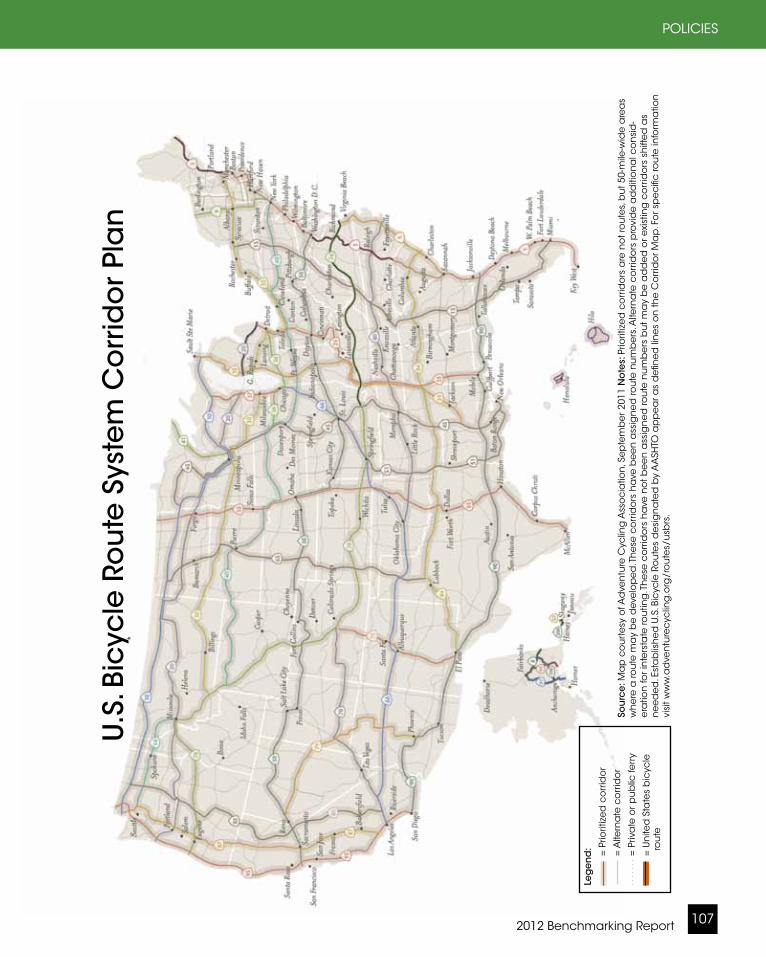
2012 Benchmarking Report 107
POLICIES
Leg
en
d:
=
Prio
ritiz
ed
co
rrid
or
=
Alte
rna
te c
orr
ido
r
=
Priv
ate
or p
ub
lic fe
rry
=
Un
ited
Sta
tes
bic
ycle
rou
te
U.S
. Bic
ycle
Ro
ute
Sys
tem
Co
rrid
or
Pla
n
Sou
rce
: Ma
p c
ou
rte
sy o
f Ad
ven
ture
Cyc
ling
Ass
oc
iatio
n, S
ep
tem
be
r 201
1 N
ote
s: P
riorit
ize
d c
orr
ido
rs a
re n
ot r
ou
tes,
bu
t 50-
mile
-wid
e a
rea
s w
he
re a
rou
te m
ay
be
dev
elo
pe
d. T
he
se c
orr
ido
rs h
ave
be
en
ass
ign
ed
rou
te n
um
be
rs. A
ltern
ate
co
rrid
ors
pro
vid
e a
dd
itio
na
l co
nsi
d-
era
tion
for i
nte
rsta
te ro
utin
g. T
he
se c
orr
ido
rs h
ave
no
t be
en
ass
ign
ed
rou
te n
um
be
rs b
ut m
ay
be
ad
de
d o
r exi
stin
g c
orr
ido
rs s
hift
ed
as
ne
ed
ed
. Est
ab
lish
ed
U.S
. Bic
ycle
Ro
ute
s d
esi
gn
ate
d b
y A
ASH
TO a
pp
ea
r as
de
fine
d li
ne
s o
n th
e C
orr
ido
r Ma
p. F
or s
pe
cifi
c ro
ute
info
rma
tion
vi
sit w
ww
.ad
ven
ture
cyc
ling
.org
/ro
ute
s/u
sbrs
.
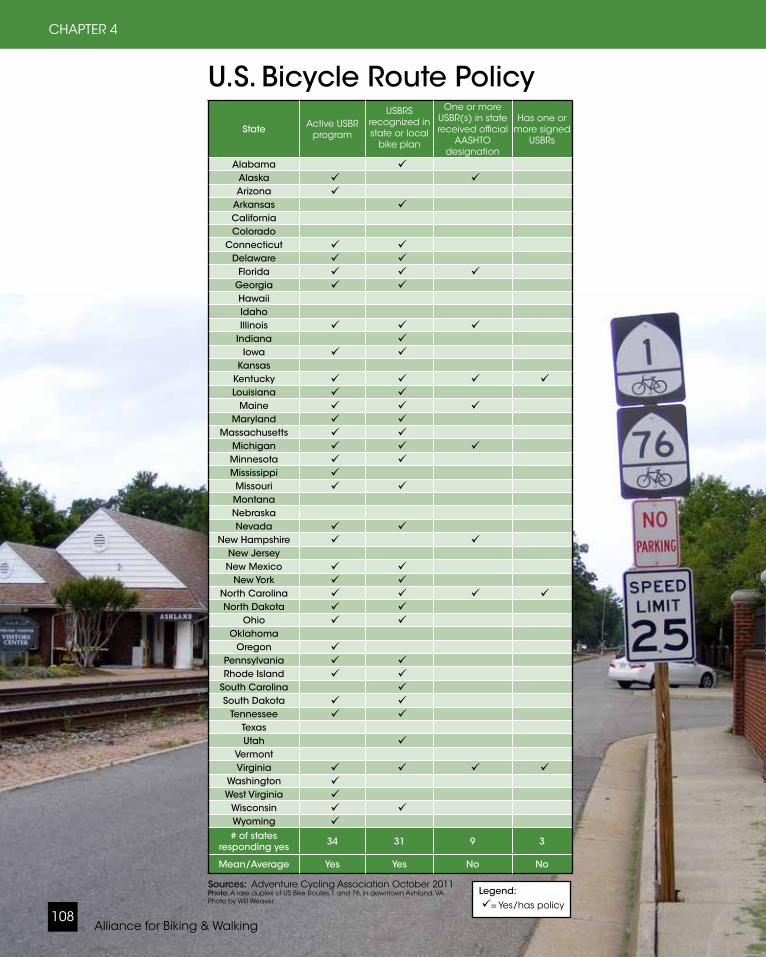
Alliance for Biking & Walking108
CHAPTER 4
U.S. Bicycle Route Policy
Legend: = Yes/has policy
State Active USBR program
USBRS recognized in state or local
bike plan
One or more USBR(s) in state received official
AASHTO designation
Has one or more signed
USBRs
Alabama Alaska Arizona
Arkansas CaliforniaColorado
Connecticut Delaware
Florida Georgia HawaiiIdahoIllinois
Indiana Iowa
KansasKentucky Louisiana
Maine Maryland
Massachusetts Michigan Minnesota Mississippi Missouri MontanaNebraskaNevada
New Hampshire New Jersey New Mexico
New York North Carolina North Dakota
Ohio Oklahoma
Oregon Pennsylvania Rhode Island
South Carolina South Dakota
Tennessee Texas Utah
VermontVirginia
Washington West Virginia
Wisconsin Wyoming # of states
responding yes 34 31 9 3
Mean/Average Yes Yes No No
Sources: Adventure Cycling Association October 2011Photo: A rare duplex of US Bike Routes 1 and 76, in downtown Ashland, VA. Photo by Will Weaver.
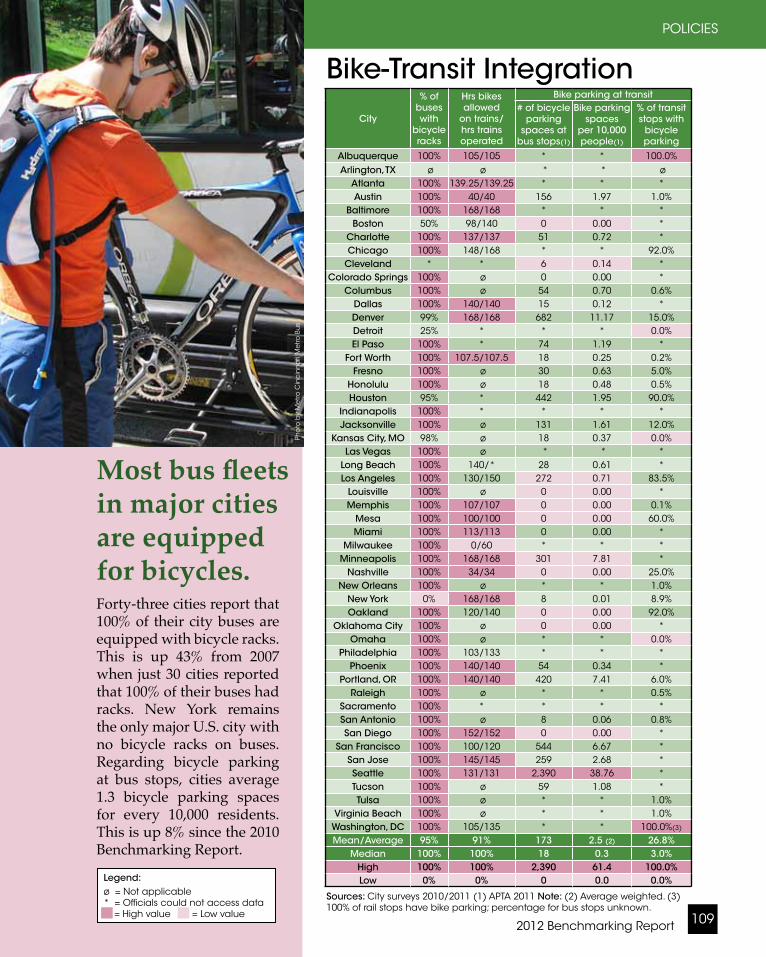
2012 Benchmarking Report 109
POLICIES
City
% of buses with
bicycle racks
Hrs bikes allowed
on trains/hrs trains operated
Bike parking at transit# of bicycle
parking spaces at
bus stops(1)
Bike parking spaces
per 10,000 people(1)
% of transit stops with
bicycle parking
Albuquerque 100% 105/105 * * 100.0%Arlington, TX ø ø * * ø
Atlanta 100% 139.25/139.25 * * *Austin 100% 40/40 156 1.97 1.0%
Baltimore 100% 168/168 * * *Boston 50% 98/140 0 0.00 *
Charlotte 100% 137/137 51 0.72 *Chicago 100% 148/168 * * 92.0%
Cleveland * * 6 0.14 *Colorado Springs 100% ø 0 0.00 *
Columbus 100% ø 54 0.70 0.6%Dallas 100% 140/140 15 0.12 *Denver 99% 168/168 682 11.17 15.0%Detroit 25% * * * 0.0%El Paso 100% * 74 1.19 *
Fort Worth 100% 107.5/107.5 18 0.25 0.2%Fresno 100% ø 30 0.63 5.0%
Honolulu 100% ø 18 0.48 0.5%Houston 95% * 442 1.95 90.0%
Indianapolis 100% * * * *Jacksonville 100% ø 131 1.61 12.0%
Kansas City, MO 98% ø 18 0.37 0.0%Las Vegas 100% ø * * *
Long Beach 100% 140/* 28 0.61 *Los Angeles 100% 130/150 272 0.71 83.5%
Louisville 100% ø 0 0.00 *Memphis 100% 107/107 0 0.00 0.1%
Mesa 100% 100/100 0 0.00 60.0%Miami 100% 113/113 0 0.00 *
Milwaukee 100% 0/60 * * *Minneapolis 100% 168/168 301 7.81 *
Nashville 100% 34/34 0 0.00 25.0%New Orleans 100% ø * * 1.0%
New York 0% 168/168 8 0.01 8.9%Oakland 100% 120/140 0 0.00 92.0%
Oklahoma City 100% ø 0 0.00 *Omaha 100% ø * * 0.0%
Philadelphia 100% 103/133 * * *Phoenix 100% 140/140 54 0.34 *
Portland, OR 100% 140/140 420 7.41 6.0%Raleigh 100% ø * * 0.5%
Sacramento 100% * * * *San Antonio 100% ø 8 0.06 0.8%San Diego 100% 152/152 0 0.00 *
San Francisco 100% 100/120 544 6.67 *San Jose 100% 145/145 259 2.68 *Seattle 100% 131/131 2,390 38.76 *Tucson 100% ø 59 1.08 *Tulsa 100% ø * * 1.0%
Virginia Beach 100% ø * * 1.0%Washington, DC 100% 105/135 * * 100.0%(3)
Mean/Average 95% 91% 173 2.5 (2) 26.8%Median 100% 100% 18 0.3 3.0%
High 100% 100% 2,390 61.4 100.0%Low 0% 0% 0 0.0 0.0%
Bike-Transit Integration
Most bus fleets in major cities are equipped for bicycles.Forty-three cities report that 100% of their city buses are equipped with bicycle racks. This is up 43% from 2007 when just 30 cities reported that 100% of their buses had racks. New York remains the only major U.S. city with no bicycle racks on buses. Regarding bicycle parking at bus stops, cities average 1.3 bicycle parking spaces for every 10,000 residents. This is up 8% since the 2010 Benchmarking Report.
Sources: City surveys 2010/2011 (1) APTA 2011 Note: (2) Average weighted. (3) 100% of rail stops have bike parking; percentage for bus stops unknown.
Pho
to b
y M
etro
Cin
cin
na
ti M
etro
Bu
s
Legend:ø = Not applicable* = Officials could not access data = High value = Low value
State Active USBR program
USBRS recognized in state or local
bike plan
One or more USBR(s) in state received official
AASHTO designation
Has one or more signed
USBRs
Alabama Alaska Arizona
Arkansas CaliforniaColorado
Connecticut Delaware
Florida Georgia HawaiiIdahoIllinois
Indiana Iowa
KansasKentucky Louisiana
Maine Maryland
Massachusetts Michigan Minnesota Mississippi Missouri MontanaNebraskaNevada
New Hampshire New Jersey New Mexico
New York North Carolina North Dakota
Ohio Oklahoma
Oregon Pennsylvania Rhode Island
South Carolina South Dakota
Tennessee Texas Utah
VermontVirginia
Washington West Virginia
Wisconsin Wyoming # of states
responding yes 34 31 9 3
Mean/Average Yes Yes No No

Alliance for Biking & Walking110
CHAPTER 5
2 of the "5 Es"
Education and encouragement are two of the often cited “5 Es” needed for making a com-munity bicycle and pedestrian
friendly. Both bicyclists and motorists need education on how to safely share the road and navigate traffic. Wide-spread education efforts can contribute to safer roadways for all. Encourage-ment is also needed to promote the spread of bicycling and walking as means of transport, recreation, and physical activity.
The 2010 Benchmarking Report was the first to establish benchmarks for bicycle and pedestrian education and encour-agement efforts. Many states and cities
The "5 Es"1. Engineering2. Education3. Encouragement4. Enforcement 5. Evaluation
5: EDUCATION AND ENCOURAGEMENT
have implemented pro-grams and events with these aims but have had no way to evaluate their success compared to others. This report builds on data from the previous report to track progress of these efforts.
Educating Professionals
This report measured education efforts in two areas: professional education and public education. The first refers to the education professionals receive that contributes to the promotion and safety of bicycling and walking. Included is
Children line up for a kids' bicycle race. Photo courtesy of Paul Dineen
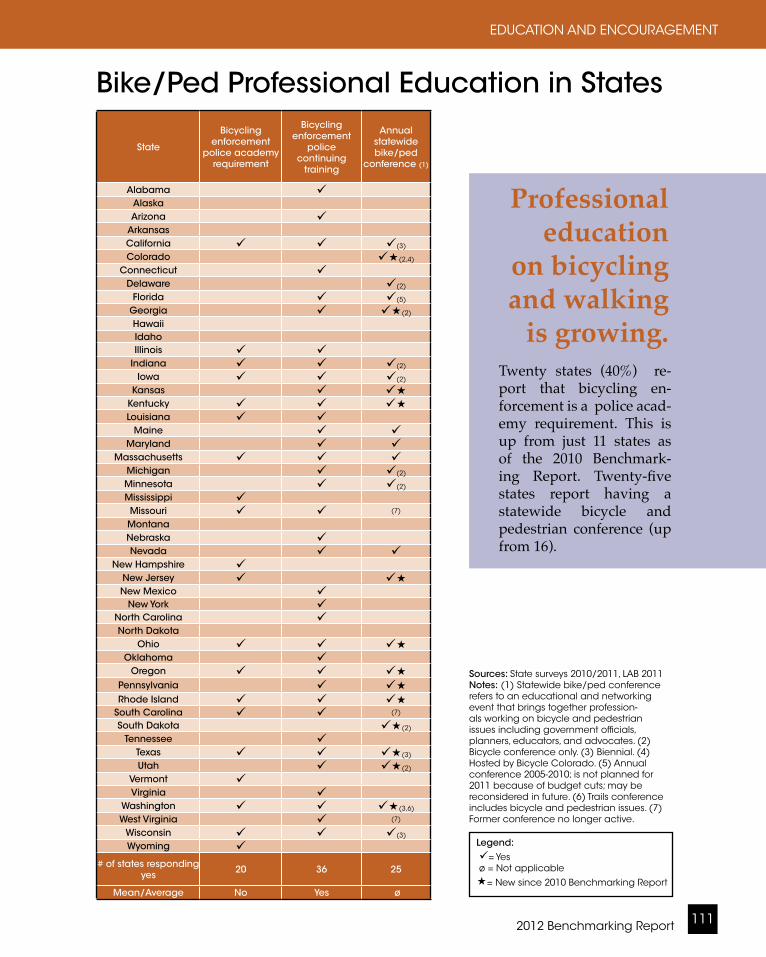
2012 Benchmarking Report 111
EDUCATION AND ENCOURAGEMENT
State
Bicycling enforcement
police academy requirement
Bicycling enforcement
police continuing
training
Annual statewide bike/ped
conference (1)
Alabama AlaskaArizona
ArkansasCalifornia (3)
Colorado (2,4)
Connecticut Delaware (2)
Florida (5)
Georgia (2)
HawaiiIdahoIllinois
Indiana (2)
Iowa (2)
Kansas Kentucky Louisiana
Maine Maryland
Massachusetts Michigan (2)
Minnesota (2)
Mississippi Missouri (7)
MontanaNebraska Nevada
New Hampshire New Jersey New Mexico
New York North Carolina North Dakota
Ohio Oklahoma
Oregon Pennsylvania Rhode Island
South Carolina (7)
South Dakota (2)
Tennessee Texas (3)
Utah (2)
Vermont Virginia
Washington (3,6)
West Virginia (7)
Wisconsin (3)
Wyoming # of states responding
yes 20 36 25
Mean/Average No Yes ø
Bike/Ped Professional Education in States
Sources: State surveys 2010/2011, LAB 2011 Notes: (1) Statewide bike/ped conference refers to an educational and networking event that brings together profession-als working on bicycle and pedestrian issues including government officials, planners, educators, and advocates. (2) Bicycle conference only. (3) Biennial. (4) Hosted by Bicycle Colorado. (5) Annual conference 2005-2010; is not planned for 2011 because of budget cuts; may be reconsidered in future. (6) Trails conference includes bicycle and pedestrian issues. (7) Former conference no longer active.
Professional education
on bicycling and walking
is growing.Twenty states (40%) re-port that bicycling en-forcement is a police acad-emy requirement. This is up from just 11 states as of the 2010 Benchmark-ing Report. Twenty-five states report having a statewide bicycle and pedestrian conference (up from 16).
Legend: = Yes ø = Not applicable = New since 2010 Benchmarking Report
1. Engineering2. Education3. Encouragement4. Enforcement 5. Evaluation
5: EDUCATION AND ENCOURAGEMENT
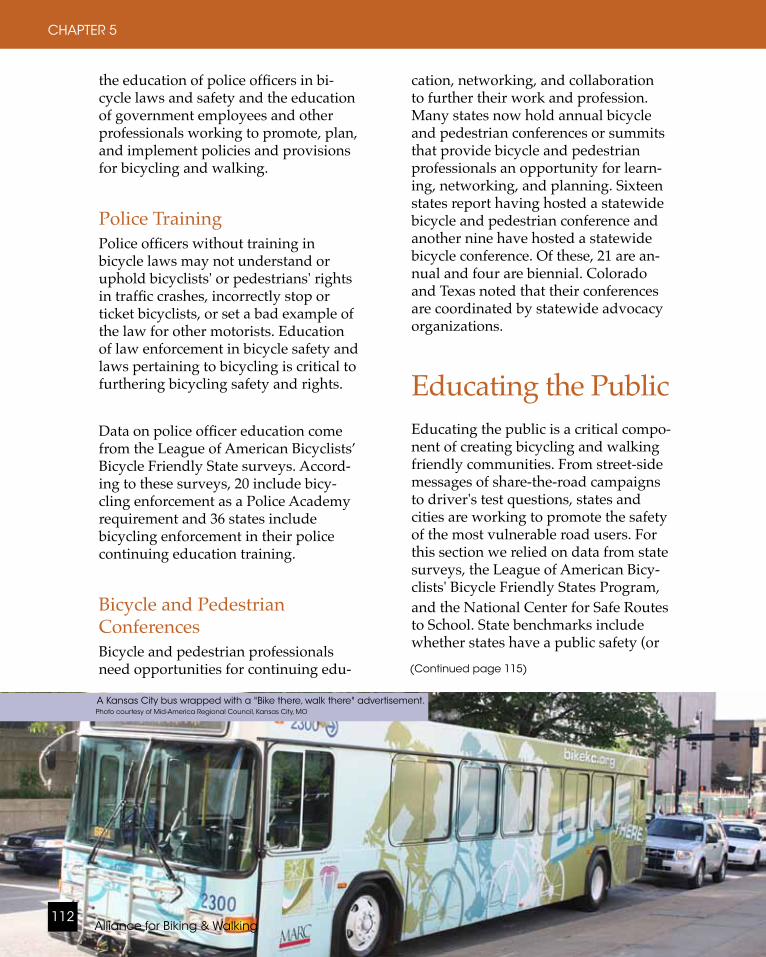
Alliance for Biking & Walking112
CHAPTER 5
Photo by Melvin Schlubman
the education of police officers in bi-cycle laws and safety and the education of government employees and other professionals working to promote, plan, and implement policies and provisions for bicycling and walking.
Police TrainingPolice officers without training in bicycle laws may not understand or uphold bicyclists' or pedestrians' rights in traffic crashes, incorrectly stop or ticket bicyclists, or set a bad example of the law for other motorists. Education of law enforcement in bicycle safety and laws pertaining to bicycling is critical to furthering bicycling safety and rights.
Data on police officer education come from the League of American Bicyclists’ Bicycle Friendly State surveys. Accord-ing to these surveys, 20 include bicy-cling enforcement as a Police Academy requirement and 36 states include bicycling enforcement in their police continuing education training.
Bicycle and Pedestrian ConferencesBicycle and pedestrian professionals need opportunities for continuing edu-
A Kansas City bus wrapped with a "Bike there, walk there" advertisement.Photo courtesy of Mid-America Regional Council, Kansas City, MO
cation, networking, and collaboration to further their work and profession. Many states now hold annual bicycle and pedestrian conferences or summits that provide bicycle and pedestrian professionals an opportunity for learn-ing, networking, and planning. Sixteen states report having hosted a statewide bicycle and pedestrian conference and another nine have hosted a statewide bicycle conference. Of these, 21 are an-nual and four are biennial. Colorado and Texas noted that their conferences are coordinated by statewide advocacy organizations.
Educating the PublicEducating the public is a critical compo-nent of creating bicycling and walking friendly communities. From street-side messages of share-the-road campaigns to driver's test questions, states and cities are working to promote the safety of the most vulnerable road users. For this section we relied on data from state surveys, the League of American Bicy-clists' Bicycle Friendly States Program, and the National Center for Safe Routes to School. State benchmarks include whether states have a public safety (or (Continued page 115)

2012 Benchmarking Report 113
EDUCATION AND ENCOURAGEMENT
State
Share the Road/ public safety
campaign
Info on bicycling in driver's manual
Driver’s test questions
on bicycling
State-sponsored
ride to promote
bicycling/activity
# of schools participating
in Walk to School Day
Alabama 23Alaska 9Arizona 116
Arkansas 9California 429Colorado 215
Connecticut 17Delaware 10
Florida 225Georgia 111Hawaii 1Idaho 47Illinois 186
Indiana 28Iowa 41
Kansas 56Kentucky 12Louisiana 28
Maine 7Maryland 81
Massachusetts 147Michigan 164Minnesota 27Mississippi 130Missouri 44Montana * 27Nebraska 27Nevada 37
New Hampshire 18New Jersey 80New Mexico * 78
New York 81North Carolina 84North Dakota 6
Ohio 108Oklahoma 85
Oregon 164Pennsylvania 58Rhode Island 18
South Carolina 129South Dakota 7
Tennessee 49Texas 84Utah 31
Vermont 20Virginia 54
Washington 31
West Virginia 32
Wisconsin 59Wyoming 6# of states
responding yes 38 49 32 17 ø
Mean/Average Yes Yes Yes No 71
Public Education and Events in States
Sources: State surveys 2010/2011, LAB 2011, National Center for Safe Routes to School 2011
Legend: = Yes ø = Not applicable * = Officials could not access data

Alliance for Biking & Walking114
CHAPTER 5
City
Bicycle education courses Bike to
Work Day events
Open street
initiatives (4)
City-sponsored
bicycle ride
Public bike share programYouth Adult
Albuquerque (1)
Arlington, TX (3) (3) Atlanta (2) Austin (1) * (1)
Baltimore (1,2) (1) (1)
Boston (1)
Charlotte Chicago (5)
Colorado Springs * Columbus
Dallas (1)
Denver (1) El Paso (1)
Fort Worth (1)
Fresno Honolulu (1)
Houston (1)
Jacksonville Kansas City, MO (1)
Las Vegas Long Beach (1)
Los Angeles (1)
Louisville (1)
Memphis Mesa (1)
Miami * (1)
Milwaukee *Minneapolis
Nashville New Orleans
New York (1)
Oakland Oklahoma City (1)
Omaha (1)
Philadelphia (1)
Phoenix (1)
Portland, OR (1)
Raleigh (1)
Sacramento (1)
San Antonio (1) (1)
San Diego * (1)
San Francisco (1)
San Jose (1)
Seattle (1)
Tucson Tulsa * * *
Virginia Beach Washington, DC
# of cities responding yes 38 41 43 21 32 5
Mean/Average Yes Yes Yes No Yes No
Bicycle Promotion in Cities
Source: City surveys 2010/2011 Notes: Cleveland, Detroit, and Indianapolis did not provide data requested for this chart. (1) In development. (2) Previous education program lost funding and agency is working on reinstating. (3) New in 2011. (4) Open streets are events where streets are temporarily closed to cars and are also known as "ciclovias." "Sunday parkways," and by other names. (5) Initiative no longer in operation or is currently inactive.
84% of cities report having Bike to Work Day events.
Legend: = Yes ø = Not applicable * = Officials could not access data = New since 2010
Benchmarking Report
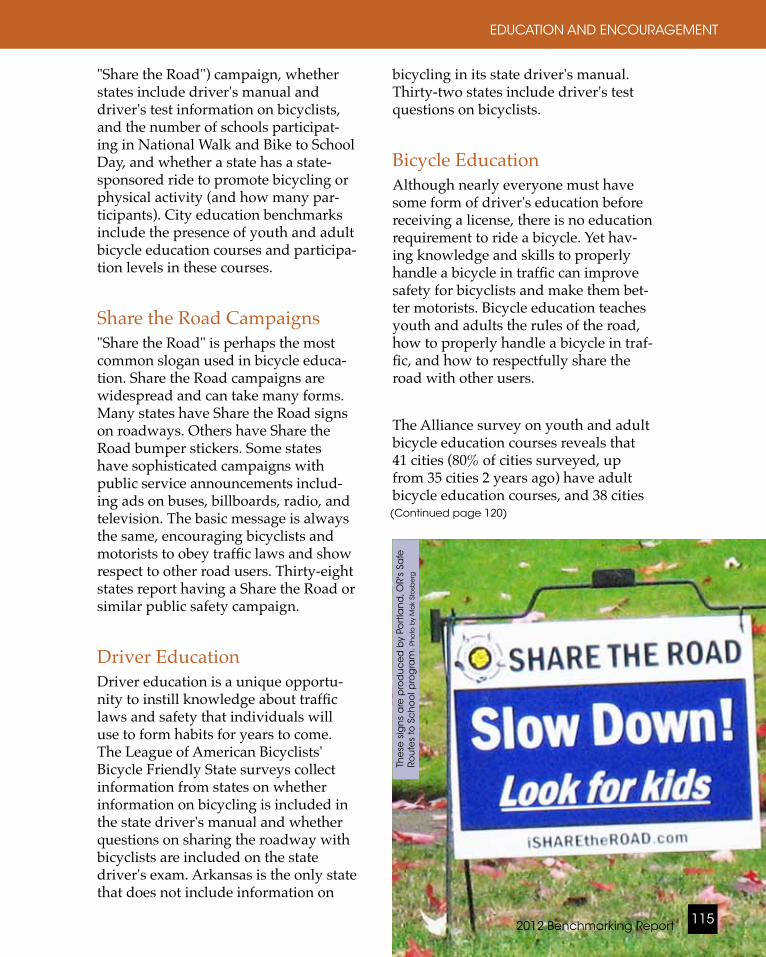
2012 Benchmarking Report 115
EDUCATION AND ENCOURAGEMENT
"Share the Road") campaign, whether states include driver's manual and driver's test information on bicyclists, and the number of schools participat-ing in National Walk and Bike to School Day, and whether a state has a state-sponsored ride to promote bicycling or physical activity (and how many par-ticipants). City education benchmarks include the presence of youth and adult bicycle education courses and participa-tion levels in these courses.
Share the Road Campaigns"Share the Road" is perhaps the most common slogan used in bicycle educa-tion. Share the Road campaigns are widespread and can take many forms. Many states have Share the Road signs on roadways. Others have Share the Road bumper stickers. Some states have sophisticated campaigns with public service announcements includ-ing ads on buses, billboards, radio, and television. The basic message is always the same, encouraging bicyclists and motorists to obey traffic laws and show respect to other road users. Thirty-eight states report having a Share the Road or similar public safety campaign.
Driver EducationDriver education is a unique opportu-nity to instill knowledge about traffic laws and safety that individuals will use to form habits for years to come. The League of American Bicyclists' Bicycle Friendly State surveys collect information from states on whether information on bicycling is included in the state driver's manual and whether questions on sharing the roadway with bicyclists are included on the state driver's exam. Arkansas is the only state that does not include information on
bicycling in its state driver's manual. Thirty-two states include driver's test questions on bicyclists.
Bicycle EducationAlthough nearly everyone must have some form of driver's education before receiving a license, there is no education requirement to ride a bicycle. Yet hav-ing knowledge and skills to properly handle a bicycle in traffic can improve safety for bicyclists and make them bet-ter motorists. Bicycle education teaches youth and adults the rules of the road, how to properly handle a bicycle in traf-fic, and how to respectfully share the road with other users.
The Alliance survey on youth and adult bicycle education courses reveals that 41 cities (80% of cities surveyed, up from 35 cities 2 years ago) have adult bicycle education courses, and 38 cities (Continued page 120)
The
se s
ign
s a
re p
rod
uc
ed
by
Port
lan
d, O
R's
Safe
Ro
ute
s to
Sc
ho
ol p
rog
ram
. Ph
oto
by
Ma
k St
osb
erg
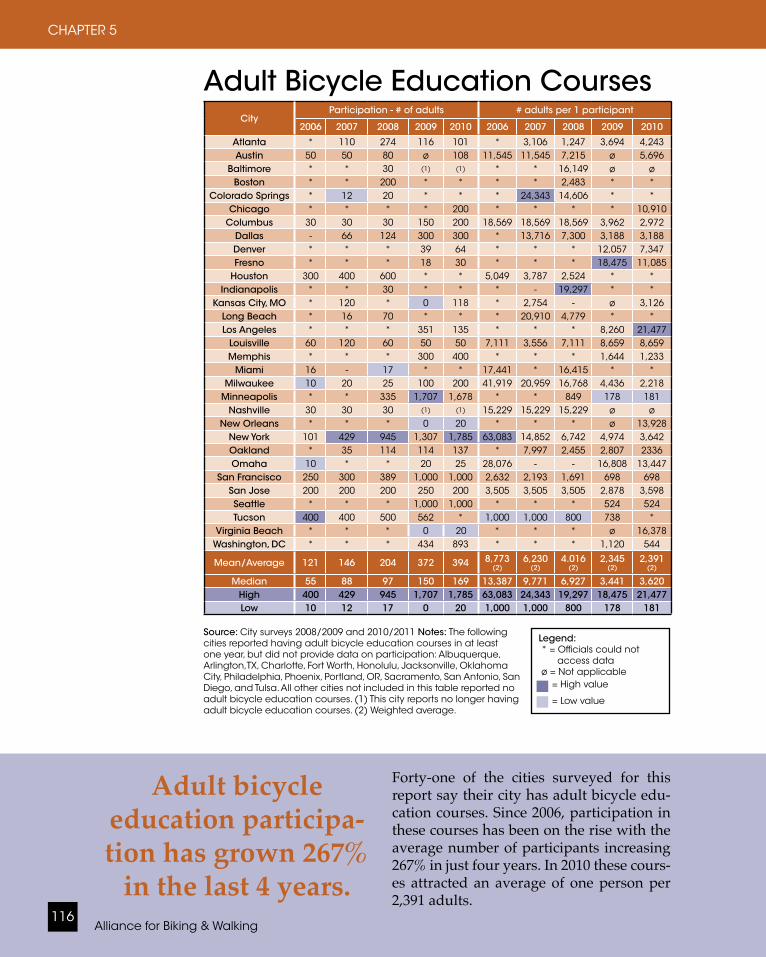
Alliance for Biking & Walking116
CHAPTER 5
CityParticipation - # of adults # adults per 1 participant
2006 2007 2008 2009 2010 2006 2007 2008 2009 2010
Atlanta * 110 274 116 101 * 3,106 1,247 3,694 4,243Austin 50 50 80 ø 108 11,545 11,545 7,215 ø 5,696
Baltimore * * 30 (1) (1) * * 16,149 ø øBoston * * 200 * * * * 2,483 * *
Colorado Springs * 12 20 * * * 24,343 14,606 * *Chicago * * * * 200 * * * * 10,910
Columbus 30 30 30 150 200 18,569 18,569 18,569 3,962 2,972Dallas - 66 124 300 300 * 13,716 7,300 3,188 3,188Denver * * * 39 64 * * * 12,057 7,347Fresno * * * 18 30 * * * 18,475 11,085
Houston 300 400 600 * * 5,049 3,787 2,524 * *Indianapolis * * 30 * * * - 19,297 * *
Kansas City, MO * 120 * 0 118 * 2,754 - ø 3,126Long Beach * 16 70 * * * 20,910 4,779 * *Los Angeles * * * 351 135 * * * 8,260 21,477
Louisville 60 120 60 50 50 7,111 3,556 7,111 8,659 8,659Memphis * * * 300 400 * * * 1,644 1,233
Miami 16 - 17 * * 17,441 * 16,415 * *Milwaukee 10 20 25 100 200 41,919 20,959 16,768 4,436 2,218
Minneapolis * * 335 1,707 1,678 * * 849 178 181Nashville 30 30 30 (1) (1) 15,229 15,229 15,229 ø ø
New Orleans * * * 0 20 * * * ø 13,928New York 101 429 945 1,307 1,785 63,083 14,852 6,742 4,974 3,642Oakland * 35 114 114 137 * 7,997 2,455 2,807 2336Omaha 10 * * 20 25 28,076 - - 16,808 13,447
San Francisco 250 300 389 1,000 1,000 2,632 2,193 1,691 698 698San Jose 200 200 200 250 200 3,505 3,505 3,505 2,878 3,598Seattle * * * 1,000 1,000 * * * 524 524Tucson 400 400 500 562 * 1,000 1,000 800 738 *
Virginia Beach * * * 0 20 * * * ø 16,378Washington, DC * * * 434 893 * * * 1,120 544
Mean/Average 121 146 204 372 394 8,773 (2)
6,230 (2)
4.016 (2)
2,345 (2)
2,391 (2)
Median 55 88 97 150 169 13,387 9,771 6,927 3,441 3,620High 400 429 945 1,707 1,785 63,083 24,343 19,297 18,475 21,477Low 10 12 17 0 20 1,000 1,000 800 178 181
Adult Bicycle Education Courses
Source: City surveys 2008/2009 and 2010/2011 Notes: The following cities reported having adult bicycle education courses in at least one year, but did not provide data on participation: Albuquerque, Arlington,TX, Charlotte, Fort Worth, Honolulu, Jacksonville, Oklahoma City, Philadelphia, Phoenix, Portland, OR, Sacramento, San Antonio, San Diego, and Tulsa. All other cities not included in this table reported no adult bicycle education courses. (1) This city reports no longer having adult bicycle education courses. (2) Weighted average.
Adult bicycle education participa-tion has grown 267%
in the last 4 years.
Forty-one of the cities surveyed for this report say their city has adult bicycle edu-cation courses. Since 2006, participation in these courses has been on the rise with the average number of participants increasing 267% in just four years. In 2010 these cours-es attracted an average of one person per 2,391 adults.
Legend: * = Officials could not access data ø = Not applicable = High value = Low value

2012 Benchmarking Report 117
EDUCATION AND ENCOURAGEMENT
» » » » » » » » »
14,606
14,780
14,869
15,128
15,229
16,149
16,378
16,415
19,297
Adult Bicycle Education: Adults Per One Participant
Source: City surveys 2008/2009 and 2010/2011, ACS 2009 Notes: 3-year average data between 2008 and 2010 used with the following exceptions: 1-year data used for: Baltimore, Boston, Chicago, Colorado Springs, Houston, Indianapolis, Kansas City, MO, Long Beach, Miami, Nashville, New Orleans, Virginia Beach; 2-year average used for: Austin, Denver, Fresno, Los Angeles, Memphis, Omaha, Seattle, Tucson, Washington, DC. The following cities reported having adult bicycle education courses in at least one year, but did not provide data on participation: Albuquerque, Arlington,Charlotte, Fort Worth, Honolulu, Jacksonville, Oklahoma City, Philadelphia, Phoenix, Portland, Sacramento, San Antonio, San Diego, Tulsa. All other cities not included in this table reported no adult bicycle education courses.
cities
# o
f ad
ults
pe
r o
ne
pa
rtic
ipa
nt
Minneapolis leads cities for adult
bicycle education participation.
One out of every 403 Minneapolis adults was a bicycle education participant, on av-erage, between 2008-2010. Seattle, Tucson, and Washington, DC, also rank among the cities with the highest levels of participa-tion in adult bicycle education courses.
CityParticipation - # of adults # adults per 1 participant
2006 2007 2008 2009 2010 2006 2007 2008 2009 2010
Atlanta * 110 274 116 101 * 3,106 1,247 3,694 4,243Austin 50 50 80 ø 108 11,545 11,545 7,215 ø 5,696
Baltimore * * 30 (1) (1) * * 16,149 ø øBoston * * 200 * * * * 2,483 * *
Colorado Springs * 12 20 * * * 24,343 14,606 * *Chicago * * * * 200 * * * * 10,910
Columbus 30 30 30 150 200 18,569 18,569 18,569 3,962 2,972Dallas - 66 124 300 300 * 13,716 7,300 3,188 3,188Denver * * * 39 64 * * * 12,057 7,347Fresno * * * 18 30 * * * 18,475 11,085
Houston 300 400 600 * * 5,049 3,787 2,524 * *Indianapolis * * 30 * * * - 19,297 * *
Kansas City, MO * 120 * 0 118 * 2,754 - ø 3,126Long Beach * 16 70 * * * 20,910 4,779 * *Los Angeles * * * 351 135 * * * 8,260 21,477
Louisville 60 120 60 50 50 7,111 3,556 7,111 8,659 8,659Memphis * * * 300 400 * * * 1,644 1,233
Miami 16 - 17 * * 17,441 * 16,415 * *Milwaukee 10 20 25 100 200 41,919 20,959 16,768 4,436 2,218
Minneapolis * * 335 1,707 1,678 * * 849 178 181Nashville 30 30 30 (1) (1) 15,229 15,229 15,229 ø ø
New Orleans * * * 0 20 * * * ø 13,928New York 101 429 945 1,307 1,785 63,083 14,852 6,742 4,974 3,642Oakland * 35 114 114 137 * 7,997 2,455 2,807 2336Omaha 10 * * 20 25 28,076 - - 16,808 13,447
San Francisco 250 300 389 1,000 1,000 2,632 2,193 1,691 698 698San Jose 200 200 200 250 200 3,505 3,505 3,505 2,878 3,598Seattle * * * 1,000 1,000 * * * 524 524Tucson 400 400 500 562 * 1,000 1,000 800 738 *
Virginia Beach * * * 0 20 * * * ø 16,378Washington, DC * * * 434 893 * * * 1,120 544
Mean/Average 121 146 204 372 394 8,773 (2)
6,230 (2)
4.016 (2)
2,345 (2)
2,391 (2)
Median 55 88 97 150 169 13,387 9,771 6,927 3,441 3,620High 400 429 945 1,707 1,785 63,083 24,343 19,297 18,475 21,477Low 10 12 17 0 20 1,000 1,000 800 178 181
Adult Bicycle Education Courses
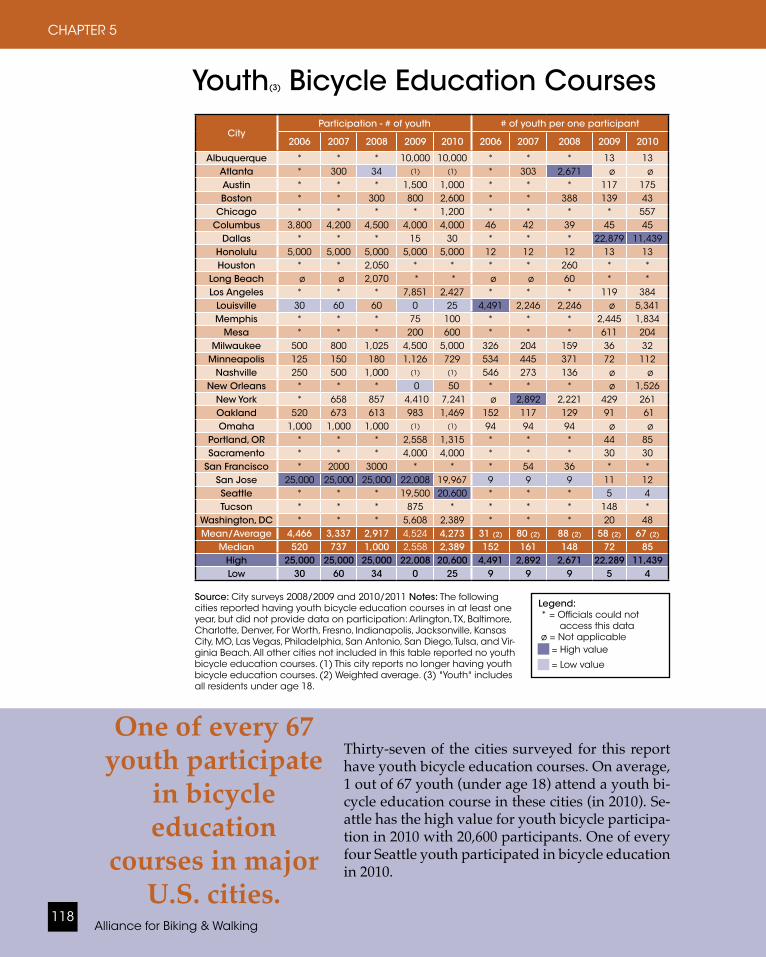
Alliance for Biking & Walking118
CHAPTER 5
CityParticipation - # of youth # of youth per one participant
2006 2007 2008 2009 2010 2006 2007 2008 2009 2010
Albuquerque * * * 10,000 10,000 * * * 13 13Atlanta * 300 34 (1) (1) * 303 2,671 ø øAustin * * * 1,500 1,000 * * * 117 175Boston * * 300 800 2,600 * * 388 139 43
Chicago * * * * 1,200 * * * * 557Columbus 3,800 4,200 4,500 4,000 4,000 46 42 39 45 45
Dallas * * * 15 30 * * * 22,879 11,439Honolulu 5,000 5,000 5,000 5,000 5,000 12 12 12 13 13Houston * * 2,050 * * * * 260 * *
Long Beach ø ø 2,070 * * ø ø 60 * *Los Angeles * * * 7,851 2,427 * * * 119 384
Louisville 30 60 60 0 25 4,491 2,246 2,246 ø 5,341Memphis * * * 75 100 * * * 2,445 1,834
Mesa * * * 200 600 * * * 611 204Milwaukee 500 800 1,025 4,500 5,000 326 204 159 36 32
Minneapolis 125 150 180 1,126 729 534 445 371 72 112Nashville 250 500 1,000 (1) (1) 546 273 136 ø ø
New Orleans * * * 0 50 * * * ø 1,526New York * 658 857 4,410 7,241 ø 2,892 2,221 429 261Oakland 520 673 613 983 1,469 152 117 129 91 61Omaha 1,000 1,000 1,000 (1) (1) 94 94 94 ø ø
Portland, OR * * * 2,558 1,315 * * * 44 85Sacramento * * * 4,000 4,000 * * * 30 30
San Francisco * 2000 3000 * * * 54 36 * *San Jose 25,000 25,000 25,000 22,008 19,967 9 9 9 11 12Seattle * * * 19,500 20,600 * * * 5 4Tucson * * * 875 * * * * 148 *
Washington, DC * * * 5,608 2,389 * * * 20 48Mean/Average 4,466 3,337 2,917 4,524 4,273 31 (2) 80 (2) 88 (2) 58 (2) 67 (2)
Median 520 737 1,000 2,558 2,389 152 161 148 72 85High 25,000 25,000 25,000 22,008 20,600 4,491 2,892 2,671 22,289 11,439Low 30 60 34 0 25 9 9 9 5 4
Youth(3) Bicycle Education Courses
Source: City surveys 2008/2009 and 2010/2011 Notes: The following cities reported having youth bicycle education courses in at least one year, but did not provide data on participation: Arlington, TX, Baltimore, Charlotte, Denver, For Worth, Fresno, Indianapolis, Jacksonville, Kansas City, MO, Las Vegas, Philadelphia, San Antonio, San Diego, Tulsa, and Vir-ginia Beach. All other cities not included in this table reported no youth bicycle education courses. (1) This city reports no longer having youth bicycle education courses. (2) Weighted average. (3) "Youth" includes all residents under age 18.
One of every 67 youth participate
in bicycle education
courses in major U.S. cities.
Thirty-seven of the cities surveyed for this report have youth bicycle education courses. On average, 1 out of 67 youth (under age 18) attend a youth bi-cycle education course in these cities (in 2010). Se-attle has the high value for youth bicycle participa-tion in 2010 with 20,600 participants. One of every four Seattle youth participated in bicycle education in 2010.
Legend: * = Officials could not access this data ø = Not applicable = High value = Low value
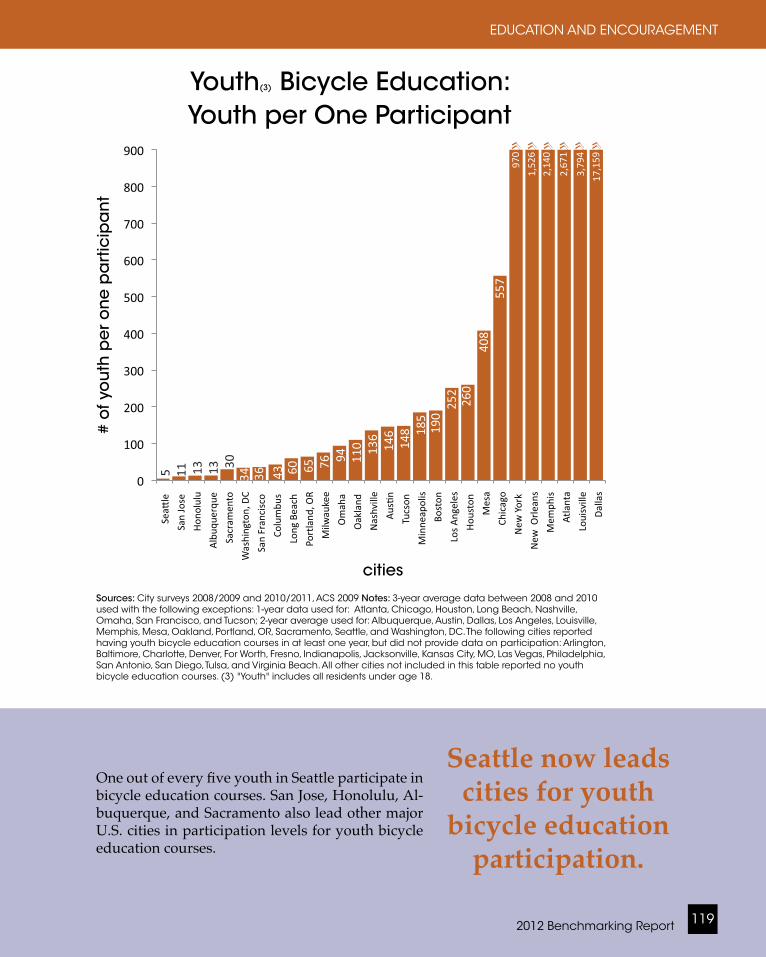
2012 Benchmarking Report 119
EDUCATION AND ENCOURAGEMENT
970
1,52
6
2,14
0
2,67
1
3,79
4
17,159
» » » » » »
Youth(3) Bicycle Education: Youth per One Participant
Sources: City surveys 2008/2009 and 2010/2011, ACS 2009 Notes: 3-year average data between 2008 and 2010 used with the following exceptions: 1-year data used for: Atlanta, Chicago, Houston, Long Beach, Nashville, Omaha, San Francisco, and Tucson; 2-year average used for: Albuquerque, Austin, Dallas, Los Angeles, Louisville, Memphis, Mesa, Oakland, Portland, OR, Sacramento, Seattle, and Washington, DC. The following cities reported having youth bicycle education courses in at least one year, but did not provide data on participation: Arlington, Baltimore, Charlotte, Denver, For Worth, Fresno, Indianapolis, Jacksonville, Kansas City, MO, Las Vegas, Philadelphia, San Antonio, San Diego, Tulsa, and Virginia Beach. All other cities not included in this table reported no youth bicycle education courses. (3) "Youth" includes all residents under age 18.
cities
# o
f yo
uth
pe
r o
ne
pa
rtic
ipa
nt
One out of every five youth in Seattle participate in bicycle education courses. San Jose, Honolulu, Al-buquerque, and Sacramento also lead other major U.S. cities in participation levels for youth bicycle education courses.
Seattle now leads cities for youth
bicycle education participation.
Youth(3) Bicycle Education Courses
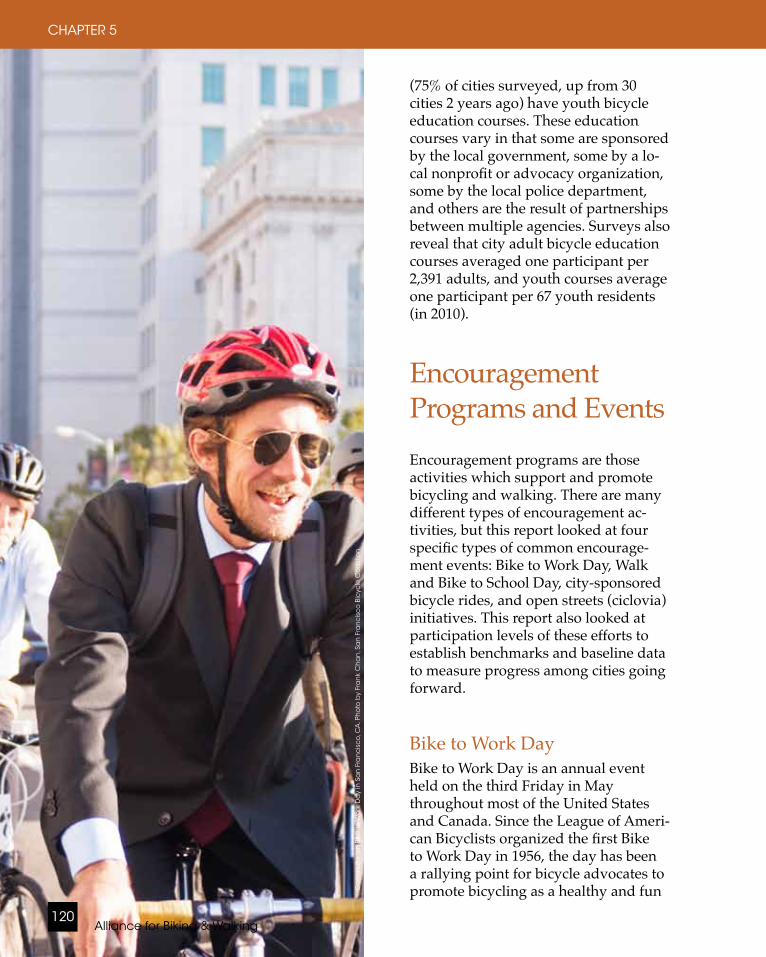
Alliance for Biking & Walking120
CHAPTER 5
(75% of cities surveyed, up from 30 cities 2 years ago) have youth bicycle education courses. These education courses vary in that some are sponsored by the local government, some by a lo-cal nonprofit or advocacy organization, some by the local police department, and others are the result of partnerships between multiple agencies. Surveys also reveal that city adult bicycle education courses averaged one participant per 2,391 adults, and youth courses average one participant per 67 youth residents (in 2010).
Encouragement Programs and EventsEncouragement programs are those activities which support and promote bicycling and walking. There are many different types of encouragement ac-tivities, but this report looked at four specific types of common encourage-ment events: Bike to Work Day, Walk and Bike to School Day, city-sponsored bicycle rides, and open streets (ciclovia) initiatives. This report also looked at participation levels of these efforts to establish benchmarks and baseline data to measure progress among cities going forward.
Bike to Work DayBike to Work Day is an annual event held on the third Friday in May throughout most of the United States and Canada. Since the League of Ameri-can Bicyclists organized the first Bike to Work Day in 1956, the day has been a rallying point for bicycle advocates to promote bicycling as a healthy and fun C
om
mu
ter o
n B
ike
to W
ork
Da
y in
Sa
n F
ran
cis
co
, CA
. Ph
oto
by
Fra
nk
Ch
an
, Sa
n F
ran
cis
co
Bic
ycle
Co
alit
ion
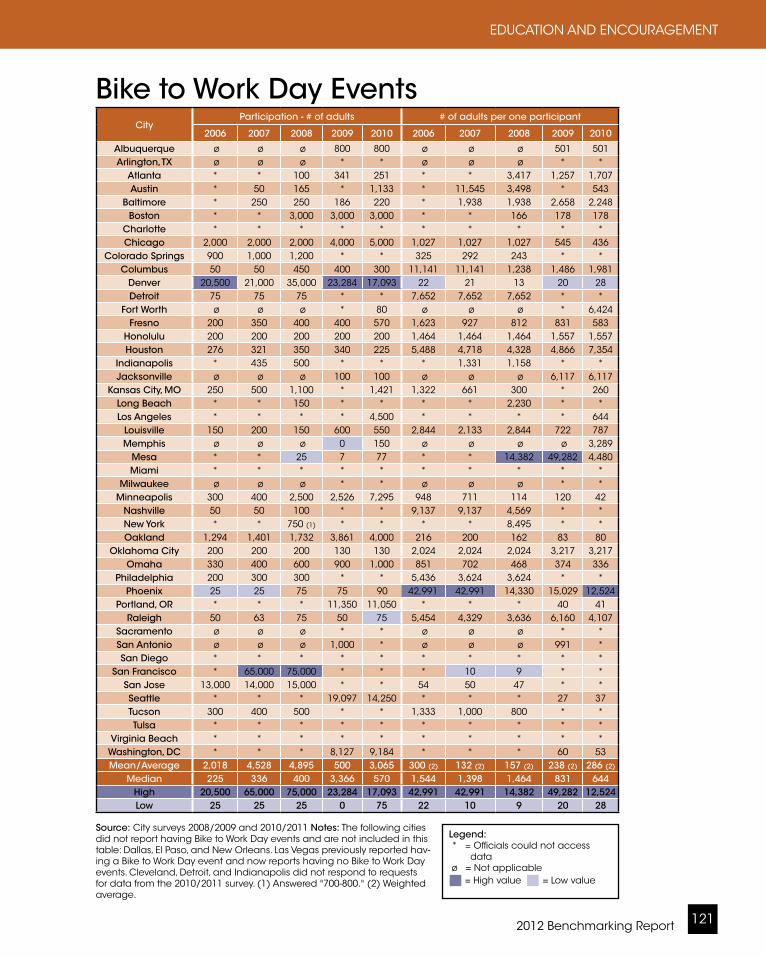
2012 Benchmarking Report 121
EDUCATION AND ENCOURAGEMENT
CityParticipation - # of adults # of adults per one participant
2006 2007 2008 2009 2010 2006 2007 2008 2009 2010
Albuquerque ø ø ø 800 800 ø ø ø 501 501Arlington, TX ø ø ø * * ø ø ø * *
Atlanta * * 100 341 251 * * 3,417 1,257 1,707Austin * 50 165 * 1,133 * 11,545 3,498 * 543
Baltimore * 250 250 186 220 * 1,938 1,938 2,658 2,248Boston * * 3,000 3,000 3,000 * * 166 178 178
Charlotte * * * * * * * * * *Chicago 2,000 2,000 2,000 4,000 5,000 1,027 1,027 1,027 545 436
Colorado Springs 900 1,000 1,200 * * 325 292 243 * *Columbus 50 50 450 400 300 11,141 11,141 1,238 1,486 1,981
Denver 20,500 21,000 35,000 23,284 17,093 22 21 13 20 28Detroit 75 75 75 * * 7,652 7,652 7,652 * *
Fort Worth ø ø ø * 80 ø ø ø * 6,424Fresno 200 350 400 400 570 1,623 927 812 831 583
Honolulu 200 200 200 200 200 1,464 1,464 1,464 1,557 1,557Houston 276 321 350 340 225 5,488 4,718 4,328 4,866 7,354
Indianapolis * 435 500 * * * 1,331 1,158 * *Jacksonville ø ø ø 100 100 ø ø ø 6,117 6,117
Kansas City, MO 250 500 1,100 * 1,421 1,322 661 300 * 260Long Beach * * 150 * * * * 2,230 * *Los Angeles * * * * 4,500 * * * * 644
Louisville 150 200 150 600 550 2,844 2,133 2,844 722 787Memphis ø ø ø 0 150 ø ø ø ø 3,289
Mesa * * 25 7 77 * * 14,382 49,282 4,480Miami * * * * * * * * * *
Milwaukee ø ø ø * * ø ø ø * *Minneapolis 300 400 2,500 2,526 7,295 948 711 114 120 42
Nashville 50 50 100 * * 9,137 9,137 4,569 * *New York * * 750 (1) * * * * 8,495 * *Oakland 1,294 1,401 1,732 3,861 4,000 216 200 162 83 80
Oklahoma City 200 200 200 130 130 2,024 2,024 2,024 3,217 3,217Omaha 330 400 600 900 1,000 851 702 468 374 336
Philadelphia 200 300 300 * * 5,436 3,624 3,624 * *Phoenix 25 25 75 75 90 42,991 42,991 14,330 15,029 12,524
Portland, OR * * * 11,350 11,050 * * * 40 41Raleigh 50 63 75 50 75 5,454 4,329 3,636 6,160 4,107
Sacramento ø ø ø * * ø ø ø * *San Antonio ø ø ø 1,000 * ø ø ø 991 *San Diego * * * * * * * * * *
San Francisco * 65,000 75,000 * * * 10 9 * *San Jose 13,000 14,000 15,000 * * 54 50 47 * *Seattle * * * 19,097 14,250 * * * 27 37Tucson 300 400 500 * * 1,333 1,000 800 * *Tulsa * * * * * * * * * *
Virginia Beach * * * * * * * * * *Washington, DC * * * 8,127 9,184 * * * 60 53Mean/Average 2,018 4,528 4,895 500 3,065 300 (2) 132 (2) 157 (2) 238 (2) 286 (2)
Median 225 336 400 3,366 570 1,544 1,398 1,464 831 644High 20,500 65,000 75,000 23,284 17,093 42,991 42,991 14,382 49,282 12,524Low 25 25 25 0 75 22 10 9 20 28
Bike to Work Day Events
Legend: * = Officials could not access data ø = Not applicable = High value = Low value
Source: City surveys 2008/2009 and 2010/2011 Notes: The following cities did not report having Bike to Work Day events and are not included in this table: Dallas, El Paso, and New Orleans. Las Vegas previously reported hav-ing a Bike to Work Day event and now reports having no Bike to Work Day events. Cleveland, Detroit, and Indianapolis did not respond to requests for data from the 2010/2011 survey. (1) Answered "700-800." (2) Weighted average.
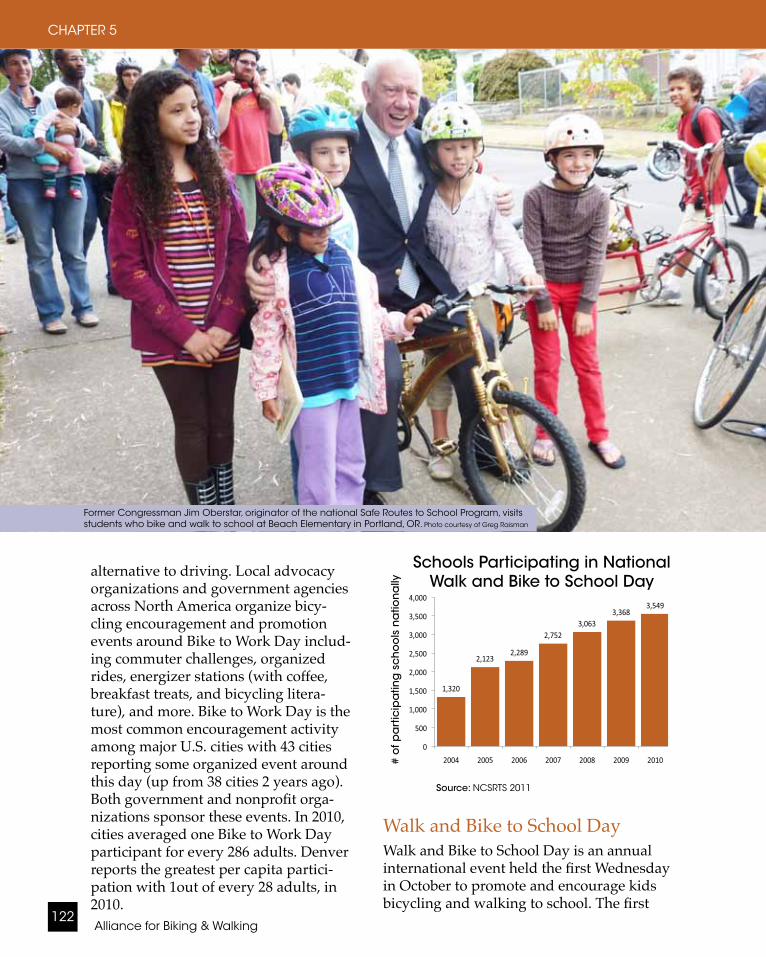
Alliance for Biking & Walking122
CHAPTER 5
alternative to driving. Local advocacy organizations and government agencies across North America organize bicy-cling encouragement and promotion events around Bike to Work Day includ-ing commuter challenges, organized rides, energizer stations (with coffee, breakfast treats, and bicycling litera-ture), and more. Bike to Work Day is the most common encouragement activity among major U.S. cities with 43 cities reporting some organized event around this day (up from 38 cities 2 years ago). Both government and nonprofit orga-nizations sponsor these events. In 2010, cities averaged one Bike to Work Day participant for every 286 adults. Denver reports the greatest per capita partici-pation with 1out of every 28 adults, in 2010.
2004 13202005 21232006 22892007 27522008 30632009 33682010 3549
# o
f pa
rtic
ipa
ting
sc
ho
ols
na
tion
ally
Schools Participating in National Walk and Bike to School Day
Source: NCSRTS 2011
Former Congressman Jim Oberstar, originator of the national Safe Routes to School Program, visits students who bike and walk to school at Beach Elementary in Portland, OR. Photo courtesy of Greg Raisman
Walk and Bike to School DayWalk and Bike to School Day is an annual international event held the first Wednesday in October to promote and encourage kids bicycling and walking to school. The first

2012 Benchmarking Report 123
EDUCATION AND ENCOURAGEMENT
DC
, OR
, TX
Number of Schools Participating in Walk and Bike to School Day
(2-year average 2009-2010)
Source: NCSRTS 2011
citi
es
# of participating schools
Portland had more schools participate in
National Walk and Bike to
School Day than any other major
U.S. city.
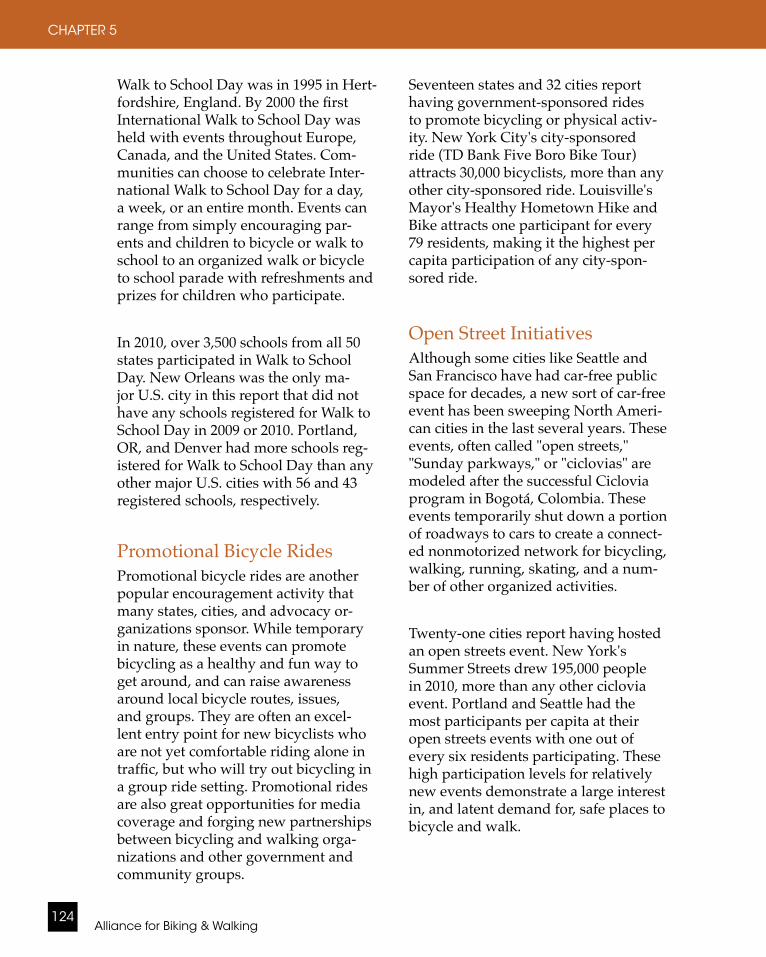
Alliance for Biking & Walking124
CHAPTER 5
Walk to School Day was in 1995 in Hert-fordshire, England. By 2000 the first International Walk to School Day was held with events throughout Europe, Canada, and the United States. Com-munities can choose to celebrate Inter-national Walk to School Day for a day, a week, or an entire month. Events can range from simply encouraging par-ents and children to bicycle or walk to school to an organized walk or bicycle to school parade with refreshments and prizes for children who participate.
In 2010, over 3,500 schools from all 50 states participated in Walk to School Day. New Orleans was the only ma-jor U.S. city in this report that did not have any schools registered for Walk to School Day in 2009 or 2010. Portland, OR, and Denver had more schools reg-istered for Walk to School Day than any other major U.S. cities with 56 and 43 registered schools, respectively.
Promotional Bicycle RidesPromotional bicycle rides are another popular encouragement activity that many states, cities, and advocacy or-ganizations sponsor. While temporary in nature, these events can promote bicycling as a healthy and fun way to get around, and can raise awareness around local bicycle routes, issues, and groups. They are often an excel-lent entry point for new bicyclists who are not yet comfortable riding alone in traffic, but who will try out bicycling in a group ride setting. Promotional rides are also great opportunities for media coverage and forging new partnerships between bicycling and walking orga-nizations and other government and community groups.
Seventeen states and 32 cities report having government-sponsored rides to promote bicycling or physical activ-ity. New York City's city-sponsored ride (TD Bank Five Boro Bike Tour) attracts 30,000 bicyclists, more than any other city-sponsored ride. Louisville's Mayor's Healthy Hometown Hike and Bike attracts one participant for every 79 residents, making it the highest per capita participation of any city-spon-sored ride.
Open Street InitiativesAlthough some cities like Seattle and San Francisco have had car-free public space for decades, a new sort of car-free event has been sweeping North Ameri-can cities in the last several years. These events, often called "open streets," "Sunday parkways," or "ciclovias" are modeled after the successful Ciclovia program in Bogotá, Colombia. These events temporarily shut down a portion of roadways to cars to create a connect-ed nonmotorized network for bicycling, walking, running, skating, and a num-ber of other organized activities.
Twenty-one cities report having hosted an open streets event. New York's Summer Streets drew 195,000 people in 2010, more than any other ciclovia event. Portland and Seattle had the most participants per capita at their open streets events with one out of every six residents participating. These high participation levels for relatively new events demonstrate a large interest in, and latent demand for, safe places to bicycle and walk.
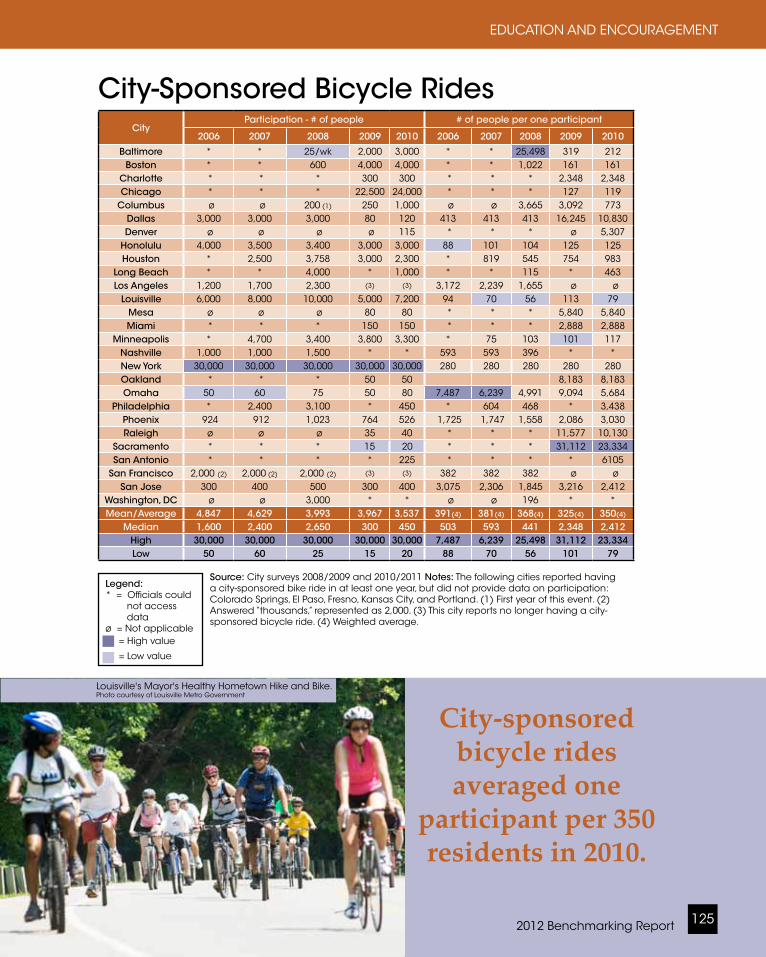
City-sponsored bicycle rides averaged one
participant per 350 residents in 2010.
2012 Benchmarking Report 125
EDUCATION AND ENCOURAGEMENT
CityParticipation - # of people # of people per one participant
2006 2007 2008 2009 2010 2006 2007 2008 2009 2010
Baltimore * * 25/wk 2,000 3,000 * * 25,498 319 212Boston * * 600 4,000 4,000 * * 1,022 161 161
Charlotte * * * 300 300 * * * 2,348 2,348Chicago * * * 22,500 24,000 * * * 127 119
Columbus ø ø 200 (1) 250 1,000 ø ø 3,665 3,092 773Dallas 3,000 3,000 3,000 80 120 413 413 413 16,245 10,830Denver ø ø ø ø 115 * * * ø 5,307
Honolulu 4,000 3,500 3,400 3,000 3,000 88 101 104 125 125Houston * 2,500 3,758 3,000 2,300 * 819 545 754 983
Long Beach * * 4,000 * 1,000 * * 115 * 463Los Angeles 1,200 1,700 2,300 (3) (3) 3,172 2,239 1,655 ø ø
Louisville 6,000 8,000 10,000 5,000 7,200 94 70 56 113 79Mesa ø ø ø 80 80 * * * 5,840 5,840Miami * * * 150 150 * * * 2,888 2,888
Minneapolis * 4,700 3,400 3,800 3,300 * 75 103 101 117Nashville 1,000 1,000 1,500 * * 593 593 396 * *New York 30,000 30,000 30,000 30,000 30,000 280 280 280 280 280Oakland * * * 50 50 8,183 8,183Omaha 50 60 75 50 80 7,487 6,239 4,991 9,094 5,684
Philadelphia * 2,400 3,100 * 450 * 604 468 * 3,438Phoenix 924 912 1,023 764 526 1,725 1,747 1,558 2,086 3,030Raleigh ø ø ø 35 40 * * * 11,577 10,130
Sacramento * * * 15 20 * * * 31,112 23,334San Antonio * * * * 225 * * * * 6105
San Francisco 2,000 (2) 2,000 (2) 2,000 (2) (3) (3) 382 382 382 ø øSan Jose 300 400 500 300 400 3,075 2,306 1,845 3,216 2,412
Washington, DC ø ø 3,000 * * ø ø 196 * *Mean/Average 4,847 4,629 3,993 3,967 3,537 391(4) 381(4) 368(4) 325(4) 350(4)
Median 1,600 2,400 2,650 300 450 503 593 441 2,348 2,412High 30,000 30,000 30,000 30,000 30,000 7,487 6,239 25,498 31,112 23,334Low 50 60 25 15 20 88 70 56 101 79
City-Sponsored Bicycle Rides
Source: City surveys 2008/2009 and 2010/2011 Notes: The following cities reported having a city-sponsored bike ride in at least one year, but did not provide data on participation: Colorado Springs, El Paso, Fresno, Kansas City, and Portland. (1) First year of this event. (2) Answered “thousands,” represented as 2,000. (3) This city reports no longer having a city-sponsored bicycle ride. (4) Weighted average.
Legend:* = Officials could not access data ø = Not applicable = High value = Low value
Louisville's Mayor's Healthy Hometown Hike and Bike. Photo courtesy of Louisville Metro Government

Alliance for Biking & Walking126
CHAPTER 5
CityParticipation - # of people # of people per one participant
2006 2007 2008 2009 2010 2006 2007 2008 2009 2010
Atlanta ø ø ø ø 10,500(1) ø ø ø ø 52Baltimore ø ø 2,000 (1) ø(5) ø(5) ø ø 319 ø ø
Boston 2,000 3,000 4,000 ø(5) ø(5) 307 204 153 ø øKansas City, MO ø ø 3,600 (1) ø ø ø ø 122 ø ø
Los Angeles ø ø ø ø 60,000 ø ø ø ø 64Louisville ø ø ø 40 50 ø ø ø 14,162 11,330
Miami ø ø 2,800 2,000 5,000 ø ø 125 217 87New York ø 250 (1) (2) 150,000 205,000 195,000 ø 33,098 55 41 43Oakland ø ø ø ø 4,000 ø ø ø ø 103Phoenix * * 75,000 ø ø * * 20 ø ø
Portland, OR ø ø 15,000 (1) 62,000 91,000 ø ø 37 9 6San Francisco ø ø 7,000 (1) (3) * * ø ø 109 * *
San Jose ø ø ø ø 5,000 ø ø ø ø 193Seattle ø ø ø 96,000 96,000 ø ø ø 6 6Tucson ø ø ø ø 5,000 ø ø ø ø 109
Washington, DC ø ø 1,200 * ø ø ø 490 * øMean/Average ø ø 28,9556 52,149 42,868 ø ø 53 (4) 41 37
Median ø ø 4,000 2,000 5,000 ø ø 116 41 75.5High ø 3,000 150,000 205,000 195,000 ø 33,098 490 14,162 11,330Low ø 250 1,200 40 50 ø 204 20 6 6
Open Street/Ciclovia Initiatives
Source: City surveys 2008/2009 and 2010/2011 Notes: Albuquerque, Chicago, El Paso, Honolulu, Houston, Long Beach, Philadelphia, and Seattle reported having an open street/ciclovia event during at least one of these years but could not access data on participation; all other cities did not report having an open street/ciclovia event. (1) First year of this event. (2) Answered “200-300.” (3) Answered “several thousand.”(4) Weighted average. (5) Report no longer having a ciclovia event.
Legend:* = Officials could not access data ø = Not applicable = High value = Low value
San Francisco children enjoy a street free of car traffic at one of the city's Sunday Streets events. Photo by Frank Chan, San Francisco Bicycle Coalition
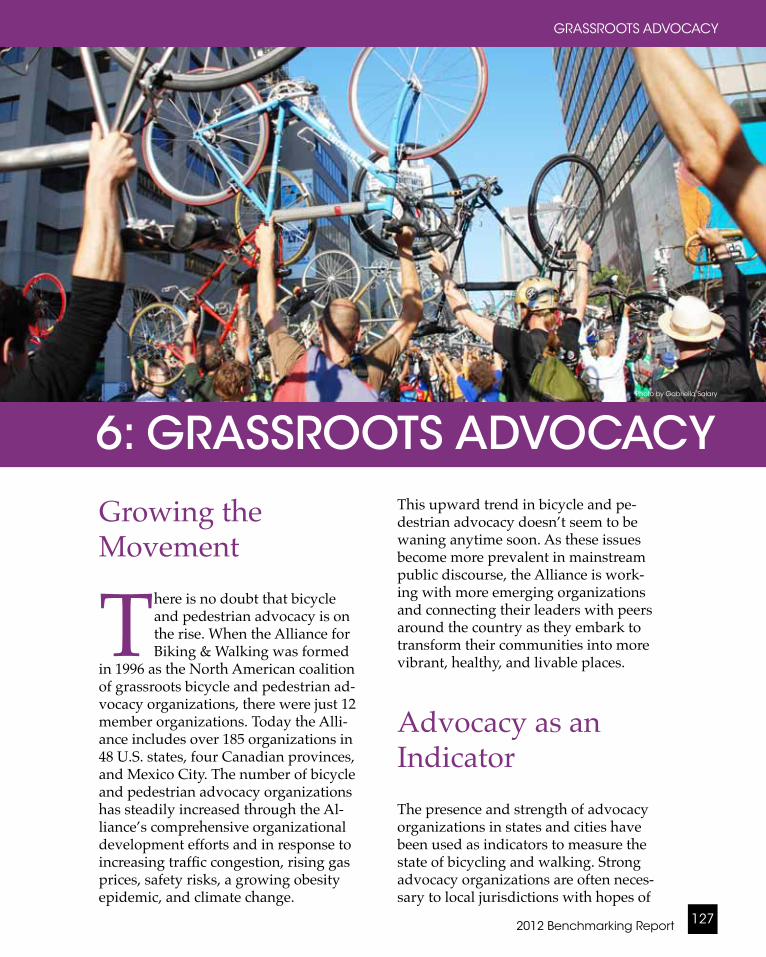
2012 Benchmarking Report 127
GRASSROOTS ADVOCACY
Growing the Movement
There is no doubt that bicycle and pedestrian advocacy is on the rise. When the Alliance for Biking & Walking was formed
in 1996 as the North American coalition of grassroots bicycle and pedestrian ad-vocacy organizations, there were just 12 member organizations. Today the Alli-ance includes over 185 organizations in 48 U.S. states, four Canadian provinces, and Mexico City. The number of bicycle and pedestrian advocacy organizations has steadily increased through the Al-liance’s comprehensive organizational development efforts and in response to increasing traffic congestion, rising gas prices, safety risks, a growing obesity epidemic, and climate change.
Photo by Gabriella Salary
6: GRASSROOTS ADVOCACYThis upward trend in bicycle and pe-destrian advocacy doesn’t seem to be waning anytime soon. As these issues become more prevalent in mainstream public discourse, the Alliance is work-ing with more emerging organizations and connecting their leaders with peers around the country as they embark to transform their communities into more vibrant, healthy, and livable places.
Advocacy as an Indicator The presence and strength of advocacy organizations in states and cities have been used as indicators to measure the state of bicycling and walking. Strong advocacy organizations are often neces-sary to local jurisdictions with hopes of
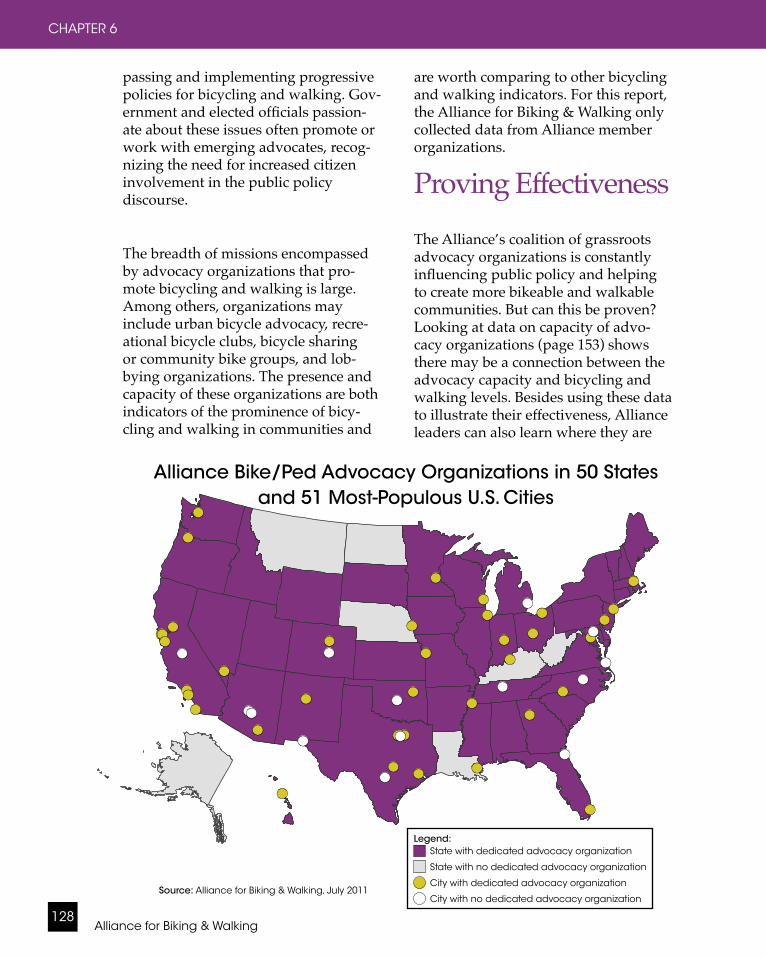
Alliance for Biking & Walking128
CHAPTER 6
passing and implementing progressive policies for bicycling and walking. Gov-ernment and elected officials passion-ate about these issues often promote or work with emerging advocates, recog-nizing the need for increased citizen involvement in the public policy discourse.
The breadth of missions encompassed by advocacy organizations that pro-mote bicycling and walking is large. Among others, organizations may include urban bicycle advocacy, recre-ational bicycle clubs, bicycle sharing or community bike groups, and lob-bying organizations. The presence and capacity of these organizations are both indicators of the prominence of bicy-cling and walking in communities and
NoAdvocacyOrgCitiesAdvocacyOrgCitiesAdvocacyOrgStatesAllStates
Source: Alliance for Biking and Walking 2011
Source: Alliance for Biking & Walking, July 2011
are worth comparing to other bicycling and walking indicators. For this report, the Alliance for Biking & Walking only collected data from Alliance member organizations.
Proving Effectiveness
The Alliance’s coalition of grassroots advocacy organizations is constantly influencing public policy and helping to create more bikeable and walkable communities. But can this be proven? Looking at data on capacity of advo-cacy organizations (page 153) shows there may be a connection between the advocacy capacity and bicycling and walking levels. Besides using these data to illustrate their effectiveness, Alliance leaders can also learn where they are
Alliance Bike/Ped Advocacy Organizations in 50 States and 51 Most-Populous U.S. Cities
Legend: State with dedicated advocacy organization
State with no dedicated advocacy organization
City with dedicated advocacy organization
City with no dedicated advocacy organization

2012 Benchmarking Report 129
GRASSROOTS ADVOCACY
Legend: = Memberships and donations
= Fee-for-service activities= Other
= Bicycle shops and manufacturers
successful and which areas need greater attention, thus refocusing limited re-sources for the greatest impact.
Measuring Advocacy CapacityMeasuring the capacity of advocacy organizations is not an easy thing to do. The Alliance collects data from member organizations annually as part of an "or-ganization profile." Variables measured include revenue and revenue sources, membership, staffing, number of con-tacts and media impressions (among others). While these variables are telling in some cases, they will not accurately reflect the full capacity of these organi-zations. Some organizations with strong
Breakdown of Every Dollar Earned by Statewide
Alliance Organizations
Breakdown of Every Dollar Earned by Alliance
Organizations Serving Cities
(Graphs this page) Source: Alliance for Biking & Walking 2011 Note: Graphs consider only Alliance organizations serving states and one of the 51 study-area cities. To see what organizations are included, reference Appendix 2, page 200. Some values round down which makes total appear to be 99%.
leaders and a dedicated base, can and do win great victories for bicycling and walking with virtually no budget. However, in the Alliance’s experience, organizations with sustainable revenue sources and budgets to employ full-time staff are the most self-sustaining and are able to accomplish more in the long term. Membership numbers and media impressions were included because they increase the political influ-ence of an organization. Organizations are represented in this section by the state or city they serve. In the cases where more than one advoca-cy organization serves a particular state or city, both organizations are represent-ed separately by their city name and a number. Appendix 2 contains the list of 50 states and 51 cities studied in
2¢
36¢
6¢
28¢
5¢
18¢
4¢
33¢
27¢
8¢
18¢
9¢
3¢
1¢
= Events, rides, galas, sponsorships
= Foundation grants
= Government grants and contracts
Source: Alliance for Biking & Walking, July 2011
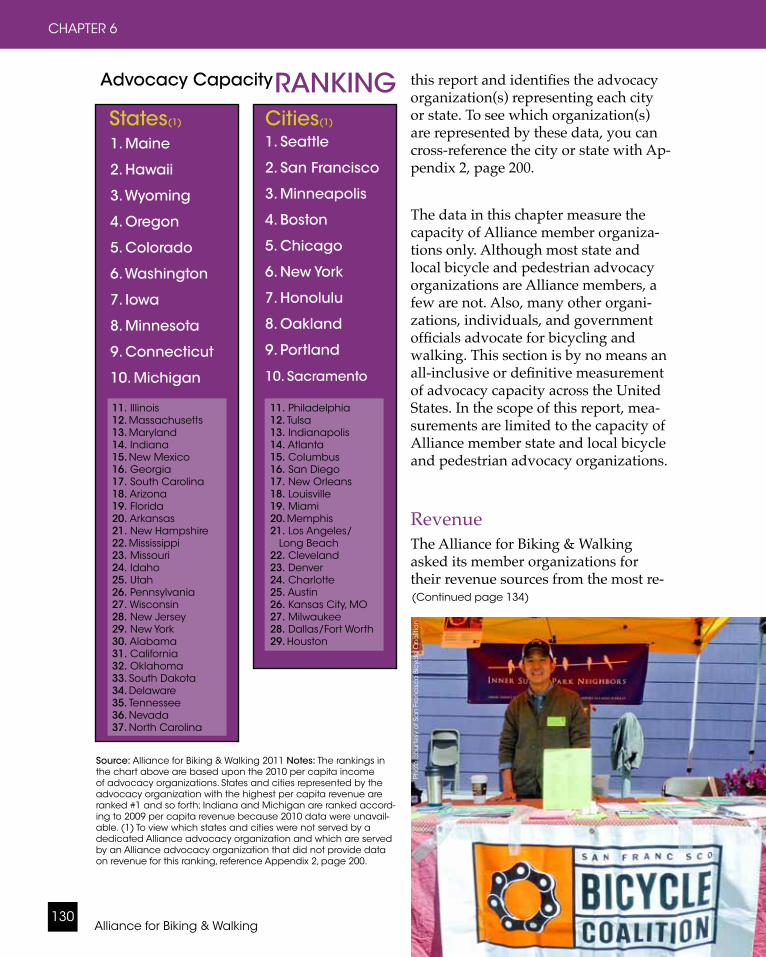
Alliance for Biking & Walking130
CHAPTER 6
11. Illinois12. Massachusetts13. Maryland14. Indiana15. New Mexico16. Georgia17. South Carolina18. Arizona19. Florida20. Arkansas21. New Hampshire22. Mississippi23. Missouri24. Idaho25. Utah26. Pennsylvania27. Wisconsin28. New Jersey29. New York30. Alabama31. California32. Oklahoma33. South Dakota34. Delaware35. Tennessee36. Nevada37. North Carolina
States(1)
this report and identifies the advocacy organization(s) representing each city or state. To see which organization(s) are represented by these data, you can cross-reference the city or state with Ap-pendix 2, page 200.
The data in this chapter measure the capacity of Alliance member organiza-tions only. Although most state and local bicycle and pedestrian advocacy organizations are Alliance members, a few are not. Also, many other organi-zations, individuals, and government officials advocate for bicycling and walking. This section is by no means an all-inclusive or definitive measurement of advocacy capacity across the United States. In the scope of this report, mea-surements are limited to the capacity of Alliance member state and local bicycle and pedestrian advocacy organizations.
RevenueThe Alliance for Biking & Walking asked its member organizations for their revenue sources from the most re-
Source: Alliance for Biking & Walking 2011 Notes: The rankings in the chart above are based upon the 2010 per capita income of advocacy organizations. States and cities represented by the advocacy organization with the highest per capita revenue are ranked #1 and so forth; Indiana and Michigan are ranked accord-ing to 2009 per capita revenue because 2010 data were unavail-able. (1) To view which states and cities were not served by a dedicated Alliance advocacy organization and which are served by an Alliance advocacy organization that did not provide data on revenue for this ranking, reference Appendix 2, page 200.
11. Philadelphia12. Tulsa13. Indianapolis14. Atlanta15. Columbus16. San Diego17. New Orleans18. Louisville19. Miami20. Memphis21. Los Angeles/ Long Beach22. Cleveland23. Denver24. Charlotte25. Austin26. Kansas City, MO27. Milwaukee28. Dallas/Fort Worth29. Houston
Cities(1)
Advocacy CapacityRANKING
1. Maine
2. Hawaii
3. Wyoming
4. Oregon
5. Colorado
6. Washington
7. Iowa
8. Minnesota
9. Connecticut
10. Michigan
1. Seattle
2. San Francisco
3. Minneapolis
4. Boston
5. Chicago
6. New York
7. Honolulu
8. Oakland
9. Portland
10. Sacramento
Pho
to c
ou
rte
sy o
f Sa
n F
ran
cis
co
Bic
ycle
Co
alit
ion
(Continued page 134)

2012 Benchmarking Report 131
GRASSROOTS ADVOCACY
Per Capita Revenue of Statewide Alliance Organizations
Source: Alliance for Biking & Walking 2011 Notes: Graph considers only Alliance organizations serving states. As of May 2011, the following states were not served by a dedicated statewide Alliance advocacy organization: Alaska, Kentucky, Louisiana, Montana, Nebraska, North Dakota, and West Virginia. The following states are served by a statewide Alliance advocacy organi-zation that did not provide information on organization revenue: Indiana, Kansas, Ohio, Rhode Island, Texas, and Vermont; Data for Alabama, Georgia, Idaho, and New Hampshire are from 2009 because no 2010 data were available. To see the organization and study area matches, please reference Appendix 2, page 200.
Statewide Alliance organizations earn
$0.03 per capita on average. Maine
leads statewide organizations
earning $0.36 per capita.
sta
tes
revenue per capita
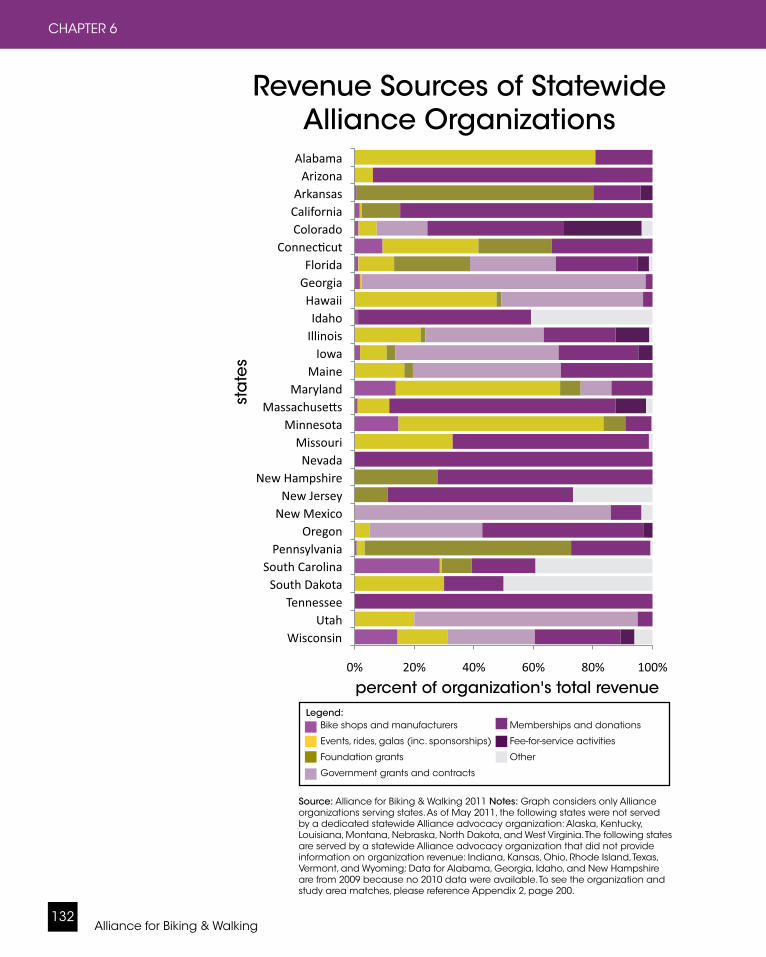
Alliance for Biking & Walking132
CHAPTER 6
sta
tes
percent of organization's total revenue
Source: Alliance for Biking & Walking 2011 Notes: Graph considers only Alliance organizations serving states. As of May 2011, the following states were not served by a dedicated statewide Alliance advocacy organization: Alaska, Kentucky, Louisiana, Montana, Nebraska, North Dakota, and West Virginia. The following states are served by a statewide Alliance advocacy organization that did not provide information on organization revenue: Indiana, Kansas, Ohio, Rhode Island, Texas, Vermont, and Wyoming; Data for Alabama, Georgia, Idaho, and New Hampshire are from 2009 because no 2010 data were available. To see the organization and study area matches, please reference Appendix 2, page 200.
Revenue Sources of Statewide Alliance Organizations
Legend: Bike shops and manufacturers
Events, rides, galas (inc. sponsorships)
Foundation grants
Government grants and contracts
Memberships and donations
Fee-for-service activities
Other
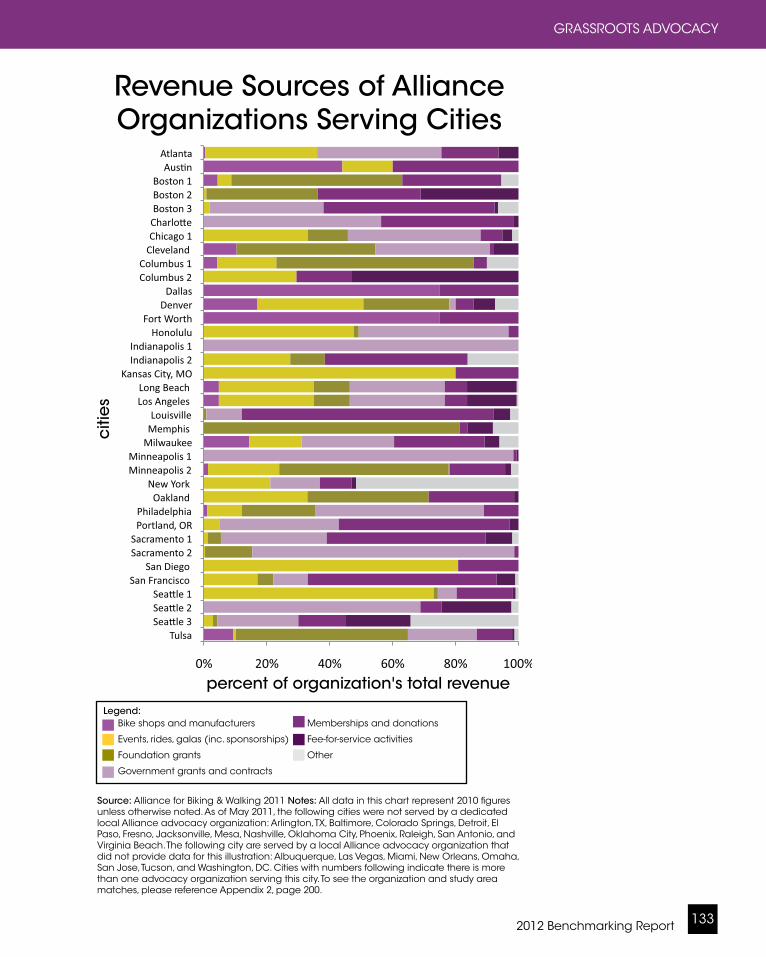
2012 Benchmarking Report 133
GRASSROOTS ADVOCACY
Revenue Sources of Alliance Organizations Serving Cities
, OR
citi
es
percent of organization's total revenue
Source: Alliance for Biking & Walking 2011 Notes: All data in this chart represent 2010 figures unless otherwise noted. As of May 2011, the following cities were not served by a dedicated local Alliance advocacy organization: Arlington, TX, Baltimore, Colorado Springs, Detroit, El Paso, Fresno, Jacksonville, Mesa, Nashville, Oklahoma City, Phoenix, Raleigh, San Antonio, and Virginia Beach. The following city are served by a local Alliance advocacy organization that did not provide data for this illustration: Albuquerque, Las Vegas, Miami, New Orleans, Omaha, San Jose, Tucson, and Washington, DC. Cities with numbers following indicate there is more than one advocacy organization serving this city. To see the organization and study area matches, please reference Appendix 2, page 200.
Legend: Bike shops and manufacturers
Events, rides, galas (inc. sponsorships)
Foundation grants
Government grants and contracts
Memberships and donations
Fee-for-service activities
Other
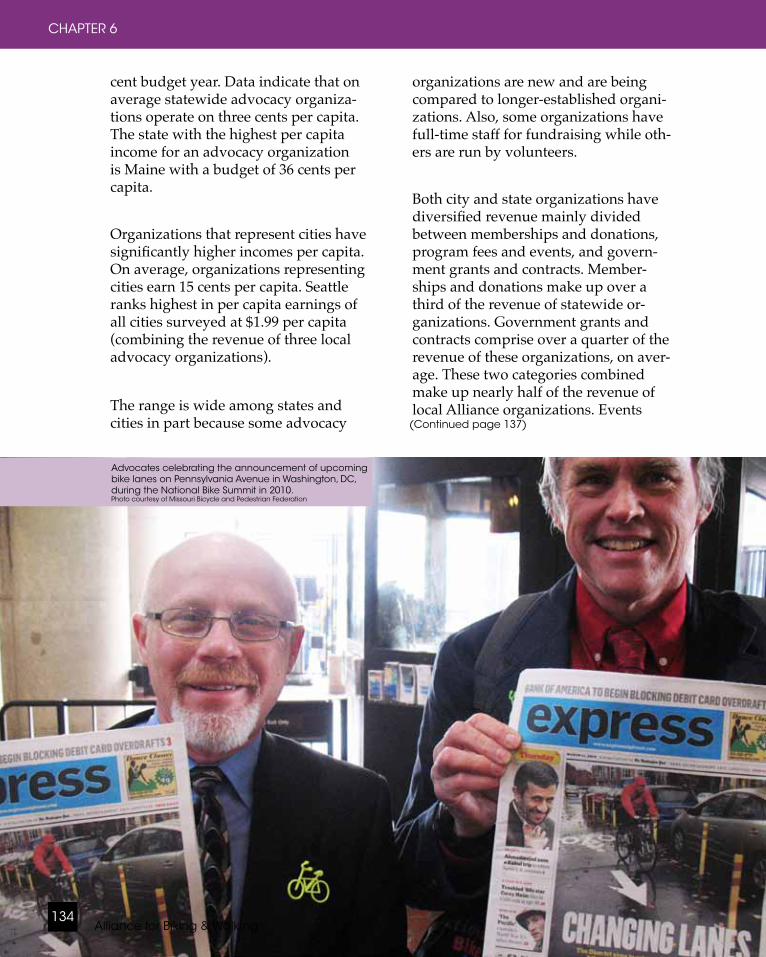
Alliance for Biking & Walking134
CHAPTER 6
cent budget year. Data indicate that on average statewide advocacy organiza-tions operate on three cents per capita. The state with the highest per capita income for an advocacy organization is Maine with a budget of 36 cents per capita.
Organizations that represent cities have significantly higher incomes per capita. On average, organizations representing cities earn 15 cents per capita. Seattle ranks highest in per capita earnings of all cities surveyed at $1.99 per capita (combining the revenue of three local advocacy organizations).
The range is wide among states and cities in part because some advocacy
organizations are new and are being compared to longer-established organi-zations. Also, some organizations have full-time staff for fundraising while oth-ers are run by volunteers.
Both city and state organizations have diversified revenue mainly divided between memberships and donations, program fees and events, and govern-ment grants and contracts. Member-ships and donations make up over a third of the revenue of statewide or-ganizations. Government grants and contracts comprise over a quarter of the revenue of these organizations, on aver-age. These two categories combined make up nearly half of the revenue of local Alliance organizations. Events
Advocates celebrating the announcement of upcoming bike lanes on Pennsylvania Avenue in Washington, DC, during the National Bike Summit in 2010. Photo courtesy of Missouri Bicycle and Pedestrian Federation
(Continued page 137)

2012 Benchmarking Report 135
GRASSROOTS ADVOCACY
Number of Residents Per One Member(1) in Statewide Alliance Organizations
sta
tes
number of residents per one member in organizationSource: Alliance for Biking & Walking 2011 Notes: Graph considers only Alliance organizations serving states. As of May 2011, the following states were not served by a dedicated statewide Alliance advocacy organization: Alaska, Kentucky, Louisiana, Montana, Nebraska, North Dakota, and West Virginia. The following states are served by a statewide Alliance advocacy organi-zation that did not provide information on organization revenue: Indiana, Kansas, Ohio, Rhode Island, Texas, and Vermont. Data for Alabama, Idaho, and New Hampshire are from 2009 because no 2010 data were available. Georgia Bikes has free mem-bership, so they do not have any dues-paying members. To see the organization and study area matches, reference Appendix 2, page 200. (1) "Member" is defined as a "dues paying member."
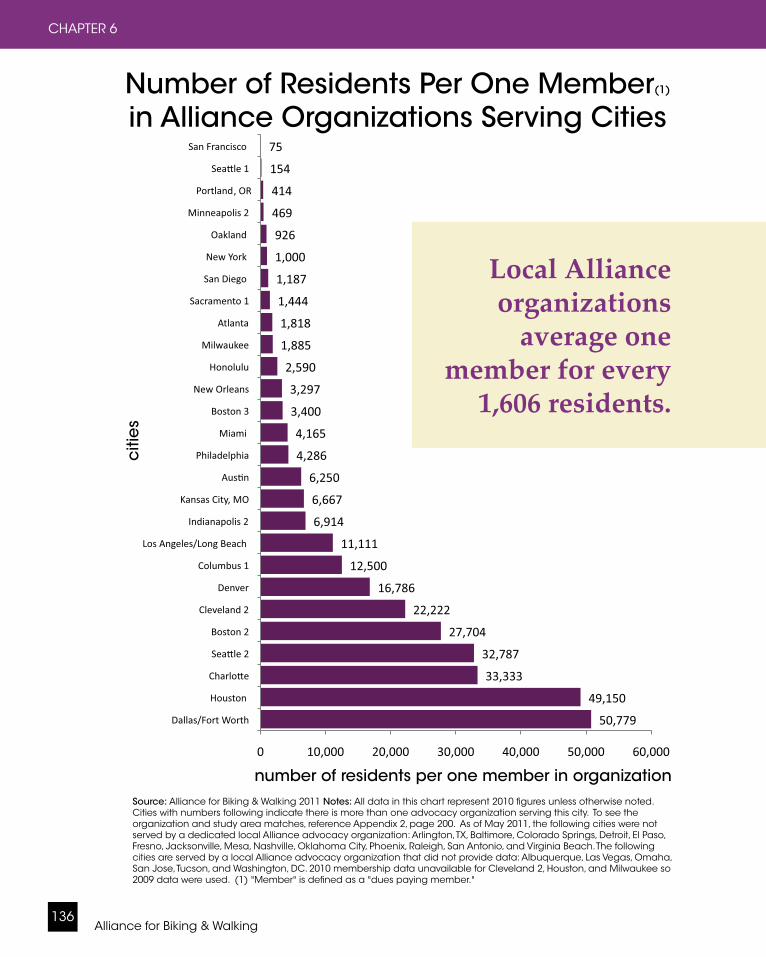
Alliance for Biking & Walking136
CHAPTER 6
, OR
citi
es
number of residents per one member in organizationSource: Alliance for Biking & Walking 2011 Notes: All data in this chart represent 2010 figures unless otherwise noted. Cities with numbers following indicate there is more than one advocacy organization serving this city. To see the organization and study area matches, reference Appendix 2, page 200. As of May 2011, the following cities were not served by a dedicated local Alliance advocacy organization: Arlington, TX, Baltimore, Colorado Springs, Detroit, El Paso, Fresno, Jacksonville, Mesa, Nashville, Oklahoma City, Phoenix, Raleigh, San Antonio, and Virginia Beach. The following cities are served by a local Alliance advocacy organization that did not provide data: Albuquerque, Las Vegas, Omaha, San Jose, Tucson, and Washington, DC. 2010 membership data unavailable for Cleveland 2, Houston, and Milwaukee so 2009 data were used. (1) "Member" is defined as a "dues paying member."
Local Alliance organizations
average one member for every
1,606 residents.
Number of Residents Per One Member(1) in Alliance Organizations Serving Cities

2012 Benchmarking Report 137
GRASSROOTS ADVOCACY
and sponsorships are another major revenue category for local organizations comprising a third of earned funds on average.
MembershipA strong membership base is often a critical component for successful advo-cacy organizations. Members provide a donor base, volunteer pool, and can leverage significant political power. Statewide organizations averaged one member per 4,975 people. Maine has the highest rate of members to population with one member for every 195 Maine residents. Organizations serving cities have higher membership rates averag-ing one member per 1,522 residents. San Francisco has the highest member-
ship rate with one member for every 75 residents. Seattle ranks second with one member for every 154 residents.
New to the 2012 Benchmarking Report, we also collected data on the number of email and mail contacts organiza-tions have. Along with membership, number of contacts indicate the reach an organization potentially has with the community. Both state and local orga-nizations have more mail contacts, on average, than email contacts. Statewide organizations average one mail contact for every 1,297 residents and one email contact for every 1,663 residents. Local organizations average one mail contact for every 268 residents and one email contact for every 299 residents.
Participants of the 2010 Lucinda Means Bicycle Advocacy Day on the steps of Michigan’s State Capitol. Many legislators learned about Complete Streets for the first time from bicycle advocates during the annual event. Complete Streets legisla-tion was introduced shortly thereafter and was signed into law with broad bipartisan support in less than six months. Since then, over 50 local Complete Streets ordinances and resolutions have been adopted across the state due to the leadership of bicycle, pedestrian, and disability rights advocates. Photo by John Lindenmayer.

Alliance for Biking & Walking138
CHAPTER 6
State Year founded
Per capita income
2010
# of staff
Staff per 1 million people
# of members
(3)
Residents per one:
Member(3)
Mail contact
Email contact
Alabama (2) 2003 $0.004 0 0.0 100 336,336 13,531 21,115Arizona 2006 $0.012 * * 130 50,737 * *
Arkansas 2004 $0.010 0 0.0 37 78,093 4,816 3,853California 1994 $0.003 2 0.1 1,200 49,282 14,785 6,160Colorado 1992 $0.146 7 1.4 7,205 792 199 586
Connecticut 2005 $0.046 1.5 0.4 450 7,818 235 1,759Delaware (2) 2008 $0.001 * * 50 17,702 * *
Florida 1997 $0.011 2 0.1 2,200 8,426 7,415 4,634Georgia (2) 2003 $0.017 1 0.1 0 (4) ø 129,332 12,210
Hawaii 1975 $0.243 5 3.9 500 2,590 2,590 2,590Idaho (2) 2009 $0.008 0.5 0.3 42 36,805 16,102 22,732
Illinois 1992 $0.027 1.8 0.1 1,220 10,582 1,614 5,164Indiana (2) 1993 $0.022 * * 2,000 3,212 * *
Iowa 2003 $0.100 3.5 1.2 700 4,297 501 1,203Maine 1992 $0.358 4 3.0 6,750 195 131 176
Maryland 2000 $0.025 1 0.2 60 94,991 1,425 300Massachusetts 1977 $0.027 3 0.5 2,827 2,332 758 924
Michigan 1981 $0.030 2 0.2 2,490 4,004 * *Minnesota 2008 $0.065 3.2 0.6 1,500 1,755 4,389 6,583Mississippi 1995 $0.010 0.5 0.2 71 41,577 * *Missouri 1993 $0.008 4 0.7 479 12,500 * *Nevada 2009 $0.0004 0 0.0 10 264,309 105,723 26,431
New Hampshire (2) 2004 $0.010 2 1.5 89 7,569 2,304 17,661New Jersey 2009 $0.005 0 0.0 235 37,054 * 622New Mexico 2002 $0.021 1.1 0.5 121 16,609 * 2,512
New York 1995 $0.004 1.5 0.1 225 86,851 9,771 15,633North Carolina 2009 $0.0002 * * 30 312,696 * 46,904
Oklahoma 1993 $0.002 0 0.0 130 28,362 * *Oregon 1991 $0.184 16 4.2 6,000 414 109 128
Pennsylvania 2009 $0.006 1 0.1 700 18,007 21,621 28,199South Carolina 1998 $0.015 1 0.2 1,250 3,649 8,293 5,068South Dakota 2009 $0.001 * * 20 40,619 8,124 8,124
Tennessee 2009 $0.001 * * 43 146,425 125,925 125,925Utah 2006 $0.007 1 0.4 125 22,277 * 11,138
Washington 1987 $0.105 7 1.1 1,700 3,920 * *Wisconsin 1988 $0.005 10 1.8 3,500 1,616 480 615Wyoming 1999 $0.189 1 1.8 1.500 363 605 1,209
Mean/Average (1) 1999 $0.02 3.0 0.4 7,205 4,975 1,297 1,663Median 2000 $0.011 1.8 0.3 450 15,746 4,389 5,068
High 2009 $0.385 16 4.2 9,250 336,336 129,332 125,925Low 1975 $0.0002 0 0.0 0 234 109 128
Capacity of Statewide Organizations
Source: Alliance for Biking & Walking 2011 Notes: As of May 2011, the following states were not served by a dedicated statewide Alliance advocacy organization: Alaska, Kentucky, Louisiana, Montana, Nebraska, North Dakota, West Virginia, and Wyoming. The following states are served by a statewide Alliance advocacy organization that did not provide data for this report: Indiana, Kansas, Ohio, Rhode Island, Texas, and Vermont. To see the orga-nization and study area matches, reference Appendix 2, page 200. (1) All averages are weighted by population except for year founded, # of members, and # of staff. (2) 2010 data unavailable, 2009 data used. (3) "Member" is defined as a "dues paying mem-ber." (4) Georgia has free membership so they do not have any dues-paying members.
Legend:* = Officials could not access data ø = Not applicable = High value = Low value
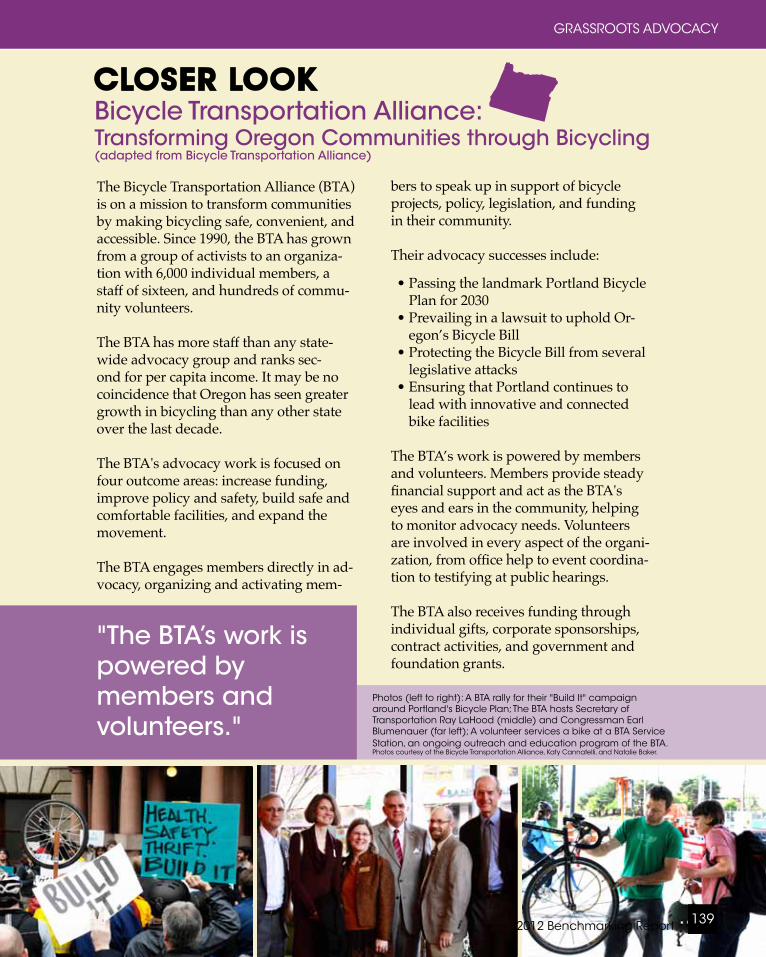
2012 Benchmarking Report 139
GRASSROOTS ADVOCACY
CLOSER LOOKBicycle Transportation Alliance: Transforming Oregon Communities through Bicycling(adapted from Bicycle Transportation Alliance)
The Bicycle Transportation Alliance (BTA) is on a mission to transform communities by making bicycling safe, convenient, and accessible. Since 1990, the BTA has grown from a group of activists to an organiza-tion with 6,000 individual members, a staff of sixteen, and hundreds of commu-nity volunteers.
The BTA has more staff than any state-wide advocacy group and ranks sec-ond for per capita income. It may be no coincidence that Oregon has seen greater growth in bicycling than any other state over the last decade.
The BTA's advocacy work is focused on four outcome areas: increase funding, improve policy and safety, build safe and comfortable facilities, and expand the movement.
The BTA engages members directly in ad-vocacy, organizing and activating mem-
"The BTA’s work is powered by members and volunteers."
Photos (left to right): A BTA rally for their "Build It" campaign around Portland's Bicycle Plan; The BTA hosts Secretary of Transportation Ray LaHood (middle) and Congressman Earl Blumenauer (far left); A volunteer services a bike at a BTA Service Station, an ongoing outreach and education program of the BTA. Photos courtesy of the Bicycle Transportation Alliance, Katy Cannatelli, and Natalie Baker.
bers to speak up in support of bicycle projects, policy, legislation, and funding in their community. Their advocacy successes include:
• Passing the landmark Portland Bicycle Plan for 2030
• Prevailing in a lawsuit to uphold Or-egon’s Bicycle Bill
• Protecting the Bicycle Bill from several legislative attacks
• Ensuring that Portland continues to lead with innovative and connected bike facilities
The BTA’s work is powered by members and volunteers. Members provide steady financial support and act as the BTA's eyes and ears in the community, helping to monitor advocacy needs. Volunteers are involved in every aspect of the organi-zation, from office help to event coordina-tion to testifying at public hearings.
The BTA also receives funding through individual gifts, corporate sponsorships, contract activities, and government and foundation grants.
State Year founded
Per capita income
2010
# of staff
Staff per 1 million people
# of members
(3)
Residents per one:
Member(3)
Mail contact
Email contact
Alabama (2) 2003 $0.004 0 0.0 100 336,336 13,531 21,115Arizona 2006 $0.012 * * 130 50,737 * *
Arkansas 2004 $0.010 0 0.0 37 78,093 4,816 3,853California 1994 $0.003 2 0.1 1,200 49,282 14,785 6,160Colorado 1992 $0.146 7 1.4 7,205 792 199 586
Connecticut 2005 $0.046 1.5 0.4 450 7,818 235 1,759Delaware (2) 2008 $0.001 * * 50 17,702 * *
Florida 1997 $0.011 2 0.1 2,200 8,426 7,415 4,634Georgia (2) 2003 $0.017 1 0.1 0 (4) ø 129,332 12,210
Hawaii 1975 $0.243 5 3.9 500 2,590 2,590 2,590Idaho (2) 2009 $0.008 0.5 0.3 42 36,805 16,102 22,732
Illinois 1992 $0.027 1.8 0.1 1,220 10,582 1,614 5,164Indiana (2) 1993 $0.022 * * 2,000 3,212 * *
Iowa 2003 $0.100 3.5 1.2 700 4,297 501 1,203Maine 1992 $0.358 4 3.0 6,750 195 131 176
Maryland 2000 $0.025 1 0.2 60 94,991 1,425 300Massachusetts 1977 $0.027 3 0.5 2,827 2,332 758 924
Michigan 1981 $0.030 2 0.2 2,490 4,004 * *Minnesota 2008 $0.065 3.2 0.6 1,500 1,755 4,389 6,583Mississippi 1995 $0.010 0.5 0.2 71 41,577 * *Missouri 1993 $0.008 4 0.7 479 12,500 * *Nevada 2009 $0.0004 0 0.0 10 264,309 105,723 26,431
New Hampshire (2) 2004 $0.010 2 1.5 89 7,569 2,304 17,661New Jersey 2009 $0.005 0 0.0 235 37,054 * 622New Mexico 2002 $0.021 1.1 0.5 121 16,609 * 2,512
New York 1995 $0.004 1.5 0.1 225 86,851 9,771 15,633North Carolina 2009 $0.0002 * * 30 312,696 * 46,904
Oklahoma 1993 $0.002 0 0.0 130 28,362 * *Oregon 1991 $0.184 16 4.2 6,000 414 109 128
Pennsylvania 2009 $0.006 1 0.1 700 18,007 21,621 28,199South Carolina 1998 $0.015 1 0.2 1,250 3,649 8,293 5,068South Dakota 2009 $0.001 * * 20 40,619 8,124 8,124
Tennessee 2009 $0.001 * * 43 146,425 125,925 125,925Utah 2006 $0.007 1 0.4 125 22,277 * 11,138
Washington 1987 $0.105 7 1.1 1,700 3,920 * *Wisconsin 1988 $0.005 10 1.8 3,500 1,616 480 615Wyoming 1999 $0.189 1 1.8 1.500 363 605 1,209
Mean/Average (1) 1999 $0.02 3.0 0.4 7,205 4,975 1,297 1,663Median 2000 $0.011 1.8 0.3 450 15,746 4,389 5,068
High 2009 $0.385 16 4.2 9,250 336,336 129,332 125,925Low 1975 $0.0002 0 0.0 0 234 109 128
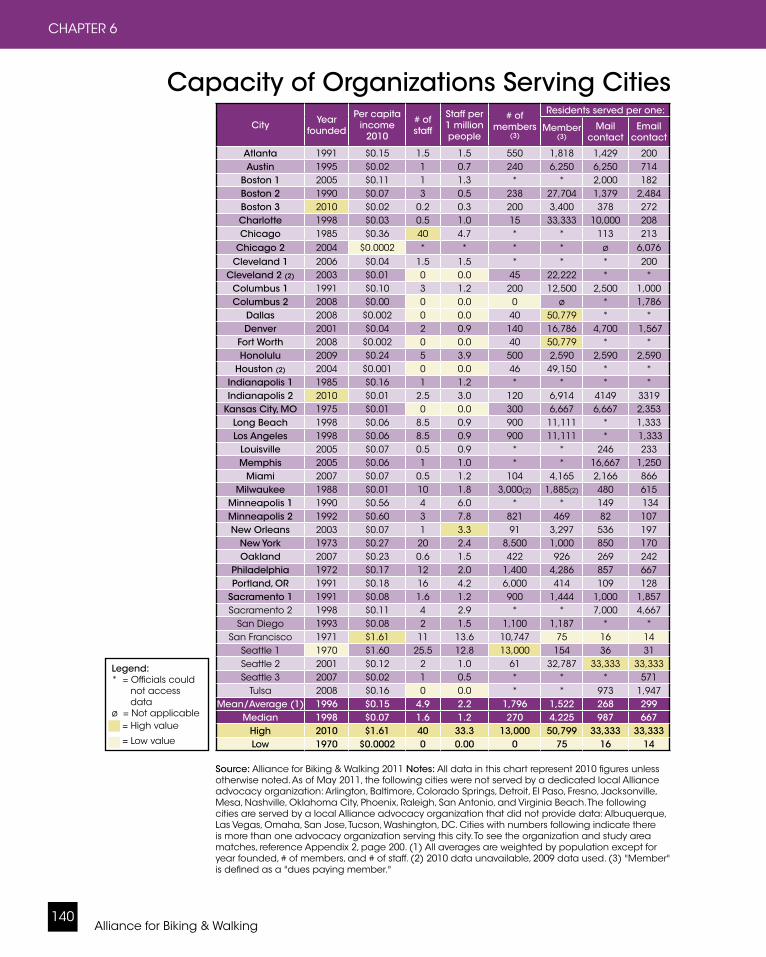
Alliance for Biking & Walking140
CHAPTER 6
Capacity of Organizations Serving Cities
Source: Alliance for Biking & Walking 2011 Notes: All data in this chart represent 2010 figures unless otherwise noted. As of May 2011, the following cities were not served by a dedicated local Alliance advocacy organization: Arlington, Baltimore, Colorado Springs, Detroit, El Paso, Fresno, Jacksonville, Mesa, Nashville, Oklahoma City, Phoenix, Raleigh, San Antonio, and Virginia Beach. The following cities are served by a local Alliance advocacy organization that did not provide data: Albuquerque, Las Vegas, Omaha, San Jose, Tucson, Washington, DC. Cities with numbers following indicate there is more than one advocacy organization serving this city. To see the organization and study area matches, reference Appendix 2, page 200. (1) All averages are weighted by population except for year founded, # of members, and # of staff. (2) 2010 data unavailable, 2009 data used. (3) "Member" is defined as a "dues paying member."
Legend:* = Officials could not access data ø = Not applicable = High value = Low value
City Year founded
Per capita income
2010
# of staff
Staff per 1 million people
# of members
(3)
Residents served per one:
Member (3)
Mail contact
Email contact
Atlanta 1991 $0.15 1.5 1.5 550 1,818 1,429 200Austin 1995 $0.02 1 0.7 240 6,250 6,250 714
Boston 1 2005 $0.11 1 1.3 * * 2,000 182Boston 2 1990 $0.07 3 0.5 238 27,704 1,379 2,484Boston 3 2010 $0.02 0.2 0.3 200 3,400 378 272Charlotte 1998 $0.03 0.5 1.0 15 33,333 10,000 208Chicago 1985 $0.36 40 4.7 * * 113 213
Chicago 2 2004 $0.0002 * * * * ø 6,076Cleveland 1 2006 $0.04 1.5 1.5 * * * 200
Cleveland 2 (2) 2003 $0.01 0 0.0 45 22,222 * *Columbus 1 1991 $0.10 3 1.2 200 12,500 2,500 1,000Columbus 2 2008 $0.00 0 0.0 0 ø * 1,786
Dallas 2008 $0.002 0 0.0 40 50,779 * *Denver 2001 $0.04 2 0.9 140 16,786 4,700 1,567
Fort Worth 2008 $0.002 0 0.0 40 50,779 * *Honolulu 2009 $0.24 5 3.9 500 2,590 2,590 2,590
Houston (2) 2004 $0.001 0 0.0 46 49,150 * *Indianapolis 1 1985 $0.16 1 1.2 * * * *Indianapolis 2 2010 $0.01 2.5 3.0 120 6,914 4149 3319
Kansas City, MO 1975 $0.01 0 0.0 300 6,667 6,667 2,353Long Beach 1998 $0.06 8.5 0.9 900 11,111 * 1,333Los Angeles 1998 $0.06 8.5 0.9 900 11,111 * 1,333
Louisville 2005 $0.07 0.5 0.9 * * 246 233Memphis 2005 $0.06 1 1.0 * * 16,667 1,250
Miami 2007 $0.07 0.5 1.2 104 4,165 2,166 866Milwaukee 1988 $0.01 10 1.8 3,000(2) 1,885(2) 480 615
Minneapolis 1 1990 $0.56 4 6.0 * * 149 134Minneapolis 2 1992 $0.60 3 7.8 821 469 82 107New Orleans 2003 $0.07 1 3.3 91 3,297 536 197
New York 1973 $0.27 20 2.4 8,500 1,000 850 170Oakland 2007 $0.23 0.6 1.5 422 926 269 242
Philadelphia 1972 $0.17 12 2.0 1,400 4,286 857 667Portland, OR 1991 $0.18 16 4.2 6,000 414 109 128
Sacramento 1 1991 $0.08 1.6 1.2 900 1,444 1,000 1,857Sacramento 2 1998 $0.11 4 2.9 * * 7,000 4,667
San Diego 1993 $0.08 2 1.5 1,100 1,187 * *San Francisco 1971 $1.61 11 13.6 10,747 75 16 14
Seattle 1 1970 $1.60 25.5 12.8 13,000 154 36 31Seattle 2 2001 $0.12 2 1.0 61 32,787 33,333 33,333Seattle 3 2007 $0.02 1 0.5 * * * 571
Tulsa 2008 $0.16 0 0.0 * * 973 1,947Mean/Average (1) 1996 $0.15 4.9 2.2 1,796 1,522 268 299
Median 1998 $0.07 1.6 1.2 270 4,225 987 667High 2010 $1.61 40 33.3 13,000 50,799 33,333 33,333Low 1970 $0.0002 0 0.00 0 75 16 14
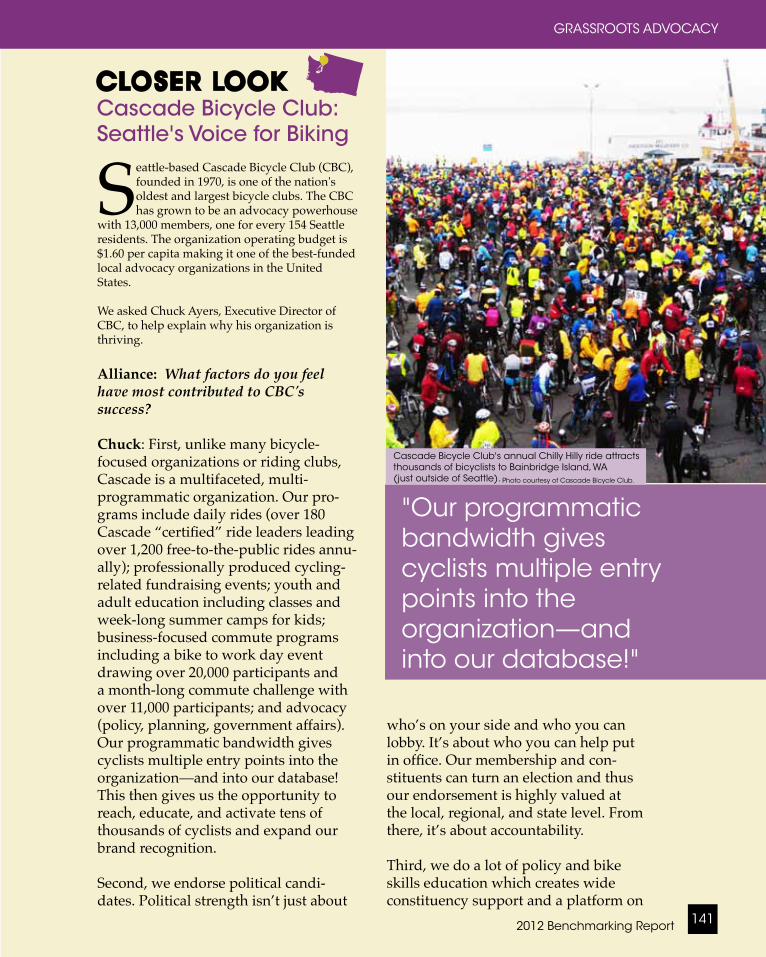
who’s on your side and who you can lobby. It’s about who you can help put in office. Our membership and con-stituents can turn an election and thus our endorsement is highly valued at the local, regional, and state level. From there, it’s about accountability. Third, we do a lot of policy and bike skills education which creates wide constituency support and a platform on
2012 Benchmarking Report 141
GRASSROOTS ADVOCACY
CLOSER LOOKCascade Bicycle Club: Seattle's Voice for Biking
Seattle-based Cascade Bicycle Club (CBC), founded in 1970, is one of the nation's oldest and largest bicycle clubs. The CBC has grown to be an advocacy powerhouse
with 13,000 members, one for every 154 Seattle residents. The organization operating budget is $1.60 per capita making it one of the best-funded local advocacy organizations in the United States.
We asked Chuck Ayers, Executive Director of CBC, to help explain why his organization is thriving.
Alliance: What factors do you feel have most contributed to CBC's success? Chuck: First, unlike many bicycle-focused organizations or riding clubs, Cascade is a multifaceted, multi- programmatic organization. Our pro-grams include daily rides (over 180 Cascade “certified” ride leaders leading over 1,200 free-to-the-public rides annu-ally); professionally produced cycling-related fundraising events; youth and adult education including classes and week-long summer camps for kids; business-focused commute programs including a bike to work day event drawing over 20,000 participants and a month-long commute challenge with over 11,000 participants; and advocacy (policy, planning, government affairs). Our programmatic bandwidth gives cyclists multiple entry points into the organization—and into our database! This then gives us the opportunity to reach, educate, and activate tens of thousands of cyclists and expand our brand recognition. Second, we endorse political candi-dates. Political strength isn’t just about
P
"Our programmatic bandwidth gives cyclists multiple entry points into the organization—and into our database!"
Cascade Bicycle Club's annual Chilly Hilly ride attracts thousands of bicyclists to Bainbridge Island, WA (just outside of Seattle). Photo courtesy of Cascade Bicycle Club.
City Year founded
Per capita income
2010
# of staff
Staff per 1 million people
# of members
(3)
Residents served per one:
Member (3)
Mail contact
Email contact
Atlanta 1991 $0.15 1.5 1.5 550 1,818 1,429 200Austin 1995 $0.02 1 0.7 240 6,250 6,250 714
Boston 1 2005 $0.11 1 1.3 * * 2,000 182Boston 2 1990 $0.07 3 0.5 238 27,704 1,379 2,484Boston 3 2010 $0.02 0.2 0.3 200 3,400 378 272Charlotte 1998 $0.03 0.5 1.0 15 33,333 10,000 208Chicago 1985 $0.36 40 4.7 * * 113 213
Chicago 2 2004 $0.0002 * * * * ø 6,076Cleveland 1 2006 $0.04 1.5 1.5 * * * 200
Cleveland 2 (2) 2003 $0.01 0 0.0 45 22,222 * *Columbus 1 1991 $0.10 3 1.2 200 12,500 2,500 1,000Columbus 2 2008 $0.00 0 0.0 0 ø * 1,786
Dallas 2008 $0.002 0 0.0 40 50,779 * *Denver 2001 $0.04 2 0.9 140 16,786 4,700 1,567
Fort Worth 2008 $0.002 0 0.0 40 50,779 * *Honolulu 2009 $0.24 5 3.9 500 2,590 2,590 2,590
Houston (2) 2004 $0.001 0 0.0 46 49,150 * *Indianapolis 1 1985 $0.16 1 1.2 * * * *Indianapolis 2 2010 $0.01 2.5 3.0 120 6,914 4149 3319
Kansas City, MO 1975 $0.01 0 0.0 300 6,667 6,667 2,353Long Beach 1998 $0.06 8.5 0.9 900 11,111 * 1,333Los Angeles 1998 $0.06 8.5 0.9 900 11,111 * 1,333
Louisville 2005 $0.07 0.5 0.9 * * 246 233Memphis 2005 $0.06 1 1.0 * * 16,667 1,250
Miami 2007 $0.07 0.5 1.2 104 4,165 2,166 866Milwaukee 1988 $0.01 10 1.8 3,000(2) 1,885(2) 480 615
Minneapolis 1 1990 $0.56 4 6.0 * * 149 134Minneapolis 2 1992 $0.60 3 7.8 821 469 82 107New Orleans 2003 $0.07 1 3.3 91 3,297 536 197
New York 1973 $0.27 20 2.4 8,500 1,000 850 170Oakland 2007 $0.23 0.6 1.5 422 926 269 242
Philadelphia 1972 $0.17 12 2.0 1,400 4,286 857 667Portland, OR 1991 $0.18 16 4.2 6,000 414 109 128
Sacramento 1 1991 $0.08 1.6 1.2 900 1,444 1,000 1,857Sacramento 2 1998 $0.11 4 2.9 * * 7,000 4,667
San Diego 1993 $0.08 2 1.5 1,100 1,187 * *San Francisco 1971 $1.61 11 13.6 10,747 75 16 14
Seattle 1 1970 $1.60 25.5 12.8 13,000 154 36 31Seattle 2 2001 $0.12 2 1.0 61 32,787 33,333 33,333Seattle 3 2007 $0.02 1 0.5 * * * 571
Tulsa 2008 $0.16 0 0.0 * * 973 1,947Mean/Average (1) 1996 $0.15 4.9 2.2 1,796 1,522 268 299
Median 1998 $0.07 1.6 1.2 270 4,225 987 667High 2010 $1.61 40 33.3 13,000 50,799 33,333 33,333Low 1970 $0.0002 0 0.00 0 75 16 14
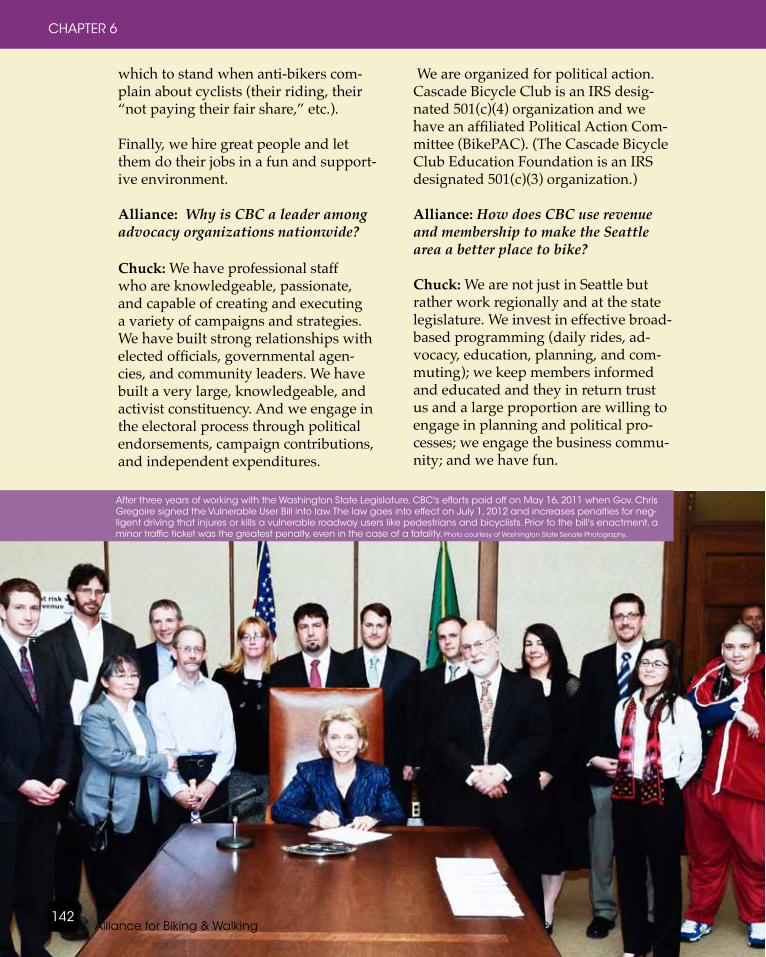
which to stand when anti-bikers com-plain about cyclists (their riding, their “not paying their fair share,” etc.). Finally, we hire great people and let them do their jobs in a fun and support-ive environment. Alliance: Why is CBC a leader among advocacy organizations nationwide? Chuck: We have professional staff who are knowledgeable, passionate, and capable of creating and executing a variety of campaigns and strategies. We have built strong relationships with elected officials, governmental agen-cies, and community leaders. We have built a very large, knowledgeable, and activist constituency. And we engage in the electoral process through political endorsements, campaign contributions, and independent expenditures.
We are organized for political action. Cascade Bicycle Club is an IRS desig-nated 501(c)(4) organization and we have an affiliated Political Action Com-mittee (BikePAC). (The Cascade Bicycle Club Education Foundation is an IRS designated 501(c)(3) organization.) Alliance: How does CBC use revenue and membership to make the Seattle area a better place to bike? Chuck: We are not just in Seattle but rather work regionally and at the state legislature. We invest in effective broad-based programming (daily rides, ad-vocacy, education, planning, and com-muting); we keep members informed and educated and they in return trust us and a large proportion are willing to engage in planning and political pro-cesses; we engage the business commu-nity; and we have fun.
Alliance for Biking & Walking142
CHAPTER 6
After three years of working with the Washington State Legislature, CBC's efforts paid off on May 16, 2011 when Gov. Chris Gregoire signed the Vulnerable User Bill into law. The law goes into effect on July 1, 2012 and increases penalties for neg-ligent driving that injures or kills a vulnerable roadway users like pedestrians and bicyclists. Prior to the bill's enactment, a minor traffic ticket was the greatest penalty, even in the case of a fatality. Photo courtesy of Washington State Senate Photography.

2012 Benchmarking Report 143
INFLUENCING BICYCLING AND WALKING
recent growth in bicycling, and Seville, Spain, a country that has experienced a recent boom in bicycling levels. These two examples demonstrate how policy decisions and investment can play a vital role in determining how many people bicycle and walk.
Environmental InfluencesClimateDoes climate influence the choice to bicycle? The Alliance compared aver-age summer and winter temperatures to bicycle share of work trips in 50 states and did not find any compelling evi-dence that climate is a major influence. Montana and Alaska, for example, are
We are constantly learning what influences bicy-cling and walking. Stud-ies show that a number
of factors contribute to the choice to bicycle or walk (Heinen et al., 2010, Krizek and Forsyth 2009, and Pucher, Dill, Handy 2010). These include envi-ronmental influences such as climate, density, mix of uses, and infrastructure; socioeconomic and demographic factors such as age, gender, and car ownership; and other factors including education and existing levels of bicycling and walking.
This chapter looks at a few potential relationships using data from previ-ous chapters and additional data from the Census and American Community Survey. Also included is a closer look at Oregon, the state with the greatest
7: INFLUENCING BIKING AND WALKING
Park on the Atlanta BeltLine. Photo by Andrew Dannenberg.
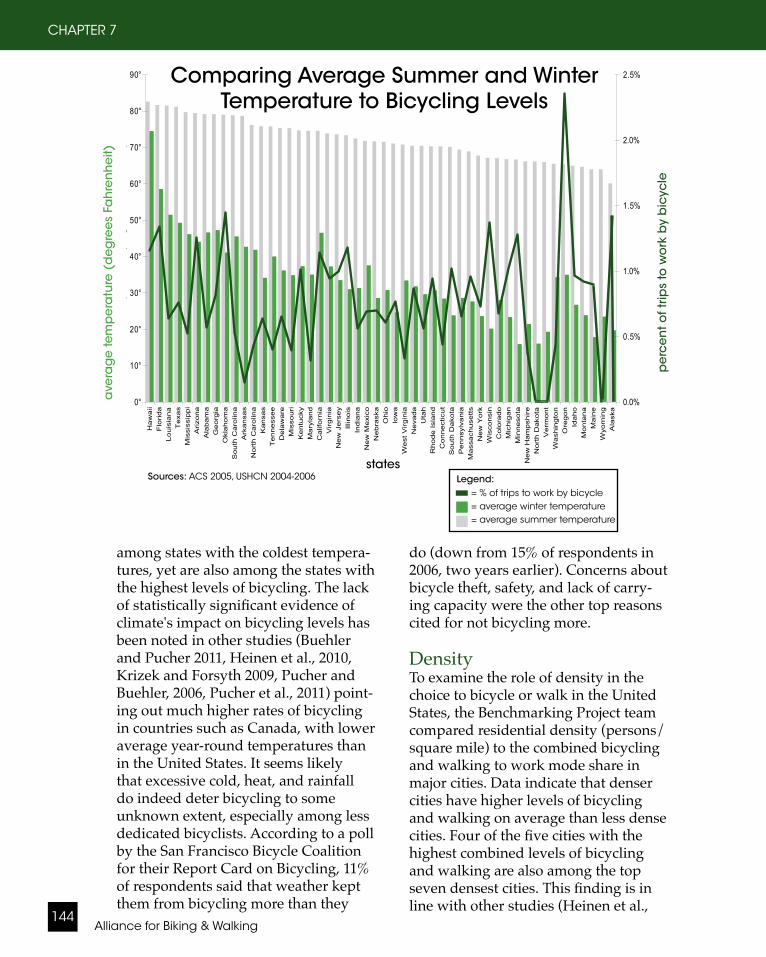
Alliance for Biking & Walking144
CHAPTER 7
0°
0° 1
0° 2
0° 3
0° 4
0° 5
0° 6
0° 7
0°8
0°9
Ha
wa
iiF
lori
da
Lou
isia
na
Texa
sM
issi
ssip
pi
Ari
zona
Ala
ba
ma
Ge
org
iaO
kla
ho
ma
South
Caro
lina
Ark
ansa
sN
ort
h C
aro
lina
Ka
nsa
sT
en
ness
ee
De
law
are
Mis
sou
riK
en
tuck
yM
ary
land
Ca
lifo
rnia
Vir
gin
iaN
ew
Jers
ey
Illin
ois
India
na
New
Mexi
coN
ebra
ska
Oh
ioIo
wa
West
Vir
gin
iaN
eva
da
Uta
hR
ho
de I
slan
dC
onnect
icut
South
Dako
taP
en
nsy
lvan
iaM
ass
ach
use
tts
New
York
Wis
con
sin
Colo
rado
Mic
hig
an
Min
neso
taN
ew
Ha
mp
shir
eN
ort
h D
ako
taV
erm
ont
Wa
shin
gto
nO
reg
on
Idaho
Monta
na
Main
eW
yom
ing
Ala
ska
tem
pera
ture
(degre
es
farh
enheit)
0.0%
5% . 0
1.0%
5% . 1
2.0%
5% . 2 Comparing Average Summer and Winter Temperature to Bicycling Levels
ave
rag
e te
mp
era
ture
(d
eg
ree
s Fa
hre
nh
eit)
pe
rce
nt o
f trip
s to
wo
rk b
y b
icyc
le
statesSources: ACS 2005, USHCN 2004-2006 Legend:
= % of trips to work by bicycle = average winter temperature= average summer temperature
among states with the coldest tempera-tures, yet are also among the states with the highest levels of bicycling. The lack of statistically significant evidence of climate's impact on bicycling levels has been noted in other studies (Buehler and Pucher 2011, Heinen et al., 2010, Krizek and Forsyth 2009, Pucher and Buehler, 2006, Pucher et al., 2011) point-ing out much higher rates of bicycling in countries such as Canada, with lower average year-round temperatures than in the United States. It seems likely that excessive cold, heat, and rainfall do indeed deter bicycling to some unknown extent, especially among less dedicated bicyclists. According to a poll by the San Francisco Bicycle Coalition for their Report Card on Bicycling, 11% of respondents said that weather kept them from bicycling more than they
do (down from 15% of respondents in 2006, two years earlier). Concerns about bicycle theft, safety, and lack of carry-ing capacity were the other top reasons cited for not bicycling more.
DensityTo examine the role of density in the choice to bicycle or walk in the United States, the Benchmarking Project team compared residential density (persons/square mile) to the combined bicycling and walking to work mode share in major cities. Data indicate that denser cities have higher levels of bicycling and walking on average than less dense cities. Four of the five cities with the highest combined levels of bicycling and walking are also among the top seven densest cities. This finding is in line with other studies (Heinen et al.,

2012 Benchmarking Report 145
INFLUENCING BICYCLING AND WALKING
DC
, OR
Residential Density and Bicycling and Walking Levels in Major U.S. Cities
cities
% o
f trip
s to
wo
rk b
y b
icyc
le o
r fo
ot
resi
de
nts
pe
r sq
ua
re m
ile
Legend: = % of trips to work by bicycle
or foot= Residents per square mile
Denser cities have higher rates of bicycling and
walking.
Cities with the most residents per square mile have higher levels of bicycling and walking, on average, than less dense cities. Boston, Washington, DC, San Francisco, and New York, four of the five cities with the highest combined rates of bicycling and walking, are also among the top seven densest cities. The least dense cities, including Jacksonville and Nashville, are among the cities with the lowest levels of bicy-cling and walking.
Source: ACS 2009 Note: r = 0.69.
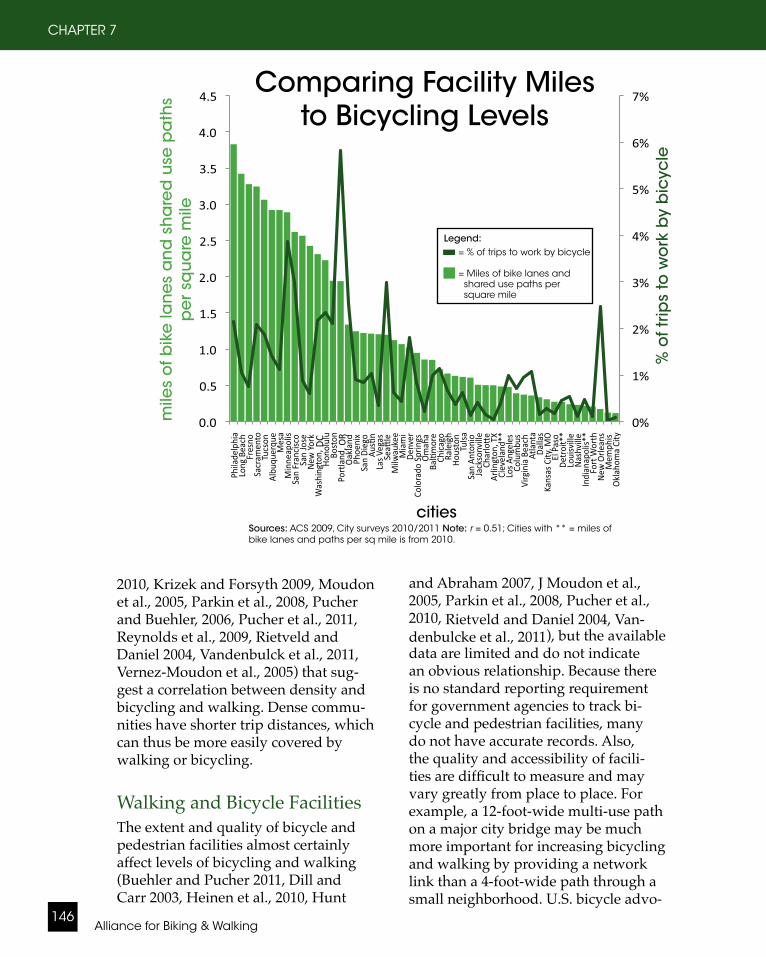
Alliance for Biking & Walking146
CHAPTER 7
R= 0.511211856
Cities with ** = miles of bike lanes and paths per sq mile is from 2010
, OR
continue working on final draft comments/edits
DC
Comparing Facility Miles to Bicycling Levels
% o
f trip
s to
wo
rk b
y b
icyc
le
mile
s o
f bik
e la
ne
s a
nd
sh
are
d u
se p
ath
s
pe
r sq
ua
re m
ile
cities
Legend: = % of trips to work by bicycle
= Miles of bike lanes and shared use paths per square mile
Sources: ACS 2009, City surveys 2010/2011 Note: r = 0.51; Cities with ** = miles of bike lanes and paths per sq mile is from 2010.
2010, Krizek and Forsyth 2009, Moudon et al., 2005, Parkin et al., 2008, Pucher and Buehler, 2006, Pucher et al., 2011, Reynolds et al., 2009, Rietveld and Daniel 2004, Vandenbulck et al., 2011, Vernez-Moudon et al., 2005) that sug-gest a correlation between density and bicycling and walking. Dense commu-nities have shorter trip distances, which can thus be more easily covered by walking or bicycling.
Walking and Bicycle FacilitiesThe extent and quality of bicycle and pedestrian facilities almost certainly affect levels of bicycling and walking (Buehler and Pucher 2011, Dill and Carr 2003, Heinen et al., 2010, Hunt
and Abraham 2007, J Moudon et al., 2005, Parkin et al., 2008, Pucher et al., 2010, Rietveld and Daniel 2004, Van-denbulcke et al., 2011), but the available data are limited and do not indicate an obvious relationship. Because there is no standard reporting requirement for government agencies to track bi-cycle and pedestrian facilities, many do not have accurate records. Also, the quality and accessibility of facili-ties are difficult to measure and may vary greatly from place to place. For example, a 12-foot-wide multi-use path on a major city bridge may be much more important for increasing bicycling and walking by providing a network link than a 4-foot-wide path through a small neighborhood. U.S. bicycle advo-

2012 Benchmarking Report 147
INFLUENCING BICYCLING AND WALKING
cates commonly look to places like the Netherlands where cities have invested heavily in an infrastructure network for bicycling. These investments (includ-ing bike lanes, separated paths, and specialized signals and traffic signs for bicyclists) may contribute to a bicycling mode share that reaches between 30% to 50% in many Dutch cities (Pucher and Buehler, 2007 and 2008). This report compared miles of bicycle facilities per square mile to levels of bicycling in cities. Results suggest there may be a re-lationship between facilities and mode share. Although it is not true in every case, the general trend is that cities with higher levels of bicycling have more bicycle facilities per square mile than cities with lower bicycling levels.
Socioeconomics and Demographics
IncomeIncome could play a role in the deci-sion to bicycle or walk (Buehler and Pucher 2011, Shafizadeh and Niemeier 1997, Vandenbulcke et al., 2011). As graphs in Chapter 3 show, bicycling levels are fairly even among various income groups although the majority of pedestrians earn less than $35,000 a year. Among states, 46% of people who walk to work earn less than $15,000 a year. Nearly 3/4 of people who walk to work nationwide earn less than $35,000 a year. Although income may play a role in the decision to walk to work for some people, among cities with higher levels of walking, such as New York, in-come levels are more evenly distributed among pedestrians. This suggests that income alone is not an important factor
Pho
to c
ou
rte
sy o
f Ma
ds
Boe
dke
r @ F
lickr
in the decision to walk in dense transit-oriented cities.
Car OwnershipOwning a car is definitely related to levels of walking and bicycling (Van-denbulcke et al., 2011). According to the 2009 ACS, cities with the highest levels of bicycling and walking have the low-est car ownership rates. Although the statistical relationship is strong (r = 0.77), the causation probably runs in both directions. Those who walk or bicycle a lot are less likely to need or want a car. And those who do not own a car are more likely to need to walk or bicycle for some trips. In any case, it is clear that high levels of car ownership are strongly related to low levels of walking and bicycling.

Alliance for Biking & Walking148
CHAPTER 7
San Diego 4% 6.87%Raleigh 3% 6.76%
Albuquerque 3% 6.34%Austin 3% 6.14%Mesa 3% 5.57%
San Jose 3% 4.95%
Virginia Beach 3% 4.38%
Arlington CBD 2% 4.37%0.767003459
, OR
, DC
% o
f trip
s to
wo
rk b
y b
icyc
le o
r fo
ot
% o
f ho
use
ho
lds
tha
t do
no
t ow
n a
ca
r
cities
Legend: = % of trips to work by bicycle
or foot= % of households that do not own a car
Source: ACS 2009 Note: r = 0.77.
Levels of Bicycling, Walking, and SafetyTo see how levels of bicycling and walking affect safety, the Benchmarking Project team compared fatality data re-ported by cities to ACS 2009 bicycle and pedestrian mode share (trips to work). Results were consistent with previous research (Elvik 2009, Jacobsen 2003, Pucher et al., 2011, Vandenbulcke et al., 2009) indicating a negative correlation between levels of bicycling and walking and fatality rates. Cities with the high-est levels of bicycling generally have
Comparing Car Ownership to Bicycling and Walking Levels
lower bicycle fatality rates. Cities with the highest rates of pedestrian fatalities are also among those with the lowest levels of walking. A possible explana-tion could be that in places where more bicyclists and pedestrians are present, motorists are more used to sharing the roadways with bicyclists and are more aware of pedestrians at crossings. Environmental factors that contribute to increased bicycling and walking (such as signed routes, bike lanes, and side-walks) may also contribute to increased safety.(Continued page 152)

2012 Benchmarking Report 149
INFLUENCING BICYCLING AND WALKING
South Carolina 0.2% 13.32Mississippi 0.2% 14.07
-0.54472806
Relationship between Bicycle Fatalities and Bicycling Levels
% o
f trip
s to
wo
rk b
y b
icyc
le
# o
f bic
yclin
g fa
talit
ies
pe
r 10
K b
icyc
lists
states
Legend: = % of trips to work by bicycle
= Bicycling fatalities per 10K bicyclists
Bicycle safety
increases with more bicycling.
Many studies show that bicycling safety increases greatly as bicycling levels rise (Elvik 2009, Jacobsen 2003, Pucher et al., 2011). For this illustration, bike to work mode share from ACS 2009 was compared to FARS bicycle fatality data (using a 3-year average number of fatalities). To figure the fatality rate, the Alliance divided the number of fatalities by popu-lation (weighted, or multiplied, by share of the population biking to work) (to more accurately determine exposure lev-els). The result is a negative correlation (r = −0.52) that sug-gests greater bicycling levels may mean increased safety for bicyclists.
Sources: ACS 2009, FARS 2007-2009 Notes: Bicyclist fatality rate was calculated by dividing the number of annual bicycle fatalities by population (weighted, or multiplied, by share of the population biking to work). Because of the approximate nature of the exposure data and great fluctuations in fatality data from year to year, this rate should be seen as a rough estimate and not the literal number of fatalities per 10,000 bicyclists.r = −0.54.
Source: ACS 2009 Note: r = 0.77.

Alliance for Biking & Walking150
CHAPTER 7
Louisiana 2% 11.86Florida 2% 16.72
-69%
# o
f pe
de
stria
n fa
talit
ies
pe
r 10
K p
ed
est
rian
s
% o
f trip
s to
wo
rk b
y fo
ot
states
Legend: = % of trips to work by foot
= Pedestrian fatalities per 10K pedestrians
Higher levels of walking
contribute to pedestrian
safety.
States with higher levels of walking have lower rates of pe-destrian fatalities. For this illustration, pedestrian worker mode share from the ACS was compared to FARS data on pedestrian fatalities. To figure fatality rate, the Alliance di-vided the number of fatalities by population (weighted, or multiplied, by share of the population walking to work) (to more accurately determine exposure levels). The result is a negative correlation (r = −0.69) that suggests greater walk-ing levels may mean increased safety for pedestrians.
Sources: ACS 2009, FARS 2007-2009 Notes: Pedestrian fatality rate was calculated by dividing the number of annual pedestrian fatalities by population (weighted, or multiplied, by share of the population walking to work) (to adjust for exposure). Because of the approximate nature of the exposure data and great fluctuations in fatality data from year to year, this rate should be seen as a rough estimate and not the literal number of fatalities per 10,000 pedestrians. r = −0.69.
Relationship between Pedestrian Fatalities and Walking Levels

2012 Benchmarking Report 151
INFLUENCING BICYCLING AND WALKING
Location: Lake Oswego, OR. Photo by Dan Burden, Walkable and Livable Communities Institute
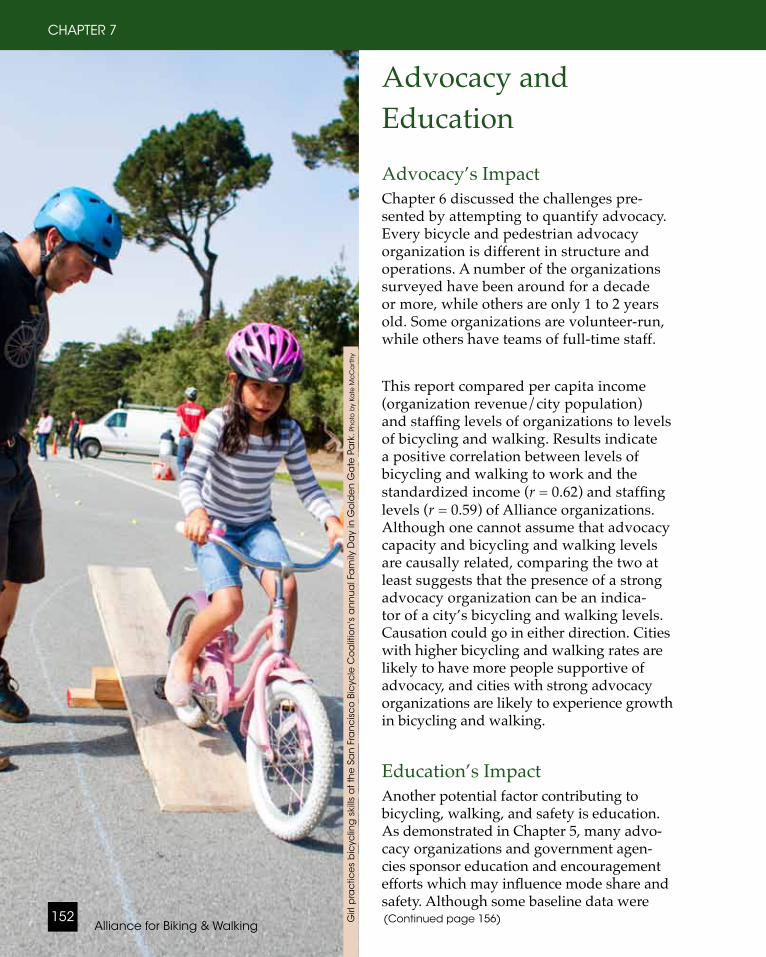
Alliance for Biking & Walking152
CHAPTER 7
Advocacy and Education
Advocacy’s ImpactChapter 6 discussed the challenges pre-sented by attempting to quantify advocacy. Every bicycle and pedestrian advocacy organization is different in structure and operations. A number of the organizations surveyed have been around for a decade or more, while others are only 1 to 2 years old. Some organizations are volunteer-run, while others have teams of full-time staff.
This report compared per capita income (organization revenue/city population) and staffing levels of organizations to levels of bicycling and walking. Results indicate a positive correlation between levels of bicycling and walking to work and the standardized income (r = 0.62) and staffing levels (r = 0.59) of Alliance organizations. Although one cannot assume that advocacy capacity and bicycling and walking levels are causally related, comparing the two at least suggests that the presence of a strong advocacy organization can be an indica-tor of a city’s bicycling and walking levels. Causation could go in either direction. Cities with higher bicycling and walking rates are likely to have more people supportive of advocacy, and cities with strong advocacy organizations are likely to experience growth in bicycling and walking.
Education’s ImpactAnother potential factor contributing to bicycling, walking, and safety is education. As demonstrated in Chapter 5, many advo-cacy organizations and government agen-cies sponsor education and encouragement efforts which may influence mode share and safety. Although some baseline data were (Continued page 156)G
irl p
rac
tice
s b
icyc
ling
ski
lls a
t th
e S
an
Fra
nc
isc
o B
icyc
le C
oa
litio
n's
an
nu
al F
am
ily D
ay
in G
old
en
Ga
te P
ark
. Ph
oto
by
Kate
Mc
Ca
rthy

2012 Benchmarking Report 153
INFLUENCING BICYCLING AND WALKING
Relationship between Advocacy Capacity and Mode Share
% o
f trip
s to
wo
rk b
y b
icyc
le o
r fo
ot
org
an
iza
tion
inc
om
e (
in d
olla
rs)
pe
r 10
resi
de
nts
/nu
mb
er
of a
dvo
ca
cy
sta
ff p
er
mill
ion
pe
op
lecities
Legend: = % of trips to work by bicycle
or foot= Organization's income (in dollars) per 10 residents= Number of advocacy staff per million people
Advocacy capacity may be linked to higher levels of bicycling and
walking.
The Alliance compared the combined levels of bi-cycling and walking to work from the ACS 2009 to standardized income and staffing levels of Alliance organizations serving these cities. Positive correla-tions (r = 0.62 and r = 0.59) suggest that a relation-ship may exist between advocacy capacity and lev-els of bicycling and walking.
Sources: ACS 2009, Alliance for Biking & Walking 2011 Notes: r = 0.62 (organization income per 10 residents/bike + walk levels) r = 0.59 (organization staffing per million residents/bike + walk levels).
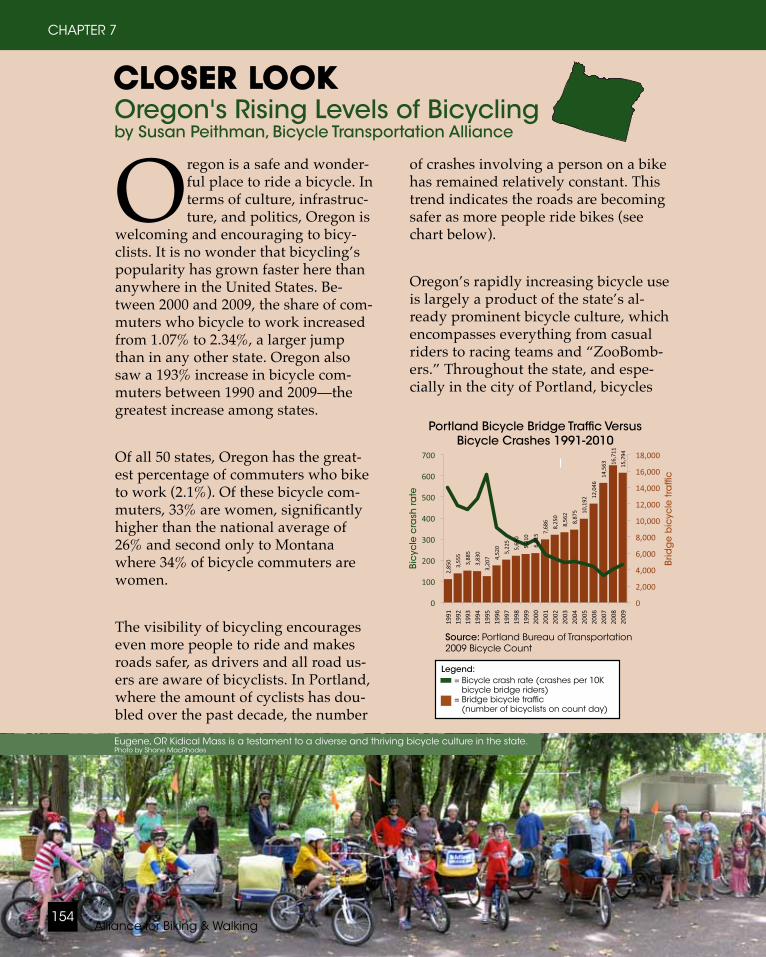
Alliance for Biking & Walking154
CHAPTER 7
Oregon is a safe and wonder-ful place to ride a bicycle. In terms of culture, infrastruc-ture, and politics, Oregon is
welcoming and encouraging to bicy-clists. It is no wonder that bicycling’s popularity has grown faster here than anywhere in the United States. Be-tween 2000 and 2009, the share of com-muters who bicycle to work increased from 1.07% to 2.34%, a larger jump than in any other state. Oregon also saw a 193% increase in bicycle com-muters between 1990 and 2009—the greatest increase among states.
Of all 50 states, Oregon has the great-est percentage of commuters who bike to work (2.1%). Of these bicycle com-muters, 33% are women, significantly higher than the national average of 26% and second only to Montana where 34% of bicycle commuters are women.
The visibility of bicycling encourages even more people to ride and makes roads safer, as drivers and all road us-ers are aware of bicyclists. In Portland, where the amount of cyclists has dou-bled over the past decade, the number
CLOSER LOOKOregon's Rising Levels of Bicyclingby Susan Peithman, Bicycle Transportation Alliance
of crashes involving a person on a bike has remained relatively constant. This trend indicates the roads are becoming safer as more people ride bikes (see chart below).
Oregon’s rapidly increasing bicycle use is largely a product of the state’s al-ready prominent bicycle culture, which encompasses everything from casual riders to racing teams and “ZooBomb-ers.” Throughout the state, and espe-cially in the city of Portland, bicycles
Eugene, OR Kidical Mass is a testament to a diverse and thriving bicycle culture in the state. Photo by Shane MacRhodes
Year Bridge Bicycle Traffic Bikeway Miles1991 2850 791992 3555 84.51993 3885 871994 3830 1041995 3207 1141996 4520 1441997 5225 1671998 5690 1831999 5910 2142000 6015 222.52001 7686 2362002 8250 2532003 8562 2562004 8875 2622005 10192 265.52006 12046 2692007 14563 2722008 16711 2742009 15749 2812010 17576 299
Year19911992199319941995199619971998199920002001200220032004200520062007200820092010
Bicycle Traffic across Four Main Portland Bicycle Bridges Juxtaposed with Bikeway Miles
Portland Bicycle Bridge Traffic Versus Bicycle Crashes 1991-2010
Bic
ycle
cra
sh ra
te
Brid
ge
bic
ycle
tra
ffic
Source: Portland Bureau of Transportation 2009 Bicycle Count
Legend: = Bicycle crash rate (crashes per 10K
bicycle bridge riders)= Bridge bicycle traffic (number of bicyclists on count day)
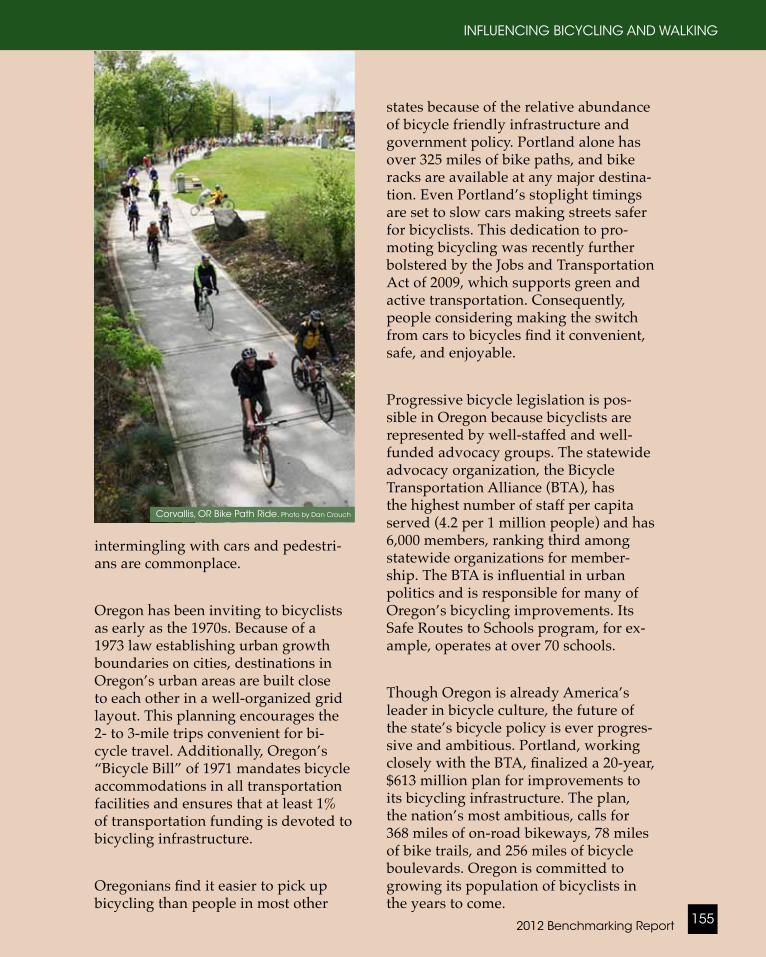
states because of the relative abundance of bicycle friendly infrastructure and government policy. Portland alone has over 325 miles of bike paths, and bike racks are available at any major destina-tion. Even Portland’s stoplight timings are set to slow cars making streets safer for bicyclists. This dedication to pro-moting bicycling was recently further bolstered by the Jobs and Transportation Act of 2009, which supports green and active transportation. Consequently, people considering making the switch from cars to bicycles find it convenient, safe, and enjoyable.
Progressive bicycle legislation is pos-sible in Oregon because bicyclists are represented by well-staffed and well-funded advocacy groups. The statewide advocacy organization, the Bicycle Transportation Alliance (BTA), has the highest number of staff per capita served (4.2 per 1 million people) and has 6,000 members, ranking third among statewide organizations for member-ship. The BTA is influential in urban politics and is responsible for many of Oregon’s bicycling improvements. Its Safe Routes to Schools program, for ex-ample, operates at over 70 schools. Though Oregon is already America’s leader in bicycle culture, the future of the state’s bicycle policy is ever progres-sive and ambitious. Portland, working closely with the BTA, finalized a 20-year, $613 million plan for improvements to its bicycling infrastructure. The plan, the nation’s most ambitious, calls for 368 miles of on-road bikeways, 78 miles of bike trails, and 256 miles of bicycle boulevards. Oregon is committed to growing its population of bicyclists in the years to come.
2012 Benchmarking Report 155
INFLUENCING BICYCLING AND WALKING
intermingling with cars and pedestri-ans are commonplace.
Oregon has been inviting to bicyclists as early as the 1970s. Because of a 1973 law establishing urban growth boundaries on cities, destinations in Oregon’s urban areas are built close to each other in a well-organized grid layout. This planning encourages the 2- to 3-mile trips convenient for bi-cycle travel. Additionally, Oregon’s “Bicycle Bill” of 1971 mandates bicycle accommodations in all transportation facilities and ensures that at least 1% of transportation funding is devoted to bicycling infrastructure.
Oregonians find it easier to pick up bicycling than people in most other
Corvallis, OR Bike Path Ride. Photo by Dan Crouch
Source: Portland Bureau of Transportation 2009 Bicycle Count
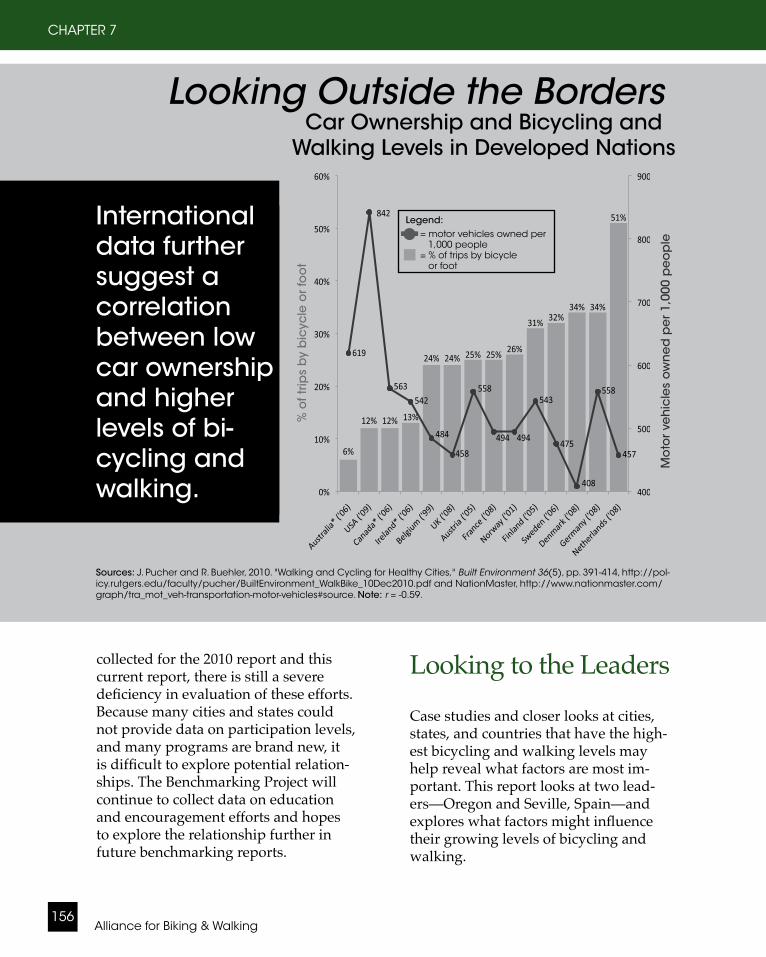
Looking Outside the Borders Car Ownership and Bicycling and Walking Levels in Developed Nations
Alliance for Biking & Walking156
CHAPTER 7
collected for the 2010 report and this current report, there is still a severe deficiency in evaluation of these efforts. Because many cities and states could not provide data on participation levels, and many programs are brand new, it is difficult to explore potential relation-ships. The Benchmarking Project will continue to collect data on education and encouragement efforts and hopes to explore the relationship further in future benchmarking reports.
ceList_of_countries_by_vehicles_per_capita#cite_note-0
% o
f trip
s b
y b
icyc
le o
r fo
ot
Mo
tor
veh
icle
s o
wn
ed
pe
r 1,
000
pe
op
le
International data further suggest a correlation between low car ownership and higher levels of bi-cycling and walking.
Sources: J. Pucher and R. Buehler, 2010. "Walking and Cycling for Healthy Cities," BuiltEnvironment36(5), pp. 391-414, http://pol-icy.rutgers.edu/faculty/pucher/BuiltEnvironment_WalkBike_10Dec2010.pdf and NationMaster, http://www.nationmaster.com/graph/tra_mot_veh-transportation-motor-vehicles#source. Note: r = -0.59.
Looking to the Leaders
Case studies and closer looks at cities, states, and countries that have the high-est bicycling and walking levels may help reveal what factors are most im-portant. This report looks at two lead-ers—Oregon and Seville, Spain—and explores what factors might influence their growing levels of bicycling and walking.
Legend: = motor vehicles owned per
1,000 people = % of trips by bicycle or foot
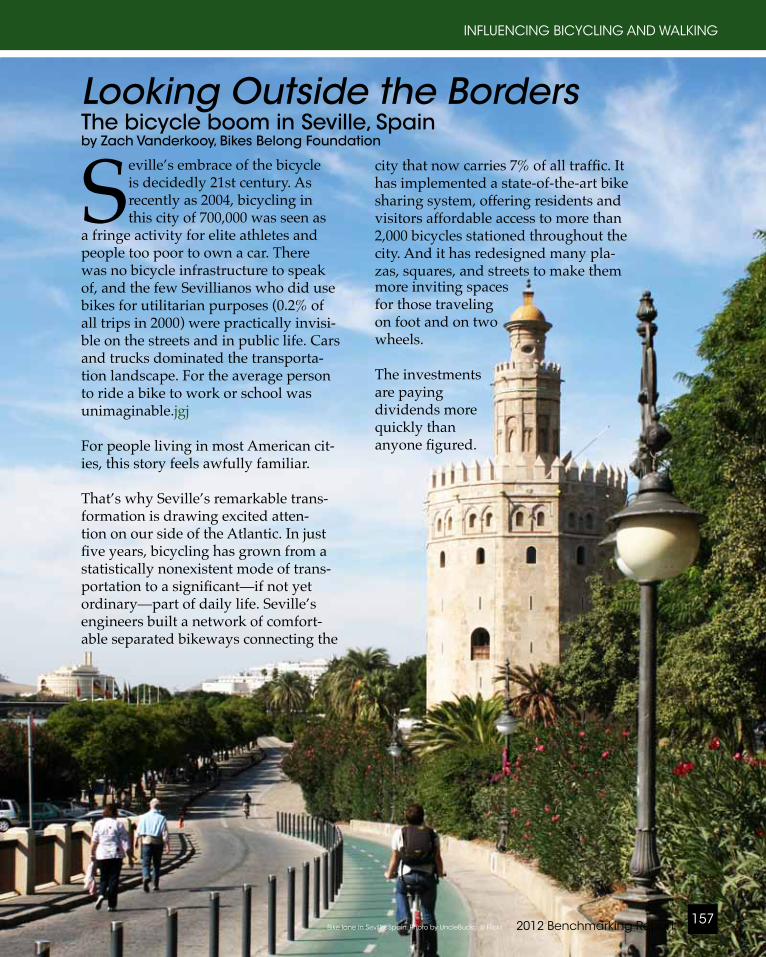
Looking Outside the BordersThe bicycle boom in Seville, Spainby Zach Vanderkooy, Bikes Belong Foundation
Seville’s embrace of the bicycle is decidedly 21st century. As recently as 2004, bicycling in this city of 700,000 was seen as
a fringe activity for elite athletes and people too poor to own a car. There was no bicycle infrastructure to speak of, and the few Sevillianos who did use bikes for utilitarian purposes (0.2% of all trips in 2000) were practically invisi-ble on the streets and in public life. Cars and trucks dominated the transporta-tion landscape. For the average person to ride a bike to work or school was unimaginable.jgj
For people living in most American cit-ies, this story feels awfully familiar.
That’s why Seville’s remarkable trans-formation is drawing excited atten-tion on our side of the Atlantic. In just five years, bicycling has grown from a statistically nonexistent mode of trans-portation to a significant—if not yet ordinary—part of daily life. Seville’s engineers built a network of comfort-able separated bikeways connecting the
city that now carries 7% of all traffic. It has implemented a state-of-the-art bike sharing system, offering residents and visitors affordable access to more than 2,000 bicycles stationed throughout the city. And it has redesigned many pla-zas, squares, and streets to make them more inviting spaces for those traveling on foot and on two wheels.
The investments are paying dividends more quickly than anyone figured.
2012 Benchmarking Report 157
INFLUENCING BICYCLING AND WALKING
Bike lane in Seville, Spain. Photo by UncleBucko @ Flickr.
Traffic congestion and pollution are declining for the first time in 30 years. Businesses are thriving along bike routes and around the newly improved public spaces that are breathing fresh life into the central city. The number of car trips into the historic city center has plummeted from 25,000 a day to 10,000, freeing valuable space for residents to park and visitors to linger. More than 70,000 bike trips are made every day, up from just 2,500 in 2002. Bicycling has given Sevillianos a healthy, speedy new way to get around.
Designing a better cityWhen it came to designing Seville’s bicycle infrastructure, the city looked north for inspiration. David Muñoz de la Torre, Director of Seville’s Bike Program, cites the Netherlands as a key influence in shaping the city’s bikeway system. “We wanted to create a com-plete network, not a piecemeal system,” he emphasized. Nothing discourages potential bike riders more than bike lanes that end abruptly, forcing them to mix with fast-moving cars. Seville’s bikeways continue through intersec-tions, around roundabouts, and across zigzags, making navigation a breeze — just follow the impossible-to-miss bright green path and you’ll stay on route.
All the bikeways along major roads are physically separated from car and pedestrian traffic as much as possible. City leaders explain that protection from traffic is a key factor in making the system appealing to less experienced riders, particularly children, women, and older people. “Our design target is a 65-year old woman with grocer-ies,” explained Muñoz de la Torre. He reasons that if bicycling is safe for her, it is safe for everyone.
The entire 87-mile network cost about $43 million to install between 2007 and 2009—a bargain when you consider that a single mile of urban freeway in the United States easily costs twice as much. With the core bicycling network now in place, Muñoz de la Torre says the city is focused on improving dif-ficult crossings and tight squeezes on the streets, installing more bike parking, and launching public education cam-paigns as the next steps to boost bicycle
-
• Seville added 87 miles of new bike infra-structure in 36 months between 2007 and 2009.
• 85% of the space came from removal of car parking and travel lanes; 15% came from pedestrian space (which was com-pensated for by major, new additions to public space in other places).
• The improvements increased the percent-age of all trips taken by bicycle from 0.4% to ~ 7%.
• In 2005, the Alameda de Hercules, a major public plaza, was redesigned to be more inviting to people on bikes and on foot. More than 100 public meetings were held to discuss the plan, which required reallo-cating 200 parking spaces to make room for new public space. Initially neighbors and local businesses strongly opposed the changes, but now 22% of customers arrive by bike and businesses along the plaza are thriving.
• City Council passed a law that restricts non-resident auto access into the cramped central city; the law reduced the daily number of cars in downtown from 25,000 to 10,000, drastically reducing congestion.
• “Great is the enemy of good.” The city’s infrastructure emphasizes network con-nectivity, not perfection. It’s far from the polished bikeways of Northern Europe, but the protected bikeways of Seville are safe, convenient, and get you where you need to go without interruption.
Quick Facts
Alliance for Biking & Walking158
CHAPTER 7
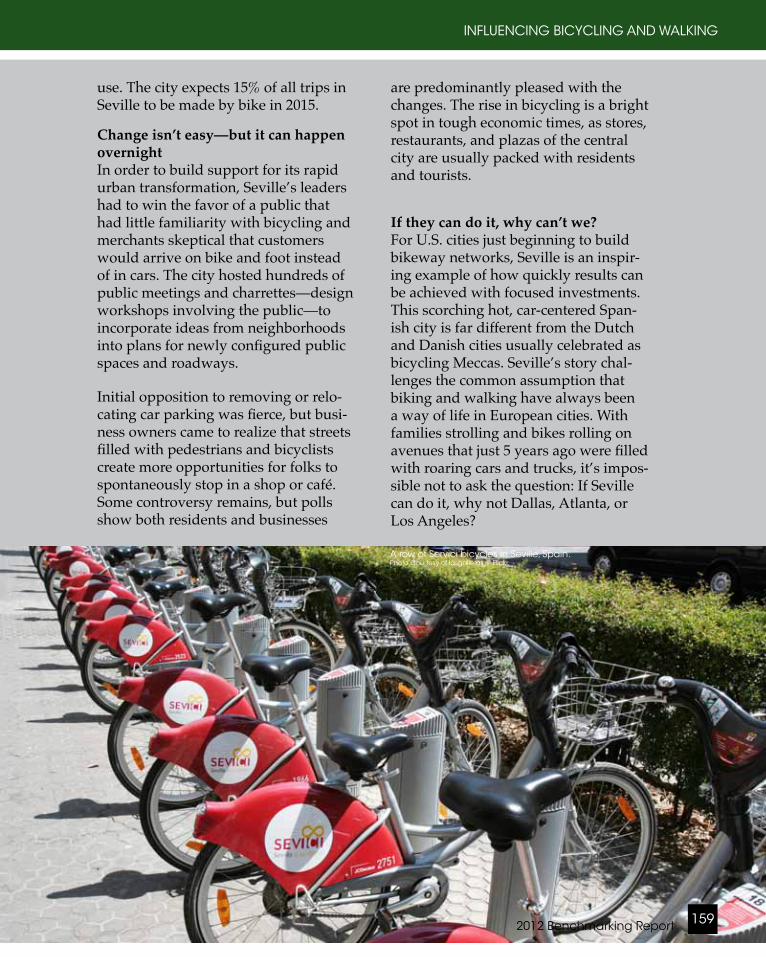
use. The city expects 15% of all trips in Seville to be made by bike in 2015.
Change isn’t easy—but it can happen overnightIn order to build support for its rapid urban transformation, Seville’s leaders had to win the favor of a public that had little familiarity with bicycling and merchants skeptical that customers would arrive on bike and foot instead of in cars. The city hosted hundreds of public meetings and charrettes—design workshops involving the public—to incorporate ideas from neighborhoods into plans for newly configured public spaces and roadways.
Initial opposition to removing or relo-cating car parking was fierce, but busi-ness owners came to realize that streets filled with pedestrians and bicyclists create more opportunities for folks to spontaneously stop in a shop or café. Some controversy remains, but polls show both residents and businesses
are predominantly pleased with the changes. The rise in bicycling is a bright spot in tough economic times, as stores, restaurants, and plazas of the central city are usually packed with residents and tourists.
If they can do it, why can’t we?For U.S. cities just beginning to build bikeway networks, Seville is an inspir-ing example of how quickly results can be achieved with focused investments. This scorching hot, car-centered Span-ish city is far different from the Dutch and Danish cities usually celebrated as bicycling Meccas. Seville’s story chal-lenges the common assumption that biking and walking have always been a way of life in European cities. With families strolling and bikes rolling on avenues that just 5 years ago were filled with roaring cars and trucks, it’s impos-sible not to ask the question: If Seville can do it, why not Dallas, Atlanta, or Los Angeles?
Quick Facts
2012 Benchmarking Report 159
INFLUENCING BICYCLING AND WALKING
A row of Servici bicycles in Seville, Spain. Photo Courtesy of lasgalletas @ Flickr.
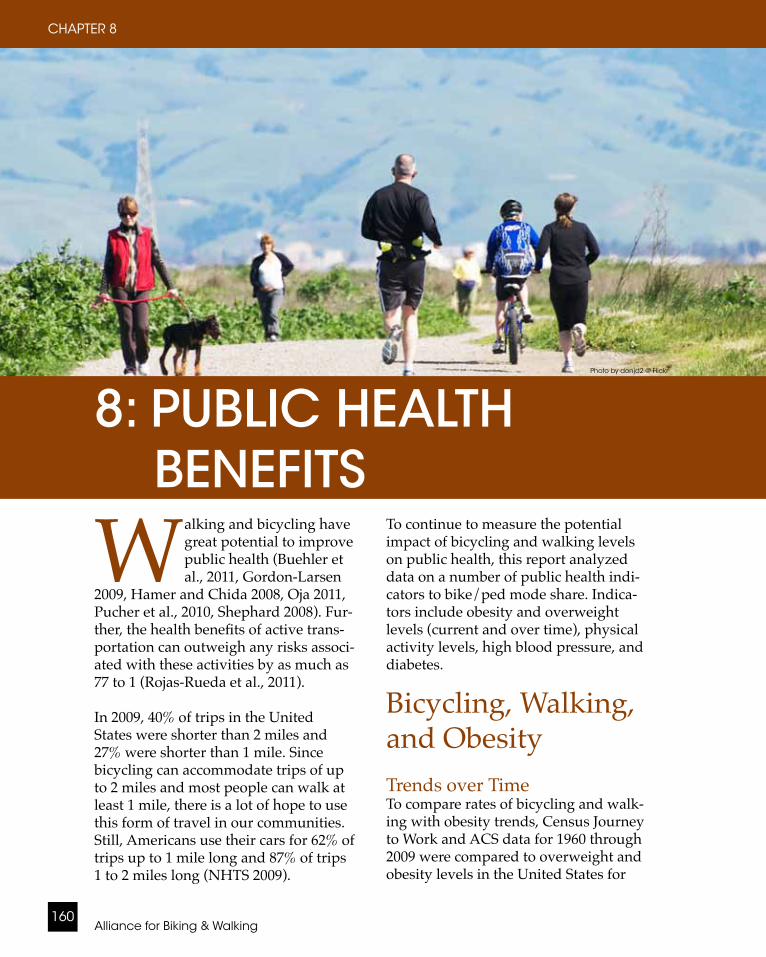
Alliance for Biking & Walking160
CHAPTER 8
8: PUBLIC HEALTH BENEFITS
Walking and bicycling have great potential to improve public health (Buehler et al., 2011, Gordon-Larsen
2009, Hamer and Chida 2008, Oja 2011, Pucher et al., 2010, Shephard 2008). Fur-ther, the health benefits of active trans-portation can outweigh any risks associ-ated with these activities by as much as 77 to 1 (Rojas-Rueda et al., 2011).
In 2009, 40% of trips in the United States were shorter than 2 miles and 27% were shorter than 1 mile. Since bicycling can accommodate trips of up to 2 miles and most people can walk at least 1 mile, there is a lot of hope to use this form of travel in our communities. Still, Americans use their cars for 62% of trips up to 1 mile long and 87% of trips 1 to 2 miles long (NHTS 2009).
To continue to measure the potential impact of bicycling and walking levels on public health, this report analyzed data on a number of public health indi-cators to bike/ped mode share. Indica-tors include obesity and overweight levels (current and over time), physical activity levels, high blood pressure, and diabetes.
Bicycling, Walking, and Obesity Trends over TimeTo compare rates of bicycling and walk-ing with obesity trends, Census Journey to Work and ACS data for 1960 through 2009 were compared to overweight and obesity levels in the United States for
Photo by donjd2 @ Flickr

ph
oto
by
Da
ve D
ela
ney
2012 Benchmarking Report 161
PUBLIC HEALTH BENEFITS
Trend in Obese Children vs. Rate of Bicycling and Walking to School
Change in Bicycling and Walking Rates vs. Adult Obesity Rates
yearsp
erc
en
t of t
rips
by
bic
ycle
o
r fo
ot
pe
rce
nt o
be
se
Sources: Ogden and Carroll 2010, Census 1960,1970,1980,1990, 2000, ACS 2009 Note: bicy-cling was not separated from “other”modes in early Census surveys, so 1960 and 1970 levels shown are for walking only; r = −0.93 (bicycle + walk/over-weight);r = −0.87 (bicycle + walk/obesity).
pe
rce
nt o
f ch
ildre
n w
ho
wa
lk
or
bic
ycle
to s
ch
oo
l
pe
rce
nt o
f ch
ildre
n w
ho
are
o
be
se
years
Sources: CDC, NHANES, McDonald 2007, Ogden and Car-roll 2010, NHTS 2009 Note: r = -0.70.
Legend: = % of trips to work by
bicycle or foot= % obese
Legend: = % of kids who bicycle
or walk to school= % of kids who are obese
the same time period. These data show that as bicycling and walking levels have plummeted, overweight levels have steadily increased and obesity levels have soared. The decrease in bicycling and walking may be even greater since these data do not take into account any trips besides work trips (walking and bicycling to school, for example, would not be counted here). Also, bicycling was not separated from “other”modes in early Census surveys, so 1960 and 1970 levels shown are for walking only. While bicycling and walking levels fell 66% between 1960 and 2009, obesity levels increased by 156%. Although these two trends are not the only factors involved, the cor-relation cannot be ignored.
This report also looked at data on childhood obesity prevalence from the CDC's National Health and Nutrition
Examination Survey (NHANES) and data on levels of bicycling and walking to school from the NHTS (McDonald 2007, NHTS 2009) over a similar time period. The data demonstrate a parallel trend among schoolchildren in this time period. Levels of bicycling and walking to school declined sharply while child-(Continued page 173)
Photo by donjd2 @ Flickr
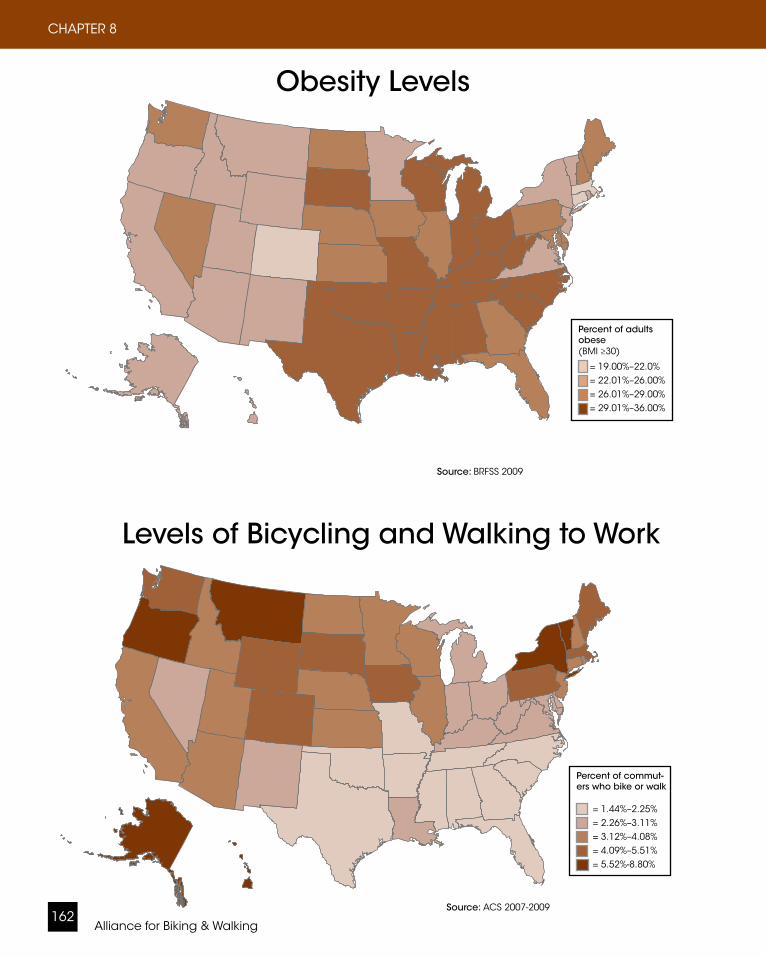
Alliance for Biking & Walking162
CHAPTER 8
Obesity Levels
Levels of Bicycling and Walking to Work
Percent of adults obese (BMI ≥30)
= 19.00%–22.0%= 22.01%–26.00%= 26.01%–29.00%= 29.01%–36.00%
Source: BRFSS 2009
Source: ACS 2007-2009
Percent of commut-ers who bike or walk
= 1.44%–2.25%= 2.26%–3.11%= 3.12%–4.08%= 4.09%–5.51%= 5.52%-8.80%
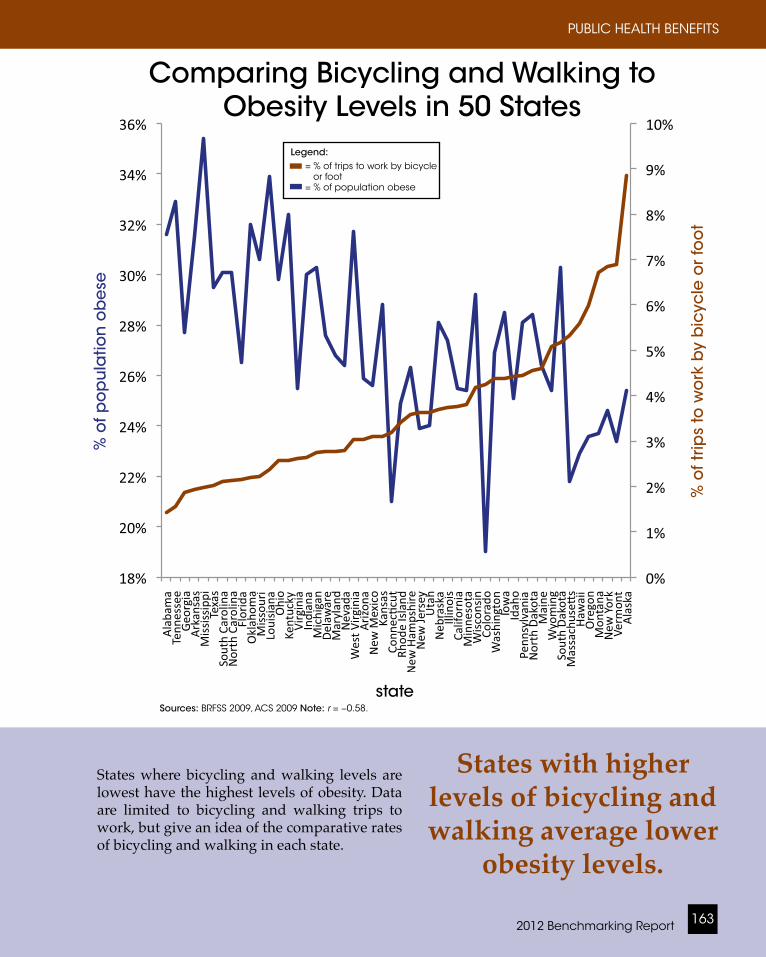
2012 Benchmarking Report 163
PUBLIC HEALTH BENEFITS
Comparing Bicycling and Walking to Obesity Levels in 50 States
Sources: BRFSS 2009, ACS 2009 Note: r = −0.58.
States with higher levels of bicycling and walking average lower
obesity levels.
States where bicycling and walking levels are lowest have the highest levels of obesity. Data are limited to bicycling and walking trips to work, but give an idea of the comparative rates of bicycling and walking in each state.
% o
f trip
s to
wo
rk b
y b
icyc
le o
r fo
ot
% o
f po
pu
latio
n o
be
se
Legend: = % of trips to work by bicycle
or foot= % of population obese
state
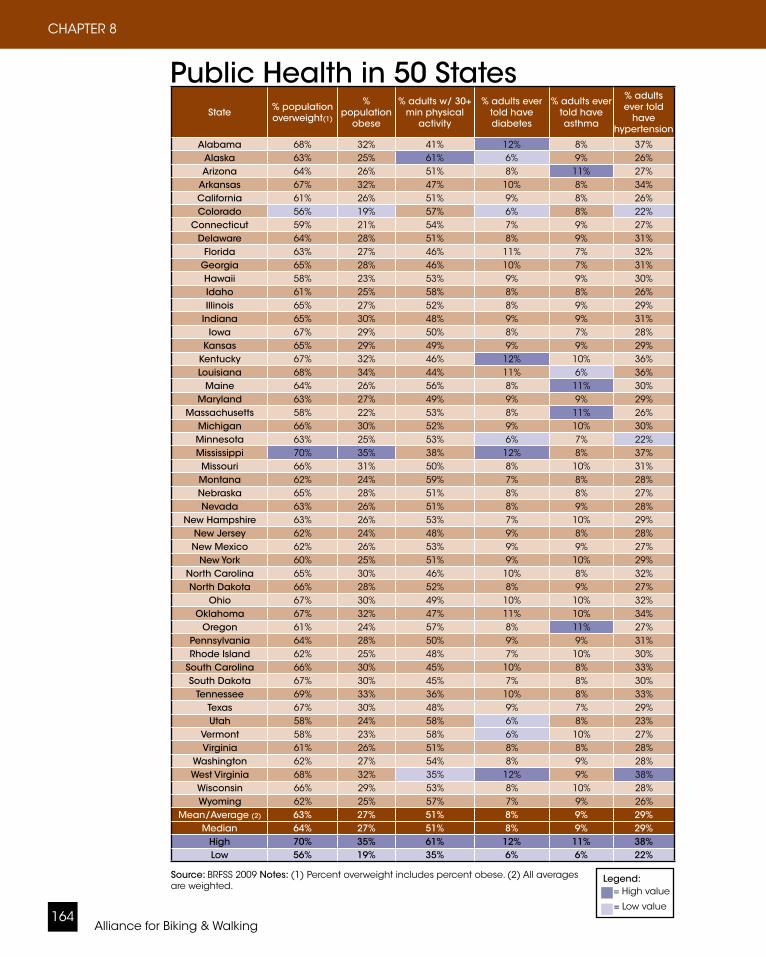
Alliance for Biking & Walking164
CHAPTER 8
State % population overweight(1)
% population
obese
% adults w/ 30+ min physical
activity
% adults ever told have diabetes
% adults ever told have asthma
% adults ever told
have hypertension
Alabama 68% 32% 41% 12% 8% 37%Alaska 63% 25% 61% 6% 9% 26%Arizona 64% 26% 51% 8% 11% 27%
Arkansas 67% 32% 47% 10% 8% 34%California 61% 26% 51% 9% 8% 26%Colorado 56% 19% 57% 6% 8% 22%
Connecticut 59% 21% 54% 7% 9% 27%Delaware 64% 28% 51% 8% 9% 31%
Florida 63% 27% 46% 11% 7% 32%Georgia 65% 28% 46% 10% 7% 31%Hawaii 58% 23% 53% 9% 9% 30%Idaho 61% 25% 58% 8% 8% 26%Illinois 65% 27% 52% 8% 9% 29%
Indiana 65% 30% 48% 9% 9% 31%Iowa 67% 29% 50% 8% 7% 28%
Kansas 65% 29% 49% 9% 9% 29%Kentucky 67% 32% 46% 12% 10% 36%Louisiana 68% 34% 44% 11% 6% 36%
Maine 64% 26% 56% 8% 11% 30%Maryland 63% 27% 49% 9% 9% 29%
Massachusetts 58% 22% 53% 8% 11% 26%Michigan 66% 30% 52% 9% 10% 30%Minnesota 63% 25% 53% 6% 7% 22%Mississippi 70% 35% 38% 12% 8% 37%Missouri 66% 31% 50% 8% 10% 31%Montana 62% 24% 59% 7% 8% 28%Nebraska 65% 28% 51% 8% 8% 27%Nevada 63% 26% 51% 8% 9% 28%
New Hampshire 63% 26% 53% 7% 10% 29%New Jersey 62% 24% 48% 9% 8% 28%New Mexico 62% 26% 53% 9% 9% 27%
New York 60% 25% 51% 9% 10% 29%North Carolina 65% 30% 46% 10% 8% 32%North Dakota 66% 28% 52% 8% 9% 27%
Ohio 67% 30% 49% 10% 10% 32%Oklahoma 67% 32% 47% 11% 10% 34%
Oregon 61% 24% 57% 8% 11% 27%Pennsylvania 64% 28% 50% 9% 9% 31%Rhode Island 62% 25% 48% 7% 10% 30%
South Carolina 66% 30% 45% 10% 8% 33%South Dakota 67% 30% 45% 7% 8% 30%
Tennessee 69% 33% 36% 10% 8% 33%Texas 67% 30% 48% 9% 7% 29%Utah 58% 24% 58% 6% 8% 23%
Vermont 58% 23% 58% 6% 10% 27%Virginia 61% 26% 51% 8% 8% 28%
Washington 62% 27% 54% 8% 9% 28%West Virginia 68% 32% 35% 12% 9% 38%
Wisconsin 66% 29% 53% 8% 10% 28%Wyoming 62% 25% 57% 7% 9% 26%
Mean/Average (2) 63% 27% 51% 8% 9% 29%Median 64% 27% 51% 8% 9% 29%
High 70% 35% 61% 12% 11% 38%Low 56% 19% 35% 6% 6% 22%
Public Health in 50 States
Source: BRFSS 2009 Notes: (1) Percent overweight includes percent obese. (2) All averages are weighted.
Legend: = High value = Low value
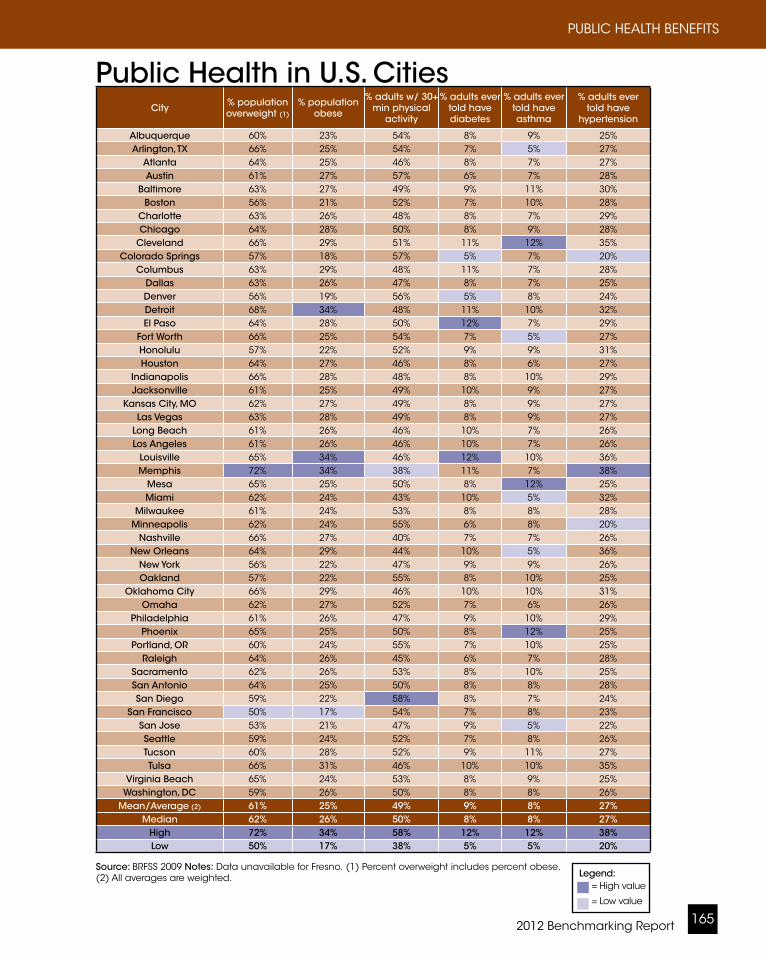
2012 Benchmarking Report 165
PUBLIC HEALTH BENEFITS
City % population overweight (1)
% population obese
% adults w/ 30+ min physical
activity
% adults ever told have diabetes
% adults ever told have asthma
% adults ever told have
hypertension
Albuquerque 60% 23% 54% 8% 9% 25%Arlington, TX 66% 25% 54% 7% 5% 27%
Atlanta 64% 25% 46% 8% 7% 27%Austin 61% 27% 57% 6% 7% 28%
Baltimore 63% 27% 49% 9% 11% 30%Boston 56% 21% 52% 7% 10% 28%
Charlotte 63% 26% 48% 8% 7% 29%Chicago 64% 28% 50% 8% 9% 28%
Cleveland 66% 29% 51% 11% 12% 35%Colorado Springs 57% 18% 57% 5% 7% 20%
Columbus 63% 29% 48% 11% 7% 28%Dallas 63% 26% 47% 8% 7% 25%Denver 56% 19% 56% 5% 8% 24%Detroit 68% 34% 48% 11% 10% 32%El Paso 64% 28% 50% 12% 7% 29%
Fort Worth 66% 25% 54% 7% 5% 27%Honolulu 57% 22% 52% 9% 9% 31%Houston 64% 27% 46% 8% 6% 27%
Indianapolis 66% 28% 48% 8% 10% 29%Jacksonville 61% 25% 49% 10% 9% 27%
Kansas City, MO 62% 27% 49% 8% 9% 27%Las Vegas 63% 28% 49% 8% 9% 27%
Long Beach 61% 26% 46% 10% 7% 26%Los Angeles 61% 26% 46% 10% 7% 26%
Louisville 65% 34% 46% 12% 10% 36%Memphis 72% 34% 38% 11% 7% 38%
Mesa 65% 25% 50% 8% 12% 25%Miami 62% 24% 43% 10% 5% 32%
Milwaukee 61% 24% 53% 8% 8% 28%Minneapolis 62% 24% 55% 6% 8% 20%
Nashville 66% 27% 40% 7% 7% 26%New Orleans 64% 29% 44% 10% 5% 36%
New York 56% 22% 47% 9% 9% 26%Oakland 57% 22% 55% 8% 10% 25%
Oklahoma City 66% 29% 46% 10% 10% 31%Omaha 62% 27% 52% 7% 6% 26%
Philadelphia 61% 26% 47% 9% 10% 29%Phoenix 65% 25% 50% 8% 12% 25%
Portland, OR 60% 24% 55% 7% 10% 25%Raleigh 64% 26% 45% 6% 7% 28%
Sacramento 62% 26% 53% 8% 10% 25%San Antonio 64% 25% 50% 8% 8% 28%San Diego 59% 22% 58% 8% 7% 24%
San Francisco 50% 17% 54% 7% 8% 23%San Jose 53% 21% 47% 9% 5% 22%Seattle 59% 24% 52% 7% 8% 26%Tucson 60% 28% 52% 9% 11% 27%Tulsa 66% 31% 46% 10% 10% 35%
Virginia Beach 65% 24% 53% 8% 9% 25%Washington, DC 59% 26% 50% 8% 8% 26%
Mean/Average (2) 61% 25% 49% 9% 8% 27%Median 62% 26% 50% 8% 8% 27%
High 72% 34% 58% 12% 12% 38%Low 50% 17% 38% 5% 5% 20%
Public Health in U.S. Cities
Source: BRFSS 2009 Notes: Data unavailable for Fresno. (1) Percent overweight includes percent obese. (2) All averages are weighted. Legend:
= High value = Low value
State % population overweight(1)
% population
obese
% adults w/ 30+ min physical
activity
% adults ever told have diabetes
% adults ever told have asthma
% adults ever told
have hypertension
Alabama 68% 32% 41% 12% 8% 37%Alaska 63% 25% 61% 6% 9% 26%Arizona 64% 26% 51% 8% 11% 27%
Arkansas 67% 32% 47% 10% 8% 34%California 61% 26% 51% 9% 8% 26%Colorado 56% 19% 57% 6% 8% 22%
Connecticut 59% 21% 54% 7% 9% 27%Delaware 64% 28% 51% 8% 9% 31%
Florida 63% 27% 46% 11% 7% 32%Georgia 65% 28% 46% 10% 7% 31%Hawaii 58% 23% 53% 9% 9% 30%Idaho 61% 25% 58% 8% 8% 26%Illinois 65% 27% 52% 8% 9% 29%
Indiana 65% 30% 48% 9% 9% 31%Iowa 67% 29% 50% 8% 7% 28%
Kansas 65% 29% 49% 9% 9% 29%Kentucky 67% 32% 46% 12% 10% 36%Louisiana 68% 34% 44% 11% 6% 36%
Maine 64% 26% 56% 8% 11% 30%Maryland 63% 27% 49% 9% 9% 29%
Massachusetts 58% 22% 53% 8% 11% 26%Michigan 66% 30% 52% 9% 10% 30%Minnesota 63% 25% 53% 6% 7% 22%Mississippi 70% 35% 38% 12% 8% 37%Missouri 66% 31% 50% 8% 10% 31%Montana 62% 24% 59% 7% 8% 28%Nebraska 65% 28% 51% 8% 8% 27%Nevada 63% 26% 51% 8% 9% 28%
New Hampshire 63% 26% 53% 7% 10% 29%New Jersey 62% 24% 48% 9% 8% 28%New Mexico 62% 26% 53% 9% 9% 27%
New York 60% 25% 51% 9% 10% 29%North Carolina 65% 30% 46% 10% 8% 32%North Dakota 66% 28% 52% 8% 9% 27%
Ohio 67% 30% 49% 10% 10% 32%Oklahoma 67% 32% 47% 11% 10% 34%
Oregon 61% 24% 57% 8% 11% 27%Pennsylvania 64% 28% 50% 9% 9% 31%Rhode Island 62% 25% 48% 7% 10% 30%
South Carolina 66% 30% 45% 10% 8% 33%South Dakota 67% 30% 45% 7% 8% 30%
Tennessee 69% 33% 36% 10% 8% 33%Texas 67% 30% 48% 9% 7% 29%Utah 58% 24% 58% 6% 8% 23%
Vermont 58% 23% 58% 6% 10% 27%Virginia 61% 26% 51% 8% 8% 28%
Washington 62% 27% 54% 8% 9% 28%West Virginia 68% 32% 35% 12% 9% 38%
Wisconsin 66% 29% 53% 8% 10% 28%Wyoming 62% 25% 57% 7% 9% 26%
Mean/Average (2) 63% 27% 51% 8% 9% 29%Median 64% 27% 51% 8% 9% 29%
High 70% 35% 61% 12% 11% 38%Low 56% 19% 35% 6% 6% 22%

Alliance for Biking & Walking166
CHAPTER 8
states
Comparing Bicycling and Walking to Diabetes Rates in 50 States
Sources: BRFSS 2009, ACS 2009 Note: r= −0.63.
Diabetes rates are lowest among states with high levels of
bicycling and walking.
Data suggest a negative correlation exists be-tween rates of diabetes and levels of bicycling and walking (r = −0.63). According to data from BRFSS and ACS 2009, diabetes rates are highest among states with low levels of bicycling and walking.
Legend: = % of trips to work by bicycle
or foot= % of population ever told have diabetes
% o
f trip
s to
wo
rk b
y b
icyc
le o
r fo
ot
% o
f po
pu
latio
n e
ver
told
ha
ve d
iab
ete
s
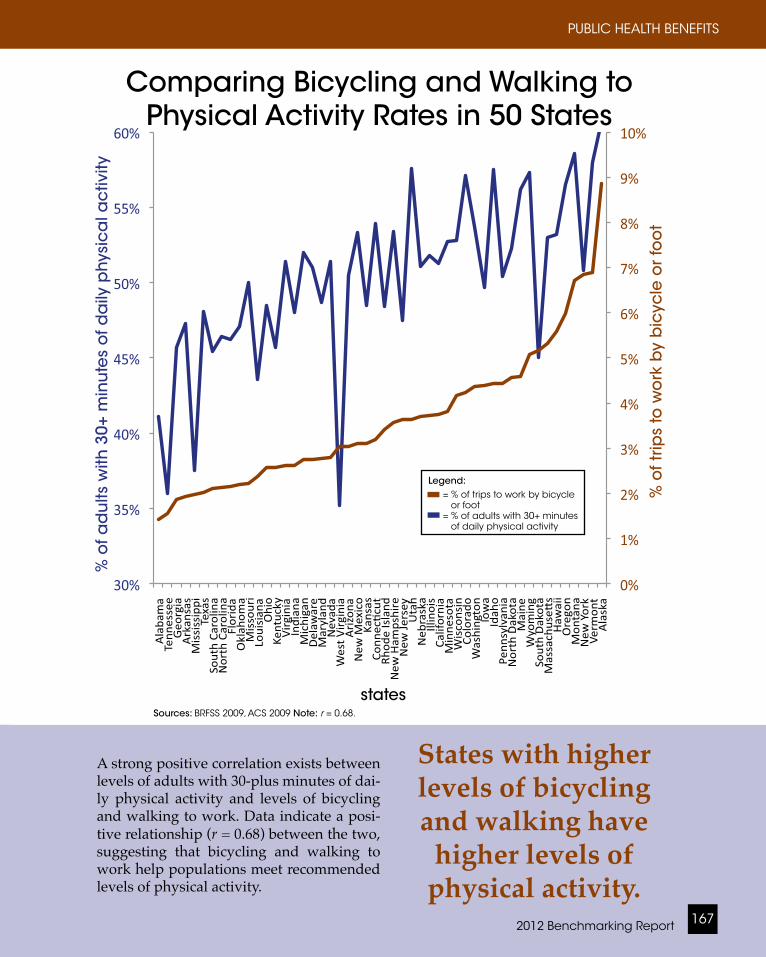
2012 Benchmarking Report 167
PUBLIC HEALTH BENEFITS
Comparing Bicycling and Walking to Physical Activity Rates in 50 States
Sources: BRFSS 2009, ACS 2009 Note: r = 0.68.
States with higher levels of bicycling and walking have
higher levels of physical activity.
A strong positive correlation exists between levels of adults with 30-plus minutes of dai-ly physical activity and levels of bicycling and walking to work. Data indicate a posi-tive relationship (r = 0.68) between the two, suggesting that bicycling and walking to work help populations meet recommended levels of physical activity.
Legend: = % of trips to work by bicycle
or foot= % of adults with 30+ minutes of daily physical activity
% o
f trip
s to
wo
rk b
y b
icyc
le o
r fo
ot
% o
f ad
ults
with
30+
min
ute
s o
f da
ily p
hysi
ca
l ac
tivity
states

CLOSER LOOKClark County, WA's Health Impact Assessmentby Brendon Haggerty, Clark County Public Health, Clark County, WA
Obesity, an underlying factor for several chronic diseases, has become epidemic in the United States, and, as such,
is a central challenge for public health. Reversing this epidemic will require many actions, and among them is ad-dressing the role of the built environ-ment in contributing to obesity. To do this, local agencies are increasingly us-ing health impact assessment (HIA) to evaluate the potential health effects of a project or policy. Clark County Public Health (CCPH) is one example of a local agency that has used HIA to integrate health concerns, such as obesity, into public decisions related to the built environment.
In December 2010, Clark County adopt-ed its first Bicycle and Pedestrian Mas-ter Plan. With the support of the Robert Wood Johnson Foundation, CCPH partnered with the County’s Commu-nity Planning Department to conduct an HIA on the plan. The HIA focused on prioritizing projects, programs, and policies to maximize the health benefits of physical activity. The health benefits of walking and cycling are obvious, but CCPH wanted to prioritize projects in a way that benefited populations more vulnerable to poor health outcomes, in-cluding low-income households, racial and ethnic minorities, youth, and adults over age 65.
After performing an extensive geo-graphic information system (GIS) analysis and identifying existing research findings on physical activ-
ity and obesity, CCPH recommended programs, policies, and implementation strategies designed to increase oppor-tunities for physical activity and reduce obesity. CCPH calculated a walkability index (see map) and overlaid it with demographic data to determine where projects could best serve populations in need of increased opportunities for physical activity. Among the key recom-mendations were: • Include low-speed roadway designs
as bicycle and pedestrian projects• Implement a variety of innovative
bikeway facility types• Integrate policies to improve street
connectivity, urban design, land use mix, and residential density
Alliance for Biking & Walking168
CHAPTER 8
Clark County HIA Walkability Index
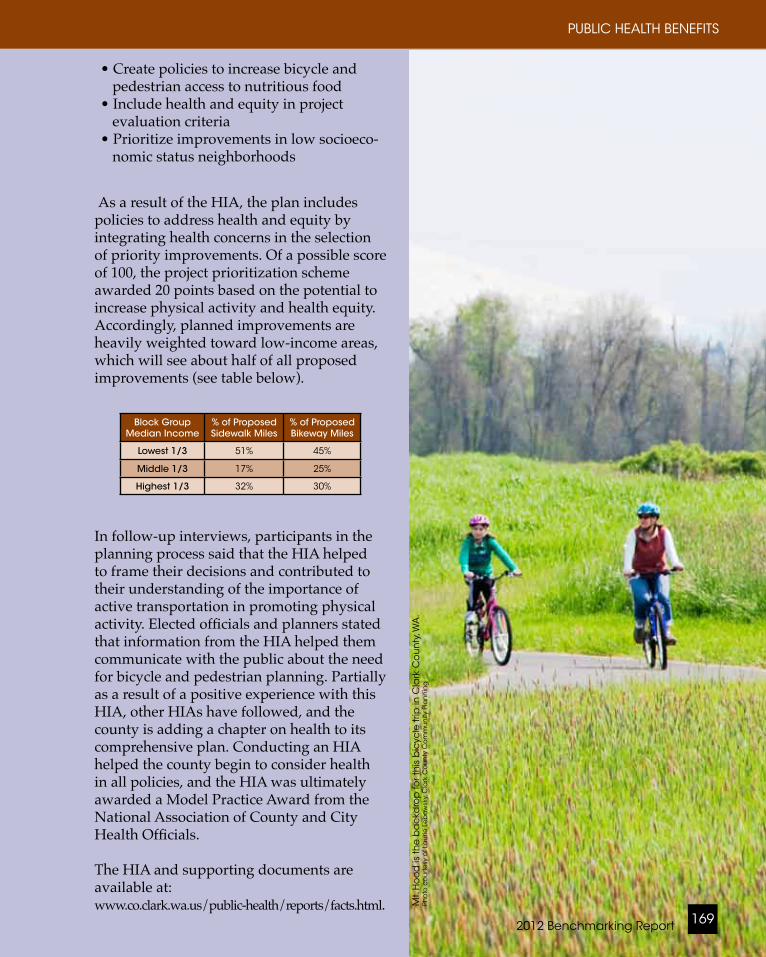
• Create policies to increase bicycle and pedestrian access to nutritious food
• Include health and equity in project evaluation criteria
• Prioritize improvements in low socioeco-nomic status neighborhoods
As a result of the HIA, the plan includes policies to address health and equity by integrating health concerns in the selection of priority improvements. Of a possible score of 100, the project prioritization scheme awarded 20 points based on the potential to increase physical activity and health equity. Accordingly, planned improvements are heavily weighted toward low-income areas, which will see about half of all proposed improvements (see table below).
Block Group Median Income
% of Proposed Sidewalk Miles
% of Proposed Bikeway Miles
Lowest 1/3 51% 45%
Middle 1/3 17% 25%
Highest 1/3 32% 30%
In follow-up interviews, participants in the planning process said that the HIA helped to frame their decisions and contributed to their understanding of the importance of active transportation in promoting physical activity. Elected officials and planners stated that information from the HIA helped them communicate with the public about the need for bicycle and pedestrian planning. Partially as a result of a positive experience with this HIA, other HIAs have followed, and the county is adding a chapter on health to its comprehensive plan. Conducting an HIA helped the county begin to consider health in all policies, and the HIA was ultimately awarded a Model Practice Award from the National Association of County and City Health Officials.
The HIA and supporting documents are available at: www.co.clark.wa.us/public-health/reports/facts.html.
2012 Benchmarking Report 169
PUBLIC HEALTH BENEFITS
Mt.
Ho
od
is th
e b
ac
kdro
p fo
r th
is b
icyc
le tr
ip in
Cla
rk C
ou
nty
, WA
. Ph
oto
co
urt
esy
of L
au
rie L
eb
ow
sky,
Cla
rk C
ou
nty
Co
mm
un
ity P
lan
nin
g
Clark County HIA Walkability Index
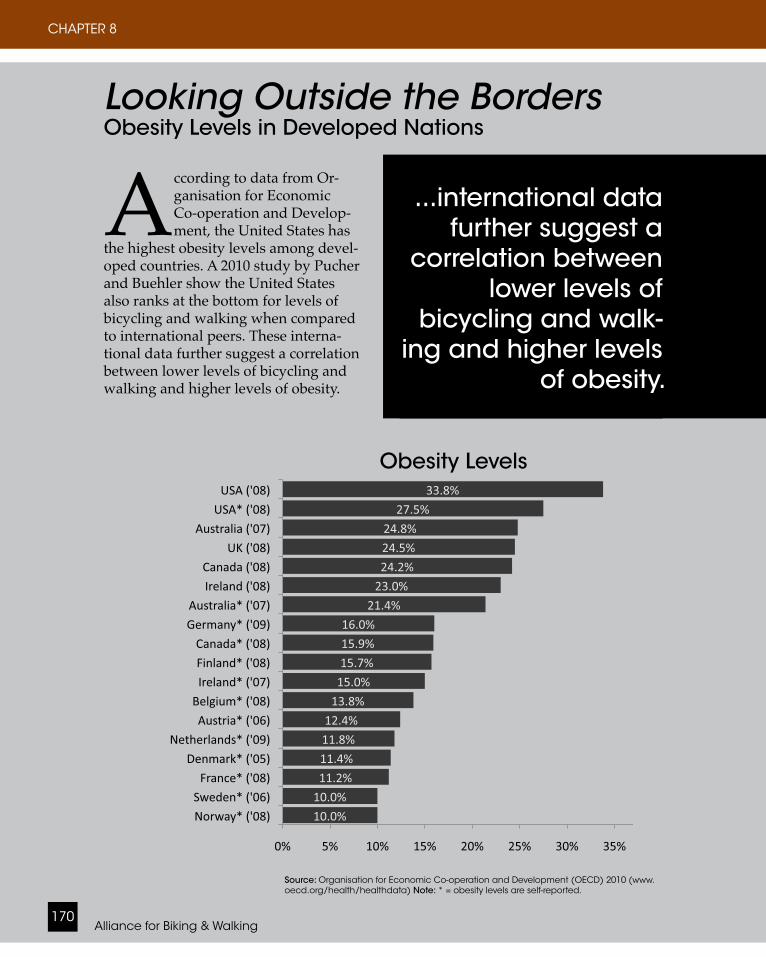
Alliance for Biking & Walking170
CHAPTER 8
Obesity Prevalence
Obesity Levels
Source: Organisation for Economic Co-operation and Development (OECD) 2010 (www.oecd.org/health/healthdata) Note: * = obesity levels are self-reported.
According to data from Or-ganisation for Economic Co-operation and Develop-ment, the United States has
the highest obesity levels among devel-oped countries. A 2010 study by Pucher and Buehler show the United States also ranks at the bottom for levels of bicycling and walking when compared to international peers. These interna-tional data further suggest a correlation between lower levels of bicycling and walking and higher levels of obesity.
Looking Outside the BordersObesity Levels in Developed Nations
...international data further suggest a
correlation between lower levels of
bicycling and walk-ing and higher levels
of obesity.
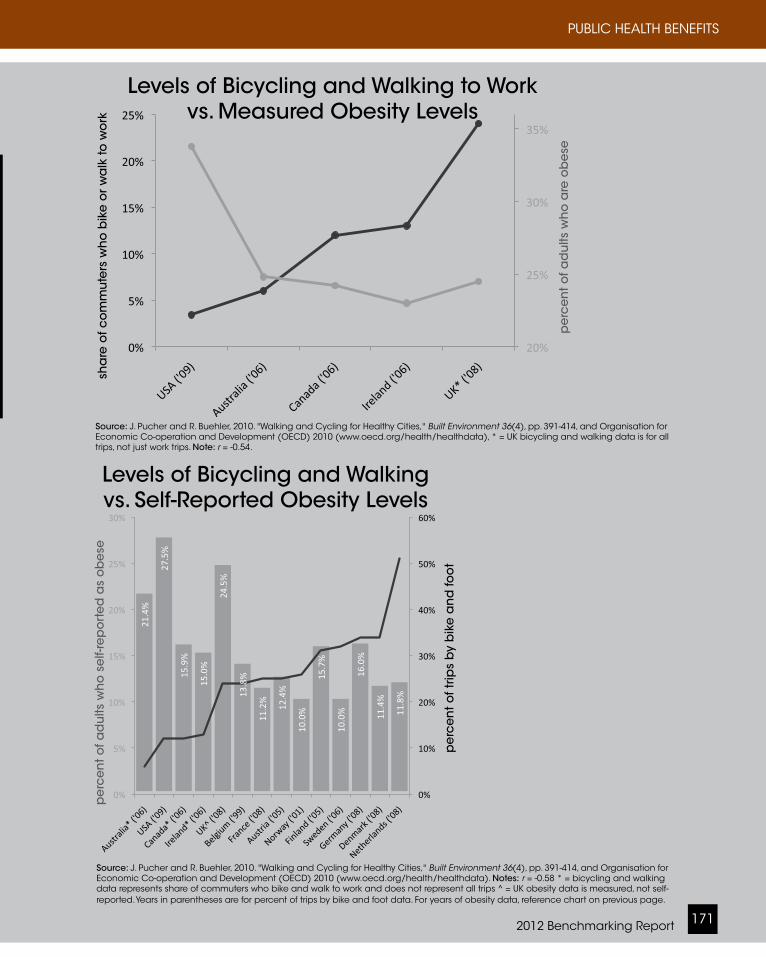
2012 Benchmarking Report 171
PUBLIC HEALTH BENEFITS
18407775.0-spirt lla *
Levels of Bicycling and Walking vs. Self-Reported Obesity Levels
Levels of Bicycling and Walking to Work vs. Measured Obesity Levels
Source: J. Pucher and R. Buehler, 2010. "Walking and Cycling for Healthy Cities," BuiltEnvironment36(4), pp. 391-414, and Organisation for Economic Co-operation and Development (OECD) 2010 (www.oecd.org/health/healthdata). Notes: r= -0.58 * = bicycling and walking data represents share of commuters who bike and walk to work and does not represent all trips ^ = UK obesity data is measured, not self-reported. Years in parentheses are for percent of trips by bike and foot data. For years of obesity data, reference chart on previous page.
Source: J. Pucher and R. Buehler, 2010. "Walking and Cycling for Healthy Cities," BuiltEnvironment36(4), pp. 391-414, and Organisation for Economic Co-operation and Development (OECD) 2010 (www.oecd.org/health/healthdata), * = UK bicycling and walking data is for all trips, not just work trips. Note: r = -0.54.
sha
re o
f co
mm
ute
rs w
ho
bik
e o
r w
alk
to w
ork
pe
rce
nt o
f ad
ults
wh
o a
re o
be
se
pe
rce
nt o
f ad
ults
wh
o s
elf-
rep
ort
ed
as
ob
ese
pe
rce
nt o
f trip
s b
y b
ike
an
d fo
ot

Alliance for Biking & Walking172
CHAPTER 8
Comparing Bicycling and Walking to High Blood Pressure Rates in 50 States
Sources: BRFSS 2009, ACS 2009 Note: r= −0.52.
States with higher levels of bicycling
and walking average lower prevalence of high blood pressure.
Data from BRFSS and ACS suggest a neg-ative correlation between levels of high blood pressure and bicycling and walking (r = −0.52). This relationship is in line with other results indicating a similar negative correlation between bicycling and walk-ing levels and prevalence of obesity and diabetes.
Legend: = % of trips to work by bicycle
or foot= % of population ever told they have hypertension
% o
f trip
s to
wo
rk b
y b
icyc
le o
r fo
ot
% o
f po
pu
latio
n e
ver
told
they
ha
ve h
ype
rte
nsi
on
states

Pho
to c
ou
rte
sy o
f Tra
nsp
ort
atio
n fo
r Am
eric
a
2012 Benchmarking Report 173
PUBLIC HEALTH BENEFITS
hood obesity levels sharply increased. During the period between 1966 and 2009, the number of children who biked or walked to school fell 75%, while the percentage of obese children rose 276% (McDonald 2007, NHTS 2009).
Comparing Obesity Levels to Bicycling and WalkingThe Alliance used ACS data on bicy-cling and walking to work, and Behav-ioral Risk Factor Surveillance System (BRFSS) data on obesity levels across states to compare current levels of obesity with bicycling and walking. The data indicate that states with the high-est levels of bicycling and walking to work have lower levels of obesity on average.
Other Health IndicatorsThis report also compared rates of bicycling and walking to work to other health indicators including levels for physical activity, rates of high blood pressure, and diabetes. Data suggest a strong positive correlation between rates of bicycling and walking and lev-els of physical activity. States with the highest levels of bicycling and walking have a greater percentage of the popula-tion meeting the recommended 30-plus minutes a day of physical activity. A negative correlation exists between rates of bicycling and walking and high blood pressure and diabetes. States with higher levels of bicycling and walking have lower levels of both diabetes and high blood pressure on average.
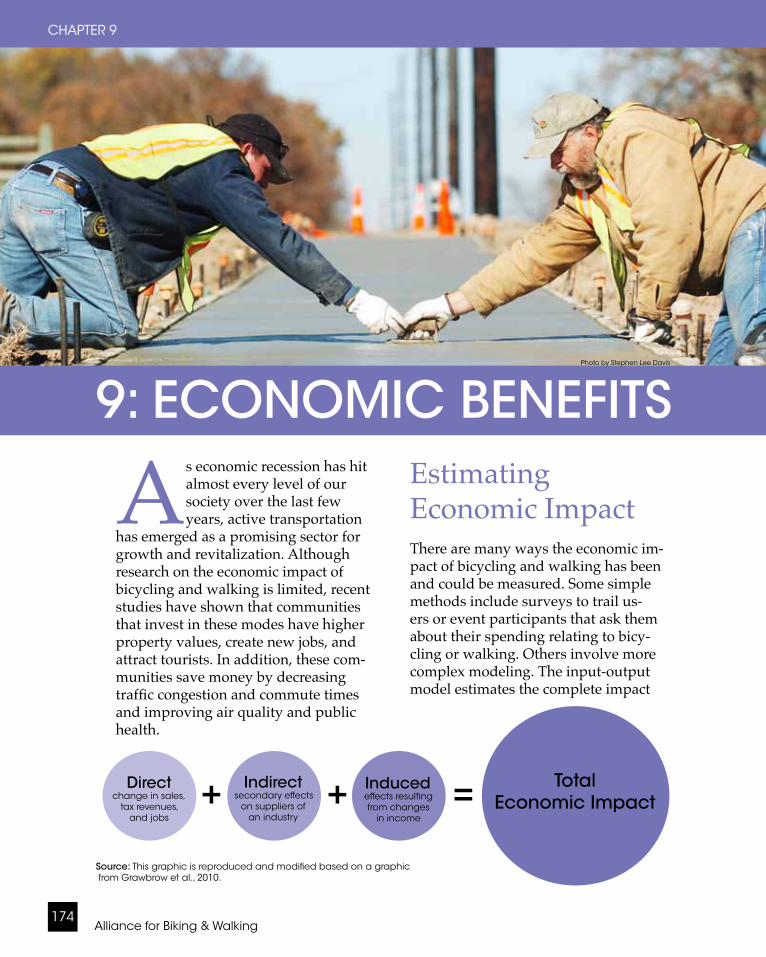
9: ECONOMIC BENEFITSPhoto by Stephen Lee Davis
Alliance for Biking & Walking174
CHAPTER 9
As economic recession has hit almost every level of our society over the last few years, active transportation
has emerged as a promising sector for growth and revitalization. Although research on the economic impact of bicycling and walking is limited, recent studies have shown that communities that invest in these modes have higher property values, create new jobs, and attract tourists. In addition, these com-munities save money by decreasing traffic congestion and commute times and improving air quality and public health.
Estimating Economic ImpactThere are many ways the economic im-pact of bicycling and walking has been and could be measured. Some simple methods include surveys to trail us-ers or event participants that ask them about their spending relating to bicy-cling or walking. Others involve more complex modeling. The input-output model estimates the complete impact
Directchange in sales,
tax revenues,and jobs
Indirectsecondary effects
on suppliers of an industry
Inducedeffects resulting from changes
in income
Total Economic Impact+ + =
Source: This graphic is reproduced and modified based on a graphic from Grawbrow et al., 2010.
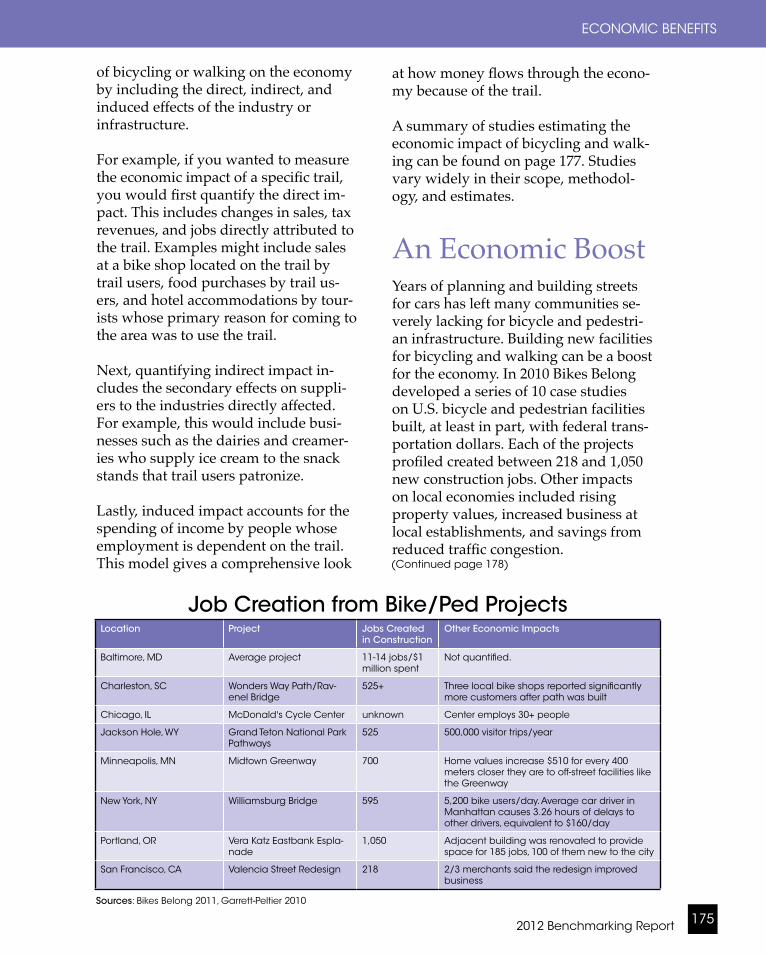
Photo by Stephen Lee Davis
2012 Benchmarking Report 175
ECONOMIC BENEFITS
of bicycling or walking on the economy by including the direct, indirect, and induced effects of the industry or infrastructure.
For example, if you wanted to measure the economic impact of a specific trail, you would first quantify the direct im-pact. This includes changes in sales, tax revenues, and jobs directly attributed to the trail. Examples might include sales at a bike shop located on the trail by trail users, food purchases by trail us-ers, and hotel accommodations by tour-ists whose primary reason for coming to the area was to use the trail.
Next, quantifying indirect impact in-cludes the secondary effects on suppli-ers to the industries directly affected. For example, this would include busi-nesses such as the dairies and creamer-ies who supply ice cream to the snack stands that trail users patronize.
Lastly, induced impact accounts for the spending of income by people whose employment is dependent on the trail. This model gives a comprehensive look
at how money flows through the econo-my because of the trail.
A summary of studies estimating the economic impact of bicycling and walk-ing can be found on page 177. Studies vary widely in their scope, methodol-ogy, and estimates.
An Economic BoostYears of planning and building streets for cars has left many communities se-verely lacking for bicycle and pedestri-an infrastructure. Building new facilities for bicycling and walking can be a boost for the economy. In 2010 Bikes Belong developed a series of 10 case studies on U.S. bicycle and pedestrian facilities built, at least in part, with federal trans-portation dollars. Each of the projects profiled created between 218 and 1,050 new construction jobs. Other impacts on local economies included rising property values, increased business at local establishments, and savings from reduced traffic congestion.
Location Project Jobs Created in Construction
Other Economic Impacts
Baltimore, MD Average project 11-14 jobs/$1 million spent
Not quantified.
Charleston, SC Wonders Way Path/Rav-enel Bridge
525+ Three local bike shops reported significantly more customers after path was built
Chicago, IL McDonald's Cycle Center unknown Center employs 30+ people
Jackson Hole, WY Grand Teton National Park Pathways
525 500,000 visitor trips/year
Minneapolis, MN Midtown Greenway 700 Home values increase $510 for every 400 meters closer they are to off-street facilities like the Greenway
New York, NY Williamsburg Bridge 595 5,200 bike users/day. Average car driver in Manhattan causes 3.26 hours of delays to other drivers, equivalent to $160/day
Portland, OR Vera Katz Eastbank Espla-nade
1,050 Adjacent building was renovated to provide space for 185 jobs, 100 of them new to the city
San Francisco, CA Valencia Street Redesign 218 2/3 merchants said the redesign improved business
Job Creation from Bike/Ped Projects
Sources: Bikes Belong 2011, Garrett-Peltier 2010
(Continued page 178)

Photo courtesy of Frank Chan, San Francisco Bicycle CoalitionAlliance for Biking & Walking176
CHAPTER 9

2012 Benchmarking Report 177
ECONOMIC BENEFITS
State Location/scope Economic Impact Study Link
California San Francisco: Valencia Street bike lane
Sixty-six percent of merchants believe that the bike lanes have had a generally posi-tive impact on their business and/or sales, and the same percentage would support more traffic calming on Valencia Street (2003).
http://www.emilydrennen.org/Traf-ficCalming_full.pdf
Colorado Statewide Total economic benefit from bicycling in Colorado is over $1 billion annually; 1,316 full time and 7,500 seasonal bicycle manufacturing, retail, and tourism jobs in the state (1999).
http://atfiles.org/files/pdf/CObi-keEcon.pdf
Florida, California, and Iowa
Three rail trails $1.2 to $1.9 million annually in economic activity and pumps $294,000-$630,000 an-nually into local trail communities. (1992).
http://www.brucefreemanrailtrail.org/pdf/1_Exec_summ__contents.pdf
Maine Statewide bicycle tourism
Bicycle tourists spend $36.3 million annu-ally with a total economic impact of $66.8 million each year (2001).
http://www.maine.gov/mdot/opt/pdf/biketourismexecsumm.pdf
Maryland/Pennsylvania
Great Allegheny Passage
Trail attributed revenue in 2007 was $32,614,703 and it was projected that businesses distributed $6,273,927 in wages. Despite the tough economic times, in 2008 these figures increased to projected receipts and wages of $40,677,299 and $7,500,798, respectively (2009).
http://www.adventurecycling.org/routes/nbrn/resourcespage/GAPeconomicImpactStudy200809.pdf
Maryland Baltimore Pedestrian and bicycle infrastructure projects create 11-14 jobs per $1 million of spending (2010).
http://www.americabikes.org/Docu-ments/PERI_Case_Study-Baltimore.pdf
Minnesota Trails throughout the state
Statewide trail spending of $2,422 million was estimated to produce $2,953 million in gross output (total sales of local businesses including indirect and induced effects but subtracting imports). This contributed $1,542 million to gross state product (GSP). Some 30,900 full-time and part-time jobs were supported by trail spending in various regions. Employee compensation from these jobs reached some $864 million. State and local revenues from all taxes, fees, and other sources amounted to $206 million (2009).
http://www.tourism.umn.edu/prod/groups/cfans/@pub/@cfans/@tourism/documents/asset/cfans_as-set_167538.pdf
New York Eight trails throughout New York
Trail users spent average of $28.90/visit, $200 on equipment related to use of the trail, Total economic impact of just one of the eight trails studied was estimated to be $2 million annually, supporting roughly 40 FTE (Full Time Equivalent) jobs within the community. This estimate does not include increased tax revenues to the local com-munity (2010).
http://nysparks.com/recreation/trails/statewide-plans.aspx.; State-wide Trails Plan. Appendix C – Every Mile Counts – An Analysis of the 2008 Trail User Surveys.
North Carolina Outer Banks bicycle tourism
A conservative estimate of the annual economic impact of bicycle tourists is $60 million, almost nine times as much as the one-time expenditure of public funds used to construct special bicycle facilities in the region. 1,400 jobs are created or supported annually with the expenditures made by bicycle tourists (2004).
http://www.ncdot.gov/bikeped/download/bikeped_research_EIA-fulltechreport.pdf
Oregon Portland Health cost savings attributable to new bicycle infrastructure and programs will be between $388 and $594 million by 2040. The savings in value of statistical lives is between $7 and $12 billion (2011).
http://www.portland-mercury.com/images/
Overview of Bike/Ped Economic Impact Studies

Alliance for Biking & Walking178
CHAPTER 9
Pennsylvania Pine Creek Rail Trail 82% of survey respondents on trail had pur-chased “hard goods” (bikes, bike accesso-ries, clothing, etc.) at an average of $354/user. 86% had purchased "soft goods" (water, soda, candy, ice cream, etc.) at an average of $30/user. 57% of users were tourists who reported staying in hotels that averaged $69/night (2006).
http://www.railstotrails.org/resourc-es/documents/resource_docs/RTC_PineCreekGuide_web.pdf
Pennsylvania Heritage Rail Trail 85% of trail users surveyed purchased some form of “hard goods” (defined as bikes; bike accessories; auto accessories; running, walking, hiking shoes or clothing) in conjunction with their use of the trail. The average spending of those who provided spending data was $367. Nearly 72% had purchased “soft goods” (water, soda, candy, ice cream, lunches, etc.) averaging $12.66. 12% of users said their use of trail involved an overnight hotel stay with an average cost of $51 (2007).
http://www.yorkcountyparks.org/PDF/2007%20Rail%20Trail%20User%20Survey%20Report%20VERSION%204.1.pdf
Virginia Virginia Creeper Trail Economic impact of nonlocals was $2.2 million. Total economic impact was $2.5 million/year (2004).
http://atfiles.org/files/pdf/VAC-study04.pdf
Wisconsin Statewide comprehensive
This study estimates the economic impact of bicycle recreation and tourism in Wisconsin to be $924,211,000, and the total potential value of health benefits from reducing short car trips and increasing bicycle trips to total $409,944,167 (2010).
http://www.bfw.org/uploads/me-dia/Valuing_Bicycling_in_Wisconsin_Final_Report_January_2010[1].pdf
A December 2010 study used the input-output model to estimate the number of jobs created by pedestrian and bicycle infrastructure projects and other road projects. According to the author, "pedestrian and bicycle infrastructure projects create 11-14 jobs per $1 million of spending while road infrastructure projects create approximately 7 jobs per $1 million of expenditures" (Garrett-Peltier 2010).
Lasting ImpactAfter the initial economic boost from construction, pedestrian and bicycle infrastructure has lasting effects on local economies.
Events and TourismIt has long been recognized that facili-ties like rail trails and safe places to bike
and walk attract tourists. Local com-munities now vie for "Bicycle Friendly Community" and "Walking Friendly Community" designation and commu-nities with this designation report it is good for business (Maus 2006).
Numerous studies and papers have looked at the impact of bicycling on tourism. A 2004 study (detailed on page 181) found the annual economic impact of bicycle tourists to North Carolina's Outer Banks was $60 million. In addi-tion, 1,400 jobs were created or sustained annually because of these tourists.
Bicycling and walking events can also stimulate local economies. Iowa's RAGBRAI, a weeklong bicycle ride across the state, contributed $16.5 mil-lion in direct spending and supported 362 jobs in the state (Lankford 2008). The Tour of Missouri, a professional cycling race, estimated their direct
Overview of Bike/Ped Economic Impact Studies (Continued)
continued next page...
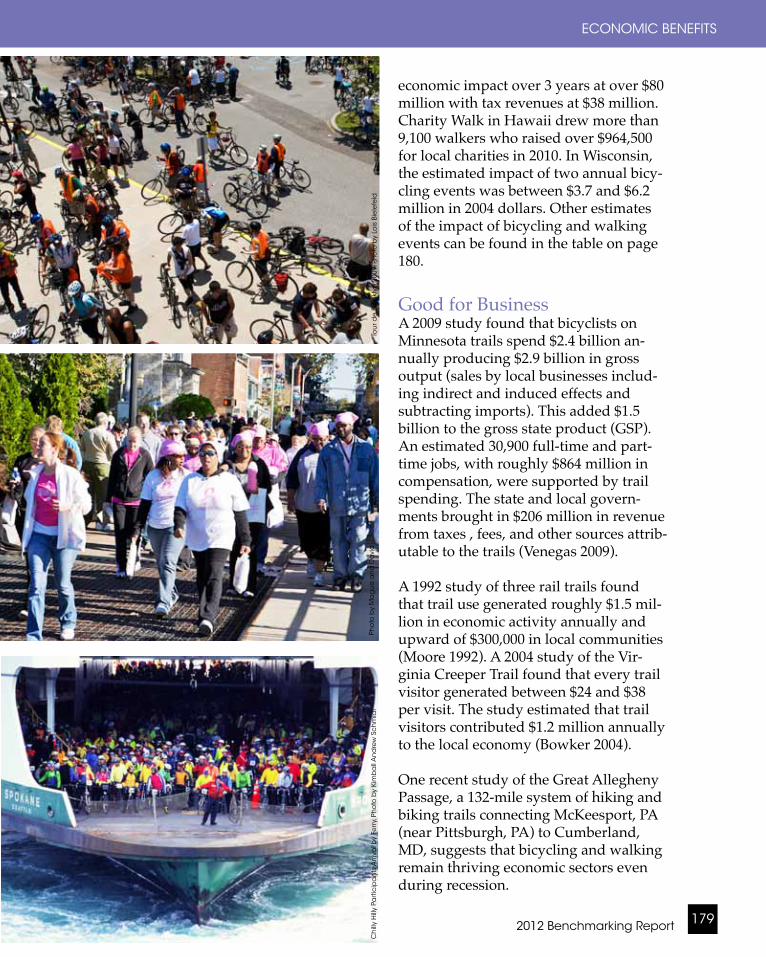
2012 Benchmarking Report 179
ECONOMIC BENEFITS
economic impact over 3 years at over $80 million with tax revenues at $38 million. Charity Walk in Hawaii drew more than 9,100 walkers who raised over $964,500 for local charities in 2010. In Wisconsin, the estimated impact of two annual bicy-cling events was between $3.7 and $6.2 million in 2004 dollars. Other estimates of the impact of bicycling and walking events can be found in the table on page 180.
Good for BusinessA 2009 study found that bicyclists on Minnesota trails spend $2.4 billion an-nually producing $2.9 billion in gross output (sales by local businesses includ-ing indirect and induced effects and subtracting imports). This added $1.5 billion to the gross state product (GSP). An estimated 30,900 full-time and part-time jobs, with roughly $864 million in compensation, were supported by trail spending. The state and local govern-ments brought in $206 million in revenue from taxes , fees, and other sources attrib-utable to the trails (Venegas 2009).
A 1992 study of three rail trails found that trail use generated roughly $1.5 mil-lion in economic activity annually and upward of $300,000 in local communities (Moore 1992). A 2004 study of the Vir-ginia Creeper Trail found that every trail visitor generated between $24 and $38 per visit. The study estimated that trail visitors contributed $1.2 million annually to the local economy (Bowker 2004).
One recent study of the Great Allegheny Passage, a 132-mile system of hiking and biking trails connecting McKeesport, PA (near Pittsburgh, PA) to Cumberland, MD, suggests that bicycling and walking remain thriving economic sectors even during recession.
Ch
illy
Hill
y Pa
rtic
ipa
nts
Arr
iva
l by
Ferr
y, Ph
oto
by
Kim
ba
ll A
nd
rew
Sc
hm
idt
Pho
to b
y M
ag
uis
an
d D
avi
dTo
ur d
e B
roo
klyn
200
9. P
ho
to b
y Lo
is B
iele
feld
Pennsylvania Pine Creek Rail Trail 82% of survey respondents on trail had pur-chased “hard goods” (bikes, bike accesso-ries, clothing, etc.) at an average of $354/user. 86% had purchased "soft goods" (water, soda, candy, ice cream, etc.) at an average of $30/user. 57% of users were tourists who reported staying in hotels that averaged $69/night (2006).
http://www.railstotrails.org/resourc-es/documents/resource_docs/RTC_PineCreekGuide_web.pdf
Pennsylvania Heritage Rail Trail 85% of trail users surveyed purchased some form of “hard goods” (defined as bikes; bike accessories; auto accessories; running, walking, hiking shoes or clothing) in conjunction with their use of the trail. The average spending of those who provided spending data was $367. Nearly 72% had purchased “soft goods” (water, soda, candy, ice cream, lunches, etc.) averaging $12.66. 12% of users said their use of trail involved an overnight hotel stay with an average cost of $51 (2007).
http://www.yorkcountyparks.org/PDF/2007%20Rail%20Trail%20User%20Survey%20Report%20VERSION%204.1.pdf
Virginia Virginia Creeper Trail Economic impact of nonlocals was $2.2 million. Total economic impact was $2.5 million/year (2004).
http://atfiles.org/files/pdf/VAC-study04.pdf
Wisconsin Statewide comprehensive
This study estimates the economic impact of bicycle recreation and tourism in Wisconsin to be $924,211,000, and the total potential value of health benefits from reducing short car trips and increasing bicycle trips to total $409,944,167 (2010).
http://www.bfw.org/uploads/me-dia/Valuing_Bicycling_in_Wisconsin_Final_Report_January_2010[1].pdf

Alliance for Biking & Walking180
CHAPTER 9
Trail-attributed revenue in 2007 was $32,614,703 and it was projected that businesses distributed $6,273,927 in wages. Despite the tough economic times, in 2008 these figures actually increased to projected receipts and wages of $40,677,299 and $7,500,798, respectively (Campos 2009).
Business owners are aware of the impact new bicycle facilities have on business. A survey of San Francisco Valencia Street businesses, 4 years after
bike lanes were installed on the street found that nearly two-thirds of mer-chants (65%) thought the bike lanes had an overall positive impact on their business and/or sales. Thirty percent believed the bike lanes had no impact. Just one merchant said the lanes had a “slightly negative” impact on business.
Similarly, a 2006 survey of over 100 Portland, OR businesses asked if Port-land's reputation for bike-friendliness is good for business. Eighty-two percent
Location Event Event Description Estimated Economic Impacts
Florida (2) Bike Florida Week-long bicycle camping tour 75% of participants (1,000) were from out of state. According to a survey, 36% stayed in hotels, 95% dined at restaurants, 66% shopped for groceries, and 55% purchased clothing.
Hawaii (5) Charity Walk A statewide annual charity walk that occurs simultaneously on Oahu, Maui, the Big Island, and Kauai.
More than 9,100 walkers raised over $964,500 for over 220 local charities.
Iowa(7)
RAGBRAI Annual weeklong bike ride across state of Iowa attracting roughly 9,500 bicyclists.
RAGBRAI participants’ expenditures had a di-rect economic impact of $16.5 million in direct sales, $10.4 million in value added/ income, and supported 362 jobs in the state.
Michigan (4)
Midwest Tandem Bike Rally
An annual recreational bicycling event staged in a different location each year over a week-end. In 1999, Midland was selected as the site and attracted 550 tandem bicycle teams to the event held on the Pere Marquette Rail-Trail.
$260,000 of direct spending by travel parties in Michigan. 25% of the events’ participants said the Pere Marquette Rail-Trail was the primary draw to ride participation.
Michigan (4)
Michigander Recreational bicycle special events held on the Pere Marquette Rail-Trail in Midland County Michigan during the summer of 1999.
$207,000 of direct spending by travel parties in Michigan. 25% of the events’ participants said the Pere Marquette Rail-Trail was the primary draw to ride participation.
Missouri (1)
Tour of Missouri
The United State's second biggest professional cycling race event.
>$80 million in direct economic impact over three years; tax revenues estimated at $38 million.
Ohio (6) Harbin Park Cyclocross Race
Cyclocross race. Estimated impact of $200,000 to local com-munity.
Wisconsin (3)
Aids Network ACT II
Bicycle fundraising ride with 110 riders in2004.
Total estimated impact = $342,400Amount fundraised = $274,00088% of funds raised served Aids Network clients throughout Wisconsin.
Wisconsin (3)
GRABAAWR and SAG-BRAW
The Great Annual Bicycle Adventure Along theWisconsin River (GRABAAWR) had 900 riders in2004, and Sprocket’s Annual Great Bicycle Ride Across Wisconsin (SAGBRAW) had 1,140 riders in 2004.
The economic impact of the combined events was between $3.7 million and $6.2 million in 2004. These figures were based on the event budgets, which total about $350,000 a year, plus actual spending by the participants in the two cross-state bicycling events, and ap-propriate multipliers to estimate indirect and induced economic effects. GRABAAWR partici-pants reported spending an average of $60/day, while SAGBRAW participants reported spending an average of $57/day.
Sources: (1) Tour of Missouri 2010 (2) Bike Florida 2010 (3) Grabrow et al. (4) Nelson et al., 2001(5) Charity Walk 2011 (6) Liberles 2010 (7) Lankford et al., 2008
Economic Impact of Bike/Ped Events
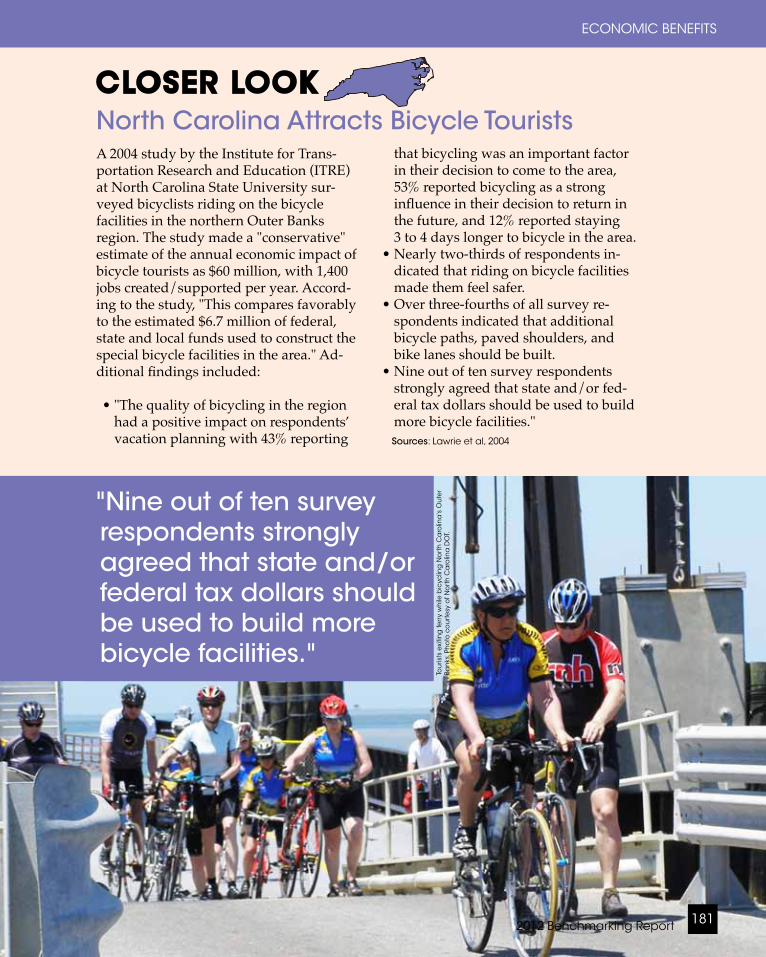
CLOSER LOOKNorth Carolina Attracts Bicycle TouristsA 2004 study by the Institute for Trans-portation Research and Education (ITRE) at North Carolina State University sur-veyed bicyclists riding on the bicycle facilities in the northern Outer Banks region. The study made a "conservative" estimate of the annual economic impact of bicycle tourists as $60 million, with 1,400 jobs created/supported per year. Accord-ing to the study, "This compares favorably to the estimated $6.7 million of federal, state and local funds used to construct the special bicycle facilities in the area." Ad-ditional findings included:
• "The quality of bicycling in the region had a positive impact on respondents’ vacation planning with 43% reporting
that bicycling was an important factor in their decision to come to the area, 53% reported bicycling as a strong influence in their decision to return in the future, and 12% reported staying 3 to 4 days longer to bicycle in the area.
• Nearly two-thirds of respondents in-dicated that riding on bicycle facilities made them feel safer.
• Over three-fourths of all survey re-spondents indicated that additional bicycle paths, paved shoulders, and bike lanes should be built.
• Nine out of ten survey respondents strongly agreed that state and/or fed-eral tax dollars should be used to build more bicycle facilities."
"Nine out of ten survey respondents strongly agreed that state and/or federal tax dollars should be used to build more bicycle facilities."
Tou
rists
exi
ting
ferr
y w
hile
bic
yclin
g N
ort
h C
aro
lina
's O
ute
r Ba
nks
. Ph
oto
co
urt
esy
of N
ort
h C
aro
lina
DO
T.
2012 Benchmarking Report 181
ECONOMIC BENEFITS
Sources: Lawrie et al, 2004
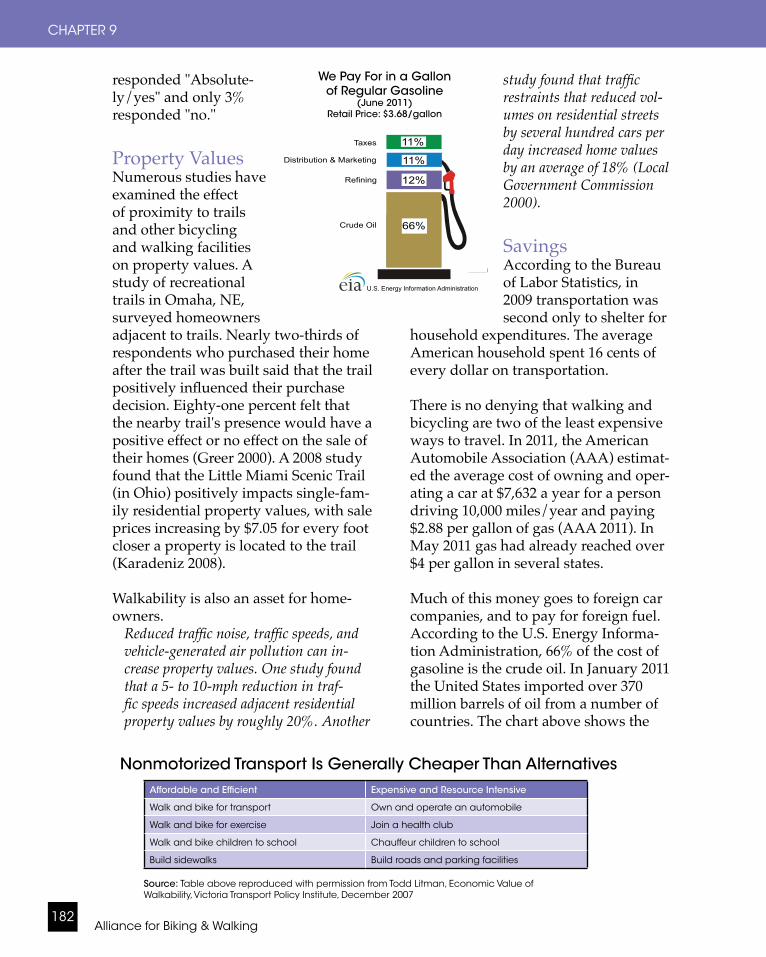
Alliance for Biking & Walking182
CHAPTER 9
responded "Absolute-ly/yes" and only 3% responded "no."
Property ValuesNumerous studies have examined the effect of proximity to trails and other bicycling and walking facilities on property values. A study of recreational trails in Omaha, NE, surveyed homeowners adjacent to trails. Nearly two-thirds of respondents who purchased their home after the trail was built said that the trail positively influenced their purchase decision. Eighty-one percent felt that the nearby trail's presence would have a positive effect or no effect on the sale of their homes (Greer 2000). A 2008 study found that the Little Miami Scenic Trail (in Ohio) positively impacts single-fam-ily residential property values, with sale prices increasing by $7.05 for every foot closer a property is located to the trail (Karadeniz 2008).
Walkability is also an asset for home-owners.
Reduced traffic noise, traffic speeds, and vehicle-generated air pollution can in-crease property values. One study found that a 5- to 10-mph reduction in traf-fic speeds increased adjacent residential property values by roughly 20%. Another
study found that traffic restraints that reduced vol-umes on residential streets by several hundred cars per day increased home values by an average of 18% (Local Government Commission 2000).
SavingsAccording to the Bureau of Labor Statistics, in 2009 transportation was second only to shelter for
household expenditures. The average American household spent 16 cents of every dollar on transportation.
There is no denying that walking and bicycling are two of the least expensive ways to travel. In 2011, the American Automobile Association (AAA) estimat-ed the average cost of owning and oper-ating a car at $7,632 a year for a person driving 10,000 miles/year and paying $2.88 per gallon of gas (AAA 2011). In May 2011 gas had already reached over $4 per gallon in several states. Much of this money goes to foreign car companies, and to pay for foreign fuel. According to the U.S. Energy Informa-tion Administration, 66% of the cost of gasoline is the crude oil. In January 2011 the United States imported over 370 million barrels of oil from a number of countries. The chart above shows the
Affordable and Efficient Expensive and Resource Intensive
Walk and bike for transport Own and operate an automobile
Walk and bike for exercise Join a health club
Walk and bike children to school Chauffeur children to school
Build sidewalks Build roads and parking facilities
Source: Table above reproduced with permission from Todd Litman, Economic Value of Walkability, Victoria Transport Policy Institute, December 2007
Nonmotorized Transport Is Generally Cheaper Than Alternatives
We Pay For in a Gallon of Regular Gasoline
(June 2011)Retail Price: $3.68/gallon
66%
12%
Crude Oil
Refining
11%
11%
Distribution & Marketing
Taxes
What We Pay For In A Gallon Of Regular Gasoline(June 2011)
Retail Price: $3.68/gallon
U.S. Energy Information Administration
66%
12%
Crude Oil
Refining
11%
11%
Distribution & Marketing
Taxes
What We Pay For In A Gallon Of Regular Gasoline(June 2011)
Retail Price: $3.68/gallon
U.S. Energy Information Administration
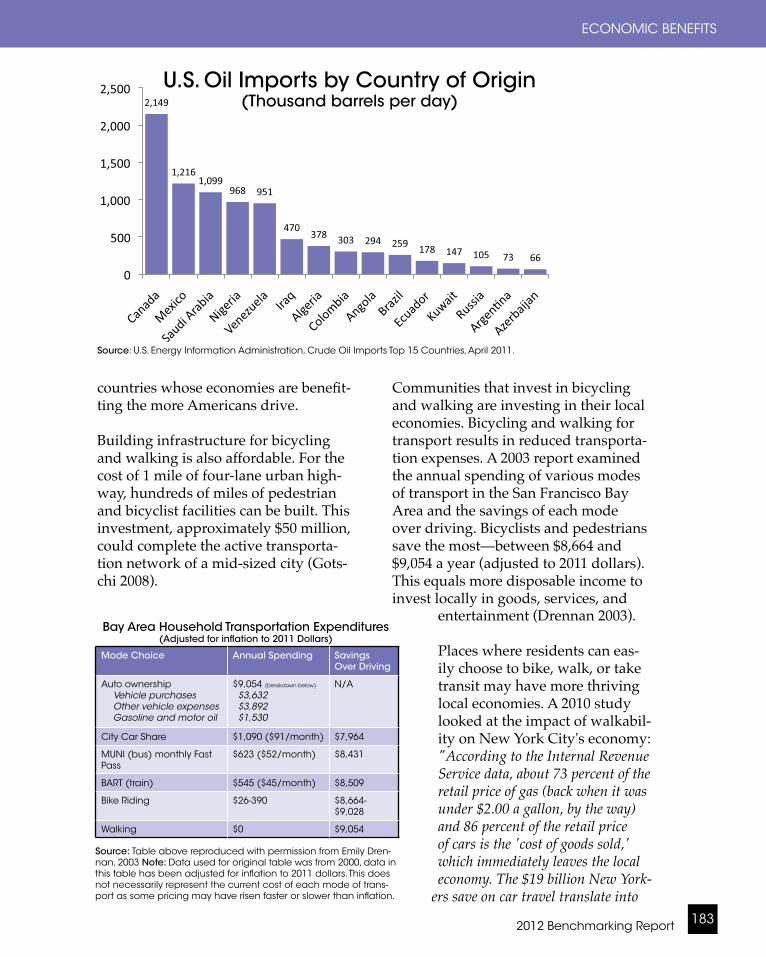
Mode Choice Annual Spending Savings Over Driving
Auto ownershipVehiclepurchasesOthervehicleexpensesGasolineandmotoroil
$9,054 (breakdown below)
$3,632$3,892$1,530
N/A
City Car Share $1,090 ($91/month) $7,964
MUNI (bus) monthly Fast Pass
$623 ($52/month) $8,431
BART (train) $545 ($45/month) $8,509
Bike Riding $26-390 $8,664-$9,028
Walking $0 $9,054
Source: Table above reproduced with permission from Emily Dren-nan, 2003 Note: Data used for original table was from 2000, data in this table has been adjusted for inflation to 2011 dollars. This does not necessarily represent the current cost of each mode of trans-port as some pricing may have risen faster or slower than inflation.
Bay Area Household Transportation Expenditures (Adjusted for inflation to 2011 Dollars)
Communities that invest in bicycling and walking are investing in their local economies. Bicycling and walking for transport results in reduced transporta-tion expenses. A 2003 report examined the annual spending of various modes of transport in the San Francisco Bay Area and the savings of each mode over driving. Bicyclists and pedestrians save the most—between $8,664 and $9,054 a year (adjusted to 2011 dollars). This equals more disposable income to invest locally in goods, services, and
entertainment (Drennan 2003). Places where residents can eas-ily choose to bike, walk, or take transit may have more thriving local economies. A 2010 study looked at the impact of walkabil-ity on New York City's economy:"According to the Internal Revenue Service data, about 73 percent of the retail price of gas (back when it was under $2.00 a gallon, by the way) and 86 percent of the retail price of cars is the 'cost of goods sold,' which immediately leaves the local economy. The $19 billion New York-
ers save on car travel translate into
2012 Benchmarking Report 183
ECONOMIC BENEFITS
rude Oil Imports (Top 15 Countries)(Thousand Barrels per Day)Country 11-Jan 10-Dec YTD 2011 10-Jan YTD 2010
Canada 2,149 2,064 2,149 1,882 1,882Mexico 1,216 1,223 1,216 1,033 1,033Saudi Arabia 1,099 1,076 1,099 958 958Nigeria 968 1,024 968 996 996Venezuela 951 825 951 827 827
605605074633074qarIAlgeria 378 262 378 327 327Colombia 303 220 303 293 293Angola 294 307 294 268 268Brazil 259 271 259 271 271Ecuador 178 192 178 215 215Kuwait 147 125 147 66 66Russia 105 158 105 137 137Argentina 73 85 73 18 18Azerbaijan 66
U.S. Oil Imports by Country of Origin(Thousand barrels per day)
Source: U.S. Energy Information Administration, Crude Oil Imports Top 15 Countries, April 2011.
countries whose economies are benefit-ting the more Americans drive. Building infrastructure for bicycling and walking is also affordable. For the cost of 1 mile of four-lane urban high-way, hundreds of miles of pedestrian and bicyclist facilities can be built. This investment, approximately $50 million, could complete the active transporta-tion network of a mid-sized city (Gots-chi 2008).
more than $16 billion that are available to be spent in the local economy. Because this money tends to be re-spent in other sectors of the economy, it stimulates businesses" (Cortright 2010).
Reducing car dependence is investing in local business. In addition, pedestrian improvements encourage residents to shop locally in their own neighborhoods. One success-ful example is a $4.5 million public-private pedestrian-oriented project in Lodi, CA. The city credits the retrofit of five main street blocks with widened sidewalks, bulbed-out intersections, and other improvements for a large econom-ic turnaround. Vacancy rates dropped from 18 to 6 percent. And, after the work was completed, the city saw a 30% increase in downtown sales tax revenue (Local Government Commission 2000).
Cost/BenefitBesides the obvious impact on job creation, tourism, and savings, there are other economic benefits of bicycling and walking that are harder to quantify. Some of these include reduced traffic congestion, reduced time spent in traffic, improved health and reduced mortality, cleaner air, reduced noise pollution, and lower levels of stress. A 2008 report by Rails-to-Trails Con-servancy attempted to quantify, for the first time, the benefits the United States could expect for elevating the priority of bicycling and walking in our transpor-tation policy. Benefits were quantified for the status quo and for increases in bicycling and walking under a "modest" and "substantial" scenario. The results of increasing active transportation were
significant. The modest scenario showed a reduction of 70 billion miles of au-tomobile travel while the substantial increase in bicycling and walking could help divert 200 billion miles per year.
Valuing bicycling and walking's impact on healthBicycling and walking for transportation has a great potential to influence public health. Because bicycling and walking are part of a healthy active lifestyle, these activities have been shown to exist more alongside reduced levels of obe-sity. Further, because most American adults gain weight gradually—about 2 pounds each year—bicycling or walking for less than 30 minutes daily can ward off this extra weight (Gotschi 2008). According to a 2010 study sponsored by the Society of Actuaries, the total economic cost of overweight and obese citizens in the Unites States and Canada was roughly $300 billion in 2009. This estimate includes medical costs, disabil-ity, and excess mortality (Behan et al., 2010). A 2006 report by the National Governors Association found that obesity costs the average taxpayer $180 per year regard-less of their own health status. Studies show that promoting physical activity is cost-effective and the value of health benefits can far outweigh the costs (Gotschi 2008, Gotschi 2011, National Governors Association 2006, Roux et al., 2008). Further, if just one of every ten adults started a regular walking program, the United States could save $5.6 billion —the equivalent of paying the college tuition of 1,020,000 students (National Governors Association 2006). (To see how your state compares, see the table to the right.)
Alliance for Biking & Walking184
CHAPTER 9
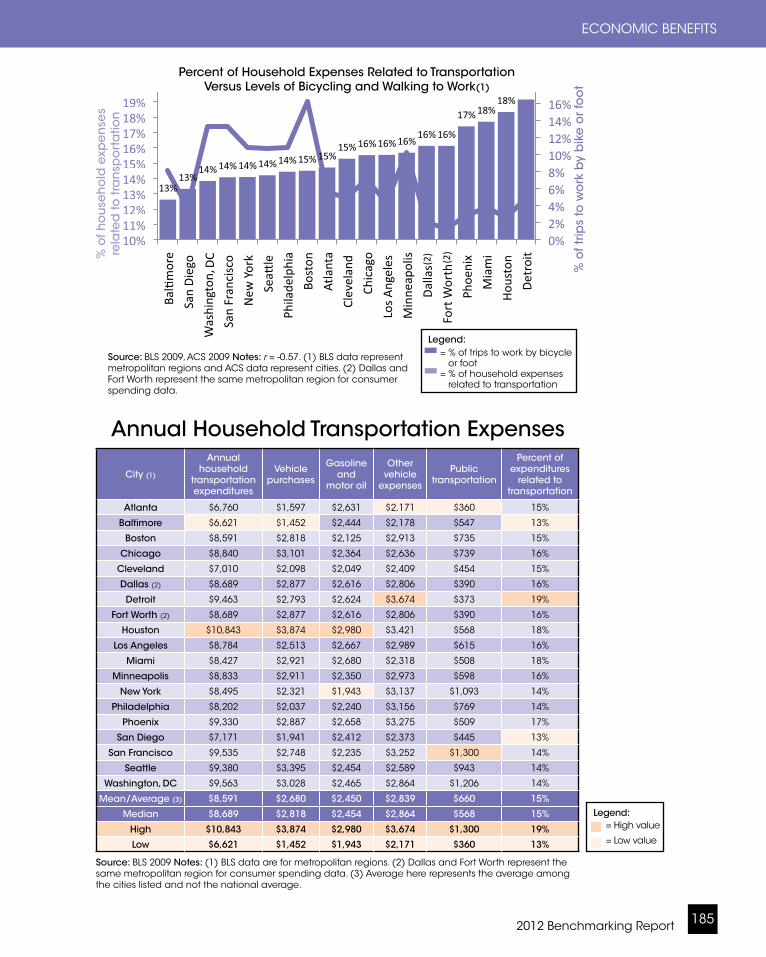
2012 Benchmarking Report 185
ECONOMIC BENEFITS
City (1)
Annual household
transportation expenditures
Vehicle purchases
Gasoline and
motor oil
Other vehicle
expenses
Public transportation
Percent of expenditures
related to transportation
Atlanta $6,760 $1,597 $2,631 $2,171 $360 15%
Baltimore $6,621 $1,452 $2,444 $2,178 $547 13%
Boston $8,591 $2,818 $2,125 $2,913 $735 15%
Chicago $8,840 $3,101 $2,364 $2,636 $739 16%
Cleveland $7,010 $2,098 $2,049 $2,409 $454 15%
Dallas (2) $8,689 $2,877 $2,616 $2,806 $390 16%
Detroit $9,463 $2,793 $2,624 $3,674 $373 19%
Fort Worth (2) $8,689 $2,877 $2,616 $2,806 $390 16%
Houston $10,843 $3,874 $2,980 $3,421 $568 18%
Los Angeles $8,784 $2,513 $2,667 $2,989 $615 16%
Miami $8,427 $2,921 $2,680 $2,318 $508 18%
Minneapolis $8,833 $2,911 $2,350 $2,973 $598 16%
New York $8,495 $2,321 $1,943 $3,137 $1,093 14%
Philadelphia $8,202 $2,037 $2,240 $3,156 $769 14%
Phoenix $9,330 $2,887 $2,658 $3,275 $509 17%
San Diego $7,171 $1,941 $2,412 $2,373 $445 13%
San Francisco $9,535 $2,748 $2,235 $3,252 $1,300 14%
Seattle $9,380 $3,395 $2,454 $2,589 $943 14%
Washington, DC $9,563 $3,028 $2,465 $2,864 $1,206 14%
Mean/Average (3) $8,591 $2,680 $2,450 $2,839 $660 15%
Median $8,689 $2,818 $2,454 $2,864 $568 15%
High $10,843 $3,874 $2,980 $3,674 $1,300 19%
Low $6,621 $1,452 $1,943 $2,171 $360 13%
Source: BLS 2009 Notes: (1) BLS data are for metropolitan regions. (2) Dallas and Fort Worth represent the same metropolitan region for consumer spending data. (3) Average here represents the average among the cities listed and not the national average.
Annual Household Transportation Expenses(2)
(2)
DC
Percent of Household Expenses Related to Transportation Versus Levels of Bicycling and Walking to Work(1)
Legend: = % of trips to work by bicycle
or foot= % of household expenses related to transportation
% o
f ho
use
ho
ld e
xpe
nse
s
rela
ted
to tr
an
spo
rta
tion
% o
f trip
s to
wo
rk b
y b
ike
or
foo
t
Source: BLS 2009, ACS 2009 Notes: r = -0.57. (1) BLS data represent metropolitan regions and ACS data represent cities. (2) Dallas and Fort Worth represent the same metropolitan region for consumer spending data.
Legend: = High value = Low value
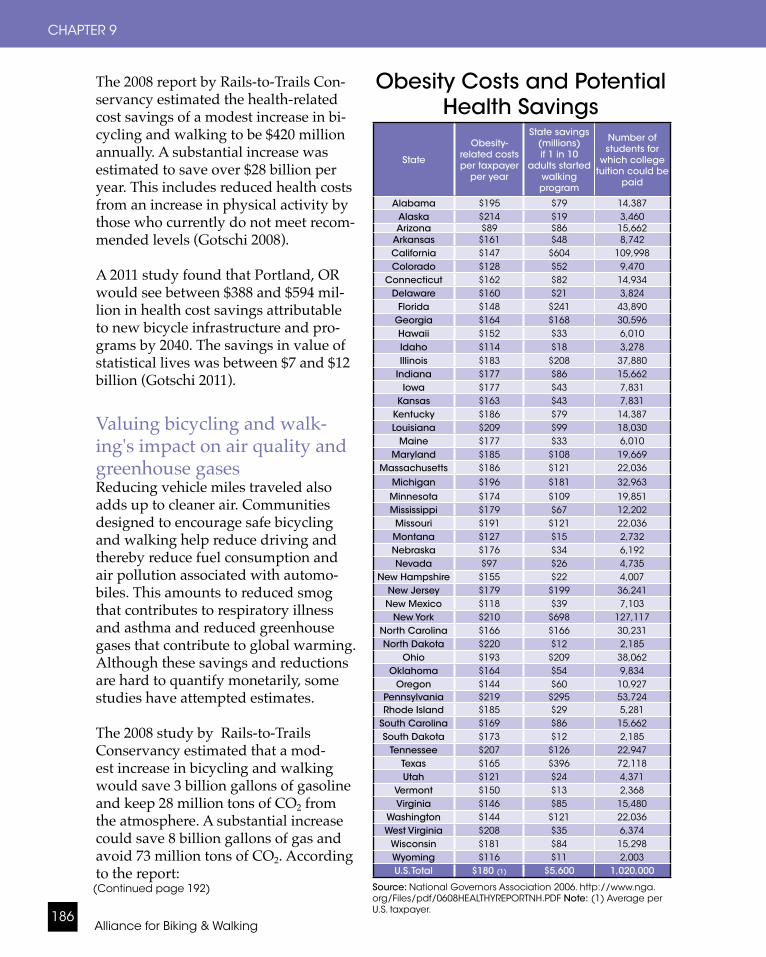
The 2008 report by Rails-to-Trails Con-servancy estimated the health-related cost savings of a modest increase in bi-cycling and walking to be $420 million annually. A substantial increase was estimated to save over $28 billion per year. This includes reduced health costs from an increase in physical activity by those who currently do not meet recom-mended levels (Gotschi 2008). A 2011 study found that Portland, OR would see between $388 and $594 mil-lion in health cost savings attributable to new bicycle infrastructure and pro-grams by 2040. The savings in value of statistical lives was between $7 and $12 billion (Gotschi 2011).
Valuing bicycling and walk-ing's impact on air quality and greenhouse gasesReducing vehicle miles traveled also adds up to cleaner air. Communities designed to encourage safe bicycling and walking help reduce driving and thereby reduce fuel consumption and air pollution associated with automo-biles. This amounts to reduced smog that contributes to respiratory illness and asthma and reduced greenhouse gases that contribute to global warming. Although these savings and reductions are hard to quantify monetarily, some studies have attempted estimates. The 2008 study by Rails-to-Trails Conservancy estimated that a mod-est increase in bicycling and walking would save 3 billion gallons of gasoline and keep 28 million tons of CO2 from the atmosphere. A substantial increase could save 8 billion gallons of gas and avoid 73 million tons of CO2. According to the report:
Alliance for Biking & Walking186
CHAPTER 9
State
Obesity-related costs per taxpayer
per year
State savings (millions) if 1 in 10
adults started walking program
Number of students for
which college tuition could be
paid
Alabama $195 $79 14,387Alaska $214 $19 3,460Arizona $89 $86 15,662
Arkansas $161 $48 8,742California $147 $604 109,998Colorado $128 $52 9,470
Connecticut $162 $82 14,934Delaware $160 $21 3,824
Florida $148 $241 43,890Georgia $164 $168 30,596Hawaii $152 $33 6,010Idaho $114 $18 3,278Illinois $183 $208 37,880
Indiana $177 $86 15,662Iowa $177 $43 7,831
Kansas $163 $43 7,831Kentucky $186 $79 14,387Louisiana $209 $99 18,030
Maine $177 $33 6,010Maryland $185 $108 19,669
Massachusetts $186 $121 22,036Michigan $196 $181 32,963Minnesota $174 $109 19,851Mississippi $179 $67 12,202Missouri $191 $121 22,036Montana $127 $15 2,732Nebraska $176 $34 6,192Nevada $97 $26 4,735
New Hampshire $155 $22 4,007New Jersey $179 $199 36,241New Mexico $118 $39 7,103
New York $210 $698 127,117North Carolina $166 $166 30,231North Dakota $220 $12 2,185
Ohio $193 $209 38,062Oklahoma $164 $54 9,834
Oregon $144 $60 10,927Pennsylvania $219 $295 53,724Rhode Island $185 $29 5,281
South Carolina $169 $86 15,662South Dakota $173 $12 2,185
Tennessee $207 $126 22,947Texas $165 $396 72,118Utah $121 $24 4,371
Vermont $150 $13 2,368Virginia $146 $85 15,480
Washington $144 $121 22,036West Virginia $208 $35 6,374
Wisconsin $181 $84 15,298Wyoming $116 $11 2,003U.S. Total $180 (1) $5,600 1,020,000
Source: National Governors Association 2006. http://www.nga.org/Files/pdf/0608HEALTHYREPORTNH.PDF Note: (1) Average per U.S. taxpayer.
Obesity Costs and Potential Health Savings
(Continued page 192)
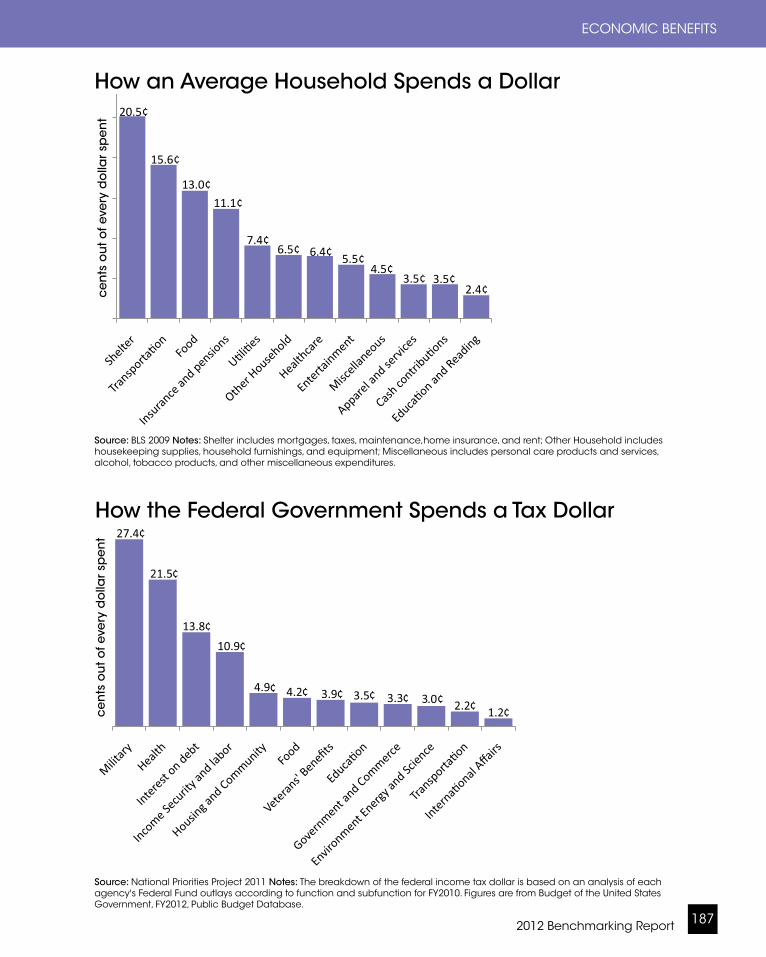
2012 Benchmarking Report 187
ECONOMIC BENEFITS
20.5¢
15.6¢
13.0¢
11.1¢
7.4¢6.5¢ 6.4¢ 5.5¢
4.5¢3.5¢ 3.5¢
2.4¢
How an Average Household Spends a Dollar
Source: BLS 2009 Notes: Shelter includes mortgages, taxes, maintenance,home insurance, and rent; Other Household includes housekeeping supplies, household furnishings, and equipment; Miscellaneous includes personal care products and services, alcohol, tobacco products, and other miscellaneous expenditures.
nationalpriorities.org/tools/taxday/breakdown-one-dollar/ April 18, 2011.s of each agency's Federal Fund outlays according to function and subfunction for FY2010
¢
¢
¢
¢
¢ ¢ ¢ ¢ ¢ .0¢ ¢ ¢
How the Federal Government Spends a Tax Dollar
Source: National Priorities Project 2011 Notes: The breakdown of the federal income tax dollar is based on an analysis of each agency's Federal Fund outlays according to function and subfunction for FY2010. Figures are from Budget of the United States Government, FY2012, Public Budget Database.
ce
nts
ou
t of e
very
do
llar
spe
nt
ce
nts
ou
t of e
very
do
llar
spe
nt
State
Obesity-related costs per taxpayer
per year
State savings (millions) if 1 in 10
adults started walking program
Number of students for
which college tuition could be
paid
Alabama $195 $79 14,387Alaska $214 $19 3,460Arizona $89 $86 15,662
Arkansas $161 $48 8,742California $147 $604 109,998Colorado $128 $52 9,470
Connecticut $162 $82 14,934Delaware $160 $21 3,824
Florida $148 $241 43,890Georgia $164 $168 30,596Hawaii $152 $33 6,010Idaho $114 $18 3,278Illinois $183 $208 37,880
Indiana $177 $86 15,662Iowa $177 $43 7,831
Kansas $163 $43 7,831Kentucky $186 $79 14,387Louisiana $209 $99 18,030
Maine $177 $33 6,010Maryland $185 $108 19,669
Massachusetts $186 $121 22,036Michigan $196 $181 32,963Minnesota $174 $109 19,851Mississippi $179 $67 12,202Missouri $191 $121 22,036Montana $127 $15 2,732Nebraska $176 $34 6,192Nevada $97 $26 4,735
New Hampshire $155 $22 4,007New Jersey $179 $199 36,241New Mexico $118 $39 7,103
New York $210 $698 127,117North Carolina $166 $166 30,231North Dakota $220 $12 2,185
Ohio $193 $209 38,062Oklahoma $164 $54 9,834
Oregon $144 $60 10,927Pennsylvania $219 $295 53,724Rhode Island $185 $29 5,281
South Carolina $169 $86 15,662South Dakota $173 $12 2,185
Tennessee $207 $126 22,947Texas $165 $396 72,118Utah $121 $24 4,371
Vermont $150 $13 2,368Virginia $146 $85 15,480
Washington $144 $121 22,036West Virginia $208 $35 6,374
Wisconsin $181 $84 15,298Wyoming $116 $11 2,003U.S. Total $180 (1) $5,600 1,020,000
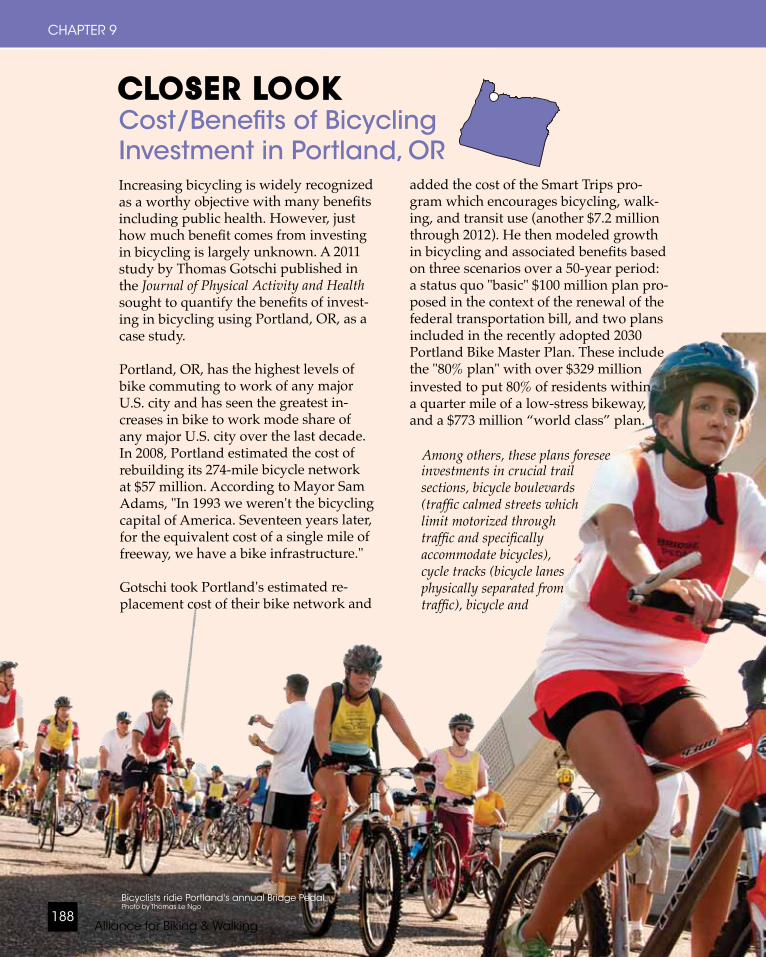
Alliance for Biking & Walking188
CHAPTER 9
Increasing bicycling is widely recognized as a worthy objective with many benefits including public health. However, just how much benefit comes from investing in bicycling is largely unknown. A 2011 study by Thomas Gotschi published in the Journal of Physical Activity and Health sought to quantify the benefits of invest-ing in bicycling using Portland, OR, as a case study. Portland, OR, has the highest levels of bike commuting to work of any major U.S. city and has seen the greatest in-creases in bike to work mode share of any major U.S. city over the last decade. In 2008, Portland estimated the cost of rebuilding its 274-mile bicycle network at $57 million. According to Mayor Sam Adams, "In 1993 we weren't the bicycling capital of America. Seventeen years later, for the equivalent cost of a single mile of freeway, we have a bike infrastructure." Gotschi took Portland's estimated re-placement cost of their bike network and
added the cost of the Smart Trips pro-gram which encourages bicycling, walk-ing, and transit use (another $7.2 million through 2012). He then modeled growth in bicycling and associated benefits based on three scenarios over a 50-year period: a status quo "basic" $100 million plan pro-posed in the context of the renewal of the federal transportation bill, and two plans included in the recently adopted 2030 Portland Bike Master Plan. These include the "80% plan" with over $329 million
CLOSER LOOKCost/Benefits of Bicycling Investment in Portland, OR
Bicyclists ridie Portland's annual Bridge Pedal. Photo by Thomas Le Ngo
invested to put 80% of residents within a quarter mile of a low-stress bikeway, and a $773 million “world class” plan.
Among others, these plans foresee investments in crucial trail sections, bicycle boulevards (traffic calmed streets which limit motorized through traffic and specifically accommodate bicycles), cycle tracks (bicycle lanes physically separated from traffic), bicycle and
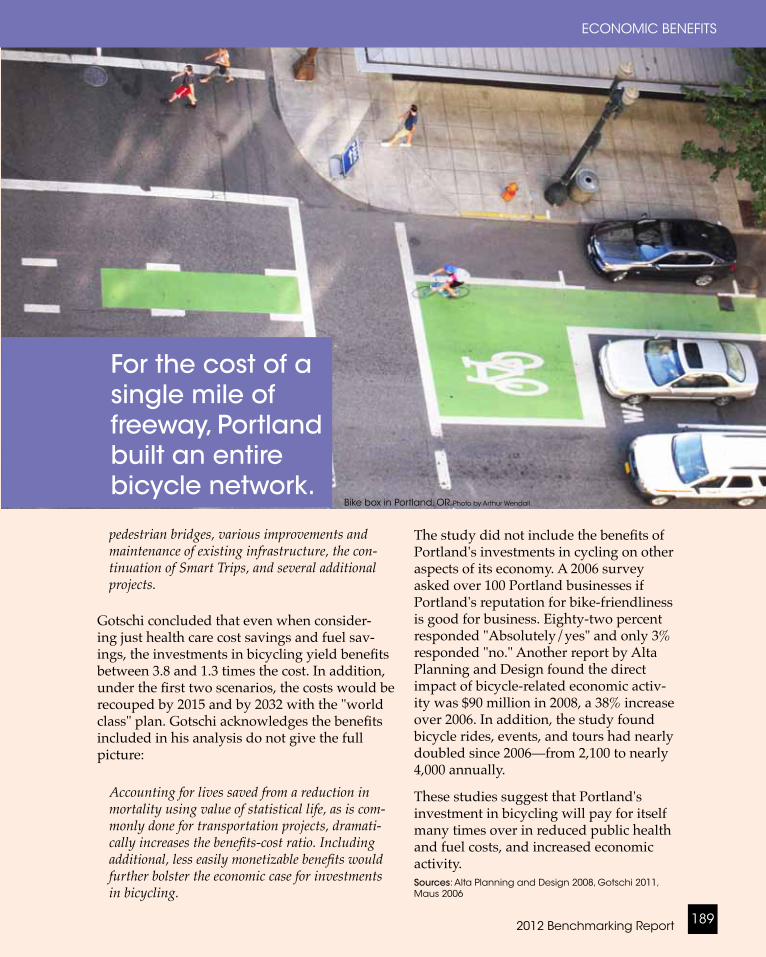
2012 Benchmarking Report 189
ECONOMIC BENEFITS
For the cost of a single mile of freeway, Portland built an entire bicycle network.
Bike box in Portland, OR. Photo by Arthur Wendall.
pedestrian bridges, various improvements and maintenance of existing infrastructure, the con-tinuation of Smart Trips, and several additional projects.
Gotschi concluded that even when consider-ing just health care cost savings and fuel sav-ings, the investments in bicycling yield benefits between 3.8 and 1.3 times the cost. In addition, under the first two scenarios, the costs would be recouped by 2015 and by 2032 with the "world class" plan. Gotschi acknowledges the benefits included in his analysis do not give the full picture:
Accounting for lives saved from a reduction in mortality using value of statistical life, as is com-monly done for transportation projects, dramati-cally increases the benefits-cost ratio. Including additional, less easily monetizable benefits would further bolster the economic case for investments in bicycling.
Sources: Alta Planning and Design 2008, Gotschi 2011, Maus 2006
The study did not include the benefits of Portland's investments in cycling on other aspects of its economy. A 2006 survey asked over 100 Portland businesses if Portland's reputation for bike-friendliness is good for business. Eighty-two percent responded "Absolutely/yes" and only 3% responded "no." Another report by Alta Planning and Design found the direct impact of bicycle-related economic activ-ity was $90 million in 2008, a 38% increase over 2006. In addition, the study found bicycle rides, events, and tours had nearly doubled since 2006—from 2,100 to nearly 4,000 annually. These studies suggest that Portland's investment in bicycling will pay for itself many times over in reduced public health and fuel costs, and increased economic activity.

Looking Outside the BordersBicycling in Groningen: An Economic ProgramThisarticlewasoriginallypublishedbyGlobalIdeasBankandisreprintedherewithpermissionfromAndrewCurry,GlobalIdeasBank,April2004.
ness. It has been proved that planning for the bicycle is cheaper than planning for the car.' Proving the point, requests now regularly arrive from shopkeepers in streets where 'cyclisation' is not yet in force to ban car traffic on their roads.
A vital threshold has been crossed. Through sheer weight of numbers, the bicycle lays down the rules, slowing down traffic, determining the attitudes of drivers. All across the city roads are being narrowed or closed to traffic, cycleways are being constructed and new houses built to which the only direct access is by bicycle. Out-of-town shopping centres are banned. The aim is not to force cars to take longer detours, but to provide a 'fine mesh' network for bicycles, giving them easy access to the city center.
Alliance for Biking & Walking190
CHAPTER 9
In Groningen, the Netherlands' sixth largest city, the main form of transport is the bicycle. Sixteen years ago, ruinous traffic congestion led city planners to
dig up city-center motorways. In 2003 they set about creating a car-free city center. Now Groningen, with a popula-tion of 170,000, has the highest level of bicycle usage in the West. Fifty-seven percent of its inhabitants travel by bicycle—compared with four percent in the UK.
The economic repercussions of the program repay some examination. Since 1977, when a six-lane motorway inter-section in the city's center was replaced by greenery, pedestrianisation, cycle-ways, and bus lanes, the city has staged a remarkable recovery. Rents are among the highest in the Netherlands, the out-flow of population has been reversed and businesses, once in revolt against car restraint, are clamouring for more of it. As Gerrit van Werven, a senior city planner, puts it, 'This is not an environ-mental program, it is an economic pro-gram. We are boosting jobs and busi-
" This is not an environmental program, it is an economic program. We are boosting jobs and business."
Cyclists in Groningen. Photo by Jan Glas.

Like the Netherlands nationally, Gron-ingen is backing bicycles because of fears about car growth. Its ten-year bicycle programme is costing £20m, but every commuter car it keeps off the road saves at least £170 a year in hidden costs such as noise, pollution, parking and health.
Bicycling in Groningen is viewed as part of an integral urban renewal, plan-ning and transport strategy. Bicycle-friendly devices seen as exceptional in the UK—separate cycle ways, advanced stop lines at traffic lights, and official sanction for bicyclists to do right hand turns at red lights—are routine.
New city center buildings must provide bicycle garages. There are tens of thou-sands of parking spaces for bicycles, either in 'guarded' parks—the central railway station has room for over 3,000 —or street racks. Under the city hall a nuclear shelter has been turned into a bicycle park (bike parking).
"We don't want a good system for bicy-cles, we want a perfect system", says Mr. van Werven. "We want a system for bi-cycles that is like the German autobahns for cars. We don't ride bicycles because we are poor—people here are richer than in England. We ride them because it is fun, it is faster, it is convenient."
2012 Benchmarking Report 191
ECONOMIC BENEFITS
Cyclists in Groningen. Photo by Tup Wanders
Alliance for Biking & Walking192
CHAPTER 9
10: CONCLUSION
To achieve equivalent fuel savings through vehicle efficiency improvements alone, between 19 million and more than 50 million drivers would need to trade in their vehicles for a highly efficient gas-electric hybrid version of the same model. To put this in perspective, there are about 250 million automobiles on America's streets and, despite rapidly growing sales, by the end of 2007 only about one million of them were hybrid vehicles."
The study estimated the value of CO2 reduction from miles driven avoided to be $333 million with a modest increase in bicycling and walking and over $2.7 billion with a substantial increase (Gots-chi 2008).
A Prudent InvestmentResearch looking at the cost/benefit of investing in bicycling and walking all point to the same conclusion. Bicycling and walking pay dividends.
• Lincoln, Nebraska: Every $1 spent on use of bicycle and pedestrian
trails (including construction, main-tenance, equipment, and travel) yields $2.94 in direct medical benefits (Wang et. al., 2008).
• Portland, Oregon: Every $1 invested in bicycling yields $3.40 in health care cost savings. When the statisti-cal value of lives is considered, as is done for the evaluation of highway safety improvement projects, every $1 invested yields nearly $100 in benefits (Gotschi 2011).
• Kansas City: Every dollar invested in bicycle and pedestrian projects yields $11.80 in benefits (Ridgway 2010).
• Every dollar invested in bicycle networks yields at least $4 to $5 in benefits (Sælensminde 2004).
Investing in bicycle and pedestrian infrastructure is not only affordable, it creates jobs, stimulates local economies, increases property values, and has last-ing benefits to health, air quality, and quality of life.
Photo by Elizabeth Edwards
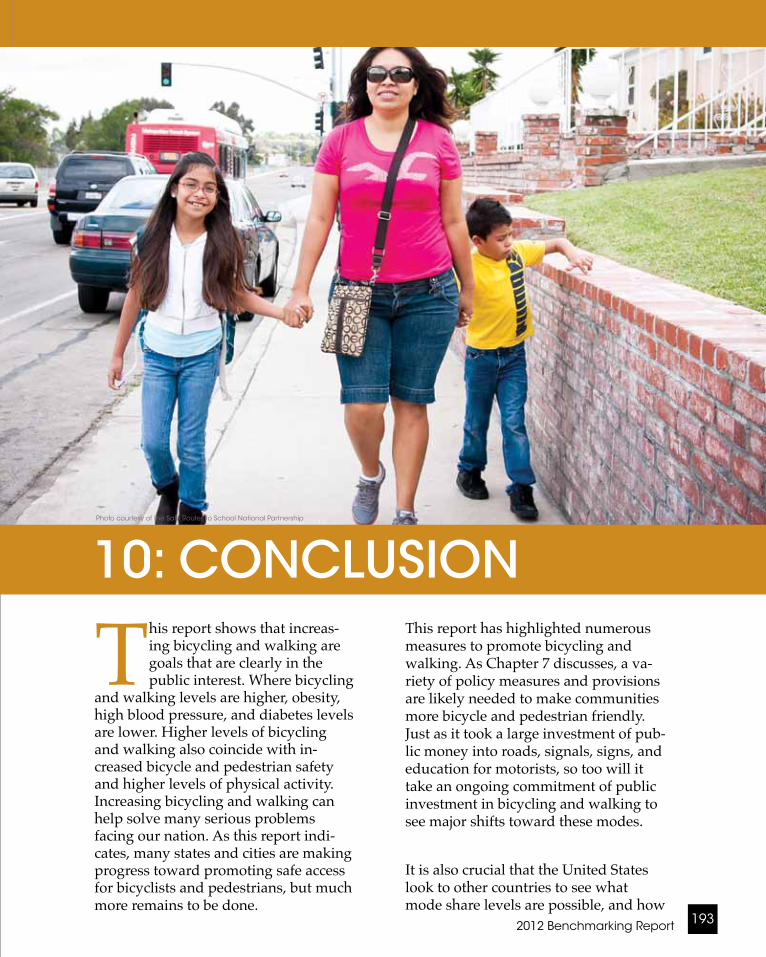
2012 Benchmarking Report 193
CONCLUSION
This report shows that increas-ing bicycling and walking are goals that are clearly in the public interest. Where bicycling
and walking levels are higher, obesity, high blood pressure, and diabetes levels are lower. Higher levels of bicycling and walking also coincide with in-creased bicycle and pedestrian safety and higher levels of physical activity. Increasing bicycling and walking can help solve many serious problems facing our nation. As this report indi-cates, many states and cities are making progress toward promoting safe access for bicyclists and pedestrians, but much more remains to be done.
10: CONCLUSIONThis report has highlighted numerous measures to promote bicycling and walking. As Chapter 7 discusses, a va-riety of policy measures and provisions are likely needed to make communities more bicycle and pedestrian friendly. Just as it took a large investment of pub-lic money into roads, signals, signs, and education for motorists, so too will it take an ongoing commitment of public investment in bicycling and walking to see major shifts toward these modes.
It is also crucial that the United States look to other countries to see what mode share levels are possible, and how
Photo courtesy of the Safe Routes to School National Partnership
Alliance for Biking & Walking194
CHAPTER 10
Photo by Paul Adkins
2012 Benchmarking Report 195
CONCLUSION
12% of trips in the United States are by
bicycle or foot, yet bicyclists and
pedestrians make up 14% of traffic fatalities
and receive just 1.6% of federal
transportation dollars.
ability to fully participate in Ameri-can society, or else makes them reliant on others to drive them around. Less than half of states and major U.S. cities have adopted complete streets policies, which require that roadways be de-signed and built with all users in mind. In the absence of a national complete streets policy, the Alliance encourages states and jurisdictions to pursue local policies to begin to transform their local transportation culture and guarantee access for all road users.
Other policies featured in this report, such as education for police officers and the inclusion of bicycling and walking safety in driver education, are also key to the shift toward a bicycle and pedes-trian friendly culture. Adult and youth education programs, public awareness campaigns such as "Share the Road," and other promotional efforts can also help raise awareness and change atti-tudes around bicycling and walking.
Many of the benchmarks featured in this report contribute to making com-
they have increased bicycling, walk-ing, and safety. The United States lags far behind other countries and interna-tional cities in regard to walk and bike share of trips, safety, and public health. As this report has shown, the coun-tries and cities with the greatest levels of bicycling and walking are also the safest places to bicycle and walk. These countries also have the lowest levels of obesity and report that prioritizing bicycling and walking is good for their economies.
As this report shows, the United States overall has great disparities between bicycling and walking mode share, safety, and funding. Twelve percent of trips are by bicycle or foot, yet bicyclists and pedestrians make up 14% of traffic fatalities and receive just 1.6% of federal transportation dollars. An international comparison of bicycle funding and mode share by Gotschi and Mills and Rails-to-Trails Conservancy (see chapter 4, page 96) demonstrates that interna-tional cities that invest greater amounts per capita into bicycling have greater levels of bicycling. These cities provide strong evidence that in order to increase bicycling and walking, the United States must invest significantly more in these modes. Although greater investment in bi-cycling and walking is the primary recommendation of this report, there are many other measures that must be taken to simultaneously strengthen public policy, infrastructure, and be-havior toward bicycling and walking. Over one-third of the U.S. population is under age 16 (typically cannot legally drive) or over age 65. Streets that do not adequately accommodate bicyclists and pedestrians create barriers for people who do not drive. This limits their
Alliance for Biking & Walking196
CHAPTER 10
munities more bicycle and pedestrian friendly by changing the built environ-ment, culture, attitudes, and behaviors. But continuous evaluation of efforts to promote bicycling and walking is key to better understanding the relationships between levels of bicycling and walk-ing, safety, policies, provisions, advoca-cy capacity, and other measures. Bench-marking is a necessary process to better understand these relationships, identify the most strategic areas on which to fo-cus resources, and ultimately to increase these forms of active transportation.
Through researching and compiling data for this report, the Alliance has identified several places in need of im-proved data collection.
• Accurate data on state and local bicycling and walking levels are the key outcome indicator needed to measure success, and yet none cur-rently exists. The ACS is an annual survey that measures share of com-muters by bicycle or on foot, but no existing survey collects data on all trip purposes with enough samples to evaluate the local level. A nation-al household travel survey should be funded to allow for greater sample size at the local level and to be conducted more regularly—ev-ery 7 years is not frequent enough. The Alliance encourages the fed-eral government to fund annual or biennial travel surveys to more accurately measure progress and to better understand travel behaviors, trends, and needs for all modes of transportation.
• Funding data on bicycling and walking are recorded by state departments of transportation for the FHWA. Differences in project coding methods mean that data on
funding are not always accurate or comparable between states. For example, a project with bicycle and pedestrian components that are a small amount of the total project cost might not be coded as a bicycle and pedestrian project at all in one location, but another location might break the project out into its parts. Also, some projects are coded by county, some by standard place code, and some by urbanized area. The differences in coding make it difficult to identify which projects are in certain cities. If projects that spanned a county also included codes for the cities affected by the project, it would be easier to obtain accurate spending data at the local level. The Alliance encourages the FHWA to set standards for cod-ing projects so that spending on bicycling and walking can be more accurately tracked.
• The FHWA should develop a better method of tracking federal safety funding and what percentage of this funding in each state is being used for bicycle and pedestrian projects. With the great disparities that exist between bicycle and pedestrian mode share and fatality rates, it is essential that officials and advocates push for a fair share for safety.
• Many states and cities were unable to provide data on quantities of bicycle and pedestrian infrastruc-ture such as miles of sidewalks, bike lanes, trails, and number of bicycle racks. The Alliance recommends that the FHWA develop a frame-work for best practices for states and local jurisdictions to conduct audits and report on bicycle and pe-destrian facilities (and gaps) every 1 to 2 years.
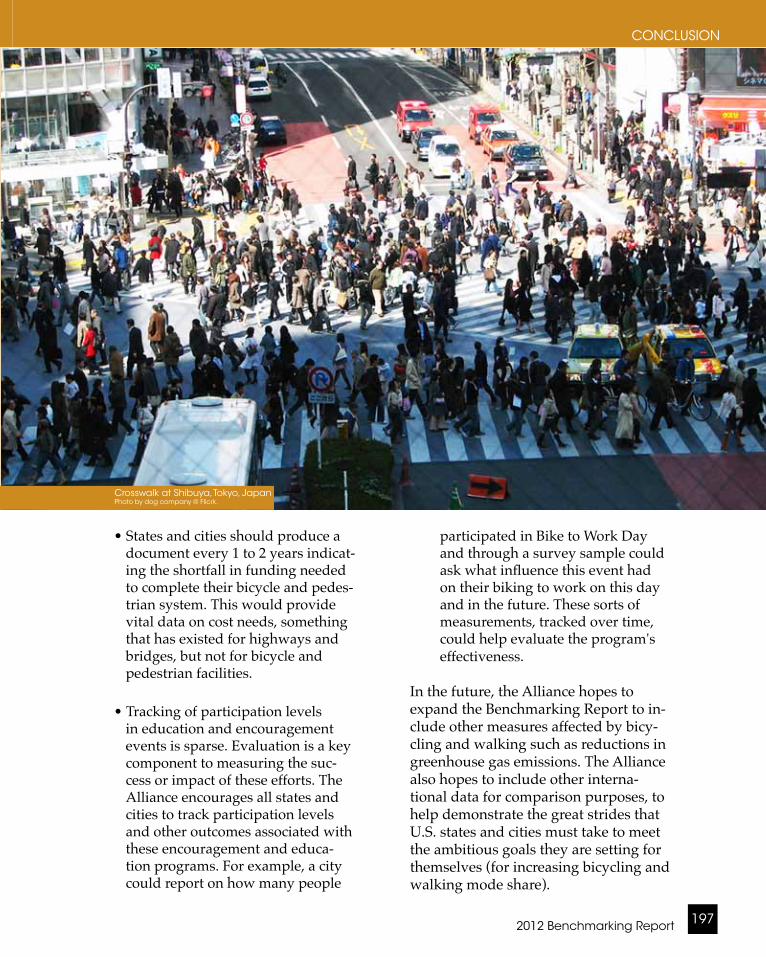
2012 Benchmarking Report 197
CONCLUSION
• States and cities should produce a document every 1 to 2 years indicat-ing the shortfall in funding needed to complete their bicycle and pedes-trian system. This would provide vital data on cost needs, something that has existed for highways and bridges, but not for bicycle and pedestrian facilities.
• Tracking of participation levels in education and encouragement events is sparse. Evaluation is a key component to measuring the suc-cess or impact of these efforts. The Alliance encourages all states and cities to track participation levels and other outcomes associated with these encouragement and educa-tion programs. For example, a city could report on how many people
participated in Bike to Work Day and through a survey sample could ask what influence this event had on their biking to work on this day and in the future. These sorts of measurements, tracked over time, could help evaluate the program's effectiveness.
In the future, the Alliance hopes to expand the Benchmarking Report to in-clude other measures affected by bicy-cling and walking such as reductions in greenhouse gas emissions. The Alliance also hopes to include other interna-tional data for comparison purposes, to help demonstrate the great strides that U.S. states and cities must take to meet the ambitious goals they are setting for themselves (for increasing bicycling and walking mode share).
Crosswalk at Shibuya, Tokyo, Japan Photo by dog company @ Flicrk.

Alliance for Biking & Walking198
CHAPTER 10
In the meantime, this report provides plenty of examples of states and cities that are leaders in a variety of efforts to promote bicycling and walking. Ap-pendix 5, page 209, lists a number of resources from these cities and states. These are presented so that practitio-ners can have models for inspiration when working toward their goals. The Benchmarking Report should be used as a tool by cities and states to learn what works best to promote bicy-cling and walking and what is possible here in the United States. States and cit-ies can learn from each other's successes and failures and set their goals accord-ingly. The Alliance encourages all state and city officials and advocates to take an active role in benchmarking their ef-forts to promote bicycling and walking. Even smaller cities that are not included in this report can collect data from their city and compare it to the benchmarks and progress in other communities.
Photo courtesy of Minnesota Clean Energy Resource Teams
There is no doubt that government of-ficials and advocates seeking to grow bicycling and walking have a lot of work ahead of them. But it is crucial for advocates and officials to take the time to evaluate their efforts. While many international benchmarking efforts re-quire huge investments of government time and money to participate, the Al-liance's Benchmarking Project is a free service that requires a relatively small amount of time to complete a survey every 2 years. With more officials and advocates taking the time to fully par-ticipate, this project will become a better source of information and a stronger benchmarking tool for everyone. If you would like more information about this report, please contact the Alliance at [email protected].
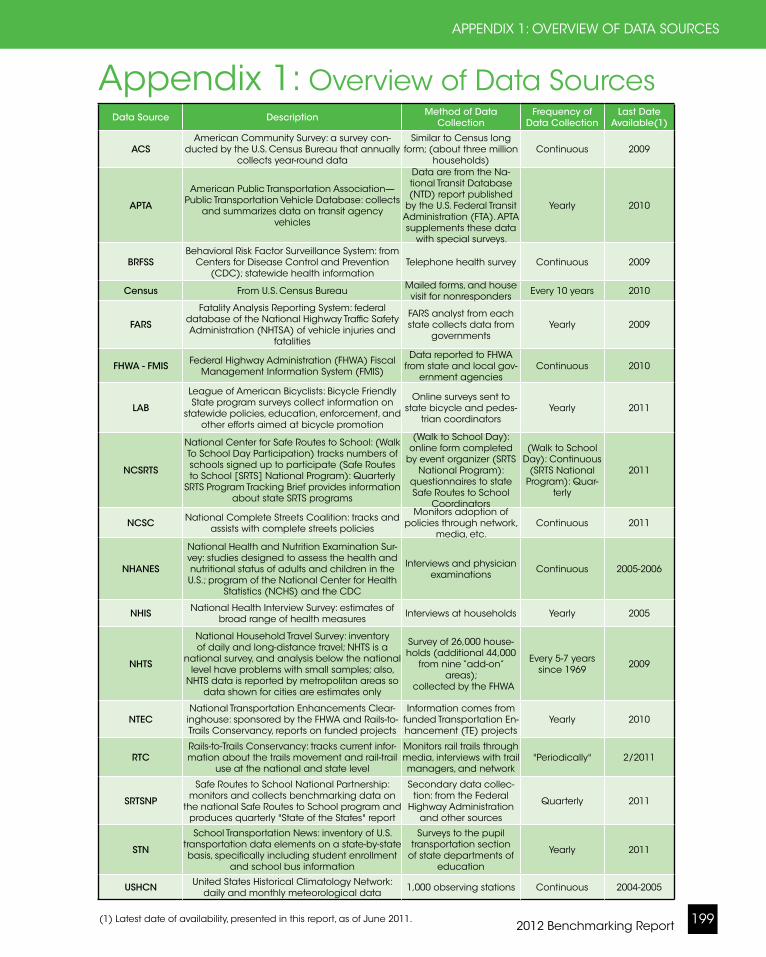
2012 Benchmarking Report 199
Appendix 1: Overview of Data Sources
APPENDIX 1: OVERVIEW OF DATA SOURCES
(1) Latest date of availability, presented in this report, as of June 2011.
Data Source Description Method of Data Collection
Frequency of Data Collection
Last Date Available(1)
ACS American Community Survey: a survey con-
ducted by the U.S. Census Bureau that annually collects year-round data
Similar to Census long form; (about three million
households)Continuous 2009
APTA
American Public Transportation Association—Public Transportation Vehicle Database: collects
and summarizes data on transit agency vehicles
Data are from the Na-tional Transit Database (NTD) report published
by the U.S. Federal Transit Administration (FTA). APTA supplements these data
with special surveys.
Yearly 2010
BRFSSBehavioral Risk Factor Surveillance System: from
Centers for Disease Control and Prevention (CDC); statewide health information
Telephone health survey Continuous 2009
Census From U.S. Census Bureau Mailed forms, and house visit for nonresponders Every 10 years 2010
FARS
Fatality Analysis Reporting System: federal database of the National Highway Traffic Safety Administration (NHTSA) of vehicle injuries and
fatalities
FARS analyst from each state collects data from
governmentsYearly 2009
FHWA - FMIS Federal Highway Administration (FHWA) Fiscal Management Information System (FMIS)
Data reported to FHWA from state and local gov-
ernment agenciesContinuous 2010
LAB
League of American Bicyclists: Bicycle Friendly State program surveys collect information on
statewide policies, education, enforcement, and other efforts aimed at bicycle promotion
Online surveys sent to state bicycle and pedes-
trian coordinatorsYearly 2011
NCSRTS
National Center for Safe Routes to School: (Walk To School Day Participation) tracks numbers of schools signed up to participate (Safe Routes to School [SRTS] National Program): Quarterly
SRTS Program Tracking Brief provides information about state SRTS programs
(Walk to School Day): online form completed
by event organizer (SRTS National Program):
questionnaires to state Safe Routes to School
Coordinators
(Walk to School Day): Continuous
(SRTS National Program): Quar-
terly
2011
NCSC National Complete Streets Coalition: tracks and assists with complete streets policies
Monitors adoption of policies through network,
media, etc.Continuous 2011
NHANES
National Health and Nutrition Examination Sur-vey: studies designed to assess the health and nutritional status of adults and children in the U.S.; program of the National Center for Health
Statistics (NCHS) and the CDC
Interviews and physician examinations Continuous 2005-2006
NHIS National Health Interview Survey: estimates of broad range of health measures Interviews at households Yearly 2005
NHTS
National Household Travel Survey: inventory of daily and long-distance travel; NHTS is a
national survey, and analysis below the national level have problems with small samples; also,
NHTS data is reported by metropolitan areas so data shown for cities are estimates only
Survey of 26,000 house-holds (additional 44,000
from nine “add-on” areas);
collected by the FHWA
Every 5-7 years since 1969 2009
NTECNational Transportation Enhancements Clear-
inghouse: sponsored by the FHWA and Rails-to-Trails Conservancy, reports on funded projects
Information comes from funded Transportation En-hancement (TE) projects
Yearly 2010
RTCRails-to-Trails Conservancy: tracks current infor-mation about the trails movement and rail-trail
use at the national and state level
Monitors rail trails through media, interviews with trail managers, and network
"Periodically" 2/2011
SRTSNP
Safe Routes to School National Partnership: monitors and collects benchmarking data on
the national Safe Routes to School program and produces quarterly "State of the States" report
Secondary data collec-tion: from the Federal
Highway Administration and other sources
Quarterly 2011
STN
School Transportation News: inventory of U.S. transportation data elements on a state-by-state basis, specifically including student enrollment
and school bus information
Surveys to the pupil transportation section
of state departments of education
Yearly 2011
USHCN United States Historical Climatology Network: daily and monthly meteorological data 1,000 observing stations Continuous 2004-2005

Alliance for Biking & Walking200
Appendix 2: Organization and Study Area Matches
APPENDIX 2
City Alliance organizationAlbuquerque Bike ABQ (1)
Arlington, TX NRO
Atlanta Atlanta Bicycle Coalition
Austin League of Bicycling Voters, Austin Cycling Association(1)
Baltimore NRO
Boston 1- LivableStreets Alliance, 2- Walk Boston, 3- Boston Cyclists UnionCharlotte Charlotte Area Bicycle Alliance
Chicago 1- Active Transportation Alliance, 2- Chicagoland Bicycling GroupCleveland 1- Walk+Roll, 2- Cleveland Bikes
Colorado Springs NRO (4)
Columbus 1- Consider Biking, 2 -Yay BikesDallas BikeDFW
Denver BikeDenver
Detroit NRO
El Paso NRO
Fort Worth BikeDFW
Fresno NRO
Honolulu Hawaii Bicycling League
Houston Citizens' Transportation CoalitionIndianapolis 1- Alliance for Health Promotion 2- IndyCogJacksonville NRO
Kansas City, MO Kansas City Bicycle Club, Bike Walk KC (1), Revolve (1)
Las Vegas Outside Las Vegas Foundation(1)
Long Beach Los Angeles County Bicycle Coalition, City Fabrick (1), Bikeable Communities (1)
Los Angeles Los Angeles County Bicycle Coalition, C.I.C.L.E. (1), Bikeside(1)
Louisville Bicycling for Louisville
Memphis Livable MemphisMesa NRO
Miami Green Mobility NetworkMilwaukee Bicycle Federation of Wisconsin (3)
Minneapolis 1- St. Paul Smart Trips, 2- Midtown Greenway Coalition, Minneapolis Bicycle Coalition (1)
Nashville NRO (4)
New Orleans Bike Easy
New York Transportation Alternatives
Oakland Walk Oakland Bike Oakland
Oklahoma City NRO
Omaha Bike Omaha (1)
Philadelphia Bicycle Coalition of Greater Philadelphia
Phoenix NRO
Portland, OR 1- Bicycle Transportation Alliance (3), 2- Willamette Pedestrian Coalition 3- Community Cycling Center
Raleigh NRO
Sacramento Sacramento Area Bicycle Advocates, Walk Sacramento
San Antonio NRO
San Diego San Diego County Bicycle Coalition
San Francisco 1- San Francisco Bicycle Coalition 2- Walk SF
San Jose Silicon Valley Bicycle Coalition (1)
Seattle 1- Cascade Bicycle Club 2- Feet First 3- UndrivingTucson Living Streets Alliance (1)
Tulsa Tulsa HubVirginia Beach NRO
Washington, DC Washington Area Bicyclist Association (1)
City Advocacy Organizations
Legend:NRO = No Representative Organization = Organization is new to the Alliance since the 2010 Benchmarking Report
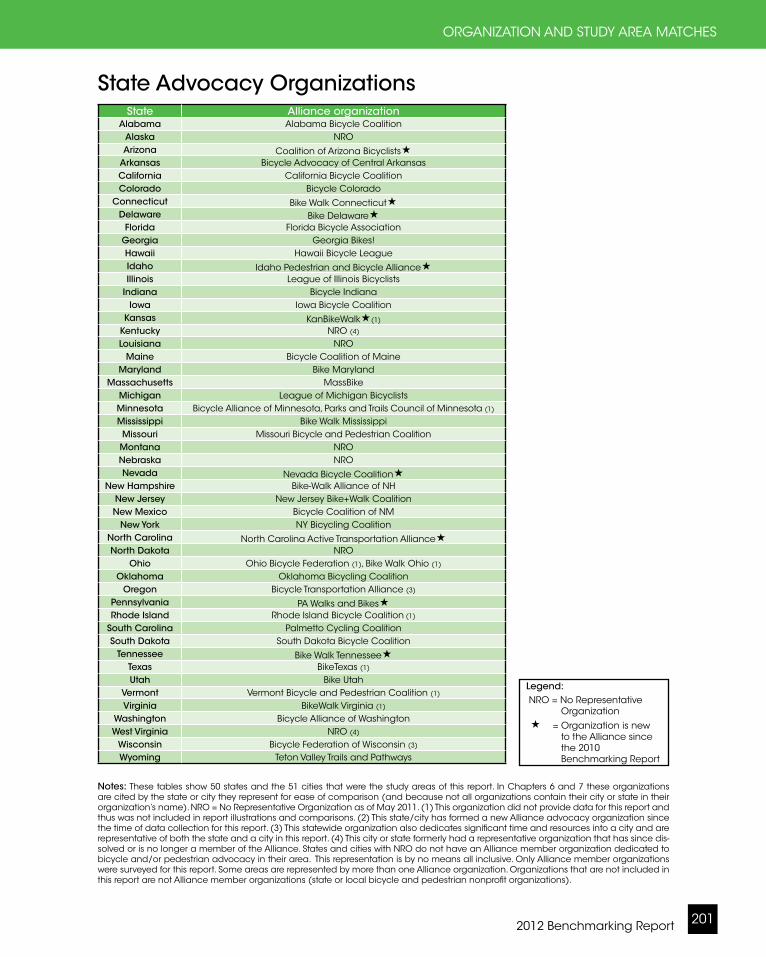
2012 Benchmarking Report 201
Notes: These tables show 50 states and the 51 cities that were the study areas of this report. In Chapters 6 and 7 these organizations are cited by the state or city they represent for ease of comparison (and because not all organizations contain their city or state in their organization’s name). NRO = No Representative Organization as of May 2011. (1) This organization did not provide data for this report and thus was not included in report illustrations and comparisons. (2) This state/city has formed a new Alliance advocacy organization since the time of data collection for this report. (3) This statewide organization also dedicates significant time and resources into a city and are representative of both the state and a city in this report. (4) This city or state formerly had a representative organization that has since dis-solved or is no longer a member of the Alliance. States and cities with NRO do not have an Alliance member organization dedicated to bicycle and/or pedestrian advocacy in their area. This representation is by no means all inclusive. Only Alliance member organizations were surveyed for this report. Some areas are represented by more than one Alliance organization. Organizations that are not included in this report are not Alliance member organizations (state or local bicycle and pedestrian nonprofit organizations).
State Alliance organizationAlabama Alabama Bicycle Coalition
Alaska NROArizona Coalition of Arizona Bicyclists
Arkansas Bicycle Advocacy of Central ArkansasCalifornia California Bicycle CoalitionColorado Bicycle Colorado
Connecticut Bike Walk ConnecticutDelaware Bike Delaware
Florida Florida Bicycle AssociationGeorgia Georgia Bikes!Hawaii Hawaii Bicycle LeagueIdaho Idaho Pedestrian and Bicycle AllianceIllinois League of Illinois Bicyclists
Indiana Bicycle IndianaIowa Iowa Bicycle Coalition
Kansas KanBikeWalk(1)
Kentucky NRO (4)
Louisiana NROMaine Bicycle Coalition of Maine
Maryland Bike MarylandMassachusetts MassBike
Michigan League of Michigan BicyclistsMinnesota Bicycle Alliance of Minnesota, Parks and Trails Council of Minnesota (1)
Mississippi Bike Walk MississippiMissouri Missouri Bicycle and Pedestrian CoalitionMontana NRONebraska NRONevada Nevada Bicycle Coalition
New Hampshire Bike-Walk Alliance of NHNew Jersey New Jersey Bike+Walk CoalitionNew Mexico Bicycle Coalition of NM
New York NY Bicycling CoalitionNorth Carolina North Carolina Active Transportation AllianceNorth Dakota NRO
Ohio Ohio Bicycle Federation (1), Bike Walk Ohio (1)
Oklahoma Oklahoma Bicycling CoalitionOregon Bicycle Transportation Alliance (3)
Pennsylvania PA Walks and BikesRhode Island Rhode Island Bicycle Coalition (1)
South Carolina Palmetto Cycling CoalitionSouth Dakota South Dakota Bicycle Coalition
Tennessee Bike Walk TennesseeTexas BikeTexas (1)
Utah Bike UtahVermont Vermont Bicycle and Pedestrian Coalition (1)
Virginia BikeWalk Virginia (1)
Washington Bicycle Alliance of WashingtonWest Virginia NRO (4)
Wisconsin Bicycle Federation of Wisconsin (3)
Wyoming Teton Valley Trails and Pathways
State Advocacy Organizations
Legend: NRO = No Representative Organization = Organization is new to the Alliance since the 2010 Benchmarking Report
ORGANIZATION AND STUDY AREA MATCHES
Alliance for Biking & Walking202
APPENDIX 3
Appendix 3: Challenges with Trip Data
Determining How Many People Bike and Walk The question of how many people bicycle or walk is not easily answered with the limited data available. The most reliable source of information on how many people bike or walk comes from the U.S. Census Journey to Work data (and the annual American Com-munity Survey). However, census figures are limiting and inaccurate for a number of reasons. The Census Bureau only collects data on the main mode of transportation to work. This measure excludes trips of individuals not in the workforce, such as children or retirees. Moreover other trip purposes, such as shopping and recreational outings, are not captured. Additionally, the Census Bureau only reports the main mode of transportation to work, thus exclud-ing many walk and bike trips used for shorter segments of commutes, for example, walk trips to transit stops or a walk from the parking garage to work, and also misses people who walk or bicycle 1 or 2 days a week.
Comparing Data from the Census and ACS Surveys It is also not completely accurate to compare data from the decennial Census to the annual American Com-munity Survey. While the decennial Census is taken in April, ACS data are collected throughout the year. The time of year the Census data are collected
might influence reported bike and walk share of work trips. This is particularly true in cities such as Minneapolis and Boston which can still be cold in April. Although the decennial Census has a larger sample size, in this case, the ACS may more accurately reflect bicycle travel because it is collected throughout the year.
The biggest difference in the survey-ing between the ACS and the Census is that the ACS is done every year instead of every decade. However, the Census provides detailed socioeconomic data and for much smaller areas. There are differences in the ACS and the Census when it comes to residence rules, uni-verses, and reference periods. However, comparisons can generally be made for most population and housing subjects. For some categories such as disability, income, and employment status, the U.S. Census Bureau recommends not comparing or comparing with caution. But according to the Bureau, the catego-ry “means of transportation to work” is comparable from the ACS to the Census and between the different years of the ACS. http://www.census.gov/acs/www/UseData/Comparison_Guid-ance.htm#transport.
Bicycle and Pedestrian Travel Data for All Trip PurposesThe National Household Travel Study (NHTS) is another source of data on daily travel, sponsored by the Bureau of Transportation Statistics and the Federal Highway Administration. The NHTS attempts to collect data on all trips, not
2012 Benchmarking Report 203
just trips to work. However, because it is a national survey, analysis below the national level has problems with small sample sizes. It is also difficult to extract data for cities from this source as it uses Metropolitan Statistical Areas (MSAs), which often stretch beyond city boundaries. Also, the NHTS is only col-lected every 5 to 7 years. Due to these limitations, NHTS data on city and state levels should be considered as rough estimates for walking and bicycling in these areas. The NHTS methodology includes a brief phone survey that gathers basic demographic information and asks the person if he or she is willing to keep a travel diary for a day to record all trips by members of the household, includ-ing children. Travel diaries are mailed to the household and NHTS officials follow up to answer any questions. Sur-vey participants then receive a follow-up call from NHTS to collect informa-tion from the travel diary. They are asked a number of questions on their travel behavior during their assigned travel day and during the last week including such questions as how many times they went for a walk or bike ride, how long did they spend bicycling or walking, and (if they drive) how many minutes it takes them to walk from where they park to their workplace. To view the most recent complete NHTS questionnaire, visit http://nhts.ornl.gov/2008/doc/NHTS_2008_Question-naire.pdf.
Other Trip Count EffortsBecause of the serious gap in reliable data on bicycling (and walking) trips, there have been numerous efforts to create a more reliable means to mea-
sure travel. Barnes and Krizek (2005) developed a formula for determining total bicycling trips by multiplying the commute share by 1.5 and adding 0.3%. Some cities have done their own travel counts in an attempt to deter-mine the share of all bicycle trips. Of all cities surveyed, 25 reported having conducted some type of bicycle count at least once (Atlanta, Austin, Baltimore, Boston, Charlotte, Chicago, Columbus, Dallas, Denver, Honolulu, Houston, Long Beach, Louisville, Memphis, Minneapolis, New York, Oakland, Philadelphia, Portland, San Diego, San Francisco, San Jose, Seattle Tucson, and Washington, DC). Eight of these cities (Chicago, Columbus, Denver, Minne-apolis, New York, Portland, San Fran-cisco, and Seattle) reported having done an “all-trips” count to determine bicycle mode share.
San Francisco provides an example of the discrepancies in travel counts and methods to determine bicycling and walking mode share. The Barnes and Krizek formula indicates that 4.1% of all trips in San Francisco are by bicycle. This number is higher than the NHTS estimate of 0.93% of all trips repre-sented by bicyclists. According to the 2000 Census, 1.98% of work trips are by bicycle. The Census Bureau’s American Community Survey (ACS) 2007 data show bike to work share in San Francis-co as 2.52%. And a city-commissioned study shows bicycling mode share is 6%. The study commissioned by San Francisco is more likely correct, because of a larger sample size and more robust methods. However, because there is a lack of standardized trip counts for multiple cities, the Alliance could not extrapolate a formula for all bicycle trips to apply across cities and states.
CHALLENGES WITH TRIP DATA
Appendix 3: Challenges with Trip Data

Alliance for Biking & Walking204
Prospective SolutionsThe National Bicycle and Pedestrian Documentation Project (NBPD), coordi-nated by the Institute of Transportation Engineers, is attempting to address the gap in accurate and comparable trip count data. NBPD sets detailed stan-dards and guidelines and provides tools for performing bicycle and pedestrian counts and surveys in communities and collects data from communities in a centralized database. By using the same methodologies, NBPD can compare progress of cities and better identify fac-tors that influence bicycling and walk-ing levels. To date, NBPD has collected counts from over 50 organizations and 500 locations. More widespread and consistent participation from local agen-cies could help this tool reach its full potential. Another potential solution is for the federal government to fund more regular travel surveys. Currently the National Household Travel Survey is only done every several years and low sampling on the local level makes com-parisons inaccurate. There is currently discussion in Congress about adding funding for improved data collection at the federal level as part of the next federal transportation bill. This sort of investment in surveying bicycling and walking levels is crucial to evaluating the impact of investments and efforts toward increasing these modes.
ApplicationsCollection of bicycling and walking data would assist transportation plan-ners, public health officials, and elected officials in making informed decisions.
Transportation planners would receive information regarding the impact of bicycling and walking facilities, and be able to put information on injuries in perspective with information on the levels of bicycling and walking. A robust data collection system could help public health officials target and assess community-level interventions for physical activity and injury preven-tion efforts. Elected officials would have access to the same types of data that exist for motor vehicles, including information on the cost of the projects and the subsequent effect on bicycling and walking.
The World Health Organization Re-gional Office for Europe has developed a promising tool, the Health Economic Assessment Tool (HEAT) for bicycling. This could further inform decisions about bicycling and walking infra-structure by providing an estimate for the economic value of positive health effects of bicycling. HEAT for bicycling requires information on the number of trips done by bicycle and the average trip distance, and, based on these in-puts and best-evidence default values, the economic savings that result from reduced mortality due to regular physi-cal activity from commuter bicycling are estimated. This tool could be used to estimate the value of health effects of current levels of bicycling, calculate the health-related economic benefits when planning new bicycling infrastructure, or provide input into more comprehen-sive cost-benefit analyses. If bicycling and walking data collection was as ro-bust as other modes of transportation, it would assist professionals and the pub-lic to make better informed decisions about the design of their communities.
APPENDIX 3
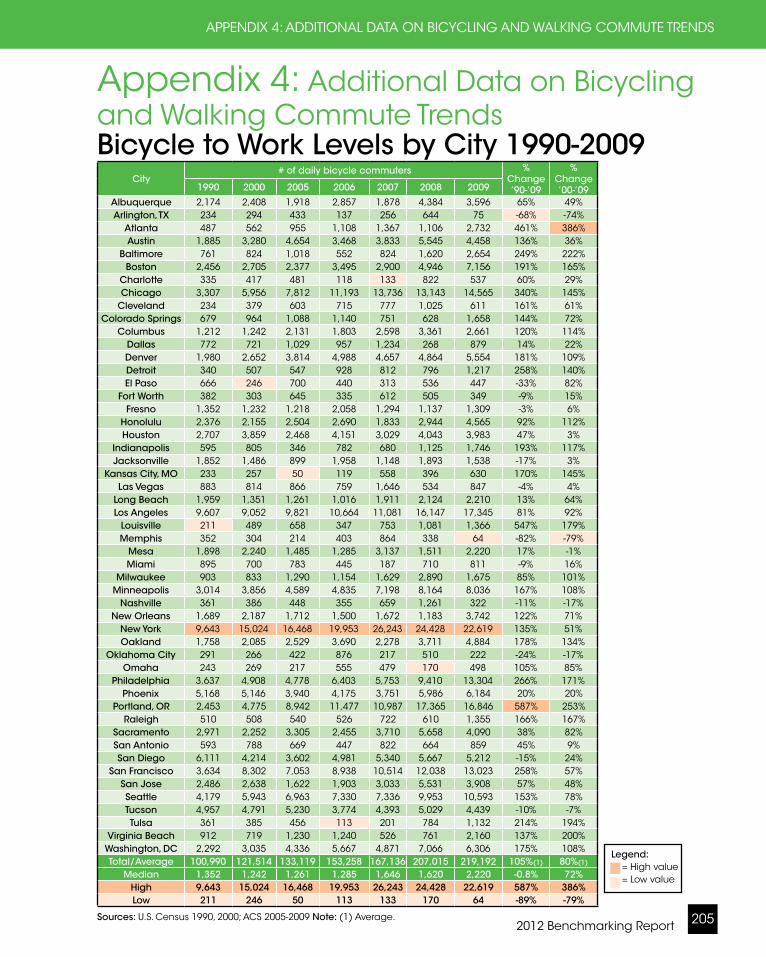
2012 Benchmarking Report 205
Bicycle to Work Levels by City 1990-2009City
# of daily bicycle commuters % Change ’90-’09
% Change ’00-’091990 2000 2005 2006 2007 2008 2009
Albuquerque 2,174 2,408 1,918 2,857 1,878 4,384 3,596 65% 49%Arlington, TX 234 294 433 137 256 644 75 -68% -74%
Atlanta 487 562 955 1,108 1,367 1,106 2,732 461% 386%Austin 1,885 3,280 4,654 3,468 3,833 5,545 4,458 136% 36%
Baltimore 761 824 1,018 552 824 1,620 2,654 249% 222%Boston 2,456 2,705 2,377 3,495 2,900 4,946 7,156 191% 165%
Charlotte 335 417 481 118 133 822 537 60% 29%Chicago 3,307 5,956 7,812 11,193 13,736 13,143 14,565 340% 145%
Cleveland 234 379 603 715 777 1,025 611 161% 61%Colorado Springs 679 964 1,088 1,140 751 628 1,658 144% 72%
Columbus 1,212 1,242 2,131 1,803 2,598 3,361 2,661 120% 114%Dallas 772 721 1,029 957 1,234 268 879 14% 22%Denver 1,980 2,652 3,814 4,988 4,657 4,864 5,554 181% 109%Detroit 340 507 547 928 812 796 1,217 258% 140%El Paso 666 246 700 440 313 536 447 -33% 82%
Fort Worth 382 303 645 335 612 505 349 -9% 15%Fresno 1,352 1,232 1,218 2,058 1,294 1,137 1,309 -3% 6%
Honolulu 2,376 2,155 2,504 2,690 1,833 2,944 4,565 92% 112%Houston 2,707 3,859 2,468 4,151 3,029 4,043 3,983 47% 3%
Indianapolis 595 805 346 782 680 1,125 1,746 193% 117%Jacksonville 1,852 1,486 899 1,958 1,148 1,893 1,538 -17% 3%
Kansas City, MO 233 257 50 119 558 396 630 170% 145%Las Vegas 883 814 866 759 1,646 534 847 -4% 4%
Long Beach 1,959 1,351 1,261 1,016 1,911 2,124 2,210 13% 64%Los Angeles 9,607 9,052 9,821 10,664 11,081 16,147 17,345 81% 92%
Louisville 211 489 658 347 753 1,081 1,366 547% 179%Memphis 352 304 214 403 864 338 64 -82% -79%
Mesa 1,898 2,240 1,485 1,285 3,137 1,511 2,220 17% -1%Miami 895 700 783 445 187 710 811 -9% 16%
Milwaukee 903 833 1,290 1,154 1,629 2,890 1,675 85% 101%Minneapolis 3,014 3,856 4,589 4,835 7,198 8,164 8,036 167% 108%
Nashville 361 386 448 355 659 1,261 322 -11% -17%New Orleans 1,689 2,187 1,712 1,500 1,672 1,183 3,742 122% 71%
New York 9,643 15,024 16,468 19,953 26,243 24,428 22,619 135% 51%Oakland 1,758 2,085 2,529 3,690 2,278 3,711 4,884 178% 134%
Oklahoma City 291 266 422 876 217 510 222 -24% -17%Omaha 243 269 217 555 479 170 498 105% 85%
Philadelphia 3,637 4,908 4,778 6,403 5,753 9,410 13,304 266% 171%Phoenix 5,168 5,146 3,940 4,175 3,751 5,986 6,184 20% 20%
Portland, OR 2,453 4,775 8,942 11,477 10,987 17,365 16,846 587% 253%Raleigh 510 508 540 526 722 610 1,355 166% 167%
Sacramento 2,971 2,252 3,305 2,455 3,710 5,658 4,090 38% 82%San Antonio 593 788 669 447 822 664 859 45% 9%San Diego 6,111 4,214 3,602 4,981 5,340 5,667 5,212 -15% 24%
San Francisco 3,634 8,302 7,053 8,938 10,514 12,038 13,023 258% 57%San Jose 2,486 2,638 1,622 1,903 3,033 5,531 3,908 57% 48%Seattle 4,179 5,943 6,963 7,330 7,336 9,953 10,593 153% 78%Tucson 4,957 4,791 5,230 3,774 4,393 5,029 4,439 -10% -7%Tulsa 361 385 456 113 201 784 1,132 214% 194%
Virginia Beach 912 719 1,230 1,240 526 761 2,160 137% 200%Washington, DC 2,292 3,035 4,336 5,667 4,871 7,066 6,306 175% 108%Total/Average 100,990 121,514 133,119 153,258 167,136 207,015 219,192 105%(1) 80%(1)
Median 1,352 1,242 1,261 1,285 1,646 1,620 2,220 -0.8% 72%High 9,643 15,024 16,468 19,953 26,243 24,428 22,619 587% 386%Low 211 246 50 113 133 170 64 -89% -79%
Sources: U.S. Census 1990, 2000; ACS 2005-2009 Note: (1) Average.
Legend: = High value = Low value
Appendix 4: Additional Data on Bicycling and Walking Commute Trends
APPENDIX 4: ADDITIONAL DATA ON BICYCLING AND WALKING COMMUTE TRENDS
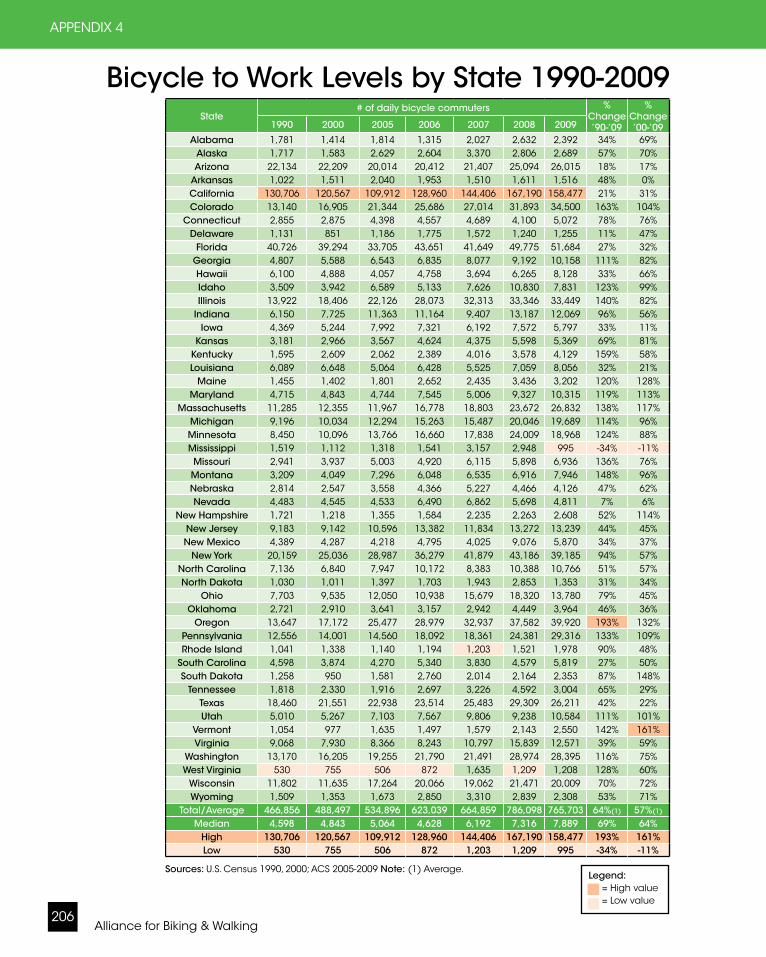
Alliance for Biking & Walking206
Bicycle to Work Levels by State 1990-2009State
# of daily bicycle commuters % Change ’90-’09
% Change ’00-’091990 2000 2005 2006 2007 2008 2009
Alabama 1,781 1,414 1,814 1,315 2,027 2,632 2,392 34% 69%Alaska 1,717 1,583 2,629 2,604 3,370 2,806 2,689 57% 70%Arizona 22,134 22,209 20,014 20,412 21,407 25,094 26,015 18% 17%
Arkansas 1,022 1,511 2,040 1,953 1,510 1,611 1,516 48% 0%California 130,706 120,567 109,912 128,960 144,406 167,190 158,477 21% 31%Colorado 13,140 16,905 21,344 25,686 27,014 31,893 34,500 163% 104%
Connecticut 2,855 2,875 4,398 4,557 4,689 4,100 5,072 78% 76%Delaware 1,131 851 1,186 1,775 1,572 1,240 1,255 11% 47%
Florida 40,726 39,294 33,705 43,651 41,649 49,775 51,684 27% 32%Georgia 4,807 5,588 6,543 6,835 8,077 9,192 10,158 111% 82%Hawaii 6,100 4,888 4,057 4,758 3,694 6,265 8,128 33% 66%Idaho 3,509 3,942 6,589 5,133 7,626 10,830 7,831 123% 99%Illinois 13,922 18,406 22,126 28,073 32,313 33,346 33,449 140% 82%
Indiana 6,150 7,725 11,363 11,164 9,407 13,187 12,069 96% 56%Iowa 4,369 5,244 7,992 7,321 6,192 7,572 5,797 33% 11%
Kansas 3,181 2,966 3,567 4,624 4,375 5,598 5,369 69% 81%Kentucky 1,595 2,609 2,062 2,389 4,016 3,578 4,129 159% 58%Louisiana 6,089 6,648 5,064 6,428 5,525 7,059 8,056 32% 21%
Maine 1,455 1,402 1,801 2,652 2,435 3,436 3,202 120% 128%Maryland 4,715 4,843 4,744 7,545 5,006 9,327 10,315 119% 113%
Massachusetts 11,285 12,355 11,967 16,778 18,803 23,672 26,832 138% 117%Michigan 9,196 10,034 12,294 15,263 15,487 20,046 19,689 114% 96%Minnesota 8,450 10,096 13,766 16,660 17,838 24,009 18,968 124% 88%Mississippi 1,519 1,112 1,318 1,541 3,157 2,948 995 -34% -11%Missouri 2,941 3,937 5,003 4,920 6,115 5,898 6,936 136% 76%Montana 3,209 4,049 7,296 6,048 6,535 6,916 7,946 148% 96%Nebraska 2,814 2,547 3,558 4,366 5,227 4,466 4,126 47% 62%Nevada 4,483 4,545 4,533 6,490 6,862 5,698 4,811 7% 6%
New Hampshire 1,721 1,218 1,355 1,584 2,235 2,263 2,608 52% 114%New Jersey 9,183 9,142 10,596 13,382 11,834 13,272 13,239 44% 45%New Mexico 4,389 4,287 4,218 4,795 4,025 9,076 5,870 34% 37%
New York 20,159 25,036 28,987 36,279 41,879 43,186 39,185 94% 57%North Carolina 7,136 6,840 7,947 10,172 8,383 10,388 10,766 51% 57%North Dakota 1,030 1,011 1,397 1,703 1,943 2,853 1,353 31% 34%
Ohio 7,703 9,535 12,050 10,938 15,679 18,320 13,780 79% 45%Oklahoma 2,721 2,910 3,641 3,157 2,942 4,449 3,964 46% 36%
Oregon 13,647 17,172 25,477 28,979 32,937 37,582 39,920 193% 132%Pennsylvania 12,556 14,001 14,560 18,092 18,361 24,381 29,316 133% 109%Rhode Island 1,041 1,338 1,140 1,194 1,203 1,521 1,978 90% 48%
South Carolina 4,598 3,874 4,270 5,340 3,830 4,579 5,819 27% 50%South Dakota 1,258 950 1,581 2,760 2,014 2,164 2,353 87% 148%
Tennessee 1,818 2,330 1,916 2,697 3,226 4,592 3,004 65% 29%Texas 18,460 21,551 22,938 23,514 25,483 29,309 26,211 42% 22%Utah 5,010 5,267 7,103 7,567 9,806 9,238 10,584 111% 101%
Vermont 1,054 977 1,635 1,497 1,579 2,143 2,550 142% 161%Virginia 9,068 7,930 8,366 8,243 10,797 15,839 12,571 39% 59%
Washington 13,170 16,205 19,255 21,790 21,491 28,974 28,395 116% 75%West Virginia 530 755 506 872 1,635 1,209 1,208 128% 60%
Wisconsin 11,802 11,635 17,264 20,066 19,062 21,471 20,009 70% 72%Wyoming 1,509 1,353 1,673 2,850 3,310 2,839 2,308 53% 71%
Total/Average 466,856 488,497 534,896 623,039 664,859 786,098 765,703 64%(1) 57%(1)
Median 4,598 4,843 5,064 4,628 6,192 7,316 7,889 69% 64%High 130,706 120,567 109,912 128,960 144,406 167,190 158,477 193% 161%Low 530 755 506 872 1,203 1,209 995 -34% -11%
Sources: U.S. Census 1990, 2000; ACS 2005-2009 Note: (1) Average.
APPENDIX 4
Legend: = High value = Low value

2012 Benchmarking Report 207
Walking to Work Levels by City 1990-2009City
# of daily walking commuters % Change ’90-’09
% Change ’00-’091990 2000 2005 2006 2007 2008 2009
Albuquerque 5,358 5,785 5,173 5,274 5,938 5,829 3,981 -26% -31%Arlington, TX 2,428 2,761 1,425 1,836 2,602 4,014 3,430 41% 24%
Atlanta 6,453 6,261 6,068 9,350 7,922 9,643 11,450 77% 83%Austin 8,058 8,995 6,374 7,901 8,099 7,967 9,677 20% 8%
Baltimore 22,906 17,727 13,819 20,549 18,302 16,816 19,134 -16% 8%Boston 39,450 36,323 31,769 39,913 40,598 45,522 47,840 21% 32%
Charlotte 4,623 4,269 4,762 5,712 5,973 6,130 8,460 83% 98%Chicago 76,041 67,556 63,580 64,866 67,084 73,472 75,469 -1% 12%
Cleveland 8,964 7,080 6,471 7,133 5,726 7,221 7,208 -20% 2%Colorado Springs 4,370 4,514 4,661 3,760 4,841 4,858 5,232 20% 16%
Columbus 13,494 11,743 5,528 10,017 9,406 10,830 9,879 -27% -16%Dallas 12,050 10,466 9,675 10,400 8,089 11,084 11,406 -5% 9%Denver 12,345 12,112 12,967 11,448 12,434 13,131 11,300 -8% -7%Detroit 10,919 8,977 6,759 8,457 6,793 6,125 11,670 7% 30%El Paso 5,917 4,075 4,531 5,020 5,303 4,712 6,339 7% 56%
Fort Worth 4,627 4,036 3,004 5,777 3,500 3,766 3,894 -16% -4%Fresno 3,732 3,222 3,094 4,052 3,951 3,613 3,464 -7% 8%
Honolulu 12,494 11,404 12,004 11,633 11,725 15,111 17,058 37% 50%Houston 23,194 19,413 16,357 22,455 20,901 19,762 24,318 5% 25%
Indianapolis 8,825 7,705 6,722 6,656 6,237 8,919 7,376 -16% -4%Jacksonville 8,372 6,271 6,545 6,506 4,934 6,567 6,447 -23% 3%
Kansas City, MO 5,838 4,731 4,796 4,255 4,584 3,902 5,297 -9% 12%Las Vegas 4,634 4,545 4,541 4,978 5,326 3,838 6,288 36% 38%
Long Beach 6,185 4,674 3,766 5,244 7,468 7,285 4,597 -26% -2%Los Angeles 63,885 53,386 52,416 58,869 64,134 61,819 59,805 -6% 12%
Louisville 4,346 4,539 3,426 4,273 6,219 6,621 5,456 26% 20%Memphis 6,569 5,300 5,508 5,575 5,631 6,099 5,031 -23% -5%
Mesa 3,322 3,794 4,083 4,666 4,207 4,192 4,000 20% 5%Miami 6,144 4,646 7,203 3,870 6,269 6,163 6,378 4% 37%
Milwaukee 16,051 11,770 9,586 12,776 11,516 10,689 12,479 -22% 6%Minneapolis 14,798 13,488 11,004 13,735 12,169 11,592 13,308 -10% -1%
Nashville 6,485 6,509 4,815 5,758 3,620 6,732 4,282 -34% -34%New Orleans 9,762 9,822 7,479 3,915 7,055 8,202 8,736 -11% -11%
New York 340,077 332,264 323,712 355,154 378,073 392,786 384,065 13% 16%Oakland 7,787 6,355 4,898 7,970 8,379 7,735 7,037 -10% 11%
Oklahoma City 4,093 3,714 3,316 4,398 2,539 4,341 3,841 -6% 3%Omaha 5,445 4,659 3,952 5,279 3,925 5,242 7,559 39% 62%
Philadelphia 66,446 51,564 43,259 44,102 45,003 49,590 53,533 -19% 4%Phoenix 12,874 12,998 10,730 12,991 12,383 10,921 13,464 5% 4%
Portland, OR 12,058 14,192 11,076 14,264 12,232 15,482 16,125 34% 14%Raleigh 4,087 4,383 2,913 3,549 5,768 4,956 5,040 23% 15%
Sacramento 5,416 4,602 6,905 5,586 6,888 7,336 5,556 3% 21%San Antonio 12,244 10,679 7,873 13,614 12,451 10,839 12,367 1% 16%San Diego 27,250 21,172 10,938 22,632 16,465 18,821 18,364 -33% -13%
San Francisco 37,611 39,192 36,629 37,934 40,241 41,621 45,227 20% 15%San Jose 6,495 6,170 6,131 8,183 8,645 8,142 8,480 31% 37%Seattle 20,250 23,291 20,737 26,686 26,907 31,419 27,249 35% 17%Tucson 7,237 7,438 7,256 9,942 9,434 8,098 8,567 18% 15%Tulsa 4,995 4,195 3,440 3,504 4,510 4,429 3,475 -30% -17%
Virginia Beach 7,373 4,369 3,429 8,257 4,621 5,874 3,325 -55% -24%Washington, DC 35,978 30,785 24,905 33,625 32,163 36,636 32,328 -10% 5%Total/Average 1,064,763 969,921 882,010 1,014,299 1,029,183 1,086,494 1,096,291 3%(1) 13%(1)
Median 8.058 7,080 6,545 7,970 7,468 7,967 8,480 -1% 11%High 340,077 332,264 323,712 355,154 378,073 392,786 384,065 83% 98%Low 2,428 2,761 1,425 1,836 2,539 3,613 3,325 -55% -34%
Sources: U.S. Census 1990, 2000; ACS 2005-2009 Note: (1) Average.
ADDITIONAL DATA ON BICYCLING AND WALKING COMMUTE TRENDS
Legend: = High value = Low value

Alliance for Biking & Walking208
Walking to Work Levels by State 1990-2009State
# of daily walking commuters % Change ’90-’09
% Change ’00-’091990 2000 2005 2006 2007 2008 2009
Alabama 32,873 25,360 23,230 22,003 25,887 25,826 25,810 -21% 2%
Alaska 26,927 21,298 19,368 28,841 27,750 24,288 26,751 -1% 26%
Arizona 54,648 58,015 54,084 63,952 62,419 55,038 65,624 20% 13%Arkansas 27,058 21,915 19,301 21,851 19,651 25,614 22,866 -15% 4%California 469,867 414,581 384,989 440,072 462,555 470,877 447,411 -5% 8%Colorado 69,041 65,668 66,273 73,495 77,613 69,642 73,437 6% 12%
Connecticut 61,484 44,348 33,775 52,221 53,229 49,997 50,342 -18% 14%Delaware 12,862 9,637 7,159 10,865 11,001 9,795 9,713 -24% 1%
Florida 145,269 118,386 121,370 137,621 134,794 125,397 118,132 -19% 0%Georgia 72,640 65,776 54,467 74,829 71,522 66,106 70,992 -2% 8%Hawaii 31,935 27,134 19,369 30,287 27,727 27,763 29,016 -9% 7%Idaho 20,091 20,747 21,841 23,073 21,645 22,640 17,568 -13% -15%Illinois 225,942 180,119 151,285 171,224 183,864 185,226 189,926 -16% 5%
Indiana 84,324 69,184 54,512 65,675 61,439 69,561 62,950 -25% -9%Iowa 76,572 58,088 46,469 56,101 58,839 64,035 61,390 -20% 6%
Kansas 45,346 33,271 33,761 36,467 37,420 37,168 38,761 -15% 17%Kentucky 54,938 42,494 30,024 37,637 40,320 45,380 43,922 -20% 3%Louisiana 48,216 40,184 32,101 32,165 37,577 38,373 39,371 -18% -2%
Maine 30,813 24,700 23,204 27,536 26,257 25,976 26,414 -14% 7%Maryland 83,417 64,852 56,401 73,327 71,127 68,399 74,434 -11% 15%
Massachusetts 161,820 134,566 114,505 133,638 136,920 151,996 151,189 -7% 12%Michigan 125,501 101,506 79,324 99,422 101,010 97,835 98,309 -22% -3%Minnesota 105,328 84,148 70,164 83,377 82,058 81,952 77,059 -27% -8%Mississippi 27,142 21,868 15,274 21,646 20,750 21,662 19,684 -27% -10%Missouri 66,553 55,631 48,382 57,187 55,818 57,211 54,127 -19% -3%Montana 27,022 23,336 21,160 24,302 21,982 26,069 24,724 -9% 6%Nebraska 36,914 28,003 23,631 31,898 27,182 29,332 30,642 -17% 9%Nevada 24,866 24,875 26,044 25,553 28,654 29,787 25,187 1% 1%
New Hampshire 23,137 18,545 18,381 23,634 22,824 23,365 19,158 -17% 3%New Jersey 156,523 121,305 122,068 141,051 133,200 142,567 137,504 -12% 13%New Mexico 21,923 21,435 21,064 19,117 19,460 23,238 20,989 -4% -2%
New York 575,089 511,721 469,473 547,956 558,152 583,118 574,322 0% 12%North Carolina 96,614 74,147 53,946 73,056 78,373 75,088 82,681 -14% 12%North Dakota 24,111 16,094 13,492 13,505 14,814 12,925 12,419 -48% -23%
Ohio 156,648 125,882 97,639 134,493 121,594 118,969 116,395 -26% -8%Oklahoma 39,782 32,796 27,643 32,813 31,494 33,566 30,444 -23% -7%
Oregon 53,953 57,217 54,015 68,134 62,702 70,638 65,863 22% 15%Pennsylvania 304,589 229,725 201,199 234,674 228,848 235,564 227,700 -25% -1%Rhode Island 20,727 18,717 12,701 15,426 16,929 15,576 15,797 -24% -16%
South Carolina 50,538 42,567 27,136 35,316 35,438 37,212 36,672 -27% -14%South Dakota 22,578 16,786 15,277 17,092 18,828 19,488 17,914 -21% 7%
Tennessee 50,773 39,689 36,376 39,065 39,075 39,283 38,131 -25% -4%Texas 202,494 173,670 148,535 195,559 189,007 196,347 192,756 -5% 11%Utah 25,080 28,523 23,991 32,864 32,736 38,437 36,985 47% 30%
Vermont 19,001 17,554 16,563 19,650 20,312 21,088 17,214 -9% -2%Virginia 97,766 80,487 63,042 87,750 81,547 89,107 85,818 -12% 7%
Washington 91,475 89,739 83,595 99,717 106,144 113,874 103,950 14% 16%West Virginia 29,511 21,059 18,135 23,118 18,828 23,802 20,652 -30% -2%
Wisconsin 130,136 100,301 79,439 99,410 93,824 97,390 94,869 -27% -5%Wyoming 11,051 10,548 11,319 8,244 10,908 10,771 9,347 -15% -11%
Total/Average 4,488,886 3,758,982 3,291,401 3,951,534 3,954,210 4,060,994 3,965,659 -12% (1) 5% (1)
Median 53,953 42,567 33,775 39,065 40,320 42,332 41,647 -16% 4%High 575,089 511,721 469,473 547,956 558,152 583,118 574,332 47% 30%
Low 11,051 9,637 7,159 8,244 10,908 9,795 9,347 -48% -23%
Sources: U.S. Census 1990, 2000; ACS 2005-2009 Note: (1) Average.
APPENDIX 4
Legend: = High value = Low value
2012 Benchmarking Report 209
Advocacy Organizations:State and Local Advocacy Organizations:• See www.PeoplePoweredMovement.org to find your state or local bicycle and pedestrian advocacy organization
National Advocacy Organizations:• Adventure Cycling Association: http://www.adventurecycling.org• Alliance for Biking & Walking: http://www.PeoplePoweredMovement.org• America Bikes: http://www.americabikes.org• American Public Health Association: http://bit.ly/d5iw6O• American Trails: http://www.americantrails.org/ • America Walks: http://www.americawalks.org• Association of Pedestrian and Bicycle Professionals: http://www.apbp.org • Bikes Belong Coalition: http://www.bikesbelong.org• International Mountain Bicycling Association: http://www.imba.com• League of American Bicyclists: http://www.bikeleague.org • National Center for Bicycling and Walking: http://www.bikewalk.org• National Complete Streets Coalition: http://www.completestreets.org• Rails-to-Trails Conservancy: http://www.railstotrails.org• Safe Routes to School National Partnership: http://www.saferoutespartnership.org
Economic Impact:• The Hidden Health Costs of Transportation: http://bit.ly/cMo7HI• Economic Benefits of Bicycle Infrastructure: http://bit.ly/rchKVd• Economic Impact of Road Riding Events: http://bit.ly/qUTTrG• How Bicycling Investments Affect Real Estate: http://bit.ly/p7I9SI• Economic Value Walkability: http://www.vtpi.org/walkability.pdf• Economic Impact Federal Investment in Bicycling: 10 Case Studies: http://bit.ly/funydz• Economic Impact of U.S. Bike Route: http://bit.ly/qAsHAq• Health Economic Assessment Tool (World Health Organization): http://www.heatwalkingcycling.org/
Economic Impact Studies• Baltimore: www.bikeleague.org/resources/reports/pdfs/baltimore_Dec20.pdf• Colorado: http://www.atfiles.org/files/pdf/CObikeEcon.pdf• Florida, California, and Iowa (trails): http://bit.ly/qaepVb• Maine: http://www.maine.gov/mdot/opt/pdf/biketourismexecsumm.pdf • Maryland/Pennsylvania: http://bit.ly/pSIQKg• Minnesota: http://bit.ly/c1YuLK• New York (trails): http://nysparks.com/recreation/trails/statewide-plans.aspx.; Statewide Trails Plan. Appendix C – Every Mile Counts – An Analysis of the 2008 Trail User Surveys.• North Carolina (Outer Banks): http://1.usa.gov/oZLo5n• Portland (cost:benefit): http://bit.ly/nC5nY9• Portland (bike industry): http://bit.ly/kMQih4• San Francisco (bike lanes): http://www.emilydrennen.org/TrafficCalming_full.pdf• Virginia (trail): http://atfiles.org/files/pdf/VACstudy04.pdf • Wisconsin: http://bit.ly/aMnH09
Appendix 5: Additional Resources
APPENDIX 5: ADDITIONAL RESOURCES

Alliance for Biking & Walking210
Education:• Blueprint for a Bicycle Friendly America: http://bit.ly/nfrDDg• State Bike Summit Guide: http://bit.ly/qYd1jg
Share the Road:• Colorado (3-2-1 Courtesy Code): http://bicyclecolo.org/page.cfm?PageID=1030 • Maine (Share the Road): http://www.sharetheroadmn.org/resources.html• Minnesota (Share the Road): http://www.sharetheroadmn.org• New York City (Give Respect/Get Respect): http://bit.ly/6tp1C• San Francisco (Coexist): http://www.sfbike.org/?coexist• South Carolina (Safe Streets Save Lives): http://www.safestreetssavelives.org • South Carolina (Share the Road): http://www.pccsc.net/sharetheroad.php
Model Bicycle Education Programs:• Arizona Bike Safety Classes: http://www.dot.pima.gov/tpcbac/SafetyClasses.htm• Arizona Education Guides: http://www.azbikeped.org/education.html• Delaware: http://bit.ly/mBFKZ• Connecticut: http://www.wecyclect.org/education/• Florida: http://www.floridabicycle.org/programs/education.html• Hawaii: http://www.hbl.org/content/bikeed• Illinois: http://www.bikelib.org/• Indiana: http://www.bicycleindiana.org/education.html• Kansas: http://ksdot.org/burRail/bike/default.asp• Maine: http://www.bikemaine.org/what-we-do/education• Michigan: http://www.lmb.org/index.php/Education/• Minnesota: http://www.bikemn.org/• New York: http://www.bikenewyork.org/learn/classes-workshops/overview/• Oklahoma: http://okbike.org/index.php?option=com_content&task=section&id=6&Itemid=35• Oregon: http://www.bta4bikes.org/at_work/programs.php• Texas: http://www.biketexas.org/en/education• Vermont: http://www.vtbikeped.org/what/safety.htm• West Virginia: http://www.wvcf.org/home/
Encouragement:• Blueprint for a Bicycle Friendly America: http://bit.ly/nfrDDg
Bike to Work Day Events:• Baltimore: http://www.baltometro.org/commuter-options/bike-to-work-day • Cleveland: http://www.clevelandbicycleweek.org/events/bike-work-day• Denver: http://www.drcog.org/btwd2009/• Louisville: http://www.louisvilleky.gov/BikeLouisville/biketoworkday2011.htm• San Francisco: http://www.sfbike.org/?btwd and http://www.youcanbikethere.com/• San Jose: http://bikesiliconvalley.org/btwd • Washington, DC: http://www.waba.org/events/btwd/
Open Streets/Ciclovias/Sunday Parkways:• See the current info on over 60 open streets initiatives at: http://www.OpenStreetsProject.org• Baltimore: http://www.baltimorespokes.org/article.php?story=20070821100331287 • Chicago: http://www.activetrans.org/openstreets• Los Angeles: http://www.ciclavia.org/
APPENDIX 5
2012 Benchmarking Report 211
• Miami: http://bikemiamiblog.wordpress.com/• New York: http://www.nyc.gov/html/dot/summerstreets/html/home/home.shtml• Oakland: http://oaklavia.org/• Portland: http://www.portlandonline.com/Transportation/index.cfm?c=46103• San Francisco: http://sundaystreetssf.com/• Seattle: http://www.seattle.gov/transportation/summerstreets.htm
Promotional Rides:• Chicago's Bike the Drive: http://www.bikethedrive.org• Iowa's Register’s Annual Great Bicycle Ride Across Iowa: http://ragbrai.com• Louisville's Mayor's Healthy Hometown Hike and Bike: http://1.usa.gov/o2cPn5
Public Bike Sharing:• Chicago: http://chicago.bcycle.com/• Denver: http://www.denverbikesharing.org/• Minneapolis: https://www.niceridemn.org/• Nashville: http://www.nashvillebikeshare.org/• Washington, DC: http://www.capitalbikeshare.com/
Engineering• Blueprint for a Bicycle Friendly America: http://bit.ly/nfrDDg
Bicycle Parking:• APBP's Bicycle Parking Guidelines: http://www.apbp.org/?page=Publications• Minneapolis: http://www.ci.minneapolis.mn.us/bicycles/bikeparking.asp• Stolen Bicycle Registry: http://www.stolenbicycleregistry.com
Bicycle and Pedestrian Facility Design:• Bicycle Facility Design: http://www.bicyclinginfo.org/engineering/• Outdoor Developed Areas (recreational trails): http://www.access-board.gov/outdoor/index.htm • Pedestrian Facility Design: http://www.walkinginfo.org/engineering/• Public Rights of Way: http://www.access-board.gov/prowac/index.htm • Shared Use Paths: http://www.access-board.gov/sup.htm• Urban Bikeway Design Guide: http://nacto.org/cities-for-cycling/design-guide/
Funding:• America Bikes Funding Fact Sheet: http://bit.ly/pkwbNQ• Congestion Mitigation and Air Quality Improvement Program: http://bit.ly/r15wxM• Highway Safety Improvement Program: http://bit.ly/r8vwB8• Highway Safety Improvement Program Case Studies: http://bit.ly/pnKSLG• Federal Funding for Bicycling: http://1.usa.gov/qXGI0K• Rescissions: http://www.advocacyadvance.org/site_images/content/Rescissions_FAQs.pdf• Transportation Enhancements: http://www.enhancements.org
Infrastructure:• Bicycles on Bridges: http://www.advocacyadvance.org/docs/Bridge_Access_Report.pdf• Economic Benefits of Bicycle Infrastructure: http://bit.ly/rchKVd
Sharrows:• San Francisco: http://www.sfmta.com/cms/bproj/22747.html• Seattle: http://www.cityofseattle.net/transportation/sharrows.htm
ADDITIONAL RESOURCES

Alliance for Biking & Walking212
EnvironmentClimate Change/Air Quality• Climate Change and Bicycling: http://bit.ly/bbe92z• Congestion Mitigation and Air Quality Improvement Program: http://bit.ly/r15wxM
Healthy and Active Living:• American Public Health Association: http://bit.ly/d5iw6O• Active Living Research: http://www.activelivingresearch.org/ • Centers for Disease Control and Prevention: http://www.cdc.gov/HealthyYouth/index.htm• Health Economic Assessment Tool: http://www.heatwalkingcycling.org/ • Healthy Places (CDC): www.cdc.gov/healthyplaces
Fact Sheets: http://www.cdc.gov/healthyplaces/factsheets.htm Healthy Community Design: http://www.cdc.gov/healthyplaces/healthy_comm_design.htm Health Impact Assessment: http://www.cdc.gov/healthyplaces/hia.htm Images: http://www.cdc.gov/healthyplaces/images.htm Increasing Physical Activity: http://www.cdc.gov/healthyplaces/healthtopics/physactivity.htm Reducing Injury: http://www.cdc.gov/healthyplaces/healthtopics/injury.htm
• Kaiser Permanente's Thrive Campaign: http://thrivewithkp.org/• National Environmental Public Health Tracking: http://bit.ly/mAF7cT• Robert Woods Johnson Foundation Active Living by Design: http://www.activelivingbydesign.org
Health Impact Assessments:• Oregon (Crook County): http://1.usa.gov/p0hUcx• Sacramento: http://www.ph.ucla.edu/hs/health-impact/docs/WalktoschoolSummary.pdf• Washington (Clark County): http://bit.ly/r54yTu
International Organizations• Denmark Cycling Embassy: http://www.cycling-embassy.dk/ • European Cyclists Federation: http://www.ecf.com/ • Fietsberaad: http://www.fietsberaad.nl/
Maps:• Arizona Bicycle Maps: http://www.dot.pima.gov/tpcbac/Publications.html#map and http://www.azbikeped.org/maps.htm• Colorado: http://bicyclecolo.org/page.cfm?PageID=626• Delaware: http://bit.ly/2yvA13• Denver: http://www.bikedenver.org/maps/• Illinois: http://www.dot.state.il.us/bikemap/STATE.HTML• Louisville: http://www.louisvilleky.gov/BikeLouisville/IWantTo/existingbikelanes.htm• Maine: http://www.exploremaine.org/bike/search-bike.shtml• Michigan: http://bit.ly/caNrl• Milwaukee: http://www.ci.mil.wi.us/maps4460.htm
APPENDIX 5
2012 Benchmarking Report 213
• Minneapolis: http://www.ci.minneapolis.mn.us/bicycles/where-to-ride.asp• Minnesota: http://www.dot.state.mn.us/bike/• New Hampshire: http://www.nh.gov/dot/programs/bikeped/maps/index.htm• New Jersey: http://www.njbikemap.com/• New York: http://www.nycbikemaps.com/• North Carolina: http://www.ncdot.org/it/gis/DataDistribution/BikeMaps/• Ohio: http://www.noaca.org/bikemaps.html• Oklahoma: http://www.oklahomabicyclesociety.com/Maps/maphome.htm• Oregon: http://www.oregon.gov/ODOT/HWY/BIKEPED/maps.shtml• Philadelphia: http://www.bicyclecoalition.org/resources/maps• Portland: http://bit.ly/lEzWp• San Francisco: http://www.sfbike.org/?maps• Seattle: http://www.cityofseattle.net/transportation/bikemaps.htm• Washington, DC: http://www.waba.org/resources/maps.php• Wisconsin: http://www.dot.wisconsin.gov/travel/bike-foot/bikemaps.htm
Master Plans: Bicycle & Pedestrian Master Plans:• Arizona: http://www.azbikeped.org/statewide-bicycle-pedestrian.html• Arlington, TX: http://www.arlingtontx.gov/planning/HikeandBike.html • Atlanta: http://bit.ly/pmYIYp• Las Vegas: http://www.rtcsouthernnevada.com/mpo/plansstudies/nmamp/index.cfm• Nashville: http://mpw.nashville.gov/IMS/stratplan/PlanDownload.aspx• Sacramento: http://www.sacog.org/bikeinfo/download_bike_ped_trails_mp.cfm
Bicycle Master Plans:• Austin: http://www.ci.austin.tx.us/publicworks/bicycle-plan.htm• Baltimore: http://1.usa.gov/rkgyvT• Chicago: http://bike2015plan.org/• Columbus: http://www.altaprojects.net/columbus/• Dallas: http://www.tooledesign.com/dallasbikeplan/• Delaware: http://bit.ly/1qfa1T• Denver: http://bit.ly/kH56Mf• Fresno: http://bit.ly/11E7HM• Hawaii: http://hawaii.gov/dot/highways/Bike/Bike%20Plan/index.htm• Honolulu: http://www1.honolulu.gov/dts/bikeway/• Los Angeles: http://www.labikeplan.org/• Long Beach: http://bit.ly/vFOTi• Louisville: http://www.louisvilleky.gov/BikeLouisville/• Minneapolis: http://www.ci.minneapolis.mn.us/bicycles/bicycle-plans.asp• Nevada: http://www.bicyclenevada.com/bikeplan03.htm• New York City: http://www.nyc.gov/html/dcp/html/bike/mp.shtml• Oakland: http://bit.ly/njCGb2• Portland, OR: http://bit.ly/17AeXX• Raleigh: http://1.usa.gov/nAnBFG• Sacramento County: http://bit.ly/nq5yst• San Diego: http://bit.ly/1271Kl• San Francisco: http://www.sfmta.com/cms/bproj/bikeplan.htm• Seattle: http://www.cityofseattle.net/transportation/bikemaster.htm
ADDITIONAL RESOURCES
Alliance for Biking & Walking214
Pedestrian Master Plans:• Austin: http://www.ci.austin.tx.us/publicworks/downloads/sidewalk_mp_resolution.pdf• Kansas City: http://bit.ly/p8E8hn• Louisville: http://www.louisvilleky.gov/HealthyHometown/StepUpLouisville/pedmasterplan/• Minneapolis: http://bit.ly/TFTqB• Oakland: www.oaklandnet.com/government/pedestrian/PedMasterPlan.pdf• Portland, OR: http://www.portlandonline.com/transportation/index.cfm?c=34778&a=292295• San Diego: http://bit.ly/WsW5r• San Francisco: http://www.sfmta.com/cms/wproj/28717.html• Seattle: http://www.seattle.gov/transportation/pedestrian_masterplan• Washington, DC: http://1.usa.gov/nHvOL9
Policies:Advisory Committees:• Arlington Bicycle Advisory Committee: http://www.nctcog.org/trans/committees/bpac/index.asp• California Bicycle Advisory Committee: http://www.dot.ca.gov/hq/tpp/offices/bike/cbac.html• City of Columbus Bikeway Advisory Committee: http://bit.ly/nRJhhi• Denver Bicycling Advisory Committee: http://bit.ly/QUqTZ• Fresno Bicycle/Pedestrian Advisory Committee: http://bit.ly/1yWDmp• Fort Worth Bicycle and Pedestrian Advisory Committee: http://bit.ly/4oErlO• Houston Pedestrian and Bicycle Advisory Committee: http://bit.ly/ocFpQX• Los Angeles Bicycle Advisory Committee: http://ladot.lacity.org/tf_Bicycle_advisory.htm• Los Angeles Pedestrian Advisory Committee: http://bit.ly/chcHn2• Maryland Bicycle and Pedestrian Advisory Committee: http://bit.ly/jcQ1Q• Miami-Dade Bicycle Pedestrian Advisory Committee: http://1.usa.gov/nyOJO3• Minneapolis Bicycle Advisory Committee: http://bit.ly/1a4qt4• Nashville Bicycle Pedestrian Advisory Committee: http://bit.ly/4wYc6A• Nevada: http://www.bicyclenevada.com/board.html• Oakland Bicycle Advisory Committee: http://bit.ly/oXsjIh• Omaha Bicycle Advisory Committee: http://bit.ly/o9llI• San Antonio Bicycle Mobility Advisory Committee: http://bit.ly/7tSSsv• San Francisco Bicycle Advisory Committee: http://www.sfgov.org/site/bac_index.asp?id=11525• San Jose Bicycle Pedestrian Advisory Committee: http://1.usa.gov/nsRXqC• Tucson Bicycle Advisory Committee: http://www.dot.pima.gov/tpcbac/
Complete Streets:• Advice on complete streets campaigns: http://www.PeoplePoweredMovement.org/contact• The latest complete streets news: http://www.completestreets.org
Complete Streets Policies:• Guide to Complete Streets Campaigns: http://www.peoplepoweredmovement.org/publications• Examples of Complete Streets Policies and Guides: http://bit.ly/5Iy15q• Federal policy: http://www.dot.gov/affairs/2010/bicycle-ped.html • California: http://www.completestreets.org/webdocs/policy/cs-ca-legislation.pdf • Connecticut: http://www.completestreets.org/webdocs/policy/cs-ct-legislation.pdf• Delaware: http://governor.delaware.gov/orders/exec_order_06.shtml#TopOfPage • Hawaii: http://www.completestreets.org/webdocs/policy/cs-hi-legislation.pdf• Illinois: http://www.completestreets.org/webdocs/policy/cs-il-legislation.pdf• Louisiana: http://www.completestreets.org/webdocs/policy/cs-la-resolution.pdf
APPENDIX 5
2012 Benchmarking Report 215
• Louisville: http://www.louisvilleky.gov/BikeLouisville/Complete+Streets/• Massachusetts: http://bit.ly/pVDsBQ• Minnesota: http://www.completestreets.org/webdocs/policy/cs-mn-legislation.pdf• New Jersey: http://www.completestreets.org/webdocs/policy/cs-nj-dotpolicy.pdf• North Carolina: http://www.completestreets.org/webdocs/policy/cs-nc-dotpolicy.pdf• Oregon: http://www.completestreets.org/webdocs/policy/cs-or-legislation.pdf• Rhode Island: http://www.rilin.state.ri.us/statutes/title31/31-18/31-18-21.HTM • Wisconsin: http://www.completestreets.org/webdocs/policy/cs-wi-legislation.pdf
Police on Bicycles:• International Police Mountain Biking Association: http://www.ipmba.org
Safe Passing Laws:• 3FeetPlease.com: http://www.3feetplease.com/ • Arizona: http://azbikelaw.org/articles/ThreeFoot.html• Austin: http://bit.ly/prO7XV• Delaware: http://delcode.delaware.gov/title21/c041/sc03/index.shtml• Louisiana: http://www.louisiana3feet.com/• Georgia: http://www.legis.ga.gov/legislation/en-US/Display.aspx?Legislation=32251• Maine: http://www.mainelegislature.org/legis/statutes/29-a/title29-asec2070.html• New Orleans: http://bit.ly/eVzY4• Oklahoma City: http://bit.ly/46paAG• Tennessee: http://www.tennessee3feet.org/
Mandatory Helmet Laws:• Bicycle Helmet Safety Institute: http://www.helmets.org/mandator.htm • Arguments/Case Study Against Mandatory Bicycle Helmet Laws: http://www.cycle-helmets.com/• LAB Helmet Law Position: http://www.bikeleague.org/about/positions/helmetuse.php• Arguments Against Mandatory Helmet Laws: http://www.kenkifer.com/bikepages/advocacy/mhls.htm
Staffing:• Why Communities & States Need Bicycle and Pedestrian Staff: http://bit.ly/o5Kjel
Retailers/Industry:• Bikes Belong Coalition: http://www.bikesbelong.org• National Bicycle Dealers Association: http://www.nbda.com
Safety:• Distracted Driving: http://www.advocacyadvance.org/docs/distracted_driving_league_report.pdf• Highway Safety Improvement Program: http://bit.ly/r8vwB8• Highway Safety Improvement Program Case Studies: http://bit.ly/pnKSLG• Traffic Safety Fact Sheets: http://bit.ly/wrKo0• State Traffic Safety Information: http://bit.ly/d3EzmD
ADDITIONAL RESOURCES

Alliance for Biking & Walking216
Safe Routes to School:• Safe Routes to School National Partnership: www.saferoutespartnership.org• The National Center for Safe Routes to School: www.saferoutesinfo.org• Progress Reports: http://www.saferoutesinfo.org/resources/tracking-reports.cfm• State of the States: http://bit.ly/pRGIap• EPA School Siting Guidelines (Draft): http://www.epa.gov/schools/siting/
Sample Safe Routes to School Programs:• Boston: http://www.walkboston.org/work/safe_routes.htm• California: http://saferoutescalifornia.wordpress.com/• Colorado: http://www.coloradodot.info/programs/bikeped/safe-routes• Connecticut: http://www.ctsaferoutes.ct.gov/• Delaware: http://deldot.gov/information/community_programs_and_services/srts• Denver: http://www.denvergov.org/DenverSafeRoutestoSchool/tabid/427939/Default.aspx• Florida: http://www.dot.state.fl.us/Safety/SRTS_files/SRTS.shtm• Illinois: http://www.dot.il.gov/saferoutes/saferouteshome.aspx• Indiana: http://www.in.gov/indot/2355.htm• Iowa: http://www.iowadot.gov/saferoutes/• Kansas: http://www.ksdot.org/burTrafficEng/sztoolbox/default.asp• Louisiana: http://www.dotd.louisiana.gov/planning/highway_safety/safe_routes/• Maine: http://www.bikemaine.org/what-we-do/maine-safe-routes-to-school-program• Massachusetts: http://www.commute.com/schools• Michigan: http://www.saferoutesmichigan.org/• Minnesota: http://www.dot.state.mn.us/saferoutes/• Mississippi: http://bit.ly/1iQixg• Missouri: http://www.modot.mo.gov/safety/saferoutestoschool.htm• Montana: http://www.mdt.mt.gov/pubinvolve/saferoutes/• Nebraska: http://www.saferoutesne.com/• New Jersey: http://www.state.nj.us/transportation/community/srts/• New Mexico: http://www.nmshtd.state.nm.us/main.asp?secid=15411• New York: http://bit.ly/XVFMv• North Carolina: http://www.ncdot.org/doh/preconstruct/traffic/congestion/CM/msta/docs/SRTS.pdf• Oklahoma: http://www.okladot.state.ok.us/srts/index.php• Portland: http://www.portlandonline.com/TRANSPORTATION/index.cfm?c=40511• South Carolina: http://www.scdot.org/community/saferoutes.shtml• Texas: http://www.saferoutestx.org/• Wisconsin: http://www.dot.wisconsin.gov/localgov/aid/saferoutes.htm
Statistics/Studies:General Information:• Advocacy Advance: http://www.advocacyadvance.org• Alliance Benchmarking Project: http://www.peoplepoweredmovement.org/benchmarking• Bikes Belong: http://www.bikesbelong.org/statistics• Federal Highway Administration: http://www.fhwa.dot.gov/environment/bikeped• Fietsberaad (Netherlands): http://www.fietsberaad.nl/index.cfm?lang=en§ion=Kennisbank • League of American Bicyclists: http://www.bikeleague.org/resources/reports/ • National Highway Traffic Safety Administration Traffic Safety Fact Sheets: http://bit.ly/wrKo0• Pedestrian and Bicycle Information Center: http://www.pedbikeinfo.org
APPENDIX 5
2012 Benchmarking Report 217
• Rails-to-Trails Conservancy: http://www.railstotrails.org/ourWork/advocacy/activeTransportation • Victoria Transport Policy Institute: http://www.vtpi.org/• National Environmental Public Health Tracking: http://bit.ly/mAF7cT
Mode Share (Bicycle and Pedestrian Counts):• Commuter Trends: http://www.advocacyadvance.org/docs/acs_commuting_trends.pdf• National Bicycle and Pedestrian Documentation Project: http://bikepeddocumentation.org
Trainings:• Action 2020 Workshops: http://www.advocacyadvance.org/trainings• Membership Development Training: http://bit.ly/2Rrx7Q• Safe Routes to School: http://www.saferoutestoschools.org/Programs/Workshops.htm and http://www.saferoutesinfo.org/events-and-training/national-course• Winning Campaigns Trainings: http://www.peoplepoweredmovement.org/wctraining
ADDITIONAL RESOURCES

Alliance for Biking & Walking218
Appendix 6: Overview of Other Benchmarking EffortsThe Alliance for Biking & Walking’s Benchmarking Project is the only focused effort to set benchmarks for bicycling and walking in the United States using data from all 50 states and the 51 largest cities. Other benchmark-ing efforts from abroad and within the United States have provided examples and inspiration for this project.
Benchmarking Efforts Abroad Cycling and walking benchmarking efforts have been in place longer in many other countries than in the United States, England, Scotland, and the Neth-erlands all have completed benchmark-ing projects. More than 100 cities and 18 regions in 21 European countries have participated in BYPAD (Bicycle Policy Audit), developed by an international consortium of bicycle experts as part of a European Union-funded project. Velo Mondial completed a national bicycling benchmark program with five participating countries (Czech Repub-lic, England, Finland, Scotland, and the Netherlands) that compared bicycling policies at the national level. Another multi-nation benchmarking project is the Urban Transport Benchmarking Initiative that uses benchmarking to compare European Union cities around six transport themes (Behavioral and Social Issues in Public Transport, City Logistics, Cycling, Demand Manage-ment, Public Transport Organization and Policy, and Urban Transport for Disabled People).
APPENDIX 6
Benchmarking Bicycling in the UKOne benchmarking project by the Cyclist’s Touring Club (CTC) investi-gated up to 10 cities per year between 2001 and 2003. The CTC investigated bi-cycling policy and practice in each city including how bicycling is promoted and integrated into wider transporta-tion plans. Participating jurisdictions completed a self-auditing questionnaire, received site visits from project staff to review the self-audit and create long-range action plans, and attended group workshops to collaborate with other jurisdictions. The CTC formulated and disseminated a comprehensive list of “Best Practices” to help each area make better plans for bicycling. These “Best Practice” resources and photographs are located in a searchable database on CTC’s website.
Dutch Benchmarking Sophistication The Dutch have sophisticated bench-marking techniques which utilize advanced technology. The Cycle Bal-ance, a project of the Dutch Cyclists Union (Fietsersbond), began in 1999 and aims to “stimulate local authorities to adopt a (still) better cycling policy.... The secondary objective of the project is to enhance the position and strength of the local Cyclists Union branches.” The Cycle Balance assesses 10 dimen-sions of local conditions for bicyclists including: directness, comfort (obstruc-tion), comfort (road surface), attractive-ness, competitiveness compared to the car, bicycle use, road safety of bicyclists,
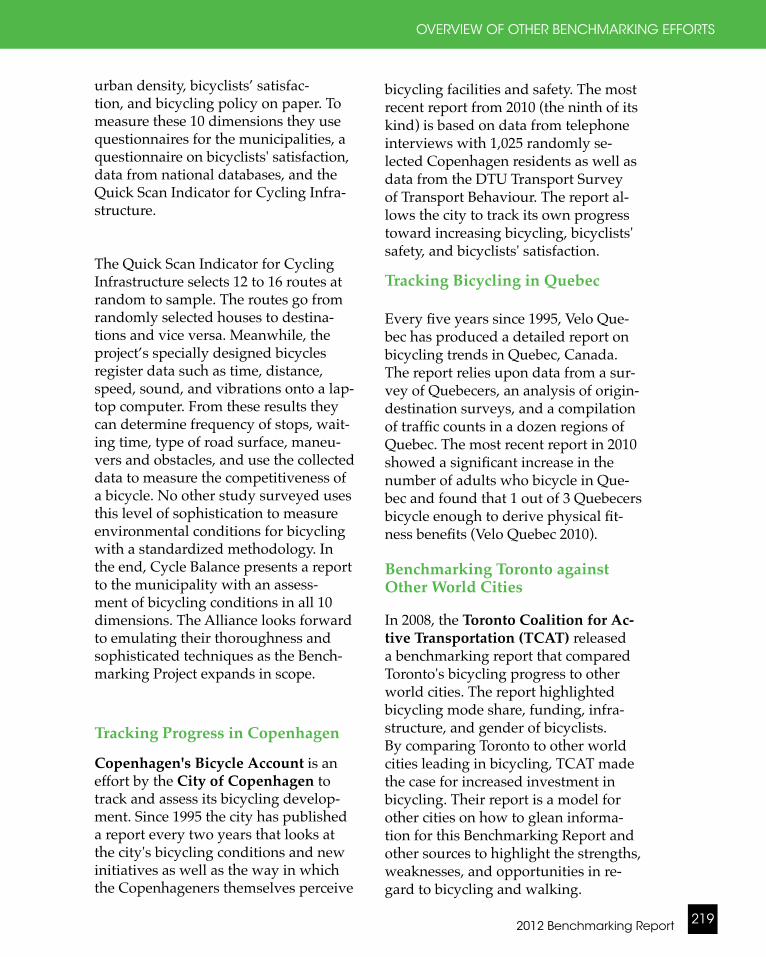
2012 Benchmarking Report 219
urban density, bicyclists’ satisfac-tion, and bicycling policy on paper. To measure these 10 dimensions they use questionnaires for the municipalities, a questionnaire on bicyclists' satisfaction, data from national databases, and the Quick Scan Indicator for Cycling Infra-structure.
The Quick Scan Indicator for Cycling Infrastructure selects 12 to 16 routes at random to sample. The routes go from randomly selected houses to destina-tions and vice versa. Meanwhile, the project’s specially designed bicycles register data such as time, distance, speed, sound, and vibrations onto a lap-top computer. From these results they can determine frequency of stops, wait-ing time, type of road surface, maneu-vers and obstacles, and use the collected data to measure the competitiveness of a bicycle. No other study surveyed uses this level of sophistication to measure environmental conditions for bicycling with a standardized methodology. In the end, Cycle Balance presents a report to the municipality with an assess-ment of bicycling conditions in all 10 dimensions. The Alliance looks forward to emulating their thoroughness and sophisticated techniques as the Bench-marking Project expands in scope.
Tracking Progress in Copenhagen
Copenhagen's Bicycle Account is an effort by the City of Copenhagen to track and assess its bicycling develop-ment. Since 1995 the city has published a report every two years that looks at the city's bicycling conditions and new initiatives as well as the way in which the Copenhageners themselves perceive
OVERVIEW OF OTHER BENCHMARKING EFFORTS
bicycling facilities and safety. The most recent report from 2010 (the ninth of its kind) is based on data from telephone interviews with 1,025 randomly se-lected Copenhagen residents as well as data from the DTU Transport Survey of Transport Behaviour. The report al-lows the city to track its own progress toward increasing bicycling, bicyclists' safety, and bicyclists' satisfaction.
Tracking Bicycling in Quebec
Every five years since 1995, Velo Que-bec has produced a detailed report on bicycling trends in Quebec, Canada. The report relies upon data from a sur-vey of Quebecers, an analysis of origin-destination surveys, and a compilation of traffic counts in a dozen regions of Quebec. The most recent report in 2010 showed a significant increase in the number of adults who bicycle in Que-bec and found that 1 out of 3 Quebecers bicycle enough to derive physical fit-ness benefits (Velo Quebec 2010).
Benchmarking Toronto against Other World Cities
In 2008, the Toronto Coalition for Ac-tive Transportation (TCAT) released a benchmarking report that compared Toronto's bicycling progress to other world cities. The report highlighted bicycling mode share, funding, infra-structure, and gender of bicyclists. By comparing Toronto to other world cities leading in bicycling, TCAT made the case for increased investment in bicycling. Their report is a model for other cities on how to glean informa-tion for this Benchmarking Report and other sources to highlight the strengths, weaknesses, and opportunities in re-gard to bicycling and walking.

Alliance for Biking & Walking220
Measuring WalkingSince the launch of this Benchmark-ing Project, Walk 21 has launched an international effort to measure walking. Measuring Walking is an effort to stan-dardize monitoring methods of walking and public space. The project is ongoing and is seeking agreement from experts from different countries as to best prac-tice methods and guidelines.
At the same time, a number of cities are now using the Making Walking Count survey tool to better understand the na-ture of walking in their neighborhoods and the issues and ideas walkers have.
Benchmarking Efforts in the United StatesBicycle Friendly Community Awards Although they don’t use the term “benchmarking,” the League of Ameri-can Bicyclists (LAB) has created a system for scoring cities based on a measure of “bicycle-friendliness”—all of the ways a community promotes and accommodates bicycling. The Bicycle Friendly Communities program began in 1995 and is an awards program that recognizes municipalities that actively support bicycling. Cities interested in receiving a “Bicycle Friendly Commu-nity” designation submit an application to the League. The application is scored by a committee that consults with na-tional and local bicyclists. Since its rede-sign and relaunch in 2003, 452 commu-nities have applied for Bicycle Friendly Community designation and 181 have
Platinum:Portland, OR
Gold:MinneapolisSan FranciscoSeattleTucson
Silver:AustinBostonChicagoColorado SpringsDenverNew York CityWashington, DC
Bronze:AlbuquerqueBaltimoreCharlotteColumbusFresnoIndianapolisKansas CityLong BeachLouisvilleMesaMilwaukeeNew OrleansOaklandOmahaPhiladelphiaRaleighSacramentoSan AntonioSan JoseTulsa
51 Largest Cities with
"Bicycle Friendly" Status
APPENDIX 6
Source: LAB 2011

2012 Benchmarking Report 221
been awarded in that time. Currently 179 are designated.
LAB’s Bicycle Friendly Community pro-gram includes Bronze, Silver, Gold, and Platinum levels awarded based on how communities score in five categories including engineering, education, en-couragement, enforcement, and evalu-ation. This program has been extremely valuable to incite a spirit of competition among communities to be designated “Bicycle Friendly.” The program also forces communities to complete an in-depth application, which gives them an opportunity to evaluate where they stand and causes them to gather data on bicycling in their community.
Walking Friendly CommunitiesIn 2010 the Pedestrian and Bicycle Information Center launched the Walk-ing Friendly Communities (WFC) pro-gram, modeled after the BFC program described above. WFC is a national recognition program developed to encourage U.S. communities to sup-port safer walking environments. The WFC program recognizes places that are working to improve conditions for walking, including safety, mobility, ac-cess, and comfort. In April 2011, eleven communities received some level of WFC award. Seattle, Austin, and Char-lotte were the only cities in this report to receive a WFC award in this first round.
Benchmarking State PoliciesThe National Center for Bicycling and Walking (NCBW) conducted a one-time study between December 2002 and February 2003 to evaluate state Depart-ments of Transportation (DOTs) accom-
OVERVIEW OF OTHER BENCHMARKING EFFORTS
modating bicycles and pedestrians. “The Benchmarking Project” focused on data from questionnaires sent to the Bicycle and Pedestrian Coordinator of state DOTs. NCBW identified four benchmarks: presence of statewide long-range plan for bicycle/pedestrian elements, accommodating bicycles into all transport projects, accommodating pedestrians into all state highway proj-ects, and other special programs. NCBW assessed whether each state met national standards for these Bench-marks. Results were reported as “Yes” or “No” for each state meeting all or part of the benchmark, and summarized by each benchmark. They concluded that most state DOTs did not meet the benchmarks they identified for bicycle and pedestrian planning, accommoda-tion (design), and special programs. All four of the benchmarks they identified are addressed in some way in Chapter 5 of this report. Although the Alliance’s surveys did not frame questions in the same way, its review and discussion of complete streets policies, Safe Routes to School, and other bicycle and pedes-trian policies address many of the same issues covered in NCBW’s report.
Since the release of the 2007 Bench-marking Report, the League of Ameri-can Bicyclists began a Bicycle Friendly States program that also compares all 50 states to each other on a number of indicators of "bicycle friendliness." The Bicycle Friendly States scoring system is based on 75 items that evaluate how committed the states are to bicycling. The six main areas the questionnaire covers are legislation, policies and programs, infrastructure, education and encouragement, evaluation and plan-
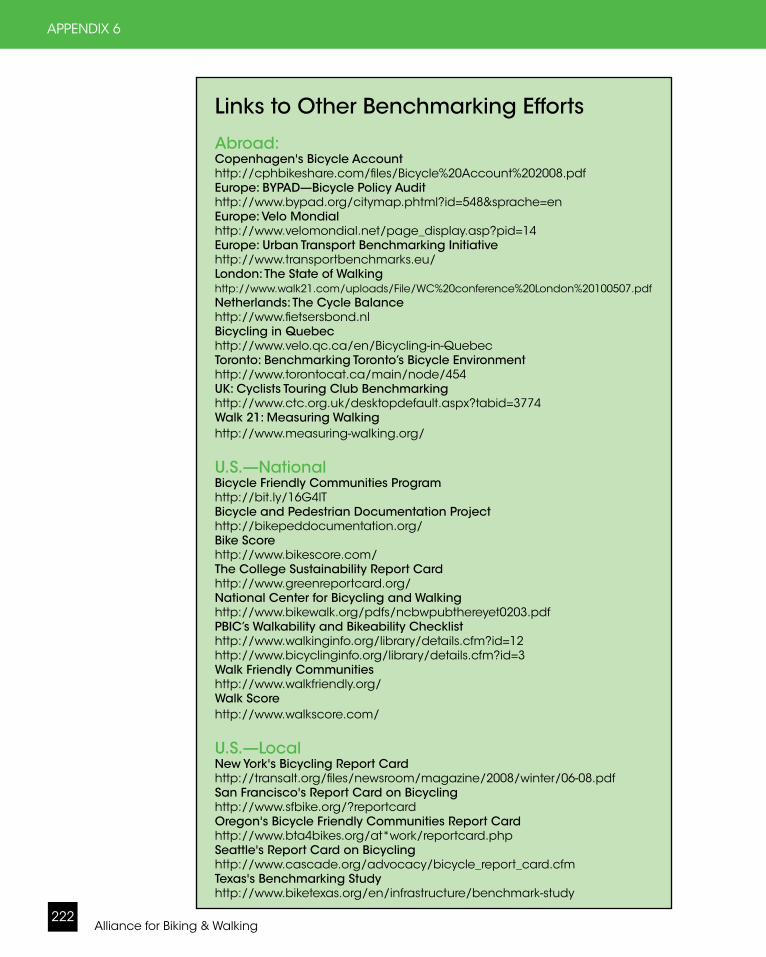
Alliance for Biking & Walking222
Links to Other Benchmarking Efforts
Abroad:Copenhagen's Bicycle Accounthttp://cphbikeshare.com/files/Bicycle%20Account%202008.pdfEurope: BYPAD—Bicycle Policy Audithttp://www.bypad.org/citymap.phtml?id=548&sprache=enEurope: Velo Mondial http://www.velomondial.net/page_display.asp?pid=14Europe: Urban Transport Benchmarking Initiative http://www.transportbenchmarks.eu/ London: The State of Walkinghttp://www.walk21.com/uploads/File/WC%20conference%20London%20100507.pdfNetherlands: The Cycle Balance http://www.fietsersbond.nl Bicycling in Quebechttp://www.velo.qc.ca/en/Bicycling-in-Quebec Toronto: Benchmarking Toronto’s Bicycle Environmenthttp://www.torontocat.ca/main/node/454UK: Cyclists Touring Club Benchmarkinghttp://www.ctc.org.uk/desktopdefault.aspx?tabid=3774Walk 21: Measuring Walkinghttp://www.measuring-walking.org/
U.S.—NationalBicycle Friendly Communities Program http://bit.ly/16G4lTBicycle and Pedestrian Documentation Project http://bikepeddocumentation.org/ Bike Scorehttp://www.bikescore.com/ The College Sustainability Report Cardhttp://www.greenreportcard.org/National Center for Bicycling and Walking http://www.bikewalk.org/pdfs/ncbwpubthereyet0203.pdfPBIC’s Walkability and Bikeability Checklisthttp://www.walkinginfo.org/library/details.cfm?id=12http://www.bicyclinginfo.org/library/details.cfm?id=3Walk Friendly Communitieshttp://www.walkfriendly.org/Walk Scorehttp://www.walkscore.com/
U.S.—LocalNew York's Bicycling Report Cardhttp://transalt.org/files/newsroom/magazine/2008/winter/06-08.pdfSan Francisco's Report Card on Bicyclinghttp://www.sfbike.org/?reportcardOregon's Bicycle Friendly Communities Report Cardhttp://www.bta4bikes.org/at*work/reportcard.phpSeattle's Report Card on Bicyclinghttp://www.cascade.org/advocacy/bicycle_report_card.cfmTexas's Benchmarking Studyhttp://www.biketexas.org/en/infrastructure/benchmark-study
APPENDIX 6

2012 Benchmarking Report 223
ning, and enforcement. The League released their fourth annual ranking of Bicycle Friendly States in 2011. The League hopes this will promote bicy-cling by listing which states recognize and support bicycling as an active form of transportation and recreation. States may also apply for awards under this program to receive further recognition for their bicycling efforts. Upon win-ning awards, states may also receive technical assistance, feedback, and training to further their bicycling plans.
Evaluating Walkability and Bike-ability of CommunitiesThe Pedestrian and Bicycle Informa-tion Center’s Walkability and Bike-ability checklists are another means of evaluating conditions for bicycling and walking. These checklists are com-munity tools that allow individuals to subjectively score their communities. The document invites individuals to go for a walk or bicycle ride with survey in hand and to rate their experience on a scale of 1 to 5 while checking off poten-tial problems. The document then goes through each question and offers po-tential solutions to common problems and also provides a list of resources at the end. This survey could be useful for community stakeholders wishing to gain insight into “bikeability” or “walk-ability.” It could also be used by advo-cates in coordinated education efforts or to raise public perception of a problem area.
Looking at UniversitiesThe Bicycle Friendly University (BFU) initiative was launched in 2010 by the League of American Bicyclists under their Bicycle Friendly America program.
OVERVIEW OF OTHER BENCHMARKING EFFORTS
The BFU program recognizes institu-tions of higher education for promoting and providing a more bicycle friendly campus for students, staff, and visi-tors. The BFU program also provides information and technical assistance to create great campuses for cycling. Uni-versities are invited to apply for BFU designation and are scored for their efforts in engineering, encouragement, education, enforcement, and evalua-tion/planning. In March 2011, twenty universities throughout the United States were honored with some level of Bicycle Friendly University award.
The College Sustainability Report Card is another effort to compare and evaluate campuses, but with a broader focus on all sustainability activities. The fifth report card, released in October 2010, scored more than 300 universi-ties on administration, climate change and energy, food and recycling, green building, student involvement, trans-portation, endowment transparency, investment priorities, and shareholder engagement. The report relies on data from publicly available documentation, and from three surveys sent to school administrators. As of the most recent survey, 37% of schools earned an "A" grade in transportation. Key findings in the transportation category included:
• Bicycle-sharing programs have been instituted at 50 percent of schools.
• Car-sharing programs are available at 51 percent of schools.
• Reduced-fare passes for public transit are offered at 61 percent of schools.
• Hybrid or other alternative-energy vehicles are used in 86 percent of school fleets.
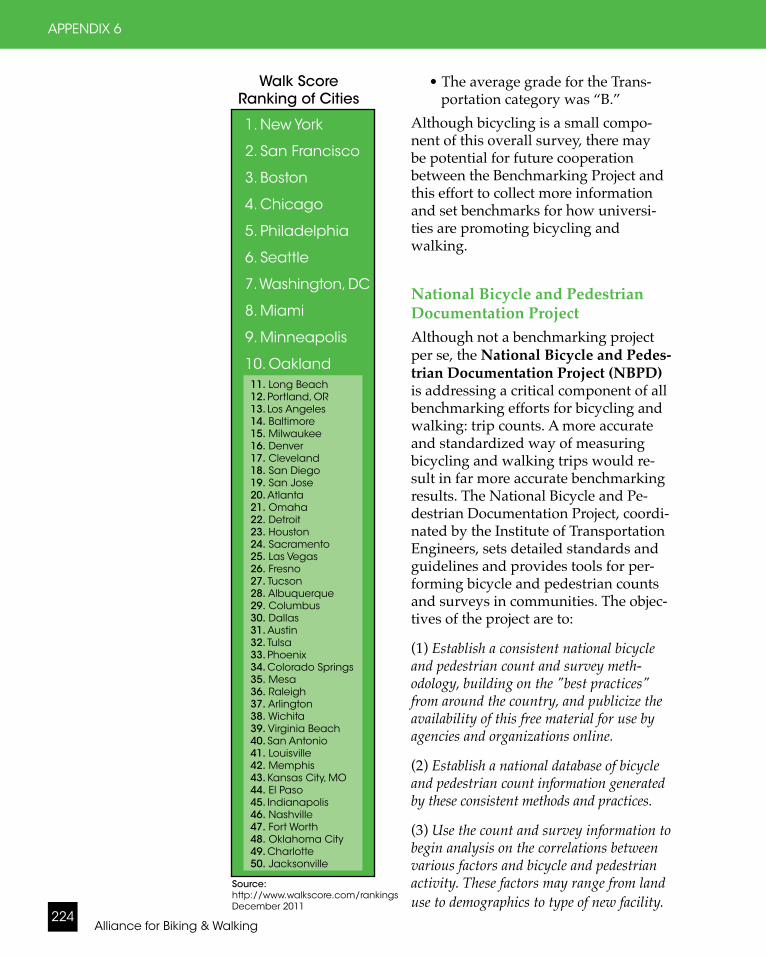
Alliance for Biking & Walking224
1. New York
2. San Francisco
3. Boston
4. Chicago
5. Philadelphia
6. Seattle
7. Washington, DC
8. Miami
9. Minneapolis
10. Oakland11. Long Beach12. Portland, OR13. Los Angeles14. Baltimore15. Milwaukee16. Denver17. Cleveland18. San Diego19. San Jose20. Atlanta21. Omaha22. Detroit23. Houston24. Sacramento25. Las Vegas26. Fresno27. Tucson28. Albuquerque29. Columbus30. Dallas31. Austin32. Tulsa33. Phoenix34. Colorado Springs35. Mesa36. Raleigh37. Arlington38. Wichita39. Virginia Beach40. San Antonio41. Louisville42. Memphis43. Kansas City, MO44. El Paso45. Indianapolis46. Nashville47. Fort Worth48. Oklahoma City49. Charlotte50. Jacksonville
Walk Score Ranking of Cities
APPENDIX 6
• The average grade for the Trans-portation category was “B.”
Although bicycling is a small compo-nent of this overall survey, there may be potential for future cooperation between the Benchmarking Project and this effort to collect more information and set benchmarks for how universi-ties are promoting bicycling and walking.
National Bicycle and Pedestrian Documentation ProjectAlthough not a benchmarking project per se, the National Bicycle and Pedes-trian Documentation Project (NBPD) is addressing a critical component of all benchmarking efforts for bicycling and walking: trip counts. A more accurate and standardized way of measuring bicycling and walking trips would re-sult in far more accurate benchmarking results. The National Bicycle and Pe-destrian Documentation Project, coordi-nated by the Institute of Transportation Engineers, sets detailed standards and guidelines and provides tools for per-forming bicycle and pedestrian counts and surveys in communities. The objec-tives of the project are to:
(1) Establish a consistent national bicycle and pedestrian count and survey meth-odology, building on the "best practices" from around the country, and publicize the availability of this free material for use by agencies and organizations online.
(2) Establish a national database of bicycle and pedestrian count information generated by these consistent methods and practices.
(3) Use the count and survey information to begin analysis on the correlations between various factors and bicycle and pedestrian activity. These factors may range from land use to demographics to type of new facility.
Source: http://www.walkscore.com/rankingsDecember 2011
2012 Benchmarking Report 225
As of January 2009, the project had col-lected 310 counts in about 93 different communities across the nation. NBPD has had a great variety of cities submit data. Large cities like San Jose, New York, Boston, and Portland have sent counts as well as smaller cities like San Rafael. Like the Alliance's Benchmark-ing Project, NBPD is working toward improving data collection and con-sistency in order to better understand influences and improve facilities and programs.
Scoring WalkabilitySince the release of the 2007 Bench-marking Report, a new effort has launched to measure the walkability of cities. Walk Score, launched in July 2007, is a tool that "helps people find walkable places to live." Walk Score calculates the walkability of an address, or city, using a patent-pending system for measuring walkability. The calcula-tor locates nearby stores, restaurants, schools, parks, and so on, to determine how close destinations are and deter-mine how easy it is to get places by walking. Since its launch, almost 6 million ad-dresses have been served and Walk Score has been featured in over 500 newspaper articles and 50 TV segments. According to Walk Score, "Our vision is for every property listing to read: Bedrooms: 3 Baths: 2 Walk Score: 84. We want walkability and transporta-tion costs to be a key part of choosing where to live." Walk Score has also used its methods to rank the 50 largest U.S. cities on walkability.
As of July 2011, the makers of Walk Score have been developing a version
OVERVIEW OF OTHER BENCHMARKING EFFORTS
for biking called Bike Score. The public is invited to vote on what should be included in the Bike Score calculation at http://www.bikescore.com.
Local EffortsEfforts to measure the state of bicy-cling locally have also been under-taken by local advocacy organiza-tions. Alliance member organizations including Transportation Alterna-tives (New York City), San Francisco Bicycle Coalition, the Bicycle Trans-portation Alliance (Oregon), Cascade Bicycle Club, and BikeWalk Virginia have all created report cards for rating their communities at least once. Since the 2010 Benchmarking Report, new local benchmarking efforts have be-gun in Texas, Wisconsin, and Indiana. The results of these efforts are that communities receive credit for areas where they are doing well, and areas needing improvement are identi-fied. These efforts, many of which are modeled after this Benchmarking Report, serve as a benchmarking tool for cities to evaluate themselves and to use these data to measure progress over time.
Transportation Alternatives Bicy-cling Report Card
Transportation Alternatives (T.A.), the New York City bicycle, pedestrian, and transit-advocacy organization, has the longest running report card for bicycling among U.S. cities. In 2009, T.A. published their 12th annual NYC Bicycling Report Card, assigning three grades to eight “bicycle basics” includ-ing bicycling environment, safety, and parking, among others. T.A. assigns one grade based on government effort and
Alliance for Biking & Walking226
one grade based on their assessment of the reality on the streets. A third grade is assigned by an Internet public opin-ion poll that received 1,200 responses for the last report. According to T.A., the purpose of the report card is “to provoke and encourage our politicians and government agencies to make NYC safer and more convenient for current bicyclists and more inviting for future ones.” This report card provides a use-ful and provoking annual assessment of bicycling conditions and progress being made toward a more bicycle friendly New York City.
San Francisco Bicycle Coalition Re-port Card on BicyclingIn 2006, the San Francisco Bicycle Co-alition (SFBC), San Francisco’s bicycle advocacy organization, published its first Report Card on Bicycling. Un-like T.A.’s Bicycling Report Card, SFBC relied completely on survey responses from bicyclists in San Francisco. The survey was answered by 1,151 indi-viduals and addressed topics such as bicycling environment, safety, theft, and transit connections. The survey also collected information on topics such as frequency and types of bicycle trips and what prevents people from bicycling more than they do. The SFBC gave San Francisco a "B−" overall and included recommendations for the city to improve the score. According to the SFBC, the report card is “an instrument to hold (our) local decision makers ac-countable for their stated commitments to boosting bicycling rates and safety and making bicycling a mainstream transportation mode.” In 2008 the SFBC published their second biennial report card after surveying over 1,800 San Francisco bicyclists during April 2008. In addition to the survey results, this
APPENDIX 6
second report also included a variety of other measurements and statistics from local sources.
BTA’s Bicycle Friendly Communi-ties Report CardThe Bicycle Transportation Alliance (BTA), Oregon’s statewide bicycle ad-vocacy organization, produced its first Bicycle-Friendly Community Report Card in 2002. Grades were given to 20 of Oregon’s largest communities based on such things as quality and quantity of bicycle facilities, encouragement of bicycling, established safety programs, and feedback from community bicycle riders. The 20 communities received a letter grade ranging from A− to D−. A discussion highlighted the good, the bad, and the opportunities to increase bicycling in various Oregon regions. According to the BTA, their report was “designed to help communities assess their commitment to bicycling as both recreation and transportation.”
Cascade Bicycle Club's Report Card on BicyclingSeattle had their first ever Report Card on Bicycling published in 2009 by the Cascade Bicycle Club. The report card, largely modeled after SFBC's efforts, re-ports on both local bicycling data from government sources and on the results of a local survey of 600 Seattle residents. The report card grades Seattle on four categories: participation, network, sup-port facilities, and safety. Each of these categories was further divided into subcategories derived from surveys and government data. Each subcategory grade determined the category grades, and the grades of the four categories were averaged to give Seattle an overall grade of "B." According to the Cascade
2012 Benchmarking Report 227
Bicycle Club, "ultimately, the findings identified in this Report Card will drive Cascade’s future advocacy efforts to ensure that our cyclists' concerns are at the forefront of our agenda."
Benchmarking across the State of VirginiaIn 2009, BikeWalk Virginia, in coop-eration with the Virginia Department of Health, Virginia Department of Motor Vehicles (DMV), and Virginia Department of Transportation (VDOT), released the first-ever comprehensive report of bicycling and pedestrian plan-ning, resources, accommodations, and safety in the state of Virginia. The report was funded by a DMV safety grant. BikeWalk Virginia surveyed 39 cities, 95 counties, and 157 incorporated towns in Virginia.
They developed a new measure, the Virginia Active Transportation Index (VATI), to provide a "comprehensive picture of biking and walking resources in each locality." Each locality was scored (from 0 to a perfect score of 11) on the index based on the number of resources they reported, which includ-ed: comprehensive transportation plan, bicycle plan, pedestrian plan, green-way plan, bicycle advisory committee, pedestrian advisory committee, green-way advisory committee, law requiring persons 14 and under to wear a helmet, paved bicycle trails, and striped bike lanes. Findings also include identifica-tion of localities that reported receiv-ing an Enhancement Grant from the Virginia Department of Transportation. According to BikeWalk Virginia, "The report established a valid benchmark against which progress in expanding resources can be measured." The orga-nization plans to conduct continuing
OVERVIEW OF OTHER BENCHMARKING EFFORTS
surveys and update the report every two years.
Bike Texas BenchmarkingBike Texas, Texas' statewide bicycling advocacy organization, initiated a state-wide benchmarking project in 2010 with consultation from the Alliance. Their study, unpublished as of this report, will reveal baseline data from at least the 30 largest Texas cities. Measures in-clude pedestrian and bicycle infrastruc-ture, education and advocacy programs, funding, mode share, and safety.
Bicycle Benchmarking in WisconsinThe Bicycle Federation of Wisconsin released their first benchmarking report on the state of bicycling in Wisconsin in 2011. The report, released at the 2011 Wisconsin Bike Summit, reveals data on bicycling ridership, facilities, education, and encouragement, and more based on data from local, state, and national sources. The Bicycle Federation of Wisconsin plans to release this report, based on the Alliance's Benchmarking Project, every other year.
Benchmarking TogetherAll efforts described above provide in-spiration or direct knowledge to inform the Alliance's Benchmarking Project. The Alliance will continue to track other benchmarking efforts and encourage local communities to use the results of this report to support their own bench-marking efforts.
Alliance for Biking & Walking228
Appendix 7: Corrections to 2010 Benchmarking ReportThe Alliance for Biking & Walking and our project team of advisors makes every effort to ensure the accuracy of data contained in this report. The self-reported nature of state and city data can lead to discrepancies from year to year, especially as respondents may change and interpret ques-tions differently. In our effort to ensure accurate tracking and reporting of data, a number of re-sponses to 2010 Benchmarking Report surveys have been updated. These corrections are reflected in the data analysis contained in this report. Below is a complete list of all corrections to the initial printed version of the 2010 report released in January 2010. Corrections are organized by chapter and page number.
Acknowledgments
• Teton Valley Trails and Pathways was misspelled
4: Policies and Provisions
Page 60:• Published goal to increase walking—Response corrected to “no”: Arkansas, New Hampshire,
North Dakota, South Carolina• Published goal to increase bicycling—Response corrected to “no”: Arkansas, New Hampshire,
South Carolina• Published goal to decrease pedestrian fatalities—Response corrected to “no”: New Hampshire• Published goal to decrease bicycle fatalities—Response corrected to “no”: New Hampshire,
Wyoming• Master Plan adopted for bicycling—Response corrected to “no”: Iowa, North Dakota, Okla-
homa, South Carolina• Master Plan adopted for walking—Response corrected to “no”: Hawaii, Maine, Oklahoma,
South Carolina• Bicycle and Pedestrian Advisory Committee—Response corrected to “no”: New Hampshire
Page 61:• Published goal to increase walking—Response corrected to “no”: Colorado Springs, Dallas • Published goal to decrease pedestrian fatalities—Response corrected to “no”: Atlanta, Colo-
rado Springs, Dallas, Miami• Published goal to decrease bicycle fatalities—Response corrected to “no”: Atlanta, Colorado
Springs, Dallas• Master Plan adopted for bicycling—Response corrected to “no”: Memphis, Mesa, Tulsa; Re-
sponse corrected to “yes”: Charlotte• Master Plan adopted for walking—Response corrected to “no”: Charlotte, Memphis, Mesa,
Phoenix, San Diego, Tulsa• Bicycle and Pedestrian Advisory Committee—Response corrected to “no”: Las Vegas, Mem-
phis, Philadelphia
Pages 63-65:• Complete Streets Policy—Response corrected to “no”: El Paso, Kentucky
Pages 64-65:• Complete Streets Policy—Corrected totals: Cities (13 with policies), States (17 with policies)
APPENDIX 7
2012 Benchmarking Report 229
Page 64:• Max number of car parking spaces for new buildings—Response corrected to “no”: Chicago,
Memphis• Bike parking requirements in buildings/garages—Response corrected to “no”: Las Vegas• Bike parking requirements in new buildings—Response corrected to “no”: Las Vegas•Bike parking at public events—Response corrected to “no”: Baltimore, Colorado Springs, Co-
lumbus, Milwaukee
Page 68:• Provides SRTS funding beyond federal—Response corrected to “no”: Arizona, Massachusetts
Pages 88 and 90:• Existing miles of on-street bike lanes per square mile (total miles)—Atlanta corrected to 0.1
mile per square mile (19 miles); Austin corrected to 0.6 mile per square mile (137 miles); Fort Worth corrected to 0.1 mile per square mile (13.8 miles); New York City corrected to 1.1 miles per square mile (341 miles); Phoenix corrected to 0.8 mile per square mile (365 miles); San Diego corrected to 1.0 mile per square mile (309.4 miles); Tulsa corrected to 0.1 mile per square mile (8.6 miles)
• Existing miles of multi-use paths per square mile (total miles)—Atlanta corrected to 0.2 mile per square mile (29 miles); Fort Worth corrected to 0.2 mile per square mile (57.3 miles); Lou-isville corrected to 0.4 mile per square mile (24.3 miles); Milwaukee corrected to 0.03 mile per square mile (3 miles); New York City corrected to 1.0 mile per square mile (295 miles); Virginia Beach corrected to 0.3 miles per square mile (74.7 miles)
• Existing miles of signed bicycle routes per square mile (total miles)—Fort Worth corrected to 0.1 mile per square mile (38.9 miles); Los Angeles corrected to “unknown” miles per square mile (“unknown” miles); Louisville corrected to 1.4 miles per square mile (89.8 miles); Phoe-nix corrected to 0.3 mile per square mile (122 miles); Tucson corrected to 0.5 mile per square mile (90 miles); Tulsa corrected to 0.5 mile per square mile (82.6 miles); Virginia Beach cor-rected to 0.3 mile per square mile (75 miles)
Pages 89-90:• Existing total miles of bicycle facilities per square mile—Atlanta corrected to 0.6 mile per
square mile; Austin corrected to 1.7 miles per square mile; Fort Worth corrected to 0.4 mile per square mile; Louisville corrected to 2.2 miles per square mile; Milwaukee corrected to 2.4 miles per square mile; New York City corrected to 2.1 miles per square mile; Phoenix cor-rected to 1.5 miles per square mile; San Diego corrected to 1.2 miles per square mile; Tucson corrected to 3.4 miles per square mile; Tulsa corrected to 1.1 miles per square mile; Virginia Beach corrected to 0.6 mile per square mile
Page 91: • Shared lane markings—Response corrected to “no”: Dallas• Woonerf/living streets—Response corrected to “no”: Dallas
5: Education and Encouragement
Page 97:• Annual statewide bike/ped conference—Response corrected to “no”: Illinois
Page 100:• State-sponsored ride to promote bicycling/activity—Response corrected to “no”: Maine
CORRECTIONS TO 2010 BENCHMARKING REPORT
Alliance for Biking & Walking230
Page 106:• Youth bike education courses—Response corrected to “no”: Omaha• Adult bike education courses—Response corrected to “no”: Fort Worth, Las Vegas• Bike to Work Day event—Response corrected to “no”: Las Vegas• Open Streets/Ciclovia event—Response corrected to “no”: Baltimore, Chicago, Phoenix
Page 106:• City-sponsored bike ride—Response corrected to “no”: Las Vegas; Response corrected to “yes”:
Phoenix
Page 110:• City-sponsored bike ride, number of participants—New York City response corrected to 30,000
participants for all three years (2006-2008); Phoenix ride added: 924 participants (2006), 912 participants (2007), 1,023 participants (2008)
6: Grassroots Advocacy
Page 120:• Residents per one member—Colorado should be 693 adults per one member
Appendix 5: Resources
• The correct website for the National Bicycle and Pedestrian Documentation Project is http://bikepeddocumentation.org/
APPENDIX 7
2012 Benchmarking Report 231
402 Safety Funds, http://safety.fhwa.dot.gov/state*program/section402/index.htm. 5 E's: Creating Your Action Plan: The 5E’s for Safe Routes to School, Safe Routes
to School National Partnership, http://www.saferoutespartnership.org/local/4191/4219?tid=21841.
AAA (American Automobile Association), Your Driving Costs: 2011 Edition, 2011. Adventure Cycling Association, U.S. Bicycle Route System 101, February 3, 2010, http://
blog.adventurecycling.org/2010/02/us-bicycle-route-system-101.html. Akar, G., Clifton, K., 2009. The influence of individual perceptions and bicycle infrastruc-
ture on the decision to bike. Transportation Research Record 2140, 165–172. Alliance for Biking and Walking, 2010. Bicycling and Walking in the United States: 2010 Bench-
marking Report. Available at http://www.peoplepoweredmovement.org/benchmarking.Alliance for Biking and Walking, 2007. Bicycling and Walking in the U.S.: Benchmarking Report
2007. Available at http://www.peoplepoweredmovement.org/benchmarking.Alta Planning and Design, The Value of the Bicycle-Related Industry in Portland, Septem-
ber 2008, http://www.altaplanning.com/App_Content/files/fp_docs/2008%20Port-land%20Bicycle-Related%20Economy%20Report.pdf.
America Bikes and League of American Bicyclists (LAB), 2011, Rescissions FAQ, http://www.advocacyadvance.org/site_images/content/Rescissions_FAQs.pdf.
America Bikes, 2011, American Recovery and Reinvestment Act (ARRA) Funding of Bicycle and Pedestrian Projects: America Bikes Research Summary, accessed July 2011 at http://www.americabikes.org/Documents/AB_ARRA_Research_Summary.pdf.
APBP, 2010. Bicycle Parking Guidelines, second ed. Association of Pedestrian and Bicycle Professionals, Washington, DC.
APTA, 2011. 2010 Public Transportation Vehicle Database. American Public Transportation Association, Washington, DC.
Aultman-Hall, L., Hall, F.L., Baetz, B.B., 1998. Analysis of bicycle commuter routes using geographic information systems: implications for bicycle planning. Transportation Re-search Record 1578, 102–110.
Barnes, G. and K. Krizek, "Tools for Predicting Usage and Benefits of Urban Bicycle Net-work Improvements," Minnesota Department of Transportation, Research Services Sec-tion, December 2005.
Bassett, D. R., J. Pucher, R. Buehler, D. L. Thompson, and S. E. Crouter, 2008. "Walking, Cycling, and Obesity Rates in Europe, North America, and Australia," Journal of Physical Activity and Health, 5, pp. 795–814.
Behan, D. F. and S.H. Cox, Obesity and its Relation to Mortality and Morbidity Costs, Soci-ety of Actuaries, December 2010.
"Benchmarking Toronto’s Bicycle Environment: Comparing Toronto to other World Cities," Toronto Coalition for Active Transportation, April 25, 2008.
Bergström, A., Magnusson, R., 2003. Potential of transferring car trips to bicycle during winter. Transportation Research Part A 37(8), 649–666.
"Bicycle Commuter Tax Provision"; League of American Bicyclists, http://www.bikelea-gue.org/news/100708adv.php.
Bibliography
BIBLIOGRAPHY

Alliance for Biking & Walking232
BIBLIOGRAPHY
Bicycle Federation of Wisconsin, 2011 Wisconsin Bicycling Benchmarking Report, http://www.bfw.org/uploads/media/2011_Wisconsin_Bicycling_Benchmarking_Re-port.pdf, 2011.
"Bicycle Friendly Communities: Enhancing Cities Through Cycling," American Bicyclist, League of American Bicyclists, March/April 2007.
Bicycle Policy Audit (BYPAD), http://www.bypad.org."Bikeability Checklist—How bikeable is your community?" Pedestrian and Bicycle Infor-
mation Center, www.bicyclinginfo.org/cps/checklist.htm.Bike Florida, Bike Florida 2010 "Greenways & Blueways" Economic Impact Report: Volusia
County, 2010. Bikes Belong, Bikes Belong Survey: The Size and Impact of Road Riding Events, November
2009. Bikes Belong, The Federal Investment in Bicycling: 10 Success Stories, 2011, http://www.
bikesbelong.org/assets/documents/uploads/top_10_reduced.pdf. Bike Texas, BikeTexas Benchmark Study, http://www.biketexas.org/en/infrastructure/
benchmark-study, accessed June 13, 2011.Borgman, F., "The Cycle Balance: Benchmarking local cycling conditions," Published in
Rodney Tolley (ed.), Sustaining sustainable transport: Planning for walking and cycling in urban environments, Cambridge (UK), Woodhead Publishing Limited, 2003.
Bowker, J.M., J.C. Bergstrom, and J.K. Gill, The Virginia Creeper Trail: An Assessment of User Demographics, Preferences, and Economics, December 8, 2004.
Bradley, J., "A Small-town or Metro Nation?," Brookings Institute, October 2008.Brons, M., Givoni, M., Rietveld, P., 2009. Access to railway stations and its potential in in-
creasing rail use. Transportation Research Part A 43(2), 136–149. Buehler, R. and J. Pucher, “Cycling to Work in 90 Large American Cities: New Evidence on
the Role of Bike Paths and Lanes," Transportation, Vol. 38, 2011, forthcoming. Buehler, R., J. Pucher, D. Merom, and A. Bauman, 2011, "Active Travel in Germany and the
USA: Contributions of Daily Walking and Cycling to Physical Activity," American Journal of Preventive Medicine, Vol. 40, No. 9, September 2011, pp. 241–250.
Buehler, R. and J. Pucher, 2011. Sustainable transport in Germany: Lessons from Germany’s environmental capital. International Journal of Sustainable Transportation 5, 43–70.
Campos Inc., The Great Allegheny Passage Economic Impact Study (2007-2008), The Prog-ress Fund, Laurel Highlands Visitors Bureau, and Allegheny Trail Alliance, August 7, 2009.
Center for Research on Economic and Social Policy (CRESP) of the University of Colorado at Denver, “Bicycling and Walking in Colorado: Economic Impact and Household Re-sults,” commissioned by the Colorado Department of Transportation Bicycle/Pedestrian Program, April 2000.
Charity Walk, http://www.charitywalkhawaii.org, accessed April 17, 2011. Christie, L., "Cities are hot again," CNNMoney.com, June 2006."College Sustainability Report Card," Sustainable Endowments Institute,
http://www.greenreportcard.org/report-card-2009.
2012 Benchmarking Report 233
"Comparison of Bike Parking Policies," Massachusetts Bicycle Coalition, http://www.massbike.org/bikelaw/parkcomp1.htm.
"Copenhagen City of Cyclists: Bicycle Account 2008," City of Copenhagen, August 2009. http://cphbikeshare.com/files/Bicycle%20Account%202008.pdf.
Cortright, J., New York City's Green Dividend, CEOs for Cities, April 2010. Cosgrove, L., N. Chaudhary, and I. Reagan, 2011, Four High-Visibility EnforcementDemon-
stration Waves in Connecticut and New York Reduce Hand-Held Phone Use, National Highway Traffic Safety Administration, July 2011, accessed September 10, 2011, at http://www.distraction.gov/files/for-media/2011/508-research-note-dot-hs-811-845.pdf.
Cradock, A., Troped, P., Fields, B., Melly, S., Simms, S., Gimmler, F., Fowler, M., 2009. Fac-tors associated with federal transportation funding for local pedestrian and bicycle programming and facilities. Journal of Public Health Policy 30, S38–S72.
CTC Benchmark Project; www.ctc.org.uk/DesktopDefault.aspx?TabID=3774; Summary presented at 2003 VeloCity Conference found at http://www.ctc.org.uk/resources/Benchmarking/2003VelocityBM.pdf.
Deichmeister, J., B. Dows, and K.L. Perry, "Biking and Walking Resources in Virginia: Part I," BikeWalk Virginia, September 2, 2009.
de Geus, B., I. de Bourdeaudhuij, C. Jannes, R. Meeusen, 2008. Psychosocial and environ-mental factors associated with cycling for transport among a working population. Health Education Research 23, 697–708.
DeMaio, P., 2009. Bike-sharing: history, impacts, models of provision, and future. Journal of Public Transportation 14(4), 41–56.
Dill, J., Carr, T., 2003. Bicycle commuting and facilities in major US Cities: if you build them, commuters will use them. Transportation Research Record 1828, 116–123.
Dill, J., 2009. Bicycling for transportation and health: the role of infrastructure. Journal of Public Health Policy 30, S95–S110.
Dougherty, C., "Cities Grow at Suburbs' Expense During Recession," The Wall Street Journal, July 2009.
Drennen, E., Economic Effects of Traffic Calming on Urban Small Businesses, San Francisco State University, December 2003.
ECMT, 2004. National Policies to Promote Cycling. European Conference of the Ministers of Transport, Organisation for Economic Cooperation and Development, Paris, France.
Ecoplan, 2010. World City Bike Cooperative: Public Bike System Inventory. http://www.ecoplan.org/wtpp/citybike_index.htm.
Elvik, R., 2009. The non-linearity of risk and the promotion of environmentally sustainable transport. Accident Analysis and Prevention 41, 849–855.
Emond, C., W. Tang, S. Handy, 2009. Explaining gender difference in bicycling behavior. Transportation Research Record 2125, 16–25.
Ernst, M., Dangerous by Design 2011, Transportation for America, 2011, http://t4america.org/docs/dbd2011/Dangerous-by-Design-2011.pdf.
BIBLIOGRAPHY

Alliance for Biking & Walking234
"Evaluating Nonmotorized Transport: Techniques for Measuring Walking and Cycling Activity and Conditions," Transportation Demand Management (TDM) Encyclopedia, Victoria Transport Policy Institute, March 2007, http://www.vtpi.org/tdm/tdm63.htm#*Toc121444872.
"Examples of Complete Streets Policies and Guides," National Complete Streets Coalition, http://www.completethestreets.org.
Fietsberaad, 2010. Bicycle Policies of the European Principals: Continuous and Integral. Fietsber-aad, Amsterdam, NL.
Flusche, D., US Mayors Want More Bicycle and Pedestrian Investments, League of Ameri-can Bicyclists, May 3, 2011, http://www.bikeleague.org/blog/2011/05/us-mayors-want-more-bicycle-and-pedestrian-investments/.
Frank L.D., M.A. Andresen, T.L. Schmid, 2004. Obesity relationships with community design, physical activity, and time spent in cars. American Journal of Preventative Medicine 27(2):87–96.
Garrard, J., Rose, G., Lo, S.K., 2008. Promoting transportation cycling for women: The role of bicycle infrastructure. Preventive Medicine 46, 55–59.
Garrett-Peltier, H., Estimating the Employment Impacts of Pedestrian, Bicycle, and Road Infrastructure Case Study: Baltimore, University of Massachusetts Amherst, December 2010.
Gatersleben, B., Appleton, K., 2007. Contemplating cycling to work: Attitudes and percep-tions in different stages of change. Transportation Research Part A 41(4), 302–312.
Givoni, M., Rietveld, P., 2007. The access journey to the railway station and its role in pas-sengers’ satisfaction with rail travel. Transport Policy 14, 357–365.
Global Ideas Bank, "Groningen, the car-free city for bikes," http://www.globalideasbank.org/site/bank/idea.php?ideaId=378.
Goldberg, D., et al., SMARTRAQ Summary Report. New Data for a New Era: A Summary of the SMARTRAQ Findings Linking Land Use, Transportation, Air Quality, and Health in the Atlanta Region, January 2007.
Gomez, L., Sarmiento, O., Lucimi, D., Espinosa, G., Forero, R., Bauman, A., 2005. Preva-lence and factors associated with walking and bicycling for transport among young adults in two low-income localities of Bogotá, Colombia. Journal of Physical Activity and Health 2, 445–449.
Gordon-Larsen P., J. Boone-Heinonen, S. Sidney, B. Sternfeld, D.R. Jacobs, Jr., C.E. Lewis, 2009. Active commuting and cardiovascular disease risk: The CARDIA study. Archives of Internal Medicine;169(13):1216-1223.
Gotschi, T., and K. Mills, 2008. Active Transportation for America: The Case for Increased Federal Investment in Bicycling and Walking, Rails-to-Trails Conservancy, http://www.railstotrails.org/atfa.
Gotschi, T., 2011. "Costs and Benefits of Bicycling Investments in Portland," Oregon Journal of Physical Activity and Health, 2011, 8(Suppl 1), S49-S58.
Grabow, M., M. Hahn, and M.Whited, 2010. Valuing Bicycling’s Economic and Health Im-pacts in Wisconsin, University of Wisconsin Madison.
BIBLIOGRAPHY
2012 Benchmarking Report 235
Greer, D.L., Omaha Recreational Trails: Their Effect on Property Values and Public Safety, University of Nebraska at Omaha, June 2000.
Hamer, M and Y. Chida, 2008. Active commuting and cardiovascular risk: A meta-analytic review. Preventive Medicine 46(1):9–13.
Healthypeople.gov, U.S. Department of Health and Human Services, http://www.healthypeople.gov/2020/topicsobjectives2020/objectiveslist.aspx?topicId=12 , ac-cessed on July 26, 2011.
Heart and Stroke Foundation 2005 Report Card on Canadians’ Health—Has the Subur-ban Dream Gone Sour?, Press Release from the Heart and Stroke Foundation, www.heartandstroke.ca, February 10, 2005.
Hegger, R., 2007. Public transport and cycling: Living apart or together? Public Transport International 2, 38–41.
Heinen, E., B. Van Wee, K. Maat, 2010. Bicycle use for commuting: A literature review. Transport Reviews 30(1), 105–132.
"History of Safe Routes to School," from the website of the National Center for Safe Routes to School, www.saferoutesinfo.org.
Hopkinson, P., Wardman, M.,1996. Evaluating the demand for new cycle facilities. Trans-port Policy 3(4), 241–249.
Howard, C., Burns, E., 2001. Cycling to work in Phoenix: Route choice, travel behavior, and commuter characteristics. Transportation Research Record 1773, 39–46.
Hunt, J., Abraham, J., 2007. Influences on bicycle use. Transportation 34, 453–470. Interim Program Guidance, The Congestion Mitigation and Air Quality (CMAQ) Im-
provement Program under the Safe, Accountable, Flexible, Efficient Transportation Equity Act: A Legacy for Users, http://www.fhwa.dot.gov/environment/cmaq06gd.pdf, October 31, 2006.
International Walk to School in the U.S., National Center for Safe Routes to School, http://www.walktoschool-usa.org.
Jacobsen, P.L., 2003. "Safety in Numbers: More Walkers and Bicyclists, Safer Walking and Bicycling," Injury Prevention, 9, 205–209.
Jensen, S., 2008. How to obtain a healthy journey to school. Transportation Research Part A 42(3), 475–486.
Jones, M.G., S. Ryan, J. Donlon, L. Ledbetter, and D.R. Ragland, 2010. Seamless Travel: Measuring Bicycle and Pedestrian Activity in San Diego County and Its Relationship to Land Use, Transportation, Safety, and Facility Type, University of California, Berkeley, http://www.altaplanning.com/App_Content/files/Seamless-Final-Report-June-2010.pdf.
Knoch, C. and P. Tomes, 2006. Pine Creek Rail Trail 2006 User Survey and Economic Im-pact Analysis, Rails-to-Trails Conservancy.
Knoch, C., 2007. Heritage Rail Trail County Park 2007 User Survey and Economic Impact Analysis, Prepared for York County Department of Parks and Recreation.
Krizek, K., A. Forsyth, and L. Baum, 2009. Walking and Cycling International Literature Re-view. Melbourne: Victoria Department of Transport.
BIBLIOGRAPHY
Alliance for Biking & Walking236
LAB, 2011. Bicycle Friendly America: Bicycle Friendly Community Master List. League of American Bicyclists, Washington, DC. http://www.bikeleague.org/programs/bicycle-friendlyamerica/.
Lankford, S. et al., 2008. The Economic Impact & Spectator Characteristics of RAGBRAI, University of Northern Iowa, http://www.uni.edu/step/reports/STEP_RAGBRAI.pdf.
Larson, J., A. El-Geneidy, 2010. A travel behavior analysis of urban cycling facilities in Montréal, Canada. Transportation Research Part D 16(2), 172–177.
Law, P., "Seacoast Rides," The Wire, May 16, 2007.Lawrie, J., J. Guenther, T. Cook, M.P. Meletiou, and S.W. O'Brien, 2004. Pathways to
Prosperity: The Economic Impact of Investments in Bicycle Facilities, North Carolina Department of Transportation.
League of American Bicyclists Bicycle Friendly Communities, www.bicyclefriendlycom-munity.org/pdf/bfc*application*1.pdf, Report of 2006 Bicycle Friendly Communities at http://www.bicyclefriendlycommunity.org/Images/bfc*pdf*pages/bicycle*friendly*community*case*study.pdf.
Liberles, J., "Money talks, UCI3 Harbin Park event brings $200,000 to community," CX-magazine.com, 3 November 2010.
Lindsay A. and D. Karadeniz, 2008. The Impact of the Little Miami Scenic Trail on Single Family Residential Property Value, University of Cincinnati School of Planning.
Litman, T., 2007. Economic Value of Walkability, Victoria Transport Policy Institute. Local Government Commission, The Economic Benefits of Walkable Communities, 2000."Making the Grade 2009: T.A.’s 12th Annual Bicycling Report Card," Reclaim Magazine,
Winter 2009.Mapes, J., 2009. Pedaling Revolution: How Cyclists are Changing American Cities. Oregon State
University Press, Corvalis, OR. Martens, K., 2004. The bicycle as a feedering mode: Experiences from three European
countries. Transportation Research Part D 9, 281–294. Maus, J., "Portland bicycle industry worth $63M," BikePortland.org, June 15, 2006. McClintock, H., J. Cleary, 1996. "Cycle facilities and cyclists’ safety—experience from
Greater Nottingham and lessons for future cycling provision." Transport Policy 3, 67–77.McCann, B. and S. Handy, “Regional Response to Federal Funding for Bicycle and Pedes-
trian Projects,” Journal of the American Planning Association, Vol. 77, No. 1, winter 2011, pp. 23-38.
McDonald, N.C., 2007. "Active Transportation to School: Trends Among U.S. Schoolchil-dren, 1969–2001," American Journal of Preventive Medicine, 32(6), 509–516.
McDonald, N., A. Aalborg, 2009. "Why parents drive children to school: Implications for safe routes to school programs." Journal of the American Planning Association 75(3): 331–342.
McDonald, N., 2011. "U.S. School Travel, 2009: An Assessment of Trends," American Journal of Preventive Medicine, 41(2): 146-151.
Menghini, G., N. Carrasco, N. Schüssler, K. Axhausen, 2010. Route choice of cyclists in Zurich. Transportation Research Part A(9), 754–765.
BIBLIOGRAPHY

2012 Benchmarking Report 237
Moore R.L., A.R. Graefe, R.J. Gitelson, and E. Porter, The Impacts of Rail-Trails: A Study of the Users and Property Owners from Three Trails, National Park Service, Washington, DC, February 1992.
Moudon, A., C. Lee, A. Cheadle, C. Collier, D. Johnson, T. Schmid, 2005. Cycling and the built environment, a US perspective. Transportation Research Part D 10, 245–261.
NACTO, 2011. Bicycle Preferred Streets. National Association of City Transportation Of-ficials, Washington, DC. http://www.nacto.org/bikeprefstreets.html#cities.
Nankervis, M., 1999. The effect of weather and climate on bicycle commuting. Transporta-tion Research Part A 33(6), 417–431.
National Association of Realtors, 2011 Community Preference Survey, conducted by Belden, Russonello, and Stewart, March 2011.
National Bicycle and Pedestrian Documentation Project: Instructions, Alta Planning + De-sign, Inc., August 2005, http://www.altaplanning.com/nbpd/NDP_Instructions090205.pdf.
National Bicycle and Pedestrian Documentation Project: Description, Alta Planning + De-sign, Inc., August 2005, http://www.altaplanning.com/nbpd/NDP_Description090205.pdf.
National Center for Health Statistics, Health, United States, 2006: With Chartbook on Trends in the Health of Americans, Hyattsville, MD: 2006, 57 (further cites Centers for Disease Control and Prevention, National Center for Health Statistics, National Health Examination Survey, and National Health and Nutrition Examination Survey).
National Governors Association, Investing in America's Health, August 2006. National Park Service, Economic Impacts of Protecting Rivers, Trails, and Greenway Cor-
ridors, 4th Edition, 1995. National Priorities Project, Tax Day 2011: Where Do Your Tax Dollars Go?, http://national-
priorities.org/tools/taxday/breakdown-one-dollar/ April 18, 2011. NTEC (National Transportation Enhancements Clearinghouse), 2010, Transportation En-
hancements: Summary of Nationwide Spending as of FY 2009, NTEC, Washington, DC.Nelson, A., D. Allen, 1997. If you build them, commuters will use them. Transportation
Research Record 1578, 79–83. Nelson, C., C. Vogt, J. Lynch, and D. Stynes, Rail-Trails and Special Events: Community
and Economic Benefits, paper presented at the 2001 Northeast Recreation Research Sym-posium, April 1–3, 2001, Bolton Landing, NY, 2001.
NHTS, National Household Travel Survey, U.S. Department of Transportation and Federal Highway Administration, 2001, 2009.
Ogden, C. and M. Carroll, 2010. Prevalence of Obesity Among Children and Adolescents: United States, Trends 1963–1965 through 2007–2008, National Center for Health Statis-tics..
Ogden, C. and M. Carroll, 2010. Prevalence of Overweight, Obesity, and Extreme Obesity Among Adults: United States, Trends 1960–1962 Through 2007–2008, National Center for Health Statistics.
BIBLIOGRAPHY

Alliance for Biking & Walking238
Oja1, P., S. Titze, A. Bauman, B. de Geus, P. Krenn, B. Reger-Nash, T. Kohlberger, 2011. Health benefits of cycling: A systematic review, Scandinavian Journal of Medicine and Sci-ence in Sports, 21, 496-509.
Parkin, J., M. Wardman, M. Page, 2008. Estimation of the determinants of bicycle mode share for the journey to work using census data. Transportation 35, 93–109.
PBIC and FHWA, 2010. The national walking and bicycling study: 15-year status report. Pedestrian and Bicycling Information Center, University of North Carolina, Chapel Hill, NC, and Federal Highway Administration, US Department of Transportation, Washington, DC. http://drusilla.hsrc.unc.edu/cms/downloads/15-year_report.pdf.
Pedroso, M., Safe Routes to School Federal Program State of the States Report, Safe Routes to School National Partnership, November 2011, http://www.saferoutespartnership.org/state/5043.
Pucher, J., and L. Dijkstra, "Promoting Safe Walking and Cycling to Improve Public Health: Lessons from The Netherlands and Germany," American Journal of Public Health, 93 (9), September 2003, 1509-1506. Accessible at: http://policy.rutgers.edu/faculty/pu-cher/AJPHfromJacobsen.pdf.
Pucher, J., and J.L. Renne, "Socioeconomics of Urban Travel: Evidence from the 2001 NHTS," Transportation Quarterly, 57(3), Summer 2003, pp. 49–77. Accessible at: http://policy.rutgers.edu/faculty/pucher/TQPuchRenne.pdf.
Pucher, J. and R. Buehler, "Why Canadians cycle more than Americans: A Comparative Analysis of Bicycling Trends and Policies," Transport Policy, 13, 2006, pp. 265–279. Acces-sible at: http://policy.rutgers.edu/faculty/pucher/TransportPolicyArticle.pdf.
Pucher, J. and R. Buehler, "At the Frontiers of Cycling: Policy Innovations in the Nether-lands, Denmark, and Germany," World Transport Policy and Practice, 13(3), December 2007, pp. 8–57. Accessible at: http://www.eco-logica.co.uk/pdf/wtpp13.3.pdf.
Pucher, J. and R. Buehler, 2008. "Making Cycling Irresistible: Lessons from the Nether-lands, Denmark, and Germany," Transport Reviews, 28(4), 95–528. Accessible at: http://policy.rutgers.edu/faculty/pucher/Irresistible.pdf.
Pucher, J. and R. Buehler, 2009. "Integration of Bicycling and Public Transport in North America," Journal of Public Transportation, 12(3), 79–104. http://policy.rutgers.edu/fac-ulty/pucher/PUCHER_BUEHLER.pdf.
Pucher, J., R. Buehler, and M. Seinen, 2011. "Bicycling Renaissance in North America? An Update and Re-Assessment of Cycling Trends and Policies," Transportation Re-search A, 45(6), 451-475. URL link: http://policy.rutgers.edu/faculty/pucher/TRA960_01April2011.pdf
Pucher, J., J. Dill, and S. Handy, 2010. “Infrastructure, Programs and Policies to Increase Bicycling: An International Review," Preventive Medicine, 50(S1), S106-S125. URL link: http://policy.rutgers.edu/faculty/pucher/Pucher_Dill_Handy10.pdf
Pucher, J., R. Buehler, D. Merom, A. Bauman, 2011. “Walking and Cycling in the United States, 2001-2009: Evidence from the National Household Travel Surveys," American Journal of Public Health, 101(10), Published online ahead of print at: http://ajph.apha-publications.org/cgi/content/abstract/AJPH.2010.300067v1
BIBLIOGRAPHY

2012 Benchmarking Report 239
Pucher, J., R. Buehler, D. Bassett, and A. Dannenberg, 2010. “Walking and Cycling to Health: Recent Evidence from City, State, and International Comparisons," American Journal of Public Health, 100(10), 1986-1992. URL link: http://ajph.aphapublications.org/cgi/content/abstract/AJPH.2009.189324v1 Report Card on Bicycling: Seattle 2009, Cas-cade Bicycle Club, 2009, http://www.cascade.org/advocacy/bicycle_report_card.cfm.
Pucher, J., R. Buehler, and M. Seinen, 2011. "Bicycling Renaissance in North America? An Update and Re-Assessment of Cycling Trends and Policies," Transportation Re-search A, 45(6), 451-475. URL link: http://policy.rutgers.edu/faculty/pucher/TRA960_01April2011.pdf.
Pucher, J. and R. Buehler, 2010. “Walking and Cycling for Healthy Cities," Built Environ-ment, 36(5), 391-414. URL link: http://policy.rutgers.edu/faculty/pucher/BuiltEnvi-ronment_WalkBike_10Dec2010.pdf
Pucher, J., J. Garrard, S. Greaves, 2011b. "Cycling down under: a comparative analysis of bicycling trends and policies in Sydney and Melbourne." Journal of Transport Geography 19(2), 332–345.
Pucher, J., L. Thorwaldson, R. Buehler, N. Klein, 2010. "Cycling in New York: policy inno-vations at the urban frontier." World Transport Policy and Practice 16(2), 7–50.
Report Card on Bicycling: San Francisco 2006, San Francisco Bicycle Coalition, May 2006, http://www.sfbike.org/?reportcard.
Report Card on Bicycling: San Francisco 2008, San Francisco Bicycle Coalition, May 2008, http://www.sfbike.org/?reportcard.
Reynolds, C., M. Harris, K. Teschke, P. Cripton, M. Winters, 2009. "The impact of trans-portation infrastructure on bicycling injuries and crashes: A review of the literature." Environmental Health 8(47). http://www.ehjournal.net/content/8/1/47.
Ridgway, D., 2010. Kansas City Regional Tiger Application Appendix D: KC Bicycle/Pedestrian Project, http://www.marc.org/Recovery/assets/tiger/APPENDIX_D_Bi-cycle_Pedestrian.pdf.
Rietveld, P., 2000. "The accessibility of railway stations: the role of the bicycle in The Neth-erlands." Transportation Research Part D 5, 71-75.
Rietveld, P. and V. Daniel, 2004. "Determinants of bicycle use: Do municipal policies mat-ter?" Transportation Research Part A 38(7), 531–550.
Rojas-Rueda, D., A. Nazelle, M. Tainio, and M. Nieuwenhuijsen, 2011. "The health risks and benefits of cycling in urban environments compared with car use: Health impact assessment study," British Medical Journal, 343:d4521.
Rose, G. and H. Marfurt, 2007. "Travel behaviour change impacts of a major ride to work day event." Transportation Research Part A 41, 351–364.
Roux, Larissa et al.,2008. "Cost Effectiveness of Community-Based Physical Activity In-terventions," American Journal of Preventative Medicine 35(6), 578–588, URL link: http://rafapana.org/files/attachments/261_Cost%20Effectiveness%20of%20CBI.pdf.
Saelens B.E., and S.L. Handy, 2008. "Built environment correlates of walking: a review." Medicine and Science in Sports and Exercise 40(7 Suppl), S550–S566.
BIBLIOGRAPHY
Alliance for Biking & Walking240
Sælensminde, K., 2004. Cost-benefit analyses of walking and cycling track networks tak-ing into account insecurity, health effects and external costs of motorized traffic, Trans-portation Research Part A: Policy and Practice 38(8), 593-606.
Safe Routes to School: http://safety.fhwa.dot.gov/saferoutes. Safe Routes to School Federal Program: State of the States, Safe Routes to School National
Partnership, July 2009.Sarmiento, O., A. Torres, E. Jacoby, M. Pratt, T. Schmid, G. Stierling, 2010. "The Ciclovía–
recreativa: A mass recreational program with public health potential." Journal of Physical Activity and Health (S2), S163–S180.
Shafizadeh, K., D. Niemeier, 1997. "Bicycle journey-to-work: Travel behavior characteris-tics and spatial analysis." Transportation Research Record 1578, 84–90.
Shaheen, S., S. Guzman, H. Zhang, 2010. "Bikesharing in Europe, the Americas, and Asia: past, present, and future." In: Paper Presented at the 89th Annual Meeting of the Trans-portation Research Board, Washington, DC.
Shephard R., 2008. "Is active commuting the answer to population health?" Sports Medicine 39(9), 751-758.
Shoup, Donald, 2005. "High Cost of Free Parking", American Planning Association.Smart, M., 2010. "US immigrants and bicycling: Two-wheeled in autopia," Transport Policy
17(3), 153–159. Staunton, C., D. Hubsmith, W. Kallins, 2003. "Promoting safe walking and biking to
school: The Marin County success story." American Journal of Public Health 93, 1431–1434.
Stinson, M. and C. Bhat, 2004. "Frequency of bicycle commuting: Internet-based survey analysis." Transportation Research Record 1878, 122–130.
StolenBicycleRegistry.com, http://www.stolenbicycleregistry.com/links.php.Su, J., M. Winters, M. Nunes, M. Brauer, 2010. "Designing a route planner to facilitate
and promote cycling in Metro Vancouver, Canada." Transportation Research Part A 44, 495–505.
Summer 2009 SRTS Program Tracking Brief , National Center for Safe Routes to School, June 2009, http://www.saferoutesinfo.org/resources/tracking-reports.cfm.
Surface Transportation Program (STP), http://www.fhwa.dot.gov/Tea21/factsheets/stp.htm.
"Survey of EMS Bike Teams," International Police Mountain Biking Association (IPMBA), 2002, http://www.ipmba.org/survey-2002-results-ems.htm.
Texas Department of Health State Services , Texas Overweight and Obesity Statistics, www.dshs.state.tx.us/obesity/pdf/txobesitydata.pdf.
"The Bicycle as a Vehicle," Massachusetts Bicycle Coalition, http://www.massbike.org/bikelaw/vehicle.htm.
The Bicycle-Friendly Communities Report Card: A Comparative Look at the Quality of Bicycling in Oregon’s Cities, Bicycle Transportation Alliance, Portland, OR, 2002.
BIBLIOGRAPHY
2012 Benchmarking Report 241
Taylor, N., 2006. Transport and Travel Research, Ltd., The Urban Transport Benchmarking Initiative: Year Three Final Report, Cycling Scotland, http://www.transportbench-marks.org.
Tilahun, N., D. Levinson, K. Krizek, 2007. "Trails, lanes, or traffic: Valuing bicycle facilities with an adaptive stated preference survey." Transportation Research Part A 41, 287–301.
Timperio, A., K. Ball, J. Salmon, R. Roberts, B. Giles-Corti, C. Baur, D. Crawford, 2006. Personal, family, social, and environmental correlates of active commuting to school. American Journal of Preventive Medicine 30 (1), 45–51.
Tour of Missouri, 2010. Tour of Missouri Set to Cancel for 2010, May 27, 2010. Article ac-cessed April 17, 2011, http://www.tourofmissouri.com.
Transportation Research Board (TRB), Does the Built Environment Influence Physical Ac-tivity: Examining the Evidence, TRB Special Report 282, 2005.
UPI (United Press International), Millennials say they are driving less, Nov. 22, 2010, http://www.upi.com/Business_News/2010/11/22/Millennials-say-they-are-driving-less/UPI-73481290485950.
U.S. Centers for Disease Control and Prevention, "Kids Walk-to-School: Then and Now—Barrier and Solutions," www.cdc.gov/nccdphp/dnpa/kidswalk/then*and*now.htm, Accessed June 21, 2007.
USDOT, New Research Shows Enforcement Cuts Distracted Driving: Pilot Programs in Syracuse, NY, and Hartford, CT, Significantly Curb Texting and Cell Phone Use Behind the Wheel, press release, July 2011.
Vandenbulcke, G., Dujardin, C., Thomas, I., de Geus, B., Degraeuwe, B., Meeusen, R., Int Panis, L., 2011. "Cycle commuting in Belgium: Spatial determinants and 're-cycling' strategies." Transportation Research Part A 45(2), 118–137.
Vandenbulcke, G., I. Thomas, B. de Geus, B. Degraeuwe, R. Torfs, R. Meeusen, L. Int Panis, 2009. "Mapping bicycle use and the risk of accidents for commuters who cycle to work in Belgium," Transport Policy 16(2), 77–87.
Velo Mondial, National Cycling Benchmark Policies, http://www.velomondial.net/page_display.asp?pid=14.
Velo Quebec, "Bicycling in Quebec in 2010," 2010, URL link: http://www.velo.qc.ca/en/Bicycling-in-Quebec.
Venegas, E., 2009. "Economic Impact of Recreational Trail Use in Different Regions of Min-nesota," University of Minnesota Tourism Center.
Vernez-Moudon, A.V., C. Lee, A.D. Cheadle, C.W. Collier, D. Johnson, T.L. Schmid, R.D. Weather, 2005. "Cycling and the built environment, a US perspective." Transportation Research Part D 10, 245–261.
"Walkability Checklist: How walkable is your community?," Partnership for a Walkable America, www.walkableamerica.org/checklist-walkability.pdf.
Walker, J., The State of Walking in London, Walk21, accessed July 2011 at http://www.walk21.com/uploads/File/WC%20conference%20London%20100507.pdf.
Walkscore, http://www.walkscore.com/how-it-works.shtml.
BIBLIOGRAPHY

Alliance for Biking & Walking242
"Walk to School Campaign History," Living Streets, http://www.walktoschool.org.uk/content/campaign_history.php.
Wang, G., C.A. Macera, B. Scudder-Soucie, T. Schmid, M. Pratt, and D. Buchner, 2008. "A Cost-Benefit Analysis of Physical Activity Using Bike/Pedestrian Trails." Health Promo-tion Practice 9, 426-433.
Wardman, M., M. Tight, and M., Page, 2007. "Factors influencing the propensity to cycle to work." Transportation Research Part A 41, 339–350.
Winters, M., M. Friesen, M. Koehoorn, K. Teschke, 2007. "Utilitarian bicycling: A multilevel analysis of climate and personal influences." American Journal of Preventive Medicine 32, 52–58.
Witlox, F. and H. Tindemans, 2004. "Evaluating bicycle-car transport mode competitive-ness in an urban environment: An activity-based approach." World Transport Policy and Practice 10(4), 32–42.
Wray, H., 2008. Pedal Power: The Quiet Rise of the Bicycle in American Public Life. Paradigm Publishers, Boulder, Colorado.
BIBLIOGRAPHY

2012 Benchmarking Report 243
Bic
yclin
g a
nd
Wa
lking
in th
e U
nite
d Sta
tes: 2
01
2 B
ENC
HM
AR
KIN
G R
EPO
RT

Alliance for Biking & Walking244
Bic
yclin
g a
nd
Wa
lking
in th
e U
nite
d Sta
tes: 2
01
2 B
ENC
HM
AR
KIN
G R
EPO
RT
PeoplePoweredMovement.org
Made possible in part by: $34.95